Embed Size (px)
Citation preview
Assessment of aquifer vulnerability based on GIS and DRASTIC
methods: a case study of the Senirkent-Uluborlu Basin (Isparta,
Turkey)
Erhan Sener & Sehnaz Sener & Aysen Davraz
Abstract Aquifer vulnerability has been assessed in theSenirkent-Uluborlu Basin within the Egirdir Lake catchment(Turkey) using the DRASTIC method, based on a geo-graphic information system (GIS). There is widespreadagriculture in the basin, and fertilizer (nitrate) and pesticideapplications have caused groundwater contamination as aresult of leaching. According to hydrogeological data fromthe study area, surface water and groundwater flow aretowards Egirdir Lake. Hence, aquifer vulnerability in thebasin should be determined by water quality in Egirdir Lake.DRASTIC layers were prepared using data such as rainfall,groundwater level, aquifer type, and hydraulic conductivity.These data were obtained from hydrogeological investiga-tions and literature. A regional-scale aquifer-vulnerabilitymap of the basin was prepared using overlay analysis withthe aid of GIS. A DRASTIC vulnerability map, verified bynitrate in groundwater data, shows that the defined areas arecompatible with land-use data. It is concluded that 20.8% ofthe basin area is highly vulnerable and urgent pollution-preventions measures should be taken for every kind ofrelevant activity within the whole basin.
Keywords Geographic information systems .DRASTIC . Aquifer vulnerability . Turkey
Introduction
Nowadays, groundwater resources play on important rolein meeting demands on water supply because of regional
climate change and scanty surface-water sources or theirunsuitability. Pollution of groundwater is a major issuebecause aquifers and the contained groundwater areinherently susceptible to contamination from land useand other anthropogenic impacts (Thirumalaivasan et al.2003). There are several types of pollutants that appear topredominate in groundwater such as heavy metals,nutrients, pesticides and other organic chemicals, andfertilizers. Leaching of various pollutants through theunsaturated zone and groundwater zone gives rise tocontamination in these zones. These processes vary fromone location to another (Baalousha 2006).
Frequently, aquifer vulnerability assessments are car-ried out in areas with water resources under stressesoriginating from industrial and agricultural activities.Therefore, the vulnerability studies can provide valuableinformation for stakeholders working on preventingfurther deterioration of the environment (Mendoza andBarmen 2006). Additionally, aquifer vulnerability studiesare useful in the evaluation of the economic impacts ofwaste disposal in highly vulnerable areas. Moreover, theyare providing preliminary information and criteria fordecision-making in such areas as designation of land-usecontrols, delineation of monitoring networks, and man-agement of water resources in the context of regionalplanning as related to protection of groundwater quality(Bachmat and Collin 1990).
The concept of vulnerability of groundwater to contam-ination was introduced in the 1960s in France by Margat(1968). Then, there were several approaches for developingaquifer vulnerability assessment maps such as DRASTIC(Aller et al. 1987), GOD (Foster 1987), AVI (VanStempvoort et al. 1993), and SINTACS (Civita 1994). Athorough overview of existing methods is given in Vrbaand Zaporozec (1994) and in Gogu and Dassargues (2000).These methods have been mainly applied to groundwaterprotection in porous aquifers, except the EPIK (Doerfligerand Zwahlen 1998; Doerfliger et al. 1999), PI (Goldscheideret al. 2000), and COP (Vias et al. 2006) methods which werespecifically developed for the assessment of vulnerability inkarstic areas.
Conventional methods (i.e. DRASTIC, AVI, GOD,SINTACS) are able to distinguish degrees of vulnerabil-ity at regional scales where different lithologies exist
Received: 27 October 2008 /Accepted: 25 June 2009Published online: 11 July 2009
© Springer-Verlag 2009
E. Sener ()) : S. Sener :A. DavrazSüleyman Demirel Üniversitesi Jeoloji Mühendisliği Bölümü,Çünür, 32260, Isparta, Turkeye-mail: [email protected]
S. Senere-mail: [email protected]
A. Davraze-mail: [email protected]
Hydrogeology Journal (2009) 17: 2023–2035 DOI 10.1007/s10040-009-0497-0
(Vias et al. 2005). The DRASTIC method is a familiarmethod developed in the US Environmental ProtectionAgency (USEPA) by Aller et al. (1987) and this methodhas been applied in several regions by differentresearchers (Merchant 1994; Melloul and Collin 1998;Kim and Hamm 1999; Cameron and Peloso 2001; Al-Zabet 2002; Al-Adamat et al. 2003; Baalousha 2006;Jamrah et al. 2007). Some of the researchers modifiedthe DRASTIC method and added different parameters(Secunda et al. 1998; Lee 2003; Mendoza and Barmen2006; Wang et al. 2007) such as land use index,lineaments, aquifer thickness, and impact of contaminant.Thirumalaivasan et al. (2003) developed a softwarepackage AHP-DRASTIC to derive ratings and weightsof modified DRASTIC model parameters.
The DRASTIC method assumes that: (1) any contam-inant is introduced at the ground surface; (2) thecontaminant is flushed into the groundwater by precipita-tion; (3) the contaminant has the mobility of water; (4) theareas evaluated using DRASTIC are 0.4 km2 or larger(Rosen 1994). The DRASTIC system is composed of twomajor parts: (1) the designation of mappable units, termedhydrogeological settings; and (2) the application of anumerical scheme of relative ranking of hydrogeologicalfactors (Lee 2003). Hydrogeological factors help toevaluate the relative groundwater pollution potential ofany hydrogeological setting. Hydrogeological setting is acomposite description of all the geological and hydrolog-ical factors controlling groundwater flow into, through,and out of an area (Kim and Hamm 1999).
Recently, geographic information system (GIS) techni-ques have been widely used in aquifer vulnerability mapping(Hrkal 2001; Rupert 2001; Lake et al. 2003; Panagopoulos etal. 2006; Jamrah et al. 2007; Rahman 2008). The majoradvantage of GIS-based mapping is the combination of datalayers and rapid change in the data parameters used invulnerability classification (Wang et al. 2007).
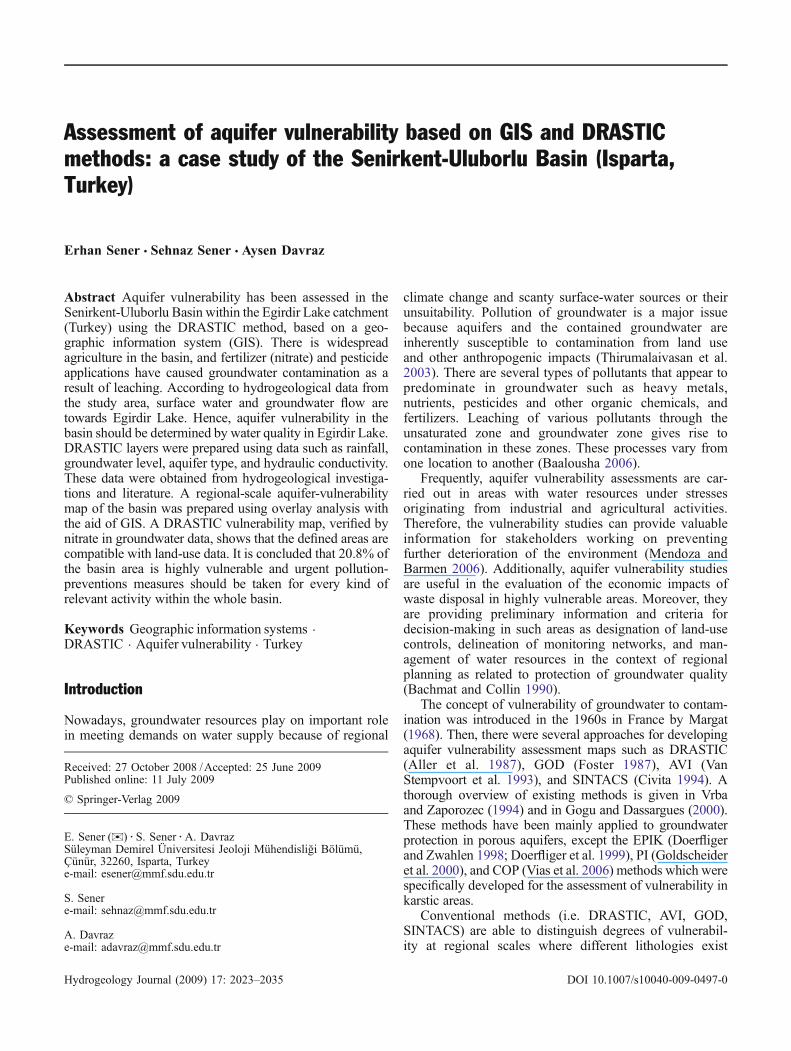
The study area is located within the Egirdir Lakecatchment, namely the Senirkent-Uluborlu Basin (Fig. 1).Egirdir Lake is the second largest freshwater lake inTurkey which is used for different purposes such asirrigation, tourism, fishing and 90% of the drinking watersupplied to the city of Isparta. Agricultural pesticides andwastewater are the main causes of the degradation ofgroundwater quality in the study area. The main aim ofthis study is to evaluate the aquifer vulnerability in thebasin and determine the degree of contamination ofEgirdir Lake using the DRASTIC model based on GIS.According to vulnerability, a map showing high, mediumand low vulnerability areas was produced for the basin.
The study area: Senirkent-Uluborlu Basin
The Senirkent-Uluborlu Basin is located within the LakeDistrict in the southwest of Turkey and covers an area of685 km2 (Fig. 1). Egirdir Lake is one of the mostimportant freshwater lakes in Turkey, with potential tosupply 4×10⁹ m3 of water. Also, Egirdir Lake has great
importance for the region because it supplies drinkingwater to Isparta; hence, the Senirkent-Uluborlu Basin waschosen for this study.
In the basin, groundwater discharge from the alluviumaquifer is towards Egirdir Lake and the amount ofdischarge has been calculated as 37,800,000 m3/year(Seyman 2005). The most important surface water flowingthrough the basin is Pupa Stream, which discharges12.84 m3/year to Egirdir Lake (Tay 2005; Seyman 2005).
In the basin, agriculture is widespread, and fertilizerand pesticides application practices have caused ground-water contamination through leaching. Also, insecurelandfill of municipal wastes on permeable aquifer units,mining activities and uncontrolled discharge of sewageaffect groundwater quality negatively. As a result ofsurface and groundwater flow towards Egirdir Lake, thevariety of contaminants and their mixing in surface waterand groundwater threaten the lake water quality. Hence,aquifer vulnerability in the basin should be determined forthe protection of the lake.
Geology and hydrogeology
There are several geological units with different ages andlithologies outcropping in the study area. Mesozoiccarbonate rocks are the oldest rock units. Cenozoic ageclastic and volcanic units unconformably overlie theMesozoic carbonates. Clastic rocks consist of sandstone,claystone, siltstone and conglomerates, namely Uluborluflysch. Incesu conglomerates contain carbonate cementand are classified as a member of the Uluborlu flysch.Volcanic units are known as Zendevi volcanics whichoverlie carbonates and flysch unconformably (Koçyiğit1983). Pliocene age terrestrial sediments and Pupacayıconglomerates occupy limited areas in the basin. Terres-trial sediments consist of clay, silt, sand and gravel.Quaternary alluvium is composed of materials such asclay, silt, sand and gravel, unconformably covering all ofthe other lithological units (Tay 2005).
Hydrogeogical properties of the lithological units weredetermined and the units were classified as permeable,semi-permeable and impermeable. The main aquifer in thebasin, which is the most vulnerable to contamination, isthe Quaternary alluvium aquifer. The Mesozoic carbonaterocks are classified as karstic aquifer due to havingfractures and swallow holes. Alluvium, karstic aquifersand conglomerates in the basin are classified as permeableunits. Zendevi volcanic units are classified as semi-permeable, depending on the volcanic gravel content.Uluborlu flysh and terrestrial sediments are classified asimpermeable units because of high clay levels (Tay 2005).
Methodology
Description of the DRASTIC methodSeveral aquifer vulnerability mapping methods have beendeveloped by different researchers since 1970. However,
2024
Hydrogeology Journal (2009) 17: 2023–2035 DOI 10.1007/s10040-009-0497-0
DRASTIC has been the most commonly used for mappingaquifer vulnerability in porous aquifers (Aller et al. 1987).In this study, the DRASTIC method was selected fordetermination of aquifer vulnerability in the basin becausethe main contamination sources are fertilizer and pesticideapplication practices in agricultural areas which arerepresented mainly in alluvium aquifer areas.
A DRASTIC method was derived from ratings andweights associated with the seven parameters. These are
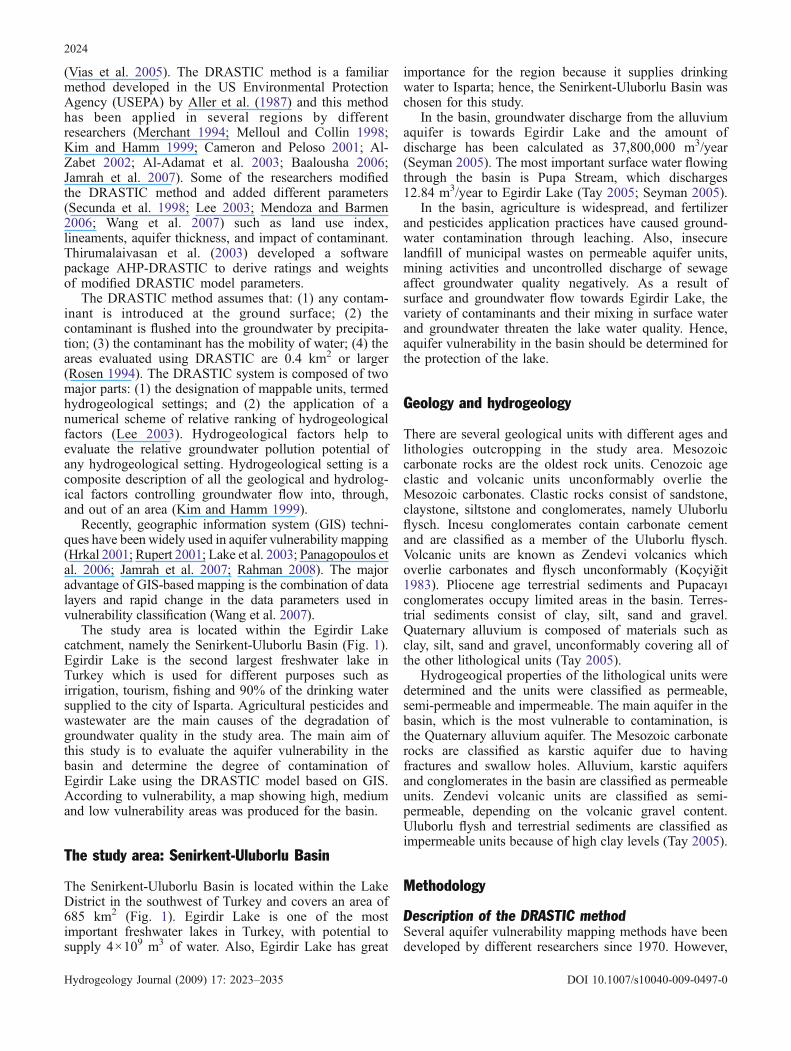
depth to groundwater (D), net recharge (R), aquifer media(A), soil media (S), topography (T), influence of thevadose zone (I) and hydraulic conductivity (C) (Fig. 2).
Each parameter is subdivided into ranges and isassigned different ratings in a scale of 1 (least contami-nation potential) to 10 (highest contamination potential)based on functional curves (Table 1). This rating is scaledby a pesticide and DRASTIC weighting factors rangingbetween 1 (least significant) and 5 (most significant). In
Fig. 1 Location map
2025
Hydrogeology Journal (2009) 17: 2023–2035 DOI 10.1007/s10040-009-0497-0
this study, pesticide weight was used for alluvium areasand DRASTIC weight was used for the other areas of thebasin. The linear additive combination of the aboveparameters with the ratings and weights was used tocalculate the DRASTIC Vulnerability Index (DVI) asgiven below (Aller et al. 1987):
DVI ¼ DrDw þ RrRw þ ArAw þ SrSw
þ TrTw þ IrIw þ CrCw ð1Þ
where
Dr Rating for the depth to water tableDw Weight assigned to the depth to water tableRr Rating for aquifer rechargeRw Weight for aquifer rechargeAr Rating assigned to aquifer mediaAw Weight assigned to aquifer mediaSr Rating for the soil mediaSw Weight for the soil mediaTr Rating for topography (slope)Tw Weight assigned to topography
Ir Rating assigned to impact of vadose zoneIw Weight assigned to impact of vadose zoneCr Rating for rates of hydraulic conductivityCw Weight given to hydraulic conductivity
The rating ranges were determined depending on theproperties of the study area only. The range componentdivides each DRASTIC parameter into several classes, orsignificant media types that may affect the potential forpollution (Ehteshami et al. 1991). This rating range maychange from one study area to another. Good knowledgeof the geology and hydrogeology of the research area is aprerequisite to determine rating ranges of the parameters.In this study, the range of each parameter resulted in fiveor six classes (Table 1). If minimum and maximum ratingvalues do not change, the number of range classes will notaffect the obtained result. For example, the depth to watertable parameter is divided into three classes and ratingvalues of 9, 5 and 1 were assigned for depths 0–10, 10–20and 20–30 m, respectively. Then, the same parameter wasdivided into six classes and rating values of 9, 8, 7, 5, 3and 1 were assigned for depths 0–5, 5–10, 10–15, 15–20,
Fig. 2 Methodology flowchart for DRASTIC method
2026
Hydrogeology Journal (2009) 17: 2023–2035 DOI 10.1007/s10040-009-0497-0
20–25 and 25–30 m, respectively. When the DVI valuewas calculated and the vulnerability classes (high,medium, low) were determined using the quantile classi-fication method, nearly the same results were obtained.This shows that rating value is more important than therange classes in the DRASTIC applications. The DRASTICsystem allows the user to determine a numerical value ofthe DVI that shows areas more likely to be susceptible togroundwater contamination relative to others. A higherDRASTIC index shows greater groundwater pollutionvulnerability (Lee 2003).
DRASTIC has been the most commonly used aquifervulnerability assessment method; however, it is notintended to predict the occurrence of groundwater con-tamination (USEPA 1985). Recent work has furtherimproved upon this method, evolving the method beyond
a simple rating of vulnerability, to a descriptive approachidentifying areas with similar hydrogeologic character-istics (i.e. hydrologic setting) and assessing individuallythese areas for groundwater susceptibility to potentialcontamination (Hearne et al. 1992).
In this type of vulnerability analysis, data obtainedfrom hydrogeological field investigations should be usedfor weighting of DRASTIC parameters. Thus, disadvan-tages of the DRASTIC method may be reduced to anegligible level. Accuracy of the vulnerability map shouldbe checked with available pollutant data obtained fromfield investigations such as nitrate and pesticides.
In this study, all parameter maps were prepared in aGIS environment and vulnerability classification of thebasin was performed using GIS techniques. Seven datalayers were digitized and were converted to raster data sets
Table 1 DRASTIC rating and weighting values for the various hydrogeological parameter settings (Aller et al. 1987; Al-Zabet 2002)
DRASTIC Parameters Range Rating Weighta Total weight (rating x weight) AreaPesticide Drastic (%) km2
Depth to water table (m) 5 50 to <10 10 50 8.86 60.6310 to <20 7 35 8.57 58.6420 to <30 5 25 7.32 50.0930 to 40 3 15 0.77 5.27>40 1 5 74.48 509.67
Recharge (mm) 4 4490 to <520 1 4 1.44 9.85520 to <550 3 12 9.04 61.86550 to <580 5 20 24.28 166.15580 to <610 7 28 24.78 169.57610 to <640 9 36 28.98 198.31640 to 670 10 40 11.48 78.56
Aquifer media 3 3Alluvium 10 30 29.85 204.26Limestone 9 27 38.73 265.03Conglomerate 8 24 4.4 30.11Volcanic 7 21 9.89 67.68Flysch 3 9 17.13 117.22
Soil media 5 2Absent 10 20 43.43 297.19Gravel-sand 9 45 13.9 95.12Gravel 8 40 12.13 83.01Sandy clay 3 6 17.34 118.66Clay loam 2 4 13.2 90.33
Topography (slope %) 3 10 to <2 10 30 33.64 230.202 to <6 9 27 16.95 115.996 to <12 5 15 13.32 91.1512 to 18 3 3 7.49 51.25>18 1 1 28.6 195.71
Impact of the vadoze zone 3 5Limestone 10 50 38.36 262.50Sand-gravel 8 24 12.06 82.53Gravel-sandy clay 7 21 11.04 75.55Sandy clay 6 18 5.61 38.39Tuff 3 9 11.47 78.49Clay 1 3 21.46 146.85
Conductivity(m2/s) 2 310−9 to <10−8 1 2 21.46 146.8510−8 to <10−7 3 6 11.48 78.5610−7 to <10−6 5 10 5.61 38.3910−6 to <10−5 7 14 11.03 75.4810−5 to <10−4 9 18 12.06 82.5310−4 to 10−3 10 30 38.36 262.50
a Pesticide weight was used for alluvium areas and DRASTIC weight was used for the other areas of the basin
2027
Hydrogeology Journal (2009) 17: 2023–2035 DOI 10.1007/s10040-009-0497-0
using ArcGIS. Then, the DVI was computed and thevulnerability map of the basin was prepared taken intoconsideration hydrogeological field observations andinvestigations. Weighting factors of the seven parameterswere determined depending on location properties whichare shown in Table 1. The DRASTIC and pesticideweights were used in the DVI calculation. Pesticideweights were specifically designed to address the impor-tant processes offsetting the fate and transport of pesti-
cides in the soil (Wang et al. 2007). In the study area,agricultural activities occur in the alluvium areas. Thereare no agricultural applications of pesticide in the otherareas of the basin. The location of the pesticide applicationarea can see in Fig. 1.
Pesticides are used in agriculture to inhibit growth ofvarious organisms. Pesticides include herbicides, insecti-cides, nematicides and fungicides which are used to controlweeds, insects, nematodes and diseases (Wischmeier and
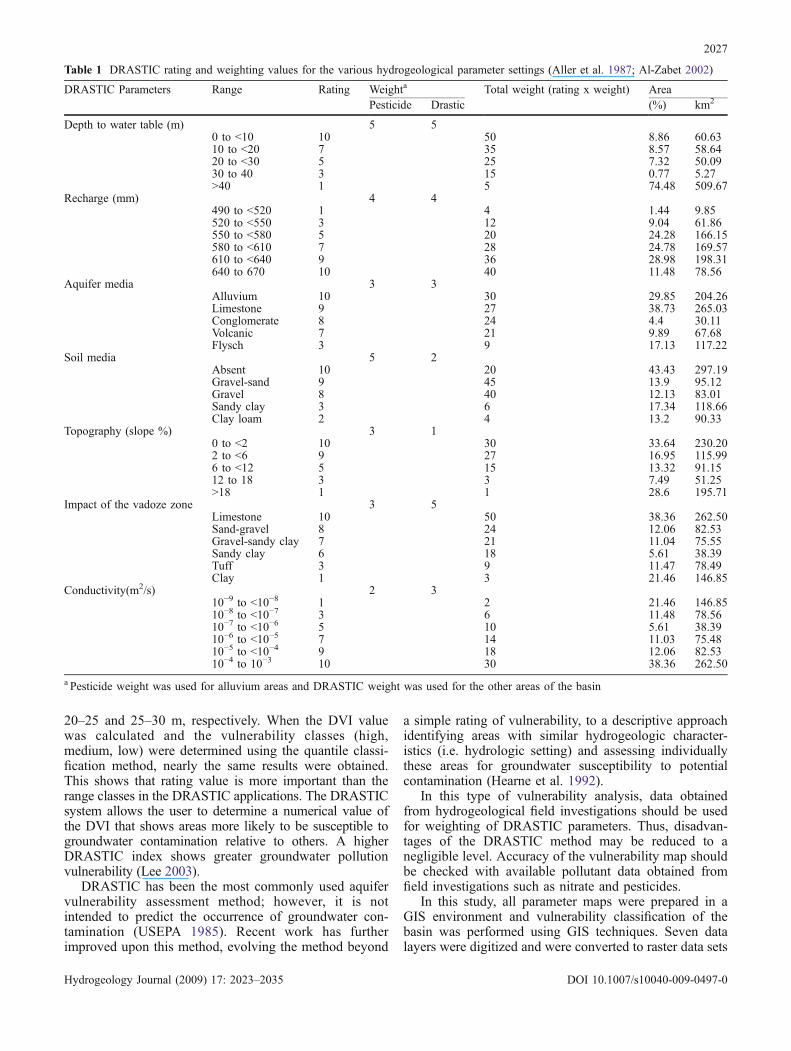
Fig. 3 Depth to water table
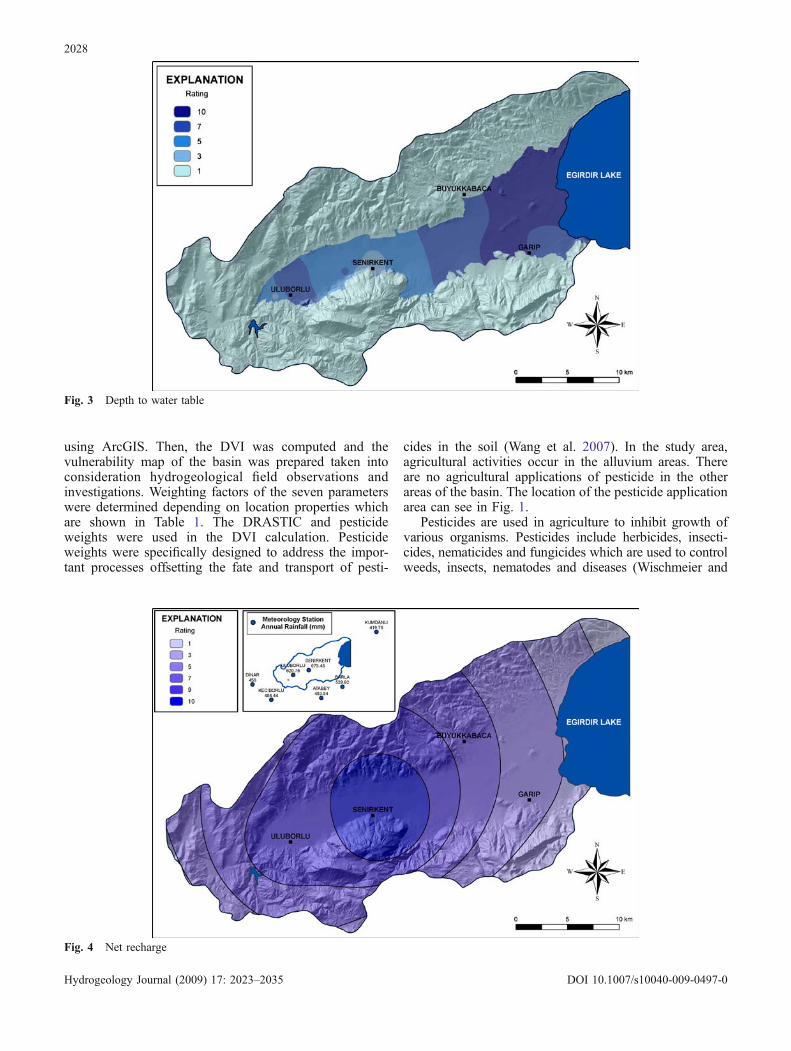
Fig. 4 Net recharge
2028
Hydrogeology Journal (2009) 17: 2023–2035 DOI 10.1007/s10040-009-0497-0
Smith 1978). The application of pesticides, when combinedwith sensitive groundwater areas, can have a largeimpact on the water quality. Agricultural contaminantssuch as pesticides and nitrate will dissolve in theirrigation water and infiltrate through the soil profile(Ahmed 2009). So, when the DVI was calculated,pesticide weight was used for alluvium areas andDRASTIC weight was used for the other areas of thebasin (Table 1; Aller et al. 1987; Al-Zabet 2002).
Evaluation of the DRASTIC vulnerability map wascarried out using groundwater quality data such as nitrate,
since high nitrate mainly originates from surface sourceslike agricultural activities and urban pollution. Also, thehigh nitrate content (> 5 mg/L) usually indicates anthro-pogenic contamination (fertilizers, farm manures, septictank, etc.). Hence, nitrate can be a good water-qualityparameter to evaluate the DRASTIC index (Jamrah et al.2007). In this study, groundwater from high, medium andlow vulnerability aquifer media was checked for nitratecontent. This evaluation was performed using analysisresults which were obtained by Seyman (2005). Spatialdistribution of nitrate (NO3) concentration was prepared.
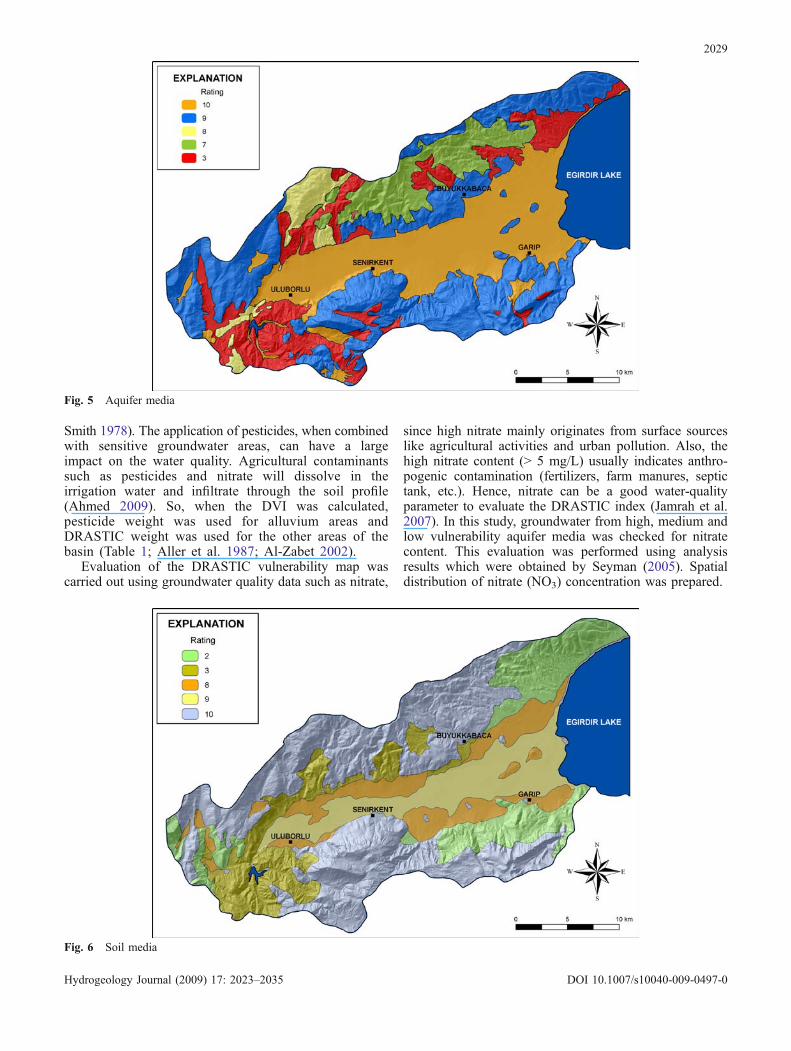
Fig. 5 Aquifer media
Fig. 6 Soil media
2029
Hydrogeology Journal (2009) 17: 2023–2035 DOI 10.1007/s10040-009-0497-0
Preparation of the aquifer vulnerability map(DRASTIC)Input data used for assessment of aquifer vulnerability inthe study area were obtained from previous investigations,the State Hydraulic Works (SHW), the State MeteorologyWorks and the Management of Agriculture and VillageWorks. The seven maps using vulnerability assessment ofthe Senirkent-Uluborlu basin with DRASTIC methodwere prepared using hydrogeological data based on GIS-ArcView. Each parameter of the DRASTIC method isexplained in the following.
Depth to water table (D)Depth to groundwater is important as it determines thedepth of the material through which a contaminant travelsbefore reaching the saturated aquifer (Al-Zabet 2002). Forthis study, groundwater head measurements were made in17 piezometers in October 2005 (Tay 2005). Then, theabsolute altitudes were measured by means of a differentialglobal positioning system (GPS). These data were recordedin the GIS environment and a groundwater depth map (D)of the basin was obtained (Fig. 3). The rating for depth towater table varies from 10 (for 0–10 m) to 1 (for > 40 m,
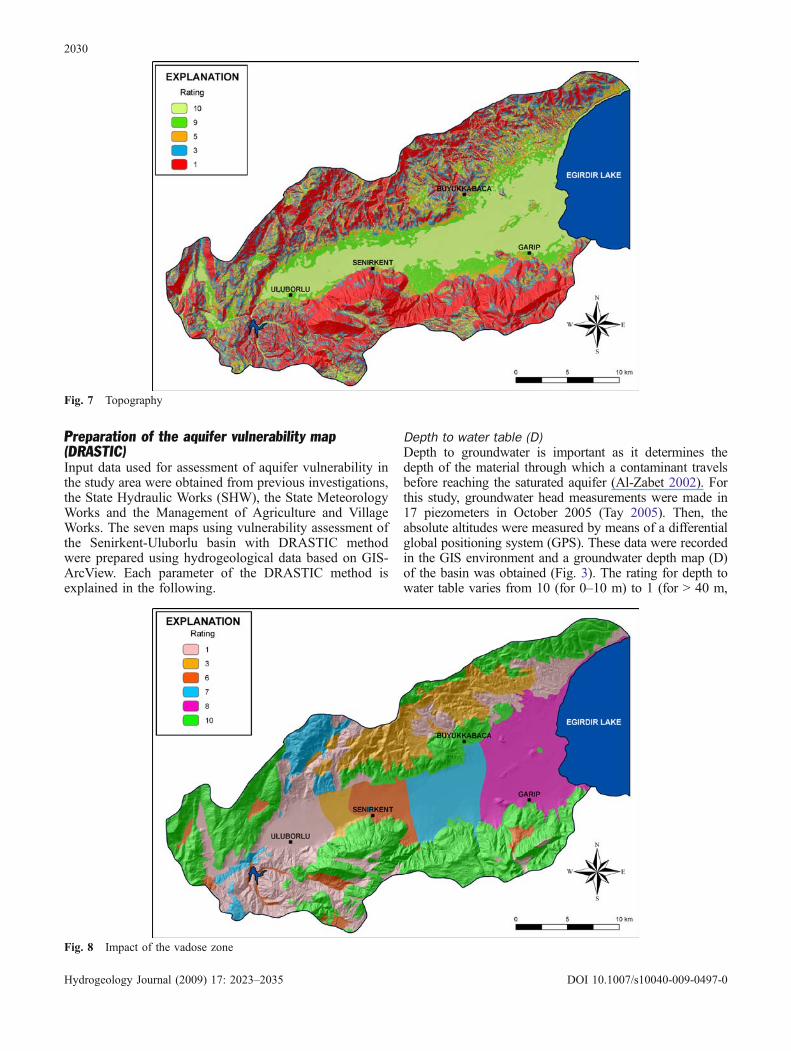
Fig. 7 Topography
Fig. 8 Impact of the vadose zone
2030
Hydrogeology Journal (2009) 17: 2023–2035 DOI 10.1007/s10040-009-0497-0
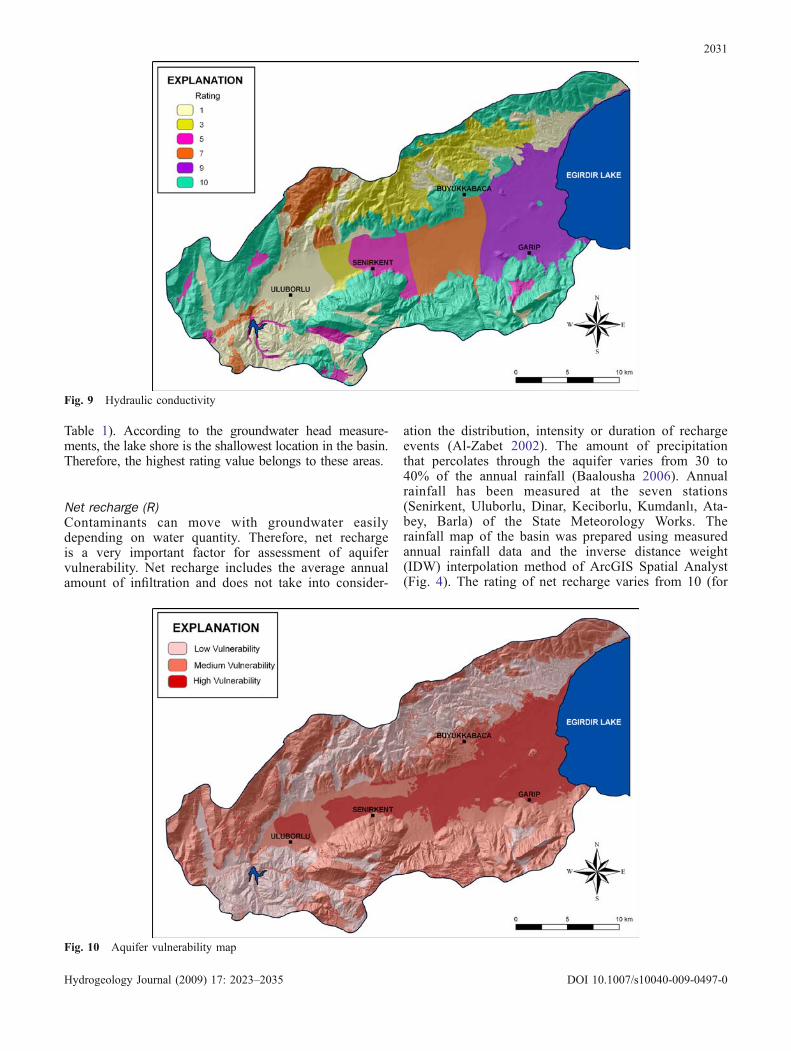
Table 1). According to the groundwater head measure-ments, the lake shore is the shallowest location in the basin.Therefore, the highest rating value belongs to these areas.
Net recharge (R)Contaminants can move with groundwater easilydepending on water quantity. Therefore, net rechargeis a very important factor for assessment of aquifervulnerability. Net recharge includes the average annualamount of infiltration and does not take into consider-
ation the distribution, intensity or duration of rechargeevents (Al-Zabet 2002). The amount of precipitationthat percolates through the aquifer varies from 30 to40% of the annual rainfall (Baalousha 2006). Annualrainfall has been measured at the seven stations(Senirkent, Uluborlu, Dinar, Keciborlu, Kumdanlı, Ata-bey, Barla) of the State Meteorology Works. Therainfall map of the basin was prepared using measuredannual rainfall data and the inverse distance weight(IDW) interpolation method of ArcGIS Spatial Analyst(Fig. 4). The rating of net recharge varies from 10 (for
Fig. 9 Hydraulic conductivity
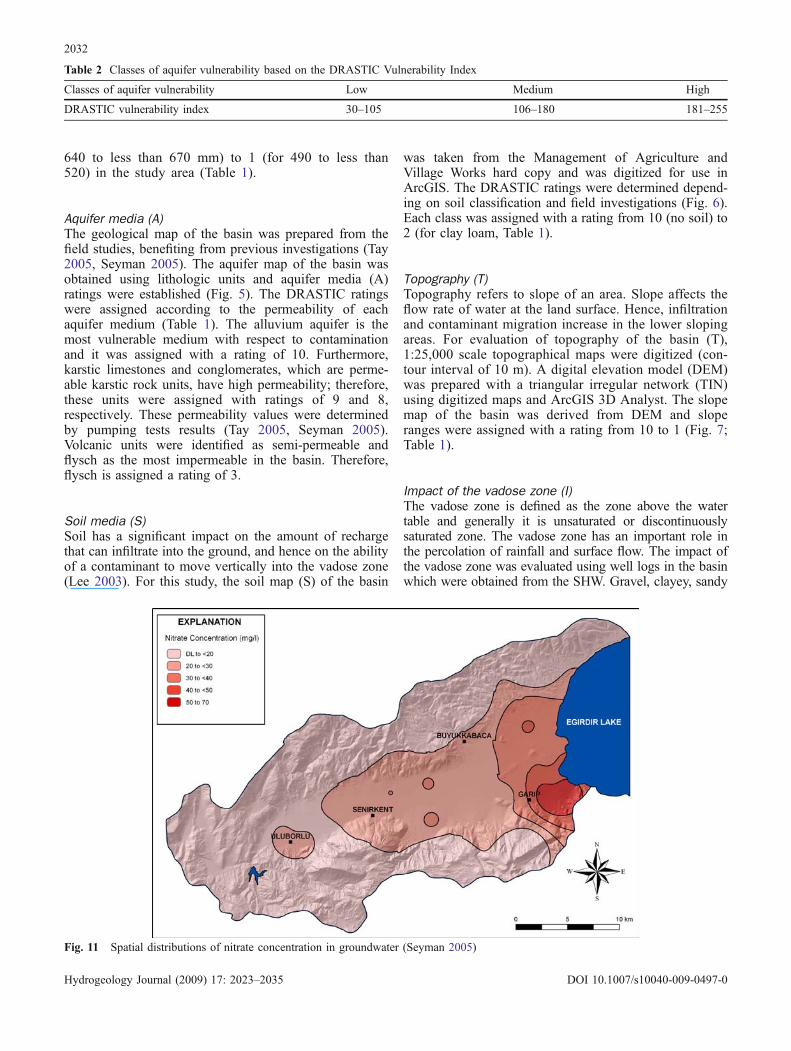
Fig. 10 Aquifer vulnerability map
2031
Hydrogeology Journal (2009) 17: 2023–2035 DOI 10.1007/s10040-009-0497-0
640 to less than 670 mm) to 1 (for 490 to less than520) in the study area (Table 1).
Aquifer media (A)The geological map of the basin was prepared from thefield studies, benefiting from previous investigations (Tay2005, Seyman 2005). The aquifer map of the basin wasobtained using lithologic units and aquifer media (A)ratings were established (Fig. 5). The DRASTIC ratingswere assigned according to the permeability of eachaquifer medium (Table 1). The alluvium aquifer is themost vulnerable medium with respect to contaminationand it was assigned with a rating of 10. Furthermore,karstic limestones and conglomerates, which are perme-able karstic rock units, have high permeability; therefore,these units were assigned with ratings of 9 and 8,respectively. These permeability values were determinedby pumping tests results (Tay 2005, Seyman 2005).Volcanic units were identified as semi-permeable andflysch as the most impermeable in the basin. Therefore,flysch is assigned a rating of 3.
Soil media (S)Soil has a significant impact on the amount of rechargethat can infiltrate into the ground, and hence on the abilityof a contaminant to move vertically into the vadose zone(Lee 2003). For this study, the soil map (S) of the basin
was taken from the Management of Agriculture andVillage Works hard copy and was digitized for use inArcGIS. The DRASTIC ratings were determined depend-ing on soil classification and field investigations (Fig. 6).Each class was assigned with a rating from 10 (no soil) to2 (for clay loam, Table 1).
Topography (T)Topography refers to slope of an area. Slope affects theflow rate of water at the land surface. Hence, infiltrationand contaminant migration increase in the lower slopingareas. For evaluation of topography of the basin (T),1:25,000 scale topographical maps were digitized (con-tour interval of 10 m). A digital elevation model (DEM)was prepared with a triangular irregular network (TIN)using digitized maps and ArcGIS 3D Analyst. The slopemap of the basin was derived from DEM and sloperanges were assigned with a rating from 10 to 1 (Fig. 7;Table 1).
Impact of the vadose zone (I)The vadose zone is defined as the zone above the watertable and generally it is unsaturated or discontinuouslysaturated zone. The vadose zone has an important role inthe percolation of rainfall and surface flow. The impact ofthe vadose zone was evaluated using well logs in the basinwhich were obtained from the SHW. Gravel, clayey, sandy
Table 2 Classes of aquifer vulnerability based on the DRASTIC Vulnerability Index
Classes of aquifer vulnerability Low Medium High
DRASTIC vulnerability index 30–105 106–180 181–255
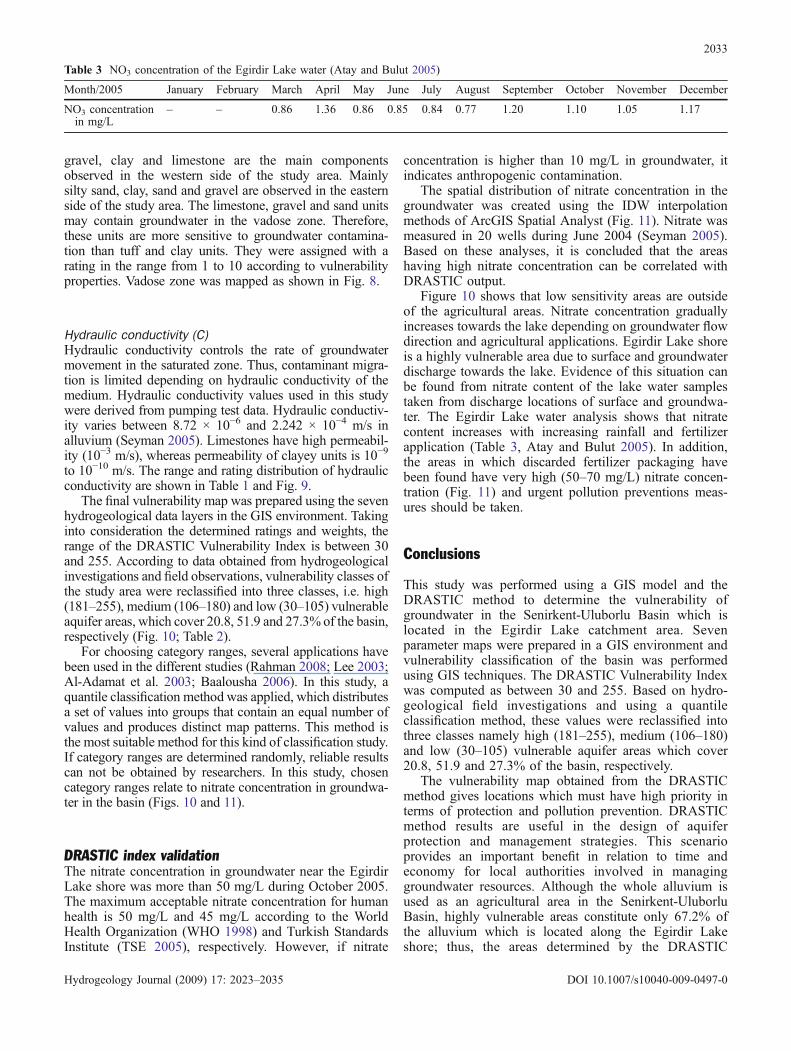
Fig. 11 Spatial distributions of nitrate concentration in groundwater (Seyman 2005)
2032
Hydrogeology Journal (2009) 17: 2023–2035 DOI 10.1007/s10040-009-0497-0
gravel, clay and limestone are the main componentsobserved in the western side of the study area. Mainlysilty sand, clay, sand and gravel are observed in the easternside of the study area. The limestone, gravel and sand unitsmay contain groundwater in the vadose zone. Therefore,these units are more sensitive to groundwater contamina-tion than tuff and clay units. They were assigned with arating in the range from 1 to 10 according to vulnerabilityproperties. Vadose zone was mapped as shown in Fig. 8.
Hydraulic conductivity (C)Hydraulic conductivity controls the rate of groundwatermovement in the saturated zone. Thus, contaminant migra-tion is limited depending on hydraulic conductivity of themedium. Hydraulic conductivity values used in this studywere derived from pumping test data. Hydraulic conductiv-ity varies between 8.72 × 10⁻⁶ and 2.242 × 10⁻⁴ m/s inalluvium (Seyman 2005). Limestones have high permeabil-ity (10−3 m/s), whereas permeability of clayey units is 10−9
to 10−10 m/s. The range and rating distribution of hydraulicconductivity are shown in Table 1 and Fig. 9.
The final vulnerability map was prepared using the sevenhydrogeological data layers in the GIS environment. Takinginto consideration the determined ratings and weights, therange of the DRASTIC Vulnerability Index is between 30and 255. According to data obtained from hydrogeologicalinvestigations and field observations, vulnerability classes ofthe study area were reclassified into three classes, i.e. high(181–255), medium (106–180) and low (30–105) vulnerableaquifer areas, which cover 20.8, 51.9 and 27.3% of the basin,respectively (Fig. 10; Table 2).
For choosing category ranges, several applications havebeen used in the different studies (Rahman 2008; Lee 2003;Al-Adamat et al. 2003; Baalousha 2006). In this study, aquantile classification method was applied, which distributesa set of values into groups that contain an equal number ofvalues and produces distinct map patterns. This method isthe most suitable method for this kind of classification study.If category ranges are determined randomly, reliable resultscan not be obtained by researchers. In this study, chosencategory ranges relate to nitrate concentration in groundwa-ter in the basin (Figs. 10 and 11).
DRASTIC index validationThe nitrate concentration in groundwater near the EgirdirLake shore was more than 50 mg/L during October 2005.The maximum acceptable nitrate concentration for humanhealth is 50 mg/L and 45 mg/L according to the WorldHealth Organization (WHO 1998) and Turkish StandardsInstitute (TSE 2005), respectively. However, if nitrate
concentration is higher than 10 mg/L in groundwater, itindicates anthropogenic contamination.
The spatial distribution of nitrate concentration in thegroundwater was created using the IDW interpolationmethods of ArcGIS Spatial Analyst (Fig. 11). Nitrate wasmeasured in 20 wells during June 2004 (Seyman 2005).Based on these analyses, it is concluded that the areashaving high nitrate concentration can be correlated withDRASTIC output.
Figure 10 shows that low sensitivity areas are outsideof the agricultural areas. Nitrate concentration graduallyincreases towards the lake depending on groundwater flowdirection and agricultural applications. Egirdir Lake shoreis a highly vulnerable area due to surface and groundwaterdischarge towards the lake. Evidence of this situation canbe found from nitrate content of the lake water samplestaken from discharge locations of surface and groundwa-ter. The Egirdir Lake water analysis shows that nitratecontent increases with increasing rainfall and fertilizerapplication (Table 3, Atay and Bulut 2005). In addition,the areas in which discarded fertilizer packaging havebeen found have very high (50–70 mg/L) nitrate concen-tration (Fig. 11) and urgent pollution preventions meas-ures should be taken.
Conclusions
This study was performed using a GIS model and theDRASTIC method to determine the vulnerability ofgroundwater in the Senirkent-Uluborlu Basin which islocated in the Egirdir Lake catchment area. Sevenparameter maps were prepared in a GIS environment andvulnerability classification of the basin was performedusing GIS techniques. The DRASTIC Vulnerability Indexwas computed as between 30 and 255. Based on hydro-geological field investigations and using a quantileclassification method, these values were reclassified intothree classes namely high (181–255), medium (106–180)and low (30–105) vulnerable aquifer areas which cover20.8, 51.9 and 27.3% of the basin, respectively.
The vulnerability map obtained from the DRASTICmethod gives locations which must have high priority interms of protection and pollution prevention. DRASTICmethod results are useful in the design of aquiferprotection and management strategies. This scenarioprovides an important benefit in relation to time andeconomy for local authorities involved in managinggroundwater resources. Although the whole alluvium isused as an agricultural area in the Senirkent-UluborluBasin, highly vulnerable areas constitute only 67.2% ofthe alluvium which is located along the Egirdir Lakeshore; thus, the areas determined by the DRASTIC
Table 3 NO3 concentration of the Egirdir Lake water (Atay and Bulut 2005)
Month/2005 January February March April May June July August September October November December
NO3 concentrationin mg/L
– – 0.86 1.36 0.86 0.85 0.84 0.77 1.20 1.10 1.05 1.17
2033
Hydrogeology Journal (2009) 17: 2023–2035 DOI 10.1007/s10040-009-0497-0
method should be investigated as priority in terms ofcontamination.
Nitrate concentration of groundwater was evaluated forvalidation of the DRASTIC results. These evaluationsshow that high nitrate concentrations correspond topossible nitrate enrichment in the highly vulnerableaquifer medium. The low sensitivity areas are outside ofthe agricultural areas in the basin. Nitrate concentrationsgradually increase towards the lake depending on ground-water flow direction and agricultural applications, andhigh nitrate contamination is observed in the locationswhere groundwater and surface water discharge to EgirdirLake. This indicates that the obtained results are realisticand representative to the actual situation in the field.Therefore, the DRASTIC method is utilizable in the lakebasin. If agricultural applications continue for a long time,nitrate contamination will increase step by step in thebasin.
The vulnerability assessment of the Senirkent-UluborluBasin shows that the limited groundwater resources arenot sensitive. In order that the groundwater flow directionis towards Egirdir Lake, which is used for drinking water,groundwater protection plans and lake-water-qualityinvestigations should be performed in the basin. Further-more, vulnerability of the other lake basins should beevaluated and a future risk assessment should be derivedfrom these results.
Acknowledgements The authors would like to thank Dr. ÖmerElitok for his contributions in improving the manuscript.
References
Ahmed AA (2009) Using generic and pesticide DRASTIC GIS-based models for vulnerability assessment of the Quaternaryaquifer at Sohag, Egypt. Hydrogeol J. doi:10.1007/s10040-009-0433-3
Al-Adamat RAN, Foster IDL, Baban SMJ (2003) Groundwatervulnerability and risk mapping for the Basaltic aquifer of theAzraq basin of Jordan using GIS, remote sensing andDRASTIC. Appl Geogr 23:303–324
Al-Zabet T (2002) Evaluation of aquifer vulnerability to contami-nation potential using the DRASTIC method. Env Geol 43:203–208
Aller L, Bennett T, Lehr JH, Petty RH, Hackett G (1987)DRASTIC: a standardised system for evaluating groundwaterpollution potential using hydrogeologic settings. USEPA Report600/2- 87/035, Robert S. Kerr Environmental Research Labo-ratory, Ada, Oklahoma
Atay R, Bulut C (2005) Beyşehir, Egirdir, Kovada, Çivril veKarakuyu Göllerinde Su Kirliliği Projesi [The project of watercontamination in the Beyşehir, Egirdir, Kovada, Çivril andKarakuyu Lakes], Tarım ve Köy İşleri Bakanlığı-Egirdir SuÜrünleri Araştırma Enstitüsü Müdürlüğü Araştırma Raporu.Isparta, Turkey
Baalousha H (2006) Vulnerability assessment for the Gaza Strip,Palestine using DRASTIC. Env Geol 50:405–414
Bachmat Y, Collin M (1990) Management oriented assessment ofgroundwater vulnerability to pollution. Israel HydrologicalService Report, Israel Hydrological Service, Jerusalem
Cameron E, Peloso GF (2001) An application of fuzzy logic to theassessment of aquifers’ pollution potential. Env Geol 40:1305–1315
Civita M (1994) Le carte della vulnerabilit`a degli acquiferiall’inquinamiento: teoria e pratica [Contamination vulnerabilitymapping of the aquifer: theory and practice]. Quaderni diTecniche di Protezione Ambientale, Pitagora, Italy
Doerfliger N, Zwahlen F (1998) Groundwater vulnerability map-ping in karstic regions (EPIK): application to GroundwaterProtection Zones. Swiss Agency for the Environment, Forestsand Landscape (SAEFL), Bern, Switzerland
Doerfliger N, Jeannin PY, Zwahlen F (1999) Water vulnerabilityassessment in karst environments: a new method of definingprotection areas using a multi-attribute approach and GIS tools(EPIK method). Env Geol 39(2):165–176
Ehteshami M, Peralta RC, Eisele H, Deer H, Tindall T (1991)Assessing pesticide contamination to ground water: a rapidapproach. Ground Water 29:862–868
Foster S (1987) Fundamental concepts in aquifer vulnerability,pollution risk and protection strategy. In: Van DuijvenboodenW, Van Waegeningh HG (eds) Vulnerability of soil andgroundwater to pollutants. Committee on Hydrological Re-search, The Hague, pp 69–86
Gogu R, Dassargues A (2000) Current trends and future challengesin groundwater vulnerability assessment using overly and indexmethods. Env Geol 39(6):549–559
Goldscheider N, Klute M, Sturm S, Hotzl H (2000) The PI method:a GIS-based approach to mapping groundwater vulnerabilitywith special consideration of karst aquifers. Z Angew Geol 46(3):157–166
Hearne GM, Wireman A, Campbell S, Turner A, Ingersall GP(1992) Vulnerability of the uppermost groundwater to contam-ination in the Greater Denver Area, Colorado. US Geol SurvWater Resour Invest Rep 92-4143, 241pp
Hrkal Z (2001) Vulnerability of groundwater to acid deposition, JizerskeMountains, northern Czech Republic: construction and reliability ofa GIS-based vulnerability map. Hydrogeol J 9:348–357
Jamrah A, Futaisi AA, Rajmohan N, Al-Yaroubi S (2007)Assessment of groundwater vulnerability in the coastal regionof Oman using DRASTIC index method in GIS environment.Environ Monit Assess. doi:10.1007/s10661-007-0104-6
Kim Y, Hamm S (1999) Assessment of the potential for groundwa-ter contamination using the DRASTIC/EGIS technique,Cheongju area, South Korea. Hydrogeol J 7:227–235
Koçyiğit A (1983) Tectonics of Hoyran Lake (Isparta Angle) region(in Turkish). Bull Geol Soc Turkey C(26):1–10
Lake IR, Lovett AA, Hiscock KM (2003) Evaluating factorsinfluencing groundwater vulnerability to nitrate pollution:developing the potential of GIS. J Environ Manage 68:315–328
Lee S (2003) Evaluation of waste disposal site using the DRASTICsystem in southern Korea. Env Geol 44:654–664
Margat J (1968) Vulnerabilite des nappes d’eau souterraine a lapollution [Groundwater vulnerability to contamination]. Basesde al cartographie, (Doc.) 68 SGC 198 HYD, BRGM, Orleans,France
Melloul AJ, Collin M (1998) A proposed index for aquifer water-quality assessment: the case of Israel’s Sharon region. J EnvironManage 54(2):131–142
Mendoza JA, Barmen G (2006) Assessment of groundwatervulnerability in the Río Artiguas basin, Nicaragua. Env Geol50:569–580
Merchant JW (1994) GIS-based groundwater pollution hazardassessment: a critical review of the DRASTIC model. Photo-gramm Eng Remote Sens 60(9):1117–1127
Panagopoulos GP, Antonakos AK, Lambrakis NJ (2006) Optimiza-tion of the DRASTIC method for groundwater vulnerabilityassessment via the use of simple statistical methods and GIS.Hydrogeol J 14:894–911
Rahman A (2008) A GIS based DRASTIC model for assessinggroundwater vulnerability in shallow aquifer in Aligarh, India.Appl Geogr 28:32–53
Rosen L (1994) A study of the DRASTIC methodology withemphasis on Swedish conditions. Ground Water 32:278–285
Rupert MG (2001) Calibration of the DRASTIC ground watervulnerability mapping method. Ground Water 39(4):625–630
2034
Hydrogeology Journal (2009) 17: 2023–2035 DOI 10.1007/s10040-009-0497-0
Secunda S, Collin M, Melloul AJ (1998) Groundwater vulnerabilityassessment using a composite model combining DRASTIC withextensive land use in Israel’s Sharon region. J Environ Manage54:39–57
Seyman F (2005) Hydrogeological investigations of Senirkent-Uluborlu (Isparta) basin (in Turkish). M Sci Thesis, SuleymanDemirel University, Turkey
Tay S (2005) Geological and geotechnical investigations in Senirkent-Uluborlu (Isparta) Basin for solid waste landfill site selection (inTurkish). M Sci Thesis, Suleyman Demirel University, Turkey
Thirumalaivasan D, Karmegam M, Venugopal K (2003) AHP-DRASTIC: software for specific aquifer vulnerability assess-ment using DRASTIC model and GIS. Environ Model Softw18:645–656
TSE (Turkish Standards Institute)(2005) Water intended for humanconsumption (in Turkish). TS266, TSE, Ankara, Turkey
USEPA (1985) DRASTIC: a standard system for evaluatinggroundwater potential using hydrogeological settings. WA/EPASeries, Ada, OK, USA
Van Stempvoort D, Ewert L, Wassenaar L (1993) Aquifervulnerability index (AVI): a GIS compatible method for
groundwater vulnerability mapping. Can Water Resour J18:25–37
Vias JM, Andreo B, Perles MJ, Carrasco F (2005) A comparativestudy of four schemes for groundwater vulnerability mapping ina diffuse flow carbonate aquifer under Mediterranean climaticconditions. Env Geol 47:586–595
Vias JM, Andreo B, Perles MJ, Carrasco F, Vadillo I, Jimenez P(2006) Proposed method for groundwater vulnerability mappingin carbonate (karstic) aquifers: the COP method. Application intwo pilot sites in southern Spain. Hydrogeol J 14:912–925
Vrba J, Zaporozec A (1994) Guidebook on mapping groundwatervulnerability. IAH, Heise, Hanover, Germany
Wang Y, Merkel BJ, Li Y, Ye H, Fu S, Ihm D (2007) Vulnerabilityof groundwater in Quaternary aquifers to organic contaminants:a case study in Wuhan City, China. Env Geol 53:479–484
WHO (1998) Guidelines for drinking water quality. Addendum tovol 2, 2nd edn. Health criteria and other supporting information(WHO/EOS/98.1). World Health Organization, Geneva
Wischmeier WH, Smith DD (1978) Predicting rainfall-erosionlosses: a guide to conservation planning. Agr. handbook no.537, USDA, Washington, DC
2035
Hydrogeology Journal (2009) 17: 2023–2035 DOI 10.1007/s10040-009-0497-0


