Embed Size (px)
Citation preview

* Corresponding author: [email protected]
1
Volume 1, No.1, September 2013, Pages 1-12
Assessment of Heavy Metal Contamination in Topsoil of Northern Coasts of Persian Gulf Fatemeh Valizadeh-kakhki 1, 2, Mohammad Pauzi Zakaria 2, Mehdi Mohammadi 1,*, Hassan Tajik 3, Elaheh Valizadeh-kakhki 4
1Persian Gulf Research Institute, Persian Gulf University Bushehr, Iran 2 Faculty of Environmental Studies, University Putra Malaysia, Malaysia 3Faculty of Science, Gilan University, Gilan, Iran 4Islamic Azad University of Mashhad, Mashhad, Iran
ARTICLE INFO
ABSTRACT
Received July 18, 2013 Accepted August 29, 2013
Persian Gulf and its coastal areas are the world's largest source of crude oil and related industries govern the region. One of the contaminants in this area is heavy metals associated with oil spill. More importantly, vanadium, nickel and zinc can be named in this regard. In this study, the contamination of northern coasts of Persian Gulf is selected to investigate for trace metals of V, Ni, Cd, Co, Zn, Cu, and Pb pollution in soils, their distribution and levels of contamination. The study was carried out on the northern coasts of Persian Gulf including three provinces of Bushehr, Khuzestan and Hormozgan. The results revealed a great increase in the amount of vanadium in most of the sampling sites to be higher than background values for soil. In Southern Pars Gas Field there was the concentration of 7713.77 mg Kg-1. The concentration of other metals was almost high and a great relationship between vanadium, zinc, cadmium, and lead was found.
Keywords heavy metals Persian Gulf topsoil contamination vanadium nickel
1 INTRODUCTION
Persian Gulf and its coastal areas are the world's largest single source of crude oil and related industries govern the region. Safaniya Oil Field, the world's largest offshore oil field, is located in the Persian Gulf. Persian Gulf with its own geographical and ecological characteristics of marine ecosystems is among the rarest marine ecosystem in the world. It is well-known as a great economic resource of oil and gas and two-third of the world oil
resources are located there. Each year, around 25000 oil and non-oil tankers have traffic in it, so it is one of the world's busiest waterways for oil and non-oil tankers (Metz,1993).
About 50 percent of the pollution of the Persian Gulf is caused by non-oil pollutants and the remaining 50 percent is due to oil sources. Most of the oil discharged in the environment originates from natural sources and fuel oil consumption. However, the number of accidental spills has highly

Valizadeh-kakhki et al. / Environmental Studies of Persian Gulf 1(1) (2013) 1-12
2
decreased over the years and nowadays, oil contamination is mostly attributable to a limited number of oil tanker accidents (Anderson and LaBelle, 2000). Nevertheless, although petroleum products also contain significant concentrations of trace metals (Metwally, et al., 1997; Márquez, et al., 1999), so far few studies have investigated the impact of these elements on the environment.
Heavy metals at trace levels exist in natural water, air, dusts, soils and sediments play an important role inhuman life (Santos, et al., 2005). Soils are critical environment where rock, air and water interface. Consequently, they are subjected to a number of pollutants due to different anthropogenic activities (e.g. Industrial, agricultural, transport etc.) (Facchinelli, et al., 2001;Jonathan, et al., 2004). The heavy (density> 5g.cm-3) and light (density <5g.cm-3) trace metals are all found in crude oil. Those usually available in crude oil include Cd, Cr, Cu, Fe, Hg, Ni, V, Pb, As, Zn, Co, Mn, Pt, Ag, and Au. They are introduced into crude oil through many processes such as the disintegration of natural organometalic plant metaboliteschlorophyll. The accumulation of metals from the overlaying water to the soildependson a number of external environmental factors such as pH, ionic strength and concentration of organic and inorganic ligands (Guvenē, et al., 2003).
Some of the trace metals are hazardous while others are not. Some studies (Bu-Olayan and Al-Yakoob, 1998;Cantú, et al., 2000)for instance, have shown that nickel and vanadium are not very mobile in fuel oil, and consequently their transfer to the aqueous phase is extremely slow. More importantly, Vanadium is the most abundant metal in petroleum with the concentration of 1000 mg Kg-1. It primarily exists in porphyrin complexes and other organic compounds(Adams, et al.,
1982). Vanadium is, however, proposed as an internal marker for the monitoring of microbial degradation of crude oil (Sasaki, et al., 1998). The trace metals form a very important part of the non-hydrocarbon component of crude oil. They are described as metals occurring at1000 mg Kg-1 or less in the environmental matrix understudy.
Therefore, in order to investigate heavy metals contamination in soil, northern coasts of Persian Gulf was selected to study the distribution and levels of soil contamination in this region. 2 MATERIALS AND METHODS 2.1 Site description
The study was carried out on the northern coasts of Persian Gulf including three provinces of Bushehr, Khuzestan, and Hormozgan. Bushehr Province with an area of 27653 km2 is situated in the northern part of Persian Gulf and has a725 km border with the Persian Gulf, so economically and ecologically it is one of the most important provinces of the country. Weather is hot and humid with a dramatic deficiency in vegetation in this province. This province has 62.5 percent of gas reservoirs and 8 percent of oil reservoirs of Iran. About 95 percent of the crude oil is exported from Khark terminal as the largest energy pole in the country. Several oil platforms, including marine and land are active in the province; therefore, emphasis should be put on environmental research in the field of oil pollution in this part of the country.
Khuzestan, a province in the southwest of the country, borders the Persian Gulf. It covers an area of 63,238 km².The climate is generally hot and occasionally humid, predominantly in the south, whereas winters are much more pleasant and dry.

Valizadeh-kakhki et al. / Environmental Studies of Persian Gulf 1(1) (2013) 1-12
3
Fig.1. Study areas and soil sampling locations (a) location of Iran (b) Provinces of the sampling sites (c) Soil
sampling location.
Summertime temperatures routinely surpass 50 degrees Celsius and in the winter, it can drop below freezing, with occasional snowfall.
Hormozgan as the third province under study here has an area of 70,697 km2. It has 14 islands located in the Persian Gulf, and 1,000 km of coastline. The province of Hormozgan experiences a very hot and humid climate, with temperatures sometimes exceeding 49 degrees Celsius in summers. 2.2 Sampling design, soil collection and preparation
Soils from the three provinces of the northern part of Persian Gulf were selected. Bushehr was selected as gas and oil producer and Khuzestan and Hormozgan as just oil producers. Using aerial and satellite images, relative location of each sampling site was investigated first. Soils were taken using quadrate which is thrown thrice randomly.
Final sample was a composite one involving 10 cm of top soil. The samples of soil were collected from northern coasts of Persian Gulf. The positions of sampling sites were recorded using GPS and are shown in Table1. All samplings were conducted during June 2011. Map of sampling is shown in Fig.1. The samples of soil (0–10 cm) were collected in pre-cleaned containers with dichloromethane and n-hexane. The samples were stored in the ice box and darkness during transportation to the laboratory of Persian Gulf Research Institute (PGRI) and kept frozen (−20°C) till being analyzed. 2.3 Laboratory analysis
Determination of moisture content to compare all sample concentrations with the accepted base, soil moisture content must be calculated to explain the result based on dry weight. So, a constant weight of watch glass was obtained
Persian Gulf
Persian Gulf

Valizadeh-kakhki et al. / Environmental Studies of Persian Gulf 1(1) (2013) 1-12
4
Table 1 Locations of sampling stations.
Sample Site Sample Code DMSa (N-E) Soil Texture pH EC(ms)
Haleh S1b N:27.23.36.3 E:52.38.50.1
Sandy loam 8.2 0.55Zabareh-Bonood S2 N:27.21.40.4
E:52.42.49.5
Silt loam 6.9 0.037Lavarchahu-Hashniz
S3 N:27.04.35.4
E:53.31.05.1
Sandy loam 8.2 0.1687 km to bandarlengeh
S4 N:26.48.36.8
E:54.11.03.6
Sandy loam 8.3 0.91Charak and Lengeh S5 N:26.47.35.2
E:54.18.09.7
Silt loam 7.7 1.58Akhand-Tomato AgS1c N:27.26.26.5
E:52.44.50.0
Sandy loam 7.8 4.39Phase 9,10-17,18-20,21 S6 N:27.29.38.7
E:52.36.49.2
Sandy loam 7.7 0.036Phase 2,3 S8 N:27.31.00.2
E:52.34.54.8
Sandy loam 7.5 29.4Phase 1 S9 N:27.31.28.6
E:52.34.30.5
loam 7.8 1.98Petrochemistry S10 N:27.33.15.1
E:52.33.47.8
Sandy loam 7.7 1.39Petrochemistry S11 N:27.34.33.6
E:52.32.22.2
Silt loam 8.4 16.32Jam (water melon) AgS2 N:27.49.27.2
E:52.19.53.7
loam 8 0.3Southern Mianloo S12 N:27.46.48.8
E:52.07.18.1
Sandy loam 7.8 1.81Dayyer S13 N:27.50.15.1
E:51.57.05.0
Sandy loam 7.8 1.71Genaveh AgS3 N:29.36.09.1
E:50.30.22.4
Silt loam 7.7 0.01Emam Hassan S14 N:25.59.48.5
E:51.26.40.00
Silt loam 7.6 60.5Deylam-Amery AgS5 N:30.09.00.7
E:50.10.56.2
Sandy loam 7 3.07Deylam-Amery S15 N:30.08.59.8
E:50.11.06.00
Silt loam 8.2 1.68Deylam-Hendijan S16 N:30.06.38.00
E:50.09.11.6
Silty clay loam 7.6 96.5Hendijan AgS4 N:30.13.18.3
E:49.42.38.9
Silt loam 7.7 572Bandar Emam S17 N:30.34.44.0
E:49.02.30.2
Silt loam 7.9 10.56Khoramshahr S18 N:30.25.15.6
E:48.11.14.7
Silty clay loam 7.8 86.6Abadan S19 N:30.21.12.4
E:48.14.59.7
Silt loam 7.9 9.98Abadan-Emam S20 N:30.26.13.3
E:48.26.10.9
Sandy loam 8.8 131.5Lian Park Bushehr S21 N:28.52.34.1
E:50.50.52.4
Silt loam 7.9 10.29aDMS (N–E)=Degree Minute Second (North–East) of geographic coordinates of the sampling sites. bS=soil. cAgS = Agricultural Soil.
and thereafter, 20 g of each sample was weighed into the watch glass, and transferred into the oven for 1 h at 110 °C.
The samples were cooled inside desiccators for 30 min before a constant weight of the sample and watch glass was recorded after heating and cooling. Moisture content was estimated as:
% Moisture Content = [W1-(W3-W2)]×100W1 Where W1 is weight of sample; W2 is Constant weight of watch glass; and W3 is Weight of sample + watch glass after heating and cooling.

Valizadeh-kakhki et al. / Environmental Studies of Persian Gulf 1(1) (2013) 1-12
5
Table 2 Published and certified data for MESS-3 (mg kg-1)
Element Published data Obtained data of the present study Vanadium 243±10 234.3 Nickel 46.9±2.2 44.65
2.3 Determination of soil pH and electrical conductivity (EC) Since soil alkalinity or acidity and salinity influence availability of heavy metals, it is needed to measure pH and EC of the studied soil samples. Hence, 50 ml of distilled water (in a sample cell) was added to ten grams of each soil sample. The lump of the soil was stirred to form homogenous slurry. Then pH meter (Jenway 3015) and EC meter (Jenway 4010) probes were immersed into the sample respectively and allowed to stabilize at 25 °C. Next, pH and EC of the sample were recorded. 2.4 Total organic carbon (TOC) content
Total organic carbon has high affinity with the accumulation of heavy metals in soil. So, in order to find their sources in soil, it is necessary to calculate them. Therefore, one gram of each oven-dried in 60-70 °C soil samples from the fraction of particles < 2 mm was put into aconical flask and 10 ml of 1N potassium dichromate solution was added and swirled gently to disperse the sample in the solution. Next, 20 ml of concentrated sulphuric acid was added gently into the flask and swirled gently until sample and reagents were mixed and finally swirled vigorously for about a minute. Eventually, the color changed to dark green. The flask was allowed to stand in a fume cupboard overnight. Samples were centrifuged in 4000-5000 rpm for 10 min. Standard calibration curve is drawn by given saccarose concentration. Sample concentration was read in 490-890 wavelengths. A blank determination was carried out to standardize the dichromate (ISO 14235:1998).
2.5 Heavy metals Nitric–perchloric acid digestion was
performed following the procedure recommended by the (AOAC, 1990). One gram of oven dried sample was placed in a 250 ml digestion tube and 10 ml of concentrated HNO3 was added. The mixture was boiled gently for 30–45 min to oxidize all easily oxidizable matter. Being balanced with the ambient temperature, 5 ml of concentrated HClO4 was added and the mixture was boiled gently for 1 hr in 140°C and subsequently 2 more hours in 100°C until dense white fumes appeared. After cooling, 20 ml of distilled water was added and the mixture was boiled further to release any fumes. The solution was cooled, further filtered through <0.45 Millipore filter paper and transferred quantitatively to a 25 ml volumetric flask by adding distilled water and kept cool in 4 °C till further analysis. (Adams, et al., 1982). The metal determination of the solutions was performed with Shimadzu AA-670 atomic absorption spectrometer using the calibration curve method. A standard sample (MESS-3) was applied to check the precision of the analysis. Certified concentrations for the elements are shown in Table 2. 2.6 Total nitrogen
In order to calculate carbon to nitrogen ratio (C/N) for soil it is needed to analyze total nitrogen of the soil. It helps to estimate the relationship of heavy metals and organic matter and the most important element of it (C/N) to evaluate their concentration in different soil application.

Valizadeh-kakhki et al. / Environmental Studies of Persian Gulf 1(1) (2013) 1-12
6
Table 3 Trace metal concentrations in soil subsamples (mg Kg-1 soil dry weight)
Soil Cd Co Ni Pb Cu Zn V V/Ni S1 3.02 14.27 35.33 29.17 22.43 51.17 6729.17 190.47 S2 2.13 9.42 32.5 23.18 10.53 36.36 4125.02 126.92 S3 3.21 7.32 20.52 29.13 0.37 37.30 6108.59 297.72 S4 2.77 7.83 27.84 26.99 7.36 33.36 4774.95 171.48 S5 2.68 11.47 40.07 35.47 11.54 49.20 5228.20 130.48 S6 3.38 9.13 17.59 35.24 29.47 105.68 7713.77 438.37 S7 3.07 9.06 15.59 34.01 35.78 87.59 7367.41 472.44 S8 3.14 6.85 13.15 41.74 29.13 108.73 5901.85 448.63 S9 3.51 10.55 21.14 44.15 25.07 101.69 7628.13 360.76 S10 2.39 13.32 30.58 25.79 30.50 109.71 5519.79 180.52 S11 2.61 7.19 13.01 24.73 32.72 96.13 6604.02 507.65 S12 3.67 11.47 27.06 40.84 7.35 48.51 7741.38 286.07 S13 2.13 7.24 23.38 23.36 10.06 39.91 4586.50 196.16 S14 1.68 13.68 47.92 22.45 17.61 50.79 3084.90 64.37 S15 1.71 8.16 33.33 14.98 9.96 33.73 3435.14 103.05 S16 2.12 7.18 32.18 25.36 15.09 41.79 3633.42 112.9 S17 2.99 11.42 38.20 33.31 11.89 53.21 5024.78 131.52 S18 3.28 8.87 34.07 53.35 24.08 89.99 4390.51 128.85 S19 3.15 19.27 71.45 52.55 54.95 92.96 4752.74 66.51 S20 3.47 10.54 41.096 36.48 35.76 140.95 3408.70 82.94 S21 2.53 11.77 35.18 26.67 12.56 41.39 4949.07 140.67 AgS1 2.73 5.04 14.27 25.82 5.78 42.57 6163.75 431.78 AgS2 2.73 9.64 26.66 27.98 8.10 76.04 5765.90 216.23 AgS3 2.04 14.34 50.27 28.67 23.28 56.25 3963.68 78.85 AgS4 2.46 15.62 34.58 31.22 89.08 46.44 5220.22 150.97 AgS5 1.87 12.29 38.77 23.86 12.07 38.23 3665.42 94.54
It helps to find out if it is related to oil pollution or it is indigenous. Therefore, to digest soil for nitrogen analysis, 0.5 g of air dried soil was added to the experimental tubes and 2 catalyzer tablets were added. 15 ml of concentrated H2SO4 was added into the samples and they were packed in 2020 digester in 400 °C for 1 hr. When digestion was completed, a bluish green color appeared. The last step was to analyze the samples using FOSS 2400 Kjeltec Analyzer Unit. 3 RESULTS 3.1 Trace heavy metals
The concentrations of heavy metals of Cd,
Co, Ni, Pb, Cu, Zn, V in the soils of south of Iran are displayed in Table 3. This is the first comprehensive study carried out for soil within the mentioned area. Meanwhile, there was not any background value to compare with the obtained results or to make the geoaccumulation index.
In order to find the inter-relationships among trace metals concentration in soil and some soil properties such as TOC, C/N, pH and EC correlation coefficient values were computed (Table 4).
Trace metal concentrations were converted into a dendrogram using cluster analysis. Cluster analysis is composed of two distinct

Valizadeh-kakhki et al. / Environmental Studies of Persian Gulf 1(1) (2013) 1-12
7
Table 4 Correlation coefficient among trace metals and soil properties
Trace metals Zn Cu Co Cd Pb Ni V TOC
r 0.1458 0.2049 0.12097 0.03248 0.21308 0.20087 0.34677 P value 0.4772 0.3151 0.5561 0.8748 0.2959 0.3251 0.0826
C/N r 0.00137 0.10126 0.07661 0.4182 0.03906 0.1858 0.3499 P value 0.9945 0.6225 0.7099 0.5196 0.8497 0.3634 0.0797
pH r 0.2672 0.02738 0.09606 0.3587 0.04684 0.02097 0.07065 P value 0.1869 0.8943 0.6406 0.0719 0.8202 0.9185 0.7316
EC r 0.00264 0.7653 0.2760 0.0536 0.0665 0.09518 0.1401 P value 0.9894 <.0001 0.1723 0.7946 0.7468 0.6436 0.4947
clusters which provide visual means for easier interpretation of data.
Correlation coefficients for all of the metals and parameters such as TOC, C/N, pH and EC did not show any significant correlation among them. So, they were mostly derived from outside inputs for the soil or they were related to the intrinsic characteristics of the rocks and soils of the region except for vanadium. 3.2 Zinc, cadmium, lead and vanadium
The concentrations of Zn, Cd, Pb and V were in the ranges of (33.35-140.95 mg Kg-1), (1.68-3.67 mg Kg-1), (14.98- 53.35 mg Kg-1) and (3084.9-7741.4 mg Kg-1) respectively. They are grouped together since they are in a similar cluster. As Vanadium is an indicator of oil pollution, it shows that all these metals are derived from petroleum pollution. Although they show similar clustering, there is not high levels of lead, and Zinc as they are compared to background values of likelihood of heavy metals existence in soil based on Fabis (1987) (Table 5). Most of them have attained their natural background levels; hence it does not show any evidence that these elements are derived from pollutant sources although there
are some exceptions as well. Cadmium in some of the subsamples was higher than its acceptable value in S12, S6, S9 and S21. As a result, it is a proof of soil contamination with petroleum. Moreover, vanadium which was in a high range in all the subsamples in all three provinces is undoubtedly an indicator of oil pollution within all sampling sites. Also, it revealed high concentrations in one of the agricultural lands in Bushehr province with the amount of 6163.75 mg Kg-1. Although it is said that natural gas and distillate fuel oils contain very low or undetectable levels (<0.05 mg/l) of vanadium and are not considered a significant source of vanadium to the environment, except in the case of large unintentional spills, the concentration of vanadium in Southern Pars Gas field refinery was significantly high. Based on European Limit Values for land use (50-100), there was only one subsample for Zn which showed higher concentration located between Abadan and Emam Khomeini sites. With respect to the result, the concentration of Zn showed that the stations S6-S11 had high amounts being belonged to South Pars Gas field and Petro chemistry in Bushehr Province. Moreover, Zn concentration in Khuzestan Province in stations S18-S20 was high and in

Valizadeh-kakhki et al. / Environmental Studies of Persian Gulf 1(1) (2013) 1-12
8
Table 5 Heavy metal concentrations likely to exist in soil as milligram per kilogram dry soil (Fabis 1987)
Metals Concentration Acceptable values Maximum values Lead 0.1-20 100 100 Cadmium 0.1-1 3 3 Chromium 10-50 100 100 Copper 5-20 50 100 Nickel 10-20 50 50 Mercury 0.1-1 2 2 Zinc 10-50 300 300 Boron 5-30 25 - Cobalt 1-10 50 - Molybdenum 1-5 5 - Selenium 0.1-5 3 - Arsenic 2-20 20 - Titanium - 500 - Vanadium 10-100 50 - Uranium - 5 -
S20 located between Abadan and Emam Khomeini port was the highest with the concentration of 140 mg Kg-1. Also, zinc as an indicator of oil pollution was linked with cadmium, lead and vanadium, suggesting similar source for these elements as well.
The regional distribution of Pb revealed that significant concentrations more than soil limitation was in Bushehr and Khuzestan Provinces; They were in S6-S10 for South Pars Gas Field and S18-S20 in Khoramshar and Abadan Cities producing most of the terrestrial petroleum.
3.3 Copper, cobalt and nickel
Dendrogram in other cluster illustrates nickel, copper and cobalt together. Cu, Co, and Ni ranged from (0.37-89.07 mg Kg-1), (5.039-19.27 mg Kg-1) and (13-71.46 mg Kg-1) respectively. Based on the literature, nickel is also an indicator of petroleum product and it shows the same root for this cluster. However, according to the classification of Fabis (1987), in some of the subsamples such as S19, S1 and
AgS1, the concentration of cobalt in the highest amount was higher. Cu was almost the same and it showed only higher concentration based on ELV for two subsamples S19 and AgS4 located in Abadan and Hendijan (Khuzestan Province). Both of them had the agricultural background and it did not illustrate any proof of pollution. Nickel had high concentration of 47.92, 50.27 and 71.64 mg Kg-1 in S14, AgS3 and S19 respectively which were higher than the background values for soil. 4 DISCUSSION
The concentrations of nickel and vanadium in crude oil are highly variable depending on the oil source, ranging from 2to 200 mg Kg-1 for nickel (Vale, et al., 2004) and from 0.02 to1180 mg Kg-1 for vanadium (Crans, et al., 1998). Origin and type of Iran oil with regard to vanadium and nickel and their ratio are given in Table 6.

Valizadeh-kakhki et al. / Environmental Studies of Persian Gulf 1(1) (2013) 1-12
9
Table 6 Published data on V and Ni contents of Persian Gulf oils/residues and the Kuwait oil slick (Literathy and Foda, 1985; Al-Arfaj and Alam, 1993)
Originand type of oil Iran V(µg.g-1) Ni (µg.g-1) V/Ni Bahrgansar Nowruz (STRIP) crude+ 550 C residue 72 25 2.88 Nowruz crude 202 69 2.93 ACIP 130 34 3.82 DTAH 93 31 3.00 Aboozar (Ardeshir) crude 71 21 3.38 + 565 C residue 244 74 3.30 Dorrood (Darius) crude 23 8 2.88 + 565 C residue 101 36 2.81 Foroozan (Fereidoon) crude 36 11 3.27 + 343 C residue 66 20 3.30 + 566 C residue 143 44 3.25 Sirri, crude 41 12 3.42 + 350 C residue 70 20 3.50
4.1 Relationship between vanadium and soil properties
Since the concentration of V was significantly higher than the other metals, its concentration and distribution is studied separately. The transport and partitioning of vanadium in water and soil are influenced by pH, redox potential, and the presence of particulate. The mobility of vanadium in soils is affected by the pH of the soil.
Relative to other metals, vanadium is quite mobile in neutral or alkaline soils, but its mobility decreases in acidic soils (van Zinderen Bakker, et al., 1980).
Although the soil pH in subsamples was alkaline or neutral, the concentration of vanadium was almost very high. So, it can be concluded that there was not any mobility factor such as water resource or precipitation. According to correlations, pH had a significant correlation with nickel and vanadium. They also reveal that their concentration was highly affected by pH changes in soil (Table 7).
Vanadium is more soluble and is easily leached from soils into water. Vanadium remains in the soil after being precipitated
from the weathering solution. This can be brought about by precipitation with polyvalent cations such as divalent calcium and divalent copper, by binding with organic complexing agents, adsorbing onto anion exchangers such as clay particles in the soil, and co-precipitating and adsorbing to hydrous ferric oxide in the soil (Van Zinderen Bakker, et al., 1980). In this research, a significant relationship was found between total organic carbon and vanadium concentration in S8 sampling site which is located in Southern Pars Gas refinery field. Analyzing the result of correlation coefficients showed that just TOC and vanadium had significant correlations (p<0.05). Vanadium is widely distributed in the earth’s crust at an average concentration of 100 ppm (approximately 100 mg Kg-1), similar to that of zinc and nickel (Byerrum, et al., 1991). It cannot be destroyed in the environment. It can only change form or become attached or separated from airborne particulate, soil, particulate in water and sediment. Levels of vanadium in residual fuel oil fluctuate by source.
Valizadeh-kakhki et al. / Environmental Studies of Persian Gulf 1(1) (2013) 1-12
10
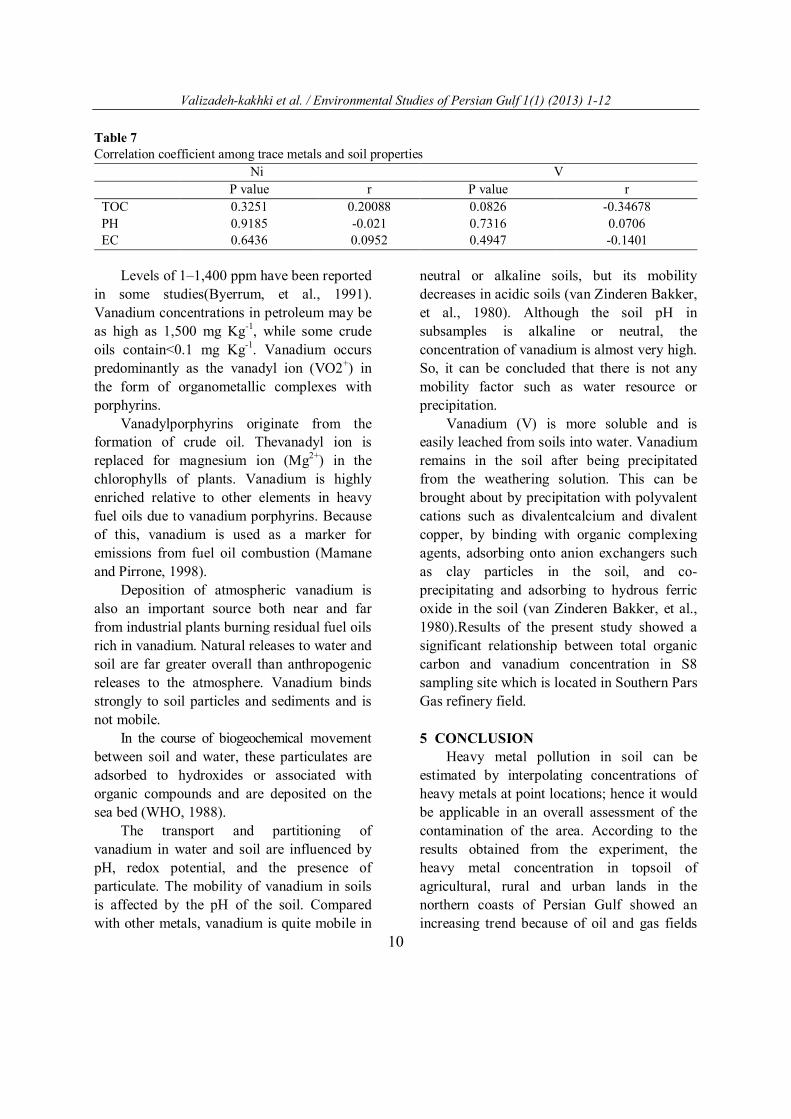
Table 7 Correlation coefficient among trace metals and soil properties
Ni V P value r P value r
TOC 0.3251 0.20088 0.0826 -0.34678 PH 0.9185 -0.021 0.7316 0.0706 EC 0.6436 0.0952 0.4947 -0.1401
Levels of 1–1,400 ppm have been reported in some studies(Byerrum, et al., 1991). Vanadium concentrations in petroleum may be as high as 1,500 mg Kg-1, while some crude oils contain<0.1 mg Kg-1. Vanadium occurs predominantly as the vanadyl ion (VO2+) in the form of organometallic complexes with porphyrins.
Vanadylporphyrins originate from the formation of crude oil. Thevanadyl ion is replaced for magnesium ion (Mg2+) in the chlorophylls of plants. Vanadium is highly enriched relative to other elements in heavy fuel oils due to vanadium porphyrins. Because of this, vanadium is used as a marker for emissions from fuel oil combustion (Mamane and Pirrone, 1998).
Deposition of atmospheric vanadium is also an important source both near and far from industrial plants burning residual fuel oils rich in vanadium. Natural releases to water and soil are far greater overall than anthropogenic releases to the atmosphere. Vanadium binds strongly to soil particles and sediments and is not mobile.
In the course of biogeochemical movement between soil and water, these particulates are adsorbed to hydroxides or associated with organic compounds and are deposited on the sea bed (WHO, 1988).
The transport and partitioning of vanadium in water and soil are influenced by pH, redox potential, and the presence of particulate. The mobility of vanadium in soils is affected by the pH of the soil. Compared with other metals, vanadium is quite mobile in
neutral or alkaline soils, but its mobility decreases in acidic soils (van Zinderen Bakker, et al., 1980). Although the soil pH in subsamples is alkaline or neutral, the concentration of vanadium is almost very high. So, it can be concluded that there is not any mobility factor such as water resource or precipitation.
Vanadium (V) is more soluble and is easily leached from soils into water. Vanadium remains in the soil after being precipitated from the weathering solution. This can be brought about by precipitation with polyvalent cations such as divalentcalcium and divalent copper, by binding with organic complexing agents, adsorbing onto anion exchangers such as clay particles in the soil, and co-precipitating and adsorbing to hydrous ferric oxide in the soil (van Zinderen Bakker, et al., 1980).Results of the present study showed a significant relationship between total organic carbon and vanadium concentration in S8 sampling site which is located in Southern Pars Gas refinery field.
5 CONCLUSION
Heavy metal pollution in soil can be estimated by interpolating concentrations of heavy metals at point locations; hence it would be applicable in an overall assessment of the contamination of the area. According to the results obtained from the experiment, the heavy metal concentration in topsoil of agricultural, rural and urban lands in the northern coasts of Persian Gulf showed an increasing trend because of oil and gas fields

Valizadeh-kakhki et al. / Environmental Studies of Persian Gulf 1(1) (2013) 1-12
11
and also anthropogenic inputs. Even though, there were some differences in the polluted locations in these three provinces within different heavy metals, it was evident that in the locations around Southern Pars Gas field and Abadan, as another oil land field location, most of the heavy metals had higher concentrations above background level. Consequently, it is proven that they are derived from petroleum production. Moreover, the pattern of correlations between heavy metals and total organic carbon, C/N ratio, pH and EC showed that there was not any significant effect of these factors on their concentration. However, the exception of a highly significant relationship between EC and copper (p value <.0001) showed that the concentration does not originate from oil products. On the whole, it is probably derived from the arid and subtropical conditions which lead to salted rivers containing salt as well as copper, so it increases electrical conductivity as well. As the above concentration of vanadium is highly risky, there should be every intellectual and sophisticated act to control and remediate the vast area ruined by anthropogenic sources. To reduce human health risk caused by heavy metal pollution, release and utilization of oil products should be under permanent surveillance.
ACKNOWLEDGEMENT
The author would like to thank Persian Gulf Research and Studies Center and Persian Gulf University for providing financial and technical support in this study. REFERENCES Adams, P., Constanti, A., Brown, D. A., &
Clark, R. B. (1982). Intracellular Ca2+ activates a fast voltage-sensitive K+ current in vertebrate sympathetic neurones.
Al-Arfaj, A. A., & Alam, I. A. (1993).
Chemical characterization of sediments from the Gulf area after the 1991 oil spill. Marine Pollution Bulletin, Vol. 27, pp. 97-101.
Anderson, C. M. M., & LaBelle, R. P. (2000). Update of comparative occurrence rates for offshore oil spills. Spill Science & Technology Bulletin, Vol. 6, No. (5-6), pp. 303-321.
AOAC, (1990). Association of Official Agricultural Chemists.
Bu-Olayan, A., & Al-Yakoob, S. (1998). Lead, nickel and vanadium in seafood: an exposure assessment for Kuwaiti consumers. The Science of the Total Environment, Vol. 223, NO. (2-3), pp. 81-86.
Byerrum, R., et al., (1991). Vanadium. Metals and Their Compounds in the Environment VCH, Weinheim, New York, Basel, Cambridge: pp. 1289-1297.
Cantú, R., et al., (2000). Surfactant-enhanced partitioning of nickel and vanadyldeoxophylloerythroetioporphyrins from crude oil into water and their analysis using surface-enhanced resonance raman spectroscopy. Environmental science & technology, Vol. 34, No. 1, pp. 192-198.
Crans, D. C., et al., (1998). Chemistry of relevance to vanadium in the environment. Advances in environmental science and technology-New York, Vol. 30, pp. 73-96.
Fabis, W., (1987). Schadstftbelastung von Boden-Auswirkurgen auf Boden-und Wasserqalitat Allg Farstzeitsehr. BLV Verlaggesellshaft, Munich, pp. 128-131.
Facchinelli, A., et al., (2001). Multivariate statistical and GIS-based approach to identify heavy metal sources in soils. Environmental Pollution, Vol. 114, No. 3, pp. 313-324.
Guvenē, N., et al., (2003). Investigation of soil multi-element composition in Antalya,

Valizadeh-kakhki et al. / Environmental Studies of Persian Gulf 1(1) (2013) 1-12
12
Turkey. Environment international, Vol. 29, No. 5, pp. 631-640.
Jonathan, M., et al., (2004). Geochemical variations of major and trace elements in recent sediments, off the Gulf of Mannar, the southeast coast of India. Environmental Geology, Vol. 45, No. 4, pp. 466-480.
Literathy, P. and Foda, M., (1985). KISR activities on Nowruz oil slick. Kuwait Institute for Scientific Research, Kuwait Vol. 180.
Mamane, Y. and Pirrone, N., (1998). Vanadium in the atmosphere. Advances in environmental science and technology-New York, Vol. 30, pp. 37-72.
Márquez, N., et al., (1999). Three analytical methods to isolate and characterize vanadium and nickel porphyrins from heavy crude oil. Analytica chimica acta, Vol. 395, No. 3, pp. 343-349.
Massoud, M., et al., (1996). Bottom sediments of the Persian Gulf--II. TPH and TOC contents as indicators of oil pollution and implications for the effect and fate of the Kuwait oil slick. Environmental Pollution Vol. 93, No. 3, pp. 271-284.
Metwally, M. E. S., et al., (1997). Petroleum hydrocarbons and related heavy metals in
the near-shore marine sediments of Kuwait. Environment international, Vol. 23, No. 1, pp. 115-121.
Metz, H. C., (1993). Area Handbook Series: Persian Gulf States Country Studies, DTIC Document.
Santos, I. R., et al., (2005). Heavy metal contamination in coastal sediments and soils near the Brazilian Antarctic Station, King George Island. Marine Pollution Bulletin, Vol. 50, No. 2, pp. 185-194.
Sasaki, T., et al., (1998). Vanadium as an internal marker to evaluate microbial degradation of crude oil. Environmental science & technology, Vol. 32, No.22, pp. 3618-3621.
Vale, M. G. R., et al., (2004). Method development for the determination of nickel in petroleum using line-source and high-resolution continuum-source graphite furnace atomic absorption spectrometry. Microchemical Journal, Vol. 77, No. 2, pp. 131-140.
van Zinderen Bakker, E. M., et al., (1980). Effects of vanadium in the Canadian environment, National Research Council of Canada.


![Ultra Sonic Sensors [Persian]](https://img.pdfslide.net/doc/110x75/631cf6f01c5736defb026123/ultra-sonic-sensors-persian.jpg)