Embed Size (px)
Citation preview

1
ASSESSMENT OF PATIENTS` SATISFACTION WITH HEALTH
SERVICES AT THE GENERAL OUT PATIENT DEPARTMENT
OF THE UNIVERSITY OF PORT HARCOURT TEACHING
HOSPITAL
BY
OJI KALU U2005/4797336
THIS IS A DISSERTATION SUBMITTED TO THE DEPARTMENT OF
PREVENTIVE AND SOCIAL MEDICINE AS PARTIAL FULFILLMENT
FOR THE AWARD OF BACHELOR OF MEDICINE, BACHELOR OF
SURGERY, (M.B.B.S), OF THE COLLEGE OF HEALTH SCIENCES,
UNIVERSITY OF PORT HARCOURT, RIVERS STATE, NIGERIA.
JUNE 2015

2
DECLARATION
This research work was carried out by the under listed under the supervision of
Dr.I. D. Alabere. The result presented therein are original and have been read and
approved as meeting the requirements for the award of MBBS Degree of the
College of Health Sciences, University of Port Harcourt, Rivers state, Nigeria.
DECLARANTS
OJI KALU ………………… ..……………
U2005/4797336 Signature Date

3
CERTIFICATION
I hereby certify that this research project is original and was carried out under the
supervision of Dr. Alabere, and has been approved as having met the requirements
for the award of Bachelor of medicine, Bachelor of Surgery (MBBS) degree of
College of Health Sciences, University of Port Harcourt, Rivers State.
DR. I. D. ALABERE …………… ……………
(Project supervisor) Signature Date
DR.BEST ORDINOHA …………… ……………
(Head of Department) Signature Date
………………………. …………….. ……………
(External Examiner) Signature Date

4
DEDICATION
I dedicate this project to God Almighty, our ever present help in time of need,
without him we would not have been here today, for seeing us through medical
school. To my lecturers, who were very patient with me, God bless you
immensely. To my parents, for the sacrifices you made to mould me, may you reap
the fruit of your labor.
5
ACKNOWLEDGEMENT
I am forever grateful to God Almighty who has brought us this far, it has been his
grace all the way. I am grateful to our supervisor, Dr I. D. Alabere , who brought
out the best in me.
I remain indebted to my parents and sponsors: Mr. and Mrs. S.O Amah my lovely
parents who gave me their utmost support and prayers, Dr. Oji Jonah who has been
an inspiration and an anchor, God bless you.
I appreciate the staff and patients of General Out Patient Department of University
of Port Harcourt Teaching Hospital for their support and compliance.
To my friends, siblings and well wishers I appreciate you.
6
TABLE OF CONTENT
PAGES
Title……………………………………………………………………………….1
Declaration………………………………………………………………………..2
Certification……………………………………………………………………….3
Dedication…………………………………………………………………………4
Acknowledgment …………………………………………………………………5
List of tables……………………………………………………………………….6
Abstract……………………………………………………………………………10
CHAPTER ONE: INTRODUCTION
1.1 Background……………………………………………………………………11
1.2 Statement of Problem………………………………………………………….14
1.3 Justification Of Study………………………………………………………….14
1.4 Aim And Objectives…………………………………………………………...14
CHAPTER TWO: LITERATURE REVIEW
2.1 Conceptual Frame Work………………………………………………………15
2.2 Assessment of Quality Of Health Care………………………………………..15
2.3 Review of Empirical Literature……………………….………………………17

7
CHAPTER THREE: MATERIALS AND METHOD
3. 1 Study Area………………………….………………………………………28
3.2 Study Design………………………………………………………………...28
3.3 Study Population……………..………………………………………………28
3.4 Eligibility…………………………..…………………………………………29
3.5 Sample Size Determination……..…………………………………………….29
3.6 Sampling Technique…………………………………………….…………….30
3.7 Survey Instrument……………………………………………………………..31
3.8 Data Analysis………………………………………………………………….31
CHAPTER FOUR: RESULTS
Demographic Analysis of Samples………………………………………………..33
Tables of Figures and Results……………………………………………………..34
CHAPTER FIVE; DISCUSSION, CONCLUSION AND
RECOMMENDATIONS.
5.1 Discussion……………………………………………………………………..46
5.2 Conclusion…………………………………………………………………….50
5.3 Recommendations…………………………………………………………….50
References………………………………………………………………………...51
Sample of Questionnaires…………………………………………………………56
8
LIST OF TABLES
1. Table 1: Age distribution of Respondents………………………………...32
2. Table 2: Sex distribution of respondents………………………………….33
3. Table 3: Religion of Respondents…………………………………………33
4. Table 4: Tribe of respondents……………………………………………...34
5. Table 5: Level of education of respondents……………………………….34
6. Table 6: Residence of respondents………………………………………...35
7. Table 7 :Occupation of Respondents…………………………………........35
8. Table 8: Time spent before getting hospital card………………………….36
9. Table 9: Time spent at the Nurses' section before being attended to……...36
10. Table 10: Time spent at the Doctors' section before consultation…………37
11. Table 11: Total time spent at the GOPD…………………………………...37
12. Table 12: Assessment of courtesy of record staff………………………….38
13. Table 13: Assessment of Nurses' courtesy……………………………........38
14. Table 14: Assessment of doctors’ courtesy and show of concern …………39
15. Table 15a: Assessment of cleanliness of doctors’ area…………………….40
16. Table 15b: Assessment of cleanliness record area and Nurses area………..40
17. Table 16: Assessment of level of satisfaction with total time spent at clinic41
18. Table 17 Assessment of overall performance of GOPD…………………...42
19. Table 18a: Relationship between overall satisfaction and respondents
age, sex and religion ……………………………………………………….42
20. Table18b: Relationship between overall satisfaction and the respondents’
tribes and residence.………………………………………………….……43

9
21. Table 18c: Relationship between overall satisfaction and respondents'
occupation.....................................................................................................43
22. Table 19: relationship between overall time spent at the GOPD and
Overall level of respondents satisfaction.……………………………..…..44
23. Table 20: Respondents suggestions towards ensuring improved patients’
satisfaction……………………………..…………………………………...45

10
ABSTRACT
Introduction: Patients’ satisfaction assesses the fulfillment of a need or desire or
allayment of anxiety in respect to the quality of health care received. Patients’
satisfaction refers to patients’ valued judgments and subsequent reactions to what
they perceive in the health care environment just before, during, and after the
course of their stay or clinical visit
Aim The study aims to assess patients’ satisfaction with health services at the
general outpatient clinic of the University of Port Harcourt Teaching Hospital.
Methodology: A cross-sectional study was carried out at the Outpatient Clinics of
the University of Port Harcourt Teaching Hospital during the study period. A total
of 250 patients were interviewed using a interviewer administered questionnaire to
obtain information on several dimensions of perceived quality of care and patient
satisfaction. The data collected was analyzed using SPSS version 20 statistical
software.
Result: A total of 175 (70%) patients were satisfied with the overall services
received at the hospital. The association between the level of satisfaction, the
respondents’ religion, and overall time spent in the clinic was statistically
significant. Patients who were satisfied with the service had a shorter waiting time
than those who were not.
Conclusion: A large number of patients were satisfied with the health care
services they received in the study facility. There is the need to shorten waiting
time by employing more Medical Personnel and improve time for interaction
between the health care professional and the patient in order to enhance patient
satisfaction with health care service delivery.

11
CHAPTER ONE
INTRODUCTION
1.1 BACKGROUND
Patients’ satisfaction assesses the fulfillment of a need or desire or allayment of
anxiety in respect to the quality of health care received. Patients’ satisfaction refers
to patients’ valued judgments and subsequent reactions to what they perceive in the
health careenvironment just before, during, and after the course of their stay or
clinical visit1.It is an important outcome measure for health services. Data on
patient satisfaction are the key indicators for the quality of care and treatment
delivered by the physicians, paramedical staff and the hospital as a whole2.This
could be considered in the context of contentment with services, and expectations
in health care. Most often, expectation comes with efficiency of services received
and this is important in their satisfaction.
One of the factors that influence patient satisfaction is efficiency of services
rendered to patients. This includes promptness of the care given to patients,
duration of waiting time (i.e. the time a patient spends since registration up to the
time of the start of consultation), consultation time, quick response to emergencies,
quick dispensation of drugs, fast and accurate laboratory tests. Satisfied patients
are more likely to comply with prescribed treatment and advice from doctors;

12
theyare also more likely to return for additional care when necessary and may be
more willing to pay for services.
The efficiency of services could be categorized based on infrastructure; cleanliness
and hygiene of the environment,convenience in waiting room, waiting time before
consultation.Several studies in Nigeria have observed long wait time in outpatient
clinics, thus leading to dissatisfaction with services offered in these clinics .The
lack of a time-specific appointment system has been suggested as a reason for this
observation3.
Time-specific appointments are not the usual practice in most outpatient clinics in
Nigeria as most patients arrive at the general outpatient clinics within the same
time block from 07:00 to 10:00 hours as a result of which physicians get so
overwhelmed with the large number of patients waiting to be seen4.One of the
factors that influence patient satisfaction is efficiency of services rendered to
patients. This efficiency of services include promptness of the care given to
patients, duration of wait time (i.e. the time a patient spends since registration up to
the time of the start of consultation), consultation time, quick response to
emergencies, quick dispensation of drugs, fast and accurate laboratory tests. The
outpatient department in any hospital is considered the shop window of
thehospital; hence, patients’ perception of services obtained there reflects the
overall view of the hospital services5.

13
1.2 STATEMENT OF PROBLEM
Patients’ perceptions about healthcare systems seem to have been largely ignored
by healthcare managers in developing countries and clinicians lack both awareness
and adequate training to address patients’ expectations6,7.
Studies have shown that
long waiting time appears to be the primary challenge.Other factors include
discomfort in the waiting area, attitude of healthcare providers and poor
infrastructure8.
1.3 JUSTIFICATION OF STUDY
Beside training and research, theaim of establishing a tertiary health carefacility is
to offer satisfactory health services that are specifically directed to attending to
patient’s health needs. While the hospital management and health care provider in
the hospital have ways of assessing the quality of care provided e.g. clinical audit,
medical audit, various peer review mechanisms, the quality of care from the
consumers i.e. patients perspective is often ignored.Therefore this study was
conducted to determine the quality of care provided at the General Outpatients
Department of UPTH from the patient’s perspective.
Findings from this study will help identify loop holes in the administration of
health services in GOPD of University of Port Harcourt Teaching Hospital. Itwill
address lack of information on health service delivery in Rivers State. It will serve

14
as a guide in the implementation and evaluation of health service delivery in
UPTH. Recommendations from this study will contribute to the overall
improvement of patients’ satisfaction.Findings from this study will be of outmost
importance to the general health practitioner and other health personnel on the
need for renderingquality health services to patients.
1.4AIM AND OBJECTIVES
1.4.1 Aim
To assesspatients’ satisfaction with health services at the general outpatient clinic
of the University of Port Harcourt Teaching Hospital.
1.4.2 Specific objective
a. To assess the level of patients satisfaction with the various sections of the
GOPD in UPTH.
b. To assess the overall level of patients satisfaction with the GOPD in UPTH.
c. To determine the factors responsible for the level of satisfaction with the
various sections and services provided in the GOPD of UPTH.

15
CHAPTER TWO
LITERATURE REVIEW
2.1 CONCEPTUAL FRAMEWORK
2.1.1 Assessment is an act of evaluation or appraisal of a particular situation to
determine the performance of an individual or an organization.Patient satisfaction
is usually a subjective judgment of the quality of care, though it may also be
assessed objectively. However, it has long been considered an important
component of care outcomes and is frequently integrated into evaluations of
overall clinical quality. Donabedian, arguably the leading theorist in the area of
quality assurance, has emphasized that client satisfaction is of fundamental
importance as a measure of the quality of care because it gives information on the
provider’s success at meeting those client values and expectations, which are
matters on which the client is the ultimate authority9.
2.1.2 Health is a state of complete physical, mental and social wellbeing and
not necessarily the absence of disease. Better health is essential for human
happiness and well-being. It also makes an important contribution to economic
progress, as healthy populations live longer, are more productive, and save
more.

16
Many factors influence health status and a country's ability to provide quality
health services for its people. Ministries of health are important contributors as
well as other government departments, donor organizations, civil society
groups and communities themselves. For example: investments in roads can
improve access to health services; inflation targets can constrain health
spending; and civil service reform can create opportunities - or limits - to hiring
more health workers.9
2.1.3 Healthcare is the prevention, treatment and management of illness or the
preservation of mental and physical well-being through the services offered by the
medical, nursing and allied health professions.Wares and his colleagues identified
the art of care to be the most frequently measured dimension assessing patients’
satisfaction and was also considered to be an aspect of physicians conduct along
with the technical quality of care. It was described as the dimension focused on the
‘amount of care’ shown to the patient; friendliness of the physician, patience,
concern, etc. on the positive spectrum of evaluation and attributes such as
abruptness, disrespect, degree to which physicians embarrass, hurt, or worry their
patients etc. on the negative spectrum9,10
.
2.1.4 A patient is any person who receives treatment from a doctor or medically
educated persons. The patient is often ill or injured and in need of treatment by a
health care provider9.

17
2.1.5 Satisfaction is said to be a state of pleasure or contentment with an action,
event or service, especially one that was previously desired. When applied to
medical care; patient satisfaction can be considered in the context of patient’s
appraisal of their desires and expectations of health care. Patients’ satisfaction
refers to patients’ value, judgments and subsequent reactions to what they perceive
in the health environment just before, during, and after the course of their inpatient
stay or clinical visit. It is patients’ appraisal of their desires and expectation of
healthcare.
One of the factors that influence patient satisfaction is efficiency of services
rendered to patients. Satisfied patients are more likely to comply with prescribed
treatment and advice from doctors; they are also more likely to return for
additional care when necessary and may be more willing to pay for services,
thereby increasing revenue11
.
2.1.6 Quality is defined as the standard of something as measured against other
things of a similar kind; the degree of excellence of something.Before assessment
can begin, we must decide how quality is to be defined and that depends on
whether one assesses only the performance of practitioners or also the
contributions of patients` and of the healthcare system. Donabedian proposed that
the health system or healthcare can be visualized as a set of concentric circles
around a target or a ladder with rungs and the definer describes quality with their

18
own context as the target of the concentric circles or the beginning rung in the
ladder. He illustrated this concept from a physician’s point of view and represented
the physician’s art of care as the target and subsequent levels around the target as
the available facilities and equipment; the care provided by patient families and
patients themselves and on the outermost circle is the health status of the
community. He then further explained that the definition of quality is expanded
with every movement across these concentric circles and with every expansion in
definition and scope comes a whole different interplay of factors that affect the
way quality is perceived9.
2.2 ASSESSMENT OF THE QUALITY OF HEALTH CARE
A work carried out by Avedis Donabedian on how to assess the quality of
healthcare states that the information from which inferences can be drawn about
the quality of care can be classified under three categories: structure, process and
outcome 9.
Structure:This denotes the attributes of the setting in which care occurs.This
includes the attributes of material resources such as facilities, equipment and
money of human resources such as the number and qualification of personnel and
of organizational structuresuch as medical staff organization,methods of peer
review and reimbursement.

19
Process:Process denotes what is actually done in giving and receiving care.It
includes the patients` activities in seeking care and carrying it out as well as the
practitioners’ activities in making a diagnosis and recommending or implementing
treatment.
Outcome:Outcome refers to the effects of care on the health status of patients and
populations. It also involves improvements in the patients` knowledge and salutary
changes in the patients` behavior are included under a broad definition of health
status,and so is the degree of the patients` satisfaction with care.
This three-part approach to quality assessment is possible only because good
structure increases the likelihood of good process and good process increases the
likelihood of good outcome9.
Assessment of the quality of health care provided in
any facility can be done using these three part approach by either the managers,
provider or the patients. The patient perspective to the quality of care is however,
very vital as the level of satisfaction is known to influence the patients likelihood
to comply with prescribed treatment, doctors’ advice as well as return for
additional treatment when and where necessary.
2.3 REVIEW OF EMPIRICAL LITERATURE
A comparative study on patients satisfaction on health care services using 400
subjects from the two hospitals (a private and a public hospital) with the focus of

20
measuring patients satisfaction from the two hospitals showed that the private
hospital performed better in providing quality service and satisfaction according to
patients need11.
A study on service quality and patient satisfaction with health care delivery:
empirical evidencefrom patients’ of the outpatient department carried out in a
public university hospital in Ghana concluded that health care delivery is a service
based industry and patients satisfaction is a critical factor in measuring the hospital
performance just as in other service based organization12
.
A cross sectional study which was conducted in Hawassa University Teaching
Hospital, Ethiopia assessed the level of satisfaction of patients with outpatient
health services and factors associated with it. Four-fifth (80.1%) of patients
reported to be satisfied with the hospital’s outpatient services. Respondents who
claimed to have had a long stay in the hospital were found to be more satisfied than
those who claimed to have had a very long stay. Furthermore, there was negative
association between patients’ satisfaction and not getting required services in the
hospital, lack of privacy, and absence of good dialogue with outpatient service
provider. It was recommended that health managers and service providers should
devise innovative ways to reduce waiting time, have good dialogue with patients,
and maintain privacy of patients in order to improve the level of satisfaction of
patients13
.
21
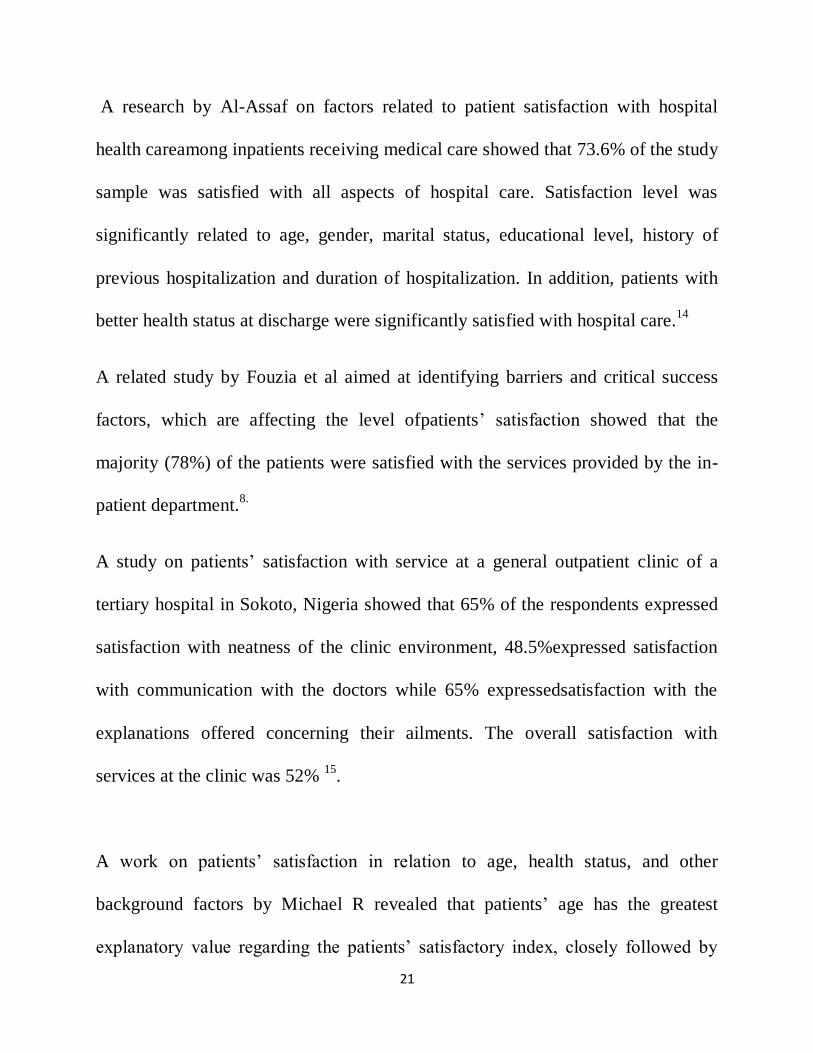
A research by Al-Assaf on factors related to patient satisfaction with hospital
health careamong inpatients receiving medical care showed that 73.6% of the study
sample was satisfied with all aspects of hospital care. Satisfaction level was
significantly related to age, gender, marital status, educational level, history of
previous hospitalization and duration of hospitalization. In addition, patients with
better health status at discharge were significantly satisfied with hospital care.14
A related study by Fouzia et al aimed at identifying barriers and critical success
factors, which are affecting the level ofpatients’ satisfaction showed that the
majority (78%) of the patients were satisfied with the services provided by the in-
patient department.8.
A study on patients’ satisfaction with service at a general outpatient clinic of a
tertiary hospital in Sokoto, Nigeria showed that 65% of the respondents expressed
satisfaction with neatness of the clinic environment, 48.5%expressed satisfaction
with communication with the doctors while 65% expressedsatisfaction with the
explanations offered concerning their ailments. The overall satisfaction with
services at the clinic was 52% 15
.
A work on patients’ satisfaction in relation to age, health status, and other
background factors by Michael R revealed that patients’ age has the greatest
explanatory value regarding the patients’ satisfactory index, closely followed by

22
experience, anxiety during admission. Gender did not correlate with the
patients`satisfactory index (PSI) although males were some worth more satisfied
than females16
A structural model to investigate factors affecting patient satisfaction and revisit
intention in Jordanian hospitals showed that by measuring to what extent hospitals
meet or exceed patient’s expectations, hospital managers can determinethe needed
service design and delivery improvements that contribute to patient satisfaction
and re-visitintention. The results showed that hospital performance has no
significant effect on patient satisfaction and revisit intention. This result however
indicated that the patients were facing troubles in admission, registration, waiting
time, and response time for results of medical tests. Also, the hospital stay, hospital
facilities, service quality, and patient security culture are found significantly
important in achieving patient satisfaction and revisit intention. Further, the
interaction with patients’ requirements and needs significantly related to service
quality and hospital stay17
.
An article on factors related to patients' satisfaction with their medical care,
reviewed the research of patients` satisfaction after recent identifiable medical care
visits. Results of the reviewed studies were grouped into 13 factors of the medical
care setting and of the physicians' competence and relationships to their patients

23
which may be related to patient satisfaction. The factors with the clearest
relationship to satisfaction included the accessibility of medical care, the
organizational structure of clinics, treatment length, and perceived competence of
physicians, clarity and retention of physicians' communication to patients,
physicians' control, and patients' expectations18
.
A study which was aimed at identifying factors which determine patients’
satisfaction with health care services at Pumwani Maternity Hospital in Nairobi,
Kenya showed that despite the high cost of services, inadequate staffing and poor
sanitation, the hospital managed to offer quality services that satisfied the majority
of clients. The factors identified to determine patient satisfaction were patient
waiting time, attitude of the providers, availability of drugs and services,
affordability of the services, level of staffing and level of cleanliness19
.
Adescriptivecross sectional study on assessment of student’s satisfaction and
quality of patient care under the Nigerian tertiary institutions social health
insurance programme in Ahmadu Bello University Zaria, Nigeria showed that the
overall level of satisfaction score of therespondents was 57.1%. Specifically, the
respondents expressed satisfaction with: warm reception 58.7%,doctors attitude
74.60%, nurses attitude 55.6%, general attitude of other sick bay staff 55.6% ,
general cleanliness of the sick bay 74.6% and dissatisfaction with general waiting
24
time 39.683%. This study showedthat the overall student’s satisfaction with the
quality of services provided was very good with patient-providerrelationship rated
highest and waiting time rated lowest20
.
A study on Clients’ satisfaction with quality of healthcare received among mothers
attending infant welfare clinics in a semi-urban community in South-western
Nigeria showed that most of the respondents (194, 97.0%) were satisfied with the
treatment their children received, while 147 (73.5%) were not fully satisfied with
the level of sanitation of the toilets. About two thirds had low level of satisfaction
however dissatisfaction was more with the amenities21
.
A study on Patients’ Satisfaction and Quality of Care in a tertiary institution in
Southeast Nigeriashowed that overall, participants were quite satisfied with the
services provided by the different service providers. Respondent’s greatest
displeasure was with the time spent at the facility as 63.9% of them were
displeased. More than a third (36.9%) was most pleased with information given to
them as a factor of importance. Participants were quite satisfied with the services
provided as well as the quality of care by the different service providers of the
health facility. Interventions in terms of time spent at the facility which would
promote good customer focused service deliverywasconsequently recommended22
.

25
A research on Patient satisfaction with the services provided at a general
outpatients' clinic, Ibadan, Nigeria, assessed patients' perception of care provided
using triangulation of methods. Four hundred and seven adult patients selected by
systematic sampling technique were interviewed, 10 focus group discussion
sessions (FGD) were held and observations were made at the record clerks' desk,
nurses' desk and waiting hall. Also, 35 consultations were observed.Generally, all
methods revealed high level of satisfaction with the different aspects of care
assessed. However, assessment of satisfaction using survey method concealed a
variety of negative experiences reported at FGD and observation. These
discrepancies were related to satisfaction with the organization of the clinic,
attitude of record clerks' and consultation process23
.
A descriptive cross-sectional study carried out among consumers of Primary
Health Care in North Central Nigeria, showed that the highest mean perception
was in the domain of lack of interruption during consultation, while the lowest was
in the domain of respect for patients’ opinion. Consumers that were given adequate
information from doctors are 84.0%, those that were motivated to continue seeking
healthcare are 84.4%, while 71.2% felt that the consulting room provided enough
privacy. Factors that affected satisfaction with treatment were age, sex, educational
level, and income level24
.

26
A survey to assess patients’ satisfaction with respect to eye care services received
from a hospital in Kathmandu, Nepal; in which patients assessed care, perception
of waiting time, patient- service provider relationship, payment and hospital
facilities/environment. The results showed that slightly more than three quarters of
the participants expressed overall satisfaction. Satisfaction with access to health
facility was75.5%, patient doctor relationship was 87.9%, affordability was 76.8%
and waiting time was 62.0%. It was recommended that patient satisfaction surveys
should be carried out periodically not only to determine the level of patient
satisfaction about the various services of the hospital but also to get the patients’
feedback which could be incorporated into the hospital service improvement
plans25
.
A related work on assessment of satisfaction among patients attending
surgicaloutpatientdepartment in a tertiary care teaching hospital in Bathinda used
concise OPD user satisfaction scale in 510 patients. The concise outpatient
department usersatisfaction scale was used to measure patient satisfaction. The
items in this score were physical environment, equipment and facilities,
appointment arrangement, waiting time, service of the dispensary, support staff,
physician’s professionalism, explanation given by the case physician, consultation
time. Significantdifference was found between genders, with males satisfied more
in terms of support staff, physician’s professionalism, explanationand consultation

27
time given by physicians. It was concluded that patient satisfaction level was
overall good with the surgical outpatientdepartment. The patients were most
satisfied with physician’s professionalism and leastsatisfied with service of
dispensary26
.

28
CHAPTER 3
MATERIALS AND METHODS
3.1 Study Area
The study was carried outat the GOPD of University of PortHarcourt Teaching
Hospital (UPTH), Port Harcourt, Nigeria. The hospital, which is located in Obio-
akpor Local Government Area (LGA) of Rivers state, serves as areferralcenter for
patients from primary and secondary health care facilities in Rivers
andneighboring states. It presently has over 500 beds. The GOP clinic is usually
the first point of call for all patients who visit the hospital. An average of 150
outpatients visits the clinic each day. The clinic also takes care of the hospital staff,
retainers and National Health Insurance Scheme (NHIS) clients 27
.
3.2 Study Design
It was a descriptive cross-sectional study.
3.3 Study population
All patients’ visiting the general out patients department of University of Port
Harcourt Teaching Hospital.
3.4 Eligibility
All patients attending the general out patients’ clinic of UPTH were included in the
study. Hospital staff, medical personnel and medical students were excluded from
the study.

29
3.5 Sample Size Determination
The minimum sample size will be determined using the formula
pq
N = _____
(e/z)2
Where N= the desired sample size
P= working prevalence rate
q = 100-p
e =margin of sampling error tolerated at 95% degree of confidence =5%.
Using a prevalence of 83.1% 28
P=83.1
q =100-83.1=16.9%
e=5
z=1.96
Therefore N= 215.7 ~216.
Provided for non-response rate of 15% .
15x 216 = 32.4
100
Total sample size =216+32.4=248.4 approx. 250 .
3.6 Sampling Technique
Systematic sampling technique was used.
K= Average number of targeted population
Minimum required sample size
Where k is the sampling interval.

30
The study was carried out in 10days.
About 150 patients’ visit the GOPD of UPTH per day.
Total number of targeted population =150per day.
Samplesize=250
Minimum required sample size (per day) =250/10 = 25 patients’ per day were
recruited into the study using the questionnaire for 10days.
K=150/25=6.
Sampling interval = 6 (Every sixth patients was chosen).
Simple random sampling by balloting was done to select the first patient among the
first 6 patients in the clinic each day. Thereafter, every other 6th
new patient that
came to the clinic was enrolled in the study (after obtaining informed consent) until
the required sample size was obtained. In the event of decline or not meeting the
eligibility criteria, we recruited the next patient for the study.
3.7 Survey Instrument
Data was collected using a structured questionnaire, which was interviewer-
administered to seek information on socio-demographic characteristics of
participants, wait time and patients’satisfaction with the different services of the

31
clinic. The questionnaires’ were administered at the exit point of the GOPD of
UPTH.
3.8 Data Analysis
The questionnaires was sorted out for accuracy and completeness immediately
after collection, before entering the data into the computer for analysis using
Statistical Package for Social Sciences (SPSS) Version 20.
Frequency distribution and cross tabulation were computed for categorical
variables. The dependent variable was the patient’s satisfaction, while some of the
independent variables would be wait time, age, sex, educational and employment
status etc. of the participants.
Chi square test was used to compare differences between proportions (satisfied and
dissatisfied respondents). Level of statistical significance will be set at 5%
(p≤0.05).
The rating of patients’ satisfaction using the Likerts’ scale was as follows:
1= very dissatisfied.
2= Dissatisfied .
3= Neutral.
4= satisfied.
5= very satisfied.

32
Ratings of one and two were considered dissatisfied, three was considered as
neutral while, four and five were considered satisfied.
3.9 Ethical Consideration
All the patients present in the general outpatient clinic were informed about the
study and the possibility of being recruited into the study and they had to give their
consent to participate in the study. We briefed the selected participants on the
purpose of the study, potential benefits. We also informed the participants about
their right to withdraw from the study at any point, without any consequence to
them. The Ethics Committee of the Hospital had to approve the conduct of the
study.

33
CHAPTER FOUR
RESULTS
A total of 250 questionnaires were administered in the GOPD of the University of
Port Harcourt Teaching Hospital and all were satisfactorily recovered.
SECTION 1: SOCIO-DEMOGRAPHICS CHARACTERISTICS
Table 7: Age distribution of respondents.
Age (years) Frequency Percent(%)
16-24 38 15.2
25-34 79 31.6
35-44 66 26.4
45-54 33 13.2
55-64 28 11.2
>65 6 2.4
Total
Mean = 38years
250 100.0
Table 1 shows that 31.6%of our respondents were within the range of25-34 years,
closely followed by 26% within 35-44 years and the least frequency was 2.4% for
those >65 years. The mean age distribution is 38years.

34
Table 8: Sex distribution of respondents
Sex Frequency Percent(%)
Male 102 40.8
Female 148 59.2
Total 250 100.0
Table 2 shows that there were more females (59.2%) thanmales(40.8%)
respondents.
Table 9: Religion of respondents.
Religion Frequency Percent(%)
Christianity
Islam
Others
Total
242
6
2
250
96.8
2.4
.8
100.0
Table 3 shows that Christianity was the most common religion among
therespondents96.8%,on the other hand, Islam was 2.4%.
Table 10: Tribe of respondents.
Tribe Frequency Percent(%)
Ikwerre
Ijaw
Igbo
Yoruba
Others
Total
62
52
87
10
39
250
24.8
20.8
34.8
4.0
15.6
100.0
Table 4 shows that the Igbos had the highest population 34.8%,Ikwerre 24.8% and
the Yorubas constituted 4%.

35
Table 11: Level of education of respondents.
Education Frequency Percent(%)
None
Primary
Secondary
Tertiary
Total
9
32
97
112
250
3.6
12.8
38.8
44.8
100.0
Table 5 shows that a total of 44.8% of our respondents had tertiary
education,38.8% secondary education and 3.6% had no form of education.
Table 12: Residence of respondents.
Residence Frequency Percent (%)
Urban
Rural
Total
213
37
250
85.2
14.8
100.0
Table13 shows that 85.2% of our respondents reside in the urban areas while14.8%
reside in rural area.
Table 7:Occupation of respondents.
variable Frequency Percent %
Student
House wife
Farmer
Business
Artisan
Civil servant
Company worker
Pensioner
Others
Total
49
8
12
79
24
30
21
11
16
250
19.6
3.2
4.8
31.4
9.6
12.0
8.4
4.4
6. 6
100

36
Table 7 shows that 19.6% of the respondents were students, 31.4% were into
business, 12% were civil servants, 4.4% were pensioners.
Table 8: Time spent before getting hospital card.
Time Frequency Percent (%)
<30min
30min-1hr
1-2hr
>2hrs
Total
76
113
44
17
250
30.4
45.2
17.6
6.8
100.0
Table 8 shows that 45.2% of the respondents spent 30min-1hr before getting their
card,30.4% <30mins and 6.8% >2hrs.
Table 9: Time spent at the Nurses' section beforebeing attended to.
Time Frequency Percent (%)
<30min
30min-1hr
1-2hrs
>2hr
Total
46
123
67
14
250
18.4
49.2
26.8
5.6
100.0
Table 9 depicts that 49.2% of the respondents spent 30min-1hr at the nurses’
section,26.8% spent1- 2hrs and 5.6% >2hrs which was the least.

37
Table 10: Time spent at the Doctors' section before consultation.
Time Frequency Percent(%)
<30 mins
30min-1hr
1-2hr
>2hr
Total
28
118
74
30
250
11.2
47.2
29.6
12.0
100.0
Table 10 shows that 47.2% of our respondents spent 30min-1hr at the Doctors’
section,29.6% 1-2hrs and 12% >2hrs
Table 11: Total time spent at the GOPD.
Time Frequency Percent (%)
<30mns
30mins-1hr
1-2hr
>2hrs
Total
3
16
46
185
250
1.2
6.4
18.4
74.0
100.0
Table 11 shows that 74.0% spent more than 2hrs at the GOPD, 18.4% 1-2hrs and
1.2% <30 minutes.

38
Table 12: Assessment of courtesy of record staff.
Variables Frequency Percent (%)
Very Satisfied
Satisfied
Neutral
Dissatisfied
Very Dissatisfied
Total
37
183
14
12
4
250
14.8
73.2
5.6
4.8
1.6
100.0
Table 12 depicts that 89% of our respondents were satisfied with the courtesy of
the records staff and 6.4% were dissatisfied while 5.6% were neutral.
Table 13: Assessment of Nurses' courtesy.
Variables Frequency Percent (%)
Very Satisfied
Satisfied
Neutral
Dissatisfied
Very Dissatisfied
Total
33
161
32
20
4
250
13.2
64.4
12.8
8.0
1.6
100.0
Table 13 shows that 77.6% of our respondents were satisfied with the courtesy of
the nurses’ and 9.6% were dissatisfied while 12.8% were neutral.
39
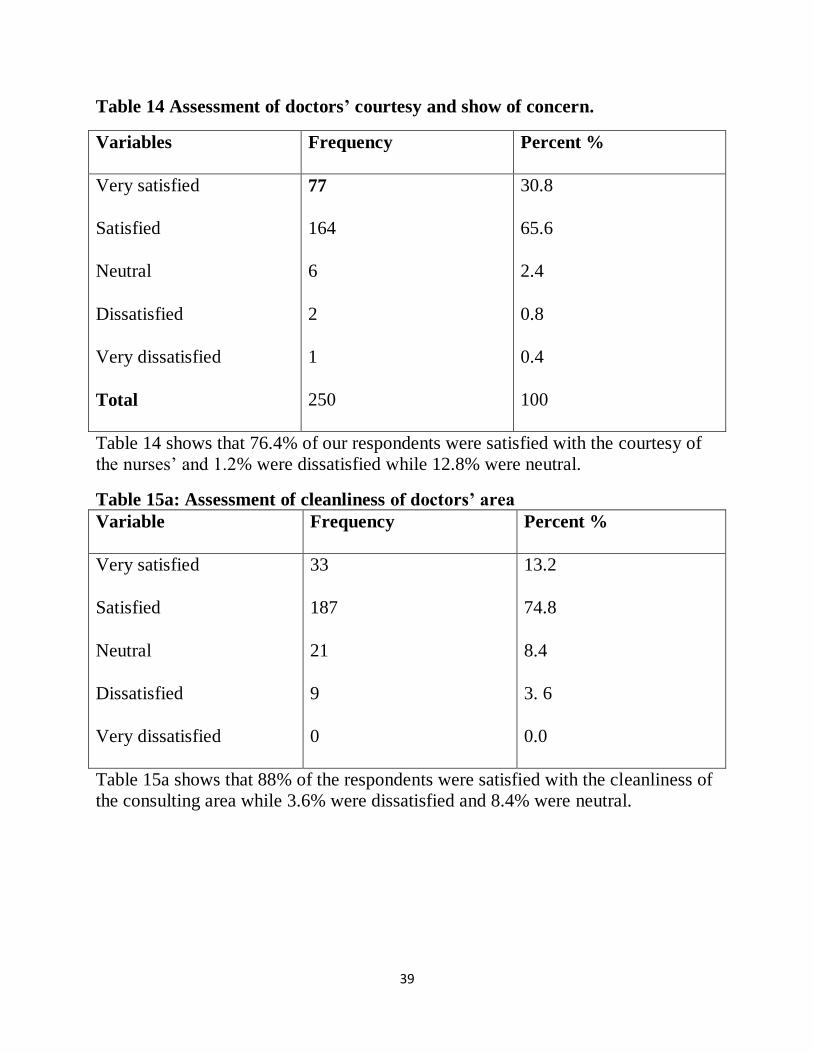
Table 14 Assessment of doctors’ courtesy and show of concern.
Variables Frequency Percent %
Very satisfied
Satisfied
Neutral
Dissatisfied
Very dissatisfied
Total
77
164
6
2
1
250
30.8
65.6
2.4
0.8
0.4
100
Table 14 shows that 76.4% of our respondents were satisfied with the courtesy of
the nurses’ and 1.2% were dissatisfied while 12.8% were neutral.
Table 15a: Assessment of cleanliness of doctors’ area
Variable Frequency Percent %
Very satisfied
Satisfied
Neutral
Dissatisfied
Very dissatisfied
33
187
21
9
0
13.2
74.8
8.4
3. 6
0.0
Table 15a shows that 88% of the respondents were satisfied with the cleanliness of
the consulting area while 3.6% were dissatisfied and 8.4% were neutral.

40
Table 15b: Assessment of cleanliness record area and Nurses area.
Variables Frequency Percent (%)
Record area
Very satisfied
Satisfied
Neutral
Dissatisfied
Very Dissatisfied
29
156
49
15
1
11.6
62.4
19.6
6.0
.4
Total 250 100.0
Nurses area
Very Satisfied
Satisfied
Neutral
Dissatisfied
Very dissatisfied
25
186
34
5
0
10.0
74.4
13.6
2.0
0
Total 250 100.0
Table 15b shows that a total of74% of our respondents were satisfied with the
cleanliness of the records area ,19.6% were indecisive, while 6.4% were
dissatisfied; similarly, 84% were satisfied with the cleanliness of the nurses’ area,
13.6% neutral, while 2% were dissatisfied.

41
Table 16: Assessment of level of satisfaction with total time spent at clinic.
Variable Frequency Percent %
Very Satisfied
Satisfied
Neutral
Dissatisfied
Very Dissatisfied
Total
12
105
13
75
45
250
4.8
42.0
5.2
30.0
18.0
100
Table 16 shows that 46.8% of our respondents were satisfied with the total time
spent at the clinic while 48% were dissatisfied, while 5.2% were neutral
Table 17: Assessment of overall performance of GOPD.
Variables Frequency Percent (%)
Very Satisfied
Satisfied
Neutral
Dissatisfied
Very Dissatisfied
Total
29
146
57
14
4
250
11.6
58.4
22.8
5.6
1.6
100.0
Table 17 shows that 70% of our respondents were satisfied with the overall performance of
GOPD while 7.2% were dissatisfied while 22.8% were neutral.

42
Table 18a: Relationship between overall satisfaction and respondents age, sex
and religion.
Variables Very
satisfied
Satisfied Neutral Dissatisfied Very
Dissatisfied
Statistical
test
Age
(years)
16-24
25-34
35-44
45-54
55-64
>65
4 (10.5%)
7 (8.9%)
9 (13.6%)
6 (18.2%)
2 (7.1%)
1 (16.7%)
24 (63.2%)
50 (63.3%)
34 (51.5%)
15 (45.5%)
20 (71.4%)
3(50%)
5 (13.2%)
(24.0%)
(27.3%)
(27.3%)
(17.9%)
(16.7%)
4 (10.5%)
1 (1.3%)
4 (6.1%)
3 (9.1%)
1 (3.6%)
1 (16.6%)
2.6 (2.6%)
2 (2.5%)
1 (1.5%)
0 (0%)
0 (0%)
0 (0%)
X2 = 16.66
df = 20
p =0.68
Sex
Male
Female
13 (12.7%)
64 (10.8%)
64 (62.7%)
82 (55.4%)
(18.6%)
(2.56%)
4 (3.9%)
10 (6.8%)
2 (2%)
2 (1.4%)
X2 =3.1
df =4
p =0.55
Religion
Christianity
Islam
Others
28 (11.6%)
1 (16.7%)
0 (0%)
143(59.1%)
3 (50%)
0 (0%)
(22.7%)
(33.3%)
(0%)
14 (5.8%)
0 (0%)
0 (0%)
2 (0.8%)
0 (0%)
2 (100%)
X2 = 1.24
df = 8
p =0.00
Table 18a shows that the relationship between the overall level of satisfaction
religion was statistically significant (p = 0.00). Christians had 70.7% satisfaction,
Islam had 66.7% satisfaction while 100% of those from other religions were very
dissatisfied.

43
Table 18b: Relationship between overall satisfaction and the respondents’
tribes and residence. Variable Very
satisfied
Satisfied Neutral Dissatisfied Very
dissatisfied
Test statistics
Tribe
Ikwerre
Ijaw
Igbo
Yoruba
Others
5(8.1%)
6(11.5%)
9(10.3%)
3(30%)
6(15.4%)
35(56.5%)
35(67.3%)
49(53.3%)
4(40%)
23(59%)
15 (24.2%)
9(17.3%)
23(26.5%)
3(30%)
7(17.9%)
4(6.5%)
1(1.9%)
6(6.9%)
0(0%)
3(7.7%)
3(4.8%)
1(1.9%)
0(0%)
0(0%)
0(0%)
X2 =16.1
df =16
p= 0.44
Residence
Urban
Rural
25(11.7%)
4(10.5%)
125(58.7%)
21(56.8%)
49(23%)
8(21.7%)
11(5.2%)
3(8.1%)
3(1.4%)
1(2.7%)
X2 = 0.89
df =4
p =0.93
Education
None
Primary
Secondary
Tertiary
2(22.2%)
6(18.8%)
9(9.3%)
12(10.7%)
5(55.6%)
15 (46.9%)
64(66%)
62(55.4%)
1(11.1%)
8(25%)
18(18.6%)
30(26.8%)
0(0%)
3(9.4%)
5 (6.2%)
6(5.4%)
1(11.1%)
0(0%)
1(1%)
2(1.8%)
X2 =14.2
df =12
p =0.299
Table 18b shows that there was no significant association between the overall
patients’ satisfaction with their tribe, residence and level of education. p= 0.44,
0.93 and 0.299 respectively.

44
Table18c: Relationship between overall satisfaction and respondents' occupation.
Variable Very
satisfied
Satisfied Neutral Dissatisfied
Very
dissatisfied
Test
statistics
Students
House wife
Farmer
Artisan
civil servant
Business
Company Worker
Pensioner
Others
4(8.2%)
1(12.5%)
1(8.3%)
1(4.2%)
8(26.7%)
2(7.4%)
1(4.8%)
1(1.9%)
0(0%)
34(69.4%
6(75%)
6(50%)
16(66.7%)
17(56.7%)
16(59.3%)
12(57.1%)
6(54.5%)
12(75%)
8(16.3%)
1(12.5%)
3(25%)
6(25%)
4(13.3%)
7(25.9%)
8(38.1%)
3(27.3%)
2(12.5%)
2(4.1%)
0(0%)
1(8.3%)
1(4.2%)
0(0%)
2(7.4%)
0(0%)
1(9.1%)
1(6.2%)
1(2%)
0(0%)
1(8.3%)
0(0%)
1(3.3%)
0(0%)
0(0%)
0(0%)
1(6.2%)
X2 =42.8
df = 40
p =0.352
Table 18c shows the relationship between the overall level of satisfaction of our
respondents and their level of education was not statistically significant. (p =0.352)
Table 19: relationship between overall time spent at the GOPD and overall
level of respondents satisfaction.
Variables Very
satisfied
Satisfied Neutral Dissatisfied Very
dissatisfied
Test
statistics
< 30min
30min-1hr
1 -2hrs
>2hr
1(33.3%)
3(18.8%)
14(30.4%)
11(5.9%)
2(66.7%)
11(68.8%)
28(60.9%)
105(56.8%)
0(0%)
1(6.2%)
3(6.5%)
53(28.6%)
0(0%)
1(6.2%)
0(0%)
7(13%)
0(0%)
0(0%)
1(2.2%)
3(1.6%)
X2 = 36.1
df = 12
p =0.000
Table 19 shows that 100% of the respondents who waited for less than 30min were satisfied with
overall services at the GOPD while 8.7% of those who waited for more than 2hours were
dissatisfied and this was found to be statistically significant. P =0.000

45
Table 20: Respondents suggestions towards ensuring improved patients’
satisfaction.
Suggestions Frequency Percent (%)
Provision of more
medical equipment and
infrastructure
Employment of more
doctors
Employment of more
nurses
Employment of more
record staff.
Improved courtesy of
medical personnel.
Others
Total
60
58
48
63
18
3
250
24
23.2
19.2
25.2
7.2
1.2
100
Table 20 highlights the recommendations made by my respondent in which 25.2%
of them believe that employment of more record staff will improve patients’
satisfaction, similarly,24% of the respondents wants more doctors to be brought in;
19.2% of them think employment of more nurses is essential and 7.2% wants an
improvement in the show of courtesy by medical personnel.

46
CHAPTER FIVE
DISCUSSION, CONCLUSION AND RECOMMENDATIONS.
5.1 DISCUSSION
This study showed that there were more female respondents 59.2% than males
40.8% .This is consistent with the work done in south east Nigeria where it was
shown that more females access the hospital facilities either for medical advice or
for childhood illnessthan men21
. More of the respondents were within the age range
of 25-34 (31.6%), while those above 65 years (2.4%) were the least frequent
respondents. This is not surprising as the younger age group could easily
independently seek for health care against the elderly who will need assistance
from other members of the family or community to do same 29
.
Christians constituted significant number of the respondents 90.8% with 2.4% of
the respondents being Muslims. This is due to the fact that majority of the
inhabitant of the Rivers State where UPTH is located are Christiansand this
research findings is in agreement with a similar work done in a teaching hospital in
Sokoto, a Northern state in Nigeria where more of the respondents were Muslims
(87.5%)15
. This indicates that the health facility in a region is more likely to be
accessed by the dominant religion within that region.

47
The respondents in this study were more of Igbos 34.8%, followed by
Ikwerre24.8%. One would have thought that the Ikwerres would feature more as
the hospital is in their locality. This is not the case as the Igbos made most of the
appearance. This may be related to the proximity of the south-east to the south-
south as UPTH is a referral center for most of the south-east and south-south
hospitals that are contiguous.
Respondents who had tertiary level of education were 44.8%. While those who
had completed secondary and primary level of education were 38.85% and 12.8%
respectively, whereas 3.6% of the respondents had no formal education. The
findings in this study is in contrast to that shown in a study carried out in a primary
health care center located in North Central Nigeria where a greater proportion of
patients 37.6% had only primary education. The dissimilarity in these studies could
be due to the location of UPTH proximal to a tertiary institution hence making it
accessible for student of the institute, unlike the primary health care center in Ilorin
that is located in an area likely to be a rural area 24
. Respondents from the study are
majorly habitants within the urban area 85.2% while a few of them who visit the
GOP clinic are from the rural area 14.8%.
The result of the study revealed that of the respondents that visited the GOP clinic
of UPTH,students were more and constituted 19.6% of the respondents which is

48
similar to a finding in a research carried out in Northern part of Nigeria15
followed
closely by traders with 18.0%. However12.0% were civil servants, 3.2% were
house wives, 4.4%were pensioners, 2.8%were contractors, while others were 6.4%.
The predominance of students in the clinic may be attributed to better
enlightenment on good health seeking behavior and also to the proximity of the
health care facility to the campus3.
Significant number of participants 45.2% waited for 30min-1hr before getting their
cards while those who waited for >2hr where 6.8%. There wassimilar finding in
the wait time at the nurses 49.2% and doctors 47.2% sections where more of the
participants spent30mins-1hr whereas those who waited for >2hr before being
attended to either by the nurses 5.6% or doctors 12.0% were found to be the least.
The relationship between patients satisfaction and wait time was significant
(p=0.00). This was because those who spent <30mins had a 100% level of
satisfaction while those spending >2hrs were most dissatisfied. This was similar to
a research work 19
in which showed a significant relationship with longer waiting
time associated with low level of client satisfaction. Another study by Andrabi et al
also revealed that Major client dissatisfaction was with waiting time greater than
30minutes30
.
From the result it was found that a greater number of respondents were satisfied
with the courtesy of the records88% and nurses77.6% of the GOP clinic. It has
49
been found that the most powerful predictor for client satisfaction was the
providers behavior towards patients30
. However the participants who were neither
dissatisfied nor satisfied 5.6% and 12.8% were less when compared to those who
were dissatisfied 6.4% and 9.6% respectively.
The result shows that 74% and 84.4% of the respondents were satisfied with the
cleanliness of therecords and nurses wait areas which indicated an overall
satisfaction with the GOP clinic wait areas. Although there was an overall
satisfaction with the cleanliness of the wait areas, those who were neither satisfied
nor dissatisfied were higher when compared to those who were dissatisfied.
This study showed that those who were dissatisfied 48.8% with the total time spent
at the clinic were more although the difference wasn’t much when compared to
those who were satisfied46.8% with the total time spent at the clinic.5.2% were
neither satisfied nor dissatisfied.
The overall performance satisfaction level of GOPD is 70% which is above
average. This is similar to a finding in a study carried out in Nepal where about
three quarter of the patients expressed an overall satisfaction25,14
. The higher
satisfaction may be attributed to UPTH being a referral hospital, which receives
patients who have often been shunted around between lower level facilities
and attended by general practioners than by specialists30
. And an overall

50
performance dissatisfaction level of 7.2%. The overall performance level for those
who were neither satisfied nor dissatisfied 22.8% was higher than the overall
dissatisfaction.The difference in the satisfaction level may also be due to the
variation in the ways services are delivered, differences in the study population,
socio cultural differences, variation in methodology and variation in levels of
literacy25
.
The relationship between overall patients’ satisfaction with respect to age(p=0.06)
and sex (p=0.55) was statistically non-significant whereas that between overall
level of satisfaction and patients’ religion (p=0.00) was statistically significant.
There were no statistical significance of overall patients’ satisfaction with respect
to tribe (p=0.44), residence (p=0.93) level of education (p=0.299) and occupation
(p=0.352). This is in contrast to a work done in a Teaching Hospital in Oyo State
in which there were statistically significant associations between the level of
satisfaction of the respondents and their occupations (p = 0.044) and educational
status (p = 0.029)21
.
From the recommendations made by the respondents 25.2% of them believe that
employment of more record staff will improve patients’ satisfaction, Similarly,24%
of the respondents want more doctors to be brought in; 19.2% of them think
employment of more nurses is essential and 7.2% want an improvement in the
show of courtesy by medical personnel.

51
5.2 CONCLUSION
The findings from this study showed that the overall satisfaction with services at
the general outpatient clinic was way above average, however, we observed
varying degrees of dissatisfaction with some services. The satisfaction of patients
with services in healthcare settings has turned out to be an important issue which if
properly handled could help educate healthcare providers about their shortcomings
and achievements, thus making them more responsive to the needs of patients.
The results showed that most of the patients are satisfied with the GOPD with a
satisfaction rate of 70%. This is contrary to our expectations, as we believe there
are a lot of improvements which can be done to elevate the quality of service
provided. One reason may be that patients wanted to be good patients and a
negative answer negated this aspect.
5.3 RECOMMENDATIONS
Sequel to the findings, the following recommendations are thus made.
a. Provision of more medical equipments and infrastructure.
b. Employment of more doctors.
c. Employment of more nurses.
d. Employment of more record staff.

52
REFERENCES
1. Stresser S. Perception and use of the results of patient satisfaction survey in
French teaching hospital. International Journal in quality of health care 2006
18(5) 359-364.
2. Lliyasu Z, Abubakar S, Lawan U M, Gajida AU. Patients Satisfaction with
services obtained from Aminu Kano Teaching Hospital, Kano, Northern
Nigeria. Nigerian Journal Clinical Practice, 2010: 13; 371-378.
3. Bamgboye E, Jarallah J. Long waiting Outpatients: Target Audience for
Health Education. Patient Education and Counseling. 1994:23:49-54.
4. Ogunfowokan O, Mora M. Time, Expectation and Satisfaction: Patients
experience at National Hospital Abuja, Nigeria. Afr J Prm Health Care Fam
Med. 2012; 4(1).
5. Kunders GD, Hospitals planning, design and management. Tata McGraw-
Hill Publishing Company Ltd., New Delhi. 1998; 328-342.
6. Yildlz Z, Erdogmus S (2004).Measuring patient satisfaction of the quality of
health care: a study of hospitals in Turkey. J. Med. Syst. 28(6):581-589.
7. Rozenblum R, Lisby M, Hockey PM, Levtizion KO, Salzberg CA, Lipsitz S,
Bates DW (2011). Uncovering the blind spot of patient satisfaction: an
international survey. BMJ Qual. Saf. 20:959-965.
8. Fouzia N., Gobind M. H and Nawaz A., Identifying Factors Affecting
Patients’ Satisfaction against Quality of Health Care Services: An
Investigation from Aga Khan Hospital Karachi. Social Science Research
Network;2012: (12)123-125.
9. Avedis D. The quality of care: How it can be assessed? Journal American
Medical Association; 1988:260(12):1743-1748.
10. Ware JE, Snyder MR, Wright R. Defining and measuring patient satisfaction
with medical care. Eval. Prog. Planning, 1983; 6: 247-263.

53
11. Kovitha R, A comparative study on patients` satisfaction in health care
service. European Journals of Business and Management; 2012, 4: 156.
12. Joshua O.E, Service quality and patients satisfaction with health care
delivery: empirical evidence from patients of the outpatient department of a
public university in Ghana. European journal of business and management;
2013, 5: 52-5.
13. Anteneh A., Andargachew K. and Muluken D., Patient satisfaction with
outpatient health services in Hawassa University Teaching Hospital,
Southern Ethiopia. Journal of Public Health and Epidemiology
2014,6(2):101-11.
14. Al-Assaf N H, Factors Related to Patient Satisfaction with Hospital Health
Care at Iraqi J. Comm. Med; 2009, (4): 218-2.
15. Adamu H.,Oche M O., Patient Satisfaction with Services at a General
Outpatient Clinic of a Tertiary Hospital in Nigeria. British Journal of
Medicine & Medical Research; 2014, 4(11): 2181-2202.
16. Mikael R. Patients’ satisfaction in relation to age, health status and other
background: a model for comparison of health care unit. International
Journal for Quality in Health Care; 2001, 13:385-390.
17. Al-Refaie A.A Structural Model to Investigate Factors Affect Patient
Satisfaction and Revisit Intention in Jordanian Hospitals. International
Journal of Artificial Life Research; 2011, 2(4): 43-56.
18. John E. L. Factors related to patients' satisfaction with their medical care in
south west Nigeria. Journal of Community Health; 1983, 9: 91-109.
19. Margaret W.N, Rosebella O, Rose K., Determinants of clients’ satisfaction
with healthcare services at PumwaniMaternity Hospital in Nairobi, Kenya.
International Journal of Social and Behavioral Sciences; 2014, 2(1):011-017.
20. Yahaya J.S. Assessment of Student’s Satisfaction and Quality of Patient
Care under the Nigerian Tertiary Institutions Social Health Insurance
Programme, Department of Business Administration, Ahmadu Bello
University Zaria, Kaduna State, Nigeria. European Journal of Business and
Management; 2015, (7):2222-2839.

54
21. Abodunrin O. L,Adeomi A. A. and Adeoye O. A. Clients’ satisfaction with
quality of healthcare received: Study among mothers attending infant
welfare clinics in a semi-urban community in South-western Nigeria.
Department of Community Medicine, College of Health Sciences,
LadokeAkintola University of Technology (LAUTECH), Sky Journal of
Medicine and Science;2014, 2(7):45-51
22. Jane C U-E, Obinna E O , Benjamin S C U,Ogochukwu P E. Patients’
Satisfaction and Quality of Care in a Tertiary Institution in Southeast
Nigeria. International Research Journal of Basic and Clinical Studies; 2014,
2(2):14-19
23. Ajayi I.O, Olumide E.A, Oyediran O; Patients satisfaction with the services
provided at a general outpatients clinic, Ibadan, Oyo State, Nigeria. Afr J
MedSci 200; 34(20) 133-40.
24. Oluwole A.B, Emmanuel A, Olugbenga A.A, Tanimola M.A, omotosho I.M,
Adekunle G.S, Olubukpla O.B, Oladele A.A; Primary health care consumer
perception of quality of care and its determination in North-Central Nigeria:
Journal of Asia Scientific research;2013, 3(7) 775 -785.
25. Rizyal A. patients’ satisfaction with eye care services at Nepal Medical
College Department of Ophthalmology, Nepal Medical College Teaching
Hospital, Jorpati, Kathmandu, Nepal. Nepal Med Coll J 2012; 14(3): 172-
175.
26. Sidhu T K, Kaushal R, Kumar R; Assessment of satisfaction of patients
attending Surgical OutpatientDepartment in Adesh institute of Medical
Science and Research. Journal of Clinical and Diagnostic Research. 2010;
4: 2416-2420.
27. Daniel H O Port Harcourt Medical Journal, University Of Port Harcourt
Teaching Hospital, College of Health Sciences;2013, 2 (74-110).
28. Daniel OJ, Patients Satisfaction with Health Services at the Outpatient
Departmaentof a Tertiary Hospital in Nigeria. Nigerian Journalof Clinical
Medicine; 2013, (5):243- 63.

55
29. Abdulraheem, I., A. Oladipo and M. Amodu, Prevalence and correlates of
physical disability and functional limitation among elderly rural population
in Nigeria. Journal of Aging Research, ID 369894.
doi:10.4061/2011/369894.
30. Andrabi S.A, Hamdi S, Rohul J, Anjun F; measuring patients satisfaction: a
cross sectional study to improve quality of care at a tertiary care hospital;
healthline Journal 2012, 3(1) 59-62.

56
APPENDIX 1
QUESTIONNAIRE
SECTION A: Socio-demographic profile
1. . Age (yrs.) a.16-24□b. 25-34□.35-44□ d.45-54□ e.55-64□ f.>65□
2. Sex a. Male□ b. Female □
3. Religion a. Christianity □ b. Islam □ c. Others□………….…… (Specify)
4. Tribe a. Ikwerre□ b.Ijaw□ c.Igbo□ d. Yoruba □Others……. (Specify)
5. Place of residence a. Urban□ b. Rural□
6. Educational level completed a. None□ b. Primary□ c. Secondary□
d. Tertiary□
7. Occupation a. Student□ b. Farmer□ c. Trader□ d. Artisan□
e. Civil servant□ f. Business □g. Company worker□ h. Contractor□
i. Pensioner□ j. Housewife□ k. Others (specify)………………………
SECTION B: Assessment of record section of GOPD
8. How long did you wait before getting your card/folder? a. <30 mins □
b. 30 mins-1hr□ c.1-2hrs□d. >2hrs□.
9. How satisfied were you with the courtesy by the record staff?
a. Very satisfied□ b. Satisfied□ c. Neutral□ d. Dissatisfied□ e. Very
dissatisfied□.

57
10. How satisfied were you with the waiting time before registration?
a. Very satisfied□ b. Satisfied□ c. Neutral□ d. Dissatisfied□
e. Very dissatisfied□.
11. How satisfied were you with the registration process? a. Very satisfied□
b. Satisfied□ c. Neutral□ d. Dissatisfied□ e. Very dissatisfied□.
12. How satisfied were you with the cleanliness of the records waiting area? a.
Very satisfied□ b. Satisfied□ c. Neutral□ d. Dissatisfied□
e. Very dissatisfied□.
SECTION C: Assessment of nurses’ section of GOPD
13. How long did you wait before being attended to by the nurses?
a. <30mins□ b.30 mins-1hr□ c. 1-2hrs□ d. >2hrs□
14. How satisfied were you with the courtesy by the nurses? a. Very satisfied□
b. Satisfied□ c. Neutral□ d. Dissatisfied□ e. Very dissatisfied□,
15. How satisfied were you with the cleanliness of the nursing waiting area?
a. Very satisfied□ b. Satisfied□ c. Neutral□ d. Dissatisfied□
e. Very dissatisfied□
16. How satisfied were you with the care and concern shown by nurses?
a. Very satisfied □b. Satisfied□ c. Neutral □d. Dissatisfied □
e Very dissatisfied□.

58
17. How satisfied were you with the overall service by the nurses at GOPD? a.
Very satisfied□ b. Satisfied□ c. Neutral□ d. Dissatisfied□
e. Very dissatisfied□
18. Was there any health talk given while you were in the waiting area?
a. Yes□ b. No□.
19. If yes, how satisfied were you with it? a. Very satisfied □b. Satisfied□
c. Neutral □ d. Dissatisfied□ e. Very dissatisfied□.
SECTION D: Assessment of doctors’ section of GOPD
20. How long did you wait before seeing the doctor?
a. <30 mins□ b. 30mins-1hr□ c. 1-2hrs□ d. >2hrs□
21. How satisfied were you with the neatness and comfort of the waiting area?
a. Very satisfied□ b. Satisfied□ c. Neutral□ d. Dissatisfied□
e. Very dissatisfied□.
22. How satisfied were you with the show of concern by the doctors?
a. Very satisfied□ b. Satisfied□ c. Neutral □d. Dissatisfied □
e. Very dissatisfied□.
23. How satisfied were you with the technical skills of the doctors?
a. Very satisfied□ b. Satisfied□ c. Neutral□ d. Dissatisfied□
e. Very dissatisfied□
24. How satisfied were you with doctor’s explanation of your condition?
a. Very satisfied□ b. Satisfied□ c. Neutral□ d. Dissatisfied□
e. Very dissatisfied□.

59
25. How satisfied were you with instructions given by the doctor on
investigations/prescriptions? a. Very satisfied□ b. Satisfied□ c. Neutral□
d. Dissatisfied□ e. Very dissatisfied□.
26. How much time did you spend with the doctor? a. <10 mins□ b.10-
15mins□ c. 15-20mins□ d. 20-25mins□e. >25min□.
27. How satisfied were you with the amount of time you spent with the doctor?
a. Very satisfied□ b Satisfied□ c. Neutral□ d. Dissatisfied□
e. Very dissatisfied□.
28. How satisfied were you with the condition (comfort, privacy etc.) of the
consulting room? a. Very satisfied□ b. Satisfied□ c. Neutral□
d. Dissatisfied□ e. Very dissatisfied□.
SECTION E: Assessment of general performance of GOPD
29. How much time did you spend from arrival to your exit?
a. <30 mins□ b.30mins-1hr□ c. 1-2hrs□ d. >2hrs□.
30. How satisfied were you with the amount of time you spent at the clinic?
a. Very satisfied □b. Satisfied□ c. Neutral□ d. Dissatisfied □
e. Very dissatisfied□.
31. How satisfied are you generally with the overall performance (services) of
the clinic/staff? a. Very satisfied□ b. Satisfied□ c. Neutral□
d. Dissatisfied□ e Very dissatisfied □.
32. Do you think you waited too long in the course of receiving services at the
clinic? a. Yes□ b. No □

60
33. If yes, why? a. No /few record clerk(s) on desk□ b. Patients were too
many□ c. No /few doctor (s) to attend to me on time□ d. shunting by other
patients/staff□ e. Others (Specify)…………………………………
34. Would you be willing to recommend the services of this clinic to others?
a. Yes□ b. No □.
35. What are your suggestions to ensure improved satisfaction for patients?
a. Provision of more medical equipment and infrastructure□ b. Employment
of more doctors □c. Employment of more nurses □d. Employment of more
records staff□ e. Improved courtesy of medical personnel □ f. Others please specify.…………………………..................................


