Embed Size (px)
Citation preview

Seediscussions,stats,andauthorprofilesforthispublicationat:https://www.researchgate.net/publication/259947575
Assessmentofportableemissionmeasurementsystems(PEMS)forheavy-dutydieselengineswithrespecttoparticulatematter
ARTICLEinJOURNALOFAEROSOLSCIENCE·MARCH2013
ImpactFactor:2.24·DOI:10.1016/j.jaerosci.2012.10.004
CITATIONS
13
READS
251
4AUTHORS,INCLUDING:
AdolfoPerujo
EuropeanCommission
113PUBLICATIONS1,156CITATIONS
SEEPROFILE
MassimoCarriero
EuropeanCommission
16PUBLICATIONS115CITATIONS
SEEPROFILE
Allin-textreferencesunderlinedinbluearelinkedtopublicationsonResearchGate,
lettingyouaccessandreadthemimmediately.
Availablefrom:AdolfoPerujo
Retrievedon:05February2016

Contents lists available at SciVerse ScienceDirect
Journal of Aerosol Science
Journal of Aerosol Science 57 (2013) 54–70
0021-85
http://d
n Corr
E-m
journal homepage: www.elsevier.com/locate/jaerosci
Assessment of portable emission measurement systems(PEMS) for heavy-duty diesel engines with respectto particulate matter
Athanasios Mamakos n, Pierre Bonnel, Adolfo Perujo, Massimo Carriero
European Commission, Joint Research Centre, I-21027 Ispra (VA), Italy
a r t i c l e i n f o
Article history:
Received 31 July 2012
Received in revised form
12 October 2012
Accepted 15 October 2012Available online 27 October 2012
Keywords:
PEMS
PM
In service conformity
Moving average window
02/$ - see front matter & 2012 Elsevier Ltd.
x.doi.org/10.1016/j.jaerosci.2012.10.004
esponding author. Current address: Southw
ail address: [email protected] (
a b s t r a c t
The performance of three Portable Emission Measurement Systems (PEMS) for Particu-
late Matter (PM) was assessed in our laboratory against reference instrumentation in
engine dynamometer testing of five Heavy Duty Engines (HDEs) of different after-
treatment technologies. The candidate systems were designed around the minimum
requirements of allowing a gravimetric determination of the total emitted PM mass and
incorporating a real time particle sensor. All PEMS-PM systems were found to reproduce
within 730% the gravimetric PM results determined with reference measurement
systems under non-regenerative operating conditions, at emission levels lying at and
above the Euro VI limit of 10 mg/kWh. The use of prolonged sampling times envisaged
in In Service Conformity (ISC) testing (4120 min) was found to be beneficial, as it
reduced the limit of detection of the PEMS-PM instrumentation to 1–3 mg/kWh
(120 min) from 3 to 9 mg/kWh (30 min). The real time aerosol instrumentation exhibited
a much higher sensitivity, being capable of quantifying emission levels below the EURO
VI particle number limit of 6�1011 #/kWh. Some modifications were required though in
two particle sensors that were based on diffusion charging, in order to avoid a
disproportional increase in their responses in the presence of homogeneously nucleated
particles. Passive regeneration of the particulate filter resulted in excessive emission of
volatile PM but also large discrepancies between the PEMS-PM and reference systems.
The accurate quantification of absolute emission levels of non-volatile PM from the real
time sensors can assist in the identification of such excessive volatile PM fractions, to
avoid properly working DPF systems to fail an ISC test.
& 2012 Elsevier Ltd. All rights reserved.
1. Introduction
On-road and non-road diesel vehicles were long recognized as significant contributors to ambient Particulate Matter(PM) and Nitrogen Oxide (NOx) emissions (EEA, 2010; USEPA, 2000). Accordingly, the exhaust PM and NOx emissions ofdiesel internal combustion engines employed in Heavy Duty Vehicles (HDVs), Passenger Cars (PCs) and Non-Road MobileMachineries (NRMM) have been subject to increasingly stringent regulations worldwide.
The emission certification was traditionally conducted on an engine (HDVs, NRMM) or a chassis (PCs) dynamometer,under well prescribed operating conditions. These standard procedures however, do not necessarily capture the real-world
All rights reserved.
est Research Institute, 78238 San Antonio (TX), USA. Tel.: þ1 210 52 2987.
A. Mamakos).

Nomenclature
CO2 carbon dioxideCPC condensation particle counterCRT continuous regenerating trapCVS constant volume samplerDOC diesel oxidation catalystDPF diesel particulate filterDR dilution ratioEAD electrical aerosol detectorEC European commissionESC European stationary cycleETaPS electrical Tailpipe particulates sensorGFB gravimetric filter boxHEPA high efficiency particulate air filterHDE heavy duty engineHDV heavy duty vehicleISC in service conformityIUC in use complianceLOD limit of detectionMAW moving average windowMOVE mobile vehicle evaluationmPSS micro particulate sampling systemMSS micro-soot sensorNO nitrogen monoxideNOx nitrogen oxides
NO2 nitrogen dioxideN2O nitrous oxideNRMM non-road mobile machineryNTE not to exceedOBS(-TRPM) on-board system (with transient PM
measurement)PC passenger carPEMS portable emission measurement systemPFDS partial flow dilution systemPM particulate matterPMP particle measurement programmePMP_HD_ILCE PMP heavy duty inter-laboratory corre-
lation exercisePN particle numberPPS Pegasor particle sensorSCR selective catalytic reductionSO2 sulphur dioxideSPC AVL SPC-472 partial flow dilution systemSPCS solid particle counter systemTX40 47 mm Teflon-coated glass-fiber Pallflexs
TX40H120-WWUSA United States of AmericaUSEPA United States Environmental Protection
AgencyWHTC World-harmonized heavy duty transient cycle
A. Mamakos et al. / Journal of Aerosol Science 57 (2013) 54–70 55
emission performance of the vehicles (Federal Register, 2003; Weiss et al., 2011). Portable Emission Measurement Systems(PEMS) for gaseous pollutants, first developed in the late 1990s, have provided the means to assess the emissionperformance of both HDVs (Bachman et al., 2005, Vojtisek et al., 2001) and PCs (Jetter et al., 2000; Rubino et al., 2007)under real-world driving conditions but also served as emission inventorying tools (Dilara et al., 2010).
Shortly after their introduction in the market, gas PEMS systems were recognized as an alternative cost-effectivesolution to check the In Service Conformity (ISC) of HDEs, which would otherwise require extracting the engine from thevehicle. The portable measurement devices were proven to exhibit nearly similar performance to laboratory gradeequipment (Bonnel et al., 2011; USEPA, 2008), and were accordingly approved by both the United States EnvironmentalProtection Agency (USEPA, Federal Register, 2005) and the European Commission (EC, 2009) for use in engine certificationbut also for ISC (In Use Compliance (IUC) in USA).
The ISC and IUC are similar regulatory concepts, addressing the in-field performance of HDVs. The main difference liesin the engine map covered and the evaluation principle. In IUC, the emissions of a pollutant are calculated from the realtime signal of a PEMS for a period of time where the engine operating conditions fall into a defined high speed and loadarea of the engine map, the so called Not-To-Exceed (NTE) zone, for a minimum of 30 s (Boucher et al., 2012; Durbin et al.,2007; Federal Register, 2003). In the European ISC, the Moving Average Window (MAW) approach is employed instead(Bonnel et al., 2011), according to which, the real time signal of a pollutant is used to calculate the emissions over all timesegments (windows) where the engine work (or CO2 emissions) matches the engine certification value and the averageengine power exceeds a limit value (Rubino et al., 2007, Appendix A in Supplementary material).
The application of PEMS procedures for PM measurements however, is not straightforward. PM is not a well definedpollutant, but is rather a complex mixture of solid material (mainly soot but also metallic ash) produced in the combustionprocess and volatile organic and inorganic compounds that are added as the exhaust dilutes and cools down (Kittelson,1998). It was traditionally determined gravimetrically following the Constant Volume Sampling (CVS) technique where thewhole exhaust is diluted in a tunnel operating at constant total flowrate or, more recently, using Partial Flow DilutionSystems (PFDS) sampling a portion of the exhaust at a rate proportional to the exhaust flow (ISO 16183, 2002). Yet, theoperating conditions of the CVS or the PFDS were found to have a strong effect on the volatile fraction of PM (Duran et al.,2002; Khalek et al., 2002; MacDonald et al., 1980; Reichel et al., 1983), the contribution of which becomes more importantfor low emitting engines (Vouitsis et al., 2003). The gravimetric determination of PM also implies the lack of real timeinformation that is a prerequisite for PEMS measurements irrespective of whether the NTE or the MAW approach isemployed.
In the meanwhile, the regulatory authorities have introduced very strict PM emission limits, which will effectively mandatethe installation of Diesel Particulate Filters (DPFs) in both PCs (EC, 2007) and HDVs (EC, 2009). DPFs are also anticipatedto be widely employed in future NRMMs to comply with the upcoming emission standards (Directive 2004/26/EC, 2004).

A. Mamakos et al. / Journal of Aerosol Science 57 (2013) 54–7056
An important development in this direction has been the introduction of a non-volatile Particle Number (PN) limit in theEuropean legislation for HDEs (EC, 2009) and PCs (EC, 2008) that can only be met if very efficient wall flow DPFs willbe employed. The application of DPFs drastically changes the chemistry of the emitted PM, which is dominated byvolatile species and adsorbed material, the quantification of which at the low post-DPF levels becomes very challenging(Chase et al., 2004).
Shortly after the first appearance of prototype PEMS instrumentation capable of quantifying PM emissions on-board(Booker et al., 2007; Durbin et al., 2007), the European Commission launched a laboratory evaluation programme to assesstheir potential. The basic technical requirements for the PEMS-PM instrumentation were (a) to be capable of quantifying thetotal emitted PM mass over at least 2 h of on-road testing, either following the standard regulated dilution and samplingmethods (PFDS) or using a method proven to be equivalent to the standard method and (b) to provide real time informationof a physical property related to PM mass to allow for a calculation of the PM emissions over MAWs or NTE events.
Five in total candidate PEMS-PM systems were supplied to the Joint Research Centre (JRC) of the European Commissionand were assessed in a dedicated measurement campaign which was split in two main phases. The first phase lasted forapproximately 2 years and concluded that the proposed reference measurement principle (i.e. gravimetric determinationof PM with a proportional PFDS accompanied by a real time particle sensor) can reproduce the regulated methodologywith an accuracy of 715% for non-DPF equipped engines but at post-DPF levels, large deviations (in excess of 50%) wereobserved (Bonnel et al., 2010; Giechaskiel et al., 2011). Accordingly, it was decided to further investigate the performanceof the different PEMS-PM candidate systems at PM emission levels representative of HDEs equipped with properlyfunctioning or damaged DPFs, in an attempt to establish the sensitivity levels of the instrumentation. At the same time,instrumental manufacturers were recommended to undertake all possible measures to improve the performance of theirsystems (both for measurement and on-vehicle easiness of use), allowing once more for simplified implementations (i.e.non-proportional sampling, or non-gravimetric determination of PM) to be evaluated. The follow-up measurementcampaign lasted for approximately one and a half years and consisted of three sub-phases (referred here as phase 2,Mamakos et al., 2011a, phase 3, Mamakos et al., 2011b, and phase 4 of the programme, respectively), within which thecandidate systems were refined several times by the instrument manufacturers.
Here we assess the performance of three PEMS-PM candidate systems that complied with the aforementioned essentialrequirements.1 More specifically we investigate the sensitivity and PM emission discrimination capabilities, relative toreference laboratory instrumentation, focusing at post-DPF and damaged-DPF emission levels. The assessment includesPM sample collection over consecutive test cycles using different filter media to quantify the benefit of prolonged samplingenvisaged in ISC testing. Dedicated tests are also conducted to evaluate the performance of the PEMS-PM instrumentationduring passive DPF regeneration.
2. Experimental
2.1. Engines, fuels and test cycles
Five in total HDEs were employed in the measurement campaign. The engines tested in phase 1 of the project were a 10l IVECO Cursor Euro III HDE (HDE#1) equipped with an EMITEC Partial Flow Deep Bed Filter, a 10 l Man D2066 LF Euro VHDE (HDE#2) employing a Selective Catalytic Reduction (SCR) system and a US2007 compliant 15 l Cummins ISX 500 HDE(HDE#3) utilizing a Diesel Oxidation Catalyst (DOC) and a wall flow Diesel Particulate Filter (DPF). The engine tested inphase 2 of the project (HDE#4) was the 7.8 l IVECO Cursor 8 Euro III ‘‘golden’’ HDE of the Particle Measurement ProgrammeHeavy Duty Inter-laboratory Correlation Exercise (PMP_HD_ILCE) (Andersson et al., 2010). HDE#4 was retrofitted with aContinuous Regenerating Trap (CRT) system by Johnson Matthey, consisting of a DOC and a wall flow DPF. The engineemployed in the last two phases of the campaign (HDE#5) was a Euro III IVECO Cursor 10 engine, which was retrofitted bya non-catalyzed DPF (Pirelli Feelpure system – HDE#5_U) and a DOC plus catalyzed DPF (by Baumot – HDE#5_C),respectively. In the tests of HDE#4 and HDE#5, a bypass line (9 cm diameter stainless steel tube of 160 cm length) wasemployed in parallel to the whole aftertreatment system (including the DOC) to simulate malfunctions (cracks) of thelatter. The actual PM levels were controlled by means of a valve in this by-pass line.
All engines were tested on diesel fuel complying with Annexes 3 and 4 of Directive 2003/17/EC describing fuelspecifications to be employed after 1st January 2009 (less than 10 ppm sulphur). The HDEs run on 5W-30 or 10W-40lubricating oil according to the manufacturers’ specifications.
The engines were mostly tested over the World-harmonized Heavy duty Transient Cycle (WHTC). Selected tests ofHDE#4 and HDE#5 were also conducted at mode 12 of the European Stationary Cycle (ESC mode 12–85 % speed and 75%load), where the high exhaust temperatures triggered passive regeneration of the DPFs. Some blank tests (engine turnedoff) were also conducted in order to quantify the PM background levels in the different systems.
The exhaust flowrate signal (necessary for the control of the sample flowrates of all proportional partial flow dilutionsystems) was provided by the test bench control software and was determined by means of real time measurement of theintake air flow and the fuel consumption.
1 Information on the performance of the other two systems can be found in details elsewhere (Bonnel et al., 2010; Mamakos et al., 2011a, 2011b).

A. Mamakos et al. / Journal of Aerosol Science 57 (2013) 54–70 57
2.2. Instrumentation
This section provides a brief overview of the instrumentation employed and the modifications undertaken by themanufacturers during the measurement campaign. A more detailed description can be found elsewhere (Bonnel et al.,2010; Mamakos et al., 2011a, 2011b).
2.2.1. PEMS-PM candidates
2.2.1.1. OBS-TRPM. The On-Board System with Transient PM Measurement (OBS-TRPM, Horiba Instruments Inc.) is an on-board proportional PFDS allowing for the collection of PM samples on 47 mm filters at a total flow-rate of 30 lpm (Weiet al., 2009) (filter face velocity of 48 cm/s). Samples are extracted and immediately diluted at the tailpipe. The dilutedexhaust is subsequently transported to the temperature controlled (4775 1C) filter cabinet through a 4 m long (1.1 sresidence time) heated line (47 1C). The OBS-TRPM (abbreviated as OBS hereinafter) also incorporates an Electrical AerosolDetector (EAD) by TSI Inc. to measure the ‘‘total particle length’’ of the diluted exhaust in real time (Kaufman et al., 2002).The original EAD unit (EAD#1) was replaced after the conclusion of phase 2, as it was found that the efficiency of thecorona charger dropped. In selected tests of the replacement EAD (EAD#2) in the 4th phase of the programme, the trapvoltage employed to remove the excess ions produced in the corona charger was intentionally increased (from the originalsetting at 20 V to 300 V). This modification was employed in order to intentionally increase the particle losses in thenanosized range and accordingly decrease the sensitivity of the instrument to nucleation mode volatile particles. As thismeasure was not proven sufficient to effectively remove nucleation mode particles under certain operating conditions, astack of 15 stainless steel diffusion screens (TSI 376060) was additionally employed at the inlet of the EAD#2 in theremaining tests of phase 4.
2.2.1.2. mPSS. The micro Particulate Sampling System (mPSS) by Control Sistem l.t.d. is an on-board proportional PFDS thatincorporates a 47 mm filter sample. Samples were drawn from the tailpipe through a 1 m long heated line (47 1C) and weresubsequently diluted with heated, HEPA-filtered ambient air so that the temperature of the filter holder is maintained at4775 1C. The mPSS operated at a total flowrate of 30 lpm that resulted in a residence time of 0.5 s for the diluted exhaustand a filter face velocity of 48 cm/s.
In its original configuration, the mPSS did not incorporate any real time particle sensor as it was initially intendedto be combined with an Electrical Tailpipe Particulates Sensor (ETaPS) by Dekati l.t.d. (Gautam et al., 2010) thatallowed raw exhaust measurements. However, following the poor performance of the ETaPS in the main measurementcampaign (Phase 1 – Bonnel et al., 2010), it was decided that raw exhaust measurements will not be allowed2. Accordingly,the mPSS was modified to allow for the integration of an alternative particle sensor developed by Pegasor Ltd(PPS) (Ntziachristos & Tikkanen, 2009). The operating principle of the PPS is based on the diffusion charging of thesampled aerosol and the subsequent measurement of the current induced as the charged aerosol exits the sensor, designedto act as a Faraday cage. The PPS also incorporates an ion-trap, which can be adjusted to control the lowest detectableparticle size.
Three different prototype versions of the PPS were assessed, all of which had to be improved to address a number ofissues ranging from zero drifting of the electrometer (PPS#1 employed in phase 2 – Mamakos et al., 2011a), to corrosion ofthe corona wire (PPS#2 employed in phase 3 – Mamakos et al., 2011b) and some grounding problems (PPS#3 employed inphase 4). PPS#2 and PPS#3 were set at elevated ion trap voltages in selected tests to reduce their sensitivity to volatilenucleation mode particles. The manufacturer though, identified that the set voltage trap was not achieved in PPS#3 due tosome grounding problems.
2.2.1.3. AVL MOVE PM-PEMS. The PEMS-PM system submitted by AVL GmbH (hereinafter MOVE), utilizes a conditioningunit mounted directly at the tailpipe that provides a fixed dilution ratio of up to 12:1. The diluted sample is transferredthrough a 1 m heated line (4775 1C) to a photoacoustic sensor (Bell, 1880) (AVL Micro Soot Sensor – MSS) measuring themass concentration of soot particles in real time (Schindler et al., 2004). Initially, the system did not incorporate a filterholder and the total PM mass was estimated from a numerical model (mentioned in Durbin et al., 2009; Giechaskiel et al.,2011) which required information on the hydrocarbon emissions, fuel sulphur content and catalyst formulation, amongstothers. It was requested though at the conclusion of the first phase that the manufacturer incorporates a more traceablemethod for the determination of the total PM emissions.
In response, AVL introduced an externally heated (at 4775 1C) Gravimetric Filter Box (GFB) allowing for PM samplecollection onto 47 mm filters at a flowrate of 5 lpm. A specially designed spacer ring (Arndt et al., 2011) was employed insome tests to increase the filter face velocity (originally �7 cm/s) to the same level with the other PEMS-PM systems andthe reference instrumentation (50 cm/s). A prototype system was employed in the first two phases of the follow-upinvestigations on post-DPF emission levels, which was replaced afterwards by a commercial version.
2 Accordingly, the ETaPS results will not be presented here. The interested reader can find this information in Bonnel et al. (2010) and Giechaskiel
et al. (2011).

A. Mamakos et al. / Journal of Aerosol Science 57 (2013) 54–7058
2.2.2. Reference instrumentation
2.2.2.1. Gravimetric PM sampling. PM samples were also taken from both the CVS tunnel and a reference PFDS (Silvis et al.,2002) fully compliant with the European legislation and the ISO 1683 (2002) standard.
The exhaust was transported to the CVS tunnel through a 9.5 m long stainless steel tubing, of which 3 m in the middlesection were not insulated to allow for the connection of the various sampling and measurement systems. The CVS tunnelincorporated highly efficient filters for particles and hydrocarbons (H13 of EN 1822) to minimize particle contributionsfrom the dilution air. The flowrate of the diluted exhaust was controlled by a critical flow venture. A flowrate of 80 m3/minat normal reference conditions (0 1C and 1013 mbar) was used for HDE#2, HDE#4 and HDE#5 and 100 m3/min for HDE#1and HDE#3. PM samples were collected in a temperature controlled (4775 1C) secondary dilution tunnel at a totalflowrate of 30 lpm, to match the filter face velocities of the PEMS-PM instrumentation (and particularly, OBS and mPSS).Secondary dilution air of 15 lpm was only employed in the tests of HDE#1 and HDE#2. A cyclone pre-classifier (URG-2000-30EP) installed upstream of the filter holder removed coarse mode particles with a 50% removal efficiency (d50) at 6 mm.
The reference PFDS (AVL SPC-472) operated at a total flowrate of 30 lpm (filter face velocity of 44 cm/s). An additionalHEPA and carbon capsule was installed to reduce the background number concentrations to levels below 10 #/cm3. A URG-2000-30EP cyclone was installed upstream of the 47 mm filter holder (d50 at 6 mm). The filter holder and the cyclone wereexternally heated to achieve a filter face temperature of 4775 1C.
The majority of tests were conducted on 47 mm Teflon-coated glass-fiber Pallflexs TX40H120-WW (TX40) butselected tests were also conducted using 2 um pore size 47 mm Teflon filters (R2PJ047 – Pall Corp.).
2.2.2.2. Non-volatile particle number emissions. Two non-volatile Particle Number measurement systems (UNECE, 2010)were also employed in the campaign, both of them sampling from the CVS tunnel. The first one employed in phase 1 of theproject was build in-house . It consisted of a Dekati ejector heated at 150 1C (through electrical blanket) operating onconditioned air at 150 1C, followed by an Evaporating Tube set at 330 1C and then a second ejector diluter operating atambient temperature (Giechaskiel et al., 2009). The number concentration in this dual ejector system was measured with aGrimm 5.404 Condensation Particle Counter (CPC)3 modified to exhibit a 50% detection efficiency at 23 nm.
The second PN measurement system, which was employed in the remaining three phases of the project, was aprototype Solid Particle Counter System (SPCS) by Horiba Ltd that was employed in the PMP_HD_ICLE as the reference PNinstrumentation (Andersson et al., 2010). The SPCS operated at an evaporating tube temperature of 350 1C and employed aTSI 3010D CPC (d50 at 23 nm) for number concentration measurements.
3. Results
3.1. Gravimetrically determined PM
3.1.1. Limit of detection
A number of studies have raised concerns regarding the sensitivity of the gravimetric procedure especially at post-DPFlevels (Andersson et al., 2010; Chase et al., 2004; Kirchner et al., 2010). It is therefore important to establish the Limit OfDetection (LOD) of the gravimetric PM measurements. The LOD expresses the lowest level that can be distinguished frombackground for a given statistical confidence, and at the generally accepted 1% confidence level, is defined as the averageplus three standard deviations of blank tests (McNaught & Wilkinson, 1997).
Fig. 1 summarizes the calculated brake-specific LOD determined from two series of blank tests (the corresponding filtermasses are summarized in Appendix B). Since brake-specific values depend on the engine work, a range of values is showncorresponding to the minimum (46 kW – maximum LOD) and maximum (74 kW – minimum LOD) power over the WHTCcycle from all engines tested. The sampling time in the first campaign was confined to the duration of the WHTC cycle(30 min) or half that value, while in the second campaign it was extended to the minimum duration of an ISC test(120 min). In this second set of experiments, a back-up filter was also employed.
In the case of the reference instrumentation, the LOD for 30 min tests with TX40 filters lied in the 0.4–2.2 mg/kWh forthe CVS and 1.6–3.8 mg/kWh for the SPC. The corresponding LOD for Teflon filters were 3.4–5.3 mg/kWh (CVS) and 0.6–1 mg/kWh (SPC), respectively. These figures lie at the lower range of background PM levels reported in the PMP_HD_ILCE(Andersson et al., 2010), with the filter mass collected being generally less than 15 mg (Table B1 in Appendix). The use of120 min sampling time was generally beneficial and reduced the LOD to 1–2 mg/kWh for both CVS and SPC, and for bothfilter media. The back-up filters suggested a minimal adsorption artifact for Teflon filters (less than 1 mg collected even for120 min sampling – Table B1). On the contrary, the mass collected on the back-up TX40 filters corresponded to 25% (CVS)to 45% (SPC) of the mass collected on the primary TX40 filters even after 120 min of sampling, suggesting a morepronounced adsorption artefact, in good agreement with previously published data (Andersson et al., 2010; Chase et al.,2004; Khalek, 2007).
3 It should be pointed that this particular CPC was not fully in-line with the European legislation requirements as it was not a full-flow CPC.

Fig. 1. Limits of Detection (LOD) of the gravimetric results (derived as the average blank result plus three standard deviations) expressed in WHTC-
equivalent mg/kWh, for TX40 (upper panel) and Teflon (lower panel) filters. Since brake-specific emissions depend on the engine power, a range of LOD is
presented corresponding to the maximum and minimum work of the different engines tested (23–36 kWh over the WHTC). In the second set of
experiments, a spacer was employed in the MOVE system (an asterisk designates the particular data).
A. Mamakos et al. / Journal of Aerosol Science 57 (2013) 54–70 59
The beneficial effect of employing longer sampling times (120 min) was even more evident in the PEMS-PM results.In the case of the mPSS, the LOD for TX40 filers decreased from 5.8 to 9 mg/kWh for 15 min sampling, to 3.5–7.9 mg/kWhfor 30 min sampling and 1.2–1.9 mg/kWh for the 120 min tests. When Teflon filters were employed, the LOD decreasedfrom 4.7 to 7.2 mg/kWh for 15 min sampling, to 1.7–2.6 mg/kWh for 30 min sampling and 0.7–1.1 mg/kWh for 120 mintests. Similarly, the LOD for the OBS system when using TX40 filters were found to be 4.4–6.8 mg/kWh, 1.7–3.9 mg/kWhand 2–3 .1 mg/kWh for 15, 30 and 120 min sampling, respectively. The corresponding figures for Teflon filters were5.2–8 mg/kWh, 1.5–22 mg/kWh and 0.6–1 mg/kWh, respectively.
With respect to the MOVE system, there are two particularities that need to be considered when interpreting thecalculated LOD. First, the MOVE system employs a sample flowrate of 5 lpm which is six times lower compared to all othersystems. Accordingly, the total PM background mass collected on the filter should be six times lower. Second, thecalculation of the brake-specific emissions from the collected filter mass directly depends on the employed fixed DilutionRatio (DR). Overall, a 2 mg mass loading in the MOVE system (which corresponds to the requested minimum precision ofthe balance in the European regulation – UNECE, 2011) would result in 0.9–1.3 mg/kWh brake specific emissions for a DRof 6:1 and 0.4–0.7 mg/kWh for a DR of 3:1, when the same filter loading in the CVS would correspond to a brake specificemission of 0.2–0.3 mg/kWh.
Accordingly, the LOD of the MOVE system for 15–30 min sampling and a DR of 6:1 ranged between 5 and 12 mg/kWhat a DR of 6:1, while a 3:1 dilution setting effectively reduced the LOD to half these figures (2.5–6 mg/kWh). At thesesampling times, no clear benefit of using Teflon filters or the spacer ring could be identified. When a 120 min sampling wasemployed, however, the LOD was reduced to levels similar to the other PEMS-PM candidate systems (2–3 mg/kWh forTX40 and 1.1–1.8 mg/kWh for Teflon at DR of 6:1, and half these figures at DR of 3:1). It should be stressed here that the120 min blank tests with both filter media were conducted using the spacer ring. The latter was introduced by themanufacturer after the tests of HDE#4, in order to increase the filter face velocity to levels similar to the other PEMS-PMinstrumentation (from 7 cm/s to 50 cm/s) and thus reduce the adsorption artefacts (Arndt et al., 2011; Chase et al., 2004;Mader & Pankow, 2001). In the engine tests however, the spacer ring was only installed when the more prone-to-adsorption artifacts TX40 filters were employed, following the manufacturer’s recommendations.
3.1.2. Performance at different diesel exhaust PM levels
Fig. 2 summarizes the gravimetric PM results determined with the PEMS-PM candidates and the reference systems (SPCand CVS) over the WHTC hot tests for all engine/aftertreatment configurations. Since all PFDS are designed to mimicexhaust sampling and conditioning in the CVS tunnel, the results obtained in the latter are employed as a reference.Accordingly, the percentage difference between the reference PFDS (SPC) and the CVS tunnel results, serve as a benchmarkagainst which the performance of the different PEMS-PM candidate systems can be assessed. To facilitate this assessment,Table 1 provides the average (7one standard deviation) differences between the PM results determined with the differentPFDS systems and those measured in the CVS tunnel, for each engine/aftertreatment configuration.
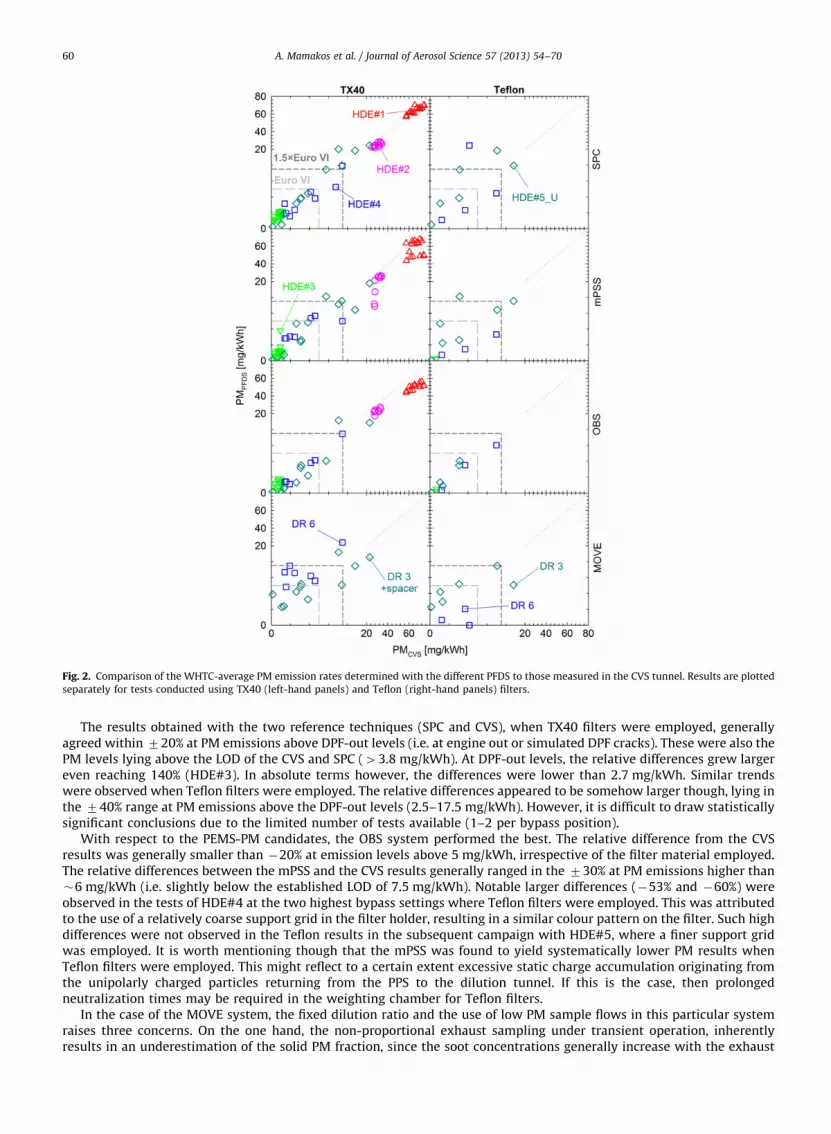
Fig. 2. Comparison of the WHTC-average PM emission rates determined with the different PFDS to those measured in the CVS tunnel. Results are plotted
separately for tests conducted using TX40 (left-hand panels) and Teflon (right-hand panels) filters.
A. Mamakos et al. / Journal of Aerosol Science 57 (2013) 54–7060
The results obtained with the two reference techniques (SPC and CVS), when TX40 filters were employed, generallyagreed within 720% at PM emissions above DPF-out levels (i.e. at engine out or simulated DPF cracks). These were also thePM levels lying above the LOD of the CVS and SPC (43.8 mg/kWh). At DPF-out levels, the relative differences grew largereven reaching 140% (HDE#3). In absolute terms however, the differences were lower than 2.7 mg/kWh. Similar trendswere observed when Teflon filters were employed. The relative differences appeared to be somehow larger though, lying inthe 740% range at PM emissions above the DPF-out levels (2.5–17.5 mg/kWh). However, it is difficult to draw statisticallysignificant conclusions due to the limited number of tests available (1–2 per bypass position).
With respect to the PEMS-PM candidates, the OBS system performed the best. The relative difference from the CVSresults was generally smaller than �20% at emission levels above 5 mg/kWh, irrespective of the filter material employed.The relative differences between the mPSS and the CVS results generally ranged in the 730% at PM emissions higher than�6 mg/kWh (i.e. slightly below the established LOD of 7.5 mg/kWh). Notable larger differences (�53% and �60%) wereobserved in the tests of HDE#4 at the two highest bypass settings where Teflon filters were employed. This was attributedto the use of a relatively coarse support grid in the filter holder, resulting in a similar colour pattern on the filter. Such highdifferences were not observed in the Teflon results in the subsequent campaign with HDE#5, where a finer support gridwas employed. It is worth mentioning though that the mPSS was found to yield systematically lower PM results whenTeflon filters were employed. This might reflect to a certain extent excessive static charge accumulation originating fromthe unipolarly charged particles returning from the PPS to the dilution tunnel. If this is the case, then prolongedneutralization times may be required in the weighting chamber for Teflon filters.
In the case of the MOVE system, the fixed dilution ratio and the use of low PM sample flows in this particular systemraises three concerns. On the one hand, the non-proportional exhaust sampling under transient operation, inherentlyresults in an underestimation of the solid PM fraction, since the soot concentrations generally increase with the exhaust

Table 1Percentage difference between the PM emissions over hot-start WHTC determined with the various PEMS-PM candidates and the reference PFDS and the
PM emissions measured in the CVS tunnel for all engines/aftertreatment configurations examined and the two filter media employed (TX40 and Teflon).
When more than one test repetitions are available, the standard deviation is also given in parenthesis. The columns labelled ‘‘#’’ provide the number of
valid tests out of the total repetitions performed. The range of PM emissions measured in the CVS tunnel is also given for reference (columns 2 and 3). The
percentage of the exhaust bypassing the DPF was estimated by means of comparing the PN emissions at a given bypass position and at engine-out levels.
WHTC hot PMCVS [mg/kWh] Aftertreatment SPC mPSS OBS GFB
Min Max # diff. # diff. # diff. # diff.
TX40
HDE#1 57.6 74.4 Open trap 16/16 �2%(74%) 16/16 �12%(714%) 14/16 �24%(74%) n.a. n.a.
HDE#2 25.3 34.4 SCR 12/12 �17%(76%) 9/12 �30%(712%) 8/12 �22%(76%) n.a. n.a.
HDE#3 0.5 2.4 DPF 21/21 138%(7110%) 20/21 61%(7111%) 15/21 47%(7118%) n.a. n.a.
HDE#4 2.8 3.1 DPF 2/2 76%(749%) 2/2 295%(782%) 2/2 �4%(73%) 2/2 93%(78%)
3.9 4.9 5% Bypassed 2/2 �11%(78%) 2/2 227%(758%) 1/2 �42% 2/2 40%(718%)
8.3 9.2 10% Bypassed 2/2 �2%(714%) 2/2 36%(714%) 2/2 �9%(71%) 2/2 27%(73%)
13.5 14.9 30% Bypassed 2/2 �8%(714%) 1/2 59% 1/2 0% 1/2 �33%
HDE#5_U 5.2 DPF 1/1 22% 1/1 79% 1/1 �50% 1/1 61%
7.7 5% Bypassed 1/1 16% 1/1 26% 1/1 �44% 1/1 �15%
11.5 20% Bypassed 1/1 29% 1/1 41% 1/1 �30% 0/1 n.a.
14.8 25% Bypassed 1/1 7% 1/1 2% 0/1 n.a. 1/1 �32%
22.9 40% Bypassed 1/1 6% 1/1 �15% 1/1 �23% 1/1 �25%
Teflon
HDE#4 0.2 DPF 1/1 127% 1/1 �100% 1/1 �100% 1/1 �100%
2.5 5% Bypassed 1/1 �11% 1/1 �41% 1/1 �71% 1/1 �47%
7.4 10% Bypassed 1/1 �37% 1/1 �60% 1/1 �5% 1/1 �45%
14 30% Bypassed 1/1 �36% 1/1 �53% 1/1 �14% 0/1 n.a.
HDE#5_U 0.3 2.1 DPF 2/2 13%(793%) 2/2 �46%(771%) 2/2 �41%(781%) 2/2 1520%(71987%)
2.6 5% Bypassed 1/1 39% 1/1 �43% 1/1 �56% 1/1 82%
6.1 6.3 20% Bypassed 2/2 23%(70%) 2/2 �19%(74%) 2/2 7%(76%) 2/2 62%(74%)
14.1 17.6 40% Bypassed 2/2 27%(723%) 2/2 �13%(720%) 1/2 30% 2/2 7%(733%)
A. Mamakos et al. / Journal of Aerosol Science 57 (2013) 54–70 61
flowrate (Ntziachristos et al., 2004a). In this particular implementation, the use of a MSS measuring the mass of soot in realtime, can compensate for this, allowing for a more accurate quantification of the elemental carbon content of PM(Mamakos et al., 2011a, 2011b). The real time traces of the MSS over the WHTC tests of HDE#4 and HDE#5, suggested thatthe underestimation of the soot fraction by the gravimetric filter box of the MOVE system, would lie in the 20–35 % range.One other concern pertains to the accuracy of the quantification of the volatile fraction of PM that strongly depends on thedilution conditions (i.e. dilution ratio and residence time), which vary in the reference CVS technique but are maintainedconstant in the MOVE system. It is rather difficult to estimate the magnitude (as well as the sign) of the associated error,but is should be a fraction of the organic content of the emitted PM. Finally, the six times lower sample flowrates can leadin significantly lower filter face velocities (7 cm/s compared to the 44–48 cm/s) that can enhance adsorption artefacts. Thereduction of the stain area through the use of the special spacer designed by AVL should compensate for this.
Overall though, the gravimetric PM results determined with the MOVE system at emission levels above the estimatedLOD (5–11 mg/kWh at a DR of 6:1 and 2.5–5.5 mg/kWh at DR of 3:1), agreed with those measured in the CVS within circa
730%. At lower PM levels, the MOVE results appeared to have reached a plateau which mainly depended on the dilutionratio and agreed quantitatively with the established LODs. At the minimum recommended dilution ratio of 6:1 the TX40results reached a plateau at 1272 mg/kWh (filter mass �30 mg). The three Teflon tests gave PM emissions consistentlybelow 4 mg/kWh (o10 mg loading) which lied within the LOD and differed from the CVS results by 45–90 %. In the tests ofHDE#5 a lower dilution setting of 3:1 was employed to assess the performance of this non-proportional PFDS system atextreme operating conditions with respect to volatile and gas-phase compound concentrations passing through the filter.In these particular tests, the stain-area of the TX40 filters was also reduced (from 1135 to 285 mm2) using the spacerring. At these settings, TX40 and Teflon filters yielded equivalent PM results over the WHTC, with the plateau lyingat 672 mg/kWh, which coincided with the established LOD of 2.5–5.5 mg/kWh at the dilution ratio of 3:1.
3.1.3. Performance over consecutive WHTCs
Fig. 3 shows the percentage change of the PM results when a single filter was employed over three consecutive WHTCtests of HDE#5_U at different DPF bypass levels. The use of a single TX40 filter over three consecutive WHTC tests resultedin systematically lower PM results for all systems, with the percentage change increasing with decreasing emission levels.The percentage change (3 WHTCs vs 1 WHTC) in the case of the two reference systems (CVS and SPC) dropped roughlyfrom �10% at the highest bypass level (�40% of the exhaust bypassing the DPF) to �50% at DPF-out levels. Similar trends

Fig. 3. Percentage change of the PM results when a single TX40 (left-hand panel) or Teflon (right-hand panel) filter was employed over three consecutive
WHTC tests of HDE#5_U at different DPF bypass levels. The exponential fit to the TX40 data for CVS and SPC only serves as an eye-guide.
A. Mamakos et al. / Journal of Aerosol Science 57 (2013) 54–7062
were generally observed in the PEMS-PM data with the OBS being a notable exception, showing less than 5% difference atthe two lowest PM levels.
When Teflon filters were employed, no clear trend could be identified down to �5 mg/kWh, with the difference lyingwithin 720%. Below that threshold, the differences grew larger, but lied within the uncertainty of the measurements(e.g. Table 1). It is also interesting to note that the mass collected on Teflon filters was systematically lower compared tothat measured with TX40. In that respect, the DPF-out PM levels determined with Teflon filters over a single WHTC rangedfrom 0.2 mg/kWh (mPSS and OBS) to 1.2 mg/kWh (CVS), when the corresponding TX40 results lied in the 5.2 mg/kWh(CVS) to 9 mg/kWh (mPSS) range. A notable exception was the MOVE system which appears to have reached a plateauat �6.2 mg/kWh at the DR of 3:1 (see Section 3.1.2).
3.1.4. Performance during passive DPF regeneration
Fig. 4 compares the PM emissions determined during 30 min operation of the HDE#5_C at ESC mode 12 where the DPFregenerated passively, to those over 5 consecutive WHTC cycles. Also shown for reference, are the corresponding soot massemission rates determined with the MSS.
The reference CVS and SPC systems suggested a large increase of the PM emissions over the ESC mode 12, reachinglevels as high as 8.5 mg/kWh (SPC). The corresponding emissions of this DPF equipped engine over five consecutive WHTCsaveraged at 1 mg/kWh and 0.1 mg/kWh for TX40 and Teflon filters, respectively. Back-up filters employed in some of theWHTC tests, collected similar amounts of mass with the primary filters, suggesting that the majority of PM originated fromgas adsorption. This would also explain the elevated emissions determined with TX40 filters which are more prone to suchadsorption artefacts (Chase et al., 2004).
Such information is not available for the ESC mode 12 tests. However, the photoacoustic sensor, detected an increase ofthe soot mass emissions from background levels (�0.2 mg/kWh – Mamakos et al., 2011a) over WHTC to 0.6 mg/kWh overESC 12. This increase reflects the reduction of the DPF filtration efficiency as the accumulated soot was oxidized (seeSection 3.2.1). In absolute terms, soot constituted less than 10% of the total emitted mass during passive regeneration.Similar large increases of volatile PM during regeneration, have been reported for both light duty (Bergmann et al., 2009;Campbell et al., 2006) and heavy duty vehicles (Khan et al., 2012; Swanson et al., 2009). These increased volatile PMemissions have been associated to formation of sulphates at the elevated exhaust temperatures (pre-DPF temperature of460 1C), through oxidation of sulphur dioxide (SO2) to sulphur trioxide (SO3) in the catalyst and the subsequent hydrationof the latter to sulphuric acid (H2SO4) during dilution. Interestingly, such high sulphate emissions were observed even ifultra low sulphur fuels were employed (o10 ppm in Bergmann et al., 2009, o15 ppm in Khan et al., 2012 and o2.5 ppmin Swanson et al., 2009). It needs to be emphasized here that the formation of sulphates is not directly related to passiveregeneration, but rather depends on the exhaust temperature, the catalyst/washcoat formulation and the availability ofSO2 (Giechaskiel et al., 2007 and references within there). The amount of sulphate formation is also reported to stronglydepend on the condition of the DPF (Swanson et al., 2009) and particularly the amount of sulphur previously stored on thecatalysts, highlighting the importance of vehicle preconditioning for ISC testing. Unfortunately, no information is availableon the chemistry of the PM samples collected in our campaign.
Interestingly, such large increases in the break-specific PM emissions over ESC mode 12 were not observed with thePEMS-PM candidate instrumentation. The OBS measured 2.4 mg/kWh over ESC mode 12 and 1.6 mg/kWh over the fiveconsecutive WHTCs, while the mPSS yielded 1.8 mg/kWh for both conditions, with the consecutive WHTC resultscomparing well with the established LOD for 120 min sampling on TX40. The MOVE also gave similar brake-specific PMemissions over the ESC mode 12 and the WHTC, but the absolute levels were higher (�5 mg/kWh). Similar, lowerresponses of PEMS-PM systems during passive DPF regeneration were reported by Khan et al. (2012). The volatile fractionof PM is known to strongly depend on the conditioning of the DPF (Khalek, 2007; MacDonald et al., 1980). Whileproportional PFDS were designed and set to mimic dilution in the CVS tunnel, the non-linear dependence of binary

Fig. 4. Comparison of the PM emissions (bars) and filter masses (numbers on top of bars) over five consecutive WHTC and 30 min operation at
regenerative ESC mode 12, for HDE#5_C. Bars in light colours indicate the PM emissions determined from back-up filters in selected tests. The two
rightmost bars indicate the corresponding soot mass emission rates determined with a MSS.
A. Mamakos et al. / Journal of Aerosol Science 57 (2013) 54–70 63
sulphuric acid/water nucleation on the dilution ratio, the diluent temperature and humidity (Seinfeld & Pandis, 2006)implies that small differences in the dilution conditions can have a strong effect on the amount of nucleated sulphates.At the same time the longer residence times in the SPC (2.5 s) and the CVS (0.5 s in the primary tunnel and 7 s inthe secondary tunnel) compared to the PEMS-PM candidates (0.5 s for mPSS and MOVE to 1.1 s for OBS) may havealso promoted nucleation and growth (Khalek, 2007), but also losses of sulphuric acid (Ball et al., 1999). More research isrequired in order to understand the reasons for the different performance of the various systems at such operatingconditions.
It is important to note that this volatile PM had an even more profound effect on the total amount of mass collected onthe filters. For example, the mass collected on the TX40 filters of the SPC during a 30 min operation at ESC mode 12 was�360 mg, which is equivalent to �36 mg/kWh over a single WHTC. For comparison, the total mass collected during the150 min duration of the five consecutive WHTC tests was 63 mg and 2 mg for TX40 and Teflon filters, respectively. Similarlyhigh amounts of filter mass during passive DPF regeneration were reported by Khan et al. (2012) for Teflon filters.
3.2. Real time instrumentation
3.2.1. Sensitivity
Fig. 5 compares the cycle-average emissions determined with the real time aerosol sensor of the three candidatePEMS-PM systems to the regulated non-volatile particle number emission rates, for all WHTC hot tests conducted.All sensors appeared to be sensitive enough to identify emission levels at least down to the Euro VI Particle Number (PN)limit of 6�1011 #/kWh. Thus all sensors have the potential to even identify exceedance of the PN limit.
The MSS appears to reach a plateau at approximately 0.4 mg/kWh (corresponding to approximately 5�1011 #/kWh)for all diesel engines equipped with a catalyzed DPF and/or oxidation catalyst. In the tests with the uncatalyzed DPF, thelowest detectable level dropped by almost one order of magnitude (0.05 mg/kWh). At the very low soot concentrationsdownstream of a properly functioning wall-flow DPF, the main contributors to the photoacoustic signal of the MSS aregaseous compounds. The gases exhibiting the highest interference in the MSS are nitrogen dioxide (NO2) and nitrous oxide(N2O), with a reported cross-sensitivity of 1.7�10�5 mg/m3/ppmNO2 and 4.3�10-5 mg/m3/ppmN2O, respectively(Schindler et al., 2004). In the presence of a catalyst, the predominately emitted nitrogen monoxide (NO) can oxidize toproduce high enough concentrations of NO2 and nitrous oxide N2O to interfere with the MSS signal, especially over theelevated exhaust temperatures over the motorway segment of WHTC (combined concentrations of up to 600 ppm).A comparison of the real time traces of the MSS and the non-NO nitrogen oxides suggested an even higher cross-sensitivityto these compounds of approximately 2�10�4 mg/m3/ppm (Fig. S1 in Supplementary material). Given that theconcentration of nitrogen oxides should be available from gas-PEMS instrumentation, it might be even possible toback-correct for this interference. Yet, in absolute terms the interference is too low to be of concern for ISC purposes. Itshould also be mentioned that when the prototype system was returned to AVL for inspection it was found that the laserwavelength lied outside its specifications (805 nm instead of 808–809 nm) and this effectively tripled its cross sensitivityto NO2. AVL has currently tightened the control/adjustment of the wavelength to keep this interference as low as possiblein all new units.
The EAD in its original configuration was found to be sensitive enough to detect emission levels even below 1010 #/kWh(�105 mm/kWh). One of the concerns with the EAD pertains to the fact that its signal is approximately proportional to theparticle diameter (Jung & Kittelson, 2005) and not to the mass, which scales with the diameter raised to the power of thefractal dimension, reported to lie in the 2.2–2.9 range for diesel exhaust aerosol (Olfert et al., 2007 and references within

Fig. 5. Comparison of the cycle average responses of the different PEMS-PM real time sensors to the non-volatile particle number emissions over all hot
start WHTC tests.
A. Mamakos et al. / Journal of Aerosol Science 57 (2013) 54–7064
there). Accordingly, the presence of volatile nucleation mode particles can result in a disproportional increase of the EADsignal, compared to the actual nucleation mode mass. In order to reduce this type of interference, the manufacturerinitially modified the EAD to operate at an elevated ion trap voltage4 (300 V instead of the original 20 V) that wouldeffectively remove also some of the nanoparticles. However, this measure was not proven sufficient since some volatilenucleation mode interference was observed in some WHTC tests of HDE#5_C. To further reduce the sensitivity of the EADin the nucleation-mode region, the manufacturer introduced a stack of 15 diffusion screens (TSI 376060) at the inlet of theinstrument. This particle selector resulted in a nominal removal of 99% at 25 nm (d1), 90% at 45 nm (d10) and 50% at130 nm, as also verified experimentally (Appendix D in the supplementary material). This modification, applied in thetesting of HDE#5_C, also reduced the overall sensitivity of the EAD by approximately one order of magnitude (for the sizedistribution of HDE#5_C exhaust aerosol), but the instrument remained sensitive enough to identify emission levels as lowas 1010 #/kWh.
The two last prototype versions of the PPS evaluated (PPS#2 and PPS#3), were found to be sensitive enough to detectemission levels down to 1011 #/kWh (corresponding PPS levels of 2�109 fA cm3/kWh). The results from the first prototypetested were not considered in the present analysis as it was found to experience a large drift of the electrometer zerolevels. The performance of PPS#2 was found to gradually deteriorate over time (see Section 3.2.2) due to a corrosion of thecorona wire which eventually led to its complete rupture. This issue was resolved in the last version tested (PPS#3), by theuse of a protective coating onto the corona wire and by ensuring a continuous flow of dilution air across the corona wire.In order to reduce the sensitivity of the sensor to nucleation mode particles, the manufacturer suggested operating theinstrument at increased ion trap voltage. Accordingly, PPS#2 was tested at 200 V and 400 V when the original setting(optimized to remove only ions) was 50 V. It was not possible to quantify the effect of the different ion trap voltagesthough, due to the excessive degradation of the corona charger at the point these investigations took place (see Section3.2.2). Some calibration experiments conducted with PPS#2 using a new, properly working corona wire and externallysupplied dilution air (at the nominal 1.5 bar overpressure), suggested a 50% particle penetration at �40 nm (d50) at 400 Vsetting (Mamakos et al., 2011b). The corresponding cut-off size (d50) at 200 V setting was �25 nm. The charger efficiencycalibration experiments yielded very unstable results (Mamakos et al., 2011b), and this was later found to be related to thecalibration setup.5 While the experimental data does not allow for an exact, accurate determination of the charging
4 This ion trap voltage serves to remove the excess ions in the charger section that would otherwise also contribute to the measured signal.5 The PPS response is very sensitive to pressure differences between the inlet and the outlet (even at levels as low as a few mbars) since the system is
designed to return the sampled aerosol back in the sample line (i.e. the tailpipe or the mPSS in the PEMS-PM configuration). However this was not
possible in the calibration setup where the sampling line was always at under-pressure .

A. Mamakos et al. / Journal of Aerosol Science 57 (2013) 54–70 65
efficiency, it did suggest a performance similar to other unipolar chargers with the number of charges per particle scalingwith the diameter raised to the power of �1.4 (Jung & Kittelson, 2005; Ntziachristos et al., 2004b). It was later clarified bythe manufacturer though, that the PPS operated at reduced flowrates in the mPSS which effectively increased the aerosolresidence time and accordingly increased the associated cut-off sizes. Accordingly, the instrument evaluated at the lastcampaign (PPS#3) operated at the recommended by the manufacturer setting of 250 V which should be equivalent to the400 V calibration results owing to the reduced operating flowrates (d50 440 nm).
3.2.2. Correlation with non-volatile particle number
The real time sensors employed in the three PEMS-PM candidate systems generally monitor a different property of theairborne particles. However, according to the MAW approach, the total PM mass collected during an ISC test will serve asan absolute standard against which the real time responses of the different PEMS-PM sensors will be scaled. Yet, theabsolute emission levels determined with the real time sensors provides important complementary information. It canhelp verify the proper performance of the sensor but can also shed some more light on the nature of the particle emissionsidentifying for example excess volatile PM emissions during passive DPF regeneration.
It is difficult, if not impossible, to establish correlation factors between the real time sensor signal and thegravimetrically determined mass, since the latter is also subject to adsorption artefacts especially at post-DPF levels.Instead, the non-volatile particle number emissions, which will also be regulated at a Euro VI stage, could serve as analternative absolute reference. These correlations will in general depend on the size distribution of the exhaust aerosolwhich may differ from engine to engine or even between different operating modes of the same engine. As such, theestablished correlation factors may be subject to uncertainties that need to be taken into consideration.
The soot mass emissions determined with the MSS suggested a correlation of 1.8(70.3)�1018 particles per kg of soot,at emission levels down to 0.4 mgsoot/kWh (or equivalently 7�1011 #/kWh). This figure compares very well to reportedcorrelations between thermo-gravimetrically determined elemental carbon and non-volatile particle numbers for dieselvehicles (1.8�1018 #/kgsoot) (Kirchner et al., 2010). Of course, the soot mass concentrations measured with MSS (whichwere found to correlate very well with elemental carbon – Mamakos et al., 2011a, 2011b) are also per se a usefulinformation allowing for a direct quantification of the volatile fraction of the total collected PM mass on the filter.
The results of the EAD in its original configuration (trap voltage of 20 V with no diffusion screens), suggested acorrelation factor of 80(720) nm per particle for the tests of the first three engines (HDE#1–3). Intuitively, this figure canbe considered as the length-weighted mobility diameter of the aerosol, provided that the limited formation of volatilenucleation mode particles (that could not be detected by the PN system) took place. In the subsequent tests with HDE#4and HDE#5_U, the correlation factor dropped to 58(75) nm. This reduced figure originated from a deterioration of theEAD charging efficiency, as verified in dedicated calibration experiments (Mamakos et al., 2011a, 2011b). The replacementEAD was modified to operate at an elevated trap voltage of 300 V and incorporate 15 diffusion screens. These modificationseffectively dropped the correlation factor to 7(72) nm per particle.
The results obtained with PPS#3 at levels above its zero levels (�1011 #kWh) suggested a correlation factor of0.015(70.003) fA per 1 #/cm3. The cross-comparison of the PPS#2 results with the non-volatile particle number emissionsyielded a gradually decreasing correlation factor during the measurement campaign, from approximately 0.01 fA per 1 #/cm3
in the first official test, down to 0.002 fA per 1 #/cm3. As discussed in the previous section, this deterioration of thesensitivity was due to a corrosion of the corona wire.
3.2.3. Performance during passive DPF regeneration
Fig. 6 compares the real time responses of the three PEMS-PM sensors to the non-volatile particle number emissiontraces measured in accordance to the European legislation, for two ESC mode 12 tests of HDE#5_C where the DPFregenerated passively. The non-volatile particle number emissions in both tests were found to increase sharply after 300–600 s. This increase was accompanied with a sharp drop of the DPF backpressure, indicating a consumption of theaccumulated soot and an associated reduction of the DPF filtration efficiency (Fig. S5 in Supplementary material). Theemissions reached a peak level, which coincided with a minimum in the pressure drop, after which the graduallydecreased, suggesting that some soot accumulation took place.
The MSS traces generally followed the same pattern with the non-volatile particle numbers, further verifying that theseelevated emissions were due to less efficient removal of soot. The initial MSS levels of 0.05 mg/s (0.016 mg/m3) wererather high and should be associated with the elevated conversion of NO to NO2 and N2O at these conditions. Indeed, theamount of oxidized NO was measured to be 80 ppm, which for a cross-sensitivity of 2�10�4 mg/m3/ppm (Section 3.2.2)translates to 0.016 mg/m3, or equivalently 0.05 mg/s.
In the ESC mode 12 test corresponding to the upper panel of Fig. 6, the EAD was not equipped with the diffusionscreens, but only operated at an elevated trap voltage of 300 V. The EAD response stood out showing very large emissionsin the beginning of the test, which for a 80(720) nm/# correlation factor (Section 3.2.2) translates to a peak numberemission of 5.6(71.1)�1013 #/s. The corresponding non-volatile particle number emission rates over this time periodwere less than 1011 #/s, suggesting that the high EAD responses originated from a large volatile nucleation modeinterference. The use of the diffusion screens appeared to be very effective in removing such nucleation mode particles,and no such interference could be observed in the ESC mode 12 tests conducted at this configuration (e.g. lower panelof Fig. 6).

Fig. 6. Comparison of the real time responses of the PEMS-PM sensors to the non-volatile particle number emissions during two ESC mode 12 tests of
HDE#5_C, where the DPF regenerated passively.
A. Mamakos et al. / Journal of Aerosol Science 57 (2013) 54–7066
The PPS#2 sensor, running on properly working corona wire and at 400 V ion trap voltage, followed the responses ofthe non-volatile particle number and MSS, in all ESC mode 12 tests conducted. Its results also verified the correlation factorof 0.015(70.003) fA cm3 established in Section 3.2.2, the application of which in the results shown in the top panel ofFig. 6 translated to a peak number emission rate of 6.6(71.6)�1011 #/s (when the non-volatile number emission rateswere measured to be 6.6�1011 #/s). The lower sensitivity of the PPS#2 on nucleation mode compared to the EADoperating at 300 V, could hardly be attributed to the different slope of the charging efficiency, considering the almost threeorders of magnitude increase in the response of the EAD. This should rather point towards a small nucleation modeparticle size, lying below the cut-off size of the PPS, or could even be reflecting a lower nucleation mode formation and/orvolatile particle growth rate in the mPSS/PPS configuration. For example, the sampling point of the PPS is quite close to theinlet of the mPSS dilution tunnel (�2/5 of the dilution tunnel length), which in any case exhibits the shortest residencetime of diluted exhaust (only 0.5 s) from all dilution systems examined. It is therefore very likely that the sample extractedby the PPS is conditioned much differently from the OBS (where dilution occurs at the tailpipe and the diluted sample istransferred through a heated line in the filter box and the EAD). Furthermore, the PPS units installed in the mPSS weremodified to incorporate an internal heater that maintained temperature at 40 1C, thus further reducing the nucleationmode potential (Seinfeld & Pandis, 2006). The PPS#3 sensor, which replaced PPS#2 before the main measurementcampaign with HDE#5_C, was consistently detecting volatile nucleation mode particles. This distinctly different behaviourof PPS#3 (evident in the example case shown in the lower panel of Fig. 6) could reflect the formation of larger nucleatedvolatile particles, i.e. due to the different exhaust or dilution conditions (e.g. the dilution ratio was lower for this largerengine). The manufacturer has also suggested a potential grounding problem in the ion-trap stage of the sensor whichcould have effectively resulted in a reduced actual trap voltage and accordingly inefficient removal of nanosized particles.
3.3. Application of the MAW methodology
The tests of HDE#5_C and HDE#5_U over consecutive WHTC cycles provided the means to assess the MAWmethodology over sampling periods expected during ISC tests. Table 2 summarizes the results of the MAW methodologybased on the average engine work over one WHTC test (as described in Appendix A). Also shown in Table 2 are the PM andthe non-volatile particle number emissions over the WHTC, for the different levels of exhaust flow by-passing examined.For the calculations, a conformity factor of 1.5 (applicable to all gaseous emissions) has been employed, even if the exactvalue has not been decided yet.
The first thing to note is that for all by-pass levels that resulted in regulated PM emissions lying below the threshold of15 mg/kWh (corresponding to the product of the emission limit (10 mg/kWh) times a conformity factor of 1.5), the MAWprocedure verified the proper emission performance of the engine with all PEMS-PM instrumentation. The onlyconfiguration that resulted in an ISC failure corresponded to a 40% exhaust flow bypassing the DPF. The associated PMemissions measured in the CVS over a single WHTC repetition were determined to be 23 mg/kWh when TX40 filters wereemployed and 16 mg/kWh when using Teflon.
The MOVE system correctly indentified excessive emissions over all four repetitions irrespective if Teflon or TX40 filterswere employed. Due to some communication problems, only two test results (both with Teflon filters) are available withthe OBS system, in both of which the OBS correctly indentified excessive PM emissions. The mPSS identified the engine as

Table 2Results of the MAW procedure for the tests of HDE#5 at the different bypass settings examined, where a single filter was employed over three
consecutive hot start WHTC cycles. Calculations were performed using the Euro VI limit and a Conformity Factor (CF) of 1.5. The PM emissions measured
in the CVS tunnel over a single WHTC-hot cycle are also given for reference.
Engine Bypass level 1�WHTC Rep. CF¼1.5
PNCVS (#/kWh) PMCVS (mg/kWh) mPSS OBS MOVE
TX40
HDE#5_U (3�WHTC)
0% 2.3 (70.5)�1010 5.2 #1 – – Pass
#2 – – Pass
5% 2.7 (70.3)�1012 7.7 #1 Pass – Pass
#2 Pass Pass Pass
20% 1.1 (70.03)�1013 11.5 #1 Pass – Pass
#2 Pass Pass Pass
25% 1.3 (70.04)�1013 14.8 #1 Pass – Pass
#2 Pass Pass Pass
40% 2.6 (70.1)�1013 22.9 #1 Fail – Fail#2 Fail – Fail
Teflon
0% 2.3 (70.5)�1010 1.2 (70.9) #1 – Pass Pass
#2 Pass – Pass
5% 2.7 (70.3)�1012 2.6 #1 Pass Pass Pass
#2 Pass – Pass
20% 1.1 (70.03)�1013 6.2 (70.1) #1 Pass Pass Pass
#2 Pass Pass Pass
40% 2.6 (70.1)�1013 15.9 (71.7) #1 Pass Fail Fail#2 Pass Fail Fail
HDE#5_C (5�WHTC) TX40
0% 6 (79)�109 – #1 – Pass Pass
#2 Pass Pass Pass
1% 3(70.01)�1011 – #1 Pass Pass Pass
#2 Pass – Pass
#3 Pass Pass Pass
Teflon
0% 6(79)�109 – #1 Pass Pass Pass
#2 Pass Pass Pass
1% 3(70.01)�1011 – #1 Pass Pass Pass
A. Mamakos et al. / Journal of Aerosol Science 57 (2013) 54–70 67
high-emitter only when TX40 filters were employed. This however, does not imply a degraded performance of the mPSSsystem considering the close proximity of the PM emissions determined with Teflon filters following the legislatedprocedure to the 15 mg/kWh threshold (lying within the estimated uncertainty of 730%).
4. Conclusions
The performance of three PEMS-PM candidate systems, designed around the main requirements laid down in theEuropean PEMS-PM program, was assessed against reference instrumentation in dedicated engine dynamometer testing.The gravimetric PM procedure was found to exhibit a rather limited sensitivity, with the reference CVS and PFDStechniques exhibiting a Limit of Detection (LOD) of as high as 2 and 4 mg/kWh, respectively, over the WHTC. The PEMS-PMsystems exhibited a similar (3 mg/kWh for OBS) or even higher limit of detection (8 mg/kWh for mPSS and 9 mg/kWh forMOVE in its original configuration). These levels are quite high, considering that the Euro VI limit is set at 10 mg/kWh.However, at the prolonged sampling times envisaged during ISC testing (at least 120 min) the LOD is effectively reducedto 1–3 mg/kWh for all systems.
Similarly high PM background levels have been reported in other studies (Andersson et al., 2010), and wereassociated to impurities in the dilution air and/or contamination of the dilution system with exhaust deposits.This highlights the importance of establishing the background PM levels of any candidate PEMS-PM system beforethe ISC testing, using the dilution air source that will be employed in the actual tests. Still, the discrimination betweenbackground and exhaust PM from blank tests, is a rather challenging task, considering for example the differentconditions prevailing between blank and engine tests (i.e. dilution tunnel temperatures that directly affect desorptionand adsorption of deposited material). Accordingly, the accurate quantification of PM emissions is rather restricted toPM levels above the LOD.
All PEMS-PM systems were capable of quantifying PM emissions at and above the Euro VI limit of 10 mg/kWh over theWHTC cycle with an accuracy similar to that of the reference instrumentation (730%). One of the systems (AVL MOVE)employed a constant dilution ratio and a much lower PM sample flowrate (5 lpm compared to 30 lpm of the othercandidates), an approach that raises concerns with respect to the accurate quantification of both the solid and volatile
A. Mamakos et al. / Journal of Aerosol Science 57 (2013) 54–7068
fraction of PM. The net effect on the PM results obtained with the MOVE system over the single WHTC tests, appeared to bea rather limited sensitivity manifested in an apparent plateau in the 6–12 mg/kWh range (depending on the dilutionsetting). The system though appeared to exhibit similar performance with the reference instrumentation at levels abovethis threshold (730% agreement with the CVS results), at least for the two engines for which the gravimetric filter box wasavailable (HDE#4 and HDE#5).
Passive DPF regeneration resulted in large inconsistencies even in the brake-specific PM results obtained with the tworeference systems (�70%). Perhaps more importantly, DPF regeneration resulted in large release of volatile (presumablysulphate) material which in terms of collected filter mass could exceed the levels over five consecutive WHTCs by oneorder of magnitude. Such high PM levels, which were also reported in other studies (Khan et al., 2012), may actually lead toproperly working DPF systems to fail an ISC test.
The strength of the PEMS-PM instrumentation lies on the real time sensors, all of which were found to be sensitiveenough to even identify exceedance of the much stricter Euro VI particle number limit of 6�1011 #/kWh. Yet, the sensorsin their original configuration, exhibited a different sensitivity to homogeneously nucleated volatile particles, theconcentration of which is also known to strongly depend on the sampling and dilution conditions that are not wellcontrolled even in the reference CVS technique. The MSS cannot detect such particles as it is only sensitive to soot, whilethe PPS and EAD signals are proportional to the diameter raised to the power of �1.4 and �1, respectively, when the massof volatile particles should scale up to their volume. It was accordingly requested that the manufacturers took all possiblemeasures to minimize the sensitivity of the sensors to nucleation mode particles. The approach envisaged by bothmanufacturers was particle removal in the lower size spectrum in an electric field (PPS) or in diffusion screens (EAD).Dedicated tests at DPF regeneration, where enhanced formation of volatile nanoparticles took place, have currently onlyverified the efficient removal of nucleation mode particles for the modified EAD sensor at the recommended settings.Subsequent calibration experiments indicated that there exists a lot of room for optimization, with both systems.In particular, the insufficient PPS trap voltage of 250 V can increase up to 1000 V, while the 15 diffusion screens employedat the inlet of the EAD are introducing significant particle losses in the accumulation regime.
From an ISC perspective, the results obtained over consecutive WHTC cycles, suggested that the MAW methodology at aconformity factor of 1.5, is capable of identifying high emitting engines even at a Euro VI level of 10 mg/kWh, with allPEMS-PM candidate systems. The main concern, relates to the assessment of the emission performance of DPF equippedvehicles. On the one hand, the limited sensitivity of the gravimetric procedure implies that only large failures of the DPFcan be detected. At engine-out levels of 50–100 mg/kWh, a 15 mg/kWh threshold effectively translates to a 15–30 % of theexhaust bypassing the DPF. At the same time, sulphate particle release at elevated exhaust temperatures (i.e. duringpassive DPF regeneration) can lead to excessive filter loadings (depending on the status of the aftertreatment devices) thatmay even result in a properly working DPF system to fail during the ISC test. In both cases, the real time sensors cansignificantly enhance the discrimination capabilities of the PEMS-PM instrumentation, provided that they will not besensitive to volatile nucleation mode particle formation.
Acknowledgements
The authors would like to gratefully acknowledge H. Demircioglu, S. Alessandrini, F. Forni, F. Montigny and D. Lesueurfor their invaluable assistance in performing the experiments. The authors would also like to express their gratefulness toL. Hill (Horiba), K. Lenz (Horiba), U. Dierks (Horiba), J. Tikkanen (Pegasor), J. Landkammer (Pegasor), C. Bassoli (ControlSistem), D. Testa (Control Sistem), K. Obergugenberger (AVL) and W. Schindler (AVL) for their co-operation and theprovision of the equipment used during this program. The authors would also like to thank INEOS Oligomers for supplyingthe Poly-Alpha Olefin employed in the calibration experiments. A. Mamakos would like to gratefully acknowledge A. Melasfor his invaluable assistance in the calibration of the EAD.
Appendix A. Supporting information
Supplementary data associated with this article can be found in the online version at http://dx.doi.org/10.1016/j.jaerosci.2012.10.004.
References
Andersson, J., Mamakos, A., Giechaskiel, B., Carriero, M. & Martini, G. (2010) Particle measurement programme (PMP) heavy-duty inter-laboratorycorrelation exercise (ILCE_HD). Final Report. JRC Scientific and Technical Report EUR 24561 EN.
Arndt, M., Schindler, W. & Silvis, W. (2011). Gas adsorption effects in particulate filters. In: 15th ETH Conference on Combustion Generated Particles,Zurich, June 26th–29th , 2011.
Bachman, L.J., Erb, A. & Bynum, C.L. (2005). Effect of single wide tires and trailer aerodynamics on fuel economy and NOx emissions of Class 8 line-haultractor-trailers. SAE Technical Paper 2005-01-3551 .
Ball, S.,.M., Hanson, D.,.R., Eisele, F.,.L., & McMurry, P.,.H. (1999). Laboratory studies of particle nucleation: initial results for H2SO4, H2O, and NH3 vapors.Journal of Geophysical Research, 104, 23709–23718.
Bell, G.A. (1880). On the production and reproduction of sound by light: the photophone. American Journal of Science, 20, 305–324.

A. Mamakos et al. / Journal of Aerosol Science 57 (2013) 54–70 69
Bergmann, M., Kirchner, U., Vogt, R., & Benter, T. (2009). On-road and laboratory investigation of low-level PM emissions of a modern diesel particulatefilter equipped diesel passenger car. Atmospheric Environment, 43, 1908–1916.
Bonnel, P., Carriero, M., Forni, F., Alessandrini, S., Montigny, F., Demircioglu, H., & Giechaskiel, B. (2010). EU-PEMS PM evaluation program – first report.JRC Scientific and Technical Reports. EUR 24543 EN.
Bonnel, P., Kubelt, J., & Provenza, A. (2011). Heavy-Duty engines conformity testing based on pems – lessons learned from the European pilot program.JRC Scientific and Technical Report EUR 24921 EN.
Booker, D.R., Giannelli, R.A., & Hu, J. (2007). Road test of an on-board particulate matter mass measurement system. SAE Technical Paper 2007-01-1116 .Boucher, T.L., Khalek, I.A., Laroo, C.A., & Bishnu, D.K. (2012). Determination of the PEMS measurement allowance for PM emissions regulated under the
heavy-duty diesel engine in-use testing program. SAE International Journal of Engines, 5, 1371–1386.Campbell, B., Peckham, M., Symonds, J., Parkinson, J., & Finch, A. (2006). Transient gaseous and particulate emissions measurements on a diesel passenger
car including a dpf regeneration event. SAE Technical Paper 2006-01-1079 .Chase R.,.E., Duszkiewicz, G.,.J., Richert, J.,.F., Lewis, D., Maricq, M.,.M. & Xu, N. (2004). PM measurement artefact: organic vapour deposition on different
filter media. SAE Technical Papers 2004-01-0967 .Dilara, P., Franco, V., Kousoulidou, M., Ntziachristos, L., Geivanidis, S. , & Samaras, Z. (2010). Validation of the COPERT road emission inventory model with
real-use data. In: 19th International Emission Inventory Conference. Emission Inventories – Informing Emerging Issues. San Antonio, TX. September27–30 2010.
Directive 2004/26/EC. (2004). Directive 2004/26/EC of the European Parliament and of them Council of 21 April 2004 Amending Directive 97/68/EC onthe Approximation of the Laws of the Member States Relating to Measures Against the Emission of Gaseous and Particulate Pollutants from InternalCombustion Engines to be Installed in Non-Road Mobile Machinery. Available for download at: /http://ec.europa.eu/enterprise/sectors/mechanical/documents/legislation/emissions-non-road/index_en.htmS.
Duran, A., de Lucas, A., Carmona, M., Ramos, M.J., & Armas, O. (2002). Accuracy of the European standard method to measure the amount of dpm emittedto the atmosphere. Fuel, 81, 2053–2060.
Durbin, T.D., Johnson, K., Cocker, D.R., Miller, J.W., Maldonado, H., Shah, A., Ensfield, C., Weaver, C., Akard, M., Harvey, N., Symon, J., Lanni, T., Bachalo, W.D.,Payne, G., Smallwood, G., & Linke, M. (2007). Evaluation and comparison of portable emissions measurement systems and federal reference methods foremissions from a back-up generator and a diesel truck operated on a Chassis dynamometer. Environmental Science and Technology, 41, 6199–6204.
Durbin, T.D., Jung, H., Johnson, K., & Cocker, D.R. (2009). PM PEM’s pre-measurement allowance – on-road evaluation and investigation. Final Reportpresented for the Measurement Allowance steering Committee, January 2009.
EC (2007). Regulation (EC) No 715/2007 of the European Parliament and of the Council of 20 June 2007 on Type Approval of Motor Vehicles with Respectto Emissions from Light Passenger and Commercial Vehicles (Euro 5 and Euro 6) and on Access to Vehicle Repair and Maintenance Information.Available at: /http://ec.europa.eu/enterprise/sectors/automotive/documents/directives/motor-vehicles/index_en.htmS.
EC (2008). Commission Regulation (EC) No 692/2008 of 18 July 2008 Implementing and Amending Regulation (EC) No 715/2007 of the EuropeanParliament and of the Council on Type-Approval of Motor Vehicles with Respect to Emissions from Light Passenger and Commercial Vehicles (Euro 5and Euro 6) and on Access to Vehicle Repair and Maintenance Information. Available at: /http://ec.europa.eu/enterprise/sectors/automotive/documents/directives/motor-vehicles/index_en.htmS.
EC (2009). Regulation (EC) No 595/2009 of the European Parliament and of the Council of 18 June 2009 on Type-Approval of Motor Vehicles and Engineswith Respect to Emissions from Heavy Duty Vehicles (Euro VI) and on Access to Vehicle Repair and Maintenance Information and AmendingRegulation (EC) No 715/2007 and Directive 2007/46/EC and Repealing Directives 80/1269/EEC, 2005/55/EC and 2005/78/EC. Available at: /http://ec.europa.eu/enterprise/sectors/automotive/documents/directives/motor-vehicles/index_en.htmS.
EEA (2010). European Union emission inventory report 1990–2008 under the UNECE convention on long-range transboundary air pollution (LRTAP).Environmental Protection Agency Technical report No 7/2010. Copenhagen, Denmark. Available for download at: /http://www.eea.europa.eu/publications/european-union-emission-inventory-reportS.
Federal Register. (2003). Proposed settlement agreement. Federal Register 68:113, June 12, 2013, pp 35211-35212 .Federal Register (2005). Control of emissions of air pollution from new motor vehicles: in-use testing for heavy-duty diesel engines and vehicles. Federal
Register, June 14, 2005, vol. 70, No. 113.Gautam, M., Stedman, D., Carder, D., Shade, B., Clark, N., Thompson, G., Wayne, S., Bishop, G., Schuchmann, B., Pope, D., Vescio, N., Full, G., McClintock, P., &
Rau, D. (2010). Correlation of the real-time particulate matter emissions measurements of a ESP remote sensing device (RSD) and a Dekati ElectronicTailpipe Sensor (ETaPS) with gravimetrically measured pm from a total exhaust dilution tunnel system. ICAT Grant No. 06-02: Final Report. Availablefor download at: /http://www.arb.ca.gov/research/apr/past/icat06-02.pdfS.
Giechaskiel, B., Carriero, M., Bonnel, P., Schindler, W., Scheder, D., Bassoli, C., & Niemela, V. (2011). Feasibility of particulate mass and numbermeasurement with portable emission measurement systems (PEMS) for in-use testing. SAE Technical Paper 2011-24-0199 .
Giechaskiel, B., Carriero, M., Martini, G., Krasenbrink, A., & Scheder, D. (2009). Calibration and validation of various commerical particle numbermeasurement systems. SAE Technical Paper 2009-01-1115 .
Giechaskiel, B., Ntziachristos, L., Samaras, Z., Casati, R., Scheer, V., & Vogt, R. (2007). Effect of speed and speed-transition on the formation of nucleationmode particles from a light duty diesel vehicle. SAE Technical Paper 2007-01-1110 .
ISO 16183 (2002). Heavy duty engines – measurement of gaseous emissions from raw exhaust gas and of particulate emissions using partial flow dilutionsystems under transient test conditions. ISO/TC 22/SC 5/WG 2 N 195E, 2002-02-07 .
Jetter, J., Maeshiro, S., Hatcho, S., & Klebba, R. (2000). Development of an on-board analyzer for use on advanced low emission vehicles. SAE TechnicalPaper 2000-01-1140 .
Jung, H., & Kittelson, D.,.B. (2005). Characterization of aerosol surface instruments in transition regime. Aerosol Science and Technology, 39, 902–911.Kaufman, S.L., Medved, A., Pocher, A., Hill, N., Caldow, R., & Quant, F.R. (2002). An electrical aerosol detector based on the corona-jet charger. In: 21st
AAAR Conference, October 7–11 , 2002, Paper No. P12-07, Charlotte, NC.Khalek, I.,.A. (2007). 2007 Diesel particulate measurement research. Final Report of Project E-66-Phase 2. March 2006. Available at download at: /http://
www.crcao.org/reports/recentstudies2006/E-66-Phase%202-Final%20Report-IAK-R5.pdfS.Khalek, I.A., Ulman, T.L., Shimpi, S.A., Jackson, C.C., Dharmawardhana, B., Silvis, W.M. , Kreft, N., Harvey, R.N. , Munday, D., Yamagishi, Y., Graze, R.,
Smitherman, J., & Adkins, J.. (2002). Performance of partial flow sampling systems relative to full flow CVS for determination of particulate emissionsunder steady-state and transient diesel engine operation. SAE Technical Paper 2002-01-1718 .
Khan, M.,.Y., Johnson, K.,.C., Durbin, T.,.D., Jung, H., Cocker, D.,.R., III, Bishnu, D., & Giannelli, R. (2012). Characterization of PEMS-PM forin-use measurements conducted during validation testing for the PM-PEMS measurement allowance programme. Atmospheric Environment, 55,311–318.
Kirchner, U., Vogt, R., & Maricq, M. (2010). Investigation of Euro-5/6 level particle number emissions of european diesel light duty vehicles. SAE TechnicalPaper 2010-01-0789 .
Kittelson, D.B. (1998). Engines and nanoparticles: a review. Journal of Aerosol Science, 29, 575–588.MacDonald, J.S., Plee, S.L., D’Arcy, J.B., & Schreck, R.M. (1980). Experimental measurements of the independent effects of dilution ratio and filter
temperature on diesel exhaust particulate samples. SAE Technical Paper 800185.Mader, B.T., & Pankow, J.F. (2001). Gas/solid partitioning of semivolatile organic compounds (SOCs) to air filters. 3. An analysis of gas adsorption artefacts
in measurements of atmospheric SOCs and organic carbon (OC) when using teflon membrane filters and quartz fiber filters. Environmental Science andTechnology, 35, 3422–3432.
Mamakos, A., Carriero, M., Bonnel, P., Demircioglu, H., Douglas, K., Alessandrini, S., Forni., F., Montigny, F., & Lesueur, D. (2011a). EU-PEMS PM evaluationprogram – second report – study on post DPF PM/PN emissions. JRC Scientific and Technical Report EUR 24793 EN.

A. Mamakos et al. / Journal of Aerosol Science 57 (2013) 54–7070
Mamakos, A., Carriero, M., Bonnel, P., Demircioglu, H., Douglas, K., Alessandrini, S., Forni., F., Montigny, F., & Lesueur, D. (2011b). EU-PEMS PM evaluationprogram – third report – further study on post DPF PM/PN emissions. JRC Scientific and Technical Report EUR 24883 EN.
McNaught, A.D., & Wilkinson, A. (1997). Compendium of Chemical Terminology 2nd edition). Blackwell Science Inc: 978-0865426849.Ntziachristos, L., Giechaskiel, B., Pistikopoulos, P., Samaras, Z., Mathis, U., Mohr, M., Ristimaki, J., Keskinen, J., Mikkanen, P., Casati, R., Scheer, V., & Vogt, R.
(2004a). Performance evaluation of a novel sampling and measurement system for exhaust particle characterization. SAE Technical Paper 2004-01-1439 .Ntziachristos, L., Giechaskiel, B., Ristimaki, J., & Keskinen, J. (2004b). Use of a corona charger for the characterisation of automotive exhaust aerosol.
Journal of Aerosol Science, 35, 943–963.Ntziachristos, L., & Tikkanen, J. (2009). Pegasor particle sensor (PPS) potential solution for on-board diagnosis of particle filter operation – first results and
development potential. In: American Filtration & Separations Society 2009 Topical Conference, Emission Solutions in Transportation; October 5–8 ,2009, Ann Arbor, MI.
Olfert, J.,.S., Symonds, J.,.P.,.R., & Collings, N. (2007). The effective density and fractal dimension of particles emitted from a light-duty diesel vehicle with adiesel oxidation catalyst. Journal of Aerosol Science, 2007, 69–82.
Reichel, S., Pischinger, F.,.F., & Lepperhoff, G. (1983). Influence of particles in diluted diesel engine exhaust gas. SAE Technical Paper 831333.Rubino, L., Bonnel, P., Hummel, R., Krasenbrink, A., & De Santi, G. (2007). PEMS light duty vehicles application: experience in downtown Milan. SAE
Technical Paper 2007-24-0113 .Schindler, W., Haisch, C., Beck, H.A., Niessner, R., Jacob, E., & Rothe, D. (2004). A photoacoustic sensor system for time resolved quantification of diesel soot
emissions. SAE Technical Paper 2004, 2004-01-0968 .Seinfeld, J., & Pandis, S. (2006). Atmospheric Chemistry and Physics: From Air Pollution to Climate Change 2nd edition). Willey-Interscience: New York 579.Silvis, W.M., Marek, G., Kreft, N., & Schindler, W. (2002). Diesel particulate measurement with partial flow sampling systems: a new probe and tunnel
design that correlates with full flow tunnels. SAE Technical Paper 2002-01-0054 .Swanson, J., Kittelson, D., Watts, W., Gladis, D., & Twigg, M. (2009). Influence of storage and release on particle emissions from new and used CRTs.
Atmospheric Environment, 43, 3998–4004.UNECE (2010). Regulation 83: agreement concerning the adoption of uniform technical prescriptions for wheeled vehicles, equipment and parts which
can be fitted and/or be used on wheeled vehicles and the conditions for reciprocal recognition of approvals granted on the basis of theseprescriptions. Available at: /http://www.unece.org/trans/main/wp29/wp29regs81-100.htmlS.
UNECE (2011). Regulation 49: agreement concerning the adoption of uniform technical prescriptions for wheeled vehicles, equipment and parts whichcan be fitted and/or be used on wheeled vehicles and the conditions for reciprocal recognition of approvals granted on the basis of theseprescriptions. Addendum 48: Regulation No. 49, Revision 5. Available at /http://www.unece.org/trans/main/wp29/wp29regs41-60.htmlS9.
USEPA (2000). National air pollutant emission trends, 1900–1998 . United States Environmental Protection Agency report EPA 454/R-00-002. Availablefor download at /http://www.epa.gov/ttn/chief/trends/trends98/index.htmlS.
USEPA (2008). Determination of PEMS measurement allowances for gaseous emissions regulated under the heavy-duty diesel engine in-use testingprogramme. Revised Final Report. February 2008. Available at: /www.epa.gov/otaq/regs/hd-hwy/inuse/420r08005.pdfS.
Vojtisek Lom, M. & Allsop, J.E. (2001). Development of heavy-duty diesel portable on-board mass exhaust emissions monitoring system with NOx, CO2,and qualitative PM capabilities. SAE Technical Paper 2001-01-3641 .
Vouitsis, E., Ntziachristos, L., & Samaras, Z. (2003). Particulate matter mass measurements for low emitting diesel powered vehicles what’s next?. Progressin Energy and Combustion Science, 29, 635–636.
Wei, Q., Akard, M., Porter, S., & Nakamura, H. (2009). The effect of drive cycles on pm emission characteristics from a gasoline vehicle. SAE Technical Paper2009-01-1119 .
Weiss, M., Bonnel, P., Hummel, R., Provenza, A., & Manfredi, U. (2011). On-road emissions of light-duty vehicles in Europe. Environmental Science andTechnology, 41, 8575–8581.


