Embed Size (px)
Citation preview
ASSESSMENT OF REEF AND LAGOON ASSOCIATED FINFISH IN
SAMOA (PROCFISH SITES)
Maria F. Sapatu
Inshore Fisheries Officer
Samoa Fisheries Division
Einar Hjorleifsson
Iceland Marine Research Institute
The main objective of the study is to assess the coastal finfish fishery in Samoa.
This was done by estimating the stock size within the four selected sampled sites.
The sites were divided into four habitats (strata) including the coastal reef, lagoon
patches, back reef and outer reef. Variability of finfish biomass density was
obtained among habitats and sites. ANOVA was used to test such differences
which resulted in habitats within the sites as significantly different while among
the sites was the same. The trend among the habitats was biomass density,
abundance, size range increases with increase distance from the shore. With
known catches from the socio-economic data, the status of exploitation of the
stock was evaluated. Sites with large fishing area have a higher biomass, catches,
and low fishing pressure, which was vice versa for the small fishing area sites.
Therefore considering the population size, the fishing pressure has an inverse
relationship with accessible fishing area.
Maria Sapatu
UNU Fisheries Training Programme Page 2
TABLE OF CONTENTS
1. INTRODUCTION ............................................................................................................. 4
1.1 OBJECTIVE OF THE STUDY ................................................................................................. 4
2. SAMOA ................................................................................................................................. 5
2.1 COASTAL FISHERIES .......................................................................................................... 6
2.1.1 Management Measures .............................................................................................. 6
2.1.2 Ongoing Data collection ............................................................................................ 7
3. ASSESSMENT METHODS ............................................................................................. 8
3.1 UNDERWATER VISUAL CENSUS (UVC) ............................................................................. 8
3.2 CREEL CENSUS AND SOCIO-ECONOMIC .............................................................................. 9
4. METHODOLOGY ............................................................................................................... 9
4.1 SITE CHARACTERISTICS ..................................................................................................... 9
4.2 DATA COLLECTION .......................................................................................................... 11
4.2.1 Finfish Fisher Survey ............................................................................................... 11
4.2.2 Finfish Survey .......................................................................................................... 11
4.3 DATA ANALYSIS .............................................................................................................. 12
4.3.1 Finfish fisher survey ................................................................................................. 12
4.3.2 Finfish Survey .......................................................................................................... 12
4.3.3 Statistical test ........................................................................................................... 14
4.3.4 Combined Analysis ................................................................................................... 14
5. RESULT ........................................................................................................................... 15
5.1 RELATIVE ABUNDANCE AND BIOMASS ............................................................................. 15
5.2 MAJOR FAMILIES OF BIOMASS DENSITY .......................................................................... 16
5.3 TOTAL BIOMASS AND CATCHES ....................................................................................... 16
6. DISCUSSION .................................................................................................................. 17
7. CONCLUSION ............................................................................................................... 19
8. ACKNOWLEDGEMENT .............................................................................................. 20
9. REFERENCE .................................................................................................................. 20
10. APPENDICES ............................................................................................................. 24
10.1 LIST OF TABLES ............................................................................................................. 24 TABLE 1: KNOWN MARINE BIODIVERSITY OF SAMOA (WILKINSON, 2008) ........................................................... 24 TABLE 2: INSHORE FISHERY LANDINGS FROM MARKET OUTLETS IN FISCAL YEAR 98/99-07/08 (FISHERIES DIVISION)
...................................................................................................................................................................... 24 TABLE 3: DESCRIPTION OF EACH SITE BY FOUR SURVEYED HABITATS ................................................................... 24 TABLE 4:NUMBER OF FINFISH FAMILIES, GENERA, SPECIES RECORDED FROM D-UVC SURVEYS OF EACH SITE. ... 25 TABLE 5: MEAN ABUNDANCE AND BIOMASS DENSITY ESTIMATES (PER 500M
2), STANDARD DEVIATION AND
COEFFICIENT OF VARIANCE (CV) FOR EACH HABITAT AMONG THE FOUR STUDY SITES. ................................. 25 TABLE 6: ANOVA TEST OF BIOMASS IN HABITATS WITHIN EACH SITE (NUMBERING IN DIFFERENCES APPLIES TO
SIGNIFICANCE BETWEEN HABITATS E.G. 1-4 BETWEEN COASTAL REEF AND OUTER REEF) ............................. 25 TABLE 7: ANOVA TEST OF BIOMASS IN HABITATS BETWEEN SITES ....................................................................... 26 TABLE 8: DENSITY BIOMASS (BY TRANSECT) OF HABITATS BY SITES WHICH ARE RAISED TO TOTAL BIOMASS AND
THEIR TOTAL CATCHES .................................................................................................................................. 26 TABLE 9: CATCHES BY BIOMASS BY FISH FAMILIES IN MANONO UTA ................................................................... 26 TABLE 10: CATCHES BY BIOMASS BY FISH FAMILIES IN SALELAVALU ................................................................... 27
Maria Sapatu
UNU Fisheries Training Programme Page 3
TABLE 11: CATCHES BY BIOMASS BY FISH FAMILIES IN VAILOA ........................................................................... 27 TABLE 12: CATCHES BY BIOMASS BY FISH FAMILIES IN VAISALA .......................................................................... 27 TABLE 13: THE ALPHA AND BETA COEFFICIENTS OF FISH SPECIES FOR IN LENGTH WEIGHT CONVERSION............... 28
10.2 LIST OF FIGURES ................................................................................................................ 40
Figure 1: Inshore Fishery Landings from the markets outlets from 1986-94(Fisheries
Division)...............................................................................................................40
Figure 2: The four survey sites in Samoa where the balloon s indicate the locations of
transects (BALLOONS: green=outer reef, yellow=back reef, blue=lagoon,
purple=coastal reef ........................................................................................................... 41 Figure 3: Density (weight (kg)/transect) of Finfish within each habitat of the four sites ........ 42 Figure 4: Density (NO/transect) of finfish within each habitat by site .................................... 42 Figure 5: Length distribution (cm) in Outer reefs of the four sites .......................................... 43 Figure 6: Length distribution (cm) in back reefs of the four sites ........................................... 43 Figure 7: Lengths distribution (cm) in the lagoon habitats of Manono and Salelavalu .......... 44 Figure 8: Length distribution (cm) in coastal reefs of the four sites ....................................... 44 Figure 9: Fish Family density in outer reefs among sites. ....................................................... 45 Figure 10: Fish family density in back reefs among sites ........................................................ 46 Figure 11: Fish family density in lagoons among sites ........................................................... 47 Figure 12: Fish family density in coastal reefs among sites .................................................... 48 Figure 13: Annual Yield of catches and estimated biomass of the four surveyed sites
(Red=Vaisala, Green=Salelavalu, Black=Vailoa, Blue=Manono uta). .......................... 49 Figure 14: Proxy of fishing pressure on the estimated biomass of the surveyed sites
(Red=Vaisala, Green=Salelavalu, Black=Vailoa, Blue=Manono uta). .......................... 49 Figure 15: Fish density comparison between the left and right diver. .................................... 50
1. INTRODUCTION Reef fisheries, coastal fisheries, inshore fisheries or small-scale artisanal fishery are all
various terms used in describing fishing of reef and lagoon associated finfish. All these
terms do fit and have been commonly used in fisheries reports. However, they fail to clearly
Maria Sapatu
UNU Fisheries Training Programme Page 4
describe the defined area of fishing which is from the coastline to the outer reefs. It is of
relative importance because such fishing includes various gears, species and unique habitats.
Samoan coastal communities largely depend on inshore resources for their livelihood and
fisheries contribute a large proportion of the animal protein diet consumed in the country. In
2000, the nation wide household fisheries census recorded the average seafood consumption
per capita to be 57 kg per annum consisting of 44 kg fish, 13 kg invertebrates and seaweed
(Mulipola, 2001) which is very high compared to the regional average of 35kg/person/year
(Vunisea, et al., 2008).
However, proximity and easy access to coastal reosurces also results in challenges such as
overfishing, destructive fishing and other anthropogenic impacts as evidenced by increased
number of fishing households from 6,700 in 1999 to 8,377 in 2000 (Mulipola, 2001). Three
quarters of the villagers on the main island Upolu are engaged in fishing with an average of
four fishing trips per week (Zann, 1992). At a regional level, Samoa belongs to a group of
Polynesian islands which are considered to have a higher fishing effort than that of the
Melanesian islands (Dalzell et al., 1996). Indeed, the question is, will Samoa be able to
sustain its vital fisheries?
Various actions have been implemented by the Government through the Fisheries Division to
sustain these important fisheries. These interventions include providing assistance in
formulating village level regulations and management plans, establishing marine protected
areas and implementing restocking projects. However these management guidelines are
generally based on qualitative analysis with limited availability of robust scientific data. This
gave rise to this study which looks into the scientific data collected as part of the Pacific
Regional Oceanic and Coastal Fisheries Development Programme (PROCFish) carried out in
Samoa in 2005. PROCFish was the first comprehensive multi-country comparative
assessment of reef fisheries in the Pacific Islands and it aimed to provide the Pacific Island
countries and territories with basic information necessary to identify and alleviate critical
problems in the management of reef fisheries (Secretariat of the Pacific Community, 2007)
1.1 Objective of the Study
The main objective of the study is to assess coastal finfish fishery in Samoa. This will be
done by estimating the stock size within the selected sampled sites. The sites will be divided
into four habitats (strata) types, which are the coastal reef, lagoon patches, back reef and outer
reef (Vunisea et al., 2008). Comparisons will be carried out between these sites and strata in
terms of density and abundance. Furthermore, the study will identify any variability of finfish
density by species and families within each stratum and their proportion in the overall area of
each site. With known catches from the socio-economic data, the status of exploitation of the
stock will be evaluated. Hence, the study will result in a recent status of the finfish fishery
which will help fill in this information gap that hinders the effective management of this
fishery. In addition it is expected to foresee any improvements on the data collection with
results obtained from analysis. Lastly to build the confidence, skills and knowledge for one of
the fisheries staff to carry out such work.
2. SAMOA
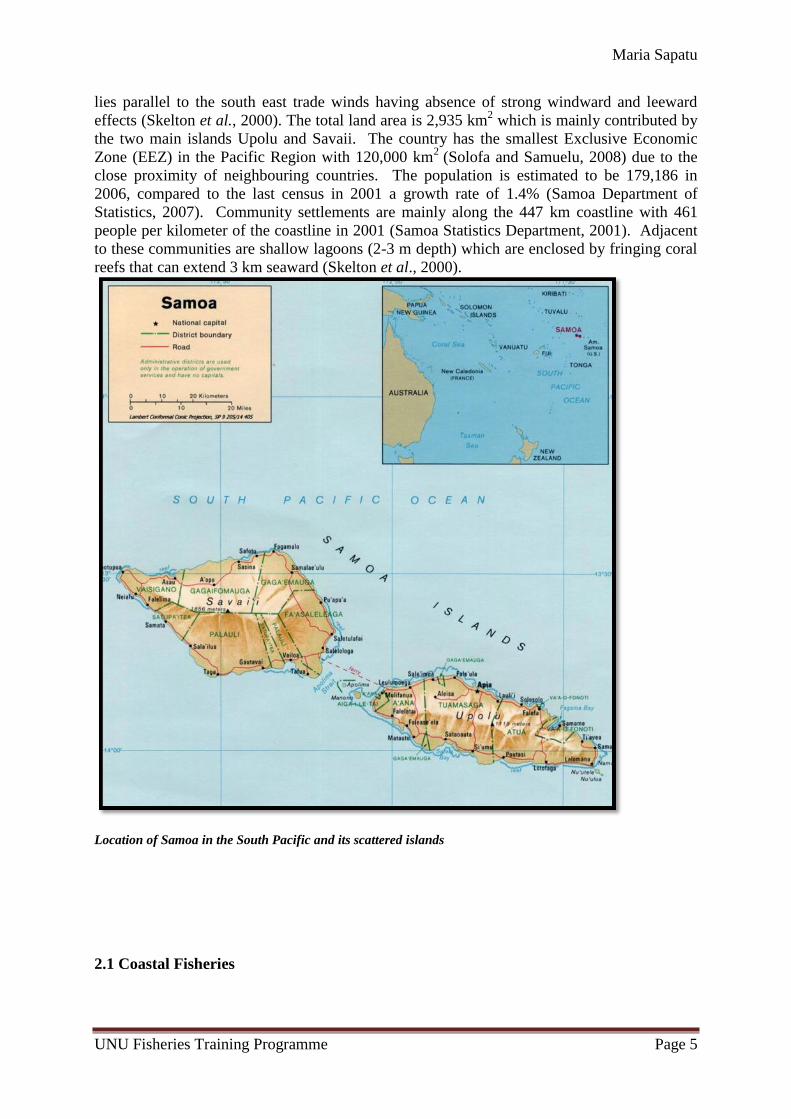
Located between the 13º25’-14
º05’ latitudes south and 171
º23’-172
º48’ longitudes west are the
mountainous, volcanic origin islands of Samoa (Skelton et al., 2000). The chain of islands
Maria Sapatu
UNU Fisheries Training Programme Page 5
lies parallel to the south east trade winds having absence of strong windward and leeward
effects (Skelton et al., 2000). The total land area is 2,935 km2 which is mainly contributed by
the two main islands Upolu and Savaii. The country has the smallest Exclusive Economic
Zone (EEZ) in the Pacific Region with 120,000 km2
(Solofa and Samuelu, 2008) due to the
close proximity of neighbouring countries. The population is estimated to be 179,186 in
2006, compared to the last census in 2001 a growth rate of 1.4% (Samoa Department of
Statistics, 2007). Community settlements are mainly along the 447 km coastline with 461
people per kilometer of the coastline in 2001 (Samoa Statistics Department, 2001). Adjacent
to these communities are shallow lagoons (2-3 m depth) which are enclosed by fringing coral
reefs that can extend 3 km seaward (Skelton et al., 2000).
Location of Samoa in the South Pacific and its scattered islands
2.1 Coastal Fisheries
Maria Sapatu
UNU Fisheries Training Programme Page 6
There have been various studies on Samoa’s biodiversity however they are either incomplete,
or in a foreign language, or mostly covering the neighbouring country American Samoa
(Skeleton et al., 2000). According to Wass (1984), 890 fish species are considered shallow-
water (depths less than 60 m); 56 are considered deeper demersal fishes (depths of 60-500 m);
and 45 are considered pelagic (depths less than 200 m). Recent studies on marine algae have
added 89 new records (Skeleton and South, 1999). The Fisheries Division has been collecting
and updating such collection from various research (Table 1).
Samoans harvest, consume and market a wide range of marine species from finfish, bivalves,
invertebrates; crustaceans to seaweed (Fisheries Division, 2005). They are harvested with
simple and non-mechanised tools like canoes, spears, casting nets and by gleaning
(collecting). Each method reflects the targeted species. For instance, spear diving is the most
commonly used method to target finfish often within the lagoons (Eriksson, 2006). Second in
rank is gleaning where collecting sedentary invertebrates on the reef flats is mainly carried out
by women (Passfield et al., 2002). Overall, different species of finfish are targeted and finfish
is dominantly sold in the market outlets. For instance, in 2005 the inshore market landed 115
mt valuing at $469,711 USD with finfish contributing 63% while processed food (cooked or
already gutted products), seaweed and bivalves contributed about 30% (Fisheries Division,
2005).
Both natural and human induced environmental disturbances have contributed to problems
with inshore fisheries. A series of tropical cyclones have struck Samoa in 1990 (Ofa), 1991
(Valerie) and 2004 (Heta) but cyclone Ofa was disastrous which reported cyclone banks along
the northern coast of Upolu measuring up to 2-3meters high (Rearic,1990). Recovery of
habitats has been shown in the increased coral coverage in permanent fish reserve from 2004
to 2007 (Wilkinson, 2008). Furthermore, an outbreak of crown-of-thorns starfish,
Acanthaster planci, was experienced from 1978 to 1983 (Zann and Sua, 1991). As well as
invasive species like Codium arenicola and Codium prostratum seaweeds which have
replaced the local animals and plants along the Apia wharf (Skelton and Robin, 2007).
However, continuous human activities it will slow ecosystem recovery. The unplanned
developments along coastlines have resulted in overfishing, pollution, and eutrophication of
reefs (Zann, 1994). Also a number of destructive fishing methods have been recorded such as
dynamite fishing and coral breaking destroying individual coral stands or coral reefs (Solofa
and Samuelu, 2008). In addition, with increased population evidence of overfishing has in
some instances become apparent like the decline of giant clams to a point of local extinction
(Horsman and Mulipola,1995) and over-harvesting of sea cucumbers when the export market
was open (Eriksson, 2006). An overall record of inshore market annual landings were
declining from 250 mt (1986) to about 50 mt (1993) (Figure 1) but recent landings have been
stable in a range of 97 – 146 mt (Table 2). According to Samoilys and Carlos (1991) in less
fished deep slopes there was a higher biomass while the heavily fished and shallow (lagoon)
areas was low. Similarly lagoons were also noted by Zann (1992) as the main fishing area
from anecdotal data.
2.1.1 Management Measures
Village Fono Act (1990) was an act to validate and empower the exercise of authority by
villages in accordance with the custom and usage of their villages and to confirm or grant
certain powers. One of these powers was allocating the management of the adjacent coastal
waters to the villages and traditional regulations. The Government removed itself from a
Maria Sapatu
UNU Fisheries Training Programme Page 7
centralised management of coastal fisheries to act a supporting role to the villages. These
roles were observed in various management programs implemented for the coastal waters.
Community-Based Fisheries Management Programme was initiated under the Fisheries
Extension Training Project (1995-2001) with the assistance of AUSAID (King and Faasili,
1998). The aim was to help the villages set up their management plans by identifying key
problems, possible solutions through regulations and provide continuous biological
assessments (King and Faasili, 1998). The Fisheries Act (1988) and Fisheries regulation
(1996) governs marine resource, conservation and monitoring, prohibit certain fishing,
authorize scientific research and provide regulations to regulate and manage any fishery
(Skelton et al., 2000).
Traditional management only applies to villagers within a particular community but is not
recognised publicly. Village bylaws under the Fisheries Act allow legal recognition of village
by laws to solve consequences of neighbouring villages illegally fishing (Mulipola, 2002). At
present, 57 villages (Mulipola et al., 2004) are under this program and the Fisheries Division
aims to include more and maintain the activeness of existing stakeholders. Promotion of
ownership and awareness is the overall objective targeted by the programme.
With such awareness in local communities most have become interested in development and
protection of their coastal waters. Development projects such as coral restoration, mangrove
replanting and introduction of species for restocking purposes. Conservation initiatives
include fish reserves which are included in the above mentioned management plans. As well
as district level marine protected areas (MPA) with collaboration with other NGOs and
government departments which are bided by National Parks and Reserves Act (1974). As
illustrated in Safata and Aleipata MPA districts under the Marine Biodiversity Protection and
Management Project carried out by World Conservation Union (IUCN) and the Ministry of
Natural Resources and Environment in 2002 (Solofa and Samuelu, 2008). This conservation
measures are also incorporated in the National Parks and Reserves Act (1974) and The Lands,
Surveys and Environment Act (1989) (Mulipola, 2002).
2.1.2 Ongoing Data collection
The Fisheries Division is mandated to monitor the status of the fish reserves as well as the
resources exploited (Mulipola, 2002). Annual UVC assessments are carried out for fish
reserve for both existing and newly established ones. Samoa is also part of the Global Coral
Reef Monitoring Network (South-West Pacific Node) since 2001 with 10 permanent sites
which are assessed along side with the fish reserves. Furthermore training of community
members in assessing their own coastal waters was conducted in a two-year project funded by
the Project Development Fund (Solofa and Samuelu, 2008). This was to assist with the time
constraints, budget and shortage of staff faced by Fisheries Division since it may not possible
to conduct annual assessments of all Fish Reserves.
As for the exploited resources, regular (3 x week) surveys are conducted randomly in three
main market outlets (Apia Fish market, Salelologa Market and Fugalei Agricultural Market)
and along roadside (Fisheries, 2007) for marine inshore products. These surveys record
abundance, weight, length of species ranging from fishes, invertebrates, crustaceans, bivalves
and crustaceans. Additional information on the method used, habitat and village are also
noted from interviewing sellers, proprietors and vendors (Fisheries, 2005). “Faaoso” which
refers to fish packed as gifts for overseas relatives is considered as export for inshore
Maria Sapatu
UNU Fisheries Training Programme Page 8
fisheries. Fisheries Division issues permits for such export and through this inspection
progress the abundance and weight are also recorded.
3. ASSESSMENT METHODS
Various methods of assessing fish stocks such as production models, yield per recruit models
and cohort analysis have been established and implemented. No method has been prescribed
that is appropriate for the situation in most tropical countries like Samoa since the models are
dependent on age based data. This is mainly due to the fact that in the tropics annual marks
on scales and otoliths are usually difficult to distinguish (Munro and Fakahau, 1986).
The alternative is the length converted catch curve which gives a reasonable estimate of the
total mortality on the fish stock (Pauly, 1984). However, there is a shortage of research based
information and a tendency to obtain social and economical information based on household
surveys and underwater visual census.
3.1 Underwater Visual Census (UVC)
Results from household and creel census however do not give any real insight into the
potential productivity of a fishery let alone the status of particular fish stocks (Munro and
Fakahau, 1986). UVC method is the use of divers´ visual senses to record fish and it provides
estimates of relative abundance, biomass and length frequency distributions (Samoilys and
Carlos, 2000). It has been widely used and recognised since 1970s due to its rapid
assessment, low cost and non-destructive to underwater habitats (Connel et al., 1998).
However, fisheries scientists are not so willing to use such method because of lack of general
agreement on a standardised method (Samoilys and Carlos, 2000). This is mainly due to the
fact that reef and lagoon associated fishes are multispecies, patchy distribution, different
behaviours and in diverse habitats.
According to Watson and Quinn (1997) UVC transects (line observation of fish) have
negative bias when fish was moving away and positive moving towards the observer while no
such bias was experienced in the point count (radius observation of fish). Indeed, the natural
movement of the fish is of decisive importance to the amount of bias in the fish density
estimations. Fish behave differently, some are cryptic, roving or sedentary (Samoilys and
Carlos, 2000). This can seen in comparison of two herbivores fish where surgeon fish are
nomadic while damsel fish tends remain stationary to algae gardens (Mcginley et al., 2008).
Fish also react differently to light can be either diurnal or nocturnal and crepuscular (Hobson,
1965). Diurnal fish have a direct response to light level where slow rate descent of fishes
towards reefs at dusk is in response to slow decrease of light (Jennings et al., 1998).
When applying UVC, these limitations should be considered in order to limit ways of under
or over estimating fish counts. Past surveys have tackled this by surveying and analysing at a
species level and grouping species into the above mentioned movements (Stobutzki, 1997).
Others have looked at a limit number of fish species to survey. Furthermore, UVC is more
applicable to survey fish species that are abundant, non cryptic and not highly mobile
(Samoliys and Carlos, 1997).
However, in order to get overview of all fish within the reefs and lagoons it will be a tedious
task to survey and analyse by species level. Most of these overall surveys were analysed at
Maria Sapatu
UNU Fisheries Training Programme Page 9
fish family level (Samoilys and Carlos, 1991). A question rises whether the grouping in
families would be appropriate since within families grouping tend to mask the importance of
individual species. Stobutzki (1997) notes from his finding that clear differences in
swimming ability among species may vary their detectability within both the Chaetodontidae
and Pomacentridae but the extent of the variation is family dependent.
Speed of observer census may bias visual estimates as well either by efficiency of observer or
its presence. It is favourable to obtain the optimal speed and standardise it, however in most
cases, the speed is dependable on cost of the assessment (Watson and Quinn, 1997).
Samoilys and Carlos (1997) recommend the slow 50 x 5m transect in contrast to bigger area
transects because it showed high abundance in most species recorded moreover the
assumption was the higher estimates the greater the accuracy. This of course requires a large
number of replicates in order to lower variance and limit the area surveyed to have sufficient
search or detection of fish (Labrosse et al., 2002). There is likelihood of overestimation with
smaller areas but generally UVC underestimate fish abundance (Samoilys and Carols, 1997).
To lower the level of such bias, divers should be trained to gain experience as well as
investigating any significant difference in estimates between buddy divers (Graham et al.,
2004). In addition, divers or observers need continuous re-training in these estimations in
order to sustain their standard visual census.
3.2 Creel census and Socio-economic
In small scale fishing, landing sites are dispersed along the coast with other characteristics
than mixed multispecies fishing. This is one of the problems in successfully maintaining an
application of an established statistical system to monitor this fishery (Munro, and Fakahau.
1988). Creel census and questionnaires set out for fishermen to estimate catches are often a
method used in this situation, particularly Samoa. The catches can then be used to estimate
finfish removed from the estimated standing stock. Moreover, it determines the exploitation
rate of the estimated unbiased biomass from the UVC survey. However, the relation of creel
and questionnaire surveys was noted by Connell and collegues (1998) as closely related than
that of UVC.
Perhaps a reasonable approach is the one set out by Kulbicki (1998) to survey fishing where a
longline survey was carried out in the SW lagoon of New Caledonia and the visual census
showed a high correlated catch per unit effort in numbers and weights. Its considered
reasonable since it minimises bias that arise from questionnaires which were dependent on
fisher‘s behaviour as well as having standardised sites, time and exploited species for both
visual counts and catches (Connell et al.,1998). This can be illustrated where UVC was
usually carried out at day time while creel and questionnaires varies from day to night fishing.
Both UVC and socioeconomic data are considered and accepted to give an estimate but may
not be the absolute value (Connell et al., 1998).
4. METHODOLOGY
4.1 Site Characteristics Selection of the sites and number was relative to the aims and objectives of the PROCfish
survey as well as interests shown by the Samoa’s Fisheries Division (Figure 2). The
characteristics considered was diverse habitats, appropriate size, accessibility and a
Maria Sapatu
UNU Fisheries Training Programme Page 10
comparable number to same surveys that was carried out in other Pacific Island countries
(Vunisea et al., 2009). Furthermore, the sites should be representative of Samoa which
resulted in four sites Manono Uta, Salelavalu, Vailoa and Vaisala (Vunisea et al., 2009)(Table
3).
At the west end of Upolu island is Manono Uta and four kilometres east is Manono (Tai)
island of only 3 km2 land area situated within the shallow lagoon that was formed by the
barrier reefs of Upolu (Samoa Department of Statistics, 2007). These two Manono Uta and
Tai are of the same clan having common access to fishing area from the island to the west
coast of Upolu which was the surveyed area covering the coastal reefs, lagoon, back reef and
outer reef. Consumption of fresh finfish within this site was estimated to be 79
kg/person/year which were mainly sourced from lagoon and outer reefs (Vunisea et al., 2008).
The lagoon has a sandy silt bottom where suspension of the sand would cause poor visibility
(Mulipola et al., 2004). In addition it had a few patches of algae assemblages, sea grasses and
live corals. In contrast, excellent visibility was observed in the back reefs and steep outer
reefs with good coral coverage (Vunisea et al., 2008).
Further west of Manono (Tai) island is the big island Savaii where the second site Salelavalu
is situated in the east coast. Being a neighbouring community to Salelologa wharf and
commercial town it provides good access to markets for Salelavalu fishers. Finfish are
mainly caught in easy accessible habitats because of limited number of boats. Furthermore
the consumption of finfish within the community is 58 kg/person/year (Vunisea et al., 2008).
Adjacent coastal water from Salelavalu stretching up north to Lalomalava villages was
surveyed. Similar to Manono Uta four habitats were surveyed. The coral reefs in this area
have been noted as healthy and complex (Vunisea et al., 2008). Furthermore, it has a larger
reef than Vaisala, moreover one of the largest reefs in Samoa.
Vaisala is another community in Savaii on the north western coast with once a thriving Asau
Bay of economic development that included logging operations(MNRE, 2007). Finfish is
mainly for consumption (51 kg/person/year) purposes due to isolation from Apia and
Salelologa center towns (Vunisea et al., 2008). The survey of this site only covered the back
reef and outer reef habitats. The outer reef crest is about 240m from the beach with a reef
passage midway along the Vaisala Bay and bordered by a major passage at the eastern end
into the Asau Bay (MNRE, 2007). In 1999 the bay was characterized as two areas the eastern
part consisting of dead coral boulders and western part with good coral coverage. The lagoon
is relatively small and shallow with sandy bottoms and scattered sea grass patches (Mulipola
et al., 2004).
The last site, Vailoa within the Aleipata district is located at the far east end of Upolu.
Similarly this Vaisala, this site is far from main markets thus finfish harvest is mainly for
consumption (47 kg/person/year) and lesser degree of income generation (Vunisea et al.,
2008). The adjacent coastal waters of three villages in this district was surveyed stretching
from Vailoa, Ulutogia to Satitoa. This was carried out only for coastal reef, backreef and
outer reefs. As well as the outer reefs of the nearby uninhabited islands Nuutele and Nuulua
(Vunisea et al., 2008). This was mainly due to the fact that adjacent communities to the
islands also fish in this area. The outer reef was characterised by pavement of coralline algae
and algal ridge in the reef edge. Reef slopes were mostly steep with generally low in coral
cover in some areas (Vunisea et al., 2008).
Maria Sapatu
UNU Fisheries Training Programme Page 11
4.2 Data collection
4.2.1 Finfish Fisher Survey
Fishers (men and women) within the random selected households of each site were enquired
on fishing strategies, quantitative and qualitative data on average catches for each fishing
habitat (Vunisea et al., 2008). Fishing strategies included frequency of fishing trips and
habitats, time of fishing, use of catch, techniques used and so forth. As for the average
catches the Fishers gave vernacular or local names, number and length estimates of fish
caught which was assisted by size field survey charts. The field chart consisted of five major
size classes in 8 cm intervals but length more than these classes was estimated with tape
measure. Lengths were then converted to weights (Kulbicki et al., 2005) for the overall
weighted catches by habitat and sites.
The use of aerial photographs, maps, hydrologic charts for detail description of habitats by
fisher was used to taken challenging of fisher identifying habitats. Also photographic indices
were used to assist in identification of local fish names to matching scientific names.
Additional information on species seasonality was recorded and catches with commonly used
fishing techniques were encouraged to provide (Vunisea et al., 2008).
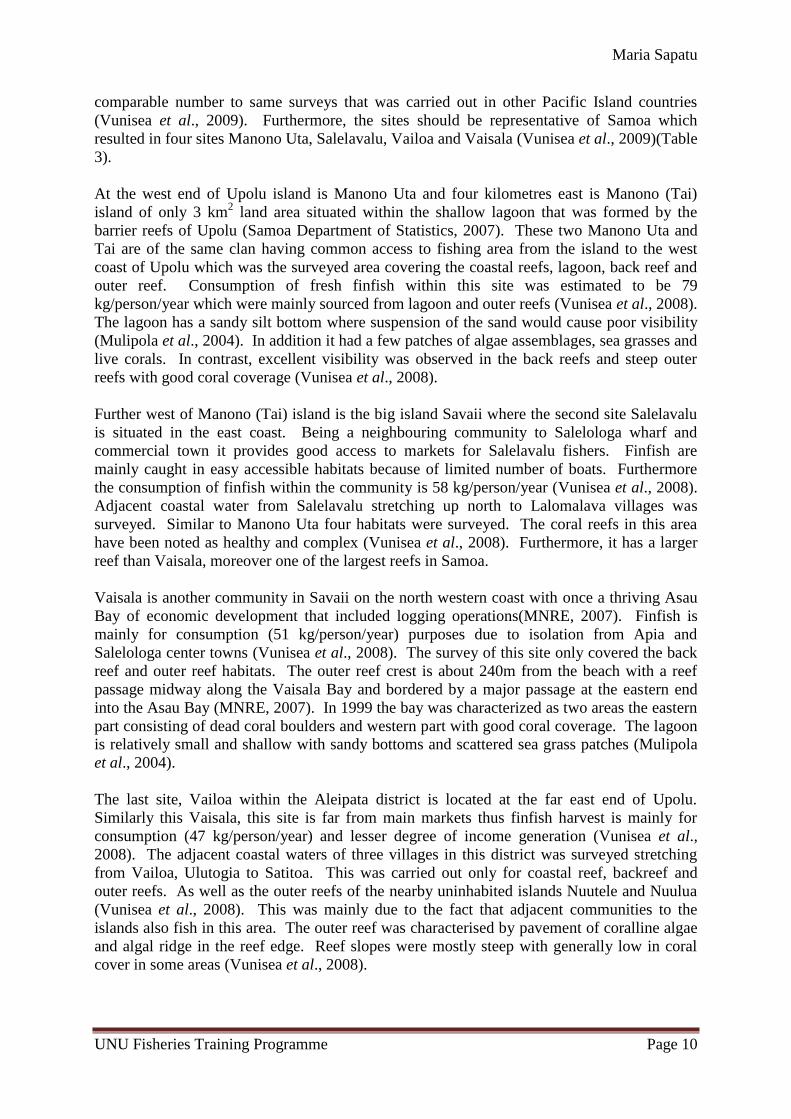
Finfish size field survey chart for estimating average length of reef and lagoon fish (including 5 size classes
from 8 cm to 40 cm, in 8 cm intervals). (Vunisea et al., 2008)
4.2.2 Finfish Survey
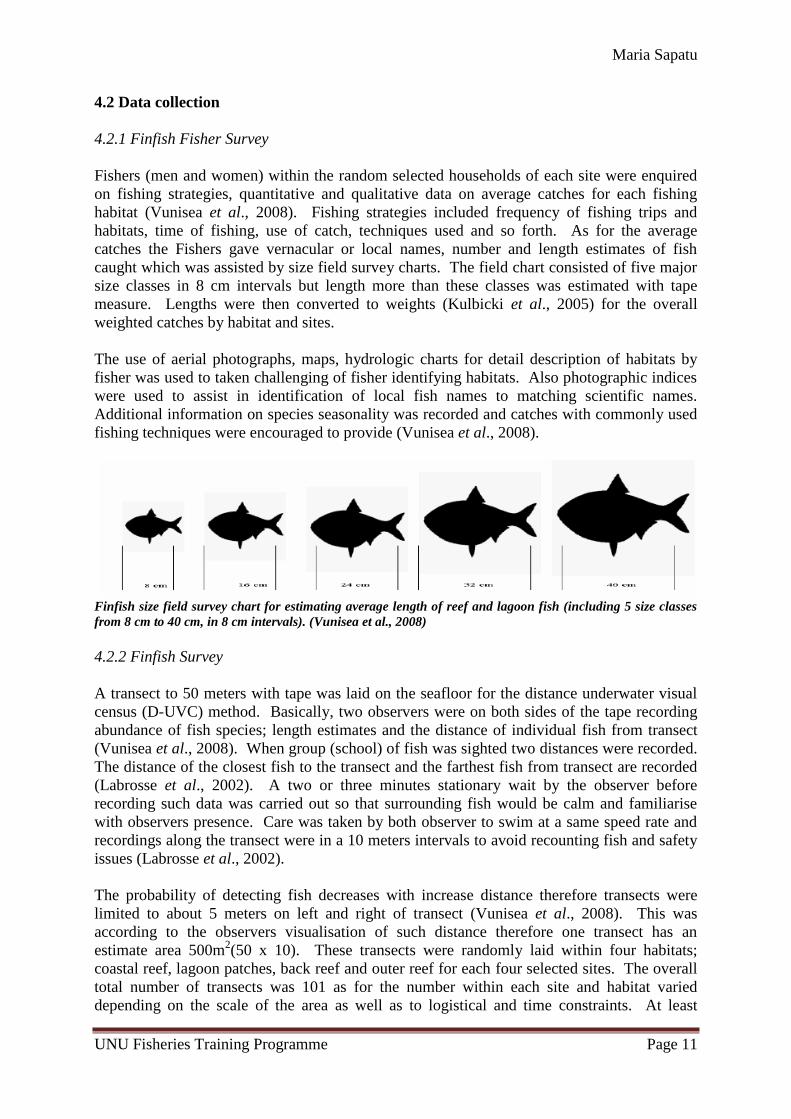
A transect to 50 meters with tape was laid on the seafloor for the distance underwater visual
census (D-UVC) method. Basically, two observers were on both sides of the tape recording
abundance of fish species; length estimates and the distance of individual fish from transect
(Vunisea et al., 2008). When group (school) of fish was sighted two distances were recorded.
The distance of the closest fish to the transect and the farthest fish from transect are recorded
(Labrosse et al., 2002). A two or three minutes stationary wait by the observer before
recording such data was carried out so that surrounding fish would be calm and familiarise
with observers presence. Care was taken by both observer to swim at a same speed rate and
recordings along the transect were in a 10 meters intervals to avoid recounting fish and safety
issues (Labrosse et al., 2002).
The probability of detecting fish decreases with increase distance therefore transects were
limited to about 5 meters on left and right of transect (Vunisea et al., 2008). This was
according to the observers visualisation of such distance therefore one transect has an
estimate area 500m2(50 x 10). These transects were randomly laid within four habitats;
coastal reef, lagoon patches, back reef and outer reef for each four selected sites. The overall
total number of transects was 101 as for the number within each site and habitat varied
depending on the scale of the area as well as to logistical and time constraints. At least
Maria Sapatu
UNU Fisheries Training Programme Page 12
maximum of 24 transects was targeted for each site and at about 12 transects for shallow
habitats (coastal reef, lagoon) and 12 transects for deeper waters (outer reefs) (Vunisea et al.,
2008).
A diagram illustrating the procedure of the D-UVC method (Vunisea et al., 2008)
4.3 Data Analysis
4.3.1 Finfish fisher survey
The focus of this study is to obtain catches by habitat to compile with UVC biomass by
habitat. However, the fishing habitats recorded in the data collection showed either
combination of habitats or shifting of habitats in a fishing trip. Therefore, the overall sum of
these catches by sites would be more appropriate than the sum of habitat catches.
The data made available from SPC (PROCfish project) was the annual catches and average
size of grouped fish families by each fisher of household surveyed. The total catches of the
fisher for each household was calculated at fish family level. Then the average catches of
households within the sites was calculated. This was then scaled to the number of households
within the site to be of representative of the whole community (one site).
4.3.2 Finfish Survey
Application of stratified random sampling (Conquest, et al., 1996): where the subpopulations
or strata were referred to as the four habitats within a site. Thus species richness (mean total
number), fish abundance and fish biomass were calculated for each habitat at each site.
Biomass was calculated with length-weight relationship data. These calculations were for
each fish species recorded which were later summarised into fish families.
In order to estimate biomass, the observed lengths were converted to weight using the
following formula:
Maria Sapatu
UNU Fisheries Training Programme Page 13
The parameters and which are species specific were obtained from Kulbicki (1993)
and are given in table 13 in the appendix.
For each site, mean density (per 500 m2) within each habitat (strata), either in terms of
number (N) or biomass (B) was calculated as:
Where h stands for habitat and s stands for site, n is the total number of transect sampled
within a habitat. The total number is Nt and Bt is the total biomass of finfish sampled in
transect (t). The variance in the estimates within each habitat was calculated by:
Standard deviation (s), standard error (se) and coefficient of variation (cv) are calculated the
conventional way:
Assuming a catchability of one, the estimated total abundance in term of numbers and total
biomass of a site was calculated as:
Where H is the number of habitats, Wt the total area of transect and Wh is the area of each
habitat which is converted to similar units (m2) as transect area. The variance of the total
biomass estimates was calculated by:
Maria Sapatu
UNU Fisheries Training Programme Page 14
: is then simply the standard error of the total biomass estimates
4.3.3 Statistical test
The analysis of variance (ANOVA) was used to test the difference of biomass density
between habitats of sites and within each site. Logarithm of the weights was taken for this
analysis. This was followed by the Tukey HSD (Tukey Honest Significant Difference)
multiple comparison procedure. The Tukey procedure was followed to identify the group
(site and habitat) showing significant difference at the 95% family-wise confidence level
(Cochran, 1997).
(abbreviation of the above equation)
(calculating mean sum of squares between groups)
(calculating mean sum of squares within groups)
= Sum of squares between groups
=Sum of squares within groups
=Total sum of squares
=Mean sum of squares between groups
=Mean sum of squares within groups
=Degress of freedom between groups (number of groups - 1)
=Degress of freedom within groups (total degrees of freedom - 1)
=F ratio
4.3.4 Combined Analysis
With known catches from the socioeconomic survey and the average standing stock biomass
calculated from the D-UVC data one can get a proxy of the fishing pressure by taking the
ration of annual catch over the standing biomass:
If the catchability in the UVC survey is one, i.e. the density estimates are a true reflection of
the biomass and if the biomass estimates in the UVC survey is the same as the mean annual
biomass, then the above fishing pressure proxy is equivalent to instantaneous fishing
mortality (F), i.e.
Maria Sapatu
UNU Fisheries Training Programme Page 15
If natural mortality (M) is known, the exploitation rate (the relative amount taken by fishing
compared with the total amount removed) can be calculated by:
5. RESULT
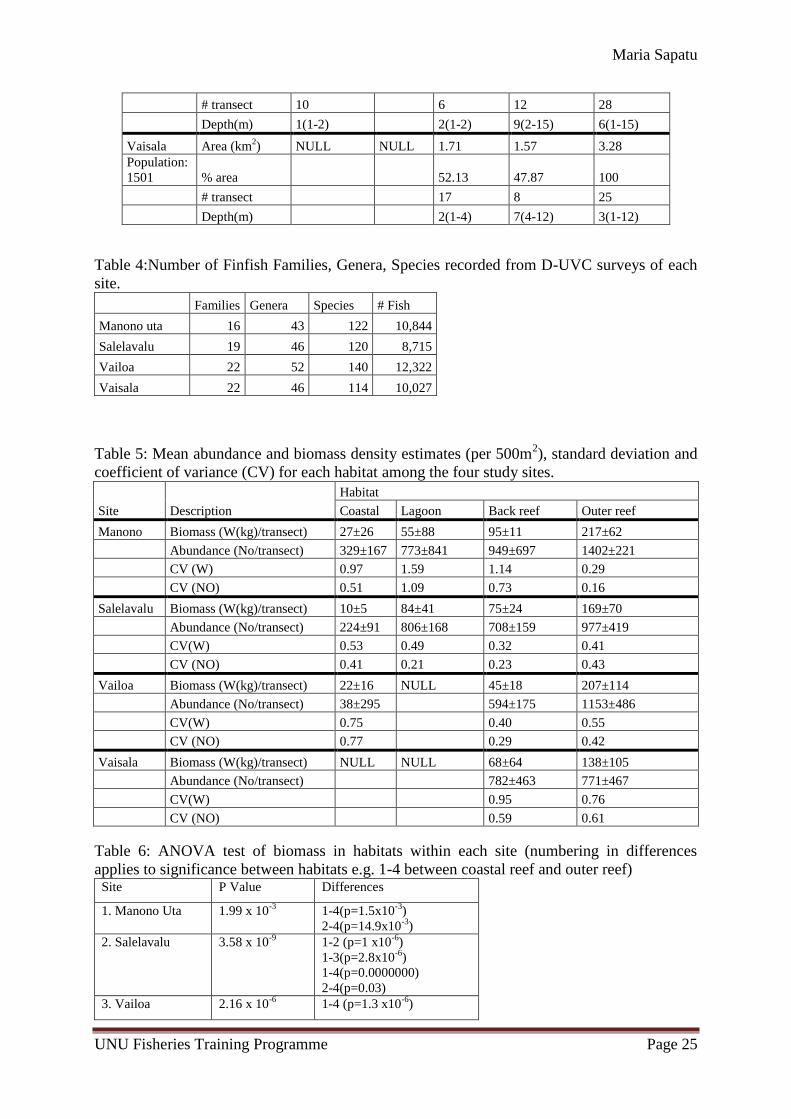
A total of 27 fish families was recorded from the UVC survey that was used in the analysis.
Within the four sites a range of 22 – 16 families, 56-43 generas and 140-114 species was
obtained. Vailoa and Vaisala have diverse abundance of these finfish classes than that of
Manono uta and Salelavalu (Table 4). Only 13 of these families was composed in the catches
obtained from the Fisher survey.
1. Acanthuridae
2. Aulostomidae
3. Balistidae
4. Belonidae
5. Caesionidae
6. Carangidae
7. Chaetodontidae
8. Cirrhitidae
9. Diodontidae
10. Haemulidae
11. Holocentridae
12. Kyphosidae
13. Labridae
14. Lethrinidae
15. Lutjanidae
16. Mugilidae
17. Mullidae
18. Nemipteridae
19. Pempheridae
20. Pomacanthidae
21. Scaridae
22. Scombridae
23. Scorpaenidae
24. Serranidae
25. Siganidae
26. Tetraodontidae
27. Zanclidae
5.1 Relative abundance and biomass
The density of fish both in terms of numbers and biomass is highly influence by habitat
(Table 5). An ANOVA test of biomass density between habitats within sites was highly
significant for Manono uta, Salelavalu and Vailoa but not for Vaisala (Table 6). A pairwise
test showed that the biomass density in the outer and back reef is the same as well as the
lagoon and backreef. In contrast, the biomass density in the coastal reef is significantly
different to all other habitats. The only exception was in Vailoa where the coastal reef and
back reef were the same and back reef and outer reef significantly different.
The overall pattern (Figures 3 & 4) is that the outer reefs have highest densities (average of
138-217 kg/500m2) with lagoons and back reef showing moderate densities (average of 45-95
kg/500m2) while the coastal habitat have the lowest biomass (average of 10-27 kg/500m
2).
To test for difference in densities between sites one must take into account the influence of
habitat on densitites. An ANOVA test on the biomass density where habitat is a factor
showed that the densities in coastal reef, back reef and coastal reefs are the same at all four
sites (Table 7). The density of the lagoon habitat was however significantly different in
Manono Uta and Salelavalu, the only two sites where this habitat was found.
Maria Sapatu
UNU Fisheries Training Programme Page 16
The size pattern among the different habitats is relatively consistent among different sites
(Figure 5-8), with the modal size decreasing from 20-15 cm in the outer reef to 15-10 cm in
the back reef and lagoons to 10-5 cm in the coastal reef. A number of very small (< 4 cm)
and large (46-70 cm) fish lengths were recorded mainly within the Vailoa and Vaisala.
5.2 Major Families of Biomass Density
Acanthuridae, Scaridae are the two dominant fish families within the outer reefs (Figure 9).
These fish families are herbivores often foraging in daytime for food with life span varying
from 5 to 20 years. Second in rank was the carnivorous fish Lutjanidae that are often sited
along the reefs in schools during the day. Other noticeable families with such moderate
density in the outer reefs were Caesonidae (planktivore), Balistidae and Lethrinidae both
carnivorous fish.
Among the sites these families do not show a uniform density. The Caesonidae family are
often in schools feeding along the reef slopes was particularly dense in Vailoa and Manono
uta. While in Vaisala the Balistidae family had the highest biomass and lowest in Lethrinidae
finfish. Mullidae family, also carnivorous and sand dwellers, are often solitary were denser in
Salelavalu than other sites.
In close proximity to outer reefs, the back reef show similar fish family dominance but of
lower biomass. As illustrated by the high biomass density of Acanthuridae and Scaridae with
other fish families below 5 kg per transect (Figure 10). An exception was observed in
Manono uta where Mullidae and Nemipteridae were of higher biomass compared to other
sites. In addition Siganidae, herbivore family was very low in the Savaii sites (Salevalu and
Vaisala).
The lagoons of only two sites show relative high biomass of families Acanthuridae and
Scaridae (Figure 11). Lutjanidae and Caesionidae in Manono uta have become more
important (dense) than the Scaridae and Acanthuridae. On the other hand Salelavalu still
maintains the dominance of Scaridae and Acanthuridae with Lutjanidae and Nempteridae as
moderate biomass density.
Coastal reefs show a decline in the two dominant herbivore families from the outer reefs.
Other families like Siganidae and Nemipteridae have become relatively higher than in the
deeper habitats. Manono uta had a significant high biomass of Siganidae compared to all
other sites (Figure 12). Scaridae and Acanthuridae still show high density in Salelavalu and
Vailoa but not in Manono uta. Other families show relative spread among the sites like
Nemipteridae and Mullidae. Vailoa was the only site to have Mugilidae family at a moderate
biomass.
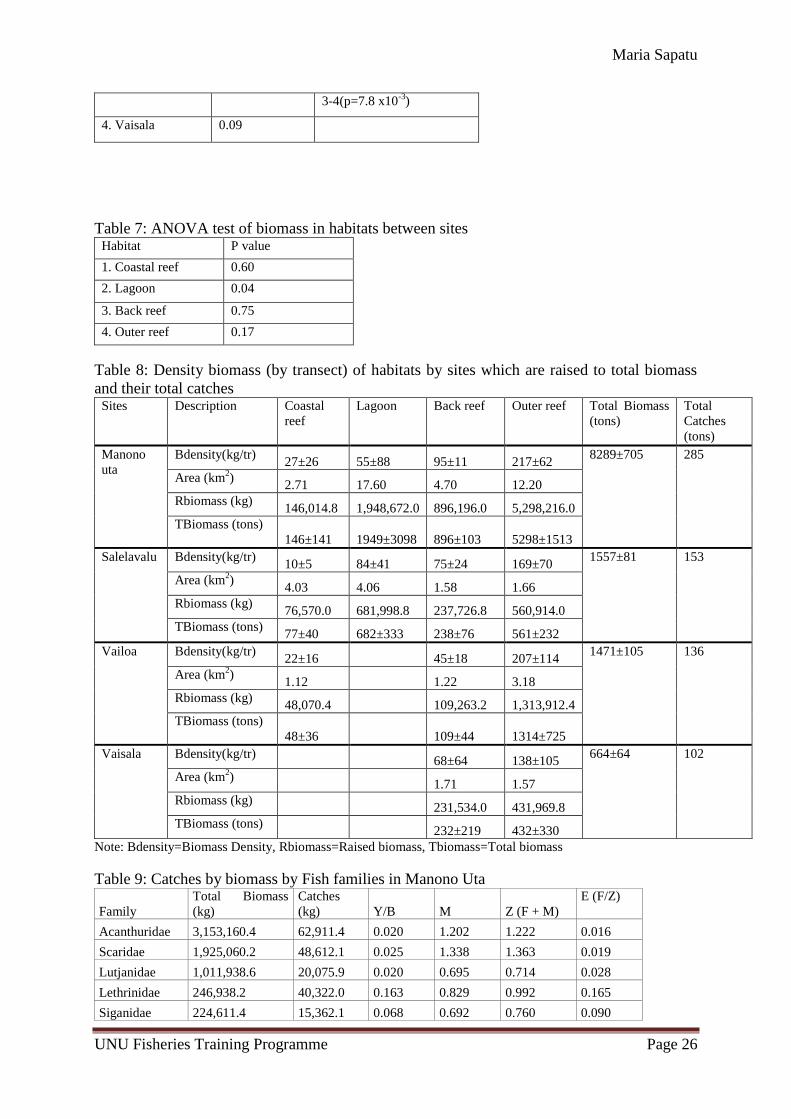
5.3 Total Biomass and Catches
The estimated total biomass among the four sites was 8289, 1557, 1471 and 664 tonnes at
Manono, Salalavalu, Vailoa and Vaisala respectively (Table 8). Among the habitats the
biomass increases with distance towards the outer reefs. However the lagoons of 1948
(Manono uta) and 682 (Salelavalu) tonnes is higher than that of back reefs ranging from 896 -
109 tonnes. Manono uta has the highest biomass in all the four habitats surveyed with
Maria Sapatu
UNU Fisheries Training Programme Page 17
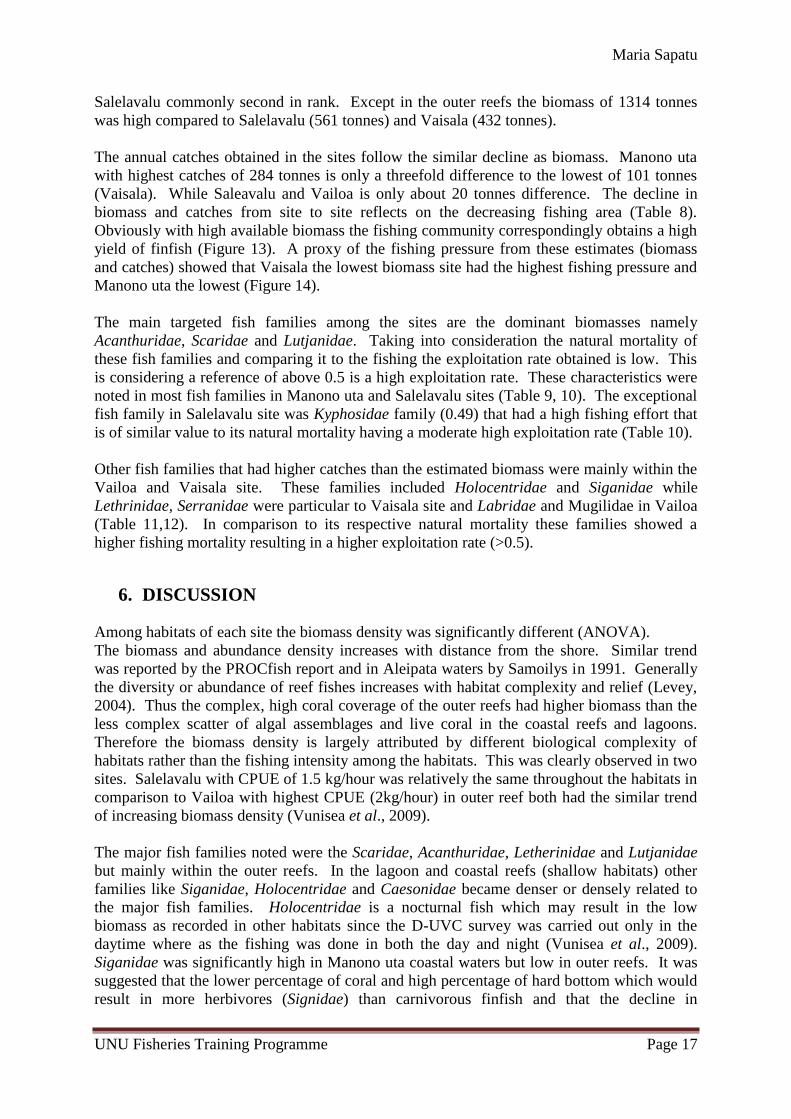
Salelavalu commonly second in rank. Except in the outer reefs the biomass of 1314 tonnes
was high compared to Salelavalu (561 tonnes) and Vaisala (432 tonnes).
The annual catches obtained in the sites follow the similar decline as biomass. Manono uta
with highest catches of 284 tonnes is only a threefold difference to the lowest of 101 tonnes
(Vaisala). While Saleavalu and Vailoa is only about 20 tonnes difference. The decline in
biomass and catches from site to site reflects on the decreasing fishing area (Table 8).
Obviously with high available biomass the fishing community correspondingly obtains a high
yield of finfish (Figure 13). A proxy of the fishing pressure from these estimates (biomass
and catches) showed that Vaisala the lowest biomass site had the highest fishing pressure and
Manono uta the lowest (Figure 14).
The main targeted fish families among the sites are the dominant biomasses namely
Acanthuridae, Scaridae and Lutjanidae. Taking into consideration the natural mortality of
these fish families and comparing it to the fishing the exploitation rate obtained is low. This
is considering a reference of above 0.5 is a high exploitation rate. These characteristics were
noted in most fish families in Manono uta and Salelavalu sites (Table 9, 10). The exceptional
fish family in Salelavalu site was Kyphosidae family (0.49) that had a high fishing effort that
is of similar value to its natural mortality having a moderate high exploitation rate (Table 10).
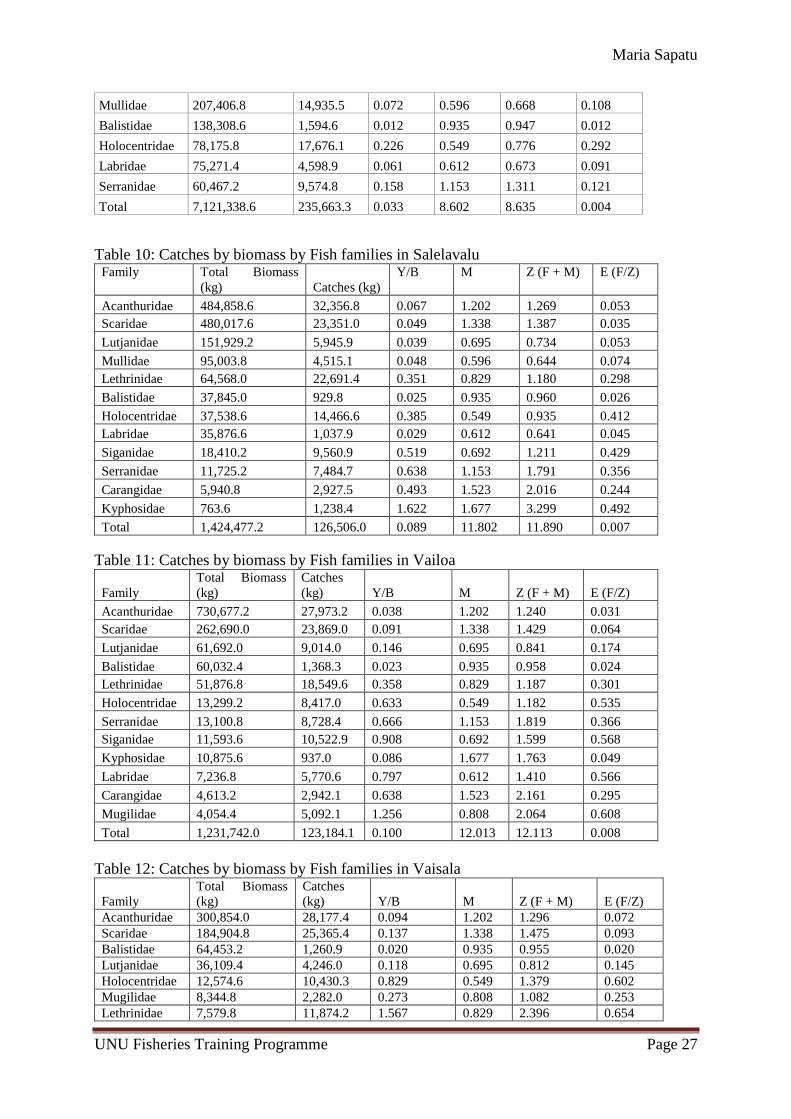
Other fish families that had higher catches than the estimated biomass were mainly within the
Vailoa and Vaisala site. These families included Holocentridae and Siganidae while
Lethrinidae, Serranidae were particular to Vaisala site and Labridae and Mugilidae in Vailoa
(Table 11,12). In comparison to its respective natural mortality these families showed a
higher fishing mortality resulting in a higher exploitation rate (>0.5).
6. DISCUSSION
Among habitats of each site the biomass density was significantly different (ANOVA).
The biomass and abundance density increases with distance from the shore. Similar trend
was reported by the PROCfish report and in Aleipata waters by Samoilys in 1991. Generally
the diversity or abundance of reef fishes increases with habitat complexity and relief (Levey,
2004). Thus the complex, high coral coverage of the outer reefs had higher biomass than the
less complex scatter of algal assemblages and live coral in the coastal reefs and lagoons.
Therefore the biomass density is largely attributed by different biological complexity of
habitats rather than the fishing intensity among the habitats. This was clearly observed in two
sites. Salelavalu with CPUE of 1.5 kg/hour was relatively the same throughout the habitats in
comparison to Vailoa with highest CPUE (2kg/hour) in outer reef both had the similar trend
of increasing biomass density (Vunisea et al., 2009).
The major fish families noted were the Scaridae, Acanthuridae, Letherinidae and Lutjanidae
but mainly within the outer reefs. In the lagoon and coastal reefs (shallow habitats) other
families like Siganidae, Holocentridae and Caesonidae became denser or densely related to
the major fish families. Holocentridae is a nocturnal fish which may result in the low
biomass as recorded in other habitats since the D-UVC survey was carried out only in the
daytime where as the fishing was done in both the day and night (Vunisea et al., 2009).
Siganidae was significantly high in Manono uta coastal waters but low in outer reefs. It was
suggested that the lower percentage of coral and high percentage of hard bottom which would
result in more herbivores (Signidae) than carnivorous finfish and that the decline in
Maria Sapatu
UNU Fisheries Training Programme Page 18
Acanthuridae and Scaridae (herbivores) is due to the high catch per unit effort (about
2kg/hour) on this habitat (Vunisea et al., 2009).
Particularly the above low biomass of Acanthuridae and Scaridae may as well been existing
for a long time. Since the major size range of this Siganidae family was of bigger fish from
10-24 cm than other families. Hence, it may as well be a school of adults feeding in the
coastal reef resulting to this exceptionally high biomass. Detectability would be another
reason where this large mean length was easier to be recorded than the small mean size. For
instance the coastal habitats (coastal reef and lagoon) of Manono uta was particularly
described as turbid due to the easy suspension of the sandy silt bottom.
The dominant size range within habitats increases with distance from the shore. The size
difference the coastal and lagoon habitats are good nursery grounds for juveniles due to
abundant algal assemblages and decrease predation with distance from the reefs (Carr and
Hixon, 1995., Shulman, 1985). A corresponding high biomass fish families (e.g.
Acanthuridae and Scaridae) in the outer reefs also prevailed in the coastal reefs. However the
biomass of these juveniles are much lower than that of the outer reefs. Considering they are
nursery grounds, one would expect a higher biomass. This large scale biomass differences
can be related to high natural mortality, recruitment and movement of juvenile finfish
(Gillanders, 2006). Moreover, the more likely of natural mortality (predation) and together
with fishing mortality these juveniles are in low biomass.
Total biomass among the habitats and sites resulted in Manono Uta as the highest and the
lowest was Vaisala. This does not entirely reflect the biomass density where Vailoa was the
highest then Manono Uta, Vaisala and Salelavalu as the lowest. The main reason behind this
biomass variation is the different fishing area. As illustrated by the lagoon habitat where the
area of Manono Uta had fourfold difference than Salelavalu (84kg/transect) resulted in the
higher biomass in Manono Uta. Furthermore, this was the only habitat among sites that the
ANOVA test showed significant difference of biomass density while the rest was the same.
One has to keep in mind that these were the only two sites surveyed for this habitat.
The surveyed sites have a small range of catch per unit effort from 1-2 kg/hour and the
population is relatively the same (Vunisea et al., 2009). This correlates to the annual yields
among sites obtained which was only a threefold difference. In comparison to the estimated
biomass the sites have about a 13 times difference in biomass. Again the available fishing
area is contributing to such difference of the biomass. With decreasing biomass and area
correlated to decreasing catches from Manono Uta to Vaisala site.
The fishing area also determines the fishing pressure where Manono uta (13fisher/km2) had a
lower fishing pressure than that of Vaisala (52fisher/kg) (Vunisea et al., 2009). In other
words, considering the population size the fishing pressure has an inverse relationship with
accessible fishing area. Therefore Vailoa and Vaisala sites are considered highly fished. In
addition the estimated MSY by Munro (1984) of the neighbouring country American Samoa
was 20tons/km2/year (Dalzell et al., 1996). Such idea similarly shows Vailoa and Vaisala as
being above such estimated MSY. It also reflected on the high exploitation of some fish
families like Holocentridae and Siganidae that was particularly in these two sites.
However, the overall the catches obtained for the surveyed sites are lower than that of the
available estimated biomass. Kulibicki (1994) states that a 10% of the estimated standing
stock is the MSY fishable stock of the coral reefs which means all sites are not being highly
Maria Sapatu
UNU Fisheries Training Programme Page 19
fished. Thus overfishing is questionable but there is surely a difference of fishing pressure of
the sites. In addition one should consider such overfishing conclusion carefully due to the
following various reasons.
The high variance in the biomass estimates which is problematic in determining a precise
increase or decrease of the biomass when having a series of reassessments. Comparison in
coefficient of variance showed that coastal reefs, lagoons and back reefs have higher variance
than that of outer reefs. Hence an increase in sampling numbers and on certain habitats would
decrease such variance. Furthermore the average number of fish recorded per transect by the
two divers do not show any correlation (Figure 16). The trend observed in the density along
the four habitats simultaneously show that diver 2 was recording more fish than diver 1. The
underwater visual census should be standardised to lower such level of errors.
7. CONCLUSION
Biomass density of the four sites did not show significant difference among sites, but there
was a difference within habitats. The habitats showed increase in biomass, abundance and
size length as distance from shore increases which is related to the biological recruitment,
predation and movement of finfish. Hence the fishing pressure does not largely attribute on
such pattern among the habitats. The fishing area does largely attribute to the biomass
calculated as shown in the lagoon habitats where the area is greater than that of back reefs and
having higher biomass.
The four sites had relatively the same in population numbers and catch per unit effort. The
yield obtained are closely related, only a threefold difference while the biomass is of 13 fold
difference. Again among the sites the fishing area is contributing largely to the available
biomass. With high biomass corresponds to high yield but of low fishing pressure as shown
in Manono uta. The Vailoa and Vaisala site with small fishing area have a higher fishing
pressure and low catches. In terms of fish families Scaridae, Acanthuridae and Lutjanidae
are of high importance in both the catches and biomass of all the sites. This is unlike the low
biomasses of Holocentridae and Signidae which are highly exploited in Vaisala and Vailoa.
Therefore, considering the population size, the fishing pressure has an inverse relationship
with accessible fishing area.
Overall the catches obtained for the surveyed sites are lower than that of the available
estimated biomass. The fishable stock is still below the 10% of the MSY fishable stock of the
coral reefs which considers all sites as not being highly fished. Thus overfishing is
questionable but there is surely a difference of fishing pressure of the sites. In addition one
should consider such overfishing conclusion carefully since the number of samples used is
low, the high variance and the errors associated with the method used.
On the other hand, with the conclusions obtained from this study it is possible to advice
managers that the management measures within Manono Uta cannot be readily apply to these
other two sites due to the results obtained. Vailoa and Vaisala may focus on extension of
fishing area to the outer reef rather than coastal reefs. Since the coastal reefs are of smaller
areas and already of low biomass and with high fishing pressure may reach a high
exploitation of finfish in these near shore habitats. Furthermore, data collection and analysis
of socio economic (catches) data and biological data (D-UVC) should be undertaken. Since it
Maria Sapatu
UNU Fisheries Training Programme Page 20
is often separately collected and analysed that such conclusions made from this report cannot
be obtained. Also improvement of monitoring schemes should be considered.
8. ACKNOWLEDGEMENTS
This project would have not been possible without the help of various people. Firstly big
thanks go to SPC through the access of the data, information and elaboration on some
enquiries particularly Frank Magron (SPC). Communication wise for data access and
deliveries I would like to thank Mulipola Atonio (ACEO Samoa Fisheries), Ueta Faasili (SPC
Fisheries Advisor) and Lucille Aukusitino (Samoa Fisheries Officer). Also to Dr. Jeppe
Kolding (University of Bergen) with assistance on some problems faced with the pasgear
software. To the editors Tumi Tomasson, Konrad, Thor Asgeirsson of UNU-FTP thanks for
the time taken for such hard task of reading and editing this report. Lastly to my supervisor
Einar Hjorleifsson thank you for the endless support throughout these months in sharing your
skills and knowledge towards the end of the project. As well as your positive attitude through
the difficulties faced that one would not forget.
9. REFERENCE
Carrr, M.H. and Hixon, M.A., 1995. Predation effects on early post settlement survivorship of
coral reef fishes [Electronic version]. Marine Ecology Progress Series. Vol 124, pp 31-42.
Cochran, W. G. 1997, Sampling Techniques, John Wiley and Sons, New York.
Conquest, L. Burr, R. Donnelly, R. Chavarria, J. and Galluci, V. 1996.“Sampling methods for
stock assessment for small scale fisheries in developing countries”. In: Galluci, V.F. Saila,
S.B., Gustafon, D.J. and Rothshchild, B.J. (eds). Stock Assessment: Quantitaive methods and
applications for small scale fisheries. CRC Press, Lewis Publications. United States.
Connell, S.D., Samoilys, M.A., Smith, M.P.L. and Leqata, J. 1998. Comparisons of
abundance of coral reef fish: Catch and effort surveys vs visual census [Electronic version].
Australian Journal of Ecology. Vol 23, pp 579-586.
Dalzell, P., Adams, J.H. and Polunin, N.V.C. 1996. Coastal Fisheries in the Pacific Islands
[Electronic version]. Oceanography and Marine Biology: an Annual Review. Vol 34, pp 395-
531.
Eriksson, H. 2006. Sea cucumber abundance diversity and fishery in Samoa: An assessment
of lagoon occurring sea cucumbers. Uppsala University.
Fisheries Division, 2005. Fisheries Annual Report 04-05. Ministry of Agriculture and
Fisheries, Samoa. Unpublished report.
Fisheries Division, 2007. Inshore Section Scientific Technical Report. Ministry of Agriculture
and Fisheries, Samoa. Unpublished report.
Maria Sapatu
UNU Fisheries Training Programme Page 21
Gillanders, B.M. 1997. Comparison of growth rates between esturarine and coastal reef
populations of Achoerodus viridus (Pisces:Labridae). Marine Ecology Progress Series. Vol
146, pp 283-287.
Graham, J.E., Barrett, N.S. and Morton, A.J. 2004. Biases associated with the use of
underwater visual census techniques to quatify the density and size structure of fish
populations. Journal of Experimental Marine Biology and Ecology. Vol 308, pp 269-290.
Hobson E.S. 1965. Diurnal-noctural activity of some inshore fishes in the gulf of California
[Electronic version].Copeia.Vol 3, 291-302
Horsman, N. & Mulipola, A. 1995. Catch data and collection from market surveys in Western
Samoa. South Pacific Commission and Forum Fisheries Agency Workshop on the
management of South Pacific Inshore Fisheries. Integrated Coastal Fisheries Management
Project Technical Document. South Pacific Commission, Noumea.
Jennings, S., Bustamante, R.H., Collins, K. and Mallison, J. 1998. Reef fish behaviour during
a total solar ellipse at Pinta island, Galapagos [Electronic version]. Journal of Fish biology.
Vol 53, pp 683-686.
King, M. & Faasili, U. 1998. “Community based management of fisheries and the marine
environment”. In Seeto, J., & Bulai. N. (eds). Fisheries and Marine Resources - Papers
presented at Symposium 8, VIIIth Pacific Science Inter-Congress. Marine Studies Programme
Technical Report. Vol 98(3), pp 115-125. The University of the South Pacific.
Kulbicki, M., Guillemot, N. & Amand, M. 2005. A general approach to length-weight
relationships for New Caledonian lagoon fishes [Electronic version]. Cybium Vol 29(3), pp
235-252.
Kulbikic, M. 1998. Correlation between catch data from bottom longlines and fish censures
in the SW lagoon of New Caledonia, Proceedings of the 6th
International Coral Reef
Symposium, Australia 1988, Vol 2. Department of Oceanography ORSTOM BP A5,
Noumea, New Caledonia.
Labrosse, P., Kulbicki, M. and Ferraris, J. 2002. Underwater visual fish census survey:
Proper use and implementation. Secretariat of the Pacific Community, Noumea, New
Caledonia.
Levy, M. Reef fish habitat associations in the gulf of California. Moss landing Marine
Laboratories <http://ichthy.mlml.calstate.edu/levey.htm> [Febuary, 2009]
McGinley, Mark (Lead Author); Judith S. Weis (Topic Editor). 2008. Coral reef fish feeding
behavior in the Caribbean. In: Encyclopedia of Earth. Eds. Cutler J. Cleveland (Washington,
D.C.: Environmental Information Coalition, National Council for Science and the
Environment).<http://www.eoearth.org/article/Coral_reef_fish_feeding_behavior_in_the_Cari
bbean>[November 30, 2008]
MNRE, 2007. Coastal Ecosystem recovery plan Vaisala, Ministry of Natural Resources,
Environment and Meterology. Unpublished report.
Maria Sapatu
UNU Fisheries Training Programme Page 22
Munro, J.L. and Fakahau, S.T. 1988. A cost effective approach to stock assessment and
monitoring of small-scale coastal fisheries in the South Pacific Region: Workshop and Pacific
Inshore Fishery Resources. International Centre for Living, Noumea, New Caledonia.
Munro, J.L. and Fakahau, S.T. 1986. Methods for appraisal and assessment of coastal
fisehery resources in the South Pacific region. Nearshore Marine Resources of the South
Pacific: Information for fisheries development and management. Forum Fisheries Agency.
Mulipola, A., Samuelu, J., Solofa, A. and Tausa, N. 2004. Current Status of Coral Reefs in
Samoa, Report Submission to the 10th
International Coral Reef Symposium, Fisheries
Division, Ministry of Agriculture and Fisheries. Unpublished report.
Mulipola A,. 2002. Marine resources of Samoa. Report prepared for the World Summit on
Sustainable Development, Johannesburg, South Africa, July 2002. Fisheries Division,
Ministry of Agriculture, Forests, Fisheries and Meteorology, Samoa.
Mulipola, A. 2001. Profile of village fisheries in Samoa: Fisheries Division, Ministry of
Agriculture., Forests, Fisheries and Meterology. GRM International Pty Ltd, Australia.
Pauly, D. 1984. Length converted catch curves: a powerful tool for fisheries research in the
tropics (Part III: Conclusion) [Electronic version]. Fishbyte, Newsletter of the Network of
Tropical Fisheries Scientists. Vol 2(3), pp 8-10.
Passfield, K., King, M., Mulipola, A. and Ropeti, E. 2002. Report of a household fisheries
and dietary survey October-November 2000. Ministry of Agriculture , Forests, Fisheries and
Meterology, Samoa. <www.mnre.gov.ws/documents/forum/2002/12>[November 28, 2008]
Rearic, D.M. 1990. Survey of cyclone Ofa damage to the northern coast of Upolu, Western
Samoa. SOPAC technical report 104.
Samoa Statistics Department. 2001. Population Size and Growth. Samoa Department of
Statistics.
<http://www.spc.int/prism/Country/ws/stats/Products&Services/Reports/PDF/PopCensus/Ch.
%201-%20Population%20size.pdf>[November27,2008]
Samoa Department of Statistics. 2007. 2008 Population Estimates. Samoa Department of
Statistics. <http://www.spc.int/prism/Country/ws/stats> [November 27, 2008]
Samoa Department of Statistics. 2008. 2006 Population Estimates. Samoa Department of
Statistics.<http://www.sbs.gov.ws/Portals/138/PDF/census%20survey/Table%202.%20Popula
tion%20byregion,%20faipule%20district%202006.pdf>
[November 27, 2008]
Samoilys, M., Carlos, G. 2000. Determining methods of underewater visual census for
estimating the abundance of coral reefs [Electronic version]. Environmental Biology of
Fisheries. Vol 57, pp 289-304.
Samoilys, M., Carlos, G. 1991. A survey of reef fish stock in Western Samoa: Application of
underwater visual census methods 1991, Report to Forum Fisheries Agency and FAO,
Queensland Dept of Primary Industries, Cairns, Australia, Unpubl, Report 6. SM/89/002.
Maria Sapatu
UNU Fisheries Training Programme Page 23
Samoilys, M. 1997. Underwater visual census surveys. In: Samoilys, M. (ed). Manual for
Assessing Fish stocks on Pacific Coral Reefs, Queensland Department of Primary Industries,
Townsville.
Shulman, M.A., 1985. Recruitment of coral reefs fisheries:effects of distribution of predators
and shelter [Electronic version]. Ecology. Vol 66, pp 1056-066
Skelton, P.A. and Robin, G. 2007. Marine Invasive species survey of the Apia Harbour,
Samoa : Preliminary Report. National Marine Biodiversity Conservation project, Ministry of
Natural Resource and Environment. Unpublished report.
Skelton, P., Bell, L. Mulipola, A. and Trevor, A. 2000. The Status of coral reefs and marine
resources of Samoa, Coral Reefs in the Pacific: Status and monitoring, resource and
management. International Coral Reef Initiative (ICRI).
<http://www.icriforum.org/secretariat/pdf/207-316.pdf>[November 27, 2008]
Skelton, P.A., and G.R. South, 1999. “A preliminary checklist of the benthic marine algae of
the Samoan archipelago”. Marine Studies Programme Technical Report. The University of
the South Pacific. Vol 99(1), pp 1-30.
Solofa, A. and Samuelu, J. 2008. “Status of coral reef in Samoa”. In: Wilkinson, C. (ed.):
Status of coral reefs of the world: 2004. Vol 2, pp 337-362. Australian Institute of Marine
Science, Townsville, Queensland, Australia.
SPC, 2007. Pacific ACP and OCT Regional Oceanic and Coastal fisheries development
programme. Annual workplan, SPC.
Stobuzki, I.C. 1998. Interspecific variation in sustained swimming ability of late pelagic stage
reef fish from two families (Pomacentridae and Chaetodonidae) [Electronic version]. Coral
Reefs. Vol 17, pp 111-119.
Vunisea, A., Friedman, K., Awira, R., Kronen, M. Pinca, S. Chapman, L., Magron, F. Sauni,
S., Pakoa, K. and Lasi, F. 2008. Samoa Country Report: Profiles and Results from survey
work at Manono-uta, Salelavalu, Vailoa and Vailoa. Secretariat of the Pacific Community.
Wass, R.C., 1984. An annotated checklist of the fishes of Samoa [Electronic version]. NOAA
Technical Report SSRT. Vol 781, pp 43.
Watson, R.A. and Quinn, T.J. 1997. Performance of transect and point count underwater
visual census methods [Electronic version]. Ecological Modelling. Vol 104, pp 103-112.
Zann, L.P. 1994. The status of coral reefs in South Western Pacific Islands [Electronic
version]. Marine Pollution Bulletin Vol. 29, no. 1-3, pp 52-61.
Zann, L.P. 1992. The inshore resources of Upolu, Western Samoa: Coastal Inventory and
fisheries database. Unpubl, Report 5. SAM/89/002.
Maria Sapatu
UNU Fisheries Training Programme Page 24
Zann and Sua, 1991. Effects of cyclones of Ofa on the fisheries and coral reefs of Upolu,
Western Samoa in 1990. Government of Western Samoa. Unpubl, Field Report 2.
FAO/UNDP SAM/89/002.
10. APPENDICES
10.1 List of Tables
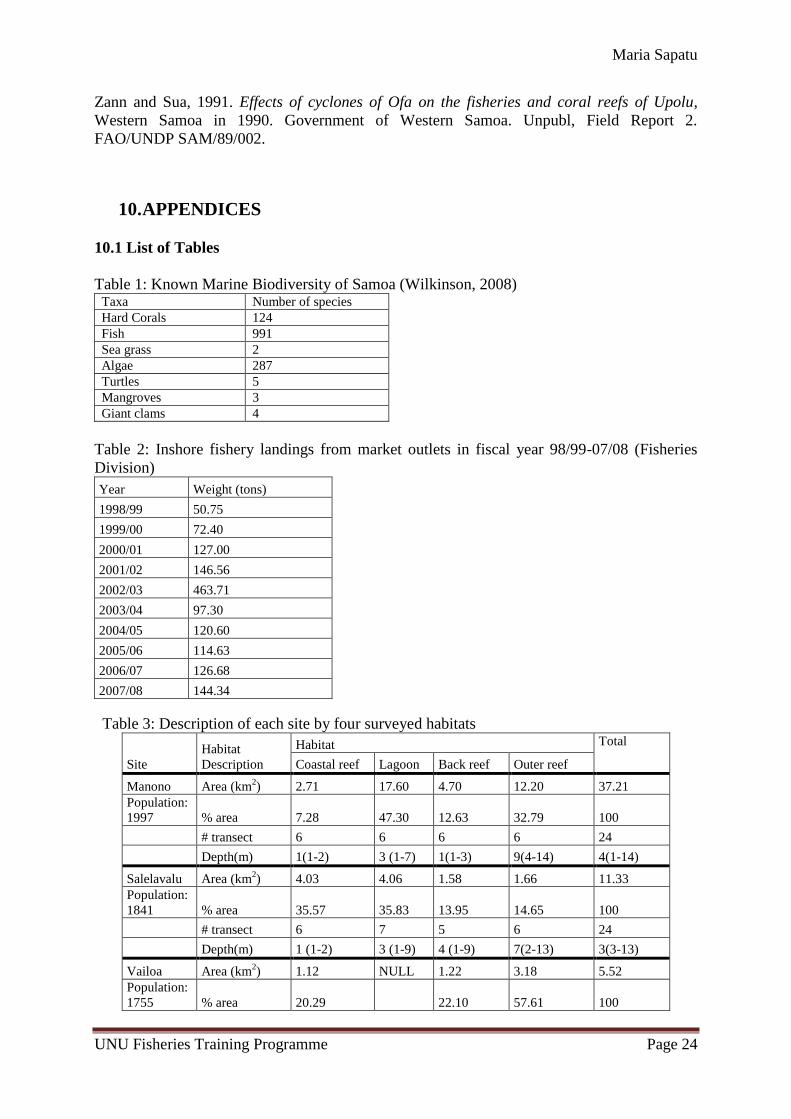
Table 1: Known Marine Biodiversity of Samoa (Wilkinson, 2008) Taxa Number of species
Hard Corals 124
Fish 991
Sea grass 2
Algae 287
Turtles 5
Mangroves 3
Giant clams 4
Table 2: Inshore fishery landings from market outlets in fiscal year 98/99-07/08 (Fisheries
Division)
Year Weight (tons)
1998/99 50.75
1999/00 72.40
2000/01 127.00
2001/02 146.56
2002/03 463.71
2003/04 97.30
2004/05 120.60
2005/06 114.63
2006/07 126.68
2007/08 144.34
Table 3: Description of each site by four surveyed habitats
Site
Habitat
Description
Habitat Total
Coastal reef Lagoon Back reef Outer reef
Manono Area (km2) 2.71 17.60 4.70 12.20 37.21
Population:
1997 % area 7.28 47.30 12.63 32.79 100
# transect 6 6 6 6 24
Depth(m) 1(1-2) 3 (1-7) 1(1-3) 9(4-14) 4(1-14)
Salelavalu Area (km2) 4.03 4.06 1.58 1.66 11.33
Population:
1841 % area 35.57 35.83 13.95 14.65 100
# transect 6 7 5 6 24
Depth(m) 1 (1-2) 3 (1-9) 4 (1-9) 7(2-13) 3(3-13)
Vailoa Area (km2) 1.12 NULL 1.22 3.18 5.52
Population:
1755 % area 20.29 22.10 57.61 100
Maria Sapatu
UNU Fisheries Training Programme Page 25
# transect 10 6 12 28
Depth(m) 1(1-2) 2(1-2) 9(2-15) 6(1-15)
Vaisala Area (km2) NULL NULL 1.71 1.57 3.28
Population:
1501 % area 52.13 47.87 100
# transect 17 8 25
Depth(m) 2(1-4) 7(4-12) 3(1-12)
Table 4:Number of Finfish Families, Genera, Species recorded from D-UVC surveys of each
site.
Families Genera Species # Fish
Manono uta 16 43 122 10,844
Salelavalu 19 46 120 8,715
Vailoa 22 52 140 12,322
Vaisala 22 46 114 10,027
Table 5: Mean abundance and biomass density estimates (per 500m2), standard deviation and
coefficient of variance (CV) for each habitat among the four study sites.
Site Description
Habitat
Coastal Lagoon Back reef Outer reef
Manono Biomass (W(kg)/transect) 27±26 55±88 95±11 217±62
Abundance (No/transect) 329±167 773±841 949±697 1402±221
CV (W) 0.97 1.59 1.14 0.29
CV (NO) 0.51 1.09 0.73 0.16
Salelavalu Biomass (W(kg)/transect) 10±5 84±41 75±24 169±70
Abundance (No/transect) 224±91 806±168 708±159 977±419
CV(W) 0.53 0.49 0.32 0.41
CV (NO) 0.41 0.21 0.23 0.43
Vailoa Biomass (W(kg)/transect) 22±16 NULL 45±18 207±114
Abundance (No/transect) 38±295 594±175 1153±486
CV(W) 0.75 0.40 0.55
CV (NO) 0.77 0.29 0.42
Vaisala Biomass (W(kg)/transect) NULL NULL 68±64 138±105
Abundance (No/transect) 782±463 771±467
CV(W) 0.95 0.76
CV (NO) 0.59 0.61
Table 6: ANOVA test of biomass in habitats within each site (numbering in differences
applies to significance between habitats e.g. 1-4 between coastal reef and outer reef) Site P Value Differences
1. Manono Uta 1.99 x 10⁻³
1-4(p=1.5x10⁻³
)
2-4(p=14.9x10⁻³
)
2. Salelavalu 3.58 x 10⁻⁹
1-2 (p=1 x10⁻⁶
)
1-3(p=2.8x10⁻⁶
)
1-4(p=0.0000000)
2-4(p=0.03)
3. Vailoa 2.16 x 10⁻⁶
1-4 (p=1.3 x10⁻⁶
)
Maria Sapatu
UNU Fisheries Training Programme Page 26
3-4(p=7.8 x10⁻³
)
4. Vaisala 0.09
Table 7: ANOVA test of biomass in habitats between sites Habitat P value
1. Coastal reef 0.60
2. Lagoon 0.04
3. Back reef 0.75
4. Outer reef 0.17
Table 8: Density biomass (by transect) of habitats by sites which are raised to total biomass
and their total catches Sites Description Coastal
reef
Lagoon Back reef Outer reef Total Biomass
(tons)
Total
Catches
(tons)
Manono
uta
Bdensity(kg/tr) 27±26 55±88 95±11 217±62
8289±705 285
Area (km2)
2.71 17.60 4.70 12.20
Rbiomass (kg) 146,014.8 1,948,672.0 896,196.0 5,298,216.0
TBiomass (tons)
146±141
1949±3098 896±103
5298±1513
Salelavalu Bdensity(kg/tr) 10±5 84±41 75±24 169±70
1557±81 153
Area (km2)
4.03 4.06 1.58 1.66
Rbiomass (kg) 76,570.0 681,998.8 237,726.8 560,914.0
TBiomass (tons) 77±40 682±333 238±76 561±232
Vailoa Bdensity(kg/tr) 22±16 45±18 207±114
1471±105 136
Area (km2)
1.12 1.22 3.18
Rbiomass (kg) 48,070.4 109,263.2 1,313,912.4
TBiomass (tons)
48±36 109±44
1314±725
Vaisala Bdensity(kg/tr) 68±64 138±105
664±64 102
Area (km2)
1.71 1.57
Rbiomass (kg) 231,534.0 431,969.8
TBiomass (tons) 232±219 432±330
Note: Bdensity=Biomass Density, Rbiomass=Raised biomass, Tbiomass=Total biomass
Table 9: Catches by biomass by Fish families in Manono Uta
Family
Total Biomass
(kg)
Catches
(kg) Y/B M Z (F + M)
E (F/Z)
Acanthuridae 3,153,160.4 62,911.4 0.020 1.202 1.222 0.016
Scaridae 1,925,060.2 48,612.1 0.025 1.338 1.363 0.019
Lutjanidae 1,011,938.6 20,075.9 0.020 0.695 0.714 0.028
Lethrinidae 246,938.2 40,322.0 0.163 0.829 0.992 0.165
Siganidae 224,611.4 15,362.1 0.068 0.692 0.760 0.090
Maria Sapatu
UNU Fisheries Training Programme Page 27
Mullidae 207,406.8 14,935.5 0.072 0.596 0.668 0.108
Balistidae 138,308.6 1,594.6 0.012 0.935 0.947 0.012
Holocentridae 78,175.8 17,676.1 0.226 0.549 0.776 0.292
Labridae 75,271.4 4,598.9 0.061 0.612 0.673 0.091
Serranidae 60,467.2 9,574.8 0.158 1.153 1.311 0.121
Total 7,121,338.6 235,663.3 0.033 8.602 8.635 0.004
Table 10: Catches by biomass by Fish families in Salelavalu Family Total Biomass
(kg) Catches (kg)
Y/B M Z (F + M) E (F/Z)
Acanthuridae 484,858.6 32,356.8 0.067 1.202 1.269 0.053
Scaridae 480,017.6 23,351.0 0.049 1.338 1.387 0.035
Lutjanidae 151,929.2 5,945.9 0.039 0.695 0.734 0.053
Mullidae 95,003.8 4,515.1 0.048 0.596 0.644 0.074
Lethrinidae 64,568.0 22,691.4 0.351 0.829 1.180 0.298
Balistidae 37,845.0 929.8 0.025 0.935 0.960 0.026
Holocentridae 37,538.6 14,466.6 0.385 0.549 0.935 0.412
Labridae 35,876.6 1,037.9 0.029 0.612 0.641 0.045
Siganidae 18,410.2 9,560.9 0.519 0.692 1.211 0.429
Serranidae 11,725.2 7,484.7 0.638 1.153 1.791 0.356
Carangidae 5,940.8 2,927.5 0.493 1.523 2.016 0.244
Kyphosidae 763.6 1,238.4 1.622 1.677 3.299 0.492
Total 1,424,477.2 126,506.0 0.089 11.802 11.890 0.007
Table 11: Catches by biomass by Fish families in Vailoa
Family
Total Biomass
(kg)
Catches
(kg) Y/B M Z (F + M) E (F/Z)
Acanthuridae 730,677.2 27,973.2 0.038 1.202 1.240 0.031
Scaridae 262,690.0 23,869.0 0.091 1.338 1.429 0.064
Lutjanidae 61,692.0 9,014.0 0.146 0.695 0.841 0.174
Balistidae 60,032.4 1,368.3 0.023 0.935 0.958 0.024
Lethrinidae 51,876.8 18,549.6 0.358 0.829 1.187 0.301
Holocentridae 13,299.2 8,417.0 0.633 0.549 1.182 0.535
Serranidae 13,100.8 8,728.4 0.666 1.153 1.819 0.366
Siganidae 11,593.6 10,522.9 0.908 0.692 1.599 0.568
Kyphosidae 10,875.6 937.0 0.086 1.677 1.763 0.049
Labridae 7,236.8 5,770.6 0.797 0.612 1.410 0.566
Carangidae 4,613.2 2,942.1 0.638 1.523 2.161 0.295
Mugilidae 4,054.4 5,092.1 1.256 0.808 2.064 0.608
Total 1,231,742.0 123,184.1 0.100 12.013 12.113 0.008
Table 12: Catches by biomass by Fish families in Vaisala
Family
Total Biomass
(kg)
Catches
(kg) Y/B M Z (F + M) E (F/Z)
Acanthuridae 300,854.0 28,177.4 0.094 1.202 1.296 0.072
Scaridae 184,904.8 25,365.4 0.137 1.338 1.475 0.093
Balistidae 64,453.2 1,260.9 0.020 0.935 0.955 0.020
Lutjanidae 36,109.4 4,246.0 0.118 0.695 0.812 0.145
Holocentridae 12,574.6 10,430.3 0.829 0.549 1.379 0.602
Mugilidae 8,344.8 2,282.0 0.273 0.808 1.082 0.253
Lethrinidae 7,579.8 11,874.2 1.567 0.829 2.396 0.654
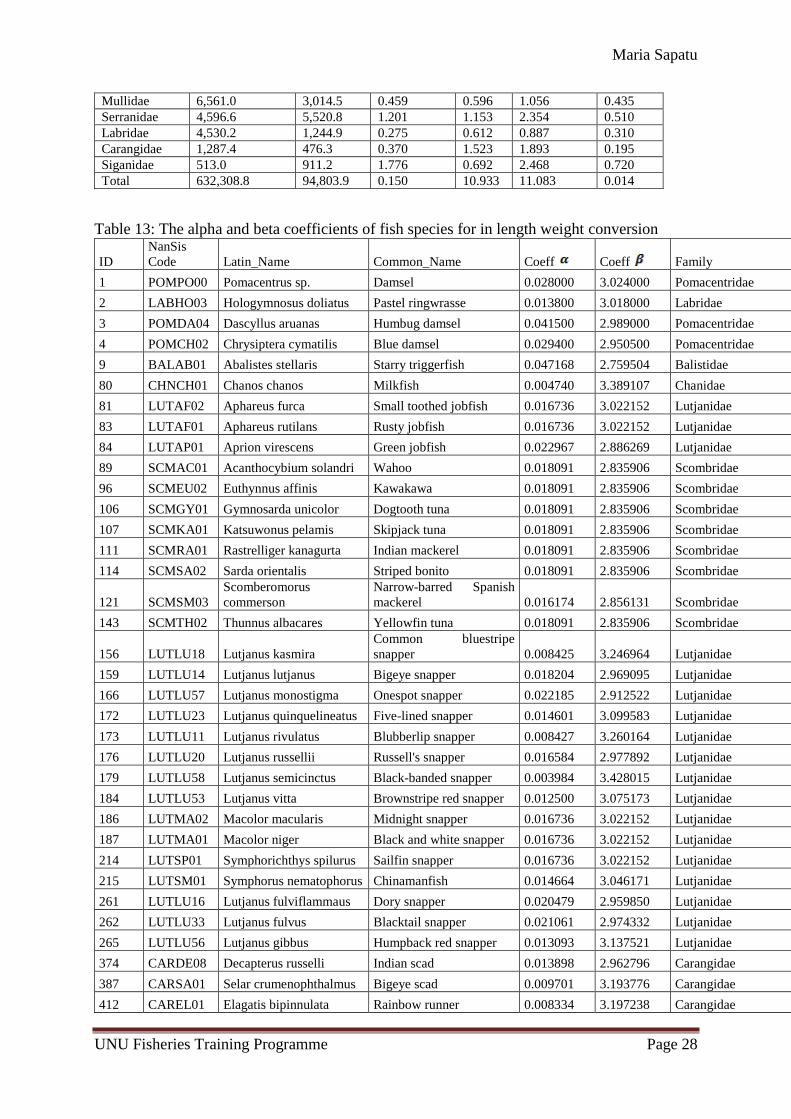
Maria Sapatu
UNU Fisheries Training Programme Page 28
Mullidae 6,561.0 3,014.5 0.459 0.596 1.056 0.435
Serranidae 4,596.6 5,520.8 1.201 1.153 2.354 0.510
Labridae 4,530.2 1,244.9 0.275 0.612 0.887 0.310
Carangidae 1,287.4 476.3 0.370 1.523 1.893 0.195
Siganidae 513.0 911.2 1.776 0.692 2.468 0.720
Total 632,308.8 94,803.9 0.150 10.933 11.083 0.014
Table 13: The alpha and beta coefficients of fish species for in length weight conversion
ID
NanSis
Code Latin_Name Common_Name Coeff Coeff Family
1 POMPO00 Pomacentrus sp. Damsel 0.028000 3.024000 Pomacentridae
2 LABHO03 Hologymnosus doliatus Pastel ringwrasse 0.013800 3.018000 Labridae
3 POMDA04 Dascyllus aruanas Humbug damsel 0.041500 2.989000 Pomacentridae
4 POMCH02 Chrysiptera cymatilis Blue damsel 0.029400 2.950500 Pomacentridae
9 BALAB01 Abalistes stellaris Starry triggerfish 0.047168 2.759504 Balistidae
80 CHNCH01 Chanos chanos Milkfish 0.004740 3.389107 Chanidae
81 LUTAF02 Aphareus furca Small toothed jobfish 0.016736 3.022152 Lutjanidae
83 LUTAF01 Aphareus rutilans Rusty jobfish 0.016736 3.022152 Lutjanidae
84 LUTAP01 Aprion virescens Green jobfish 0.022967 2.886269 Lutjanidae
89 SCMAC01 Acanthocybium solandri Wahoo 0.018091 2.835906 Scombridae
96 SCMEU02 Euthynnus affinis Kawakawa 0.018091 2.835906 Scombridae
106 SCMGY01 Gymnosarda unicolor Dogtooth tuna 0.018091 2.835906 Scombridae
107 SCMKA01 Katsuwonus pelamis Skipjack tuna 0.018091 2.835906 Scombridae
111 SCMRA01 Rastrelliger kanagurta Indian mackerel 0.018091 2.835906 Scombridae
114 SCMSA02 Sarda orientalis Striped bonito 0.018091 2.835906 Scombridae
121 SCMSM03
Scomberomorus
commerson
Narrow-barred Spanish
mackerel 0.016174 2.856131 Scombridae
143 SCMTH02 Thunnus albacares Yellowfin tuna 0.018091 2.835906 Scombridae
156 LUTLU18 Lutjanus kasmira
Common bluestripe
snapper 0.008425 3.246964 Lutjanidae
159 LUTLU14 Lutjanus lutjanus Bigeye snapper 0.018204 2.969095 Lutjanidae
166 LUTLU57 Lutjanus monostigma Onespot snapper 0.022185 2.912522 Lutjanidae
172 LUTLU23 Lutjanus quinquelineatus Five-lined snapper 0.014601 3.099583 Lutjanidae
173 LUTLU11 Lutjanus rivulatus Blubberlip snapper 0.008427 3.260164 Lutjanidae
176 LUTLU20 Lutjanus russellii Russell's snapper 0.016584 2.977892 Lutjanidae
179 LUTLU58 Lutjanus semicinctus Black-banded snapper 0.003984 3.428015 Lutjanidae
184 LUTLU53 Lutjanus vitta Brownstripe red snapper 0.012500 3.075173 Lutjanidae
186 LUTMA02 Macolor macularis Midnight snapper 0.016736 3.022152 Lutjanidae
187 LUTMA01 Macolor niger Black and white snapper 0.016736 3.022152 Lutjanidae
214 LUTSP01 Symphorichthys spilurus Sailfin snapper 0.016736 3.022152 Lutjanidae
215 LUTSM01 Symphorus nematophorus Chinamanfish 0.014664 3.046171 Lutjanidae
261 LUTLU16 Lutjanus fulviflammaus Dory snapper 0.020479 2.959850 Lutjanidae
262 LUTLU33 Lutjanus fulvus Blacktail snapper 0.021061 2.974332 Lutjanidae
265 LUTLU56 Lutjanus gibbus Humpback red snapper 0.013093 3.137521 Lutjanidae
374 CARDE08 Decapterus russelli Indian scad 0.013898 2.962796 Carangidae
387 CARSA01 Selar crumenophthalmus Bigeye scad 0.009701 3.193776 Carangidae
412 CAREL01 Elagatis bipinnulata Rainbow runner 0.008334 3.197238 Carangidae
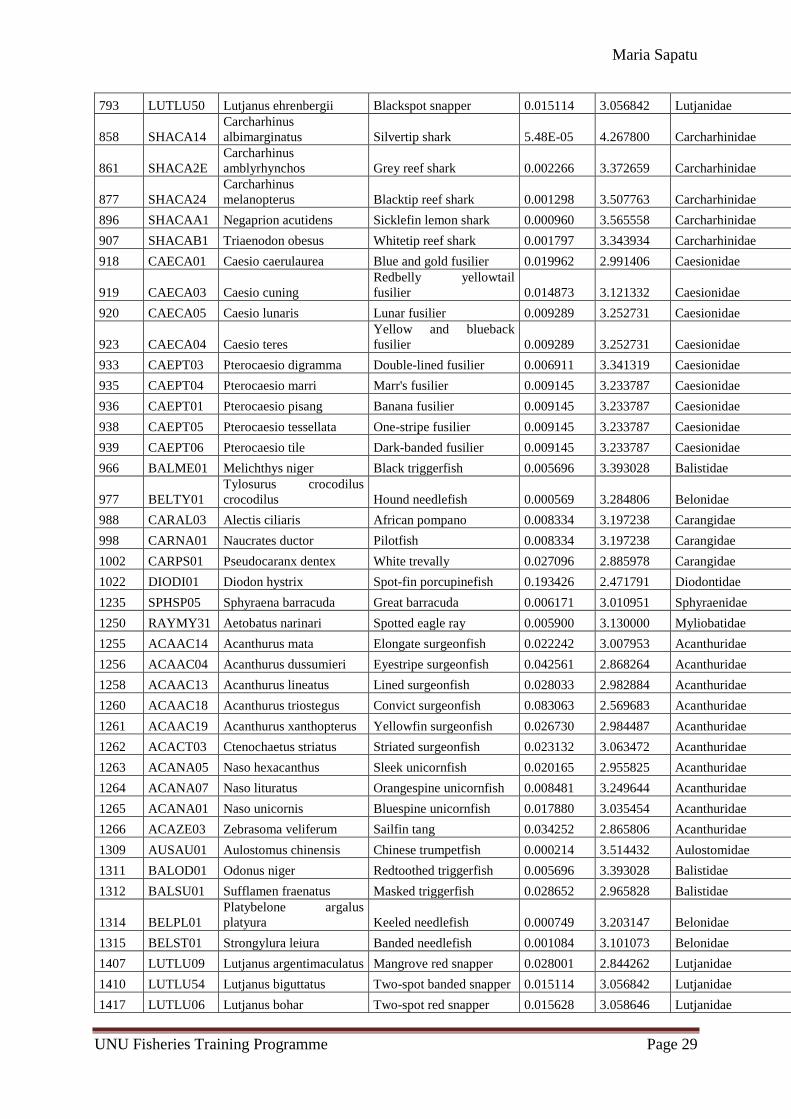
Maria Sapatu
UNU Fisheries Training Programme Page 29
793 LUTLU50 Lutjanus ehrenbergii Blackspot snapper 0.015114 3.056842 Lutjanidae
858 SHACA14
Carcharhinus
albimarginatus Silvertip shark 5.48E-05 4.267800 Carcharhinidae
861 SHACA2E
Carcharhinus
amblyrhynchos Grey reef shark 0.002266 3.372659 Carcharhinidae
877 SHACA24
Carcharhinus
melanopterus Blacktip reef shark 0.001298 3.507763 Carcharhinidae
896 SHACAA1 Negaprion acutidens Sicklefin lemon shark 0.000960 3.565558 Carcharhinidae
907 SHACAB1 Triaenodon obesus Whitetip reef shark 0.001797 3.343934 Carcharhinidae
918 CAECA01 Caesio caerulaurea Blue and gold fusilier 0.019962 2.991406 Caesionidae
919 CAECA03 Caesio cuning
Redbelly yellowtail
fusilier 0.014873 3.121332 Caesionidae
920 CAECA05 Caesio lunaris Lunar fusilier 0.009289 3.252731 Caesionidae
923 CAECA04 Caesio teres
Yellow and blueback
fusilier 0.009289 3.252731 Caesionidae
933 CAEPT03 Pterocaesio digramma Double-lined fusilier 0.006911 3.341319 Caesionidae
935 CAEPT04 Pterocaesio marri Marr's fusilier 0.009145 3.233787 Caesionidae
936 CAEPT01 Pterocaesio pisang Banana fusilier 0.009145 3.233787 Caesionidae
938 CAEPT05 Pterocaesio tessellata One-stripe fusilier 0.009145 3.233787 Caesionidae
939 CAEPT06 Pterocaesio tile Dark-banded fusilier 0.009145 3.233787 Caesionidae
966 BALME01 Melichthys niger Black triggerfish 0.005696 3.393028 Balistidae
977 BELTY01
Tylosurus crocodilus
crocodilus Hound needlefish 0.000569 3.284806 Belonidae
988 CARAL03 Alectis ciliaris African pompano 0.008334 3.197238 Carangidae
998 CARNA01 Naucrates ductor Pilotfish 0.008334 3.197238 Carangidae
1002 CARPS01 Pseudocaranx dentex White trevally 0.027096 2.885978 Carangidae
1022 DIODI01 Diodon hystrix Spot-fin porcupinefish 0.193426 2.471791 Diodontidae
1235 SPHSP05 Sphyraena barracuda Great barracuda 0.006171 3.010951 Sphyraenidae
1250 RAYMY31 Aetobatus narinari Spotted eagle ray 0.005900 3.130000 Myliobatidae
1255 ACAAC14 Acanthurus mata Elongate surgeonfish 0.022242 3.007953 Acanthuridae
1256 ACAAC04 Acanthurus dussumieri Eyestripe surgeonfish 0.042561 2.868264 Acanthuridae
1258 ACAAC13 Acanthurus lineatus Lined surgeonfish 0.028033 2.982884 Acanthuridae
1260 ACAAC18 Acanthurus triostegus Convict surgeonfish 0.083063 2.569683 Acanthuridae
1261 ACAAC19 Acanthurus xanthopterus Yellowfin surgeonfish 0.026730 2.984487 Acanthuridae
1262 ACACT03 Ctenochaetus striatus Striated surgeonfish 0.023132 3.063472 Acanthuridae
1263 ACANA05 Naso hexacanthus Sleek unicornfish 0.020165 2.955825 Acanthuridae
1264 ACANA07 Naso lituratus Orangespine unicornfish 0.008481 3.249644 Acanthuridae
1265 ACANA01 Naso unicornis Bluespine unicornfish 0.017880 3.035454 Acanthuridae
1266 ACAZE03 Zebrasoma veliferum Sailfin tang 0.034252 2.865806 Acanthuridae
1309 AUSAU01 Aulostomus chinensis Chinese trumpetfish 0.000214 3.514432 Aulostomidae
1311 BALOD01 Odonus niger Redtoothed triggerfish 0.005696 3.393028 Balistidae
1312 BALSU01 Sufflamen fraenatus Masked triggerfish 0.028652 2.965828 Balistidae
1314 BELPL01
Platybelone argalus
platyura Keeled needlefish 0.000749 3.203147 Belonidae
1315 BELST01 Strongylura leiura Banded needlefish 0.001084 3.101073 Belonidae
1407 LUTLU09 Lutjanus argentimaculatus Mangrove red snapper 0.028001 2.844262 Lutjanidae
1410 LUTLU54 Lutjanus biguttatus Two-spot banded snapper 0.015114 3.056842 Lutjanidae
1417 LUTLU06 Lutjanus bohar Two-spot red snapper 0.015628 3.058646 Lutjanidae
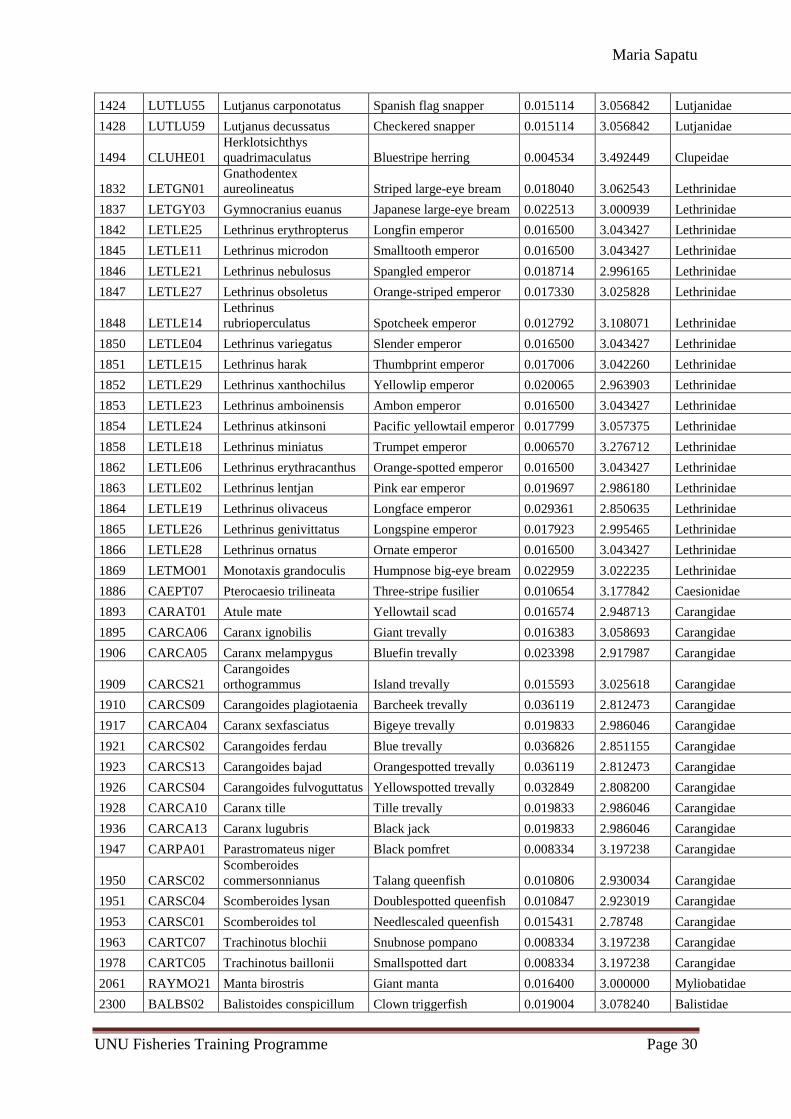
Maria Sapatu
UNU Fisheries Training Programme Page 30
1424 LUTLU55 Lutjanus carponotatus Spanish flag snapper 0.015114 3.056842 Lutjanidae
1428 LUTLU59 Lutjanus decussatus Checkered snapper 0.015114 3.056842 Lutjanidae
1494 CLUHE01
Herklotsichthys
quadrimaculatus Bluestripe herring 0.004534 3.492449 Clupeidae
1832 LETGN01
Gnathodentex
aureolineatus Striped large-eye bream 0.018040 3.062543 Lethrinidae
1837 LETGY03 Gymnocranius euanus Japanese large-eye bream 0.022513 3.000939 Lethrinidae
1842 LETLE25 Lethrinus erythropterus Longfin emperor 0.016500 3.043427 Lethrinidae
1845 LETLE11 Lethrinus microdon Smalltooth emperor 0.016500 3.043427 Lethrinidae
1846 LETLE21 Lethrinus nebulosus Spangled emperor 0.018714 2.996165 Lethrinidae
1847 LETLE27 Lethrinus obsoletus Orange-striped emperor 0.017330 3.025828 Lethrinidae
1848 LETLE14
Lethrinus
rubrioperculatus Spotcheek emperor 0.012792 3.108071 Lethrinidae
1850 LETLE04 Lethrinus variegatus Slender emperor 0.016500 3.043427 Lethrinidae
1851 LETLE15 Lethrinus harak Thumbprint emperor 0.017006 3.042260 Lethrinidae
1852 LETLE29 Lethrinus xanthochilus Yellowlip emperor 0.020065 2.963903 Lethrinidae
1853 LETLE23 Lethrinus amboinensis Ambon emperor 0.016500 3.043427 Lethrinidae
1854 LETLE24 Lethrinus atkinsoni Pacific yellowtail emperor 0.017799 3.057375 Lethrinidae
1858 LETLE18 Lethrinus miniatus Trumpet emperor 0.006570 3.276712 Lethrinidae
1862 LETLE06 Lethrinus erythracanthus Orange-spotted emperor 0.016500 3.043427 Lethrinidae
1863 LETLE02 Lethrinus lentjan Pink ear emperor 0.019697 2.986180 Lethrinidae
1864 LETLE19 Lethrinus olivaceus Longface emperor 0.029361 2.850635 Lethrinidae
1865 LETLE26 Lethrinus genivittatus Longspine emperor 0.017923 2.995465 Lethrinidae
1866 LETLE28 Lethrinus ornatus Ornate emperor 0.016500 3.043427 Lethrinidae
1869 LETMO01 Monotaxis grandoculis Humpnose big-eye bream 0.022959 3.022235 Lethrinidae
1886 CAEPT07 Pterocaesio trilineata Three-stripe fusilier 0.010654 3.177842 Caesionidae
1893 CARAT01 Atule mate Yellowtail scad 0.016574 2.948713 Carangidae
1895 CARCA06 Caranx ignobilis Giant trevally 0.016383 3.058693 Carangidae
1906 CARCA05 Caranx melampygus Bluefin trevally 0.023398 2.917987 Carangidae
1909 CARCS21
Carangoides
orthogrammus Island trevally 0.015593 3.025618 Carangidae
1910 CARCS09 Carangoides plagiotaenia Barcheek trevally 0.036119 2.812473 Carangidae
1917 CARCA04 Caranx sexfasciatus Bigeye trevally 0.019833 2.986046 Carangidae
1921 CARCS02 Carangoides ferdau Blue trevally 0.036826 2.851155 Carangidae
1923 CARCS13 Carangoides bajad Orangespotted trevally 0.036119 2.812473 Carangidae
1926 CARCS04 Carangoides fulvoguttatus Yellowspotted trevally 0.032849 2.808200 Carangidae
1928 CARCA10 Caranx tille Tille trevally 0.019833 2.986046 Carangidae
1936 CARCA13 Caranx lugubris Black jack 0.019833 2.986046 Carangidae
1947 CARPA01 Parastromateus niger Black pomfret 0.008334 3.197238 Carangidae
1950 CARSC02
Scomberoides
commersonnianus Talang queenfish 0.010806 2.930034 Carangidae
1951 CARSC04 Scomberoides lysan Doublespotted queenfish 0.010847 2.923019 Carangidae
1953 CARSC01 Scomberoides tol Needlescaled queenfish 0.015431 2.78748 Carangidae
1963 CARTC07 Trachinotus blochii Snubnose pompano 0.008334 3.197238 Carangidae
1978 CARTC05 Trachinotus baillonii Smallspotted dart 0.008334 3.197238 Carangidae
2061 RAYMO21 Manta birostris Giant manta 0.016400 3.000000 Myliobatidae
2300 BALBS02 Balistoides conspicillum Clown triggerfish 0.019004 3.078240 Balistidae
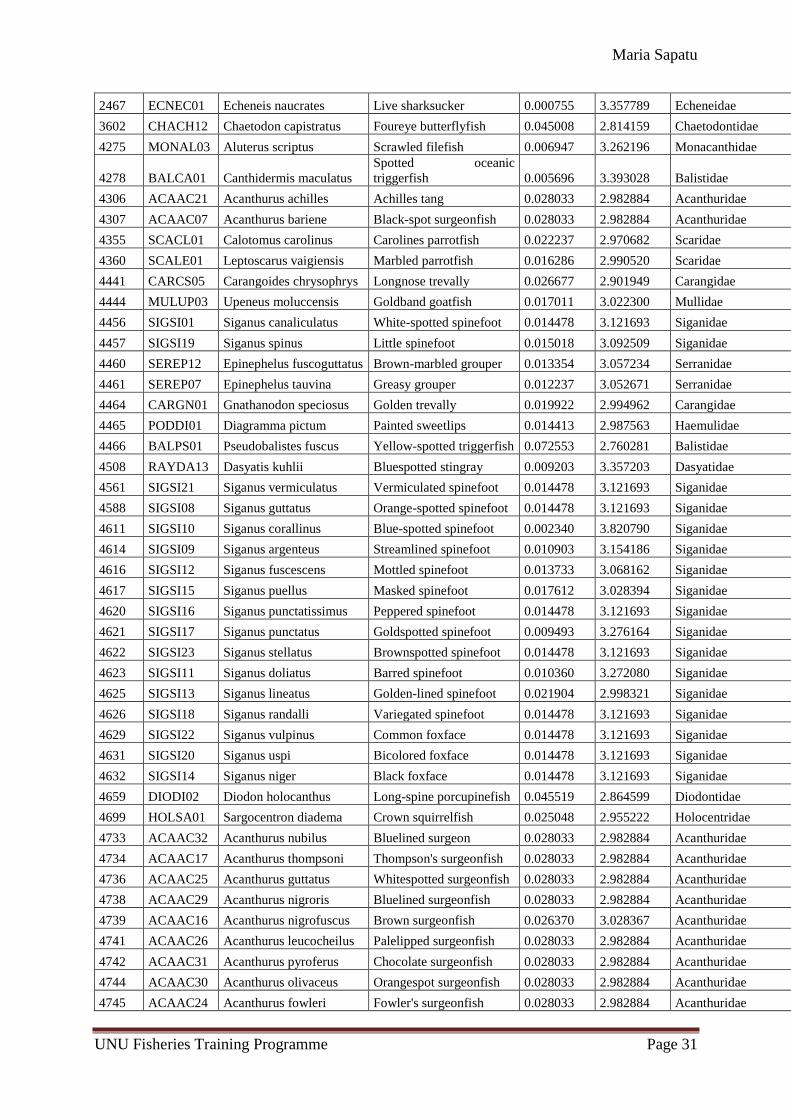
Maria Sapatu
UNU Fisheries Training Programme Page 31
2467 ECNEC01 Echeneis naucrates Live sharksucker 0.000755 3.357789 Echeneidae
3602 CHACH12 Chaetodon capistratus Foureye butterflyfish 0.045008 2.814159 Chaetodontidae
4275 MONAL03 Aluterus scriptus Scrawled filefish 0.006947 3.262196 Monacanthidae
4278 BALCA01 Canthidermis maculatus
Spotted oceanic
triggerfish 0.005696 3.393028 Balistidae
4306 ACAAC21 Acanthurus achilles Achilles tang 0.028033 2.982884 Acanthuridae
4307 ACAAC07 Acanthurus bariene Black-spot surgeonfish 0.028033 2.982884 Acanthuridae
4355 SCACL01 Calotomus carolinus Carolines parrotfish 0.022237 2.970682 Scaridae
4360 SCALE01 Leptoscarus vaigiensis Marbled parrotfish 0.016286 2.990520 Scaridae
4441 CARCS05 Carangoides chrysophrys Longnose trevally 0.026677 2.901949 Carangidae
4444 MULUP03 Upeneus moluccensis Goldband goatfish 0.017011 3.022300 Mullidae
4456 SIGSI01 Siganus canaliculatus White-spotted spinefoot 0.014478 3.121693 Siganidae
4457 SIGSI19 Siganus spinus Little spinefoot 0.015018 3.092509 Siganidae
4460 SEREP12 Epinephelus fuscoguttatus Brown-marbled grouper 0.013354 3.057234 Serranidae
4461 SEREP07 Epinephelus tauvina Greasy grouper 0.012237 3.052671 Serranidae
4464 CARGN01 Gnathanodon speciosus Golden trevally 0.019922 2.994962 Carangidae
4465 PODDI01 Diagramma pictum Painted sweetlips 0.014413 2.987563 Haemulidae
4466 BALPS01 Pseudobalistes fuscus Yellow-spotted triggerfish 0.072553 2.760281 Balistidae
4508 RAYDA13 Dasyatis kuhlii Bluespotted stingray 0.009203 3.357203 Dasyatidae
4561 SIGSI21 Siganus vermiculatus Vermiculated spinefoot 0.014478 3.121693 Siganidae
4588 SIGSI08 Siganus guttatus Orange-spotted spinefoot 0.014478 3.121693 Siganidae
4611 SIGSI10 Siganus corallinus Blue-spotted spinefoot 0.002340 3.820790 Siganidae
4614 SIGSI09 Siganus argenteus Streamlined spinefoot 0.010903 3.154186 Siganidae
4616 SIGSI12 Siganus fuscescens Mottled spinefoot 0.013733 3.068162 Siganidae
4617 SIGSI15 Siganus puellus Masked spinefoot 0.017612 3.028394 Siganidae
4620 SIGSI16 Siganus punctatissimus Peppered spinefoot 0.014478 3.121693 Siganidae
4621 SIGSI17 Siganus punctatus Goldspotted spinefoot 0.009493 3.276164 Siganidae
4622 SIGSI23 Siganus stellatus Brownspotted spinefoot 0.014478 3.121693 Siganidae
4623 SIGSI11 Siganus doliatus Barred spinefoot 0.010360 3.272080 Siganidae
4625 SIGSI13 Siganus lineatus Golden-lined spinefoot 0.021904 2.998321 Siganidae
4626 SIGSI18 Siganus randalli Variegated spinefoot 0.014478 3.121693 Siganidae
4629 SIGSI22 Siganus vulpinus Common foxface 0.014478 3.121693 Siganidae
4631 SIGSI20 Siganus uspi Bicolored foxface 0.014478 3.121693 Siganidae
4632 SIGSI14 Siganus niger Black foxface 0.014478 3.121693 Siganidae
4659 DIODI02 Diodon holocanthus Long-spine porcupinefish 0.045519 2.864599 Diodontidae
4699 HOLSA01 Sargocentron diadema Crown squirrelfish 0.025048 2.955222 Holocentridae
4733 ACAAC32 Acanthurus nubilus Bluelined surgeon 0.028033 2.982884 Acanthuridae
4734 ACAAC17 Acanthurus thompsoni Thompson's surgeonfish 0.028033 2.982884 Acanthuridae
4736 ACAAC25 Acanthurus guttatus Whitespotted surgeonfish 0.028033 2.982884 Acanthuridae
4738 ACAAC29 Acanthurus nigroris Bluelined surgeonfish 0.028033 2.982884 Acanthuridae
4739 ACAAC16 Acanthurus nigrofuscus Brown surgeonfish 0.026370 3.028367 Acanthuridae
4741 ACAAC26 Acanthurus leucocheilus Palelipped surgeonfish 0.028033 2.982884 Acanthuridae
4742 ACAAC31 Acanthurus pyroferus Chocolate surgeonfish 0.028033 2.982884 Acanthuridae
4744 ACAAC30 Acanthurus olivaceus Orangespot surgeonfish 0.028033 2.982884 Acanthuridae
4745 ACAAC24 Acanthurus fowleri Fowler's surgeonfish 0.028033 2.982884 Acanthuridae
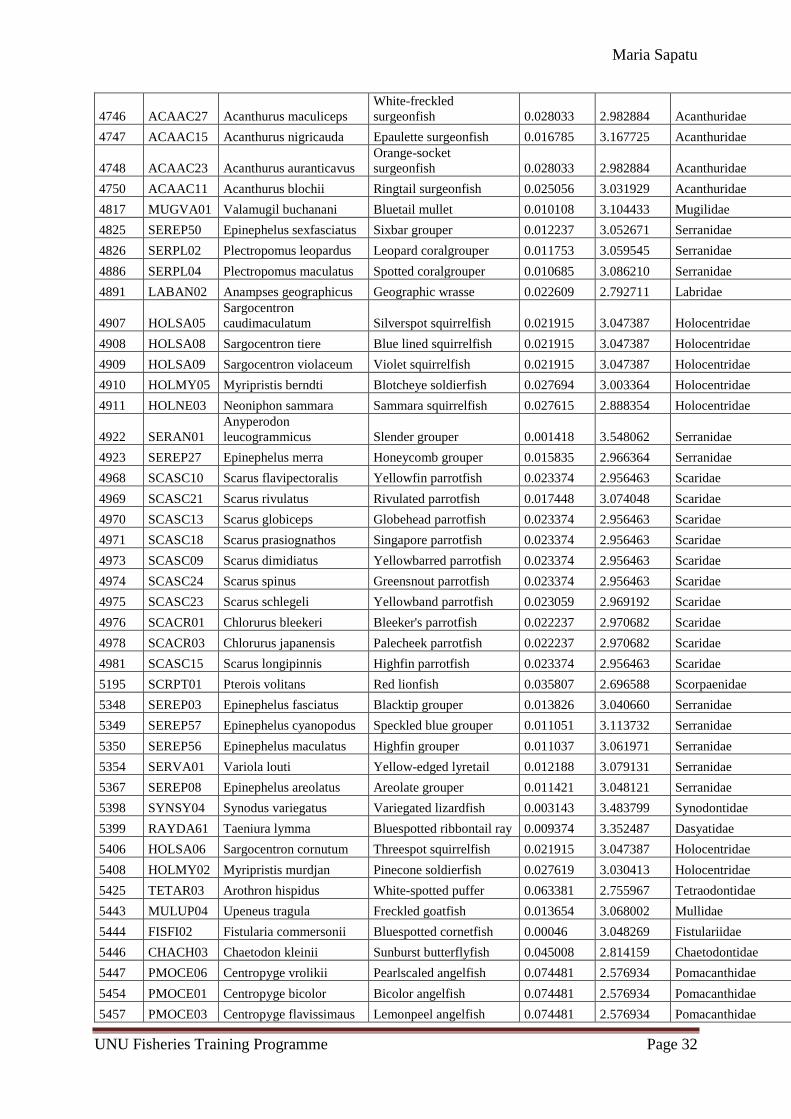
Maria Sapatu
UNU Fisheries Training Programme Page 32
4746 ACAAC27 Acanthurus maculiceps
White-freckled
surgeonfish 0.028033 2.982884 Acanthuridae
4747 ACAAC15 Acanthurus nigricauda Epaulette surgeonfish 0.016785 3.167725 Acanthuridae
4748 ACAAC23 Acanthurus auranticavus
Orange-socket
surgeonfish 0.028033 2.982884 Acanthuridae
4750 ACAAC11 Acanthurus blochii Ringtail surgeonfish 0.025056 3.031929 Acanthuridae
4817 MUGVA01 Valamugil buchanani Bluetail mullet 0.010108 3.104433 Mugilidae
4825 SEREP50 Epinephelus sexfasciatus Sixbar grouper 0.012237 3.052671 Serranidae
4826 SERPL02 Plectropomus leopardus Leopard coralgrouper 0.011753 3.059545 Serranidae
4886 SERPL04 Plectropomus maculatus Spotted coralgrouper 0.010685 3.086210 Serranidae
4891 LABAN02 Anampses geographicus Geographic wrasse 0.022609 2.792711 Labridae
4907 HOLSA05
Sargocentron
caudimaculatum Silverspot squirrelfish 0.021915 3.047387 Holocentridae
4908 HOLSA08 Sargocentron tiere Blue lined squirrelfish 0.021915 3.047387 Holocentridae
4909 HOLSA09 Sargocentron violaceum Violet squirrelfish 0.021915 3.047387 Holocentridae
4910 HOLMY05 Myripristis berndti Blotcheye soldierfish 0.027694 3.003364 Holocentridae
4911 HOLNE03 Neoniphon sammara Sammara squirrelfish 0.027615 2.888354 Holocentridae
4922 SERAN01
Anyperodon
leucogrammicus Slender grouper 0.001418 3.548062 Serranidae
4923 SEREP27 Epinephelus merra Honeycomb grouper 0.015835 2.966364 Serranidae
4968 SCASC10 Scarus flavipectoralis Yellowfin parrotfish 0.023374 2.956463 Scaridae
4969 SCASC21 Scarus rivulatus Rivulated parrotfish 0.017448 3.074048 Scaridae
4970 SCASC13 Scarus globiceps Globehead parrotfish 0.023374 2.956463 Scaridae
4971 SCASC18 Scarus prasiognathos Singapore parrotfish 0.023374 2.956463 Scaridae
4973 SCASC09 Scarus dimidiatus Yellowbarred parrotfish 0.023374 2.956463 Scaridae
4974 SCASC24 Scarus spinus Greensnout parrotfish 0.023374 2.956463 Scaridae
4975 SCASC23 Scarus schlegeli Yellowband parrotfish 0.023059 2.969192 Scaridae
4976 SCACR01 Chlorurus bleekeri Bleeker's parrotfish 0.022237 2.970682 Scaridae
4978 SCACR03 Chlorurus japanensis Palecheek parrotfish 0.022237 2.970682 Scaridae
4981 SCASC15 Scarus longipinnis Highfin parrotfish 0.023374 2.956463 Scaridae
5195 SCRPT01 Pterois volitans Red lionfish 0.035807 2.696588 Scorpaenidae
5348 SEREP03 Epinephelus fasciatus Blacktip grouper 0.013826 3.040660 Serranidae
5349 SEREP57 Epinephelus cyanopodus Speckled blue grouper 0.011051 3.113732 Serranidae
5350 SEREP56 Epinephelus maculatus Highfin grouper 0.011037 3.061971 Serranidae
5354 SERVA01 Variola louti Yellow-edged lyretail 0.012188 3.079131 Serranidae
5367 SEREP08 Epinephelus areolatus Areolate grouper 0.011421 3.048121 Serranidae
5398 SYNSY04 Synodus variegatus Variegated lizardfish 0.003143 3.483799 Synodontidae
5399 RAYDA61 Taeniura lymma Bluespotted ribbontail ray 0.009374 3.352487 Dasyatidae
5406 HOLSA06 Sargocentron cornutum Threespot squirrelfish 0.021915 3.047387 Holocentridae
5408 HOLMY02 Myripristis murdjan Pinecone soldierfish 0.027619 3.030413 Holocentridae
5425 TETAR03 Arothron hispidus White-spotted puffer 0.063381 2.755967 Tetraodontidae
5443 MULUP04 Upeneus tragula Freckled goatfish 0.013654 3.068002 Mullidae
5444 FISFI02 Fistularia commersonii Bluespotted cornetfish 0.00046 3.048269 Fistulariidae
5446 CHACH03 Chaetodon kleinii Sunburst butterflyfish 0.045008 2.814159 Chaetodontidae
5447 PMOCE06 Centropyge vrolikii Pearlscaled angelfish 0.074481 2.576934 Pomacanthidae
5454 PMOCE01 Centropyge bicolor Bicolor angelfish 0.074481 2.576934 Pomacanthidae
5457 PMOCE03 Centropyge flavissimaus Lemonpeel angelfish 0.074481 2.576934 Pomacanthidae

Maria Sapatu
UNU Fisheries Training Programme Page 33
5458 PMOCE02 Centropyge bispinosaus Twospined angelfish 0.091950 2.457987 Pomacanthidae
5472 CHACH48 Chaetodon oxycephalus Spot-nape butterflyfish 0.045008 2.814159 Chaetodontidae
5483 CHACH02 Chelmon rostratus Copperband butterflyfish 0.042051 2.847332 Chaetodontidae
5498 LABBO08 Bodianus axillaris Axilspot hogfish 0.010815 3.173052 Labridae
5501 LABBO10 Bodianus mesothorax Splitlevel hogfish 0.010815 3.173052 Labridae
5502 LABCO03 Choerodon anchorago Orange-dotted tuskfish 0.015111 3.122482 Labridae
5537 SCABO01 Bolbometopon muricatum
Green humphead
parrotfish 0.022237 2.970682 Scaridae
5538 SCACE01 Cetoscarus bicolor Bicolour parrotfish 0.022237 2.970682 Scaridae
5539 SCAHI01 Hipposcarus longiceps
Pacific longnose
parrotfish 0.022237 2.970682 Scaridae
5540 SCASC07 Scarus altipinnis Filament-finned parrotfish 0.018396 3.029321 Scaridae
5541 SCASC25 Scarus xanthopleura Red parrotfish 0.023374 2.956463 Scaridae
5542 SCACR06 Chlorurus bowersi Bower's parrotfish 0.022237 2.970682 Scaridae
5543 SCASC08 Scarus chameleon Chameleon parrotfish 0.023374 2.956463 Scaridae
5544 SCASC26 Scarus festivus Festive parrotfish 0.023374 2.956463 Scaridae
5545 SCASC11 Scarus forsteni Forsten's parrotfish 0.023374 2.956463 Scaridae
5546 SCASC12 Scarus frenatus Bridled parrotfish 0.023374 2.956463 Scaridae
5547 SCACR02 Chlorurus frontalis Tan-faced parrotfish 0.022237 2.970682 Scaridae
5548 SCASC01 Scarus ghobban Blue-barred parrotfish 0.016505 3.041159 Scaridae
5550 SCASC16 Scarus niger Dusky parrotfish 0.013346 3.159957 Scaridae
5551 SCASC17 Scarus oviceps Darkcapped parrotfish 0.023374 2.956463 Scaridae
5553 SCASC19 Scarus psittacus Common parrotfish 0.010451 3.318709 Scaridae
5554 SCASC20 Scarus quoyi Quoy's parrotfish 0.023374 2.956463 Scaridae
5555 SCASC22 Scarus rubroviolaceus Ember parrotfish 0.023374 2.956463 Scaridae
5556 SCACR05 Chlorurus sordidus Daisy parrotfish 0.024311 2.969306 Scaridae
5557 CHACH04 Chaetodon auriga Threadfin butterflyfish 0.040397 2.829431 Chaetodontidae
5558 CHACH26 Chaetodon baronessa
Eastern triangular
butterflyfish 0.045008 2.814159 Chaetodontidae
5559 CHACH27 Chaetodon bennetti Bluelashed butterflyfish 0.038395 2.885079 Chaetodontidae
5561 CHACH28 Chaetodon citrinellus Speckled butterflyfish 0.035299 2.834138 Chaetodontidae
5562 CHACH29 Chaetodon ephippium Saddle butterflyfish 0.022485 3.060922 Chaetodontidae
5564 CHACH31 Chaetodon lineolatus Lined butterflyfish 0.069265 2.621507 Chaetodontidae
5565 CHACH32 Chaetodon lunula Raccoon butterflyfish 0.045008 2.814159 Chaetodontidae
5566 CHACH34 Chaetodon melannotus Blackback butterflyfish 0.026693 3.0486 Chaetodontidae
5567 CHACH35 Chaetodon mertensii Atoll butterflyfish 0.004297 3.793382 Chaetodontidae
5568 CHACH36 Chaetodon meyeri Scrawled butterflyfish 0.045008 2.814159 Chaetodontidae
5570 CHACH19 Chaetodon octofasciatus Eightband butterflyfish 0.045008 2.814159 Chaetodontidae
5571 CHACH49
Chaetodon
punctatofasciatus Spotband butterflyfish 0.045008 2.814159 Chaetodontidae
5572 CHACH40
Chaetodon
quadrimaculatus Fourspot butterflyfish 0.045008 2.814159 Chaetodontidae
5573 CHACH41 Chaetodon rafflesii Latticed butterflyfish 0.045008 2.814159 Chaetodontidae
5574 CHACH42 Chaetodon reticulatus Mailed butterflyfish 0.045008 2.814159 Chaetodontidae
5575 CHACH43 Chaetodon semeion Dotted butterflyfish 0.045008 2.814159 Chaetodontidae
5576 CHACH21 Chaetodon speculum Mirror butterflyfish 0.066371 2.693022 Chaetodontidae
5578 CHACH45 Chaetodon trifascialis Chevron butterflyfish 0.025777 2.969077 Chaetodontidae
Maria Sapatu
UNU Fisheries Training Programme Page 34
5580 CHACH46 Chaetodon ulietensis
Pacific double-saddle
butterflyfish 0.031142 2.874117 Chaetodontidae
5581 CHACH47 Chaetodon unimaculatus Teardrop butterflyfish 0.053303 2.833279 Chaetodontidae
5582 CHACH17 Chaetodon vagabundus Vagabond butterflyfish 0.027755 2.973465 Chaetodontidae
5584 CHAFO01 Forcipiger flavissimus Forcepsfish 0.042051 2.847332 Chaetodontidae
5585 CHAFO02 Forcipiger longirostris Longnose butterflyfish 0.042051 2.847332 Chaetodontidae
5586 CHAHM01 Hemitaurichthys polylepis Pyramid butterflyfish 0.042051 2.847332 Chaetodontidae
5588 CHAHE01 Heniochus acuminatus Pennant coralfish 0.024699 3.105802 Chaetodontidae
5589 CHAHE03 Heniochus chrysostomus Threeband pennantfish 0.016134 3.262174 Chaetodontidae
5590 CHAHE04 Heniochus monoceros Masked bannerfish 0.016997 3.210582 Chaetodontidae
5591 CHAHE05 Heniochus singularius Singular bannerfish 0.025152 3.082177 Chaetodontidae
5592 CHAHE06 Heniochus varius Horned bannerfish 0.025152 3.082177 Chaetodontidae
5597 LABOX03 Oxycheilinus celebicus Celebes wrasse 0.010669 3.17765 Labridae
5598 LABCH06 Cheilinus chlorourus Floral wrasse 0.019725 2.993152 Labridae
5599 LABOX01 Oxycheilinus digrammus Cheeklined wrasse 0.010669 3.177650 Labridae
5600 LABCH07 Cheilinus fasciatus Redbreast wrasse 0.015508 3.057917 Labridae
5602 LABCH08 Cheilinus oxycephalus Snooty wrasse 0.015508 3.057917 Labridae
5603 LABCH04 Cheilinus trilobatus Tripletail wrasse 0.016233 3.059470 Labridae
5604 LABCH03 Cheilinus undulatus Humphead wrasse 0.011310 3.136202 Labridae
5605 LABOX02 Oxycheilinus unifasciatus Ringtail maori wrasse 0.010669 3.177650 Labridae
5606 LABEP01 Epibulus insidiator Slingjaw wrasse 0.016138 3.081018 Labridae
5610 LABNO01
Novaculichthys
taeniourus Rockmover wrasse 0.010669 3.177650 Labridae
5623 LABCH01 Cheilio inermis Cigar wrasse 0.003491 3.081569 Labridae
5624 LABCR02 Coris aygula Clown coris 0.00266 3.488575 Labridae
5625 LABCR03 Coris gaimard Yellowtail coris 0.006501 3.254414 Labridae
5635 LABHM01 Hemigymnus fasciatus Barred thicklip 0.024790 2.912845 Labridae
5636 LABHM02 Hemigymnus melapterus Blackeye thicklip 0.024234 2.922618 Labridae
5649 LABTH02 Thalassoma trilobatum Christmas wrasse 0.012306 3.097020 Labridae
5653 MUGCR01 Crenimugil crenilabis Fringelip mullet 0.012719 3.046375 Mugilidae
5656 MUGMU07 Liza vaigiensis Squaretail mullet 0.014057 3.022847 Mugilidae
5659 MUGVA02 Valamugil seheli Bluespot mullet 0.006055 3.275027 Mugilidae
5660 PMOCH02
Chaetodontoplus
mesoleucus Vermiculated angelfish 0.058435 2.718278 Pomacanthidae
5661 PMOPO09 Pomacanthus navarchus Bluegirdled angelfish 0.066943 2.722333 Pomacanthidae
5662 PMOPO11
Pomacanthus
xanthometaopon Yellowface angelfish 0.066943 2.722333 Pomacanthidae
5663 PMOPO05
Pomacanthus
semicirculatus Semicircle angelfish 0.066943 2.722333 Pomacanthidae
5734 SPHSP04 Sphyraena forsteri Bigeye barracuda 0.005336 3.034063 Sphyraenidae
5737 EPHPL03 Platax orbicularis Orbicular batfish 0.044306 2.951489 Ephippidae
5739 EPHPL01 Platax teira Tiera batfish 0.044306 2.951489 Ephippidae
5791 PRIPR03 Priacanthus hamrur Moontail bullseye 0.029966 2.800846 Priacanthidae
5805 KYPKY02 Kyphosus cinerascens Blue seachub 0.012853 3.150589 Kyphosidae
5806 KYPKY03 Kyphosus vaigiensis Brassy chub 0.019983 3.036957 Kyphosidae
5825 SYASY01 Synanceia verrucosa Reef stonefish 0.004347 3.694222 Synanceiidae
5830 CIRCI03
Cirrhitichthys
oxycephalus Coral hawkfish 0.009273 3.268401 Cirrhitidae
Maria Sapatu
UNU Fisheries Training Programme Page 35
5836 MONCA05 Cantherhines dumerilii Whitespotted filefish 0.032397 2.904667 Monacanthidae
5837 SEREP71 Epinephelus spilotoceps Foursaddle grouper 0.012237 3.052671 Serranidae
5838 BALME02 Melichthys vidua Pinktail triggerfish 0.005696 3.393028 Balistidae
5839 BALRH01 Rhinecanthus aculeatus Blackbar triggerfish 0.005696 3.393028 Balistidae
5840 BALRH03 Rhinecanthus rectangulus Wedge-tail triggerfish 0.005696 3.393028 Balistidae
5841 HOLSA07 Sargocentron microstoma Smallmouth squirrelfish 0.021915 3.047387 Holocentridae
5842 BALSU02 Sufflamen chrysopterus Halfmoon triggerfish 0.032441 2.929115 Balistidae
5867 NEMPE01 Pentapodus caninus Small-toothed whiptail 0.017121 3.003869 Nemipteridae
5873 NEMPE04 Pentapodus trivittatus Three-striped whiptail 0.017121 3.003869 Nemipteridae
5876 NEMSC10 Scolopsis ciliatus
Saw-jawed monocle
bream 0.015738 3.054293 Nemipteridae
5877 NEMSC11 Scolopsis lineatus Striped monocle bream 0.015738 3.054293 Nemipteridae
5878 NEMSC12 Scolopsis margaritifer Pearly monocle bream 0.015738 3.054293 Nemipteridae
5880 NEMSC13 Scolopsis temporalis Bald-spot monocle bream 0.018473 2.981168 Nemipteridae
5881 NEMSC14 Scolopsis trilineatus
Three-lined monocle
bream 0.015738 3.054293 Nemipteridae
5884 NEMSC09 Scolopsis auratus
Yellowstripe monocle
bream 0.015738 3.054293 Nemipteridae
5885 NEMSC05 Scolopsis bilineata Two-lined monocle bream 0.013828 3.173777 Nemipteridae
5890 NEMSC08 Scolopsis affinis Peters' monocle bream 0.015738 3.054293 Nemipteridae
5895 SHAGI21 Nebrius ferrugineus Tawny nurse shark 0.02109 2.6979 Ginglymostomatidae
5950 ZANZA02 Zanclus cornutus Moorish idol 0.014704 3.369908 Zanclidae
5951 ACAZE02 Zebrasoma scopas Twotone tang 0.029053 2.99274 Acanthuridae
5953 CIRPA01 Paracirrhites hemistictus Whitespot hawkfish 0.009273 3.268401 Cirrhitidae
5983 MULMU02
Mulloidichthys
flavolineatus Yellowstripe goatfish 0.011974 3.101093 Mullidae
5984 MULMU03
Mulloidichthys
vanicolensis Yellowfin goatfish 0.010406 3.223581 Mullidae
5986 MULPA20 Parupeneus barberinoides Bicolor goatfish 0.014446 3.12992 Mullidae
5987 MULPA10 Parupeneus barberinus Dash-and-dot goatfish 0.013067 3.122492 Mullidae
5988 MULPA03 Parupeneus bifasciatus Doublebar goatfish 0.014446 3.12992 Mullidae
5989 MULPA21 Parupeneus ciliatus Whitesaddle goatfish 0.011633 3.219917 Mullidae
5990 MULPA08 Parupeneus cyclostomus Goldsaddle goatfish 0.014446 3.12992 Mullidae
5991 MULPA22 Parupeneus heptacanthus Cinnabar goatfish 0.0169 3.078022 Mullidae
5992 MULPA12 Parupeneus indicus Indian goatfish 0.01415 3.114207 Mullidae
5993 MULPA23 Parupeneus multifasciatus Manybar goatfish 0.014446 3.12992 Mullidae
5994 MULPA19 Parupeneus pleurostigma Sidespot goatfish 0.014446 3.12992 Mullidae
6001 SEREP70 Epinephelus rivulatus Halfmoon grouper 0.011387 3.086201 Serranidae
6011 ACAAC28 Acanthurus nigricans Whitecheek surgeonfish 0.028033 2.982884 Acanthuridae
6012 ACACT02 Ctenochaetus binotatus Twospot surgeonfish 0.039157 2.874629 Acanthuridae
6013 ACACT05 Ctenochaetus hawaiiensis Chevron tang 0.023712 3.055814 Acanthuridae
6014 ACACT06 Ctenochaetus marginatus Striped-fin surgeonfish 0.023712 3.055814 Acanthuridae
6015 ACACT01 Ctenochaetus strigosus Spotted surgeonfish 0.023712 3.055814 Acanthuridae
6016 ACACT07 Ctenochaetus tominiensis Tomini surgeonfish 0.023712 3.055814 Acanthuridae
6017 ACAPA01 Paracanthurus hepatus Palette surgeonfish 0.030061 2.945768 Acanthuridae
6018 ACAZE04 Zebrasoma flavescens Yellow tang 0.037834 2.856767 Acanthuridae
6019 ACANA08 Naso annulatus Whitemargin unicornfish 0.051032 2.71537 Acanthuridae
Maria Sapatu
UNU Fisheries Training Programme Page 36
6020 ACANA06 Naso brachycentron Humpback unicornfish 0.008481 3.249644 Acanthuridae
6021 ACANA03 Naso brevirostris Spotted unicornfish 0.010649 3.242973 Acanthuridae
6022 ACANA12 Naso lopezi Elongate unicornfish 0.008481 3.249644 Acanthuridae
6023 ACANA02 Naso tuberosus Humpnose unicornfish 0.008481 3.249644 Acanthuridae
6024 ACANA04 Naso vlamingii Bignose unicornfish 0.008481 3.249644 Acanthuridae
6025 BALBT01 Balistapus undulatus Orange-lined triggerfish 0.005696 3.393028 Balistidae
6026 BALBS01 Balistoides viridescens Titan triggerfish 0.024422 3.018285 Balistidae
6027 BALPS02
Pseudobalistes
flavimarginatus Yellowmargin triggerfish 0.072553 2.760281 Balistidae
6028 BALRH04 Rhinecanthus verrucosus Blackbelly triggerfish 0.005696 3.393028 Balistidae
6029 BALSU05 Sufflamen bursa Boomerang triggerfish 0.032441 2.929115 Balistidae
6030 BALXA02
Xanthichthys
auromarginatus Gilded triggerfish 0.005696 3.393028 Balistidae
6082 SERPL03 Plectropomus areolatus Squaretail coralgrouper 0.010685 3.08621 Serranidae
6360 CARCA26 Caranx papuensis Brassy trevally 0.02354 2.922789 Carangidae
6362 PODPL13
Plectorhinchus
albovittatus Two-striped sweetlips 0.019663 2.969262 Haemulidae
6363 PODPL16 Plectorhinchus celebicus Celebes sweetlips 0.019663 2.969262 Haemulidae
6364 PODPL17
Plectorhinchus
chaetodonoides Harlequin sweetlips 0.017328 3.040327 Haemulidae
6366 PODPL11 Plectorhinchus gibbosus Harry hotlips 0.022614 2.961962 Haemulidae
6368 PODPL21 Plectorhinchus obscurus Giant sweetlips 0.027031 2.884829 Haemulidae
6369 PODPL22 Plectorhinchus orientalis Oriental sweetlips 0.019663 2.969262 Haemulidae
6370 PODPL23 Plectorhinchus picus Painted sweetlip 0.011508 3.088918 Haemulidae
6380 MURGY13 Gymnothorax javanicus Giant moray 0.000518 3.303143 Muraenidae
6396 SERCE07 Cephalopholis argus Peacock hind 0.009293 3.180743 Serranidae
6400 TETAR05 Arothron nigropunctatus Blackspotted puffer 0.035235 2.901326 Tetraodontidae
6401 TETAR07 Arothron meleagris Guineafowl puffer 0.035235 2.901326 Tetraodontidae
6438 SCASC05 Scarus tricolor Tricolour parrotfish 0.023374 2.956463 Scaridae
6439 SEREP09 Epinephelus malabaricus Malabar grouper 0.012067 3.051888 Serranidae
6440 SEREP61
Epinephelus
coeruleopunctatus Whitespotted grouper 0.018 2.937798 Serranidae
6441 SERAE01 Aethaloperca rogaa Redmouth grouper 0.013415 3.030514 Serranidae
6444 SERCE05 Cephalopholis boenak Chocolate hind 0.01462 3.01915 Serranidae
6445 SERCE16
Cephalopholis
cyanostigma Bluespotted hind 0.011457 3.109346 Serranidae
6448 SERCE17 Cephalopholis leopardus Leopard hind 0.011457 3.109346 Serranidae
6449 SERCE10 Cephalopholis microprion Freckled hind 0.011457 3.109346 Serranidae
6450 SERCE09 Cephalopholis miniata Coral hind 0.010656 3.114101 Serranidae
6453 SERCE12
Cephalopholis
sexmaculata Sixblotch hind 0.011457 3.109346 Serranidae
6454 SERCE14 Cephalopholis sonnerati Tomato hind 0.006609 3.276551 Serranidae
6456 SERCE15 Cephalopholis urodeta Darkfin hind 0.028223 2.817751 Serranidae
6457 SERCH01 Cromileptes altivelis Humpback grouper 0.096187 2.489277 Serranidae
6465 SEREP62 Epinephelus coioides Orange-spotted grouper 0.009897 3.101785 Serranidae
6466 SEREP63 Epinephelus corallicola Coral grouper 0.012237 3.052671 Serranidae
6471 SEREP67
Epinephelus
melanostigma One-blotch grouper 0.012237 3.052671 Serranidae
6472 SEREP68 Epinephelus ongus White-streaked grouper 0.018995 2.927803 Serranidae
Maria Sapatu
UNU Fisheries Training Programme Page 37
6473 SEREP69
Epinephelus
polyphekadion Camouflage grouper 0.008333 3.165759 Serranidae
6477 SERGC01 Gracila albomarginata Masked grouper 0.013415 3.030514 Serranidae
6478 SERVA02 Variola albimarginata White-edged lyretail 0.012188 3.079131 Serranidae
6504 PMOPO01 Pomacanthus imperator Emperor angelfish 0.066943 2.722333 Pomacanthidae
6505 HOLMY11 Myripristis vittata Whitetip soldierfish 0.027619 3.030413 Holocentridae
6506 HOLMY04 Myripristis adusta Shadowfin soldierfish 0.027619 3.030413 Holocentridae
6507 HOLSA03 Sargocentron spiniferum Sabre squirrelfish 0.015406 3.118811 Holocentridae
6513 CHACH25 Chaetodon aureofasciatus Golden butterflyfish 0.045008 2.814159 Chaetodontidae
6525 PMOAP01
Apolemichthys
trimaculatus Threespot angelfish 0.058435 2.718278 Pomacanthidae
6526 TETAR02 Arothron stellatus Starry toadfish 0.091496 2.672389 Tetraodontidae
6527 CHACH30 Chaetodon flavirostris Black butterflyfish 0.025097 3.113247 Chaetodontidae
6548 PMOCE05 Centropyge tibicen Keyhole angelfish 0.049231 2.794514 Pomacanthidae
6550 CHACH37 Chaetodon ornatissimus Ornate butterflyfish 0.045008 2.814159 Chaetodontidae
6555 OSTOS01 Ostracion cubicus Yellow boxfish 0.128822 2.519495 Ostraciidae
6564 PMOPO10 Pomacanthus sexstriatus Sixbar angelfish 0.066858 2.723779 Pomacanthidae
6572 PMOPY01 Pygoplites diacanthus Royal angelfish 0.058435 2.718278 Pomacanthidae
6582 HOLNE02 Neoniphon opercularis Blackfin squirrelfish 0.028791 2.867153 Holocentridae
6597 LABCO06 Choerodon jordani Jordan's tuskfish 0.015111 3.122482 Labridae
6606 CHACH38 Chaetodon pelewensis Sunset butterflyfish 0.015326 3.296587 Chaetodontidae
6613 CHACH39 Chaetodon plebeius Blueblotch butterflyfish 0.060611 2.627817 Chaetodontidae
6625 HOLSA02 Sargocentron rubrum Redcoat 0.027516 2.998402 Holocentridae
6626 MULPA24 Parupeneus spilurus Blackspot goatfish 0.019174 3.021705 Mullidae
6635 MONCA01 Cantherhines pardalis Honeycomb filefish 0.032397 2.904667 Monacanthidae
6650 CHACH01 Chelmon marginalis Margined coralfish 0.042051 2.847332 Chaetodontidae
6660 SEREP64 Epinephelus hexagonatus Starspotted grouper 0.012237 3.052671 Serranidae
6661 SEREP66 Epinephelus macrospilos Snubnose grouper 0.013199 3.030716 Serranidae
6672 MONAM01 Amanses scopas Broom filefish 0.068300 2.563000 Monacanthidae
6932 ACANA13 Naso thynnoides Oneknife unicornfish 0.008481 3.249644 Acanthuridae
6938 MULPA17 Parupeneus trifasciatus NULL 0.011359 3.210819 Mullidae
6940 PODPL20 Plectorhinchus lineatus Yellowbanded sweetlips 0.019663 2.969262 Haemulidae
7305 HOLMY07 Myripristis hexagona Doubletooth soldierfish 0.025013 3.088965 Holocentridae
7306 HOLMY08 Myripristis kuntee Shoulderbar soldierfish 0.009912 3.467647 Holocentridae
7308 HOLMY09 Myripristis pralinia Scarlet soldierfish 0.022698 3.095007 Holocentridae
7309 HOLMY10 Myripristis violacea Lattice soldierfish 0.036397 2.94026 Holocentridae
7310 HOLNE01 Neoniphon argenteus Clearfin squirrelfish 0.031648 2.823264 Holocentridae
7319 SERPL06
Plectropomus
oligacanthus Highfin coralgrouper 0.010685 3.08621 Serranidae
7348 SEREP65 Epinephelus howlandi Blacksaddle grouper 0.015254 2.999094 Serranidae
7372 SERPL05 Plectropomus laevis
Blacksaddled
coralgrouper 0.005908 3.237744 Serranidae
7625 PODPL04
Plectorhinchus
flavomaculatus Lemon sweetlip 0.019663 2.969262 Haemulidae
7659 HOLMY12 Myripristis trachyacron Roughscull soldierfish 0.027619 3.030413 Holocentridae
7734 LABBO09 Bodianus perditio Golden-spot hogfish 0.011849 3.148753 Labridae
7814 PMOCE04 Centropyge loriculaus Flame angel 0.074481 2.576934 Pomacanthidae
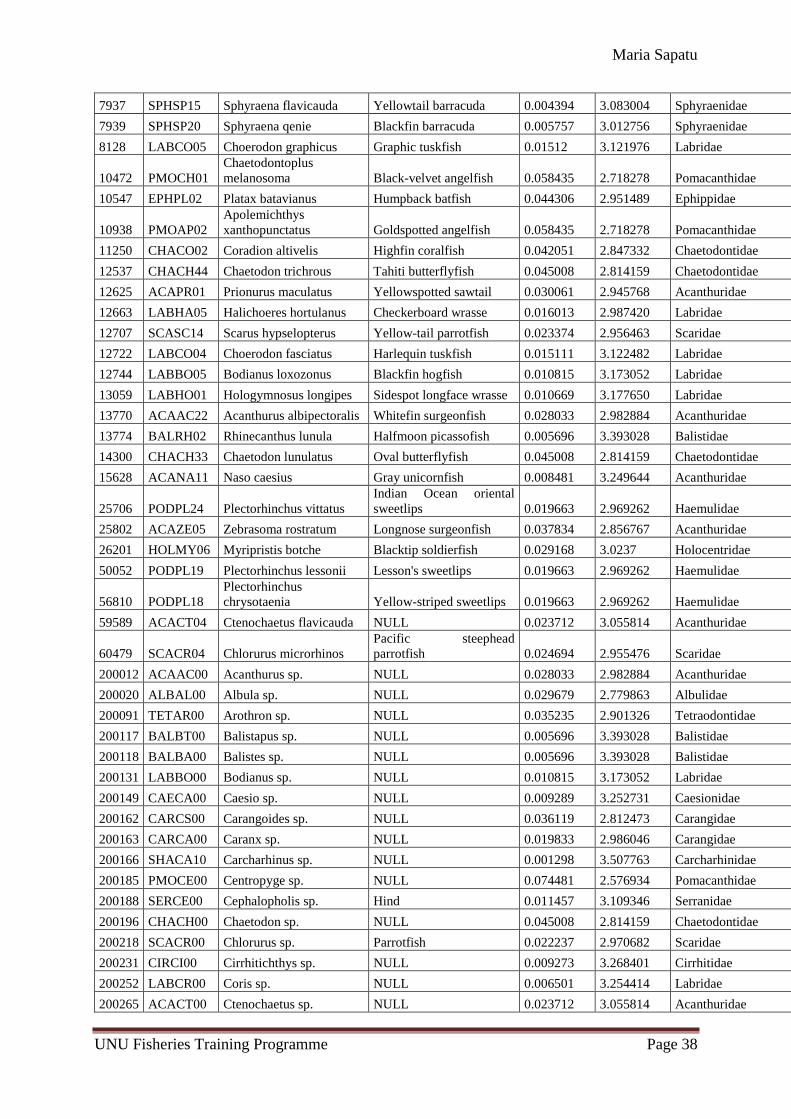
Maria Sapatu
UNU Fisheries Training Programme Page 38
7937 SPHSP15 Sphyraena flavicauda Yellowtail barracuda 0.004394 3.083004 Sphyraenidae
7939 SPHSP20 Sphyraena qenie Blackfin barracuda 0.005757 3.012756 Sphyraenidae
8128 LABCO05 Choerodon graphicus Graphic tuskfish 0.01512 3.121976 Labridae
10472 PMOCH01
Chaetodontoplus
melanosoma Black-velvet angelfish 0.058435 2.718278 Pomacanthidae
10547 EPHPL02 Platax batavianus Humpback batfish 0.044306 2.951489 Ephippidae
10938 PMOAP02
Apolemichthys
xanthopunctatus Goldspotted angelfish 0.058435 2.718278 Pomacanthidae
11250 CHACO02 Coradion altivelis Highfin coralfish 0.042051 2.847332 Chaetodontidae
12537 CHACH44 Chaetodon trichrous Tahiti butterflyfish 0.045008 2.814159 Chaetodontidae
12625 ACAPR01 Prionurus maculatus Yellowspotted sawtail 0.030061 2.945768 Acanthuridae
12663 LABHA05 Halichoeres hortulanus Checkerboard wrasse 0.016013 2.987420 Labridae
12707 SCASC14 Scarus hypselopterus Yellow-tail parrotfish 0.023374 2.956463 Scaridae
12722 LABCO04 Choerodon fasciatus Harlequin tuskfish 0.015111 3.122482 Labridae
12744 LABBO05 Bodianus loxozonus Blackfin hogfish 0.010815 3.173052 Labridae
13059 LABHO01 Hologymnosus longipes Sidespot longface wrasse 0.010669 3.177650 Labridae
13770 ACAAC22 Acanthurus albipectoralis Whitefin surgeonfish 0.028033 2.982884 Acanthuridae
13774 BALRH02 Rhinecanthus lunula Halfmoon picassofish 0.005696 3.393028 Balistidae
14300 CHACH33 Chaetodon lunulatus Oval butterflyfish 0.045008 2.814159 Chaetodontidae
15628 ACANA11 Naso caesius Gray unicornfish 0.008481 3.249644 Acanthuridae
25706 PODPL24 Plectorhinchus vittatus
Indian Ocean oriental
sweetlips 0.019663 2.969262 Haemulidae
25802 ACAZE05 Zebrasoma rostratum Longnose surgeonfish 0.037834 2.856767 Acanthuridae
26201 HOLMY06 Myripristis botche Blacktip soldierfish 0.029168 3.0237 Holocentridae
50052 PODPL19 Plectorhinchus lessonii Lesson's sweetlips 0.019663 2.969262 Haemulidae
56810 PODPL18
Plectorhinchus
chrysotaenia Yellow-striped sweetlips 0.019663 2.969262 Haemulidae
59589 ACACT04 Ctenochaetus flavicauda NULL 0.023712 3.055814 Acanthuridae
60479 SCACR04 Chlorurus microrhinos
Pacific steephead
parrotfish 0.024694 2.955476 Scaridae
200012 ACAAC00 Acanthurus sp. NULL 0.028033 2.982884 Acanthuridae
200020 ALBAL00 Albula sp. NULL 0.029679 2.779863 Albulidae
200091 TETAR00 Arothron sp. NULL 0.035235 2.901326 Tetraodontidae
200117 BALBT00 Balistapus sp. NULL 0.005696 3.393028 Balistidae
200118 BALBA00 Balistes sp. NULL 0.005696 3.393028 Balistidae
200131 LABBO00 Bodianus sp. NULL 0.010815 3.173052 Labridae
200149 CAECA00 Caesio sp. NULL 0.009289 3.252731 Caesionidae
200162 CARCS00 Carangoides sp. NULL 0.036119 2.812473 Carangidae
200163 CARCA00 Caranx sp. NULL 0.019833 2.986046 Carangidae
200166 SHACA10 Carcharhinus sp. NULL 0.001298 3.507763 Carcharhinidae
200185 PMOCE00 Centropyge sp. NULL 0.074481 2.576934 Pomacanthidae
200188 SERCE00 Cephalopholis sp. Hind 0.011457 3.109346 Serranidae
200196 CHACH00 Chaetodon sp. NULL 0.045008 2.814159 Chaetodontidae
200218 SCACR00 Chlorurus sp. Parrotfish 0.022237 2.970682 Scaridae
200231 CIRCI00 Cirrhitichthys sp. NULL 0.009273 3.268401 Cirrhitidae
200252 LABCR00 Coris sp. NULL 0.006501 3.254414 Labridae
200265 ACACT00 Ctenochaetus sp. NULL 0.023712 3.055814 Acanthuridae
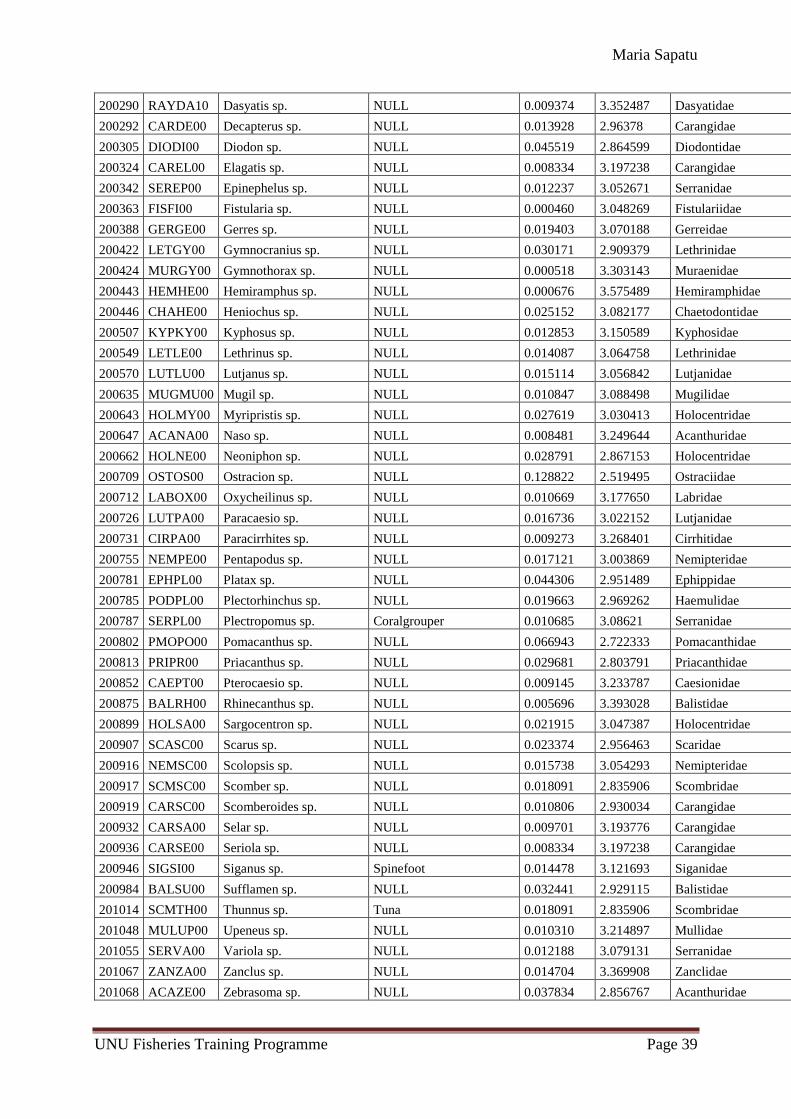
Maria Sapatu
UNU Fisheries Training Programme Page 39
200290 RAYDA10 Dasyatis sp. NULL 0.009374 3.352487 Dasyatidae
200292 CARDE00 Decapterus sp. NULL 0.013928 2.96378 Carangidae
200305 DIODI00 Diodon sp. NULL 0.045519 2.864599 Diodontidae
200324 CAREL00 Elagatis sp. NULL 0.008334 3.197238 Carangidae
200342 SEREP00 Epinephelus sp. NULL 0.012237 3.052671 Serranidae
200363 FISFI00 Fistularia sp. NULL 0.000460 3.048269 Fistulariidae
200388 GERGE00 Gerres sp. NULL 0.019403 3.070188 Gerreidae
200422 LETGY00 Gymnocranius sp. NULL 0.030171 2.909379 Lethrinidae
200424 MURGY00 Gymnothorax sp. NULL 0.000518 3.303143 Muraenidae
200443 HEMHE00 Hemiramphus sp. NULL 0.000676 3.575489 Hemiramphidae
200446 CHAHE00 Heniochus sp. NULL 0.025152 3.082177 Chaetodontidae
200507 KYPKY00 Kyphosus sp. NULL 0.012853 3.150589 Kyphosidae
200549 LETLE00 Lethrinus sp. NULL 0.014087 3.064758 Lethrinidae
200570 LUTLU00 Lutjanus sp. NULL 0.015114 3.056842 Lutjanidae
200635 MUGMU00 Mugil sp. NULL 0.010847 3.088498 Mugilidae
200643 HOLMY00 Myripristis sp. NULL 0.027619 3.030413 Holocentridae
200647 ACANA00 Naso sp. NULL 0.008481 3.249644 Acanthuridae
200662 HOLNE00 Neoniphon sp. NULL 0.028791 2.867153 Holocentridae
200709 OSTOS00 Ostracion sp. NULL 0.128822 2.519495 Ostraciidae
200712 LABOX00 Oxycheilinus sp. NULL 0.010669 3.177650 Labridae
200726 LUTPA00 Paracaesio sp. NULL 0.016736 3.022152 Lutjanidae
200731 CIRPA00 Paracirrhites sp. NULL 0.009273 3.268401 Cirrhitidae
200755 NEMPE00 Pentapodus sp. NULL 0.017121 3.003869 Nemipteridae
200781 EPHPL00 Platax sp. NULL 0.044306 2.951489 Ephippidae
200785 PODPL00 Plectorhinchus sp. NULL 0.019663 2.969262 Haemulidae
200787 SERPL00 Plectropomus sp. Coralgrouper 0.010685 3.08621 Serranidae
200802 PMOPO00 Pomacanthus sp. NULL 0.066943 2.722333 Pomacanthidae
200813 PRIPR00 Priacanthus sp. NULL 0.029681 2.803791 Priacanthidae
200852 CAEPT00 Pterocaesio sp. NULL 0.009145 3.233787 Caesionidae
200875 BALRH00 Rhinecanthus sp. NULL 0.005696 3.393028 Balistidae
200899 HOLSA00 Sargocentron sp. NULL 0.021915 3.047387 Holocentridae
200907 SCASC00 Scarus sp. NULL 0.023374 2.956463 Scaridae
200916 NEMSC00 Scolopsis sp. NULL 0.015738 3.054293 Nemipteridae
200917 SCMSC00 Scomber sp. NULL 0.018091 2.835906 Scombridae
200919 CARSC00 Scomberoides sp. NULL 0.010806 2.930034 Carangidae
200932 CARSA00 Selar sp. NULL 0.009701 3.193776 Carangidae
200936 CARSE00 Seriola sp. NULL 0.008334 3.197238 Carangidae
200946 SIGSI00 Siganus sp. Spinefoot 0.014478 3.121693 Siganidae
200984 BALSU00 Sufflamen sp. NULL 0.032441 2.929115 Balistidae
201014 SCMTH00 Thunnus sp. Tuna 0.018091 2.835906 Scombridae
201048 MULUP00 Upeneus sp. NULL 0.010310 3.214897 Mullidae
201055 SERVA00 Variola sp. NULL 0.012188 3.079131 Serranidae
201067 ZANZA00 Zanclus sp. NULL 0.014704 3.369908 Zanclidae
201068 ACAZE00 Zebrasoma sp. NULL 0.037834 2.856767 Acanthuridae
Maria Sapatu
UNU Fisheries Training Programme Page 40
10.2 List of Figures
Figure 1: Inshore Fishery Landings from the markets outlets from 1986-94(Fisheries
Division)
0
0,1
0,2
0,3
0,4
0,5
0,6
0,7
0,8
0,9
1
0 0 0 0 0 0 0 0 0
To
tal w
eig
ht
(mt)
Year
Weight of Finfish from the Markets
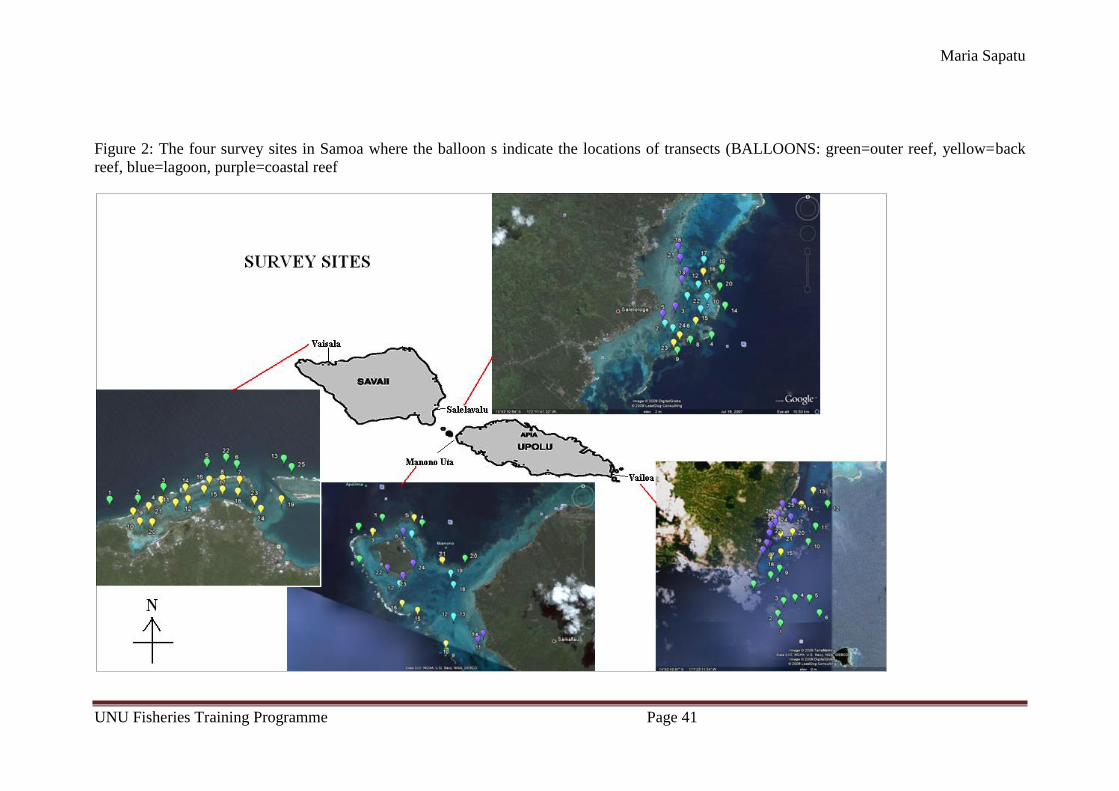
Maria Sapatu
UNU Fisheries Training Programme Page 41
Figure 2: The four survey sites in Samoa where the balloon s indicate the locations of transects (BALLOONS: green=outer reef, yellow=back
reef, blue=lagoon, purple=coastal reef
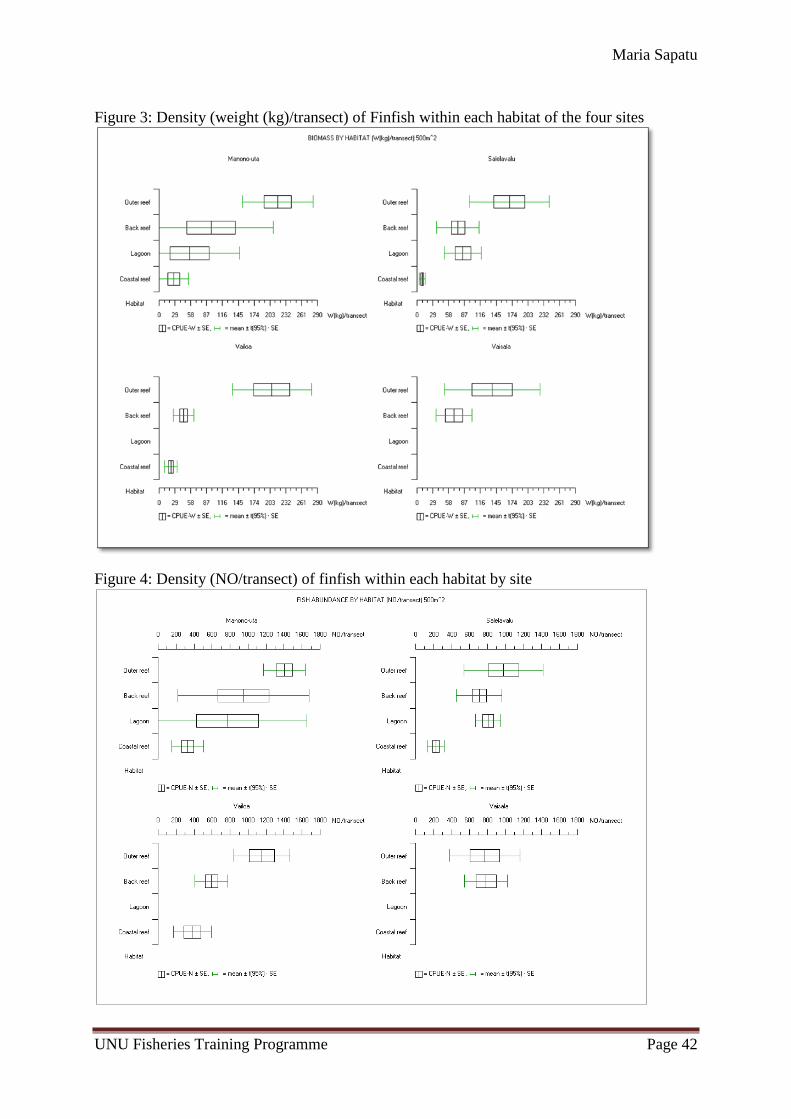
Maria Sapatu
UNU Fisheries Training Programme Page 42
Figure 3: Density (weight (kg)/transect) of Finfish within each habitat of the four sites
Figure 4: Density (NO/transect) of finfish within each habitat by site
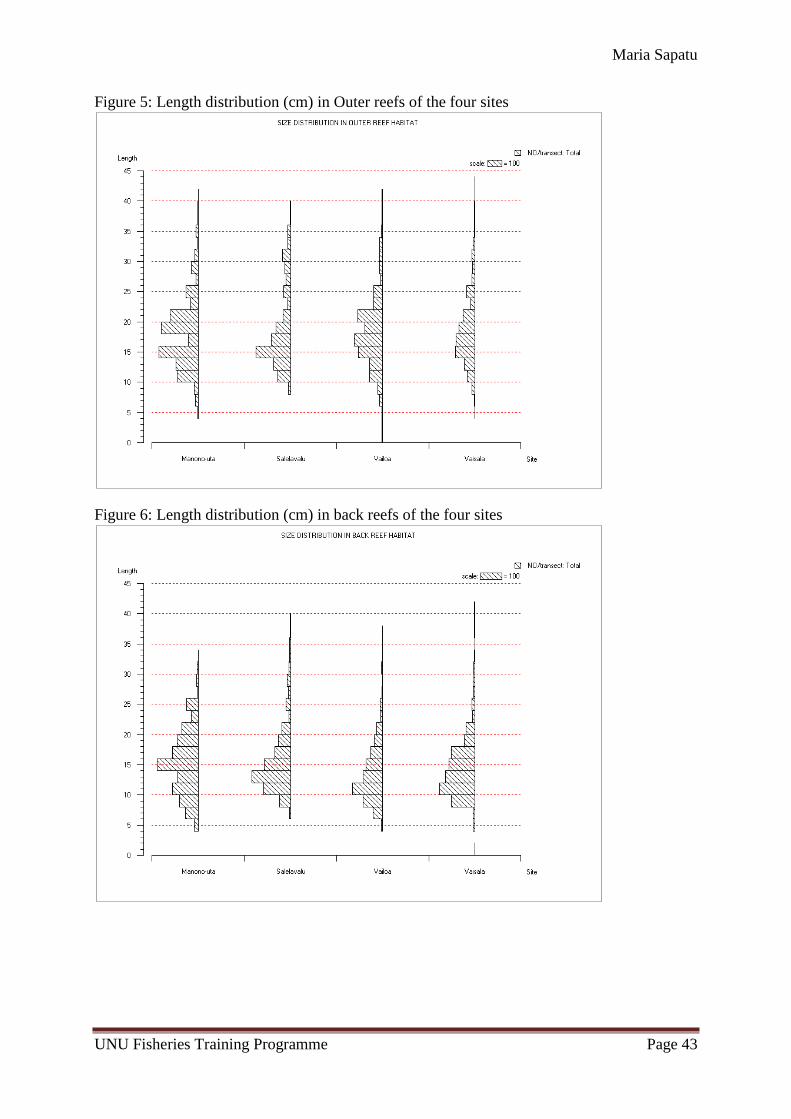
Maria Sapatu
UNU Fisheries Training Programme Page 43
Figure 5: Length distribution (cm) in Outer reefs of the four sites
Figure 6: Length distribution (cm) in back reefs of the four sites
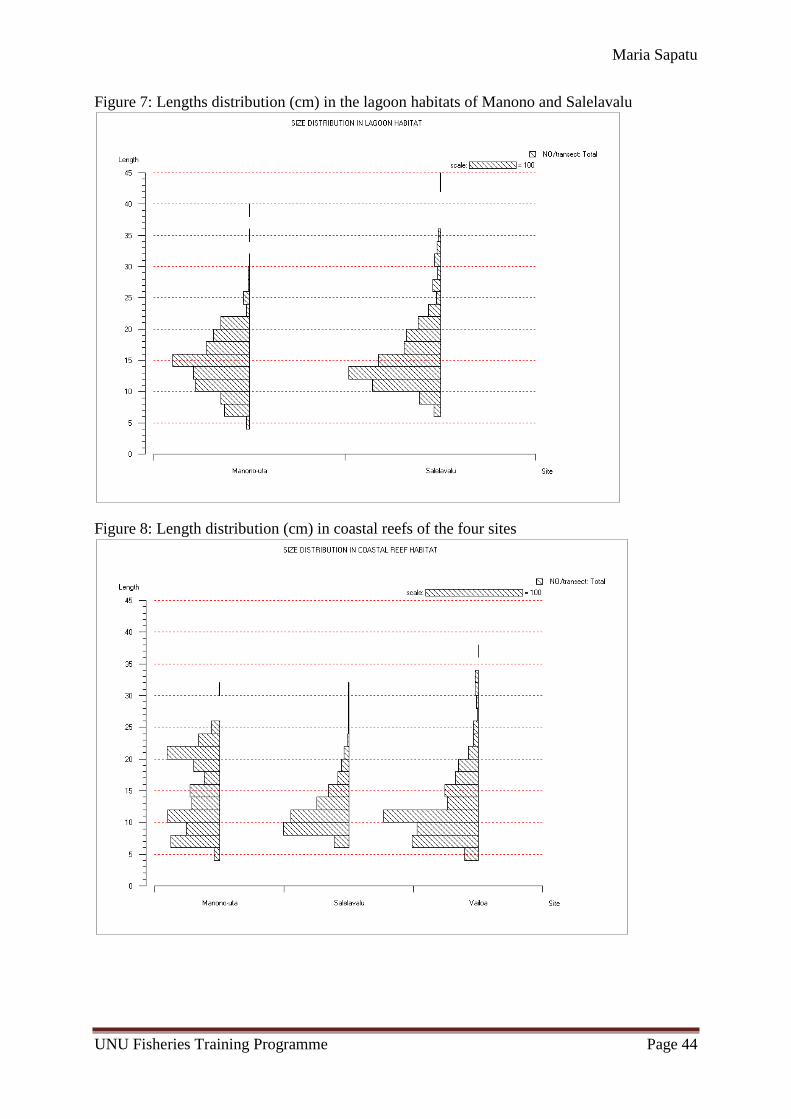
Maria Sapatu
UNU Fisheries Training Programme Page 44
Figure 7: Lengths distribution (cm) in the lagoon habitats of Manono and Salelavalu
Figure 8: Length distribution (cm) in coastal reefs of the four sites
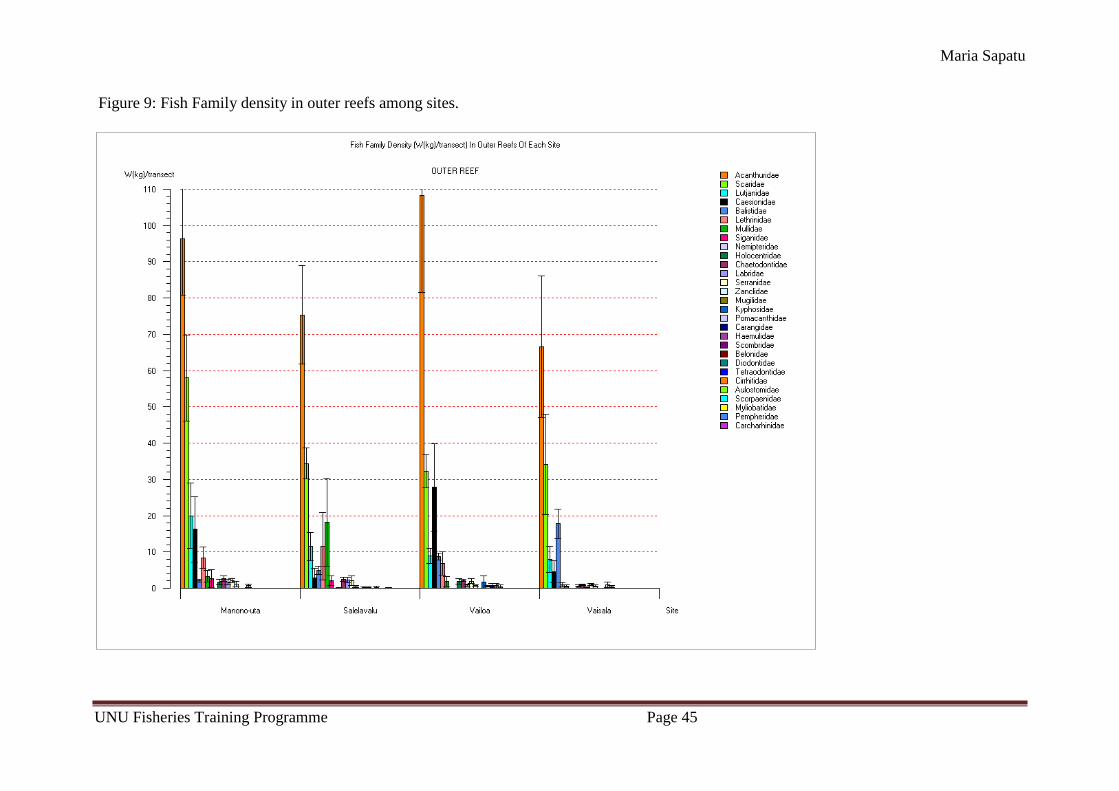
Maria Sapatu
UNU Fisheries Training Programme Page 45
Figure 9: Fish Family density in outer reefs among sites.
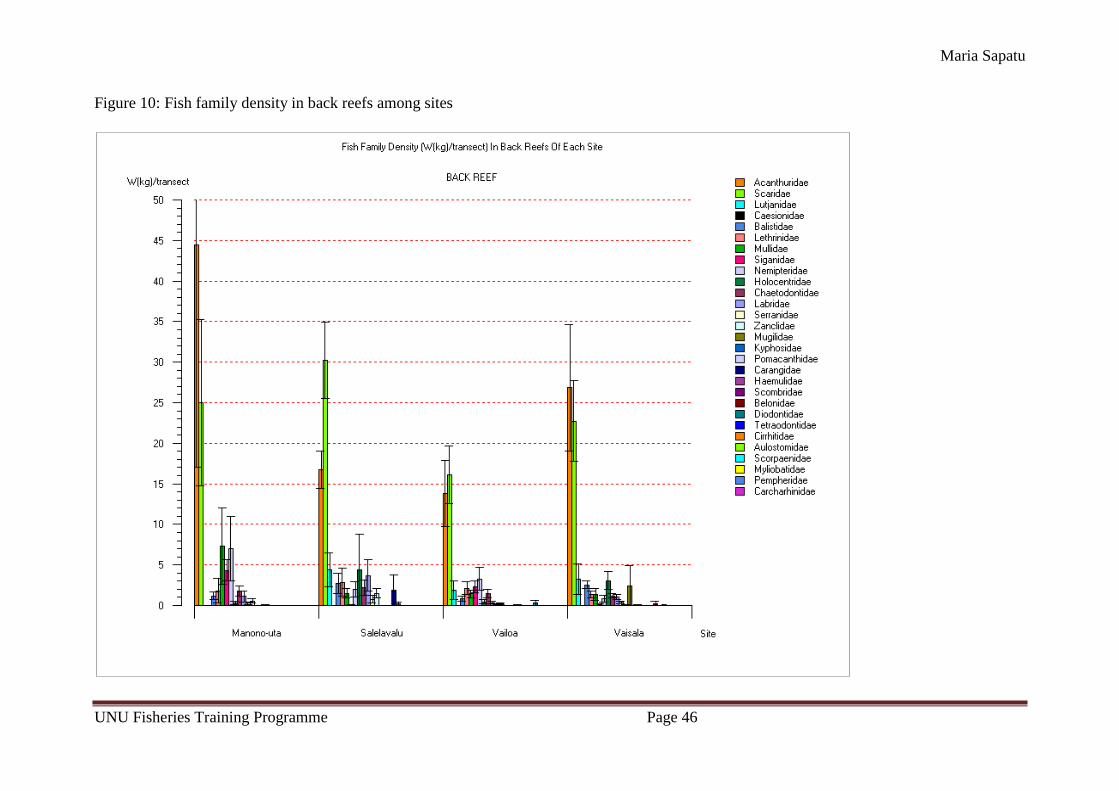
Maria Sapatu
UNU Fisheries Training Programme Page 46
Figure 10: Fish family density in back reefs among sites
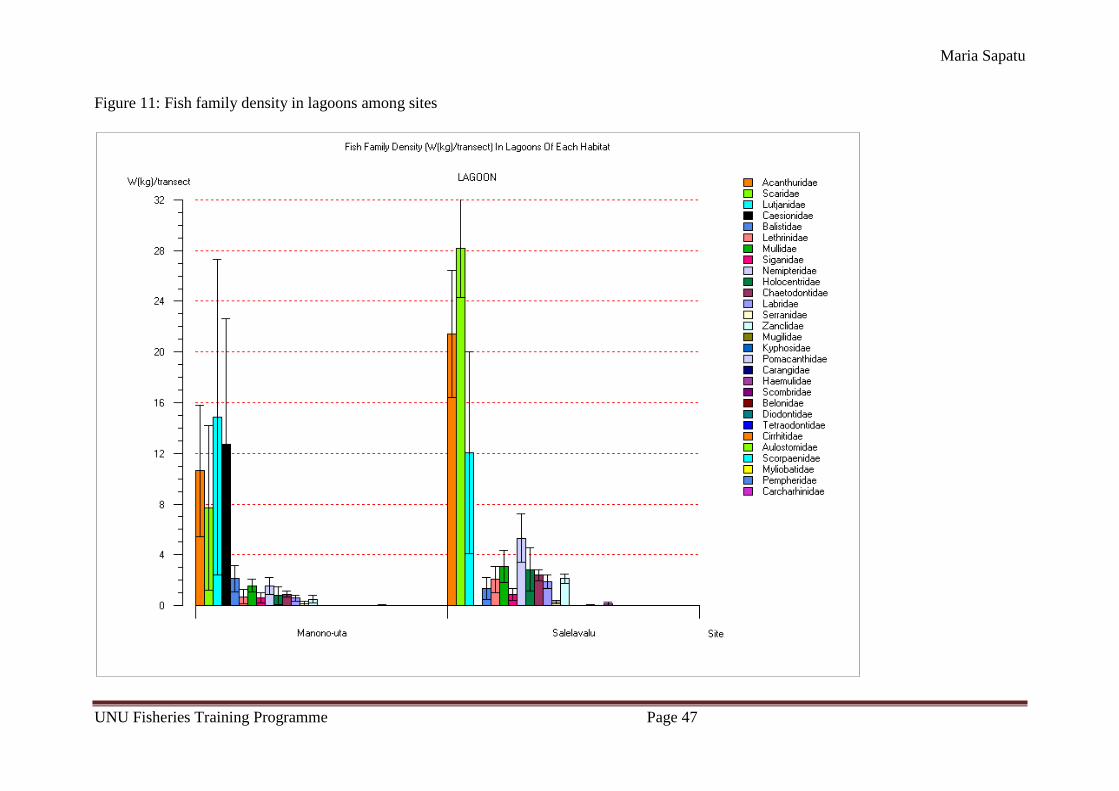
Maria Sapatu
UNU Fisheries Training Programme Page 47
Figure 11: Fish family density in lagoons among sites
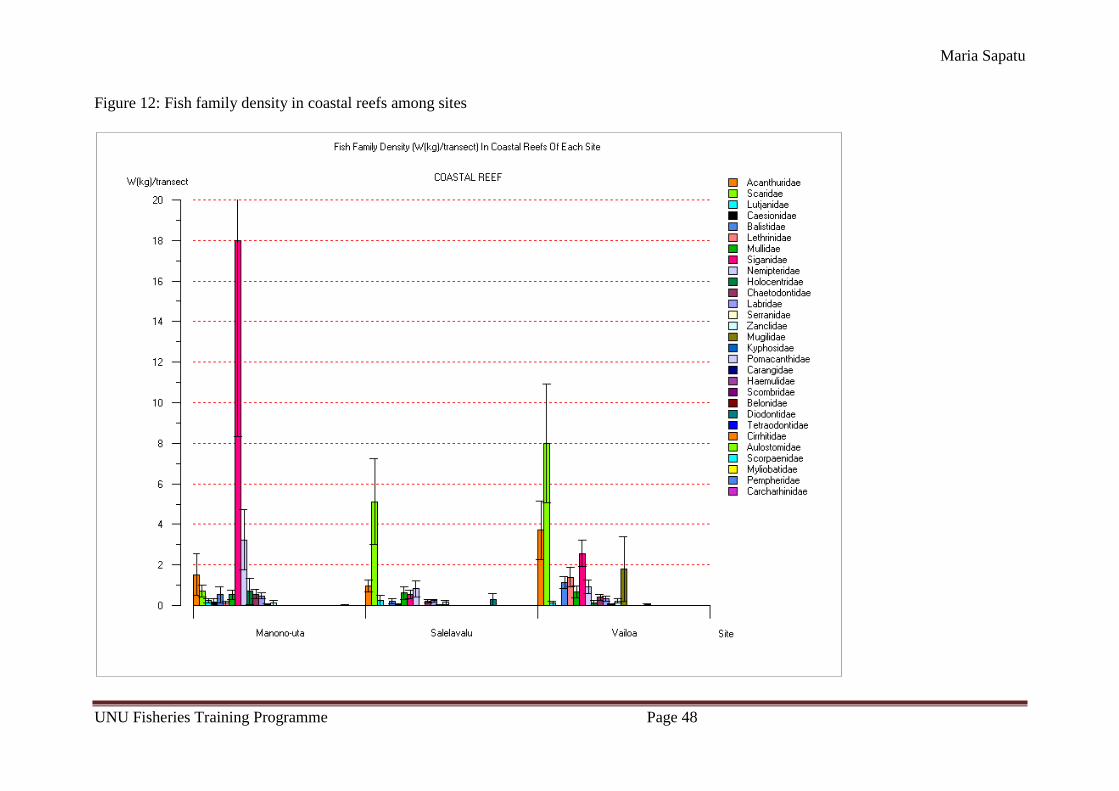
Maria Sapatu
UNU Fisheries Training Programme Page 48
Figure 12: Fish family density in coastal reefs among sites
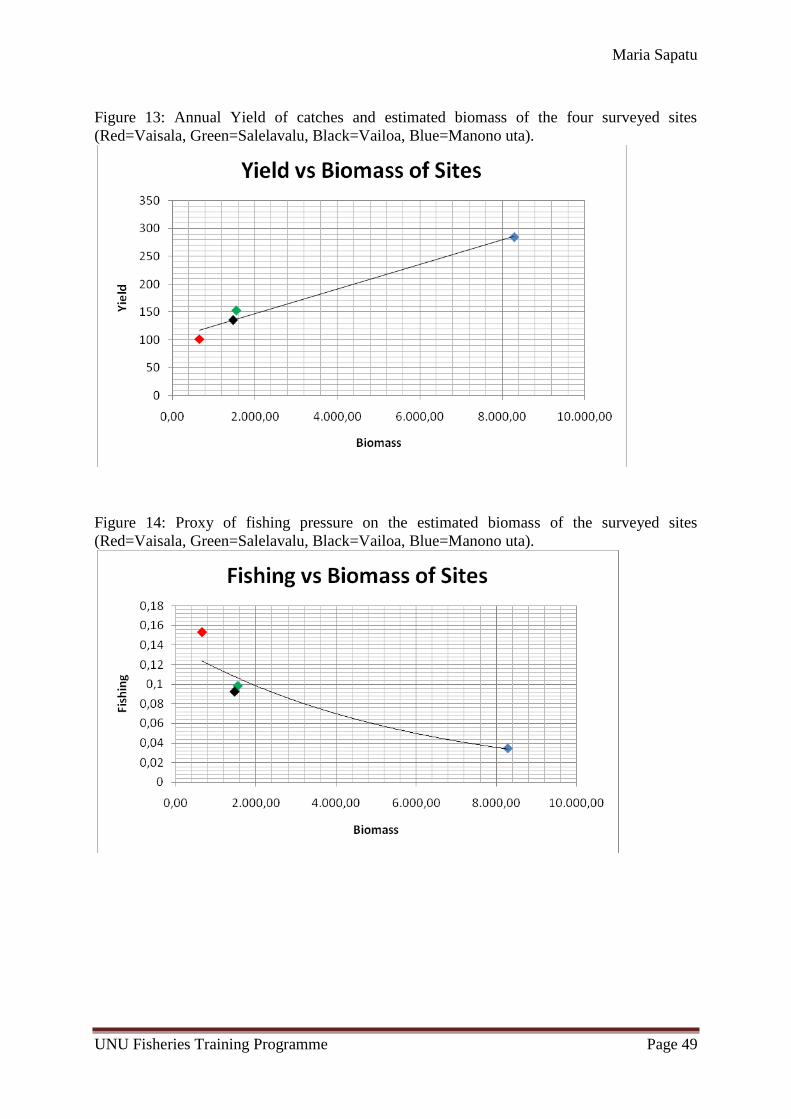
Maria Sapatu
UNU Fisheries Training Programme Page 49
Figure 13: Annual Yield of catches and estimated biomass of the four surveyed sites
(Red=Vaisala, Green=Salelavalu, Black=Vailoa, Blue=Manono uta).
Figure 14: Proxy of fishing pressure on the estimated biomass of the surveyed sites
(Red=Vaisala, Green=Salelavalu, Black=Vailoa, Blue=Manono uta).
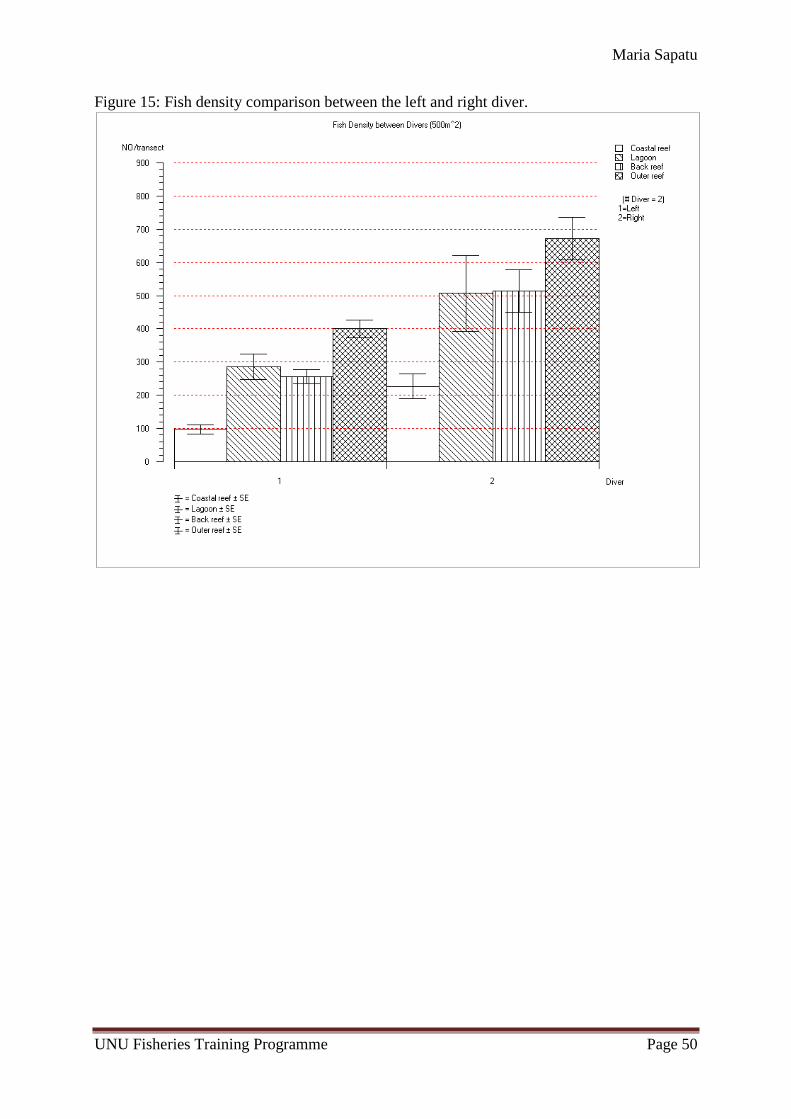
Maria Sapatu
UNU Fisheries Training Programme Page 50
Figure 15: Fish density comparison between the left and right diver.


