Embed Size (px)
Citation preview

THE EVIDENCE BASEOF CLINICAL
DIAGNOSIS
BMJ Books

THE EVIDENCE BASE OF
CLINICAL DIAGNOSIS
Andre_ChapFM.qxd 11/6/01 3:08 PM Page i

Andre_ChapFM.qxd 11/6/01 3:08 PM Page ii

THE EVIDENCE BASEOF CLINICALDIAGNOSIS
Edited by
J ANDRÉ KNOTTNERUSNetherlands School of Primary Care Research, University of Maastricht,
The Netherlands
Andre_ChapFM.qxd 11/6/01 3:08 PM Page iii

© BMJ Books 2002BMJ Books is an imprint of the BMJ Publishing Group
All rights reserved. No part of this publication may be reproduced, stored in a retrievalsystem, or transmitted, in any form or by any means, electronic, mechanical, photocopying,
recording and/or otherwise, without the prior written permission of the publishers.
First published in 2002by BMJ Books, BMA House, Tavistock Square,
London WC1H 9JR
www.bmjbooks.com
British Library Cataloguing in Publication Data
A catalogue record for this book is available from the British Library
ISBN 0 7279 1571 1
Typeset by Newgen Imaging Systems (P) Ltd., Chennai, IndiaPrinted and bound in Spain by GraphyCems, Navarra
Andre_ChapFM.qxd 11/6/01 3:08 PM Page iv

ix
Preface
“I consider much less thinking has gone into the theory underlying diagnosis, orpossibly one should say less energy has gone into constructing the correct model ofdiagnostic procedures, than into therapy or prevention where the concept of‘altering the natural history of the disease’ has been generally accepted and atheory has been evolved for testing hypotheses concerning this.”1
Although seeking an evidence base for medicine is as old as medicineitself, in the past decade the concept of evidence-based medicine (EBM)has strongly stimulated the application of the best available evidence fromclinical research into medical practice. At the same time, this process hasrevealed the need for a more extensive and more valid evidence base asinput for EBM. Accordingly, investigators have been encouraged tointensify the production and innovation of clinical knowledge, and clinicalresearch has become more successful in seeing its results implemented inpractice more completely in a shorter period.
In developing the evidence base of clinical management it has comeforward that, even 3 decades after Archie Cochrane wrote the words citedabove, the methodology of diagnostic research lags far behind that ofresearch into the effectiveness of treatment. This is the more challengingbecause making an adequate diagnostic process is a prime requirement forappropriate clinical decision making, including prognostic assessment andthe selection of the most effective treatment options.
In view of this apparent need for further methodological development ofthe evidence base of clinical diagnosis, this book was initiated. The aim is
Andre_ChapFM.qxd 11/6/01 3:08 PM Page ix

v
Contents
Contributors vii
Preface ix
1 General introduction: evaluation of 1diagnostic proceduresJ ANDRÉ KNOTTNERUS and CHRIS VAN WEEL
2 The architecture of diagnostic research 19DAVID L SACKETT and R BRIAN HAYNES
3 Assessment of the accuracy of diagnostic tests: 39the cross-sectional studyJ ANDRÉ KNOTTNERUS and JEAN W MURIS
4 Diagnostic testing and prognosis: the randomised 61controlled trial in diagnostic researchJEROEN G LIJMER and PATRICK M BOSSUYT
5 The diagnostic before–after study to assess 81clinical impactJ ANDRÉ KNOTTNERUS, GEERT-JAN DINANT andONNO P VAN SCHAYCK
6 Designing studies to ensure that estimates of test 95accuracy will travelLES M IRWIG, PATRICK M BOSSUYT, PAUL P GLASZIOU,CONSTANTINE GATSONIS and JEROEN G LIJMER
7 Analysis of data on the accuracy of diagnostic tests 117J DIK F HABBEMA, RENÉ EIJKEMANS, PIETA KRIJNEN andJ ANDRÉ KNOTTNERUS
8 Guidelines for conducting systematic reviews of 145studies evaluating the accuracy of diagnostic testsWALTER L DEVILLÉ and FRANK BUNTINX
Andre_ChapFM.qxd 11/6/01 3:08 PM Page v

9 Diagnostic decision support: contributions from 167medical informaticsJOHAN VAN DER LEI and JAN H VAN BEMMEL
10 Clinical problem solving and diagnostic 179decision making: a selective review of thecognitive research literatureARTHUR S ELSTEIN and ALAN SCHWARTZ
11 Improving test ordering and diagnostic 197cost effectiveness in clinical practice – bridgingthe gap between clinical research and routinehealth careRON AG WINKENS and GEERT-JAN DINANT
12 Epilogue: overview of evaluation strategy 209and challengesJ ANDRÉ KNOTTNERUS
Index 217
THE EVIDENCE BASE OF CLINICAL DIAGNOSIS
vi
Andre_ChapFM.qxd 11/6/01 3:08 PM Page vi

vii
Contributors
Jan H van Bemmel Department of Medical Informatics, ErasmusUniversity Rotterdam, The Netherlands
Patrick M Bossuyt Department of Clinical Epidemiology andBiostatistics, Academic Medical Centre, University of Amsterdam,The Netherlands
Frank Buntinx Department of General Practice, Catholic UniversityLeuven, Belgium
Walter L Devillé Institute for Research in Extramural Medicine, VrijeUniversiteit, Amsterdam, The Netherlands
Geert-Jan Dinant Department of General Practice, University ofMaastricht, The Netherlands
René Eijkemans Center for Clinical Decision Sciences, Department ofPublic Health, Erasmus University Rotterdam, The Netherlands
Arthur S Elstein Department of Medical Education, University ofIllinois College of Medicine, Chicago, Illinois, USA
Constantine Gatsonis Center for Statistical Sciences, Brown University,Providence, Rhode Island, USA
Paul P Glasziou Department of Social and Preventive Medicine,University of Queensland Medical School, Australia
J Dik F Habbema Center for Clinical Decision Sciences, Department ofPublic Health, Erasmus Medical Center Rotterdam, The Netherlands
Andre_ChapFM.qxd 11/6/01 3:08 PM Page vii

R Brian Haynes Clinical Epidemiology and Biostatistics, McMasterUniversity Medical Centre, Hamilton, Ontario, Canada
Les M Irwig Department of Public Health and Community Medicine,University of Sydney, Australia
J André Knottnerus Netherlands School of Primary Care Research,University of Maastricht, The Netherlands
Pieta Krijnen Center for Clinical Decision Sciences, Department ofPublic Health, Erasmus Medical Center Rotterdam, The Netherlands
Johan van der Lei Department of Medical Informatics, ErasmusUniversity Rotterdam, The Netherlands
Jeroen G Lijmer Department of Clinical Epidemiology and Biostatistics,Academic Medical Centre, University of Amsterdam, The Netherlands
Jean W Muris Department of General Practice, University ofMaastricht, The Netherlands
David L Sackett Trout Research and Education Centre at Irish Lake,Markdale, Ontario, Canada
Onno P van Schayck Institute for Extramural and Transmural HealthCare, University of Maastricht, The Netherlands
Alan Schwartz Department of Medical Education, University of IllinoisCollege of Medicine, Chicago, Illinois, USA
Chris van Weel Department of General Practice and Social Medicine,Institute for Evidence-Based Practice, University of Nijmegen, TheNetherlands
Ron AG Winkens Transmural and Diagnostic Centre, AcademicHospital Maastricht, The Netherlands
THE EVIDENCE BASE OF CLINICAL DIAGNOSIS
viii
Andre_ChapFM.qxd 11/6/01 3:08 PM Page viii

to provide a comprehensive framework for (future) investigators who wantto do diagnostic research, and for clinicians, practitioners and students whoare interested to learn more about principles, and about relevantmethodological options and pitfalls. Clearly, not all topics relevant fordiagnostic research could be covered, nor could the selected subjects bedealt with in all detail. For those who wish to know more, the references inthe chapters can be a useful guide. In preparing the work, the contributorswere able to profit from the experience and insights collected and reportedby many leading clinical researchers in the field.
First, a general outline of diagnostic research is presented. What are thekey objectives, the challenges, and the corresponding options for studydesign? What should the architecture of diagnostic research look like toprovide us with an appropriate research strategy, yielding the clinicalinformation we are looking for, with a minimum burden for study patientsand an efficient use of resources? Second, important design features forstudying the accuracy and clinical impact of diagnostic tests and proceduresare dealt with in more detail, addressing the cross-sectional study, therandomised trial, and the before–after study. In addition, it is shown that theimpact of diagnostic tests varies with different clinical settings and targetpopulations, and indications are given as how to ensure that estimates oftest accuracy will travel and be transferable to other settings. Also, forclinical diagnostic studies, an overview of the most important data-analyticissues is presented, from simple two by two tables to multiple logisticregression analysis.
Nowadays, for both clinical investigators and readers of research articles,it is not enough to understand the methodology of original clinical studies.They must also know more about the techniques to summarise andsynthesise results from various clinical studies on a similar topic. Guidelinesfor diagnostic systematic reviews and meta-analysis are therefore presented.
Learning from accumulated clinical experience and the application ofdiagnostic knowledge in practice has much in common with retrieving andselecting information from clinical databases. Accordingly, diagnosticdecision support using information and communication technology (ICT)is addressed as an increasingly important domain for clinical practice,research, and education. Furthermore, as clinical research results can onlybe successfully incorporated into diagnostic decision making if the wayclinicians tend to solve medical problems is taken into account, an overviewof the domain of clinical problem solving is given. Eventually, we have torecognise that improving test use in daily care needs more than clinicalresearch, and presenting guidelines and other supportive materials.Therefore, the strategy of successful implementation – which has become afield of study in itself – is also covered.
This book includes contributions from many authors. In order to alloweach chapter to keep a logical structure in itself, a number of topics have
THE EVIDENCE BASE OF CLINICAL DIAGNOSIS
x
Andre_ChapFM.qxd 11/6/01 3:08 PM Page x

PREFACE
xi
been dealt with more than once, albeit to a varying extent. Instead of seeingthis as a problem, we think that it may be informative for readers to seeimportant issues considered from different perspectives.
Parallel to the preparation of this book, an initiative to reachinternational agreement of standards for reporting diagnostic accuracy(STARD) was taken and elaborated.This development can be expected tomake a significant contribution to improving the quality of publishedliterature on the value of diagnostic tests.We are happy that members of thegroup of initiators of STARD have contributed to this book as the authorsof chapters 4 and 6, and are looking forward to seeing these standardshaving an impact.
The field of diagnostic research is developing strongly and an increasingnumber of talented clinical investigators are working in (the methodologyof ) diagnostic research. In view of this dynamic field, we welcomecomments from readers and suggestions for possible improvements.
The contributors wish to thank Richard Smith from the BMJ, who hasso positively welcomed the initiative for this book, Trish Groves from theBMJ who gave very useful feedback on the proposed outline andstimulated us to work it out, and Mary Banks from BMJ Books, who hasprovided support and encouragement from the beginning and monitoredthe progress of the book until the work was done.
André Knottnerus
1 Cochrane AL. Effectiveness and efficiency. Random reflections on health services. TheNuffield Provincial Hospitals Trusts, 1972. Reprinted: London, the Royal Society ofMedicine Press Limited, 1999.
Andre_ChapFM.qxd 11/6/01 3:08 PM Page xi

Andre_ChapFM.qxd 11/6/01 3:08 PM Page xii

1
1 General introduction:evaluation of diagnosticproceduresJ ANDRÉ KNOTTNERUS, CHRIS VAN WEEL
Summary box
● Whereas the development of diagnostic technologies has greatlyaccelerated, the methodology of diagnostic research lags far behindthat of evaluation of treatment.
● Objectives of diagnostic testing are (1) detecting or excludingdisorders, (2) contributing to further diagnostic and therapeuticmanagement, (3) assessing prognosis, (4) monitoring clinicalcourse, and (5) measuring general health or fitness.
● Methodological challenges include dealing with complex relations,the “gold standard” problem, spectrum and selection bias, “soft”outcome measures, observer variability and bias, addressing clinicalrelevance, appropriate sample size, and rapid progress of applicableknowledge over time.
● Choosing the appropriate study design depends on the researchquestion; the most important designs are the cross-sectional study(to determine the accuracy and added value of diagnosticprocedures) and the randomised controlled trial (to evaluate theclinical impact of testing).
● In order to synthesise the results of various studies on the same topic,diagnostic systematic reviews and meta-analyses are powerful tools.
● To make the step from research to practice, clinical decisionanalysis, cost effectiveness studies, and quality of care research,including implementation studies, are indispensible.
Andre_Chap01.qxd 11/6/01 2:54 PM Page 1

THE EVIDENCE BASE OF CLINICAL DIAGNOSIS
2
Introduction
The development and introduction of new diagnostic technologies haveaccelerated greatly over the past few decades. This is reflected in asubstantial expansion of research on diagnostic tests. For example, thenumber of such publications we found in MEDLINE increased from about2000 in the period 1966–1970 to about 17 000 in the period 1996–2000.However, the evaluation of diagnostic techniques is far from being asadvanced as the evaluation of therapies.
At present, unlike the situation with regard to drugs, there are no formalrequirements that a diagnostic test must meet in order to be accepted orretained as a routine part of health care.This is related to another point: inspite of useful early initiatives1,2 the methodology for evaluation ofdiagnostics is not much crystallised, in contrast to the deeply rootedconsensus regarding the principles of the randomised controlled trial ontherapeutic effectiveness1,3 and the broad agreement on aetiologic studydesigns.4,5 It is not surprising, then, that serious methodological flaws areoften found in published diagnostic studies.6–8 A further point of concernis that the funding of diagnostic evaluation studies is poorly organised,especially if the research is not focused on particular body systems orcategories of disorders well covered by research foundations. Rather thanbeing limited to a particular body system, diagnostic evaluation studiesfrequently start from a complaint, a clinical problem, or certain tests.
The first crucial medical intervention in an episode of illness isdiagnostic, labelling symptoms and complaints as illness, and indicatingpossible disease and its prognosis. Effective and efficient therapy –including reassurance, “watchful waiting” and supporting patient self-efficacy – depends to a large extent on an accurate interpretation of (early)symptoms and the outcome of the diagnostic process. Therefore, becausethe quality of diagnostic procedures is indicative for the quality of health care as a whole, it is vital to overcome the shortfall in standards,methodology, and funding. Accurate evaluation of diagnostic performancewill contribute to the prevention of unjustified treatment, lack of treatmentor mistreatment, as well as unnecessary costs.
This introductory chapter presents an overview of the objectives ofdiagnostic testing and evaluation research, important methodologicalchallenges, and research design options.
Objectives
Diagnostic testing can be seen as the collection of additional informationwith the intention of (further) clarifying the character and prognosis of thepatient’s condition, and can include patients’ characteristics, symptomsand signs, history and physical examination items, or additional tests using
Andre_Chap01.qxd 11/6/01 2:54 PM Page 2

laboratory or other technical facilities. Not only a “test” must be considered,but also the specific question the test is supposed to answer.Therefore, theperformance of tests must be evaluated in accordance with their intendedobjectives. Objectives may include:
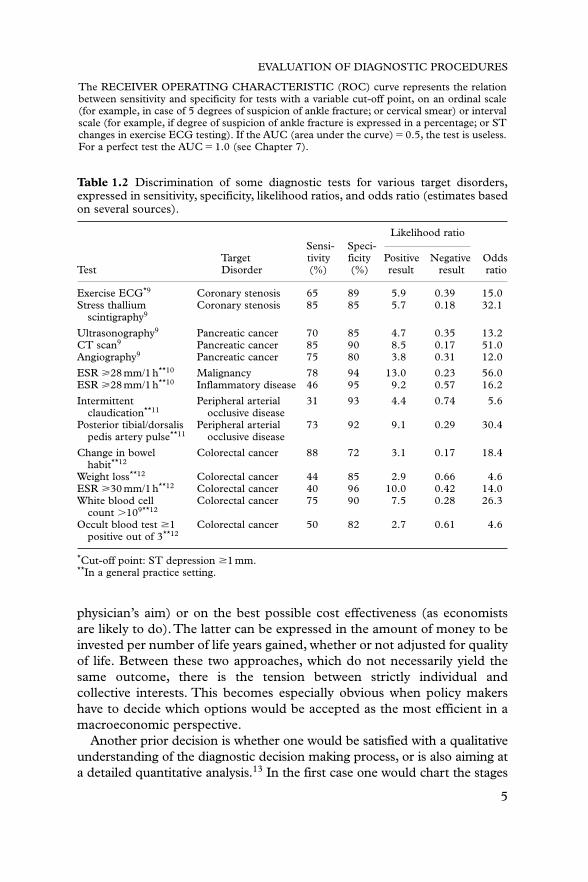
● Detecting or excluding disorders, by increasing diagnostic certainty as to theirpresence or absence. This can only be achieved if the test has sufficientdiscrimination. Table 1.1 shows the most common measures ofdiscrimination. Most of these can be simply derived from a 2 � 2 tablecomparing the test result with the diagnostic standard, as demonstratedby the example of ankle trauma. A more elaborate and comprehensiveexplanation of how to calculate these and other measures from collecteddata is presented in Chapter 7. Examples of tests for which suchmeasures have been assessed are given in Table 1.2. Such arepresentation allows various tests for the same purpose to be compared.This can show, for example, that less invasive tests (such asultrasonography) may be as good as or even better diagnostically thanmore invasive or hazardous ones (for example angiography). Also, it canbe shown that history data (for example change in bowel habit) may beat least as valuable as laboratory data. What is important is not just thediscrimination per se, but rather what a test may add to what cheaperand less invasive diagnostics already provide to the diagnostic process.This is relevant, for instance, in assessing the added value of liverfunction tests to history taking and physical examination in ill-defined,non-specific complaints.
● Contributing to the decision making process with regard to further diagnosticand therapeutic management, including the indications for therapy (forexample by determining the localisation and shape of a lesion) andchoosing the preferred therapeutic approach
● Assessing prognosis on the basis of the nature and severity of diagnosticfindings. This is a starting point for planning the clinical follow up andfor informing and – if justified – reassuring the patient
● Monitoring the clinical course of a disorder or a state of health such aspregnancy, or the clinical course of an illness during or after treatment
● Measuring physical fitness in relation to requirements, for example forsports or employment.
The evaluation of a diagnostic test concentrates on its added value for theintended application, taking into consideration the burden for the patientand any possible complications resulting from the test (such as intestinalperforation in endoscopy). This requires a comparison between thesituations with and without the use of the test, or a comparison with the useof other tests.
Prior to evaluation, one must decide whether to focus on maximising thehealth perspectives of the individual patient (which is usually the
EVALUATION OF DIAGNOSTIC PROCEDURES
3
Andre_Chap01.qxd 11/6/01 2:54 PM Page 3

THE EVIDENCE BASE OF CLINICAL DIAGNOSIS
4
Table 1.1 Commonly used measures of the discrimination of a diagnostic test Tfor disease D, illustrated with physical examination for detecting a fracture in ankletrauma, using x ray film as the reference standard.
D: result of x ray
T: conclusion of physical examination Fracture No fracture Total
Fracture 190 80 270No fracture 10 720 730Total 200 800 1000
The SENSITIVITY of T is the probability of a positive test result in people withD: P(T�|D�) � 190/200 � 0.95.The SPECIFICITY of T is the probability of a negative test result in people withoutD: P(T�|D�) � 720/800 � 0.90.
Note: sensitivity and specificity together determine the discrimination of a test.
The LIKELIHOOD RATIO (LR) of test result TX is the probability of test result TX in peoplewith D, divided by the probability of TX in people without D.
The general formula for LRX is:P(TX|D�)
P(TX|D�)
For a positive result, LR� is: P(T�|D�)
P(T�|D�)
which is equivalent to: Sensitivity�
190/200� 9.5
1�specificity 1�720/800
For a negative result, LR� is: P(T�|D�)
P(T�|D�)
which is equivalent to: 1�sensitivity�
1�190/200� 0.06
Specificity 720/800
Note: LR is an overall measure of the discrimination of test result TX. The test is useless ifLR � 1.The test is better the more LR differs from 1, that is, greater than 1 for LR� and lowerthan 1 for LR�.
For tests with multiple outcome categories, LRX can be calculated for every separatecategory x as the ratio of the probability of outcome category x among diseased and theprobability of outcome category x among non-diseased.
The PREDICTIVE VALUE of a test result TX is:for a positive result, the probability of D in persons with a positive test result:P(D�|T�) � 190/270 � 0.70.for a negative result, the probability of absence of D in persons with a negative result:P(D�|T�) � 720/730 � 0.99.
Note: the predictive value (posterior or post-test probability) must be compared with theestimated probability of D before T is carried out (the prior or pretest probability). For a gooddiscrimination, the difference between the post-test and the pretest probability should be large.
The ODDS RATIO (OR), or the cross-product ratio, represents the overall discrimination of a dichotomous test T, and is equivalent to the ratio of LR� and LR�.OR�(190�270)/(80�10)�171
Note: If OR � 1, T is useless. T is better the more OR differs from 1.
Andre_Chap01.qxd 11/6/01 2:54 PM Page 4
physician’s aim) or on the best possible cost effectiveness (as economistsare likely to do).The latter can be expressed in the amount of money to beinvested per number of life years gained, whether or not adjusted for qualityof life. Between these two approaches, which do not necessarily yield thesame outcome, there is the tension between strictly individual andcollective interests. This becomes especially obvious when policy makershave to decide which options would be accepted as the most efficient in amacroeconomic perspective.
Another prior decision is whether one would be satisfied with a qualitativeunderstanding of the diagnostic decision making process, or is also aiming ata detailed quantitative analysis.13 In the first case one would chart the stages
EVALUATION OF DIAGNOSTIC PROCEDURES
5
Table 1.2 Discrimination of some diagnostic tests for various target disorders,expressed in sensitivity, specificity, likelihood ratios, and odds ratio (estimates basedon several sources).
Likelihood ratioSensi- Speci-
Target tivity ficity Positive Negative OddsTest Disorder (%) (%) result result ratio
Exercise ECG*9 Coronary stenosis 65 89 5.9 0.39 15.0Stress thallium Coronary stenosis 85 85 5.7 0.18 32.1
scintigraphy9
Ultrasonography9 Pancreatic cancer 70 85 4.7 0.35 13.2CT scan9 Pancreatic cancer 85 90 8.5 0.17 51.0Angiography9 Pancreatic cancer 75 80 3.8 0.31 12.0
ESR �28 mm/1 h**10 Malignancy 78 94 13.0 0.23 56.0ESR �28 mm/1 h**10 Inflammatory disease 46 95 9.2 0.57 16.2
Intermittent Peripheral arterial 31 93 4.4 0.74 5.6claudication**11 occlusive disease
Posterior tibial/dorsalis Peripheral arterial 73 92 9.1 0.29 30.4pedis artery pulse**11 occlusive disease
Change in bowel Colorectal cancer 88 72 3.1 0.17 18.4habit**12
Weight loss**12 Colorectal cancer 44 85 2.9 0.66 4.6ESR �30 mm/1 h**12 Colorectal cancer 40 96 10.0 0.42 14.0White blood cell Colorectal cancer 75 90 7.5 0.28 26.3
count �109**12
Occult blood test �1 Colorectal cancer 50 82 2.7 0.61 4.6positive out of 3**12
*Cut-off point: ST depression �1 mm.**In a general practice setting.
The RECEIVER OPERATING CHARACTERISTIC (ROC) curve represents the relationbetween sensitivity and specificity for tests with a variable cut-off point, on an ordinal scale(for example, in case of 5 degrees of suspicion of ankle fracture; or cervical smear) or intervalscale (for example, if degree of suspicion of ankle fracture is expressed in a percentage; or STchanges in exercise ECG testing). If the AUC (area under the curve) � 0.5, the test is useless.For a perfect test the AUC � 1.0 (see Chapter 7).
Andre_Chap01.qxd 11/6/01 2:54 PM Page 5

and structure of the decision making process, in relation to the test to beevaluated. This may already provide sufficient insight, for instance if itbecomes clear beforehand that the result will not influence the decision to betaken. Examples of useless testing are (1) the value of the routineelectrocardiogram in acute chest pain, exploring the likelihood of a suspectedmyocardial infarction, with the consequent decision whether or not to admitthe patient to hospital; and (2) the value of “routine blood tests” in generalpractice for the decision as to whether or not to refer a patient with acuteabdominal pain to a surgeon. In addition to qualitatively mapping thestructure of the decision making process, quantitative analysis attempts toassess test discrimination and the ultimate clinical outcome, taking the risks(and the costs) of the test procedure into account.The choice of a qualitativeor a quantitative approach depends on the question to be answered and thedata available.
If a test has not yet been introduced, the prospects for a good evaluationare better than if it is already in general use. It is then, for example, stillpossible to define an appropriate control group to whom the test is notapplied, so that its influence on the prognosis can be investigated. Inaddition, at such an early stage the conclusion of the analysis can still beused in the decision regarding introduction. Furthermore, it is possible toplan a procedure for monitoring and evaluation after introduction. All ofthis emphasises the importance of developing an evaluation programmebefore a test is introduced.
A common misunderstanding is that only expensive, advanceddiagnostic technology cause unacceptable increases in healthcare costs; infact, cheap but very frequently used (routine) tests account for a major partof direct costs. Moreover, these tests greatly influence other costs, as theyoften preselect patients for more expensive procedures.Yet the performanceof such low-threshold diagnostics has often not been adequately evaluated.Examples include many applications of haematological, clinicochemical,and urine tests.14–16
Methodological challenges
In the evaluation of diagnostic procedures a number of methodologicalchallenges have to be considered.
Complex relations
Most diagnostics have more than one indication or are relevant for morethan one nosological outcome. In addition, tests are often not applied inisolation but in combinations, for instance in the context of protocols.Ideally, diagnostic research should reflect the healthcare context,17 but it isgenerally impossible to investigate all aspects in one study. Therefore,
THE EVIDENCE BASE OF CLINICAL DIAGNOSIS
6
Andre_Chap01.qxd 11/6/01 2:54 PM Page 6

EVALUATION OF DIAGNOSTIC PROCEDURES
7
choices must be made as to which issues are the most important.Multivariable statistical techniques are available to allow for the (added)value of various diagnostic data, both separately and in combination, andalso in the form of diagnostic prediction rules.18,19 Such techniques wereoriginally developed for the purpose of analysing aetiologic data, generallyfocusing on the overall aetiologic impact of a factor adjusted for covariables.Diagnostic analysis aims to specify test performance in clinical subgroups orto identify the set of variables that yield the best individual diagnosticprediction, which is a completely different perspective. Much work remainsto be done to improve the methodology of diagnostic data analysis.20
Diagnostic data analysis will be discussed further in Chapter 7.
The “gold” standard problem
To evaluate the discriminatory power of a test, its results must becompared with an independently established standard diagnosis. However,a “gold” standard, providing full certainty on the health status, rarely exists.Even x rays, CT scans and pathological preparations may produce falsepositive and false negative results. The aim must then be to define anadequate reference standard that approximates the “gold” standard asclosely as possible.
Sometimes one is faced with the question whether any appropriatereference standard procedure exists at all. For example, in determining thediscrimination of liver tests for diagnosing liver pathology, neither imagingtechniques nor biopsies can detect all abnormalities. In addition, as a liverbiopsy is an invasive procedure it is unsuitable for use as a standard in anevaluation study. A useful independent standard diagnosis may not evenexist conceptually, for example when determining the predictive value ofsymptoms that are themselves part of the disease definition, as in migraine,or when the symptoms and functionality are more important formanagement decisions than the anatomical status, as in prostatism. Also, instudying the diagnostic value of clinical examination to detect severepathology in non-acute abdominal complaints, a comprehensive invasivestandard diagnostic screening, if at all possible or ethically allowed, wouldyield many irrelevant findings and not all relevant pathology would beimmediately found. An option, then, is diagnostic assessment after a followup period by an independent panel of experts, representing a “delayedtype” cross-sectional study.21 This may not be perfect, but can be the mostacceptable solution.1
A further issue is the dominance of prevailing reference standards. Forexample, as long as classic angiography is considered the standard whenvalidating new vascular imaging techniques, the latter will always seem lessvalid because perfect agreement is never attainable. However, as soon as thenew method comes to be regarded as sufficiently valid to be accepted as the
Andre_Chap01.qxd 11/6/01 2:54 PM Page 7

THE EVIDENCE BASE OF CLINICAL DIAGNOSIS
8
standard, the difference will from then on be explained in favour of thisnew method. In addition, when comparing advanced ultrasoundmeasurements in blood vessels with angiography, one must accept that thetwo methods actually measure different concepts: the first measures bloodflow, relevant to explain the symptoms clinically, whereas the secondreflects the anatomical situation, which is important for the surgeon.Furthermore, the progress of clinicopathological insights is of greatimportance. For example, although clinical pattern X may first be thestandard to evaluate the significance of microbiological findings, it willbecome of secondary diagnostic importance once the infectious agentcausing X has been identified. The agent will then be the diagnosticstandard, as illustrated by the history of the diagnosis of tuberculosis.
In Chapters 3 and 6 more will be said about reference standard problems.
Spectrum and selection bias
The evaluation of diagnostics may be flawed by many types of bias.1,22,23
The most important of these are spectrum bias and selection bias.Spectrum bias may occur when the discrimination of the diagnostic is
assessed in a study population with a different clinical spectrum (forinstance in more advanced cases) than will be found among those in whomthe test is to be applied in practice. This may, for example, happen withtests calibrated in a hospital setting but applied in general practice. Also,sensitivity may be determined in seriously diseased subjects, whereasspecificity is tested in clearly healthy subjects. Both will then be grosslyoverestimated relative to the practical situation, where testing is reallynecessary because it is clinically impossible to distinguish in advance whois healthy and who is diseased.
Selection bias is to be expected if there is a relation between the test resultand the probability of being included in the study population in whichthe test is calibrated. For example, subjects with an abnormal exerciseelectrocardiogram are relatively likely to be preselected for coronaryangiography. Consequently, if this exercise test is calibrated amongpreselected subjects, a higher sensitivity and a lower specificity will be foundthan if this preselection had not occurred.24 Similarly, on the basis of referralpatterns alone it is to be expected that the sensitivity of many tests is higherin the clinic than in general practice, and the specificity lower.
Although spectrum and selection biases are often related, in the first theclinical picture is the primary point of concern, whereas in the latter themechanism of selection is the principal issue.These types of bias may affectnot only sensitivity and specificity, but also all other measures ofdiscrimination listed in Table 1.1.25
Chapters 2 and 6 will further address the issue of dealing with spectrumand selection biases.
Andre_Chap01.qxd 11/6/01 2:54 PM Page 8

EVALUATION OF DIAGNOSTIC PROCEDURES
9
“Soft” measures
Subjective factors such as pain, feeling unwell and the need for reassuranceare of great importance in diagnostic management. Most decisions for awatchful waiting strategy in the early phase of an episode of illness are basedon the valuation of “soft” measures.These often determine the indication fordiagnostic examinations, and may themselves be part of the diagnostics (forexample a symptom or complaint) to be evaluated. Also, such factors aregenerally indispensable in the assessment of the overall clinical outcome.Evaluation studies should, on the one hand, aim as much as possible toobjectify these subjective factors in a reproducible way. On the other hand,interindividual and even intraindividual differences will always play a part26
and should be acknowledged in the clinical decision making process.
Observer variability and observer bias
Variability between different observers, as well as for the same observerin reading and interpreting diagnostic data, should not only beacknowledged for “soft” diagnostics such as history taking and physicalexamination, but also for “harder” ones like x rays, CT scans andpathological slides. Even tests not involving any human factors show inter-and intrainstrument variability. Such variability should be limited if thediagnostic is to produce useful information.
At the same time, evaluation studies should beware of systematicobserver bias as a result of prior knowledge about the subjects examined.Clearly, if one wishes to evaluate whether a doctor can accurately diagnosean ankle fracture based on history and clinical examination, it must becertain that he is not aware of an available x ray result; and a pathologistmaking an independent final diagnosis should not be informed about themost likely clinical diagnosis.27 In such situations “blinding” is required. Adifferent form of observer bias could occur if the diagnosticians areprejudiced in favour of one of the methods to be compared, as they mayunconsciously put greater effort into that technique. A further challenge isthat the experience and skill required should be equal for the methodscompared, if these are to have a fair chance in the assessment. In thisrespect, new methods are at risk of being disadvantaged, especially shortlyafter being introduced.
Discrimination does not mean usefulness
For various reasons, a test with very good discrimination does notnecessarily influence management.
To begin with, a test may add too little to what is already known clinicallyto alter management. Furthermore, the physician may take insufficient
Andre_Chap01.qxd 11/6/01 2:54 PM Page 9

THE EVIDENCE BASE OF CLINICAL DIAGNOSIS
10
account of the information provided by the test.This is a complex problem.For instance, studies of the consequences of routine blood testing haveshown that in some cases an unaltered diagnosis still led to changes in theconsidered policy.14 In a study on the therapeutic impact of uppergastrointestinal endoscopy, a number of changes (23%) in managementwere made in the absence of a change in diagnosis, whereas in manypatients (30%) in whom the diagnosis was changed management was notaltered.28 Also, a test may detect a disorder for which no effective treatmentis available. For example, the MRI scan provides refined diagnosticinformation with regard to various brain conditions for which no therapy isyet in prospect. Finally, as discussed in the previous section, supplementarytest results may not be relevant for treatment decisions.
For this reason we strongly recommend that evaluation studies investigateboth the discrimination of a test and its influence on management.
Indication area and prior probability
Whether a test can effectively detect or exclude a particular disorder isinfluenced by the prior probability of that disorder. A test is generally notuseful if the prior probability is either very low or very high: not only willthe result rarely influence patient management, but the risk of, respectively,a false positive or a false negative result is relatively high. In other words,there is an “indication area” for the test between these extremes of priorprobability.9,10 Evaluation of diagnostics should therefore address the issueof whether the test could be particularly useful for certain categories ofprior probability. For example, tests with a moderate specificity are notuseful for screening in an asymptomatic population (with a low priorprobability) because of the high risk of false positive results.
Small steps and large numbers
Compared with therapeutic effectiveness studies, evaluation studies ofdiagnostic procedures have often neglected the question of whether thesample size is adequate to provide the desired information with a sufficientdegree of certainty. A problem is that progress in diagnostic decisionmaking often takes the form of a series of small steps so as to gain incertainty, rather than one big breakthrough. Evaluating the importance ofa small step, however, requires a relatively large study population.
Changes over time and the mosaic of evidence
Innovations in diagnostic technology may proceed at such a speed that athorough evaluation may take longer than the development of even moreadvanced techniques. For example, the results of evaluation studies on thecost effectiveness of the CT scan had not yet crystallised when the MRIand PET scans appeared on the scene. So, the results of evaluation studies
Andre_Chap01.qxd 11/6/01 2:54 PM Page 10

EVALUATION OF DIAGNOSTIC PROCEDURES
11
may already be lagging behind when they appear.Therefore, there is a needfor general models (scenarios) for the evaluation of particular (types of)tests and test procedures, whose overall framework is relatively stable andinto which information on new tests can be entered by substituting therelevant piece in the whole mosaic. This allows, for instance, a quickevaluation of the impact of new mammographic or DNA techniques withbetter discrimination on the cost effectiveness of breast cancer screening, ifother pieces of the mosaic (such as treatment efficacy) have not changed.As discrimination itself can often be relatively rapidly assessed by means ofa cross-sectional study, this may avoid new prospective studies. The samecan be said for the influence of changes in relevant costs, such as fees formedical treatment or the price of drugs.
Research designs
There are various methodological approaches for evaluating diagnostictechnologies, including original clinical research on the one hand, andsystematically synthesising the findings of already performed empiricalstudies and clinical expertise on the other.
For empirical clinical studies, a range of design options is available.Theappropriate study design depends on the research question to be answered(Table 1.3). In diagnostic accuracy studies the relationship between testresult and reference standard has to be assessed cross-sectionally. This can be achieved by a cross-sectional survey, but especially in earlyvalidation studies other approaches (case–referent or test result-basedsampling) can be most efficient. Design options for studying the impact of diagnostic testing on clinical decision making and patient prognosis are the “diagnostic randomised controlled trial” (RCT), which ismethodologically the strongest approach, and the before–after study. Also,cohort and case–control designs have been shown to have a place in thiscontext. In Chapter 2, the most important strategic considerations inchoosing the appropriate design in diagnostic research will be specificallyaddressed.
Current knowledge can be synthesised by systematic reviews, meta-analyses, clinical decision analysis, cost effectiveness studies and consensusmethods, with the ultimate aim of integrating and translating researchfindings for implementation in practice.
In the following, issues of special relevance to diagnostic evaluationstudies will be briefly outlined.
Clinical studies
A common type of research is the cross-sectional study, assessing therelationship between diagnostic test results and the presence of particular
Andre_Chap01.qxd 11/6/01 2:54 PM Page 11

THE EVIDENCE BASE OF CLINICAL DIAGNOSIS
12
disorders. This relationship is usually expressed in the measures ofdiscrimination included in Table 1.1. Design options are: (1) a survey in an“indicated population”, representing subjects in whom the studied testwould be considered in practice; (2) sampling groups with (cases) andwithout disease (referents) to compare their test distributions; or (3)sampling groups with different test results, between which the occurrenceof a disease is compared. It is advisable to include in the evaluation alreadyadopted tests, as this is a direct way to obtain an estimate of the addedvalue of the new test. The cross-sectional study will be dealt with in moredetail in Chapter 3.
In an RCT the experimental group undergoes the test to be evaluated,while a control group undergoes a different (for example the usual) or notest.This allows the assessment of not only differences in the percentage ofcorrect diagnoses, but also the influence of the evaluated test onmanagement and prognosis. A variant is to apply the diagnostic test to allpatients but to disclose its results to the caregivers for a random half of thepatients, if ethically justified. This constitutes an ideal placebo procedurefor the patient. Although diagnostic RCTs are not easy to carry out andoften not feasible, several have been already carried out some time
Table 1.3 Methodological options in diagnostic research in relation to studyobjectives.
Study objective Methodological options
Clinical studiesDiagnostic accuracy Cross-sectional study
surveycase–referent samplingtest result-based sampling
Impact of diagnostic testing on prognosis Randomised controlled trialor management Cohort study
Case–control studyBefore–after study
Synthesising findings and expertiseSynthesising results of multiple studies Systematic review
Meta-analysisEvaluation of most effective or cost Clinical decision analysis
effective diagnostic strategy Cost effectiveness analysisTranslating findings for practice Integrating results of the
above mentioned approachesExpert consensus methodsDeveloping guidelines
Integrating information in clinical practiceICT support studiesStudying diagnostic problem solvingEvaluation of implementation in practice
Andre_Chap01.qxd 11/6/01 2:54 PM Page 12

EVALUATION OF DIAGNOSTIC PROCEDURES
13
ago.29–34 Among the best known are the early trials on the effectiveness ofbreast cancer screening, which have often linked a standardisedmanagement protocol to the screening result.35,36 The randomisedcontrolled trial in diagnostic research is further discussed in Chapter 4.
If the prognostic value of a test is to be assessed and an RCT is not feasible,its principles can serve as the paradigm in applying other methods, one suchbeing the cohort study. The difference from the RCT is that the diagnosticinformation is not randomly assigned, but a comparison is made between twopreviously established groups.37 It has the methodological problem that onecan never be sure, especially regarding unknown or unmeasurablecovariables, whether the compared groups have similar disease or prognosticspectra to begin with. A method providing relatively rapid results regardingthe clinical impact of a test is the case–control study.This is often carried outretrospectively, that is, after the course and the final status of the patients areknown, in subjects who at the time have been eligible for the diagnostic testto be evaluated. It can be studied whether “indicated subjects” showing anadverse outcome (cases) underwent the diagnostic test more or lessfrequently than indicated subjects without such outcome (controls).A basic requirement is that the diagnostic must have been available to allinvolved at the time. Well known examples are case–control studies on therelationship between mortality from breast cancer and participation in breastcancer screening programmes.38,39 This is an efficient approach, althoughpotential bias because of lack of prior comparability of tested and non-testedsubjects must once again be borne in mind.
The influence of a diagnostic examination on the physician’s managementcan be also investigated by comparing the intended management policiesbefore and after test results are available. Such before–after comparisons(diagnostic impact studies) have their own applications, limitations andprecautionary measures, as reviewed by Guyatt et al.40 The method has, forexample, been applied in determining the added value of the CT scan andin studying the diagnostic impact of haematological tests in generalpractice.41,42 The before–after study design will be outlined in Chapter 5.
Although using appropriate inclusion and exclusion criteria for studysubjects is as important as in therapeutic research, in diagnostic researchdefining such criteria is less well developed. However, appropriate criteriaare indispensible in order to focus on the clinical question at issue, therelevant spectrum of clinical severity, the disorders to be evaluated and thedesired degree of selection of the study population (for example primarycare or referred population).43
Synthesising research findings and clinical expertise
Often the problem is not so much a lack of research findings but the lack of a good summary and systematic processing of those findings.
Andre_Chap01.qxd 11/6/01 2:54 PM Page 13

THE EVIDENCE BASE OF CLINICAL DIAGNOSIS
14
A diagnostic systematic review, and meta-analysis of the pooled data of anumber of diagnostic studies, can synthesise the results of those studies.This provides an overall assessment of the value of diagnosticprocedures,44,45 and can also help to identify differences in test accuracybetween clinical subgroups. In this way, an overview of the current state ofknowledge is obtained within a relatively short time. At present, thismethod is very much under development. One is aiming at bridging amethodological backlog, compared to the more established therapeuticsystematic review and meta-analysis. The methodology of systematicallyreviewing studies on the accuracy of diagnostic tests is elaborated inChapter 8.
Another important approach is clinical decision analysis, systematicallycomparing various diagnostic strategies as to their clinical outcome or costeffectiveness, supported by probability and decision trees. If goodestimates of the discrimination and risks of testing, the occurrence andprognosis of suspected disorders, and the “value” of various clinicaloutcomes are available, a decision tree can be evaluated quantitatively inorder to identify the clinically optimal or most cost effective strategy. Animportant element in the decision analytic approach is the combinedanalysis of diagnostic and therapeutic effectivenes. In this context, aqualitative analysis can be very useful. For example, non-invasivetechniques nowadays show a high level of discrimination in diagnosingcarotid stenoses, even in asymptomatic patients. This allows improvedpatient selection for the invasive and more hazardous carotid angiography,which is needed to make final decisions regarding surgical intervention.But if surgery has not been proved to influence the prognosis ofasymptomatic patients favourably compared to non-surgical management,46
the decision tree is greatly simplified as it no longer would include eitherangiography or surgery, and maybe not even non-invasive testing.
Decision analysis does not always provide an answer. The problemmay be too complex to be summarised in a tree, essential data may bemissing, and there is often a lack of agreement on key assumptionsregarding the value of outcomes. Therefore, consensus procedures areoften an indispensable step in the translational process from clinicalresearch to guidelines for practice. In these procedures, clinical expertsintegrate the most recent state of knowledge with their experience toreach agreement on clinical guidelines regarding the preferred diagnosticapproach of a particular medical problem, differentiated for relevantsubgroups.47,48
Integrating information in clinical practice
In order to help clinical investigators harvest essential diagnostic researchdata from clinical databases and to support clinicians in making and
Andre_Chap01.qxd 11/6/01 2:54 PM Page 14

EVALUATION OF DIAGNOSTIC PROCEDURES
15
improving diagnostic decisions, medical informatics and ICT (informationand communications technology) innovations are indispensible. However,as described in Chapter 9, to use the potentials in this field optimally,specific methodological and practical requirements must be met.
The information processing approaches outlined in the previous sectionconstitute links between research findings and clinical practice, and can beapplied in combination to support evidence-based medicine. How suchinput can have optimal impact on the diagnostic decision making ofindividual doctors is, however, far from simple or straightforward.Therefore, given the growing cognitive requirements of diagnostictechniques, studies to increase our insight in diagnostic problem solving byclinicians is an increasingly important part of diagnostic research. Thistopic is discussed in Chapter 10.
Information from good clinical studies, systematic reviews and guidelineconstruction is necessary but in many cases not sufficient for improvingroutine practice. In view of this, during the last decade, implementationresearch has been strongly developed to face this challenge and to facilitatethe steps from clinical science to patient care. Accordingly, Chapter 11 dealswith implementation of (cost-)effective test ordering in clinical practice.
Conclusion
Diagnostic technology assessment would be greatly stimulated if formalstandards for the evaluation of diagnostics were to be formulated, as arequirement for market acceptance. Health authorities could take theinitiative in assembling panels of experts to promote and monitor theevaluation of both new and traditional diagnostic facilities. Criteria for the acceptance and retention of diagnostics in clinical practice should be developed. Furthermore, professional organisations have a greatresponsibility to set, implement, maintain, and improve clinical standards.More effective international cooperation would be useful, as it has provedto be in the approval and quality control of drugs. In this way, theavailability of resources for industrial, private, and governmental fundingfor diagnostic technology assessment would also be stimulated.
As regards the feasibility of diagnostic evaluation studies, the required sizeand duration must be considered in relation to the speed of technologicalprogress. This speed can be very great, for instance in areas where theprogress of molecular genetic knowledge and information andcommunication technology play an important part. Especially in such areas,updating of decision analyses, expert assessments and scenarios by insertingnew pieces of the “mosaic” of evidence may be more useful than fullycomprehensive, lengthy trials.This may, for example, be very relevant for theevaluation of diagnostic areas where traditional tests will be replaced by
Andre_Chap01.qxd 11/6/01 2:54 PM Page 15

THE EVIDENCE BASE OF CLINICAL DIAGNOSIS
16
DNA diagnostics in the years to come. Finally, successful integration of“soft” health measures, quality of life aspects, and health economicobjectives into clinical evaluations will require much additional research,and methodological and ethical consideration.49
References
1 Feinstein AR. Clinical epidemiology. The architecture of clinical research. Philadelphia: WBSaunders, 1985.
2 Sackett DL, Haynes RB,Tugwell P. Clinical epidemiology: a basic science for clinical medicine.Boston: Little, Brown and Co., 1985.
3 Pocock SJ. Clinical trials, a practical approach. New York: John Wiley & Sons, 1983.4 Kleinbaum DG, Kupper LL, Morgenstern H. Epidemiologic research, principles and
quantitative methods. Belmont (CA): Wadsworth, 1982.5 Miettinen OS. Theoretical epidemiology, principles of occurrence research in medicine. New
York: John Wiley & Sons, 1985.6 Sheps SB, Schechter MT. The assessment of diagnostic tests. A survey of current medical
research. JAMA 1984;252:2418–22.7 Reid ML, Lachs MS, Feinstein AR. Use of methodological standards in diagnostic
research. Getting better but still not good. JAMA 1995;274:645–51.8 Lijmer JG, Mol BW, Heisterkamp S, et al. Empirical evidence of design-related bias in
studies of diagnostic tests. JAMA 1999;282:1061–6.9 Panzer RJ, Black ER, Griner PF, eds. Diagnostic strategies for common medical problems.
Philadelphia: American College of Physicians, 1991.10 Dinant GJ, Knottnerus JA, Van Wersch JW. Discriminating ability of the erythrocyte
sedimentation rate: a prospective study in general practice. Br J Gen Pract 1991;41:365–70.
11 Stoffers HEJH, Kester ADM, Kaiser V, Rinkens PELM, Knottnerus JA. Diagnostic valueof signs and symptoms associated with peripheral arterial obstructive disease seen ingeneral practice: a multivariable approach. Med Decision Making 1997;17:61–70.
12 Fijten GHF. Rectal bleeding, a danger signal? Amsterdam: Thesis Publishers, 1993.13 Knottnerus JA, Winkens R. Screening and diagnostic tests. In: Silagy C, Haines A, eds.
Evidence based practice in primary care. London: BMJ Books, 1998.14 Dinant GJ. Diagnostic value of the erythrocyte sedimentation rate in general practice. PhD
thesis, University of Maastricht, 1991.15 Hobbs FD, Delaney BC, Fitzmaurice DA, et al. A review of near patient testing in primary
care. Health Technol Assess 1997;1:i–iv,1–229.16 Campens D, Buntinx F. Selecting the best renal function tests. A meta-analysis of
diagnostic studies. Int J Technol Assess Health Care 1997;13:343–56.17 van Weel C, Knottnerus JA. Evidence-based interventions and comprehensive treatment.
Lancet 1999;353:916–18.18 Spiegelhalter DJ, Crean GP, Holden R, et al. Taking a calculated risk: predictive scoring
systems in dyspepsia. Scand J Gastroenterol 1987;22(suppl 128):152–60.19 Knottnerus JA. Diagnostic prediction rules: principles, requirements, and pitfalls. Primary
Care 1995;22:341–63.20 Knottnerus JA. Application of logistic regression to the analysis of diagnostic data. Med
Decision Making 1992;12:93–108.21 Knottnerus JA, Dinant GJ. Medicine based evidence, a prerequisite for evidence based
medicine. BMJ 1997;315:1109–1110.22 Ransohoff DF, Feinstein AR. Problems of spectrum and bias in evaluating the efficacy of
diagnostic tests. N Engl J Med 1978;299:926–30.23 Begg CB. Biases in the assessment of diagnostic tests. Statistics Med 1987;6:411–23.24 Green MS. The effect of validation group bias on screening tests for coronary artery
disease. Statistics Med 1985;4:53–61.25 Knottnerus JA, Leffers P. The influence of referral patterns on the characteristics of
diagnostic tests. J Clin Epidemiol 1992;45:1143–54.
Andre_Chap01.qxd 11/6/01 2:54 PM Page 16

EVALUATION OF DIAGNOSTIC PROCEDURES
17
26 Zarin OA, Pauker SG. Decision analysis as a basis for medical decision making: the treeof Hippokrates. J Med Philos 1984;9:181–213.
27 Schwartz WB, Wolfe HJ, Pauker SG. Pathology and probabilities, a new approach tointerpreting and reporting biopsies. N Engl J Med 1981;305:917–23.
28 Liechtenstein JI, Feinstein AR, Suzio KD, DeLuca V, Spiro HM. The effectiveness ofpandendoscopy on diagnostic and therapeutic decisions about chronic abdominal pain.J Clin Gastroenterol 1980;2:31–6.
29 Dronfield MW, Langman MJ, Atkinson M, et al. Outcome of endoscopy and bariumradiography for acute upper gastrointestinal bleeding: controlled trial in 1037 patients.BMJ 1982;284:545–8.
30 Brett GZ. The value of lung cancer detection by six-monthly chest radiographs. Thorax1968;23:414–20.
31 Brown VA, Sawers RS, Parsons RJ, Duncan SL, Cooke ID. The value of antenatalcardiotocography in the management of high risk pregnancy: a randomised controlledtrial. Br J Obster Gynaecol 1982;89:716–22.
32 Flynn AM, Kelly J, Mansfield H, Needham P, O’Connor M, Viegas O. A randomisedcontrolled trial of non-stress antepartum cardiotocography. Br J Obster Gynaecol1982;89:427–33.
33 Durbridge TC, Edwards F, Edwards RG, Atkinson M. An evaluation of multiphasicscreening on admission to hospital. Med J Aust 1976;1:703–5.
34 Hull RD, Hirsch J, Carter CJ, et al. Diagnostic efficacy of impedance phletysmography forclinically suspected deep-vein thrombosis. A randomized trial. Ann Intern Med 1985;102:21–8.
35 Shapiro S,Venet W, Strax Ph, Roeser R.Ten to fourteen year effect of screening on breastcancer mortality. J Natl Cancer Inst 1982;69:349–55.
36 Tabár L, Fagerberg CJG, Gad A, Badertorp L. Reduction in mortality from breast cancerafter mass screening with mammography. Lancet 1985;1:829–31.
37 Harms LM, Schellevis FG, van Eijk JT, Donker AJ, Bouter LM. Cardiovascular morbidityand mortality among hypertensive patients in general practice: the evaluation of long-termsystematic management. J Clin Epidemiol 1997;50:779–86.
38 Collette HJA, Day NE, Rombach JJ, de Waard F. Evaluation of screening for breast cancerin a non-randomised study (the DOM project) by means of a case control study. Lancet1984;1:1224–6.
39 Verbeek ALM, Hendriks JHCL, Holland R, Mravunac M, Sturmans F, Day NE.Reduction of breast cancer mortality through mass-screening with modernmammography. Lancet 1984;1:1222–4.
40 Guyatt GH,Tugwell P, Feeny DH, Drummond MF, Haynes RB.The role of before–afterstudies of therapeutic impact in the evaluation of diagnostic technologies. J Chronic Dis1986;39:295–304.
41 Fineberg HV, Bauman R. Computerized cranial tomography: effect on diagnostic andtherapeutic planns. JAMA 1977;238:224–7.
42 Dinant GJ, Knottnerus JA, van Wersch JW. Diagnostic impact of the erythrocytesedimentation rate in general practice: a before–after analysis. Fam Pract 1991;9:28–31.
43 Knottnerus JA. Medical decision making by general practitioners and specialists. FamPract 1991;8:305–7.
44 Irwig L, Macaskill P, Glasziou P, Fahey M. Meta-analytic methods for diagnostic testaccuracy. J Clin Epidemiol 1995;48:119–130.
45 Buntinx F, Brouwers M. Relation between sampling device and detection of abnormalityin cervical smears: a meta-analysis of randomised and quasi-randomised studies. BMJ1996;313:1285–90.
46 Benavente O, Moher D, Pham B. Carotid endarterectomy for asymptomatic carotidstenosis: a meta-analysis. BMJ 1998;317:1477–80.
47 Van Binsbergen JJ, Brouwer A, van Drenth BB, Haverkort AFM, Prins A, van derWeijden T. Dutch College of General Practitioners standard on cholesterol (M20). HuisartsWet 1991;34:551–7.
48 Consensus on non-invasive diagnosis of peripheral arterial vascular disease. Utrecht:CBO, 1994.
49 Feinstein AR. Clinimetrics. New Haven:Yale University Press, 1987.
Andre_Chap01.qxd 11/6/01 2:54 PM Page 17

Andre_Chap01.qxd 11/6/01 2:54 PM Page 18

19
2 The architectureof diagnostic researchDAVID L SACKETT, R BRIAN HAYNES
Summary box
● Because diagnostic testing aims to discriminate between clinically“normal” and “abnormal”, the definition of “normal” and “thenormal range” is a basic issue in diagnostic research. Although the“gaussian” definition is traditionally common, the “therapeuticdefinition” of normal is the most clinically relevant.
● The diagnostic research question to be answered has to be carefullyformulated, and determines the appropriate research approach.The four most relevant types of question are:
● Phase I questions: Do patients with the target disorder havedifferent test results from normal individuals? The answerrequires a comparison of the distribution of test results amongpatients known to have the disease and people known not to havethe disease.
● Phase II questions: Are patients with certain test resultsmore likely to have the target disorder than patients withother test results? This can be studied in the same dataset thatgenerated the Phase I answer, but now test characteristics such assensitivity and specificity are estimated.
● Only if Phase I and Phase II studies, performed in “ideal circumstances”, are sufficiently promising as to possiblediscrimination between diseased and non-diseased subjects, it isworth evaluating the test under “usual” circumstances. Phase IIIand IV questions must then be answered.
● Phase III questions: Among patients in whom it is clinicallysensible to suspect the target disorder, does the test result
Andre_Chap02.qxd 11/6/01 2:57 PM Page 19

Introduction
When making a diagnosis, clinicians seldom have access to reference or“gold” standard tests for the target disorders they suspect, and often wish toavoid the risks or costs of these reference standards, especially when they areinvasive, painful, or dangerous. No wonder, then, that clinical researchersexamine relationships between a wide range of more easily measuredphenomena and final diagnoses. These phenomena include elements of thepatient’s history, physical examination, images from all sorts of penetratingwaves, and the levels of myriad constituents of body fluids and tissues. Alas,even the most promising phenomena, when nominated as diagnostic tests,almost never exhibit a one-to-one relationship with their respective targetdisorders, and several different diagnostic tests may compete for primacy indiagnosing the same target disorder. As a result, considerable effort has beenexpended at the interface between clinical medicine and scientific methodsin an effort to maximise the validity and usefulness of diagnostic tests.Thisbook describes the result of those efforts, and this chapter focuses on thespecific sorts of questions posed in diagnostic research and the studyarchitectures used to answer them.
At the time that this book was being written, considerable interest wasbeing directed to questions about the usefulness of the plasmaconcentration of B-type natriuretic peptide in diagnosing left ventriculardysfunction.1 These questions were justified on two grounds: first, leftventricular dysfunction is difficult to diagnose on clinical examination; andsecond, randomised trials have shown that treating it (with angiotensin
THE EVIDENCE BASE OF CLINICAL DIAGNOSIS
20
distinguish those with and without the target disorder?To get the appropriate answer, a consecutive series of such patients shouldbe studied.
● The validity of Phase III studies is threatened when cases where thereference standard or diagnostic test is lost, not performed, orindeterminate, are frequent or inappropriately dealt with.
● Because of a varying patient mix, test characteristics such assensitivity, specificity and likelihood ratios may vary betweendifferent healthcare settings.
● Phase IV questions: Do patients who undergo the diagnostictest fare better (in their ultimate health outcomes) thansimilar patients who do not? These questions have to beanswered by randomising patients to undergo the test of interest orsome other (or no) test.
Andre_Chap02.qxd 11/6/01 2:57 PM Page 20
converting enzyme inhibitors) reduces its morbidity and mortality. Becausereal examples are far better than hypothetical ones in illustrating not justthe overall strategies but also the down-to-earth tactics of clinical research,we will employ this one in the following paragraphs. To save space andtongue twisting we will refer to the diagnostic test, B-type natriureticpeptide, as BNP and the target disorder it is intended to diagnose, leftventricular dysfunction, as LVD.The starting point in evaluating this or anyother promising diagnostic test is to decide how we will define its normalrange.
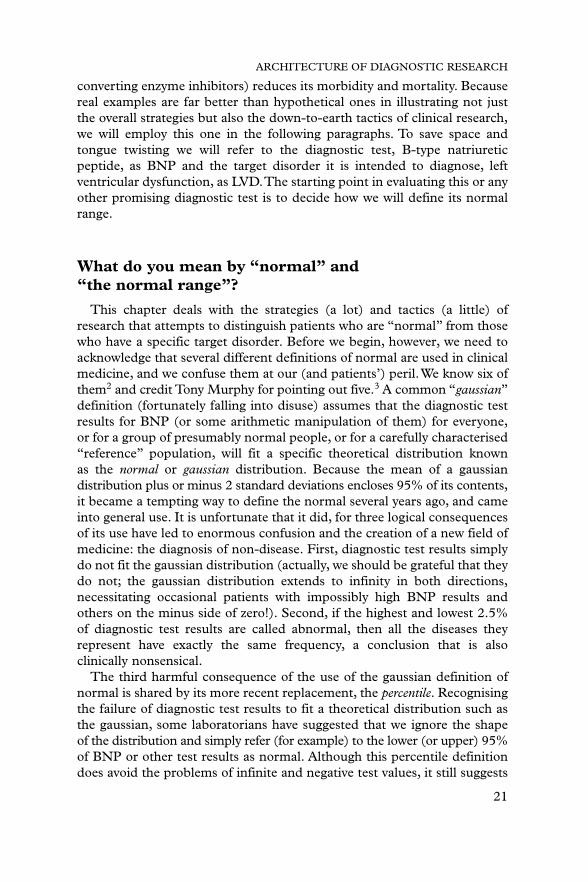
What do you mean by “normal” and“the normal range”?
This chapter deals with the strategies (a lot) and tactics (a little) ofresearch that attempts to distinguish patients who are “normal” from thosewho have a specific target disorder. Before we begin, however, we need toacknowledge that several different definitions of normal are used in clinicalmedicine, and we confuse them at our (and patients’) peril.We know six ofthem2 and credit Tony Murphy for pointing out five.3 A common “gaussian”definition (fortunately falling into disuse) assumes that the diagnostic testresults for BNP (or some arithmetic manipulation of them) for everyone,or for a group of presumably normal people, or for a carefully characterised“reference” population, will fit a specific theoretical distribution known as the normal or gaussian distribution. Because the mean of a gaussiandistribution plus or minus 2 standard deviations encloses 95% of its contents,it became a tempting way to define the normal several years ago, and cameinto general use. It is unfortunate that it did, for three logical consequencesof its use have led to enormous confusion and the creation of a new field ofmedicine: the diagnosis of non-disease. First, diagnostic test results simplydo not fit the gaussian distribution (actually, we should be grateful that theydo not; the gaussian distribution extends to infinity in both directions,necessitating occasional patients with impossibly high BNP results andothers on the minus side of zero!). Second, if the highest and lowest 2.5%of diagnostic test results are called abnormal, then all the diseases theyrepresent have exactly the same frequency, a conclusion that is alsoclinically nonsensical.
The third harmful consequence of the use of the gaussian definition ofnormal is shared by its more recent replacement, the percentile. Recognisingthe failure of diagnostic test results to fit a theoretical distribution such asthe gaussian, some laboratorians have suggested that we ignore the shapeof the distribution and simply refer (for example) to the lower (or upper) 95%of BNP or other test results as normal. Although this percentile definitiondoes avoid the problems of infinite and negative test values, it still suggests
ARCHITECTURE OF DIAGNOSTIC RESEARCH
21
Andre_Chap02.qxd 11/6/01 2:57 PM Page 21

that the underlying prevalence of all diseases is similar – about 5% – whichis silly, and still contributes to the “upper-limit syndrome” of non-diseasebecause its use means that the only “normal” patients are the ones who are not yet sufficiently worked up. This inevitable consequence arises asfollows: if the normal range for a given diagnostic test is defined as includingthe lower 95% of its results, then the probability that a given patient willbe called “normal” when subjected to this test is 95%, or 0.95. If thissame patient undergoes two independent diagnostic tests (independent inthe sense that they are probing totally different organs or functions), thelikelihood of this patient being called normal is now (0.95) � (0.95) � 0.90.So, the likelihood of any patient being called normal is 0.95 raised to thepower of the number of independent diagnostic tests performed on them.Thus, a patient who undergoes 20 tests has only 0.95 to the 20th power, orabout one chance in three, of being called normal; a patient undergoing 100such tests has only about six chances in 1000 of being called normal at theend of the work up.*
Other definitions of normal, in avoiding the foregoing pitfalls, presentother problems. The risk factor definition is based on studies of precursorsor statistical predictors of subsequent clinical events; by this definition, thenormal range for BNP or serum cholesterol or blood pressure consists of those levels that carry no additional risk of morbidity or mortality.Unfortunately, however, many of these risk factors exhibit steady increasesin risk throughout their range of values; indeed, some hold that the “normal”total serum cholesterol (defined by cardiovascular risk) might lie well below3.9 mmol/L (150 mg%), whereas our local laboratories employ an upperlimit of normal of 5.2 mmol/L (200 mg%), and other institutions employstill other definitions.
Another shortcoming of this risk factor definition becomes apparent whenwe examine the health consequences of acting upon a test result that liesbeyond the normal range: will altering BNP or any other risk factor reallychange risk? For example, although obesity is a risk factor for hypertension,controversy continues over whether weight reduction improves mildhypertension. One of us led a randomised trial in which we peeled 4.1 kg (onaverage) from obese, mildly hypertensive women with a behaviourallyoriented weight reduction programme the (control women lost less than1 kg).4 Despite both their and our efforts (the cost of the experimentalgroup’s behaviourally oriented weight reduction programme came to US$60per kilo), there was no accompanying decline in blood pressure.
A related approach defines the normal as that which is culturally desirable,providing an opportunity for what HL Mencken called “the corruption of
THE EVIDENCE BASE OF CLINICAL DIAGNOSIS
22
*This consequence of such definitions helps explain the results of a randomised trial ofhospital admission multitest screening that found no patient benefits, but increased healthcarecosts, when such screening was carried out.20
Andre_Chap02.qxd 11/6/01 2:57 PM Page 22

ARCHITECTURE OF DIAGNOSTIC RESEARCH
23
medicine by morality” through the “confusion of the theory of the healthywith the theory of the virtuous”.5 Although this definition does not fit ourBNP example, one sees such definitions in their mostly benign form at thefringes of the current lifestyle movement (for example, “It is better to be slimthan fat,”† and “Exercise and fitness are better than sedentary living and lackof fitness”), and in its malignant form in the healthcare system of the ThirdReich. Such a definition has the potential for considerable harm, and mayalso serve to subvert the role of medicine in society.
Two final definitions are highly relevant and useful to the clinicianbecause they focus directly on the clinical acts of diagnosis and therapy.The diagnostic definition identifies a range of BNP (or other diagnostic test)results beyond which LVD (or another specific target disorder) is (withknown probability) present. It is this definition that we focus on in thisbook. The “known probability” with which a target disorder is present isknown formally as the positive predictive value, and depends on where weset the limits for the normal range of diagnostic test results.This definitionhas real clinical value and is a distinct improvement over the definitionsdescribed above. It does, however, require that clinicians keep track ofdiagnostic ranges and cut-offs.
The final definition of normal sets its limits at the level of BNP beyondwhich specific treatments for LVD (such as ACE inhibitors) have beenshown conclusively to do more good than harm. This therapeutic definitionis attractive because of its link with action.The therapeutic definition of thenormal range of blood pressure, for example, avoids the hazards of labellingpatients as diseased unless they are going to be treated. Thus, in the early1960s the only levels of blood pressure conclusively shown to benefit fromantihypertensive drugs were diastolic pressures in excess of 130 mmHg(phase V). Then, in 1967, the first of a series of randomised trialsdemonstrated the clear advantages of initiating drugs at 115 mmHg, andthe upper limit of normal blood pressure, under the therapeutic definition,fell to that level. In 1970 it was lowered further to 105 mmHg with a secondconvincing trial, and current guidelines about which patients haveabnormal blood pressures that require treatment add an element of the riskfactor definition and recommend treatment based on the combination ofblood pressure with age, sex, cholesterol level, blood sugar, and smokinghabit. These days one can even obtain evidence for blood pressuretreatment levels based on the presence of a second disease: for example, intype 2 diabetes the “tight control” of blood pressure reduces the risk ofmajor complications in a cost effective way. Obviously, the use of thistherapeutic definition requires that clinicians (and guideline developers)keep abreast of advances in therapeutics, and that is as it should be.
†But the tragic consequences of anorexia nervosa teach us that even this definition cando harm.
Andre_Chap02.qxd 11/6/01 2:57 PM Page 23

THE EVIDENCE BASE OF CLINICAL DIAGNOSIS
24
In summary, then, before you start any diagnostic study you need todefine what you mean by normal, and be confident that you have done soin a sensible and clinically useful fashion.
The question is everything
As in other forms of clinical research, there are several different ways inwhich one could carry out a study into the potential or real diagnosticusefulness of a physical sign or laboratory test, and each of them isappropriate to one sort of question and inappropriate for others. Amongthe questions one might pose about the relation between a putativediagnostic test (say, BNP) and a target disorder (say, LVD), four are mostrelevant:
● Phase I questions: Do patients with the target disorder have differenttest results from normal individuals? (Do patients with LVD have higherBNP than normal individuals?)
● Phase II questions: Are patients with certain test results more likely tohave the target disorder than patients with other test results? (Arepatients with higher BNP more likely to have LVD than patients withlower BNP?)
● Phase III questions: Among patients in whom it is clinically sensible tosuspect the target disorder, does the level of the test result distinguishthose with and without the target disorder? (Among patients in whom itis clinically sensible to suspect LVD, does the level of BNP distinguishthose with and without LVD?)
● Phase IV questions: Do patients who undergo this diagnostic test farebetter (in their ultimate health outcomes) than similar patients who donot? (Of greatest interest in evaluating early diagnosis through screeningtests, this might be phrased: Do patients screened with BNP (in the hopeof achieving the early diagnosis of LVD) have better health outcomes(mortality, function, quality of life) than those who do not undergoscreening?).
At first glance the first three questions may appear indistinguishable oreven identical.They are not, because the strategies and tactics employed inanswering them are crucially different, and so are the conclusions that canbe drawn from their answers.The first two differ in the “direction” in whichtheir results are analysed and interpreted, and the third differs from the firsttwo as well in the fashion in which study patients are assembled.The fourthquestion gets at what we and our patients would most like to know: are theybetter off for having undergone it? The conclusions that can (and, moreimportantly, cannot) be drawn from the answers to these questions arecrucially different, and there are plenty of examples of the price paid bypatients and providers when the answers to Phase I or II questions are
Andre_Chap02.qxd 11/6/01 2:57 PM Page 24

interpreted as if they were answering a Phase III (or even a Phase IV)question.
These questions also nicely describe an orderly and efficient progressionof research into the potential usefulness of a clinical sign, symptom, orlaboratory result, and we will use the BNP story to show this sequence.
Phase I questions: Do patients with the target disorderhave different test results from normal individuals?
Question 1 often can be answered with a minimum of effort, time, andexpense, and its architecture is displayed in Table 2.1.
For example, a group of investigators at a British university hospitalmeasured BNP precursor in convenience samples of “normal controls” andin patients who had various combinations of hypertension, ventricularhypertrophy, and LVD.6 They found statistically significant differences inmedian BNP precursors between patients with and normal individualswithout LVD, and no overlap in their range of BNP precursor results. Itwas not surprising, therefore, that they concluded that BNP was “a usefuldiagnostic aid for LVD”.
Note, however, that the direction of interpretation here is from knowndiagnosis back to diagnostic test. Answers to Phase I questions cannot beapplied directly to patients because they are presented as overall (usuallyaverage) test results.They are not analysed in terms of the diagnostic test’ssensitivity, specificity, or likelihood ratios. Moreover, Phase I studies aretypically conducted among patients known to have the disease and peopleknown not to have the disease (rather than among patients who aresuspected of having, but not known to have, the disease). As a result, thisphase of diagnostic test evaluation cannot be translated into diagnosticaction.
Why, then, ask Phase I questions at all? There are two reasons. First, suchstudies add to our biologic insights about the mechanisms of disease, andmay serve later research into therapy as well as diagnosis. Second, suchstudies are quick and relatively cheap, and a negative answer to theirquestion removes the need to ask the tougher, more time-consuming, andcostlier questions of Phases II–IV. Thus, if a convenience (or “grab”)
ARCHITECTURE OF DIAGNOSTIC RESEARCH
25
Table 2.1 Answering a Phase I question: Do patients with LVD have higher BNPthan normal individuals?
Patients known to have the target disorder (LVD) Normal controls
Average diagnostic test (BNP 493.5 (range from 129.4 (range fromprecursor) result (and its range) 248.9 to 909) 53.6 to 159.7)
Andre_Chap02.qxd 11/6/01 2:57 PM Page 25

THE EVIDENCE BASE OF CLINICAL DIAGNOSIS
26
sample of patients with LVD already known to the investigators displays thesame average levels and distribution of BNP as apparently healthylaboratory technicians or captive medical students, it is time to abandon itas a diagnostic test and devote scarce resources to some other lead.
Phase II questions: Are patients with certain testresults more likely to have the target disorder thanpatients with other test results?
Following a positive answer to a Phase I question, it is logical to aska Phase II question, this time changing the direction of interpretation sothat it runs from diagnostic test result forward to diagnosis. Although thePhase II questions often can be asked in the same dataset that generatedthe Phase I answer, the architecture of asking and answering them differs.For example, a second group of investigators at a Belgian universityhospital measured BNP in “normal subjects” and 3 groups of patients withcoronary artery disease and varying degrees of LVD.7 Among the analysesthey performed (including the creation of ROC curves; see Chapter 7) wasa simple plot of individual BNP results, generating the results shown inTable 2.2 by picking the cut-off that best distinguished their patients withsevere LVD from their normal controls.
As you can see, the results in Table 2.2 are extremely encouraging.Whether it is used to “rule out” LVD on the basis of its high sensitivity(SnNout)8 or to “rule in” LVD with its high specificity (SpPin),9 BNPlooks useful, so it is no wonder that the authors concluded: “BNPconcentrations are good indicators of the severity and prognosis of
Table 2.2 Answering a Phase II question: Are patients with higher BNP morelikely to have LVD than patients with lower BNP?
Patients known to have the target disorder (LVD) Normal controls
High BNP 39 2Normal BNP 1 25
Test characteristics and their 95% confidence intervals Lower Upper
Sensitivity � 98% 87% 100%Specificity � 92% 77% 98%Positive predictive value � 95% 84% 99%Negative predictive value � 96% 81% 100%Likelihood ratio for an abnormal 3.5 50
test result � 13Likelihood ratio for a normal 0.0003 0.19
test result � 0.03
Andre_Chap02.qxd 11/6/01 2:57 PM Page 26
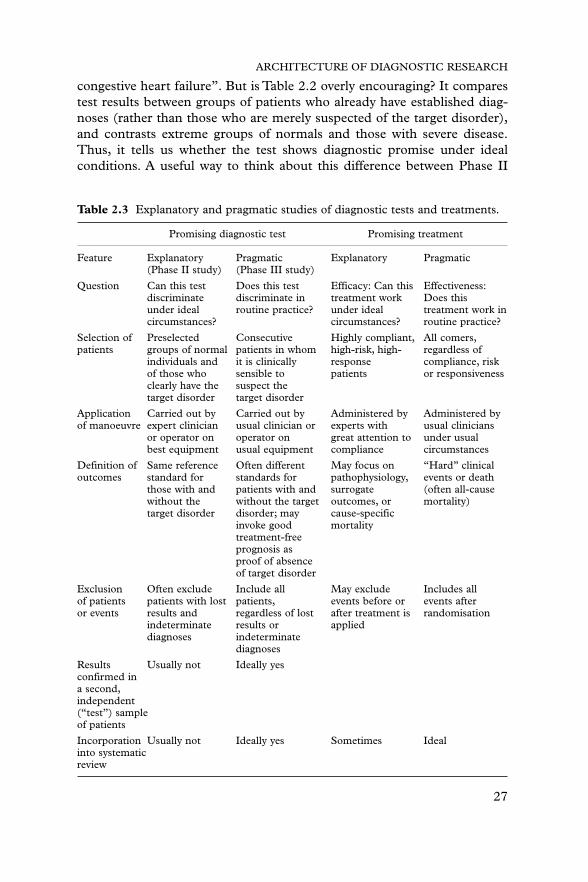
ARCHITECTURE OF DIAGNOSTIC RESEARCH
27
congestive heart failure”. But is Table 2.2 overly encouraging? It comparestest results between groups of patients who already have established diag-noses (rather than those who are merely suspected of the target disorder),and contrasts extreme groups of normals and those with severe disease.Thus, it tells us whether the test shows diagnostic promise under idealconditions. A useful way to think about this difference between Phase II
Table 2.3 Explanatory and pragmatic studies of diagnostic tests and treatments.
Promising diagnostic test Promising treatment
Feature Explanatory Pragmatic Explanatory Pragmatic(Phase II study) (Phase III study)
Question Can this test Does this test Efficacy: Can this Effectiveness:discriminate discriminate in treatment work Does thisunder ideal routine practice? under ideal treatment work incircumstances? circumstances? routine practice?
Selection of Preselected Consecutive Highly compliant, All comers,patients groups of normal patients in whom high-risk, high- regardless of
individuals and it is clinically response compliance, riskof those who sensible to patients or responsivenessclearly have the suspect thetarget disorder target disorder
Application Carried out by Carried out by Administered by Administered byof manoeuvre expert clinician usual clinician or experts with usual clinicians
or operator on operator on great attention to under usualbest equipment usual equipment compliance circumstances
Definition of Same reference Often different May focus on “Hard” clinicaloutcomes standard for standards for pathophysiology, events or death
those with and patients with and surrogate (often all-causewithout the without the target outcomes, or mortality)target disorder disorder; may cause-specific
invoke good mortalitytreatment-freeprognosis asproof of absenceof target disorder
Exclusion Often exclude Include all May exclude Includes allof patients patients with lost patients, events before or events afteror events results and regardless of lost after treatment is randomisation
indeterminate results or applieddiagnoses indeterminate
diagnoses
Results Usually not Ideally yesconfirmed in a second,independent(“test”) sample of patients
Incorporation Usually not Ideally yes Sometimes Idealinto systematicreview
Andre_Chap02.qxd 11/6/01 2:57 PM Page 27
THE EVIDENCE BASE OF CLINICAL DIAGNOSIS
28
and Phase III studies is by analogy with randomised clinical trials, whichrange from addressing explanatory (efficacy) issues of therapy (can the newtreatment work under ideal circumstances?) to management (pragmatic,effectiveness) issues (does the new treatment work under usual circum-stances?). We have summarised this analogy in Table 2.3.
As shown in Table 2.3, the Phase II study summarised in Table 2.2 isexplanatory in nature: preselected groups of normal individuals (ducks)and those who clearly have the target disorder (yaks) undergo testing underthe most rigorous circumstances possible, with the presence or absence ofthe target disorder being determined by the same reference standard. Noattempt is made to validate these initial (“training set”) results (especiallythe cut-off used to set the upper limit of normal BNP) in a second,independent “test” set of ducks and yaks. On the other hand, and as withthe Phase I study, this relatively easy Phase II investigation tells us whetherthe promising diagnostic test is worth further, costlier evaluation; as wehave said elsewhere,10 if the test cannot tell the difference between a duckand a yak it is worthless in diagnosing either one. As long as the writers andreaders of a Phase II explanatory study report make no pragmatic claimsabout its usefulness in routine clinical practice, no harm is done.Furthermore, criticisms of Phase II explanatory studies for their failure tosatisfy the methodological standards employed in Phase III pragmaticstudies do not make sense.
Phase III questions: Among patients in whom it isclinically sensible to suspect the target disorder, doesthe level of the test result distinguish those with andwithout the target disorder?
Given its promise in Phase I and II studies, it is understandable that BNPwould be tested in the much costlier and more time-consuming Phase IIIstudy, in order to determine whether it was really useful among patients inwhom it is clinically sensible to suspect LVD. As we were writing thischapter, an Oxfordshire group of clinical investigators reported that theydid just that by inviting area general practitioners “to refer patients withsuspected heart failure to our clinic”.11 Once there, these 126 patientsunderwent independent, blind BNP measurements and echocardiography.Their results are summarised in Table 2.4.
About one third of the patients referred by their general practitioners hadLVD on echocardiography. These investigators documented that BNPmeasurements did not look nearly as promising when tested in a Phase IIIstudy in the pragmatic real-world setting of routine clinical practice, andconcluded that “introducing routine measurement [of BNP] would beunlikely to improve the diagnosis of symptomatic [LVD] in the
Andre_Chap02.qxd 11/6/01 2:57 PM Page 28

ARCHITECTURE OF DIAGNOSTIC RESEARCH
29
community”. However, their report of the study also documented the effectof two other cut-points for BNP. This led both to a counterclaim on theusefulness of BNP in the subsequent email letters to the editor, and to anopportunity for us to describe an alternative way of presenting informationabout the accuracy of a diagnostic test: the multilevel likelihood ratio (LR).The original report makes it possible for us to construct Table 2.5.
By using multilevel likelihood ratios to take advantage of the full range ofBNP results, we can be slightly more optimistic about the diagnosticusefulness of higher levels: the LR for BNP results �76 pg/ml was 5.1.Theselevels were found in 29% of the patients in this study, and their presenceraised the pretest probability of LVD in the average patient from 32% to apost-test probability of 70%.This can be determined directly from Table 2.5for this “average” patient with a pretest probability of 32% and a high BNP:reading horizontally across the top row, the result is 26/(26�11) � 70%.
Table 2.4 Answering a Phase III question: Among patients in whom it is clinicallysensible to suspect LVD, does the level of BNP distinguish patients with andwithout LVD?
Patients with LVD Patients with on echocardiography normal echoes
High BNP (�17.9 pg/ml) 35 57Normal BNP (18 pg/ml) 5 29Prevalence or pretest 40/126 � 32%
probability of LVD
Test characteristics and their 95% confidence intervals Lower Upper
Sensitivity � 88% 74% 94%Specificity � 34% 25% 44%Positive predictive value � 38% 29% 48%Negative predictive value � 85% 70% 94%Likelihood ratio for an abnormal 1.1 1.6
test result � 1.3Likelihood ratio for a normal 0.2 0.9
test result � 0.4
Table 2.5 Answering a Phase III question with likelihood ratios.
Patients with LVD Patients with Likelihood ratio on echocardiography normal echoes and 95% CI
High BNP (�76 pg/ml) 26 (0.650) 11 (0.128) 5.1 (2.8–9.2)Mid BNP (10–75 pg/ml) 11 (0.275) 60 (0.698) 0.4 (0.2–0.7)Low BNP (10 pg/ml) 3 (0.075) 15 (0.174) 0.4 (0.1–1)Total 40 (1.000) 86 (1.000)
Andre_Chap02.qxd 11/6/01 2:57 PM Page 29

THE EVIDENCE BASE OF CLINICAL DIAGNOSIS
30
However, if the patient has a different pretest likelihood, say 50%, theneither the table must be reconstructed for this higher figure, or the pretestprobability needs to be converted to a pretest odds (50% is a pretest oddsof (1�0.5)/0.5 � 1), and then multiplied by the likelihood ratio for thetest result (5.1 in this case), giving a post-test odds of 5.1, which then canbe converted back into a post-test probability of 5.1/(1�5.1) � 84%.These calculations are rendered unnecessary by using a nomogram, as inFigure 2.1.
1000
99
95
90
80
70605040
30
20
10
5
2
1
0.5
0.2
0.1
0.1
0.2
0.5
1
2
5
10
20
3040
506070
80
90
95
99
Pretestprobability
Likelihoodratio
Post-testprobability
500
20010050201052
10.5
0.20.1
0.050.020.01
0.005
0.002
0.001
Figure 2.1 Nomogram for converting pretest likelihoods (left column) to post-testlikelihoods (right column) by drawing a straight line from the pretest likelihoodthrough the likelihood ratio for the test result.
Andre_Chap02.qxd 11/6/01 2:57 PM Page 30

ARCHITECTURE OF DIAGNOSTIC RESEARCH
31
Given the quite wide confidence intervals around these LRs, furthertype III studies may be fruitful (and readers can check to see whether thiswas done after this chapter was published).
Threats to the validity of Phase III studies
There are several threats to the validity of Phase III studies that distorttheir estimates of the accuracy of the diagnostic test, and the first batch areviolations of the old critical appraisal guide: “Has there been anindependent, blind comparison with a gold standard of diagnosis?”12 Byindependence we mean that all study patients have undergone both thediagnostic test and the reference (“gold”) standard evaluation and, morespecifically, that the reference standard is applied regardless of the diagnostictest result. By blind we mean that the reference standard is applied andinterpreted in total ignorance of the diagnostic test result, and vice versa.By anticipating these threats at the initial question forming phase of astudy, they can be avoided or minimised.
Although we prefer to conceptualise diagnostic test evaluations in termsof 2 � 2 tables such as the upper panel of Table 2.6 (and this is the way thatmost Phase II studies are performed), in reality Phase III studies generatethe 3 � 3 tables shown in the lower panel of Table 2.6. Reports get lost,their results are sometimes incapable of interpretation, and sometimes weare unwilling to apply the reference standard to all the study patients.
The magnitude of the cells v–z and the method of handling patients whofall into these cells will affect the validity of the study. In the perfect studythese cells are kept empty, or so small that they cannot exert any important
Table 2.6 The ideal Phase III study meets the real world.
Reference standard
The ideal study Target disorder present Target disorder absent
Diagnostic test resultPositive a bNegative c d
Reference standard
Target disorder Lost, not performed, Target disorder The real study present or indeterminate absent
Diagnostic test resultPositive a v bLost, not
performed, or w x yindeterminate
Negative c z d
Andre_Chap02.qxd 11/6/01 2:57 PM Page 31

THE EVIDENCE BASE OF CLINICAL DIAGNOSIS
32
effect on the study conclusions. However, there are 6 situations in whichthey become large enough to bias the measures of test accuracy. First, whenthe reference standard is expensive, painful, or risky, investigators will notwish to apply it to patients with negative diagnostic test results. As aconsequence, such patients risk winding up in cell z. Furthermore, there isan understandable temptation to shift them to cell d in the analysis.Because no diagnostic test is perfect, some of them surely belong in cell c.Shifting all of them to cell d falsely inflates both sensitivity and specificity.If this potential problem is recognised before the study begins, investigatorscan design their reference standard to prevent such patients from fallinginto cell z.This is accomplished by moving to a more pragmatic study andadding another, prognostic dimension to the reference standard, namelythe clinical course of patients with negative test results who receive nointervention for the target disorder. If patients who otherwise would end upin cell z develop the target disorder during this treatment-free follow up,they belong in cell c. If they remain free of disease, they join cell d. Theresult is an unbiased and pragmatic estimate of sensitivity and specificity.
Second, the reference standard may be lost; and third, it may generate anuninterpretable or indeterminate result. As before, arbitrarily analysingsuch patients as if they really did or did not have the target disorder willdistort measures of diagnostic test accuracy. Once again, if these potentialbiases are identified in the planning stages they can be minimised, apragmatic solution such as that proposed above for cell z considered, andclinically sensible rules established for shifting them to the definitivecolumns in a manner that confers the greatest benefit (in terms oftreatment) and the least harm (in terms of labelling) to later patients.
Fourth, fifth, and sixth, the diagnostic test result may be lost, neverperformed, or indeterminate, so that the patient winds up in cells w, x, ory. Here the only unforgivable action is to exclude such patients from theanalysis of accuracy. As before, anticipation of these problems before the study begins should minimise tests that are lost or never performed tothe point where they would not affect the study conclusion regardless ofhow they were classified. If indeterminate results are likely to be frequent,a decision can be made before the study begins as to whether they will beclassified as positive or negative. Alternatively, if multilevel likelihood ratiosare to be used, these patients can form their own stratum.
In addition to the 6 threats to validity related to cells v–z, there are twomore. The seventh threat to validity noted in the above critical appraisalguide arises when a patient’s reference standard is applied or interpreted bysomeone who already knows that patient’s diagnostic test result (and viceversa).This is a risk whenever there is any degree of interpretation (even inreading off a scale) involved in generating the result of the diagnostic testor reference standard. We know that these situations lead to biasedinflations of sensitivity and specificity.
Andre_Chap02.qxd 11/6/01 2:57 PM Page 32

ARCHITECTURE OF DIAGNOSTIC RESEARCH
33
The eighth and final threat to the validity of accuracy estimatesgenerated in Phase III studies arises whenever the selection of the “upperlimit of normal” or cut-point for the diagnostic test is under the control ofthe investigator. When they can place the cut-point wherever they want, itis natural for them to select the point where it maximises sensitivity (for useas a SnNout), specificity (for use as a SpPin), or the total number ofpatients correctly classified in that particular “training” set. If the studywere repeated in a second, independent “test” set of patients, employingthat same cut-point, the diagnostic test would be found to function a littleor a lot worse.Thus, the true accuracy of a promising diagnostic test is notknown until it has been evaluated in one or more independent studies.
The foregoing threats apply whether the diagnostic test comprises asingle measurement of a single phenomenon or a multivariate combinationof several phenomena. For example, Philip Wells and his colleaguesdetermined the diagnostic accuracy of the combination of several itemsfrom the medical history, physical examination, and non-invasive testing inthe diagnosis of deep vein thrombosis.13 Although their study generatedsimilar results in three different centres (two in Canada and one in Italy),even they recommended further prospective testing before widespread use.
Limits to the applicability of Phase III studies
Introductory courses in epidemiology introduce the concept thatpredictive values change as we move back and forth between screening orprimary care settings (with their low prevalence or pretest probability of thetarget disorder) to secondary and tertiary care (with their higherprobability of the target disorder). This point is usually made by assumingthat sensitivity and specificity remain constant across all settings. However,the mix (or spectrum) of patients also varies between these locations; forexample, screening is applied to asymptomatic individuals with earlydisease, whereas tertiary care settings deal with patients with advanced orflorid disease. No wonder, then, that sensitivity and specificity often varybetween these settings. Moreover, because primary care patients withpositive diagnostic test results (which comprise false positive as well as truepositive results) are referred forward to secondary and tertiary care, wemight expect specificity to fall as we move along the referral pathway.Thereis very little empirical evidence addressing this issue, and we acknowledgeour debt to Dr James Wagner of the University of Texas at Dallas fortracking down and systematically reviewing diagnostic data from over 2000patients with clinically suspected appendicitis seen in primary care and oninpatient surgical wards (personal communication, 2000). The diagnostictests comprised the clinical signs that are sought when clinicians suspectappendicitis, and the reference standard is a combination of pathology
Andre_Chap02.qxd 11/6/01 2:57 PM Page 33

reports on appendices when operations were performed, and a benignclinical course when they were not. The results for the diagnostic test ofright lower quadrant tenderness are shown in Table 2.7.
A comparison of the results in primary and tertiary care shows, as wemight expect, an increase in the proportions of patients with appendicitis(from 14% to 63%). But, of course, this increase in prevalence occurredpartly because patients with right lower quadrant tenderness (regardless ofwhether this was a true positive or false positive finding) tended to bereferred to the next level of care, whereas patients without this sign tendednot to be referred onward; this is confirmed by the rise in the frequency ofthis sign from 21% of patients in primary care to 82% of patients in tertiarycare. Although this sort of increase in a positive diagnostic test result iswidely recognised, its effect on the accuracy of the test is not. The forwardreferral of patients with false positive test results leads to a fall in specificity,in this case a dramatic one from 89% down to 16%. As a result, adiagnostic sign of real value in primary care (LR� of 8, LR� of 0.2) isuseless in tertiary care (LR� and LR� both 1); in other words, itsdiagnostic value has been “used up” along the way.‡
This phenomenon can place major limitations on the applicability ofPhase III studies carried out in one sort of setting to another setting where
THE EVIDENCE BASE OF CLINICAL DIAGNOSIS
34
Table 2.7 The accuracy of right lower quadrant tenderness in the diagnosis ofappendicitis.
Primary care settings Tertiary care settingsAppendicitis Appendicitis
Yes No Yes No(%) (%) (%) (%)
Right lower quadrant tendernessPresent 84 11 81 84Absent 16 89 19 16Total 100 100 100 100
Frequency of appendicitis 14% 63%Frequency of positive sign 21% 82%Sensitivity 84% 81%Specificity 89% 16%LR� 7.6 1LR� 0.2 1
‡Although not germane to this book on research methods, there are two major clinicalramifications of this phenomenon. First, because clinical signs and other diagnostic tests oftenlose their value along the referral pathway, tertiary care clinicians might be forgiven forproceeding immediately to applying invasive reference standards. Second, tertiary careteachers should be careful what they teach primary care trainees about the uselessness ofclinical signs.
Andre_Chap02.qxd 11/6/01 2:57 PM Page 34

ARCHITECTURE OF DIAGNOSTIC RESEARCH
35
the mix of test results may differ. Overcoming this limitation is anotherbonus that attends the replication of a promising Phase III study in asecond “test” setting attended by patients of the sort that the test is claimedto benefit.
Does specificity always fall between primary care and tertiary caresettings? Might this be employed to generate a “standardised correctionfactor” for extrapolating test accuracy between settings? Have a look at theclinical sign of abdominal rigidity in Table 2.8.
In this case, a clinical sign that is useless in primary care (LR� barelyabove 1 and LR� close to 1) is highly useful in tertiary care (LR� of 5),and in this case specificity has risen (from 74% to 95%), not fallen, alongthe referral pathway. The solution to this paradox is revealed in thefrequency of the sign in these two settings; it has fallen (from 28% to 14%),not risen, along the pathway from primary to tertiary care. We think thatthe explanation is that primary care clinicians, who do not want to miss anypatient’s appendicitis, are “over-reading” abdominal rigidity compared totheir colleagues in tertiary care. At this stage in our knowledge of thisphenomenon we do not think the “standard correction factors” noted inthe previous paragraph are advisable, and this paradox once again points tothe need to replicate promising Phase III study results in “test” settingsattended by patients (and clinicians!) of the sort that the test is claimed tobenefit. In this regard we welcome the creation of the CARE consortium ofover 800 clinicians from over 70 countries14 for their performance of web-based, large, simple, fast studies of the clinical examination.15 It is hopedthat this group, which can be contacted at www.carestudy.com, canmake a large contribution to determining the wide applicability of the
Table 2.8 The accuracy of abdominal rigidity in the diagnosis of appendicitis.
Primary care settings Tertiary care settingsAppendicitis Appendicitis
Yes No Yes No(%) (%) (%) (%)
Rigid abdomenPresent 40 26 23 6Absent 60 74 77 94Total 100 100 100 100
Frequency of 14% 47%appendicitis
Frequency of 28% 14%positive sign
Sensitivity 40% 24%Specificity 74% 94%LR� 1.5 5LR� 0.8 0.8
Andre_Chap02.qxd 11/6/01 2:57 PM Page 35
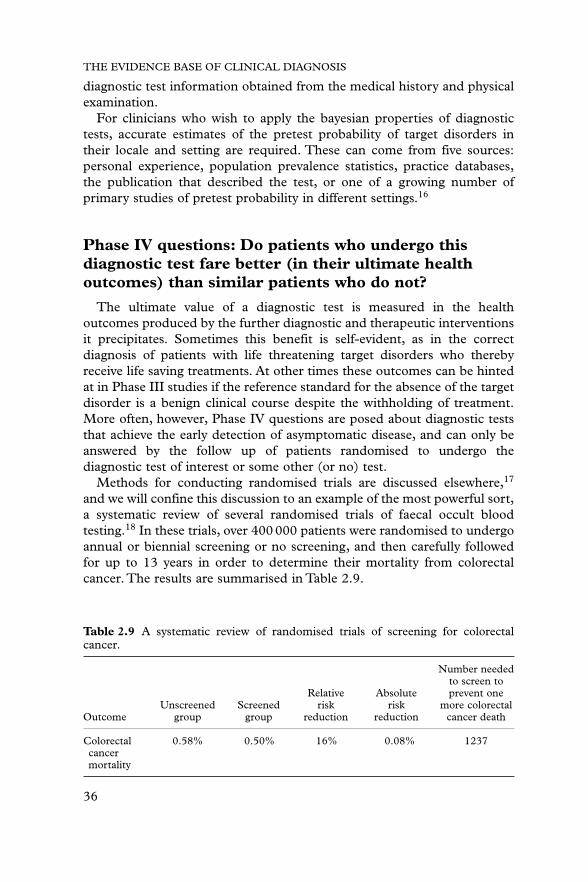
THE EVIDENCE BASE OF CLINICAL DIAGNOSIS
36
diagnostic test information obtained from the medical history and physicalexamination.
For clinicians who wish to apply the bayesian properties of diagnostictests, accurate estimates of the pretest probability of target disorders intheir locale and setting are required. These can come from five sources:personal experience, population prevalence statistics, practice databases,the publication that described the test, or one of a growing number ofprimary studies of pretest probability in different settings.16
Phase IV questions: Do patients who undergo thisdiagnostic test fare better (in their ultimate healthoutcomes) than similar patients who do not?
The ultimate value of a diagnostic test is measured in the healthoutcomes produced by the further diagnostic and therapeutic interventionsit precipitates. Sometimes this benefit is self-evident, as in the correctdiagnosis of patients with life threatening target disorders who therebyreceive life saving treatments. At other times these outcomes can be hintedat in Phase III studies if the reference standard for the absence of the targetdisorder is a benign clinical course despite the withholding of treatment.More often, however, Phase IV questions are posed about diagnostic teststhat achieve the early detection of asymptomatic disease, and can only beanswered by the follow up of patients randomised to undergo thediagnostic test of interest or some other (or no) test.
Methods for conducting randomised trials are discussed elsewhere,17
and we will confine this discussion to an example of the most powerful sort,a systematic review of several randomised trials of faecal occult bloodtesting.18 In these trials, over 400 000 patients were randomised to undergoannual or biennial screening or no screening, and then carefully followedfor up to 13 years in order to determine their mortality from colorectalcancer. The results are summarised in Table 2.9.
Table 2.9 A systematic review of randomised trials of screening for colorectalcancer.
Number neededto screen to
Relative Absolute prevent oneUnscreened Screened risk risk more colorectal
Outcome group group reduction reduction cancer death
Colorectal 0.58% 0.50% 16% 0.08% 1237cancer mortality
Andre_Chap02.qxd 11/6/01 2:57 PM Page 36

ARCHITECTURE OF DIAGNOSTIC RESEARCH
37
In this example, patients were randomised to undergo or not undergo thediagnostic test. Because most of them remained cancer free, the sample sizerequirement was huge and the study architecture is relatively inefficient. Itwould have been far more efficient (but unacceptable) to randomise thedisclosure of positive test results, and this latter strategy was employed in arandomised trial of a developmental screening test in childhood.19 In thisstudy, the experimental children whose positive test results were revealedand who subsequently received the best available counselling andinterventions fared no better in their subsequent academic, cognitive ordevelopmental performance than control children whose positive testresults were concealed. However, parents of the “labelled” experimentalchildren were more likely to worry about their school performance, andtheir teachers tended to report more behavioural problems among them.This warning that diagnostic tests can harm as well as help those whoundergo them is a suitable stopping point for this chapter.
References
1 Hobbs R. Can heart failure be diagnosed in primary care? BMJ 2000;321:188–9.2 Sackett DL, Haynes RB, Guyatt GH, Tugwell P. Clinical Epidemiology: a Basic Science for
Clinical Medicine, 2nd edn. Boston: Little, Brown and Company, 1991; pp. 58–61.3 Murphy EA. The normal, and perils of the sylleptic argument. Perspect Biol Med
1972;15:566.4 Haynes RB, Harper AC, Costley SR, et al. Failure of weight reduction to reduce mildly
elevated blood pressure: a randomized trial. J Hypertension 1984;2:535.5 Mencken HL. A Mencken chrestomathy. Westminster: Knopf, 1949;12.6 Talwar S, Siebenhofer A, Williams B, Ng L. Influence of hypertension, left ventricular
hypertrophy, and left ventricular systolic dysfunction on plasma N terminal pre-BNP.Heart 2000;83:278–82.
7 Selvais PL, Donickier JE, Robert A, et al. Cardiac natriuretic peptides for diagnosis andrisk stratification in heart failure. Eur J Clin Invest 1998;28:636–42.
8 Sackett DL, Haynes RB, Guyatt GH, Tugwell P. op cit; p. 83.9 Sackett DL, Haynes RB, Guyatt GH, Tugwell P. op cit; p. 77.
10 Sackett DL, Haynes RB, Guyatt GH, Tugwell P. op cit; p. 57.11 Landray MJ, Lehman R, Arnold I. Measuring brain natriuretic peptide in suspected left
ventricular systolic dysfunction in general practice: cross-sectional study. BMJ 2000;320:985–6.
12 Sackett DL, Haynes RB, Guyatt GH, Tugwell P. op cit; p. 52.13 Wells PS, Hirsh J, Anderson DR, et al. A simple clinical model for the diagnosis of deep-
vein thrombosis combined with impedance plethysmography: potential for animprovement in the diagnostic process. J Intern Med 1998;243:15–23.
14 McAlister FA, Straus SE, Sackett DL, on behalf of the CARE-COAD group. Why weneed large, simple studies of the clinical examination: the problem and a proposedsolution. Lancet 1999;354:1721–4.
15 Straus SE, McAlister FA, Sackett DL, Deeks JJ.The accuracy of patient history, wheezing,and laryngeal measurements in diagnosing obstructive airway disease. JAMA 2000;283:1853–7.
16 Sackett DL, Straus SE, Richardson WS, Rosenberg W, Haynes RB. Evidence-BasedMedicine: how to Practise and Teach EBM, 2nd edn. Edinburgh: Churchill Livingstone,2000;82–4.
17 Shapiro SH, Louis TA. Clinical Trials: Issues and Approaches, 2nd edn. New York: MarcelDekker, 2000; (in press).
Andre_Chap02.qxd 11/6/01 2:57 PM Page 37

18 Towler BP, Irwig L, Glasziou P, Weller D, Kewenter J. Screening for colorectal cancer usingthe faecal occult blood test, Hemoccult. Cochrane Review, latest version 16 Jan 1998. In:TheCochrane Library, Oxford: Update Software.
19 Cadman D, Chambers LW,Walter SD, Ferguson R, Johnston N, McNamee J. Evaluationof public health preschool child development screening: The process and outcomes of acommunity program. Am J Public Health 1987;77:45–51.
20 Dunbridge TC, Edwards F, Edwards RG, Atkinson M. An evaluation of multiphasicscreening on admission to hospital. Précis of a report to the National Health and MedicalResearch Council. Med J Aust 1976;1:703–5.
THE EVIDENCE BASE OF CLINICAL DIAGNOSIS
38
Andre_Chap02.qxd 11/6/01 2:57 PM Page 38

39
3 Assessment of theaccuracy of diagnostictests: the cross-sectionalstudyJ ANDRÉ KNOTTNERUS, JEAN W MURIS
Summary box
● In determining the accuracy of diagnostic testing, the first step is toappropriately define the contrast to be evaluated. Options are: toevaluate one single test contrast; to compare two or more singletests; to evaluate further testing in addition to previous diagnostics;and to compare alternative diagnostic strategies. In addition, theclinical diagnostic problem under study must be specified. Finally,distinction should be made between evaluating testing in “extremecontrast” or “clinical practice” settings.
● For accuracy studies, general design types are (1) a survey of thetotal study population, (2) a case–referent approach, or (3) a test-based enrolment. The direction of the data collection shouldgenerally be prospective, but ambispective and retrospectiveapproaches are sometimes appropriate.
● One should specify the determinants of primary interest (the test(s)under study) and other potentially important determinants(possible modifiers of test accuracy and confounding variables).
● The reference standard procedure to measure the target disordershould be applied on all included subjects, independently of theresult of the test under study. Applying a reference standard procedure can be difficult because of classification errors, lack of a
Andre_Chap03.qxd 11/6/01 2:56 PM Page 39

THE EVIDENCE BASE OF CLINICAL DIAGNOSIS
40
Introduction
Although the ultimate objective of the diagnostic phase is to optimise thepatient’s prognosis by enabling the clinician to choose an adequatetherapeutic strategy, an accurate diagnostic assessment is a first andindispensable step in the process of clinical management.
Making a useful clinical diagnosis implies classifying the presented healthproblem of a patient in the context of accepted nosological knowledge.Thisdiagnostic classification may result in confirmation or exclusion of thepresence of a certain disease, in the selection of one disease from a set ofpossibly present diseases, or in the conclusion that a number of diseases arepresent simultaneously.1 Also, it can be concluded that, given presentknowledge, a further diagnostic classification than the observedsymptomatology cannot be achieved. Sometimes such a classification is notworthwhile, considering the balance between expected gain in certainty,the burden of making a definitive diagnosis, and relevant therapeuticconsequences.
Apart from making a diagnostic classification, the diagnostic process maybe aimed at assessing the clinical severity or monitoring the clinical courseof a diagnosed condition. Another very important clinical application isdocumenting the precise localisation or shape of a diagnosed lesion tosupport further, for example surgical, decision making.
A potential new diagnostic test must first go through a phase ofpathophysiological and technical development, before its clinical
well defined pathophysiological concept, incorporation bias, or tooinvasive or too complex patient investigations. Possible solutions are:an independent expert panel, and the delayed-type cross-sectionalstudy (clinical follow up). Also, a prognostic criterion can be chosento define clinical outcome.
● Inclusion criteria must be based on “the intention to diagnose” or“intention to screen” with respect to the studied clinical problem.The recruitment procedure is preferably a consecutive series ofpresenting patients or a target population screening, respectively.
● In the design phase, sample size estimation should be routine. BothBivariate and multivariate techniques can be used in the analysis,based on the evaluated contrast. Estimating test accuracy andprediction of outcome require different approaches.
● External (clinical) validation should preferably be based onrepeated studies in other, similar populations. Also, systematicreviews and meta-analysis have a role.
Andre_Chap03.qxd 11/6/01 2:56 PM Page 40

effectiveness in terms of diagnostic accuracy or prognostic impact can beevaluated. The methodology discussed in this book, focused on clinicaleffectiveness, is applicable to the further evaluation of tests that havesuccesfully passed this early development.
A basic question to be anwered, then, is: what is the probability that thisparticular patient with this particular symptomatology or test result has acertain disorder or a combination of disorders? Obtaining an evidence-based answer, using clinical epidemiological research data, requires ananalysis of the association between the presented symptomatology or testresult and the appropriate diagnostic classification, that is, the presence orabsence of certain diagnoses.
This chapter deals with principles, design and pitfalls of cross-sectionaldiagnostic research. In this context, cross-sectional research includesstudies in which the measured test results and the health status to bediagnosed essentially represent one point in time for each study subject.2
Diagnostic research on test accuracy:the basic steps to take
All measures of diagnostic association3 (Chapters 1 and 7) can bederived from research data on the relation between test results and areference standard diagnosis. A valid data collection on this relation is themain point of concern,4 and the various measures can be calculated byapplying straightforward analytical methods. Research data for the purposeof diagnostic discrimination are generally collected in cross-sectionalresearch, irrespective of the diagnostic parameters to be used.
As usual in research, a first requirement is to specify the researchquestion. Second, the most appropriate study design to answer thisquestion has to be outlined. A third step is to operationalise thedeterminants (test(s) to be evaluated, relevant modifiers of diagnosticaccuracy, and possible confounding variables) and outcome (generally the presence or absence of the disorder to be diagnosed). Further, the studypopulation, the corresponding inclusion and exclusion criteria, and themost appropriate recruitment procedure have to be further specified.Finally, an adequate data analysis must be planned and achieved.
The research question: contrast to be evaluated
In short, the diagnostic research question should define:
● The test or test set to be evaluated● The clinical problem for which the use of these test(s) is considered
possibly relevant
ASSESSING THE ACCURACY OF DIAGNOSTIC TESTS
41
Andre_Chap03.qxd 11/6/01 2:56 PM Page 41

THE EVIDENCE BASE OF CLINICAL DIAGNOSIS
42
● Whether the planned study should evaluate (1) the potential of the testprocedure to discriminate between subjects with and without a targetdisorder in an ideal situation of extreme contrast, or (2) to what extentit could be useful in a daily practice clinical setting (where discriminationis, by definition, more difficult).
Box 3.1 The research question
(a) Contrast to be evaluated– single test– comparing single tests– additional testing– comparing diagnostic strategies
(b) Define the clinical problem(c) Extreme contrast or practice setting
A key issue is the specific contrast to be evaluated (a). The question canbe, for example,What is the discriminative power of one specific test or testprocedure to be applied for a certain clinical diagnostic problem (singletest)? However, the focus may also be on the discriminative power of a newtest compared to the best test(s) already available for a similar clinicaldiagnostic problem (comparing single tests). For clinical practice, it isimportant to determine the added value of further (for example moreinvasive) testing, given the tests already performed (additional testing),5 orto evaluate the most accurate or efficient diagnostic test set or test sequence(diagnostic strategy) for a certain diagnostic problem. In general, werecommend that in studying a new, more invasive or more expensive test,already available less invasive or less expensive tests with fewer adverseeffects should be also included.This makes it possible to critically evaluatethe new test’s net contribution, if any. Also, it is informative to include theclinician’s diagnostic assessment (without knowing the test result) as aseparate test.The performance of the new approach can then be evaluatedas to its added value compared to the doctor’s usual diagnostic performanceor “black box”.
Regarding the clinical problem studied (b), it is of key importance notonly to define the target disorder(s) to be diagnosed, but also the clinicalsetting and clinical spectrum (for example, early or later in thedevelopment of the disorder, and degree of severity) at which one isprimarily aiming. It is crucial whether the investigator wants to evaluate thevalidity of a test for diagnosing a possible disease in its early phase ina primary care setting, or to diagnose more advanced disease in anoutpatient clinic or hospital setting, with patients selected by referral based
Andre_Chap03.qxd 11/6/01 2:56 PM Page 42

on suspect symptoms or previous tests.6,7 This is dealt with in more detailin Chapters 2 and 6.
As to (c), critical appraisal of the state of current knowledge is importantfor defining an optimally efficient research strategy. For instance, if nothingat all is known yet about the discriminative power of a test, it is moreefficient – in terms of reducing the burden for study patients, the samplesize, the resources, and the time needed for the study – first to evaluatewhether the test discriminates between clearly diseased and clearly non-diseased subjects. If the test does not discriminate in such a Phase I study(Feinstein2, Sackett and Haynes, Chapter 2 of this book) any further,usually larger and longer, studies evaluating a more difficult contrastbetween clinically similar study subjects will be useless: the index testcannot be expected to add anything valuable to clinical practice anyhow.
The specification of these three aspects of the research question isdecisive for designing the optimal study methodology. Aspect (c) wasextensively addressed in Chapter 2.
Outline of the study design
Because study questions on diagnostic accuracy generally evaluate theassociation between (combinations of ) test results and health status (mostlythe presence or absence of a target disorder), a cross-sectional design is anatural basic design option. However, this basic design has variousmodifications, each with specific pros and cons in terms of scientificrequirements, burden for the study subjects, and efficient use of resources.
ASSESSING THE ACCURACY OF DIAGNOSTIC TESTS
43
Box 3.2 Study design
General approach– survey of total study population– case–referent approach– test based enrolment
Direction of data collection– prospective– ambispective– retrospective
General approach
The most straightforward approach of the cross-sectional design is a surveyof the study population to determine the test distribution and the presence ofthe target disorder simultaneously. Examples are a survey on the relationship
Andre_Chap03.qxd 11/6/01 2:56 PM Page 43

between intermittent claudication and peripheral arterial occlusive disease inan elderly population,8 and a study in a consecutive series of sciatica patientsto determine the accuracy of history and clinical examination.9
Another option is the case–referent approach, starting from an alreadyknown disease status (for example present or absent) as the criterion forenrolment, the test result being determined afterwards in the studypatients. This design type may be more efficient or more acceptable whenthe disease under study is infrequent or when the reference standardprocedure is highly invasive to the patient, for example in pancreaticcancer, or very expensive.
A further approach is test based enrolment, where the available testresult (such as positive or negative) is the criterion for recruitment, with thedisease status being determined afterwards. This modification may bepreferable when test results are easily available from routine health care. Anexample regarding the latter is a study on the diagnostic value of “fatigue”for detecting anaemia in primary care, comparing patients presenting withfatigue and a control group as to haematological parameters.10
In the context of the cross-sectional design, efficient sampling of thestudied distributions may be artificially facilitated at the determinant (test)or the outcome (target disorder) side. For example, in order to achieve abalanced data collection over the relevant categories, a stratified sample canbe drawn from the various test result levels or from various parts of thewhole disease spectrum, from clearly no disease to most severe disease. Also,the contrast between the categories of the diseased and non-diseasedsubjects can be enhanced by limiting the sampling to those who have beenproved to be clearly diseased and those proved to be completely healthy.Thelatter approach is applied in planning a Phase I study (Chapter 2), which isessentially a case–referent study. Because of a sharp contrast in diseasespectrum between diseased and non-diseased, sensitivity and specificity willbe optimal, and as by sampling of cases and referents the “prevalence” in thestudy population can also be artificially optimised (with, for example, adisease prevalence of 50%), Phase I studies generally need a relatively smallnumber of subjects to be included. Moreover, for a Phase I study thesubjects in the “case group” (the diseased) and those in the reference group(the healthy or non-diseased subjects) can be specifically selected frompopulations consisting of subjects who have already undergone a “referencestandard” procedure with maximum certainty.
Direction of data collection
Whereas Phase I and Phase II studies (according to Sackett and Haynes,Chapter 2) may be based on either retrospective or prospectiveidentification of subjects with a certain diagnosis or test status, Phase IIIstudies must usually be prospectively planned.The latter start from a study
THE EVIDENCE BASE OF CLINICAL DIAGNOSIS
44
Andre_Chap03.qxd 11/6/01 2:56 PM Page 44

ASSESSING THE ACCURACY OF DIAGNOSTIC TESTS
45
population of subjects comparable with those who will be tested in clinicalpractice. In such studies it is not known in advance who is diseased and whois not, and the clinical characteristics of the two are therefore very similar(which in fact is the reason that testing is clinically necessary at all). Becausethe clinical contrast is much less pronounced, and as the prevalence ofdiseased subjects is usually much lower than 50%, substantially largersample sizes are generally needed than in Phase I studies.
Also, when the subject selection is prospective the data collection can bepartly retrospective (ambispective approach). For instance, if patient historyis an important element of the diagnostic test to be evaluated (such as whenstudying the diagnostic value of rectal bleeding, palpitations, or psychiatricsymptoms in the preceding 6 months), information about the past isincluded in the test result. Essential, however, is that the test result status,albeit based on historical information, is evaluated and interpreted as to itsdiagnostic accuracy at the very moment that the patient “history” is taken.
The “direction” of the sampling and the data collection must be decidedupon in advance. In addition, and secondary to scientific considerations,practical issues may play a role, such as the availability of data and theefficiency of its collection. Prospectively planned data collections often takemore time but are generally more valid, as the procedure and the quality ofthe data collection can be optimised beforehand. But this is not necessarilyalways the case. Valid data may be already available in a well documenteddatabase of an appropriate study population with an adequately describedepidemiological (morbidity) numerator and (population) denominator,and with all relevant covariables present. Especially when the clinicalindication to perform the test is appropriately defined (for examplecoronary angiography in instable angina pectoris) and recorded, and whenall eligible patients can be assumed to be included, this is an option.Moreover, a prospective data collection may sometimes imply a higher riskof bias than a retrospective approach. For example, if participatingclinicians know that they are being observed in a study of the accuracy oftheir usual diagnostic assessment compared to an independent standard orpanel, their behaviour will be easily be influenced in the context of aprospective design (Hawthorne effect). However, in a retrospective designthe availability of complete and well standardised data and the controllingof the subject selection process are often problematic.
Operationalising determinants and outcome
Determinants
As in any (clinical) epidemiological study, research questions ondiagnostic accuracy can be operationalised in a central “occurrencerelation”11 between independent and dependent variables.
Andre_Chap03.qxd 11/6/01 2:56 PM Page 45
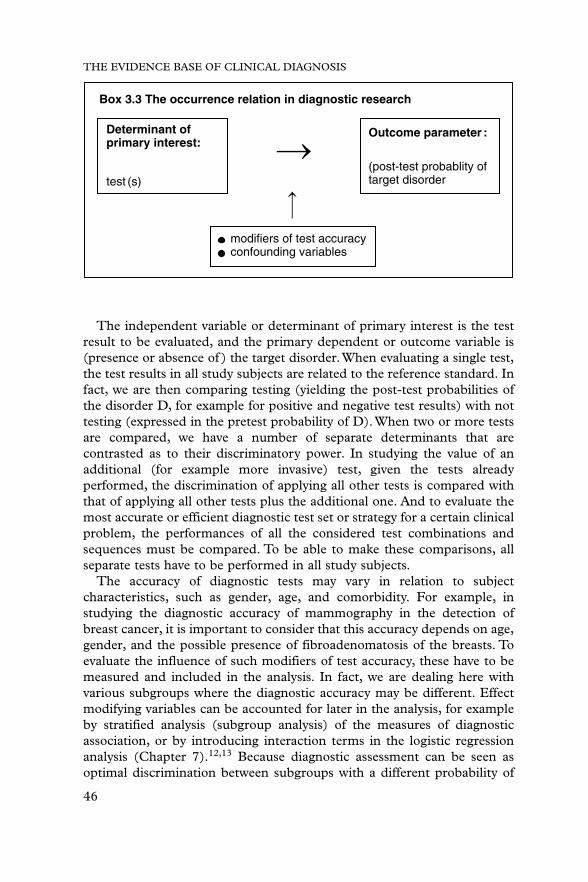
THE EVIDENCE BASE OF CLINICAL DIAGNOSIS
46
The independent variable or determinant of primary interest is the testresult to be evaluated, and the primary dependent or outcome variable is(presence or absence of ) the target disorder.When evaluating a single test,the test results in all study subjects are related to the reference standard. Infact, we are then comparing testing (yielding the post-test probabilities ofthe disorder D, for example for positive and negative test results) with nottesting (expressed in the pretest probability of D).When two or more testsare compared, we have a number of separate determinants that arecontrasted as to their discriminatory power. In studying the value of anadditional (for example more invasive) test, given the tests alreadyperformed, the discrimination of applying all other tests is compared withthat of applying all other tests plus the additional one. And to evaluate themost accurate or efficient diagnostic test set or strategy for a certain clinicalproblem, the performances of all the considered test combinations andsequences must be compared. To be able to make these comparisons, allseparate tests have to be performed in all study subjects.
The accuracy of diagnostic tests may vary in relation to subjectcharacteristics, such as gender, age, and comorbidity. For example, instudying the diagnostic accuracy of mammography in the detection ofbreast cancer, it is important to consider that this accuracy depends on age,gender, and the possible presence of fibroadenomatosis of the breasts. Toevaluate the influence of such modifiers of test accuracy, these have to bemeasured and included in the analysis. In fact, we are dealing here withvarious subgroups where the diagnostic accuracy may be different. Effectmodifying variables can be accounted for later in the analysis, for exampleby stratified analysis (subgroup analysis) of the measures of diagnosticassociation, or by introducing interaction terms in the logistic regressionanalysis (Chapter 7).12,13 Because diagnostic assessment can be seen asoptimal discrimination between subgroups with a different probability of
Determinant of primary interest:
Box 3.3 The occurrence relation in diagnostic research
Outcome parameter :
(post-test probablity oftarget disorder
modifiers of test accuracyconfounding variables
test (s)
Andre_Chap03.qxd 11/6/01 2:56 PM Page 46

ASSESSING THE ACCURACY OF DIAGNOSTIC TESTS
47
disease, effect modifying variables can also be considered as additionaldiagnostic tests themselves.
Confounding variables are independent extraneous determinants of theoutcome that may obscure or inflate an association between the test and the disorder. They are essentially related to both the test result and theoutcome. For example, in studying whether the symptom fatigue ispredictive for a low blood haemoglobin level, it is important to know whichstudy subjects have previously taken oral iron, as this can improve thefatigue symptoms and enhance the haemoglobin level as well. Aconfounder can only be controlled for if it is considered beforehand andmeasured, which requires insight into relevant external influences. Indiagnostic research the term “confounding variable” is used in a different,more pragmatic sense than in aetiologic research, as consistent diagnosticcorrelations do not need to be fully causally understood to be useful.
Generally, according to Bayes’ theorem, the pretest probability of thetarget disorder is seen as a basic determinant of the post-test probability,independent of the accuracy of the applied tests. However, the clinicalspectrum of the disorder may be essentially different in high and lowprevalence situations. Because the clinical spectrum can influence testaccuracy (Chapters 1, 2, and 6), it is then crucial to measure separatelyspectrum characteristics, such as disease severity, and frequency ofoccurrence as such. Spectrum characteristics can then be analysed asmodifiers of test accuracy.
Good test reproducibility is a requirement for good accuracy in practice.Therefore, when the test under study is sensitive to inter- or intraobservervariability, documentation and, if possible, reduction of this variability isimportant. Documentation can be achieved in a pilot study or in thecontext of the main study. For example, in a study of the accuracy andreproducibility of erythrocyte sedimentation rate (ESR) measurements ingeneral practice centres, for measuring an identical specimen a clinicallyrelevant range between practices from 4 to 40 mm/1 h was observed. Theaverage coefficient of variation (CV: standard deviation as a percentage ofthe mean) was 37% between practices and 28% within practices.9 Observervariability can be reduced by training. In the same ESR study, the averageinter- and intrapractice CVs were reduced by training to 17% and 7%,respectively. The accuracy of a test can be evaluated in relation to theachieved reproducibility. This reproducibility must then, for practicalpurposes, be judged as to its clinical acceptability and feasibility.
Outcome: the reference standard
Principles
Establishing a final and “gold standard” diagnosis of the target disorder isgenerally more invasive and expensive than applying the studied diagnostic
Andre_Chap03.qxd 11/6/01 2:56 PM Page 47
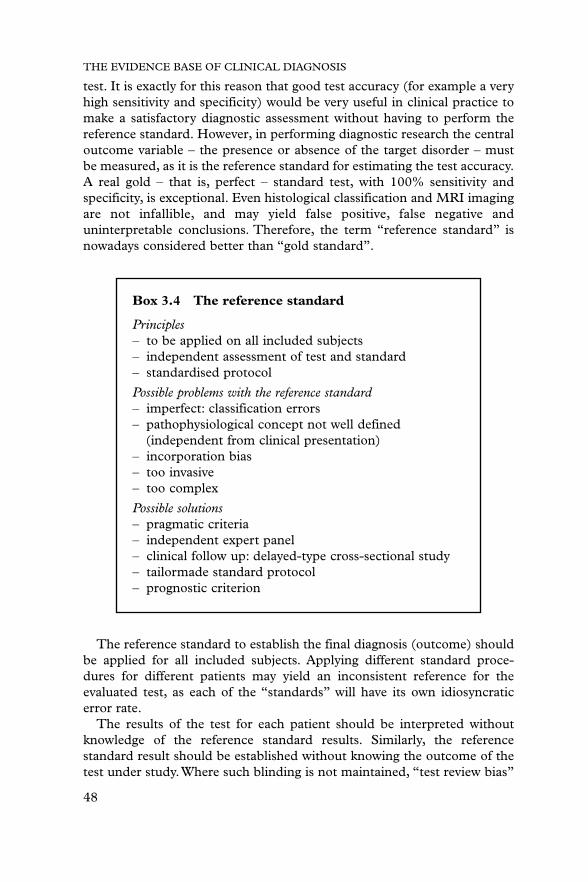
test. It is exactly for this reason that good test accuracy (for example a veryhigh sensitivity and specificity) would be very useful in clinical practice tomake a satisfactory diagnostic assessment without having to perform thereference standard. However, in performing diagnostic research the centraloutcome variable – the presence or absence of the target disorder – mustbe measured, as it is the reference standard for estimating the test accuracy.A real gold – that is, perfect – standard test, with 100% sensitivity andspecificity, is exceptional. Even histological classification and MRI imagingare not infallible, and may yield false positive, false negative anduninterpretable conclusions. Therefore, the term “reference standard” isnowadays considered better than “gold standard”.
THE EVIDENCE BASE OF CLINICAL DIAGNOSIS
48
Box 3.4 The reference standard
Principles– to be applied on all included subjects– independent assessment of test and standard– standardised protocol
Possible problems with the reference standard– imperfect: classification errors– pathophysiological concept not well defined
(independent from clinical presentation)– incorporation bias– too invasive– too complex
Possible solutions– pragmatic criteria– independent expert panel– clinical follow up: delayed-type cross-sectional study– tailormade standard protocol– prognostic criterion
The reference standard to establish the final diagnosis (outcome) shouldbe applied for all included subjects. Applying different standard proce-dures for different patients may yield an inconsistent reference for theevaluated test, as each of the “standards” will have its own idiosyncraticerror rate.
The results of the test for each patient should be interpreted withoutknowledge of the reference standard results. Similarly, the referencestandard result should be established without knowing the outcome of thetest under study.Where such blinding is not maintained, “test review bias”
Andre_Chap03.qxd 11/6/01 2:56 PM Page 48

and “diagnosis review bias” may occur: non-independent assessment of testand reference standard, mostly resulting in overestimation of test accuracy.
The reference standard must be properly performed and interpretedusing standardised criteria. This is especially important when the standarddiagnosis depends on subjective interpretations, for example by apsychiatrist, a pathologist, or a radiologist. In such cases inter- and evenintraobserver variability in establishing the standard can occur. Forexample, in evaluating the intraobserver variability of MRI assessment asthe standard for nerve root compression in sciatica patients, the sameradiologist repeatedly scored the presence of root compression as suchconsistently (: 1.0) but the site of root compression only moderately (: 0.60).14 In these situations, training sessions and permanentdocumentation of performance are important.
Problems and solutions
Apart from the limitations in reaching a 100% perfect standarddiagnosis, meeting the requirements for a reference standard can beproblematic in various ways.
For many conditions a reference standard cannot be measured on the basis of a well defined pathophysiological concept, independent of theclinical presentation. Examples are sinusitis, migraine, depression, irritablebowel syndrome, and benign prostatic hyperplasia. When, in such cases,information related to the test result (for example symptom status) isincorporated into the diagnostic criteria, “incorporation bias” may result inoverestimation of test accuracy. Furthermore, a defined reference standardprocedure may sometimes be too invasive for research purposes. Forinstance, when validating urinary flow measurement it would beunacceptable to apply invasive urodynamic studies to those with normalflow results.15 And in studying the diagnostic value of non-acute abdominalpain in primary care for diagnosing intra-abdominal cancer, one cannotimagine that all patients presenting with non-acute abdominal pain wouldbe routinely offered laparotomy.16 In addition, one may doubt whethersuch laparotomy, if it were to be performed, could always provide anaccurate final diagnosis in the very early stage of a malignancy. Anotherproblem can be that a complex reference standard might include a largenumber of laboratory tests, so that many false positive test results couldoccur by chance.
For these problems, practical solutions have been sought.
Pragmatic criteria
The absence of a well defined pathophysiological concept can sometimesbe overcome by defining consensus based pragmatic criteria. However, ifapplying such reference standard criteria (such as a cut-off value on a
ASSESSING THE ACCURACY OF DIAGNOSTIC TESTS
49
Andre_Chap03.qxd 11/6/01 2:56 PM Page 49

depression questionnaire) is no more difficult than applying the test understudy, evaluating and introducing the test will not be very useful.
Independent expert panel
Another method is the composition of an independent expert panel that,given general criteria and decision rules for clinical agreement, can assign afinal diagnosis to each patient, based on the available clinical information.Toachieve a reasonably consistent classification it is important that the panel iswell prepared for its task, and a training session or pilot study using patientswith an already established diagnosis is recommended.The agreement of theprimary assessments of the individual panel members, prior to reaching toconsensus, can be documented.
Clinical follow up: delayed-type cross-sectional study
When applying a definitive reference standard is too invasive orotherwise inapplicable at the very moment that the test should bepredictive for the presence of the target disorder, a good alternative canbe follow up of the clinical course during a suitable predefined period.Most diseases that are not self-limiting, such as cancers and chronicdegenerative diseases, will usually become clinically manifest a period ofmonths or a year or so after the first diagnostic suspicion (generally themoment of enrolment in the study) was raised. The follow up periodshould not be too short, in order to give early phase disorders the chanceto become manifest and therefore to have a minimum number of “falsenegative” final diagnoses. Nor should it be too long, so as to avoid thefinal diagnosis after follow up being related to a new disease episodestarted after the baseline “cross-section” (false positives).16,17 Inaddition, it would be ideal to collect the follow up data that are decisivefor making the final diagnosis independently from and blinded to thehealth status and test results at time zero, and also to blind the finaloutcome assessment for these test results.
One should take into account that “confounding by indication” canoccur: management decisions during follow up are possibly related to thehealth status at baseline, and might therefore influence the clinical courseand the probability of detecting the target disorder. This is especially a pointof concern in studying target disorders with a rather variable clinical course,becoming clinically manifest dependent on management decisions.
In contrast to what is commonly thought, it has to be acknowledged thatthe described method of clinical follow up should not be considered as a“follow up” or “cohort” study, as the focus is not on relating the time zerodata to a subsequently developing (incident) disorder. In fact, the follow upprocedure is aimed at retrospectively assessing the (prevalent) health statusat time zero, as a substitute for establishing the reference standard
THE EVIDENCE BASE OF CLINICAL DIAGNOSIS
50
Andre_Chap03.qxd 11/6/01 2:56 PM Page 50

ASSESSING THE ACCURACY OF DIAGNOSTIC TESTS
51
diagnosis of the target disorder immediately at time zero itself. Therefore,this design modification can be designated a “delayed-type cross-sectionalstudy”, instead of a follow up study.18
The expert panel and the clinical follow up can be combined in acomposite reference standard procedure, in which the outcome after followup is evaluated and established by the panel.15
Tailormade standard protocol
In some situations, for example in diagnostic research on psychiatricillnesses, it might be difficult to separate test data at time zero (for examplethe presence of anxiety) from the information needed to make a finalassessment (anxiety disorder). As mentioned earlier, in such situationsincorporation bias may be the result. If test data are indeed an essential partof the diagnostic criteria, one cannot avoid balancing a certain risk ofincorporation bias against not being able to perform diagnostic research atall, or making a final diagnosis while ignoring an important element of thecriteria. Often, one can find a practical compromise in considering that forclinical purposes it is sufficient to know to what extent the availablediagnostic tests at time zero are able to predict the target disorder’s becomingclinically manifest during a reasonably chosen follow up period.17 There isalso the option to ask the expert panel to establish the final diagnosis firstwithout the baseline test data, and then to repeat it with these dataincorporated.This can be done while adding an extra blinding step, such asrandomly rearranging the order of anonymised patient records. If therethen appear to be important differences in the research conclusions, thisshould be transparently reported and discussed as to the clinicalimplications.
When it is impossible to meet the principle that the reference standardshould be similarly applied to all study subjects irrespective of their healthor test result status, “next best” solutions can be considered. For example,to determine the accuracy of the exercise electrocardiogram (ECG) inprimary care settings, it might be considered medically and ethicallyunjustified to submit those with a negative test result to coronaryangiography. For these test negatives a well standardised clinical follow upprotocol (delayed-type cross-sectional study) might be acceptable. Thisoption is particularly important when the focus is on exercise ECG inpatients who have a relatively low prior probability of coronary heartdisease. For this spectrum of patients, results of a study limited to thosewho would be clinically selected for coronary angiography would be clearlynot applicable.19–21 If one would still prefer an identical standard procedurefor primary care patients, irrespective of previous test results, one couldalso consider submitting all patients to the clinical follow up standardprocedure. In order to have some validation of this procedure, for the
Andre_Chap03.qxd 11/6/01 2:56 PM Page 51

THE EVIDENCE BASE OF CLINICAL DIAGNOSIS
52
subgroup who had an angiography one can compare the standarddiagnoses based on the follow up with the angiography results.
In summary, although a completely identical and “hard” reference standardfor all included study subjects is the general methodological paradigm, thisis not always achievable. In such situations, given the described limitationsand the suggested alternative approaches, establishing a well documentedand reproducible reference standard protocol – indicating the optimalprocedure for each type of patient – may be not only the best one can getbut also sufficient for clinical purposes.
Prognostic criterion
Diagnostic testing should ultimately be in favour of the patient’s health,rather than just an assessment of the probability of the presence of disease.In view of this, the reference standard procedure can sometimesincorporate prognosis or consequences for clinical management.22,23 It isthen a starting point for further decision making (for example, whethertreatment is useful or not) rather than a diagnostic endpoint. This isespecially relevant in situations where an exhaustive nosologicalclassification is less important, and when management is based primarilyon the clinical assessment (for example in deciding about physiotherapy inlow back pain, or referral to a neurosurgeon in sciatica14). Sometimesmaking a final diagnosis is less important than a prognosis, in view of theclinical consequences (incidental fever) or the lack of a solid diagnosticconsensus (the pyriformis syndrome). In establishing a “prognosticreference criterion”, a pitfall is that prognosis can be influenced byinterfering treatments. In this context, methods for unbiased assessment ofthe impact of testing on patient prognosis are important (Chapter 4). It isto be expected that with the progress of DNA testing for disease,prognostic relevance will increasingly be the reference standard.
Standard shift as a result of new insights
At certain moments during the progress of pathophysiological knowledgeon diagnosis, new diagnostic tests may be developed that are better than thecurrently prevailing reference standard. However, if this possibility issystematically ignored by reducing diagnostic accuracy research to justcomparing new tests with traditional standards, possible new referencestandards would never be recognised, as they would always seem lessaccurate than the traditional ones. Therefore, pathophysiological expertiseshould be involved in the evaluation of diagnostic accuracy. Examples of ashift in reference standard are the replacement of the clinical definition oftuberculosis by the identification of Mycobacterium tuberculosis, and of oldimaging techniques by new ones (see also Chapter 1).
Andre_Chap03.qxd 11/6/01 2:56 PM Page 52

ASSESSING THE ACCURACY OF DIAGNOSTIC TESTS
53
Specifying the study population
As in all clinical research, the study population for diagnostic researchshould be appropriately chosen, defined, and recruited. The selection ofpatients is crucial for the study outcome and its external (clinical) validity.For example, as has already been emphasised, it is widely recognised thatdiagnostic accuracy is very much dependent on the spectrum of includedpatients and the results of relevant tests performed earlier, and may differfor primary care patients and patients referred to a hospital.6,7,21
Given that the test has successfully passed Phase I and Phase II studies(Chapter 2), the starting point is the clinical problem for which the testunder study should be evaluated as to its diagnostic accuracy, taking therelevant healthcare setting into account. For example, the study canaddress the diagnostic accuracy of clinical tests for sciatica in generalpractice, the accuracy of ECG recording in outpatients with palpitationswithout a compelling clinical reason for immediate referral, or thediagnostic accuracy of the MRI scan in diagnosing intracerebral pathologyin an academic neurological centre. The study population should berepresentative for the “indicated”, “candidate”, or “intended” patientpopulation, also called the target population, thereby being clinicallysimilar to the group of patients in whom the validated test is to be appliedin practice.24,25 The “intention to diagnose” should be the key criterion forthe study of presented clinical problems. For the evaluation of populationscreening of asymptomatic subjects, such as in the context of breast cancerscreening or hypertension case finding, a study population similar to thetarget population “intended to be screened” is required.
Box 3.5 Study population
– In accordance with studied clinical problem– “Intention to diagnose” or “intention to screen”– Inclusion criteria corresponding with “indicated” population– Consecutive series (“iatrotropic”) or target population survey
The next step is generally straightforward: the specification of therelevant process of selection of patients for the study (preferablycorresponding with the clinical problem and the healthcare settingrequirements), and the relevant inclusion citeria (in accordance with theindicated population and the relevant patient spectrum). Exclusion criteriamay also be defined, for example identifying those patients for whom the
Andre_Chap03.qxd 11/6/01 2:56 PM Page 53

reference standard procedure is too risky or too burdensome. Theimportance of explicitly formulated entry criteria is demonstrated by astudy on the diagnostic value of reported collapse for the diagnosis ofclinically relevant arrhythmias in general practice: if the inclusion wasbased on presented symptoms the odds ratio (OR) was 1.9, whereas for an inclusion based on coincidentally finding a pulse 60 or � 100 bpm oran irregular pulse, the OR was 10.1.26 Investigators should include“indicated” patients as long as there is no compelling reason not to do so,in order that after the study a non-evidence-based testing practice will notbe introduced or maintained for relevant parts of the “real life” patientspectrum. In this context it is emphasised that, for example in the elderly,comorbidity in addition to the possible presence of the target disorderis often an important aspect of clinical reality.27 For the clinicalapplicability of the study measuring comorbidity and studying it as amodifier of diagnostic accuracy is the preferred approach, instead ofexcluding it.
In the section on study design we discussed the choice betweenpopulation survey and disorder- or test-oriented subject selection, coveringthe principal starting point of patient recruitment. In addition, the pros andcons of the various options for practical patient recruitment should beconsidered. When problems presented to clinicians are studied, recruiting(a random sample of ) a series of consecutively presenting patients whomeet the criteria of the indicated population is most sensible for clinicalvalidity purposes. This should preferably be supported by a description ofthe patient flow in health care prior to presentation. Sometimes, however, itmay take too long to await the enrolment of a sufficiently large consecutiveseries – for example when the clinical problem or target disorder is veryrare, or when a useful contribution to rapidly progressing diagnosticknowledge can only be made within a limited period. In such situations,active surveys of the target population or sampling from a patient registercan be alternatives. However, it should be borne in mind that such methodsmay yield a population of study subjects with a different clinical spectrum.Also, for such subjects the indication to test is less clear than for patientswho experienced an “iatrotropic” stimulus2 to visit a doctor at the verymoment that they want their health problem to be solved.
Of course, for validating test procedures to be used in populationscreening, an active survey of a study population similar to the targetpopulation is the best approach.
In order to enhance external validity, it is essential to add key demographicand clinical characteristics of the identified study population, and toevaluate non-response in relation to these characteristics. Furthermore, allimportant steps in the study protocol, with data on specific subgroups,including subgroup non-response, should be documented. This can besupported by a flow diagram.
THE EVIDENCE BASE OF CLINICAL DIAGNOSIS
54
Andre_Chap03.qxd 11/6/01 2:56 PM Page 54
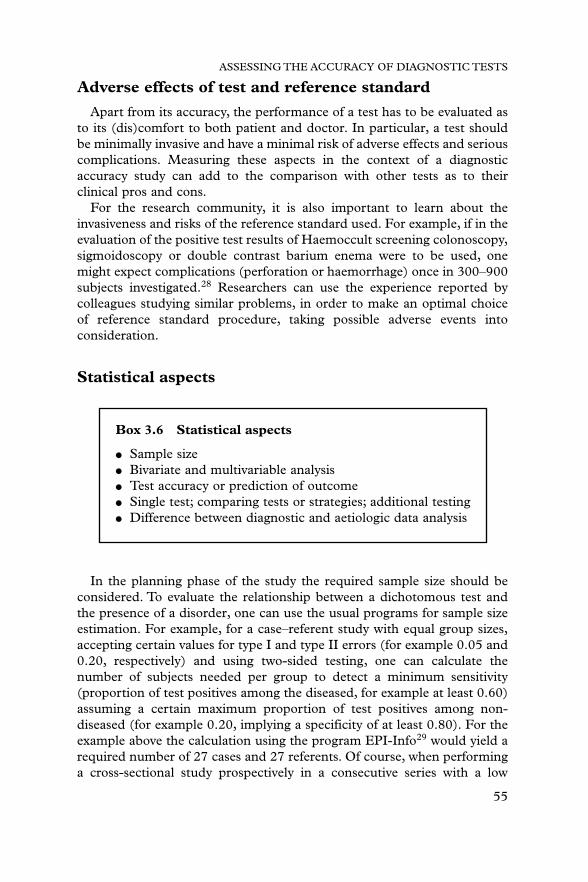
Adverse effects of test and reference standard
Apart from its accuracy, the performance of a test has to be evaluated asto its (dis)comfort to both patient and doctor. In particular, a test shouldbe minimally invasive and have a minimal risk of adverse effects and seriouscomplications. Measuring these aspects in the context of a diagnosticaccuracy study can add to the comparison with other tests as to theirclinical pros and cons.
For the research community, it is also important to learn about theinvasiveness and risks of the reference standard used. For example, if in theevaluation of the positive test results of Haemoccult screening colonoscopy,sigmoidoscopy or double contrast barium enema were to be used, onemight expect complications (perforation or haemorrhage) once in 300–900subjects investigated.28 Researchers can use the experience reported bycolleagues studying similar problems, in order to make an optimal choiceof reference standard procedure, taking possible adverse events intoconsideration.
Statistical aspects
ASSESSING THE ACCURACY OF DIAGNOSTIC TESTS
55
Box 3.6 Statistical aspects
● Sample size● Bivariate and multivariable analysis● Test accuracy or prediction of outcome● Single test; comparing tests or strategies; additional testing● Difference between diagnostic and aetiologic data analysis
In the planning phase of the study the required sample size should beconsidered. To evaluate the relationship between a dichotomous test andthe presence of a disorder, one can use the usual programs for sample sizeestimation. For example, for a case–referent study with equal group sizes,accepting certain values for type I and type II errors (for example 0.05 and0.20, respectively) and using two-sided testing, one can calculate thenumber of subjects needed per group to detect a minimum sensitivity(proportion of test positives among the diseased, for example at least 0.60)assuming a certain maximum proportion of test positives among non-diseased (for example 0.20, implying a specificity of at least 0.80). For theexample above the calculation using the program EPI-Info29 would yield arequired number of 27 cases and 27 referents. Of course, when performinga cross-sectional study prospectively in a consecutive series with a low
Andre_Chap03.qxd 11/6/01 2:56 PM Page 55

expected prevalence of the target disorder (unequal group sizes), therequired sample will be much higher. Also, if a number of determinants issimultaneously included in the analysis, the required sample size is higher:as a rule of thumb, for each determinant at least 10 subjects with the targetdisorder are needed.30
Data analysis in diagnostic research follows the general lines of that inclinical epidemiological research. For single tests the first step is a Bivariateanalysis focused on one predictive variable only, for example in a 2�2 tablein the case of a dichotomous test. It is possible to stratify for modifiers ofaccuracy, thereby distinguishing relevant clinical subgroups, and to adjustfor potential confounding variables. Point estimates and confidenceintervals for the measures of diagnostic accuracy can be determined.Subsequently, there are various options for multivariable analysis, takingthe influence of multiple independent variables into accountsimultaneously. Multiple logistic regression is especially useful foranalysing accuracy data.12,13 These data analytical challenges in diagnosticresearch are discussed in detail in Chapter 7.
It is important to distinguish the analytical approach focusing on theaccuracy of individual tests from the analysis where an optimal predictionof the presence of the studied disorder in patients is at stake. In the first,the dependent variable may even be test accuracy itself, as a function of various determinants. In the latter, a diagnostic prediction model can be derived with disease probability as the dependent variable, and withvarious tests, demographic, and clinical covariables as independentvariables.18,31
When a number of tests are applied there are various analytical options.First, the accuracy of all tests can be determined and compared. Further-more, using multivariate analysis such as multiple logistic regression, thecombined predictive power of sets of test variables can be determined.Moreover, starting from the least invasive and most easily available test(such as history taking), it can be evaluated whether adding more invasiveor more expensive tests contributes to the diagnosis. For example, the sub-sequent contributions of history, physical examination, laboratory testing,and more elaborate additional investigations can be analysed, supported bydisplaying the ROC curves (with areas under the curve) of the respectivelyextended test sets (see Chapter 7).8,26
It must be acknowledged that data analysis in diagnostic research isessentially different from aetiologic data analysis. The principal differenceis that aetiologic analysis usually focuses on the effect of a hypothesisedaetiologic factor adjusted for the influence of possible confounders, therebyaiming at a causal interpretation. In diagnostic research the focus is onidentifying the best correlates of the target disorder irrespective of anycausal interpretations. It is sufficient if these correlates (tests) can besystematically and reproducibly used for diagnostic prediction. Whereas in
THE EVIDENCE BASE OF CLINICAL DIAGNOSIS
56
Andre_Chap03.qxd 11/6/01 2:56 PM Page 56

ASSESSING THE ACCURACY OF DIAGNOSTIC TESTS
57
aetiologic analysis there is a natural hierarchical relation between thepossible aetiologic factor of interest and the covariables to be adjusted for,such a hierarchy is absent for the possible predictors in diagnostic research.This implies that diagnostic data analysis can be more pragmatic, seekingfor the best correlates.
External validation
Analyses of diagnostic accuracy in the collected data set, especially theresults of multivariable analyses, may produce too optimistic results thatmay not be reproducible in clinical practice or similar study populations.32
Therefore, it is advisable to perform one or more separate externalvalidation studies in independent but clinically similar populations.
Box 3.7 External (clinical) validation
● Results based on study data may be too optimistic● “Split-half” analysis is no external validation● Repeated studies in other, similar populations are preferred● First exploration: compare first included half with second half● Role of systematic reviews and meta-analysis
Sometimes authors derive a diagnostic model in a random half of theresearch data set and test its performance in the other half (split-halfanalysis). This approach is not addressing the issue of external validation:in fact, it only evaluates the degree of random error at the cost of possiblyincreasing such error by reducing the available sample size by 50%.18 Also,other methods using one and the same database do not provide a realexternal validation. An exploratory approximation, however, could be tocompare the performance of the diagnostic model in the chronologicallyfirst enrolled half of the patients, with that in the second half. Thejustification is that the second half is not a random sample of the total, butrather a subsequent clinically similar study population. However,totally independent studies in other, clinically similar settings will be moreconvincing. In fact, over time, various studies can be done in comparablesettings, enabling diagnostic systematic reviews and meta-analyses to be performed. This may yield a constantly increasing insight into theperformance of the studied diagnostic test, both in general and in relevantclinical subgroups (Chapter 8).
Andre_Chap03.qxd 11/6/01 2:56 PM Page 57

THE EVIDENCE BASE OF CLINICAL DIAGNOSIS
58
References
1 van den Akker M, Buntinx F, Metsemakers JF, Roos S, Knottnerus JA. Multimorbidity ingeneral practice: prevalence, incidence, and determinants of co-occurring chronic andrecurrent diseases. J Clin Epidemiol 1998;51:367–75.
2 Feinstein AR. Clinical Epidemiology. The architecture of clinical research. Philadelphia: WBSaunders, 1985.
3 Sackett DL, Haynes RB, Guyatt GH, Tugwell P. Clinical epidemiology. A basic science forclinical medicine. Boston: Little, Brown and Company, 1991.
4 Lijmer JG, Mol BW, Heisterkamp S et al. Empirical evidence of design-related bias instudies of diagnostic tests. JAMA 1999;282:1061–6.
5 Moons KGM, van Es GA, Deckers JW, Habbema JDF, Grobbee DE. Limitations ofsensitivity, specificity, likelihood ratio, and Bayes’s theorem in assessing diagnosticprobabilities: a clinical example. Epidemiology 1997;8:12–17.
6 Ransohoff DF, Feinstein AR. Problems of spectrum and bias in evaluating the efficacy ofdiagnostic tests. N Engl J Med 1978;299:926–30.
7 Knottnerus JA, Leffers P. The influence of referral patterns on the characteristics ofdiagnostic tests. J Clin Epidemiol 1992;45:1143–54.
8 Stoffers HEJH. Peripheral arterial occlusive disease. Prevalence and diagnostic management ingeneral practice. Thesis. Maastricht: Datawyse, 1995.
9 Dinant GJ, Knottnerus JA, van Aubel PGJ, van Wersch JWJ. Reliability of the erythrocytesedimentation rate in general practice. Scand J Prim Health Care 1989;7:231–5.
10 Knottnerus JA, Knipschild PG, van Wersch JWJ, Sijstermanns AHJ. Unexplained fatigueand hemoglobin, a primary care study. Can Fam Phys 1986;32:1601–4.
11 Miettinen OS. Theoretical Epidemiology. Principles of occurrence research in medicine. NewYork: John Wiley & Sons, 1985.
12 Spiegelhalter DJ, Knill-Jones RD. Statistical and knowledge-based approaches to clinicaldecision support systems, with an application to gastroenterology. J Roy Stat Soc Ser A1984;147:35–76.
13 Knottnerus JA. Application of logistic regression to the analysis of diagnostic data: exactmodeling of a probability tree of multiple binary variables. Med Decision Making1992;12:93–108.
14 Vroomen PCAJ. The diagnosis and conservative treatment of sciatica. Maastricht: Datawyse,1998.
15 Wolfs GGMC. Obstructive micturition problems in elderly males, prevalence and diagnosis ingeneral practice. Maastricht: Datawyse, 1997.
16 Muris JW, Starmans R. Non acute abdominal complaints. Diagnostic studies in general practiceand outpatient clinic. Thesis. Maastricht, 1993.
17 Warndorff DK, Knottnerus JA, Huijnen LG, Starmans R. How well do generalpractitioners manage dyspepsia? J Roy Coll Gen Pract 1989;39:499–502.
18 Knottnerus JA. Diagnostic prediction rules: principles, requirements and pitfalls. PrimaryCare 1995;22:341–63.
19 Green MS. The effect of validation group bias on screening tests for coronary arterydisease. Stat Med 1985;4:53–61.
20 Knottnerus JA.The effects of disease verification and referral on the relationship betweensymptoms and diseases. Med Decision Making 1987;7:139–48.
21 Begg CB, Greenes RA. Assessment of diagnostic tests when disease verification is subjectto selection bias. Biometrics 1983;39:207–16.
22 Hunink MG. Outcome research and cost-effectiveness analysis in radiology. Eur Radiol1996;6:615–20.
23 Moons KGM. Diagnostic research: theory and application. Thesis. Rotterdam 1996.24 Dinant GJ. Diagnostic value of the erythrocyte sedimentation rate in general practice. Thesis.
Maastricht, 1991.25 van der Schouw YT, Verbeek AL, Ruijs SH. Guidelines for the assessment of new
diagnostic tests. Invest Radiol 1995;30:334–40.26 Zwietering P. Arrhythmias in general practice, prevalence and clinical diagnosis. Maastricht:
Datawyse, 2000.
Andre_Chap03.qxd 11/6/01 2:56 PM Page 58

ASSESSING THE ACCURACY OF DIAGNOSTIC TESTS
59
27 Schellevis FG, van der Velden J, van de Lisdonk E, van Eijk JT, van Weel C. Comorbidityof chronic diseases in general practice. J Clin Epidemiol 1993;46:469–73.
28 Towler BP, Irwig L, Glasziou P, Weller D, Kewenter J. Screening for colorectal cancer using the faecal occult blood test, hemoccult. Cochrane Database Syst Rev 2000;(2):CD001216.
29 Dean AG. The Epi Info Manual. Brixton Books, 1996.30 Harrell FE Jr, Lee KL, Mark DB. Multivariable prognostic models: issues in developing
models, evaluating assumptions and adequacy, and measuring and reducing errors. StatMed 1996;15:361–87.
31 Laupacis A, Sekar N, Stiell IG. Clinical prediction rules. A review and suggestedmodifications of methodological standards. JAMA 1997;277:488–94.
32 Starmans R, Muris JW, Fijten GH, Schouten HJ, Pop P, Knottnerus JA. The diagnosticvalue of scoring models for organic and non-organic gastrointestinal disease, including theirritable-bowel syndrome. Med Decision Making 1994;14:208–16.
Andre_Chap03.qxd 11/6/01 2:56 PM Page 59

Andre_Chap03.qxd 11/6/01 2:56 PM Page 60

61
4 Diagnostic testing andprognosis: the randomisedcontrolled trial indiagnostic researchJEROEN G LIJMER, PATRICK M BOSSUYT
Summary box
● From the patient’s perspective the contribution of diagnostic teststo a better health outcome is of primary importance, rather thantheir correspondence with the “truth”.
● Diagnostic test evaluations should therefore focus on the likelihoodthat tests detect clinical events of interest and the effect that testscan have on those events by way in which the results affectsubsequent management decisions.
● Randomised controlled trials of diagnostic tests are feasible, andseveral designs are possible.
● Each trial design option has its own advantages and disadvantages.Depending on the clinical problem under study, the type ofinformation needed, and the costs of tests or follow up, one designcan be preferred over another.
● Whereas in most randomised controlled trials of diagnostic tests so farthe point of randomisation coincided with the clinical decision as towhether or not to perform the test, the trial design can be made moreefficient by randomising only patients with the test result of interest.
● The randomised trial design can be elaborated both for evaluatingthe (additional) prognostic value of a single test, and for comparingdifferent test strategies.
Andre_Chap04.qxd 11/6/01 2:57 PM Page 61

THE EVIDENCE BASE OF CLINICAL DIAGNOSIS
62
Why bother about the prognostic impact of a diagnostic test?
For scientific purposes it is worth knowing whether or not a result froma medical test corresponds to the truth. Can this value be trusted? Is thistruly a sign of disease? These are the first questions that come to the mindin the evaluation of medical tests.
From a patient perspective, mere knowledge about the present, true stateof things is in most cases not enough. In relieving health problems,information in itself will not suffice. Patients will only benefit fromdiagnostic tests if the information generated by those tests is correctly usedin subsequent decisions on action to restore or maintain the patient’s health.
There are several ways in which medical tests can affect a patient’shealth. First, undergoing the test itself can have an impact. The adverseeffects range from slight discomfort and temporary unpleasantness tolasting side effects or death. On the other hand, undergoing an elaborateprocedure can also have a non-specific positive effect on patientcomplaints, regardless of the information that results from it. This can becalled the “placebo” effect of testing, and we know very little about itsmagnitude and modifying factors.
In addition to the effects of the diagnostic procedure itself, the informationgenerated by the test also influences patients. Information on the likely causeof one’s health problems or other aspects of health status can have both apositive and a negative effect, albeit limited. As patients, we want to beinformed about the origin of our complaints, even in the absence of a cure.Such information may enable us to find better ways of handling them, bydeveloping strategies to limit their disabling impact on our daily activities.
In these cases it is not just the present state of health that is of interest,but also the future course of disease. It follows, then, that the value ofinformation from diagnostic tests lies not only in the past (where did thiscome from?) or the present (how is it?), but also in the future. Hence, therelevance of diagnostic information is closely related to prognosis: theimplications for the future course of the patient’s condition.
● A randomised controlled trial of diagnostic tests should incorporatea prespecified link between test and treatment options to ascertainvalidity and generalisability.
● Methods to preserve allocation concealment and blinding deservespecial attention.
● Sample size calculations need special attention, and must includean estimation of the discordance rate.
Andre_Chap04.qxd 11/6/01 2:57 PM Page 62

The first section of this chapter discusses the evaluation of a single test,starting from an evaluation of its prognostic value and then moving on tothe consequences for treatment. It closes with a presentation of randomiseddesigns for evaluating test–treatment combinations. The second sectioncontains an elaboration of the methods for comparing and evaluatingmultiple test strategies, also including randomised clinical trials. Thechapter ends with a discussion on practical issues.
How to measure the prognostic impact of a test
A recent example of the assessment of the prognostic value of a test canbe found in the literature on the management of carotid disease. Severalstudies have examined the need to perform duplex ultrasonography inpatients with a cervical bruit without further symptoms of cerebrovasculardisease.To answer this question, an assessment has to be made of the valueof duplex ultrasonography. Such an evaluation will often look at theamount of agreement between the index test (duplex ultrasonography) andthe reference test (the best available method to reveal the true condition ofthe carotid arteries). In this case, the reference test will mostly likely beconventional angiography. If properly conducted, a 2�2 table can beconstructed after the study is done and all indicators of diagnostic accuracycan be calculated. Unfortunately, many of the evaluation studies indiagnostic techniques for carotid stenosis performed so far did not meet thedesign requirements for an unbiased and useful evaluation.1
From a patient perspective, one could successfully argue that it is not somuch the correspondence with the “truth” that should be of concern,especially not in asymptomatic patients. For these patients, the true valueof the information should come from the strength of the associationbetween data on the presence and severity of carotid stenosis and thelikelihood of vascular events in the near future. The appropriate referencestandard for such an evaluation will not be a diagnostic procedure. Instead,one should look for clinical information collected through a meticulousfollow up of all patients subjected to the index test.
Figure 4.1 illustrates the general design of such a study. All patients withcervical bruits without previous cerebrovascular disease are eligible for the
DIAGNOSTIC TESTING AND PROGNOSIS
63
Outcome
Outcome
Duplex US
3 years follow up
3 years follow up
+
–
Patients withcervical bruits
Figure 4.1 Prognostic study.
Andre_Chap04.qxd 11/6/01 2:57 PM Page 63
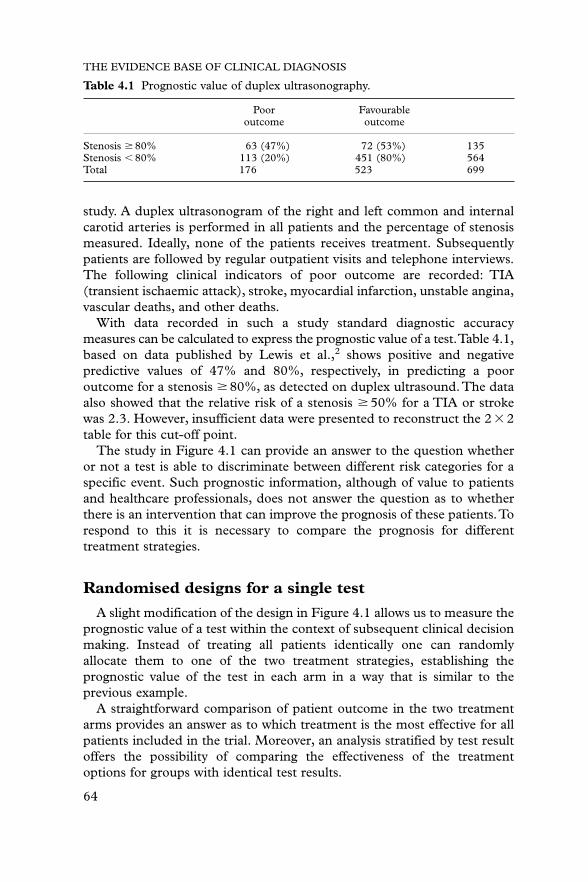
THE EVIDENCE BASE OF CLINICAL DIAGNOSIS
64
study. A duplex ultrasonogram of the right and left common and internalcarotid arteries is performed in all patients and the percentage of stenosismeasured. Ideally, none of the patients receives treatment. Subsequentlypatients are followed by regular outpatient visits and telephone interviews.The following clinical indicators of poor outcome are recorded: TIA(transient ischaemic attack), stroke, myocardial infarction, unstable angina,vascular deaths, and other deaths.
With data recorded in such a study standard diagnostic accuracymeasures can be calculated to express the prognostic value of a test.Table 4.1,based on data published by Lewis et al.,2 shows positive and negativepredictive values of 47% and 80%, respectively, in predicting a pooroutcome for a stenosis � 80%, as detected on duplex ultrasound.The dataalso showed that the relative risk of a stenosis � 50% for a TIA or strokewas 2.3. However, insufficient data were presented to reconstruct the 2 � 2table for this cut-off point.
The study in Figure 4.1 can provide an answer to the question whetheror not a test is able to discriminate between different risk categories for aspecific event. Such prognostic information, although of value to patientsand healthcare professionals, does not answer the question as to whetherthere is an intervention that can improve the prognosis of these patients.Torespond to this it is necessary to compare the prognosis for differenttreatment strategies.
Randomised designs for a single test
A slight modification of the design in Figure 4.1 allows us to measure theprognostic value of a test within the context of subsequent clinical decisionmaking. Instead of treating all patients identically one can randomlyallocate them to one of the two treatment strategies, establishing theprognostic value of the test in each arm in a way that is similar to theprevious example.
A straightforward comparison of patient outcome in the two treatmentarms provides an answer as to which treatment is the most effective for allpatients included in the trial. Moreover, an analysis stratified by test resultoffers the possibility of comparing the effectiveness of the treatmentoptions for groups with identical test results.
Table 4.1 Prognostic value of duplex ultrasonography.
Poor Favourableoutcome outcome
Stenosis � 80% 63 (47%) 72 (53%) 135Stenosis 80% 113 (20%) 451 (80%) 564Total 176 523 699
Andre_Chap04.qxd 11/6/01 2:57 PM Page 64

This type of design and analysis can be illustrated with another examplefrom the field of cerebrovascular disease. In the management of acutestroke the role of intravenous anticoagulation and duplex ultrasonographyof the carotid arteries is unclear. A large trial has been performed with asits primary objective the documentation of the efficacy of unfractionatedheparin in the treatment of acute stroke. A secondary objective was anevaluation of the role of duplex ultrasonography in selecting patients foranticoagulation.3,4 A simplified version of the design of this trial is outlinedin Figure 4.2. Patients with evidence of an ischaemic stroke, withsymptoms present for more than 1 hour but less than 24 hours, wereeligible for the study. A duplex ultrasonogram of the right and left commonand internal carotid arteries was performed in all included patients.Subsequently, patients were randomised to treatment with unfractionatedheparin or placebo, and followed for 3 months. A favourable outcome afterstroke was defined as a score of I or II on the Glasgow Coma Scale and ascore of 12–20 on the modified Barthel Index.
Tables 4.2(a) and (b) shows the prognostic value of Duplex ultra-sonography in each trial arm. An odds ratio can be calculated for each table.These odds ratios can be interpreted as measures of the natural prognosticvalue (Table 4.2(b)) and the prognostic value with intervention (Table 4.2(a)),respectively. Another presentation of the same data gives us Tables 4.2(c) and(d), which provide us with information on the treatment effect in both testresult categories.We will call the odds ratios of the latter two tables treatmenteffect in test normals (Table 4.2(d)) and treatment effect in test abnormals (Table4.2(c)). When the test discriminates well between patients that benefit fromtreatment and those that do not, the treatment effect in test abnormals willdiffer from that in test normals.The ratio of the odds ratios of Tables 4.2(c) and4.2(d) can therefore be used as a measure of the prognostic impact of the test.
The study in Figure 4.2 provides information on the treatment effect inall test result categories. In practice, it will not always be necessary or ethicalto randomise all patients, as uncertainty may exist only for patients with aspecific – say, abnormal – test result. This will be the case when there isinformation available that the prognosis for normal test results is good and
DIAGNOSTIC TESTING AND PROGNOSIS
65
Outcome
Outcome
Duplex US
Unfractionated heparin
Placebo
RPatients withacute stroke
Figure 4.2 Basic RCT of a single diagnostic test.
Andre_Chap04.qxd 11/6/01 2:57 PM Page 65

that patients with such results need no intervention. A logical translation ofsuch a question into a study design would be to randomise only patientswith abnormal test results between the different treatment options.
Consider the first example of duplex ultrasonography in patients withcervical bruits. Such a trial could provide evidence that the natural historyof patients with a stenosis of less than 50% has a good prognosis.The trialoutlined in Figure 4.3 can subsequently answer the question as to whethertherapy can improve the prognosis of patients with a stenosis of 50% ormore. As in the first example, all patients with cervical bruits withoutprevious cerebrovascular disease are eligible for the study. A duplexultrasonography of the right and left common and internal carotid arteriesis performed in all patients to measure the percentage of stenosis.Subsequently, if the stenosis is 50% or more patients are randomly assignedto receive either aspirin 325 mg a day or placebo. The clinical endpoints –TIA, stroke, myocardial infarction, unstable angina, vascular deaths, andother deaths – are recorded during follow up.
THE EVIDENCE BASE OF CLINICAL DIAGNOSIS
66
Table 4.2 Analysis of an RCT of a single diagnostic test.
(a) Unfractionated heparin (b) Placebo
Poor Favourable Poor Favourableoutcome outcome outcome outcome
Stenosis 38 (32%) 82 (68%) 120 Stenosis 51 (47%) 58 (53%) 109�50% �50%
Stenosis 121 (23%) 400 (77%) 521 Stenosis 116 (22%) 409 (78%) 52550% 50%
Total 159 482 641 Total 167 467 634
(c) Stenosis larger than 50% or occlusion (d) Stenosis smaller than 50%
Poor Favourable Poor Favourableoutcome outcome outcome outcome
Unfract. 38 (32%) 82 (68%) 120 Unfract. 121 (23%) 400 (77%) 521heparin heparin
Placebo 51 (47%) 58 (53%) 109 Placebo 116 (22%) 409 (78%) 525Total 89 140 229 Total 237 809 1046
(e) Comparison of strategies
Poor Favourableoutcome outcome
Duplex US 154 (24%) 491 (76%) 645No duplex US 167 (26%) 467 (74%) 634Total 321 958 1279
Duplex US in (e): Decision whether or not to give UFH is based on duplex ultrasonography.The odds ratios and their 95% CI of (a) to (e) are: 1.5 (0.99–2.4), 3.1 (2.0–4.8), 0.53(0.31–0.90), 1.1 (0.80–1.4), and 0.88 (0.68–1.1). The relative odds ratio of (a)/(b) or (c)/(d)is 0.48.
Andre_Chap04.qxd 11/6/01 2:57 PM Page 66

DIAGNOSTIC TESTING AND PROGNOSIS
67
Cote and colleagues performed such a trial in 1995.5 They randomised372 neurologically asymptomatic patients with a carotid stenosis of 50% ormore between aspirin and placebo. By comparing the outcomes in bothtreatment arms the effectiveness of treating patients with a stenosis of 50%or more with aspirin was evaluated (treatment effect in test abnormals). In50 of the 188 patients receiving aspirin and 54 of the 184 receiving placeboa clinical event was measured during follow up, yielding an adjusted hazardratio (aspirin versus placebo) of 0.99 (95% CI, 0.67–1.46). The authorsconcluded that aspirin did not have a significant long term protective effectin asymptomatic patients with high grade stenosis (more than 50%).
The trial in Figure 4.3 can also provide information on the accuracy ofduplex US in predicting the outcomes of interest (natural prognosticvalue). This can be done by comparing the outcome in patients in theplacebo arm, who all had an abnormal test result, with the outcome inthose with a normal test result. A prerequisite for this comparison is thatpatient management in both of these arms is similar. Table 4.3(a) and (b)shows the crude results and possible comparisons. Note that to calculatethe diagnostic accuracy of duplex US it is necessary to correct for thesampling rate of patients with high grade stenosis.6
Patients withcervical bruits
Outcome
Outcome
Outcome
Duplex US
Aspirin 325 mg/day
Placebo
2 years follow up
+
–
R
Figure 4.3 Randomising abnormal test results.
Table 4.3 Analysis of an RCT, randomising only abnormal test results
(a) Natural prognostic value (b) Treatment effect in case of � 50% stenosis
Poor Favourable Poor Favourableoutcome outcome outcome outcome
Stenosis 130 (71%) 54 (29%) 184 Aspirin 138 (73%) 50 (27%) 188�50%*
Stenosis 255 (78%) 72 (22%) 327 Placebo 130 (71%) 54 (29%) 18450%
Total 385 126 511 Total 268 104 372
*Random sample of patients with a stenosis �50%.
Andre_Chap04.qxd 11/6/01 2:57 PM Page 67

THE EVIDENCE BASE OF CLINICAL DIAGNOSIS
68
Alternative randomised designs
An alternative to the design in Figure 4.3 would be to move the point ofrandomisation back in time to the point where the test results are not yetknown. This comes down to the randomisation of all patients to eitherdisclosure or non-disclosure of the test results.
The latter design was used to evaluate Doppler ultrasonography of theumbilical artery in the management of women with intrauterine growthretardation (IUGR).7 A total of 150 pregnant women with IUGRunderwent Doppler ultrasonography and were subsequently randomised todisclosure or non-disclosure of the test results (Figure 4.4(a)). In the groupin which the results of the test were revealed, women were hospitalised incase of abnormal flow and discharged with outpatient management in caseof normal flow. In the non-disclosure group all patients received theconventional strategy for women with IUGR, of hospitalisation regardless oftheir test results. The trial compared perinatal outcome, neurologicaldevelopment and postnatal growth between the two strategies. The trialdesign, depicted in Figure 4.4(a), allows us to determine the natural prognosticvalue and the treatment effect in test abnormals. Unfortunately the authorsdid not report sufficient data to reconstruct the necessary 2 � 2 tables.
One could move the point of randomisation further back in time, to thedecision whether or not to perform the test. A translation of this
Women withIUGR
Outcome
Outcome
Outcome
Outcome
Outcome
Outcome
Doppler US
Clin. management
Home care
No disclosure
Disclosure
Clin. management
+
–
R
Women withIUGR
Doppler US
Clin. management
Home care
Clin. management
+
–
R
(a)
(b)
Figure 4.4 Alternative randomised designs.
Andre_Chap04.qxd 11/6/01 2:57 PM Page 68

DIAGNOSTIC TESTING AND PROGNOSIS
69
comparison for the Doppler US in IUGR is the RCT in Figure 4.4(b).Women in whom IUGR has been diagnosed are randomly allocated to twostrategies. The first consists of applying the test of interest, Dopplerultrasonography, in all women with IUGR. In case of abnormal flow apatient is hospitalised. In case of normal flow they are discharged withoutpatient management. In the second strategy all women with IUGR arehospitalised. Subsequently, neonatal outcome is observed in each trial arm.A comparison of the outcomes in the two arms offers a measure of theeffectiveness of using Doppler ultrasonography in making decisions onhospitalisation. Such a design evaluates both the test and the treatmenteffect; it is, however, not possible to distinguish the treatment effect fromthe prognostic value of the test.
Similar outcomes in both arms will be observed if there is no differencein outcome with either home care or clinical management in all patientssatisfying the inclusion criteria for this trial. Differences in outcome are notnecessarily attributed to the test. In case of a wrong choice of treatment, theoutcome of the Doppler ultrasonography arm can turn out to be inferior tothe conventional strategy, no matter how good or reliable the test actuallyis. This same line of reasoning can also be applied in case of a superioroutcome in the Doppler arm. If there is a (sub)group of patients that isbetter off with home care, then the expected outcome in the Dopplerultrasonography group will always be superior, regardless of the intrinsicquality or accuracy of the test.
These examples demonstrate that it is not possible to make conclusionson the prognostic impact of the test itself using the design in figure 4(b), aslong as it remains unclear to what degree results of such a trial depend onthe new treatment, on accurate selection through the test, or both.
How to compare test strategies
In many clinical situations there are multiple tests available to examine thepresence of the target condition. When one wishes to compare twocompeting tests the first three designs introduced earlier for the evaluationof a single test have to be adapted slightly.
To compare the prognostic value of two tests, a straightforwardtranslation of Figure 4.1 is to perform both tests in all patients and tomonitor the outcome of interest during a follow up period. Such a designis outlined in Figure 4.5(a). The data from such a study can be used tocalculate and compare the prognostic value of each test, using conventionalmeasures of diagnostic accuracy. One can also analyse the data bystratifying the results according to the possible test combinations.With twodichotomous tests this will result in a 4 � 2 table (Table 4.4). Note thateach possible combination of results on test A and test B is treated as aseparate test result category, analogously to a single test with four possible
Andre_Chap04.qxd 11/6/01 2:57 PM Page 69

THE EVIDENCE BASE OF CLINICAL DIAGNOSIS
70
Outcome
Outcome
Patients
Follow up(a)
Follow up
+
–A B
Outcome
Outcome
Patients
Treatment I(b)
Treatment II
+
–
RA B
Outcome
Outcome
Patients
Treatment I
Treatment I
(c)
Treatment II
Treatment II
+ –
++
– –
– +
RA B
Outcome
Outcome
Figure 4.5 Designs to compare diagnostic strategies.
Table 4.4 A 4 � 2 table of the results of two dichotomous tests.
Outcome
A B � �
� �
� �
� �
� �
Total
result categories. Subsequently, the predictive value or the likelihood ratioof each result category can be calculated as a measure of prognostic value.8
To examine both tests in the context of subsequent clinical decisionmaking, it is possible to randomise all patients between two treatment
Andre_Chap04.qxd 11/6/01 2:57 PM Page 70

strategies, similar to the design in Figure 4.2, regardless of their test results.Figure 4.5(b) shows an example of such a design: both tests are performedand all patients are randomly allocated to one of the two treatment options.This allows one to explore the prognostic value of both tests in eachtreatment arm. In addition, the data from such a trial can be used to findthe most effective treatment for all patients included in the trial. Ifstatistical power allows it, subgroup analysis of the treatment effect in thefour possible test result categories offers the possibility of identifying themost effective treatment option for patients in the respective categories.
Although the previous design allows for many different explorations, onlysome are relevant from a clinical perspective.When two tests are compared,one of them is often already used in clinical practice and decisions onsubsequent management are made based on this test. Let us assume that,in clinical practice, test positive patients are treated and test negativepatients are not. If future decisions are to be made under the guidance ofthe new test, patients who are positive on the new test will be treated andthose who are negative will not. This means that the only patients that willbe managed differently are the ones who are test positive on the existingtest but negative on the new one, and those who are test negative on theexisting test but positive on the new one.
As patients with concordant test results (�� or ��) will receive the samemanagement, it is unnecessary and in some circumstances even unethical toexamine the treatment effect in these two subgroups. If a new test (B) is thenexamined with the goal of substituting the old, possibly more invasive,and/or costly test (A), the design in Figure 4.5(c), randomising only thediscordant test results, is more efficient. Subsequently, the treatment effectand the predictive values of the discordant result categories (A�B� andA�B�) can be examined (see Table 4.5(a–d)).
By transposing these tables it is possible to examine the effect of a clinicalpathway based on test A or test B for patients with discordant test results(Tables 4.5(e) to 4.5(f )). The difference in poor outcome rate betweenthese two tables, after correcting for the frequency of discordant results, isequal to the absolute risk difference of a clinical pathway based on test Acompared to a pathway based on test B.To calculate the relative risk or thetotal risk of each strategy separately it is necessary to have information onthe clinical event rate in each concordant group.
An alternative design, using the random disclosure principle, is outlinedin Figure 4.6(a). Both test A and test B are performed in all patients.Subsequently, patients are randomised between a clinical pathway based ontest A without disclosing the results of test B, and a pathway based on testB with non-disclosure of the results of test A.The same measures and tablescan be obtained from such a design as discussed for the design in Figure 4.5.
In some situations one might wish to let the point of randomisationcoincide with that of the clinical decision to choose either test A or test B and
DIAGNOSTIC TESTING AND PROGNOSIS
71
Andre_Chap04.qxd 11/6/01 2:57 PM Page 71

act on the respective results. A recent trial used this design to study twodifferent diagnostic approaches for the management of outpatients withdysphagia.9 Patients with dysphagia are at risk for aspiration pneumonia. Amodified barium swallow test (MBS) and flexible endoscopic evaluation ofswallowing with sensory testing (FEESST) are supposed to distinguishpatients who can benefit from behavioural and dietary management fromthose who will need a percutaneous endoscopic gastrostomy (PEG) tube.For the discussion we consider a simplified design as outlined in Figure4.6(b). Outpatients presenting with dysphagia were randomly allocated toeither a strategy using MBS or a strategy using FEESST to guide subsequentmanagement. During 1 year of follow up the occurrence of pneumonia wasrecorded in both trial arms. There were six cases of pneumonia in the 50(12%) patients allocated to the FEESST strategy and 14 in the 76 (18%)patients allocated to the MBS strategy.The absolute risk difference was notsignificantly different from zero (risk difference 6%; 95% CI �6% to 19%).As no patient received both tests it is not possible to distinguish the
THE EVIDENCE BASE OF CLINICAL DIAGNOSIS
72
Table 4.5 Analysis of an RCT of two tests randomising only discordant results.
(a) Treatment effect A�B� (b) Treatment effect A�B�
A� B� Poor Favourable A� B� Poor Favourableoutcome outcome outcome outcome
Treatment I Treatment I
Treatment II Treatment II
Total Total
(c) Treatment (d) No treatment
A B Poor Favourable A B Poor Favourableoutcome outcome outcome outcome
� � � �
� � � �
Total
(e) Strategy based on A (f) Strategy based on B
A B Poor Favourable A B Poor Favourableoutcome outcome outcome outcome
� � � �
� � � �
Total
Andre_Chap04.qxd 11/6/01 2:57 PM Page 72

DIAGNOSTIC TESTING AND PROGNOSIS
73
treatment effect from the prognostic value of the tests, nor is it possible tocompare the outcome in the subgroups with discordant test results.
Often a new test is introduced to complement rather than to replaceexisting tests. One example is where the new test is to be added to thediagnostic pathway before an older test as a triage instrument. Patients witha particular test result (say, negative) on the new test will not be subjectedto the existing test. Alternatively, the new test is added after the existingtest, making further refinement in diagnosis or treatment decisionspossible. We refer to these two options as pre- and postaddition.
If a test is added at the end of a diagnostic work up to further classifydisease (postaddition) all the designs presented in Figures 4.2 to 4.4 for thesingle test evaluation can be used to evaluate this new classification. For
Outcome
Outcome
Treatment I(a)
Treatment II
+
–
RA B
Disclose A
Outcome
Outcome
Treatment I
Treatment II
+
–
Disclose B
Outcome
Outcome
PEG(b)
Diet
+
–
R
FEESST
Outcome
Outcome
PEG
Diet
+
–
MBS
Patients
Patients withdysphagia
Figure 4.6 Alternative designs to compare diagnostic strategies.
Andre_Chap04.qxd 11/6/01 2:57 PM Page 73

THE EVIDENCE BASE OF CLINICAL DIAGNOSIS
74
example, to evaluate the prognostic impact of a genetic test for theclassification of women with breast cancer in two different subgroups, onecould use a design similar to the one in Figure 4.3. Women suspected ofbreast cancer are evaluated with the conventional diagnostic work up.Subsequently, only women with breast cancer are eligible for the trial. In allthese women genetic tests are performed. Depending on the results, theyare subsequently randomised between two types of treatment.
When the goal of a new test is to limit the number of people undergoingthe classic diagnostic work up (triage or preaddition), the designs inFigures 4.5(b)–(c) and 4.6(a) can be used to evaluate the prognosticimpact of such a strategy. Using the principle that only patients with testresults that will actually account for the difference are randomised, onecould also adapt the design of Figure 4.5(b), randomising only patientswith the pair of discordant test results that will be treated differently if thenew strategy is adopted. Another option is shown in Figure 4.7(a). As thedifference between the two strategies comes from the group of patients whoare not selected for the classic diagnostic work up, one can randomise onlythese patients to either the classic work up and treatment, or managementbased on the results of the new test.
Many studies to evaluate the preaddition of a test have randomised allpatients between the two different diagnostic work ups.10,11 One such studyevaluated Helicobacter pylori serology as a way to reduce the number ofpatients subjected to endoscopy. Lassen et al.10 performed the trialoutlined in Figure 4.7(b). Patients presenting in primary care withdyspepsia were randomly assigned to either H. pylori and eradicationtherapy or prompt endoscopy. In case of a negative H. pylori test patientswere still subjected to endoscopy. During a 1 year follow up the symptomswere recorded on a Likert scale.
Choice of design
Each of the designs discussed in Figures 4.1 to 4.7 has its ownadvantages and disadvantages. Depending on the clinical problem onewishes to answer, the type of information needed, and the costs of tests orfollow up, one design can be preferred over another.
The outlines in Figures 4.2 to 4.4 can be used to evaluate a strategy witha new test compared to a classic strategy without such a test. In case ofpostaddition the classic strategy will consist of the classic diagnostic workup and treatment. In case of a substitution problem, any of the trial designsoutlined in Figures 4.5(b) to 4.6(b) can provide an answer. The designsoutlined in Figures 4.5(b), 4.6(a), 4.7(a), and 4.7(b) can provide an answerin case of a preaddition problem.
Table 4.6 gives an overview of the information that can be deduced fromthe different designs. The designs in Figures 4.2 and 4.5(b), testing all
Andre_Chap04.qxd 11/6/01 2:57 PM Page 74

DIAGNOSTIC TESTING AND PROGNOSIS
75
patients and randomising all between two treatment strategies, provide themost information. In addition to data on the effects of the two evaluatedstrategies, they provide information on the treatment effect and prognosticvalue of all possible test result categories.Yet these designs are not always
Outcome
Outcome
Patients
Treatment I(a)
Treatment II
+
+
–
–
B
Outcome
Outcome
Treatment I
Treatment II
OutcomeTreatment II
+
–
B
R
Outcome
Outcome
Eradication therapy(b)
Proton pump inhibitor
+
–
Endoscopy
Outcome
Outcome
Eradication therapy
Outcome
+
– +
–
R
HP serology
Endoscopy
Eradication therapy
Proton pump inhibitor
Patients withdyspepsia
A
Figure 4.7 Designs to evaluate preaddition.
Andre_Chap04.qxd 11/7/01 10:28 AM Page 75

ethical, as there is often evidence that one treatment is better for some ofthe test result categories. In that case a better alternative are the designsoutlined in Figures 4.3, 4.5(c) and 4.7(a), in which only the patients forwhom there is uncertainty in the subsequent management are randomised.
The designs in Figures 4.4(b), 4.6(b) and 4.7(b) have frequently beenused in the medical literature, probably because of their pragmaticattractiveness. In these designs the point of randomisation coincides withthe decision to perform either test A or test B. From a cost perspectivethese designs can be more be economical than the other designs, in case ofan expensive test, as on average fewer patients are tested than with the otherdesigns. If follow up is expensive, designs randomising only patients withthe test category of interest (Figures 4.3, 4.5(c) and 4.7) are more efficient,as fewer patients will be needed to achieve the same amount of statisticalprecision.12 However, the latter designs are not feasible when tests thatinfluence each other’s performance are being compared. For example,it is not possible to compare two surgical diagnostic procedures,mediastinoscopy and anterior mediastinotomy, for the detection ofmediastinal lymphomas by performing them both in all patients assuspected lymph nodes are removed.13
Practical issues
We have discussed the pros and cons of different designs to evaluate theprognostic impact of a single test or to compare different test strategies. Inthe design of a trial there are several other issues that should be consideredin advance. In all of the examples we have presented here there was aprespecified link between test results and management decisions. Testpositive patients were to receive one treatment, test negative another. If sucha link is absent, and clinicians are free to select therapy for each test result,it will remain unclear to what extent poor trial results reflect deficiencies ofthe test itself, ineffective treatment options or, alternatively, incorrectmanagement decisions. Detailed information on the treatment protocol isalso necessary for others to implement the possible findings of the study.
THE EVIDENCE BASE OF CLINICAL DIAGNOSIS
76
Table 4.6 Possible analyses of each randomised design.
Figure 1, 5(a) 2 3, 4(a) 5(b) 5(c) 6(a) 4(b) 6(b)7(a) 7(b)
Natural prognostic value � � � �Prognostic value under intervention � �Treatment effect test abnormals � � �Treatment effect test normals � �Treatment effect discordant tests � �Strategy effect � � � � �
Andre_Chap04.qxd 11/6/01 2:57 PM Page 76

A clear specification of the treatment options and their relation with thedifferent test results is an absolute necessity for any diagnostic study.12
As for each randomised controlled trial, methods to preserve allocationconcealment and blinding deserve special attention. It has been shownempirically that inadequate concealment of allocation, as well asinadequate blinding, can lead to exaggerated estimates of a strategy’seffectiveness.14 One way to guard adequate allocation concealment is acentral randomisation procedure. In some situations the use of sealedopaque envelopes, with monitoring of the concealment process, may be more feasible.15 Blinding of the outcome measurement for therandomisation outcome is of greater importance for some outcomes thanfor others, but can be implemented with the same methods as developedfor therapeutic trials. Blinding of the clinician or patient to the allocation ismore difficult. When two different strategies are randomised (Figure4.6(b)) one can imagine that the knowledge of the type of test influencessubsequent management decisions, despite a prespecified link. Forexample, an obstetrician might be more reassured with the results ofmagnetic resonance pelvimetry in a breech presentation at term, than withmanual pelvimetry, which will influence subsequent decisions to perform anemergency section.16 One could choose a design that randomises testresults to overcome this problem. Alternatively, one could try to mask theclinician by only presenting standardised test results, without any referenceto the type of test.
The a priori calculation of the necessary sample size for a randomiseddiagnostic study is not straightforward. When discussing Figure 4.5(c) weshowed that the expected difference in outcome between the two teststrategies resulted from the expected difference in the category withdiscordant test results only. In trials in which patients are randomised toone of two test strategies (Figure 4.6(b)) a large group of participants willalso not contribute to the final difference. Let us explain this with anotherrandomised diagnostic trial from the literature, in which ultrasonographywas compared with clinical assessment for the diagnosis of appendicitis.17
The authors report a power of 80% to detect a reduction in the non-therapeutic operation rate from 11% to 2%, by randomising 302 patients.What are the nominator and denominator of these estimated rates?
Figure 4.8 shows the two trial arms. A large group of patients withabnormal results in the ultrasound group, indicating operation, would alsohave been detected at clinical examination. The same argument stands fora subgroup of patients with a normal ultrasound. The sum of these twogroups forms the total with concordant test results. As patients withconcordant test results will receive the same management, their event rateswill be identical except for chance differences.The rate of 11% results from( x�n�o)/151. The rate of 2% results from ( y�n�o)/151. The ratedifference, 9%, results solely from the events in the discordant group. By
DIAGNOSTIC TESTING AND PROGNOSIS
77
Andre_Chap04.qxd 11/6/01 2:57 PM Page 77

assuming a concordance rate of ultrasonography with clinical assessment of80%, one can calculate the postulated rate difference in this discordantgroup: 9%/20% is 45%. This could result from a rate of non-therapeuticoperations of 55% in patients with a positive clinical assessment andotherwise negative ultrasound, and a rate of 10% in patients with a positiveultrasound and otherwise negative clinical examination. (This implies thatthe event rate is 0% in the concordant group, which is not very likely, as theauthors discuss in their introduction that 15–30% of all operations are non-therapeutic.) With some extra calculations we can show that the differenceassumed by the authors implies a discordance rate of at least 80%. It wouldbe very strange to expect such a high discordance rate in advance. Thisexample shows that it is important to incorporate the discordance rate insample size calculations of randomised trials of diagnostic tests.
Conclusions
In this chapter we discuss the evaluation of the prognostic impact oftests. From a patient perspective one could argue that it is not so much thecorrespondence with the “truth” that should be the focus of a diagnostictest evaluation, but the likelihood that such a test detects events of clinicalinterest, and the possibilities that exist to let test results guide subsequentclinical decision making to reduce the likelihood of such events occurring.The latter can be evaluated by evaluating a test–treatment combination ina clinical trial, for which several possible designs are discussed.
The examples of published randomised diagnostic trials in this chaptershow that it is feasible to perform such a thorough evaluation of a
THE EVIDENCE BASE OF CLINICAL DIAGNOSIS
78
% discordant
% concordant
Abnormal in ultrasoundand control group
Normal in ultrasoundand control group
Ultrasound groupn =151
Control groupn =151
x events y events
n events n events
o events o events
Figure 4.8 Sample size calculation.
Andre_Chap04.qxd 11/6/01 2:57 PM Page 78
DIAGNOSTIC TESTING AND PROGNOSIS
79
diagnostic test. Several additional examples can be found in the literature,such as trials of mediastinoscopy, cardiotocography and MRI,11,18,19 and ofa number of screening tests.20–22 These date back as far as 1975.23
In most of these trials the point of randomisation coincided with theclinical decision as to whether or not to perform the tests. This makes itimpossible to differentiate between the treatment effect and the prognosticvalue of the test. Power analyses of any diagnostic trial should incorporatean estimation of the discordance rate, as differences in outcome can onlybe expected for patients who have discordant test results. In this chapter wehave shown that a design incorporating randomisation of discordant testresults is more efficient, provides more information, and is less prone tobias. Most importantly, all of these designs require a prespecifiedtest–treatment link. This is to allow for the application of the study resultsin other settings, and to guard the internal validity of the study.
References
1 Rothwell PM, Pendlebury ST,Wardlaw J,Warlow CP. Critical appraisal of the design andreporting of studies of imaging and measurement of carotid stenosis. Stroke2000;31:1444–50.
2 Lewis RF, Abrahamowicz M, Cote R, Battista RN. Predictive power of duplexultrasonography in asymptomatic carotid disease. Ann Intern Med 1997;127:13–20.
3 Adams HP Jr, Bendixen BH, Leira E, et al. Antithrombotic treatment of ischemicstroke among patients with occlusion or severe stenosis of the internal carotid artery: areport of the Trial of Org 10172 in Acute Stroke Treatment (TOAST). Neurology1999;53:122–5.
4 Anonymous. Low molecular weight heparinoid, ORG 10172 (danaparoid), and outcomeafter acute ischemic stroke: a randomized controlled trial. The Publications Committeefor the Trial of ORG 10172 in Acute Stroke Treatment (TOAST) Investigators [seecomments]. JAMA 1998;279:1265–72.
5 Cote R, Battista RN, Abrahamowicz M, Langlois Y, Bourque F, Mackey A. Lack of effectof aspirin in asymptomatic patients with carotid bruits and substantial carotid narrowing.The Asymptomatic Cervical Bruit Study Group. Ann Intern Med 1995;123:649–55.
6 Kraemer HC. Evaluating medical tests: objective and quantitative guidelines. Newbury Park:SAGE Publications, 1992:295.
7 Nienhuis SJ, Vles JS, Gerver WJ, Hoogland HJ. Doppler ultrasonography in suspectedintrauterine growth retardation: a randomized clinical trial. Ultrasound Obstet Gynecol1997;9:6–13.
8 Simel DL, Samsa GP, Matchar DB. Likelihood ratios with confidence: sample sizeestimation for diagnostic test studies. J Clin Epidemiol 1991;44:763–70.
9 Aviv JE. Prospective, randomized outcome study of endoscopy versus modified bariumswallow in patients with dysphagia. Laryngoscope 2000;110:563–74.
10 Lassen AT, Pedersen FM, Bytzer P, de Muckadell OBS. Helicobacter pylori test-and-eradicate versus prompt endoscopy for management of dyspeptic patients: a randomisedtrial. Lancet 2000;356:455–60.
11 Anonymous. Investigation for mediastinal disease in patients with apparently operablelung cancer. Canadian Lung Oncology Group. Ann Thorac Surg 1995;60:1382–9.
12 Bossuyt P, Lijmer J, Mol B. Randomised comparisons of medical tests: sometimes invalid,not always efficient. Lancet 2000;356:1844–7.
13 Elia S, Cecere C, Giampaglia F, Ferrante G. Mediastinoscopy vs. anterior mediastinotomyin the diagnosis of mediastinal lymphoma: a randomized trial. Eur J Cardiothorac Surg1992;6:361–5.
Andre_Chap04.qxd 11/6/01 2:57 PM Page 79

THE EVIDENCE BASE OF CLINICAL DIAGNOSIS
80
14 Schulz KF, Chalmers I, Hayes RJ, Altman DG. Empirical evidence of bias. Dimensions ofmethodological quality associated with estimates of treatment effects in controlled trials.JAMA 1995;273:408–12.
15 Swingler GH, Zwarenstein M. An effectiveness trial of a diagnostic test in a busyoutpatients department in a developing country: issues around allocation concealmentand envelope randomization. J Clin Epidemiol 2000;53:702–6.
16 van der Post JA, Maathuis JB. Magnetic-resonance pelvimetry in breech presentation[letter; comment]. Lancet 1998;351:913.
17 Douglas C, Macpherson N, Davidson P, Gani J. Randomised controlled trial ofultrasonography in diagnosis of acute appendicitis, incorporating the Alvarado score. BMJ2000;321:1–7.
18 Strachan BK, van Wijngaarden WJ, Sahota D, Chang A, James DK. Cardiotocographyonly versus cardiotocography plus PR-interval analysis in intrapartum surveillance: arandomised, multicentre trial. FECG Study Group. Lancet 2000;355:456–9.
19 Dixon AK, Wheeler TK, Lomas DJ, Mackenzie R. Computed tomography or magneticresonance imaging for axillary symptoms following treatment of breast carcinoma? Arandomized trial. Clin Radiol 1993;48:371–6.
20 Kronborg O, Fenger C, Olsen J, Jorgensen OD, Sondergaard O. Randomised study ofscreening for colorectal cancer with faecal-occult-blood test. Lancet 1996;348:1467–71.
21 Anonymous. Controlled trial of universal neonatal screening for early identification ofpermanent childhood hearing impairment.Wessex Universal Neonatal Hearing ScreeningTrial Group. Lancet 1998;352:1957–64.
22 Miller AB,To T, Baines CJ,Wall C. Canadian National Breast Screening Study-2: 13-YearResults of a Randomized Trial in Women Aged 50–59 Years. J Natl Cancer Inst2000;92:1490–9.
23 Morris DW, Levine GM, Soloway RD, Miller WT, Marin GA. Prospective, randomizedstudy of diagnosis and outcome in acute upper-gastrointestinal bleeding: endoscopyversus conventional radiography. Am J Dig Dis 1975;20:1103–9.
Andre_Chap04.qxd 11/6/01 2:57 PM Page 80
81
5 The diagnosticbefore–after study to assess clinical impactJ ANDRÉ KNOTTNERUS, GEERT-JAN DINANT,ONNO P VAN SCHAYCK
Summary box
● The before–after design is more appropriate for evaluating theclinical impact of additional testing than to compare the impact ofdifferent diagnostic options.
● Demonstrating an effect of diagnostic testing on the patient’s healthoutcome is more difficult than showing a change in the doctor’sassessment and management plan.
● Whether and what specific blinding procedures have to be applieddepends on the study objective.
● To optimise the assessment of the independent effect of the testinformation, performance of the test or disclosure of the test resultcan be randomised.This would change the before–after design in arandomised trial.
● The therapeutic consequences of the various test results can bestandardised in the research protocol, provided that such therapyoptions are clinically rational and have a well documented evidencebase. The study will then evaluate the impact of the test resultconnected with a defined therapeutic consequence, rather than thetest result per se.
● If evaluating the doctor’s assessment is the primary study objective,the assessment should preferably take place immediately after
Andre_Chap05.qxd 11/6/01 2:59 PM Page 81

THE EVIDENCE BASE OF CLINICAL DIAGNOSIS
82
Introduction
Apart from facilitating an accurate diagnosis, a test is aimed at causingchange: starting from a baseline situation, applying the test and interpretingits outcome should result in a new situation. In fact, the most importantjustification for diagnostic testing is that it is expected to make a difference,by influencing clinical management and ultimately benefiting the patient’swellbeing. Accordingly, performing a test can be seen as an interventionthat should be effective in bringing about a clinically relevant change.
In studying the clinical effect of a test result, the randomised controlledtrial (RCT) is the strongest methodological design option,1 and is dealtwith in Chapter 4. However, although it is the paradigm for effectivenessresearch, an RCT cannot always be achieved.This is, for example, the caseif randomly withholding a test or test result from patients or doctors isconsidered medically or ethically unacceptable. Difficulties may also ariseif the diagnostic test is integrated in the general skills of the clinician, sothat performing it cannot be randomly switched on and off in his or her head, nor simply assigned to a different doctor. This is especiallyproblematic if at the same time patients cannot be randomly assigned to adoctor. This situation may, for instance, occur in studying the impact ofdiagnostic reasoning skills in general practice. Also, when an RCT iscomplex and expensive, or will last too long to still be relevant when theresults become available, one may wish to consider a more feasiblealternative.
One alternative that may be considered is the diagnostic before–afterstudy.2 This approach seems attractive, as it fits naturally within the clinicalprocess and is easier to perform than the randomised trial. Therefore, thischapter will discuss the potentials, limitations, and pitfalls of this designoption.
disclosure of the test result, with a minimal risk of interferingfactors influencing the doctor’s judgement.
● Because a rather long follow up is mostly needed to estimate theimpact of testing on the clinical course, the risk of interferinginfluences is substantial.
● Given that before–after studies can be carried out relatively fast,largely embedded in daily care, while RCTs are more complex orexpensive, a well designed before–after study may sometimes beused to explore whether and how a diagnostic RCT should beperformed. If an RCT is impossible or infeasible, or ethicallyunacceptable, a well designed before–after study can be the mostsuitable alternative.
Andre_Chap05.qxd 11/6/01 2:59 PM Page 82

The research question
Example
In a study to assess the diagnostic impact of erythrocyte sedimentationrate (ESR) in general practice, 305 consecutive patients with aspecificsymptoms for whom general practitioners (GPs) considered ESR testingnecessary were included.3 Before testing, the GPs were asked to specify themost likely diagnosis in each patient, and to assess whether or not thisdiagnosis was severe in the sense of malignant or inflammatory disease forwhich further management would be urgently needed. Subsequently, theESR was independently performed and the result was made available to theGPs, who then again specified their (revised) diagnostic assessment. After3 months, based on all the available medical information, a clinicalassessment was carried out for each patient by an independent clinician notknowing about the pre- and post-test assessments for each patient, in orderto establish a final diagnosis (reference standard).4
In Figure 5.1 the percentage of patients most likely having severepathology according to the GP is presented before and after disclosure ofthe ESR result. There seems to be no relevant pre–post-test change.However, looking at Table 5.1, it is clear that there was a change in 32patients: 17 from severe pathology to “other”, and 15 from “other” tosevere pathology.
THE DIAGNOSTIC BEFORE–AFTER STUDY
83
Pretest diagnosticinterpretation:
53/305 = 17.4%Severe pathology
Post-test diagnosticinterpretation:
51/305 = 16.7%Severe pathology
ESR result
Figure 5.1 Pre- and post-test diagnostic assessment in studying the impact of ESR.
Table 5.1 Relation between pre- and post-test diagnostic assessments in studyingthe impact of ESR.
Post-test interpretation
Pretest interpretation Severe pathology Other Total
Severe pathology 36 17 53Other 15 237 252
Total 51 254 305
Andre_Chap05.qxd 11/6/01 2:59 PM Page 83

THE EVIDENCE BASE OF CLINICAL DIAGNOSIS
84
Whether these changes had indeed resulted in a more accuratediagnostic assessment could be determined after correlating the GPs’ pre-and post-test findings with the reference standard procedure. It appearedthat the pretest accuracy of the GPs’ assessment was 69% (that is, 69% ofcases were correctly classified), whereas the post-test accuracy was 76%,implying an increase of 7%.
Furthermore, of the 32 patients with a diagnostic classification changedby the GP, nine with a positive (severe) post-test diagnosis proved to be“false positives”, and two with a negative (other) post-test diagnosis were“false negatives”.
The test characteristics of the ESR (cut-off value � 27 mm/1h) could bealso determined in relation to the reference diagnosis, yielding a sensitivityof 53%, a specificity of 94%, a positive predictive value of 46%, and anegative predictive value of 91%.
The general model
The basic question in the diagnostic before–after study is whether applyinga certain diagnostic test favourably influences the doctor’s (a) diagnostic or (b) prognostic assessment of a presented clinical problem;(c) the further management; and, ultimately, (d) the patient’s health. Itessentially comprises the baseline (pretest) situation, a determinant (thetest), and the outcome (post-test situation) (Figure 5.2).
Pretest baselineDoctor’s assessmentof clinical problem:* Diagnostic or prognostic interpretation* Clinical managementPatient :* Health status
Post-test outcomeDoctor’s assessmentof clinical problem:* Diagnostic or prognostic interpretation* Clinical managementPatient :* Health status
Determinants* Test result* Effect modifiers* Confounding variables
Figure 5.2 General representation of the research question in a diagnosticbefore–after study.
Andre_Chap05.qxd 11/6/01 2:59 PM Page 84

The point of departure can be characterised by a clinical problem, withthe doctor’s assessment regarding the possible diagnosis, prognosis, or thepreferred management option, and the patient’s health status at baseline,without knowing the information from the test to be evaluated. Thepatient’s health status at baseline is important, not only as a starting pointfor possible outcome assessment but also as a reference for generalising thestudy results to comparable patient groups.
The determinant of primary interest is performing the diagnostic testand disclosure of its result, which is in fact the intended intervention.Furthermore, because diagnostic classification is essentially involved withdistinguishing clinically relevant subgroups, it is often useful to considerthe influence of effect modifying variables, such as the doctor’s skills andexperience, the patient’s age and gender, and pre-existing comorbidity. Inaddition, the effect of possible confounding variables should be taken intoaccount. For example, extraneous factors such as reading publications orattending professional meetings may affect the clinician’s assessment. Butalso the time needed to do the test and obtain its result may be important,as it may be used to think and study on the clinical problem, and this willindependently influence the assessment. Moreover, the patient’s healthstatus may have changed as a result of the clinical course of the illness, byinterfering comorbidity and related interventions, by environmentalfactors, or by visiting other therapists. The patient’s symptom perceptionmay have been influenced by information from family, friends, or themedia, or by consulting the internet. Also, the patient may claim to havebenefited from a diagnostic intervention because he does not wish todisappoint the doctor.
The key challenge for the investigator is now to evaluate the extent towhich applying the diagnostic test has independently changed the doctor’sdiagnostic or prognostic assessment of the presented clinical problem, thepreferred management option, or the patient’s health status.The latter willgenerally be influenced indirectly, via clinical management, but cansometimes also be directly affected, for example because the patient feelshimself being taken more seriously by the testing per se. Moreover, patientself testing, which is nowadays becoming more common, can influencepatient self management.
At this point, two important limitations of the before–after design mustbe emphasised. First, the design is more appropriate to evaluate the impactof “add on” technologies2 (that is, the effect of additional testing) than tocompare the impact of different diagnostic technologies or strategies. Forthe latter purpose one could, in principle, apply both studied technologies,for example colonoscopy and double contrast barium enema, inrandomised order, to all included patients, and then compare the impact ofdisclosing the test results, again in random order, on the clinicians’assessment. Another example would be to subject patients to both CT and
THE DIAGNOSTIC BEFORE–AFTER STUDY
85
Andre_Chap05.qxd 11/6/01 2:59 PM Page 85

NMR head scanning to study their influence on clinicians’ managementplans in those with suspected intracranial pathology. However, suchcomparisons are unrealistic, as the two tests would never be appliedsimultaneously in practice. Moreover, such studies are very burdensome forpatients, not to say ethically unacceptable, and would make it virtuallyimpossible to study the complication rate of each procedure separately.5
When the various options are mutually exclusive, for example when comparingdiagnostic laparotomy with endoscopy in assessing intra-abdominalpathology as to their adverse effects, a before–after design is clearlyinappropriate. In such situations, a randomised controlled trial is by far thepreferred option. Only when the compared tests can be easily carried outtogether without any problem for the patient, can they be appliedsimultaneously.This can be done, for instance, when comparing the impactof different blood tests using the same blood sample. However, when thedisclosure of the results of the compared tests to the clinicians is thenrandomised, which would be a good idea, we are in fact in the RCT option.
Second, demonstrating an effect of diagnostic testing on the patient’shealth outcome is much more difficult than showing a change in thedoctor’s assessment and management plan. In fact, this is often impossible,as it usually takes quite some time to observe a health effect that might beascribed to performance of the test. Controlling for the influence of themany possible confounders over time generally requires a concurrent controlgroup of similar patients not receiving the test. However, a diagnosticbefore–after study could be convincing in case of: (1) studying a clinicalproblem with a highly predictable outcome in the absence of testing (suchas unavoidable death in the case of imminent rupture of an aneurysm of theaorta), (2) while adding specific diagnostic information (an appropriateimaging technique) leading to a specific therapeutic decision (whether andhow to operate) (3), which is aimed at a clearly defined short term effect(prevention of a rupture and survival), possibly followed by less specificlong term effects (rehabilitation). However, such opportunities areextraordinary. Besides, although on the one hand some clinicians wouldconsider such clinical situations to be self evident and not needingevaluation by research, others may still see room for dispute as to whatextent clinical events are predictable or unavoidable.
Working out the study
Pretest baseline
The study protocol follows the elements of the research question.At baseline, the clinical problem and the study question are defined.The
clinical problem could be aspecific symptoms as presented in primary care,with the question being whether the ESR would contribute to the doctor’s
THE EVIDENCE BASE OF CLINICAL DIAGNOSIS
86
Andre_Chap05.qxd 11/6/01 2:59 PM Page 86

THE DIAGNOSTIC BEFORE–AFTER STUDY
87
diagnostic assessment,3,4 or sciatica, in order to study whether radiographywould affect therapeutic decision making.
The health status of each patient to be included is systematicallydocumented, using standardised measurement instruments for thepresented symptoms, patient history, physical examination, and furtherrelevant clinical data.
Overseeing all available patient data, the doctor makes a first clinicalassessment of the probability of certain diagnoses or diagnostic categories.In primary care, for example, the probability of a severe organic malignantor inflammatory, disorder can be assessed. This can be done for onespecified diagnostic category, for a list of specified diagnoses, or in an openapproach, just asking the differential diagnosis the doctor has in mind, with the estimated probability of each specific diagnostichypothesis being considered.
Furthermore, the doctor is asked to describe the preferred diagnostic ortherapeutic management plan, which can be done, again, according to aprepared list of items or as an open question.
At baseline, possibly relevant effect modifying variables should beconsidered. Often the general clinical experience of the clinicians and theirspecific expertise regarding the test under study are important. Furthermore,variables characterising important clinical subgroups can be assessed, andpotential confounding factors have to be measured in order to be able totake these into account in the data analysis. Recording of covariables issometimes difficult, for example for extraneous variables such as mediaexposure. Moreover, it cannot be excluded that important or even decisivefactors are not identified or even foreseen.
Diagnostic testing
In performing the diagnostic test or procedure under study and revealingits outcome after the baseline assessment, different options can beconsidered depending on the specific study objective.
● If one wishes to assess the specific effect of the test information on theoutcome, in addition to the pretest clinical information, the test resultshould be determined independently from the pretest information. Thisis especially relevant for test procedures with a subjective element in theinterpretation of the result, such as patient interviews, auscultation,imaging, x ray films, and pathological specimens. Accordingly, those whointerpret the test should not be aware of the pretest information.However, when patient history itself is the test to be evaluated, this willgenerally not be feasible.
● When it is important to limit possible confounding effects of apreoccupation of participating doctors with the expected relevance of a
Andre_Chap05.qxd 11/6/01 2:59 PM Page 87
THE EVIDENCE BASE OF CLINICAL DIAGNOSIS
88
certain test, the investigator may wish to obscure the performing of theevaluated test itself. This can theoretically be achieved by not telling thedoctor in advance about what specifically is being evaluated, and bydisclosing the test result while also providing information on a numberof other items irrelevant for the studied comparison. However, suchmasking is difficult and often not feasible, or may be so much in conflictwith clinical reality that the findings will not be relevant for practice.Finally, intentional obscuring of the specific research question will needthe explicit approval of the medical ethics review board.
● If the investigator wishes to assess the diagnostic process as it is usuallyembedded in clinical practice, the interpretation of the test result can becarried out as usual without specific blinding procedures. However,particularly for tests with subjective elements in reading or interpretationof the results, this will imply that the independent contribution of thetest cannot be reliably determined.
● To optimise the assessment of the independent effect of the testinformation, performance of the test or, even more precisely, disclosureof the test result, can be randomised so that half of the participantswould and half would not get the result. In fact, this would change the before–after design into a randomised trial, which is discussed inChapter 4.
Because a test is almost never perfect, applying it may produce mis-classification. Even when most patients are more accurately classified if theclinician uses the test information, some patients with a correct pretestdiagnosis may be incorrectly classified after testing, for example because ofa false positive or false negative result. As this may have important negativeconsequences for those patients – for example when a false positivemammography would lead to unnecessary surgery – it is recommended toinclude evaluation of the actual disease status in the context of thebefore–after study. This also enables the investigator to determine testaccuracy by relating the test result cross-sectionally to the disease status,established according to an acceptable reference standard.5
Post-test outcome
The measurement of the final post-test outcome after disclosure of the test result (diagnostic assessment, preferred management plan, and/orpatient health status) should follow the same procedure as the baselinemeasurement. In doing so, both the doctor and the patient will generallyremember the baseline status, implying that the post-test assessment of thedoctor’s differential diagnosis and management options cannot be blindedfor the pretest assessment. This has probably been the case in the exampleof the diagnostic impact of the ESR measurement.
Andre_Chap05.qxd 11/6/01 2:59 PM Page 88

THE DIAGNOSTIC BEFORE–AFTER STUDY
89
When one is evaluating the impact of adding the test information to already known clinical information at baseline in order to make a comprehensive assessment, lack of blinding is not always a principal problem.In fact, it is clinically natural and supported by Bayes’s theorem to study theimpact of the test result in the light of the prior probability. However, whenclinicians are more or less “anchored” to their initial diagnostic assessment,they are biased in that they do not sufficiently respond to the test informationin revising their diagnostic assessment. But even this can sometimes beacceptable for an investigator who deliberately aims to assess the impact of thetest in clinical reality, where such anchoring is a common phenomenon,6,7 andto study the influence of the test result in terms of confirming or refuting thisanchoring. As doctors will vary in “anchoring”, such evaluations need toinclude sufficient participating clinicians.
When the post-test outcome is patient status, objective assessment independent of both pretest status and the doctor’s interpretations is abasic requirement.
If one evaluates a test which is already firmly accepted among themedical profession, the response of clinicians is in fact “programmed” bymedical education, continuing medical education, or clinical guidelines. Insuch cases the investigator is studying the adherence to agreed guidelinesrather than the independent clinical impact of the test result. On the otherhand, the clinical impact of testing will not be easily detected if there is noclear relationship between revision of the diagnostic classification based onthe test information, and the revision of the management plan.2 Thisrelation can indeed be unclear when doctors ignore the test information, orwhen the same test result may lead to a variety of management decisions,including doing nothing. The latter can, for example, be the case whenlaboratory tests are carried out in asymptomatic patients. As a remedy, thetherapeutic consequences of the various test results can be standardised inthe research protocol, provided that such therapy options are clinicallyrational and have a well documented evidence base. Accordingly, the studywill then evaluate the impact of the test result connected with a definedtherapeutic consequence, rather than the test result per se. On the otherhand, when there is a lack of clarity beforehand as to the potentialmanagement consequences of performing a test, we should ask ourselveswhether such testing should be evaluated or used at all.
The time factor
The interval between the pre- and post-test assessments should becarefully chosen. Generally, the interassessment period should be short ifevaluating the doctor’s assessment is the primary study objective: theassessment should preferably take place immediately after disclosure of thetest result, with a minimal risk of interfering factors influencing the doctor’s
Andre_Chap05.qxd 11/6/01 2:59 PM Page 89

judgement. Sometimes, however, this may take some days (bacterialculture) or longer (cervical smear). A rather long period until the final post-test assessment is mostly needed if estimating the impact of testing on theclinical course is the objective, although this longer period will beassociated with an increased risk of interfering interventions and influencesduring follow up. A combined approach can be chosen, with a pretestmeasurement, a post-test measurement of the clinician’s assessment, and alonger follow up period for measuring patient health outcome, respectively(Figure 5.3). In the analysis, then, the relation between the test’s impact onthe clinician’s assessment and patient outcome could be studied ifextraneous factors and changes in the clinical condition can be sufficientlycontrolled for. However, as outlined in the section on the researchquestion, this is mostly impossible in the context of the before–after design.For the purpose of studying the test’s impact on patient health, therandomised controlled trial is a more valid option.
Selection of the study subjects
Regarding the selection of the study subjects, similar methodologicalcriteria to those discussed in Chapter 3 should be met: the study patientpopulation should be representative for the “indicated”, “candidate” or“intended” patient population, or target population, with a well definedclinical problem, clinically similar to the group of patients in whom the test would be applied in practice. Accordingly, the healthcare setting fromwhere the patients come, the inclusion criteria, and the procedure forpatient recruitment must be specified. Regarding the selection ofparticipating doctors, the study objective is decisive. If the aim is toevaluate what the test adds to current practice, the pre- and post-testassessments should be made by clinicians representing usual clinicalstandards. However, if one wishes to ensure that the test’s contribution is
THE EVIDENCE BASE OF CLINICAL DIAGNOSIS
90
Pretest baselineDoctor’s assessmentof clinical problem:* Diagnostic or prognostic interpretation* Clinical managementPatient :* Health status
Outcome 1Doctor’s assessmentof clinical problem:* Diagnostic or prognostic interpretation* Clinical management
Outcome 2
Patient :* Health status
test
Figure 5.3 Separate post-test measurements of doctor’s assessment (immediately)and patient health outcome (later).
Andre_Chap05.qxd 11/6/01 2:59 PM Page 90

analysed using a maximum of available expertise, top experts in the specificclinical field must be recruited.
Generally, in clinical studies a prospectively included consecutive seriesof patients with a clearly defined clinical presentation will be the mostappropriate option with the lowest selection bias. If one were toretrospectively select patients who had already had the test in the past, onewould generally not be able to be certain whether those patients really hada similar clinical problem, and whether all candidate patients in the sourcepopulation would have non-selectively entered the study population. Apartfrom this, a valid before–after comparison of the doctors’ assessments (withthe doctors first not knowing and subsequently knowing the test result) isnot possible afterwards, as a change in diagnostic assessment and theplanning of management cannot be reliably reconstructed post hoc.
Sample size and analysis
Sample size requirements for the before–after study design need to bemet according to general conventions. Point of departure can be the size ofthe before–after difference in estimated disease probability or othereffectiveness parameters, for example, the decrease in the rate of(diagnostic) referrals, which would be sufficiently relevant to be detected.If the basic phenomenon to be studied is the clinical assessment of doctors,the latter are the units of analysis. When the consequences for the patientsare considered the main outcome, their number is of specific interest.
The data analysis of the basic before–after comparison can follow theprinciples of the analysis of paired data. In view of the relevance of evaluatingdifferences of test impact in various subgroups of patients, and given theobservational nature of the before–after study, studying the effect of effect modifying variables and adjusting for confounding factors usingmultivariable analytical methods, may add to the value of the study. Whenthe clinician and patient “levels” are to be considered simultaneously,multilevel analysis can be used.
As it is often difficult to reach sufficient statistical power in studies withdoctors as the units of analysis, and because of the expected heterogeneityin observational clinical studies, before–after studies are more appropriateto confirm or exclude a substantial clinical impact than to find subtledifferences.
Modified approaches
Given the potential sources of uncontrollable bias in all phases of the study, investigators may choose to use “paper” or videotaped patients orclinical vignettes, interactive computer simulated cases, or “standardisedpatients” especially trained to simulate a specific role consistently over time.
THE DIAGNOSTIC BEFORE–AFTER STUDY
91
Andre_Chap05.qxd 11/6/01 2:59 PM Page 91

Standardised (simulated) patients can consult the doctor even withoutbeing recognised as “non-real”.8 Furthermore, the pre- and post-test assessments can also be done by an independent expert panel in order toensure that the evaluation of the clinical impact is based on best availableclinical knowledge.The limitations of such approaches are that they do notalways sufficiently reflect clinical reality, are less suitable (vignettes) for aninteractive diagnostic work up, cannot be used to evaluate more invasivediagnostics (standardised patients), and are not appropriate for additionallyassessing diagnostic accuracy.
A before–after comparison in a group of doctors applying the test to anindicated patient population can be extended with a concurrent observationalcontrol group of doctors assessing indicated patients, without receiving thetest information (quasi experimental comparison). However, given thesubstantial risk of clinical and prognostic incomparability of theparticipating doctors and patients in the parallel groups compared, and ofpossibly incorrectable extraneous influences, this will often not strengthenthe design substantially. If a controlled design is considered, a randomisedtrial is to be preferred (Chapter 4).
Concluding remarks
As Guyatt et al.2 have brilliantly pointed out, in considering abefore–after design to study the clinical impact of diagnostic testing, twotypes of methodological problem must be acknowledged. First, we have todeal with problems for which, in principle, reasonable solutions can befound in order to optimise the study design. In this chapter, some of these“challenges” have been discussed. Examples are appropriate specificationsof the clinical problem to be studied and the candidate patient population,and the concomitant documentation of test accuracy. Second, thebefore–after design has inherent limitations that cannot be avoided norsolved. If these are not acceptable, another design should be chosen.The most important of these limitations are: (1) the before–after design is especially appropriate for evaluating additional testing, rather thancomparing two essentially different (mutually exclusive) diagnosticstrategies; (2) the reported pretest management options may be differentfrom the real strategy the clinicians would have followed if the test had notbeen available, or if they would not have known that there is a second (post-test) chance for assessment; (3) the pre- and post-test assessments by thesame clinicians for the same patients are generally not independent; and (4)an unbiased evaluation of the impact of testing on the patients’ healthstatus can mostly not be achieved.
Acknowledging the large number of difficulties and pitfalls of thebefore–after design, as outlined in previous sections, we conclude that thedesign can have a place especially if the pre–post-test assessment interval
THE EVIDENCE BASE OF CLINICAL DIAGNOSIS
92
Andre_Chap05.qxd 11/6/01 2:59 PM Page 92

THE DIAGNOSTIC BEFORE–AFTER STUDY
93
can be relatively short (evaluation of the test’s impact on the doctor’sassessment), and if the relation between the diagnostic assessment, thesubsequent therapeutic decision making, and therapeutic effectiveness iswell understood. If impact on patient outcome is studied, it is importantthat the clinical course of the studied problem in the absence of testing iswell known and highly predictable.
Given the various limitations for studying the clinical impact ofdiagnostic tests, the randomised controlled trial design, if feasible, will inmost cases be superior. However, given that before–after studies can becarried out relatively fast, largely embedded in daily care, whereas RCTsare more complex or expensive, a well designed before–after study may beuseful to explore whether a diagnostic RCT could be worthwhile, or how itshould be performed. In addition, if an RCT is impossible or infeasible, orethically unacceptable, a before–after study may be the most suitablealternative. Other options, which could provide a more uniform clinicalpresentation and a better control of interfering variables, are before–afterstudies using written patient vignettes, interactive computer simulations, orstandardised patients. The specific potentials and limitations (for examplerepresenting less clinical reality) of these alternative approaches will thenhave to be taken into account.
References
1 Alperovitch A. Controlled assessment of diagnostic techniques: methodological problems.Effective Health Care 1983;1:187–90.
2 Guyatt GH, Tugwell PX, Feeney DH, Drummond MF, Haynes RB. The role ofbefore–after studies in the evaluation of therapeutic impact of diagnostic technology.J Chronic Dis 1986;39:295–304.
3 Dinant GJ, Knottnerus JA, van Wersch JWJ. Diagnostic impact of the erythrocytesedimentation rate in general practice: a before–after analysis. Fam Pract 1992;9:28–31.
4 Dinant GJ. Diagnostic value of the erythrocyte sedimentation rate in general practice. Thesis.Maastricht: University of Maastricht, 1991.
5 Guyatt G, Drummond M. Guideline for the clinical and economic assessment of healthtechnologies: the case of magnetic resonance. Intl J Health Tech Assess Health Care 1985;1:551–66.
6 Tversky A, Kahneman D. Judgment under uncertainty: heuristics and biases. Science 1974;185:1124–31.
7 Elstein AS, Shulman LS, Sprafka SA. Medical problem solving: an analysis of clinicalreasoning. Cambridge, MA: Harvard University Press, 1978.
8 Rethans JJ, Sturmans F, Drop R, van der Vleuten C. Assessment of the performance ofgeneral practitioners by the use of standardized (simulated) patients. Br J Gen Pract 1991;41:97–9.
Andre_Chap05.qxd 11/6/01 2:59 PM Page 93

Andre_Chap05.qxd 11/6/01 2:59 PM Page 94

95
6 Designing studies toensure that estimates oftest accuracy will travelLES M IRWIG, PATRICK M BOSSUYT,PAUL P GLASZIOU, CONSTANTINE GATSONIS,JEROEN G LIJMER
Summary box
● There may be genuine differences between test accuracies indifferent settings, such as primary care or hospital, in different typesof hospital, or between countries.
● Deciding whether estimates of test accuracy are transferable to othersettings depends on an understanding of the possible reasons forvariability in test discrimination and calibration across settings.
● The transferability of measures of test performance from one settingto another depends on which indicator of test performance is to beused.
● Real variation in the performance of diagnostic tests (such asdifferent test types, or a different spectrum of disease) needs to bedistinguished from artefactual variation resulting from study designfeatures. These features include the target condition and referencestandard used, the population and the clinical question studied, theevaluated comparison, and the way the index test was performed,calibrated, and interpreted.
● In preparing studies on diagnostic accuracy, a key question is how todesign studies that carry more information about the transferabilityof results.
Andre_Chap06.qxd 11/6/01 3:00 PM Page 95

THE EVIDENCE BASE OF CLINICAL DIAGNOSIS
96
Introduction
Measures of test accuracy are often thought of as fixed characteristics thatcan be determined by research and then applied in practice.Yet even whentests are evaluated in a study with adequate quality – including features suchas consecutive patients, a good reference standard, and independent,blinded assessments of tests and the reference standard1 – diagnostic testperformance in one setting may vary from the results reported elsewhere.This has been explored extensively for coronary artery disease,2–5 but hasalso been shown for a variety of other conditions.6–8 This variability is notonly due to chance.There may be genuine differences between test accuracyin different settings, such as primary care or hospital, different types ofhospital, or the same type of hospital in different countries. As aconsequence, the findings from a study may not be applicable to the specificdecision problem for which the reader has turned to the literature.
We suggest that deciding whether the estimates of test accuracy fromstudies are transferable to other settings depends on an understanding ofthe possible reasons for variability in test discrimination and calibrationacross settings. Variability may be due to artefactual differences (forexample different design features of studies in different settings) or truedifferences (such as different test types, or a different spectrum of disease).To decide on the transferability of test results, we are concerned with truedifferences, after artefactual differences have been addressed.9–11
This chapter is divided into two main sections. The first is concernedwith the reasons for true variability in accuracy; it explores conceptual
● In order to ensure that estimates of diagnostic accuracy will travel,before starting to design a study the following questions must beanswered:– How are the target condition and reference standard defined?– Is the objective to estimate global test performance or to estimate
probability of disease in individuals?– What is the population and clinical problem?– Is the test being considered as a replacement or incremental test?– To what extent do you want to study the reasons for variability
of the results within your population?– To what extent do you want to study the transferability of the
results to other settings?● Designing studies with heterogeneous study populations allows
exploration of the transferability of diagnostic performance indifferent settings. This will require larger studies than havegenerally been carried out in the past for diagnostic tests.
Andre_Chap06.qxd 11/6/01 3:00 PM Page 96

underpinnings. The second section is a pragmatic guide for thoseinterpreting and designing studies of diagnostic tests. It is based on theview that value can be added to studies of diagnostic tests by exploring theextent to which we can characterise the reasons for variability in diagnosticperformance between patients in different settings, and examining howmuch variability remains unexplained.
1. Reasons for true variability in test accuracy:conceptual underpinnings
Measures of diagnostic test performance:discrimination and calibration
There are many measures of test accuracy. Broadly speaking, we canthink of them as falling into one of the following categories.
1 Global measures of test accuracy assess only discriminatorypower. These measures assess the ability of the test to discriminatebetween diseased and non-diseased individuals. Common examples are thearea under the receiver operating characteristic curve, and the odds ratio,sometimes also referred to as the diagnostic odds ratio. They may besufficient for some broad health policy decisions, for example whether anew test is in general better than an existing test for that condition.
2 Measures of test performance to estimate the probability ofdisease in individuals require discrimination and calibration. Thesemeasures are used to estimate probabilities of the target condition inindividuals who have a particular test result. An example is the predictivevalue: the proportion of people with a particular test result who have thedisease of interest. To be useful for clinical practice, these estimates shouldbe accompanied by other relevant information. For example, fracture ratesin people with a particular result of a test for osteoporosis differ betweenpeople depending on their age, sex, and other characteristics. It is clumsyand difficult to estimate disease rates for all categories of patient who mayhave different prior probabilities. Therefore, the estimation is often doneindirectly using Bayes’ theorem, based on the patient-specific priorprobability and some expression of the conditional distributions of testresults: the distribution of test results in subjects with and without the targetcondition. Examples are the sensitivity and specificity of the test, andlikelihood ratios for test results.These measures of test performance requiremore than the discrimination assessed by the global measures. They requiretests to be calibrated. As an example of the difference between discriminationand calibration, consider two tests with identical odds ratios (and ROCcurves) which therefore have the same discriminatory power. However, onetest may operate at a threshold that gives a sensitivity of 90% and a
DESIGNING STUDIES FOR TRANSFERABILITY
97
Andre_Chap06.qxd 11/6/01 3:00 PM Page 97

THE EVIDENCE BASE OF CLINICAL DIAGNOSIS
98
specificity of 60%, whereas the other operates at a threshold that gives asensitivity of 60% and a specificity of 90%.Therefore, they differ in the waythey are calibrated.
Features that facilitate transferability of test results
The transferability of measures of test performance from one setting toanother depends on which indicator of test performance is to be used.Thepossible assumptions involved in transferability are illustrated in Figure6.1. Table 6.1 indicates the relationship between these assumptions and thetransferability of the different measures of test performance.
The main assumptions in transferring tests across settings are:
1 The definition of disease is constant. Many diseases have ambiguousdefinitions. For example, there is no single reference standard for heartfailure, Alzheimer’s disease or diabetes. Reference standards may differbecause conceptual frameworks differ between investigators, or becauseit is difficult to apply the same framework in a standardised way.
2 The same test is used. Although based on the same principle, tests maydiffer – for example over time, or if made by different manufacturers.
3 The thresholds between categories of test result (for example positive andnegative) are constant. This is possible with a well standardised test thatcan be calibrated across different settings. However, there may be noaccepted means of calibration: for example different observers ofimaging tests may have different thresholds for calling an image“positive”. The effect of different cut points is classically studied by theuse of an ROC curve. In some cases calibration may be improved byusing category specific likelihood ratios, rather than a single cut point.
4 The distribution of test results in the disease group is constant in shape andlocation.This assumption is likely to be violated if the spectrum of diseasechanges: for example, a screening setting is likely to include earlierdisease, for which test results will be closer to a non-diseased group(hence a lower sensitivity).
5 The distribution of test results in the non-disease group is constant in shape andlocation. This assumption is likely to be violated if the spectrum of non-disease changes: for example the secondary care setting involvesadditional causes of false positives due to comorbidity, not seen inprimary care.
6 The ratio of disease to non-disease (pretest probability) is constant. If this werethe case, we could use the post-test probability (“predictive” values)directly. However, this assumption is likely to be frequently violated: forexample, the pretest probability is likely to be lowest in screening andgreatest in referral settings. This likely non-constancy is the reason forusing Bayes’ theorem to “adjust” the post-test probability for the pretestprobability of each different setting.
Andre_Chap06.qxd 11/6/01 3:00 PM Page 98
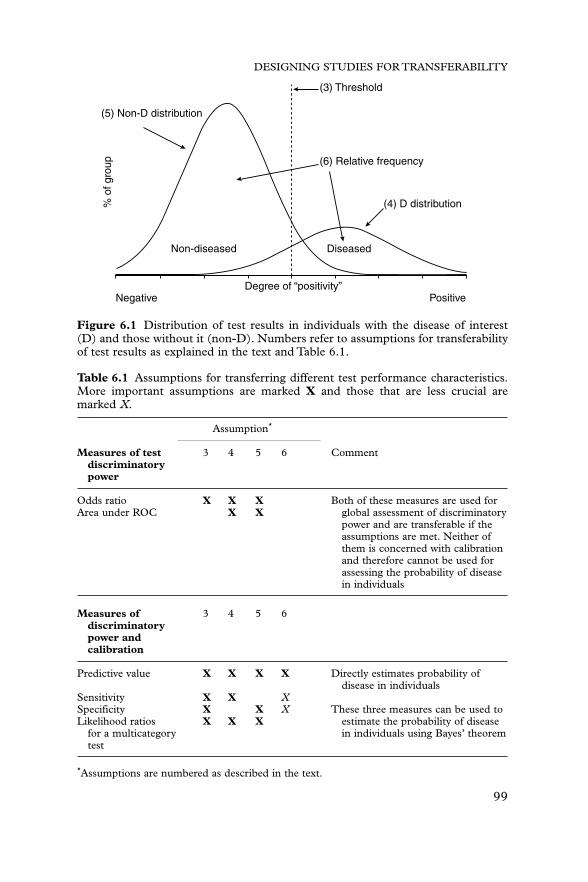
DESIGNING STUDIES FOR TRANSFERABILITY
99
Degree of “positivity”
Non-diseased Diseased
(6) Relative frequency
(3) Threshold
(5) Non-D distribution%
of g
roup
(4) D distribution
Negative Positive
Figure 6.1 Distribution of test results in individuals with the disease of interest(D) and those without it (non-D). Numbers refer to assumptions for transferabilityof test results as explained in the text and Table 6.1.
Table 6.1 Assumptions for transferring different test performance characteristics.More important assumptions are marked X and those that are less crucial aremarked X.
Assumption*
Measures of test 3 4 5 6 Commentdiscriminatorypower
Odds ratio X X X Both of these measures are used forArea under ROC X X global assessment of discriminatory
power and are transferable if theassumptions are met. Neither of them is concerned with calibration and therefore cannot be used for assessing the probability of disease in individuals
Measures of 3 4 5 6discriminatorypower andcalibration
Predictive value X X X X Directly estimates probability ofdisease in individuals
Sensitivity X X XSpecificity X X X These three measures can be used toLikelihood ratios X X X estimate the probability of disease
for a multicategory in individuals using Bayes’ theoremtest
*Assumptions are numbered as described in the text.
Andre_Chap06.qxd 11/6/01 3:00 PM Page 99

All the measures of test performance need the first two assumptions tobe fulfilled. The extent to which the last four assumptions are sufficient isshown in Table 6.1, although they may not be necessary in every instance;occasionally the assumptions may be violated, but because of compensatingdifferences transferability is still reasonable.
Lack of transferability and applicability of measuresof test performance
We need first to distinguish artefactual variation from real variation indiagnostic performance. Artefactual variation arises when studies vary inthe extent to which they incorporate study design features, such as whetherconsecutive patients were included, or whether the reference standard andthe index test were read blind to each other. Once such artefactual sourcesof variation have been ruled out, we may explore the potential sources oftrue variation.12 The issues to consider are similar to those for assessinginterventions. For interventions, we consider patient, intervention,comparator, and outcome (PICO).13,14 For tests the list is as follows, butwith the target condition (equivalent to outcome in trials) shifted to thebeginning of the list: (1) The target condition and reference standard usedto assess it; (2) the population/clinical question; (3) the comparison; and(4) the index test. We now look at each of these in turn.
The target condition and the reference standard used to assess it
Test accuracy in any population will depend on how we define who hasthe target condition(s) that the test aims to detect. Clearly, the stage andspectrum of the target disease will influence the accuracy of the index test,as described later. However, even within a fixed spectrum and stage, theremay be different definitions of who is “truly” diseased or not. Depending onthe purpose of the study, the target conditions may be defined on groundsof clinical relevance, oriented to management decisions or prognosis, ordefined on the grounds of pathological diagnosis. The definition of thetarget condition is therefore an active choice to be made by the investigatorand its relevance interpreted by the reader of the study in the light of howthey want to use the information. For example, should myocardial infarctioninclude (a) “silent” myocardial infarction (with no chest pain)? (b) coronarythrombosis reversed by thrombolytic treatment, which then averts fullinfarction? This issue of the definition of the target condition and its methodof ascertainment will clearly affect the apparent accuracy of the index test.For example, in parallel to considerations in clinical trials, the closer thereference standard is to a patient-relevant measure, the more this will helpdecisions about clinical applicability. Often reference standards that areconsidered objective and free of error are surrogates for (predictors of )
THE EVIDENCE BASE OF CLINICAL DIAGNOSIS
100
Andre_Chap06.qxd 11/6/01 3:00 PM Page 100

DESIGNING STUDIES FOR TRANSFERABILITY
101
natural history, which could be measured directly. Consider the referencestandard for a test for appendicitis.The “objective” reference standard for anew test of appendicitis is often considered to be histology (arrow 2 onFigure 6.2.) In fact, conceptually, follow up of natural history is a far moreuseful reference standard than histology (Figure 6.2, arrow 1). It is patient-relevant: those people who would have been found to have abnormalhistology but whose condition resolves without operation can be consideredfalse positives of the histological reference standard (Figure 6.2, arrow 3). Inpractice, the data for arrow 3 cannot be established, and we need to use acombined reference standard that we would consider as natural historywhen available and histology when not, rather than (as it is usuallyconceptualised) histology when available and natural history when not.
The usual presentation deals with a dichotomous definition of the targetcondition: it is either present or absent. In most cases the possibility ofmultiple conditions is more plausible. If these are known in advance, thepolytomous nature can be taken into account.15–17
Misclassification of the reference standard will tend to result inunderestimation of test accuracy if the errors in the reference standard andtest are uncorrelated. The degree of underestimation is prevalencedependent in a non-linear way. Estimation of sensitivity is underestimatedmost when the prevalence of the target condition is low, whereas specificityis underestimated most when the prevalence of the target condition ishigh.18,19 The odds ratio is underestimated most when prevalence is ateither extreme. Therefore, error in the reference standard may causeapparent (rather than real) effect modification of test discrimination insubgroups in which the target condition has different prevalences.20,21 Thisis shown in Table 6.2 where the same hypothetical test and referencestandard are applied to a population in which disease prevalence is 50%
New test
Histology reference standard
Natural history reference standard
1
2
3
Figure 6.2 Choosing a relevant reference standard.
Andre_Chap06.qxd 11/6/01 3:00 PM Page 101

THE EVIDENCE BASE OF CLINICAL DIAGNOSIS
102
(top half of table) and about 9% (bottom half ). Sensitivity is reduced morein the population with 9% prevalence of disease, and specificity more in thepopulation at 50% prevalence. The odds ratio is reduced most in thepopulation at 9% prevalence. If errors in the reference standard arecorrelated with test errors, then the effect will be more difficult to predict.Correlated errors may result in overestimation of test accuracy.
The population and the clinical question
The population/clinical question are concerned not only with what diseaseis being tested for, but with what presentation of symptoms, signs and otherinformation has prompted the use of the test. Test performance may varyin different populations and with minor changes in the clinical question.There are three critical concepts that help in understanding why thisoccurs. These are the spectrum of disease, the referral filter, and theincremental value of the test.
● Spectrum of disease and non-disease. Many diseases are not on/offstates, but represent a spectrum ranging from mild to severe forms ofdisease.22 Tumours, for example, start small, with a single cell, and thengrow, leading eventually to symptoms. The ability of mammography, forexample, to detect a breast tumour depends on its size. Therefore, testsensitivity will generally differ between asymptomatic and symptomatic
Table 6.2 Reference standard misclassification results in underestimation of testaccuracy and apparent effect modification of different prevalences.If reference standard has sensitivity � 0.9 and specificity � 0.8
True disease Reference standard
Test Present Absent Total Test Present Absent Total
Positive 80 30 110 Positive 78 32 110Negative 20 70 90 Negative 32 58 90
Total 100 100 200 Total 110 90 200
Sensitivity � 0.80 OR � 9.3 Sensitivity � 0.71 OR � 4.4Specificity � 0.70 Specificity � 0.64
If reference standard has sensitivity � 0.9 and specificity � 0.8True disease Reference standard
Test Present Absent Total Test Present Absent Total
Positive 80 300 380 Positive 132 248 380Negative 20 700 720 Negative 158 562 720
Total 100 1000 1100 Total 290 810 1100
Sensitivity � 0.80 OR � 9.3 Sensitivity � 0.46 OR � 1.9Specificity � 0.70 Specificity � 0.69
Andre_Chap06.qxd 11/6/01 3:00 PM Page 102

DESIGNING STUDIES FOR TRANSFERABILITY
103
persons. If previous tests have been carried out the spectrum of disease intested patients may be limited, with patients who have very severe forms ofdisease or those with very mild forms being eliminated from thepopulation. For example, in patients with more severe urinary tractinfection, as judged by the presence of more severe symptoms and signs,the sensitivity of dipstick tests was much higher than in those with minorsymptoms and signs.6
Likewise, patients without the target condition are not a homogeneousgroup. Even in the absence of disease, variability in results is the norm ratherthan the exception. For many laboratory tests, normal values in womendiffer from those in men. Similarly, values in children differ from those inadults, and values in young adults sometimes differ from those in the elderly.
Commonly, the “non-diseased” group consists of several differentconditions, for each of which the test specificity may vary. The overallspecificity will depend on the “mix” of alternative diagnoses: the proportionof people in each of the categories that constitute the non-diseased; forexample, prostate specific antigen may have a lower specificity in olderpeople or those with prostatic symptoms, as it is elevated in men withbenign prostatic hypertrophy.23 In principle, patients without that targetcondition could represent a wide range of other conditions. However, thedecision to use a test is usually made because of the presenting problem ofthe patient and the route by which they reached the examining clinician.Hence, the actual range of variability in patients without the targetcondition will depend on the mechanism by which patients have ended upin that particular situation. As an example, consider a group of ambulantoutpatients presenting with symptoms of venous thromboembolismwithout having this disease compared to a group of inpatients suspected ofvenous thromboembolism but actually having a malignancy.The specificityof a D-dimer test in outpatients will be lower than that in inpatients.24
● Referral filter. The discriminatory power of tests often varies acrosssettings because patients presenting with a clinical problem in onesetting – for example primary care – are very different from thosepresenting to a secondary care facility with that clinical problem.25,26
Patients who are referred to secondary care may be those with a moredifficult diagnostic problem, in whom the usual tests have not resolved theuncertainty. These patients have been through a referral filter to get to thetertiary care centre.
This concept can best be considered using the hypothetical results of adiagnostic test evaluation in primary care (Table 6.3). Imagine that patientsare referred from this population to a source of secondary care, and that allthe test positive patients are referred, but only a random half of the testnegative patients. As shown in Table 6.4, the overall test discrimination, asreflected in the odds ratio, has not changed. However, there appears to bea shift in threshold, with an increased sensitivity and a decreased specificity.
Andre_Chap06.qxd 11/6/01 3:00 PM Page 103

Of course, it is unlikely that test negatives would be referred randomly;rather, it may be on the grounds of other clinical information that thepractitioner is particularly concerned about those test negatives. If thepractitioner is correct in identifying patients about whom there is anincreased risk of disease, the table could well turn out like Table 6.5.
In this case, because of the clinician’s skill and the use of otherinformation, not only does the test threshold appear to be shifted, but theoverall test performance of the test in secondary care has been eroded, asshown by the reduced odds ratio. The more successfully the primary carepractitioner detects cases that are test negative but which nevertheless need
THE EVIDENCE BASE OF CLINICAL DIAGNOSIS
104
Table 6.3 Accuracy of a test in primary care.
Disease
Test Present Absent Total
Positive 60 40 100Negative 40 60 100
Total 100 100 200
Sensitivity � 0.60 OR � 2.25Specificity � 0.60
Table 6.4 Test accuracy if a random sample of test negatives are referred forverification.
Disease
Test Present Absent Total
Positive 60 40 100Negative 20 30 50
Total 80 70 150
Sensitivity � 0.75 OR � 2.25Specificity � 0.43
Table 6.5 Diagnostic performances vary by setting because of selective patientreferral.
Disease
Test Present Absent Total
Positive 60 40 100Negative 25 25 50
Total 85 65 150
Sensitivity � 0.71 OR � 1.5Specificity � 0.38
Andre_Chap06.qxd 11/6/01 3:00 PM Page 104

referral for management of the disease of interest, the more theperformance of the test in secondary care is eroded.
● To what prior tests is the incremental value of the new test being assessed ?In many situations several tests are being used and the value of a particulartest may depend on what tests have been done before,27 or simple priorclinical information.28,29 In Table 6.6 two tests are cross-classified withindiseased and non-diseased people. The sensitivity and specificity of eachtest is 0.6, and they remain 0.6 if test B is used after test A, that is, the testperformance characteristics of B remain unaltered in categories of patientswho are A positive and those who are A negative.
However, if the tests are conditionally dependent or associated with eachother within diseased and non-diseased groups, for example because theyboth measure a similar metabolite, then the overall test performance of Bis eroded, as judged by the OR changing from 2.25 to 2.00 (Table 6.7 andFigure 6.3). In addition, there appears to be a threshold shift: the test ismore sensitive but less specific in patients for whom A is positive than inthose for whom A is negative. In other words, not only is the discriminationof the new test (B) less if done after the existing test (A), as judged by theodds ratio, but the calibration appears to differ depending on the result ofthe prior test. In fact, the threshold has not altered but there has been a
DESIGNING STUDIES FOR TRANSFERABILITY
105
Table 6.6 Incremental value when tests A and B are conditionally independent.
Have disease No disease
A� A� Total A� A� Total
B� 36 24 60 16 24 40B� 24 16 40 24 36 60
Total 60 40 100 40 60 100
“Crude” sensitivity and specificity of both A and B � 0.6 and odds ratio � 2.25.If A is � or �, SnB � 0.6, SpB � 0.6 and OR � 2.25.
Table 6.7 Incremental value when tests A and B are conditionally dependent.
Have disease No disease
A� A� Total A� A� Total
B� 40 20 60 20 20 40B� 20 20 40 20 40 60
Total 60 40 100 40 60 100
“Crude” sensitivity and specificity of both A and B � 0.6.Odds ratio � 2.25.If A �, SnB � 0.67, SpB � 0.50 and OR � 2.00.If A �, SnB � 0.50, SpB � 0.67 and OR � 2.00.
Andre_Chap06.qxd 11/6/01 3:00 PM Page 105

shift in the distribution of test results in diseased and non-diseased groups,conditional on the results of test A.
An example is provided by Mol and colleagues,30 who evaluated theperformance of serum hCG (human chorionic gonadotrophin)measurement in the diagnosis of women with suspected ectopic pregnancy.Several studies have reported an adequate sensitivity of this test.30
However, the presence of an ectopic or intrauterine pregnancy can also bediagnosed with ultrasound. Mol et al. reported the sensitivity of hCG to besignificantly different in patients with signs of an ectopic pregnancy(adnexal mass, or fluid in the pouch of Douglas) on ultrasound, comparedto those without signs on ultrasound. As a consequence, an uncriticalgeneralisation of the “unconditional” sensitivity will overestimate thediagnostic performance of this test if it is applied after an initialexamination with ultrasound, as is the case in clinical practice.30
Categories of patients for whom new tests are most helpful are worthinvestigating. For example, whole-body positron emission tomography(PET) contributed most additional diagnostic information in the subgroupof patients in whom prior conventional diagnostic methods had beenequivocal.31
The comparison: replacement or incremental test
Note that a new test may be evaluated as a replacement for the existing test,rather than being done after the existing test, in which case the incrementalvalue is of interest. For assessment of replacement value, the cross-classification of the tests is not necessary to obtain unbiased estimates of howthe diagnostic performance of the new test differs from that of the existing
THE EVIDENCE BASE OF CLINICAL DIAGNOSIS
106
1
0.8
0.6
0.4
0.2
00 0.2 0.4 0.6 0.8 1
Sn
1–Sp
Test B accuracy whenperformed alone
Test B accuracy in patientswith positive test A
Test B accuracy in patientswith negative test A
ROC curve for test B, whenperformed subsequent to test A
ROC curve for test B, whenperformed alone
ROC curves for test B under different conditions
Figure 6.3 Test characteristics for test B alone and in those with positive andnegative test A.
Andre_Chap06.qxd 11/6/01 3:00 PM Page 106

DESIGNING STUDIES FOR TRANSFERABILITY
107
one. However, information about how they are associated from a cross-classification will provide extra useful information and improve precision.32
Readers may have noticed that the issue of incremental value and thedecreased test performance if tests are conditionally dependent is related tothe prior issue of decreased test performance if the primary care clinicianis acting as an effective referral filter. In our previous example, imagine thatthe test being evaluated is B. The clinician may be using test A to alter themix of A� and A�s that get through to secondary care, and the testperformance of B reflects the way in which this mix has occurred.
The test
● Discriminatory power. Information about the test is relevant to bothdiscriminative power and calibration. Discrimination may differ betweentests that bear the same generic name but which, for example, are made bydifferent manufacturers.Tests may be less discriminatory when produced in“kit” form than in initial laboratory testing.33 When tests requireinterpretative skill, they are often first evaluated in near-optimal situations.Special attention is usually devoted to the unambiguous and reproducibleinterpretation of test results.This has implications for the interpretation andgeneralisability of the results. If the readers of images are less than optimalin your own clinical setting, test accuracy will be affected downward.34–36
The usual presentation deals with a two-way definition of test results,into positive and negative. In many cases, multiple categories of test results ismore plausible. In addition, there may be a category of uninterpretable testresults that needs to be considered.The polytomous nature of tests shouldbe taken into account, for which several methods are available. Rather thana simple positive–negative dichotomy and the associated characteristicssensitivity and specificity, likelihood ratios for the multiple categories andROC curves can be calculated (see Chapter 7). In all cases, a more generaln � n table can be used to describe test characteristics, and severallikelihoods can be calculated.16
● Calibration. If the purpose of the study is clinical decision making, inwhich information is being derived to estimate probablilities of disease,then a second major issue is the calibration of test results. A continuous testmay have equivalent ROCs and diagnostic ORs in two different settings,but very different likelihood ratios (LRs). For example, machine calibrationmay be different in the two settings, so that one machine may show resultsconsiderably higher than another. Likewise, even if two readers ofradiographs have similar discriminative power, as shown by similar ROCs,the threshold they use to differentiate positive from negative tests (oradjacent categories of a multicategory test) may vary widely.37–40
In summary, variability in the discriminative power and calibration of thesame test used in different places is the rule rather than the exception.
Andre_Chap06.qxd 11/6/01 3:00 PM Page 107

THE EVIDENCE BASE OF CLINICAL DIAGNOSIS
108
When we strive for parsimony in our descriptions, we run the risk ofoversimplification. In the end, the researcher who reports a study, as wellas the clinician searching the literature for help in interpreting test results,has to bear in mind that test performance characteristics are never justproperties of the test itself: they depend on several factors, including priorclinical and test information, and the setting in which the test is done.
2. Implications of variation in discriminative power and calibration of tests: questions to ask yourself before you start designing the study
1 What is the target condition and the reference standard?2 Is the objective to estimate test performance using a global measure, or
a measure that will allow estimation of the probability of disease inindividuals?
3 What is the population and clinical problem?4 Is the test being considered as a replacement or incremental test?5 To what extent do you want to study the reasons for variability of the
results within your population?6 To what extent do you want to study the transferability of the results to
other settings?
In what follows, we assume that the usual criteria for adequate design of anevaluation of a diagnostic test have been fulfilled.The issue is then: How dowe design a study which will also help to ensure that its transferability canbe determined? Based on the concepts in the first part of this chapter, wesuggest that investigators ask themselves the following questions to helpensure that readers have the necessary information to decide on thetransferability of the study to their own setting.
1. What is the target condition and reference standard?
The target condition and reference standard need to be chosen to reflectthe investigator’s requirements. Is the choice appropriate to whether theinvestigator is doing the study to assist with predicting prognosis, decidingas the need for intervention, or researching pathological processes? Forexample, in a study of tests to assess stenosis of the carotid artery, it wouldbe sensible to choose the reference standard as angiographic stenosisdichotomised around 70%, if this is the level of angiographic abnormalityabove which, on currently available evidence, the benefits of treatmentoutweigh the harm. On the other hand, if the study is being done byresearchers whose interest is in basic science, they may wish to compare thetest with stenosis assessed on surgically removed specimens at a differentthreshold, or across a range of thresholds.
Andre_Chap06.qxd 11/6/01 3:00 PM Page 108

DESIGNING STUDIES FOR TRANSFERABILITY
109
Error in the reference standard is a major constraint on our ability toestimate test accuracy and explore reasons for variability of testcharacteristics.18,19,41 Therefore, researchers should consider methods ofminimising error in the reference standard, for example by using bettermethods or multiple assessments. Any information about the testperformance characteristics of the reference standard will helpinterpretation, as will several different measures of the target condition,which can be combined. Multiple measures of the reference standard ormultiple different tests also allow the use of more sophisticated analyses,such as latent class analysis, to minimise the potential for bias in estimatesof test accuracy or factors that affect it.21,42 Because the effects ofmisclassification in the reference standard have different effects inpopulations of different prevalence, as shown in Table 6.2, one may chooseto assess a test in a population where any residual effects of error in thereference standard are minimised. For the odds ratio, this is at about 50%prevalence. For sensitivity it is when prevalence is high, and for specificitywhen prevalence is low. However, when using this strategy, considerwhether the spectrum of disease may also vary with prevalence. If so, youwill need to judge whether reference standard misclassification is asufficiently important problem to outweigh the potential for spectrum biasinduced by choosing a study in a population with specified prevalence.
2. Is the objective to estimate test performance using a globalmeasure (discrimination) or a measure that will allow estimation of the probability of disease in individuals(discrimination and calibration)?
Global assessment of the discriminatory power of the test requiresmeasures such as the area under the ROC curve, or the diagnostic oddsratio. These may be sufficient for some purposes, for example if a policydecision needs to be made about alternative tests of equivalent cost, or todecide whenever a test has sufficient accuracy to warrant further calibration.For estimating the probability of disease in individuals, likelihood ratios (orsensitivity and specificity) are needed, with additional information on howtests were calibrated. Information about calibration should be provided inpapers for readers to be able to use the result of your study. Access toselected example material, such as radiographs of lesions, will help readersunderstand what thresholds have been used for reading in your study.
3. What is the population and clinical problem?
This question defines how the inception cohort should be selected forstudy, although the breadth of the group selected will also be determinedby the extent to which you wish to address the following questions.
Andre_Chap06.qxd 11/6/01 3:00 PM Page 109

For example, a new test for carotid stenosis could be considered for allpatients referred to a surgical unit. However, ultrasound is reasonablyaccurate at quantifying the extent of stenosis, and so investigators maychoose to restrict the study of a more expensive or invasive test to patientsin whom the ultrasound result is near the decision threshold for surgery. Auseful planning tool is to draw a flow diagram of how patients reach thepopulation/clinical problem of interest. This flow diagram includes whatclinical information has been gathered and what tests have been done, andhow the results of those tests determine entry into the population andclinical problem of interest. For example, in the flow diagram in Figure 6.4the clinical problem is suspected appendicitis in children presenting to ahospital emergency service. The decisions based sequentially on clinicalevidence and ultrasonography are shown.The flow diagram helps to clarifythat computed tomography (CT) is being assessed only in patients inwhom those prior tests had not resolved the clinical problem. Also as shownin the figure, in addition to being helpful at the design stage, publishing
THE EVIDENCE BASE OF CLINICAL DIAGNOSIS
110
Children with suspectedappendicitis, n = 177
Evaluated withultrasonography, n = 139
Went to operating roomfor appendectomy, n = 20
Went to operating roomfor appendectomy, n = 31
Admitted to hospital forobservation, n = 25
Discharged home fromemergency department, n = 52
No appendicitis, n = 0
No appendicitis,n = 3
Appendicitis,n = 28
No appendicitis,n = 24
Appendicitis,n = 1
No appendicitis,n = 52
Appendicitis,n = 0
Appendicitis, n = 20 No appendicitis, n = 10 Appendicitis, n = 1
Evaluated with CTRC,n = 108
Discharged home,n = 11
Discharged home fromemergency department, n = 4
No appendicitis, n = 4 Appendicitis, n = 0 No appendicitis, n = 4 Appendicitis, n = 30
Directly to operating room, n = 34
Figure 6.4 A flow diagram to formulate a diagnostic test research question. Studyprofile flow diagram of patients with suspected appendicitis. (From Garcia PenaBM et al. Ultrasonography and limited computed tomography in the diagnosis andmanagement of appendicitis in children. JAMA 1999;282:1041–6. Reproducedwith permission from the American Medical Association.43)
Andre_Chap06.qxd 11/6/01 3:00 PM Page 110

such flow diagrams, with numbers of patients who follow each step, is veryhelpful to readers.43
4. Is the test being considered as a replacementor incremental test?
As outlined above, the population and the clinical problem define theinitial presentation and referral filter. In addition, a key question is whetherwe are evaluating the test to assess whether it should replace an existing test(because it is better, or just as good and cheaper) or to assess whether it hasvalue when used in addition to a particular existing test. This decision willalso be a major determinant of how the data will be analysed.44–46
5. To what extent do you want to study the reasons for variability of the results within your population?
How much variability is there between readers/operators?
Data should be presented on the amount of variability between differentreaders or test types and tools to help calibration, such as standardradiographs,39,40 or laboratory quality control measures. The extent towhich other factors, such as experience or training, affect reading adequacywill also help guide readers of the study. Assessment of variability shouldinclude not only test discriminatory power but also calibration, if theobjective is to provide study results that are useful for individual clinicaldecision making.
Do the findings vary in different (prespecified) subgroupswithin the study population?
Data should be analysed to determine the influence on test performancecharacteristics of the following variables, which should be available for eachindividual.
● The spectrum of disease and non-disease, for example by estimating“specificity” within each category of “non-disease”. These can beconsidered separately by users or combined into a weighted specificityfor different settings. The same approach can be used for levels (stage,grade) in the “diseased” group.
● The effect of other test results. This follows the approach often used inclinical prediction rules. It should take account of logical sequencing oftests (simplest, least invasive, and cheapest are generally first). It shouldalso take account of possible effect modification by other tests. In someinstances people would have been referred because of other tests beingpositive (or negative), so that the incremental value of the new test cannotbe evaluated. In this case, knowing the referral filter and how tests have
DESIGNING STUDIES FOR TRANSFERABILITY
111
Andre_Chap06.qxd 11/6/01 3:00 PM Page 111

been used in it (as in Figure 6.4) will help interpretation. For example, astudy by Flamen31 has shown that the major value of PET for recurrentcolorectal adenocarcinoma is in the category of patients in whom prior(cheaper) tests gave inconclusive results. It would therefore be a usefulincremental test in that category of patients, but would add little (exceptcost) if being considered as a replacement test for all patients, many ofwhom would have the diagnostic question resolved by the cheaper test.This suggests that PET is very helpful in this clinical situation.31
● Any other characteristics, such as age or gender.
There are often a vast number of characteristics that could be used todefine subgroups in which one may wish to check whether there aredifferences in test performance. The essential descriptors of a clinicalsituation need to be decided by the researcher. As for subgroup analysis inrandomised trials,47 these characteristics should be prespecified, ratherthan decided at analysis stage.The decision is best made on the basis of anunderstanding of the pathophysiology of the disease, the mechanism bywhich the test assesses abnormality, an understanding of possible referralfilters, and knowledge of which characteristics vary widely between centres.Remember that variability between test characteristics in subgroups maynot be due to real subgroup differences if there is reference standardmisclassification and the prevalence of disease differs between subgroups,as shown in Table 6.2. Modelling techniques can be used to assess the effectof several potential predictors of test accuracy simultaneously.48–52
6. To what extent do you want to study the transferability of the results to other settings?
To address this question, you need to perform the study in severalpopulations or centres, and assess the extent to which test performancediffers, as has been done for the General Health Questionnaire53 andpredictors of coma.54 The extent to which observed variability is beyondthat compatible with random sampling variability can be assessed usingstatistical tests for heterogeneity. Predictors (as discussed above) shouldalso be measured to assess the extent to which within-population variablesexplain between-population variability. Because of the low power of tests ofheterogeneity, this is worth doing even if tests for heterogeneity betweencentres or studies are not statistically significant. The more the measuredvariables explain between-population differences, the more they can berelied on when assessing the transferability of that study to the populationin the reader’s setting. Between-site variability can also be explored acrossdifferent studies using meta-analytical techniques.55,56
Sites for inclusion in the multicentre comparison should be selected asbeing representative of the sorts of populations in which the results of thediagnostic study are likely to be used. The more the variability in site
THE EVIDENCE BASE OF CLINICAL DIAGNOSIS
112
Andre_Chap06.qxd 11/6/01 3:00 PM Page 112

DESIGNING STUDIES FOR TRANSFERABILITY
113
features can be characterised – and indeed taken account of in the samplingof sites for inclusion in studies – the more informative the study will be.Data should be analysed to determine the influence on results of thewithin-site (individually measured) patient characteristics mentionedabove. They should also explore the following sources of between-sitevariability that are not accounted for by the within-site characteristics:
● Site characteristics, for example primary, secondary or tertiary care● Other features, such as country● Prevalence of the disease of interest.
Residual heterogeneity between sites should be explored to judge the extentto which there is inexplicable variability that may limit test applicability.
Explanatory note about prevalence
The inclusion of “prevalence” in the above list may seem unusual, as itis not obviously a predictor of test performance. However, there are manyreasons why prevalence should be included in the list of potentialpredictors, in an analogous way to the exploration of trial resultdependence on baseline risk.57 First, many of the reasons for variationbetween centres may not be easy to characterise, and prevalence maycontain some information about how centres differ that is not captured byother crude information, for example whether the test is evaluated inprimary, secondary or tertiary care centres. Second, it is a direct test of thecommon assumption that test performance characteristics such assensitivity and specificity are independent of prevalence. Third, non-linearprevalence dependence is an indication that there is misclassification of thereference standard.
In summary, there is merit in designing studies with heterogeneous studypopulations. This will allow exploration of the extent to which diagnosticperformance depends on prespecified predictors, and how much residual
Table 6.8 The value of designing studies that enable the exploration of predictorsof heterogeneity of diagnostic accuracy.
Heterogeneity inHeterogeneity in study population
diagnostic accuracy Yes No
Yes To what extent is Transferability limitedheterogeniety in accuracyexplained by predictors?
If not, transferability islimited
No Highly transferable Design does not allowexploration of transferability
Andre_Chap06.qxd 11/6/01 3:00 PM Page 113

THE EVIDENCE BASE OF CLINICAL DIAGNOSIS
114
heterogeneity exists. The more heterogeneity there is in study populations,the greater the potential to explore the transferability of diagnosticperformance to other settings, as shown in Table 6.8.
Concluding remarks
There is good evidence that measures of test accuracy are not astransferable across settings as is often assumed. This chapter outlines theconceptual underpinnings for this, and suggests some implications for howwe should be designing studies that carry more information about thetransferability of results. Major examples are examining the extent to whichtest discrimination and calibration depend on prespecified variables, andthe extent to which there is residual variability between study populationswhich is not explained by these variables. This will require larger studiesthan have generally been done in the past for diagnostic tests.Improvements in study quality and designs to assess transferability areneeded to ensure that the next generation of studies on test accuracy aremore able to meet our needs.
Acknowledgement
We thank Petra Macaskill, Clement Loy, André Knottnerus, MargaretPepe, Jonathan Craig, and Anthony Grabs for comments on earlier drafts.Clement Loy also provided Figure 6.3. We thank Barbara Garcia Pena forpermission to use a figure from her paper as our Figure 6.4.
References
1 Begg C. Biases in the assessment of diagnostic tests. Stat Med 1987;6:411–23.2 Moons K, van Es G, Deckers JW, Habbema JO, Grobbee DE. Limitations of sensitivity,
specificity, likelihood ratio, and Bayes’ theorem in assessing diagnostic probabilities: Aclinical example. Epidemiology 1997; 8:12–17.
3 Detrano R, Janosi A, Lyons KP et al. Factors affecting sensitivity and specificity of adiagnostic test: the exercise thallium scintigram. Am J Med 1988;84:699–710.
4 Hlatky M, Pryor D, Harrell FE Jr, Califf RM, Mark DB, Rosati RA. Factors affectingsensitivity and specificity of exercise electrocardiography. Am J Med 1984;77:64–71.
5 Rozanski ADG, Berman D, Forrester JS, Morris D, Swan HJC. The declining specificityof exercise radionuclide ventriculography. N Engl J Med 1983;309:518–22.
6 Lachs MS, Nachamkin I, Edelstein PH, Goldman J, Feinstein AR, Schwartz JS. Spectrumbias in the evaluation of diagnostic tests: lessons from the rapid dipstick test for urinarytract infection. Ann Intern Med 1992;117:135–40.
7 Molarius ASJ, Sans S, Tuomilehto J, Kuulasmaa K. Varying sensitivity of waist actionlevels to identify subjects with overweight or obesity in 19 populations of the WHOMONICA Project. J Clin Epidemiol 1999;52:1213–24.
8 Starmans R, Muris JW, Fijten GH, Schouten HJ, Pop P, Knottnerus JA. The diagnosticvalue of scoring models for organic and non-organic gastrointestinal disease, including theirritable-bowel syndrome. Med Decision Making 1994;14:208–16.
Andre_Chap06.qxd 11/7/01 10:26 AM Page 114

9 Glasziou P, Irwig L. An evidence-based approach to individualising treatment. BMJ1995;311:1356–9.
10 National Health and Medical Research Council. How to use the evidence: assessment andapplication of scientific evidence. Handbook series on preparing clinical practice guidelines.Canberra, Commonwealth of Australia, 2000; (Website http://www.health.gov.au/nhmrc/publicat/synopses/cp65syn.htm)
11 Justice AC, Covinsky KE, Berlin JA. Assessing the generalizability of prognosticinformation. Ann Intern Med 1999;130:515–24.
12 Gatsonis C, McNeil BJ. Collaborative evaluations of diagnostic tests: experience of theRadiology Diagnostic Oncology Group. Radiology 1990;175:571–5.
13 Sackett D, Straus S, Richardson WS, Rosenberg W, Haynes RB. Evidence-based Medicine:How to practice and teach EBM. Edinburgh: Churchill Livingstone, 2000.
14 Richardson W,Wilson M, Nishikawa J, Hayward RS.The well-built clinical question: a keyto evidence-based decisions. ACP Journal Club 1995;123:A12.
15 Brenner H. Measures of differential diagnostic value of diagnostic procedures. J ClinEpidemiol 1996;49:1435–9.
16 Sappenfield RW, Beeler MF, Catrou PG, Boudreau DA. Nine-cell diagnostic decisionmatrix. A model of the diagnostic process: a framework for evaluating diagnosticprotocols. Am J Clin Pathol 1981;75:769–72.
17 Taube A, Tholander B. Over- and underestimation of the sensitivity of a diagnosticmalignancy test due to various selections of the study population. ACTA Oncol 1990;29:1–5.
18 Buck A, Gart J. Comparison of a screening test and a reference test in epidemiologic studies.I. Indices of agreement and their relation to prevalence. Am J Epidemiol 1966;83:586–92.
19 Gart J, Buck A. Comparison of a screening test and a reference test in epidemiologicstudies. II. A probabilistic model for the comparison of diagnostic tests. Am J Epidemiol1966;83:593–602.
20 Kelsey JL, Whittemore AS, Evans AS, Thompson WD. Methods in observationalepidemiology, 2nd edn. New York: Oxford University Press, 1996.
21 Walter SD, Irwig L, Glasziou PP. Meta-analysis of diagnostic tests with imperfectreference standards. J Clin Epidemiol 1999;52:943–51.
22 Ransohoff DF, Feinstein AR. Problems of spectrum and bias in evaluating the efficacy ofdiagnostic tests. N Engl J Med 1978;299:926–30.
23 Coley C, Barry M, Fleming C, Mulley AG. Early detection of prostate cancer. Part I: Priorprobability and effectiveness of tests. Ann Intern Med 1997;126:394–406.
24 van Beek EJR, Schenk BE, Michel BC. The role of plasma D-dimer concentration in theexclusion of pulmonary embolism. Br J Haematol 1996;92:725–32.
25 Knottnerus J, Leffers P. The influence of referral patterns on the characteristics ofdiagnostic tests. J Clin Epidemiol 1992;45:1143–54.
26 van der Schouw YT, van Dijk R, Verbeek AL. Problems in selecting the adequate patientpopulation from existing data files for assessment studies of new diagnostic tests. J ClinEpidemiol 1995;48:417–22.
27 Katz IA, Irwig L, Vinen JD, et al. Biochemical markers of acute myocardial infarction:strategies for improving their clinical usefulness. Ann Clin Biochem 1998;35:393–9.
28 Whitsel E, Boyko E, Siscovick DS. Reassessing the role of QT in the diagnosis ofautonomic failure among patients with diabetes: a meta-analysis. Arch Intern Med2000;23:241–7.
29 Conde-Agudelo A, Kafury-Goeta AC. Triple-marker test as screening for Down’ssyndrome: a meta-analysis. Obstet Gynecol Surv 1998;53:369–76.
30 Mol B, Hajenius P, Engelsbel S. Serum human chorionic gonadotrophin measurement inthe diagnosis of ectopic pregnancy when transvaginal sonography is inconclusive. FertilSteril 1995;70:972–81.
31 Flamen PSS, van Cutsem E, Dupont P, et al. Additional value of whole-body positronemission tomography with fluorine-18-2-fluoro-2-deoxy-D-glucose in recurrent colorectalcancer. J Clin Oncol 1999;17:894–901.
32 Decode Study Group. Glucose tolerance and mortality: comparison of WHO andAmerican Diabetes Association diagnostic criteria. Lancet 1999;354:617–21.
DESIGNING STUDIES FOR TRANSFERABILITY
115
Andre_Chap06.qxd 11/7/01 10:26 AM Page 115

33 Scouller K, Conigrave KM, Macaskill P, Irwig L, Whitfield JB. Should we use CDTinstead of GGT for detecting problem drinkers? A systematic review and meta-analysis.Clin Chem 2000;46:1894–902.
34 West OC, Anbari MM, Pilgram TK, Wilson AJ. Acute cervical spine trauma: diagnosticperformance of single-view versus three-view radiographic screening. Radiology1997;204:819–23.
35 Scheiber CMM, Dumitresco B, Demangeat JL, et al. The pitfalls of planar three-phasebone scintigraphy in nontraumatic hip avascular osteonecrosis. Clin Nucl Med1999;24:488–94.
36 Krupinski EA, Weinstein RS, Rozek LS. Experience-related differences in diagnosis frommedical images displayed on monitors. Telemed J 1996;2:101–8.
37 Egglin TK, Feinstein AR. Context bias. A problem in diagnostic radiology. JAMA1996;276:1752–5.
38 Irwig L, Groeneveld HT, Pretorius JP, Itnizdo E. Relative observer accuracy fordichotomized variables. J Chronic Dis 1985;28:899–906.
39 D’Orsi C, Swets J. Variability in the interpretation of mammograms. N Engl J Med1995;332:1172.
40 Beam C, Layde P, Sullivan DC.Variability in the interpretation of screening mammogramsby US radiologists. Findings from a national sample. Arch Intern Med 1996;156:209–13.
41 Valenstein PN. Evaluating diagnostic tests with imperfect standards. Am J Clin Pathol1990;93:252–8.
42 Walter S, Irwig L. Estimation of test error rates, disease prevalence and relative risk frommisclassified data: A review. J Clin Epidemiol 1988;41:923–37.
43 Garcia Pena BM, Mandl KD, Kraus SJ, et al. Ultrasonography and limited computedtomography in the diagnosis and management of appendicitis in children. JAMA1999;282:1041–6.
44 Marshall R. The predictive value of simple rules for combining two diagnostic tests.Biometrics 1989;45:1213–22.
45 Biggerstaff B. Comparing diagnostic tests: a simple graphic using likelihood ratios.Statistics Med 2000;19:649–63.
46 Chock C, Irwig L, Berry G, Glaszion P. Comparing dichotomous screening tests whenindividuals negative on both tests are not verified. J Clin Epidemiol 1997;50:1211–17.
47 Oxman A, Guyatt G. A consumer guide to subgroup analyses. Ann Intern Med1992;116:78–84.
48 Tosteson ANA, Weinstein MC, et al. ROC curve regression analysis: the use of ordinalregression models for diagnostic test assessment. Environ Health Perspect 1994;102(Suppl8):73–8.
49 Toledano A, Gatsonis C. Ordinal regression methodology for ROC curves derived fromcorrelated data. Statistics Med 1996;15:1807–26.
50 Pepe M. An interpretation for the ROC curve and inference using GLM procedures.Biometrics 2000;56:352–9.
51 Leisenring W, Pepe M. Regression modelling of diagnostic likelihood ratios for theevaluation of medical diagnostic tests. Biometrics 1998;54:444–52.
52 Leisenring W, Pepe M, Longton G. A marginal regression modelling framework forevaluating medical diagnostic tests. Statistics Med 1997;16:1263–81.
53 Furukawa T, Goldberg DP. Cultural invariance of likelihood ratios for the General HealthQuestionnaire. Lancet 1999;353:561–2.
54 Zandbergen EGJ, de Haan RJ, et al. Prognostic predictors of coma transferable from onesetting to another in SR. Lancet 1998;352:1808–12.
55 Irwig L, Tosteson ANA, Gatsonis C, et al. Guidelines for meta-analyses evaluatingdiagnostic tests. Ann Intern Med 1994;120:667–76.
56 Rutter C, Gatsonis C. Regression methods for meta-analysis of diagnostic test data. AcadRadiol 1995;2(Suppl 1):S48–56.
57 Schmid C, Lau J, McIntosh MW, Cappelleri JC. An empirical study of the effect of thecontrol rate as a predictor of treatment efficacy in meta-analysis of clinical trials. StatisticsMed 1998;17:1923–42.
THE EVIDENCE BASE OF CLINICAL DIAGNOSIS
116
Andre_Chap06.qxd 11/6/01 3:00 PM Page 116

117
7 Analysis of data on theaccuracy of diagnostic testsJ DIK F HABBEMA, RENÉ EIJKEMANS,PIETA KRIJNEN, J ANDRÉ KNOTTNERUS
Summary box
● Neither sensitivity nor specificity is a measure of test performanceon its own. It is the combination that matters.
● The statistical approach for analysing variability in probabilityestimates of test accuracy is the calculation of confidence intervals.
● The magnitude of the change from pretest to post-test probability(predictive value) reflects the informativeness of the diagnostic testresult.
● The informative value of a test result is determined by thelikelihood ratio: the ratio of the frequencies of occurrence of thisresult in patients with and patients without the disease.
● The odds ratio summarises the diagnostic value of a dichotomoustest, but does not tell us the specific values of sensitivity andspecificity and the likelihood ratios.
● A measure of performance for a continuous test is the area under theROC curve.This varies between 0.5 for a totally uninformative testand 1.0 for a test perfectly separating diseased and non-diseased.
● Bayes’ theorem implies that “post-test odds equals pretest oddstimes likelihood ratio”.
● One can derive the optimal cut-off from the relative importance offalse positives and false negatives.
● A sensitivity analysis is important for getting a feeling for thestability of our conclusions.
Andre_Chap07.qxd 11/6/01 3:01 PM Page 117

THE EVIDENCE BASE OF CLINICAL DIAGNOSIS
118
Introduction
After the painstaking job of collecting, computerising and cleaningdiagnostic data, we enter the exciting phase of analysing and interpretingthese data and assessing the clinical implications of the results. It would bea pity if all the effort put into the research were not to be crowned with asound analysis and interpretation. It is the purpose of this chapter to helpreaders to do so.
We will study the classic test performance measures introduced inChapter 1: sensitivity, specificity, positive and negative predictive value,likelihood ratio, and error rate, first for dichotomous tests and later, forcontinuous tests, including the possibility of dichotomisation, with its questfor cut-off values. ROC curves are part of this.
Next, Bayes’ theorem for the relationship between pretest and post-testprobability of disease is discussed, followed by decision analyticalconsiderations. For generalisation of the one-test situation to diagnosticconclusions based on many diagnostic test results, there will be a discussionon logistic regression and its link with Bayes’ theorem.
The strengths and weaknesses of study designs, possible biases, andother methodological issues have been discussed in previous chapters andwill not be repeated here, although the discussion will provide some linksbetween biases and analysis results.
We will refer to software for performing the analysis. Also, we will includeappendices with tables and graphs, which can support you in the analysis.
Clinical example
Renal artery stenosis in hypertension
We use data from a study on the diagnosis of renal artery stenosis. Inabout 1% of all hypertensive patients the hypertension is caused by aconstriction (stenosis) of the renal artery. It is worth identifying thesepatients because their hypertension could be cured by surgery, andconsequently their risk of myocardial infarction and stroke could be
● From multiple logistic regression analysis one can not only learnabout the predictive value of a combination of tests, but also whata certain test adds to other tests that have already been performed.
● When starting a data analysis one must be confident that theresearch data have been collected with avoidance of important biasand with acceptable generalisability to the target population.
Andre_Chap07.qxd 11/6/01 3:01 PM Page 118

reduced. Moreover, renal failure could be prevented by relieving thestenosis. The definitive diagnosis of renal artery stenosis is made by renalangiography. This diagnostic reference test should be used selectively,because it is a costly procedure that can involve serious complications.Thus, clinicians need a safe, reliable, and inexpensive screening test to helpthem select patients for angiography.
The diagnostic tests that we will use in this chapter are clinicalcharacteristics suggestive of renal artery stenosis, and renography;angiography serves as the reference standard test for stenosis. The clinicalcharacteristics used as examples are symptoms and signs of atheroscleroticvascular disease, the presence of an abdominal bruit and the serumcreatinine concentration. Renography is a non-invasive test for detectingasymmetry in renal function between the kidneys, which also is suggestiveof renal artery stenosis.
The data, listed as indicated in Table 7.1, are from a Dutch multicentrestudy aiming to optimise the diagnosis and treatment of renal arterystenosis (RAS). The study included 437 hypertensive patients aged 18–75years, who had been referred for unsatisfactory blood pressure control orfor analysis of possible secondary hypertension.
Diagnostic questions and concepts
One can ask a number of questions concerning this diagnostic problem.Some are mentioned below, with the diagnostic concept concerned inparentheses.
● How good is my diagnostic test in detecting patients with RAS (sensitivity)?● How good is my diagnostic test in detecting patients without RAS
(specificity)?● How well does a positive/abnormal test result predict the presence of
RAS (positive predictive value)?
ANALYSING THE ACCURACY OF DIAGNOSTIC TESTS
119
Table 7.1 The first three and last three patients of 8�437 data array from a studyon diagnostics in possible renal artery stenosis (RAS).
Patient Atherosclerotic Abdominal Creatinine Abnormal RAS oncode Age Gender vascular disease bruit (micromol) renogram angiography
1 62 F No Yes 87 No Yes2 52 M No No 146 Yes Yes3 49 F No No 77 No No… … … … … … … …… … … … … … … …435 36 M No No 84 No No436 51 M Yes No 74 No No437 55 M No No 83 No No
Andre_Chap07.qxd 11/6/01 3:01 PM Page 119

THE EVIDENCE BASE OF CLINICAL DIAGNOSIS
120
● How well does a negative/normal test result predict the absence of RAS(negative predictive value)?
● What is a reasonable estimate for the pretest probability of RAS(prevalence of RAS)?
● How many false conclusions will I make when applying the diagnostictest (error rate)?
● How informative is my positive/negative test result (likelihood ratio)?● How do I summarise the association between a dichotomous test and the
standard diagnosis (diagnostic odds ratio)?● What is an optimal cut-off level when I want to dichotomise a
continuous test (ROC curve)?● To what extent does the test result change my pretest belief/probability
of RAS (Bayes’ theorem)?● How are the above concepts applied to a number of diagnostic tests
simultaneously (logistic regression)?
Sensitivity and specificity for a dichotomous test
We will illustrate the dichotomous test situation by assessing how wellrenography is able to predict arterial stenosis. Therefore we construct fromour database the 2 � 2 table with, as entries for renographic assessment,“abnormal/normal”, and for angiography, “stenosis/no stenosis” (Table 7.2).
The generic table with the corresponding symbolism is given in Table 7.3,with N � total number of patients, NT� � number of patients with positivetest results, NT� � number of patients with negative test results,
Table 7.2 2�2 table for analysing the diagnostic value of renographic assessmentin predicting renal artery stenosis.
Angiography
Renography Stenosis No Stenosis Total
Abnormal 71 33 104Normal 29 304 333
100 337 437
Table 7.3 Generic 2 � 2 table representing possible classifications for therelationship between a diagnostic test and a diagnosis (reference test).
Test Diagnosis
� �
� TP FP NT�
� FN TN NT�
ND� ND� N
Andre_Chap07.qxd 11/6/01 3:01 PM Page 120

ND� �number of patients without the disease, ND� � the number of patientswith the disease, TP�number of true positives, TN�number of truenegatives, FP�number of false positives, and FN�number of false negatives.
Together, sensitivity (the probability of a positive test result in diseasedsubjects, P(T�|D�) and specificity (the probability of a negative test resultin non-diseased subjects, P(T�|D�), characterise the dichotomous testfor the clinical situation at hand. Neither is a measure of test performanceon its own: it is the combination that matters.2
For the example in Table 7.2 we can calculate:
Sensitivity � TP/ND� � 71/100 � 71%Specificity � TN/ND� � 304/337 � 90%
In the next section we will see the degree of variability with which theseestimates are associated.
Sampling variability and confidence intervalsfor probabilities
Confidence intervals
A main challenge in the analysis of diagnostic data is to assess howconfident we can be about the test characteristics as observed in ourpatients. This may sound strange because an observed proportion, forexample the sensitivity of renography in Table 7.2 of 71%, is a fact.However, it is unlikely that we will again find exactly 71% for sensitivity ina new series of 437 similar patients, and an indication of the limits of whatcan reasonably be expected is therefore important (even when the samepatients would have been re-examined in the same or another setting, otherdata will be obtained because of inter- and intraobserver variability).
The statistical method for analysing the variability in estimates ofsensitivity, and of all other probability estimates that we will discuss, isconfidence intervals. The probability level of the confidence interval can bechosen. A higher level of confidence corresponds to a larger interval in termsof number of percentiles covered. Throughout the chapter, we will –conventionally – work with 95% confidence intervals. The interpretation ofa 95% confidence interval for an observed proportion, that is, a probabilityestimate, is as follows: when the data sampling is repeated many times, the95% confidence interval calculated from each sample will, on average,contain the “true” value of the proportion in 95% of the samples.Variabilityin sensitivity estimates is illustrated in Table 7.4. In part(a) of this table, the100 stenosis patients of our study are subdivided into four groups of 25consecutive patients. It is seen that the four subgroup sensitivities rangeenormously, from 48% to 88% (tables and formulae for the confidenceinterval will be discussed later). Part(b) illustrates what sensitivities we would
ANALYSING THE ACCURACY OF DIAGNOSTIC TESTS
121
Andre_Chap07.qxd 11/6/01 3:01 PM Page 121

THE EVIDENCE BASE OF CLINICAL DIAGNOSIS
122
Table 7.4 Analysis of diagnostic data of patients with possible renal artery stenosis(RAS): confidence intervals for sensitivity of renography in diagnosing RAS; (a)variability in sensitivity between equal numbers of RAS patients, and (b) smallerconfidence intervals with larger sample size, as cumulated during the study.
TP ND� Sensitivity 95% Confidence interval
(a) 18 25 0.72 0.51–0.8822 25 0.88 0.69–0.9719 25 0.76 0.55–0.9112 25 0.48 0.28–0.69
(b) 3 5 0.60 0.15–0.957 10 0.70 0.35–0.93
18 25 0.72 0.51–0.8840 50 0.80 0.66–0.9071 100 0.71 0.61–0.80
Table 7.5 Confidence interval for the 71% (71 out of 100) sensitivity estimate ofrenography in diagnosing RAS, for different confidence levels.
Confidence level (%) Confidence interval (%)
50 67–7467 66–7680 64–7790 63–7895 61–8099 58–8299.9 54–84
have obtained if we had finished the study earlier, that is, after observing thefirst 5, 10, 25, 50 and 100 stenosis patients of the present study.
As you see from Table 7.4(a), the 95% confidence intervals of thehighest and lowest estimates of sensitivity of 0.88 and 0.48 just touch eachother. Table 7.4(b) shows that the width and the confidence intervalbecome smaller with increasing sample size, as you would expect. Forconfidence intervals, and more generally for the accuracy of statisticalestimates, the square root rule applies: when one makes the sample size Atimes as large, the confidence interval will be a factor �A smaller. Forexample, for a two-times smaller confidence interval one needs four timesas many patients. You can check the (approximate) validity of the squareroot rule in Table 7.4(b).
The confidence interval for the 71% sensitivity estimate for the totalstudy runs from 61% to 80% (bottom line in Table 7.4). Table 7.5 givesconfidence intervals for a number of confidence levels, with wider intervalsfor higher levels.
For the specificity of renography in diagnosing RAS we get the followingconfidence interval around the 90% estimate for the total number of 337non-diseased subjects: from 87% to 93%. As you can see, the confidence
Andre_Chap07.qxd 11/6/01 3:01 PM Page 122

interval is roughly half the size of the confidence interval for the sensitivity,which reflects about four times as high the number of observations onwhich the estimate is based (square root rule!).
Some theory and a guide to the tables in the appendix
The theory of calculating confidence intervals for proportions is basedon the binomial distribution and requires complicated calculations. Ingeneral, the confidence interval is asymmetrical around the point estimateof the sensitivity, because of the “floor” and “ceiling” effects implied by thelimits of 0 and 1 to any probability.
Fortunately, when the numbers are not small the 95% confidenceinterval becomes approximately symmetrical and the upper, and lowerlimits can be calculated by adding or substracting 1.96 � standard error,with the standard error calculated by:
where p̂ stands for the proportion or probability estimate, and N for thenumber of observations on which the proportion is based (in practice,multiplication by 2 instead of the more tedious 1.96 works well).
For other confidence levels, the multiplication factor 1.96 should bereplaced by other values (see Appendix A.3).
Appendix Tables A.1 and A.2 give confidence levels for situations withsmall sample sizes where you need the tedious binomial calculations.Table A.3 gives the confidence interval for a number of situations in whichthe above formula for the standard error works well. In cases not coveredby the tables, the standard error can be calculated using the formula. Thereader can now verify the correctness of the confidence intervals presentedin this section.
Positive and negative predictive value:pre- and post-test probability of disease
The positive predictive value (PPV) is the probability that the patient hasthe disease when the test result is positive. This “post-test probability” iseasily derived from Table 7.2. For the probability of RAS in case ofabnormal renography, it is:
PPV � P(D�|T�) � TP/NT� � 71/104 � 68%
The confidence interval (CI) can be estimated using the formula on page 137or Table A.3.: the 95% confidence interval for PPV runs from 59% to 77%.
The negative predictive value (NPV), that is, the probability that thepatient has the disease if the test result is negative, translates in our case to
2p̂(1 � p̂)>N
ANALYSING THE ACCURACY OF DIAGNOSTIC TESTS
123
Andre_Chap07.qxd 11/6/01 3:01 PM Page 123

the probability of no stenosis in case of normal renography. We get:
NPV � P(D�|T�) � TN/NT� � 304/333 � 91%
with 95% CI from 88% to 94% (see Table A.3).The probabilities of no stenosis for an abnormal renogram and of
stenosis for a normal renogram, and their CIs, are obtained as 100% minusPPV and 100% minus NPV, respectively because the probabilities ofstenosis and no stenosis have to add up to 100%:
P(D�|T�) � 1�P(D�|T�) � 32% (95% CI: 23% to 41%)P(D�|T�) � 1�P(D�|T�) � 9% (95% CI: 6% to 12%)
The PPV and NPV are post-test probabilities, that is, they are the updatedprobabilities given the information provided by the positive and negativetest results, respectively. Before the test, we have the pretest probabilities ofpresence and absence of disease, which for our RAS example are:
P(D�) � 100/437� 23% (95% CI: 19% to 27%)P(D�) � 337/437� 77% (95% CI: 73% to 81%)
The magnitude of the change from pre- to post-test probability reflectsthe informativeness of the diagnostic test result. In our case, the pretestprobability of stenosis of 23% changes to 68% in case of an abnormalrenogram, and to 9% in case of a normal renogram.
Error rate
How well does our diagnostic test discriminate between patients withand without stenosis, or, more generally, how well does the testdiscriminate between the two disease categories? So far we have onlylooked at partial measures of performance, such as sensitivity, specificity,and predictive values. None of these concepts on its own gives anassessment of the performance of the test.
The most straightforward measure expresses how many errors we makewhen we diagnose patients with an abnormal test result as diseased, andthose with a normal test result as non-diseased. This concept is known asthe error rate. For our example, the error rate is easily calculated fromTable 7.1.There are 29 false negative results, as the test was negative whenstenosis was present, and 33 false positive results, with the test beingabnormal when there was no stenosis. Thus, in total there are 62 errors,from a total of 437 patients.
This gives the following calculations for the error rate and its confidenceinterval, the latter being derived from Table A.3 (the closest entry is 60 out
THE EVIDENCE BASE OF CLINICAL DIAGNOSIS
124
Andre_Chap07.qxd 11/6/01 3:01 PM Page 124

of 500, with a half-CI size of 0.028; interpolation to 70 and 300 shows that� 3% is indeed the correct CI):
Error rate(ER) � 62/437� 14% (95% CI: 11% to 17%)
The error rate is a weighted average of errors among persons with thedisease (the false negatives) and among those without the disease (the falsepositives), as is seen from the following equation:
ER � P(T�|D�) � P(D�)� P(T�|D�) � P(D�)
For our stenosis example we can easily verify this expression for the errorrate:
ER � (29/100) � (100/437) � (33/337) � (337/437) � 62/437 �14%
The weights in this formula are 23%, being the pretest probability ofdisease, and 77% for the probability of no disease.
This equation enables us to investigate what the error rate would be if thepretest probability of disease were different. For example, if the pretestprobability of disease were 50% instead of 23%, the error rate would becalculated as:
ER � 29/100 � 0.5 � 33/337 � 0.5 � 19.4%
Using this formula we can speculate about the performance of the test insituations that differ from the original context (the assumption is that falsepositive and false negative rates do not change. This is unfortunately notalways valid; see Chapters 1, 2, and 6).
Information in a diagnostic test result:the likelihood ratio
The informative value, or weight of evidence, of a test result isdetermined by the frequency of occurrence of this result in patients withthe disease compared to those without the disease. If, for example, a certaintest result occurs twice as often in patients with the disease, this result givesan evidence factor of 2 in favour of the disease. If, on the other hand, a testresult occurs twice as often in patients without the disease, it gives anevidence factor of 2 in favour of non-disease, that is, a factor 2 against thedisease (or a factor 1/2 in favour of disease).
This important probability ratio is called the likelihood ratio (LR). Eachtest result X has its own likelihood ratio LR(X) � P(X|D�)/P(X|D�).
For dichotomous tests, we have only two test results, T� and T�, andtherefore also only two likelihood ratios:
the LR of a positive test result: LR(T�) � P(T�|D�)/P(T�|D�)� Se/(1�Sp)
ANALYSING THE ACCURACY OF DIAGNOSTIC TESTS
125
Andre_Chap07.qxd 11/6/01 3:01 PM Page 125

the LR of a negative test result: LR(T�) � P(T�|D�)/P(T�|D�)�(1�Se)/Sp
For our example of renal artery stenosis, we obtain the following valuesfor the likelihood ratio of an abnormal and a normal renogram,respectively:
LR (T�)� 0.71/0.10� 7.1 with 95% CI: 5.1 to 10.3LR (T�)� 0.29/0.90� 0.32 with 95% CI: 0.24 to 0.44.
Thus, an abnormal renogram provides a factor of 7 in favour of stenosis,whereas a normal renogram yields a factor of 3 (that is, 1/0.32) in favourof no stenosis.
The following approximate formula has been used to calculate the 95%confidence interval for the likelihood ratio:
in which p1 � P(X|D�) is based on sample size n1 and p2 � P(X|D�) onsample size n2.3
Diagnostic odds ratio
For a dichotomous test it is possible to summarise the associationbetween the test and the diagnosis (reference standard) presented in the 2 � 2table in one measure: the diagnostic odds ratio (OR), which is equivalentto the cross-product of the table. Looking at the example of renal arterystenosis (Table 7.2):
OR � (71/33) /(29/304)�(71 � 304)/(33 � 29)� 22.6,with 95% CI: 12.4 to 41.3
The OR is equivalent to the ratio of LR(T�) and LR(T�), as can beeasily checked in the table. The 95% confidence interval of the OR isprovided by the software recommended in the references with this chapter.
The advantage of the OR is that it summarises in one figure thediagnostic association in the whole table. However, this summary measuredoes not tell us the specific values of the likelihood ratios of the two testresults, nor those of sensitivity and specificity. These measures have to becalculated as described earlier.
Continuous tests, and their dichotomisation and trichotomisation
Another test for investigating the presence or absence of renal arterystenosis is the serum creatinine concentration. This test has a continuous
expaln
p1p2
�1.96B1 � p1p1n1
�1 � p2p2n2
b
THE EVIDENCE BASE OF CLINICAL DIAGNOSIS
126
Andre_Chap07.qxd 11/6/01 3:01 PM Page 126

range of possible test results. For analysis, results can best be grouped inclasses of sufficient size (Table 7.6). Each class has its own evidence for andagainst stenosis, as expressed in the likelihood ratio.
The theory thus far has concerned only dichotomous tests, but thespecific concepts for the dichotomous test situation can be translated intomore general concepts for tests with more categories. The probabilities ofobserving a test result for stenosis and non-stenosis patients are given inTable 7.6. The likelihood ratio is a concept linked to a specific test result,and so also applies to multicategory tests. For example, the likelihood ratiofor a test result in the category 61–70 micromol can be calculated as theratio of the likelihood of this test result in diseased and the likelihood of thisresult in non-diseased, that is: (4/100)/(36/337) � 0.37. As expected, thelikelihood ratio increases with higher serum creatinine levels. Theirregularity in this increasing trend in the 81–90 class reflects samplingvariation, and not an underlying biological phenomenon.
We will now analyse the relationship between the multicategory test ofserum creatinine described in Table 7.6 and its possible simplification to adichotomous test. Dichotomisation can take place at any category boundary.This is done in Table 7.7, which gives in each row the correspondingdichotomous test data. For example, based on a cut-off level of 80 thenumber of patients with and without stenosis over the value of 80 is 82 and215, respectively, resulting in a sensitivity of 82% and a specificity of 36%.Likelihood ratios can again be calculated, now for the two results of thedichotomised test. As can be seen, much information is lost by thedichotomisation. All results above and below the threshold are aggregated,and the likelihood ratio after dichotomisation becomes an average of thelikelihood ratios of the individual classes above and below this threshold.Also, the question of the choice of the cut-off value is a difficult one, especially
ANALYSING THE ACCURACY OF DIAGNOSTIC TESTS
127
Table 7.6 Probability of test results and diagnostic information of serumcreatinine concentration in relation to renal artery stenosis.
Serum creatinine Likelihood(micromol/l) Stenosis No stenosis All ratio (95% CI)
60 1 (1%) 19 (6%) 20 (5%) 0.18 (0.02–1.31)61–70 4 (4%) 36 (11%) 40 (9%) 0.37 (0.14–1.03)71–80 13 (13%) 67 (20%) 80 (18%) 0.65 (0.38–1.13)81–90 12 (12%) 71 (21%) 83 (19%) 0.57 (0.32–1.01)91–100 17 (17%) 71 (21%) 88 (20%) 0.81 (0.50–1.30)
101–110 15 (15%) 41 (12%) 56 (13%) 1.23 (0.71–2.13)111–120 7 (7%) 10 (3%) 17 (4%) 2.33 (0.92–6.04)121–130 9 (9%) 9 (3%) 18 (4%) 3.33 (1.37–8.26)131–150 11 (11%) 8 (2%) 19 (4%) 4.58 (1.92–11.20)�150 11 (11%) 5 (1%) 16 (4%) 7.33 (2.64–20.84)
All 100 (100%) 337 (100%) 437 (100%)
Andre_Chap07.qxd 11/6/01 3:01 PM Page 127

when patients require a different amount of evidence in deciding for oragainst a certain further action. In our case, it could well be that somepatients with a history that more clearly corroborates renal artery stenosisonly need limited further evidence in order to decide for surgicalintervention, whereas others need high likelihood ratios for the same decision.
The sensitivity–specificity pairs obtained for different cut-off values canbe connected in a graph, yielding the so-called ROC curve (Figure 7.1).Themore the ROC curve moves toward the left upper corner, which representsa perfect dichotomous test with 100% sensitivity and 100% specificity, thebetter the test is. The steepness of the slope between two adjoining cut-offpoints represents the likelihood ratio of an observation falling in betweenthese two points. This is shown in Figure 7.2. The likelihood ratios inFigure 7.2 are the same as those in Table 7.6.
A measure of performance for the test is the area under the ROC curve.4
This varies between 0.5 for a totally uninformative test with a likelihoodratio of 1 for all its cut-off values (the diagonal of Figure 7.1), and 1 for atest that perfectly separates diseased and non-diseased (Se�Sp�1.0). Theserum creatinine has an area under the curve of 0.70 for differentiatingbetween stenosis and non-stenosis patients.The interpretation of the valueof 0.70 is as follows. Consider the hypothetical situation that two patients,drawn randomly from the stenosis patients and the non-stenosis patientsrespectively, are subjected to the serum creatinine test. If the test results areused to guess which of the two is the stenosis patient, the test will be right70% of the time. The confidence interval can be calculated using acomputer program (see software references).
If a continuous test such as serum creatinine has to be summarised in afew classes for further condensation of the results or for further decision
THE EVIDENCE BASE OF CLINICAL DIAGNOSIS
128
Table 7.7 Probability of test results and diagnostic information of dichotomisedserum creatinine concentration values for nine possible cut-offs between high andlow values.
Serum creatinine Stenosis No stenosis(Micromol) Se 1 � Sp All LR� LR�
�60 99 (99%) 318 (94%) 417 (95%) 1.05 0.18�70 95 (95%) 282 (84%) 377 (81%) 1.14 0.31�80 82 (82%) 215 (64%) 297 (68%) 1.29 0.50�90 70 (70%) 144 (43%) 114 (49%) 1.64 0.52�100 53 (53%) 73 (22%) 126 (29%) 2.44 0.60�110 38 (38%) 32 (9%) 70 (16%) 4.00 0.69�120 31 (31%) 22 (7%) 53 (12%) 4.77 0.74�130 22 (22%) 13 (4%) 35 (8%) 5.64 0.81�150 11 (11%) 5 (1%) 16 (4%) 7.33 0.90
Total 100 (100%) 337 (100%) 437 (100%)
Andre_Chap07.qxd 11/6/01 3:01 PM Page 128
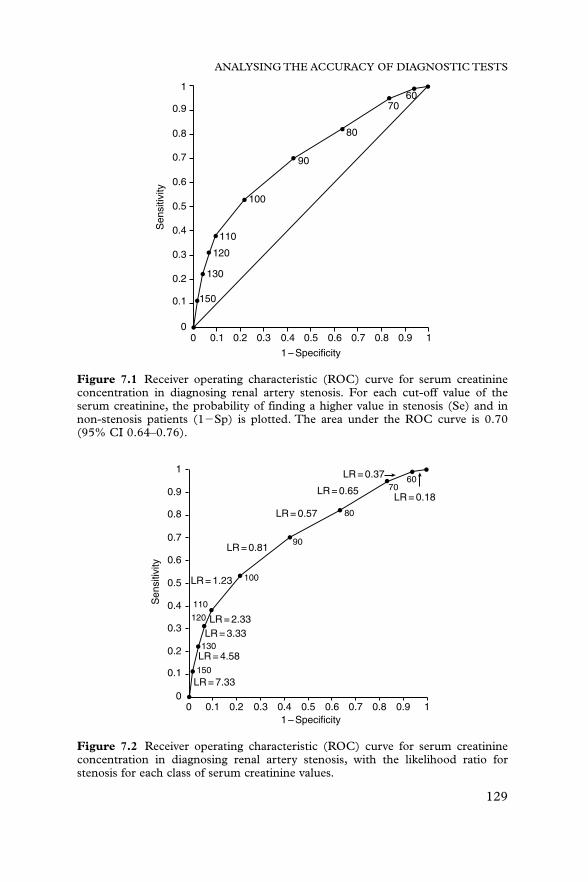
ANALYSING THE ACCURACY OF DIAGNOSTIC TESTS
129
1
0.9
0.8
0.7
0.6
0.5
Sen
sitiv
ity
0.4
0.3
0.2
0.1
00 0.1 0.2 0.3 0.4 0.5 0.6 0.7 0.8 0.9 1
150
130
120
110
100
90
80
7060
1 – Specificity
Figure 7.1 Receiver operating characteristic (ROC) curve for serum creatinineconcentration in diagnosing renal artery stenosis. For each cut-off value of theserum creatinine, the probability of finding a higher value in stenosis (Se) and innon-stenosis patients (1�Sp) is plotted. The area under the ROC curve is 0.70(95% CI 0.64–0.76).
1
0.9
0.8
0.7
0.6
0.5
Sen
sitiv
ity
0.4
0.3
0.2
0.1
00 0.1
LR = 7.33
LR = 4.58
LR = 3.33LR = 2.33
100
90
80
7060
110
LR = 1.23
LR = 0.81
LR = 0.57
LR = 0.65
LR = 0.37
LR = 0.18
120
130
150
0.2 0.3 0.4 0.51 – Specificity
0.6 0.7 0.8 0.9 1
Figure 7.2 Receiver operating characteristic (ROC) curve for serum creatinineconcentration in diagnosing renal artery stenosis, with the likelihood ratio forstenosis for each class of serum creatinine values.
Andre_Chap07.qxd 11/6/01 3:01 PM Page 129

making, it is often more useful to consider a trichotomisation than adichotomisation. In Table 7.8 we have divided the serum creatinine valueinto three classes, one for values giving a reasonable evidence for stenosis(likelihood ratio greater than 2.0), one for results giving reasonableevidence against stenosis (likelihood ratio smaller than 0.5), and anintermediate class for rather uninformative test results. It is seen that serumcreatinine gives informative test results in about 30% of patients, whereasthe test results are rather uninformative in the remaining 70%.
From pretest probability to post-test probability:Bayes’ theorem
The formula for calculating how the pretest probability changes under theinfluence of diagnostic evidence into a post-test probability is known asBayes’ theorem. In words, this is as follows:
“If disease was A times more probable than no disease before carrying out a certaintest, and if the observed test result is B times as probable in diseased as innon-diseased subjects, then the disease is (A � B) as probable compared to no diseaseafter the test.”
A, B and A � B are respectively the pretest odds, the likelihood ratio, andthe post-test odds, and a technical formulation of Bayes’ theorem istherefore: “post-test odds equals pretest odds times likelihood ratio”; and informula: O(X) � O � LR(X). An example: take the dichotomousrenography test (Table 7.2). The pretest odds (A) are 100:337, or 0.30.Assuming a positive test result, the likelihood ratio B equals 7.1. Bayes’theorem tells us now that the post-test odds of disease are 0.30 � 7.1 � 2.13.This corresponds to a probability of 2.13/(2.13 � 1) � 0.68, because of therelationship between probability P and odds O: O � P/(1�P), and thereforeP � O/(1 � O).
Another example: take the category 61–70 for serum creatinine (Table7.6) with a likelihood ratio of 0.37. In the post-test situation, stenosis is0.30 � 0.37 � 0.11 times as probable as no disease.This yields a probabilityof stenosis of 0.11/1.11 � 0.10.
THE EVIDENCE BASE OF CLINICAL DIAGNOSIS
130
Table 7.8 Probability of test results and diagnostic information of serumcreatinine concentration for a trichotomisation of the test results.
Serum creatinine Likelihood (Micromol/l) Stenosis No stenosis All ratio
70 5 (5%) 55 (16%) 60 (14%) 0.3171–110 57 (57%) 250 (74%) 307 (70%) 0.77�110 38 (38%) 32 (10%) 70 (16%) 4.00
All 100 (100%) 337 (100%) 437 (100%)
Andre_Chap07.qxd 11/6/01 3:01 PM Page 130

The formula of Bayes’ theorem for directly calculating the post-testprobability is as follows:
P(D�|X) �P(D�) � P(X|D�)
P(D�) � P(X|D�) � P(D�) � P(X|D�)
For dichotomous test we can express this formula in terms of sensitivity(Se) and specificity (Sp), and positive and negative predictive values (PPVand NPV), as can also be easily derived from the (2 � 2) Tables 7.2 and 7.3:
PPV �P(D�) � Se
andP(D�) � Se � P(D�)�(1 � Sp)
NPV �P(D�)�Sp
P(D�) � Sp � P(D�) � (1 � Se)
Figure 7.3 gives a graphical presentation of Bayes’ theorem and enablesyou to directly calculate the post-test probability from pretest probabilityand likelihood ratio.The two examples described earlier can be graphically
ANALYSING THE ACCURACY OF DIAGNOSTIC TESTS
131
1.0
0.9
0.8
0.7
0.6
0.5
Pos
t-te
st p
roba
bilit
y
0.4
0.3
0.2
0.1
0.00.0 0.1 0.2 0.3 0.4 0.5
Pretest probability
0.6 0.7 0.8 0.9 1.0
12864
3216
8
4
2
1
1/2
1/4
1/81/16
1/321/641/128
Figure 7.3Graphical presentation in which the result of Bayes’ theorem can beread for a number of likelihood ratios. Each curve represents one likelihood ratio.For example, a pretest probability of 0.7 and a likelihood ratio of 4 give rise to apost-test probability of about 0.90.
Andre_Chap07.qxd 11/6/01 3:01 PM Page 131

verified with a pretest probability of stenosis of 23%: a likelihood ratio of7.1 gives a post-test probability of 68%, and a likelihood ratio of 0.37 givesa post-test probability of 10% (these post-test probabilities can only beread approximately in the figure). For an alternative, nomogram type ofrepresentation of Bayes’ theorem, see Chapter 2, Figure 2.1.
Decision analytical approach of the optimal cut-off value
The error rate is a good measure of test performance, as it gives the numberof false positives and false negatives in relation to the total number ofdiagnostic judgements made. It should be realised that the error rateimplicitly assumes that false positives and false negatives have an equalweight. This may not be reasonable: for example a missed stenosis may bejudged as much more serious than a missed non-stenosis. Here we enter therealm of decision science, where the loss of wrong decisions is explicitlytaken into account. As an appetiser to decision analysis, look at Table 7.9.This is based on Table 7.7, but now with an indication of how many falsepositives are additionally avoided and how many additional false negativesare induced by increasing the threshold between positive and negative(“cut-off”) with one class of serum creatinine values at a time.
With the (uninteresting) cut-off value of 0, we would have 337 falsepositives (FP) and 0 false negatives (FN). Increasing the threshold from 0to 60 would decrease the FP by 19 and increase the FN by 1. A shift from60 to 70 would decrease the FP by 36 and increase the FN by four, and soon, until the last step in cut-off from 150 to “very high” serum creatinine
THE EVIDENCE BASE OF CLINICAL DIAGNOSIS
132
Table 7.9 Decrease in false positives and increase in false negatives whenincreasing the cut-off between high and low serum creatinine values by one class ata time. Eleven possible cut-offs are considered.
FP decrease:Serum creatinine FN increase Approximate(micromol/l) No stenosis Stenosis per step trade-off
�0 337 100 337:0�60 318 99 19:1 20:1�70 282 95 36:4 10:1�80 215 82 67:13 5:1�90 144 70 71:12 5:1�100 73 53 71:17 5:1�110 32 38 41:15 3:1�120 22 31 10:7 1:1�130 13 22 9:9 1:1�150 5 11 8:11 1:1“Very high” 0 0 5:11 1:2
Total 337 100
Andre_Chap07.qxd 11/6/01 3:01 PM Page 132
values, by which the last five FP are prevented but also the last 11 stenosispatients are turned into FN.
One can derive the optimal cut-off from the relative importance of falsepositives and false negatives. For example, if one false positive is judged tobe four times more serious than a false negative, a good cut-off would be100, because all shifts in cut-off between 0 and 100 involve a trade-off of atleast five FN to one FP, which is better than the 4 : 1 judgement on therelative seriousness of the two types of error. A further shift from 100 to 110is not indicated because the associated trade-off is three FN or less to oneFP or more, which is worse than the 4 : 1 judgement. Note that for differentpretest values of stenosis the FN : FP trade-offs will change, and thereforealso the optimal threshold. For example, if the pretest probability were twotimes higher, the threshold would shift to 60 (calculations not shown).
For a further study of decision analytical considerations, the reader isreferred to Sox et al.5
Sensitivity analysis
In a sensitivity analysis we look at what would have happened to ourconclusions in case of other, but plausible, assumptions. This is importantfor getting a feeling for the stability of the conclusions.
We saw an example of a sensitivity analysis in our discussion of the errorrate, when we looked what the error rate would have been if the pretestprobability of stenosis had been different from the 30% in the study.
Sensitivity analysis could also be conducted using Figure 7.3, thegraphical representation of Bayes’ theorem. Using the confidence intervalsfor the pretest probability and for the likelihood ratio, we can assess theassociated uncertainty in the post-test probability. For example, when wehave a confidence interval for the pretest probability between 0.5 and 0.7,and a confidence interval for the likelihood ratio of our test results between4 and 8, Figure 7.3 tells us that values for the post-test probability between0.8 and 0.95 are possible.
A third type of sensitivity analysis could be done using the relativeseriousness of false positive and false negative results by checking how thethreshold between positive and negative test results will shift when differentvalues for this relative seriousness are considered.
“Many” diagnostic tests: logistic regression
The analysis of many diagnostic tests is more complicated than the analysisof a single diagnostic test.There is, however, a standard statistical method,logistic regression, that can be applied in this situation. It is a generalmethod for the analysis of binary data, such as the presence or absence of
ANALYSING THE ACCURACY OF DIAGNOSTIC TESTS
133
Andre_Chap07.qxd 11/6/01 3:01 PM Page 133

disease.6 It is best seen as a generalised form of Bayes’ theorem, using alogarithmic transformation, in order to have an additive instead of amultiplicative formula. Thus “post-test odds equals pretest odds timeslikelihood ratio”, becomes, after taking the logarithm, “log post-test oddsequals log pretest odds plus log likelihood ratio”. Or, in formula form, withthe L indicating “logarithm”:
O(X)� O � LR becomes LO(X) � LO � LLR(X)
The similar generalised formula of logistic regression is as follows: the logodds of disease, (also called logit (LO)), given test results X1, X2, … Xk, isa linear function of the test results:
LO(X1, X2, … Xk) � b0 � b1X1 � b2X2 � … � bkXk
Usually, the natural logarithm (Ln) is used, as we will do in theremainder of this section.We will illustrate logistic regression by applying itto a single dichotomous test, because in such a case calculations are easilydone by hand. We take again the renography test for renal artery stenosis,the results of which were depicted in Table 7.2.
We start with the situation prior to performing the test: our best estimateof stenosis is then the prior or pretest probability, based on the observationthat we have 100 patients with and 337 patients without stenosis. Thelogistic formula in this case LnO� b0, and contains only a constant b0,because no tests have been performed yet. Thus b0, the Ln pretest odds,which in this case is Ln (100/337) � �1.21.
Next the renography test is performed.The test result is coded as X1 � 0(normal) or X1 � 1 (abnormal), and the logistic formula is LnO(X1) � b0�b1X1. We will derive the coefficients b0 and b1 by applying the log oddsform of Bayes’ theorem to both the normal and the abnormal test results.The logistic formula follows immediately from the results.
In case of a normal renogram (X1�0) there are 29 patients with and 304patients without stenosis in Table 7.2. Bayes’ theorem tells that the log oddson stenosis for result X1�0, LnO(X1 � 0) � Ln(29/304) � �2.35, equalsthe Ln pretest odds of �1.21 plus the Ln likelihood ratio of a normalrenogram, which is �1.14.
In case of an abnormal renogram (X1 � 1) there are 71 patients with and33 patients without stenosis, and LnO(X1 � 1)� Ln(71/33) � 0.77, beingthe Ln pretest odds of �1.21 plus the Ln likelihood ratio 1.98 of anabnormal renogram. Combining the two applications of Bayes’ theorem,we get:
LnO(X1) � �1.21 � 1.14 (when X1 � 0) � 1.98 (when X1 � 1).
This can be simplified to the logistic formula:
LnO(X1) � b0 � b1X1 � �2.35 � 3.12 X1.
THE EVIDENCE BASE OF CLINICAL DIAGNOSIS
134
Andre_Chap07.qxd 11/6/01 3:01 PM Page 134

Two remarks can be made: the coefficient b1 (3.12) is precisely the Ln ofthe diagnostic odds ratio (22.6) of renography discussed earlier. And b0 inthe logistic formula can no longer be interpreted as a pretest log odds ofstenosis, but as the LnO(X1�0). This completes the logistic regressionanalysis of one dichotomous test.
When more than one test is involved the calculations are extensions ofthe described single test situation, using the multiple logistic regressionformula:
Ln(X1, X2, … Xk) � b0 � b1X1 � b2X2 � … � bkXk
Using this approach, the investigator can account for dependency andinteraction between the various tests.7 However, such multivariatecalculations are very troublesome to do by hand. In general, when manytests, including continuous tests, are involved, standard statistical softwaresuch as SPSS, SAS or BMDP will have to be used. This software alsoprovides 95% confidence intervals for b0, b1, b2, … bk, and thecorresponding odds ratios (eb).
From multiple logistic regression analysis one can not only learn aboutthe predictive value of a combination of tests, but also what a certain testadds to other tests that have already been performed.
Concluding remarks
In this chapter we have given an overview of the most importantperformance measures of diagnostic tests, illustrated with a clinicalexample. Also, the estimation of confidence intervals to account forsampling variability has been explained. Furthermore, decision analyticalconsiderations and sensitivity analysis, as methods to deal with valuejudgements and uncertainties, have been introduced. Finally, the principlesof logistic regression to analyse the predictive value of multiple tests, whenapplied simultaneously, have been outlined.
In applying the presented analysis techniques it is presupposed that theresearch data have been collected with the avoidance of important bias(affecting internal validity) and with acceptable generalisability to the targetpopulation where the diagnostic test(s) are to be applied (external validity).These issues regarding the validity of the study design are dealt with inChapters 1–6. As a general rule, in the analysis phase one cannot correct forshortcomings of the validity of the study design, such as bias resulting froman unclear or inappropriate process of selection of study subjects, or from aninadequate reference standard. However, if potential factors that may affecttest performance are measured during the study, these can be included asindependent covariables in the analysis. An example may be age as apotential effect modifier of the performance of renography. The potentialinfluence of other possible biases can be explored using sensitivity analysis.
ANALYSING THE ACCURACY OF DIAGNOSTIC TESTS
135
Andre_Chap07.qxd 11/6/01 3:01 PM Page 135

In the past decade, new data analytical challenges have resulted from theneed to synthesise a number of studies and to analyse the pooled data ofthose studies (meta-analysis). Also, in such a pooled analysis the usualperformance measures of diagnostic tests can be assessed, as is shown inChapter 8. Finally, although it is always the aim to minimise the number oflost outcomes or not-performed tests, in most studies these will not betotally avoided. Although associated methodological problems arediscussed in Chapter 2, there are various options for the analyticalapproach to such “missing values” on which professional biostatisticianscan give advice.
References
1 Altman DG, Machin D, Bryant TN, Gardner MJ. Statistics with confidence, 2nd edn.London: BMJ Books, 2000 (includes software).
2 Sackett DL, Haynes PB, Tugwell P. Clinical epidemiology: a basic science for clinical medicine.Boston: Little, Brown and Co, 1985.
3 Simel DL, Samsa GP, Matchar DB. Likelihood ratios with confidence: sample sizeestimation for diagnostic test studies. J Clin Epidemiol 1991;44:763–70.
4 Hanley JA, McNeil BJ. The meaning and use of the area under a receiver operatingcharacteristic (ROC) curve. Radiology 1982;143:29–36.
5 Sox HC Jr, Blatt MA, Higgins MC, Marton KI. Medical decision making. Stoneham, MA:Butterworths, 1988.
6 Hosmer DW, Lemeshow S. Applied logistic regression. New York: Wiley, 1989.7 Knottnerus JA. Application of logistic regression to the analysis of diagnostic data: exact
modeling of a probability tree of multiple binary variables. Med Decision Making1992;12:93–108.
Software● For the analysis of test results, including logistic regression for single and multiple tests and
confidence intervals for the diagnostic odds ratio, standard statistical software such asSPSS, SAS or BMDP may be used. In SPSS and SAS analysis of the area under the ROCcurve (plus confidence intervals) can be performed.
● Visual Bayes is a freely available program introducing basic methods for the interpretationand validation of diagnostic tests in an intuitive way. It may be downloaded fromhttp://www.imbi.uni-freiburg.de/medinf.
● Treeage-DATA is a decision analysis program in which diagnostic tests and subsequenttreatment decisions can be represented. Good opportunities for sensitivity analysis.
Appendix: Tables for confidence intervals for proportionsTable A.1–A.2 Exact confidence intervals for proportions based on small N (Table A.1) oron small n (Table A.2).
Table A.3 Half 95% confidence intervals for proportions.
For all tables N � number of observations (denominator), n � number of successes(numerator).
Table A.1 Example: In a group of five patients with renal artery stenosis, three were positiveon diagnostic renography.The estimated sensitivity of renography is therefore 3/5, that is, 0.6with 95% confidence interval (0.15–0.95).
THE EVIDENCE BASE OF CLINICAL DIAGNOSIS
136
Andre_Chap07.qxd 11/6/01 3:01 PM Page 136

Table A.2 Exact confidence intervals for small n. Because the binomial distribution issymmetric around p � 0.5, the table can also be used for small values of N-n: when using N-n instead of n the resulting confidence interval changes to (1�upper limit, 1�lower limit).
Example for small n: A new screening test for a disease is required to have a very low falsepositive rate that is, high specificity. In a sample of 200 proven non-diseased subjects only onehad a positive test result. The false positive rate is estimated at 1/200 � 0.005 and the exact95% confidence interval is (0.000–0.028)
Example for small N-n: In the previous example we can estimate the specificity as199/200 � 0.995, with 95% confidence interval (0.972–1.000).
Table A.3 The half 95% confidence interval for proportions, based on the normalapproximation to the binomial distribution for large numbers of observations. With thisapproximation, the half 95% confidence interval for a proportion p̂ � n/N is 1.96 � SE, withSE being the standard error.The 95% confidence interval is constructed by subtracting (lowerconfidence limit) or adding (upper confidence limit) the number from the table to theestimate p. By symmetry the values for n and for N-n are the same.When the values of n andN are not given directly in the table, linear interpolation for n and/or N may be used.
ExampleIn a group of 333 patients with a negative renography, 29 nevertheless appeared to suffer
from renal artery stenosis. The estimated negative predictive value (NPV) of renography istherefore (333–29)/333, that is, 0.91.
The value from the table is required for N � 333 and N-n � 29.We use linear interpolationfor N. At N � 300, the table gives a value of 0.0335 and at N � 500 the value is 0.0205, forn � 29, taking the averages of the values for n � 28 and 30.
Linear interpolation at N � 333 requires:({Value at N � 333} � 0.0355) : (0.0205 � 0.0335) � (333 � 300) : (500 � 300). Thus {Valueat N � 333} � 0.03.The 95% confidence interval becomes (0.91 – 0.03, 0.91 � 0.03) � (0.88 � 0.94).
Note 1Instead of interpolation, the formula for SE could have been used directly:
Multiplying by 1.96 gives a value of 0.03 for the half 95% confidence interval.
Note 2For other levels of confidence the numbers in Table A.3 have to be multiplied by a factor.
The following table gives multiplication factors for a few commonly used levels of confidence:
SE � B p̂(1 � p̂)
N, giving SE �R 304
333a1 �
29333b
333� 0.0154
ANALYSING THE ACCURACY OF DIAGNOSTIC TESTS
137
Confidence level (%) Multiplication factor
50 0.3467 0.4980 0.6590 0.8495 199 1.3199.9 1.68
Andre_Chap07.qxd 11/6/01 3:01 PM Page 137

THE EVIDENCE BASE OF CLINICAL DIAGNOSIS
138
0 0 0.00 0.781 0.5 0.01 0.992 1 0.22 1.00
[N � 3]
0 0 0.00 0.631 0.33 0.01 0.912 0.67 0.09 0.993 1 0.37 1.00
[N � 4]
0 0 0.00 0.531 0.25 0.01 0.812 0.5 0.07 0.933 0.75 0.19 0.994 1 0.47 1.00
[N � 5]
0 0 0.00 0.451 0.2 0.01 0.722 0.4 0.05 0.853 0.6 0.15 0.954 0.8 0.28 0.995 1 0.55 1.00
[N � 6]
0 0 0.00 0.391 0.17 0.00 0.642 0.33 0.04 0.783 0.5 0.12 0.884 0.67 0.22 0.965 0.83 0.36 1.006 1 0.61 1.00
[N � 7]
0 0 0.00 0.351 0.14 0.00 0.582 0.29 0.04 0.713 0.43 0.10 0.824 0.57 0.18 0.905 0.71 0.29 0.966 0.86 0.42 1.007 1 0.65 1.00
[N � 8]
0 0 0.00 0.311 0.13 0.00 0.532 0.25 0.03 0.65
3 0.38 0.09 0.764 0.5 0.16 0.845 0.63 0.24 0.916 0.75 0.35 0.977 0.88 0.47 1.008 1 0.69 1.00
N � 9
0 0 0.00 0.281 0.11 0.00 0.482 0.22 0.03 0.603 0.33 0.07 0.704 0.44 0.14 0.795 0.56 0.21 0.866 0.67 0.30 0.937 0.78 0.40 0.978 0.89 0.52 1.009 1 0.72 1.00
N � 10
0 0 0.00 0.261 0.1 0.00 0.452 0.2 0.03 0.563 0.3 0.07 0.654 0.4 0.12 0.745 0.5 0.19 0.816 0.6 0.26 0.887 0.7 0.35 0.938 0.8 0.44 0.979 0.9 0.55 1.00
10 1 0.74 1.00
N � 11
0 0 0.00 0.241 0.09 0.00 0.412 0.18 0.02 0.523 0.27 0.06 0.614 0.36 0.11 0.695 0.45 0.17 0.776 0.55 0.23 0.837 0.64 0.31 0.898 0.73 0.39 0.949 0.82 0.48 0.98
10 0.91 0.59 1.0011 1 0.76 1.00
N � 12
0 0 0.00 0.221 0.08 0.00 0.38
2 0.17 0.02 0.483 0.25 0.05 0.574 0.33 0.10 0.655 0.42 0.15 0.726 0.5 0.21 0.797 0.58 0.28 0.858 0.67 0.35 0.909 0.75 0.43 0.95
10 0.83 0.52 0.9811 0.92 0.62 1.0012 1 0.78 1.00
N � 13
0 0 0.00 0.211 0.08 0.00 0.362 0.15 0.02 0.453 0.23 0.05 0.544 0.31 0.09 0.615 0.38 0.14 0.686 0.46 0.19 0.757 0.54 0.25 0.818 0.62 0.32 0.869 0.69 0.39 0.91
10 0.77 0.46 0.9511 0.85 0.55 0.9812 0.92 0.64 1.0013 1 0.79 1.00
N � 14
0 0 0.00 0.191 0.07 0.00 0.342 0.14 0.02 0.433 0.21 0.05 0.514 0.29 0.08 0.585 0.36 0.13 0.656 0.43 0.18 0.717 0.5 0.23 0.778 0.57 0.29 0.829 0.64 0.35 0.87
10 0.71 0.42 0.9211 0.79 0.49 0.9512 0.86 0.57 0.9813 0.93 0.66 1.0014 1 0.81 1.00
N � 15
0 0 0.00 0.181 0.07 0.00 0.322 0.13 0.02 0.403 0.2 0.04 0.48
Table A.1 Exact 95% confidence intervals for proportions n/N for N from 2 to 25
n p 95% CI n p 95% CI n p 95% CI
N�2 N�8(cont’d) N�12(cont’d)
Andre_Chap07.qxd 11/6/01 3:01 PM Page 138

ANALYSING THE ACCURACY OF DIAGNOSTIC TESTS
139
4 0.27 0.08 0.555 0.33 0.12 0.626 0.4 0.16 0.687 0.47 0.21 0.738 0.53 0.27 0.799 0.6 0.32 0.8410 0.67 0.38 0.8811 0.73 0.45 0.9212 0.8 0.52 0.9613 0.87 0.60 0.9814 0.93 0.68 1.0015 1 0.82 1.00
[N � 16]
0 0 0.00 0.171 0.06 0.00 0.302 0.13 0.02 0.383 0.19 0.04 0.464 0.25 0.07 0.525 0.31 0.11 0.596 0.38 0.15 0.657 0.44 0.20 0.708 0.5 0.25 0.759 0.56 0.30 0.8010 0.63 0.35 0.8511 0.69 0.41 0.8912 0.75 0.48 0.9313 0.81 0.54 0.9614 0.88 0.62 0.9815 0.94 0.70 1.0016 1 0.83 1.00
[N � 17]
0 0 0.00 0.161 0.06 0.00 0.292 0.12 0.01 0.363 0.18 0.04 0.434 0.24 0.07 0.505 0.29 0.10 0.566 0.35 0.14 0.627 0.41 0.18 0.678 0.47 0.23 0.729 0.53 0.28 0.7710 0.59 0.33 0.8211 0.65 0.38 0.8612 0.71 0.44 0.9013 0.76 0.50 0.9314 0.82 0.57 0.9615 0.88 0.64 0.9916 0.94 0.71 1.0017 1 0.84 1.00
0 0 0.00 0.151 0.06 0.00 0.272 0.11 0.01 0.353 0.17 0.04 0.414 0.22 0.06 0.485 0.28 0.10 0.536 0.33 0.13 0.597 0.39 0.17 0.648 0.44 0.22 0.699 0.5 0.26 0.74
10 0.56 0.31 0.7811 0.61 0.36 0.8312 0.67 0.41 0.8713 0.72 0.47 0.9014 0.78 0.52 0.9415 0.83 0.59 0.9616 0.89 0.65 0.9917 0.94 0.73 1.0018 1 0.85 1.00
N � 19
0 0 0.00 0.151 0.05 0.00 0.262 0.11 0.01 0.333 0.16 0.03 0.404 0.21 0.06 0.465 0.26 0.09 0.516 0.32 0.13 0.577 0.37 0.16 0.628 0.42 0.20 0.679 0.47 0.24 0.71
10 0.53 0.29 0.7611 0.58 0.33 0.8012 0.63 0.38 0.8413 0.68 0.43 0.8714 0.74 0.49 0.9115 0.79 0.54 0.9416 0.84 0.60 0.9717 0.89 0.67 0.9918 0.95 0.74 1.0019 1 0.85 1.00
N � 20
0 0 0.00 0.141 0.05 0.00 0.252 0.1 0.01 0.323 0.15 0.03 0.384 0.2 0.06 0.445 0.25 0.09 0.496 0.3 0.12 0.54
7 0.35 0.15 0.598 0.4 0.19 0.649 0.45 0.23 0.68
10 0.5 0.27 0.7311 0.55 0.32 0.7712 0.6 0.36 0.8113 0.65 0.41 0.8514 0.7 0.46 0.8815 0.75 0.51 0.9116 0.8 0.56 0.9417 0.85 0.62 0.9718 0.9 0.68 0.9919 0.95 0.75 1.0020 1 0.86 1.00
N � 21
0 0 0.00 0.131 0.05 0.00 0.242 0.1 0.01 0.303 0.14 0.03 0.364 0.19 0.05 0.425 0.24 0.08 0.476 0.29 0.11 0.527 0.33 0.15 0.578 0.38 0.18 0.629 0.43 0.22 0.66
10 0.48 0.26 0.7011 0.52 0.30 0.7412 0.57 0.34 0.7813 0.62 0.38 0.8214 0.67 0.43 0.8515 0.71 0.48 0.8916 0.76 0.53 0.9217 0.81 0.58 0.9518 0.86 0.64 0.9719 0.9 0.70 0.9920 0.95 0.76 1.0021 1 0.87 1.00
N � 22
0 0 0.00 0.131 0.05 0.00 0.232 0.09 0.01 0.293 0.14 0.03 0.354 0.18 0.05 0.405 0.23 0.08 0.456 0.27 0.11 0.507 0.32 0.14 0.558 0.36 0.17 0.599 0.41 0.21 0.64
10 0.45 0.24 0.68
Table A.1 Continued
n p 95% CI n p 95% CI n p 95% CI
N�15(cont’d) N�18 N�20(cont’d)
Andre_Chap07.qxd 11/6/01 3:01 PM Page 139

THE EVIDENCE BASE OF CLINICAL DIAGNOSIS
140
11 0.5 0.28 0.7212 0.55 0.32 0.7613 0.59 0.36 0.7914 0.64 0.41 0.8315 0.68 0.45 0.8616 0.73 0.50 0.8917 0.77 0.55 0.9218 0.82 0.60 0.9519 0.86 0.65 0.9720 0.91 0.71 0.9921 0.95 0.77 1.0022 1 0.87 1.00
[N � 23]
0 0 0.00 0.121 0.04 0.00 0.222 0.09 0.01 0.283 0.13 0.03 0.344 0.17 0.05 0.395 0.22 0.07 0.446 0.26 0.10 0.487 0.3 0.13 0.538 0.35 0.16 0.579 0.39 0.20 0.6110 0.43 0.23 0.6611 0.48 0.27 0.6912 0.52 0.31 0.7313 0.57 0.34 0.7714 0.61 0.39 0.8015 0.65 0.43 0.8416 0.7 0.47 0.87
17 0.74 0.52 0.9018 0.78 0.56 0.9319 0.83 0.61 0.9520 0.87 0.66 0.9721 0.91 0.72 0.9922 0.96 0.78 1.0023 1 0.88 1.00
N � 24
0 0 0.00 0.121 0.04 0.00 0.212 0.08 0.01 0.273 0.13 0.03 0.324 0.17 0.05 0.375 0.21 0.07 0.426 0.25 0.10 0.477 0.29 0.13 0.518 0.33 0.16 0.559 0.38 0.19 0.59
10 0.42 0.22 0.6311 0.46 0.26 0.6712 0.5 0.29 0.7113 0.54 0.33 0.7414 0.58 0.37 0.7815 0.63 0.41 0.8116 0.67 0.45 0.8417 0.71 0.49 0.8718 0.75 0.53 0.9019 0.79 0.58 0.9320 0.83 0.63 0.9521 0.88 0.68 0.97
22 0.92 0.73 0.9923 0.96 0.79 1.0024 1 0.88 1.00
N � 25
0 0 0.00 0.111 0.04 0.00 0.202 0.08 0.01 0.263 0.12 0.03 0.314 0.16 0.05 0.365 0.2 0.07 0.416 0.24 0.09 0.457 0.28 0.12 0.498 0.32 0.15 0.549 0.36 0.18 0.57
10 0.4 0.21 0.6111 0.44 0.24 0.6512 0.48 0.28 0.6913 0.52 0.31 0.7214 0.56 0.35 0.7615 0.6 0.39 0.7916 0.64 0.43 0.8217 0.68 0.46 0.8518 0.72 0.51 0.8819 0.76 0.55 0.9120 0.8 0.59 0.9321 0.84 0.64 0.9522 0.88 0.69 0.9723 0.92 0.74 0.9924 0.96 0.80 1.0025 1 0.89 1.00
Table A.1 Continued
n p 95% CI n p 95% CI n p 95% CI
N�22(cont’d) N�23(cont’d) N�24(cont’d)
Andre_Chap07.qxd 11/6/01 3:01 PM Page 140

Tab
le A
.2E
xact
95%
con
fide
nce
inte
rval
s fo
r pr
opor
tion
s n/
Nfo
r sm
all n
(0–7
) an
d N
�30
,35,
…,7
0,80
,90,
100,
120,
150,
200,
300,
500,
1000
,200
0.
n
01
23
45
67
N30
0.00
00.
095
0.00
10.
172
0.00
80.
221
0.02
10.
265
0.03
80.
307
0.05
60.
347
0.07
70.
386
0.09
90.
423
350.
000
0.08
20.
001
0.14
90.
007
0.19
20.
018
0.23
10.
032
0.26
70.
048
0.30
30.
066
0.33
60.
084
0.36
940
0.00
00.
072
0.00
10.
132
0.00
60.
169
0.01
60.
204
0.02
80.
237
0.04
20.
268
0.05
70.
298
0.07
30.
328
450.
000
0.06
40.
001
0.11
80.
005
0.15
10.
014
0.18
30.
025
0.21
20.
037
0.24
10.
051
0.26
80.
065
0.29
550
0.00
00.
058
0.00
10.
106
0.00
50.
137
0.01
30.
165
0.02
20.
192
0.03
30.
218
0.04
50.
243
0.05
80.
267
550.
000
0.05
30.
000
0.09
70.
004
0.12
50.
011
0.15
10.
020
0.17
60.
030
0.20
00.
041
0.22
20.
053
0.24
560
0.00
00.
049
0.00
00.
089
0.00
40.
115
0.01
00.
139
0.01
80.
162
0.02
80.
184
0.03
80.
205
0.04
80.
226
650.
000
0.04
50.
000
0.08
30.
004
0.10
70.
010
0.12
90.
017
0.15
00.
025
0.17
00.
035
0.19
00.
044
0.20
970
0.00
00.
042
0.00
00.
077
0.00
30.
099
0.00
90.
120
0.01
60.
140
0.02
40.
159
0.03
20.
177
0.04
10.
195
800.
000
0.03
70.
000
0.06
80.
003
0.08
70.
008
0.10
60.
014
0.12
30.
021
0.14
00.
028
0.15
60.
036
0.17
290
0.00
00.
033
0.00
00.
060
0.00
30.
078
0.00
70.
094
0.01
20.
110
0.01
80.
125
0.02
50.
139
0.03
20.
154
100
0.00
00.
030
0.00
00.
054
0.00
20.
070
0.00
60.
085
0.01
10.
099
0.01
60.
113
0.02
20.
126
0.02
90.
139
120
0.00
00.
025
0.00
00.
046
0.00
20.
059
0.00
50.
071
0.00
90.
083
0.01
40.
095
0.01
90.
106
0.02
40.
116
150
0.00
00.
020
0.00
00.
037
0.00
20.
047
0.00
40.
057
0.00
70.
067
0.01
10.
076
0.01
50.
085
0.01
90.
094
200
0.00
00.
015
0.00
00.
028
0.00
10.
036
0.00
30.
043
0.00
50.
050
0.00
80.
057
0.01
10.
064
0.01
40.
071
300
0.00
00.
010
0.00
00.
018
0.00
10.
024
0.00
20.
029
0.00
40.
034
0.00
50.
038
0.00
70.
043
0.00
90.
047
500
0.00
00.
006
0.00
00.
011
0.00
00.
014
0.00
10.
017
0.00
20.
020
0.00
30.
023
0.00
40.
026
0.00
60.
029
1000
0.00
00.
003
0.00
00.
006
0.00
00.
007
0.00
10.
009
0.00
10.
010
0.00
20.
012
0.00
20.
013
0.00
30.
014
2000
0.00
00.
001
0.00
00.
003
0.00
00.
004
0.00
00.
004
0.00
10.
005
0.00
10.
006
0.00
10.
007
0.00
10.
007
Andre_Chap07.qxd 11/6/01 3:01 PM Page 141

Tab
le A
.3H
alf
95%
con
fide
nce
inte
rval
s (�
1.96
�S
E)
of p
ropo
rtio
ns n
/Nfo
r N
�30
,35,
…,7
0,80
,90,
100,
120,
150,
200,
300,
500,
1000
,200
0.
N
3035
4045
5055
6065
7080
9010
012
015
020
030
050
010
0020
00
N�
n8
0.15
80.
139
0.12
40.
112
0.10
20.
093
0.08
60.
080
0.07
50.
066
0.05
90.
053
0.04
50.
036
0.02
70.
018
0.01
10.
006
0.00
39
0.16
40.
145
0.12
90.
117
0.10
60.
098
0.09
00.
084
0.07
80.
069
0.06
20.
056
0.04
70.
038
0.02
90.
019
0.01
20.
006
0.00
310
0.16
90.
150
0.13
40.
121
0.11
10.
102
0.09
40.
088
0.08
20.
072
0.06
50.
059
0.04
90.
040
0.03
00.
020
0.01
20.
006
0.00
311
0.17
20.
154
0.13
80.
126
0.11
50.
106
0.09
80.
091
0.08
50.
075
0.06
80.
061
0.05
20.
042
0.03
20.
021
0.01
30.
006
0.00
312
0.17
50.
157
0.14
20.
129
0.11
80.
109
0.10
10.
094
0.08
80.
078
0.07
00.
064
0.05
40.
043
0.03
30.
022
0.01
30.
007
0.00
313
0.17
70.
160
0.14
50.
132
0.12
20.
112
0.10
40.
097
0.09
10.
081
0.07
30.
066
0.05
60.
045
0.03
40.
023
0.01
40.
007
0.00
414
0.17
90.
162
0.14
80.
135
0.12
40.
115
0.10
70.
100
0.09
40.
083
0.07
50.
068
0.05
70.
047
0.03
50.
024
0.01
40.
007
0.00
415
0.17
90.
164
0.15
00.
138
0.12
70.
118
0.11
00.
102
0.09
60.
086
0.07
70.
070
0.05
90.
048
0.03
70.
025
0.01
50.
008
0.00
416
0.16
50.
152
0.14
00.
129
0.12
00.
112
0.10
50.
098
0.08
80.
079
0.07
20.
061
0.04
90.
038
0.02
50.
015
0.00
80.
004
170.
166
0.15
30.
142
0.13
10.
122
0.11
40.
107
0.10
00.
090
0.08
10.
074
0.06
20.
051
0.03
90.
026
0.01
60.
008
0.00
418
0.16
60.
154
0.14
30.
133
0.12
40.
116
0.10
90.
102
0.09
20.
083
0.07
50.
064
0.05
20.
040
0.02
70.
016
0.00
80.
004
190.
155
0.14
40.
135
0.12
60.
118
0.11
10.
104
0.09
30.
084
0.07
70.
065
0.05
30.
041
0.02
80.
017
0.00
80.
004
200.
155
0.14
50.
136
0.12
70.
119
0.11
20.
106
0.09
50.
086
0.07
80.
067
0.05
40.
042
0.02
80.
017
0.00
90.
004
220.
146
0.13
80.
129
0.12
20.
115
0.10
90.
098
0.08
90.
081
0.06
90.
057
0.04
30.
029
0.01
80.
009
0.00
524
0.13
80.
131
0.12
40.
117
0.11
10.
100
0.09
10.
084
0.07
20.
059
0.04
50.
031
0.01
90.
009
0.00
526
0.13
20.
125
0.11
90.
113
0.10
30.
094
0.08
60.
074
0.06
10.
047
0.03
20.
019
0.01
00.
005
280.
126
0.12
00.
115
0.10
50.
096
0.08
80.
076
0.06
20.
048
0.03
30.
020
0.01
00.
005
300.
127
0.12
10.
116
0.10
60.
097
0.09
00.
077
0.06
40.
049
0.03
40.
021
0.01
10.
005
320.
122
0.11
70.
107
0.09
90.
091
0.07
90.
066
0.05
10.
035
0.02
10.
011
0.00
534
0.11
70.
108
0.10
00.
093
0.08
10.
067
0.05
20.
036
0.02
20.
011
0.00
636
0.10
90.
101
0.09
40.
082
0.06
80.
053
0.03
70.
023
0.01
20.
006
Andre_Chap07.qxd 11/6/01 3:01 PM Page 142

380.
109
0.10
20.
095
0.08
30.
070
0.05
40.
038
0.02
30.
012
0.00
640
0.11
00.
103
0.09
60.
084
0.07
10.
055
0.03
80.
024
0.01
20.
006
450.
103
0.09
80.
087
0.07
30.
058
0.04
00.
025
0.01
30.
006
500.
098
0.08
80.
075
0.06
00.
042
0.02
60.
014
0.00
755
0.08
90.
077
0.06
20.
044
0.02
70.
014
0.00
760
0.08
90.
078
0.06
40.
045
0.02
80.
015
0.00
770
0.08
00.
066
0.04
80.
030
0.01
60.
008
800.
068
0.05
00.
032
0.01
70.
009
900.
069
0.05
20.
034
0.01
80.
009
100
0.06
90.
053
0.03
50.
019
0.01
012
00.
055
0.03
70.
020
0.01
014
00.
056
0.03
90.
022
0.01
116
00.
056
0.04
10.
023
0.01
218
00.
042
0.02
40.
013
200
0.04
30.
025
0.01
330
00.
028
0.01
640
00.
030
0.01
850
00.
031
0.01
910
000.
022
Andre_Chap07.qxd 11/6/01 3:01 PM Page 143

Andre_Chap07.qxd 11/6/01 3:01 PM Page 144

145
8 Guidelines forconducting systematicreviews of studiesevaluating the accuracy of diagnostic testsWALTER L DEVILLÉ, FRANK BUNTINXOn behalf of an ad hoc working group of the CochraneMethods Group on Screening and Diagnostic Tests*
Summary box
● A systematic review should include all available evidence, and so asystematic and comprehensive search of the literature is needed incomputerised databases and other sources.
● The search strategy must be based on an explicit description of thesubjects receiving the test of interest, the diagnostic test and itsaccuracy estimates, the target disease, and the study design. Theseelements can be specified in the criteria for inclusion of primarystudies in the review.
● Two independent reviewers should screen the titles and abstracts ofthe identified citations using specific prespecified inclusion criteria.In case of disagreement or insufficient information, a third reviewerand/or the full papers should be consulted. The publications to beevaluated should provide sufficient information on the referencestandard, the study population, and the setting(s) studied.
*Riekie de Vet, Jeroen Lijmer, Victor Montori
Andre_Chap08.qxd 11/6/01 3:02 PM Page 145

THE EVIDENCE BASE OF CLINICAL DIAGNOSIS
146
Introduction
Systematic reviews and meta-analyses of studies evaluating the accuracyof diagnostic tests (we will refer to them generically as diagnostic systematicreviews) are appearing more often in the medical literature.1,2 Of the 26reviews on diagnostic tests published between 1996 and 1997, 19 weresystematic reviews or meta-analyses.2 In the field of clinical chemistry andhaematology, 23 of 45 reviews published between 1985 and 1998 weresystematic reviews.3 Although guidelines for the critical appraisal ofdiagnostic research and meta-analyses have already been published,1,4–7
these may be difficult for clinical researchers to understand.We here present a set of practical guidelines, based on evidence and the
expertise of the Cochrane Collaboration, to facilitate the understanding ofand appropriate adherence to methodological principles when conductingdiagnostic systematic reviews.We reviewed reports of systematic searches ofthe literature for diagnostic research,8–11 methodological criteria toevaluate diagnostic research,1,4–7 methods for statistical pooling of data ondiagnostic accuracy,12–20 and methods for exploring heterogeneity.21–25
● The methodological quality of each selected paper should beassessed independently by at least two reviewers. Chance-adjustedagreement should be reported and disagreement solved byconsensus or arbitration. Internal and external validity criteria,describing participants, diagnostic test, and target disease ofinterest, and study methods can be used in meta-analysis to assessthe overall “level of evidence”, and in sensitivity and subgroupanalyses.
● Two reviewers should independently extract the requiredinformation from the primary studies, about the participants, thetesting procedure, the cut-off points used, exclusions, andindeterminate results.
● To be able to carry out subgroup analyses, sources of heterogeneityshould be defined based on a priori existing hypotheses.
● Whether meta-analysis with statistical pooling can be conducteddepends on the number and methodological quality of the primarystudies.
● In view of the low methodological quality of most publisheddiagnostic studies, the use of random effect models for pooling maybe useful, even if there is no apparent heterogeneity.
● Methods for statistical pooling of proportions, likelihood ratios,and ROC curves are provided.
Andre_Chap08.qxd 11/6/01 3:02 PM Page 146

Guidelines for conducting diagnostic systematic reviews are presented ina stepwise fashion and are followed by comments providing furtherinformation. Examples are given using the results of two systematic reviewson the accuracy of the urine dipstick in the diagnosis of urinary tractinfections,26 and on the accuracy of the straight-leg raising test in thediagnosis of intervertebral disc hernia.27
The guidelines
How to search the literature for studies evaluating the accuracy of diagnostic tests
A systematic review should include all available evidence, and so asystematic and comprehensive search of the literature is needed. Thereviewer has to design a search strategy based on a clear and explicitdescription of the subjects receiving the test of interest, the diagnostic testand its accuracy estimates, the target disease, and the study design. Theseelements are usually specified in the criteria for inclusion of primary studiesin the review. The search will include electronic literature databases.However, because computerised databases only index a subset of all theavailable literature, the search should be extended using other sources.9
The search to identify primary studies may take the following basic butlabour intensive steps:
1. A computer aided search of MEDLINE (PubMed website(http://www.ncbi.nlm.nih.gov/PUBMED), EMBASE and otherdatabases. A search strategy begins by creating a list of database specifickeywords and text words that describe the diagnostic test and the targetdisease of interest (subject specific strategy). Because the number ofdiagnostic accuracy studies is often small, the subject specific strategyusually yields a limited number of publications to be screened.10
An accurate search strategy for diagnostic publications (genericstrategy) was recently published11 and can be combined with the subjectspecific strategy if the number of publications resulting from the latteris large. We found a combination of two published generic strategiesadapted for use in PubMed (MEDLINE) to be more sensitive andprecise than previously published strategies8,10 (Box 8.1). Eachelectronic database will need to be searched using a specially designedsearch strategy.
2. The reference section of primary studies, narrative reviews, andsystematic reviews should be checked to search for additional primarystudies that could have been missed by the electronic search.Identification methods for systematic reviews have also beenpublished.28 The MEDION database, available at the University of
GUIDELINES FOR SYSTEMATIC REVIEWS
147
Andre_Chap08.qxd 11/6/01 3:02 PM Page 147

THE EVIDENCE BASE OF CLINICAL DIAGNOSIS
148
Maastricht, the Netherlands, collects some 250 published reviews ofdiagnostic and screening studies. It is available [email protected] and will shortly be published on theinternet.
3. Consultation of experts in the disease of interest to identify furtherpublished and unpublished primary studies. As diagnostic accuracystudies are often based on routinely collected data, publication bias maybe more prevalent in diagnostic than in therapeutic research.17
Box 8.1 Search strategy in PubMed (MEDLINE) forpublications about the evaluation of diagnostic accuracy
((((((((((((“sensitivity and specificity”[All Fields] OR “sensitivity andspecificity/standards”[All Fields]) OR “specificity”[All Fields]) OR“screening”[All Fields]) OR “false positive”[All Fields]) OR “falsenegative”[All Fields]) OR “accuracy”[All Fields]) OR ((((“predictivevalue”[All Fields] OR “predictive value of tests”[All Fields]) OR“predictive value of tests/standards”[All Fields]) OR “predictivevalues”[All Fields]) OR “predictive values of tests”[All Fields])) OR ((“reference value”[All Fields] OR “reference values”[AllFields]) OR “reference values/standards”[All Fields])) OR(((((((((((“roc”[All Fields] OR “roc analyses”[All Fields]) OR “rocanalysis”[All Fields]) OR “roc and”[All Fields]) OR “roc area”[AllFields]) OR “roc auc”[All Fields]) OR “roc characteristics”[AllFields]) OR “roc curve”[All Fields]) OR “roc curve method”[All Fields]) OR “roc curves”[All Fields]) OR “roc estimated”[AllFields]) OR “roc evaluation”[All Fields])) OR “likelihood ratio”[AllFields]) AND notpubref[sb]) AND “human”[MeSH Terms])
Comments
The first step in a literature search is the identification of relevantpublications. Diagnostic research reports – older publications in particular –are often poorly indexed in the electronic databases. It is often fruitful toconduct pilot searches using the subject specific strategy. This process isrepeated after identifying and incorporating additional keywords and textwords to describe and index the retrieved reports. Studies found only in thereference sections of the retrieved reports but missed by the search strategyshould be searched for in the database, using the article title or the firstauthor’s name. If a study is found in the database, its keywords should benoted and added to the strategy. Citation tracking may provide additional
Andre_Chap08.qxd 11/6/01 3:02 PM Page 148

studies. The Science Citation Index could be searched forward in time toidentify articles citing relevant publications.29 Once the search iscompleted, two independent reviewers should screen the titles andabstracts of the identified citations using specific prespecified inclusioncriteria. These can be pilot tested on a sample of articles. If disagreementscannot be resolved by consensus, or if insufficient information is available,a third reviewer and/or the full papers should be consulted.
Inclusion criteria
● Reference test The accuracy of a diagnostic or screening test should beevaluated by comparing its results with a “gold standard”, criterionstandard, or reference test accepted as the best available by content experts.The reference test may be a single test, a combination of different tests, orthe clinical follow up of patients.20 The publication should describe thereference test, as it is an essential prerequisite for the evaluation of adiagnostic test.
● Population Detailed information about the participants in diagnosticresearch is often lacking. Participants should be defined explicitly in termsof age, gender, complaints, signs, and symptoms, and their duration. Atleast a definition of participants with and without the disease, asdetermined by the reference test, should be available.The minimal numberof participants needed with and without the disease depends on the type ofstudy, the estimates of diagnostic accuracy, and the precision used toestimate these parameters.30
● Outcome data Information should be available to allow the constructionof the diagnostic 2 � 2 table with its four cells: true positives, falsenegatives, false positives and true negatives.
● Language If a review is limited to publications in certain languages,this should be reported.
Comments
As the patient mix (spectrum of disease severity) is different at differentlevels of care, a diagnostic review may focus on a specific setting (primarycare, etc.) or include all levels. This information may be important forsubgroup analyses in case of heterogeneity. All evidence available should bereviewed, regardless of the language of publication. It is not easy to identifynon-English publications, as they are often not indexed in computeriseddatabases. In the field of intervention research there is some evidence ofbias when excluding non-English publications.31 Our research on theaccuracy of the urine dipstick revealed differences in methodologicalvalidity between European and American studies, but these differences hadno effect on accuracy.
GUIDELINES FOR SYSTEMATIC REVIEWS
149
Andre_Chap08.qxd 11/6/01 3:02 PM Page 149

Although large samples are no guarantee against selection bias, smallsamples seldom result from a consecutive series of patients or a randomsample. Small studies are very vulnerable to selection bias.
Methodological quality
The methodological quality of each selected paper should be assessedindependently by at least two reviewers. Chance-adjusted agreement shouldbe reported, and disagreements solved by consensus or arbitration. Toimprove agreement, reviewers should pilot their quality assessment tools ina subset of included studies or studies evaluating a different diagnostic test.
Validity criteria for diagnostic research have been published by theCochrane Methods Group on Screening and Diagnostic Tests32
(http://www.som.fmc.flinders.edu.au/fusa/cochrane), and by other authors.4–6
Criteria assessing internal and external validity should be coded anddescribed explicitly in the review (Table 8.1). The internal validity criteriarefer to study characteristics that safeguard against the intrusion of systematicerror or bias. External validity criteria provide insight into the generalisabilityof the study and judge whether the test under evaluation was performedaccording to accepted standards. Internal and external validity criteria,describing participants, diagnostic test and target disease of interest, andstudy methods may be used in meta-analysis to assess the overall “level ofevidence” and in sensitivity and subgroup analyses (see Data extractionand Data analysis sections).
It is important to remember that studies may appear to be of poormethodological quality because they were either poorly conducted or poorlyreported. Methodological appraisal of the primary studies is frequentlyhindered by lack of information. In these instances reviewers may choose tocontact the studies’ authors, or to score items as “don’t know” or “unclear”.
Example A urine dipstick is usually read before the material is cultured. So,it can be interpreted that the dipstick was read without awareness of the results of the culture. However, the culture (reference test) may beinterpreted with full awareness of the results of the dipstick. If blinding isnot explicitly mentioned, reviewers may choose to score this item as “don’tknow” or “diagnostic test blinded for reference test” (implicitly scoring thereference test as not blinded). Or, the authors may be contacted forclarification.
A survey of the diagnostic literature from 1990 to 1993 in a number ofpeer-reviewed journals showed that only a minority of the studies satisfiedmethodological standards.7 There is some evidence that inadequatemethods may have an impact on the reported accuracy of a diagnostic test:Lijmer2 screened diagnostic meta-analyses published in 1996 and 1997,and showed that the diagnostic accuracy of a test was overestimated instudies (1) with a case–control design; (2) using different reference tests for
THE EVIDENCE BASE OF CLINICAL DIAGNOSIS
150
Andre_Chap08.qxd 11/6/01 3:02 PM Page 150

GUIDELINES FOR SYSTEMATIC REVIEWS
151
Table 8.1 Validity criteria operationalised for papers reporting on the accuracy ofurine dipsticks in the diagnosis of urinary tract infections (UTI) or bacteriuria.
Positive score
Criteria of internal validity (IV)1 Valid reference standard (Semi-)quantitative (2 points) to dipslide
culture (1 point)2 Definition of cut-off point for Definition of urinary tract infection/
reference standard bacteriuria by colony formingunits per ml (1 point)
3 Blind measurement of index test and In both directions (2 points) or only reference test index or reference test
4 Avoidance of verification bias Assessment by reference standardindependent from index testresults (1 point)
5 Index test interpreted independently Explicitly mentioned in the publication,of all clinical information or urine samples from mixed outpatient
populations examined in a generallaboratory (1 point)
6 Design Prospective (consecutive series) (1 point)or retrospective collection of data(0 points)
Criteria of external validity (EV)1 Spectrum of disease In- and/or exclusion criteria mentioned
(1 point)2 Setting Enough information to identify setting
(1 point)(community through tertiary care)3 Previous tests/referral filter Details given about clinical and other
diagnostic information as to which index test is being evaluated (symptomatic orasymptomatic patients (1 point)
4 Duration of illness before diagnosis Duration mentioned (1 point)5 Comorbid conditions Details given (type of population) (1 point)6 Demographic information Age (1 point) and/or gender (1 point)
data provided7 Execution of index test Information about standard procedure
directly or indirectly available, urinecollection procedure, first voided urine,distribution of microorganisms, procedureof contaminated urine samples, time oftransportation of urine sample, way ofreading index test, persons reading indextest (1 point each)
8 Explanation of cut-off point of index test Trace, 2 or more � (1 point if applicable)9 Percentage missing If appropriate: missings mentioned (1 point)
10 Reproducibility of index test Reproducibility studied or referencementioned (1 point)
Blinding (IV3): When information about blinding of measurements was not given and thedipstick was performed in setting other than the culture, we assumed blind assessment of theindex test versus the reference test, but not vice versa.Explanation of the cut-off point (EV8) was only necessary for the leukocyte esterasemeasurement.
Andre_Chap08.qxd 11/6/01 3:02 PM Page 151

THE EVIDENCE BASE OF CLINICAL DIAGNOSIS
152
positive and negative results of the index test; (3) accepting the results ofobservers who were unblinded to the index test results when performingthe reference test; (4) that did not describe diagnostic criteria for the indextest; and (5) where participants were inadequately described.
Comments
Ideally, all participants should be submitted to the same reference test.Sometimes different groups of patients are submitted to different referencetests, but details are not given. In this case it is important to assess whetherthe different reference tests are recognised by experts as being adequate.Verification or work-up bias may be present if not all participants whoreceived the index test are referred to the reference test(s).Verification biasis present if the participants are referred according to the index test results.This is usually the case in screening studies where only subjects withpositive index test results receive the reference test, so that only a positivepredictive value can be calculated. Estimation of accuracy will not bepossible in these studies unless complete follow up registries are available.This is the case if, for example, cancer screening registries and cancerdiagnosis registries are coupled.
Data extraction
Two reviewers should independently extract the required informationfrom the primary studies. Detailed information must be extracted aboutthe participants included in the study and about the testing procedures.The cut-off point used in dichotomous testing, and the reasons and thenumber of participants excluded because of indeterminate results orinfeasibility, are always required.
Example Detailed information extracted in the case of the dipstick meta-analysis: mean age, male/female ratio, different cut-off points for leukocyteesterase (trace, 2�, 3�), time needed for transportation, whetherindeterminate results were excluded, included as negative, or repeated.
As the information extracted may be used in subgroup analyses andstatistical pooling of the validity, possible sources of heterogeneity shouldbe defined based on existing evidence or hypotheses.
Example In the dipstick meta-analysis we hypothesised that the followingfactors may explain heterogeneity if present: procedures of collection of testmaterial (method of urine collection, delay between urine collection andculture), who was executing the test and how (manually or automatic), anddifferent brands of commercial products.
Accuracy may be presented in different ways. For the meta-analysis ofdichotomous tests (see below) it is necessary to construct the diagnostic
Andre_Chap08.qxd 11/6/01 3:02 PM Page 152

GUIDELINES FOR SYSTEMATIC REVIEWS
153
2 � 2 table: absolute numbers in the four cells are needed. Totals of“diseased” and “non-diseased” participants are needed to calculate priorprobability (pretest probability), and to reconstruct the 2 � 2 table fromsensitivity, specificity, likelihood ratios, predictive values or receiveroperator characteristic (ROC) curves. If possible, the 2 � 2 table should begenerated for all relevant subgroups. Further information to extractincludes year of publication, language of publication, and country or regionof the world where the study was performed.
Comments
A standardised data extraction form may be used simultaneously withbut separately from the quality assessment form. This approach facilitatesdata extraction and comparison between reviewers. The form has to bepiloted to ensure that all reviewers interpret data in the same way. As inother steps of the review where judgements are made, disagreementsshould be recorded and resolved by consensus or arbitration. Lack ofdetails about test results or cut-off points, inconsequential rounding off ofpercentages, and data errors require common sense and careful datahandling when reconstructing 2 � 2 tables. If predictive values arepresented with sensitivity and specificity in “diseased” and “non-diseased”individuals, the calculation of the four cells from sensitivity and specificitycan be confirmed by using the predictive values. Details can be requestedfrom the authors of the studies, but these attempts are often unsuccessful,as the raw data may no longer be available.
Example In a review of the accuracy of the CAGE questionnaire for thediagnosis of alcohol abuse, sufficient data were made available in only nineof the 22 studies selected, although the authors of the review tried tocontact the original authors by all means.33
Data analysis
Whether or not a meta-analysis – statistical analysis and calculation of asummary diagnostic accuracy estimate – can be conducted depends on thenumber and methodological quality of primary studies included and thedegree of heterogeneity of their estimates of diagnostic accuracy. Becausediagnostic accuracy studies are often heterogeneous and present limitedinformation it is typically difficult to complete a meta-analysis. Ifheterogeneity is identified, important information is obtained fromattempts to explain it. For instance, the effect that each validity criterionhas on the estimates of diagnostic accuracy and the influence of previouslydefined study characteristics should be explored as potential explanationsof the observed study to study variation.21–25 If meta-analysis is not possible
Andre_Chap08.qxd 11/6/01 3:02 PM Page 153

or advisable, the review can be limited to a qualitative descriptive analysisof the diagnostic research available (best evidence synthesis).34
Several meta-analytical methods for diagnostic research have beenpublished in the last decade.12–20 For the analysis we recommend thefollowing steps: (1) presentation of the results of individual studies;(2) searching for the presence of heterogeneity; (3) testing for the presenceof an (implicit) cut-point effect; (4) dealing with heterogeneity;(5) deciding which model should be used if statistical pooling isappropriate; and (6) statistical pooling.
Describing the results of individual studies
Reporting the main results of all included studies is an essential part ofeach review. It provides the reader with the outcome measures and gives aninsight into their heterogeneity. Each study is presented with somebackground information (year of publication, geographical region, numberof diseased and non-diseased patients, selection of the patients,methodological characteristics) and a summary of the results. In view of theasymmetrical nature of most diagnostic tests (some tests are good toexclude a disease, others to confirm it), it is important to report pairs ofcomplementary outcome measures, that is, both sensitivity and specificity,positive and negative predictive value, likelihood ratio of a positive and of anegative test, or a combination of these. The diagnostic odds ratio (DOR)can be added, but better not alone, as a same odds ratio can relate todifferent combinations of sensitivity and specificity. Main outcomemeasures should be reported with their 95% confidence intervals (CI).
DOR �sensitivity/(1�sensitivity)
(1�specificity)/specificity
Searching for heterogeneity
Basically, heterogeneity relates to the input characteristics of each study(study population, test methods, etc.).When setting inclusion criteria, mostreviewers will try to define a more or less homogeneous set of studies. Thereality, however, is that even then most diagnostic reviews suffer fromconsiderable heterogeneity. When different studies have largely differentresults, this can be because of either random error or heterogeneity.To testfor homogeneity of sensitivity and specificity, a �2 test or an extension ofFisher’s exact test for small studies35 can be used. This may offer someguidance, although the power of this test tends to be low. A basic but veryinformative method when searching for heterogeneity is to produce a graphin which the individual study outcomes are plotted, together with their95% confidence intervals (Figure 8.1).
THE EVIDENCE BASE OF CLINICAL DIAGNOSIS
154
Andre_Chap08.qxd 11/6/01 3:02 PM Page 154

Searching for the presence of an (implicit) cut-off point effect
Estimates of diagnostic accuracy differ if not all studies use the same cut-off point for a positive test result or for the reference standard. Theinterpretation of test results often depends on human factors (for exampleradiology, pathology, etc.) or on the process of testing (for example clinical
GUIDELINES FOR SYSTEMATIC REVIEWS
155
1
0.8
0.6
0.4
0.2
0
1
0.8
0.6
0.4
0.2
0
1
1
2 3 4 5 6Studies
Specificity
Sensitivity
7 6 9 10 11
2 3 4 5 6Studies
7 6 9 10 11
1000
100
10
1
01
Odds ratio
2 3 4 5 6Studies
7 6 9 10 11
Figure 8.1 Point estimates (with confidence limits) of, respectively, sensitivity,specificity, and diagnostic odds ratio of 11 studies on the validity of the test ofLasègue for the diagnosis of disc hernia in low back pain. Study 6 is an outlier.
Andre_Chap08.qxd 11/6/01 3:02 PM Page 155

examination). In such cases different studies may use a different implicitcut-off point.Variation in the parameters of accuracy may be partly due tovariation in cut-off points. One can test for the presence of a cut-off pointeffect between studies by calculating a Spearman correlation coefficientbetween the sensitivity and the specificity of all included studies. If stronglynegatively correlated (� � �0.4), pairs of parameters represent the sameDOR. A strong correlation between both parameters will usually result ina homogeneous logarithmic transformed DOR (lnDOR). The test forhomogeneity of the lnDOR is described by Fleiss.35 If the LnDORs of theincluded studies are homogeneous, a summary ROC curve can be fittedbased on the pairs of sensitivity and specificity of the individual studies (seepage 159). If sufficient information is available, the pooling of ROC curvesof individual studies will also be possible.
Dealing with heterogeneity
In many cases the interpretation of present heterogeneity is the mostfascinating and productive part of a meta-analysis. The inspection of theplot of all outcome parameters with their 95% CI may indicate thepresence of outliers. In such cases the reason for this situation should becarefully examined.
Example In a review of the diagnostic value of macroscopic haematuria forthe diagnosis of urological cancers in primary care, the positive predictivevalues (PPV) indicated a homogeneous series of five studies with a pooledPPV of 0.19 (95% CI � 0.17–0.23) and one other with a PPV of 0.40.36
The reason for this high PPV was mentioned in the original study: “GPs’services in the region are extremely good and cases of less serious conditionsare probably adequately shifted out and treated without referral”, leading toa highly selected study population with a high prior probability.
In such cases an outlier can be excluded and the analysis continued withthe homogeneous group of remaining studies. Deviant results should beexplored and explained. The decision to exclude outliers is complex andshould be handled in the same way as in other fields of research.
Outliers can also be searched by using a Galbraith plot.37 To constructthis plot, the standardised lnDOR � lnDOR/se is plotted (y axis) againstthe inverse of the se (1/se) (x axis). A regression line that goes through theorigin is calculated, together with 95% boundaries (starting at �2 and �2on the y axis). Studies outside these 95% boundaries may be considered asoutliers (Figure 8.2).
Subgroup analyses defined in the protocol could be conducted to detecthomogeneous subgroups. Analysis of variance, with the lnDOR as adependent variable and categorical variables for subgroups as factors, canbe used to look for differences among subgroups.
THE EVIDENCE BASE OF CLINICAL DIAGNOSIS
156
Andre_Chap08.qxd 11/6/01 3:02 PM Page 156

GUIDELINES FOR SYSTEMATIC REVIEWS
157
Example In the dipstick review, sensitivity and specificity were weaklyassociated (� � � 0.227) and very heterogeneous. Subgroup analysisshowed significant differences of the lnDOR between six differentpopulations of participants. In three populations there was a strongnegative association between sensitivity and specificity (� � � 0.539,�0.559, and �1.00, respectively), yielding homogeneous lnDOR in thethree subgroups. Different SROC curves for each subgroup could be fitted(see section on statistical pooling) (Figure 8.3).
If many studies are available, a more complex multivariate model can bebuilt in which a number of study characteristics are entered as possiblecovariates. Multivariate models search for the independent effect of studycharacteristics, adjusted for the influence of other, more powerful ones.
Deciding on the model to be used for statistical pooling
Models
There are two underlying models that can be used when pooling the resultsof individual studies.
A fixed effect model assumes that all studies are a certain random sampleof one large common study, and that differences between study outcomesonly result from random error. Pooling is simple. It consists essentially ofcalculating a weighted average of the individual study results. Studies areweighted by the inverse of the variance of the parameter of test accuracy, orby the number of participants.
10
8
6
4
2
0
0
In (
DO
R)/
stan
dard
err
or I
n (D
OR
)
1 2 31/standard error In (DOR)
4 5 6–2
Figure 8.2 Galbraith plot of 11 studies on the validity of the Lasègue test for thediagnosis of disc hernia in low back pain. Study 6 is an outlier.
Andre_Chap08.qxd 11/6/01 3:02 PM Page 157

THE EVIDENCE BASE OF CLINICAL DIAGNOSIS
158
A random effect model assumes that in addition to the presence of randomerror, differences between studies can also result from real differencesbetween study populations and procedures. The weighting factor ismathematically more complex, and is based on the work of Der Simonianand Laird, initially performed and published for the meta-analysis oftrials.38 It includes both within-study and between-study variation.
Homogeneous studies
If the parameters are homogeneous, and if they show no (implicit) cut-off effect, their results can be pooled and a fixed effect model can be used.If there is evidence of a cut-off effect, SROC curves can be constructed orROC curves can be pooled.
Heterogeneous studies
If heterogeneity is present, the reviewer has the following options:
1. Refrain from pooling and restrict the analysis to a qualitative overview.2. Subgroup analysis if possible, on prior factors and pooling within
homogeneous subgroups.
1.00
0.90
0.80
0.70
0.60
0.50
0.40
0.30
0.20
0.10
0.000.00 0.20 0.40 0.60
1–specificitychildrensurgerypregnantsmixed population
SROC mixed populationSROC childrenSROC surgerySROC pregnant women
sens
itivi
ty
0.80 1.00
SROC Nitrites in various patient populations
Figure 8.3 Summary ROC curves of nitrites in urine dipsticks for the diagnosis ofbacteriuria and urinary tract infections in various homogeneous subgroups ofpatient populations.
Andre_Chap08.qxd 11/6/01 3:02 PM Page 158

GUIDELINES FOR SYSTEMATIC REVIEWS
159
3. As a last resort pooling can be performed, using methods that are basedon a random effect model.
In view of the poor methodological quality of most of the diagnostic studiesthat have been carried out, there is a tendency to advise using randomeffect models for the pooling of all diagnostic studies, even if there is noapparent heterogeneity.
Statistical pooling
Pooling of proportions
● Homogeneous sensitivity and/or specificityIf fixed effect pooling can be used, pooled proportions are the average of
all individual study results, weighted for the sample sizes.This is easily doneby adding together all numerators and dividing the total by the sum of alldenominators14 (see Appendix to this chapter).● Cut-off point effect: SROC curve
The SROC curve is presented with sensitivity on the y axis and1 � specificity on the x axis (ROC plot), where each study provides onevalue of sensitivity and one value of specificity (Figure 8.3). If a SROCcurve can be fitted, a regression model (metaregression) is used, with thenatural logarithm of the DOR (lnDOR) of the studies as dependentvariable and two parameters as independent variables: one for the intercept(to be interpreted as the mean lnDOR) and one for the slope of the curve(as an estimate of the variation of the lnDOR across the studies due tothreshold differences). Details and formulae for fitting the curve can befound in the paper presented by Littenberg and Moses13 (see Appendix).Covariates representing different study characteristics or pretestprobabilities can be added to the model to examine any possible associationof the diagnostic odds ratio with these variables.39 The pooled lnDOR andconfidence limits have to be back-transformed into a diagnostic odds ratioand its confidence intervals. Metaregression can be unweighted orweighted, using the inverse of the variance as the weighting factor. Aproblem that is encountered in diagnostic research is the often negativeassociation of the weighting factor with the lnDOR, giving studies withlower discriminative diagnostic odds ratios – because of lower sensitivityand/or specificity – a larger weight. This problem has not yet beenresolved.17,19
Pooling of likelihood ratios
Continuous test results can be transformed into likelihood ratios,obtained by using different cut-off points. Individual data points from theselected studies can be used to calculate result specific likelihood ratios,40
Andre_Chap08.qxd 11/6/01 3:02 PM Page 159

which can be obtained by logistic modelling.The natural log posterior oddsare converted into a log likelihood ratio by adding a constant to theregression equation. The constant adjusts for the ratio of the number of“non-diseased” to “diseased” participants in the respective studies17 (seeAppendix).
Pooling of the ROC curves
The results of diagnostic studies with a dichotomous gold standardoutcome, and a test result that is reported on a continuous scale, aregenerally presented as an ROC curve with or without the related area underthe curve (AUC) and its 95% CI. To pool such results, the reviewer hasthree options: to pool sensitivities and specificities for all relevant cut-offpoints; to pool the AUCs; or to model and pool the ROC curvesthemselves.
● A pooled ROC curve and its confidence interval can be constructed onthe basis of the pooled sensitivity/specificity values per cut-off point. Tomake this possible, sufficient raw data have to be available, which isseldom the case.
● The AUC, like all one-dimensional measures, provides no informationabout the asymmetrical nature of a diagnostic test. It cannot distinguishbetween curves with a high sensitivity at moderate values of the specificityand those with a high specificity at moderate values of the sensitivity.
● As ROC curves are based on ranking, they are robust with respect tointerstudy shifts in the value or meaning of cut-off points. They alsoprovide information about the asymmetrical nature of the testinformation.To enable direct pooling of ROC curves, a method has beendeveloped that requires only the published curves and the number ofpositive and negative participants on the gold standard test as input.41
The ROC curve is scanned into a graphic computer file and thenconverted into a series of sensitivity versus specificity data, usingappropiate software or, ultimately, by hand. Subsequently, a model isfitted for each study, similar to that used for producing SROC curves.
For continuous scale tests, weighted linear regression is used toestimate the parameters for each curve, including a bootstrap method to estimate the standard errors. For ordinal tests, maximum likelihoodestimation yields the parameters and their standard errors.The resultingestimates are pooled separately, using a random effect model, and theresulting model is back-transformed into a new pooled curve with its95% confidence band. In addition to causing calculation problems inspecific situations, pooling published ROC curves also hides the testvalues from the picture. Although this is not a problem when evaluatinga test method, or when comparing different methods, it limits thepossible use of the pooled curve for evaluating the diagnostic value of
THE EVIDENCE BASE OF CLINICAL DIAGNOSIS
160
Andre_Chap08.qxd 11/6/01 3:02 PM Page 160
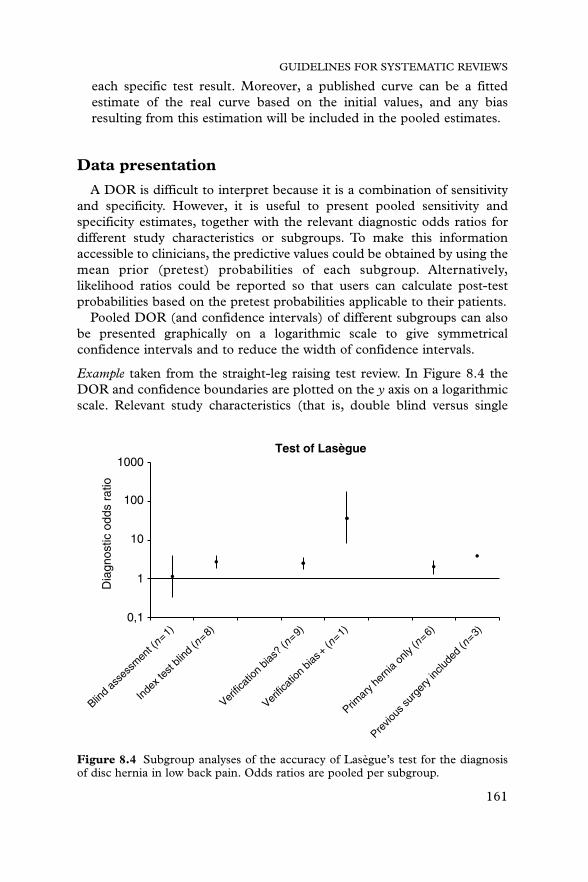
each specific test result. Moreover, a published curve can be a fittedestimate of the real curve based on the initial values, and any biasresulting from this estimation will be included in the pooled estimates.
Data presentation
A DOR is difficult to interpret because it is a combination of sensitivityand specificity. However, it is useful to present pooled sensitivity andspecificity estimates, together with the relevant diagnostic odds ratios fordifferent study characteristics or subgroups. To make this informationaccessible to clinicians, the predictive values could be obtained by using themean prior (pretest) probabilities of each subgroup. Alternatively,likelihood ratios could be reported so that users can calculate post-testprobabilities based on the pretest probabilities applicable to their patients.
Pooled DOR (and confidence intervals) of different subgroups can alsobe presented graphically on a logarithmic scale to give symmetricalconfidence intervals and to reduce the width of confidence intervals.
Example taken from the straight-leg raising test review. In Figure 8.4 theDOR and confidence boundaries are plotted on the y axis on a logarithmicscale. Relevant study characteristics (that is, double blind versus single
GUIDELINES FOR SYSTEMATIC REVIEWS
161
Test of Lasègue
Dia
gnos
tic o
dds
ratio
1000
100
10
1
0,1
Blind a
sses
smen
t (n=1)
Index
test
blind
(n=8)
Verific
ation
bias
? (n=9)
Verific
ation
bias
+ (n=1)
Primar
y her
nia on
ly (n
=6)
Previo
us su
rger
y inc
luded
(n=3)
Figure 8.4 Subgroup analyses of the accuracy of Lasègue’s test for the diagnosisof disc hernia in low back pain. Odds ratios are pooled per subgroup.
Andre_Chap08.qxd 11/6/01 3:02 PM Page 161

blind studies, studies with or without verification bias) are plotted on the x axis.
Discussion
Although the methodology to conduct a systematic review and meta-analysis of diagnostic research is developed to a certain extent, at least fordichotomised tests, the exercise itself remains quite a challenge. Systematicreviews have to meet high methodological standards and the results shouldalways be interpreted with caution. Several complicating issues needcareful consideration: (1) it is difficult to discover all published evidence,as diagnostic research is often inadequately indexed in electronicdatabases; (2) the studies are often poorly reported and a set of minimalreporting standards for diagnostic research has only recently beendiscussed; (3) the methodological quality and validity of diagnosticresearch reports is often limited (that is, no clear definition of “diseased”participants, no blinding, no independent interpretation of test results,insufficient description of participants); (4) accuracy estimates are oftenvery heterogeneous, yet examining heterogeneity is cumbersome and theprocess is full of pitfalls; (5) results have to be translated into informationthat is clinically relevant, taking into account the clinical reality at differentlevels of health care (prevalence of disease, spectrum of disease, availableclinical and other diagnostic information). Even in a state of the artsystematic review, the reviewers have to make many subjective decisionswhen deciding on the inclusion or exclusion of studies, on qualityassessment and the interpretation of limited information, on the exclusionof outliers, and on choosing and conducting subgroup analyses. Subjectiveaspects have to be assessed independently by more than one reviewer, withtracking of disagreements and resolution by consensus or arbitration.These subjective decisions should be explicitly acknowledged in the reportto allow the readers some insight into the possible consequences of thesedecisions on the outcomes of the review and the strength of inferencederived from it.
Whereas some researchers question the usefulness of pooling the resultsof poorly designed research or meta-analyses based on limitedinformation,42–43 we think that examining the effects of validity criteria on
THE EVIDENCE BASE OF CLINICAL DIAGNOSIS
162
Example taken from the dipstick review:
DOR Sensitivity Specificity Prior Factor (95% CI) (95% CI) (95% CI) probability PPV NPV
Mixed 11 (6–21) 0.50 (0.44–0.58) 0.82 (0.71–0.95) 0.32 0.57 0.78population
Surgery 34 (25–47) 0.54 (0.39–0.74) 0.96 (0.93–0.99) 0.20 0.76 0.89
Andre_Chap08.qxd 11/6/01 3:02 PM Page 162

GUIDELINES FOR SYSTEMATIC REVIEWS
163
the diagnostic accuracy measures and the analysis of subgroups addsvaluable evidence to the field of diagnostic accuracy studies.The generationof a pooled estimate – the most likely estimate of the test’s accuracy –provides clinicians with useful information until better-conducted studiesare published. The reader should remember that evidence about theinfluence of validity of studies on diagnostic accuracy is still limited.2,3,6
Consequently, it is difficult to recommend a strict set of methodologicalcriteria, recognising that any minimum set of methodological criteria islargely arbitrary. Although we have discussed some practical approaches tostatistical pooling, other methods are available in the literature.18,19
Experience with these methods, however, is limited. The development ofguidelines for systematic reviews of tests with continuous or ordinaloutcomes, reviews of diagnostic strategies of more than one test, andreviews of the reproducibility of diagnostic tests, remains anotherchallenge, as the methodology is still limited1 or even non-existent.
References
1 Irwig L, Tosteson ANA, Gatsonis C, et al. Guidelines for meta-analyses evaluatingdiagnostic tests. Ann Intern Med 1994;120:667–76.
2 Lijmer JG, Mol BW, Heisterkamp S, et al. Empirical evidence of design-related bias instudies of diagnostic tests. JAMA 1999;282:1061–6.
3 Oosterhuis WP, Niessen RWLM, Bossuyt PMM. The science of systematic reviewingstudies of diagnostic tests. Clin Chem Lab Med 2000;38:577–88.
4 Jeaschke R, Guyatt GH, Sackett DL. User’s guidelines to the medical literature, III: howto use an article about a diagnostic test, A: are the results of the study valid? JAMA1994;271:389–91.
5 Jeaschke R, Guyatt GH, Sackett DL. User’s guidelines to the medical literature, III: howto use an article about a diagnostic test, B: what are the results and will they help me incaring for my patients? JAMA 1994;271:703–7.
6 Greenhalgh T. How to read a paper: papers that report diagnostic or screening tests. BMJ1997;315:540–3.
7 Reid MC, Lachs MS, Feinstein AR. Use of methodological standards in diagnostic testresearch: getting better but still not good. JAMA 1995;274:645–51.
8 Haynes RB, Wilczynski N, McKibbon KA, Walker CJ, Sinclair JC. Developing optimalsearch strategies for detecting clinically sound studies in Medline. J Am Med InformaticsAssoc 1994;1:447–58.
9 Dickersin K, Scherer R, Lefebvre C. Identifying relevant studies for systematic reviews.BMJ 1994;309:1286–91.
10 van der Weijden T, IJzermans CJ, Dinant GJ, van Duijn NP, de Vet R, Buntinx F.Identifying relevant diagnostic studies in MEDLINE. The diagnostic value of theerythrocyte sedimentation rate (ESR) and dipstick as an example. Fam Pract 1997;14:204–8.
11 Devillé WLJM, Bezemer PD, Bouter LM. Publications on diagnostic test evaluation infamily medicine journals: an optimal search strategy. J Clin Epidemiol 2000;53:65–9.
12 McClish DK. Combining and comparing area estimates across studies or strata. MedDecision Making 1992;12:274–9.
13 Littenberg B, Moses LE. Estimating diagnostic accuracy from multiple conflictingreports: a new meta-analytic method. Med Decision Making 1993;13:313–21.
14 Midgette AS, Stukel TA, Littenberg B. A meta-analytic method for summarisingdiagnostic test performances: receiver-operating-characteristic-summary point estimates.Med Decision Making 1993;13:253–7.
Andre_Chap08.qxd 11/6/01 3:02 PM Page 163

THE EVIDENCE BASE OF CLINICAL DIAGNOSIS
164
15 Moses LE, Shapiro D, Littenberg B. Combining independent studies of a diagnostic test into a summary ROC curve: data-analytic approaches and some additionalconsiderations. Stat Med 1993;12:1293–316.
16 Hasselblad V, Hedges LV. Meta-analysis of screening and diagnostic tests. Psych Bull 1995;117:167–78.
17 Irwig L, Macaskill P, Glasziou P, Fahey M. Meta-analytic methods for diagnosticaccuracy. J Clin Epidemiol 1995;48:119–30.
18 Rutter CM, Gatsonis CA. Regression methods for meta-analysis of diagnostic test data.Acad Radiol 1995; 2:S48–S56.
19 Shapiro DE. Issues in combining independent estimates of the sensitivity and specificityof a diagnostic test. Acad Radiol 1995;2:S37–S47.
20 Walter SD, Irwig L, Glasziou PP. Meta-analysis of diagnostic tests with imperfectreference standards. J Clin Epidemiol 1999;52:943–51.
21 Yusuf S,Wittes J, Probsfield J,Tyroler HA. Analysis and interpretation of treatment effectsin subgroups of patients in randomised clinical trials. JAMA 1991;266:93–8.
22 Oxman A, Guyatt G. A consumer’s guide to subgroup analysis. Ann Intern Med 1992;116:78–84.
23 Thompson SG. Why sources of heterogeneity in meta-analysis should be investigated.BMJ 1994;309:1351–5.
24 Colditz GA, Burdick E, Mosteller F. Heterogeneity in meta-analysis of data fromepidemiologic studies: a commentary. Am J Epidemiol 1995;142:371–82.
25 Mulrow C, Langhorne P, Grimshaw J. Integrating heterogeneous pieces of evidence insystematic reviews. Ann Intern Med 1997;127:989–95.
26 Devillé WLJM,Yzermans JC, van Duin NP, van der Windt DAWM, Bezemer PD, BouterLM.Which factors affect the accuracy of the urine dipstick for the detection of bacteriuriaor urinary tract infections? A meta-analysis. In: Evidence in diagnostic research. Reviewingdiagnostic accuracy: from search to guidelines. PhD thesis, Amsterdam: Vrije Universiteit,pp 39–73.
27 Devillé WLJM, van der Windt DAWM, Dzaferagic A, Bezemer PD, Bouter LM. The testof Lasègue: systematic review of the accuracy in diagnosing herniated discs. Spine2000;25:1140–7.
28 Hunt DL, McKibbon KA. Locating and appraising systematic reviews. Ann Intern Med1997;126:532–8.
29 van Tulder MW, Assendelft WJJ, Koes BW, Bouter LM and the Editorial Board of theCochrane Collaboration Back Review Group. Method guidelines for systematic reviews inthe Cochrane Collaboration Back Review Group for spinal disorders. Spine1997;22:2323–30.
30 Obuchowski NA. Sample size calculations in studies of test accuracy. Stat Meth Med Res1998;7:371–92.
31 Grégoire G, Derderian F, Le Lorier J. Selecting the language of the publications includedin a meta-analysis: is there a Tower of Babel bias? J Clin Epidemiol 1995;48:159–63.
32 Cochrane Methods Group on Screening and Diagnostic Tests. Recommended methods.http://www.som.fmc.flinders.edu.au/fusa/cochrane
33 Aertgeerts B, Buntinx F, Kester A, Fevery J. Diagnostic value of the CAGE questionnairein screening for alcohol abuse and alcohol dependence: a meta-analysis. In: Screening foralcohol abuse or dependence. PhD thesis, Leuven: Katholieke Universiteit 2000, Appendix 3.
34 Centre for Evidence Based Medicine. Levels of Evidence and Grades ofRecommendations. http://cebm.jr2.ox.ac.uk/docs/levels.html
35 Fleiss Jl. The statistical basis of meta-analysis. Stat Meth Med Res 1993;2:121–45.36 Buntinx F, Wauters H. The diagnostic value of macroscopic haematuria in diagnosing
urological cancers. A meta-analysis. Fam Pract 1997;14:63–8.37 Galbraith RF. A note on graphical presentation of estimated odds ratios from several
clinical trials. Stat Med 1988;7:889–94.38 DerSimonian R, Laird N. Meta-analysis in clinical trials. Controlled Clin Trials
1986;7:177–88.39 Greenland S. Invited commentary: a critical look at some popular meta-analytic methods.
Am J Epidemiol 1994;140:290–6.40 Irwig L. Modelling result-specific likelihood ratios. J Clin Epidemiol 1989;42:1021–4.
Andre_Chap08.qxd 11/7/01 11:30 AM Page 164

41 Kester A, Buntinx F. Meta-analysis of ROC-curves. Med Decision Making 2000;20:430–9.42 Greenland S. A critical look at some popular meta-analytic methods. Am J Epidemiol
1994;140:290–301.43 Shapiro S. Meta-analysis/Shmeta-analysis. Am J Epidemiol 1994;140:771–7.
Appendix: statistical formulae
Pooling of proportions
Homogeneous sensitivity and/or specificity
For example, for the sensitivity:
where a � true positives, c � false negatives, i � study number, and, k � total number of studies,with standard error:
where p � sensitivitypooled, and
Cut-off point effect: SROC curve
Basic meta-regression formula:
where � � intercept, � � regression coefficient, and
With standard error:
Pooling of likelihood ratios
where LR � likelihood ratio
� � i ntercept in logistic regression, � � regression coefficient, and x � test measurement.
� log(number non-diseased/number diseased)
log cN D
NDd � correction factor
log(LR)pooled � log cN D
NDd � a � bx
SEln(DOR) � B1a
�1b
�1c
�1d
� 1n c (1 � specificity)specificity
dS � estimate of cut-off point � ln c sensitivity(1 � sensitivity)
d
ln(DOR)pooled � a � bS
n � ak
i�1 (ai � ci)
SE � Bp(1 � p)n
Sensitivitypooled � ak
i�1ai >a (ai � ci)
GUIDELINES FOR SYSTEMATIC REVIEWS
165
Andre_Chap08.qxd 11/7/01 11:30 AM Page 165

Andre_Chap08.qxd 11/6/01 3:02 PM Page 166

167
9 Diagnostic decisionsupport: contributionsfrom medical informaticsJOHAN VAN DER LEI, JAN H VAN BEMMEL
Summary box
● Applying information and communication technology (ICT) to agiven medical domain is not merely adding a new technique, buthas the potential to radically change processes in that domain.
● When introduced into an environment, ICT will initially oftenemulate or resemble the existing processes. When workers andresearchers in that domain begin to appreciate the potential of ICT,this initial stage is followed by more fundamental changes in thatdomain that take advantage of the potential of ICT.
● Many researchers argue that the fundamental enabling technologyis the introduction of electronic medical records. The explicitpurpose of automating medical records is to use the data in thoserecords to support not only the care of individual patients, but alsoapplications such as decision support, quality control, cost control,or epidemiology.
● To understand the scope of the potential changes enabled byelectronic records, three principal changes need to be understood.First, data recorded on computer can readily be retrieved andreused for a variety of purposes. Second, once data are available oncomputer, they can easily be transported. Third, as clinicians (andpatients) are using computers to record medical data, the sameelectronic record can be used to introduce other computerprograms that interact with the user.
Andre_Chap09.qxd 11/6/01 3:03 PM Page 167

THE EVIDENCE BASE OF CLINICAL DIAGNOSIS
168
Introduction
The term medical informatics dates from the second half of the 1970sand is based on the French term informatique médicale. Although the termis now widely used, other names, such as medical computer science,medical information sciences, or computers in medicine, are sometimesused. Research in informatics ranges from fundamental computer scienceto applied informatics. Several definitions of medical informatics take boththe scientific, fundamental aspect and the applied, pragmatic aspect intoaccount. Shortliffe, for example, provides the following definition:
“Medical Information Science is the science of using system-analytictools … to develop procedures (algorithms) for management, processcontrol, decision-making and scientific analysis of medical knowledge.”1
and Van Bemmel defines the field as: “Medical Informatics comprises thetheoretical and practical aspects of information processing andcommunication, based on knowledge and experience derived fromprocesses in medicine and health care.”1
Medical informatics is determined by the intersection of the termsmedicine and informatics. Medicine identifies the area of research;informatics identifies the methodology used. In medical informatics, wedevelop and assess methods and systems for the acquisition, processing,and interpretation of patient data. Computers are the vehicles to realisethese goals. The role of computers in medical informatics, however, varies.If the medical informatics research is applied, the objective is to develop acomputer system that will be used by healthcare professionals, for example
● As electronic medical records are becoming available, researchersuse them to change medical practice by providing decision support,and to analyse observational databases to study the delivery of care.New usage of data, however, generates additional requirements.Thus the experience in developing decision support systems andanalysing observational databases feeds back into the requirementsfor electronic medical records.
● Each patient–doctor encounter, each investigation, each laboratorytest, and each treatment in medical practice constitutes, inprinciple, an experiment. Ideally, we learn from each experiment.Paper as a medium to record data limits our ability to exploit thatpotential. Electronic medical records will facilitate research thatrelies on data recorded in routine medical practice.The potential ofICT, however, lies in its ability to close the loop between clinicalpractice, research, and education.
Andre_Chap09.qxd 11/6/01 3:03 PM Page 168

research aimed at the development of electronic medical records. If theresearch is more fundamental, the computer plays a role as an experimentalenvironment for models that are developed; the objective is not to build asystem, but to verify a hypothesis or to investigate the limitations of models.Some research in the area of artificial intelligence in medicine, for example,fits this last category.
Applying ICT to a given medical domain is not merely adding a newtechnique: ICT has the potential to radically change processes in thatdomain. Such change, however, may not be apparent at the beginning.When introduced into an environment, ICT will initially often emulate orresemble the already existing processes. Typically, this is only a temporarystage.When workers and researchers in that domain begin to appreciate thepotential of ICT, this initial stage is followed by more fundamental changesin that domain that take advantage of the potential of ICT.
Electronic communication, for example, is a relatively simple technology.The contents of a message may be structured (that is, contain a predefinedset of data) or free text. When introduced into the healthcare process,electronic communication is used to replace existing paper documents.Thenames of the first electronic messages often even carry the names of theirpaper counterpart: electronic discharge letter, electronic prescription, etc.At first glance, little has changed compared to the previous paper basedcommunication, except the speed of delivery. At this stage, theinfrastructure (for example computers, lines) required for ICT has beeninstalled, but its impact on the processes is still very limited. Subsequently,however, the ability to send data using electronic communication is used tosupport new forms of collaboration between healthcare professionals. Atpresent, the emphasis has shifted from replacing paper documents tosharing data between colleagues. As clinicians increasingly share data,issues such as the standardisation of the content of medical records arebecoming important areas of research. In addition, the fact that data can betransferred easily over distances enables clinicians to interpret data whilethe patient is located miles away (resulting in, for example, the so-called“telediagnosis”), or to communicate with patients over longer distancesusing, for example, the internet.
In this chapter we will focus on the contribution of medical informaticsto diagnostic decision support. We believe that the use of ICT in thedomain of diagnostic decision support is still in an early stage. Although ina few specialties (for example radiology), ICT is used extensively fordecision support, most clinicians have little or no experience with decisionsupport systems. Many researchers argue that the fundamental enablingtechnology is the introduction of electronic medical records. Onceelectronic medical records are available, they argue, we will witness a rapidincrease in the use of diagnostic decision support systems.2 We will firstdiscuss the developments with respect to electronic medical records.
DIAGNOSTIC DECISION SUPPORT
169
Andre_Chap09.qxd 11/6/01 3:03 PM Page 169

THE EVIDENCE BASE OF CLINICAL DIAGNOSIS
170
Electronic medical records
In its early stages, the written medical record had the purpose ofdocumenting the care given to a patient, and thus to facilitate continuity ofthat care. The entries in the record enabled the clinician to recall previousepisodes of illness and treatment. In recent years, however, medical recordshave been used increasingly for other purposes: they are used as a datasource for purposes ranging from billing the patient to performingepidemiological studies, and from performing quality control to defendingoneself against legal claims. One of the major barriers for using the data insuch ways is the inaccessible and often unstructured nature of the paperrecord. The introduction of computer based medical records to a largedegree, removes that barrier.
Recent decades have seen a rapid increase in the role of computers inmedical record keeping, and professional organisations have started to playan active role in the introduction of electronic records. For example, in1978 the first Dutch general practitioners started using personal computersin their practices. Five years later, in 1983, 35 general practitioners (that is,0.6% of all Dutch GPs) were using a computer. In 1990, 35% of DutchGPs were using one or more computer applications; although the majorityof these are administrative, an increasing number of clinicians usecomputer stored medical records.3 Now the electronic medical record hasreplaced paper records as the dominant form of record in Dutch primarycare. Other countries, such as the United Kingdom, have also witnessed arapid introduction of electronic records into primary care. In secondarycare, although progress has been made, the introduction of electronicrecords is slower.
The explicit purpose of automating medical records is to use the data inthose records to support not only the care of individual patients, but alsoapplications such as decision support, quality control, cost control, orepidemiology.2 The quality of medical record data, however, has often beenlamentable. The reliability of clinical data, for example, has long beenquestioned, and tensions between reimbursement schemes and codingschemes have been discussed. Some researchers argue that the process ofautomation may further reduce the reliability of data. Burnum,4 forexample, states: “With the advent of the information era in medicine, weare pouring out a torrent of medical record misinformation”. Although wedisagree with this pessimistic view, we acknowledge that medical data arerecorded for a specific purpose and that this purpose has an influence onwhat data are recorded and how. In developing systems that record medicaldata, designers make decisions about how to model those data in order toperform a given task. For example, in designing the computer basedmedical record system Elias,3 the designers focused on issues such as easeof data entry and emulating existing paper records. The same designers
Andre_Chap09.qxd 11/6/01 3:03 PM Page 170

subsequently discovered significant limitations in the Elias records when theydeveloped a decision support system that uses these records as a data source.5
Despite the limitations of the current computer based medical recordsand the data contained in them, many researchers believe electronic medicalrecords will significantly change medical practice.2,6 To understand thescope of these potential changes, three principles need to be understood.First, data recorded on computer can be readily retrieved and reused for avariety of purposes. As a result, databases containing data on millions ofpatients are available. Although the subsequent analysis of the data mayprove difficult, both clinicians and researchers are moving from a period of“data starvation” to “data overload”. Second, once data are available in thisway, they can easily be transported. The result is that processes thatinterpret the data (for example diagnosis or consultation) are no longerclosely associated with the physical location where they were collected.Data can be collected in one place and processed in another (for exampletelediagnosis). Third, as clinicians (and patients) are using computers torecord medical data, the same electronic record can be used to introduceother computer programs that interact with the user. Electronic medicalrecords require both an extensive ICT infrastructure and cliniciansexperienced in using that infrastructure. Once that infrastructure isoperational, other applications (such as decision support or access toliterature) are much easier to introduce.
Electronic medical records will stimulate and enable other developments.We will discuss two of them: the development and use of integrated decisionsupport systems, and the creation of observational databases.
Clinical decision support systems
A number of definitions for clinical decision support systems have beenproposed. Shortliffe,1 for example, defines a clinical decision supportsystem as: “any computer program designed to help health professionalsmake clinical decisions”.
The disadvantage of such a broad definition is that it includes anyprogram that stores, retrieves or displays medical data or knowledge. Tofurther specify what we mean by the term clinical decision support system,we use the definition proposed by Wyatt and Spiegelhalter1: “activeknowledge systems that use two or more items of patient data to generatecase specific advice”. This definition captures the main components of aclinical decision support system: medical knowledge, patient data, andpatient specific advice.
In a clinical decision support system, medical knowledge is modelled.That is, the designers of the system encode in a formalism the medicalknowledge that is required to make decisions. Such formalisms or models
DIAGNOSTIC DECISION SUPPORT
171
Andre_Chap09.qxd 11/6/01 3:03 PM Page 171

have traditionally been divided into two main groups: quantitative andqualitative. The quantitative models are based on well defined statisticalmethods and may rely on training sets of patient data to “train” the model.Examples of such models are neural networks, fuzzy sets, bayesian models,or belief nets. Qualitative models are typically less formal and are oftenbased on perceptions of human reasoning. Examples are truth tables,decision trees, or clinical algorithms. Increasingly, however, builders ofdecision support systems will combine different models in a given system:a bayesian network may be used to model the diagnostic knowledge and adecision tree may be used to model treatment decisions, and a pharmacokinetic model may be used to calculate dosage regimens.
Clinical decision support systems require patient data. Without them,patient-specific advice cannot be generated. Some systems may requireinteraction between the system and the clinician. The clinician initiates adialogue with the system and provides it with data by entering symptomsor answering questions. Experience has shown that the acceptance of thistype of system by clinicians is relatively low. Other systems are integratedwith electronic medical records, and use the data in them as input. In suchsettings, receiving decision support requires little or no additional datainput on the part of the clinician. Finally, some systems are directlyconnected to the devices that generate the data, for example systems thatinterpret ECGs or laboratory data.
By applying the medical knowledge to the patient data, the systemgenerates patient-specific advice. Some systems, especially those integratedwith electronic medical records, provide advice independent of a clinician’srequest for it – unsolicited advice. Examples are reminding systems thatcontinuously screen patient data for conditions that should be brought tothe clinician’s attention (for example the patient’s kidney function isdecreasing, or the patient is eligible for preventive screening). Other systems,such as critiquing systems, may monitor the decisions of the clinician andreport deviations from guidelines.
Although hundreds of clinical decision support systems have beenreported in the literature, only a few have been the subject of a rigorousclinical evaluation. Of those that have been evaluated, however, themajority of the studies showed an impact on clinician performance.7 Inparticular, systems integrated with electronic medical records have beendemonstrated to improve the quality of care. In light of the currentlyavailable evidence, clinical decision support systems constitute a possiblemethod to support the implementation of clinical guidelines in practice.
Observational databases
As a result of the increased use of electronic medical records, largeobservational databases containing data on millions of patients have
THE EVIDENCE BASE OF CLINICAL DIAGNOSIS
172
Andre_Chap09.qxd 11/6/01 3:03 PM Page 172

DIAGNOSTIC DECISION SUPPORT
173
become available for researchers. The data contained in these databases isnot of the same quality as the data collected in, for example, a clinical trial.They are collected in routine practice, and, although most observationaldatabases attempt to standardise the recording of data and to monitor theirquality, only a few observational databases require the clinician to recordadditional information.8
In the absence of a clear study design (for example a randomised controlledtrial to compare the effectiveness of possible treatment regimens) andspecification of the data required for that study, the data in observationaldatabases are difficult to interpret because of possible confounding. Theadvantage of observational databases, however, is that they reflect currentclinical practice. Moreover, the data are readily available and the costs arenot prohibitive. In settings where all the medical data are recordedelectronically, the opportunities for research are similar to studies carriedout using paper charts. Compared to paper charts, these observationaldatabases provide an environment where the analysis can be performedfaster, the data are legible, “normal” practice can be studied, rare eventscan be studied, longitudinal follow up of patients is possible, and subgroupsfor further study (such as additional data collection, or patients eligible forprospective trails) can be identified. In cases where a rapid analysis isrequired (for example a suspected side effect of a drug), observationaldatabases provide a setting for a quick assessment of the question.
Researchers in medical informatics use these observational databases toassess the behaviour of a decision support system prior to introducing thatsystem into clinical practice. Such an analysis allows the researchers todetermine, for example, the frequency of advice (for example the frequencyof reminders) and to study the trade off between false positive and falsenegative alerts.When the clinical decision support system relies on a modelthat uses patient data to train that model, observational databases allow thetuning of that model to the population in which it will be used.
Observational databases that rely on electronic records have limitations.Analysis of the contents of the records shows that information importantfor a researcher is often not recorded. Medical records typically containdata describing the patient’s state (for example the results of laboratorytests) and the actions of the clinician (such as prescribing medication).Relationships between data are often not recorded. The medical recordmainly reflects what is done, rather than why. A further complicating factoris that when data in the medical record describe the relationship betweenobservations (or findings) and actions (for example treatment), theinformation is often recorded in the form of free text. The clinician’s firstand most important objective in keeping automated medical records is todocument with the purpose of ensuring the quality and continuity ofmedical care. From the clinician’s perspective, free text is often an idealmethod for expressing the patient’s condition. Researchers, on the other
Andre_Chap09.qxd 11/6/01 3:03 PM Page 173
THE EVIDENCE BASE OF CLINICAL DIAGNOSIS
174
hand, prefer coded data to facilitate the automatic processing of largenumbers of patients. It is unrealistic, however, to expect clinicians to codeall relevant data: the time required to do so would render it impractical. Inaddition, coding is in essence a process of reducing the rich presentation ofthe patient–doctor encounter to a limited set of predefined terms.The dataavailable in an observational database may therefore not be sufficient toanswer a specific research question validly. The completeness of data canonly be discussed in the context of a specific study. It is not possible topredict all possible data that would be required for all possible studies. Asa result, data in observational databases will be incomplete. Depending onthe study question and the impact of incomplete information, additionaldata may need to be collected.
Confounding by indication
To illustrate the caveats when analysing observational databases, we discussthe problem of confounding by indication. In essence, confounding byindication is often “confounding by diagnosis”, since diagnostic assessment isthe starting point for any treatment. As an example we will use anobservational database used by Dutch GPs: the so-called IPCI database.8 Inthis database, we will study the use of long-acting � agonists (LBA). LBA,introduced into the Dutch market in 1992, are long-acting bronchodilatorsthat are used in the treatment of asthma. Dutch guidelines emphasise thatLBA are primarily a chronic medication and should be combined withinhaled corticosteroids (IC). We focus on the use of long-acting �2 agonistsand their concomitant use with corticosteroids in general practice.
We conducted a retrospective cohort study during the period 1992–1999among patients in the Netherlands receiving at least one prescription forone of the long-acting �2 agonists (LBA) or the short-acting inhaled �2agonists.We assessed the indication for the prescription, the characteristicsof recipients, the daily dose, and the treatment duration of long-acting �2agonists. In addition, we assessed the concomitant use of inhaledcorticosteroids, and the incidence of episodes of oral corticosteroid useprior to and during treatment. In the setting of this study, we used the oralcorticosteroids as a marker for exacerbations.
We found that the use of LBA among all inhaled �2 agonist users increasedfrom 3.0% in 1992 to 14.4% in 1999. Of the users, 61% were treatedexclusively by the GP and not referred to a specialist. The most commonindication for use of LBA was asthma (44%), followed by emphysema (36%)and chronic bronchitis (7%). Only 1.5% of the LBA prescriptions were issuedon an “if needed” basis; the most frequent dosing regimen was two puffs perday (78%). Only 67% of the LBA users received inhaled corticosteroidsconcomitantly. LBA were used for short periods: 32% of the users receivedonly a single prescription, and 49% were treated for less than 90 days.
Andre_Chap09.qxd 11/6/01 3:03 PM Page 174

DIAGNOSTIC DECISION SUPPORT
175
As shown in Table 9.1, among asthma patients who received LBA for atleast 1 year the episodes of oral corticosteroid use decreased from 1.6prescriptions/1000 patient-days (PD) prior to starting LBA, to 0.9/1000PD during the use of LBA. The rate of corticosteroid use prior to andduring LBA use increased in patients with a duration of LBA treatmentfrom 90 to 180 days (from 1.3 to 1.8 per 1000 person-days).
We conclude that the short duration of use of LBAs, and the fact that 33%of patients do not use LBA and IC concomitantly, shows that the use of LBAby Dutch GPs is not in agreement with Dutch guidelines for the treatmentof asthma. The interpretation of the use of oral corticosteroids, however, isdifficult. The fact that oral corticosteroid use in the patients treatedcontinuously with LBA decreased during treatment, seems to indicate thatuse of LBA has a positive effect in reducing the number of exacerbations. Onthe other hand, a comparison of the incidence of exacerbations prior to andduring treatment among patients treated with LBA from 90 to 180 daysshows that the incidence increases during treatment. It would be dangerousto conclude, based on these crude data, that LBA treatment causesexacerbations in this group of patients. Patients who receive short-term LBAmay be different from those with strong fluctuations in asthma severity, forexample. The reason (indication) for prescription in this group of patientsmay be a diagnosed temporary worsening of asthma (increasing severity)that in itself would lead to a higher incidence of exacerbations. Diagnosingseverity of the underlying disease that changes over time may therefore, havecaused this result: confounded by indication.
In order to be able to adjust for confounding during the analysis ofobservational studies, we would need an accurate indicator of the severityof the disease over time. For diseases such as asthma it is difficult reliably toassess changing severity by using data collected during routine care. In theabsence of a reliable severity indicator any interpretation can be flawed bythe potential (residual) confounding. In case of inability to assess severity,the only method to counter confounding would be the randomisation ofpatients to different treatment arms in order to make both arms similar asto the spectrum of severity. Currently, however, this option is not feasiblein “naturalistic” circumstances.
Table 9.1 For different durations of treatment of patients with asthma with long-acting �2 agonists (LBA), the frequency of oral corticosteroid use (in prescriptionsper 1000 person-days) in the 12 months before the start of the treatment with LBAand during the treatment with LBA.
Duration of treatment Corticosteroids 12 months Corticosteroids with LBA before LBA treatment during LBA treatment
From 90 to 180 days 1.3 1.8From 180 days to 1 year 1.5 1.3The full year 1.6 0.9
Andre_Chap09.qxd 11/6/01 3:03 PM Page 175

Closing the loop
One of the fundamental changes when conventional paper based medicalrecords are replaced with computerised records involves the ability toprocess the data in those records for different purposes. As electronicmedical records are becoming available, researchers use them to changemedical practice by providing decision support, and analyse observationaldatabases to study the delivery of care. New usage of data, however,generates additional requirements. Thus the experience in developingdecision support systems and analysing observational databases feeds backinto the requirements for electronic medical records. And as new requirementsfor the electronic record are formulated, the record itself begins to change.
In the area of decision support systems, researchers are combiningreminder systems that rely solely on recorded data with systems thatrequest additional information from clinicians. The resulting systems relyon the one hand on data already available in the electronic record todetermine eligible patients, and subsequently interact with the clinicianto assess, for example, whether the patient should be treated according toa certain protocol. The results of that interaction are recorded in themedical record. Researchers working on the development of observationaldatabases are beginning to combine retrospective research withprospective research. Trials are translated into software, distributedelectronically, and added to an electronic medical record. Based on thedata in that record, the system automatically detects patients eligible fora trial. It then informs the clinician that the patient is eligible, and requestspermission to include them in the trial.The system subsequently performsthe randomisation between treatment arms during patient consultation,and the electronic record supports subsequent data collection. As a result,the boundaries between an electronic record, a decision support system,and systems for clinical trials are beginning to fade.
Each patient–doctor encounter, each investigation, each laboratory test,and each treatment in medical practice constitutes, in principle, anexperiment. Ideally, we learn from each experiment. Paper as a medium torecord data limits our ability to exploit that potential. Electronic medicalrecords will facilitate research that relies on data recorded in routinemedical practice. The potential of ICT, however, lies in its ability to closethe loop between clinical practice, research, and education.
References
1 van Bemmel JH, Musen MA, eds. Handbook of Medical Informatics. Heidelberg: SpringerVerlag, 1997.
2 Institute of Medicine, Committee on Improving the Patient Record. The Computer-BasedPatient Record: An Essential Technology for Health Care (revised edn). Washington DC:National Academy Press, 1997.
THE EVIDENCE BASE OF CLINICAL DIAGNOSIS
176
Andre_Chap09.qxd 11/6/01 3:03 PM Page 176

3 van der Lei J, Duisterhout JS, Westerhof HP, et al. The introduction of computer-basedpatient records in the Netherlands. Ann Intern Med 1993;119:1036–41.
4 Burnum JF. The misinformation era: the fall of the medical record. Ann Intern Med1989;110:482–4.
5 van der Lei J, Musen MA, van der Does E, Man in‘t veld AJ, van Bemmel JH. Comparisonof computer-aided and human review of general practitioners’ management ofhypertension. Lancet 1991;338:1505–8.
6 Knottnerus JA.The role of electronic patient records in the development of general practicein the Netherlands. Meth Inform Med 1999;38:350–5.
7 Hunt DL, Haynes RB, Hanna SE, Smith K. Effects of computer-based decision supportsystems on clinician performance and patient outcomes: a systematic review. JAMA1998;280:1339–46.
8 Vlug AE, van der Lei J, Mosseveld BMT, et al. Postmarketing surveillance based onelectronic patient records: the IPCI project. Meth Inform Med 1999;38:339–44.
DIAGNOSTIC DECISION SUPPORT
177
Andre_Chap09.qxd 11/6/01 3:03 PM Page 177

Andre_Chap09.qxd 11/6/01 3:03 PM Page 178

179
10 Clinical problem solvingand diagnostic decisionmaking: a selective reviewof the cognitive researchliteratureARTHUR S ELSTEIN, ALAN SCHWARTZ
Summary box
● Research on clinical diagnostic reasoning has been conductedchiefly within two research paradigms, problem solving anddecision making.
● The key steps in the problem solving paradigm are hypothesisgeneration, the interpretation of clinical data to test hypotheses,pattern recognition, and categorisation.
● The controversy about whether rapid pattern recognition isaccomplished via retrieval of specific instances or by matching to amore abstract prototype can be resolved by recognising that themethod selected depends upon the characteristics of the problem.
● Diagnostic performance can be influenced by errors in hypothesisgeneration and restructuring.
● The decision making paradigm views diagnosis as updating opinionwith imperfect information; the normative rule for this process isBayes’ theorem.
● Well documented errors in probability estimation and revisioninclude acquiring redundant evidence, neglecting the role of
Andre_Chap10.qxd 11/6/01 3:03 PM Page 179

THE EVIDENCE BASE OF CLINICAL DIAGNOSIS
180
Introduction
This chapter reviews the cognitive processes involved in diagnosticreasoning in clinical medicine and sketches our current understanding ofthese principles. It describes and analyses the psychological processes andmental structures employed in identifying and solving diagnostic problemsof varying degrees of complexity, and reviews common errors and pitfalls indiagnostic reasoning. It does not consider a parallel set of issues in selectinga treatment or developing a management plan. For theoretical backgroundwe draw upon two approaches that have been particularly influential inresearch in this field: problem solving1–6 and decision making.7–11
Problem-solving research has usually focused on how an ill-structuredproblem situation is defined and structured (as by generating a set ofdiagnostic hypotheses). Psychological decision research has typically lookedat factors affecting diagnosis or treatment choice in well defined, tightlycontrolled problems. Despite a common theme of limited rationality,the problem-solving paradigm focuses on the wisdom of practice byconcentrating on identifying the strategies of experts in a field to helplearners acquire them more efficiently. Research in this tradition has aimedat providing students with some guidelines on how to develop their skills inclinical reasoning. Consequently, it has emphasised how experts generallyfunction effectively despite limits on their rational capacities. Behaviouraldecision research, on the other hand, contrasts human performance with anormative statistical model of reasoning under uncertainty, Bayes’ theorem.This research tradition emphasises positive standards for reasoning aboutuncertainty, demonstrates that even experts in a domain do not always meet
disease prevalence in estimating a post-test probability, under-estimating the strength of the evidence, the effect of order ofpresentation of clinical information on final diagnostic conclusions,and the tendency to overestimate the probability of serious buttreatable diseases to avoid missing them.
● Problem based learning and ambulatory clinical experiences makesense from the viewpoint of cognitive theory because studentsgeneralise less from specific clinical experiences than educatorshave traditionally hoped.
● A formal quantitative approach to the evidence might have greatergeneralisability. In residency training, both practice guidelines andevidence-based medicine are seen as responses to the psychologicallimitations of unaided clinical judgement.
Andre_Chap10.qxd 11/6/01 3:03 PM Page 180

these standards, and thus raises the case for some type of decision support.Behavioural decision research implies that contrasting intuitive diagnosticconclusions with those that would be reached by the formal application ofBayes’ theorem would give us greater insight into both clinical reasoningand the probable underlying state of the patient.
Problem solving: diagnosis as hypothesis selection
To solve a clinical diagnostic problem means, first, to recognise amalfunction and then to set about tracing or identifying its causes. Thediagnosis is ideally an explanation of disordered function – where possible, acausal explanation. The level of causal explanation changes as fundamentalscientific understanding of disease mechanisms evolves. In many instances adiagnosis is a category for which no causal explanation has yet been found.
In most cases, not all of the information needed to identify and explainthe situation is available early in the clinical encounter, and so the clinicianmust decide what information to collect, what aspects of the situation needattention, and what can be safely set aside. Thus, data collection is bothsequential and selective. Experienced clinicians execute this task rapidly,almost automatically; novices struggle to develop a plan.
The hypothetico-deductive method
Early hypothesis generation and selective data collection
Difficult diagnostic problems are solved by a process of generating alimited number of hypotheses or problem formulations early in the work upand using them to guide subsequent data collection.2 Each hypothesis canbe used to predict what additional findings ought to be present, if it weretrue, and then the work up is a guided search for these findings; hence, themethod is hypothetico-deductive. The process of problem structuring viahypothesis generation begins with a very limited dataset and occurs rapidlyand automatically, even when clinicians are explicitly instructed not togenerate hypotheses. Given the complexity of the clinical situation and thelimited capacity of working memory, hypothesis generation is a psychologicalnecessity. It structures the problem by generating a small set of possiblesolutions – a very efficient way to solve diagnostic problems.The content ofexperienced clinicians’ hypotheses are of higher quality; some novices havedifficulty in moving beyond data collection to considering possibilities.3
Data interpretation
To what extent do the data strengthen or weaken belief in the correctnessof a particular diagnostic hypothesis? A bayesian approach to answering
CLINICAL PROBLEM SOLVING AND DIAGNOSTIC DECISION MAKING
181
Andre_Chap10.qxd 11/6/01 3:03 PM Page 181

THE EVIDENCE BASE OF CLINICAL DIAGNOSIS
182
these questions is strongly advocated in much recent writing (forexample 12,13), and is clearly a pillar of the decision making approach tointerpreting clinical findings.Yet it is likely that only a minority of cliniciansemploy it in daily practice, and that informal methods of opinion revisionstill predominate. In our experience, clinicians trained in methods ofevidence-based medicine14 are more likely to use a bayesian approach tointerpreting findings than are other clinicians.
Accuracy of data interpretation and thoroughness of data collection areseparate issues. A clinician could collect data thoroughly but neverthelessignore, misunderstand, or misinterpret some findings. In contrast, a clinicianmight be overly economical in data collection, but could interpret whateveris available accurately. Elstein et al.2 found no significant association betweenthoroughness of data collection and accuracy of data interpretation. Thisfinding led to an increased emphasis upon data interpretation in research andeducation, and argued for studying clinical judgement while controlling thedatabase. This strategy is currently the most widely used in research onclinical reasoning. Sometimes clinical information is presented sequentially:the case unfolds in a simulation of real time, but the subject is given few orno options in data collection (for example15–17). The analysis may focus onmemory organisation, knowledge utilisation, data interpretation, or problemrepresentation (for example3,17,18). In other studies, clinicians are given allthe data simultaneously and asked to make a diagnosis.19,20
Pattern recognition or categorisation
Problem-solving expertise varies greatly across cases and is highlydependent on the clinician’s mastery of the particular domain. Cliniciansdiffer more in their understanding of problems and their problemrepresentations than in the reasoning strategies employed.2 From this pointof view, it makes more sense to consider reasons for success and failure ina particular case, than generic traits or strategies of expert diagnosticians.
This finding of case specificity challenged the hypothetico-deductivemodel of clinical reasoning for several reasons: both successful andunsuccessful diagnosticians used hypothesis testing, and so it was arguedthat diagnostic accuracy did not depend as much on strategy as on masteryof domain content. The clinical reasoning of experts in familiar situationsfrequently does not display explicit hypothesis testing,5,21–23 but is insteadrapid, automatic, and often non-verbal.The speed, efficiency, and accuracyof experienced clinicians suggests that they might not even use the samereasoning processes as novices, and that experience itself might makehypothesis testing unnecessary.5 It is likely that experienced clinicians usea hypothetico-deductive strategy only with difficult cases.24,25 Much of thedaily practice of experienced clinicians consists of seeing new cases thatstrongly resemble those seen previously, and their reasoning in these
Andre_Chap10.qxd 11/6/01 3:03 PM Page 182

situations looks more like pattern recognition or direct automatic retrieval.The question then becomes, what is retrieved? What are the patterns?
Pattern recognition implies that clinical reasoning is rapid, difficult toverbalise, and has a perceptual component.Thinking of diagnosis as fittinga case into a category brings some other issues into clearer view. How is anew case categorised? Two somewhat competing accounts have beenoffered, and research evidence supports both. Category assignment can bebased on matching the case either to a specific instance – so-called instancebased or exemplar based recognition – or to a more abstract prototype. Ininstance based recognition a new case is categorised by its resemblance tomemories of instances previously seen.5,22,26,27 For example, acutemyocardial infarction (AMI) is rapidly hypothesised in a 50-year-old maleheavy smoker with severe crushing, substernal chest pain because theclinician has seen previous instances of similar men with very similarsymptoms who proved to have AMI. This model is supported by the factthat clinical diagnosis is strongly affected by context (for example thelocation of a skin rash on the body), even when this context is normativelyirrelevant.27 These context effects suggest that clinicians are matching anew case to a previous one, not to an abstraction from several cases,because an abstraction should not include irrelevant features.
The prototype model holds that clinical experience – augmented byteaching, discussion, and the entire round of training – facilitates theconstruction of abstractions or prototypes.4,28 Differences betweenstronger and weaker diagnosticians are explained by variations in thecontent and complexity of their prototypes. Better diagnosticians haveconstructed more diversified and abstract sets of semantic relations torepresent the links between clinical features or aspects of the problem.3,29
Support for this view is found in the fact that experts in a domain are moreable to relate findings to each other and to potential diagnoses, and toidentify the additional findings needed to complete a picture.24 Thesecapabilities suggest that experts utilise abstract representations and do notmerely match a new case to a previous instance.
The controversy about the methods used in diagnostic reasoning can beresolved by recognising that clinicians, like people generally, are flexible inapproaching problems: the method selected depends upon the perceivedcharacteristics of the problem.There is an interaction between the clinician’slevel of skill and the perceived difficulty of the task.30 Easy cases can besolved by pattern recognition or by going directly from data to diagnosticclassification (forward reasoning).21 Difficult cases need systematichypothesis generation and testing. Whether a diagnostic problem is easy ordifficult is a function of the knowledge and experience of the clinician whois trying to solve it. When we say that a diagnostic problem is difficult, wereally mean that a significant fraction of the clinicians who encounter thisproblem will find it difficult, although for some it may be quite easy.
CLINICAL PROBLEM SOLVING AND DIAGNOSTIC DECISION MAKING
183
Andre_Chap10.qxd 11/6/01 3:03 PM Page 183

Errors in hypothesis generation and restructuring
Neither pattern recognition nor hypothesis testing is an error-proofstrategy, nor are they always consistent with statistical rules of inference.Errors that can occur in difficult cases in internal medicine are illustratedand discussed by Kassirer and Kopelman.17 Another classification ofdiagnostic errors is found in Bordage.31 The frequency of errors in actualpractice is unknown, and studies to better establish the prevalence ofvarious errors are much needed.
Many diagnostic problems are so complex that the correct solution is notcontained within the initial set of hypotheses. Restructuring andreformulating occur as data are obtained and the clinical picture evolves.However, as any problem solver works with a particular set of hypotheses,psychological commitment takes place and it becomes more difficult torestructure the problem.32
A related problem is that knowledge stored in long-term memory maynot be activated unless triggered by a hypothesis or some other cognitivestructure that provides an access channel to the contents of memory. Thisphenomenon has been demonstrated experimentally in a non-clinicalcontext: recall of the details of the layout of a house varies depending onwhether one takes the perspective of a burglar or a potential buyer.33 Weare unaware of an experimental demonstration of this effect in medicaleducation, presumably because of the difficulty of ensuring that anexperimental trigger has been effective. However, the complaint of manymedical educators that students who can solve problems in the classroomsetting appear to be unable to do so in the clinic with real patients,illustrates the role of social context in facilitating or hampering access tothe memory store. On the other side of this equation there are studentswho struggle academically but are competent clinicians, presumablybecause the clinical context facilitates their thinking. These observationsare all consistent with Bartlett’s34 classic proposal that memory isorganised schematically, not in the storage of unconnected bits. Storieshelp us to remember the details and also provide guidance as to whatdetails “must be there”. This phenomenon has been demonstrated inmedical students.6
Decision making: diagnosis as opinion revision
Bayes’ theorem
From the point of view of decision theory, reaching a diagnosis involvesupdating an opinion with imperfect information (the clinical evidence). 10–12,35
The normative mathematical rule for this task is Bayes’ theorem. Thepretest probability is either the known prevalence of the disease or the
THE EVIDENCE BASE OF CLINICAL DIAGNOSIS
184
Andre_Chap10.qxd 11/6/01 3:03 PM Page 184

CLINICAL PROBLEM SOLVING AND DIAGNOSTIC DECISION MAKING
185
clinician’s subjective probability of disease before new information isacquired. As new information is obtained, the probability of eachdiagnostic possibility is continuously revised.The post-test probability – theprobability of each disease given the information – is a function of twovariables, pretest probability and the strength of the evidence. The latter ismeasured by a “likelihood ratio”, the ratio of the probabilities of observinga particular finding in patients with and without the disease of interest.*
If the data are conditionally independent† each post-test probabilitybecomes the pretest probability for the next stage of the inference process.Using Bayes’ theorem becomes hopelessly complicated and impracticalwhen this assumption is violated and more than two correlated cues areinvolved in a diagnostic judgement, as is often the case in clinical medicine.In these situations, linear and logistic regression techniques are commonlyused to derive an equation or clinical prediction rule. A review of thesemethods is beyond the scope of this chapter. We simply point out that thecoefficients (weights) in a regression equation depend on the compositionof the derivation sample. Bayes’ theorem distinguishes the effect of diseaseprevalence and the strength of the evidence on the diagnostic judgement,but ordinary regression analytical methods confound these variables in theregression coefficients. (For alternative regression approaches that addressthis problem, see36). If the index disease is overrepresented in thederivation sample, a prediction rule should be applied cautiously topopulations where the prevalence of that disease is different. Despite thislimitation, these rules are useful. Clinical applications of statisticallyderived prediction rules can outperform human judgement37; this is therationale for a range of clinical prediction rules that have been developedduring the past two decades. Reports of the accuracy of such rules and thereasons for their success have been available in the psychological literatureon judgement for over 40 years,38 but application in clinical practice hasbeen slow because of continuing concerns about:
● whether a rule derived from a particular population generalisesaccurately to another
● eroding the professional authority and responsibility of clinicians, and● whether guidelines (at least in the United States) are intended more to
ration care and contain costs than to improve quality.39
Both evidence-based medicine (EBM) and decision analysis are effortsto introduce quantification into the diagnostic process and still leave a
* Formally, LR� � Sensitivity/(1�Specificity) and LR� � (1�Sensitivity)/Specificity.† Two tests are conditionally independent if the sensitivity and specificity of each test is thesame whether the other is positive or negative. Formally, if T1 and T2 are conditionallyindependent tests for a disease D, then:p(T2�|D� and T1�) � p(T2�|D�) andp(T2�|D� and T1�) � p(T2�|D�)
Andre_Chap10.qxd 11/6/01 3:03 PM Page 185

THE EVIDENCE BASE OF CLINICAL DIAGNOSIS
186
substantial role for clinical judgement.40,41 EBM leaves the application ofresearch results, including a clinical guideline, up to the clinical judgementof the clinician, who should be guided by canons for interpreting theliterature. Decision analysis proposes to offer the clinician insight into thecrucial variables in a decision problem, together with a recommendedstrategy that maximises expected utility (for example, see42). Both attemptto avoid quasimandatory prescriptive guidelines and to leave room forprofessional discretion.
Bayes’ theorem is a normative rule for diagnostic reasoning: it tells ushow we should reason, but it does not claim that we use it to revise opinion.It directs attention to two major classes of error in clinical reasoning: in theassessment of either pretest probability or the strength of the evidence.Thepsychological study of diagnostic reasoning from the bayesian viewpointhas focused on errors in both components.
Errors in probability estimation
Availability
People are prone to overestimate the frequency of vivid or easily recalledevents and to underestimate the frequency of events that are either veryordinary or difficult to recall.43,44 Diseases or injuries that receive considerablemedia attention (for example injuries due to shark attacks) are oftenconsidered more probable than their true prevalence. This psychologicalprinciple is exemplified clinically in overemphasising rare conditions. Unusualcases are more memorable than routine problems. The clinical aphorism“When you hear hoofbeats, think horses, not zebras” calls attention to this bias.
Representativeness
Earlier, clinical diagnosis was viewed as a categorisation process. Thestrategy of estimating the probability of disease by judging how similar a caseis to a diagnostic category or prototype can lead to an overestimation of theprobability of a disease in two ways. First, post-test probability can beconfused with test sensitivity.45,46 For example, although fever is a typicalfinding in meningitis, the probability of meningitis given fever alone as asymptom is quite low. Second, representativeness neglects base rates andimplicitly considers all hypotheses as equally likely.This is an error, because ifa case resembles disease A and disease B equally well, and there are 10 timesas many cases of A as of B, then the case is more likely an instance of A.Thisheuristic drives the “conjunction fallacy”: incorrectly concluding that theprobability of a joint event (such as the combination of multiple symptoms toform a typical clinical picture) is greater than the probability of any one ofthose events alone.The joint event may be more representative (typical) of thediagnostic category, but it cannot be more probable than a single component.
Andre_Chap10.qxd 11/6/01 3:03 PM Page 186

CLINICAL PROBLEM SOLVING AND DIAGNOSTIC DECISION MAKING
187
Probability distortions
Normative decision theory assumes that probabilities are mentallyprocessed linearly, that is, they are not transformed from the ordinaryprobability scale. Because behavioural decision research has demonstratedseveral violations of this principle, it has been necessary to formulatedescriptive theories of risky choice that will better account for choicebehaviour in a wide range of situations involving uncertainty. One of theearliest of these theories is prospect theory (PT),47 which was formulatedexplicitly to account for choices involving two-outcome gambles (or onetwo-outcome gamble and a certain outcome). Cumulative prospect theory(CPT)48 extends the theory to the multioutcome case. Both PT and CPTpropose that decision makers first edit the decision stimulus in some way,and then evaluate the edited stimulus. Options are evaluated by using anexpected-utility-like rule, except that a transformation of the probabilities,called decision weights, are multiplied by subjective values and summed toyield the valuation of a lottery. Probabilities are transformed by a functionthat is sensitive to both the magnitude of each probability and its rank in the cumulative probability distribution. Hence, it is a rank-dependentutility theory. In general, small probabilities are overweighted and largeprobabilities underweighted. This “compression error”49 results indiscontinuities at probabilities of 0 and 1, and permits this model to predict“certainty effect” violations of expected utility theory (in which thedifference between 99% and 100% is psychologically much greater thanthe difference between, say, 60% and 61%). Cumulative prospect theoryand similar rank-dependent utility theories provide formal descriptions ofhow probabilities are distorted in risky decision making.The distortions areexacerbated when the probabilities are not precisely known,50 a situationthat is fairly common in clinical medicine. It should be stressed thatcumulative prospect theory does not assert that individuals are in factcarrying out mentally a set of calculations which are even more complexthan those required to calculate expected utility. Rather, the theory claimsthat observed choices (that is, behaviour) can be better modelled by thiscomplex function than by the simpler expected-utility rule.
Support theory
Several probability estimation biases are captured by support theory,51–53
which posits that subjective estimates of the frequency or probability of anevent are influenced by how detailed the description is. More explicitdescriptions yield higher probability estimates than compact, condenseddescriptions, even when the two refer to exactly the same events (such as“probability of death due to a car accident, train accident, plane accident,or other moving vehicle accident” versus “probability of death due to amoving vehicle accident”). This theory can explain availability (when
Andre_Chap10.qxd 11/6/01 3:03 PM Page 187

memories of an available event include more detailed descriptions thanthose of less available events) and representativeness (when a typical casedescription includes a cluster of details that “fit”, whereas a less typical caselacks some of these features). Clinically, support theory implies that alonger, more detailed case description will be assigned a higher subjectiveprobability of the index disease than a brief abstract of the same case, evenif they contain the same information about that disease. Thus, subjectiveassessments of events, although often necessary in clinical practice, can beaffected by factors unrelated to true prevalence.53
Errors in probability revision
Errors in interpreting the diagnostic value of clinical information havebeen found by several research teams.2,6,54,55
Conservatism
In clinical case discussions data are commonly presented sequentially,and diagnostic probabilities are not revised as much as is implied by Bayes’theorem. This “stickiness” has been called “conservatism”, and was one ofthe earliest cognitive biases identified.56
Anchoring and adjustment
One explanation of conservatism is that diagnostic opinions are revisedup or down from an initial anchor, which is either given in the problem orformed subjectively. Anchoring and adjustment means that final opinionsare sensitive to the starting point (the “anchor”), that the shift(“adjustment”) from it is typically insufficient, and so the final judgementis closer to the anchor than is implied by Bayes’ theorem.43 Both of thesebiases will lead to the collection of more information than is normativelynecessary to reach a desired level of diagnostic certainty. The commoncomplaint that clinicians overuse laboratory tests is indirect evidence thatthese biases operate in clinical practice.
Confounding the probability and value of an outcome
It is difficult for everyday judgement to keep separate accounts of theprobability of a particular disease and the benefits that accrue fromdetecting it. Probability revision errors that are systematically linked to theperceived cost of mistakes demonstrate the difficulties experienced inseparating assessments of probability from values.57,58 For example, thereis a tendency to overestimate the probability of more serious but treatablediseases, because a clinician would hate to miss one.57
THE EVIDENCE BASE OF CLINICAL DIAGNOSIS
188
Andre_Chap10.qxd 11/6/01 3:03 PM Page 188

Acquiring redundant evidence
“Pseudodiagnosticity”59 or “confirmation bias”54 is the tendency to seekinformation that confirms a hypothesis rather than the data that facilitateefficient testing of competing hypotheses. For example, in one study,residents in internal medicine preferred about 25% of the time to orderfindings that would give a more detailed clinical picture of one disease,rather than findings that would allow them to test between two potentialdiagnoses.54 Here, the problem is knowing what information would beuseful, rather than overestimating the value (likelihood ratio) of theinformation, or failing to combine it optimally with other data.55
Incorrect interpretation
A common error is interpreting findings as consistent with hypothesesalready under consideration.2,6,60 Where findings are distorted in recall, itis generally in the direction of making the facts more consistent with typicalclinical pictures.2 Positive findings are overemphasised and negativefindings tend to be discounted.2,61 From a bayesian standpoint these are allerrors in assessing the diagnostic value of information, that is, errors insubjectively assessing the likelihood ratio. Even when clinicians agree onthe presence of certain clinical findings, wide variations have been found inthe weights assigned in interpreting cues,20 and this variation may be duepartly to the effect of the hypotheses being considered.60
Order effects
Bayes’ theorem implies that clinicians given identical information shouldreach the same diagnostic opinion, regardless of the order in which theinformation is presented. However, final opinions are also affected by theorder of presentation: information presented later in a case is given moreweight than that presented earlier.15,62 This may partly explain why it isdifficult to get medical students to pay as much attention to history and thephysical examination as their teachers would wish. Modern diagnosticstudies tend to have very high likelihood ratios, and they also are obtainedlate in the diagnostic work up.
Educational implications
Two recent innovations in undergraduate medical education andresidency training, problem based learning and evidence-based medicine,are consistent with the educational implications of this research.
Problem based learning (PBL)63–65 can be understood as an effort tointroduce formulating and testing clinical hypotheses into a preclinicalcurriculum dominated by biological sciences. The cognitive–instructional
CLINICAL PROBLEM SOLVING AND DIAGNOSTIC DECISION MAKING
189
Andre_Chap10.qxd 11/6/01 3:03 PM Page 189

theory behind this reform was that, because experienced clinicians use thisstrategy with difficult problems, and as practically any clinical situationselected for instructional purposes will be difficult for students, it makessense to call this strategy to their attention and to provide opportunities topractise it, first using case simulations and then with real patients.
The finding of case specificity showed the limits of a focus on teaching ageneral problem solving strategy. Problem solving expertise can beseparated from content analytically, but not in practice. This realisationshifted the emphasis toward helping students acquire a functionalorganisation of content with clinically usable schemata. This became thenew rationale for problem based learning.66,67
Because transfer from one context to another is limited, clinicalexperience is needed in contexts closely related to future practice. Theinstance-based model of problem solving supports providing moreexperience in outpatient care because it implies that students do notgeneralise as much from one training setting to another as has traditionallybeen thought. But a clinician overly dependent on context sees every caseas unique, as all of the circumstances are never exactly replicated. Theunwanted intrusion of irrelevant context effects implies that an importanteducational goal is to reduce inappropriate dependence on context. In ouropinion, there are two ways to do this:
1. Emphasise that students should strive to develop prototypes andabstractions from their clinical experience. Clinical experience that isnot subject to reflection and review is not enough. It must be reviewedand analysed so that the correct general models and principles areabstracted. Most students do this, but some struggle, and medicaleducators ought not to count upon its spontaneous occurrence. Welldesigned educational experiences to facilitate the development of thedesired cognitive structures should include extensive focused practiceand feedback with a variety of problems.5,68 The current climate, withits emphasis on seeing more patients to compensate for decliningpatient care revenues, threatens medical education at this level becauseit makes it more difficult for clinical preceptors to provide the neededcritique and feedback, and for students to have time for the necessaryreflection.69
2. A practical bayesian approach to diagnosis can be introduced. EBM14,70
may be viewed as the most recent – and, by most standards, the mostsuccessful – effort to date to apply these methods to clinical diagnosis.EBM uses likelihood ratios to quantify the strength of the clinicalevidence, and shows how this measure should be combined with diseaseprevalence (or prior probability) to yield a post-test probability. This isBayes’ theorem offered to clinicians in a practical, useful format! Itsstrengths are in stressing the role of data in clinical reasoning, and in
THE EVIDENCE BASE OF CLINICAL DIAGNOSIS
190
Andre_Chap10.qxd 11/6/01 3:03 PM Page 190

CLINICAL PROBLEM SOLVING AND DIAGNOSTIC DECISION MAKING
191
encouraging clinicians to rely on their judgement to apply the resultsof a particular study to their patients. Its weaknesses, in our view, are thatit does not deal systematically with the role of patient preferences inthese decisions, or with methods for quantifying preferences, and that itblurs the distinction between probability driven and utility drivendecisions.
In our experience teaching EBM, residents soon learn how to interpretstudies of diagnostic tests and how to use a nomogram70,71 to computepost-test probabilities. The nomogram, or a 2 � 2 table, combines theirprior index of suspicion (a subjective probability) and the testcharacteristics reported in the clinical literature. It has been more difficultto introduce concepts of decision thresholds (at what probability shouldmanagement change?) and the expected value of information (should a testthat cannot result in a change in action be performed at all?).
Methodological guidelines
1. Psychological research on clinical reasoning began in a thinking-aloudtradition, which remains attractive to many investigators. It seems quitenatural to ask a clinician to articulate and discuss the reasoning involved ina particular case, and to record these verbalisations for later analysis.Whatever its shortcomings, this research strategy has high face validity.Because the clinicians involved in these studies frequently discuss real cases(for example2,17), content validity on the clinical side is not a problem.
The problems of this approach are easily summarised: first, it is labourintensive, and therefore most studies have used small samples of bothclinicians and cases. Therefore, they lack statistical power and are bestsuited for exploratory analysis. But to demonstrate statistically significantdifferences between experts (senior attending clinicians) and novices(medical students or junior house officers), researchers must take intoaccount two facts: (1) within any group of clinicians at any level of clinicalexperience, or within any speciality, there is a great amount of variation,both in reasoning and in practice. With small samples, within-groupvariance will make it difficult to demonstrate significant between-groupdifferences; and (2) the performance of clinicians varies considerably acrosscases.These two features imply that research on diagnostic reasoning mustuse adequate samples of both clinicians and cases if there is to be any hopeof reaching generalisable conclusions. Most research to date has not paidadequate attention to issues of sample size (of both cases and researchparticipants) and statistical power.
2. Many important cognitive processes are not available toconsciousness and are not verbalised. Indeed, the more automatic andoverlearned a mental process is, the less likely is it that one can verbalise
Andre_Chap10.qxd 11/6/01 3:03 PM Page 191

THE EVIDENCE BASE OF CLINICAL DIAGNOSIS
192
how the process works. Once a person has lived for some time at a givenaddress, it becomes impossible to tell how one knows that address: it issimply “known”. Closer to our concerns, participants do not report that asubjective probability is overestimated because of the availability bias: theexistence of the bias is inferred by comparing estimates with knownfrequencies. For these reasons, much recent work has shifted toward aresearch paradigm that owes much to experimental cognitive psychology:research participants are presented with a task and their responses arerecorded. Their verbalisations are one more source of data, but are nottreated as a true account of internal mental processes. This research hasyielded many of the findings summarised in this chapter, but it is at timescriticised for using artificial tasks (lack of face validity) and, consequently,not motivating the participants adequately. The generalisability of theresults to real clinical settings is then questioned.
3. Selection bias is a potential threat to the validity of both types ofstudies of clinical reasoning. Senior clinicians in any clinical domain candecline to participate in research far more easily than can medical studentsor house officers in the same domain. Therefore, the more experiencedparticipants in a study are usually volunteers. Attention should be paid toissues of selection bias and response rate as potential limitations; thoughtshould be given to their possible effects on the validity and generalisabilityof the results of the study.
4. Behavioural decision research conducted to date has been concernedprimarily with demonstrating that a particular phenomenon exists, forexample demonstrating biases in probability estimation, such as availabilityand representativeness. Statistical tests of significance are used to demonstratethe phenomena. From an educational standpoint, we ought to be moreinterested in identifying how prevalent these biases are and which are mostlikely to affect treatment and management.Thus, more research is needed toassess the prevalence of these errors and to determine how often treatmentchoices are affected by diagnostic errors caused by these biases. If these factswere known, a more rational, systematic curriculum could be developed.
Conclusion
This chapter has selectively reviewed 30 years of psychological researchon clinical diagnostic reasoning, focusing on problem solving and decisionmaking as the dominant paradigms of the field.This research demonstratesthe limitations of human judgement, although the research designsemployed make it difficult to estimate their prevalence. Problem basedlearning and evidence-based medicine are both justified by thepsychological research about judgement limitations, violations of bayesianprinciples in everyday clinical reasoning, and the finding of limited transfer
Andre_Chap10.qxd 11/6/01 3:03 PM Page 192

CLINICAL PROBLEM SOLVING AND DIAGNOSTIC DECISION MAKING
193
across clinical situations, although we do not believe that these innovationswere initially directed by an awareness of cognitive limitations. Withingraduate medical education (residency training), the introduction ofpractice guidelines based on evidence has been controversial becauseguidelines may be perceived as efforts to restrict the authority of cliniciansand to ration care. The psychological research helps to explain why formalstatistical decision supports are both needed and likely to evokecontroversy.
Preparation of this review was supported in part by grant RO1 LM5630from the National Library of Medicine.
References
1 Newell A, Simon HA. Human problem solving. Englewood Cliffs (NJ): Prentice-Hall, 1972.2 Elstein AS, Shulman LS, Sprafka SA. Medical problem solving: An analysis of clinical
reasoning. Cambridge MA: Harvard University Press, 1978.3 Bordage G, Lemieux M. Semantic structures and diagnostic thinking of experts and
novices. Acad Med 1991;66(9 Suppl):S70–S72.4 Bordage G, Zacks R. The structure of medical knowledge in the memories of medical
students and general practitioners: categories and prototypes. Med Educ 1984;18:406–16.5 Schmidt HG, Norman GR, Boshuizen HPA. A cognitive perspective on medical expertise:
theory and implications. Acad Med 1990;65:611–21.6 Friedman MH, Connell KJ, Olthoff AJ, Sinacore J, Bordage G. Medical student errors in
making a diagnosis. Acad Med 1998;73(10 Suppl):S19–S21.7 Kahneman D, Slovic P, Tversky A (eds.) Judgment under uncertainty: Heuristics and biases.
New York: Cambridge University Press, 1982.8 Baron J. Thinking and deciding. New York: Cambridge University Press, 1988.9 Mellers BA, Schwartz A, Cooke ADJ. Judgment and decision making. Annu Rev Psychol
1998;49:447–77.10 Weinstein MC, Fineberg HV, Elstein AS, et al. Clinical decision analysis. Philadelphia:
WB Saunders, 1980.11 Sox HC Jr, Blatt MA, Higgins MC, Marton KI. Medical decision making. Stoneham
(MA): Butterworths, 1988.12 Pauker SG. Clinical decision making: handling and analyzing clinical data. In: Bennett JC,
Plum F, eds. Cecil’s Textbook of Medicine, 20th edn. Philadelphia: WB Saunders,1996;78–83.
13 Panzer RJ, Black ER, Griner PF. Diagnostic strategies for common medical problems.Philadelphia: American College of Physicians, 1991.
14 Sackett DL, Richardson WS, Rosenberg W, Haynes RB. Evidence-based medicine: how topractice and teach EBM. New York: Churchill Livingstone, 1997.
15 Chapman GB, Bergus GR, Elstein AS. Order of information affects clinical judgment. JBehav Decision Making 1996;9:201–11.
16 Moskowitz AJ, Kuipers BJ, Kassirer JP. Dealing with uncertainty, risks, and tradeoffs inclinical decisions: a cognitive science approach. Ann Intern Med 1988;108:435–49.
17 Kassirer JP, Kopelman RI. Learning clinical reasoning. Baltimore:Williams & Wilkins, 1991.18 Joseph GM, Patel VL. Domain knowledge and hypothesis generation in diagnostic
reasoning. Med Decision Making 1990;10:31–46.19 Patel VL, Groen G. Knowledge-based solution strategies in medical reasoning. Cogn Sci
1986;10:91–116.20 Wigton RS, Hoellerich VL, Patil KD. How physicians use clinical information in
diagnosing pulmonary embolism: an application of conjoint analysis. Med Decision Making1986;6:2–11.
Andre_Chap10.qxd 11/6/01 3:03 PM Page 193

21 Groen GJ, Patel VL. Medical problem-solving: some questionable assumptions. Med Educ1985;19:95–100.
22 Brooks LR, Norman GR, Allen SW. Role of specific similarity in a medical diagnostic task.J Exp Psych: Gen 1991;120:278–87.
23 Eva KW, Neville AJ, Norman GR. Exploring the etiology of content specificity: factorsinfluencing analogic transfer and problem solving. Acad Med 1998;73(10 Suppl):S1–S5.
24 Elstein AS, Kleinmuntz B, Rabinowitz M, et al. Diagnostic reasoning of high- and low-domain knowledge clinicians: a re-analysis. Med Decision Making 1993;13:21–9.
25 Davidoff F. Who has seen a blood sugar? Reflections on medical education. Philadelphia:American College of Physicians, 1998.
26 Medin DL, Schaffer MM. A context theory of classification learning. Psychol Rev1978;85:207–38.
27 Norman GR, Coblentz CL, Brooks LR, Babcock CJ. Expertise in visual diagnosis: areview of the literature. Acad Med 1992;66:S78–S83.
28 Rosch E, Mervis CB. Family resemblances: studies in the internal structure of categories.Cogn Psychol 1975;7:573–605.
29 Lemieux M, Bordage G. Propositional versus structural semantic analyses of medicaldiagnostic thinking. Cogn Sci 1992;16:185–204.
30 Elstein AS. What goes around comes around: the return of the hypothetico-deductivestrategy. Teach Learn Med 1994;6:121–3.
31 Bordage G. Why did I miss the diagnosis? Some cognitive explanations and educationalimplications. Acad Med 1999;74:S138–S142.
32 Janis IL, Mann L. Decision-making. New York: Free Press, 1977.33 Anderson RC, Pichert JW. Recall of previously unrecallable information following a shift
in perspective. J Verb Learning Verb Behav 1978;17:1–12.34 Bartlett FC. Remembering: a study in experimental and social psychology. New York:
Macmillan, 1932.35 Sackett DL, Haynes RB, Guyatt GH, Tugwell P. Clinical epidemiology: A basic science for
clinical medicine, 2nd edn. Boston: Little, Brown and Company; 1991.36 Knottnerus JA. Application of logistic regression to the analysis of diagnostic data. Med
Decision Making 1992;12:93–108.37 Ebell MH. Using decision rules in primary care practice. Prim Care 1995;22:319–40.38 Meehl PE. Clinical versus statistical prediction:A theoretical analysis and review of the evidence.
Minneapolis: University of Minnesota Press, 1954.39 James PA, Cowan TM, Graham RP, Majeroni BA. Family physicians’ attitudes about and
use of clinical practice guidelines. J Fam Pract 1997;45:341–7.40 Hayward R, Wilson MC, Tunis SR, Bass EB, Guyatt GH, for the Evidence-Based
Medicine Working Group. Users’ guides to the medical literature.VIII: how to use clinicalpractice guidelines, A: are the recommendations valid? JAMA 1995;274:70–4.
41 Wilson MC, Hayward R, Tunis SR, Bass EB, Guyatt GH, for the Evidence-BasedMedicine Working Group. Users’ guides to the medical literature.VIII: how to use clinicalpractice guidelines, B: what are the recommendations and will they help me in caring formy patient? JAMA 1995;274:1630–2.
42 Col NF, Eckman MH, Karas RH, et al. Patient-specific decisions about hormonereplacement therapy in postmenopausal women. JAMA 1997;277:1140–7.
43 Tversky A, Kahneman D. Judgment under uncertainty: heuristics and biases. Science1974;185:1124–31.
44 Elstein AS. Heuristics and biases: selected errors in clinical reasoning. Acad Med1999;74:791–4.
45 Eddy DM. Probabilistic reasoning in clinical medicine: problems and opportunities. In:Kahneman D, Slovic P, Tversky A, eds. Judgment under uncertainty: Heuristics and biases.New York: Cambridge University Press; 1982;249–67.
46 Dawes, RM. Rational choice in an uncertain world. New York: Harcourt Brace Jovanovich,1988.
47 Tversky A, Kahneman D. The framing of decisions and the psychology of choice. Science1982;211:453–8.
48 Tversky A, Kahneman D. Advances in prospect theory: cumulative representation ofuncertainty. J Risk Uncertain 1992;5:297–323.
THE EVIDENCE BASE OF CLINICAL DIAGNOSIS
194
Andre_Chap10.qxd 11/6/01 3:03 PM Page 194

49 Fischhoff B, Bostrom A, Quadrell MJ. Risk perception and communication. Annu Rev PubHealth 1993;14:183–203.
50 Einhorn HJ, Hogarth RM. Decision making under ambiguity. J Business 1986;59(Suppl):S225–S250.
51 Tversky A, Koehler DJ. Support theory: a nonextensional representation of subjectiveprobability. Psychol Rev 1994;101:547–67.
52 Rottenstreich Y, Tversky A. Unpacking, repacking, and anchoring: advances in supporttheory. Psychol Rev 1997;104:406–15.
53 Redelmeier DA, Koehler DJ, Liberman V, Tversky A. Probability judgment in medicine:discounting unspecified probabilities. Med Decision Making 1995;15:227–30.
54 Wolf FM, Gruppen LD, Billi JE. Differential diagnosis and the competing hypothesesheuristic: A practical approach to judgment under uncertainty and Bayesian probability.JAMA 1985;253:2858–62.
55 Gruppen LD,Wolf FM, Billi JE. Information gathering and integration as sources of errorin diagnostic decision making. Med Decision Making 1991;11:233–9.
56 Edwards W. Conservatism in human information processing. In: Kleinmuntz B, ed.Formal representation of human judgment. New York, Wiley, 1969. pp. 17–52.
57 Wallsten TS. Physician and medical student bias in evaluating information. Med DecisionMaking 1981;1:145–64.
58 Poses RM, Cebul RD, Collins M, Fager SS. The accuracy of experienced physicians’probability estimates for patients with sore throats. JAMA 1985;254:925–9.
59 Kern L, Doherty ME. “Pseudodiagnosticity” in an idealized medical problem-solvingenvironment. J Med Educ 1982;57:100–4.
60 Hatala R, Norman GR, Brooks LR. Influence of a single example on subsequentelectrocardiogram interpretation. Teach Learn Med 1999;11:110–17.
61 Wason PC, Johnson-Laird PN. Psychology of reasoning: Structure and content. Cambridge(MA): Harvard University Press, 1972.
62 Bergus GR, Chapman GB, Gjerde C, Elstein AS. Clinical reasoning about new symptomsin the face of pre-existing disease: sources of error and order effects. Fam Med 1995;27:314–20.
63 Barrows HS. Problem-based, self-directed learning. JAMA 1983;250:3077–80.64 Barrows HS. A taxonomy of problem-based learning methods. Med Educ 1986;20:481–6.65 Schmidt HG. Problem-based learning: rationale and description. Med Educ 1983;
17:11–16.66 Norman GR. Problem-solving skills, solving problems and problem-based learning. Med
Educ 1988;22:279–86.67 Gruppen LD. Implications of cognitive research for ambulatory care education. Acad Med
1997;72:117–20.68 Bordage G. The curriculum: overloaded and too general? Med Educ 1987;21:183–8.69 Ludmerer KM. Time to heal: American medical education from the turn of the century to the
era of managed care. New York: Oxford University Press, 1999.70 Fagan TJ. Nomogram for Bayes’ theorem. N Engl J Med [Letter] 1975;293:257.71 Schwartz A. Nomogram for Bayes’ theorem. Available at http://araw.mede.uic.edu/
cgi-bin/testcalc.pl.
CLINICAL PROBLEM SOLVING AND DIAGNOSTIC DECISION MAKING
195
Andre_Chap10.qxd 11/6/01 3:03 PM Page 195

Andre_Chap10.qxd 11/6/01 3:03 PM Page 196

197
11 Improving test orderingand diagnostic costeffectiveness in clinicalpractice – bridging the gapbetween clinical researchand routine health careRON AG WINKENS, GEERT-JAN DINANT
Summary box
● In recent decades the number of diagnostic tests ordered bydoctors has increased enormously, despite the often absent ordisappointing results from studies into their accuracy.
● Contradictions between scientific evidence and daily practice canbe obstacles to improving test ordering behaviour.
● Evidence-based clinical guidelines are needed to formalise optimaldiagnostic performance, but will not work unless implementedproperly.
● There is no “one and only ideal implementation strategy”. Often, acombination of supportive interventions is the best approach.
● Interventions should provide both knowledge on what to do andinsight into one’s own performance. Such interventions are audit,individual feedback, peer review, and computer reminders.
● From a viewpoint of cost effectiveness, computer interventionslook promising.
Andre_Chap11.qxd 11/6/01 3:04 PM Page 197

THE EVIDENCE BASE OF CLINICAL DIAGNOSIS
198
Introduction
An important part of making a proper diagnosis is using diagnostic tests,such as blood and radiographic investigations. In recent decades the totalnumber of diagnostic tests ordered by doctors has increased substantially,despite the often disappointing results from studies into their diagnosticaccuracy. Apparently, arguments other than scientific ones for test orderingare relevant. Furthermore, it might be questioned to what extent currentknowledge, insights into the correct use of diagnostic tests, and results fromresearch have been properly and adequately implemented in daily practice.This chapter will discuss how to bridge the gap between evidence fromclinical research and routine health care.
The need to change
For several reasons there is a need to improve test ordering behaviour.The use of medical resources in western countries is growing annually andconsistently. In the Netherlands, for example, there is a relatively stablegrowth in nationwide expenditures for health care of approximately 7% peryear. The growth in expenditure for diagnostic tests is similar. However,whereas expenditure increases, health status does not seem to improveaccordingly. This at least suggests that there is a widespread and generaloveruse of diagnostic tests.
The following factors may be responsible for the increasing use ofdiagnostic tests. First, the mere availability and technological imperative ofmore test facilities is an important determinant. In view of the interactionbetween supply and demand in health care, the simple fact that tests can beordered will lead to their actual ordering. This applies especially to newtests, which are sometimes used primarily out of curiosity. Another factoris the increasing demand for care, caused partly by the ageing of the
● More attention must be paid to the perpetuation of interventionsonce they have been started, and to the measurement and scientificevaluation of their effects over time.
● Although the randomised controlled trial remains the “goldstandard” for evaluation studies, inherent methodologicalchallenges, such as the required randomisation of doctors, needspecial attention.
● More research into the ways to improve test ordering is urgentlyneeded, in particular for patients suffering from recurrent non-specific or unexplained complaints.
Andre_Chap11.qxd 11/6/01 3:04 PM Page 198

population and an increasing number of chronically ill people. Also, newinsights from scientific evidence and guidelines often provide recomm-endations for additional diagnostic testing.
Doctors might wish to perform additional testing once an abnormal testresult is found, even in the absence of clinical suspicion, while ignoring thata test result outside reference ranges may generally be found in 50% of ahealthy population. A cascade of testing may then be the result.
Furthermore, over the years, higher standards of care (adopted by thepublic, patients, and healthcare professionals) and defensive behavioursfrom doctors have contributed to the increased use of healthcare services,one of them being diagnostic testing.
In summary, despite the introduction of guidelines focusing on rationaluse of diagnostic tests, in daily practice reasons for ignoring evidence-basedrecommendations (such as fear of patients, and the doctor’s wish to gaintime) are numerous and hard to grasp.
Altogether, the ensuing problem is threefold. First, there are reasons tobelieve that some of the tests requested are non-rational. Second, contra-dictions between scientific evidence and daily practice can be ultimateobstacles to changing test ordering behaviour. And third, there is anincreasing tension between volume growth and financial constraints. Withthis in mind, it is clear that there is a need to achieve a more efficient useof diagnostic tests. If interventions meant to put a stop to the unbridledgrowth in the number of tests ordered were to focus especially on situationswhere their use is clearly inappropriate, healthcare expenditure might bereduced and the quality of care might even improve.
Can we make the change?
In terms of quality improvement and cost containment there are sufficientarguments for attempting to change test ordering behaviour. To do so, it isrecommended that certain steps be taken, from orientation to perpetuation.The individual steps are described in the implementation cycle1 (Figure 11.1).
Following the implementation cycle, several things need to be done.First, insight into the problem is needed. The problem needs to be welldefined and must be made clear to those whose performance we wish tochange. Next, the optimal – “gold standard” – situation should be deter-mined, and communicated as such. Usually this means the developmentand dissemination of guidelines. Also, an assessment of actual performance(the level of actual care) is needed. Then, the desired changes need to bedetermined and an implementation strategy set up to achieve the actualchange. After this, the results should be monitored. The outcome of thismonitoring can be used as new input for further improvement and fordefining new goals for quality assurance, thereby re-entering theimplementation cycle. It should be noted that these general rules apply
IMPROVING TEST ORDERING AND DIAGNOSTIC COST EFFECTIVENESS
199
Andre_Chap11.qxd 11/6/01 3:04 PM Page 199
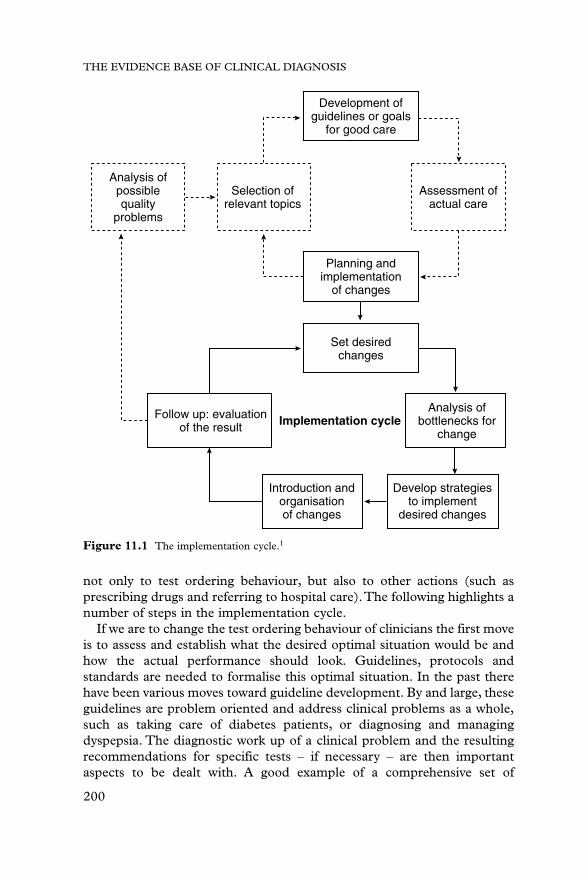
THE EVIDENCE BASE OF CLINICAL DIAGNOSIS
200
not only to test ordering behaviour, but also to other actions (such asprescribing drugs and referring to hospital care).The following highlights anumber of steps in the implementation cycle.
If we are to change the test ordering behaviour of clinicians the first moveis to assess and establish what the desired optimal situation would be andhow the actual performance should look. Guidelines, protocols andstandards are needed to formalise this optimal situation. In the past therehave been various moves toward guideline development. By and large, theseguidelines are problem oriented and address clinical problems as a whole,such as taking care of diabetes patients, or diagnosing and managingdyspepsia. The diagnostic work up of a clinical problem and the resultingrecommendations for specific tests – if necessary – are then importantaspects to be dealt with. A good example of a comprehensive set of
Development ofguidelines or goals
for good care
Planning andimplementation
of changes
Set desiredchanges
Follow up: evaluationof the result Implementation cycle
Analysis ofbottlenecks for
change
Introduction andorganisationof changes
Develop strategiesto implement
desired changes
Analysis ofpossiblequality
problems
Selection ofrelevant topics
Assessment ofactual care
Figure 11.1 The implementation cycle.1
Andre_Chap11.qxd 11/6/01 3:04 PM Page 200

guidelines is the development of standards for Dutch GPs by the DutchCollege of General Practitioners.2 Starting in 1989, the College has set upalmost 70 guidelines on a variety of common clinical problems. In themeantime, many of these standards have been revised in line with newevidence from scientific research. One of the guidelines specificallyaddresses the principles of rational ordering of blood tests.3
The development of guidelines does not automatically lead to the desiredbehavioural change, especially when their dissemination is limited to thedistribution of written material. In other words, simply publishing andmailing the guidelines does not make clinicians act accordingly.Implementation strategies are needed to bring about actual change.Implementation actually includes a whole range of activities to stimulatethe use of guidelines. Such activities may include communication andinformation, giving insight into the problem and the need to change, andspecific activities to achieve the actual change in behaviour.
One of the oldest and most frequently used interventions ispostgraduate continuous medical education (CME), varying fromlectures to comprehensive courses and training sessions. Nowadays, CMEis increasingly connected to (re)certification. Another intervention thatcan be considered an implementation strategy is written material throughbooks, papers in the literature, and protocol manuals. Although part ofthe written material is intended as a way to distribute research findingsand to increase the level of up to date scientific knowledge, amongclinicians it is often also focused as improving clinical performance.Thereis a range of interventions that combine the provision of knowledge withgiving more specific insight into one’s own performance. Such inter-ventions include audit, individual feedback, peer review, and computerreminders.
Audit represents a monitoring system on specific aspects of care. It isoften a rather formal system, set up and organised by colleges and regionalor national committees.4 The subject of an audit system may vary strongly,and the same applies for the intensity of the related interventions. Feedbackresembles audit in many ways, although it tends to be less formal and itsdevelopment is often dependent on local or even personal initiatives. Inpeer review, actual performance is reviewed by expert colleagues. Peerreview is used not only to improve aspects of clinical care, but also toimprove organisational aspects such as practice management. Anintervention that needs special attention is the provision of computerreminders. Having the same background and intentions as audit andfeedback, these do not generally involve the monitoring of the performanceof specific groups or individual doctors. Here the computer may take over,but the intention is still to provide knowledge and give insight into one’sown performance. From the viewpoint of the observed clinician,“anonymised” computer reminder systems may appear less threatening:
IMPROVING TEST ORDERING AND DIAGNOSTIC COST EFFECTIVENESS
201
Andre_Chap11.qxd 11/6/01 3:04 PM Page 201

there are no peers directly involved who must review the actions of thosewhose behaviour is monitored.
Organisational interventions are focused on facilitating or reducingcertain (diagnostic) actions. Examples are changing test ordering forms byrestricting the number of tests that can be ordered, and introducing specificprerequisites or criteria that must be met before a test is ordered.There aretwo structural implementation strategies that can be used to change testordering. Regulations include interventions where financial incentives orpenalties can be easily introduced. Reimbursement systems by health insurance companies or the government may act as a stimulus to urgeclinicians to move in the desired direction. Combinations of regulatory stepsand financial changes are also conceivable. In several western countries thehealthcare system includes payment for tests ordered by doctors, even if the tests are performed by another professional or institution. Adaptation ofthe healthcare regulations could change this payment system, which mightreduce the ordering of too many tests, thereby directly increasing clinicians’income. Even negative incentives for non-rational test ordering can be builtin, acting more or less as a financial penalty.
For obvious reasons we should seek and apply methods that bothimprove the rationality of test ordering and can stop the increase in the useof tests. Ideally, such instruments combine a more rational test orderingbehaviour with a reduction in requests.To determine these, a closer look atthe performance of the specific implementation strategies is needed.However, not all of these instruments have been used on a regular basis.Some have been regularly applied on a variety of topics (such as changingtest ordering), whereas others have been used only incidentally. Mostimplementation strategies try to change clinicians’ behaviour. Althoughevidence showing relevant effects is required to justify their implementationin practice, because of the nature of the intervention it is not alwayspossible to perform a proper effect evaluation. Especially in large-scaleinterventions, such as changes in the law or healthcare regulations(nationwide), it is virtually impossible to obtain a concurrent controlgroup. Nevertheless, a number of (randomised) trials have been performed,albeit predominantly on relatively small-scale implementation strategies.The next section gives an overview of the experience so far with most of theaforementioned instruments.
Is a change feasible?
Implementation strategies
As shown above, a variety of implementation strategies is available.However, not all of them are successful: some strategies have proved to beeffective, but others have been disappointing. This section gives a review
THE EVIDENCE BASE OF CLINICAL DIAGNOSIS
202
Andre_Chap11.qxd 11/6/01 3:04 PM Page 202

IMPROVING TEST ORDERING AND DIAGNOSTIC COST EFFECTIVENESS
203
of the literature to assess which implementation strategies are potentiallysuccessful and which are not. There have been a number of publishedreviews focusing on the effectiveness of implementation strategies.Although their conclusions vary, some general consensus can be observed:there are some implementation strategies that on the whole seem to fail andsome that are at least promising.
One of the reasons for the increasing use of tests is the simple fact that testsare both available and accessible. Consequently, a simple strategy would beto reduce the availability of tests on forms, or to request an explicitjustification for the test(s) ordered. Such interventions have by and largeproved to be effective, with a low input of additional costs and effort: Zaatand Smithuis5,6 found reductions of 20–50%. A drawback of theseinterventions, however, is that they risk a possible underuse of tests when thetest order form is reduced too extensively and unselectively. Therefore, thechanges to the form should be selected and designed very carefully.
Among the implementation strategies that have been used and studiedregularly in the past are audit and feedback. To that end, tests ordered arereviewed and discussed by (expert) peers or audit panels.Within this groupof interventions there is a huge variation in what is reviewed and discussed,in how often and to whom it is directed, and in the way the review ispresented. It may not be surprising that the evaluation of various types ofpeer review does not allow a uniform conclusion. An intervention withsubstantial effects, also proven in a randomised trial, was feedback given toindividual general practitioners, focusing on the rationality of testsordered.7 After 9 years there was a clear and constant reduction in test use,mainly due to a decrease in non-rational requests. Not all interventions areso successful. In studies by Wones8 and Everett,9 feedback was restricted toinformation about the costs of tests ordered; it did not show any effect.Nevertheless, there is evidence suggesting that feedback under specificconditions is an effective method to bring about change. Feedback is moreeffective when the information provided can be used directly in dailypractice, when the doctor is individually addressed, and when the expertpeer is generally respected and accepted.
An increasingly popular implementation strategy is the use of computerreminders. This is stimulated by the explosive growth in the use ofcomputer technology in health care, especially in the last decade. Theresults of computer reminders are promising. It appears to be a potentiallyeffective method requiring relatively little effort. Reminders have significantbut variable effects in reducing unnecessary tests, and seem to improveadherence to guidelines.10 To date, there are relatively few studies oncomputer reminders. It may be expected, however, that in the near futuremore interventions on the basis of computer reminders will be performedas a direct spin-off of the growing use of computer-supported communi-cation facilities in health care.
Andre_Chap11.qxd 11/6/01 3:04 PM Page 203

THE EVIDENCE BASE OF CLINICAL DIAGNOSIS
204
For one implementation strategy in regular use it is clear that the effectson test ordering behaviour are only marginal, if not absent. For many yearsmuch effort has been put into postgraduate education courses and inwriting papers for clinical journals. The goal of both is to improve theclinical competence of a large target group. Nowadays there is evidence thatthe direct effects of these methods are disappointing. In a recently publishedsystematic Cochrane Review, Davis et al.11 concluded that “didacticsessions do not appear to be effective in changing physician performance”.In another Cochrane Review by van der Weijden et al.,12 it was found thatthe effects of written material on test ordering was small.
Perpetuation and continuation
One aspect that needs more attention in the future is the perpetuation ofinterventions once they have been started. It is by no means assured thateffects, when achieved, will continue when the intervention itself isstopped. In most studies, the effects after stopping the intervention are notmonitored. As one of the exceptions,Tierney13 performed a follow up afterending his intervention through computer reminders on test ordering.Theeffects of the intervention disappeared 6 months after it was stopped. Onthe other hand,Winkens7 found that feedback was still effective after beingcontinued over a 9-year period. This argues in favour of a continuation ofan implementation strategy once it is started.
Evaluating the effects
There is a growing awareness that the effects of interventions are by nomeans guaranteed. Consequently, to discriminate between interventionsthat are successful and those that are not, we need evidence from scientificevaluations. However, after a series of decades where many scientificevaluations of implementation strategies have been performed and anumber of reviews have been published, many questions remain and finalconclusions cannot yet be drawn. In a dynamic environment such as the(para)medical profession, it is almost inevitable that the effects ofinterventions are dynamic and variable over time too. Hence there willalways be a need for scientific evaluation.
As is the case with all scientific evaluations, there are quality criteria thatstudies should meet.14 Regarding these criteria, evaluation studies onimplementation strategies do not essentially differ from other evaluations.The randomised controlled trial still remains the “gold standard”.However, there are some circumstances that need special attention.15 Astriking one is the following. In most studies on improving test orderingbehaviour, the doctor is the one whose decisions are to be influenced.Thisautomatically means that the unit of randomisation, and hence the unit of
Andre_Chap11.qxd 11/6/01 3:04 PM Page 204

IMPROVING TEST ORDERING AND DIAGNOSTIC COST EFFECTIVENESS
205
analysis, is the individual doctor. As the number of doctors participating ina study is often limited, this may have a considerably negative effect on thepower of the study. A potential solution to this problem may be found inmultilevel analyses.16
Cost effectiveness of implementation
As far as the cost effectiveness of intervention strategies is concerned,those that combine good effects with the least effort and lowest costs are tobe preferred. On the other hand, we may question whether strategies thatso far have not proved to be effective should be continued. Should wecontinue to put much effort into CME, especially in single training coursesor lectures? Who should we try to reach through scientific and didacticpapers: the clinicians in daily practice, or only the scientist and policymaker with special interest? Should we have to choose the most effectiveintervention method, regardless of the effort that is needed? If we start anintervention to change test ordering, does this mean it has to be continuedfor years? There is no general answer to these questions, although thevarious reviews that have been published argue in favour of combined,tailormade interventions. How such a combination is composed dependson the specific situation (such as local needs and healthcare routines, andthe availability of experts and facilities). Generalisable recommendationsfor specific combinations are therefore not possible or useful. However, ifwe look at costs in the long term, computer interventions look quitepromising.
From scientific evidence to daily practice
An important objective in influencing test ordering behaviour is thechange in the rationality and volume of orders, thereby reducing costs orachieving a better (so-called) cost–benefit ratio. However, the ultimategoal is to improve the quality of care for the individual patient. It might beasked to what extent patients are willing to pay for expensive diagnosticactivities, weighing the possibility of achieving better health through doing(and paying) the diagnostics, versus the risk of not diagnosing the diseaseand staying ill (or getting worse) because of not doing so. In other words,how is the cost–utility ratio of diagnostic testing assessed by the patient?In this context the specific positive or negative (side) effects of (not)testing on the health status of the individual patient are difficult to assessindependently of other influences. On the other hand, a reduced use inunnecessary, non-rational tests is not likely to cause adverse effects for theindividual.
Andre_Chap11.qxd 11/6/01 3:04 PM Page 205

Despite the increasing research evidence showing the need for changesin test ordering behaviour, doctors will always decide on more than merelyscientific evidence when the question whether or not to order a test for acertain patient is at stake.17 Low diagnostic accuracy or high costs of testingmay conflict with a patient’s explicit wish to have tests ordered, or with thedoctor’s wish to gain time, the fear of missing an important diagnosis, hisor her feeling insecure, and the wish of both patient and doctor to bereassured.These dilemmas are influenced by a variety of doctor and patientrelated aspects. Regarding the doctor, one could think of the way in whichthey were trained, how long they have been active in patient care, thenumber of patients on their list, their relationship with their patients, andtheir personal experience with “missing” relevant diseases in the past. Thepatient might suffer from a chronic disease, or from recurrent vague orunexplained complaints, making them question the skills of the doctor. Forthis latter category of patients in particular, doctors might order more teststhan are strictly necessary. Research into the ways of improving testordering in these situations is urgently needed.
References
1 Grol RPTM, van Everdingen JJE, Casparie AF. Invoering van richtlijnen en veranderingen.Utrecht, De Tijdstroom:1994.
2 (a) Geijer RMM, Burgers JS, van der Laan JR, et al. NHG-Standaarden voor de huisarts I,2nd edn. Utrecht, Bunge:1999.(b) Thomas S, Geijer RMM, van der Laan JR, et al. NHG-Standaarden voor de huisarts II. Utrecht, Bunge:1996.
3 Dinant GJ, van Wijk MAM, Janssens HJEM, et al. NHG-Standaard Bloedonderzoek.Huisarts Wet 1994;37:202–11.
4 Smith R. Audit in action. London, BMJ Publishers:1992.5 Zaat JO, van Eijk JT, Bonte HA. Laboratory test form design influences test ordering by
general practitioners in the Netherlands. Med Care 1992;30:189–98.6 Smithuis LOMJ, van Geldrop WJ, Lucassen PLBJ. Beperking van het laboratorium-
onderzoek door een probleemgeorienteerd aanvraagformulier [abstract in English].Huisarts Wet 1994;37:464–6.
7 Winkens RAG, Pop P, Grol RPTM, et al. Effects of routine individual feedback over nineyears on general practitioners’ requests for tests. BMJ 1996;312:490.
8 Wones RG. Failure of low-cost audits with feedback to reduce laboratory test utilization.Med Care 1987;25:78–82.
9 Everett GD, de Blois CS, Chang PF, Holets T. Effects of cost education, cost audits, andfaculty chart review on the use of laboratory services. Arch Intern Med 1983;143:942–4.
10 Buntinx F, Winkens RAG, Grol RPTM, Knottnerus JA. Influencing diagnostic andpreventive performance in ambulatory care by feedback and reminders. A review. FamPract 1993;10:219–28.
11 Davis D, O’Brien MA, Freemantle N, et al. Impact of formal continuing medicaleducation: do conferences, workshops, rounds, and other traditional continuing educationactivities change physician behavior or health care outcomes? JAMA 1999;282:867–74.
12 van der WeijdenT, Wensing M, Grol RPTM, et al. Interventions aimed at influencing theuse of diagnostic test. The Cochrane Library 2001 (accepted for publication).
13 Tierney WM, Miller ME, McDonald CJ. The effect on test ordering of informingphysicians of the charges for outpatient diagnostic tests. N Engl J Med 1990;322:1499–504.
THE EVIDENCE BASE OF CLINICAL DIAGNOSIS
206
Andre_Chap11.qxd 11/6/01 3:04 PM Page 206

14 Pocock SJ. Clinical trials: a practical approach. Chichester, John Wiley & Sons: 1991.15 Winkens RAG, Knottnerus JA, Kester ADM, Grol RPTM, Pop P. Fitting a routine
health-care activity into a randomized trial: an experiment possible without informedconsent? J Clin Epidemiol. 1997;50:435–9.
16 Campbell MK, Mollison J, Steen N, Grimshaw JM, Eccles M. Analysis of clusterrandomized trials in primary care: a practical approach. Fam Pract 2000; 17: 192–6.
17 Knottnerus JA, Dinant GJ. Medicine-based evidence, a prerequisite for evidence-basedmedicine. BMJ 1997;315:1109–10.
IMPROVING TEST ORDERING AND DIAGNOSTIC COST EFFECTIVENESS
207
Andre_Chap11.qxd 11/6/01 3:04 PM Page 207

Andre_Chap11.qxd 11/6/01 3:04 PM Page 208

209
12 Epilogue: overview ofevaluation strategy andchallengesJ ANDRÉ KNOTTNERUS
Summary box
● The first phase in the evaluation of diagnostic procedures consistsof (1), specifying the clinical problem, the diagnostic procedures(s),and the research question; (2), a systematic search and review of theliterature, to decide whether the question can already be answeredor whether a new clinical study is necessary.
● In preparing a new clinical study, the investigator must decideabout the need for (1), evaluation of test accuracy in circumstancesof maximum contrast or, as a further step, in the “indicated”clinical population; (2), evaluation of the impact of the test onclinical decision making or prognosis. The answers to thesequestions are decisive for the study design.
● Systematic reviews and meta-analysis, clinical decision analysis,cost effectiveness analysis, and expert panels can help to constructand update clinical guidelines.
● Implementation of guidelines should be professionally supportedand evaluated, in view of what is known about how cliniciansapproach diagnostic problems.
● Further developments in three fields are especially important:innovation of (bio)medical knowledge relevant for diagnostic testing;the development of information and communication technology inrelation to clinical research and practice; and, further exploration ofmethodological challenges in research on diagnostic problems.
Andre_Chap12.qxd 11/6/01 3:05 PM Page 209

THE EVIDENCE BASE OF CLINICAL DIAGNOSIS
210
Introduction
The chapters in this book speak for themselves and there is no need torepeat them or summarise their contents. However, a compact overview ofimportant steps in the evaluation of diagnostic procedures may be useful.In addition, challenges for future work are outlined.
Important steps
The most important steps are represented in a flow diagram of theevaluation strategy (Figure 12.1), with reference to chapters in the book.
The first step is to specify the clinical problem and the diagnosticprocedure(s) to be evaluated, and the aim of the study. Are we looking for the(added) diagnostic value of the procedure, the impact of the procedure onclinical management or on the patient’s prognosis, or its cost effectiveness?After having formulated the research question accordingly, we should searchand systematically review the literature and decide whether sufficient researchdata are already available. If not, a new clinical study should be considered.
In preparing a clinical study, to choose the appropriate design thefollowing questions need to be answered: (1) is evaluation of accuracy of thetest procedure in ideal circumstances of maximum contrast (still) necessary?(2) has this already been successfully achieved, and should accuracy still beestablished in the “indicated” clinical population? (3) is the impact of thediagnostic procedure on clinical decision making or prognosis yet unknown?The answers to these questions are decisive for the study design, as shown in Figure 12.1. It is sometimes possible to include more than onetype of design in one study. For example, test accuracy can sometimes bedetermined in the context of a randomised trial or a before–after study.
In preparing and reporting the results of a clinical study, thegeneralisability or external (clinical) validity should be carefully considered.If the study is unique with regard to clinical applicability, the resultsrepresent an important evidence base themselves. More often theycontribute to a broader knowledge base and can be included in a systematicreview or meta-analysis. Clinical decision analysis, cost effectivenessanalysis, and expert panels are helpful in constructing or updating clinicalguidelines. The implementation of guidelines in clinical practice should beprofessionally supported and evaluated, in view of the acquired insightsinto the way clinicians approach diagnostic problems.
Challenges
Throughout this book a comprehensive range (“architecture”) ofmethodological options have been described. At the same time, it hasbecome clear that there are important challenges for future work.
Andre_Chap12.qxd 11/6/01 3:05 PM Page 210

OVERVIEW OF EVALUATION STRATEGY
211
Specify clinical problem and diagnostic procedure(s) to be evaluated
Formulate the research question
Search and systematic review of the literature (Chapters 1, 8)
Yes Sufficient data to answer research question?
Perform Phase I/IIstudy (Chapters 2, 7)
Perform Phase III study(Chapters 2, 3, 6, 7, 9)
No
No
No
No
Evaluation of accuracy of testprocedure in ideal circumstances ofmaximum contrast (still) necessary?
Evaluation of accuracy of testprocedure in “indicated” clinical
population (still) necessary?
Diagnostic RCT (still)appropriate and possible?
Evaluation of impact of testprocedure on prognosis or clinicaldecision making (still) necessary?
Yes
Perform Phase IV study:Diagnostic Randomised trial(Chapter 2, 4)
Report results of clinical study, and consider external(clinical) validity (Chapters 1–7)
Systematic review,meta-analysis,(Chapters 1, 8)
Clinical decision analysis, cost effectiveness analysis,expert consensus, (re)construction of clinical guidelines,ICT support, (evaluation of) implementation, guided by
insight in clinical problem solving (Chapters 1, 9–11)
Yes RCT still relevant, and possible?
Observational study: before–after study, cohort study,case–control study (Chapters 1, 5, 9)
No: → clinical study
Specify aim(s) of the evaluation study: evaluation of• (added) diagnostic value of the procedure• impact of the procedure on clinical management• impact of the procedure on prognosis/patient’s health• cost effectiveness of the procedure
No
Yes
Yes
Yes
Figure 12.1 Important steps in the evaluation of diagnostic procedures.
Andre_Chap12.qxd 11/6/01 3:05 PM Page 211
THE EVIDENCE BASE OF CLINICAL DIAGNOSIS
212
Developments in three fields are especially important. First, (bio)medicalknowledge will continue to be innovated, cumulated and refined. Second,information and communication technology will further develop and itsuse in daily practice will be more and more facilitated. Third, in researchon diagnostic problems, methodological requirements and limitations areto be increasingly explored.
Innovation of biomedical knowledge and understanding ofpathophysiological processes are the principal requirements for thedevelopment and evaluation of better diagnostic tests. A clear example isthe current work to develop DNA tests in various clinical fields. In futurethese will not only be supportive of genetic counselling and prenatalscreening, but also for clinical diagnostic and prognostic purposes. Inaddition, the ambition is to use DNA testing to improve the targeting anddosing of therapeutic and preventive interventions (“diagnostic effectmodification”). Much work in this field is being done, for example, incardiovascular medicine,1 oncology,2,3 and psychiatry.4 However, it will bequite some time before these promises will really have an impact on dailypatient care. Considerable efforts are still needed, both in the laboratoryand in clinical epidemiological research. It was recently shown that theclinical epidemiological quality of many molecular genetic studies waspoor: of 40 evaluated research papers, 35 failed to comply with one or moreof seven essential methodologic criteria.5 Furthermore, long-term followup to clinically validate diagnostic and prognostic predictions needs moreattention. In view of the ambition to develop a more tailormade, perhapseven individualised, diagnostic process, population oriented validations willbe increasingly unsatisfactory. Also, ethical issues regarding the privacy ofgenetic information and the right to (not) know have to be dealt with.Doctors and patients, traditionally struggling to reduce diagnostic andprognostic uncertainty, must now learn to cope with approaching certainty.
Although until now computer decision support systems seem to have hadmore impact on the quality of drug dosing and preventive care than ondiagnosis,6 the growing body and complexity of knowledge enhances theneed for (online) diagnostic support systems. The development andevaluation of such systems will therefore remain an important challenge.The same applies to the provision of appropriate input, that is, validdiagnostic and prognostic knowledge. However, performing individualstudies in large study populations is very expensive and will always coveronly a limited part of diagnostic management. Moreover, such studies mayproduce results with rather limited generalisability in place and time.Consequently, ways are sought to more efficiently and permanently harvestclinical knowledge and experience. It is therefore worth consideringwhether and under what conditions accuracy studies, RCTs, quasi-experimental studies, and before–after studies can be more embedded inroutine health care.7 In view of continuity, up to date results, and (external)
Andre_Chap12.qxd 11/6/01 3:05 PM Page 212

clinical validity, much is expected from standardised clinical databases,with international connections, to be used as sampling frames for research.As these databases will be closely related to or even integrated into routinehealth care, additional efforts are required to meet basic quality andmethodological standards and to avoid biases, as discussed in Chapter 10.8
In the context of such an integrated approach, the implementation of newfindings can be studied and monitored in real practice.9–11
Diagnostic research should be refined with respect to strategy, spectrumand selection effects, prognostic reference standards,12 and the assessmentof the clinical impact of testing. Data analysis needs progress with regardto “diagnostic effect modification”, multiple test and disease outcomecategories, and estimation of sample size for multivariate problems. Inaddition, more flexible modelling is needed to identify alternative butclinically and pathophysiologically equivalent models, appropriate toclassify subgroups with varying sets of clinical characteristics with amaximum of predictive power.13,14 Better methods to improve and evaluateexternal clinical validity are also required. Furthermore, one must neitherforget nor underestimate the diagnostic power of “real life doctors”: atleast, the performance of proposed diagnostic innovations should becompared with the achievements of experienced clinicians, before they arerecommended as bringing new possibilities. We also need moreunderstanding of the “doctor’s black box” of diagnostic decision making,using cognitive psychological methods. This can help in more efficientdiagnostic reasoning, and in the development of custom-made supportsystems.15 Efficiency and speed in the evaluation of the impact ofdiagnostic procedures can be gained if new data on a specific aspect (forexample a diagnostic test) can be inserted into the mosaic of availableevidence on a clinical problem, rather than studying the whole problemagain whenever one element has changed. For this purpose, flexiblescenario models of current clinical knowledge are needed.
Systematic review and meta-analysis of diagnostic studies16,17 must becomea permanent routine activity of professional organisations producing andupdating clinical guidelines. Meta-analysis should not only be performedon already reported data, but increasingly also on original and evenprospectively developing databases. Such databases can originate fromspecific (collaborative) research projects, but sometimes also from healthcare (for example clinics where systematic work ups for patients withsimilar clinical presentations are routine, and where the populationdenominator is well defined). Accordingly, meta-analysis, evaluationresearch, and health care can become more integrated.
The role of the patient in diagnostic management is becoming moreactive. People want to be involved in the decision as to what diagnostics areperformed, and want to know what the outcome means to them. Patientdecision support facilities, at the doctor’s office and at home, using e-mail
OVERVIEW OF EVALUATION STRATEGY
213
Andre_Chap12.qxd 11/6/01 3:05 PM Page 213

or internet services, are receiving increasing attention. Clinicians have tothink about their possible future role in sifting, explaining, and integratinginformation via these facilities. The question as to which level of certaintyis worth which diagnostic procedures, is not always similarly answered bypatients and doctors. Patients’ perceptions, preferences, and responsibilitiesshould be respected and supported, not excluded, in diagnostic researchand guidelines.18 Sometimes, however, these features are not easilymeasurable and show substantial inter- and intrasubject variability. A goodpatient–doctor dialogue therefore remains the core instrument ofindividual decision making.19
Last but not least, formal standards for the evaluation of diagnostics are needed to control acceptance, maintenance, and substitution in thehealthcare market. This also requires high quality and transparency ofevaluation reports. The initiative to reach international agreement onStandards for Reporting Diagnostic Accuracy (STARD) therefore deservesfull support from the scientific and healthcare community.20
References
1 Aitkins GP, Christopher PD, Kesteven PJL, et al. Association of polymorphisms in thecytochrome P450 CYP2C9 with warfarin dose requirement and risk of bleedingcomplications. Lancet 1999;353:717–19.
2 McLeod HL, Murray GI. Tumour markers of prognosis in colorectal cancer. Br J Cancer1999;79:191–203.
3 Midley R, Kerr D. Towards post-genomic investigation of colorectal cancer. Lancet 2000;355:669–70.
4 Joober R, Benkelfat C, Brisebois K, et al. T102C polymorphism in the 5HTA gene andschizophrenia: relation to phenotype and drug response variability. J Psychiatry Neurosci1999;24:141–6.
5 Bogardus ST Jr, Concato J, Feinstein AR. Clinical epidemiological quality in moleculargenetic research. The need for methodological standards. JAMA 1999;281:1919–26.
6 Hunt DL, Haynes RB, Hanna SE, Smith K. Effects of computer-based clinical decisionsupport systems on physician performance and patient outcomes: a systematic review.JAMA 1998;280:1339–46.
7 van Wijk MA, van Der Lei J, Mosseveld M, Bohnen AM, van Bemmel JH. Assessment ofdecision support for blood test ordering in primary care. A randomized trial. Ann InternMed 2001;134:274–81.
8 Knottnerus JA. The role of electronic patient records in the development of generalpractice in the Netherlands. Meth Info Med 1999;38:350–5.
9 Haines A, Rogers S. Integrating research evidence into practice. In: Silagy C, Haines A,eds. Evidence based practice in primary care. London: BMJ Books, 1998;pp.144–59.
10 Baker R, Grol R. Evaluating the application of evidence. In: Silagy C, Haines A, eds.Evidence based practice in primary care. London: BMJ Books, 1998;pp.75–88.
11 Kidd M, Purves I. Role of information technology. In: Silagy C, Haines A, eds. Evidencebased practice in primary care. London: BMJ Books, 1998;pp.123–8.
12 Lijmer JG. Evaluation of diagnostic tests: from accuracy to outcome. Thesis. Amsterdam:University of Amsterdam, 2001.
13 Heckerling PS, Conant RC, Tape TG, Wigton RS. Reproducibility of predictor variablesfrom a validated clinical rule. Med Decision Making 1992;12:280–5.
14 Knottnerus JA. Diagnostic prediction rules: principles, requirements and pitfalls. PrimaryCare 1995;22:341–63.
THE EVIDENCE BASE OF CLINICAL DIAGNOSIS
214
Andre_Chap12.qxd 11/6/01 3:05 PM Page 214

15 Friedman CP, Elstein AS,Wolf FM, et al. Enhancement of clinicians’ diagnostic reasoningby computer-based consultation: a multisite study of 2 systems. JAMA 1999;282:1851–6.
16 Irwig L, Tosteson AN, Gatsonis C, et al. Guidelines for meta-analyses evaluatingdiagnostic tests. Ann Intern Med 1994;120:667–76.
17 Kester AD, Buntinx F. Meta-analysis of ROC curves. Med Decision Making 2000;20:430–39.
18 Nease RF, Owens DK. A method for estimating the cost-effectiveness of incorporatingpatient preferences into practice guidelines. Med Decision Making 1994;14:382–92.
19 Sackett DL. Evidence-based medicine. Semin Perinatol 1997;21:3–5.20 STARD Steering Committee. The STARD project. Standards for Reporting Diagnostic
Accuracy. Amsterdam: Department of Clinical Epidemiology, Academic Medical CenterAmsterdam, 16–17 December 2000.
OVERVIEW OF EVALUATION STRATEGY
215
Andre_Chap12.qxd 11/6/01 3:05 PM Page 215

Andre_Chap12.qxd 11/6/01 3:05 PM Page 216

217
abnormal test results, randomising66, 67
abstractions, construction of 183, 190accuracy 39–59, 117, 145–166additional testing 46, 199
see also before-after studiesadjustment, diagnostic opinions 188adverse effects 3, 55, 62aetiologic data analysis 7, 56, 57allocation concealment 62, 77ambispective approach 45analysis of variance 156anchoring, diagnostic opinions 89, 188angiography, as “gold” standard 7–8appendicitis
abdominal rigidity 35reference standard for tests 101right lower quadrant tenderness
33–4study profile flow diagram 110ultrasonography/clinical assessment
RCT 77–8architecture, diagnostic research 19–37
“normal” and “normal range” 21–4research question 24–37
Phase I studies 25–6Phase II studies 26–8Phase III studies 28–33Phase IV studies 36–7
summary 19–20area under ROC curve 5, 99, 109,
117, 128, 129pooling 160
artefactual variation 95, 96, 100asthma, long-acting � agonists study
174–5asymptomatic disease, population
screeningbreast cancer 13Phase IV questions 36study population 53
audit 201, 203automatic mental processes 191–2availability bias 192
background information 154bayesian approach, data interpretation
and diagnosis 181–2, 190–1bayesian properties, diagnostic
tests 36Bayes’ theorem 47, 97, 98, 117, 130–2,
179, 180, 181, 184–6, 189before-after studies 11, 12, 13, 81–93
limitations 92research question 83–6summary 81–2working out study 86–92
diagnostic testing 87–8modified approaches 91–2post-test outcome 88–9pretest baseline 86–7sample size and analysis 91study subjects, selection 90–1time factor 89–90
behavioural decision research 180, 181,187, 192
best evidence synthesis 154between-population variability 112between-site variability 112, 113bias 135
availability 192“confirmation” 189incorporation 49, 51observer 9in phase III studies 32publication 148selection 8, 150, 192spectrum 8“test review” and “diagnosis review”
48–9verification 152
bivariate analysis 40, 56
Index
Page numbers in bold type refer to figures; those in italic refer to tables or boxedmaterial
Andre_Index.qxd 11/7/01 10:48 AM Page 217

INDEX
218
blinding 9, 31, 48, 51before-after studies 81, 89delayed-type cross-sectional studies
50randomised controlled trials 62, 77
blood pressure, therapeutic definitionof “normal” 23
blood tests, routine 10breast cancer screening 13B-type natriuretic peptide (BNP), LVD
diagnosis 20–1“normal” and “normal” range
21–4research question 24–5
Phase I 25–6Phase II 26–8Phase III 28–31
CAGE questionnaire, data extractiondifficulties 153
calibration, diagnostic tests 97–8, 99,107, 109
CARE consortium 35–6carotid stenosis, duplex
ultrasonography, prognosticvalue 63–4, 65, 66, 67
case-control study 11, 12, 13case-referent study 11, 12, 44
sample size estimation 55case specificity 182, 190categories
case diagnosis 183test results 107
thresholds between 98central randomisation procedure 77chance-adjusted agreement, systematic
reviews 146, 150citation tracking 148–9clinical decision analysis 14, 185,
186clinical prediction rules 7, 111, 185clinical problem
defining 42–3, 210see also target condition
clinical signs, appendicitis diagnosis33–5, 77–8
clinical spectrum see spectrumclinicians
blinding to allocation 77doctor as unit of randomisation
204–5
Cochrane Methods Group onScreening and Diagnostic Tests150
coded data, medical records 174cognitive research literature review
179–93diagnosis as opinion revision 184–6educational implications 189–91hypothesis generation and
restructuring, errors in 184hypothesis selection 181–2methodological guideline 191–2pattern recognition 182–3probability estimation, errors in 186–8probability revision, errors in 188–9summary 179–80
cohort studies 11, 12, 13colorectal cancer screening, systematic
review 36–7combined predictive power 56comorbidity 54, 85complications of test see adverse effectsconfidence intervals 56, 117, 121–3
tables 136–43theory of calculation 123
“confirmation bias” 189confounding by indication 50, 174–5confounding probability 188confounding variables 47, 56, 85, 91“conjunction fallacy” 186consensus methods 11, 14conservatism 188context
and long-term memory activation184
reducing dependence on 190continuous medical education (CME)
201, 205continuous tests 107
dichotomisation andtrichotomisation 126–30
weighted linear regression 160contrast evaluation, defining research
question 39, 41cost effectiveness 5, 11, 14
changing test ordering 205costs
changes in 11diagnostic tests 6randomised controlled trial designs
76
Andre_Index.qxd 11/7/01 10:48 AM Page 218

cost-utility ratio, diagnostic testing 205covariables 56, 87critiquing systems 172cross-sectional studies 1, 11, 12,
39–57adverse effects 55delayed type 7, 50–1design outline 43–5external validation 57operationalising determinants and
outcome 45–52research question 41–3statistical aspects 55–7study population, specifiying 53–4summary 39–40
of steps to take 41“culturally desirable” definition of
normal 22–3cumulative prospect theory (CPT) 187cut point for test 5, 98, 117, 128, 129
decision analytical approach 132–3searching for in meta-analysis 155–6selection of 33SROC curve 157, 158, 159
formula 165
data analysis 7, 41, 56–7, 117–43, 213Bayes’ theorem 130–2before-after studies 91clinical example 118–20confidence intervals 121–3
tables 136–43cut-off value, decision analytical
approach 132–3dichotomisation and
trichotomisation, continuoustests 126–30
error rate 124–5likelihood ratio 125–6
see also likelihood ratio (LR)logistic regression 133–5odds ratio 126
see also odds ratio (OR)pre- and post-test probability 123–4,
130–2see also post-test probability;
pretest probabilitysensitivity analysis 133sensitivity and specificity,
dichotomous test 120–1see also sensitivity; specificity
software 135, 136
summary 117–18systematic reviews 153–61see also subgroup analysis
databases 171, 213observational 172–5, 176searching electronic 147–9, 162
data collection 41direction of 44–5selective 181thoroughness of 182
data extraction, systematic reviews152–3
data interpretation in problem solving181–2
data presentation, systematic reviews161–2
decision analysis approach 14, 185,186
decision making 179, 213behavioural decision research 180,
181, 187, 192calibration, test results 107diagnosis as opinion revision
184–6process 3, 5, 6randomisation at time of decision
71, 72, 79decision support 167–76
observational databases 172–5summary 167–8systems 171–2, 212
delayed type cross-sectional studies 7,50–1
dependent variables 45, 46, 56design 1, 11–15, 210
before-after studies see before-afterstudies
cross-sectional studies 11, 12, 39, 41,43–5
randomised controlled trials (RCT)12–13, 61
alternative 68–9choice of 74, 75–6comparing test strategies
69–74practical issues 76–8single test 64–7
determinants, operationalising 39, 41,45–7
developmental screening in childhoodtrial 37
“diagnosis review bias” 49
INDEX
219
Andre_Index.qxd 11/7/01 10:48 AM Page 219

diagnostic accuracy studies seecross-sectional studies
diagnostic certainty, increasing 3diagnostic classification 40diagnostic definition of normal 23diagnostic odds ratio (DOR) see odds
ratio (OR)diagnostic prediction model 56dichotomous tests 126–9
comparing prognostic value 69–71data analysis 56meta-analysis 152–3sample size estimation 55sensitivity and specificity 120–1
disclosure, test results, random 37,71, 73
discordance rate calculations 78, 79discordant test results, randomising
71, 72, 79discrimination of test 107
measures of 3, 4, 12, 97, 99, 109see also likelihood ratio (LR); odds
ratio (OR); predictive value;sensitivity; specificity
and usefulness of test 9–10for various target disorders 5
diseasedefinitions of 98monitoring course 3ratio to non-disease 98spectrum of 98, 102–3see also target condition
distribution, test results, transferability98, 99
DNA testing 52, 212Doppler ultrasonography, umbilical
artery RCT 68–9duplex ultrasonography
patient selection, anticoagulation inacute stroke 65, 66
prognostic value 63–4, 65, 66, 67Dutch College of General Practitioners
201
echocardiography study, LVD patients28, 29
ectopic pregnancy, serum hCG test106
educational implications, cognitiveinstructional theory 189–91
effect modifying variables 46, 47, 56,85, 87, 91
electronic literature databases,searching 147–9, 162
electronic medical records 167–8, 169,170–1, 176
observational databases 172–5Elias medical record system 170–1EMBASE, searching 147endoscopy
FEESST trial 72, 73therapeutic impact study 10
error rate 124–5, 132, 133see also standard error, calculating
erythrocyte sedimentation rate (ESR)studies
accuracy and reproducibility 47pre- and post-test assessment 83–4
evidence-based clinical guidelines 197evidence-based medicine (EBM) 185,
186, 189, 190–1exclusion criteria 13, 41, 53–4exemplar based recognition 183exercise ECG in primary care 51–2expected utility theory 187expert panel 50, 51experts
clinical reasoning 180, 182, 183consulting to identify studies 148
explanatory studies, diagnostic testsand treatments 27, 28
external (clinical) validation 40, 54, 57,210, 212–13
external validity criteria 150urine dipsticks in UTI reviews 151
faecal occult blood testing, systematicreview 36–7
feedback 190, 201, 203financial incentives/penalties, test
ordering 202findings, synthesising with clinical
expertise 13–14Fisher’s exact test 154fixed effect model, statistical pooling
157, 159flexible endoscopic evaluation of
swallowing with sensory testing(FEESST) trial 72, 73
flow diagram, research questionformulation 110
formschanging test ordering 202, 203data extraction 153
INDEX
220
Andre_Index.qxd 11/7/01 10:48 AM Page 220

forward reasoning 183free text in medical records 173funding, diagnostic evaluation studies 2
Galbraith plot 156, 157gaussian definition of normal 21general models, need for 11generic search strategy 147genetic tests, breast cancer 74
see also DNA testingglobal measures, test accuracy
97, 109“gold” standard see reference standardguidelines
clinical 197, 210methodological 191–2systematic reviews 145–63
data analysis 153–61data extraction 152–3data presentation 161–2how to search literature 147–9inclusion criteria 149–52summary 145–6
test ordering 199, 200, 201
Hawthorne effect 45healthcare expenditure 198healthcare setting 42
accuracy of test 103, 104effect of 33–6, 95, 96systematic reviews 149transferability between settings
112–14health status, baseline 85, 87Helicobacter pylori serology study,
evaluating preaddition 74, 75heterogeneity 114
in meta-analysisdealing with 156–7, 158dipstick example 152, 157, 158searching for 154, 155statistical pooling 158–9
predictors of in diagnostic accuracy112, 113
history data 3, 45homogenous studies, statistical pooling
158human chorionic gonadotrophin
(hCG) test, ectopic pregnancy106
hypothesis generation 179, 181, 183errors in 184
hypothetico-deductive method 181–2experienced clinicians 182
implementation cycle 199, 200implementation research 12, 15inclusion criteria 13, 40, 41, 53, 54
systematic reviews 149–52, 154comments 149–50methodological quality 150–2
incorporation bias 49, 51incremental value, test 105–6, 107,
111, 112independent expert panel 50, 51independent variables 45, 46, 56“indication area” for test 10information and communication
technology (ICT) 12, 15, 167,168, 169
information, integrating in clinicalpractice 14–15
instance based recognition 183interassessment period, before-after
study 89–90internal validity criteria 150
urine dipsticks in UTI reviews 151international cooperation 15interobserver variability 49interpretation 155–6
and diagnostic hypothesis 181–2incorrect 189
intraobserver variability 49intrauterine growth retardation
(IUGR) RCT 68–9invasive tests 3, 14
reference standard 49IPCI database 174
“kit” form tests 107
language, published studies 149latent class analysis 109left ventricular dysfunction (LVD) see
B-type natriuretic peptide (BNP),LVD diagnosis
lesions, localisation 40likelihood ratio (LR) 4, 26, 97, 99, 107,
109, 117, 125–6, 127, 129, 185, 190answering Phase III question with
29, 30, 32pooling in meta-analysis 159–60
statistical formula 165various target disorders 5
INDEX
221
Andre_Index.qxd 11/7/01 10:48 AM Page 221

INDEX
222
literature search 147–9liver tests
discrimination of 7function tests 3
logarithmic transformed DOR(lnDOR) 156, 157
logistic regression 46, 56, 133–5, 185formula 134see also multiple logistic regression
long-acting � agonists (LBA) cohortstudy 174–5
medical informatics 168–9clinical decision support systems
171–2observational databases 172–5
medical knowledge, clinical decisionsupport systems 171–2
MEDION database 147–8MEDLINE
research on diagnostic tests 2search strategy 147, 148
memorylong-term, activating stored
knowledge 184working 181
meta-analysis 1, 11, 12, 14, 40, 136,146, 153, 213
cut-off point effect, searching for155–6
discussion 162–3heterogeneity
dealing with 156–7searching for 154, 155
individual study results, describing154
statistical pooling 159–61deciding on model 157, 158–9
methodological challenges 1, 6–11changes over time 10–11complex relations 6–7discrimination and influence on
management 9–10“gold” standard problem 7–8indication area and prior probability
10observer variability and bias 9“soft” measures 9spectrum and selection bias 8
methodological guidelines, decisionmaking 191–2
methodological quality, systematicreviews 150–2, 162
misclassification 88of reference standard 101, 102,
109, 113modified barium swallow test (MBS)
dysphagia trial 72, 73monitoring disease course 3“mosaic” of evidence 10–11, 15MRI scans 10
nerve root compression,intraobserver variability 49
multiple logistic regression 56, 118,135
multiple tests, evaluating 46, 56how to compare strategies
69–74multivariable statistical techniques 7multivariate analysis 40, 56, 57, 91
natural prognostic value 65, 67negative predictive value (NPV) 123,
124new tests
evaluation 6, 42, 73–4, 106–7ordering of 198
nomogrampretest to post-test likelihoods
conversion 30use of 191
non-diseasediagnosis of 21
“upper-limit syndrome of” 22variation in test specificity 103
non-English publications 149non-invasive tests 3, 14normal
definitions of 19, 21–4selection of “upper limit” 33
see also non-disease
objectives, diagnostic testing 1,2–6
observational databases 172–5,176
confounding by indication 174–5observer variability
and bias 9reducing 47see also intraobserver variability
“occurrence” relation 45–6
Andre_Index.qxd 11/7/01 10:48 AM Page 222

odds ratio (OR) 4, 97, 99, 107, 109,117, 126
duplex ultrasonography trial 65, 66meta-analysis 154
logarithmic transformed DOR(lnDOR) 156, 157
pooled OR 161and prevalence of target condition
101, 102various target disorders 5
operator variability 111order effects 189ordering of tests, changing 197–206
feasibility of change 202–5cost effectiveness 205evaluating effects 204–5implementation strategies 202–4perpetuation and continuation 204
making the change 199–202need to change 198–9summary 197–8
outcomebefore-after study 88–9, 90effect of test on 87health 36operationalising 41, 47–52
principles 47–9outcome data, systematic reviews 149outcome measurement
blinding 77systematic reviews 154
outliers 156overview, evaluation strategy 209–14
challenges 210, 212–14important steps 210, 211summary 209
patient registers, sampling from 54patients
blinding to allocation 77characteristics 46impact of test on 62role in diagnostic management 213–14selection of 53
see also study populationself-testing 85
patient-specific advice, decisionsupport systems 172
pattern recognition 179, 182–3peer review 201, 203percentile definiton of normal 21–2performance, diagnostic test
assumptions for transfering testcharacteristics 99
measures of 97–8variation in 95, 96
Phase I studies 19, 25–6, 43, 44Phase II studies 19, 26–8, 44Phase III studies 19–20, 28–36, 44–5Phase IV studies 20, 36–7physical fitness measurement 3pilot searches 148pilot studies 47placebos 12
placebo effect 62point estimates 56pooling results 159–61, 163
deciding on model 157, 158–9formulae 165
positive predictive value (PPV) 123,124
postaddition 73, 74post-test outcome, before-after study
88–9, 90post-test probability 4, 29, 30, 47,
123–4, 130–2, 185Bayes’ theorem formula 131confusing with sensitivity 186
pragmatic studies, diagnostic tests andtreatments 27
preaddition 73designs to evaluate 74, 75
prediction model 56prediction rules 7, 111, 185predictive value 4, 97, 99, 117, 123–4
see also post-test probability; pretestprobability
prejudice towards method 9pretest baseline, before-after study 85,
86–7pretest probability 4, 29, 30, 36, 47,
123–4, 130, 184, 185prevalence, target condition 101, 102,
113primary care settings 33, 103
accuracy of tests 104appendicitis, accuracy of diagnosis
34, 35probability
estimation, errors in 186–8distortions 187support theory 187–8
prior 10revision, errors in 188–9
INDEX
223
Andre_Index.qxd 11/7/01 10:48 AM Page 223

probability – Continuedsee also post-test probability; pretest
probabilityproblem based learning 180, 189–90problem solving 179, 180
diagnosis as hypothesis selection181–2
pattern recognition 182–3see also decision making
prognosis, assessing 3, 13, 61comparing multiple test strategies
69–74how to measure prognostic impact
63–4need to assess prognostic impact
62–3prognostic criterion 40, 52proportions, pooling of 159
statistical formulae 165prospective data collection 44, 45prospect theory (PT) 187prototypes, construction of 183, 190“pseudodiagnosticity” 189psychiatric illness, diagnostic research
51publication bias 148PubMed (MEDLINE), search strategy
147, 148
qualitative approach and decisionmaking 5, 6
qualitative models, decision supportsystems 172
quality, medical record data 170quantitative approach and decision
making 5, 6, 14quantitative models, decision support
systems 172quasi experimental comparison 92questions, diagnostic research see
research question
random disclosure, test results 37, 71,73
random effect model, statistical pooling158
random error 57randomised controlled trials (RCT)
1, 61–79, 82colorectal cancer screening 36–7and decision support systems
176
prognostic impacthow to assess 63–4need to assess 62–3
randomised designs 11, 12–13alternative 68–9choice of design 74, 75–6how to compare test strategies
69–74practical issues 76–8for single test 64–7
summary 61–2rank-dependent utility theories 187rare conditions, overemphasising 186ratio, disease to non-disease, constancy
98reader variability 111recruitment procedure 40, 41, 54redundant evidence, acquiring 189reference standard 7–8, 20, 31, 32,
39–40, 46, 47–52adverse effects 55choosing 108clinical follow up 50–1differences in 98error in 109independent expert panel 50misclassification 101, 102, 109, 113pragmatic criteria 49–50prognostic criterion 52standard shift as result of new insight
52systematic reviews 149, 152tailormade standard protocol 51–2
referral filter 103–5, 111reflection 190reimbursement systems, changing test
ordering 202reliability, clinical data 170reminder systems 172, 176, 201–2, 203renal artery stenosis (RAS) 118–19
diagnostic questions and concepts119–20
dichotomous and trichotomous tests126–30
error rate of test 124–5likelihood ratio 126prediction of 120–1, 122
likelihood ratio 125pre- and post-test probability 123–4
replacement tests 106–7, 111reports, diagnostic research 148reproducibility, test 47
INDEX
224
Andre_Index.qxd 11/7/01 10:48 AM Page 224

research question 19–20, 24–5, 210before-after studies 83–6cross-sectional studies 41–3formulating, flow diagram 110Phase I studies 19, 25–6, 43, 44Phase II studies 19, 26–8Phase III studies 19–20, 28–31
limits to applicability of studies33–6
threats to validity of studies31–3
Phase IV studies 20, 36–7retrospective data 13, 45, 91risk factor definition of normal 22ROC curve 5, 26, 97, 107, 109, 128,
129, 156pooling 160–1SROC curve 157, 158, 159, 165
sample size 10, 37before-after studies 91cross-sectional studies 55–6Phase III studies 45randomised controlled trials (RCT)
62, 77–8sampling
cross-sectional studies 44variability 121–3
Science Citation Index 149search strategy, systematic reviews
145, 147secondary care settings 33selection bias 8, 150, 192selection of patients 53, 109–10
see also study populationself-testing, patient 85sensitivity 4, 97, 99
confusing with post-test probability186
for dichotomous test 120–1homogenous 159
statistical formulae 165variation in
biased inflation of 32healthcare setting 33, 103, 104prevalence of target condition
101, 102spectrum of disease 102–3
various target disorders 5sensitivity analysis 117, 133sequential information and clinical
reasoning 182
serum creatinine concentration, RASdiagnosis
dichotomised values 128ROC curve 129trichotomised values 130
setting see healthcare settingseverity indicators, absence of 175single tests, evaluation 46
data analysis 56randomised designs 64–7see also dichotomous tests
“soft” measures 9software, statistical 135, 136Spearman correlation coefficient 156specificity 4, 10, 97, 99, 111
for dichotomous test 120–1homogeneous 159
statistical formulae 165variation in
biased inflation of 32healthcare setting 33, 34, 35, 103,
104prevalence of target condition 101,
102spectrum of non-disease 103
various target disorders 5spectrum 33, 42, 54
bias 8characteristics, measuring 47of disease/non-disease 98, 102–3,
111split-half analysis 57SROC curve 157, 158, 159
formula 165standard error, calculating 123standardised data extraction forms 153standardised (simulated) patients
91–2Standards for Reporting Diagnostic
Accuracy (STARD) initiative xi,214
statistical pooling 159–61, 163deciding on model 157, 158–9formulae 165
straight-leg raising test review,subgroup analysis 161, 162
stratified analysis 46stroke, duplex
ultrasonography/anticoagulationRCT 65–6
study populationbefore-after study 90–1
INDEX
225
Andre_Index.qxd 11/7/01 10:48 AM Page 225

study population – Continuedcross-sectional study 41, 44, 53–4heterogeneous 96selecting 53, 109–10systematic reviews 149and test performance 102–6
subgroup analysis 46, 71, 146, 149,156, 156–7, 158, 163
variation in findings, different groups111–12
subject characteristics 46subject specific search strategy 147,
148support theory 187–8surveys 11, 12, 43–4, 54systematic reviews 1, 11, 12, 14, 40,
145–63, 213colorectal cancer screening trials
36–7discussion 162–3guidelines 147–53
data analysis 153–61data extraction 152–3data presentation 161–2how to search literature 147–9inclusion criteria 149–52
summary 145–6
target conditionchoosing 108defining 42, 100prevalence 101, 102, 113test specificity and sensitivity
estimation 101, 102, 103technological innovations, speed of and
test evaluation 10–11, 15telediagnosis 169, 171tertiary care settings 33, 103
appendicitis, accuracy of diagnosis34, 35
test based enrolment 44test ordering see ordering of tests,
changing
test result-based sampling 11“test review bias” 48therapeutic definition of normal 23therapy
and diagnostic test objectives 3effective and efficient 2treatment protocols 76
transferability, test accuracy 95–114questions before designing study
108–14summary 95–6true variability in test accuracy
97–108discrimination and calibration
97–8facilitating transferability
98–100lack of transferability 100–8
Treeage-DATA 136trichotomisation 130
urine dipstick reviewdata extraction 152data presentation 162dealing with heterogenity 157,
158poor methodological quality 150
useless testing, examples 6
validation, external (clinical) 40, 54,57, 210, 212–13
validity criteria, diagnostic research150, 153, 162–3
urine dipsticks in UTI reviews151
verification bias 152Visual Bayes 136
weighted linear regression 160working memory 181written medical records 170
�2 test 154
INDEX
226
Andre_Index.qxd 11/7/01 10:48 AM Page 226


