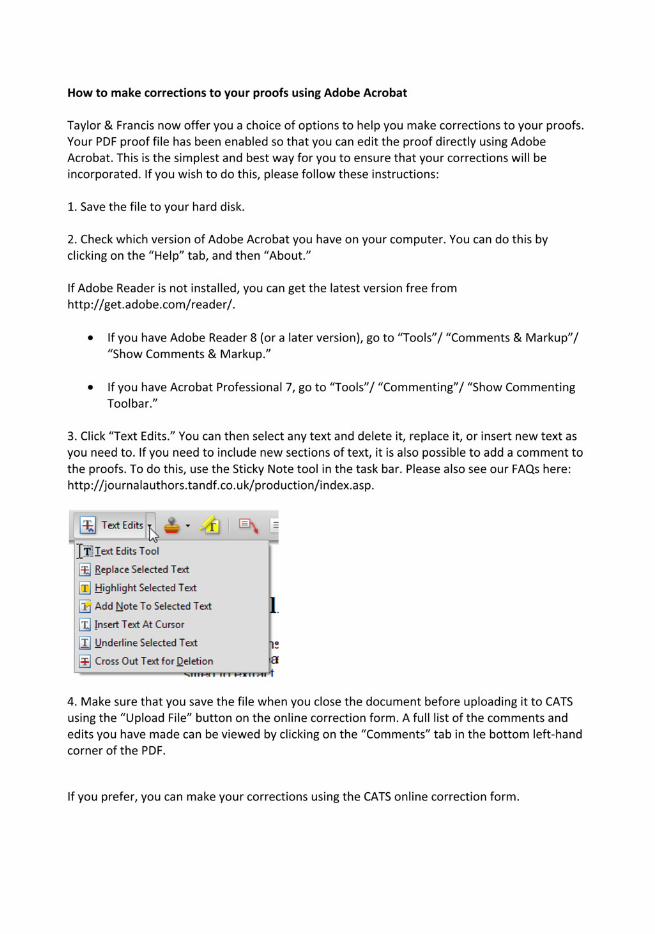
Embed Size (px)
Citation preview

PROOF COVER SHEETJournal acronym: CAEH
Author(s): Xiongyi Liu
Article title: Assessment training effects on student assessment skills and task performance in a technology-
facilitated peer assessment
Article no: 823540
Enclosures: 1) Query sheet
2) Article proofs
Dear Author,
1. Please check these proofs carefully. It is the responsibility of the corresponding author tocheck these and approve or amend them. A second proof is not normally provided. Taylor &Francis cannot be held responsible for uncorrected errors, even if introduced during the productionprocess. Once your corrections have been added to the article, it will be considered ready forpublication.
Please limit changes at this stage to the correction of errors. You should not make insignificantchanges, improve prose style, add new material, or delete existing material at this stage. Making alarge number of small, non-essential corrections can lead to errors being introduced. We thereforereserve the right not to make such corrections.
For detailed guidance on how to check your proofs, please seehttp://journalauthors.tandf.co.uk/production/checkingproofs.asp
2. Please review the table of contributors below and confirm that the first and last names arestructured correctly and that the authors are listed in the correct order of contribution. Thischeck is to ensure that your name will appear correctly online and when the article is indexed.
Sequence Prefix Given name(s) Surname Suffix
12
XiongyiLan
LiuLi

Queries are marked in the margins of the proofs.
AUTHOR QUERIES
General query: You have warranted that you have secured the necessary written permission fromthe appropriate copyright owner for the reproduction of any text, illustration, or other material inyour article. (Please see http://journalauthors.tandf.co.uk/preparation/permission.asp.) Please checkthat any required acknowledgements have been included to reflect this.
AQ1 Please provide department name for affiliation ‘b’.
AQ2 Table 5 is not cited in the text and it is cited appropriately while editing. Pleasecheck and approve the edit.
AQ3 Please provide remaining editors name instead of et al. for reference ‘Li et al.(2005)’.

Assessment training effects on student assessment skills and taskperformance in a technology-facilitated peer assessment
Xiongyi Liua* and Lan Lib
aDepartment of Curriculum and Foundations, Cleveland State University, Cleveland, OH,5USA; bBowling Green State University, Bowling Green, KY, USA
This study examines the impact of an assessment training module on studentassessment skills and task performance in a technology-facilitated peerassessment. Seventy-eight undergraduate students participated in the study. Theparticipants completed an assessment training exercise, prior to engaging in
10peer-assessment activities. During the training, students reviewed learningconcepts, discussed marking criteria, graded example projects and comparedtheir evaluations with the instructor’s evaluation. Data were collected in theform of initial and final versions of students’ projects, students’ scoring ofexample projects before and after the assessment training, and written feedback
15that students provided on peer projects. Results of data analysis indicate that theassessment training led to a significant decrease in the discrepancy betweenstudent ratings and instructor rating of example projects. In addition, the degreeof student vs. instructor discrepancy was highly predictive of the quality offeedback that students provided to their peers and the effectiveness of revisions
20that they made to their own projects upon receiving peer feedback. Smallerdiscrepancies in ratings were associated with provision of higher quality peerfeedback during peer assessment, as well as better revision of initial projectsafter peer assessment.
Keywords: peer assessment; assessment training; training effects25
Introduction
Assessment systems have great impact upon students’ behaviour and attitude toward30learning (Freeman 1995). To promote meaningful learning, researchers suggest that
assessment should progress from traditional ‘assessment of learning’ to ‘assessmentfor learning’ (Torrance 2007, 281), and students should be given more power andbe involved vigorously in assessment practice (Orsmond and Merry 1996;Orsmond, Merry, and Reiling 2002).
35As an alternative assessment approach to engage students and promote activelearning, peer assessment is a process whereby students evaluate peers’ performancebased on benchmarks (Topping, Smith, Swanson, and Elliot 2000). Although thefocus of peer assessment varies and can be categorised as either formative or sum-mative, a large volume of peer-assessment practices centre on formative goals to
40empower students in active and collaborative learning. In formative peer-assessmentmodels, students usually perform two roles: as assessors, they rate peers’ work andprovide feedback and as assessees, they read and act upon peer feedback to
AQ1
*Corresponding author. Email: [email protected]
Assessment & Evaluation in Higher Education, 2013http://dx.doi.org/10.1080/02602938.2013.823540
� 2013 Taylor & Francis
CAEH 823540 CE: KD QA: MA19 July 2013 Coll: QC:Initial

improve their own projects. Through both stages, peer assessment becomes ‘thelearning exercise in which the assessment skills are practiced’ (Sluijsmans,
5 Brand-Gruwel, and van Merrienboer 2002, 444).Conventional peer assessment used paper-based systems for decades until the
late twentieth century. Rapidly emerging information technologies have broughtnew possibilities for constructing and conducting peer assessment. Compared topaper-based peer assessment, technology-based peer assessment has several definite
10 advantages, such as participant anonymity, anytime and anywhere access, ease ofdata collection and compilation, and accommodation of multimedia components(Li, Steckelberg, and Srinivasan 2008; Sung et al. 2005). In a computerised system,identification numbers or pseudonyms can easily conceal participants’ identities,while data can be automated and summarised. Supporting and tracking objects and
15 associated peer-assessment activities no longer require manual work. In addition,technology-facilitated peer assessment allows the instructor to easily integratemultimedia components such as audio, video and animation in the peer-assessmentprocess, and gives students convenience and flexibility to interact with suchcomponents as many times as they need to. As a result, it provides a structured yet
20 dynamic, media-rich web-based platform for students to engage in active learning attheir own pace. Compared to paper-based systems, technology-facilitated peerassessment provides considerable advantages to instructors and students.
The effects of both paper-based and technology-facilitated peer assessmenthave been widely studied and well documented. In general, literature suggests
25 that peer assessment may have positive impacts in various domains such asstudent learning outcomes (e.g. Li and Steckelberg 2005; Pope 2001; Plutskyand Wilson 2004; Sung et al. 2003), self-awareness of own performance(Freeman 1995; Mehrens, Popham, and Ryan 1998), higher order thinking skills(e.g. Bostock 2000; Gratz 1990; Stefani 1994; Venables and Summit 2003),
30 shared responsibility and autonomy (e.g. Falchikov 1986; Goldfinch and Raeside1990; Somervell 1993), social skills (Earl 1986), assessment skills (Hughes andLarge 1993), confidence (Vickerman 2009) and motivation (e.g. Hiltz andWellman 1997).
While the value of peer assessment has been highlighted by a wealth of studies,35 the validity of peer marking remains a significant concern. Validity in peer assess-
ment typically means the agreement of peer marking and teacher marking. Somestudies report that there is good agreement between peer and teacher ratings in peerassessment (Falchikov 1995; Li et al. 2005; Liu, Lin, and Yuan 2002; Saito andFujita 2004). However, there is also considerable evidence that suggests otherwise
40 (Cheng and Warren 1999; Kwan and Leung 1996; Wen and Tsai 2008). Dancer andDancer (1992) argue that research studies have not consistently shown the validityof peer rating. Chang et al. (2011) admit that uncertain validity and reliability areone of the major challenges of peer assessment.
These inconsistent findings indicate that validity of peer assessment cannot be45 taken for granted. While the validity issue of peer assessment may be triggered by
variations in contextual features ranging from prior knowledge and clarity of mark-ing criteria to the assessment environment (e.g. whether students are rewarded forproviding critical feedback to their peers; see Davies 2009) and sample size (Changet al. 2011; Falchikov 1995; Li, Liu, and Steckelberg 2010), students’ lack of
50 assessment skills is another important reason why validity may be compromised(Svinicki 2001). It is critical to the success of peer assessment that students clearly
2 X. Liu and L. Li
CAEH 823540 CE: KD QA: MA19 July 2013 Coll: QC:Initial

understand marking criteria and how peers’ performance, as well as their ownperformance, will be assessed (Falchikov 1995; Li, Liu, and Steckelberg 2010).However, students may have difficulty understanding marking criteria, or they may
5interpret terms used in the rubric differently than teachers (Orsmond and Merry1996). This inconsistency may lead to discrepancies across individuals’ ratings. Inconventional education, the primary role of students is to be the ‘learner’. Seldomare students required to act as assessors to evaluate others’ or their own work. Asfew students are prepared for this radical role transition from learner to assessor in
10peer assessment, they may lack critical assessment skills (Svinicki 2001). Therefore,it is crucial that marking criteria and performance expectations are transparent andclearly communicated prior to peer assessment.
The success of peer assessment depends, to a great extent, on whether studentsare able to acquire critical assessment skills and provide valid judgment of their
15peers’ work. While training students in assessment skills has attracted the attentionof an increasing number of researchers, it has yet to be fully examined. Research-ers, in general, agree that training should be provided to equip students with essen-tial knowledge and skills of critical assessment (Cheng and Warren 1997; Dochy,Segers, and Sluijsmans 1999; Freeman 1995; Patri 2002). Nevertheless, there are
20only a handful of studies that describe training models and investigate the impact oftraining in peer assessment. Marty (2010), while reviewing peer assessment in ath-letic training education programmes, comments that, ‘there are few studies thattrained students how to properly assess the peer’s performance and provide feed-back’ (3). There are ambiguities in regard to how training should be provided and
25what critical features should be included. Marty (2010) further concludes that thebenefits of training on student-assessment skills are inconclusive in the existingliterature.
Thus, this current study will add to the literature by examining the impact of asystematic assessment training model, with built-in teacher scaffolds and peer
30interactions, on student assessment skills and task performance in a technology-facilitated peer assessment. Specifically, the following research questions wereexamined: (1) Do students show improved assessment skills after completing theassessment training module? (2) Do students with stronger assessment skills providehigher quality feedback to their peers? and (3) Do students with stronger assessment
35skills perform better on the revision of their WebQuest project after technology-facilitated peer assessment?
Facilitating platform and multimedia components
In this study, a course management system, Blackboard, was enlisted to facilitatepeer assessment. Blackboard provides a web platform for faculty to share and orga-
40nise course materials, and for faculty and students to communicate and collaborate.A peer assessment forum was created in the Discussion Board section of Black-board, where students could post and share their projects, view peers’ projects andprovide constructive feedback. Anonymity was not a concern in this study, as stu-dents were encouraged to discuss and narrow down their topics of choice in order
45to identify the most appropriate focus for their projects. Therefore, students werealready aware of projects of some peers, if not all.
Various forms of multimedia were also incorporated in this study to facilitatethe assessment training and peer-assessment process. For example, two short videos
Assessment & Evaluation in Higher Education 3
CAEH 823540 CE: KD QA: MA19 July 2013 Coll: QC:Initial

approximately 15min long were provided during assessment training for students to5 review critical features of WebQuest projects (i.e. online lesson modules that facili-
tate learners to interact with web based resources) and key elements of the rubricfor assessing such projects. A brainstorming and concept-mapping tool (https://bub-bl.us/) was used to enable students to map out ideas for their WebQuest projects.All these elements were incorporated in the Blackboard interface.
10 Method
Power analysis
To determine the sample size needed for the study, power analysis was conductedusing the free statistical software G⁄Power 3.1.3 (Faul et al. 2007). The researchersset up the power threshold at 0.80, the alpha at 0.05 and the target effect size at a
15 moderate level. Since effect size is calculated differently for different statisticaltests, two cut-off values for moderate effect size were determined, followingCohen’s (1988) suggestions. For the t-test of mean differences between matchedpairs, to achieve a moderate effect size (d) of 0.5, the minimum sample size is 34.The calculation of d is as follows: absolute value of difference in means divided by
20 square root of common error variance:
d ¼ �x1 � �x2s
:
For the multiple regression analysis with two predictors, to achieve a moderate25 effect size ( f 2) of 0.15, the minimum sample size is 55. The calculation of f 2 is as
follows: variance accounted for in the population by the set of predictors dividedby the variance unaccounted for in the population:
f 2 ¼ R2AB � R2
A
1� R2AB
30The final sample size of 78 in this study satisfied the minimum requirement for
both tests.
Participants
Seventy-eight participants were recruited from a mid-western US university. All35 participants were teacher-education students (Early Childhood and Middle
Grades majors) enrolled in a required classroom technology application course.Most of these participants were female (81%). The average age of participantswas 21.3. Among those who reported their race, about 88% were Caucasian.The remaining participants were either African-American (9%) or Other (3%).
40 Training and peer-assessment procedure
All participants followed the same procedure. Four major steps were involved inthe study (Figure 1).
4 X. Liu and L. Li
CAEH 823540 CE: KD QA: MA19 July 2013 Coll: QC:Initial

Step one – learning content and rubric
In the first step, students learned about content area – WebQuest. The WebQuest is5an online ‘inquiry-oriented’ lesson module in which users interact with pre-selected
web resources (Dodge 1995). Lectures, videos, group discussions and example pro-jects were provided for students to understand critical attributes of WebQuests.Afterwards, students were presented with the assessment rubric. The instructordelivered a presentation on how WebQuest projects would be assessed based on
10each criterion. Opportunities were offered for students to ask questions and sharethoughts.
Step two – creating initial draft of their own webQuest projects
After studying the WebQuest and rubric, students were encouraged to share, discussand narrow their topics of interest in order to identify the most appropriate focus
15for their projects. Thereafter, students composed the initial draft of their ownWebQuest projects. Students were instructed to be only concerned about the contentat this stage.
Monofor
colour o
nline
Figure 1. Peer assessment procedure.
Assessment & Evaluation in Higher Education 5
CAEH 823540 CE: KD QA: MA19 July 2013 Coll: QC:Initial

Step three – assessment training
The instructor provided assessment training to enable students to understand the5 rubric and the scoring process. Students first watched a video summarising the key
elements of the rubric. Then, the instructor and participants discussed various con-ceptual terms used in the rubric (such as scaffolding and higher order thinking) toensure that these terms conveyed the same meaning to students as they did to theinstructor. Later, participants were asked to evaluate two example WebQuest pro-
10 jects. These two projects were composed by former students and contained somecommon issues or problems. Students first assessed project A using the rubric. Stu-dents’ evaluations were then compared to the instructor’s. Small group and classdiscussions followed subsequently for students to ask questions, express agreementsand disagreements, debate and finally reach a general consensus. A similar proce-
15 dure was followed, for example, in project B evaluation.
Step four – peer-assessing WebQuest projects and completing final draft
In this step, students played the roles of assessor and assessee. As assessors, stu-dents graded and commented upon two randomly assigned peers’ projects using therubric. In the designated discussion forum of Blackboard, students downloaded and
20 reviewed assigned projects, and completed and uploaded their feedback sheet backto their peers. As assessees, students viewed peer grading and feedback, and usedthe feedback to revise and improve their WebQuest projects. The final version ofstudents’ WebQuests was submitted to the course instructor.
Grading
25 Data collected in this study include: (a) initial version and final version of students’WebQuest projects, (b) students’ grading of example WebQuest project Example Abefore the assessment training, and their grading of Example A and Example Bafter the assessment training, and (c) peer feedback that students provided to eachother during peer-assessment activity. Initial and final WebQuest projects were
30 graded by one of the researchers and an independent grader (experts) using theWebQuest Content Rubric. Students used the same rubric to grade the exampleWebQuest projects in the assessment training. Finally, peer feedback was graded bythe two expert graders using the peer feedback rubric.
WebQuest content rubric. The rubric (see Appendix 1) was first developed in35 2004 based on a few WebQuest resources (e.g. Bellofatto et al. 2001; March 2011;
Martin 1999), and has been revised according to feedback received from studentsand instructors. The rubric has a total point value of 40, with eight criteria thatcover the five critical components of WebQuests: introduction, task, process, evalua-tion and conclusion. For each criterion, the rubric delineates three levels of perfor-
40 mance (beginning, developing and accomplished) with corresponding points.To ensure grading consistency, the instructor and an independent grader went
through a rigorous grading training. During the training, they first discussed therubric to reach a general consensus. Afterwards, they went through a three-roundgrading practice. In the first round, the instructor and the grader individually graded
45 three example projects representing projects of three performance levels. They thencompared and discussed variations in their evaluation of the three projects. In the
6 X. Liu and L. Li
CAEH 823540 CE: KD QA: MA19 July 2013 Coll: QC:Initial

second round, the instructor and the grader graded another set of three examples,and compared and discussed their evaluations. Additionally, they compared varia-tions in their evaluation of the first set of examples to their evaluation of the second
5set of examples. A similar procedure was repeated in the third round of gradingtraining.
Both the instructor and the independent grader blindly graded example projectsA and B, students’ WebQuest projects (both initial and final submissions). Pearson’scorrelation (r) between the total WebQuest scores given by the instructor and the
10independent grader was used as the indicator of inter-rater reliability. The gradinginter-rater reliabilities of .82 for students’ initial WebQuests and .83 for students’final WebQuests were established. The mean scores of instructor’s and independentrater’s ratings were used in data analysis.
Peer feedback rubric. The quality of peer feedback was measured based on the15peer feedback rubric developed by Li, Liu, and Steckelberg et al. (2010). The rubric
(see Appendix 2) has a total point value of 10 with 10 criteria that cover the fivecritical components of WebQuests. Previous studies indicate that the rubric has sat-isfactory inter-rater reliability of 0.85 (e.g. Li, Liu, and Zhou 2012). In the presentstudy, one of the researchers and a trained, independent grader assessed students’
20peer feedback. There were two major steps involved in the evaluation process. First,the researcher and the grader determined if assessors could identify critical issues ofthe assessed projects. Then, peer feedback was critiqued in regard to whether asses-sors could provide constructive feedback to resolve identified issues. Data analysiswas based on grading by the researcher.
25Results
Descriptive analysis
Table 1 presents descriptive statistics of instructor and student ratings for WebQuestExample A before training, Example A after training and Example B after training,as well as average discrepancy and validity index of student ratings. As shown in
30Table 1, instructor rating (the average of the course instructor and independentgrader’s ratings) was 24 for Example A and 20 for Example B, whereas student rat-ings ranged from 9 to 40 for Example A before training, 10 to 35 for Example Aafter training and 16 to 32 for Example B. Mean student ratings were consistently
Table 1. Instructor ratings, student ratings, discrepancy, and validity index of studentratings.
Example A pre-training Example A post-training Example B
Instructor rating 24 24 20Student ratings
Mean 27.91 26.10 23.11SD 6.45 3.41 2.47Min. 9 10 16Max. 40 35 32Range 31 25 16
Average discrepancy 6.40 2.93 3.42Validity index 3.95 2.73 2.02
Note: N = 78. SD= standard deviation. Min. = minimum. Max. = maximum.
Assessment & Evaluation in Higher Education 7
CAEH 823540 CE: KD QA: MA19 July 2013 Coll: QC:Initial

higher than instructor ratings by two to three points. Both the range and standard5 deviation of student ratings became smaller after the training.
Following Cho, Schunn, and Wilson’s (2006) definition and operationalisationof validity of peer assessment from the student perspective, the validity of studentratings is indicated as the discrepancy between the instructor rating and studentratings. For a given example project rated by both the instructor and the students,
10 discrepancy scores were calculated as the absolute value of the differences betweenthe student ratings and the instructor rating. The validity index is estimated as theroot-mean-squared distance between the student ratings and the instructor rating,i.e., the standard deviation of the discrepancy scores. The higher the validity index,the lower the validity.
15 As shown in Table 1, validity index for peer assessment was 3.95 for ExampleA, before the instructor provided training on the grading criteria. After studentscompleted the training procedures, the validity index of their ratings decreased to2.73 when Example A was reassessed and to 2.02 when a new, equivalent projectExample B was assessed using the same rubric. The obvious decline in the validity
20 index before and after the training indicates improvement in the validity of peerassessment. With the pattern of lower validity index replicated in student ratingsof a new example project, it seems that such improvement is transferable andsustainable.
Correlational analysis
25 Table 2 presents the correlations among initial and final student project scores anddiscrepancy scores of student ratings for Example B. As shown in Table 2, initialand final project scores were highly correlated (r = .75). At the same time, bothinitial and final project scores were negatively correlated with discrepancy scores.Students with higher initial or final project scores tended to rate Example B in simi-
30 lar fashion to their instructor. The size of the correlation coefficients was large(r=�.52 and �.61). Furthermore, the quality of student feedback on peer projectsduring peer assessment was significantly related to not only the quality of theirinitial and final projects (r = .31 and .42) but also the student vs. instructor ratingdiscrepancy on Example B (r=�.59). This indicates that, compared to those whose
35 ratings on Example B were much different from the instructor’s, students who gaveratings similar to that of the instructor after the assessment training were morelikely to provide higher quality feedback on the two randomly assigned peer
Table 2. Pearson’s correlations among student project scores, student vs. instructordiscrepancy, and quality of student feedback on peer projects.
Variables Pretest Posttest Discrepancy Feedback
Pretest –Posttest .75⁄⁄ –Discrepancy �.52⁄⁄ �.61⁄⁄ –Feedback .31⁄⁄ .42⁄⁄ �.59⁄⁄ –
Notes: N= 78. Pretest =mean expert rating of student project before the training and peer assessment.Posttest =mean expert rating of student project after the training and peer assessment. Discrep-ancy = discrepancy between student ratings and instructor rating for Example B. Feedback = averagequality of student feedback on two randomly assigned peer projects. ⁄p < .05, ⁄⁄p < .01.
8 X. Liu and L. Li
CAEH 823540 CE: KD QA: MA19 July 2013 Coll: QC:Initial

projects that they reviewed during peer assessment. Such students also tended toproduce higher quality initial projects before peer assessment as well as higher qual-
5ity revised projects after peer assessment.
Main analysis
According to Cho, Schunn, and Wilson (2006) definition of validity of peer assess-ment from the student perspective, better validity is associated with less discrepancybetween instructor and student ratings. In order to statistically test the training effect
10on validity of peer assessment, discrepancy scores (i.e. the distance between studentratings and instructor rating) were compared before and after the training. As shownin Table 1, average discrepancy was 6.40 points for Example A before training,2.93 points for Example A after training and 3.42 points for Example B. Pairedt-tests were then conducted to examine whether such differences were statistically
15significant. Discrepancy scores for Example A and Example B after the trainingwere significantly lower than those for Example A before the training, t(76) =8.729, p< .001 and t(76) = 6.589, p< .001, respectively. There was no significantdifference between discrepancy scores for Example A after the training andExample B.
20To investigate whether the improvement in overall student ratings was causedby one or a few particular criteria of the rubric, we further examined discrepancyscores between student and instructor ratings of Example A on each rubric criterionbefore and after the assessment training. Table 3 presents the discrepancy scoresand the results of paired t-tests of pre–post training differences in mean discrepancy
25scores by each grading criterion. As expected, student ratings of Example A deviatesignificantly less from the instructor rating after the assessment training on all eightgrading criteria. Among the eight criteria, the training effect was most prominentfor criteria 2, 4 and 5. This indicates that student judgment towards all aspects ofthe rubric improved, though to a greater level on some aspects.
30Hierarchical multiple regressions were conducted to investigate the extent towhich the initial project scores (pre-test) and post-training student vs. instructordiscrepancy scores (discrepancy) predict the quality of student peer feedback
Table 3. Descriptives of pre- and post-training discrepancy between student and instructorratings of example a by grading criterion, and comparisons of mean pre-post discrepancyusing t-tests.
Pre-training discrepancy Post-training discrepancy
Range Mean SD Range Mean SD t
Criterion 1 0–2 .88 .77 0–2 .67 .68 3.019⁄⁄Criterion 2 0–4 2.21 1.20 0–3 .88 .79 8.499⁄⁄⁄Criterion 3 0–2 .91 .78 0–2 .68 .65 2.641⁄Criterion 4 0–3 1.50 1.03 0–3 1.06 .93 3.749⁄⁄⁄Criterion 5 0–2 1.08 .79 0–2 .56 .62 5.434⁄⁄⁄Criterion 6 0–3 1.00 .79 0–3 .72 .79 3.465⁄⁄Criterion 7 0–3 .83 .78 0–2 .60 .63 2.641⁄Criterion 8 0–3 .81 .82 0–3 .59 .63 2.406⁄
Notes: Discrepancy scores are based on absolute deviation of a student rating from the instructor ratingon each criterion. N= 78. SD= standard deviation. ⁄⁄⁄p < .001. ⁄⁄p < .01. ⁄p < .05.
Assessment & Evaluation in Higher Education 9
CAEH 823540 CE: KD QA: MA19 July 2013 Coll: QC:Initial

(feedback) and students’ final project grades (post-test). The analysis consisted oftwo steps/models. At step one, only the initial project score was included in the
5 model. At step two, discrepancy was included as an additional predictor.Table 4 shows the results of hierarchical regression analysis to predict the qual-
ity of student feedback on peer projects. Specifically, it shows the unstandardisedand standardised parameter estimation for each predictor in the models created byentering the two predictors sequentially. As shown in Table 4, the first model with
10 initial project grades as the predictor fits the data well, F(1,76) = 8.184, p< .01,R2 = .097, adjusted R2 = .085. Initial project scores were significant predictors of stu-dents’ peer feedback quality, with t(76) = 2.861, p< .01. The second model, withdiscrepancy between student ratings and instructor rating added to the predictors,fits the data significantly better than the first model, ΔF(2,74) = 28.868, p< . 001,
15 R2 = .348, adjusted R2 = .331, ΔR2 = .251. The effect size (f2) of the new set ofpredictors is 0.38, which would be considered large by Cohen (1988) for hierarchi-cal regression analysis. Initial project score was no longer a significant predictor,with t(74) = .068, p= 946. Discrepancy scores for Example B (Discrepancy) wasfound to be a significant predictor, with t(74) = �5.373, p< .001. That is to say,
20 when the quality of students’ initial projects was controlled for, there was a signifi-cant relationship between the quality of students’ feedback on peer projects and theextent of student vs. instructor rating discrepancy for Example B. The smaller thediscrepancy, the more informative and helpful the written feedback that studentswere able to provide on the two peer projects during peer assessment (Table 5).
25 Hierarchical linear regression was also used to predict student final projectscores. Results indicated that the first model, with initial project grades as thepredictor, fits the data well, F(1,76) = 95.129, p< .001, R2 = .556, adjustedR2 = .550. Initial project scores were significant predictors of students’ final projectscores, with t(76) = 9.753, p< .001. The second model, with both initial project
30 scores and discrepancy scores as predictors, fits the data significantly better than thefirst model, ΔF(2,74) = 13.481, p< . 001, R2 = .624, adjusted R2 = .614, ΔR2 = .068.The effect size (f2) of the new set of predictors is .18, which would be consideredmoderate by Cohen (1988) for hierarchical regression analysis. Both initial projectscores and discrepancy scores for Example B (Discrepancy 3) were significant
Table 4. Hierarchical multiple regression for prediction of peer feedback quality.
Predictors
Model 1 Model 2
β B SE β B SE
Pretest .312⁄⁄ .055⁄⁄ .019 .007 .001 .019Discrepancy �.586⁄⁄⁄ �.288⁄⁄⁄ .054
Notes: N = 78. β= standardised regression coefficient. B = unstandardized regression coefficient.SE = standard error. Pretest = initial project score. Discrepancy = discrepancy between student ratings andinstructor rating for Example B. ⁄⁄⁄p< .001. ⁄⁄p < .01. In Model 1, one variable, Pretest, was entered topredict student peer feedback quality. In Model 2, Discrepancy was added to the predictors. Withineach model, t-tests were conducted for each predictor based on the ratio of B to SE and the degrees offreedom. Results of the t-tests were indicated by the significance level (p value) of the t statistics. Gen-erally, p values smaller than .05 are considered statistically significant, i.e. the variable has significantpredictive capability for quality of student peer feedback. P values below .01 and .001 are consideredhighly significant. As shown in the table, Pretest was highly significant when it was the only predictor.It became non-significant, however, when Discrepancy was added to the predictors. Discrepancy was asignificant and stronger predictor of student feedback quality.
AQ2
10 X. Liu and L. Li
CAEH 823540 CE: KD QA: MA19 July 2013 Coll: QC:Initial

5predictors of final project grades, with t(74) = 7.085, p< .001, and t(74) = �3.672,p< .001, respectively. That is to say, when the quality of students’ initial projectswas controlled for, there was a significant relationship between the quality ofstudents’ final projects and the extent of student vs. instructor rating discrepancy forExample B. The smaller the discrepancy, the more improvement students showed in
10their final projects.
Discussion
In summary, the results of data analysis provide evidence supporting the validity ofstudent ratings of peer work when sufficient training was provided. When theinstructor rating was used as the ‘gold standard’, training led to a significant
15decrease in the discrepancy between student ratings and instructor rating of exampleprojects. In addition, the extent of rating discrepancy between student rating andinstructor rating of example projects was highly predictive of two important learn-ing outcomes in peer assessment: quality of peer feedback and quality of revisedprojects. Specifically, smaller discrepancy was found to be associated with better
20performance in providing quality feedback on peer projects, and in revising ownprojects upon receiving peer feedback. Such findings suggest that, for peer assess-ment to be an effective tool for learning gains, it is crucial to provide students withassessment training that scaffolds their understanding and application of the gradingcriteria.
25Despite its increasing popularity and recognition, peer assessment has beenquestioned for lack of reliability and validity. As discussed in the introduction, pre-vious research has reported conflicting findings regarding agreements between peermarking and tutor marking. Additionally, students have also expressed lack of confi-dence in grading peers' projects. For example, in Orsmond and Merry’s study
30(1996), students were sceptical about peers’ judgment of their work, and some indi-cated a low confidence level in their own capability of conducting peer assessment.This current study provides new evidence that validity of peer ratings in peerassessment can be substantially improved when comprehensive training is providedto students on using the rubric. Student ratings on the sample project A showed
Table 5. Hierarchical multiple regression for prediction of final project score.
Predictors
Model 1 Model 2
β B SE β B SE
Pretest .746⁄⁄⁄ .661⁄⁄⁄ .068 .588⁄⁄⁄ .521⁄⁄⁄ .074Discrepancy �.304⁄⁄⁄ �.750⁄⁄⁄ .204
Notes: N = 78. β= standardised regression coefficient. B = unstandardized regression coefficient.SE = standard error. Pretest = initial project score. Discrepancy = discrepancy between student ratings andinstructor rating for Example B. ⁄⁄⁄p < .001. In Model 1, one variable, Pretest, was entered to predictfinal project scores. In Model 2, Discrepancy was added to the predictors. Within each model, t-testswere conducted for each predictor based on the ratio of B to SE and the degrees of freedom. Results ofthe t-tests were indicated by the significance level (p value) of the t statistics. Generally, p values smal-ler than .05 are considered statistically significant, i.e. the variable has significant predictive capabilityfor final project score. P values below .01 and .001 are considered highly significant. As shown in thetable, Pretest was highly significant when it was the only predictor. It remained highly significant whenDiscrepancy was added to the predictors. Discrepancy was a significant predictor of student finalproject scores, when student initial project scores were controlled for.
Assessment & Evaluation in Higher Education 11
CAEH 823540 CE: KD QA: MA19 July 2013 Coll: QC:Initial

5 significantly less discrepancy with instructor rating before and after the training dis-cussion. Further analysis of student ratings on the individual criteria of the rubricindicates that the decrease in rating discrepancy is prevalent across all eight criteria,providing evidence that the training has led to better understanding of the wholerubric among the students. There is also evidence that the effect of training on
10 validity of student ratings could be transferred to the grading of a new example thatstudents had not graded or discussed before or during the training. In terms ofResearch Question 1, the training tends to have significant positive impact on stu-dents’ assessment skills.
The findings also indicate that validity of student ratings can be satisfactory or15 unsatisfactory, depending on how instructors prepare the students for grading their
peers’ projects. Effective training on assessment skills seems to be crucial. Accord-ing to a review by Topping (2003), reliability and validity of peer ratings may beinfluenced by a number of factors, including ‘the extent to which criteria have beendiscussed and negotiated’ and ‘the amount of scaffolding, practice, feedback and
20 monitoring’ (76). In the present study, the training focuses on understanding andapplication of the assessment rubric. Specifically, it involves students in several crit-ical stages, such as learning key elements of the WebQuest project and componentsof the rubric through video-based scaffolding, practicing the rubric by rating multi-ple sample projects, receiving expert feedback and engaging in discussion of rating
25 differences with peers.This study supports the researchers’ hypothesis on Research Question 2 that stu-
dents who were trained to provide more accurate ratings on the example projectswere able to provide more accurate and helpful written feedback to their peers dur-ing the actual peer assessment. Previous studies (such as Saito 2008) have shown
30 positive effects of training on quality of peer feedback. Through training, studentsacquired critical assessment skills and became more capable assessors. They wereable to provide higher quality feedback to assist their peers in improving projects.Nevertheless, receiving higher quality peer feedback may not necessarily lead tobetter performance. While some studies (e.g., Cho and MacArthur 2010) indicate
35 that receiving certain types of peer feedback is associated with more improvementin student revisions of their work, Li, Liu and Steckelberg (2010) study indicatesbetter revisions of WebQuest projects may be associated with giving, but not receiv-ing, higher quality peer feedback. In a subsequent study, Li, Liu, and Zhou (2012)reanalysed the data to examine how students responded to peer feedback. The new
40 findings show that students who take a critical thinking approach in accepting orrejecting peer comments and suggestions are more likely to improve in theirrevisions. It is possible, therefore, that improved validity of student ratings can leadstudents to provide better peer feedback and incorporate received peer feedbackmore critically in their revisions; both processes can then result in higher quality
45 revisions.Regarding Research Question 3, our study provides evidence that students with
better assessment skills, as represented by less discrepancy between their ratingsand the instructor ratings, tended to perform better on the final, revised WebQuestproject. Data analysis suggests that the final version of students’ WebQuests was
50 much enhanced after peer assessment. While there was much variance among thestudents’ performance improvement, i.e., some students were able to improve morethan other students, students who were able to give more valid ratings on exampleprojects after the assessment training outperformed those whose ratings deviated
12 X. Liu and L. Li
CAEH 823540 CE: KD QA: MA19 July 2013 Coll: QC:Initial

more from instructor rating in revisions of their projects after peer assessment. A5plausible explanation is that students who showed less discrepancy between their
ratings and instructor rating during assessment training may have a better under-standing of what was required in the project, and, therefore, were able to turn inhigher quality final projects. In the present study, assessment training was providedin the form of assessment trials of example projects, combined with group discus-
10sion of ratings and instructor feedback. The training may have promoted more thor-ough understanding of the WebQuest project and/or the marking criteria among thestudents. It became clearer to students what critical features a quality WebQuestshould possess and how their projects would be evaluated, which undoubtedlywould result in higher quality WebQuest projects.
15Conclusion
Overall, the findings of the current study further support the claim of a number ofresearchers and educators (e.g. Cheng and Warren 1997; Dochy, Segers, andSluijsmans 1999; Freeman 1995) that training should be provided to preparestudents with critical assessment skills, and to assist them in switching roles from
20learners to assessors. Whether web-based peer assessment is effective in facilitatingstudent learning depends largely on how the instructor structures the peer-assess-ment task and provides training to scaffold students in assessment skills. Studentswho receive such training tend to provide more valid ratings, which are also associ-ated with more helpful peer feedback and better quality revisions. Such findings
25indicate that the training on rubric-based assessment may enable students to becomenot only better assessors but also better assesses. The specific cognitive processesinvolved in the training effect on the revisions are speculated here but not empiri-cally tested. Future studies need to further examine if and how assessment trainingwould impact quality of feedback that students provide to peers and types of
30revisions that they make upon receiving feedback from peers.Despite the encouraging and intriguing findings, four limitations in this study
need to be acknowledged and addressed. The first limitation concerns the samplerecruited. Given the rather small sample size (78 subjects) and specific subject poolinvestigated (teacher candidates enrolled in a technology application course), find-
35ings should be interpreted with caution. Experiments with bigger sample sizes andother sample settings should be conducted to test if the results could be replicated.The second limitation is related to the web tool that was utilised in this study. Apeer assessment forum was created in the course management system – Blackboard– to facilitate the study. It would be interesting to see if similar findings would be
40attainable with other facilitating technology tools. The third limitation lies in thespecific assessment training module and peer-assessment procedure utilised in thisstudy. As Topping suggested (1998), peer-assessment modules vary greatly. Resultsmay be different when a different peer-assessment approach or training module isinvolved. Further empirical evaluations are needed to replicate the findings in differ-
45ent contexts. Finally, variance in student backgrounds, such as their experiencerelated to the subject of study, may influence the outcomes of peer-assessment pro-cesses and training effects. Due to the scope of our study, we did not investigatethis factor. Future research needs to study the role of student backgrounds in tech-nology-facilitated peer assessment.
Assessment & Evaluation in Higher Education 13
CAEH 823540 CE: KD QA: MA19 July 2013 Coll: QC:Initial
5 Notes on contributorsXiongyi Liu is an assistant professor of Curriculum and Foundations at Cleveland StateUniversity (USA). She obtained a PhD in Educational Psychology from University ofNebraska-Lincoln. Her research interests include self-regulated learning, computer-supportedcollaborative learning, and assessment and evaluation. Her work has appeared in major
10 journals such as Contemporary Educational Psychology and British Journal of EducationalTechnology. Most recently, she contributed a chapter on web-based testing to an edited booktitled Assessment in Blended and Online Learning Environments. Her current projectinvestigates the role of anonymity, expert feedback, goal orientation and conflict resolutionstyle in web-based peer assessment.
15 Lan Li is an associate professor of Classroom Technology at Bowling Green StateUniversity (USA) and holds a PhD in Educational Studies from University of Nebraska-Lincoln. Her research interests include technology-facilitated teaching and learning, STEMeducation and online learning. She is enthusiastic about integrating teaching and researchinterests with service opportunities that can serve the educational needs of surrounding
20 communities. She has currently participated in a few education grants. These projects havefocused largely on providing technology-integrated and research-based teacher professionaldevelopment in various educational fields.
ReferencesBellofatto, L., N. Bohl, M. Casey, M. Krill, and B. Dodge. 2001. “A Rubric for Evaluating
25 WebQuest.” Accessed June 19. http://webquest.sdsu.edu/webquestrubric.html.Bostock, S. (2000). “Student Peer Assessment, Learning Technology.” http://www.keele.ac.
uk/depts/aa/landt/lt/docs/bostock_peer_assessment.htm.Chang, C., K. Tseng, P. Chou, and Y. Chen. 2011. “Reliability and Validity of Web-Based
Portfolio Peer Assessment: A Case Study for a Senior High school’s Students Taking30 Computer Course.” Computers & Education 57 (1): 1306–1316.
Cheng, W., and M. Warren. 1997. “Having Second Thoughts: Student Perceptions beforeand after a Peer Assessment Exercise.” Studies in Higher Education 22 (2): 233–238.
Cheng, W., and M. Warren. 1999. “Peer and Teacher Assessment of the Oral and WrittenTasks of a Group Project.” Assessment & Evaluation in Higher Education 24 (3):
35 301–314.Cho, K., and C. MacArthur. 2010. “Student Revision with Peer and Expert Reviewing.”
Learning and Instruction 20: 328–338.Cho, K., C. D. Schunn, and R. Wilson. 2006. “Validity and Reliability of Scaffolded Peer
Assessment of Writing from Instructor and Student Perspectives.” Journal of Educational40 Psychology 98 (4): 891–901.
Cohen, J. 1988. Statistical Power Analysis for the Behavioral Sciences. 2nd ed. Hillsdale,NJ: Lawrence Erlbaum Associates.
Dancer, W. T., and J. Dancer. 1992. “Peer Rating in Higher Education.” Journal of Educa-tion for Business 67: 306–309.
45 Davies, P. 2009. “Review and Reward within the Computerised Peer-Assessment of Essays.”Assessment & Evaluation in Higher Education 34 (3): 321–333.
Dochy, F., M. Segers, and D. M. A. Sluijsmans. 1999. “The Use of Self-, Peer-, and Co-Assessment in Higher Education: A Review.” Studies in Higher Education 24 (3):331–350.
50 Dodge, B. 1995. “WebQuests: A Technique for Internet-Based Learning.” Distance Educator1 (2): 10–13.
Earl, S. E. 1986. “Staff and Peer Assessment – Measuring an Individual’s Contribution toGroup Performance.” Assessment and Evaluation in Higher Education 11 (1): 60–69.
Falchikov, N. 1986. “Product Comparisons and Process Benefits of Collaborative Peer Group55 and Self Assessments.” Assessment and Evaluation in Higher Education 11: 146–166.
Falchikov, N. 1995. “Peer Feedback Marking: Developing Peer Assessment.” Innovations inEducation and Training International 32 (2): 175–187.
14 X. Liu and L. Li
CAEH 823540 CE: KD QA: MA19 July 2013 Coll: QC:Initial

Faul, F., E. Erdfelder, A.-G. Lang, and A. Buchner. 2007. “G⁄Power 3: A Flexible StatisticalPower Analysis for the Social, Behavioral, and Biomedical Sciences.” Behavior Research
5Methods 39: 175–191.Freeman, M. 1995. “Peer Assessment by Groups of Group Work.” Assessment and Evalua-
tion in Higher Education 20 (3): 289–300.Goldfinch, J., and R. Raeside. 1990. “Development of a Peer Assessment Technique for
Obtaining Individual Marks on a Group Project.” Assessment and Evaluation in Higher10Education 15 (3): 210–231.
Gratz, R. K. 1990. “Improving Lab Report Quality by Model Analysis, Peer Review, andRevision.” Journal of College Science Teaching 19 (5): 292–295.
Hiltz, S. R., and B. Wellman. 1997. “Asynchronous Learning Networks as a Virtual Class-room.” Communications of the ACM 40 (2): 44–49.
15Hughes, I., and B. Large. 1993. “Staff and Peer-Group Assessment of Oral CommunicationSkills.” Studies in Higher Education 18 (3): 379–385.
Kwan, K. P., and R. Leung. 1996. “Tutor versus Peer Group Assessment of Student Perfor-mance in a Simulation Training Exercise.” Assessment & Evaluation in Higher Educa-tion 21 (3): 205–214.
20Li, L., and A. L. Steckelberg. 2005. “Impact of Technology-Mediated Peer Assessment onStudent Project Quality.” Paper presented at the annual meeting of the Association forEducational Communications and Technology, Orlando, FL, October.
Li, L., X. Liu, and A. L. Steckelberg. 2010. “Assessor or Assessee: How Student LearningImproves by Giving and Receiving Peer Feedback.” British Journal of Educational Tech-
25nology 41 (3): 523–536. doi: 10.1111/j.1467-8535.2009.00968.x.Li, L., X. Liu, and Y. Zhou. 2012. “Give and Take: a Re-Analysis of Assessor and Asses-
see’s Roles in Technology-Facilitated Peer Assessment.” British Journal of EducationalTechnology 43 (3): 376–384. doi: 10.1111/j.1467-8535.2011.01180.x.
Li, L., A. Steckelberg, X. Liu, J. Cain, T. Starker, and S. Kotcherlakota. 2005. “Comparing30Peer Assessment with Instructor Assessment in a Technology-Mediated Peer Reviewing
System.” In Proceedings of Society for Information Technology & Teacher EducationInternational Conference 2005, edited by C. Crawford, et al., 946–951. Chesapeake, VA:AACE.
Li, L., A. L. Steckelberg, and S. Srinivasan. 2008. “Utilizing Peer Interactions to Promote35Learning through a Computer-Assisted Peer Assessment System.” Canadian Journal of
Learning and Technology 34 (2): 133–148.Liu, E. Z. F., S. S. J. Lin, and S. M. Yuan. 2002. “Alternatives to Instructor Assessment: A
Case Study of Comparing Self and Peer Assessment with Instructor Assessment under aNetworked Innovative Assessment Procedures.” International Journal of Instructional
40Media 29 (4): 395–404.March, T. 2011. “Criteria for Assessing Best WebQuests.” Accessed June 13. http://bestweb-
quests.com/bwq/matrix.asp.Martin, B. 1999. “WebQuest Evaluation Rubric.” Accessed August 28. http://drwilliampmar-
tin.tripod.com/s_WebQuest_Rubric1.html.45Marty, M. C. (2010). “Outcomes of a Peer Assessment/Feedback Training Program in an
Undergraduate Sports Medicine Course.” Doctoral dissertation. The University of NorthCarolina at Greensboro (UNCG) Library. http://libres.uncg.edu/ir/uncg/listing.aspx?id=3645.
Mehrens, W. A., W. J. Popham, and J. M. Ryan. 1998. “How to Prepare Students for Perfor-50mance Assessments.” Educational Measurement: Issues and Practice 17 (1): 18–22.
Orsmond, P., and S. Merry. 1996. “The Importance of Marking Criteria in the Use of PeerAssessment.” Assessment & Evaluation in Higher Education 21 (3): 239–250.
Orsmond, P., S. Merry, and K. Reiling. 2002. “The Use of Exemplars and Formative Feed-back When Using Student Derived Marking Criteria in Peer and Self-Assessment.”
55Assessment & Evaluation in Higher Education 27 (4): 309–323.Patri, M. 2002. “The Influence of Peer Feedback on Self- and Peer-Assessment of Oral
Skills.” Language Testing 19 (2): 109–131.Plutsky, S., and B. A. Wilson. 2004. “Comparison of the Three Methods for Teaching and
Evaluating Writing: A Quasi-Experimental Study.” The Delta Pi Epsilon Journal 46 (1):6050–61.
AQ3
Assessment & Evaluation in Higher Education 15
CAEH 823540 CE: KD QA: MA19 July 2013 Coll: QC:Initial

Pope, N. 2001. “An Examination of the Use of Peer Rating for Formative Assessment in theContext of the Theory of Consumption Values.” Assessment & Evaluation in HigherEducation 26 (3): 235–246.
Saito, H. 2008. “EFL Classroom Peer Assessment: Training Effects on Rating and Com-5 menting.” Language Testing 25 (4): 553–581.
Saito, H., and T. Fujita. 2004. “Characteristics and User Acceptance of Peer Rating in EFLWriting Classrooms.” Language Teaching Research 8 (1): 31–54.
Sluijsmans, D. M. A., S. Brand-Gruwel, and J. J. G. van Merriënboer. 2002. “Peer Assess-ment Training in Teacher Education: Effects on Performance and Perceptions.” Assess-
10 ment & Evaluation in Higher Education 27 (5): 443–454.Somervell, H. 1993. “Issues in Assessment, Enterprise and Higher Education: the Case for
Self-, Peer and Collaborative Assessment.” Assessment & Evaluation in Higher Educa-tion 18: 221–233.
Stefani, L. A. J. 1994. “Peer, Self and Tutor Assessment: Relative Reliabilities.” Studies in15 Higher Education 19 (1): 69–75.
Sung, Y., K. Chang, S. Chiou, and H. Hou. 2005. “The Design and Application of a Web-Based Self- and Peer-Assessment System.” Computers & Education 45 (2): 187–202.
Sung, Y., C.-S. Lin, C.-L. Lee, and K.-E. Chang. 2003. “Evaluating Proposals for Experi-ments: An Application of Web-Based Self-Assessment and Peer Assessment.” Teaching
20 of Psychology 30 (4): 331–333.Svinicki, M. D. 2001. “Encouraging Your Students to Give Feedback.” New Directions in
Teaching and Learning 87: 12–24.Topping, K. 1998. “Peer Assessment between Students in Colleges and Universities.” Review
of Educational Research 68 (3): 249–276.25 Topping, K. 2003. “Self and Peer Assessment in School and University: Reliability, Validity
and Utility.” In Optimizing New Modes of Assessment: in Search of Qualities and Stan-dards, edited by M. Segers, F. Dochy, and E. Cascallar, 55–87. Dordrecht: KluwerAcademic.
Topping, K. J., E. F. Smith, I. Swanson, and A. Elliot. 2000. “Formative Peer Assessment of30 Academic Writing between Postgraduate Students.” Assessment & Evaluation in Higher
Education 25 (2): 149–169.Torrance, H. 2007. “Assessment as Learning? How the Use of Explicit Learning Objectives,
Assessment Criteria and Feedback in Post-Secondary Education and Training Can Cometo Dominate Learning.” Assessment in Education 14 (3): 281–294.
35 Venables, A., and R. Summit. 2003. “Enhancing Scientific Essay Writing Using Peer Assess-ment.” Innovations in Education & Teaching International 40 (3): 281–290.
Vickerman, P. 2009. “Student Perspectives on Formative Peer Assessment: An Attempt toDeepen Learning?” Assessment & Evaluation in Higher Education 34 (2): 221–230.
Wen, M. L., and C. Tsai. 2008. “Online Peer Assessment in an Inservice Science and Mathe-40 matics Teacher Education Course.” Teaching in Higher Education 13 (1): 55–67.
16 X. Liu and L. Li
CAEH 823540 CE: KD QA: MA19 July 2013 Coll: QC:Initial

Appendix 1
WebQuest content rubric5
Beginning (1 point)10Developing (2–3
points)Accomplished (4–5points)
15WebQuest attribute 1: introduction1. Effectiveness ofintroduction
The theme that thewhole WebQuest is
20centred around is notcommunicated her.
The theme forWebQuest iscommunicated here,
25but somewhat vague
The theme forWebQuest iscommunicated. Theintroduction
30effectively informsthe learner what thelesson is about
WebQuest attribute 2: task2. Clarity of task 35Task (end product of
the WebQuest) is notdoable. OR The taskis unclear
Task is partially40stated, but it is unclear
what the end productwill be; ORTask ishard for learners
Task is doable; Task45is briefly and clearly
stated
WebQuest attribute 3: process3. Clarity of process Process is not
50broken into stepsand not clearlystated. Learnerswould not knowexactly what they
55were supposed to do
Process is brokeninto steps and somedirections are given,but there is missing
60information. Learnersmight be confused
Process is brokeninto clearly statedsteps. Most learners
65would know exactlywhere they were inthe process and whatto do next
4. Richness of70process
Few activities; OR Some separate tasksor roles assigned.More complex
75activities required
Different roles andperspectives aretaken. Scaffoldingactivities are
80provided to guidelearners through eachphase of process
No separate roles ortasks assigned
855. Informationresources
No web resourcesprovided; OR Linksto sites and materials
90are not directlyconnected to theassignment; OR Useone source
Information listed95includes relevant and
irrelevant materials;OR Uses a limitednumber of sources
All information listed100is relevant
information that leadsto the completion ofthe task(s); ANDSources are
105differentiated for eachrole or separate task
6. Cognitive level ofprocess
Activities require110simply
comprehending orretelling ofinformation frominformation
115resources andanswering factualquestions
Activities requiresimple analysis of
120information and/orputting togetherinformation fromseveral sources
Activities elicit125thinking that goes
beyond rotecomprehension;Require synthesis ofinformation/taking a
130position/goingbeyond the datagiven and makinggeneralisations/creative product
135(Continued)
Assessment & Evaluation in Higher Education 17
CAEH 823540 CE: KD QA: MA19 July 2013 Coll: QC:Initial

Appendix 1. (Continued).
5 Beginning (1 point)Developing (2–3points)
Accomplished (4–510 points)
WebQuest attribute 4: evaluation7. Clarity of rubric Criteria for success
15 are not described.Criteria for successare at least partiallydescribed
Criteria for success20 are clearly stated in
the form of a rubricWebQuest attribute 5: conclusion8. Effectiveness ofconclusion
25 No conclusion; ORMinimal conclusion;OR Not tied in withthe Introduction
Sums up the30 learners’ experiences.
Makes somereference to the ideasexpressed in theIntroduction
35 Clear closure and tie-in with theIntroduction.Encourages reflectionabout the process,
40 and/or about whatwas learned
Appendix 245
Peer feedback rubric
ID of assessor:50
ID of the assessed project:Introduction(1) Was the assessor able to identify critical issue(s) in this section of the assessed
project? (1 point)55 (2) Was the assessor able to provide constructive suggestions for issue(s) identified in this
section of the assessed project? (1 point)Task(3) Was the assessor able to identify critical issue(s) in this section of the assessed
project? (1 point)60 (4) Was the assessor able to provide constructive suggestions for issue(s) identified in this
section of the assessed project? (1 point)Process(5) Was the assessor able to identify critical issue(s) in this section of the assessed
project? (1 point)65 (6) Was the assessor able to provide constructive suggestions for issue(s) identified in this
section of the assessed project? (1 point)Evaluation(7) Was the assessor able to identify critical issue(s) in this section of the assessed
project? (1 point)70 (8) Was the assessor able to provide constructive suggestions for issue(s) identified in this
section of the assessed project? (1 point)Conclusion(9) Was the assessor able to identify critical issue(s) in this section of the assessed
project? (1 point)75 (10) Was the assessor able to provide constructive suggestions for issue(s) identified in
this section of the assessed project? (1 point)
18 X. Liu and L. Li
CAEH 823540 CE: KD QA: MA19 July 2013 Coll: QC:Initial


