Embed Size (px)
Citation preview

Asset and Wealth Management Activities Survey 2021
July 2022

2Asset and Wealth Management Activities Survey 2021
Table of Contents
Highlights 3
I. Introduction 4
II. Findings 5
A. Asset and Wealth Management Business 5
An Overview 6
Analysis by Investor Base 8
Asset and Wealth Management Business Staff Profile 9
B. Asset Management and Fund Advisory Business 11
An Overview 12
Asset Management and Fund Advisory Business
– Analysis by Client and Product Types 14
Asset Management Business
– Analysis by Location of Management 16
Assets Managed in Hong Kong
– Analysis by Geographical Distribution of Investments 17
– Analysis of Investments by Asset Class 19
SFC-authorised REITs 20
C. Private Banking and Private Wealth Management Business 21
An Overview 22
Analysis by Investor Base 23
Analysis by Client Type 24
Analysis by Asset and Product Type 25
Analysis by Geographical Distribution 26
D. Assets Held under Trusts 27
III. Hong Kong as the Pre-eminent Offshore Renminbi Centre 30
IV. Recent Developments and Outlook 35
Appendices
I – Details of Survey Respondents 48
II – Breakdown of Asset and Wealth Management Business in 2021 49
Definitions 50

3Asset and Wealth Management Activities Survey 2021
$35,546 bn (A)
Asset and wealth management business
$25,888 bn (B)
Asset management and fund advisory business
$10,583 bn (C)
Private banking and private wealth management business
$4,719 bn (D)
Assets held under trusts
Highlights
1 Of the AUM of the asset and wealth management business excluding real estate investment trusts (REITs) and assets held under trusts which were not managed by LCs and RIs (ie, assets held under trusts attributable to non-LCs/RIs).
65%1
Assets sourced fromnon-Hong Kong
investors
8%AUM of asset
management andfund advisory
business
2%AUM of asset and
wealth managementbusiness
12%Staff in asset and
wealth managementbusiness
3%Mainland-related
licensed corporationsand registered
institutions
5%Licensed corporations–– Type 9 Regulated
Activity
Size of Hong Kong-domiciled SFC-
authorised funds
Registered open-ended fund companies
5% 500%
Items above refer to the assets under management (AUM) of the relevant businesses. Certain assets reported under items C and D were managed by licensed corporations or registered institutions and therefore were also reported under item B. Accordingly, item A is not the sum of items B, C and D. For details, please refer to Appendix II on page 49.

4Asset and Wealth Management Activities Survey 2021
I. Introduction
1. The Asset and Wealth Management Activities Survey (AWMAS) is conducted annually by the Securities and Futures Commission (SFC) to collect information and data on the asset and wealth management industry in Hong Kong. It helps the SFC plan its policies and operations.
2. As in previous years, this survey covers the asset and wealth management activities of the following types of firms in Hong Kong:
(a) corporations licensed by the SFC which engage in asset management and fund advisory business (collectively “licensed corporations” or LCs);
(b) banks engaging in asset management, private banking and private wealth management business (collectively “registered institutions” or RIs), and which are subject to the same regulatory regime as licensed corporations, ie, the Securities and Futures Ordinance (SFO), in respect of their asset management activities;
(c) insurance companies (ICs) registered under the Insurance Ordinance, but not licensed with the SFC, which provide services constituting classes of long-term business as defined in Part 2 of Schedule 1 of the Insurance Ordinance and derive gross operating income from wealth management products; and
(d) firms providing trust services (trustees).
3. The AWMAS analyses the asset and wealth management industry from the perspectives both of firms (ie, LCs, RIs, ICs and trustees) and clients (ie, clients of private banking and private wealth management businesses derived from assets or relationships managed out of Hong Kong by LCs and RIs).
4. As in previous years, survey questionnaires were sent to licensed corporations and, with the assistance of the Hong Kong Monetary Authority, the Insurance Authority and the Hong Kong Trustees’ Association, to registered institutions, insurance companies and trustees to enquire about their asset and wealth management activities as at 31 December 2021.
5. Unless stated otherwise, the values given in this report are in Hong Kong dollars.
6. 1,019 (2020: 942) firms reported that they conducted asset management, fund advisory, private banking and private wealth management business or trust services during the survey period. These included 906 (2020: 830) licensed corporations, 45 (2020: 47) registered institutions, 40 (2020: 39) insurance companies and 28 (2020: 26) trustees. The response rate improved compared to the previous year. Please refer to Appendix I on page 48 for details of respondents.

5Asset and Wealth Management Activities Survey 2021
Section II A
Asset and Wealth Management Business

6Asset and Wealth Management Activities Survey 2021
Asset and Wealth Management Business – An Overview
The key findings of the AWMAS for 2021 are illustrated below:
Amidst the fast-changing, challenging environment facing many markets, Hong Kong’s asset and wealth management business remained resilient, with a 2% year-on-year increase in AUM to $35,546 billion2 (US$4,558 billion).
Asset management and fund advisory business
As at 31 December 2021, the AUM of the asset management and fund advisory business conducted by licensed corporations and registered institutions increased year-on-year by 8% to $25,888 billion2 (US$3,320 billion).
Private banking and private wealth management business
As at 31 December 2021, the AUM of the private banking and private wealth management business recorded a year-on-year decrease of 6% to $10,583 billion2 (US$1,357 billion). Respondents reported that the decrease was mainly due to changes in the values of underlying investments held by clients.
Assets held under trusts As at 31 December 2021, the assets held under trusts increased 5% to $4,719 billion2 (US$605 billion).
Assets sourced from non-Hong Kong investors
Net fund inflows
Non-Hong Kong investors remained a major source of funding for the asset and wealth management business3, accounting for 65% of the AUM.
Net fund inflows of $2,152 billion (US$277 billion) were recorded for the asset and wealth management business3 during 2021 (2020: $2,035 billion (US$262 billion)), representing a 6% year-on-year increase.
Assets managed in Hong Kong
Assets managed in Hong Kong made up 56% of the AUM of the asset management business4, with 49% of these assets invested in equities as at 31 December 2021.
2 See Appendix II on page 49 for a breakdown of the asset and wealth management business in 2021.3 Excluded REITs and assets held under trusts attributable to non-LCs/RIs.4 Excluded the AUM of fund advisory business and REITs.
Asset and wealth management business

7Asset and Wealth Management Activities Survey 2021
The total number of staff in the asset and wealth management business increased by 12% to 54,003 as at 31 December 2021.
Hong Kong-domiciled SFC-authorised funds
As at 31 December 2021, the number of Hong Kong-domiciled SFC-authorised funds increased by 7% year-on-year to 865, and their net asset value increased by 5% year-on-year to $1,497 billion (US$192 billion)5 with overall net inflows of $121 billion (US$15.6 billion) during 2021.
Registered open-ended fund companies
As at 31 December 2021, the number of registered open-ended fund companies increased by 500% year-on-year to 486 with 95 sub-funds, including 21 ETFs with a market capitalisation of $16.7 billion (US$2 billion).
Staff
5 110 out of 865 Hong Kong-domiciled SFC-authorised funds were approved pooled investment funds (retail APIFs) which mandatory provident funds may invest into and may also be offered to the public in Hong Kong. Their net asset value amounted to $515 billion (US$66 billion).
6 The figure includes 41 private open-ended fund companies.
LCs – Type 9 Regulated Activity
The number of licensed corporations licensed to carry out asset management (Type 9 regulated activity) in Hong Kong increased by 5% from 1,878 as at 31 December 2020 to 1,979 as at 31 December 2021.
Mainland-related LCs and RIs
The number of licensed corporations and registered institutions established by Mainland-related groups in Hong Kong increased by 3% to 407 as at 31 December 2021, from 397 a year earlier.
8Asset and Wealth Management Activities Survey 2021
Asset and Wealth Management Business – Analysis by Investor Base
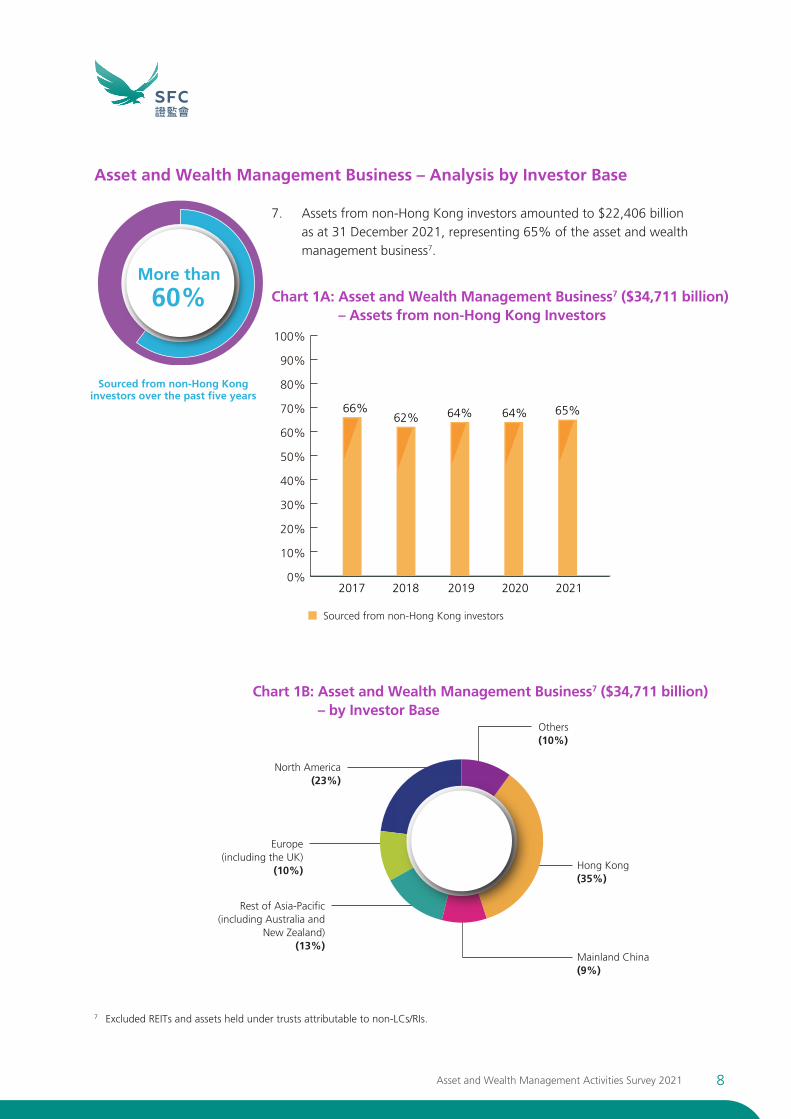
7. Assets from non-Hong Kong investors amounted to $22,406 billion as at 31 December 2021, representing 65% of the asset and wealth management business7.
Sourced from non-Hong Kong investors over the past five years
More than
60%
Hong Kong(35%)
Mainland China(9%)
Others(10%)
North America(23%)
Europe(including the UK)
(10%)
Rest of Asia-Pacific(including Australia and
New Zealand)(13%)
7 Excluded REITs and assets held under trusts attributable to non-LCs/RIs.
Chart 1B: Asset and Wealth Management Business7 ($34,711 billion) – by Investor Base
Chart 1A: Asset and Wealth Management Business7 ($34,711 billion) – Assets from non-Hong Kong Investors
Sourced from non-Hong Kong investors
66%62% 64% 64% 65%
2017 2018 2019 2020 20210%
10%
20%
30%
40%
50%
60%
70%
80%
90%
100%
9Asset and Wealth Management Activities Survey 2021
Asset and Wealth Management Business Staff Profile
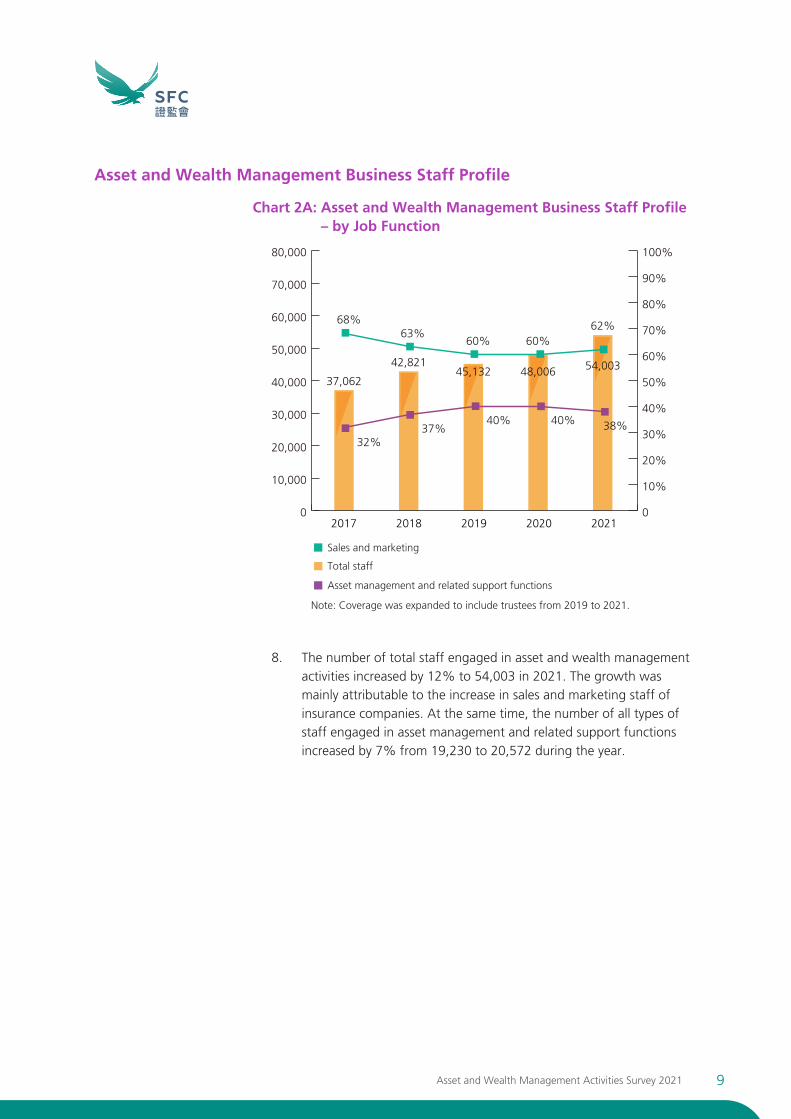
Chart 2A: Asset and Wealth Management Business Staff Profile – by Job Function
0
10,000
20,000
30,000
40,000
50,000
60,000
70,000
80,000
37,062
42,82145,132 48,006 54,003
0
10%
20%
30%
40%
50%
60%
70%
80%
90%
100%
68%
32%
63%
37%
60%
40%
60%
40%
62%
38%
2017 2018 2019 2020 2021
Total staff
Sales and marketing
Asset management and related support functions
Note: Coverage was expanded to include trustees from 2019 to 2021.
8. The number of total staff engaged in asset and wealth management activities increased by 12% to 54,003 in 2021. The growth was mainly attributable to the increase in sales and marketing staff of insurance companies. At the same time, the number of all types of staff engaged in asset management and related support functions increased by 7% from 19,230 to 20,572 during the year.
10Asset and Wealth Management Activities Survey 2021
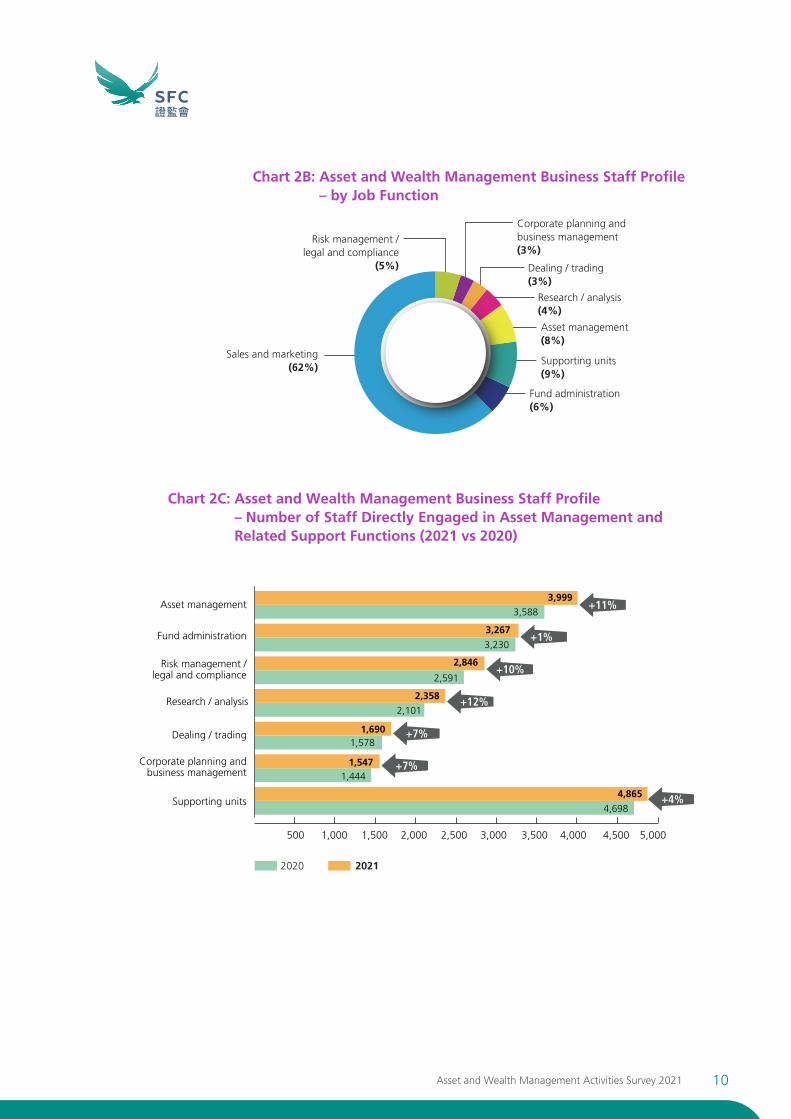
Chart 2B: Asset and Wealth Management Business Staff Profile – by Job Function
Chart 2C: Asset and Wealth Management Business Staff Profile – Number of Staff Directly Engaged in Asset Management and Related Support Functions (2021 vs 2020)
Sales and marketing(62%)
Risk management /legal and compliance
(5%)
Fund administration(6%)
Supporting units(9%)
Asset management(8%)
Research / analysis(4%)
Dealing / trading(3%)
Corporate planning andbusiness management(3%)
Fund administration
Asset management
Research / analysis
Risk management /legal and compliance
Dealing / trading
Corporate planning andbusiness management
Supporting units
2020 2021
1,000 1,500500 2,000 2,500 3,000 3,500 4,000 4,500 5,000
3,267
3,230
3,999
3,588
2,358
1,6901,578
2,101
2,846
1,547
4,865
1,444
2,591
+11%
+1%
+10%
+12%
+7%
+7%
+4%4,698

11Asset and Wealth Management Activities Survey 2021
Section II B
Asset Management and Fund Advisory Business

12Asset and Wealth Management Activities Survey 2021
Asset Management and Fund Advisory Business8 – An Overview
9. This section covers the asset management and fund advisory business carried out by licensed corporations, registered institutions and insurance companies. Fund advisory business mainly comprises institutional fund advisory services provided from Hong Kong by fund managers to overseas management firms.
10. A main component of Hong Kong’s asset and wealth management business, the asset management and fund advisory business recorded a year-on-year increase of 8% to $25,888 billion as at 31 December 2021.
11. The asset management and fund advisory business recorded net fund inflows of $1,514 billion9 for 2021 (2020: $1,379 billion), representing a 10% year-on-year increase.
Chart 3A: Asset Management and Fund Advisory Business
25,888(+8%)
17,51116,447
20,040
24,038
2017 2018 2019 2020 2021
5,000
10,000
15,000
20,000
25,000
30,000
$ billion
1,3071,536
1,1711,543
23,045
21,324
1,1101,300
17,630
8271,094
14,526
6381,242
15,631
Asset Management and Fund Advisory Business of LCs (including REITs)
Asset Management Business of RIs
Asset Management Business of ICs
Asset management and fund advisory business
in Hong Kong
8%
8 See page 50 for the definitions of “asset management” and “fund advisory business”.9 Excluded REITs.

13Asset and Wealth Management Activities Survey 2021
Chart 3B: Asset Management and Fund Advisory Business ($25,888 billion) – by Market Player
12. The aggregate asset management and fund advisory business conducted by licensed corporations saw a year-on-year increase of 8% to $23,045 billion in 2021.
13. The number of licensed corporations licensed to carry out asset management activities (ie, Type 9 regulated activity) increased by 5% to 1,979 as at 31 December 2021 from 1,878 a year earlier. During 2021, the number of individuals licensed for asset management also grew 5% year-on-year from 13,074 to 13,786.
ICs – Asset Management$1,307 bn(5%)
LCs – Asset Management$20,601 bn(79%)
LCs – Fund Advisory$2,212 bn
(9%)
RIs – Asset Management$1,536 bn
(6%)
LCs – REITs$232 bn
(1%)

14Asset and Wealth Management Activities Survey 2021
Asset Management and Fund Advisory Business – Analysis by Client and Product Types
14. As at 31 December 2021, professional investors10 accounted for 69% of the asset management and fund advisory business11 in Hong Kong. The AUM attributable to professional investors increased 3% year-on-year from $17,136 billion to $17,703 billion, which was mainly contributed by corporations, financial institutions and funds. The proportion of AUM attributable to non-professional investors in the asset management and fund advisory business increased to 31% from 28% in the previous year.
Chart 4A: Asset Management and Fund Advisory Business11 ($25,656 billion) – by Client TypeAsset management and
fund advisory business from professional investors
69%
10 See page 51 for the definition of “professional investors”.11 Excluded REITs.
Chart 4B: Asset Management and Fund Advisory Business11 ($25,656 billion) – by Client Type (2021 vs 2020)
Professional investors (69%)
Corporations / financial institutions / funds
Governments / sovereign wealth / central banks
Individuals
Family offices and private trusts
Charities
Institutional and corporate– others
45%
12%
3%
2%
1%
6%
Non-professional investors (including
retail investors)(31%)
Non-professional investors(including retail investors)
Institutional and corporate– others
Professional investors
Charities
Individuals
Family of�ces and private trusts
Governments / sovereign wealth /central banks
Corporations / �nancialinstitutions / funds
2020 2021
2,000 4,000 6,000 8,000 12,00010,000
$ billion
+3%
+8%
-35%
+8%
+8%
+29%
+19%7,953
6,664
1,539
1,190
3,079
11,54511,186
2,856
513
257
770
1,190
238
476

15Asset and Wealth Management Activities Survey 2021
Chart 5A: Asset Management and Fund Advisory Business12 ($25,656 billion) – by Product Type
15. Public funds, including both SFC-authorised funds and those from other jurisdictions, accounted for 37% of the asset management and fund advisory business12 in Hong Kong in 2021, followed by managed accounts (31%) and private funds (17%). Hedge funds (6%) and private equity and venture capital13 (5%) were included in private funds. The AUM attributable to managed accounts increased 8% year-on-year from $7,378 billion to $7,954 billion.
12 Excluded REITs.13 There are private equity firms in Hong Kong which are neither LCs nor RIs. According to AVCJ Research, Hong Kong ranked
second in Asia after Mainland China in 2021 in terms of the total capital under management by private equity funds (excluding real estate funds), which amounted to US$182 billion (2020: US$164 billion).
Others(8%)
Managed accounts(31%)
Pension funds (including mandatory provident funds
(MPF) and occupational retirement schemes (ORSO))
(7%) Public funds(37%)
Private funds(17%)
Chart 5B: Asset Management and Fund Advisory Business12 ($25,656 billion) – by Product Type (2021 vs 2020)
Others
Private funds
Pension funds (includingMPF and ORSO schemes)
Managed accounts
Public funds
2020 2021
2,000 4,000 6,000 8,000 10,000
$ billion
1,9042,143
7,378
9,0449,337
7,954
1,666
3,8084,443
1,779
+3%
+8%
+17%
+7%
+13%

16Asset and Wealth Management Activities Survey 2021
Asset Management Business14 – Analysis by Location of Management
16. As in previous years, more than half of the asset management business was managed in Hong Kong as at 31 December 2021. Assets managed in Hong Kong made up 56% of the overall total14.
14 Excluded fund advisory business and REITs.
Chart 6: Asset Management Business14 (2021: $23,444 billion) – by Location of Management
Assets managed in Hong Kong
56%
10%
20%
30%
40%
50%
60%
70%
80%
90%
100%
55%
45%
55%
45%
56%
44%
58%
42%
56%
44%
2017 2018 2019 2020 2021
Managed in Hong Kong without further delegation
Sub-contracted or delegated to other offices or third parties overseas for management

17Asset and Wealth Management Activities Survey 2021
Assets Managed in Hong Kong15 – Analysis by Geographical Distribution of Investments
18. Hong Kong managers invested mainly in the Asia-Pacific region, accounting for 63% of the assets managed in Hong Kong15 in 2021.
15 Excluded fund advisory business and REITs.
Assets invested in Asia-Pacific
63% Chart 7A: Assets Managed in Hong Kong15 (2021: $13,085 billion) – by Geographical Distribution of Investments
17. Assets managed in Hong Kong15 increased by 5% year-on-year from $12,419 billion in 2020 to $13,085 billion as at 31 December 2021.
10%
20%
30%
40%
50%
60%
70%
80%
90%
100%
68%
32%
67%
33%
66%
34%
64%
36%
63%
37%
2017 2018 2019 2020 2021
Invested outside Asia-Pacific
Invested in Asia-Pacific

18Asset and Wealth Management Activities Survey 2021
Chart 7B: Assets Managed in Hong Kong16 ($13,085 billion) – by Geographical Distribution of Investments
16 Excluded fund advisory business and REITs.
Chart 7C: Assets Managed in Hong Kong16 ($13,085 billion) – by Geographical Distribution of Investments (2021 vs 2020)
19. Hong Kong remained a preferred market for fund managers, with investments amounting to $2,987 billion, representing 23% of all assets managed locally16 in 2021. Investment allocation to Mainland China remained steady, accounting for 21% of all assets managed in Hong Kong.
Hong Kong(23%)
Mainland China(21%)
Rest of Asia-Pacific (including Australia and New Zealand)
(15%)
Europe (including the UK) (13%)
North America (16%)
Japan(4%)
Others(8%)Assets invested in Mainland
China and Hong Kong
44%
Japan
Others
Europe (including the UK)
Rest of Asia-Paci�c (includingAustralia and New Zealand)
North America
Hong Kong
Mainland China
2020 2021
1,000 2,000 3,000 4,000
$ billion
563
1,066722
2,793
2,9873,159
2,626
1,684
2,074
1,918
2,101
1,634
1,590
587
-5%
+6%
-1%
+17%
+6%
-4%
+48%

19Asset and Wealth Management Activities Survey 2021
Chart 8A: Assets Managed in Hong Kong17 ($13,085 billion) – by Asset Class
Chart 8B: Assets Managed in Hong Kong17 ($13,085 billion) – by Asset Class (2021 vs 2020)
20. As at 31 December 2021, the majority of the assets managed in Hong Kong17 were invested in equities, accounting for 49% of the total, followed by bonds, which accounted for 29%.
Assets Managed in Hong Kong17 – Analysis of Investments by Asset Class
Bonds(29%)Equities
(49%)
Collective investment schemes(10%)
Cash and money markets(8%)
Others(4%)
Assets invested in equities
49%
17 Excluded fund advisory business and REITs.
Others
Cash and money markets
Collective investment schemes
Bonds
Equities
2020 2021
1,000 2,000 3,000 5,0004,000 6,000 7,000
$ billion
521492
3,715
6,4146,677
3,664
1,355
1,080541
1,045
-4%
+1%
+30%
+100%
+6%
20Asset and Wealth Management Activities Survey 2021
21. Despite a slight decrease in the total market capitalisation of all SFC-authorised REITs by about 2.5% in 2021, largely due to market conditions, the Hang Seng REIT Index Total Return Index recorded a gain of approximately 3.5%, outperforming the Hang Seng Index (Gross Total Return Index) which recorded a loss of nearly 11.8% for 2021.
22. The first logistics-focused REIT was listed in 2021 and a number of acquisitions were made by listed REITs during the year involving an aggregate consideration of approximately $26 billion.
SFC-authorised REITs

21Asset and Wealth Management Activities Survey 2021
Section II C
PrivateBanking and Private Wealth Management Business

22Asset and Wealth Management Activities Survey 2021
Private Banking and Private Wealth Management Business18 – An Overview
23. As at 31 December 2021, the total assets of the private banking and private wealth management business, which included the asset management services provided to private banking clients by licensed corporations and registered institutions, decreased from the previous year by 6% to $10,583 billion19. Respondents reported that the decrease was mainly due to changes in the values of listed equities and bonds held by clients. Net fund inflows amounted to $638 billion in 2021 (2020: $656 billion).
24. 50 licensed corporations and 42 registered institutions reported that they had conducted private banking or private wealth management business during the survey period.
Chart 9: Private Banking and Private Wealth Management Business ($10,583 billion) – by Market Player
25. As at 31 December 2021, the total number of staff engaged in the private banking and private wealth management business increased by 4% to 8,406, of which 2,909 were Private Wealth Management Relevant Practitioners20.
Private banking and private wealth management business
18 See page 51 for the definition of “private banking and private wealth management business”.19 This figure represents the total assets under private banking and private wealth management clients’ accounts generated,
managed or served by Hong Kong relationship managers of LCs and RIs which are part of a larger banking group, or for which the relationship managers are accountable.
20 The number of staff engaged in the private banking and private wealth management business in 2021 as reported by registered institutions was 7,592, of which 2,641 were Private Wealth Management Relevant Practitioners.
RIs – Asset Management
$1,293 bn (12%)
RIs – Private Banking and Private Wealth Management Business (excluding Asset Management)$8,066 bn (76%)
LCs – Asset Management$235 bn (2%)
LCs – Private Banking and Private Wealth Management Business (excluding Asset Management)$989 bn (10%)
6%

23Asset and Wealth Management Activities Survey 2021
Private Banking and Private Wealth Management Business – Analysis byInvestor Base
26. As at 31 December 2021, 52% of the total AUM by the private banking and private wealth management business were sourced from non-Hong Kong investors, most of which were from the Asia-Pacific region.
Chart 10: Private Banking and Private Wealth Management Business ($10,583 billion) – by Investor Base
Assets sourced from non-Hong Kong investors
52%
Mainland China (16%)
Rest of Asia-Pacific (including Australia and New Zealand) (15%)
Others (11%)North America (5%)
Europe(including the UK) (5%)
Hong Kong (48%)

24Asset and Wealth Management Activities Survey 2021
Chart 11A: Private Banking and Private Wealth Management Business ($10,583 billion) – by Client Type
Chart 11B: Private Banking and Private Wealth Management Business ($10,583 billion) – by Client Type (2021 vs 2020)
Private Banking and Private Wealth Management Business – Analysis byClient Type
21 See page 51 for the definition of “professional investors”.
27. As at 31 December 2021, institutional, corporate and individual professional investors21 contributed 96% of total AUM.
Professional investors (96%)
Corporations / financial institutions / funds
Individuals
Family offices andprivate trusts
Charities
Institutional and corporate– others
45%
27%
17%
1%
Non-professional investors
(including retail investors)
(4%)
6%
1,000 2,000 3,000 4,000 5,000 6,000
Non-professional investors(including retail investors)
Institutional and corporate– others
Professional investors
Charities
Individuals
Family of�ces and private trusts
Corporations / �nancialinstitutions / funds
$ billion
428
478
2,900
4,764
5,010
2,866
35
672
1,784
2,037
813
112
2020 2021
-5%
+1%
-12%
-69%
-17%
-10%

25Asset and Wealth Management Activities Survey 2021
28. Listed equities remained the largest portion of invested assets of the private banking and private wealth management business, representing 47% of the total AUM as at 31 December 2021. The remaining assets were diversified into other products, such as private funds (including hedge funds, private equity and venture capital22), public funds, bonds, cash and deposits.
Private Banking and Private Wealth Management Business – Analysis by Asset and Product Type
Chart 12A: Private Banking and Private Wealth Management Business ($10,583 billion) – by Asset and Product Type
Chart 12B: Private Banking and Private Wealth Management Business ($10,583 billion) – by Asset and Product Type (2021 vs 2020)
22 There are private equity firms in Hong Kong which are neither LCs nor RIs. According to AVCJ Research, Hong Kong ranked second in Asia after Mainland China in 2021 in terms of the total capital under management by private equity funds (excluding real estate funds), which amounted to US$182 billion (2020: US$164 billion).
Listed equities (47%)
Managed accounts (3%)
Private funds (13%)
Public funds (8%)
Others (8%)
Cash and deposits(15%)
Bonds (6%)
Public funds
Managed accounts
Private funds
Listed equities
Bonds
Cash and deposits
Others
2020 2021
1,000 2,000 3,000 4,000 5,000 6,000
$ billion
863763
364
375
1,551
812853
1,503
694
1,346
4,9535,570
1,245
1,007
-11%
+3%
+8%
-31%
+13%
-3%
-5%

26Asset and Wealth Management Activities Survey 2021
29. In 2021, 53% of the AUM of the private banking and private wealth management business was invested in the Asia-Pacific region, with 43% invested in Mainland China and Hong Kong.
Private Banking and Private Wealth Management Business – Analysis byGeographical Distribution
Chart 13A: Private Banking and Private Wealth Management Business ($10,583 billion) – by Geographical Distribution of Investments
Chart 13B: Private Banking and Private Wealth Management Business ($10,583 billion) – by Geographical Distribution of Investments (2021 vs 2020)
Assets invested in Mainland China and Hong Kong
43%
Rest of Asia-Pacific (including Australia and New Zealand)
(8%)Japan(2%)
Others(10%)
North America(23%)
Europe (includingthe UK) (14%)
Hong Kong(34%)
Mainland China(9%)
Mainland China
Hong Kong
Japan
Europe (including the UK)
Rest of Asia-Paci�c(including Australia and
New Zealand)
North America
Others
2020 2021
1,000500 1,500 2,000 2,500 3,000 3,500 4,000
$ billion
9911,175
3,6203,817
2,458
1,0051,104
2,798
844
168
1,497
1,456
169
797
-5%
-12%
-16%
+3%
+6%
-1%
-9%
27Asset and Wealth Management Activities Survey 2021
Section II D
Assets Heldunder Trusts

28Asset and Wealth Management Activities Survey 2021
30 Assets held under trusts in Hong Kong amounted to $4,719 billion as at 31 December 2021, up 5% from a year earlier. 87% of the total assets held under trusts (ie, $4,116 billion) was managed by LCs or RIs.
31. Of the total assets held under trusts as at 31 December 2021, 52% were in Mainland China and Hong Kong.
Chart 14A: Assets Held under Trusts ($4,719 billion) – by Geographical Distribution of Investments
Chart 14B: Assets Held under Trusts ($4,719 billion) – by Geographical Distribution of Investments (2021 vs 2020)
Assets Held under Trusts
Others (5%)
Mainland China(17%)
Hong Kong (35%)
Japan (2%)
Rest of Asia-Pacific (including Australia and New Zealand)
(6%)
Europe (including the UK) (14%)
North America(21%)
Japan
Others
Europe (including the UK)
Rest of Asia-Paci�c (includingAustralia and New Zealand)
Mainland China
Hong Kong
North America
2020 2021
600 800400200 1,200 1,400 1,8001,000 1,600 2,000
$ billion
102
228254
1,003
1,6491,528
1,295
277
781
679
754
309
255
85
+8%
-23%
+4%
+120%
+9%
+20%
-10%

29Asset and Wealth Management Activities Survey 2021
32. Public funds and pension funds, including mandatory provident funds (MPF) and occupational retirement schemes (ORSO), accounted for 70% of the assets held under trusts as at 31 December 2021.
Chart 15A: Assets Held under Trusts ($4,719 billion) – by Client Type
Chart 15B: Assets Held under Trusts ($4,719 billion) – by Client Type (2021 vs 2020)
Others (including family offices and private trusts, charities, and other corporates)(24%)
Governments / sovereignwealth / central banks(6%)
Public funds(32%)
Pension funds (including MPF and ORSO)(38%)
Public funds
Pension funds (including MPF and ORSO)
Governments / sovereign wealth / central banks
Others (including family of�ces and private trusts, charities,
and other corporates)
2020 2021
600200 400 800 1,000 1,200 1,400 1,600 1,800
$ billion
1,3231,502
1,2471,152
261276
1,6491,789
+14%
+8%
+6%
-8%

30Asset and Wealth Management Activities Survey 2021
Section III
Hong Kongas thePre-eminentOffshoreRenminbi Centre

31Asset and Wealth Management Activities Survey 2021
III. Hong Kong as the Pre-eminent Offshore Renminbi Centre
Hong Kong continues to be the pre-eminent offshore renminbi centre offering a wide range of renminbi financial products.
MRF between the Mainland and Hong Kong
Under the Mainland-Hong Kong MRF scheme, 47 Mainland MRF funds were authorised by the SFC and 38 Hong Kong MRF funds were approved by the China Securities Regulatory Commission (CSRC) as of 31 March 2022. The AUM of Mainland MRF funds attributable to Hong Kong investors increased 42% to RMB1,240 million as at 31 March 2022, whilst the AUM in Hong Kong MRF funds attributable to Mainland investors declined 30% to RMB11,886 million.
2018
11
19
32
2019 2020 2021 20220
5
10
15
20
25
30
35
40
2,000
4,000
6,000
8,000
10,000
14,000
16,000
12,000
18,0003816,959
11,886
14,361
10,64712,170
Number of funds RMB million
29
50
0
10
20
30
40
50
60
70
80
90
100
200
400
600
1,000
800
1,200
1,400
5047
874
1,240
374
453456
Number of funds RMB million
50 50
2018 2019 2020 2021 2022
Chart 16: Hong Kong MRF Funds Chart 17: Mainland MRF Funds
(Figures as at 31 March 2022, 26 March for 2021, 27 March for 2020 and 31 March for 2018 to 2019)
(Figures as at 31 March for 2022, 26 March for 2021, 27 March for 2020 and 31 March for 2018 to 2019)
Number of Hong Kong MRF funds approved Number of Mainland MRF funds authorised
AUM of MRF funds attributable to Mainland investors AUM of MRF funds attributable to Hong Kong investors
32Asset and Wealth Management Activities Survey 2021
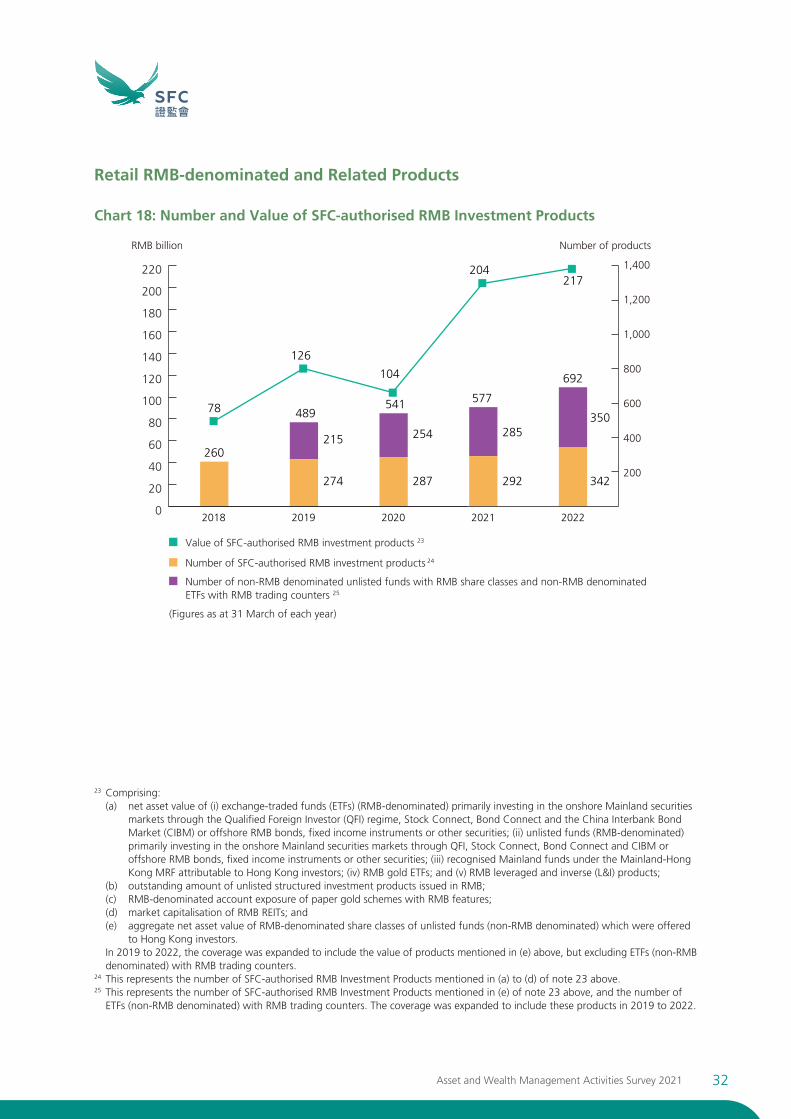
Retail RMB-denominated and Related Products
Chart 18: Number and Value of SFC-authorised RMB Investment Products
23 Comprising:(a) net asset value of (i) exchange-traded funds (ETFs) (RMB-denominated) primarily investing in the onshore Mainland securities
markets through the Qualified Foreign Investor (QFI) regime, Stock Connect, Bond Connect and the China Interbank Bond Market (CIBM) or offshore RMB bonds, fixed income instruments or other securities; (ii) unlisted funds (RMB-denominated) primarily investing in the onshore Mainland securities markets through QFI, Stock Connect, Bond Connect and CIBM or offshore RMB bonds, fixed income instruments or other securities; (iii) recognised Mainland funds under the Mainland-Hong Kong MRF attributable to Hong Kong investors; (iv) RMB gold ETFs; and (v) RMB leveraged and inverse (L&I) products;
(b) outstanding amount of unlisted structured investment products issued in RMB;(c) RMB-denominated account exposure of paper gold schemes with RMB features;(d) market capitalisation of RMB REITs; and(e) aggregate net asset value of RMB-denominated share classes of unlisted funds (non-RMB denominated) which were offered
to Hong Kong investors.In 2019 to 2022, the coverage was expanded to include the value of products mentioned in (e) above, but excluding ETFs (non-RMB denominated) with RMB trading counters.
24 This represents the number of SFC-authorised RMB Investment Products mentioned in (a) to (d) of note 23 above.25 This represents the number of SFC-authorised RMB Investment Products mentioned in (e) of note 23 above, and the number of
ETFs (non-RMB denominated) with RMB trading counters. The coverage was expanded to include these products in 2019 to 2022.
2018
260
2019 2020 2021 2022
200
400
800
1,000
600
1,400
1,200
104
204217
692
541
215
274
254
287
285
292 342
350
57748978
RMB billion Number of products
126
0
20
40
60
80
100
120
140
160
180
200
220
Value of SFC-authorised RMB investment products 23
Number of non-RMB denominated unlisted funds with RMB share classes and non-RMB denominated ETFs with RMB trading counters 25
Number of SFC-authorised RMB investment products 24
(Figures as at 31 March of each year)

33Asset and Wealth Management Activities Survey 2021
2018
16%
22%
17%
2019 2020 2021 20220
2,000
4,000
6,000
8,000
10,000
12,000
14,000
16,000
5%
10%
15%
20%
25%
17% 17%
8,3259,280
5,845
9,786
7,246
US$ million
2017 2018 2019 2020 20210
100
200
300
400
500
600
700
800
900
1,000 945
757
658658618
RMB billion
Chart 19: SFC-authorised ETFs (RMB-denominated) primarily investing in the onshore Mainland securities markets through QFI, Stock Connect, Bond Connect and CIBM
Chart 20: Total Outstanding RMB Customer Deposits and Certificates of Deposit
% of market capitalisation of SFC-authorised ETFs (RMB-denominated) primarily investing in the onshore Mainland securities markets through QFI, Stock Connect, Bond Connect and CIBM out of all ETFs in Hong Kong
Total market capitalisation of SFC-authorised ETFs (RMB-denominated) primarily investing in the onshore Mainland securities markets through QFI, Stock Connect, Bond Connect and CIBM (US$ mil)
Source: Hong Kong Monetary Authority Annual Report
(Figures as at 31 March of each year)
(Figures as at 31 December of each year)

34Asset and Wealth Management Activities Survey 2021
Growing Mainland Participation in the Hong Kong Market
Chart 21: Number and Net Asset Value of SFC-authorised Funds Managed by Mainland-related Fund Groups
0
50
100
150
200
250
300
350
400
450
500
2017 2018 2019 2020 2021
331
429499
(+16%)
354390
348 345318
Number of funds $ billion
295262
50
300
350
250
400
200
500
450
150
100
0
100
200
300
400
500
600
700
800
Number of SFC-authorised funds managed by Mainland-related fund groups
NAV of SFC-authorised funds managed by Mainland-related fund groups
(Figures as at 31 December of each year)
Chart 22: Breakdown of Licensed Corporations and Registered Institutions Established by Mainland-related Groups in Hong Kong (3% year-on-year growth)
Chart 23: Assets sourced from Mainland Investors including Qualified Domestic Institutional Investors – by Geographical Distribution of Investments
Hong Kong $668 bn
(23%)
Other parts of the Asia- Pacific region $746 bn (26%)
North America, Europe and
other regions $1,463 bn (51%)
As at 31 December 2021 (total: $2,877 billion)As at 31 December 2021 (total: 407)
Mainland securities companies(31%)
Mainland banks(18%)
Mainland insurance companies (4%)
Mainland fundmanagement
companies (10%)
Mainland private fund management
companies (8%)
Mainland futures companies (5%)
Other types of Mainland companies (24%)

35Asset and Wealth Management Activities Survey 2021
Section IV
Recent Developmentsand Outlook

36Asset and Wealth Management Activities Survey 2021
IV. Recent Developments and Outlook
Facilitating the development of the asset and wealth management industry in Hong Kong
In September 2021, the People’s Bank of China (PBoC), Hong Kong Monetary Authority (HKMA) and the Monetary Authority of Macao announced the launch of Greater Bay Area Wealth Management Connect (WMC). A pilot scheme commenced in October 2021 with 19 banks in Hong Kong initially eligible to provide related services. The number of eligible Hong Kong banks was later increased to 24.
The SFC worked closely with the PBoC, HKMA and other authorities on the pilot scheme, contributing to the scheme’s design and operations, including the product scope and conduct-related matters. In December 2021, the SFC provided input to HKMA’s frequently asked questions (FAQs) on the scheme’s enhancements to clarify that lists of eligible products may be provided upon investors’ request and explain the permissible promotional activities.
The launch of WMC strengthens Hong Kong’s unique role in intermediating global capital between mainland China and the rest of the world. WMC presents new opportunities for cross-boundary retail investment and addresses the demand for wealth management solutions in Hong Kong from the massive investor base in the Guangdong-Hong Kong-Macao Greater Bay Area, one of the most affluent regions in China with a population of more than 70 million and US$1.6 trillion in gross domestic product.
As of 31 March 2022, more than 100 SFC-authorised Hong Kong-domiciled funds managed by over 30 asset managers were available to Mainland investors via participating Hong Kong banks. Participation in both directions has steadily increased.
The SFC works closely with the Mainland authorities, HKMA and other stakeholders to review the scheme and consider enhancements such as increasing quotas, expanding the scope of eligible investment products, increasing the number and types of participating organisations and improving distribution arrangements.
Greater Bay Area Wealth Management
Connect
37Asset and Wealth Management Activities Survey 2021
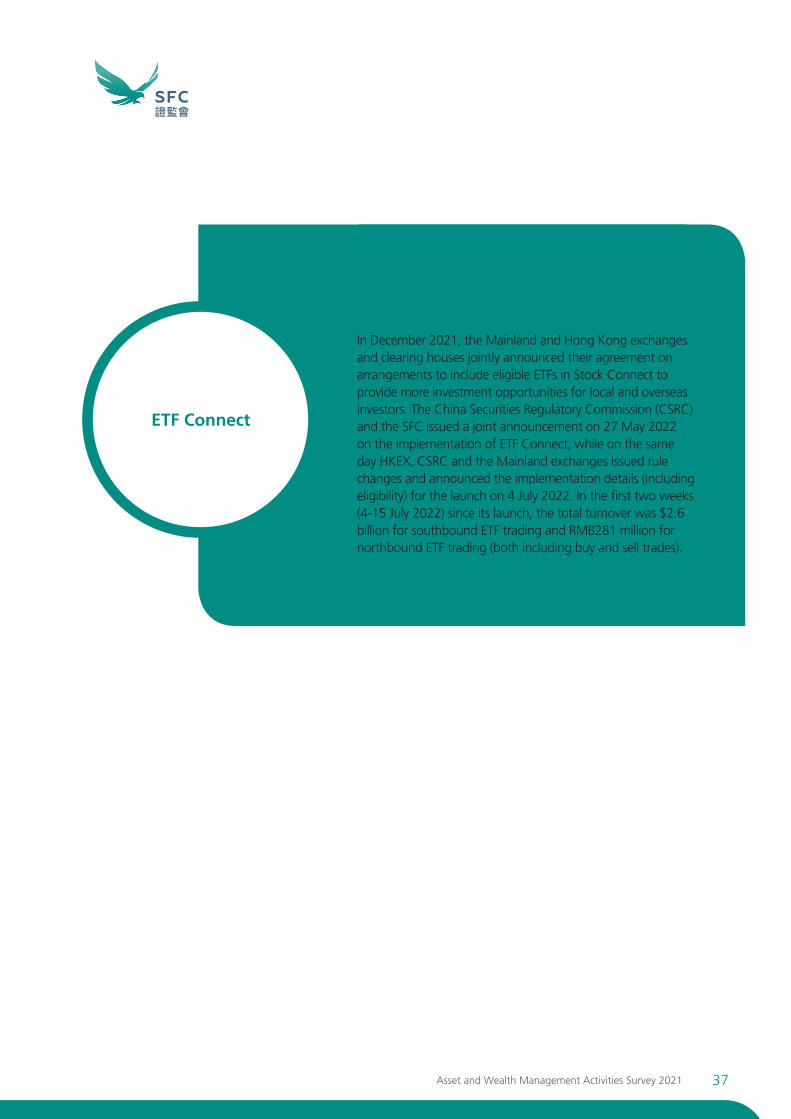
ETF Connect
In December 2021, the Mainland and Hong Kong exchanges and clearing houses jointly announced their agreement on arrangements to include eligible ETFs in Stock Connect to provide more investment opportunities for local and overseas investors. The China Securities Regulatory Commission (CSRC) and the SFC issued a joint announcement on 27 May 2022 on the implementation of ETF Connect, while on the same day HKEX, CSRC and the Mainland exchanges issued rule changes and announced the implementation details (including eligibility) for the launch on 4 July 2022. In the first two weeks (4-15 July 2022) since its launch, the total turnover was $2.6 billion for southbound ETF trading and RMB281 million for northbound ETF trading (both including buy and sell trades).

38Asset and Wealth Management Activities Survey 2021
As of 31 March 2022, 160 SFC-authorised ETFs were listed on the Stock Exchange of Hong Kong Limited (SEHK), including 28 L&I products, with total market capitalisation of $429.89 billion (up 9% year-on-year; 2021: $394.41 billion). The average daily turnover of these ETFs was $8 billion in the preceding 12 months (up 14% year-on-year; 2021: $7 billion).
Following the first cross-listing of four ETFs on SEHK and the Shenzhen Stock Exchange in October 2020, the SFC worked with the CSRC to expand the cross-listing scheme to the Shanghai Stock Exchange (SSE). The first batch of two ETFs were cross-listed in Hong Kong and Shanghai in June 2021. As of 31 March 2022, the total market capitalisation of the six cross-listed ETFs was $6.55 billion.
During the year, the SFC authorised the first three ETFs tracking the MSCI China A 50 Connect Index – the underlying index of the first A-share futures contract traded in Hong Kong. The SFC also authorised the first batch of L&I products tracking Taiwan’s equity indices, the first crude oil futures inverse product and the first gold futures inverse product.
In addition, the SFC authorised the first carbon emission allowances futures26 ETF in Hong Kong. Tracking the ICE EUA Carbon Futures Index, the ETF was listed in March 2022 and provides retail investors with access to the carbon market.
The SFC worked with SEHK to enhance the efficiency and liquidity of ETFs in the secondary market. Effective May 2021, the trading tariff and minimum stock settlement fees are waived for fixed income and money market ETFs. In addition, different trading fee exemptions for securities market maker transactions now apply to ETFs and L&I products based on their liquidity and investment exposures. As part of enhancements to the ETF market infrastructure, actively traded ETFs and L&I products were included under the volatility control mechanism starting in May 2022.
In February 2022, the SFC issued a revised circular on streamlined requirements for eligible ETFs adopting a master-feeder structure to relax the fund size and track record requirements for overseas-listed master ETFs, with a view to offering more investment choice to investors and facilitating the growth of Hong Kong’s ETF market.
ETFs andleveraged and
inverse products
26 Commonly known as carbon futures.

39Asset and Wealth Management Activities Survey 2021
Mutual recognition of funds
The SFC promotes cross-border offerings of eligible Hong Kong public funds to the Mainland and other overseas markets through mutual recognition arrangements. This broadens the investor base for Hong Kong public funds, strengthens Hong Kong’s position as a competitive global asset and wealth management centre and supports the development of local investment expertise.
As part of its efforts to expand market access for Hong Kong public funds, the SFC maintains discussions with the CSRC to enhance the Mainland-Hong Kong Mutual Recognition of Funds (MRF) scheme, including relaxing the sales limit and restrictions for overseas delegation, and offer Mainland investors a more diversified pool of funds managed in Hong Kong.
Under the Mainland-Hong Kong MRF regime, a total of six Hong Kong MRF funds were approved by the CSRC during the year, bringing the total to 85. For the year ended 31 March 2022, Mainland MRF funds recorded a net subscription of around RMB421.4 million while Hong Kong MRF funds recorded a net redemption of around RMB2.9 billion.

40Asset and Wealth Management Activities Survey 2021
In May 2021, the SFC implemented the Government’s three-year grant scheme to encourage a broader range of investment vehicles by providing subsidies for qualified open-ended fund companies (OFCs) and REITs to set up in Hong Kong. The scheme covers 70% of eligible expenses paid to Hong Kong-based service providers, subject to a cap of $1 million per OFC and $8 million per REIT. The SFC issued a press release to set out the details, including the eligibility criteria and application process, and published a set of FAQs to provide guidance to the industry. As of 31 March 2022, subsidies of more than $20 million have been disbursed under the grant scheme.
Grant scheme for OFCs and REITs

41Asset and Wealth Management Activities Survey 2021
Interest in OFCs, the corporate fund vehicle in Hong Kong, has increased substantially following the launch of the Government’s grant scheme for OFCs to set up in Hong Kong and in light of their eligibility under WMC and the ETFs cross-listing initiative.
During the year ended 31 March 2022, the SFC registered 49 new OFCs and approved 87 OFC sub-funds, including 15 ETFs. The total number of registered OFCs has more than quadrupled since the introduction of the Government’s grant scheme. As of 31 March 2022, a total of 62 OFCs with 118 OFC sub-funds (including 23 ETFs with a total market capitalisation of $13 billion) have been set up.
Launched on 1 November 2021, the new re-domiciliation regime facilitates the migration of overseas corporate funds to Hong Kong with enhanced legal and tax certainty, supporting OFCs’ further growth. The new regime helps provide legal and tax certainty to overseas corporate funds which migrate to Hong Kong as OFCs. In April 2022, the SFC registered the first private Cayman Islands corporate fund as a re-domiciled private OFC in Hong Kong.
Open-ended fund companies
To enhance Hong Kong’s attractiveness as a hub for family offices, the SFC is actively involved in the Government’s taskforce on providing tax concessions for eligible family-owned investment holding vehicles managed by single family offices. Subject to the legislative process, the tax concession treatment is aimed to apply for any years of assessment commencing on or after 1 April 2022.
Tax concessions for single family offices

42Asset and Wealth Management Activities Survey 2021
Enhancing the regulatory regime for better investor protection
The SFC regularly reviews its rules and regulations to keep them in step with market developments. The supplementary product design guidance introduced for ILAS helps achieve better investor protection. In addition, facilitative measures to enhance the ILAS authorisation process allow the SFC to maintain an effective regulatory regime. The SFC is working closely with the industry and other stakeholders to implement the new guidance.
Following a holistic review of ILAS conducted in collaboration with the Insurance Authority (IA) and consultations with other stakeholders, the SFC issued a circular in November 2021 to provide enhanced guidance on ILAS product design. The enhancements will foster better investor protection by requiring ILAS fees and charges to be commensurate with comparable alternative products and aligned with the insurance protection offered, as well as by reducing product complexity and enhancing disclosures relating to fees. An 18-month transition period is provided for existing products. In addition, the SFC enhanced its ILAS authorisation process to reduce the approval time for simpler and more standard applications. Separately, the IA issued further guidance on ILAS in December 2021 to enhance their requirements for ILAS product design and point-of-sale information disclosure. The HKMA also introduced enhanced conduct requirements to the banking industry in July 2022 for sale of a new subset of ILAS products with high insurance protection categorised as “Protection Linked Plan” (PLP).
The SFC authorised the first PLP under the new guidance in May 2022.
Investment-linked assurance schemes

43Asset and Wealth Management Activities Survey 2021
Depositaries of SFC-authorised
funds
Depositaries of SFC-authorised funds (ie, top-level trustees and custodians) have important obligations to safeguard scheme assets and conduct independent oversight. To enhance the regulation of public funds in Hong Kong, a new Type 13 regulated activity (RA 13) is proposed to be introduced to bring depositaries under the SFO licensing, supervision and enforcement regime.
In February 2022, the SFC released consultation conclusions on the proposed framework for RA 13, together with a further consultation on the proposed approach to defining RA 13 and amendments to subsidiary legislation and SFC codes and guidelines to implement the new regime. The further consultation ended on 30 April 2022. The SFC will work with the HKMA and engage the industry to finalise the proposals.
The SFC concluded a public consultation in October 2021 on proposed amendments to the Code on Pooled Retirement Funds27 (PRF Code). Key amendments included enhancing the requirements for the operation of PRFs and clarifying the obligations of key operators to strengthen investor protection and ensure that these regulations are up-to-date and fit for purpose. The amendments took effect in December 2021. A 12-month transition period is provided for existing PRFs to comply.
Pooled retirement funds
27 Pooled retirement funds are only available to occupational retirement schemes in Hong Kong as defined under the Occupational Retirement Schemes Ordinance.

44Asset and Wealth Management Activities Survey 2021
Promoting the development of green and sustainable finance
In August 2021, the SFC concluded a consultation on amendments to the Fund Manager Code of Conduct to require fund managers to take climate-related risks into consideration in their investment and risk management processes and make appropriate disclosures to meet investor demand for information about climate-related risks and combat greenwashing. The new requirements will be effective from 20 August 2022.
To assist fund managers in complying with the new requirements, the SFC issued a circular to set out the expected standards and provide examples of industry practices for the management of climate-related risks. The SFC also held two webinars on the SFC Facebook page and explained the new requirements at local industry association events during the year.
Asset managers
45Asset and Wealth Management Activities Survey 2021
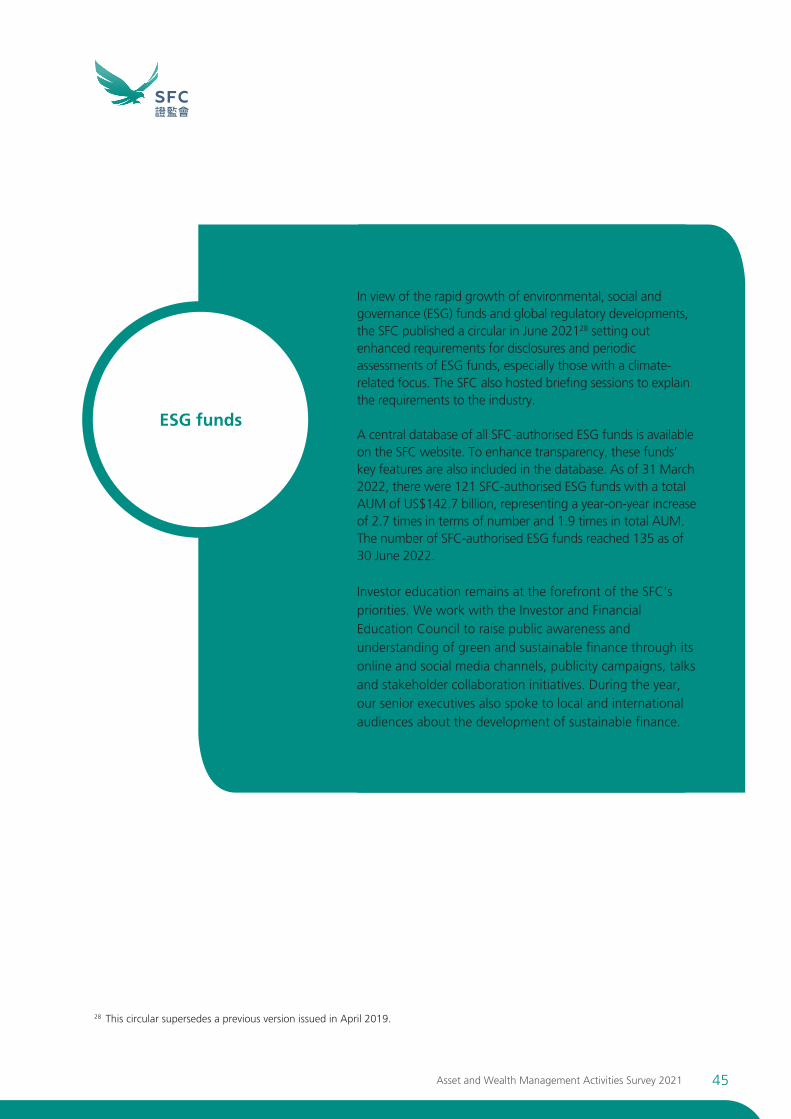
ESG funds
In view of the rapid growth of environmental, social and governance (ESG) funds and global regulatory developments, the SFC published a circular in June 202128 setting out enhanced requirements for disclosures and periodic assessments of ESG funds, especially those with a climate-related focus. The SFC also hosted briefing sessions to explain the requirements to the industry.
A central database of all SFC-authorised ESG funds is available on the SFC website. To enhance transparency, these funds’ key features are also included in the database. As of 31 March 2022, there were 121 SFC-authorised ESG funds with a total AUM of US$142.7 billion, representing a year-on-year increase of 2.7 times in terms of number and 1.9 times in total AUM. The number of SFC-authorised ESG funds reached 135 as of 30 June 2022.
Investor education remains at the forefront of the SFC’s priorities. We work with the Investor and Financial Education Council to raise public awareness and understanding of green and sustainable finance through its online and social media channels, publicity campaigns, talks and stakeholder collaboration initiatives. During the year, our senior executives also spoke to local and international audiences about the development of sustainable finance.
28 This circular supersedes a previous version issued in April 2019.

46Asset and Wealth Management Activities Survey 2021
Responding to a changing market to safeguard investors’ interests
Surveillance and monitoring
To monitor the risk exposure of Hong Kong-domiciled SFC-authorised funds, the SFC requires asset managers to report key data periodically, including subscription and redemption flows, liquidity profiles, asset allocations and securities financing and borrowing transactions. During the year, the scope of the fund data the SFC collects was enlarged to include the use of leverage, credit quality and currency exposure as a means to strengthen its monitoring of fund activities and better understand d eveloping trends in financial markets.
The SFC stays abreast of market developments and tailors its monitoring programme in response to changing market circumstances and stress events (eg, Mainland property developers’ credit events, conflicts between Russia and Ukraine). It closely monitors the liquidity of SFC-authorised funds through reports from asset managers of unusual or untoward activities, including significant redemptions, suspensions of dealing and liquidity problems.
We actively engage with asset managers to monitor their exposure and assess the impact on SFC-authorised funds. They are also reminded to act fairly in the best interests of investors, especially when handling asset disposals, valuations and redemptions.
The SFC also performs routine surveillance of advertisements and handles complaints about property-related, crypto-related or other arrangements suspected to be collective investment schemes (CIS) which may not be offered to the public in Hong Kong and will take regulatory action where appropriate.

47Asset and Wealth Management Activities Survey 2021
To enhance investor protection, the SFC launched a new alert list on its website in August 2021 to warn the public about unauthorised investment arrangements suspected to be CIS. The SFC liaised with the Consumer Council and Estate Agents Authority and also worked with the Investor and Financial Education Council to raise public awareness of the risks of investing in unauthorised CIS.
As of end-June 2022, a total of nine arrangements have been posted on the alert list, involving mostly overseas properties and also digital tokens and foreign exchange trading.
New unauthorised CIS alert list

48Asset and Wealth Management Activities Survey 2021
Licensed corporations
1. A breakdown of the activities of the 906 licensed corporations which engaged in (i) asset management (AM), (ii) fund advisory business (ADV) or (iii) private banking and private wealth management business (PB) is shown below:
Respondents with AM only 599Respondents with ADV only 63Respondents with PB only 15Respondents with AM and ADV 194Respondents with AM and PB 8Respondents with ADV and PB 3Respondents with AM, ADV and PB 24
906
Registered institutions
2. A breakdown of the activities of the 45 registered institutions which engaged in AM or PB is shown below:
Respondents with AM only 3Respondents with PB only 34Respondents with AM and PB 8
45
Insurance companies
3. 40 insurance companies which carried out long-term business of providing services covering wealth management, life and annuity and retirement planning products, but were not licensed by the SFC, responded to the survey.
Trustees
4. 28 trustees providing trust services in Hong Kong responded to the survey.
Details of Survey RespondentsAppendix I

49Asset and Wealth Management Activities Survey 2021
Breakdown of Asset and Wealth Management Business in 2021The table below provides a numeric illustration of the composition of the asset and wealth management business in terms of the type of business and the nature of the entity to which the assets relate.
Appendix II
Private Asset Banking and Asset and Management Private Wealth and Fund Wealth Management Advisory Management Assets Held(billion) LCs RIs ICs Trustees Business Business Business under Trusts
Private banking and 989 8,066 – – 9,055 – 9,055 –private wealthmanagementbusiness (excludingItem 1 below)
Asset management 235 1,293 – – 1,528 1,528 1,528 –business providedto private bankingand private wealthmanagementclients (Item 1)
Asset management 20,366 243 1,307 – 21,916 21,916 – –business forother clients
Fund advisory 2,212 – – – 2,212 2,212 – –business
SFC-authorised 232 – – – 232 232 – –REITs
Assets heldunder trusts
– managed – – – – – – – 4,116 by LCs/RIs
– attributable – – – 603 603 – – 603 to non-LCs/RIs
Total 24,034 9,602 1,307 603 35,546 25,888 10,583 4,719
Relevant section in this report Section II Section II Section II Section II A B C D

50Asset and Wealth Management Activities Survey 2021
Definitions
• “Asset and wealth management business” comprises asset management, fund advisory, private banking and private wealth management, trust services and management of SFC-authorised real estate investment trusts in Hong Kong.
– “Asset management” refers to:
(i) the provision of services which constitute Type 9 regulated activity as defined in Schedule 5 of the SFO carried out by licensed corporations and registered institutions (excluding assets from clients who are also licensed by or registered with the SFC); and
(ii) the management of financial assets arising from the provision of services which constitute classes of long-term business as defined in Part 2 of the First Schedule of the Insurance Ordinance (Chapter 41) (excluding assets sub-contracted or delegated to other licensed corporations or registered institutions in Hong Kong for management),
but excludes fund advisory business and private banking and private wealth management business. Assets managed shall be construed in the same manner.
– “Fund advisory business” refers to the provision of pure investment advisory services for funds or portfolios generating gross operating income for the service providers. It constitutes Type 4 and Type 5 regulated activities as defined in Schedule 5 of the SFO. Such service is generally provided to overseas managers who manage a global or regional portfolio and need expert advice from a manager in Hong Kong or its delegate with respect to the Hong Kong portion or a specific geographic segment of the global or regional portfolio.
– “Private banking and private wealth management business” is a generic term which refers to the provision of banking or other financial services to private banking customers.
Total assets of private banking and private wealth management business refers to total assets under private banking and private wealth management clients’ accounts which have been generated, managed or served by Hong Kong relationship managers, or for which the relationship managers are accountable, and assets managed by licensed corporations and registered institutions in Hong Kong, including i) assets managed and services provided which constitute regulated activities as defined in Schedule 5 to the SFO and ii) assets managed and services provided beyond those activities regulated under the SFO, including but not limited to cash and deposits, spot foreign exchange, currency-linked deposits/notes/instruments and physical commodities.
• “AUM” means assets under management.
• “Insurance company” means an insurance company registered under the Insurance Ordinance (Chapter 41) which provides services that constitute classes of long-term business as defined in Part 2 of the First Schedule of the Insurance Ordinance and is not licensed by the SFC. For those insurance companies which are also licensed by the SFC, their reported AUM are categorised with those of other licensed corporations.
• “Licensed corporation” means a corporation granted a licence under section 116 or 117 of the SFO to carry on a regulated activity in Hong Kong.

51Asset and Wealth Management Activities Survey 2021
• “Private Wealth Management Relevant Practitioners” refers to Relevant Practitioners as set out in a circular issued by the Hong Kong Monetary Authority entitled “Update on Enhanced Competency Framework on Private Wealth Management (ECF-PWM)” and pages 2 to 5 of the ECF-PWM document dated 14 July 2021 enclosed therewith.
• “Professional investors” includes institutional professional investors, corporate professional investors and individual professional investors.
– “Institutional professional investors” refers to persons falling under paragraphs (a) to (i) of the definition of “professional investor” in section 1 of Part 1 of Schedule 1 to the SFO;
– “Corporate professional investors” refers to trust corporations, corporations or partnerships falling under sections 3(a), (c) and (d) of the Securities and Futures (Professional Investor) Rules (Chapter 571D) (“Professional Investor Rules”); and
– “Individual professional investors” refers to individuals falling under section 3(b) of the Professional Investor Rules.
• “Registered institution” means an authorised financial institution registered under section 119 of the SFO. An authorised financial institution means an authorised institution as defined in section 2(1) of the Banking Ordinance (Chapter 155).
• “REITs” refers to SFC-authorised real estate investment trusts.


