Embed Size (px)
Citation preview
PADINI HOLDING BERHAD
1.0 COMPANY PROFILE
1.1 Background of the company
Padini is a Malaysian-domiciled investment-holding company
headquartered in HicomGlenmarie Industrial Park, Shah Alam.
Incorporated in 1971 as proprietorship under the trade name
Hwayo Garments Manufacturers Company, Padini was initially
engaged in the manufacture and wholesale of ladies wear. The
company subsequently added men’s and children’s lines to its
offerings when it established its first three brands from 1975
– 1987. In 1988, Padini discarded its role as wholesaler to
take up the role of consignor. Thereafter, the first single-
brand store distributing Seed was opened in 1992 in Sungei Wang
Plaza, Kuala Lumpur.
The company has nine labels in its family of brands and retail
in 330 freestanding stores, franchised outlets and consignment
counters in Malaysia and around the world. The company’s
subsidiaries include Vincci Ladies’ Specialties Centre Sdn.
Bhd., which is engaged in dealing of ladies’ shoes and
accessories; Padini Corporation Sdn Bhd., Seed Corporation Sdn.
Bhd., Yee Fong Hung (Malaysia) SendirianBerhad (Yee Fong Hung)
and Padini International Limited, which is engaged in dealing
of garments and ancillary products; Padini Dot Com Sdn. Bhd.
(Padini Dot Com), which is engaged in provision of management
services, and Mikihouse Children’s Wear Sdn. Bhd. (Mikihouse),
which is engaged in dealing of children’s garments, maternity
wear and accessories.
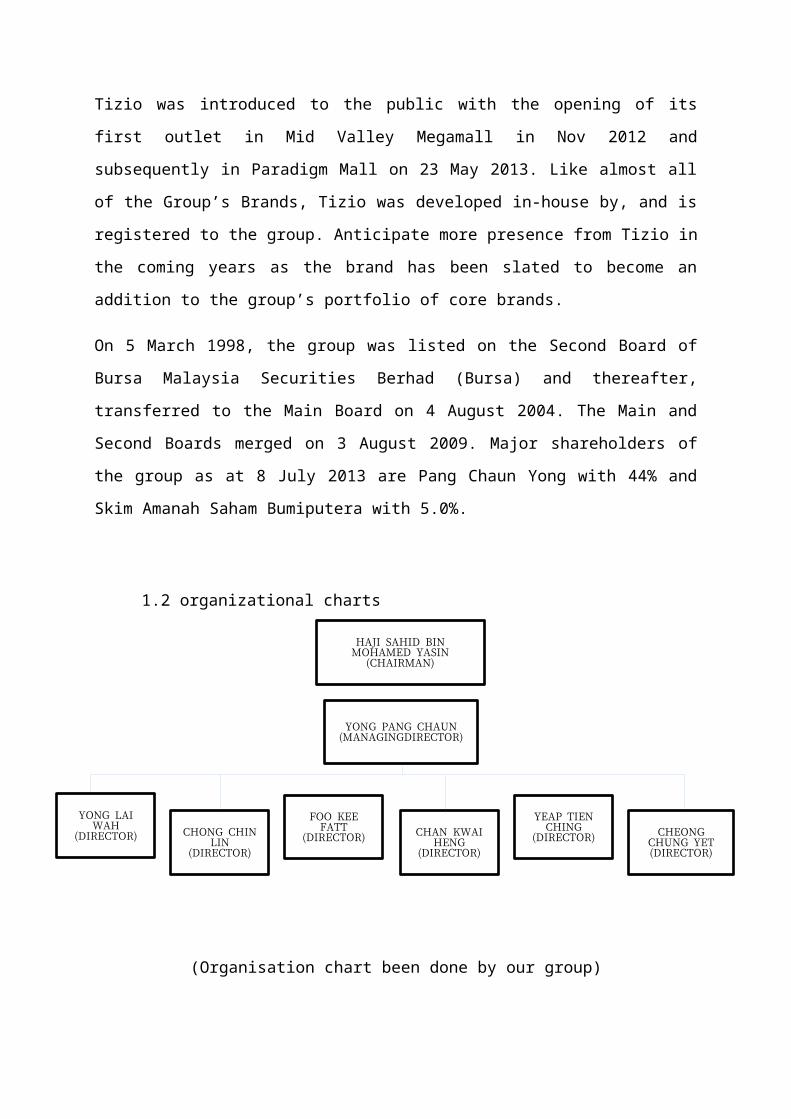
HAJI SAHID BIN MOHAMED YASIN
(CHAIRMAN)
YONG PANG CHAUN(MANAGINGDIRECTOR)
FOO KEE FATT
(DIRECTOR) CHEONG CHUNG YET(DIRECTOR)
CHAN KWAI HENG
(DIRECTOR)
CHONG CHIN LIN
(DIRECTOR)
YONG LAI WAH
(DIRECTOR)
YEAP TIEN CHING
(DIRECTOR)
Tizio was introduced to the public with the opening of its
first outlet in Mid Valley Megamall in Nov 2012 and
subsequently in Paradigm Mall on 23 May 2013. Like almost all
of the Group’s Brands, Tizio was developed in-house by, and is
registered to the group. Anticipate more presence from Tizio in
the coming years as the brand has been slated to become an
addition to the group’s portfolio of core brands.
On 5 March 1998, the group was listed on the Second Board of
Bursa Malaysia Securities Berhad (Bursa) and thereafter,
transferred to the Main Board on 4 August 2004. The Main and
Second Boards merged on 3 August 2009. Major shareholders of
the group as at 8 July 2013 are Pang Chaun Yong with 44% and
Skim Amanah Saham Bumiputera with 5.0%.
1.2 organizational charts
(Organisation chart been done by our group)
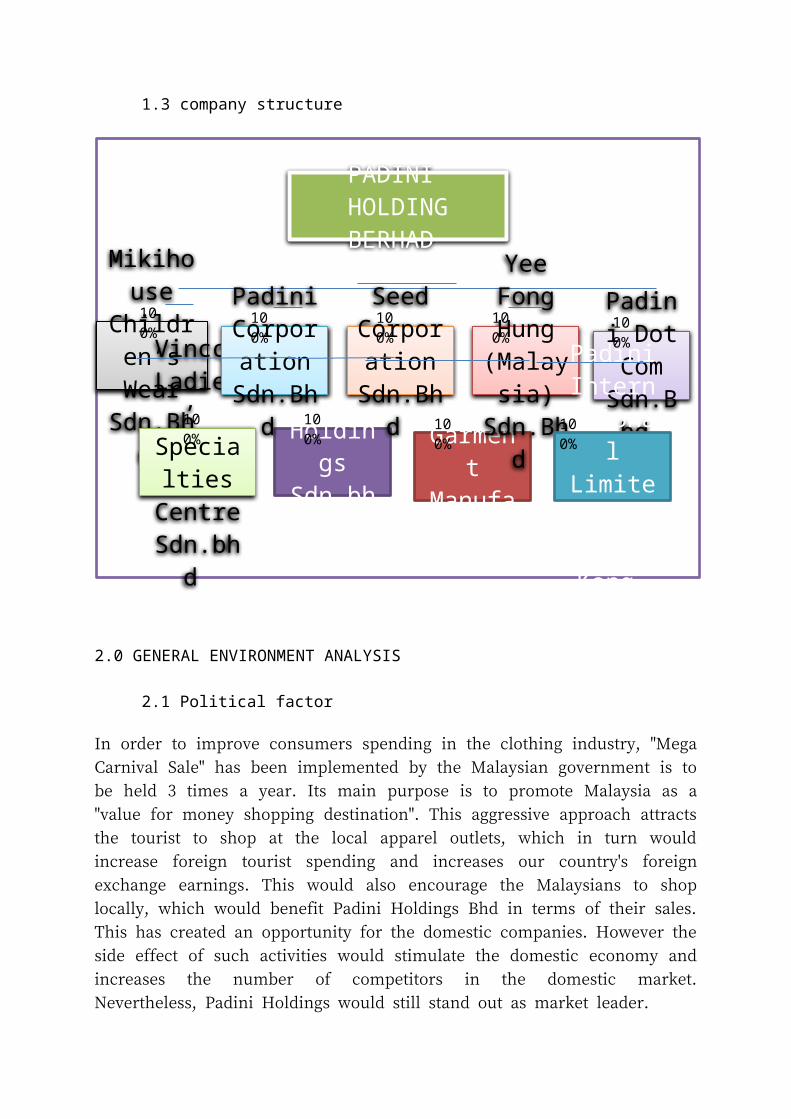
1.3 company structure
2.0 GENERAL ENVIRONMENT ANALYSIS
2.1 Political factor
In order to improve consumers spending in the clothing industry, "Mega
Carnival Sale" has been implemented by the Malaysian government is to
be held 3 times a year. Its main purpose is to promote Malaysia as a
"value for money shopping destination". This aggressive approach attracts
the tourist to shop at the local apparel outlets, which in turn would
increase foreign tourist spending and increases our country's foreign
exchange earnings. This would also encourage the Malaysians to shop
locally, which would benefit Padini Holdings Bhd in terms of their sales.
This has created an opportunity for the domestic companies. However the
side effect of such activities would stimulate the domestic economy and
increases the number of competitors in the domestic market.
Nevertheless, Padini Holdings would still stand out as market leader.
PADINI HOLDING BERHAD Mikiho
use Children’s Wear
Sdn.Bhd
Padini Dot Com
Sdn.Bhd
Vincci Ladies
’ Specialties Centre Sdn.bh
d
Vincci Holdings
Sdn,bhd
The New
World Garmen
t Manufacturer Sdn.Bh
d
Yee Fong Hung (Malaysia) Sdn.Bh
d
Seed Corporation Sdn.Bh
d
Padini Corporation Sdn.Bhd
Padini Internationa
l Limite
d, Hong Kong
100%
100%
100%
100%
100%
100%
100%
100%
100%
Through ETP projects and initiatives, the Malaysian Government
plans to boost Malaysians‟ income level. Padini should be able
to realize on the growing of Malaysian affluent as many can
afford to purchase higher priced items besides the value
products that the group offers. The incremental of wealthy and
thriving consumer base has allowed brands such as Padini,
Padini Authentic and Seed to obtain higher revenue. The group
can take this advantage to strengthen its single brand stores
into multi- brand concept stores, where consumers gain access
to all of Padini‟s in - house brand collections
2.2 Economic factor
Malaysia's economic growth is to be has been unstable fluctuating from -
1.5 to -2.6 from 2008 to 2010. The highest growth was during the period
of March to September 2009 which increases from 7, 8 to 5.7. The–economic growth is expected to be due to the domestic market with
growth in the private sector. The private sector makes up the majority of
the Malaysian economy, with private consumption accounting for nearly
44% of GDP. "Love Malaysia, Buy Malaysia" campaign was launched to by
the government to get Malaysians to support domestic market and take
holidays in local tourist sites. The government also subsequently launched
a national campaign on wise spending, with the aim to educate
consumers on the importance of domestic demand on the GDP growth
and economic recovery as a whole.
2.3 Social factor
Malaysian is classified as an upper middle-income country, and considered
as one of the most developed among the developing countries. Middle
income households defined as those earning between RM1, 500 and RM3,
500 per month, and has increased from 32.3% of total household
population in 1995 to 37% in 1999. The low-income group, categorized by
household income of up to RM1, 500 per month, spends a proportion of
this amount on food. Meanwhile, the high and middle income households
spend most of their money at hypermarkets. 3.4% of their income is
spent on clothing and foot wear. Malaysia's consumers' lifestyle has been
changing for the better due to the rise in education levels. High profile
retailers as well as global mass media have shaped consumers buying’behaviour, resulting in the Malaysians being more westernized. The
Malaysian's life leisure life revolves around trendy shopping malls.
Therefore Padini Holdings Bhd has to be more update with the latest
trends. They have to advertise and keep the consumers informed and
reminded that they still exist and provide the customers with quality and
trendy clothes.
2.4 Technological factor
With the Internet and e-commerce, retailers can now sell their products
online and deliver it to customers on their door-step efficiently within a
timely manner. It can make customers' life more convenient as they do
not need to get their house to go purchase a product in the hypermarket
and making the purchase at the comfort of their own home. Furthermore,
retailers can also sell their products to the overseas market without the
need to open a physical store in the foreign country. This helps Padini
Holdings to earn more profit using online intermediaries and cut costs by
not establishing new stores in certain areas.
2.5 Environment factor
Environmental changes have a major impact on virtually all
products, services, markets, and customers. In Padini,
environmental factors affect a lot in trends, which customer
nowadays up to date with fashions. In addition, new trends are
creating a different type of consumer and, consequently, need
for a different products, services and strategies. So, Padini
is in line because they provide variety of products to satisfy
the need of customer. Environment factor such as weather also
affected the Padini s sales where generally fluctuate with seasonal’festivities such as Hari Raya, Christmas and the Chinese Lunar New Year.
Nationwide sales programs such as the Malaysian Mega-Sale and Merdeka
Sale are also potent revenue drivers. But, during quiter periods with no
festivities (typically every 4Q of Padini s FY or Apr-Jun quarter), the’group sees comparatively lower sales figures. However, this is a known
characteristic of the retail industry and is not expected to have substantial
impact on Padini s overall financial performance.’
2.6 Legal factor
Padini has a large product offering for its customers. It offers luxury and
high fashion items that cater to upmarket consumers (Seed, Padini,
Vincci+),affordable, core value garments for the lower to middle income
earners (Brands Outlets, Vincci, Padini Authentics),and its own children s’and maternity wear (Miki). It recently started to offer children s wear’under Seed and Padini. Therefore, these brands has been credited by the
Association of Accredited Advertising Agencies of Malaysia (4 A s)’incollaboration with Interbrand the world s leading brand consultant to– ’be the Malaysia s 30 most valuable brands. ’
3.0 TASK ENVIRONMENT ANALYSIS
3.1 Porter 5 Forces Analysis
1. Threat of new entrants – high.Malaysia is becoming an
important expansion base for Western retailers. Even as
big retail brands and labels focus their attentions on the
emerging markets of China, India or even our ASEAN
neighbours, they too have seen it fit to establish a
presence in Malaysia as well. Increasingly, Malaysia will
see more international retailers venturing into the market
directly as opposed to via the traditional gateways of
Hong Kong and Singapore. In the past year itself, there
has been an influx of international brands, which compete
on the same playing field as Padini, the most recent being
Japanese behemoth Uniqlo and Swedish fashion retailer H&M,
which have opened their flagship stores in the Golden
Triangle. We believe that given the growing size of the
pot, the main barrier to entry would be with regards to
the prime retail space which is getting scarce.
2. Bargaining power of buyers – high. The rising income
levels, better education and greater access to a variety
of brands and labels have resulted in a class of consumers
more sophisticated in their needs and preferences. Where
customer loyalty is of the utmost importance, retailers
have strived to attain superior customer responsiveness by
employing various methods of advertisements and
promotions, loyalty programmes, as well as to increase
customer’s perceived value of a brand. Brands catering to
this expanding group of consumers have become numerous but
more often than not, these brands pay more attention to
the pricing strategies than to the perceived quality of
the products under their brands. As a result, many brands
fail rather than thrive.
3. Bargaining power of suppliers – low. As with the trend in
the fashion retail industry, Padini designs its garments
while outsourcing the manufacturing operations to OEM
manufacturers. Knitwear and graphic Ts are manufactured
locally while the more complex woven items are sourced
from China and Sri Lanka. With the advent of the global
slowdown, the garment manufacturing industry in China has
become saturated and oversupply issues have more than
mitigated the effects of minimum wage rebasing. Thus far,
bargaining power of suppliers has remained low, and as a
result, large scale Chinese manufacturers who had
previously shunned the small to mid-sized fashion
retailers have reopened their doors to Padini.
4. Threat of substitute products – medium. Padini’s products
cater to a wide range of audiences, the more pronounced
differences being the styles and pricing of the brands
they carry. The SEED and Padini brands are trendier while
the PDI and Vincci brands are more neutral. The brands
outlet’s products, on the other hand, houses lesser-known
value-for-money labels, which include off-season and
surplus branded items. We believe that Padini’s
differentiated products as well as its flexibility of
varying its merchandise mix provides the group with some
degree of immunity, though it is note-worthy that the
Vincci accessories are not generally designed in-house,
which means these products no longer retain their unique
qualities. In this situation, these ranges of products
runs the risk of attracting the interest of supplies eager
to broaden their distribution as well as competitive
retailers anxious to boost their own sales.
5. Competitive rivalry within the industry – high. The
garment retail industry is by nature, one of the most
competitive areas of commerce. Competition is particularly
apparent where there are numerous other brands, which
operate at the same locations as Padini. These brands
compete not only for market share and floor space, but
also for front line retail staff, which is becoming
increasingly scarce. The increased demand for staff
required to run retail operations extends beyond fashion
retailing, and the current rapid growth in retail outlets
of all kinds has caused high turnover rates for front line
staff, which has in turn made recruitment costly, time-
consuming and often unproductive. Management has envisaged
that the coming years will see the situation deteriorate
further if nothing is done to radically after the
conditions of demand and supply of labour in this
industry.
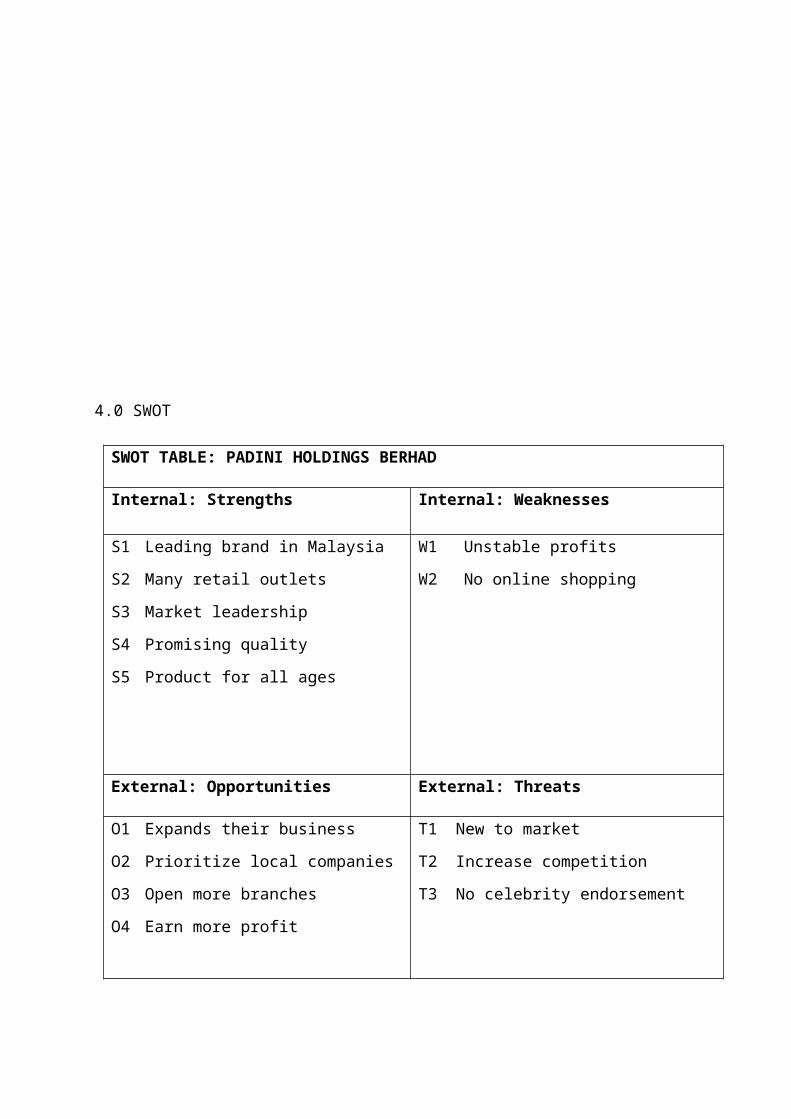
4.0 SWOT
SWOT TABLE: PADINI HOLDINGS BERHAD
Internal: Strengths Internal: Weaknesses
S1
S2
S3
S4
S5
Leading brand in Malaysia
Many retail outlets
Market leadership
Promising quality
Product for all ages
W1
W2
Unstable profits
No online shopping
External: Opportunities External: Threats
O1
O2
O3
O4
Expands their business
Prioritize local companies
Open more branches
Earn more profit
T1
T2
T3
New to market
Increase competition
No celebrity endorsement
4.1.1 Strengths
1. Leading brand in Malaysia
PADINI is a leading brand in Malaysia. There are wide
range in style and pricing of the brands that PADINI
carry. For examples, PADINI carries SEED, Vincci,
Mikihouse and etc. the products not only trendy but also
neutral which is suitable for all type of consumers.
2. Many retail outlets
There are in total of 330 retail outlets in Malaysia and
around the world for Padini Holding Berhad. With many
retail outlets, PADINI is making sure that they are
unbeatable for their competitors.
3. Market leadership
PADINI is among the well-known brand established since
1971 in Malaysia. It strategically located factories and
warehouses ensure wide market coverage in Malaysia.
4. Promising quality
PADINI ensure the quality of their product is in higher
aspect for their brand and in-house brands under them.
5. Products for all ages
With in-house brands under PADINI, they ensure that their
product is suitable for all ages of consumers.
4.1.2 Weaknesses
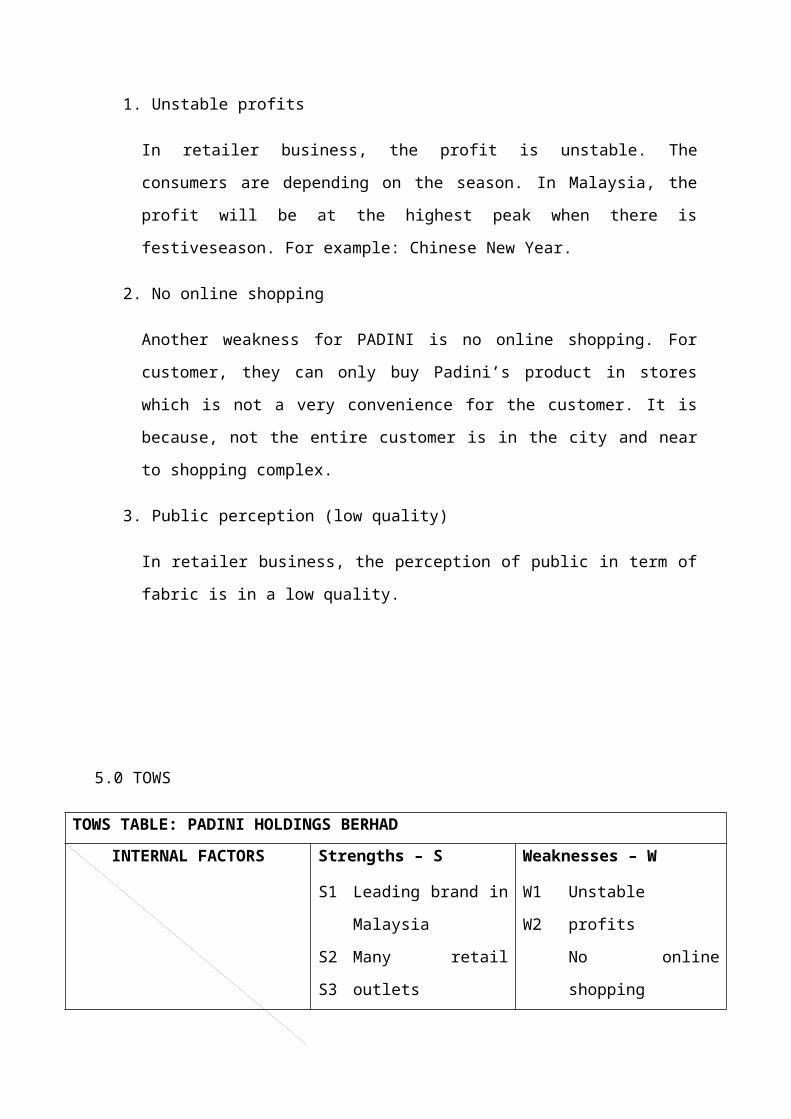
1. Unstable profits
In retailer business, the profit is unstable. The
consumers are depending on the season. In Malaysia, the
profit will be at the highest peak when there is
festiveseason. For example: Chinese New Year.
2. No online shopping
Another weakness for PADINI is no online shopping. For
customer, they can only buy Padini’s product in stores
which is not a very convenience for the customer. It is
because, not the entire customer is in the city and near
to shopping complex.
3. Public perception (low quality)
In retailer business, the perception of public in term of
fabric is in a low quality.
5.0 TOWS
TOWS TABLE: PADINI HOLDINGS BERHADINTERNAL FACTORS Strengths – S Weaknesses – W
S1
S2
S3
Leading brand in
Malaysia
Many retail
outlets
W1
W2
Unstable
profits
No online
shopping
EXTERNAL FACTORS
S4
S5
Market
leadership
Promising
quality
Product for all
agesOpportunities – O SO Strategy WO StrategyO1
O2
O3
O4
Expands their
business
Prioritize local
companies
Open more branches
Earn more profit
(s3 + o1)
Using the power as
market leadership
to expand their
business
(horizontal)
(w2 + o3)
Placing more
branches to cover
loss of potential
online customer
(market dev)Threats – T ST Strategy WT StrategyT1
T2
T3
New to market
Increase competition
No celebrity
endorsement
(s1 + t3) (w1 + t2)
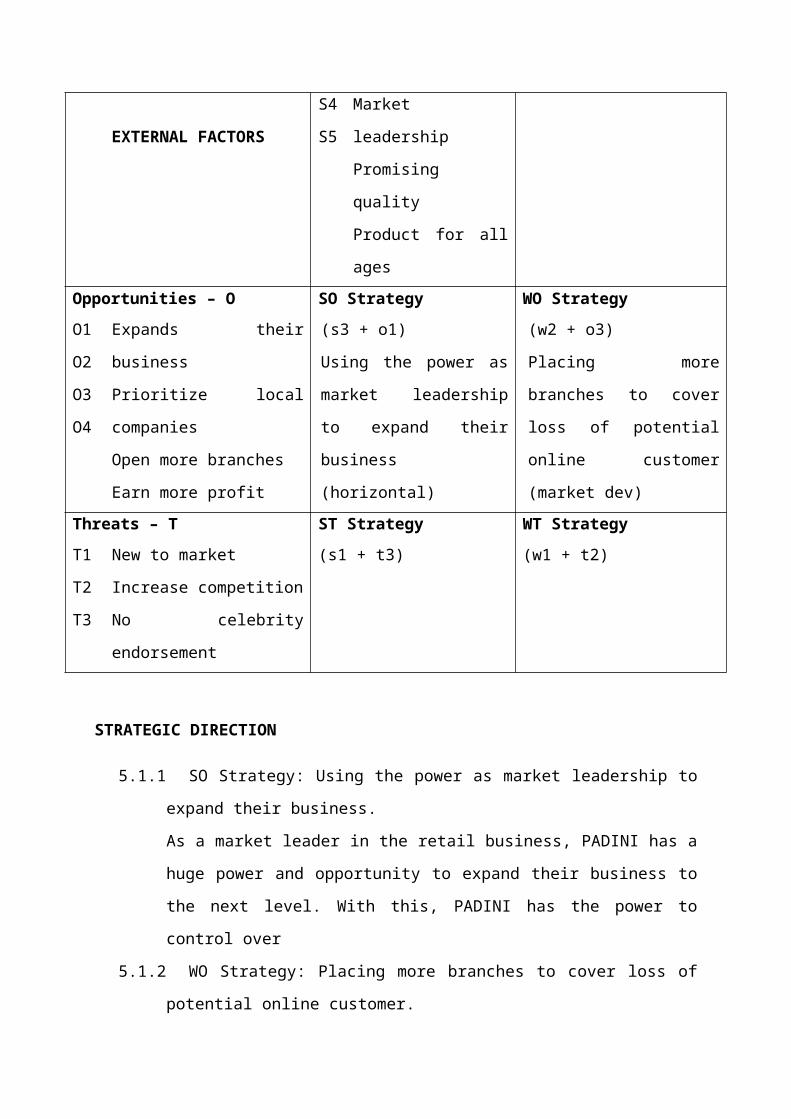
STRATEGIC DIRECTION
5.1.1 SO Strategy: Using the power as market leadership to
expand their business.
As a market leader in the retail business, PADINI has a
huge power and opportunity to expand their business to
the next level. With this, PADINI has the power to
control over
5.1.2 WO Strategy: Placing more branches to cover loss of
potential online customer.
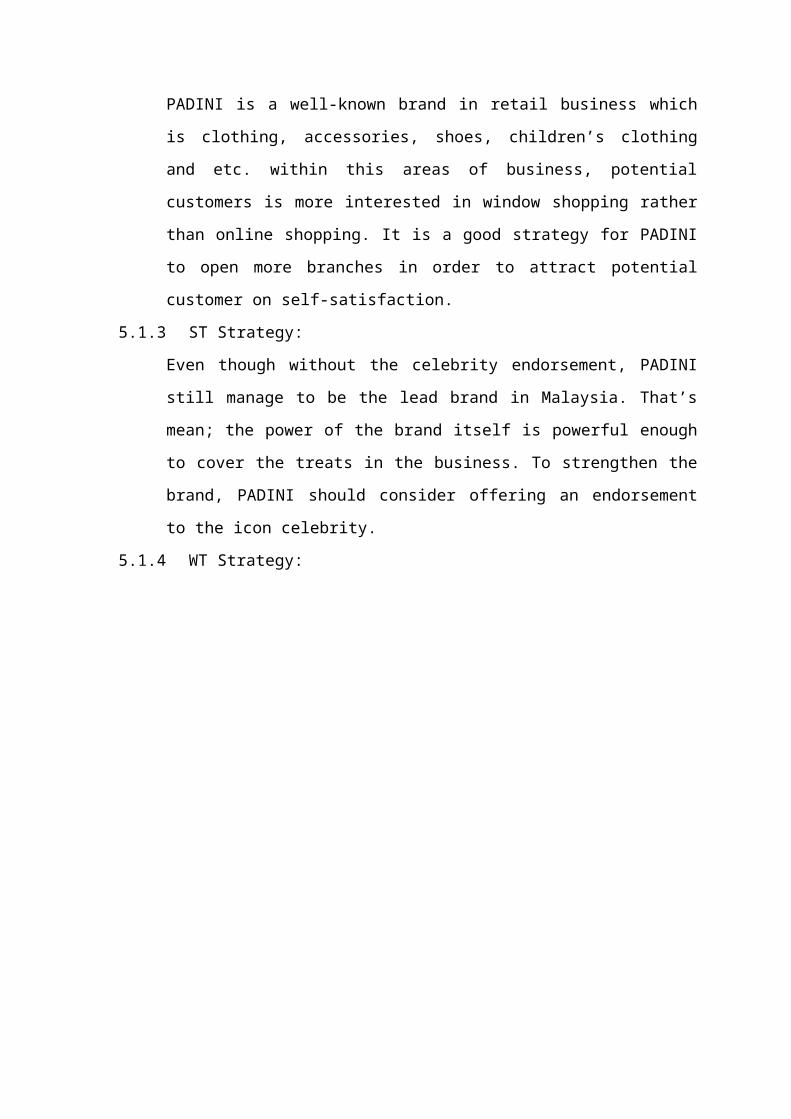
PADINI is a well-known brand in retail business which
is clothing, accessories, shoes, children’s clothing
and etc. within this areas of business, potential
customers is more interested in window shopping rather
than online shopping. It is a good strategy for PADINI
to open more branches in order to attract potential
customer on self-satisfaction.
5.1.3 ST Strategy:
Even though without the celebrity endorsement, PADINI
still manage to be the lead brand in Malaysia. That’s
mean; the power of the brand itself is powerful enough
to cover the treats in the business. To strengthen the
brand, PADINI should consider offering an endorsement
to the icon celebrity.
5.1.4 WT Strategy:
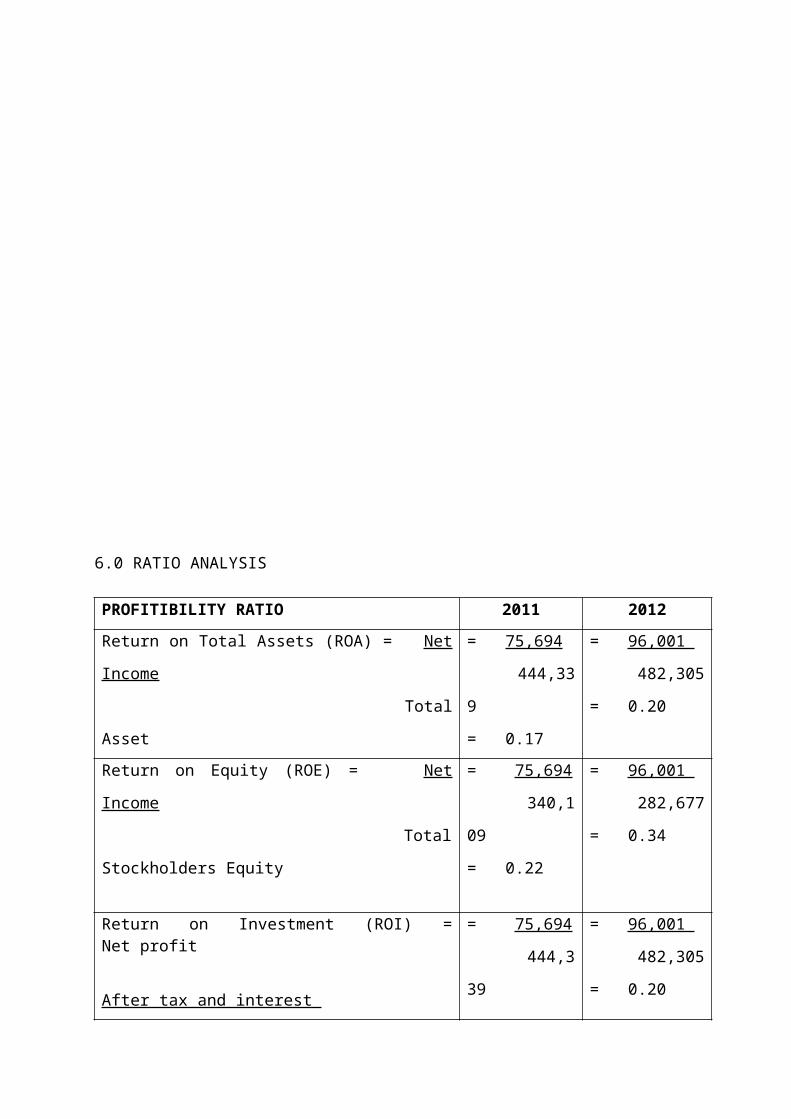
6.0 RATIO ANALYSIS
PROFITIBILITY RATIO 2011 2012Return on Total Assets (ROA) = Net
Income
Total
Asset
= 75,694
444,33
9
= 0.17
= 96,001
482,305
= 0.20
Return on Equity (ROE) = Net
Income
Total
Stockholders Equity
= 75,694
340,1
09
= 0.22
= 96,001
282,677
= 0.34
Return on Investment (ROI) =Net profit
After tax and interest
= 75,694
444,3
39
= 96,001
482,305
= 0.20
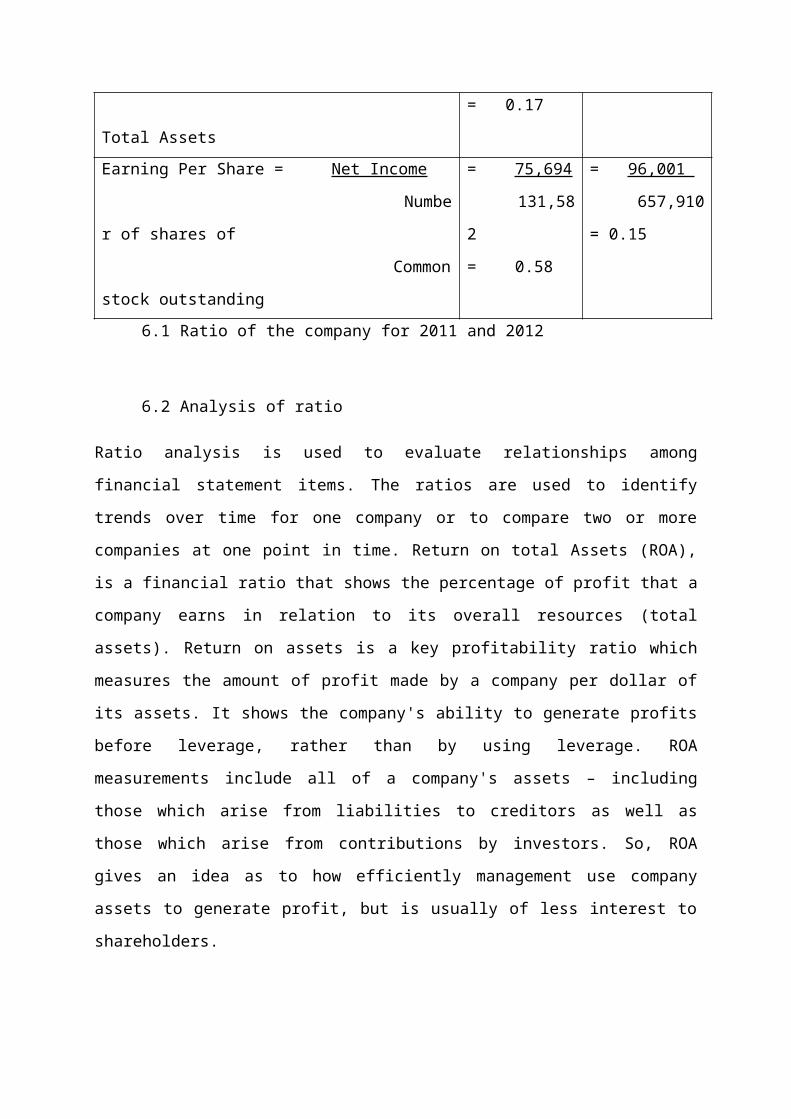
Total Assets
= 0.17
Earning Per Share = Net Income
Numbe
r of shares of
Common
stock outstanding
= 75,694
131,58
2
= 0.58
= 96,001
657,910
= 0.15
6.1 Ratio of the company for 2011 and 2012
6.2 Analysis of ratio
Ratio analysis is used to evaluate relationships among
financial statement items. The ratios are used to identify
trends over time for one company or to compare two or more
companies at one point in time. Return on total Assets (ROA),
is a financial ratio that shows the percentage of profit that a
company earns in relation to its overall resources (total
assets). Return on assets is a key profitability ratio which
measures the amount of profit made by a company per dollar of
its assets. It shows the company's ability to generate profits
before leverage, rather than by using leverage. ROA
measurements include all of a company's assets – including
those which arise from liabilities to creditors as well as
those which arise from contributions by investors. So, ROA
gives an idea as to how efficiently management use company
assets to generate profit, but is usually of less interest to
shareholders.
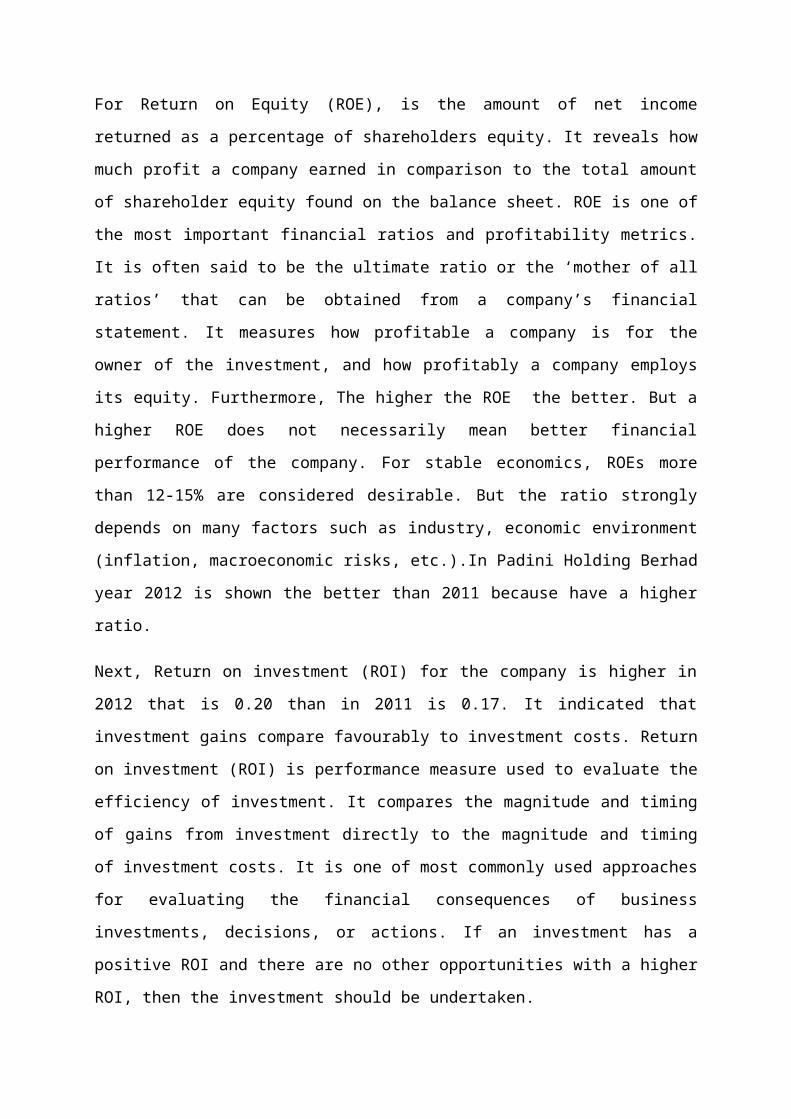
For Return on Equity (ROE), is the amount of net income
returned as a percentage of shareholders equity. It reveals how
much profit a company earned in comparison to the total amount
of shareholder equity found on the balance sheet. ROE is one of
the most important financial ratios and profitability metrics.
It is often said to be the ultimate ratio or the ‘mother of all
ratios’ that can be obtained from a company’s financial
statement. It measures how profitable a company is for the
owner of the investment, and how profitably a company employs
its equity. Furthermore, The higher the ROE the better. But a
higher ROE does not necessarily mean better financial
performance of the company. For stable economics, ROEs more
than 12-15% are considered desirable. But the ratio strongly
depends on many factors such as industry, economic environment
(inflation, macroeconomic risks, etc.).In Padini Holding Berhad
year 2012 is shown the better than 2011 because have a higher
ratio.
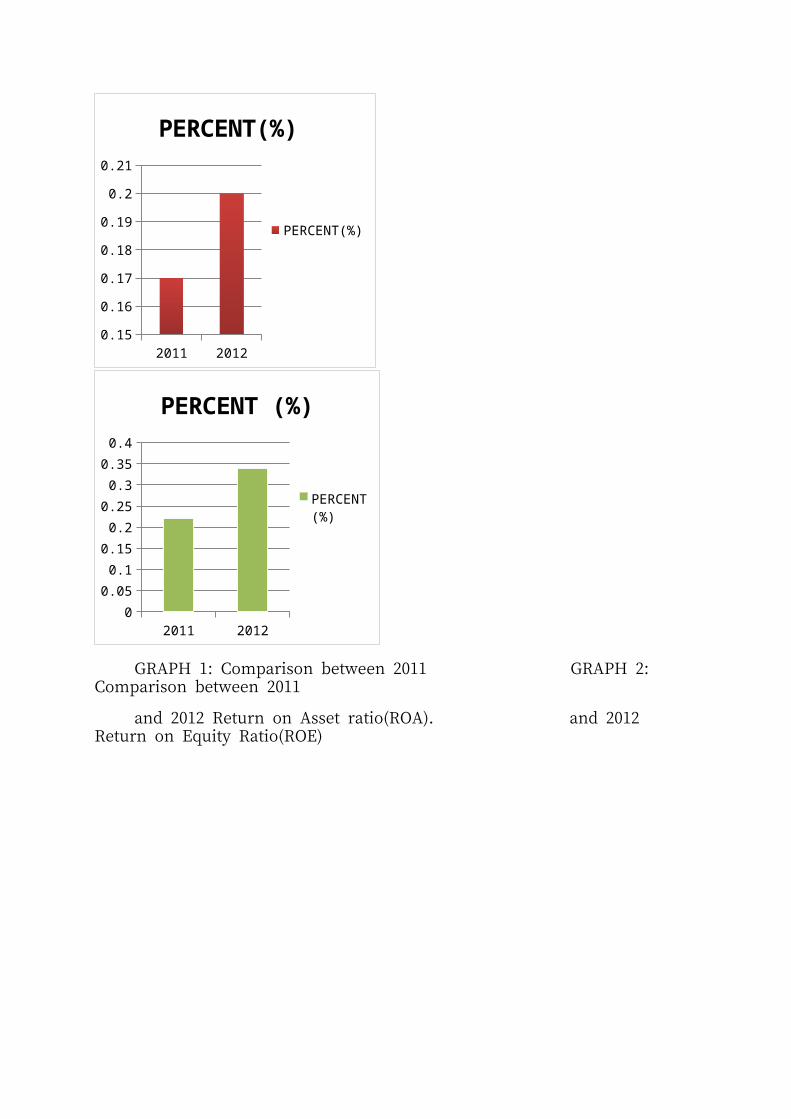
Next, Return on investment (ROI) for the company is higher in
2012 that is 0.20 than in 2011 is 0.17. It indicated that
investment gains compare favourably to investment costs. Return
on investment (ROI) is performance measure used to evaluate the
efficiency of investment. It compares the magnitude and timing
of gains from investment directly to the magnitude and timing
of investment costs. It is one of most commonly used approaches
for evaluating the financial consequences of business
investments, decisions, or actions. If an investment has a
positive ROI and there are no other opportunities with a higher
ROI, then the investment should be undertaken.
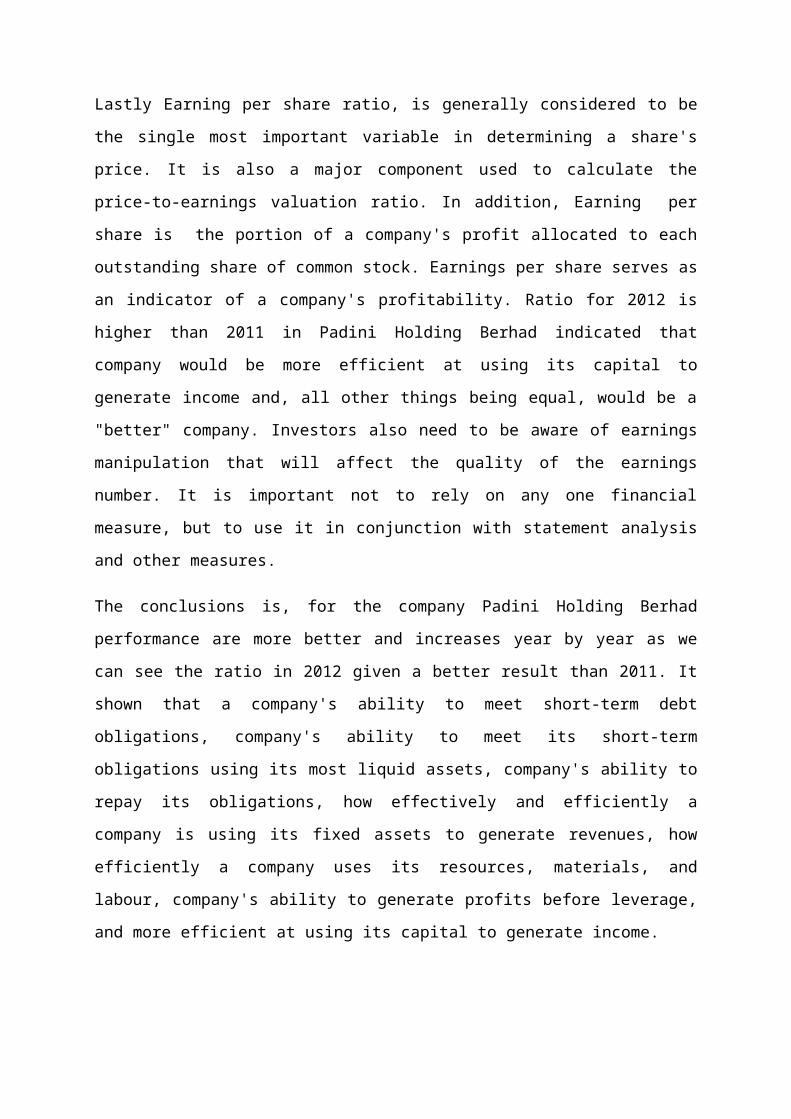
Lastly Earning per share ratio, is generally considered to be
the single most important variable in determining a share's
price. It is also a major component used to calculate the
price-to-earnings valuation ratio. In addition, Earning per
share is the portion of a company's profit allocated to each
outstanding share of common stock. Earnings per share serves as
an indicator of a company's profitability. Ratio for 2012 is
higher than 2011 in Padini Holding Berhad indicated that
company would be more efficient at using its capital to
generate income and, all other things being equal, would be a
"better" company. Investors also need to be aware of earnings
manipulation that will affect the quality of the earnings
number. It is important not to rely on any one financial
measure, but to use it in conjunction with statement analysis
and other measures.
The conclusions is, for the company Padini Holding Berhad
performance are more better and increases year by year as we
can see the ratio in 2012 given a better result than 2011. It
shown that a company's ability to meet short-term debt
obligations, company's ability to meet its short-term
obligations using its most liquid assets, company's ability to
repay its obligations, how effectively and efficiently a
company is using its fixed assets to generate revenues, how
efficiently a company uses its resources, materials, and
labour, company's ability to generate profits before leverage,
and more efficient at using its capital to generate income.
2011 20120.15
0.16
0.17
0.18
0.19
0.2
0.21
PERCENT(%)
PERCENT(%)
2011 20120
0.050.10.150.20.250.30.350.4
PERCENT (%)
PERCENT (%)
GRAPH 1: Comparison between 2011 GRAPH 2: Comparison between 2011
and 2012 Return on Asset ratio(ROA). and 2012 Return on Equity Ratio(ROE)
2011 20120.15
0.16
0.17
0.18
0.19
0.2
0.21
PERCENT(%)
PERCENT(%)
2011 20120
0.10.20.30.40.50.60.7
PERCENT(%)
PERCENT(%)
GRAPH 3: Comparison between 2011 GRAPH 4: Comparison between 2011
and 2012 Return on Investment Ratio(ROI). and 2012 Earning Per Share Ratio(EPS).
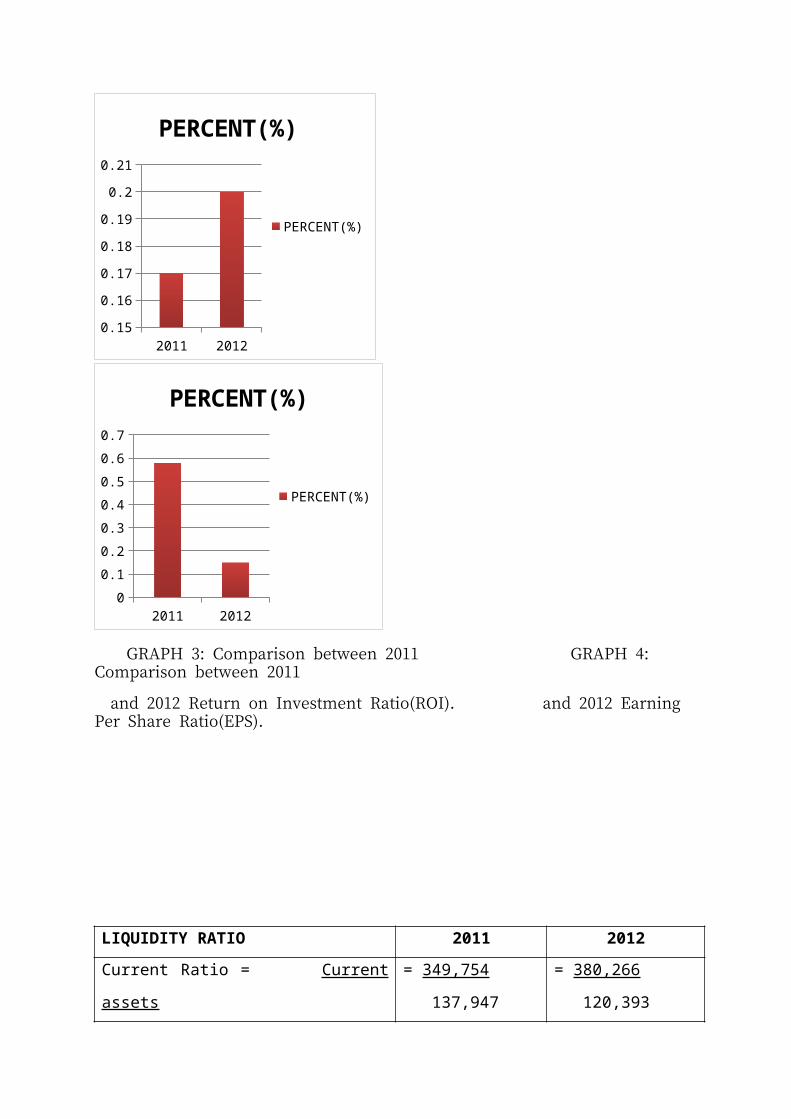
LIQUIDITY RATIO 2011 2012Current Ratio = Current
assets
= 349,754
137,947
= 380,266
120,393
Current Liabilities
= 2.54 = 3.16
Quick Ratio = Current
Asset – Inventory
Current Liabilities
= 349,754 –
170,955
137,9
47
= 1.30
= 380,266 –
192,285
120,3
93
= 1.56
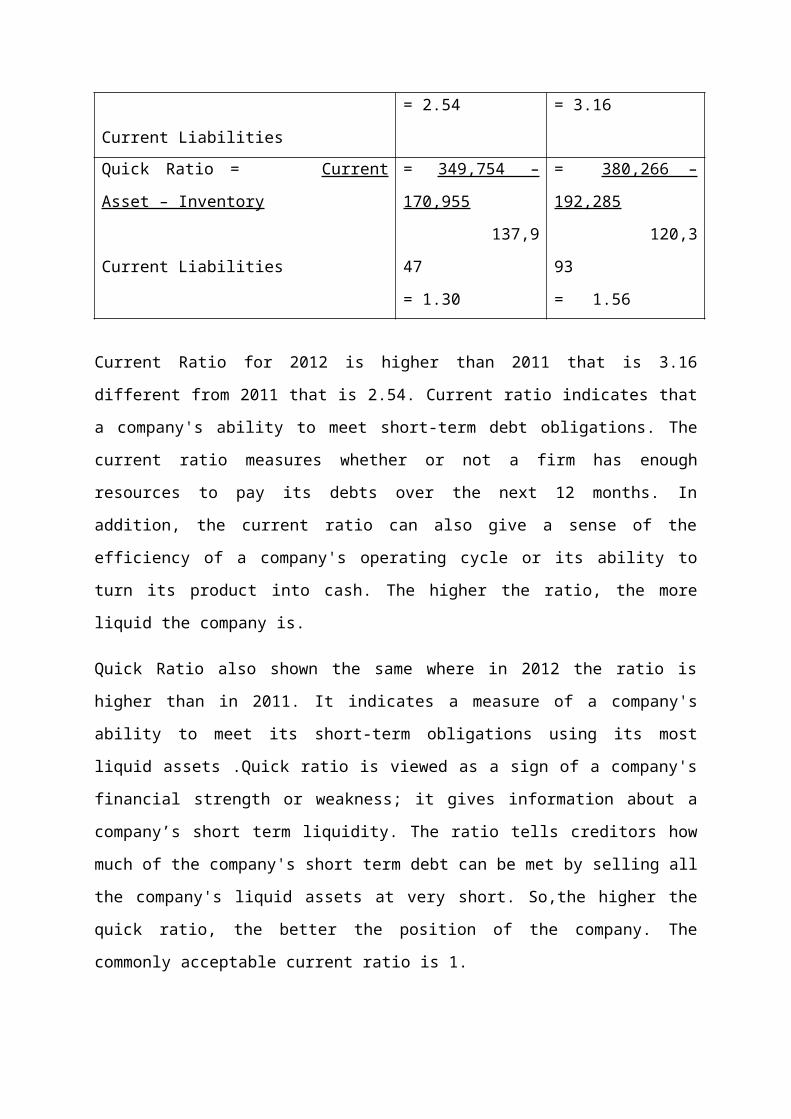
Current Ratio for 2012 is higher than 2011 that is 3.16
different from 2011 that is 2.54. Current ratio indicates that
a company's ability to meet short-term debt obligations. The
current ratio measures whether or not a firm has enough
resources to pay its debts over the next 12 months. In
addition, the current ratio can also give a sense of the
efficiency of a company's operating cycle or its ability to
turn its product into cash. The higher the ratio, the more
liquid the company is.
Quick Ratio also shown the same where in 2012 the ratio is
higher than in 2011. It indicates a measure of a company's
ability to meet its short-term obligations using its most
liquid assets .Quick ratio is viewed as a sign of a company's
financial strength or weakness; it gives information about a
company’s short term liquidity. The ratio tells creditors how
much of the company's short term debt can be met by selling all
the company's liquid assets at very short. So,the higher the
quick ratio, the better the position of the company. The
commonly acceptable current ratio is 1.
LEVERAGE RATIO 2011 2012Debt to =
Total debt
total asset
Total Asset
ratio
= 161,662
444,339
= 0.36
= 142,196
482,305
= 0.29
Debt to =
Total debt
Equity ratio Total
stockholders equity
= 161,662
340,109
= 0.48
= 142,196
282,677
= 0.50
LTD to = Long
Term Debt
Equity ratio Total
stockholders equity
= 23,715
340,109
= 0.07
= 21,803
282,677
= 0.08
Times interest =
EBIT
Earned ratio Total
= 105,057
1,573
= 66.79
= 130,649
2,328
= 56.12
interest charged Inventory turnover =
Sales
Inventory
= 568,476
170,955
= 3.33
= 723,411
192,285
= 3.76
Fixed Asset Turnover =
Sales
Fixed Asset
= 568,476
94,585
= 6.01
= 723,411
102,039
= 5.57
Total Asset Turnover =
Sales
Total Asset
= 568,476
444,339
= 1.28
= 723,411
482,305
= 1.18
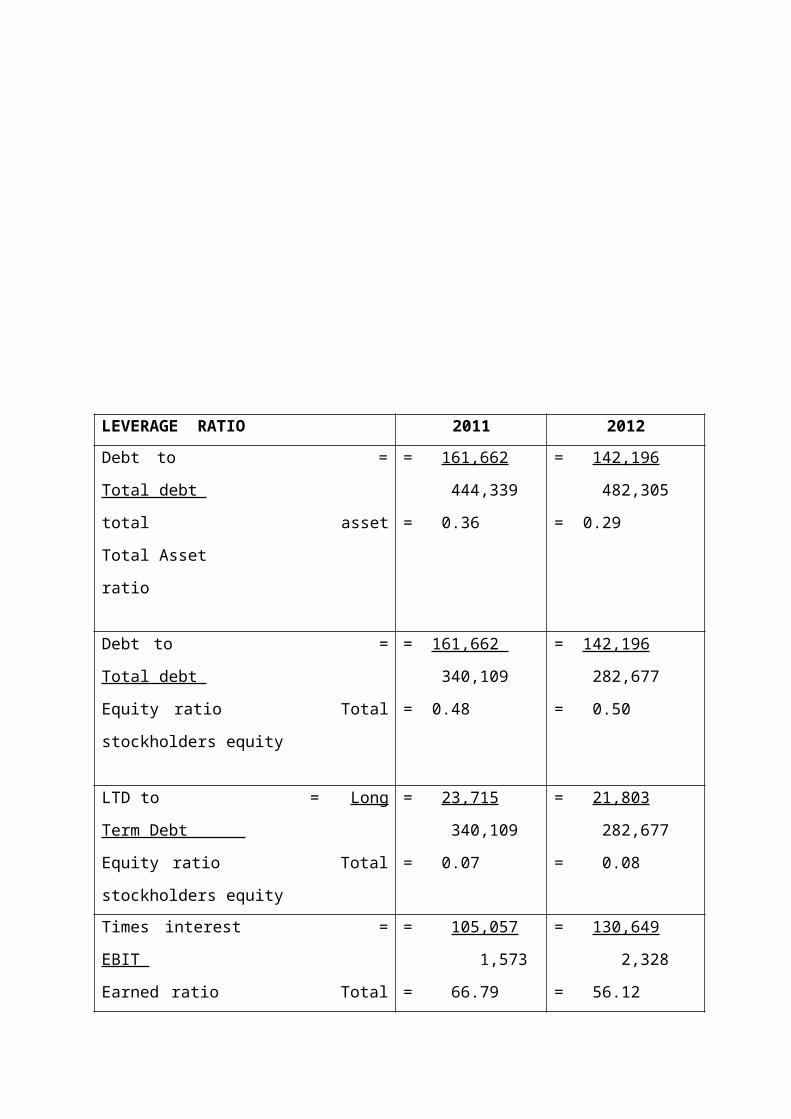
Debt to equity ratio is a financial ratio indicating the
relative proportion of entity's equity and debt used to finance
an entity's assets. This ratio is also known as financial
leverage. In addition Debt-to-equity ratio is the key financial
ratio and is used as a standard for judging a company's
financial standing. It is also a measure of a company's ability
to repay its obligations. Lenders and investors usually prefer
low debt-to-equity ratios because their interests are better
protected in the event of a business decline. Thus, companies
with high debt-to-equity ratios may not be able to attract
additional lending capital. So, 2012 is better than 2011
because have a lower amount of ratio that is 0.29.
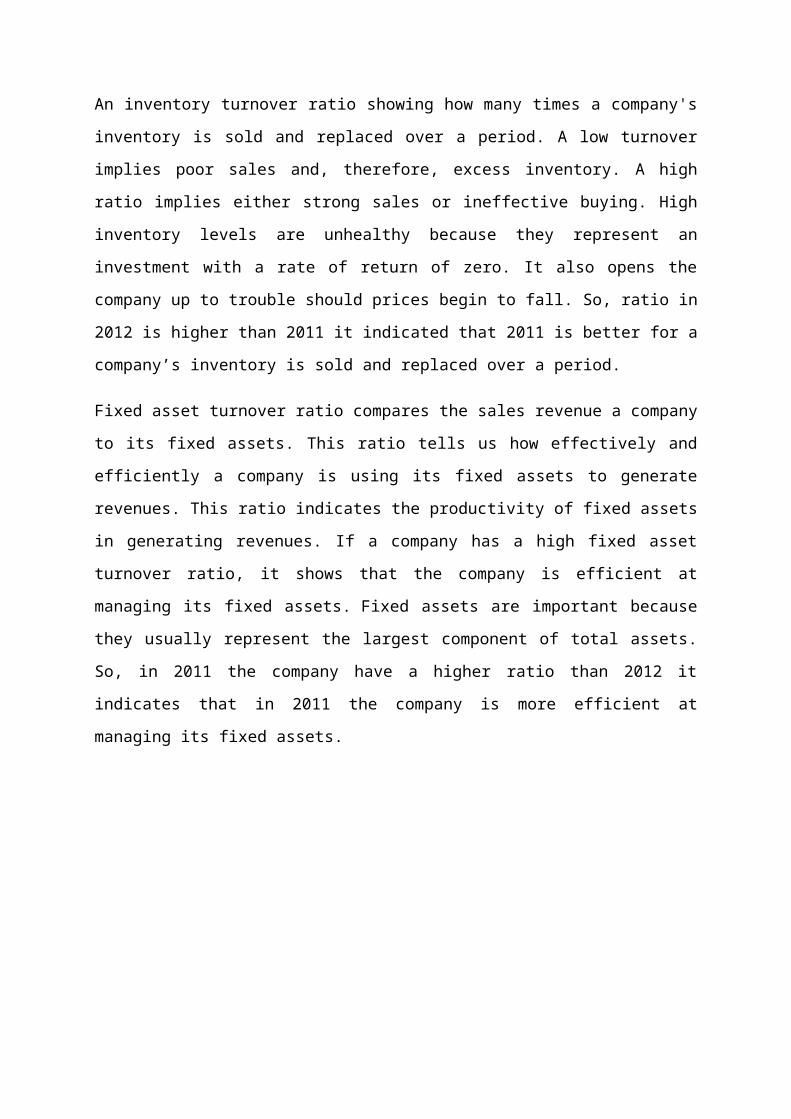
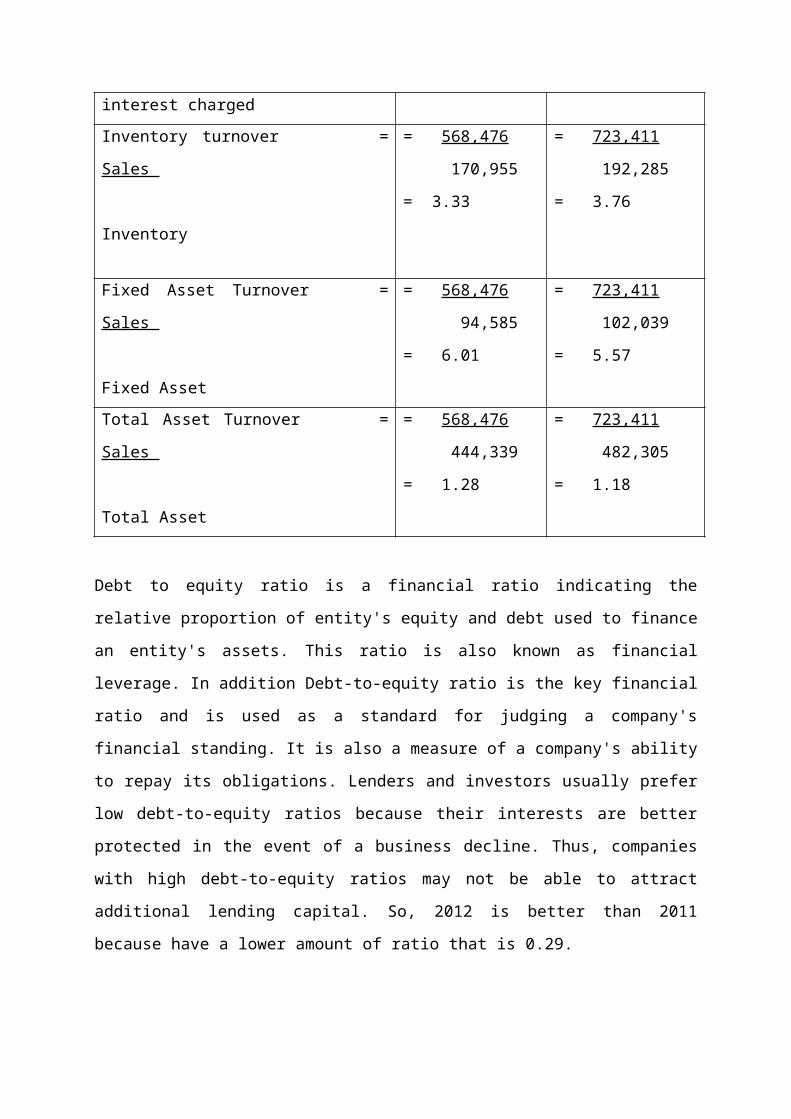
An inventory turnover ratio showing how many times a company's
inventory is sold and replaced over a period. A low turnover
implies poor sales and, therefore, excess inventory. A high
ratio implies either strong sales or ineffective buying. High
inventory levels are unhealthy because they represent an
investment with a rate of return of zero. It also opens the
company up to trouble should prices begin to fall. So, ratio in
2012 is higher than 2011 it indicated that 2011 is better for a
company’s inventory is sold and replaced over a period.
Fixed asset turnover ratio compares the sales revenue a company
to its fixed assets. This ratio tells us how effectively and
efficiently a company is using its fixed assets to generate
revenues. This ratio indicates the productivity of fixed assets
in generating revenues. If a company has a high fixed asset
turnover ratio, it shows that the company is efficient at
managing its fixed assets. Fixed assets are important because
they usually represent the largest component of total assets.
So, in 2011 the company have a higher ratio than 2012 it
indicates that in 2011 the company is more efficient at
managing its fixed assets.
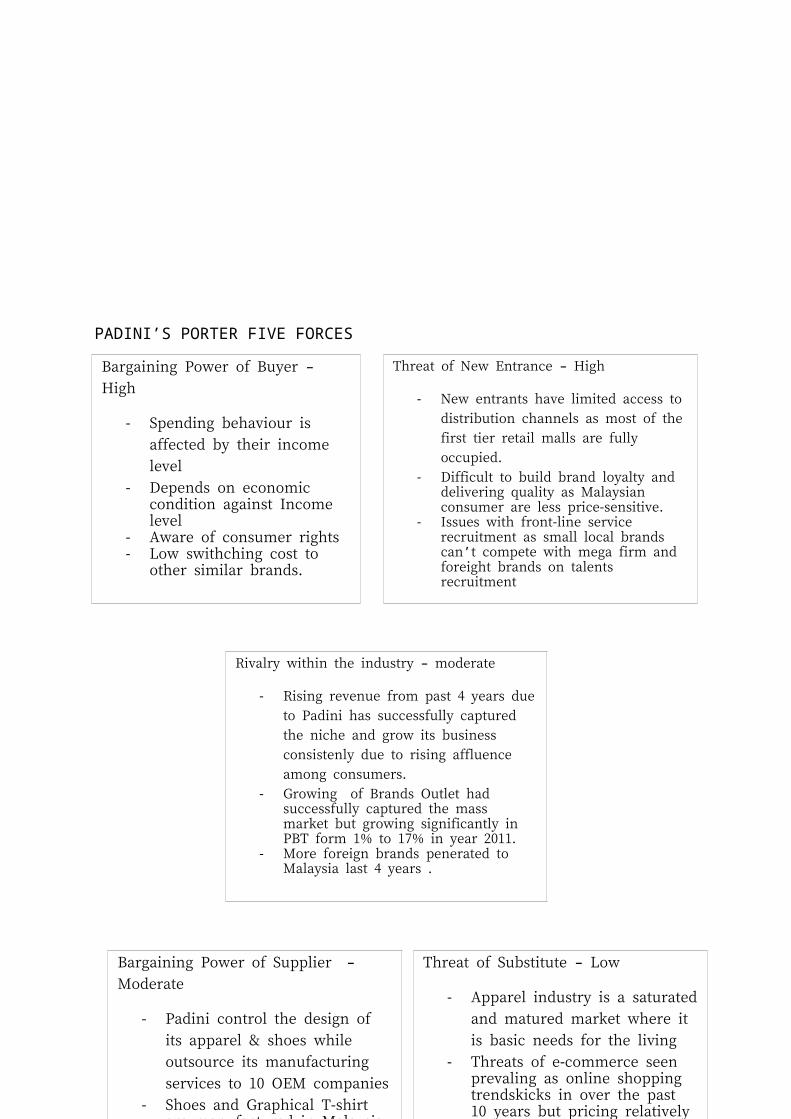
Threat of Substitute Low –
- Apparel industry is a saturated
and matured market where it
is basic needs for the living
- Threats of e-commerce seen prevaling as online shopping trendskicks in over the past 10 years but pricing relatively
Bargaining Power of Supplier –Moderate
- Padini control the design of
its apparel & shoes while
outsource its manufacturing
services to 10 OEM companies
- Shoes and Graphical T-shirt are manufactured in Malaysia
Rivalry within the industry moderate –
- Rising revenue from past 4 years due
to Padini has successfully captured
the niche and grow its business
consistenly due to rising affluence
among consumers.
- Growing of Brands Outlet had successfully captured the mass market but growing significantly in PBT form 1% to 17% in year 2011.
- More foreign brands penerated to Malaysia last 4 years .
Threat of New Entrance High –
- New entrants have limited access to
distribution channels as most of the
first tier retail malls are fully
occupied.
- Difficult to build brand loyalty and delivering quality as Malaysian consumer are less price-sensitive.
- Issues with front-line service recruitment as small local brands can t compete with mega firm and ’foreight brands on talents recruitment
Bargaining Power of Buyer –High
- Spending behaviour is
affected by their income
level
- Depends on economic condition against Income level
- Aware of consumer rights- Low swithching cost to
other similar brands.
PADINI’S PORTER FIVE FORCES


