Embed Size (px)
Citation preview
1
ATMOSPHERIC CORROSION OF MAGNESIUM ALLOYS AZ31
AND AZ61 UNDER CONTINUOUS CONDENSATION
CONDITIONS
Sebastián Feliu (Jr)a , C. Maffiotteb, Juan Carlos Galvána, Violeta Barrancoa,c.
aCentro Nacional de Investigaciones Metalúrgicas CSIC, Avda. Gregorio del Amo 8,
28040 Madrid, Spain, (e-mail: [email protected]), (e-mail: [email protected])
bCIEMAT. FNL (edificio 2), Avda. Complutense, 22, 28040 Madrid, Spain (e-mail:
cInstituto de Ciencias de Materiales de Madrid, ICMM, Consejo Superior de
Investigaciones Científicas, CSIC, Sor Juana Inés de la Cruz, 3, Cantoblanco, 28049,
Madrid, Spain
Corresponding author: Tel.:+34 91 5538900. Fax.: +34 91 5347425. Email address:
Abstract
This paper studies the corrosion rate of magnesium alloys AZ31 and AZ61 exposed in
humid air under continuous condensation conditions. The approximately parabolic
shape of the corrosion progress curves suggests that the process is controlled by
factors related with the corrosion product layer growing on the metallic surface.
Complementary EIS measurements provide evidence of the restriction of surface
activity by the accumulation of corrosion products. According to gravimetric results
there is an initial period in which only a small part of the corroded metal is incorporated
in the corrosion product layer, but after longer testing times the proportion of metal that
comes to form part of this layer tends to increase very significantly.
2
Keywords: A. Magnesium alloys; B. EIS, XPS, SEM, weight loss; C. Atmospheric
corrosion.
Introduction
The low density and appreciable mechanical strength of magnesium alloys makes
them especially attractive for a wide range of practical applications, typically in the
aerospace, automotive and electronics industries [1]. However, magnesium is a
thermodynamically active metal, and consequently its corrosion behaviour is often a
concern. It should be borne in mind that magnesium and its alloys tend to react with
oxygen in the air and many aqueous media, when the protection afforded by the thin
passivating film spontaneously formed on the surface of the metal fails for some
reason.
It is always interesting to delve into knowledge of the corrosion behaviour of these
materials in the various media and conditions in which they may be exposed [1-8]. The
literature contains many such studies, often based on analysis of the results obtained
using habitual laboratory techniques. In this respect, attention is drawn to those studies
involving the immersion of specimens in NaCl solutions [9-17] which are particularly
aggressive due to the presence of chloride ions. One benefit of immersion studies in
saline solutions is that they facilitate the application of electrochemical techniques,
which expand on the information supplied by gravimetric determinations. In fact, our
understanding of the corrosion of magnesium alloys is largely based on immersion test
studies.
Another type of test is that involving the exposure of specimens to the action of natural
or artificial atmospheres, the latter in testing cabinets, and under controlled operative
conditions representative of the multifarious circumstances of real-life exposure.
Such tests typically include high atmospheric humidity conditions [18-27 ], where the
corrosion process in the humid atmosphere may be accelerated by the presence of
pollutant gases or salts, as in the cases of spraying with saline solution or prior
contamination of the metallic surface with NaCl [6,18,19,25,26]. To make the most of
3
the information provided by these tests, a knowledge is required of the phenomena
and the mechanisms that control the corrosion process in each case.
This paper studies the corrosion rate of magnesium alloys exposed in humid air under
continuous condensation conditions. There is relatively little information on the
behaviour of these alloys under continuous condensation conditions in the absence of
any type of contamination. In the present research the permanent presence of a
condensed water layer in a process of constant renewal on the metallic surface offers
conditions of special aggressivity.
For the performance of this research we have selected the magnesium alloys AZ31
and AZ61, with close to 3% and 6% Al, respectively. The microstructure of the first
alloy is formed practically by an α-matrix with the aluminium in solid solution, while in
the microstructure of the second alloy a large part of the aluminium has precipitated in
the form of β-phase, with the possibility of galvanic coupling between the nobler β-
phase and the magnesium alloy matrix, with the corresponding effect on corrosion
[9,13]. With these alloys the research seeks to cover different possibilities in terms of
the effect of the aluminium alloying element or the microstructure on the attack.
Although it is not common to use AZ31 and AZ61 alloys in constant humidity
condensation conditions, this is a matter of theoretic and practical interest since it adds
to the information available on the behaviour of magnesium alloys in a variety of
experimental circumstances and possible corrosion processes. In particular, it is of
interest to know how the corrosion product layer formed on the metallic surface evolves
and its relationship with the corrosion process kinetics.
Experimental
Materials
The chemical composition of the tested AZ61 and AZ31 magnesium alloys is given in
Table 1. These alloys were fabricated in wrought condition and supplied in plates of 3
mm thickness by Magnesium Elecktron Ltd.
Surface conditions
4
The research also considers the possible effect on corrosion performance of a change
in surface conditions of the tested specimens. Thus, the research includes specimens
with the original (as-received) surface and others that have been mechanically polished
prior to being subjected to the humidity condensation test.
Corrosion testing
Corrosion tests were performed in a continuous condensation cabinet, QCT Model
ADO, and carried out according to International Standard ISO 6270-1:1998(E).
Continuous condensation (CC) occurs on the metal surface at about 23ºC. The CC test
provides an indication of the performance likely to be obtained in severe exposure
conditions.
Gravimetric determinations
Gravimetric monitoring of the corrosion process has been carried out by exposing
specimens to the CC test for 1, 7, 15, 30, 45 and 60 days. Practical considerations
have limited to three the number of replicate specimens of each kind exposed for each
exposure time. All the specimens have shown weight gains due to the predominance of
corrosion products that remain in place over those that are eliminated from the tested
surface. The amount of metal corroded has been obtained by weighing what is left after
the removal of all adhered corrosion products by pickling in chromic acid. Weight
losses were obtained by weighing the specimens to a precision of 0.001 mg .
EIS measurements
Electrochemical impedance spectroscopy (EIS) measurements have attempted to
complement the information provided by gravimetric measurements of the specimens
subjected to the CC test. For this purpose, the specimen was removed from the
exposure cabinet after some testing time and taken to a conventional three-electrode
cell, consisting of a reference electrode, counter electrode, and the corroded specimen
as the working electrode. A 0.6M NaCl solution was used as electrolyte. Impedance
spectra were obtained at the corrosion potential with an applied AC signal of 10 mV
over the frequency range from 1 mHz to 100 KHz.
Metallography
5
The specimens were examined by scanning electron microscopy. The equipment used
was a JEOL JXA 840A unit operating with Rontec EDR288 software for EDX spectra
acquisition and image digitalisation.
Surface roughness measurements and AFM characterisation
The surface roughness was measured using an atomic-force microscope (AFM). The
roughness value is expressed by the root mean square (RNS) value in nanometres,
AFM images have also been obtained of the surface of the specimens in original (as-
received) and polished conditions.
XPS analysis
Photoelectron spectra were acquired with a Fisons MT500 spectrometer equipped with
a hemispherical electron analyser and a non-monochromatic magnesium Ka X-ray
source operated at 300 W. Spectra were collected for 20-90 min, depending on the
peak intensities, at a pass energy of 20 eV, which is typical of high-resolution
conditions. It was possible to determine accurate binding energies by referencing to the
adventitious C1s peak at 285.0 eV. Atomic ratios were computed from peak intensity
ratios and reported atomic sensitivity factors [28]. The energy resolution is about 0.8
eV.
Results and discussion
An interesting point in this research is to elucidate the dependence of the corrosion rate
on time. For gravimetric monitoring of the corrosion process, specimens have been
exposed in triplicate in the condensation cabinet for time periods of up to 60 days. In
addition to the corroded metal weight (C), these tests have yielded information on the
weight gain (ΔW) of the specimens during the test and the weight (P) of the corrosion
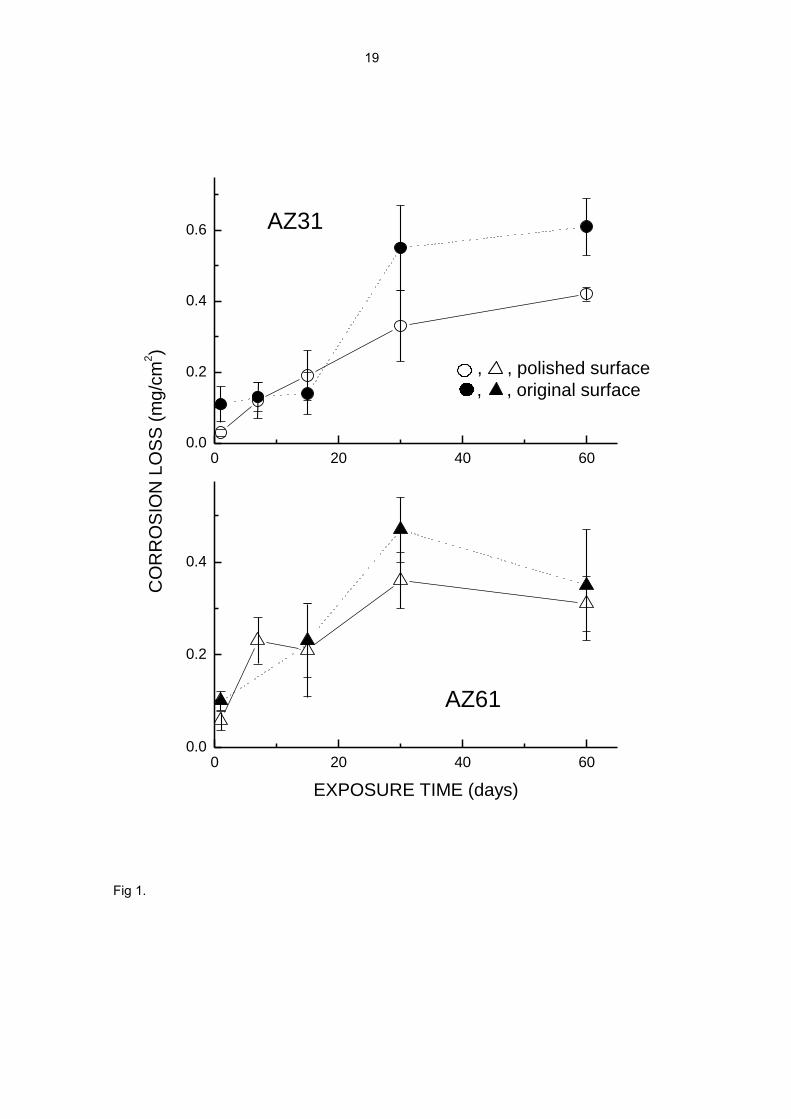
product layer formed on the metallic surface. A major difficulty when interpreting the
values of C, ΔW and P is the large scatter of the gravimetric measurements, which can
differ notably from specimen to specimen for each testing time (error bars in Fig. 1). In
spite of this, the data in Fig.1 shows a clear tendency for corrosion to increase with
time up to 30 days of exposure. This tendency is much less evident between 30 and 60
6
days of testing, and within the scatter of the results it is even doubtful whether
corrosion continues to progress or has practically halted.
The great dispersion in repeated experiments suggests that the growth characteristics
of the corrosion products layer are extraordinarily sensitive to fortuitous and minute
variations in the formation process of this layer. In an attempt to reduce the dispersion
of gravimetric data, another series of tests has been performed using the same
specimens for all the test duration. In this case the periodic determinations of weight
variation have been carried out by temporarily withdrawing the specimens from the
humidity cabinet, allowing them to dry, weighing them, and then returning them to the
cabinet to continue testing up to the scheduled time (60 days). In these determinations
the gradual increase in the weight of the specimens principally reflects the progressive
accumulation of corrosion products on their surface.
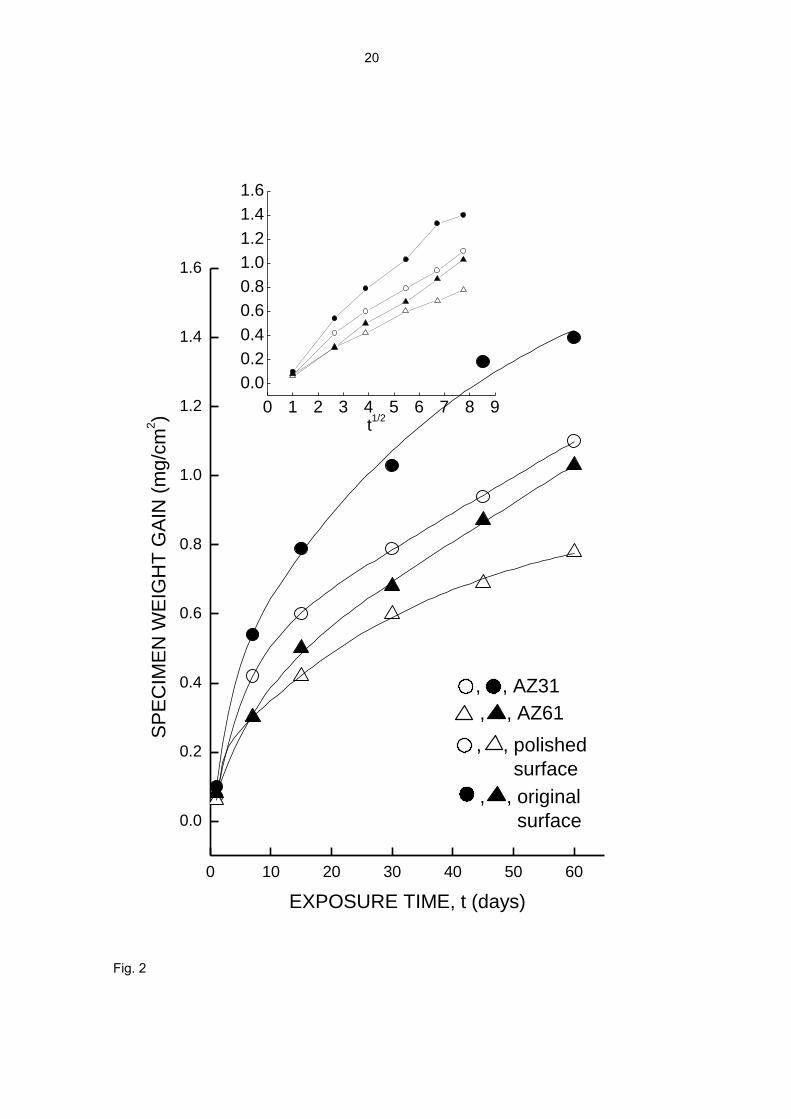
The ΔW vs. time curves in Fig. 2 show a deceleration of the corrosion process. The
corrosion rate is highest at the start and subsequently declines probably due to the
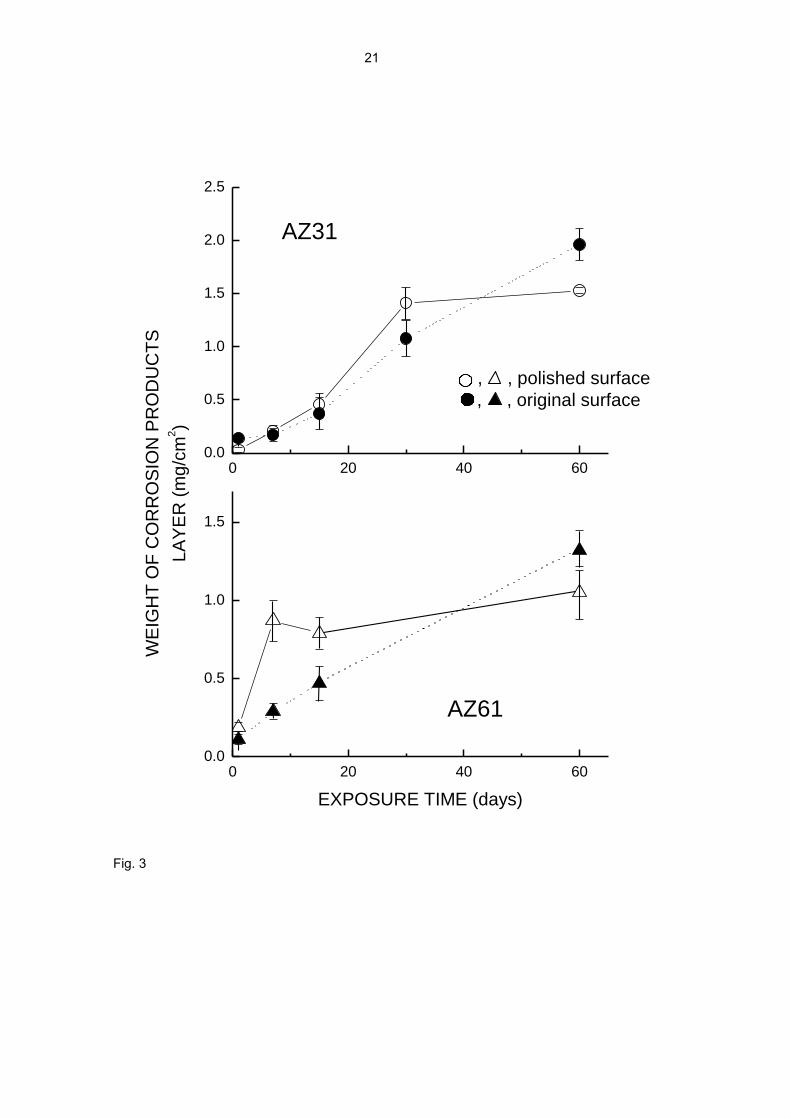
accumulation of protective corrosion products on the metal surface. Fig. 3, for the
same series of tests as in Fig. 1, gives an idea of the increasing build-up of corrosion
products with time.
The literature mentions the formation of coarse corrosion product layers on Mg and its
alloys immersed in saline solution, whose growth barely affects the corrosion rate as a
result of their high porosity [8,15,16]. In this investigation, the different behaviour of the
specimens subjected to the CC test may be because of the lower porosity and greater
protective capacity of the corrosion product layers formed on them. The
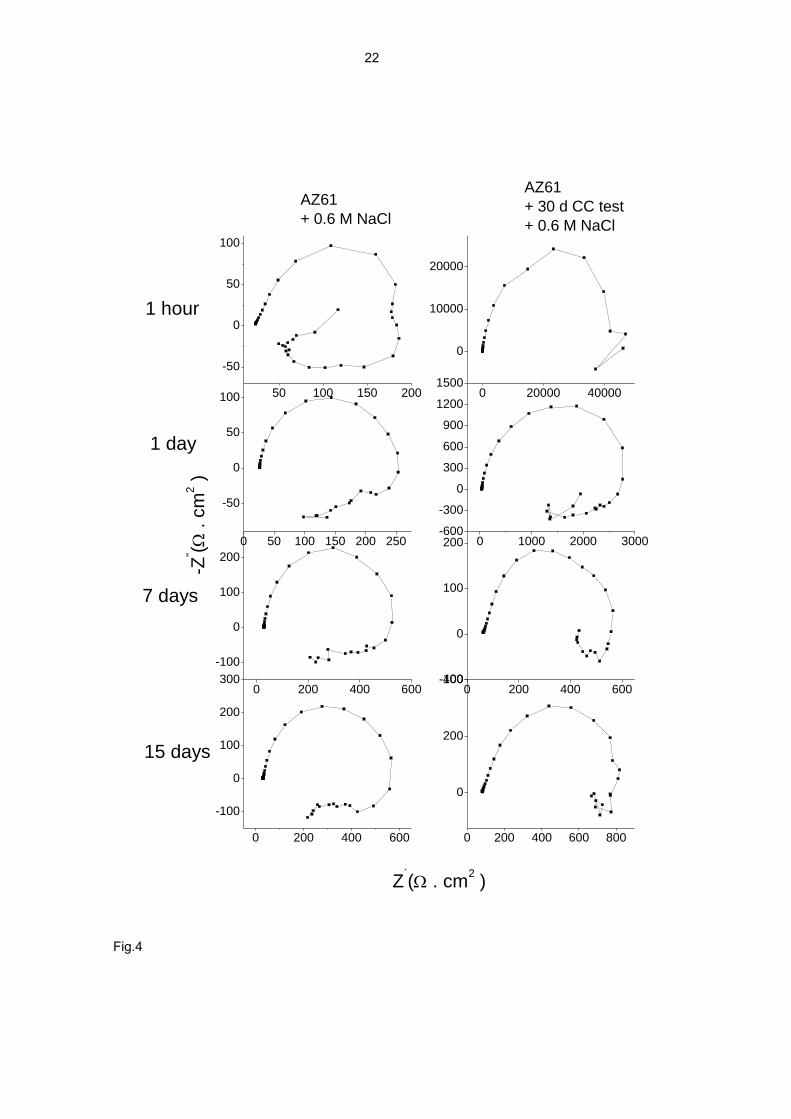
electrochemical results presented in Fig. 4 are in line with this idea. This figure
compares the impedance diagrams obtained after different immersion times in 0.6 M
NaCl solution, for specimens directly immersed in this solution and specimens
previously been exposed to the CC test for 30 days. In the latter case the corrosion
product layer formed in the CC test allowed these specimens to show considerably
higher impedance values in the first hours of immersion in the saline solution compared
to those obtained without prior exposure. It is interesting to note that the effect of the
corrosion product layer in the impedance values (diagrams in the second column of
Fig. 4) disappears completely after 7 days of contact of the specimen with the
aggressive saline solution.
7
The high Rt values per area unit (Table 2) suggest the existence of a very small
fraction of free surface area on the specimens previously exposed to the CC test,
possibly due to the low porosity of the corrosion product layer. In the same line, the
capacitance values associated with this loop for these specimens are vastly smaller (of
the order of 10-8 F/cm2) than those determined for the specimens immersed directly in
the saline solution without prior exposure to the CC test (which yield values of the order
of 10-6 F/cm2). All of these results, deduced from the impedance measurements,
suggest the formation of much more compact layers in the CC test than in simple
immersion.
Corrosiveness of the CC test
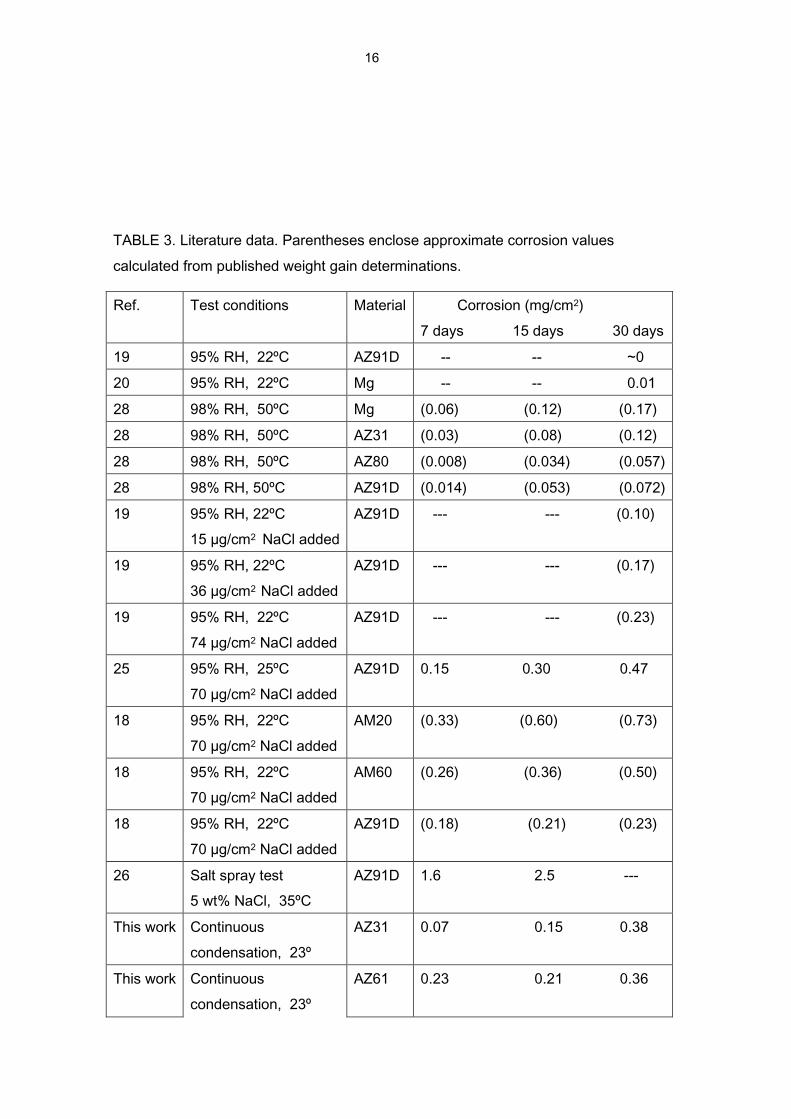
Table 3, prepared with data from the literature, compares the corrosiveness of the CC
test used in the present work with that of other tests considered in different researches
on the atmospheric corrosion of magnesium and its alloys. From the values shown in
the last two rows of this table it is deduced that the corrosiveness of the CC test is
much greater than that of other tests in atmospheres with high humidity levels that do
not reach saturation (see start of table). However, the corrosiveness of the CC test is a
little lower than that of tests which combine humid atmospheres and contamination of
the metallic surface with NaCl, and notably lower than that of the salt spray test.
In humid atmospheres, in the presence of ambient concentrations of CO2, all the
metal suffers general corrosion and a thick corrosion product layer covers the
specimen [18]. Two cathodic reactions are possible in principle: oxygen reduction
and water reduction, although in many cases the latter:
H2O + 2 e- ⇨ H2 (g) + 2 OH-
seems to be the only one of importance for magnesium corrosion [1, 8].
At the same time, the anodic reaction
Mg ⇨ Mg2+ + 2 e-
takes place and gives rise to the formation of brucite, Mg(OH)2, which, at the CO2 level
found in the ordinary atmosphere, reacts with CO2 to form magnesium hydroxide
carbonates.
8
After some time a thick carbonate-containing corrosion product layer is formed. This
layer may slow down the corrosion process by physically blocking active sites on the
metal surface. It may also reduce the rate at which reactant species are transported
through the corrosion product layer by reducing the section of the microchannels
and/or increasing their length. In particular, an increase in the length of the diffusion
paths with time could theoretically justify a parabolic rate law.
After an initial stage lasting a few days the specimen corrosion rate decelerates with
testing time, which in the plot of Fig. 2 is translated into approximately parabolic curves,
or into approximately straight sections when the abscissa is given in a t1/2 scale (inset
figure in the plot). Such behaviour suggests an effect of the corrosion product layer
thickness on the kinetics of the process. This contrasts with published results on
chloride induced atmospheric corrosion in humid air [8,16] and corrosion in saline
solutions [25,26], which show a tendency for mass losses to increase linearly with time,
possibly because in such cases the thickness of the highly porous layer does not
control the corrosion rate. A complete understanding of the kinetics of the corrosion
process in magnesium alloys exposed to the CC test does not seem possible with only
gravimetric data. An explanation of how diffusion through the corrosion product layer
could become the corrosion rate-determining step is suggested below.
Morphology and constitution of the corrosion product layer
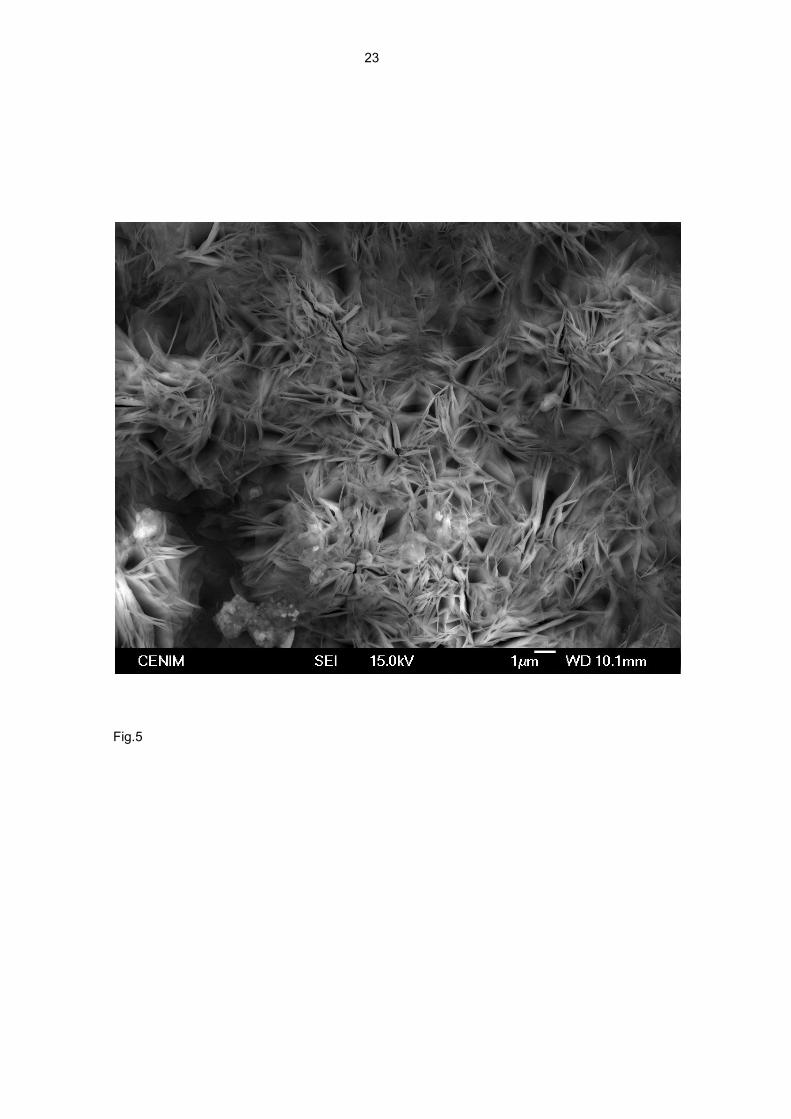
Fig. 5 shows a SEM micrograph representative of the surface morphology of the
corrosion products formed on the AZ61 and AZ31 alloys. Attention is drawn to the
presence of a large number of needle-like clusters oriented nearly perpendicular to the
specimen surface. Similar morphologies can be found in several studies on the
corrosion of Mg and its alloys in immersion tests [30-32]. As can be seen, the structure
is highly porous, which should allow diffusion through it.
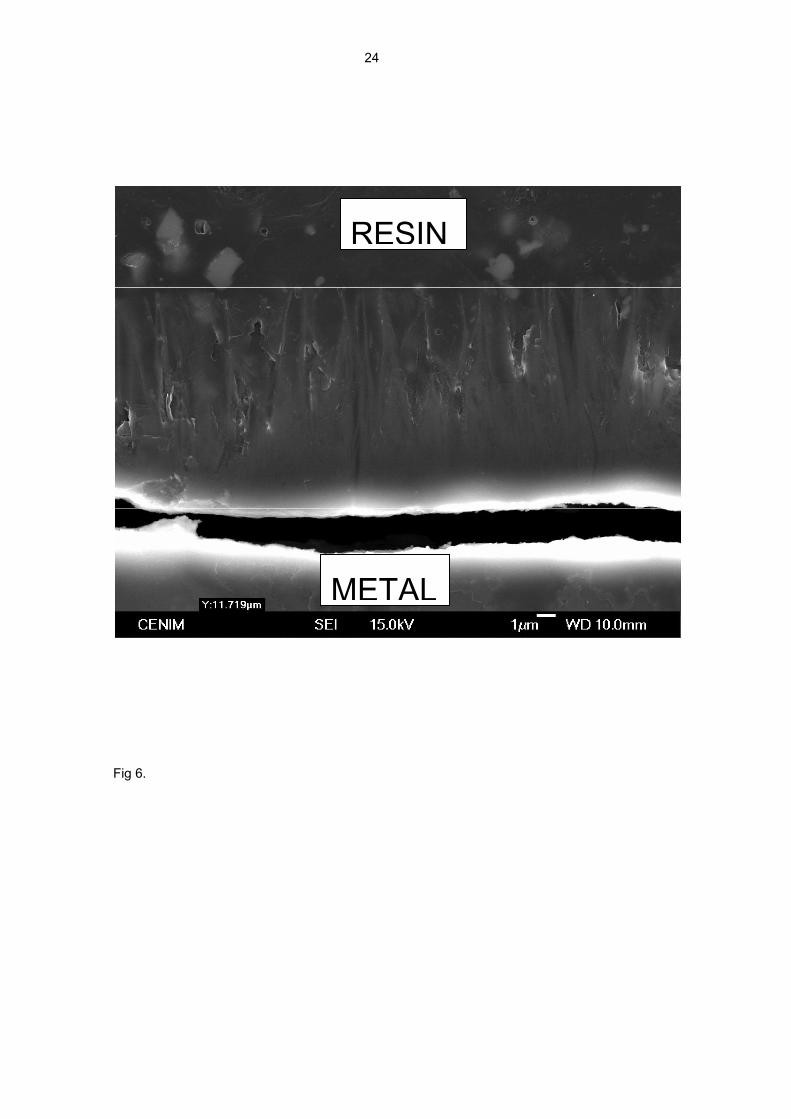
The cross-section of this corrosion product layer in Fig. 6 shows important changes in
its structure towards the metallic substrate. The needle-like crystallisations become
less abundant and practically disappear in the final third of the corrosion product layer.
The portion of the layer closest to the metallic surface is much more uniform and
compact than near its outer surface, so it seems likely to play an important role in the
kinetics of the corrosion process. Its evolution with time may have influenced the
approximately parabolic plot of the graphs in Fig. 2.
9
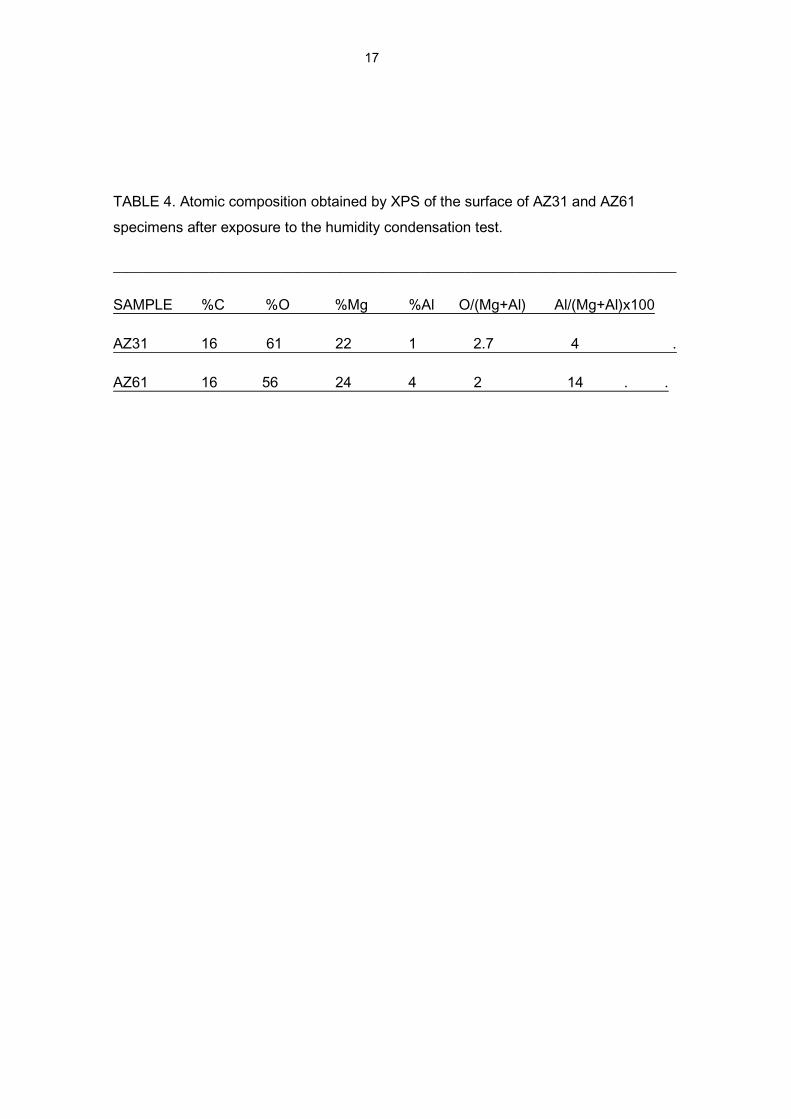
Table 4 shows the element composition on the surface of the AZ61 and AZ31 alloys
after exposure to the CC test. The O/(Mg+Al) atomic ratios obtained with the AZ61
alloy reach values of close to 2, which tends to suggest that the specimen surface is
essentially covered by an oxide layer of Mg(OH)2 . On the exposed surface of the AZ31
alloy, this ratio reaches values of close to 3; an increase that can presumably be
accounted for by the formation of magnesium carbonate on the exposed surface.
Additional information from gravimetric data
Apart from the kinetic aspects considered above, it is of interest to analyse the
information derived from the relationships established between the parameters C, ΔW
and P defined above. This information can provide insight into some of the
characteristics of the corrosion products layer during the different stages of their
formation and growth.
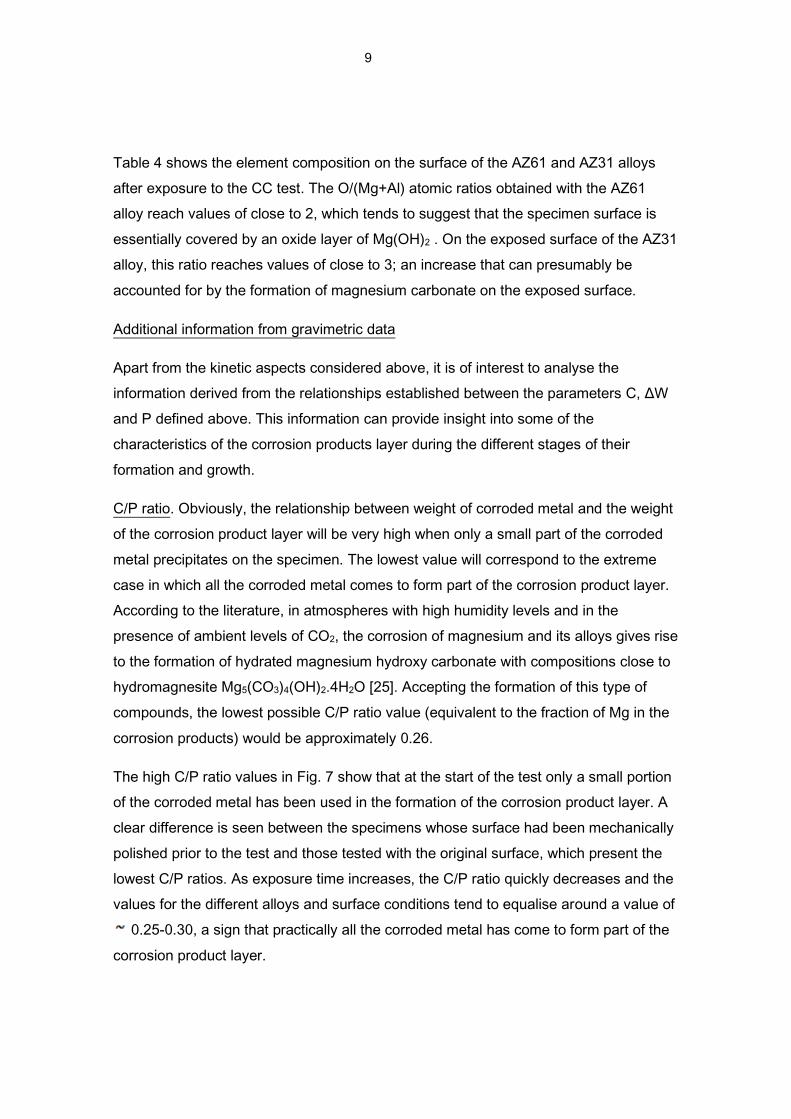
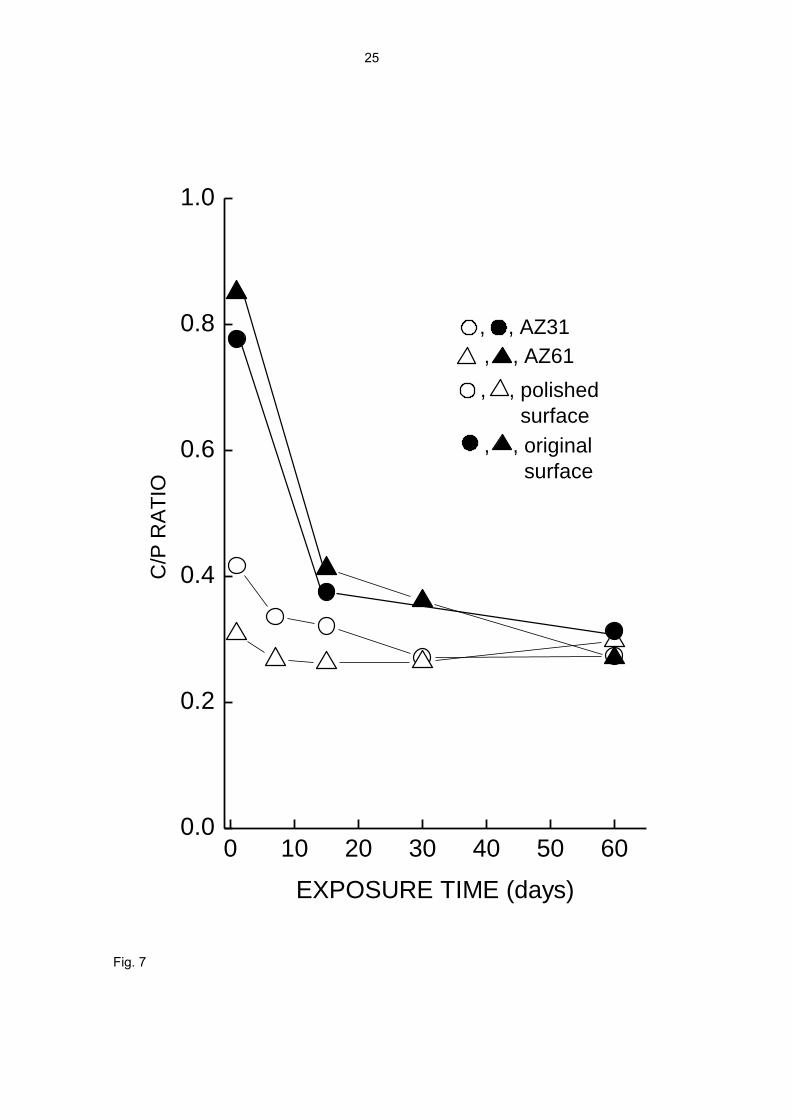
C/P ratio. Obviously, the relationship between weight of corroded metal and the weight
of the corrosion product layer will be very high when only a small part of the corroded
metal precipitates on the specimen. The lowest value will correspond to the extreme
case in which all the corroded metal comes to form part of the corrosion product layer.
According to the literature, in atmospheres with high humidity levels and in the
presence of ambient levels of CO2, the corrosion of magnesium and its alloys gives rise
to the formation of hydrated magnesium hydroxy carbonate with compositions close to
hydromagnesite Mg5(CO3)4(OH)2.4H2O [25]. Accepting the formation of this type of
compounds, the lowest possible C/P ratio value (equivalent to the fraction of Mg in the
corrosion products) would be approximately 0.26.
The high C/P ratio values in Fig. 7 show that at the start of the test only a small portion
of the corroded metal has been used in the formation of the corrosion product layer. A
clear difference is seen between the specimens whose surface had been mechanically
polished prior to the test and those tested with the original surface, which present the
lowest C/P ratios. As exposure time increases, the C/P ratio quickly decreases and the
values for the different alloys and surface conditions tend to equalise around a value of
0.25-0.30, a sign that practically all the corroded metal has come to form part of the
corrosion product layer.
10
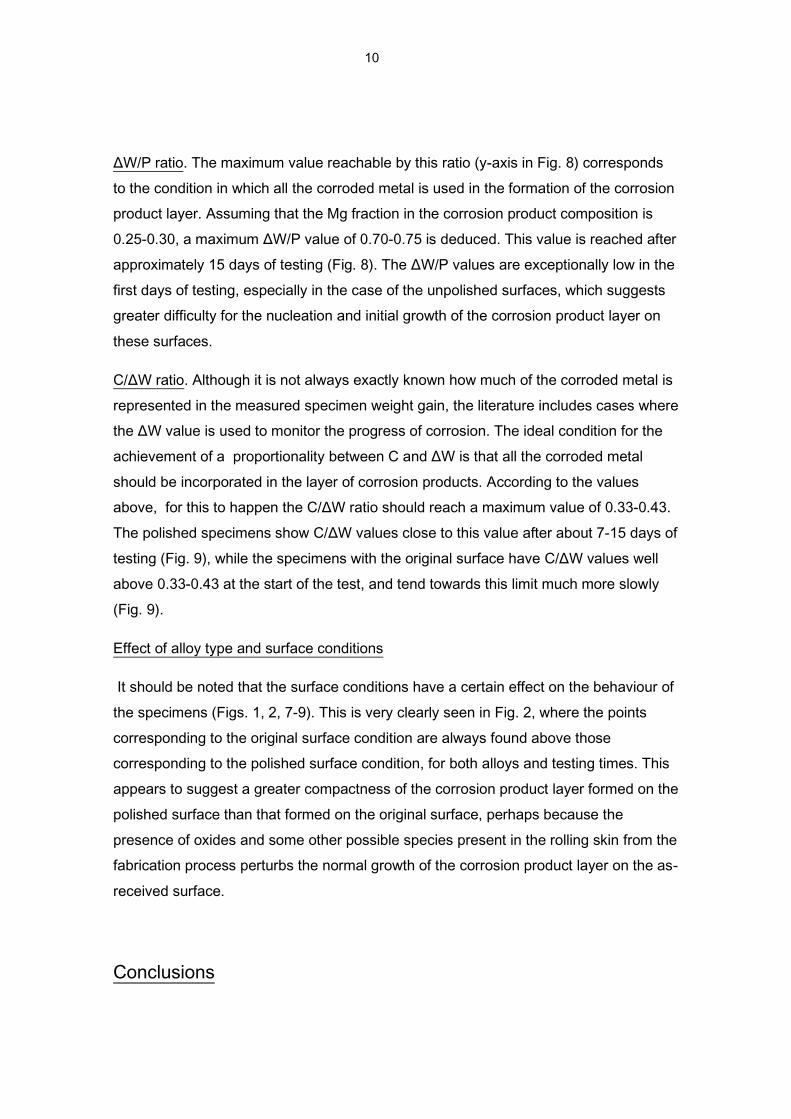
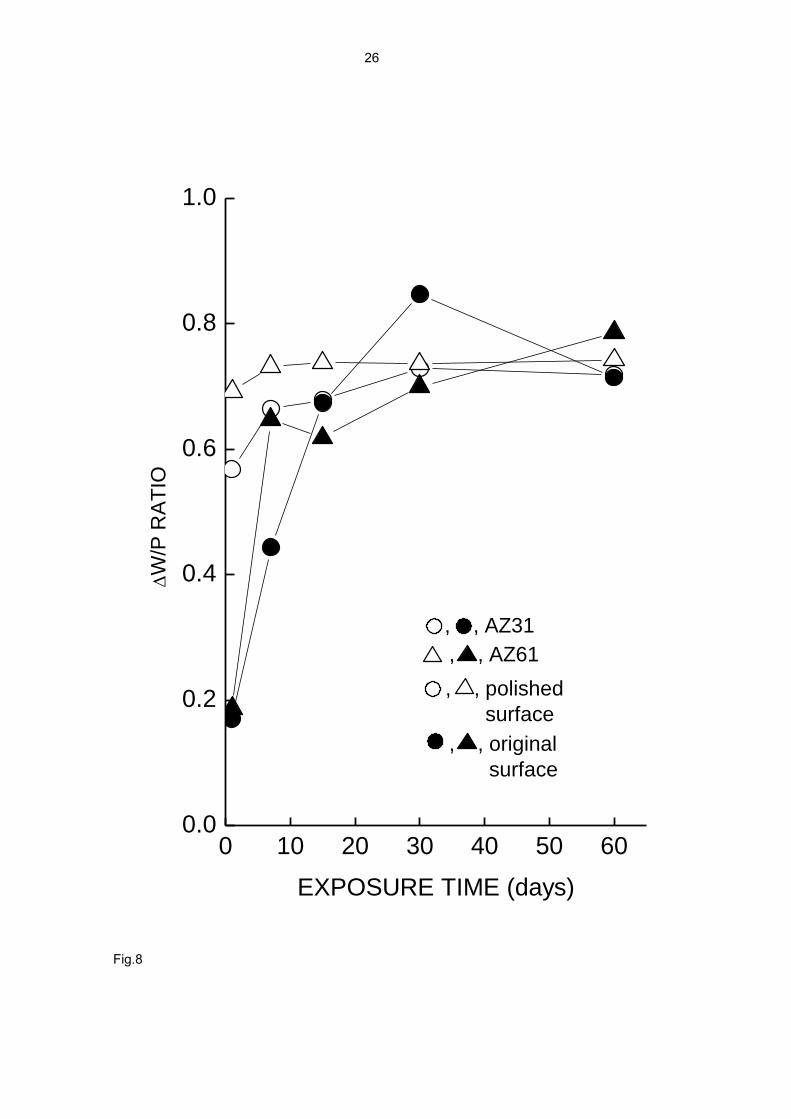
ΔW/P ratio. The maximum value reachable by this ratio (y-axis in Fig. 8) corresponds
to the condition in which all the corroded metal is used in the formation of the corrosion
product layer. Assuming that the Mg fraction in the corrosion product composition is
0.25-0.30, a maximum ΔW/P value of 0.70-0.75 is deduced. This value is reached after
approximately 15 days of testing (Fig. 8). The ΔW/P values are exceptionally low in the
first days of testing, especially in the case of the unpolished surfaces, which suggests
greater difficulty for the nucleation and initial growth of the corrosion product layer on
these surfaces.
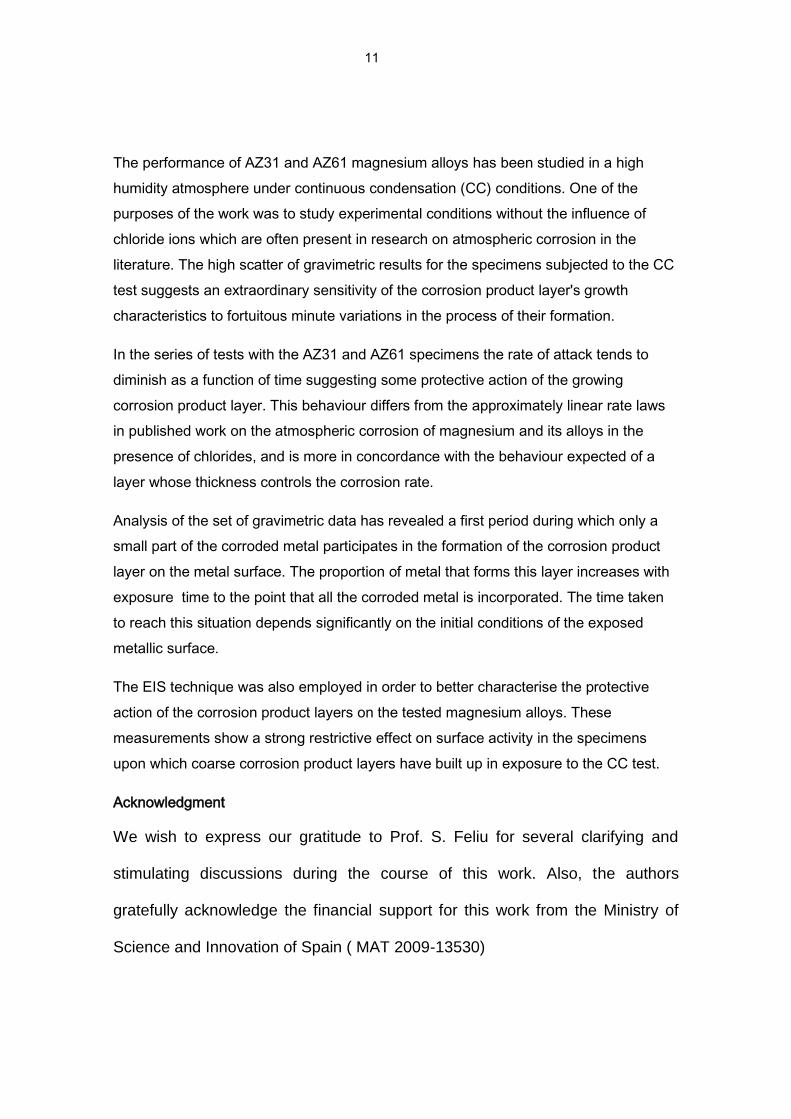
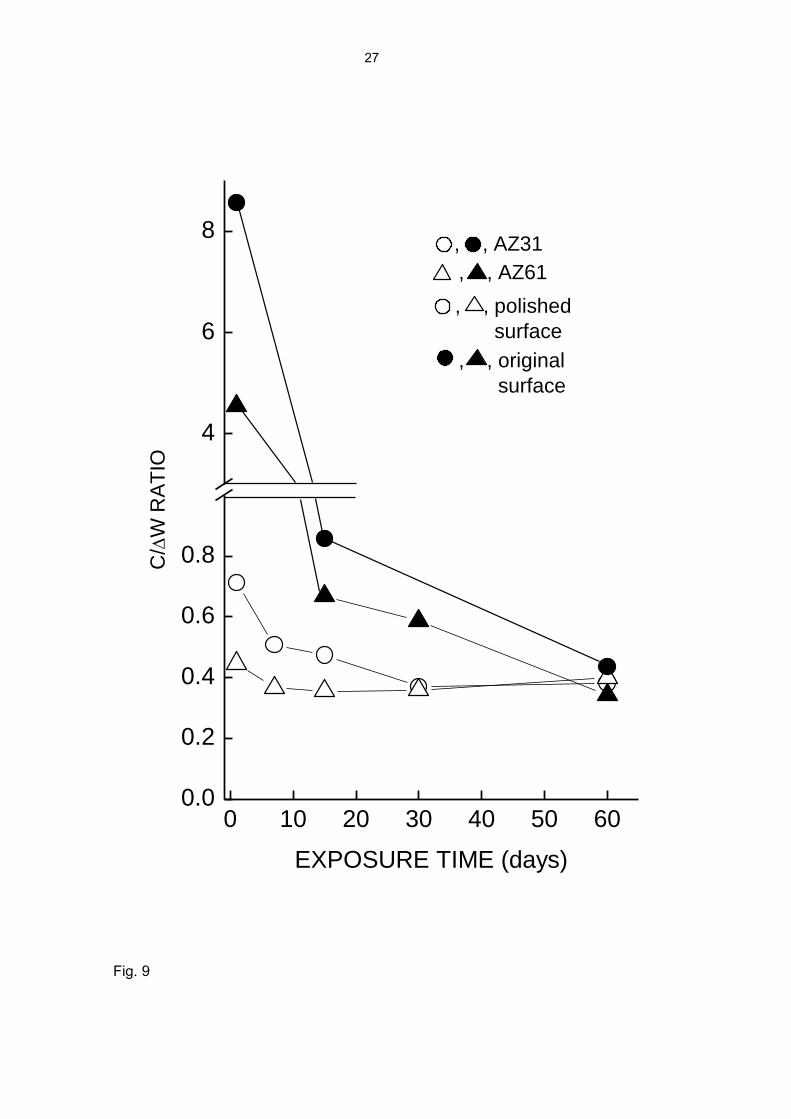
C/ΔW ratio. Although it is not always exactly known how much of the corroded metal is
represented in the measured specimen weight gain, the literature includes cases where
the ΔW value is used to monitor the progress of corrosion. The ideal condition for the
achievement of a proportionality between C and ΔW is that all the corroded metal
should be incorporated in the layer of corrosion products. According to the values
above, for this to happen the C/ΔW ratio should reach a maximum value of 0.33-0.43.
The polished specimens show C/ΔW values close to this value after about 7-15 days of
testing (Fig. 9), while the specimens with the original surface have C/ΔW values well
above 0.33-0.43 at the start of the test, and tend towards this limit much more slowly
(Fig. 9).
Effect of alloy type and surface conditions
It should be noted that the surface conditions have a certain effect on the behaviour of
the specimens (Figs. 1, 2, 7-9). This is very clearly seen in Fig. 2, where the points
corresponding to the original surface condition are always found above those
corresponding to the polished surface condition, for both alloys and testing times. This
appears to suggest a greater compactness of the corrosion product layer formed on the
polished surface than that formed on the original surface, perhaps because the
presence of oxides and some other possible species present in the rolling skin from the
fabrication process perturbs the normal growth of the corrosion product layer on the as-
received surface.
Conclusions
11
The performance of AZ31 and AZ61 magnesium alloys has been studied in a high
humidity atmosphere under continuous condensation (CC) conditions. One of the
purposes of the work was to study experimental conditions without the influence of
chloride ions which are often present in research on atmospheric corrosion in the
literature. The high scatter of gravimetric results for the specimens subjected to the CC
test suggests an extraordinary sensitivity of the corrosion product layer's growth
characteristics to fortuitous minute variations in the process of their formation.
In the series of tests with the AZ31 and AZ61 specimens the rate of attack tends to
diminish as a function of time suggesting some protective action of the growing
corrosion product layer. This behaviour differs from the approximately linear rate laws
in published work on the atmospheric corrosion of magnesium and its alloys in the
presence of chlorides, and is more in concordance with the behaviour expected of a
layer whose thickness controls the corrosion rate.
Analysis of the set of gravimetric data has revealed a first period during which only a
small part of the corroded metal participates in the formation of the corrosion product
layer on the metal surface. The proportion of metal that forms this layer increases with
exposure time to the point that all the corroded metal is incorporated. The time taken
to reach this situation depends significantly on the initial conditions of the exposed
metallic surface.
The EIS technique was also employed in order to better characterise the protective
action of the corrosion product layers on the tested magnesium alloys. These
measurements show a strong restrictive effect on surface activity in the specimens
upon which coarse corrosion product layers have built up in exposure to the CC test.
Acknowledgment
We wish to express our gratitude to Prof. S. Feliu for several clarifying and
stimulating discussions during the course of this work. Also, the authors
gratefully acknowledge the financial support for this work from the Ministry of
Science and Innovation of Spain ( MAT 2009-13530)
12
References
1. G. Song, A. Atrens, Adv. Eng. Mater., 5 (2003) 837-858.
2. G. Song, A. Atrens, M. Dargusch, Corros. Sci., 41 (1999), 249-273.
3. M. Jönsson, D. Persson, G. Leygraf, Corros. Sci., 50 (2008) 1406-1413.
4. J.H. Nordlien, K. Nisancioglu, S. Ono, N. Masuko, J. Electrochem. Soc., 143 (1996),
2564-2572.
5. J.H. Nordlien, K. Nisancioglu, S. Ono, N. Masuko, J. Electrochem. Soc., 144 (1997)
461-466.
6. C. Fotea, J. Callaway, M. R. Alexander, Surf. Interface Anal., 38 (2006) 1363-1371.
7. M-C. Zhao, P. Schmutz, S. Brunner, M. Liu, G. Song, A. Atrens, Corros. Sci., 51
(2009 ) 1277-1292.
8. G. Baril, N. Pébère, Corros. Sci., 43 (2001), 471-484.
9. G. Song, A. Atrens, D. St. John, X. Wu, J. Nairn, Corros. Sci., 39 (1997) 1981-2004.
10. G. Song, A. Atrens, X. Wu, B. Zhang, Corros. Sci., 40 (1998) 1769-1791.
11. G. Song, A. Atrens, D. St. John, J. Nairn, Y. Li, Corros. Sci., 39 (1997) 855-875.
12. S. Mathieu, C. Rapin, J. Steinmetz, P. Steinmetz, Corros. Sci., 45 (2003) 2741-
2755.
13. S. Mathieu, C. Rapin, J. Hazan, P. Steinmetz, Corros. Sci., 44 (2002) 2737-2756.
14. G.L. Makar, J. Kruger, J. Electrochem. Soc., 137 (1990) 414-421.
15. M. Santamaria, F. Di. Quarto, S. Zanna, P. Marcus, Electrochim. Acta, 53 (2007)
1314-1324.
16. A. Pardo, M.C. Merino, A.E. Coy, F. Viejo, R. Arrabal, S. Feliu Jr., Electrochim.
Acta, 53 (2008) 7890-7902.
17. G. Galicia, N. Pébère, B. Tribollet, V. Vivier, Corros. Sci., 51 (2009) 1789-1794.
13
18. R. Lindström, J-E. Svensson, L-G. Johansson, J. Electrochim. Soc., 149 (2002)
B103-B107.
19. R. Lindström, L-G. Johansson, J-E. Svensson, Materials and Corrosion, 54 (2003)
587-594.
20. R. Lindström, L-G. Johansson, G.E. Thompsson, P. Skeldon, J-E. Svensson,
Corros. Sci., 46 (2004), 1141-1158.
21. S.J. Splinter, N.S. McIntyre, Surf. Sci., 314(1994) 157-171.
22. J. H. Nordlien, S. Ono, N. Masuko, K. Nisancioglu, Corros. Sci., 39 (1997) 1397-
1414.
23. N.S. McIntyre, C. Chen, Corros. Sci. 40 (1998) 1697-1709.
24. M. Jönsson, D. Persson, R. Gubner, J. Electrochem. Soc., 1954 (2007), C684-
C691.
25. M. Jönsson, D. Persson, D. Thierry, Corros. Sci., 49 (2007), 1540-1558.
26. G. Ballerini, U. Bardi, R. Bignucolo, G. Ceraolo, Corros. Sci., 47 (2005) 2173-2184.
27. R. Arrabal, A. Pardo, M.C. Merino, S. Merino, M. Mohedano, P. Casajus, Materials
and Corrosion, 61 (2010) 1-9.
28. S. Feliu Jr., A. Pardo, M.C. Merino, A.E. Coy, F. Viejo, R. Arrabal, Appl. Sur. Sci.,
255 (2009) 4102-4108.
29. C.D. Wagner, L.E. Davis, M.V. Zeller, J.A. Taylor, R.H. Raymond, L. Gate, Surf.
Interface Anal., 3 (1981) 211-225.
30. C.B. Baliga, P. Tsakiropoulos, Mater. Sci. Technol., 9 (1993) 513-519.
31. X. Guo, J. Chang, S. He, W. Ding, X. Wang, Electrochim. Acta, 52 (2007) 2570-
2579.
32. J. Chang, X. Guo, S. He, P. Fu, L. Peng, W. Ding, Corros. Sci., 50 (2008) 166-177.
33. R. Ambat, N.N. Aung, W. Zhou, Corros. Sci., 314 (1994) 157-171.

14
34. S. Feliu Jr., M.C. Merino, R. Arrabal, A.E. Coy, E. Matyking, Surf. Interface Anal.,
41 (2009) 143-150.
35. M. Liu, P.D. Uggowitzer, A.V. Nagasekhar, P. Schmutz, M. Easton, G. Song, A.
Atrens, Corros. Sci., 51 (2009) 602-619.
15
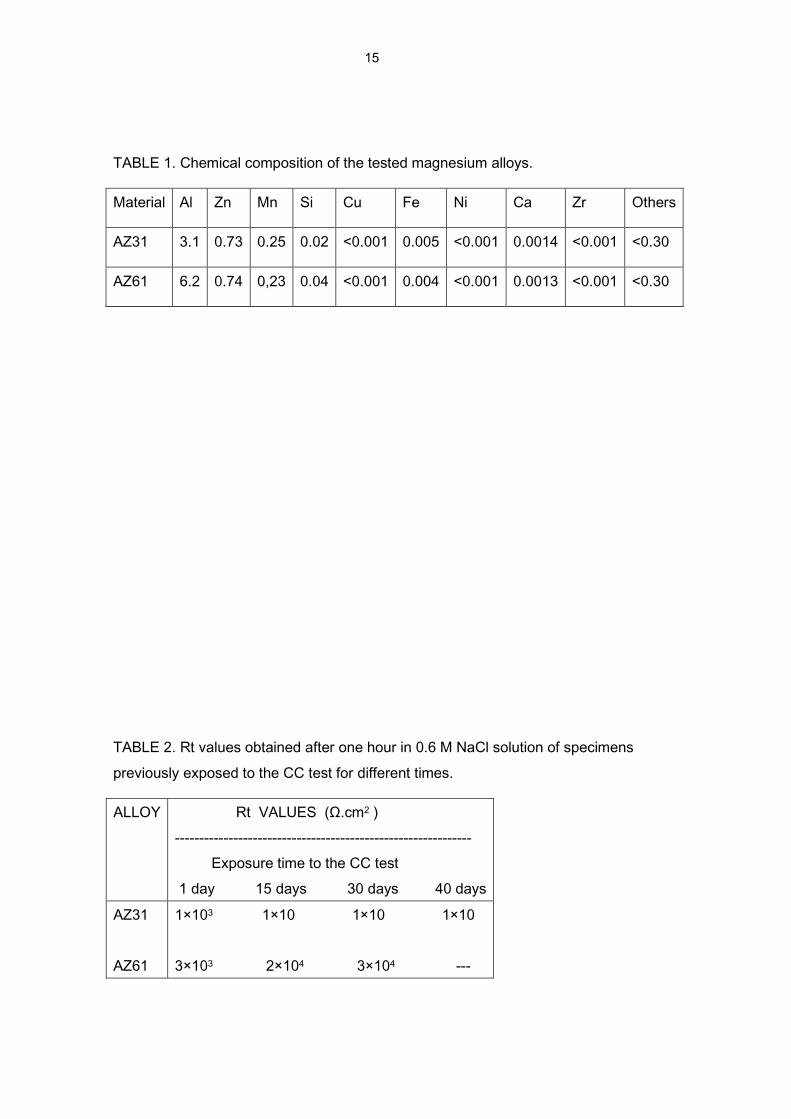
TABLE 1. Chemical composition of the tested magnesium alloys.
Material Al Zn Mn Si Cu Fe Ni Ca Zr Others
AZ31 3.1 0.73 0.25 0.02 <0.001 0.005 <0.001 0.0014 <0.001 <0.30
AZ61 6.2 0.74 0,23 0.04 <0.001 0.004 <0.001 0.0013 <0.001 <0.30
TABLE 2. Rt values obtained after one hour in 0.6 M NaCl solution of specimens
previously exposed to the CC test for different times.
ALLOY Rt VALUES (Ω.cm2 )
-------------------------------------------------------------
Exposure time to the CC test
1 day 15 days 30 days 40 days
AZ31
AZ61
1×10³ 1×10 1×10 1×10
3×10³ 2×10⁴ 3×10⁴ ---
16
TABLE 3. Literature data. Parentheses enclose approximate corrosion values
calculated from published weight gain determinations.
Ref. Test conditions Material Corrosion (mg/cm2)
7 days 15 days 30 days
19 95% RH, 22ºC AZ91D -- -- ~0
20 95% RH, 22ºC Mg -- -- 0.01
28 98% RH, 50ºC Mg (0.06) (0.12) (0.17)
28 98% RH, 50ºC AZ31 (0.03) (0.08) (0.12)
28 98% RH, 50ºC AZ80 (0.008) (0.034) (0.057)
28 98% RH, 50ºC AZ91D (0.014) (0.053) (0.072)
19 95% RH, 22ºC
15 µg/cm2 NaCl added
AZ91D --- --- (0.10)
19 95% RH, 22ºC
36 µg/cm2 NaCl added
AZ91D --- --- (0.17)
19 95% RH, 22ºC
74 µg/cm2 NaCl added
AZ91D --- --- (0.23)
25 95% RH, 25ºC
70 µg/cm2 NaCl added
AZ91D 0.15 0.30 0.47
18 95% RH, 22ºC
70 µg/cm2 NaCl added
AM20 (0.33) (0.60) (0.73)
18 95% RH, 22ºC
70 µg/cm2 NaCl added
AM60 (0.26) (0.36) (0.50)
18 95% RH, 22ºC
70 µg/cm2 NaCl added
AZ91D (0.18) (0.21) (0.23)
26 Salt spray test
5 wt% NaCl, 35ºC
AZ91D 1.6 2.5 ---
This work Continuous
condensation, 23º
AZ31 0.07 0.15 0.38
This work Continuous
condensation, 23º
AZ61 0.23 0.21 0.36
17
TABLE 4. Atomic composition obtained by XPS of the surface of AZ31 and AZ61
specimens after exposure to the humidity condensation test.
_____________________________________________________________________________
SAMPLE %C %O %Mg %Al O/(Mg+Al) Al/(Mg+Al)x100
AZ31 16 61 22 1 2.7 4 .
AZ61 16 56 24 4 2 14 . .
18
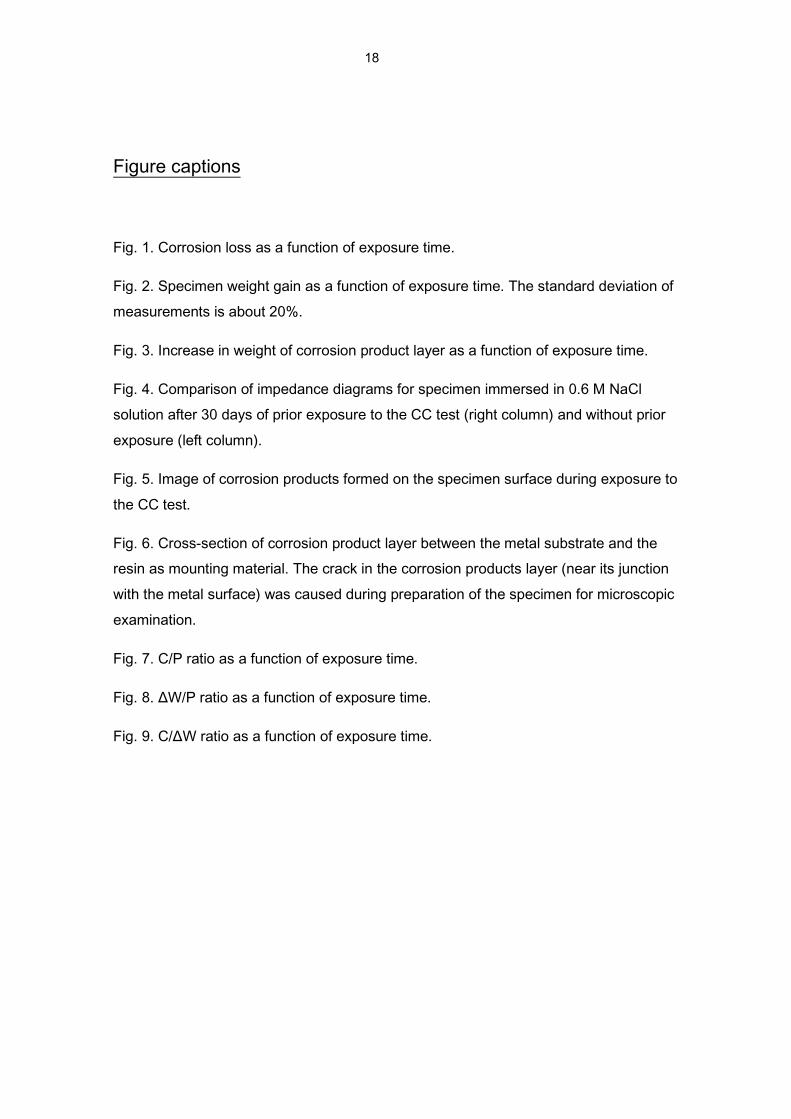
Figure captions
Fig. 1. Corrosion loss as a function of exposure time.
Fig. 2. Specimen weight gain as a function of exposure time. The standard deviation of
measurements is about 20%.
Fig. 3. Increase in weight of corrosion product layer as a function of exposure time.
Fig. 4. Comparison of impedance diagrams for specimen immersed in 0.6 M NaCl
solution after 30 days of prior exposure to the CC test (right column) and without prior
exposure (left column).
Fig. 5. Image of corrosion products formed on the specimen surface during exposure to
the CC test.
Fig. 6. Cross-section of corrosion product layer between the metal substrate and the
resin as mounting material. The crack in the corrosion products layer (near its junction
with the metal surface) was caused during preparation of the specimen for microscopic
examination.
Fig. 7. C/P ratio as a function of exposure time.
Fig. 8. ΔW/P ratio as a function of exposure time.
Fig. 9. C/ΔW ratio as a function of exposure time.
19
Fig 1.
0 20 40 600.0
0.2
0.4
AZ61
EXPOSURE TIME (days)
0 20 40 600.0
0.2
0.4
0.6
CO
RR
OS
ION
LO
SS
(m
g/c
m2)
, , polished surface
, , original surface
AZ31
20
Fig. 2
0 10 20 30 40 50 60
0.0
0.2
0.4
0.6
0.8
1.0
1.2
1.4
1.6
, , original
surface
, , polished
surface
, , AZ61
SP
EC
IME
N W
EIG
HT
GA
IN (
mg
/cm
2)
EXPOSURE TIME, t (days)
, , AZ31
0 1 2 3 4 5 6 7 8 9
0.0
0.2
0.4
0.6
0.8
1.0
1.2
1.4
1.6
t1/2
21
Fig. 3
0 20 40 600.0
0.5
1.0
1.5
AZ61
EXPOSURE TIME (days)
0 20 40 600.0
0.5
1.0
1.5
2.0
2.5
WE
IGH
T O
F C
OR
RO
SIO
N P
RO
DU
CT
S
LA
YE
R (
mg
/cm
2)
, , polished surface
, , original surface
AZ31
22
Fig.4
50 100 150 200
-50
0
50
100
0 20000 40000
0
10000
20000
AZ61
+ 30 d CC test
+ 0.6 M NaCl
0 50 100 150 200 250
-50
0
50
100
0 1000 2000 3000-600
-300
0
300
600
900
1200
1500
0 200 400 600
-100
0
100
200
0 200 400 600-100
0
100
200
0 200 400 600
-100
0
100
200
300
0 200 400 600 800
0
200
400
-Z" (
. c
m2 )
Z´( . cm
2 )
15 days
7 days
1 day
1 hour
AZ61
+ 0.6 M NaCl
23
Fig.5
24
Fig 6.
METAL
RESIN
25
Fig. 7
0 10 20 30 40 50 600.0
0.2
0.4
0.6
0.8
1.0
C/P
RA
TIO
EXPOSURE TIME (days)
, , original
surface
, , polished
surface
, , AZ61
, , AZ31
26
Fig.8
0 10 20 30 40 50 600.0
0.2
0.4
0.6
0.8
1.0
W
/P R
AT
IO
EXPOSURE TIME (days)
, , original
surface
, , polished
surface
, , AZ61
, , AZ31
27
Fig. 9
0 10 20 30 40 50 600.0
0.2
0.4
0.6
0.8
4
6
8
C/
W R
AT
IO
EXPOSURE TIME (days)
, , original
surface
, , polished
surface
, , AZ61
, , AZ31


