Embed Size (px)
Citation preview

UNCO
RRECTED P
RO
OF
1Q4 Attention in spina bifida myelomeningocele: Relations with brain2 volume and integrity
3 Paulina A. Kulesz a,b,*, Amery Treble-Barna c, Victoria J. Williams a,b, Jenifer Juranek d, Paul T. Cirino a,b,4 Maureen Dennis e, Jack M. Fletcher a,b
5aDepartment of Psychology, University of Houston, USA
6bTexas Institute for Measurement, Evaluation and Statistics, University of Houston, USA
7cDepartment of Physical Medicine and Rehabilitation, Cincinnati Children3s Hospital Medical Center, USA
8dDepartment of Pediatrics, University of Texas Health Science Center, USA
9eDepartment Of Surgery And Psychology, University Of Toronto, Canada
a b s t r a c t1 0 a r t i c l e i n f o
11 Article history:
12 Received 11 March 2015
13 Received in revised form 26 March 2015
14 Accepted 27 March 2015
15 Available online xxxx
16 Keywords:
17 Attention network
18 Neuroimaging
19 Tectum
20 Superior parietal cortex
21 Tectocortical pathways
22 Robust correlations
23This study investigated the relations of tectal volume and superior parietal cortex, as well as alterations in
24tectocortical white matter connectivity, with the orienting and executive control attention networks in individ-
25uals with spina bifida myelomeningocele (SBM). Probabilistic diffusion tractography and quantification of tectal
26and superior parietal cortical volume were performed on 74 individuals aged 8–29 with SBM and a history of
27hydrocephalus. Behavioral assessments measured posterior (covert orienting) and anterior (conflict resolution,
28attentional control) attention network functions. Reduced tectal volume was associated with slower covert
29orienting; reduced superior parietal cortical volume was associated with slower conflict resolution; and increased
30axial diffusivity and radial diffusivity along both frontal and parietal tectocortical pathwayswere associatedwith re-
31duced attentional control. Results suggest that components of both the orienting and executive control attention
32networks are impaired in SBM. Neuroanatomical disruption to the orienting network appearsmore robust and a di-
33rect consequence of characteristic midbrain dysmorphology; whereas, executive control difficulties may emerge
34from parietal cortical anomalies and reduced frontal and parietal cortical–subcortical white matter pathways
35susceptible to the pathophysiological effects of congenital hydrocephalus.
36 © 2015 Published by Elsevier Inc. This is an open access article under the CC BY-NC-ND license
37 (http://creativecommons.org/licenses/by-nc-nd/4.0/).
3839
40
41
42 1. Introduction
43 Two distinct frontoparietal attention networks underlie attentional
44 relevance and salience (Petersen and Posner, 2012). The executive con-
45 trol network is predominantly responsible for cognitively driven atten-
46 tion functions including conflict resolution and attentional control. This
47 network involves dorsolateral frontal and superior parietal cortices, and
48 connections with the thalamus and anterior cingulate cortex (Posner,
49 2012). Abnormalities of the brain structures subserving the executive
50 control network have been linked to response control deficits in devel-
51 opmental disorders such as attention deficit hyperactivity disorder
52 (ADHD; Dennis et al., 2008).
53 The orienting network, responsible for engaging, disengaging, and
54 shifting attention (Posner, 1980), is subserved by the frontal eye fields,
55 superior parietal lobule, and intraparietal sulcus, and the superior
56 colliculus of the midbrain tectum (Posner and Petersen, 1990).
57 Covert orienting is associated with unobservable, internal shifts of
58attention without engaging eye, head, or body movements (Klein,
592004). Tectal and posterior cortical abnormalities have been linked
60to covert orienting deficits in a variety of adult neurological disor-
61ders (Rafal et al., 1988).
62Covert orienting deficits are a major characteristic of spina bifida
63myelomeningocele (SBM). This neurodevelopmental disorder is of
64particular interest because in addition to covert orientingdeficits, devel-
65opmental dysmorphologies in SBM commonly include congenital ab-
66normalities of the tectum and reduced volume and atypical cortical
67thickness of the parietal lobes due to hydrocephalus. However, the rela-
68tion of these attentional difficulties and brain abnormalities has not
69been quantitatively examined. Because SBM has a range of both cog-
70nitive and neural variability, one cannot assume specific links, and so
71it is important to demonstrate such links directly in a hypothesis driven
72manner.
731.1. Spina bifida myelomeningocele
74Spina bifida myelomeningocele, a neural tube defect, is associat-
75ed with the Chiari II malformation, which involves a small posterior
76fossa and associated pathology of the cerebellum and brainstem,
NeuroImage: Clinical xxx (2015) xxx–xxx
* Corresponding author at: 4811 Calhoun Rd, Houston, TX 77204-6022, USA. Tel. +1
832 842 7003.
E-mail address: [email protected] (P.A. Kulesz).
YNICL-00480; No. of pages: 7; 4C:
http://dx.doi.org/10.1016/j.nicl.2015.03.022
2213-1582/© 2015 Published by Elsevier Inc. This is an open access article under the CC BY-NC-ND license (http://creativecommons.org/licenses/by-nc-nd/4.0/).
Contents lists available at ScienceDirect
NeuroImage: Clinical
j ourna l homepage: www.e lsev ie r .com/ locate /yn ic l
Please cite this article as: Kulesz, P.A., et al., Attention in spina bifidamyelomeningocele: Relations with brain volume and integrity, NeuroImage:Clinical (2015), http://dx.doi.org/10.1016/j.nicl.2015.03.022

UNCO
RRECTED P
RO
OF
77 often contributing to obstructive hydrocephalus and compression of
78 the midbrain (Juranek and Salman, 2010). In addition, hypoplasia or
79 partial dysgenesis of the corpus callosum (Hannay et al., 2009) is
80 common, along with, significant variations in cortical thickness: frontal
81 regions are often enlarged and posterior regions thinned (Juranek et al.,
82 2008). Fig. 1 demonstrates frequently observed neurostructural abnor-
83 malities in SBM.
84 As part of the spectrum of abnormalities associated with Chiari II
85 malformation, the midbrain is oftenmechanically distorted. The major-
86 ity of individuals with SBM and Chiari II malformation have a beaked
87 tectum that is stretched posteriorly and inferiorly (Behramn et al.,
88 2003). Williams et al. (2013) used diffusion tensor imaging (DTI)
89 to investigate the frontal and parietal tectocortical attention path-
90 ways in individuals with SBM relative to typically developing (TD)
91 individuals. Compared to TD individuals, those with SBM had re-
92 duced tectal volume, decreased fractional anisotropy in parietal
93 tectocortical pathways, and a greater discrepancy between frontal
94 and parietal tectocortical diffusion metrics. Those with SBM and tec-
95 tal beaking had increased axial diffusivity across frontal and parietal
96 tectocortical pathways compared to individuals with SBM and no
97 tectal beaking.
98 1.2. Attention in SBM
99 Impairment of the orienting network in SBM is well-established
100 (Dennis and Barnes, 2010). Individuals with SBM and a beaked tectum
101 have more difficulty disengaging attention from a current stimulus
102 and redirecting it towards a new stimulus when compared to TD individ-
103 uals and individuals with SBM and no tectal beaking (Dennis et al., 2005).
104 Similar findings have been found in infants with SBM, who require more
105 time to disengage and shift their attention towards new stimuli relative to
106 TD infants (Taylor et al., 2010). Although these findings suggest a relation
107 between orienting deficits and tectum, this relation has not been quanti-
108 tatively evaluated.
109 Functioning of the executive control network in SBM is less clear. In-
110 dividuals with SBM have demonstrated executive control difficulties on
111 measures of top-down attention processes such as attention control and
112 response inhibition (Ou et al., 2013). In contrast, on continuous perfor-
113 mance tasks, several studies found that individuals with SBM make
114 more commission errors relative to TD individuals (Swartwout et al.,
115 2008), implicating response inhibition difficulties, although such find-
116 ings have not been unequivocal (Colvin et al., 2003).
1171.3. Objectives and hypotheses
118The objective of the present studywas to investigate the relations of
119tectal and superior parietal cortical volume, and tectocortical diffusivity
120metrics, with functioning of the orienting and executive control atten-
121tion networks in SBM. Given the role of the superior colliculus in the
122orienting network, we hypothesized that lower tectal volume would
123be associated with poorer covert orienting, but not with executive con-
124trol functions. Because the superior parietal cortex subserves both the
125orienting and executive control networks, we hypothesized that lower
126volume of the superior parietal cortex would be associated with poorer
127performance on both covert orienting and executive control tasks. Finally,
128we did not have any a priori expectations concerning the understudied
129relations of tectocortical pathways and attention outcomes. The present
130study is novel due to a large clinical sample, the simultaneous analysis
131of both the orienting and executive control attention networks, and the
132implementation of robust correlations and bootstrap procedures to in-
133crease the reliability of findings.
1342. Materials and methods
1352.1. Participants
136Participants included 80 individuals with SBM (also reported in
137Williams et al., 2013) who had undergone structural MRI of the brain.
138These participants were recruited through clinics in Houston. Of these
139individuals, 74 had complete neuroimaging, orienting, and conflict
140resolution data (except for the superior parietal cortex, orienting,
141conflict resolution data where n = 73), and 59 had complete neuro-
142imaging and attentional control data. Inclusion criteria consisted of
143a myelomeningocele at birth, evidence of hydrocephalus, and adequate
144upper limb control. Participants had no evidence of major psychiatric dis-
145order. All participants had an IQ score of at least 70.
146The sample was 13.70 (SD=4.81, age range: 7.90–29.11 years) years
147in age, 55% male, and 53% Hispanic. The sample was representative of
148other samples of SBM, with most showing the Chiari II malformation
149(88%), thinning (61%) or partial dysgenesis (35%) of the corpus callosum,
150lower spinal lesions (86%), ambulatory difficulties (68%), no seizure histo-
151ry (64%), and two to four shunt revisions (49%). Tectal beaking was pres-
152ent in 47 out of 74 participants with SBM. The studywas approved by the
153human participants review boards at all institutions. Parents and
154participants gave written consent unless the participant was under
15513, in which case the parent consented and the child assented.
Fig. 1. Depiction of variations in corpus callosum (A), tectum (B), and cerebellum (C) in SBM compared to typically developing individual. I) Individual with SBM showing partial dysgen-
esis of the corpus callosum, a normal appearing tectum, and downward herniation of the cerebellum; II) individualwith SBM showing partial dysgenesis of the corpus callosum, beaking of
the midbrain tectum and normal cerebellum; III) typically developing individual showing a fully formed corpus callosum, with normal appearing tectum and cerebellum.
2 P.A. Kulesz et al. / NeuroImage: Clinical xxx (2015) xxx–xxx
Please cite this article as: Kulesz, P.A., et al., Attention in spina bifidamyelomeningocele: Relations with brain volume and integrity, NeuroImage:Clinical (2015), http://dx.doi.org/10.1016/j.nicl.2015.03.022

UNCO
RRECTED P
RO
OF
156 2.2. MRI data acquisition and processing
157 High-resolution T1 scans were obtained on a Philips 3.0 T Intera
158 system with the following acquisition parameters: slice thickness =
159 1.5 mm; TR/TE = 6.5 − 6.7/3.04–3.14 ms; flip angle = 8°; square
160 FOV = 24 cm3; matrix = 256 × 256; in-plane pixel dimensions
161 (x, y) = 0.94, 0.94; NEX = 2. DTI images were acquired using a
162 single-shot spin-echodiffusion sensitized echo-planar imaging (EPI) se-
163 quence with the balanced Icosa21 encoding schemewith the following
164 parameters: 44 slices total; square field of view (FOV)= 24 cm3; acqui-
165 sition matrix = 256 × 256; slice thickness = 3 mm; TR/TE = 6100/
166 84 ms; b-value = 1000 s/mm2. A single non-diffusion weighted image
167 with a b-value = 0 s/mm2 was acquired concurrently as an anatomical
168 reference volume.
169 All T1-weighted images were processed using FreeSurfer (https://
170 surfer.nmr.mgh.harvard.edu). Resultant cortical labels were non-
171 linearly co-registered using FMRIB3s Linear Image Registration Tool
172 (FLIRT) and transformed into native DTI space to serve as endpoint
173 masks for tractography procedures. Cortical labels were dilated 2 mm
174 into adjacent white matter to facilitate fiber-tracking procedures.
175DTI acquisitions were processed using tools available through
176FreeSurfer and FSL (http://fsl.fmrib.ox.ac.uk/fsl/fslwiki/FSL) image anal-
177yses software (Behrens et al., 2007; Jenkinson et al., 2012). Diffusion
178volumes underwent eddy current andmotion correction. Diffusion ten-
179sors were calculated for each voxel using a least-squares fit to the log of
180the diffusion signal. Maps for fractional anisotropy (FA), axial diffusivity
181[λ1] (AD) and radial diffusivity [(λ2 + λ3) / 2] (RD) were isolated for
182further FSL probabilistic tractography processing and analysis (Budde
183et al., 2007). Non-diffusion weighted images (T2) were skull stripped
184andused as amask to remove non-brain tissue fromcalculateddiffusion
185maps.
186Fig. 2 provides a visualization of MRI-derived dependent variables.
187The midbrain tectumwasmanually defined for each participant by a sin-
188gle rater blinded to diagnosis in order to determine tectal volume and to
189function as a seed region in subsequent probabilistic tractography proce-
190dures (Williams et al., 2013). Hand drawn ROIs were traced in fslview in
191the axial plane of the T2-weighted Q5lowb (e.g. b=0) image of the DTI se-
192quence such that the tectal label directly corresponded to the intended
193collicular structure in native DTI space (minimizing the need for spatial
194transformations reliant on co-registration procedures that were found
Fig. 2.Visualization ofMRI-derived dependent variables for individualswith SBM. (A) FreeSurfer semi-automated parcellation of the superior parietal cortex. (B)Manually defined regions
of interest for left (yellow) and right (orange) tectum. (C) Results of probabilistic diffusion tractography (FSL) procedures defining left and right white matter pathways between the
tectum and frontal (red) and parietal (blue) cortices.
3P.A. Kulesz et al. / NeuroImage: Clinical xxx (2015) xxx–xxx
Please cite this article as: Kulesz, P.A., et al., Attention in spina bifidamyelomeningocele: Relations with brain volume and integrity, NeuroImage:Clinical (2015), http://dx.doi.org/10.1016/j.nicl.2015.03.022

UNCO
RRECTED P
RO
OF
195 to be less reliable for smaller mid-brain regions). Dice similarity coef-
196 ficients (0.894) showed strong intra-rater reliability for the manual trac-
197 ings (Zou et al., 2004). Volume of the superior parietal cortex within
198 each hemisphere was acquired using the Freesurfer automatic cortical
199 parcellation routine (Desikan et al., 2006). Probabilistic tractography
200 was performed per hemisphere with seeding in the left or right collicular
201 division. Tractography iterations were performed twice per hemisphere
202 defining connectivity from the colliculi to separate parietal and frontal
203 cortical endpoint regions, yielding four tracts for each participant: left
204 hemisphere (LH) tectal-frontal, LH tectal-parietal, right hemisphere
205 (RH) tectal-frontal, RH tectal-parietal. Tract normalization entailed
206 waytotal normalization, thresholding to remove voxels with FA values
207 less than 0.2 tominimize crossing fibers and partial voluming, with resul-
208 tant output binarized to create tractography-derivedmasks for each path-
209 way.Mean FA, RD, and ADwas subsequently calculated for each pathway
210 and served as dependent variables in subsequent statistical analysis.
211 2.3. Behavioral measures
212 2.4.1. The Child Attention Network Test
213 The Child Attention Network Test (Rueda et al., 2004) was designed
214 to measure orienting and executive control attention networks in
215 participants as young as 4 years of age (Rueda et al., 2004). Because
216 the child version of the test is a computerized, timed test where ceiling
217 effects are unlikely, it was possible to administer the same test to all
218 participants regardless of their age. The test utilizes four types of cues
219 along with three flanker conditions. The four cue types include: no cue
220 (a fixation cross); a central cue (an asterisk in the place of the fixation
221 cross); a double cue (asterisks above and below the fixation cross);
222 and a spatial cue (an asterisk in the location of an upcoming target).
223 The three flanker conditions include: congruent, incongruent, or
224 neutral flankers. In the congruent flanker condition, the target and
225 four distractors face the same direction. In the incongruent flanker con-
226 dition, target anddistracters face in opposite directions, creating a conflict.
227 In the neutral flanker condition, the target appears without distracters
228 (Rueda et al., 2004). The goal of the task is to determine inwhichdirection
229 the target is pointing using right or left button press. The primary
230 measures for this study were composites associated with the
231 orienting and executive control attentional networks. The covert
232 orienting network was captured with the Orienting measure, equal
233 to RTCentralCue−RTSpatialCue . The executive control network was cap-
234 tured with the Conflict Resolution measure, equal to RTIncongruent−
235 RTCongruent . All mean RT were calculated on the correct trials only.
236 Within sample reliability of orienting and conflict resolution mea-
237 sures was equal to r = .11 and r = .47, respectively.
238 2.4.2. Test of Everyday Attention for Children, the Opposite Worlds subtest
239 Test of Everyday Attention for Children, the OppositeWorlds subtest
240 (Manly et al., 1999), assessing Attentional Control, was used as an addi-
241 tionalmeasure of the executive control attention network. TheOpposite
242 Worlds task involves two conditions, oppositeworld and sameworld. In
243 the same world condition (the control condition), participants read
244 aloud a list of “1” and “2” digits presented on a card. In the opposite
245 world condition (the attentional control condition), participants are
246 asked to say aloud the “opposite” of the digit appearing on the card
247 (the correct verbal response for number “1” was two, and for number
248 “2”was one; Baron, 2001). Participants receive two cards per condition.
249 The order of presented cards is as follows: same world, opposite world,
250 opposite world, sameworld. The time required to complete each condi-
251 tion is recorded. Incorrect responses result in a time penalty, as partici-
252 pants are not permitted to proceedwith the task until they correct their
253 response. Total time required to complete the two cards related to the
254 opposite world condition was used as a measure of attentional control.
255 Within sample reliability of the Opposite Worlds subtest was equal to
256 r = .85.
2572.4. Statistical analyses
258Structure–function relations were estimated using the Pearson and
259percentage bend correlations, as well as the skipped correlation using
260the Donoho–Gasko median (DGM; Wilcox, 2003). The utility of the
261three correlations in examining structure–function relations is exten-
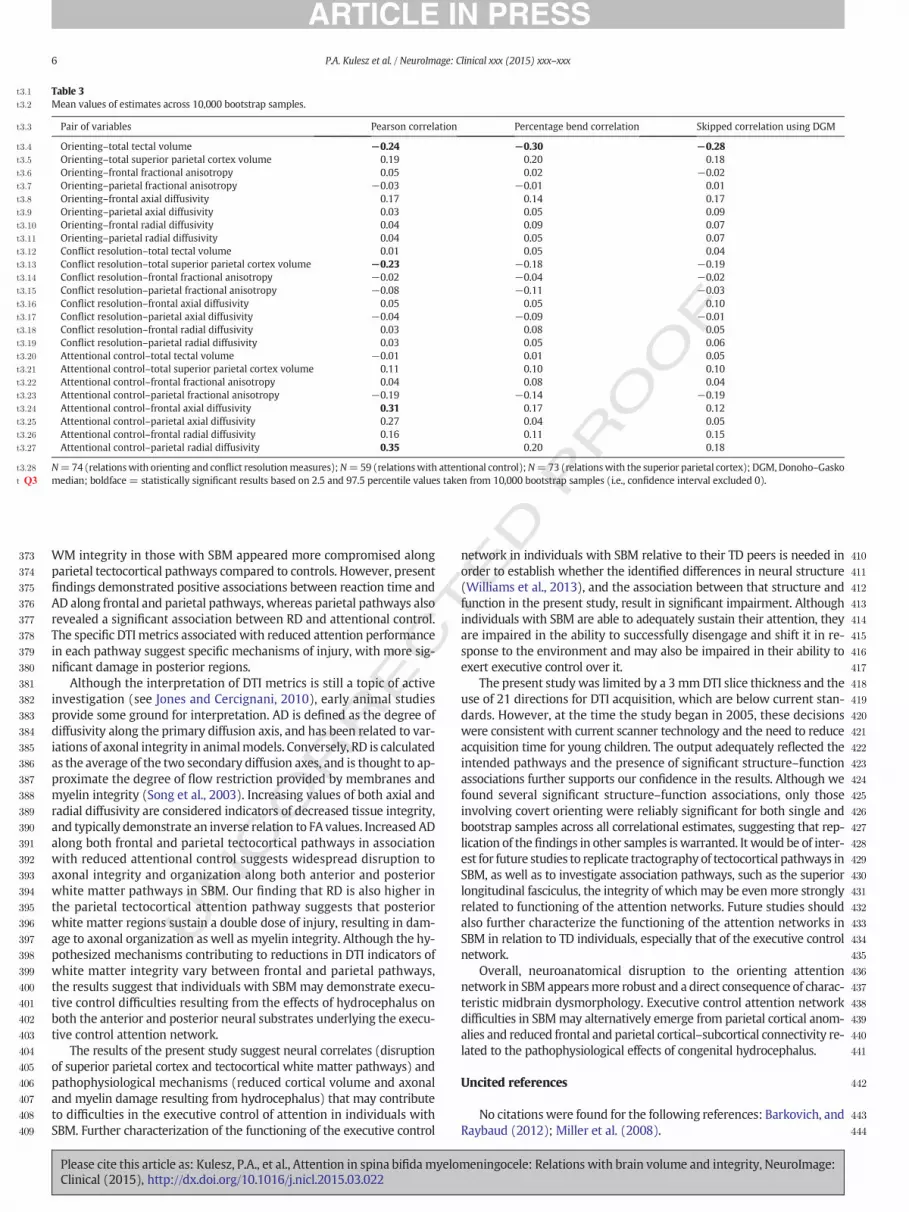
262sively discussed in Kulesz et al. (2015). Reaction time measures were
263log transformed. Statistical procedures were completed in R Version
2643.0.2 (R Development Core Team, 2008) using the boot package Version
2651.3-9, foreign package Version 0.8-55, MASS package Version 7.3-29,
266and custom written functions.
267The bootstrap procedure was applied to improve accuracy of the in-
268ferences regarding investigated relations. Relying solely on findings
269from a single sample of data decreases reliability of the results as one
270cannot be sure that the same results will be replicated in the future.
271We sampled n observations with replacement 10,000 times for each
272relation (with n was equal to 74, 73 or 59 observations depending on
273the investigated relation and missing data points) to derive bootstrap
274samples. The three correlations were computed for a given relation on
275each of the 10,000 bootstrap samples. Empirical distributions of the
276three correlations were summarized using: mean and confidence inter-
277vals based on 2.5 and 97.5 percentiles.
278The findings were evaluated in terms of their generalizability across
279different correlational estimates aswell as single and bootstrap samples.
280Increased reliability of findingswas assumed if: (a) significance tests for
281a single sample estimate yielded statistically significant results across all
282correlational estimates, and (b) confidence intervals based on the boot-
283strap distributions excluded 0 across all correlational estimates.
2843. Results
285Table 1 presents means and standard deviations for the tectum and
286superior parietal cortex volumes, FA, AD, and RD values for frontal and
287parietal tectocortical pathways, as well as measures of the orienting
288(i.e., covert orienting) and executive control (i.e., conflict resolution
289and attentional control) attention networks. Average diffusivity metrics
290were calculated for each participant based on the output of seed-based
291probabilistic tractographyproceduresmodeling tectocortical connectiv-
292ity for each hemisphere. Because there were no significant hemispheric
293differences with regard to indicators of WM tract integrity (Williams
294et al., 2013), left and right hemisphere measurements were averaged
295within participants to provide a single indicator depicting frontal and
296parietal tectocortical tract characteristics.
t1:1Table 1
t1:2Descriptive statistics for behavioral and brain measures Q1.
t1:3Mean SD
t1:4Behavioral measures
t1:5Orienting 0.05 0.07
t1:6Conflict resolution 0.17 0.12
t1:7Attentional controla 3.67 0.29
t1:8Brain measures
t1:9Total tectal volume (mm3) 1533.25 374.34
t1:10Total SP volume (mm3)b 31,429.86 6150.79
t1:11FA
t1:12Frontal 0.4403 0.0381
t1:13Parietal 0.4320 0.0324
t1:14AD (× 10−3 mm2/s)
t1:15Frontal 1.21 0.055
t1:16Parietal 1.26 0.051
t1:17RD (× 10−3 mm2/s)
t1:18Frontal 0.591 0.0445
t1:19Parietal 0.629 0.0502
t1:20SD, standard deviation; SP, superior parietal cortex; FA, fractional anisotropy; AD, axial
t1:21diffusivity; RD, radial diffusivity.
t1:22Total N = 74.
t1:23a N = 59.
t1:24b N = 73.
4 P.A. Kulesz et al. / NeuroImage: Clinical xxx (2015) xxx–xxx
Please cite this article as: Kulesz, P.A., et al., Attention in spina bifidamyelomeningocele: Relations with brain volume and integrity, NeuroImage:Clinical (2015), http://dx.doi.org/10.1016/j.nicl.2015.03.022

UNCO
RRECTED P
RO
OF
297 Tables 2 and 3 present single sample estimates and mean values of
298 estimates across 10,000 bootstrap samples (respectively) of the three
299 correlations. As hypothesized, there was a significant negative relation
300 of tectal volume with covert orienting, but not with either measure of
301 the executive control network (i.e., conflict resolution and attentional
302 control measures). Slower attentional shifts were associated with de-
303 creased tectal volume. Importantly, this result was statistically significant
304 for both single and bootstrap samples across all correlational estimates,
305 and therefore considered highly reliable.
306 Superior parietal cortex volume was significantly associated with
307 conflict resolution, but not with attentional control or covert orienting,
308 partially supporting our hypothesis. A slower pace of resolving conflicts
309 between competing stimuli was associated with lower volume of the su-
310 perior parietal cortex. This relation was significant for single and boot-
311 strap samples for the Pearson correlations, but not for the percentage
312 bend correlation or the skipped correlation using the DGM, suggesting
313 that these findings are less reliable and may reflect general properties of
314 a Pearson correlationwhich is less robust to violations of distributional as-
315 sumptions and outliers.
316 Significant positive associations were found between attentional con-
317 trol and frontal AD, parietal AD, and parietal RD. These results suggest that
318 poorer attentional control was associated with reduced indicators of
319 white matter integrity along both frontal and parietal tectocortical atten-
320 tion pathways. Relations between DTI metrics and attentional control
321 were significant for Pearson correlations, but not for the percentage
322 bend correlation or the skipped correlation using the DGM, which as
323 abovemay reflect themore robust properties of the latter two estimators.
324 The relation with RD was significant only for the single sample estimate,
325 suggesting that these findings may be sample-specific.
326 4. Discussion and conclusions
327 Despite the generalized nature of the neural abnormalities charac-
328 teristic of SBM, covert orienting difficulties were specifically related to
329 the midbrain anomalies that emerge as part of the Chiari II malforma-
330 tion. In contrast, problemswith the executive control network were as-
331 sociated with reduced superior parietal volume, as well as reduced DTI
332 indicators ofWM integrity along tectocortical pathways, both potential-
333 ly attributed to the pathological effects of hydrocephalus. These results
334indicate that the neural disruption associatedwith SBMoccurs in a prin-
335cipled manner and can be detected with a sufficiently large sample, a
336quantitative, multi-modality approach to neuroimaging, and more so-
337phisticated methods for estimating correlations.
338Neuropsychological impairments in SBM have historically been
339assumed to result predominantly from the damaging effects of hydro-
340cephalus on the brain. Recent investigations into the neuropsychological
341correlates of tectal beaking suggest that there are specific neuro-
342psychological impairments that cannot be attributed solely to the ef-
343fects of hydrocephalus; rather, they result from the characteristic brain
344malformation involving the midbrain and posterior fossa (Treble-Barna
345et al., 2014). As hypothesized, lower tectal volume was associated with
346poorer covert orienting in SBM, and not with functions of the executive
347control attention network. This finding is highly reliable given that it
348was statistically significant for both single and bootstrap samples across
349all correlational estimates. The specificity and reliability of this finding
350confirmpreviously speculated importance of the superior colliculus in co-
351vert orienting (Dennis et al., 2005).
352Because superior parietal cortex subserves both the orienting
353and executive control networks, we hypothesized that lower volume
354of the superior parietal cortex would be associated with poorer perfor-
355mance on both covert orienting and executive control functions. In par-
356tial support of our hypothesis, lower volume of the superior parietal
357cortex was associated with poorer conflict resolution in SBM; however,
358we did not find expected associationswith covert orienting or attentional
359control. Cortical volume is a less than optimal measure of brain morphol-
360ogy in SBM, possibly accounting for our only partially supported hypoth-
361esis. Cortical volume can be more finely characterized by contributory
362components including surface area, thickness, and gyrification. In SBM,
363although the parietal lobe is lower in cortical volume relative to TD indi-
364viduals (Juranek et al., 2008), the superior parietal cortex is thicker but
365less gyrified relative to TD individuals (Treble et al., 2013). Thus, volume
366may be inadequately sensitive to associations between brainmorphology
367and attention functions in SBM.
368When examining WM microstructural morphology, poorer atten-
369tional control was associated with increased AD along frontal and pari-
370etal tectocortical pathways, and increased RD along parietal pathways.
371These findings suggest reduced white WM integrity and organization.
372This is interesting because in Williams et al. (2013), DTI indicators of
t2:1 Table 2
t2:2 Single sample estimates of population correlation relations.
t2:3 Pair of variables Pearson correlation Percentage bend correlation Skipped correlation using DGM
t2:4 Orienting–total tectal volume −0.24 −0.30 −0.30
t2:5 Orienting–total superior parietal cortex volume 0.19 0.20 0.17
t2:6 Orienting–frontal fractional anisotropy 0.05 0.02 −0.07
t2:7 Orienting–parietal fractional anisotropy −0.03 0.01 0.04
t2:8 Orienting–frontal axial diffusivity 0.17 0.15 0.14
t2:9 Orienting–parietal axial diffusivity 0.03 0.05 0.10
t2:10 Orienting–frontal radial diffusivity 0.03 0.09 0.10
t2:11 Orienting–parietal radial diffusivity 0.04 0.04 0.04
t2:12 Conflict resolution–total tectal volume 0.01 0.05 0.05
t2:13 Conflict resolution–total superior parietal cortex volume −0.23 −0.19 −0.20
t2:14 Conflict resolution–frontal fractional anisotropy −0.02 −0.04 0.01
t2:15 Conflict resolution–parietal fractional anisotropy −0.08 −0.12 0.01
t2:16 Conflict resolution–frontal axial diffusivity 0.05 0.05 0.07
t2:17 Conflict resolution–parietal axial diffusivity −0.04 −0.09 0.01
t2:18 Conflict resolution–frontal radial diffusivity 0.02 0.08 0.06
t2:19 Conflict resolution–parietal radial diffusivity 0.03 0.05 0.03
t2:20 Attentional control–total tectal volume −0.02 0.00 0.09
t2:21 Attentional control–total superior parietal cortex volume 0.11 0.10 0.10
t2:22 Attentional control–frontal fractional anisotropy 0.03 0.09 0.01
t2:23 Attentional control–parietal fractional anisotropy −0.19 −0.14 −0.20
t2:24 Attentional control–frontal axial diffusivity 0.32 0.17 0.10
t2:25 Attentional control–parietal axial diffusivity 0.32 0.04 0.06
t2:26 Attentional control–frontal radial diffusivity 0.16 0.10 0.16
t2:27 Attentional control–parietal radial diffusivity 0.37 0.20 0.21
t2:28 N=74 (relationswith orienting and conflict resolutionmeasures);N=59 (relationswith attentional control);N=73 (relationswith the superior parietal cortex); DGM,Donoho–Gasko
t2:29 median; boldfaceQ2 = statistically significant results based on p b 0.05.
5P.A. Kulesz et al. / NeuroImage: Clinical xxx (2015) xxx–xxx
Please cite this article as: Kulesz, P.A., et al., Attention in spina bifidamyelomeningocele: Relations with brain volume and integrity, NeuroImage:Clinical (2015), http://dx.doi.org/10.1016/j.nicl.2015.03.022
UNCO
RRECTED P
RO
OF
373 WM integrity in those with SBM appeared more compromised along
374 parietal tectocortical pathways compared to controls. However, present
375 findings demonstrated positive associations between reaction time and
376 AD along frontal and parietal pathways, whereas parietal pathways also
377 revealed a significant association between RD and attentional control.
378 The specific DTImetrics associatedwith reduced attention performance
379 in each pathway suggest specific mechanisms of injury, with more sig-
380 nificant damage in posterior regions.
381 Although the interpretation of DTI metrics is still a topic of active
382 investigation (see Jones and Cercignani, 2010), early animal studies
383 provide some ground for interpretation. AD is defined as the degree of
384 diffusivity along the primary diffusion axis, and has been related to var-
385 iations of axonal integrity in animalmodels. Conversely, RD is calculated
386 as the average of the two secondary diffusion axes, and is thought to ap-
387 proximate the degree of flow restriction provided by membranes and
388 myelin integrity (Song et al., 2003). Increasing values of both axial and
389 radial diffusivity are considered indicators of decreased tissue integrity,
390 and typically demonstrate an inverse relation to FA values. Increased AD
391 along both frontal and parietal tectocortical pathways in association
392 with reduced attentional control suggests widespread disruption to
393 axonal integrity and organization along both anterior and posterior
394 white matter pathways in SBM. Our finding that RD is also higher in
395 the parietal tectocortical attention pathway suggests that posterior
396 white matter regions sustain a double dose of injury, resulting in dam-
397 age to axonal organization as well as myelin integrity. Although the hy-
398 pothesized mechanisms contributing to reductions in DTI indicators of
399 white matter integrity vary between frontal and parietal pathways,
400 the results suggest that individuals with SBMmay demonstrate execu-
401 tive control difficulties resulting from the effects of hydrocephalus on
402 both the anterior and posterior neural substrates underlying the execu-
403 tive control attention network.
404 The results of the present study suggest neural correlates (disruption
405 of superior parietal cortex and tectocortical white matter pathways) and
406 pathophysiological mechanisms (reduced cortical volume and axonal
407 and myelin damage resulting from hydrocephalus) that may contribute
408 to difficulties in the executive control of attention in individuals with
409 SBM. Further characterization of the functioning of the executive control
410network in individuals with SBM relative to their TD peers is needed in
411order to establish whether the identified differences in neural structure
412(Williams et al., 2013), and the association between that structure and
413function in the present study, result in significant impairment. Although
414individuals with SBM are able to adequately sustain their attention, they
415are impaired in the ability to successfully disengage and shift it in re-
416sponse to the environment and may also be impaired in their ability to
417exert executive control over it.
418The present studywas limited by a 3mmDTI slice thickness and the
419use of 21 directions for DTI acquisition, which are below current stan-
420dards. However, at the time the study began in 2005, these decisions
421were consistent with current scanner technology and the need to reduce
422acquisition time for young children. The output adequately reflected the
423intended pathways and the presence of significant structure–function
424associations further supports our confidence in the results. Although we
425found several significant structure–function associations, only those
426involving covert orienting were reliably significant for both single and
427bootstrap samples across all correlational estimates, suggesting that rep-
428lication of the findings in other samples iswarranted. It would be of inter-
429est for future studies to replicate tractography of tectocortical pathways in
430SBM, as well as to investigate association pathways, such as the superior
431longitudinal fasciculus, the integrity of whichmay be evenmore strongly
432related to functioning of the attention networks. Future studies should
433also further characterize the functioning of the attention networks in
434SBM in relation to TD individuals, especially that of the executive control
435network.
436Overall, neuroanatomical disruption to the orienting attention
437network in SBMappearsmore robust and a direct consequence of charac-
438teristic midbrain dysmorphology. Executive control attention network
439difficulties in SBMmay alternatively emerge from parietal cortical anom-
440alies and reduced frontal and parietal cortical–subcortical connectivity re-
441lated to the pathophysiological effects of congenital hydrocephalus.
442Uncited references
443No citationswere found for the following references: Barkovich, and
444Raybaud (2012); Miller et al. (2008).
t3:1 Table 3
t3:2 Mean values of estimates across 10,000 bootstrap samples.
t3:3 Pair of variables Pearson correlation Percentage bend correlation Skipped correlation using DGM
t3:4 Orienting–total tectal volume −0.24 −0.30 −0.28
t3:5 Orienting–total superior parietal cortex volume 0.19 0.20 0.18
t3:6 Orienting–frontal fractional anisotropy 0.05 0.02 −0.02
t3:7 Orienting–parietal fractional anisotropy −0.03 −0.01 0.01
t3:8 Orienting–frontal axial diffusivity 0.17 0.14 0.17
t3:9 Orienting–parietal axial diffusivity 0.03 0.05 0.09
t3:10 Orienting–frontal radial diffusivity 0.04 0.09 0.07
t3:11 Orienting–parietal radial diffusivity 0.04 0.05 0.07
t3:12 Conflict resolution–total tectal volume 0.01 0.05 0.04
t3:13 Conflict resolution–total superior parietal cortex volume −0.23 −0.18 −0.19
t3:14 Conflict resolution–frontal fractional anisotropy −0.02 −0.04 −0.02
t3:15 Conflict resolution–parietal fractional anisotropy −0.08 −0.11 −0.03
t3:16 Conflict resolution–frontal axial diffusivity 0.05 0.05 0.10
t3:17 Conflict resolution–parietal axial diffusivity −0.04 −0.09 −0.01
t3:18 Conflict resolution–frontal radial diffusivity 0.03 0.08 0.05
t3:19 Conflict resolution–parietal radial diffusivity 0.03 0.05 0.06
t3:20 Attentional control–total tectal volume −0.01 0.01 0.05
t3:21 Attentional control–total superior parietal cortex volume 0.11 0.10 0.10
t3:22 Attentional control–frontal fractional anisotropy 0.04 0.08 0.04
t3:23 Attentional control–parietal fractional anisotropy −0.19 −0.14 −0.19
t3:24 Attentional control–frontal axial diffusivity 0.31 0.17 0.12
t3:25 Attentional control–parietal axial diffusivity 0.27 0.04 0.05
t3:26 Attentional control–frontal radial diffusivity 0.16 0.11 0.15
t3:27 Attentional control–parietal radial diffusivity 0.35 0.20 0.18
t3:28 N=74 (relationswith orienting and conflict resolutionmeasures);N=59 (relationswith attentional control);N=73 (relationswith the superior parietal cortex); DGM,Donoho–Gasko
t3:29 median; boldfaceQ3 = statistically significant results based on 2.5 and 97.5 percentile values taken from 10,000 bootstrap samples (i.e., confidence interval excluded 0).
6 P.A. Kulesz et al. / NeuroImage: Clinical xxx (2015) xxx–xxx
Please cite this article as: Kulesz, P.A., et al., Attention in spina bifidamyelomeningocele: Relations with brain volume and integrity, NeuroImage:Clinical (2015), http://dx.doi.org/10.1016/j.nicl.2015.03.022

UNCO
RRECTED P
RO
OF
445 Acknowledgments
446 Thisworkwas supported by the EuniceKennedy ShriverNational In-
447 stitute of Child Health and Human Development grantQ6 (P01 HD35946-
448 06, “Spina Bifida: Cognitive and Neurobiological Variability”). The con-
449 tent is solely the responsibility of the authors and does not necessarily
450 represent the official views of the Eunice Kennedy Shriver National
451 Institute of Child Health and Human Development or the National Insti-
452 tutes of Health. All the authors state that they have no conflict of inter-
453 ests related to this manuscript.
454 Maureen Dennis passed away on July 15th, 2014.
455 References
456 Barkovich, A.J., Raybaud, C.R., 2012. Pediatric Neuroimaging. Wolters Kluwer Health/457 Lippincott Williams and Wilkins, Philadelphia, PA.458 Baron, I.S., 2001. Test of everyday attention for children. Child Neuropsychol. 7 (3),459 190–195. http://dx.doi.org/10.1076/chin.7.3.190.874212187475.460 Behramn, R.E., Kliegman, R.M., Jenson, B.H., 2003. Congenital anomalies of the central ner-461 vous system. In: Behramn, R.E., Kliegman, R.M., Jenson, B.H. (Eds.), Nelson Textbook462 of Pediatrics. Saunders, Philadelphia, PA, pp. 1983–1985.463 Behrens, T.E., Berg, H.J., Jbabdi, S., Rushworth, M.F., Woolrich, M.W., 2007. Probabilistic464 diffusion tractography with multiple fibre orientations: what can we gain?465 Neuroimage 34 (1), 144–155. http://dx.doi.org/10.1016/j.neuroimage.2006.09.466 01817070705.467 Budde, M.D., Kim, J.H., Liang, H.F., Schmidt, R.E., Russell, J.H., Cross, A.H., Song, S.K., 2007.468 Toward accurate diagnosis of white matter pathology using diffusion tensor imaging.469 Magn. Reson. Med. 57 (4), 688–695. http://dx.doi.org/10.1002/mrm.2120017390365.470 Colvin, A.N., Yeates, K.O., Enrile, B.G., Coury, D.L., 2003. Motor adaptation in children471 with myelomeningocele: comparison to children with ADHD and healthy472 siblings. J Int Neuropsychol Soc 9 (4), 642–652. http://dx.doi.org/10.1017/473 S135561770394004512755176.474 Dennis, M., Barnes, M.A., 2010. The cognitive phenotype of spina bifida meningomyelocele.475 Dev. Disabil. Res. Rev. 16 (1), 31–39. http://dx.doi.org/10.1002/ddrr.8920419769.476 Dennis, M., Edelstein, K., Copeland, K., Frederick, J., Francis, D.J., Hetherington, R., Blaser,477 S.E., Kramer, L.A., Drake, J.M., Brandt, M.E., Fletcher, J.M., 2005. Covert orienting to ex-478 ogenous and endogenous cues in children with spina bifida. Neuropsychologia 43479 (6), 976–987. http://dx.doi.org/10.1016/j.neuropsychologia.2004.08.01215716168.480 Dennis, M., Sinopoli, K.J., Fletcher, J.M., Schachar, R., 2008. Puppets, robots, critics, and ac-481 tors within a taxonomy of attention for developmental disorders. J Int Neuropsychol482 Soc 14 (5), 673–690. http://dx.doi.org/10.1017/S135561770808098318764966.483 Desikan, R.S., Ségonne, F., Fischl, B., Quinn, B.T., Dickerson, B.C., Blacker, D., Buckner, R.L.,484 Dale, A.M., Maguire, R.P., Hyman, B.T., Albert, M.S., Killiany, R.J., 2006. An automated485 labeling system for subdividing the human cerebral cortex on MRI scans into gyral486 based regions of interest. Neuroimage 31 (3), 968–980. http://dx.doi.org/10.1016/j.487 neuroimage.2006.01.02116530430.488 Hannay, H.J., Dennis, M., Kramer, L., Blaser, S., Fletcher, J.M., 2009. Partial agenesis of the489 corpus callosum in spina bifida meningomyelocele and potential compensatory490 mechanisms. J. Clin. Exp. Neuropsychol. 31 (2), 180–194. http://dx.doi.org/10.1080/491 1380339080220995419052950.492 Jenkinson, M., Beckmann, C.F., Behrens, T.E., Woolrich, M.W., Smith, S.M., 2012. FSL.493 Neuroimage 62 (2), 782–790. http://dx.doi.org/10.1016/j.neuroimage.2011.09.494 01521979382.495 Jones, D.K., Cercignani, M., 2010. Twenty-five pitfalls in the analysis of diffusion MRI data.496 N.M.R. Biomed. 23 (7), 803–820. http://dx.doi.org/10.1002/nbm.154320886566.497 Juranek, J., Fletcher, J.M., Hasan, K.M., Breier, J.I., Cirino, P.T., Pazo-Alvarez, P., Diaz,498 J.D., Ewing-Cobbs, L., Dennis, M., Papanicolaou, A.C., 2008. Neocortical reorgani-499 zation in spina bifida. Neuroimage 40 (4), 1516–1522. http://dx.doi.org/10.500 1016/j.neuroimage.2008.01.04318337124.501 Juranek, J., Salman, M.S., 2010. Anomalous development of brain structure and function in502 spina bifida myelomeningocele. Dev. Disabil. Res. Rev. 16 (1), 23–30. http://dx.doi.503 org/10.1002/ddrr.8820419768.
504Klein, R.M., 2004. On the control of visual orienting. In: Posner, M.I. (Ed.), Cognitive Neu-505roscience of Attention. Guilford Books, New York, NY, pp. 29–44.506Kulesz, P.A., Tian, S., Juranek, J., Fletcher, J.M., Francis, D.J., 2015. Relations between volu-507metric measures of brain structure and attentional function in spina bifida: utilization508of robust statistical approaches. Neuropsychology 29 (2), 212–225. http://dx.doi.org/50910.1037/neu000016625495830.510Manly, T., Robertson, I.H., Anderson, V., Nimmo-Smith, I., 1999. The Test of Everyday511Attention for Children: Manual. Thames Valley Test Company Limited, Bury St512Edmunds, UK.513Q7Miller, E., Widjaja, E., Blaser, S., Dennis, M., Raybaud, C., 2008. The old and the new:514supratentorial MRI findings in Chiari II malformation. Childs Nerv. Syst. 24 (5),515563–575. http://dx.doi.org/10.1007/s00381-007-0528-x18026960.516Ou, X., Snow, J.H., Byerley, A.K., Hall, J.J., Glasier, C.M., 2013. Decreased activation and in-517creased lateralization in brain functioning for selective attention and response inhibi-518tion in adolescents with spina bifida. Child Neuropsychol. 19 (1), 23–36. http://dx.519doi.org/10.1080/09297049.2011.63975422145814.520Petersen, S.E., Posner, M.I., 2012. The attention system of the human brain: 20 years after.521Annu. Rev. Neurosci. 35, 73–89. http://dx.doi.org/10.1146/annurev-neuro-062111-52215052522524787.523Posner, M.I., 1980. Orienting of attention. Q. J. Exp. Psychol. 32 (1), 3–25. http://dx.doi.524org/10.1080/003355580082482317367577.525Posner, M.I., 2012. Imaging attention networks. Neuroimage 61 (2), 450–456. http://dx.526doi.org/10.1016/j.neuroimage.2011.12.04022227132.527Posner, M.I., Petersen, S.E., 1990. The attention system of the human brain. Annu. Rev.528Neurosci. 13, 25–42. http://dx.doi.org/10.1146/annurev.ne.13.030190.0003252183676.529R Development Core Team, 2008. R:A Language and Environment for Statistical Comput-530ing. R Foundation for Statistical Computing, Vienna, Austria.531Rafal, R.D., Posner, M.I., Friedman, J.H., Inhoff, A.W., Bernstein, E., 1988. Orienting of visual532attention in progressive supranuclear palsy. Brain 111 (2), 267–280. http://dx.doi.533org/10.1093/brain/111.2.2673378136.534Rueda, M.R., Fan, J., McCandliss, B.D., Halparin, J.D., Gruber, D.B., Lercari, L.P., Posner, M.I.,5352004. Development of attentional networks in childhood. Neuropsychologia 42 (8),5361029–1040. http://dx.doi.org/10.1016/j.neuropsychologia.2003.12.01215093142.537Song, S.K., Sun, S.W., Ju, W.K., Lin, S.J., Cross, A.H., Neufeld, A.H., 2003. Diffusion tensor im-538aging detects and differentiates axon and myelin degeneration in mouse optic nerve539after retinal ischemia. Neuroimage 20 (3), 1714–1722. http://dx.doi.org/10.1016/j.540neuroimage.2003.07.00514642481.541Swartwout, M.D., Cirino, P.T., Hampson, A.W., Fletcher, J.M., Brandt, M.E., Dennis, M., 2008.542Sustained attention in children with two etiologies of early hydrocephalus.543Neuropsychol. 22 (6), 765–775. http://dx.doi.org/10.1037/a001337318999350.544Taylor, H.B., Landry, S.H., Barnes, M., Swank, P., Cohen, L.B., Fletcher, J., 2010. Early informa-545tion processing among infants with and without spina bifida. Infant Behav. Dev. 33 (4),546365–372. http://dx.doi.org/10.1016/j.infbeh.2010.03.00520488543.547Treble, A., Juranek, J., Stuebing, K.K., Dennis, M., Fletcher, J.M., 2013. Functional signifi-548cance of atypical cortical organization in spina bifida myelomeningocele: relations549of cortical thickness and gyrification with IQ and fine motor dexterity. Cereb. Cortex55023 (10), 2357–2369. http://dx.doi.org/10.1093/cercor/bhs22622875857.551Treble-Barna, A., Kulesz, P.A., Dennis, M., Fletcher, J.M., 2014. Covert orienting in three552etiologies of congenital hydrocephalus: the effect of midbrain and posterior fossa553dysmorphology. J. Int. Neuropsychol. Soc. 20 (3), 268–277. http://dx.doi.org/10.5541017/S135561771300150124528548.555Wilcox, R.R., 2003. Inferences based on multiple skipped correlations. Computational556Statistics & Data Analysis 44 (1–2), 223–236. http://dx.doi.org/10.1016/S0167-5579473(03)00043-4.558Williams, V.J., Juranek, J., Stuebing, K., Cirino, P.T., Dennis, M., Fletcher, J.M., 2013. Exami-559nation of frontal and parietal tectocortical attention pathways in spina bifida560meningomyelocele using probabilistic diffusion tractography. Brain Connectivity 3561(5), 512–522. http://dx.doi.org/10.1089/brain.2013.017123937233.562Zou, K.H., Warfield, S.K., Bharatha, A., Tempany, C.M., Kaus, M.R., Haker, S.J., Wells, W.M.,563Jolesz, F.A., Kikinis, R., 2004. Statistical validation of image segmentation quality564based on a spatial overlap index. Acad. Radiol. 11 (2), 178–189. http://dx.doi.org/56510.1016/S1076-6332(03)00671-814974593.
566
7P.A. Kulesz et al. / NeuroImage: Clinical xxx (2015) xxx–xxx
Please cite this article as: Kulesz, P.A., et al., Attention in spina bifidamyelomeningocele: Relations with brain volume and integrity, NeuroImage:Clinical (2015), http://dx.doi.org/10.1016/j.nicl.2015.03.022


