Embed Size (px)
Citation preview
Journal of Educational Psychology1981, Vol. 73, No. 3, 393-403
Copyright 1981 by the American Psychological Association, Inc.0022-0663/81/7303-0393$00.7S
Attributions, Affect, and Expectations:A Test of Weiner's Three-Dimensional Model
Donelson R. Forsyth and James H. McMillanVirginia Commonwealth University
In a test of predictions derived from Weiner's reformulated three-dimensionalmodel of attributions, college students who had performed well or poorly onan examination reported the locus, stability, and controllability of the causesof their performance, their affective reactions, and their expectations. As isconsistent with Weiner's model, more positive affective reactions were re-ported by students who (a) felt they controlled the causes of their perfor-mance, (b) attributed success to internal factors or failure to external factors,and (c) attributed their outcomes to factors that were stable, controllable, andinternal. Expectations, however, were related more to perceived locus ofcause and controllability than to stability. The implications of attributionsand perceived control in educational settings are discussed in relation tolearned helplessness, expectations, and reactions to failure.
Weiner's approach to classroom motiva-tion and experience (Weiner, 1972, 1979,1980) emphasizes the importance of causalattributions in explaining the consequencesof academic failure and success. Accordingto this perspective, achievement striving,affective reactions, and expectations con-cerning future outcomes are determined, inpart, by students' attributional conclusionsconcerning their classroom experiences.Following performance on an academic task,students react affectively in a generallypositive or negative manner, formulatecausal attributions to explain their perfor-mance, and then experience further affectand expectancy changes dependent on thenature of these attributions. Although asubstantial amount of laboratory researchsuggests such linkages exist (Weiner, 1979),relatively few studies have examined Wein-er's three-dimensional model in the contextof actual academic tasks. The present studyexamined Weiner's proposed model of edu-cational attributions by assessing the rela-tionship between the attributions, affect,and expectations of college students fol-lowing a course examination.
Thanks are extended to Bernard Weiner, IreneFrieze, and several anonymous reviewers for theircomments on an earlier draft of this article.
Requests for reprints should be sent to Donelson R.Forsyth, Department of Psychology, Virginia Com-monwealth University, 810 West Franklin Street,Richmond, Virginia 23284.
Dimensions of Attributions
In describing the nature of attributionsthat are relevant to educational settings,Weiner (1979) has advanced a three-di-mensional typology of attributions. Thefirst of the three dimensions, locus of cau-sality, was first introduced by Heider (1958),who suggested that the attributions peopleoffer as explanations for behaviors andevents emphasize factors that originatewithin the person or arise from environ-mental sources. As examples of possiblecausal factors, Heider mentioned ability,effort, task difficulty, and luck and pointedout that the first two causes are internalfactors, whereas the second two causes areexternal factors. Weiner, Russell, andLerman (1978, 1979) later found that thelocus of causality dimension is closely relatedto affective reactions that follow test feed-back. Individuals who attribute their suc-cess to external factors report feelings ofgratitude, surprise, and thankfulness,whereas those who emphasize internal fac-tors report pride, confidence, and satisfac-tion. Failing students, on the other hand,experience guilt, regret, and aimlessnesswhen they blame themselves, and anger,surprise, and hostility when they externalizetheir failure.
Just as luck is an external factor andability is an internal one, luck also fluctuatesmore than ability, suggesting that a second
393
;!94 DONELSON R. FORSYTH AND JAMES H. MCMILLAN
dimension—stability of causes—should beconsidered when describing attributions(e.g., Frieze & Weiner, 1971; Werner, 1972;Weiner et al., 1971). Although Heider didnot emphasize the stability dimension asmuch as the locus of cause dimension, sub-sequent studies of changes in expectationsafter success and failure indicated that theexpectancy shifts which follow feedback areclosely linked to stability (e.g., Feather £Simon, 1971; McMahan, 1973; Weiner et al.,1971). For example, in one study (Weiner,Nierenberg, & Goldstein, 1976) subjects whobelieved they had done well on a task wereasked to report their expectations con-cerning future performances as well as esti-mate the cause of their success. Althoughpositive increases in expectations were notrelated to the locus of the cause, expectancyincrements were associated with the per-ceived stability of the causal factor. Whensubjects attributed their success to suchfactors as ability or the nature of the task,their expectations for success increased,whereas subjects who attributed their suc-cess to luck or effort reported less positiveexpectancies.
Research conducted within the frameworkof self-worth theory (Covington & Beery,1976; Covington & Omelich, 1979) lendsfurther support to the link between self-worth and internal-external/stable-unsta-ble attributions. According to this per-spective, failure is more likely to lead toshame, depressed expectations, and loweredself-worth when it is ability linked ratherthan effort linked. For example, in onestudy conducted in a classroom setting,Covington and Omelich found that shamewas correlated with both effort and abilityattributions after a failing performance.When the students could ascribe their failureto low effort, they were insulated from theesteem-damaging consequences of the fail-ure and hence reported less shame. If,however, they felt their failure had beencaused by low ability, they reported greaterlevels of personal shame. These researchersconcluded that reactions to personal per-formance may be influenced by attributionsconcerning causes and add that these causaljudgments may be more self-protective thanstrictly rational.
The Third Dimension: Controllability
Weiner's original model of attributionconsiders locus and stability to be the twomajor dimensions underlying attributions,but the logical distinction between suchcauses as mood and effort soon necessitateda revision; although mood and effort are bothinternal/unstable causes, mood is consider-ably less controllable than effort. In orderto incorporate this difference in his analysisof attributions, Weiner has recently pro-posed that controllability is the third di-mension of attributions (Weiner, 1.979,1980).
Although Weiner based his decision toinclude the controllability dimension onpurely logical grounds, research in a widevariety of areas suggests that controllabilitydramatically influences reactions to out-comes. A host of concepts emphasize theimportance of personal control (deCharms,1968; Forsyth, 1980; White, 1959), and rele-vant research indicates that loss of controlis associated with depression (Seligman,1975), motivational deficits (Weiner, 1979),deterioration of physical health (Rodin &Langer, 1977), inadequate coping followinga severe accident (Bulman & Wortman,1977), and stress-related illnesses (Glass,1977). Indeed, both Wortman (1976;Wortman & Dintzer, 1978) and Seligman(1975; Abramson, Seligman, & Teasdale,1978) emphasize controllability in theirtheories of learned helplessness.
Postulating a third dimension, however,necessitates the reinterpretation of earlierfindings. Although previous research at-tested to the importance of locus of causalityand stability, these dimensions may havebeen confounded with control. To provideseveral examples: Dweck (1975) found thathelpless children trained to attribute mathperformance to effort subsequently im-proved their performance, but was this effectobtained because effort is unstable or be-cause effort is controllable? Similarly,Covington & Omelich (1979) report that ef-fort attributions after failure are linked withdecreases in shame, but does this relation-ship stem from the instability of effort or thecontrollability of effort? Lastly, Weiner,Russell, and Lerman (1978) found that fol-
ATTRIBUTIONS, AFFECT, AND EXPECTATIONS 395
lowing failure, ability attributions elicitedfeelings of incompetence, whereas effort at-tributions elicited feelings of shame, but isthis difference due to the fact that ability isa stable cause and effort is an unstable causeor the controllability of effort and the un-controllability of ability? Clearly all threedimensions must be investigated simulta-neously and unambiguously if the relation-ship between attributions, expectations, andaffect is to be adequately understood.
The Current Investigation
In the present study students in a collegecourse who had just learned they had donewell or done poorly on a major examinationwere asked to evaluate the cause of the out-come, describe their affective reactions, andestimate their expectations about future testperformances. The manner in which thevariables of interest were assessed and thesubsequent analyses performed on thesevariables were guided by (a) the need to ac-curately and unambiguously measure allthree dimensions that Weiner incorporatesin his attributional model and (b) predic-tions of interactions between the three at-tributional dimensions and outcome.
Measurement method. Attributionswere assessed by focusing on causal dimen-sions, rather than unitary causes, to cir-cumvent several problems inherent in theunitary cause assessment procedure. Asprevious researchers have noted (e.g., Elig& Frieze, 1979; Abramson, Seligman, &Teasdale, 1978), procedures that assess at-tributional processes by asking respondentsto rate the causal importance of specificcauses (e.g., luck, ability) possess two limi-tations. First, subjects' responses are lim-ited to those causes the researcher antici-pates and includes on the assessment ques-tionnaire. The bulk of the research utilizesthe four-cause list—ability, effort, task dif-ficulty, and luck—but other causes (e.g.,mood, study habits, the moon, astrologicalbirthsign) that respondents feel are impor-tant factors may be left unassessed. Second,the link between a specific cause and theconceptual attributional dimension issometimes unclear. Although most of thetheoretical emphasis is on dimensions of
attributions rather than specific causes(Weiner, 1979), using specific cause ratingsto make inferences about dimensions isproblematic, since causes can fall at varyingintervals along the dimensional continua,depending on the situation and the respon-dents' attributional perspectives. Effort, forexample, is perceived to be a stable factorwhen it refers to the typical level of motiva-tion of the individual but at other times canbe transient when it refers to energy ex-pended in seeking success on a particulartask (Covington, Spratt, & Omelich, 1980;Elig & Frieze, 1975; Ostrove, 1978). Thus,when a respondent reports an attribution toeffort, the researcher cannot be sure that astable or unstable causal factor is being em-phasized.
To circumvent the methodological dif-ficulties with unitary cause scales, the cur-rent investigation assessed attributionaldimensions using a technique developed bySeligman, Abramson, Semmel, and vonBaeyer (1979). In this technique, individ-uals rate the influence of causes in terms ofthe conceptual dimensions themselves. Forexample, rather than assuming that an at-tribution to ability reflects an emphasis oninternal rather than external factors, theseresearchers ask participants to indicate theextent to which an outcome was caused by"something about you or something aboutother people or circumstances" (Seligman etal., 1979, p. 243). Initial findings indicatethat the dimensional bipolar scales are ac-curate measures of conceptually meaningfuldimensions and yield results that are com-parable to those of other assessment tech-niques (Seligman et al., 1979; Weiner, 1980).Furthermore, multidimensional scaling andfactor analytic studies of the actual dimen-sions underlying unitary causal judgmentsshow that bipolar dimensional ratings arehighly correlated with the cognitive dimen-sions that actually underlie respondents'unitary cause judgments (Meyer, 1980;Passer, Kelley, & Michela, 1978).
Predictions. Given the persistent find-ings in many areas attesting to the dramaticimpact of perceived control, it was hypoth-esized that people who attributed theiroutcome to controllable factors would ex-perience more positive affective reactions
396 DONELSON R. FORSYTH AND JAMES H. MCMILLAN
than individuals who feel they cannot con-trol the causes of their performance. Inaddition, although successful studentsshould feel better—in terms of affect—thanfailing students (e.g., Bailey, Helm, &Gladstone, 1975; McMillan & Sprat, Note 1),the locus of attributed cause should moder-ate the magnitude of this effect. After suc-cess, internal attributions should be associ-ated with more positive affective reactions,whereas negative affective reactions shouldbe related to internal attributions forfailure.
Predictions concerning expectancy shiftsare less clear-cut. Although such shifts aretypically associated with the stability di-mension, the more recently suggested con-trollability factor may again be the moreinfluential factor. The student who fails atest and believes the cause lies in some ex-ternal, unstable factor—such as the teacher'sbad mood—may continue to expect failurebecause mood, though unstable, is difficultto control. Yet, if students think they cansomehow control their teacher's mood, thenexpectations may become more positive; inother words, the stability of attributed causeis less important when compared to thecontrollability of the attributed cause.Therefore, all three variables—controlla-bility, performance, and locus of causal-ity—will, in an interactive fashion, be relatedto expectations. After failure, individualswho attribute their outcomes to external,uncontrollable factors should be the mostnegative in their expectations. Those whosucceed and believe internal, controllablefactors were the cause of their successshould, in contrast, be the most positive intheir expectations of future success.
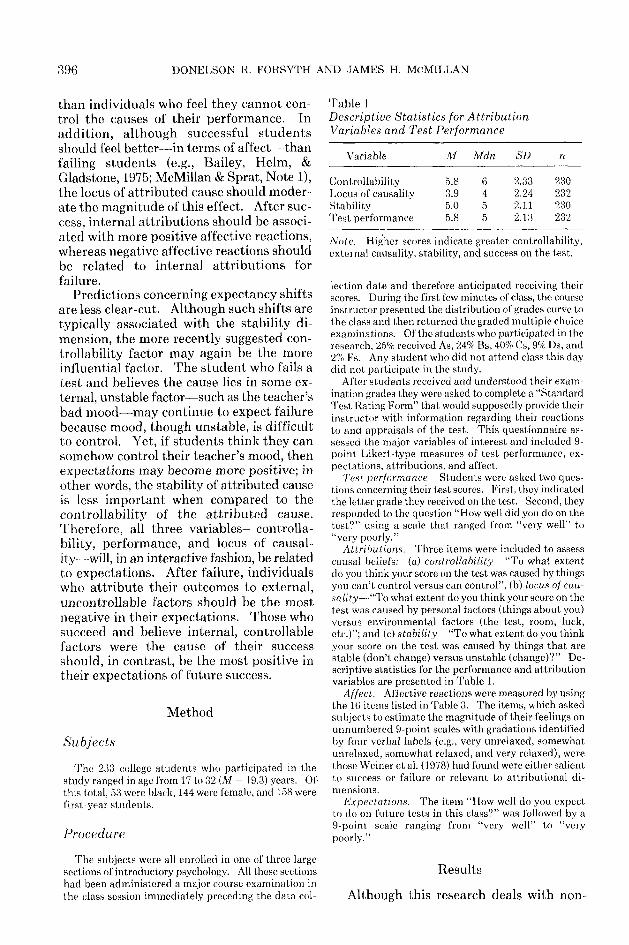
Table 1Descriptive Statistics for AttributionVariables and Test Performance
Method
Subjects
The 233 college students who participated in thestudy ranged in age from 17 to 32 (M = 19.3) years. Ofthis total, 53 were black, 144 were female, and 158 werefirst-year students.
Procedure
The subjects were all enrolled in one of three largesections of introductory psychology. AH these sectionshad been administered a major course examination inthe class session immediately preceding the data col-
Variable M Mdn SO
ControllabilityLocus of causalityStabilityTest performance
5.83.95.05.8
6455
2.332.242.112.13
230232230232
Note. Higher scores indicate greater controllability,external causality, stability, and success on the test.
lection date and therefore anticipated receiving theirscores. During the first few minutes of class, the courseinstructor presented the distribution of grades curve tothe class and then returned the graded multiple choiceexaminations. Of the students who participated in theresearch, 25% received As, 24% Bs, 40% Cs, 9% Ds, and2% Fs. Any student who did not attend class this daydid not participate in the study.
After students received and understood their exam-ination grades they were asked to complete a "StandardTest Rating Form" that would supposedly provide theirinstructor with information regarding their reactionsto and appraisals of the test. This questionnaire as-sessed the major variables of interest and included 9-point Likert-type measures of test performance, ex-pectations, attributions, and affect.
Test performance. Students were asked two ques-tions concerning their test scores. First, they indicatedthe letter grade they received on the test. Second, theyresponded to the question "How well did you do on thelest?" using a scale that ranged from "very well" to"very poorly."
Attributions. Three items were included to assesscausal beliefs: (a) controllability—"To what extentdo you think your score on the test was caused by thingsyou can't control versus can control"; (b) locus of cau-sality—"To what extent do you think your score on thetest was caused by personal factors (things about you)versus environmental factors (the test, room, luck,etc.)"; and (c) stability—"To what extent do you thinkyour score on the tost was caused by things that arestable (don't change) versus unstable (change)?" De-scriptive statistics for the performance and attributionvariables are presented in Table 1.
Affect. Affective reactions were measured by usingthe 16 items listed in Table 3. The items, which askedsubjects to estimate the magnitude of their feelings onunnumbered 9-point scales with gradations identifiedby four verbal labels (e.g., very unrelaxed, somewhatunrelaxed, somewhat relaxed, and very relaxed), werethose Weiner et al. (1978) had found were either salientto success or failure or relevant to attributional di-mensions.
Expectations. The item "How well do you expectto do on future tests in this class?" was followed by a9-point scale ranging from "very well" to "verypoorly."
Results
Although this research deals with non-
ATTRIBUTIONS, AFFECT, AND EXPECTATIONS 397
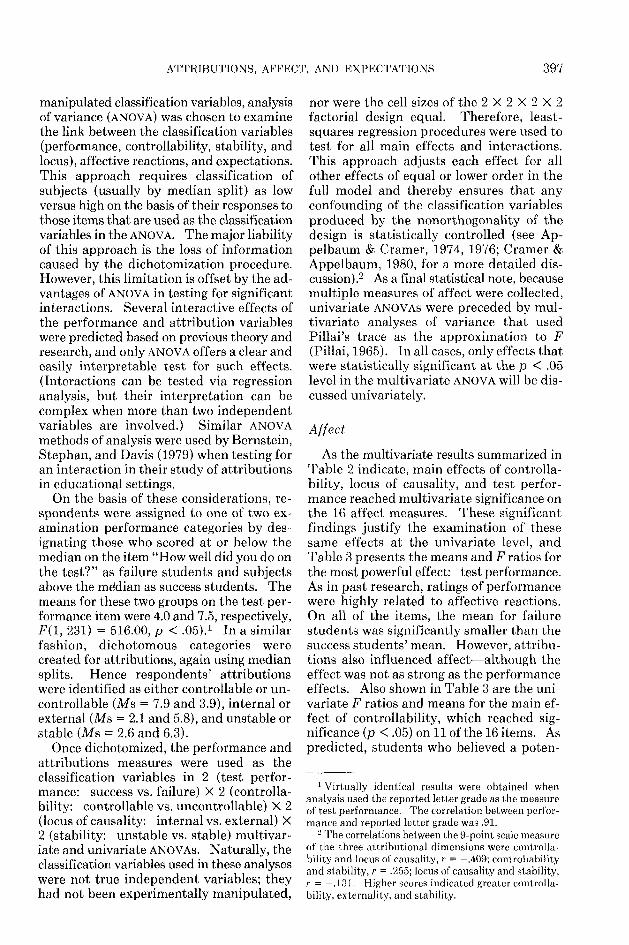
manipulated classification variables, analysisof variance (ANOVA) was chosen to examinethe link between the classification variables(performance, controllability, stability, andlocus), affective reactions, and expectations.This approach requires classification ofsubjects (usually by median split) as lowversus high on the basis of their responses tothose items that are used as the classificationvariables in the ANOVA. The major liabilityof this approach is the loss of informationcaused by the dichotomization procedure.However, this limitation is offset by the ad-vantages of ANOVA in testing for significantinteractions. Several interactive effects ofthe performance and attribution variableswere predicted based on previous theory andresearch, and only ANOVA offers a clear andeasily interpretable test for such effects.(Interactions can be tested via regressionanalysis, but their interpretation can becomplex when more than two independentvariables are involved.) Similar ANOVAmethods of analysis were used by Bernstein,Stephan, and Davis (1979) when testing foran interaction in their study of attributionsin educational settings.
On the basis of these considerations, re-spondents were assigned to one of two ex-amination performance categories by des-ignating those who scored at or below themedian on the item "How well did you do onthe test?" as failure students and subjectsabove the median as success students. Themeans for these two groups on the test per-formance item were 4.0 and 7.5, respectively,F(l, 231) = 516.00, p < .05).: In a similarfashion, dichotomous categories werecreated for attributions, again using mediansplits. Hence respondents' attributionswere identified as either controllable or un-controllable (Ms = 7.9 and 3.9), internal orexternal (Ms = 2.1 and 5.8), and unstable orstable (Ms = 2.6 and 6.3).
Once dichotomized, the performance andattributions measures were used as theclassification variables in 2 (test perfor-mance: success vs. failure) X 2 (controlla-bility: controllable vs. uncontrollable) X 2(locus of causality: internal vs. external) X2 (stability: unstable vs. stable) multivar-iate and univariate ANOVAs. Naturally, theclassification variables used in these analyseswere not true independent variables; theyhad not been experimentally manipulated,
nor were the cell sizes of the 2 X 2 X 2 X 2factorial design equal. Therefore, least-squares regression procedures were used totest for all main effects and interactions.This approach adjusts each effect for allother effects of equal or lower order in thefull model and thereby ensures that anyconfounding of the classification variablesproduced by the nonorthogonality of thedesign is statistically controlled (see Ap-pelbaum & Cramer, 1974, 1976; Cramer &Appelbaum, 1980, for a more detailed dis-cussion).2 As a final statistical note, becausemultiple measures of affect were collected,univariate ANOVAs were preceded by mul-tivariate analyses of variance that usedPillai's trace as the approximation to F(Pillai, 1965). In all cases, only effects thatwere statistically significant at the p < .05level in the multivariate ANOVA will be dis-cussed univariately.
Affect
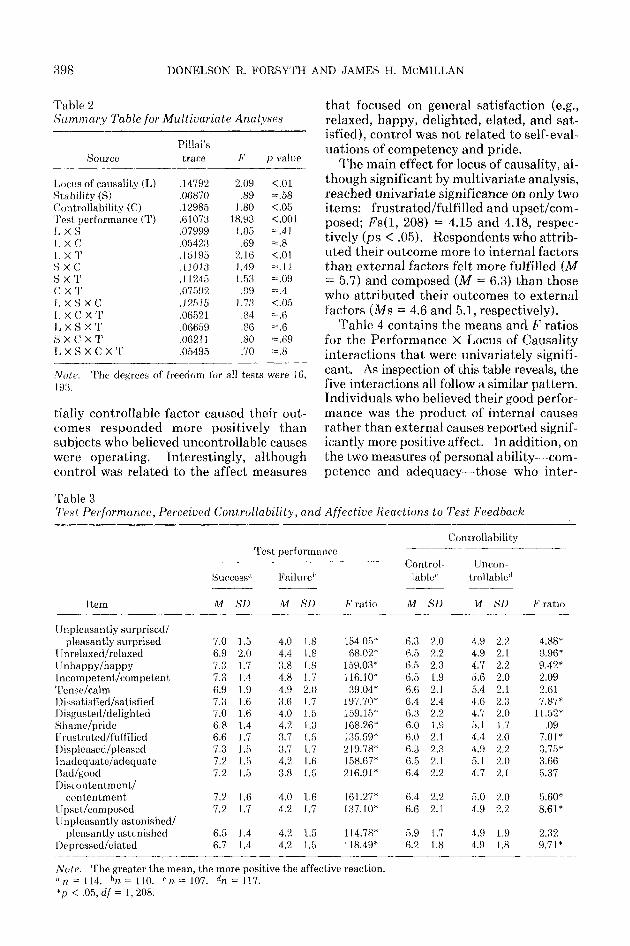
As the multivariate results summarized inTable 2 indicate, main effects of controlla-bility, locus of causality, and test perfor-mance reached multivariate significance onthe 16 affect measures. These significantfindings justify the examination of thesesame effects at the univariate level, andTable 3 presents the means and F ratios forthe most powerful effect: test performance.As in past research, ratings of performancewere highly related to affective reactions.On all of the items, the mean for failurestudents was significantly smaller than thesuccess students' mean. However, attribu-tions also influenced affect—although theeffect was not as strong as the performanceeffects. Also shown in Table 3 are the uni-variate F ratios and means for the main ef-fect of controllability, which reached sig-nificance (p < .05) on 11 of the 16 items. Aspredicted, students who believed a poten-
1 Virtually identical results were obtained whenanalysis used the reported letter grade as the measureof test performance. The correlation between perfor-mance and reported letter grade was .91.
2 The correlations between the 9-point scale measureof the three attributional dimensions were controlla-bility and locus of causality, r = —.409; controllabilityand stability, r = .255; locus of causality and stability,r = -.131. Higher scores indicated greater controlla-bility, externality, and stability.
398 DONELSON R. FORSYTH AND JAMES H. MCMILLAN
Table 2Summary Table for Multiuariate Analyses
Source
Locus of causality (L)Stability (S)Controllability (C)Test performance (T)L X SL X CI , X TS X CS XTC X TL X S X CI, X C X TT, X S X TS X C X TL X S X C X T
Pillai'strace
.14792
.06870
.12985
.61073
.07999
.05423
.15195
. L I 013
.11245
.07592
.12515
.06521
.06659
.06211
.05495
F
2.09.89
1.8018.93
1.05.69
2.161.491.53.99
1.73.84.86.80.70
p value
<.01= .58<.05<.001= .41= .8<.01= .li= .09= .4<.05= .6= .6= .69= .8
The degrees of freedom for all tests were 16,
tially controllable factor caused their out-comes responded more positively thansubjects who believed uncontrollable causeswere operating. Interestingly, althoughcontrol was related to the affect measures
that focused on general satisfaction (e.g.,relaxed, happy, delighted, elated, and sat-isfied), control was not related to self-eval-uations of competency and pride.
The main effect for locus of causality, al-though significant by multivariate analysis,reached univariate significance on only twoitems: frustrated/fulfilled and upset/com-posed; Fs(l, 208) = 4.15 and 4.18, respec-tively (ps < .05). Respondents who attrib-uted their outcome more to internal factorsthan external factors felt more fulfilled (M= 5.7) and composed (M = 6.3) than thosewho attributed their outcomes to externalfactors (Ms = 4.6 and 5.1, respectively).
Table 4 contains the means and F ratiosfor the Performance X Locus of Causalityinteractions that were univariately signifi-cant. As inspection of this table reveals, thefive interactions all follow a similar pattern.Individuals who believed their good perfor-mance was the product of internal causesrather than external causes reported signif-icantly more positive affect. In addition, onthe two measures pf personal ability—com-petence and adequacy—those who inter-
Table 3Test Performance, Perceived Controllability, and Affective Reactions to Test Feedback
ControllabilityIt
Success"
Item
Unpleasantly surprised/pleasantly surprised
Unrelaxed/relaxedUnhappy/happy1 ncompetent/competentTense/calmDissatisfied/satisfiedDisgusted/delightedShame/prideFrustrated/fulfilledDispleased/pleasedInadequate/adequateBad/goodDiscontentment/
contentmentU pset/composedUnpleasantly astonished/
pleasantly astonishedDepressed/elated
M
7.06.97.37.36.97.37.06.86.67.37.27.2
7.27.2
6.56.7
SD
1.52.01.71.41.91.61.61.41.71.51.51.5
1.61.7
1.41.4
!St pertormaru;e
Failure'1
M
4.04.43.84.84.93.64.04.23.73.74.23.8
4.04.2
4.24.2
SD
1.81.81.81.72.01.71.51.31.51.71.61.5
1.61.7
1.51.5
F ratio
154.05*68.02*
159.03*116.10*39.04*
197.70*159.15*168.26*135.59*219.78*158.67*216.91*
161.27*137.10*
114.78*118.49*
Control-lable1'
M
6.36.56.56.56.66.46.36.06.06.36.56.4
6.46.6
5.96.2
SD
2.02.22.31.92.12.42.21.92.12.32.12.2
2.22.1
1.71.8
Uncon-trollable'1
M
4.94.94.75.65.44.64.75.14.44.95.14.7
5.04.9
4.94.9
SD
2.22.12.22.02.12.32.01.72.02.22.02.1
2.02.2
1.91.8
F ratio
4.88*8.96*9.42*2.092.617.87*
11.52*.09
7.01*3.75*3.665.37
5.60*8.61*
2.329.71*
Note. The greater the mean, the more positive the affective reaction.nn = lU. hn = 110. < 'n = 107. dn = 117.*p < .05, df = 1,208.
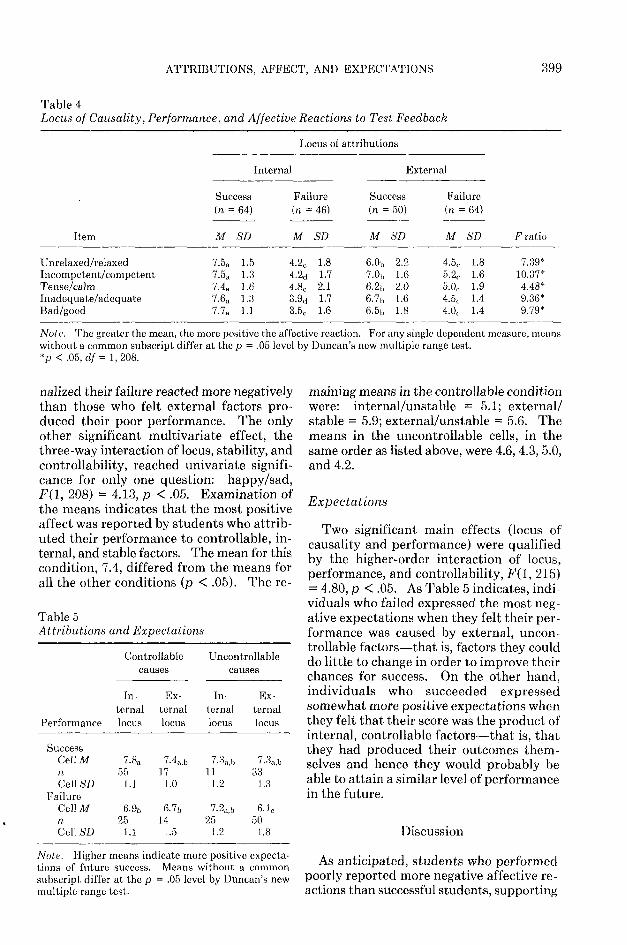
ATTRIBUTIONS, AFFECT, AND EXPECTATIONS 399
Table 4Locus of Causality, Performance, and Affective Reactions to Test Feedback
Locus of attributions
Item
Internal External
Success(n = 64)
M SD
Failure(n = 46)
M SD
Success(n = 50)
M SD
Failure(n = 64)
M SD F ratio
Unrelaxed/relaxedIncompetent/competentTense/calmInadequate/adequateBad/good
7.5a
7.5a
7.4a
V.6a
7.7a
1.51.31.61.31.1
4.2C
4.2d
4.8C
3.9d3.5C
1.81.72.11.71.6
6.0b
7.0,,6.2b
6.7b
6.5i,
2.21.62.01.61.8
4.5t.5.20
5.0C
4.5C
4.0C
1.81.61.91.41.4
7.39*10.37*4.48*9.36*9.79*
Note. The greater the mean, the more positive the affective reaction. For any single dependent measure, meanswithout a common subscript differ at the p = .05 level by Duncan's new multiple range test.*p < .05, d f = \ , 208.
nalized their failure reacted more negativelythan those who felt external factors pro-duced their poor performance. The onlyother significant multivariate effect, thethree-way interaction of locus, stability, andcontrollability, reached univariate signifi-cance for only one question: happy/sad,F(l, 208) = 4.13, p < .05. Examination ofthe means indicates that the most positiveaffect was reported by students who attrib-uted their performance to controllable, in-ternal, and stable factors. The mean for thiscondition, 7.4, differed from the means forall the other conditions (p < .05). The re-
Table 5Attributions and Expectations
Controllablecauses
Performance
SuccessCellMnCell SD
FailureCellMnCell SD
In-ternallocus
7.8a
551.1
6.9b25
1.1
Ex-ternallocus
7.4a,b17
1.0
6.7b
141.5
Uncontrollablecauses
In-ternallocus
7.3a,b
111.2
7.2a,b25
1.2
Ex-ternallocus
7.3a,b33
1.3
6.1C
501.8
Note. Higher means indicate more positive expecta-tions of future success. Means without a commonsubscript differ at the p = .05 level by Duncan's newmultiple range test.
maining means in the controllable conditionwere: internal/unstable = 5.1; external/stable = 5.9; external/unstable = 5.6. Themeans in the uncontrollable cells, in thesame order as listed above, were 4.6, 4,3, 5.0,and 4.2.
Expectations
Two significant main effects (locus ofcausality and performance) were qualifiedby the higher-order interaction of locus,performance, and controllability, .F(l, 215)= 4.80, p < .05. As Table 5 indicates, indi-viduals who failed expressed the most neg-ative expectations when they felt their per-formance was caused by external, uncon-trollable factors—that is, factors they coulddo little to change in order to improve theirchances for success. On the other hand,individuals who succeeded expressedsomewhat more positive expectations whenthey felt that their score was the product ofinternal, controllable factors—that is, thatthey had produced their outcomes them-selves and hence they would probably beable to attain a similar level of performancein the future.
Discussion
As anticipated, students who performedpoorly reported more negative affective re-actions than successful students, supporting
400 DONELSON U. FORSYTH AND JAMES H. MCMILLAN
Weiner's concept of outcome-dependentaffects. However, other findings verified theexistence of an attribution -affect link. Asis consistent with Weiner et al.'s findings(1978, 1979), individuals who attributedsuccess to internal personal factors felt morerelaxed, competent, calm, adequate, andgood, compared with students who attrib-uted this success to external factors. Inaddition, a subset of these affects (compe-tency and adequacy) revealed that studentswho externalized failure reported morepositive levels of affect than failure studentswho internalized the failure. Lastly, stu-dents who felt that internal, controllable,and stable factors produced their examina-tion score reported more happiness than allother attributors.
These findings complement and supporta self-worth explanation of the affect-attribution link in educational settings(Covington & Beery, 1976; Covington &Omelich, 1979). According to self-worththeory, the student's sense of personal worthand value is closely tied to his or her perfor-mance in the classroom. Because of thevalue placed on success and the tendency touse failure as an indicant of inability andincompetence, students react at an affectivelevel when they receive feedback aboutcourse performance. However, attributionsabout the failure or success become impor-tant because they provide the means throughwhich students can insulate themselves fromthe negative implications of the performanceor take full advantage of examination in-formation that may have a positive impact.For example, Covington and Omelich (1979)recently found that students who learn theyhave failed an exam report greater shamewhen they believe they tried hard on the testthan when they believe they tried very little.In addition, Covington, Spratt, and Omelich(1980) report that failure after high effortcreates feelings of inability and reducedsatisfaction relative to failure after expend-ing little effort. Apparently, students' at-tributions work as a self-defense against theimplications of poor performance, as ifarguing "1 should not be derogated for myfailure because I didn't try very hard."Similarly, students in the present investi-gation who failed and stressed the causal
impact of external factors reported greatercompetence and adequacy than studentswho accepted the information as an indicatorof personal worth. Furthermore, studentswho succeeded and emphasized internalfactors rated themselves more positivelythan successful students who externalizedtheir success, as though arguing "I should bepraised for my success because I am per-sonally responsible for it."
Although the findings of this investigationare generally compatible with Weiner'sprevious conclusions, the strong and con-sistent relationship between controllabilityand affect suggests that this dimension maybe more critical, attributionally speaking, inan educational setting than Weiner's originalmodel suggested. In this study the affectivereactions of students who felt their perfor-mance was caused by factors they couldcontrol—such as personal effort and amountof time devoted to studying—were morepositive (e.g., satisfied, happy, delighted,fulfilled) than the reactions of students whobelieved they did not control the cause oftheir outcome. This overall effect of con-trollability, which was unqualified by per-formance level or the other two attributionaldimensions, supports Seligman's work in-vestigating sources of learned helplessness(e.g., Abramson, Seligman, & Teasdale, 1978;Seligman, 1975). Even students who didwell on the test but nonetheless believedthey could not control their outcomes re-ported less positive affect, suggesting thatperceived noncontingency—and not justfailure or the loss of reinforcement—is as-sociated with depression and loss ofachievement motivation.
This conclusion is further substantiatedby the link between attributions and stu-dents' expectations concerning their futureperformances. Although most subjects werequite optimistic about their expected futuretest grades, a failing grade was significantlyrelated to lower expectations when studentsbelieved their score was produced by envi-ronmental factors beyond their control (e.g.,low quality of teaching, unfair testing pro-cedures, time constraint, miscellaneousoutside pressures, etc.). In contrast, themost positive expectations were expressedby students who felt that they had done well
ATTRIBUTIONS, AFFECT, AND EXPECTATIONS 401
on the test because of the influence of in-ternal, controllable factors (e.g., effort, caretaken in reading the test questions, studymethods, persistence in pursuing under-standing, etc.).
This finding stands in contrast to a widevariety of research examining the link be-tween stability of casual attributions andchanging expectations (e.g., Valle & Frieze,1976; Weiner et al, 1976), but this diver-gence may stem from several possible fac-tors. For example, much of the support forthe importance of the stability dimension inthe attribution process comes from researchconducted in laboratory settings involvingexperimental tasks. Although the labora-tory task may be of immediate interest tosubjects, performance quality is typically nottied to any long-range consequences. Infact, expectations advanced by subjects insuch situations are, in general, formulated inanswer to the experimenter's queries, sinceit is unlikely subjects consider facing a sim-ilar task again in the future.
In an educational setting, on the otherhand, students are assumed to be workingtoward the goal of successful course perfor-mance. Those students who find they arefailing must critically examine the causes ofthis outcome if they wish to improve theirgrade, and successful students must under-stand the cause of their good score if theywish to maintain this level of performance.Although possible causal candidates mayvary in terms of stability, the students in theclassroom may be more concerned with theircontrollability. When outcomes are pro-duced by factors that can be controlled,failure students can assure themselves thatthey will do better next time, and successfulstudents can assume that good scores willoccur again. Uncontrollable factors, how-ever, in conjunction with locus of causality,may be cause for dismay.
Other research conducted in academicsettings also suggests that the tie betweenexpectations, affect, and the stability di-mension is not as strong as the laboratoryfindings imply (e.g., Arkin & Maruyama,1979; Bernstein, Stephan, & Davis, 1979;Covington & Omelich, 1979), but none ofthese studies considered the impact of con-trollability on affect and expectations.
Further, in most research, attributional di-mensions are only indirectly assessed bygeneralizing from specific causes by assum-ing that the dimensions suggested by theoryare reflected in the causes. For example, ifan individual attributes an outcome to effortrather than ability, the researchers wouldconclude an "unstable" factor was beingemphasized. However, when controllabilityis introduced as a potential dimension, anemphasis of effort over ability can be rein-terpreted as an attribution to a controllable,rather than an unstable, factor. Thus, al-though past findings indicated that stabilitywas related to expectancy change, control-lability may have actually been the moreimportant attributional dimension. Thisspeculation receives further support fromfield studies of the link between controlla-bility, depression, and coping (e.g., Bulman& Wortman, 1977; Dweck & Reppucci, 1973;Janoff-Bulman, 1979; Rodin & Langer, 1977;Schulz & Hanusa, 1978).
These results support Clifford's recentlyespoused contention (1979) that failure ineducational settings need not lead to lossesin achievement motivation, depression, orfrustration. If students who do poorly inclass conclude there is nothing they per-sonally can do to change their outcomes,then certainly their failure will underminetheir motivation and satisfaction with selfand school work. However, if the teacherencourages students to associate failure withfactors that can be controlled, then the de-bilitating consequences of failure may beavoided. Thus, the attributional approachprovides a model for dealing constructivelywith classroom failure. By emphasizing theimportance of internal, controllable factorsas causes, teachers may promote pupils' ed-ucational experiences that are both moresatisfying and more effective.
Reference Note
1. McMillan, J. H., & Spral, K. F. Causal attributionsand affect in a real-life testing situation. Paperpresented at the Annual Convention of the AmericanEducational Research Association, Boston, 1980.
References
Abramson, L. Y., Seligman, M. E. P., & Teasdale, <J. 1).Learned helplessness in humans: Critique and re-
402 DONELSON R. FORSYTE AND JAMES H. McMILLAN
formulation. Journal of Abnormal Psychology,1978, 87, 49-74.
Appelbaum, M. I., & Cramer, E. M. Some problems inthe nonorthogonal analysis of variance. Psycho-logical bulletin, 1974, 81, 335-343.
Appelbaum, M. I., & Cramer, E. M. Balancing—Analysis of variance by another name. Journal ofEducational Statistics, 1976, 1, 233-252.
Arkin, R. M., & Maruyama, G. M. Attribution, affect,and college exam performance. Journal of Educa-tional Psychology, 1979, 77, 85-93.
Bailey, R. C., Helm, B., & Gladstone, R. The effects ofsuccess and failure in a real-life setting: Perfor-mance, attribution, affect, and expectancy. Journalof Psychology, 1975,89, 137-147.
Bernstein, E. M., Stephen, W. G., & Davis, M. H. Ex-plaining attributions for achievement: A path ana-lytic approach. Journal of Personality and SocialPsychology, 1979, 37, 1810-1821.
Bulman, R. J., & Wortman, C. B. Attributions of blameand coping in the "real world": Severe accidentvictims react to their lot. Journal of Personality andSocial Psychology, 1977, 35, 351-363.
Clifford, M. M. Effects of failure: Alternative expla-nations and possible implications. EducationalPsychologist, 1979, U, 44-52.
Covington, M. V., & Beery, R. Self-worth and schoollearning. New York: Holt, Rinehart & Winston,1976.
Covington, M. V., & Omelich, C. L. Are causal attri-butions causal? A path analysis of the cognitivemodel of achievement motivation. Journal of Per-sonality and Social Psychology, 1979, 37,1487-1504.
Covington, M. V., Spratt, M. F., & Omelich, C. L. Iseffort enough or does diligence count too? Studentand teacher reactions to effort stability in failure.Journal of Educational Psychology, 1980, 72,717-729.
Cramer, E. M., & Appelbaum, M. I. Nonorthogonalanalysis of variance—Once again. PsychologicalBulletin, 1980,87, 51-57.
deCharms, R. Personal causation. New York: Aca-demic Press, 1968.
Dweck, C. S. The role of expectations and attributionsin the alleviation of learned helplessness. Journalof Personality and Social Psychology, 1975, 31,674-684.
Dweck, C. S., & Reppucci, N. D. Learned helplessnessand reinforcement responsibility in children.Journal of Personality and Social Psychology, 1973,25,109-116.
Elig, T. W., & Frieze, I. H. A multi-dimensional schemefor coding and interpreting perceived causality forsuccess and failure events. JSAS Catalog of SelectedDocuments in Psychology, 1975, 5, 313. (Ms. No.1069)
Elig, T. W., & Frieze, L H. Measuring causal attribu-tions for success and failure. Journal of Personalityand Social Psychology, 1979, 37, 621-634.
Feather, N. T., & Simon, J. G. Causal attributions forsuccess and failure in relation to expectations ofsuccess based upon selective or manipulative control.Journal of Personality, 1971, 39, 527-541.
Forsyth, D. R. The functions of attributions. Social
Psychology Quarterly, 1980, 43, 184-189.Frieze, I. H., & Weiner, B. Cue utilization and attri-
butional judgments for success and failure. Journalof Personality, 1971, 39, 591-605.
Glass, D. C. Behavior patterns, stress, and coronarydisease. Hillsdale, N.J.: Erlbaum, 1977.
Heider, F. The psychology of interpersonal relations.New York: Wiley, 1958.
Janoff-Bulman, R. Characterological versus behavioralself-blame: Inquiry into depression and rape.Journal of Personality and Social Psychology, 1979,37, 1798-1809.
McMahan, I. E. Relationships between causal attri-butions and expectancy of success. Journal of Per-sonality and Social Psychology, 1973, 28, 108-114.
Meyer, J. P. Causal attribution for success and failure:A multivariate investigation of dimensionality, for-mation, and consequences. Journal of Personalityand Social Psychology, 1980, 38, 704-718.
Ostrove, N. Expectations for success on effort-deter-mined tasks as a function of incentive and perfor-mance feedback. Journal of Personality and SocialPsychology, 1978, 36, 909-916.
Passer, M. W., Kelley, H. H., & Michela, J. L. Multi-dimensional scaling of the causes for negative inter-personal behavior. Journal of Personality and So-cial Psychology, 1978, 36, 951-982.
Pillai, K. C. S. On the distribution of the largestcharacteristic root of a matrix in multivariate anal-ysis. Riometrika, 1965, 52, 405-414.
Rodin, J., & Langer, E. J. Long-term effects of a con-trol-relevant intervention with the institutionalizedaged. Journal of Personality and Social Psychology,1977,35,897-902.
Schulz, R., & Hanusa, B. H. Long-term effects ofcontrol and predictability-enhancing interventions:Findings and ethical issues. Journal of Personalityand Social Psychology, 1978, 36, 1194-1201.
Seligman, M. E. P. Helplessness: On depression,development, and death. San Francisco, Calif.:Freeman, 1975.
Seligman, M. E. P., Abramson, L. Y., Semmel, A., & vonBaeyer, C. Depressive attributional style. Journalof Abnormal Psychology, 1979, 38, 242-247.
Valle, V. A., & Frieze, I. H. Stability of causal attri-butions as a mediator in changing expectations forsuccess. Journal of Personality and Social Psy-chology, 1976, 33, 579-587.
Weiner, B. Theories of motivation: From mechanismlo cognition. Chicago: Rand McNally, 1972.
Weiner, B. A theory of motivation for some classroomexperiences. Journal of Educational Psychology,1979, 77,3-25.
Weiner, B. Human motivation. New York: Holt,Rinehart & Winston, 1980.
Weiner, B., et al. Perceiving the causes of success andfailure. Morristown, N.J.: General Learning Press,1971.
Weiner, B., Nierenberg, R., & Goldstein, M. Sociallearning (locus of control) versus attributional (causalstability) interpretation of expectancy of success.Journal of Personality, 1976, 44, 52-68.
Weiner, B., Russell, D., & Lerman, D. Affective con-sequences of causal ascriptions. In J. H. Harvey, W.J. Ickes, & R. F. Kidd (Eds.), New directions in al-
ATTRIBUTIONS, AFFECT, AND EXPECTATIONS 403
tribution research (Vol. 2). Hillsdale, N.J.: Erl-baum, 1978.
Weiner, B., Russell, D., & Lerman, D. The cognition-emotion process in achievement-related contexts.Journal of Personality and Social Psychology, 1979,37, 1211-1220.
White, R. W. Motivation reconsidered: The conceptof competence. Psychological Review, 1959, 66,297-333.
Wortman, C. B. Causal attributions and personal
control. In J. H. Harvey, W. J. Ickes, & R. F. Kidd(Eds.), New directions in attribution research (Vol.1). Hillsdale, N.J.: Erlbaum, 1976.
Wortman, C. B., & Dintzer, L. Is an attributionalanalysis of the learned helplessness phenomenonviable? A critique of the Abramson-Seligman-Teasdale reformulation. Journal of AbnormalPsychology, 1978,89, 75-90.
Received June 12,1980 •