Embed Size (px)
Citation preview

PLANNING AND LAYOUT OF A RUN-OF RIVER HYDROPOWER SCHEME WITH PONDAGE - A CASE STUDY
A DISSERTATION Submitted in partial fulfillment of the
requirements for the award of the degree of
MASTER OF TECHNOLOGY in
WATER RESOURCES DEVELOPMENT
By
ATUL KUMAR MAURYA
DEPARTMENT OF WATER RESOURCES DEVELOPMENT AND MANAGEMENT INDIAN INSTITUTE OF TECHNOLOGY ROORKEE
ROORKEE -247 667 (INDIA) JUNE, 2006

CANDIDATE'S DECLARATION
I hereby declare that the work, which is being presented in the dissertation
entitled "PLANNING AND LAYOUT OF A RUN-OF-RIVER HYDROPOWER
SCHEME WITH PONDAGE — A CASE STUDY" submitted, in partial fulfillment of
the requirement for award of the degree of MASTER OF TECHNOLOGY in
WATER RESOURCES DEVELOPMENT at DEPARTMENT of WATER
RESOURCES DEVELOPMENT AND MANAGEMENT, of Indian Institute of
Technology Roorkee, is an authentic record of my own work carried out
for a period from July, 2005 to June, 2006 under the supervision of
Prof. Gopal Chauhan, Professor, and Dr. B. N. Asthana, Ex-Visiting Professor,
in the department of Water Resources Development and Management, Indian
Institute of Technology Roorkee, India.
The matter embodied in this dissertation has not been submitted by me
for the award of any other degree.
Date: 27June, 2006
Place: Roorkee
(ATUL KUMAR MAURYA)
This is to certify that the above mentioned statement made by the
candidate is correct to the best of our knowledge.
(Prof. Gopal auhan)
Professor, WRDMD
Indian Institute of Technology
Roorkee, UA, India
(Dr.B.N.Asthana)
Ex-Visiting Professor, WRDMD
Indian Institute of Technology
Roorkee, UA, India

ACKNOWLEDGEMENT
I take this as a great pleasure and proud privilege to express my deep
sense of respect and gratitude to Dr B.N. Asthana, Ex-Visiting professor,WRDMD,
IIT Roorkee and Prof. Gopal Chauhan, professor , WRDMD, IIT Roorkee, for
introducing me to the field of hydropower and for their valuable , inspiring and
painstaking guidance in bringing out this work. Without their support and
encouragement, the present work would not have been completed successfully.
I am grateful to Prof. S.K. Tripathi, HOD, Prof. Nayan Sharma, DRC
Chairman, WRDMD, and all the faculty members and staff of WRDMD for their
support, kind cooperation and facilities extended to me.
I am very much grateful to Er. R.S. Chauhan, Er. D. Nikashi and
Er. Sanjeev Gupta of Satluj Jal Viduit Nigam Limited, Shimla and
Er. G.P.S. Bhati, Er. Adesh Kumar and Er. Ajay Kumar .
I am very much grateful to the officers of my parent organization " U. P.
Irrigation Department, Govt. of U.P. " for having deputed me in this prestigious
department for higher studies for acquiring knowledge in Water Resources
Development.
It is a great pleasure for me to acknowledge my parents and my wife which
have been continuously inspiring me. It would not have been possible for me to
complete this work without their continuous encouragement and moral support.
Zitune,2006 ( ATUL KUMAR MAURYA)
ii

CONTENTS
Page no.
CANDIDATES DECLARATION ACKNOWLEDGEMENT ii CONTENT iii LIST OF FIGURES viii
LIST OF TABLES ix
LIST OF ANNEXURES SYNOPSIS xi
CHAPTERS 1 INTRODUCTION 1
1.0 General 1
1.1 Hydro Power Development Scenario 1
1.2 Scope of Study 3
1.3 Organisation of Dissertation Report 3
2 POWER SCENARIO IN INDIA 5
2.0 General 5 2.1 Major Sources of Energy 6 2.2 Water Resources in India 6 2.3 Power Development in India 7
2.4 Advantages of Hydropower over Thermal 8 2.5 Hydroelectric Potential in India 9
2.5.1 Historical Development 9 2.5.2 Future of Hydropower 10
3 PLANNING AND INVESTIGATION 11 3.1 Planning 12 3.2 Required Data for Planning 12
3.2.1 Water Resources 12 3.2.2 Other Basic Resources 12 3.2.3 Constraints 13 3.2.4 Special Data 13
iii

3.2.5 Projections 14
3.3 Site Investigations 15
3.3.1 Preliminary.Investigations 15
3.3.2 Final Investigations 17
3.4 Hydrological Investigations 17
3.4.1 Water Availability Data for Power Studies 18
3.4.2 Direct Observation Methods 19
3.4.3 Stage Discharge Data 19
3.4.4 Water Table 19
3.4.5 Design Flood 19
3.5 Geological Investigations 20
3.5.1 Investigations for Different Structures 21
3.5.1.1 Masonry and concrete dam 21
3.5.1.2 Barrages 22
3.5.1.3 Water conductor system 22
3.5.1.4 Power station 22
3.6 Topographical Investigations 27
3.7 Meteorological Investigations 36
3.8 Other Important Investigations 36
3.8.1 Construction Material Investigations 36
3.8.2 Ecological Surveys 37
3.8.2.1 Affected flora & funa 37
3.8.2.2 Historical and cultural 37 repercussions
3.8.3 Special Surveys for Hydro Electric Project 38
4 LAYOUT OF A RUN-OF-RIVER HYDROPOWER SCHEME 39
4.1 Lay out of Scheme 39
4.1.1 Diversion Arrangement 41
4.1.2 Intake 42
4.1.3 Head Race Channel / Tunnel 45
4.1.3.1 Head race channel 46
4.1.3.2 Head race tunnel 46
4.1.4 Fore bay / Surge Tank 47
4.1.4.1 Functions of surge tank 47
iv

4.1.4.2 Types of surge tank
4.1.5 Penstock 4.1.5.1 Number of penstock 4.1.5.2 Diameter of penstock
4.1.6 Power House
4.1.7 Tail Race
48 50 50 51 51 51
4.2 Types of Run-of-River Scheme 51 4.2.1 Run-of-River scheme with Pondage 52 4.2.2 Run-of-River scheme without Pondage 52
5 POWER PLANNING 53 5.0 General 53 5.1 Fixing of Discharge 53
5.1.1 Flow Duration Curve 53 5.1.1.1 Total period method 54 5.1.1.2 Calendar year method 54 5.1.1.3 Shape of flow duration curve 54
5.1.2 Review Of Literature For Use Of FDC 55 5.2 Fixing of Head 58 5.3 Installed Capacity 59 5.4 Energy Generation 60 5.5 Pondage 60
6 LUHRI HYDROELECTRIC PROJECT - A CASE STUDY 62 6.1 The Project 62 6.2 Back Ground Information 62
6.2.1 Project Area 65 6.2.2 Seismicity 67 6.2.3 Hydrology 67 6.2.4 Geology 67
7 HYDROLOGICAL STUDIES 69

7.0
7.1
7.2
7.3
General
Available Flow Data
Analysis of Flow Data
7.2.1 Generation of Data
7.2.1.1 For Rampur site
7.2.1.2 For Lurhi dam site
Construction of Flow Duration Curve
69
69
69
70
70
71
72
7.3.1 FDC for Total Duration 72
7.3.2 FDC for Mean Year Flow 72
7.3.3 FDC for 90 % Dependable Year Flow 73
7.3.4 FDC for 50 % Dependable Year Flow 74
7.3.5 FDC for 90% & 50% synthetic Year Flow 75
7.4 Comparison Between Different FDCs 76
7.5 Design Flood Analysis 77
7.5.1 Flood Analysis with Sunni Data 77
7.5.2 Flood Analysis with Rampur Data 78
8 POWER POTENTIAL STUDIES 79
8.0 General 79
8.1 Power Studies 79
8.2 Discharge Data 79
8.3 Installed Capacity Analysis 79
8.4 Installed Capacity Selection 81
8.5 Unit Size 82
8.6 Energy Generation 82
8.7 Peaking 83
9 CONCEPTUAL LAYOUT 84
9.1 River Diversion Work 84
9.1.1 Diversion Tunnel 84
9.1.2 Diversion Dam 84
9.2 Intake Structure 85
9.3 Desilting Arrangement 86
9.4 Water Conductor System 86
vi

9.4.1 Head Race Tunnel 86
9.4.2 Surge Shaft 86
9.4.3 Pressure Shaft 87
9.4.4 Tail Race Tunnel 88 9.5 Power House 88 9.6 Dimensioning of Different Component 88 -
9.6.1 Dimensioning of Intake 88
9.6.2 Dimensioning of Desilting Chamber 88
9.6.3 Head Race Tunnel 89
9.6.4 Penstocks 89 9.6.4.1 Thickness of penstock steel liner 90 9.6.4.2 Thickness of unit penstock liner 90
9.6.5 Power House 91 9.6.5.1 Selection of turbine 91 9.6.5.2 Main parameters of turbine 91 9.6.5.3 Unit width 92 9.6.5.4 Overall dimension of power house 93 9.6.5.5 Length of power house 94 9.6.5.6 Width of power house 94 9.6.5.7 Height of power house 95
9.6.6 Tail race Tunnel 98 10 CONCLUSIONS 99
REFERENCES 101 ANNEXURE 103
vii

LIST OF FIGURES
Figure No.
Description Page No.
4.1 Typical layout of a run-of-river scheme 40 4.2 Layout of scheme having power house at toe of dam 41 4.3 Dam intake 44 4.4 Tower intake 45 4.5 Different types of surge tank 49 5.1 Shape of Flow Duration Curve 55 6.1 Map showing Luhri hydroelectric project 63 6.2 Map showing Luhri H E with adjacent project 65 6.3 Photographic view of dam site at river Satluj 66 7.1 Correlation between Rampur & Sunni discharge data 70 7.2 Flow Duration Curve of total duration 72' 7.3 Flow Duration Curve of mean year flow 73 7.4 Flow Duration Curve of 90% dependable year flow 74 7.5 Flow Duration Curve of 50% dependable year flow 74 7.6 Flow Duration Curve of 90% dependable synthetic year 75 7.7 Flow Duration Curve of 50% dependable synthetic year 75 7.8 Different Flow Duration Curve of river Satluj 76 7.9 Different Flow Duration Curve of river of Ganga basin 76 8.2 Graph of Installed capacity V/s energy generated 80 8.3 Graph between installed capacity V/s incremental energy per 81
MW
9.1 Cross-section of Satluj river at dam site 85 9.2 Surge shaft 87 9.3 Desilting chamber 89 9.4 Diagram of unit bay 0 92 9.5 Sectional elevation of power house 96 9.6 Figure showing elevation of different components of project 97

LIST OF TABLES
Table
Number
Description Page
No.
2.1 Table of per capita electric consumption in India 5
2.2 Table for demand and supply of power in India 6
2.3 Different type of waste generate 7
2.4 Contribution of different sources for generation 8
2.5 Table of type of scheme 10
3.1 Location and depth of exploratory hole/drift/pits 23
3.2 Details of map for topological & geological survey 29
5.1 Exceedence probability of some existing project 58
7.1 Maximum flood discharge _ 78
8.1 Range of power & number of days 82
8.2 Generation of energy for different ten daily flow 83
9.1 Type of turbine for different range of head 91
9.2 Different parameters of turbine 93
ix

LIST OF ANNEXURES
Annex. Description No.
VII / 1 Ten daily discharge data at Sunni site VII/2 Ten daily discharge data at Rampur site VII/3 Correlation between Rampur & Sunni ten daily data VII/4 Ten daily discharge data for Luhri dam site V11/5 Ten daily mean flow data V11/6 Calculation of 90% & 50% dependable year flow V11/7 Calculation of 90% & 50% synthetic year flow VII/8 Flood calculation by Log_Pearsion type Ill V11/9 Flood calculation by Gumbels approach VIII/1 Calculation of loss VIII/2 Energy calculation for mean year flow VIII/3 Energy calculation for 90% dependable year flow VIII/4 Incremental increase in energy for different installed capacity.
VIII/5 Energy generated & discharge required for different installed capacity. VIII/6 Energy generation for installed capacity of 900MW, at 100% time VIII/7 Energy generation for installed capacity of 900MW, at 95% time IX/1 Surge shaft calculations IX/2 Intake dimensioning IX/3 Dimensioning of desilting chamber IX/4 Dimensioning of power house

SYNOPSIS
The estimated hydro power potential in India is about 84000 MW at 60 %
load factor, out of which only 32326 MW has so far been harnessed. Its share in
total energy generation is about 25.9 % whereas for efficient power system it shall
be 40 % as per CEA norms. At present time the peak power shortage is of the
order of 12.5 %, so for improvement of present power situation it is required to
harness more and more hydropower potential of our country.
Hydro power generation can be possible either by storage schemes or by
run-of-river schemes. There are lot of problems which are associated with storage
schemes, hence run-of-river schemes are more appealing and out of 845 total
identified hydro electric sites 514 are run-of-river schemes. This study deals with
planning and layout of run-of-river schemes with pondage with a case study of
Luhri hydro electric project.
The study gives the basic idea about planning of a run-of-river hydropower
scheme, the data, the information, and the investigation required to develop a
scheme to harness the potential of stream. Besides this, study deals with the
layout of different component of project. There is no unique solution to the
problems of any project, the solution are generally site specific.
There is no general criteria for energy planning, different criteria for
planning energy generation from run-of-river schemes given by different authors
( Mosonyi, G. Brown, Nigam ) has been reviewed, and accordingly the energy
planning is done for case of Luhri hydro electric project. As the pondage is
associated with the case study, so valuable peaking energy assessment is also
worked out which is supposed to be derived from this project. The study also
xi

includes the design principles of various structures and these are illustrated with
the dimensioning of structures of Luhri hydro power project.
xii

CHAPTER -1
INTRODUCTION
1.0. GENERAL
The complication of new power house is a homage to the well known
scientist, Michael Faraday, who showed in the 19th century that when a coil of
conductor is rotated in a magnetic field then electricity flows in the coil. This basic
scientific principle was utilized by Thomas Alva Edison in his invention of first
electrical generator which has become the basis for all generating equipment
used in the different types of power houses already constructed throughout the
world.
The type of prime mover utilized for the rotation of coil designates the type
of power station. In a hydro electric power station, water which acts as a prime
mover to rotate the turbine, which is coupled to the generator rotor.
Hydropower is a renewable, cost effective, nonpolluting and
-environmentally benign source of energy as compared to other conventional
sources such as thermal and nuclear.
1.1. HYDRO POWER DEVELOPMENT SCENARIO
• First hydro power plant started in 1882 in WISCONSIN (USA).
• In India first hydro power plant was started in Darjeeling (2 X 65kVV). In
1897, still in operation.
• In northern India, in 1913 at Upper Ganga Canal, at Pathree (Haradwar).
• In India, in 1950 total installed capacity of 1320 MW in which share of
hydropower was 508 MW (38.48 %).
• In 1963, share of hydropower was 46%, which has declined since then to
25.9% as on date.
1

Consumption of electrical energy is an index of the economical and
industrial development of the nation and the quality of life. The annual per capita
power consumption (in kWh) in our country is about 606 (May-2006), which is
lower than world average of 1000 and much more lower then developed countries
(USA 13,800, Australia 9950, France 7500, South Korea 5552).
• The latest demand projection indicates a peak demand of about 1,57,000
MW and energy requirement of about 975 billion units at the end of 11th
plan (2011-12)
• To meet this demand, total installed capacity of about 2,12,000 MW would
be required at the end of 11th plan which means about 1,02,000 MW
capacity is to be added without any retirement of unit(11).
• Presently the country is facing 8.3% shortage of energy and 12.5% in peak
demand load.
• India is endowed with enormous economically exploitable and viable hydro
potential equivalent to 1,50,000 MW of installed capacity (2,50,000 MW of
installed capacity when pumped storage projects and small scale hydro-
schemes are included) out of which only 32326. MW 21.55% has been
harnessed.
A study made by Central Electricity Authority reveals that, out of 845 total
identified hydro electric sites with a potential of 84044 MW at 60% load factor, 514
sites fall in the category of run of the river scheme.
The unfavorable hydro thermal mix reduces the operating plant load factor
of thermal power plant, which not only adversely affects the efficiency of the
power system and plants life but also necessitates burning of huge amount of
valuable petroleum fuel.
2
Hydropower stations have inherent quality for quick starting, stopping, load
variation and help in improving reliability of the power system, so the hydro
stations are suitable for peaking stations. The study by CEA revels that for an
efficient power systerii a share of 40% for hydro power in total energy generation
is desirable for better grid/system efficiency and stability. Presently this share of
hydropower is 25.9%, which is much far behind than required. Therefore there is
great urge to accelerate the hydropower generation in our country. This
development can be of run-of-river type of storage type.
The construction of a storage reservoir involves some major problem such
as submergence rehabilitation, political interference, long gestation period etc.
So it is better option to go for development of run-of-the river hydro
schemes, and as stated earlier that we are short in 12.5% in peak demand, if it is
possibe to create pondage, with a run-of-river scheme, then peaking shortage
may meet out up to some extent.
1.2. SCOPE OF STUDY
This study is associated with general planning and design for development
of run-of-river scheme with pondage. The planning and design concepts are
illustrated through a case study.
1.3. ORGANISATION OF DISSERTATION REPORT
Chapter 1: Gives an introduction to the dissertation work, describing the various
aspects of the whole work.
Chapter 2: Gives the overview of present power scenario of India.
Chapter 3: Deals with the planning, investigations which are required for
development of hydropower scheme.
Chapter 4: Throws light on the lay out of hydropower scheme, few ideas about
the main component of a scheme are given.
3

Chapter 5: Highlights approach for energy planning based on different flow
duration curves and also literature review for use of flow duration curve for energy
planning.
Chapter 6: Gives brief idea about the Luhri hydro electric project, which is taken
as a case study under this work.
Chapter 7: Deals with the hydrology of the project under taken, correlation of
existing 10 daily data is done and different FDC's have been constructed by using
10 daily discharge data.
Chapter 8: Analysis of energy generation is done and different losses are
calculated in this chapter, it has been described how to get the appropriate
installed capacity for development of a hydro power scheme, power generation
and peaking studies.
Chapter 9: Gives brief idea about the layout of different component of run-of-
river scheme with pondage, and dimensioning of some main components.
Chapter 10: Conclusion and discussion.
4

CHAPTER - 2
POWER SCENARIO IN INDIA
2.0. GENERAL
Electricity is most sought after form of energy on account of evolution of
more and more convenient and efficient processes of transmission of electrical
energy over long distances from the place of production and development to its
multifarious uses for service of human being. Per capita consumption has become
the index of advancement and prosperity of any country or nation. In India this
index has varied over the years as given in Table 2.1.
Table. 2.1: Per capita consumption of electricity energy
Year Per capita electricity consumption
1947 14 KWH/ Year
1991 236 KWH / Year
2003 350 KWH/ Year
2006 606KWH/Year
(Source- Reference 11 & 26)
The annual per capita power consumption (in kWh) in the country is about
606 (May 2006, reference 26), which is lower than world average of 1000 and
much more lower than in developed countries, i.e. in USA it is 13,800, Australia
9950, France 7500, Israel 6340, South Korea 5552 etc. The scenario of power
and energy (April 2005 — Feb 2006 ) with reference to demand and supply is
given in Table 2.2
5

Table. 2.2 : Supply and demand of energy in India
Demand Supply Surplus/ Deficit
Energy 57,5384 MU 52,7539 MU - 8.3 %
Peak Demand 92,968 MW 81,370 MW - 12.5 %
(Source- Reference 26)
2.1. MAJOR SOURCES OF ENERGY
Main sources of energy which are being utilized for generation are of two
types:
a) Non- renewable
b) Renewable
In non-renewable, electricity can be generated by fuels (in all forms — solid,
liquid and gaseous).
In renewable source, we have water energy, sun, wind, and tides, but
except water these have so far not used for generation of electricity to an
appreciable extent. These except water energy are known as non-conventional
source of energy. Development of power from tides has made noticeable start in
France. In India a tidal power station of 900 MW capacity has been in planning
stage for Gujarat (Kachha). Solar & wind energy development has made a start in
India. Wind energy plants to an aggregate capacities of around 4000 MW have
installed.
Different sources of energy as mentioned above are unevenly distributed in
India and also in other countries of the world.
2.2. WATER RESOURCES IN INDIA
The available surface water resources of India have been assessed as 180
million ha-m. It has been estimated that on account of limitations of rainfall
6

distribution, physiographic, topographic, geological, social, political constraints etc.
only 69 million ha-m can be utilized, which is 38% of total available water
resources. Out of which 31.2 million ha-m is used for run-of- river schemes for
power generation which is 17% of total water resources of the country(12).
2.3. POWER DEVELOPMENT IN INDIA
The power sector since independence has gone a tremendous change and
grown from 1364 MW in 1947 to about 1,24,827 MW in 2006. Development of
hydro electric potential of India is being presently favoured due to its inherent
advantage over thermal and nuclear power such as renewable resource, non-
polluting, eco-friendly, low cost, immediate load variation.
Utilization of coal or any other fuel for generation of electricity will naturally
be restricted to available resources. Nuclear energy will also depend on the
particular type of mineral deposit which serves as raw material.
With the present rate of energy consumption, India and the whole world
would not be left with any oil or gas by the 2050 AD. Even coal reserves are not
infinite(11).
Effective handling of fly ash of thermal plant and disposal of solid
radioactive waste of nuclear power plant are a great concern today. Thermal
plants in India generates different type of waste annually as given in table 2.3.
Table. 2.3 : Type of waste generate
SI No. Type of Waste Quantity( in million Tones)
1 Fly Ash 75
2 CO2 290
3 SO2 2.25
4 NO2 1.71
7

( Source — Reference 11)
A speedy harnessing of vast eco-friendly hydro potential should has a
preference over the thermal / nuclear options. An ideal hydro thermal mix of 40:
60 for optimum operation of the system is emphasised by C.E.A.. The present
ratio of 26:74 needs to be corrected to meet peak load requirements as well as to
achieve system and frequency stability.
The unfavorable hydro thermal mix reduces the operating plant load factor
of thermal power plant, which not only adversely affects the efficiency of the
power system and plant life but also necessitates burning of huge amount of
valuable fuel. The contribution of different sources to power generation is given (
May 2006) in table 2.4:
Table.2.4 : Contribution of different source of power SI. No. Source of Power Contribution Percentage
1 Thermal Coal Gas oil
78491 MW 68519 MW 12690 MW 1201 MW
66 % 54.8 % 10.2 % 1.0 %
2 Nuclear 3900 MW 3.1 %
3 Hydro 32326 MW 25.9 %
4 Renewable 6191 MW 5.0 %
Total 124827MW (Source — Reference 26)
2.4. ADVANTAGES OF HYDROPOWER OVER THERMAL
Besides the availability for unlimited period hydropower possesses a
number of other inherent advantages over thermal and nuclear power such as:
(i) Hydropower stations can be started and stopped instantaneously and help
in stabilizing the grid.
8

(ii) Hydropower development is eco-friendly. It does not have any adverse
impact on environment unlike thermal and nuclear plants.
(iii) Hydro power possesses/ confirms non-consumptive use of natural and
annually renewable source.
(iv) Operation and maintenance cost is less. Input cost is nil. Thermal has
increasing input cost. Average cost of hydro power generation is 1/3rd to
114th of thermal(18).
(v) Life of the machines and powerhouse is more. The life of hydropower plant
is taken as 60 years as compared to 35 years for steam power.
(vi) The coal based thermal plants consume about 10% of the power
generation for its own power station auxiliaries and to that extent the load
carrying capacity of the thermal unit is reduced and the same would
therefore have the effect of increasing the capital cost of the thermal plant.
Recently concluded study by CEA indicates that reduction of 1 MW of
hydro capacity in the optimal power plan, on an average would require addition of
1.6 MW of thermal power project which would increase the investment accordingly
(source —reference 11).
2.5. HYDROELECTRIC POTENTIAL IN INDIA
2.5.1. Historical Development
In India first hydropower station was commissioned in year of 1897, at
Darjeeling, with installed capacity of 2 x 65 KW(15).
The first power station with significant installed capacity of 4.5 MW was
constructed as Sivasamudram in Karnataka in 1902. This power station is still in
the operational stage, even more than 100 years elapsed.
9,

The installed capacity of hydropower plant is 32326 MW accounting for
25.9% of total installed capacity.
The total assessed potential of hydropower at 60% load factor is 84,044
MW with probable installed capacity of 1,48,699 MW. Following table gives the
break up of type of hydro power development
Table. 2.5 : Type of hydro schemes
Number of Schemes Potential at 60 % load factor
Storage
331
Run of river
514
Total
845 84044 MW
2.5.2. Future of Hydro Power Development
It is evident from above data that India has an enormous Hydro Electric
Power potential of 84044 MW at 60% load factor assessed by CEA from a total of
845 hydroelectric schemes identified in various river basins.
These 845 schemes include 514 run-of-river schemes and rests are
storage schemes. The high cost of construction, geological complexities large
gestation period, environmental and rehabilitation problems as well as the
resource crunch are the factors which have retarded the rate of development
through storage schemes.
Thus, development of hydropower through run-of-the river schemes has to
be expedited. These can be attractive to private sector also because of less
problems and incentives by the Government. This is therefore the subject of this
study.
10

CHAPTER - 3
PLANNING AND INVESTIGATION
3.1. PLANNING
Planning can be defined as the orderly consideration of a project from the
original statement of purpose through the evaluation of alternatives to final
decision on a course of action.
There may be several feasible sites for a proposed hydroelectric plant.
Hence it often entails comparison of many alternatives. The steps involved are:
(a) Collect the hydrological data on the streams, and determine the amount
of water available and its distribution throughout the year and from year
to year.
(b) Make preliminary design for all installations which seem competitive in
cost, and determine the most economic design at each site by
comparison of costs and estimated power revenues, but if we want to
harness more power from same project then we must go for less
economic installation.
Select feasible project sites as close to the load center as
possible.
Compare the best options from the several sites, and select the
site or combination of sites which proves best for production of
the required amount of power, often this selection is guided
somewhat by estimated future requirements and the possibilities
of expansion to meet them.
11

3.2. REQUIRED DATA FOR PLANNING
For planning of a scheme lot of data is required as described below:
3.2.1. Water Resources
(i) Hydrology: Precipitation, stream flow, evaporation, water quality. Water
availability is the life line of any hydroelectric scheme. The success of
the scheme depends on how accurate has been the estimation of total
quantity of water available and is variability.
(ii) Sediment and Soil Erosion : In Himalayan region soil erosion is major
problem for hydroelectric developments. Sedimentation reduces the
storage capacity of dam. Sediment particles cause abrasion of turbine
runner. The knowledge of type and composition of sediment and extent
of soil erosion is necessary for planning and design of hydropower
scheme.
(iii) Groundwater and soil survey and also cartographic maps.
3.2.2. Other Basic Resources:
(i) Geology which type of minerals are deposited in proposed reservoir
site, about there solubility in water.
(ii) Ecologic : The over all ecology of the region likely to be effected by
construction and operation of hydroelectric project. It is there fore
necessary to make at least surveys and investigations of vegetation,
fish and wild life.
(iii) Economic : industry, transportation, markets, tourism, recreation. Such
study gives the picture of region with reference to economic growth and
economic growth is directly related to power consumption.
12

3.2.3. Constraints
(i) Law : water rights, pollution control, land zoning, land ownership,
administrative patterns.
(ii) Public Opinion: Either the public is in favor of the project or in opposition
of the project.
(iii) Existing Projects : How many projects exist in surrounding area and in
which manner they effect, e.g. some time tail water level affects the FRL of
proposed project.
3.2.4. Special Data
(a) Agriculture
(i) Land classification
(ii) Crop water requirements
(iii) Climatic limitations.
Above information is required to get the agriculture water demand if
irrigation is also a component of project.
(b) Municipal Uses
(i) Industrial water needs — quantity and quality
(ii) Population water needs.
Such information is required for release of water (after construction of
project) for industries and population of down stream.
(c) Hydropower
(i) Projected needs- if the project would be isolated then future
projected demand of power is very important for planning.
(ii) Alternate sources.
13

(d) Flood mitigation
(I) Extent of past flooding and damages.
(ii) Local storm drainage requirements.
(e) Navigation
(i) Present water traffic patterns.
(ii) Alternatives — roads, rail roads, air ways.
(f) Recreation
Natural attractions.
(g) Pollution Control
(i) Existing waste discharge — location, time, and character of water.
(ii) Water pollution regulations or quality standard.
3.2.5. Projections
(i) Population — place and time.
(ii) Land use — place and time
(iii) Economic — market, tourism etc.
(iv) Agriculture
(a) markets
(b) crops
(c) technological development
(d) Water demand.
(v) Power
(a) market and demand
(b) growth of alternate sources
(c) technological improvements
14

(vi) Flood control
(i) Projected flood damage — place and frequency
(ii) Possibilities of flood warning.
(vii) Pollution
(a) Anticipated quantities and characteristics of waste.
(b) Technological advances.
3.3. SITE INVESTIGATIONS
The scope and extent of the site investigations depends partly on the
availability of existing data, partly on the nature and size of the proposed
development, and partly on the opportunities or difficulties posed by the existing
topographical and geological features of the site. These in turn will affect the
number of alternatives which have to be worked out.
It is, however, usual for both office studies and site investigations to be
carried out in two main stages — preliminary and final and within these stages the
investigations might be placed in four following broad categories.
i) Hydrological
ii) Topographical
iii) Geological
iv) Metereological
3.3.1. Preliminary Investigations
The purpose of the preliminary investigations is to provide sufficient
information to confirm the feasibility of any proposed scheme of development, and
to compare and choose between alternative schemes or arrangements, so that
preliminary designs and estimates can be prepared and recommendations made
15

with reasonable confidence. These preliminary investigations generally include the
following studies on the existing documented data:
Hydrological Studies: overall rainfall and run off data, river flow data,
flood characteristics etc.
ii) Topographical Studies: Tacheometric, aerial or other surveys depending
on existing information and maps.
iii) Geological Studies: Overall geological characteristic and local features
should be studied from available information and maps. Some sub-surface
investigations by boring and by geophysical exploration; preliminary
reconnaissance surveys for construction materials etc. The scope of
investigations during preliminary stage is confined to the selection of the
most suitable sites from the geological stand point, besides satisfying the
engineering requirements. The investigation should proceed with 1:50000
available map to establish broad geomorphological features. Lithological
characters and altitude of the host rock and its major jointing and shear
zone pattern, the major structural and tectonic features such as folds, faults
and thrusts should be recorded and their significance in terms of the
seismicity of the area should be evaluated. After eliminating obviously
unsatisfactory sites, reconnaissance stage explorations should be done to
establish the nature and extent of overburden cover and major active or
potential slide features along the slope. Preferably, thinly bedded fissile and
highly fractured rocks should be avoided; slope configuration should be
studied with reference to instability and availability of sound rock cover over
the cavity.
16

3.3.2. Final investigations
The final investigations comprise the detailed exploration of the finally
selected site (or sites) so as to establish beyond doubt their techno-economic
suitability and to enable the final designs and contract documents to be prepared
with the least chance of serious alteration after the contract has been let. The final
investigations will generally be.
(a) Hydrological: Rain fall and run off data of the site for a considerable long
period.
(b) Topographical: Preparation of accurate large scale maps for the site of all
important structures.
(c) Geological: Detailed sub-surface investigation by excavation, boring,
drilling etc; rigorous sampling and testing of materials; permeability and
grouting tests, etc to give a complete picture of the geological features of
the site.
(d) Meteorological: It include climatic data.
Cost: The cost of site investigations in relation to the total cost of the
development is a matter on which no general rule can be given.
It is also necessary to remember that economy in the cost of site
investigations may be completely lost later by delays and added construction cost
arising from inadequate investigations. The investigation cost varies from project
to project in the range of 0.5 to 2.5 % of the project cost.
3.4. HYDROLOGICAL INVESTIGATIONS
Run off data — Data of river flows observed or computed for a long period is
essential to work out power potential of the selected site. It often happens that
17

more data about the rainfall in the catchment area is available than the flow data
in the stream or river.
Rainfall data, however, can be related to short period run-off data and used
for extending the run-off series. However, run off data is obtained by flow-
gauging of the river preferably at the proposed site of river diversion.
3.4.1. Water Availability Data for Power Studies
Long term discharge data at proposed site
10 day runoff (discharge) data i.e. mean discharge of 10 days at proposed
site for the last 25-30 years is required to work out water availability for power
generation.
Long term rainfall data for the proposed site
If direct observation of discharge at site is not available for long period, 10
day rainfall data for the last 30 years of the Indian Meteorological Department
(I.M.D.) rain gauge stations influencing the catchments of the proposed site
should be collected for computation of run off series to be used for working out
power potential
- No rainfall and discharge data is available:
In such case the data of adjoining rivers/ catchment is used to develop the
run off data at the proposed site.
- If discharge data of same river at other site is available:
In such case the data of other site is reduced in proportion to the area at
both sites to obtain the discharges at the proposed site.
18

3.4.2. Direct Observation Method
When observed / computed discharge series at proposed site is available
for last 30 years or so: The annual runoff is generally computed from 10 daily
discharges and arranged in the descending order. The year for a particular
dependability such as 90 %, 75 %, 50 % is calculated from (n+1) years where n is
the number of years for which run off data is available.
3.4.3. Stage-Discharge Data
Once the basic details of the development scheme have been decided, it is
necessary to determine, as accurately as possible, the stage discharge data is
obtained either by direct observations or by computations, to work out the design
of structures and the TWL for working out gross head.
3.4.4. Water Table
The ground water table and its fluctuations at the site of various structures
are required for planning, design and construction of works.
3.4.5. Design Flood
Another important aspect of hydrological data is the estimation of peak
discharge which has to pass over the structure without endangering its safety. A
very cautions and judicious approach is required in selecting design flood for a
hydraulic structure. If the selected design flood is too high, it will result in a
conservative and costly structure and if low, it may cause danger to the structure.
Thus the design flood is fixed depending upon the importance of the structure and
the amount of damage that its failure may cause. The frequency analysis with the
observed flow data is generally carried out to determine design flood. If data is not
available other empirical or semi empirical method are adopted which are based
on catchment characteristics.
19

3.5. GEOLOGICAL INVESTIGATIONS
Geological conditions largely influence the location and type of structures,
and the reconnaissance survey should provide sufficient information to assure the
designers that the sites chosen for diversion work, tunnels etc, are not only
feasible, but that they will not involve unduly heavy construction cost. The survey
should also include an assessment of valuable mineral deposits in the reservoir
and existing and potential slide areas.
If diversion structure is in form of a dam, then the site and the entire
reservoir area must be sufficiently water tight to avoid undue seepage losses.
The object of geological investigation is to provide the most complete and
accurate picture possible of the character of the ground upon, or through which
the work of proposed hydro-electric project may be constructed.
Geological surveying calls for imaginative and expert interpretation of data
derived from various field reconnaissance, sub-surface exploration, geophysical
methods, or aerial photographs. For this very close collaboration with, experts in
geology and soil mechanics are required.
By geological investigations attempt is made to get the following essential
data:
(i) Report on the overall geological structure and history of the area, with
general geological plans and sections. This should indicate locations of
faults slip-plans, crush-bands, buried river courses, and other potential
sources of structural instability or leakage.
(ii) Record plans and field logs of all borings, shafts, adits, galleries, etc.
Recorded data should include drilling speed; rate of water loss, standing
water levels, percentage core recovery, etc. and all other pertinent
information which will facilitate correct interpretations.
20

(iii) Laboratory test records: Chemical analyses, mechanical properties of test,
permeability test.
(iv) Site test records, including: Loading test, permeability & grouting test.
(v) Construction material report: Sources of supply and quantities to available
means of access, ownership, royalties, etc. Facilities for washing or
processing, etc.
The geological report is most conveniently prepared in "preliminary" and
"final" stages, since some amplification or modification is inevitable as the more
detailed and site specific sub-surface exploration proceeds.
The preliminary stage report should, however, be prepared early and
studied carefully before any large-scale sub-surface exploration works are
undertaken.
3.5.1. Investigation for Different Structure
The geological investigation greatly facilitate comparison of alternative
sites, and may serve as a basis for quantities used in preliminary cost estimates.
Foundation investigation for earth / rock fill / masonry, concrete dams and other
structures may be made as under.
3.5.1.1. Masonry and concrete dams
(i)
Exploratory holes and / or drifts should cover the entire foundation and
abutment area of the dam including energy dissipation structure. The
location, spacing and depth of holes shall be decided according to the
height of dam in consultation with an engineering geologist.
Description of logs for exploration should include ground elevation at the
hole, location coordinates and sufficiently detailed remarks regarding the nature
and type of rocks, geological structure, water loss etc. for a clear interpretation of
the foundation conditions.
21

Contours of bed rock and geological structure of foundation strata should be
presented.
(ii) Location and thickness of weathered, altered or otherwise softened zones
and their characteristics and the structural weaknesses and discontinuities
shall be investigated.
(iii) Tests for significant engineering properties of foundation rock such as
density, absorption, permeability, compressive strength and strain
characteristics (including the effect of moisture content) should be done
and data presented. Where the type and / or structure of rock are such that
its competency to ensure the stability of the dam against a sliding failure is
in doubt, necessary in-situ shear tests should be done and data presented.
3.5.1.2. Barrages In case of barrages the foundation investigations should be carried out for
type of soil/ rock, bearing capacity, permeability etc under the area of the barrage
and abutments.
3.5.1.3. Water Conductor System
(i) The L-Section of the water conductor system from intake structure to tail-
race should be prepared. In power channel portion, trial pits of adequate
depth should be put in at suitable intervals so as to indicate all changes of
strata.
(ii) For tunnel, a geological section of the tunnel alignment and surge shaft and
drill holes adequate to establish rock cover and important geological
features should be drawn.
3.5.1.4. Power Station
(1)
2 to 4 drill hole details for the power station area may be given. The
number, location, spacing and depth shall be decided in consultation with
an engineering geologist of the Geological' Survey of India.
22

(ii) The survey plan should cover an area sufficient to include switchyard and
alternative plant lay-outs and should give contours at intervals of 5 m. Low
water level, maximum observed flood level, rock out crops, sand shoals
etc. at the power house site will be indicated therein.
(iii) Indications of slides and the possibility of rock fall in the hill slopes should
be explored.
(iv) For underground power house, geological sections of power house,
pressure tunnel, access tunnels and switchyard and sufficient drill holes /
drifts to establish the geological features of the same are required.
(v) Ground water level at the power house site should be determined.
The following Table no 3.1 gives the minimum geological investigations
required for different structures of a run-of-river project.
Table.,3.1: Location and depth of exploratory holes! drifts / Pits etc.
Structure Pattern of Drilling
Spacing of drill holes / pits /
drifts
Depth of drill holes / pits /
drifts
1 2 3
(a) Earth and rock
fill dam
Drill holes along the axis 150m
or less apart, with intermediate
pits to delineate weak and
vulnerable strata with a
minimum number of three to
five holes in the gorge portion
and additional two on each
abutment parallel to the flow.
Drift on each abutment at
about 60m elevation interval
with a min. of one on each
abutment
Depth equals to half the
height of dam at the
elevation of the hole or 5m
in the fresh rock (proved by
the geophysical or any other
suitable method) whichever
is less. About two holes to
be extended deep (equal to
the maximum height of the t
Dam in the absence of rock at higher elevations), in the
gorge portion and one each
in abutmentS.
23

Drifts to be extended 5m in geologically sound strata for keying the dam in the absence of rock.
(b) Masonry and concrete dam
.
Drill holes along the axis at 100m interval or les apart to delineate weak and vulnerable strata with a minimum number of three to five holes in the gorge portion and additional two on each abutment parallel to the flow.
Drifts on each abutment at about 60 m elevation interval, with a minimum of one on each abutment.
10 m in fresh rock (proved by geophysical or any other suitable method). About two holes to be extended deep (equal to the maximum height of the Dam in the gorge portion, and one each in abutment.
10 m in fresh rock (proved by geophysical or any other suitable method).
(c) Tunnels
.
Drill holes one at each of the portal and adits sites and additional at least one every 1-5 km interval depending upon the length of the tunnel.
Drift, one each at the portal and adit sites.
Drill holes 5-10 m below the tunnel grade of maximum possible depth. Wherever it is not possible to drill along the central line of the tunnel, the holes can be shifted.
The explorations shall be so planned as to satisfactorily p portray the geological structure and tunneling conditions.
Drift shall be extended up to 10 m in fresh rock or up to tunnel face.
(d) Barrage and Weirs
Drill holes along the axis, 150m or less apart with intermediate pits to delineate weak and vulnerable strata with a minimum of two additional
Drill hole 1.5-2 times of maximum head of wafer below the average foundation level or 5 m in the fresh rock whichever is less.
24
holes on each abutment parallel to the flow.
.
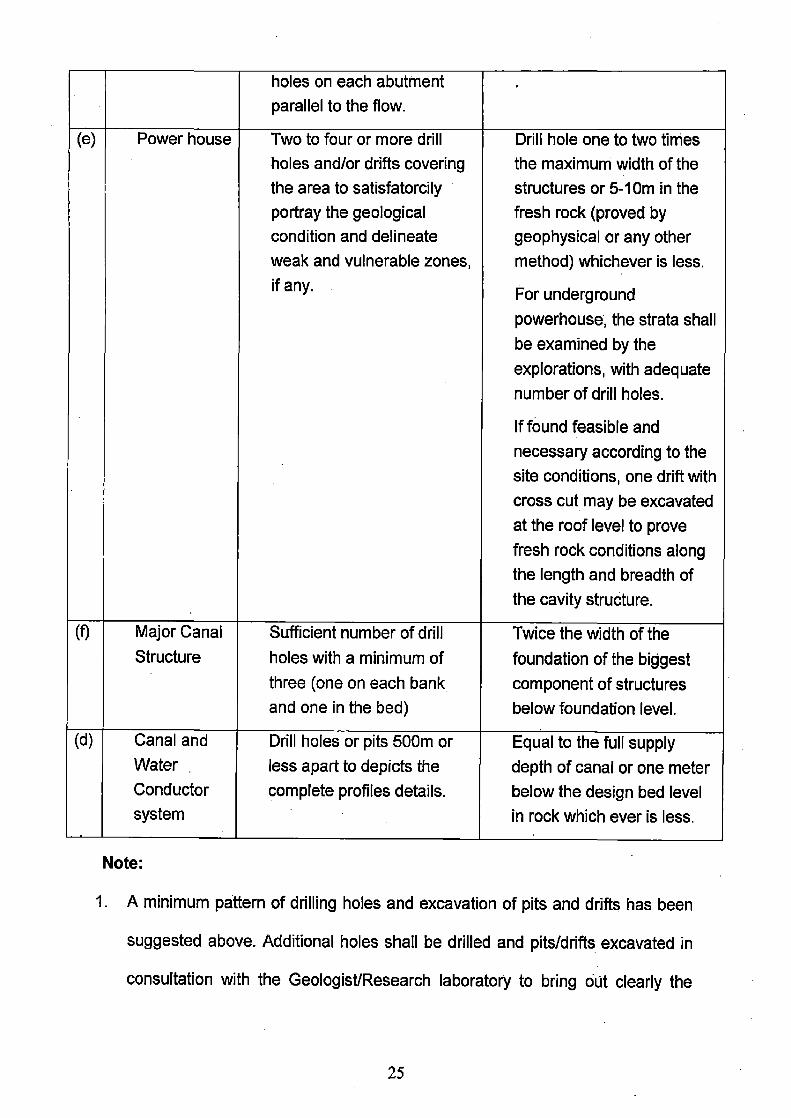
(e) Power house Two to four or more drill holes and/or drifts covering the area to satisfatorcily portray the geological condition and delineate weak and vulnerable zones, if any.
Drill hole one to two times the maximum width of the structures or 5-10m in the fresh rock (proved by geophysical or any other method) whichever is less.
For underground powerhouse, the strata shall be examined by the explorations, with adequate number of drill holes.
If fOund feasible and necessary according to the site conditions, one drift with cross cut may be excavated at the roof level to prove fresh rock conditions along the length and breadth of the cavity structure.
(f) Major Canal Structure
Sufficient number of drill holes with a minimum of three (one on each bank and one in the bed)
Twice the width of the foundation of the biggest component of structures below foundation level.
(d) Canal and Water . Conductor system
Drill holes or pits 500m or less apart to depicts the complete profiles details.
Equal to the full supply depth of canal or one meter below the design bed level in rock which ever is less.
Note:
1. A minimum pattern of drilling holes and excavation of pits and drifts has been
suggested above. Additional holes shall be drilled and pits/drifts excavated in
consultation with the Geologist/Research laboratory to bring out clearly the
25

foundation and abutment characteristics especially the weak zones requiring
special treatment.
2. Disturbed and/or undisturbed soil samples, foundation of rock samples, etc.
shall be collected and tested at an interval of 1.5 m depth or change of strata
for laboratory tests. In situ permeability tests shall be carried out in the
selected drill holes in different strata at different elevations. Other in situ tests,
shear tests etc. shall be carried out in the hole or other suitable locations
depending upon the nature of the strata and design requirements.
3. The bearings capacity test and in situ testing of the foundation rock shall be
carried out for item (b) to (f) at average foundation level.
4. The plans and cross-sections shall be prepared on the scale as indicated in
Table 3.2
5. The logs of the holes/pits/drifts shall be prepared as per I.S. Nos. 4453-1967
and 4464-1967.
In case the situation is near hilly slopes, stability of the hill slopes should be
investigated. In situations subject to avalanche the extent of falling material should
be studied. The creep of soil covered hill slopes should also be investigated.
In case of situation at high altitude, investigation should clearly bear out the
suitability of foundation material with particular reference of the following
conditions
(a) Permafrost;
(b) Stability of glacial and fluvoglacial material with a thin soil cap.
The presence and extent of artesian pressures below the foundation
material should be investigated to determine whether the site is suitable for power
house location or not.
26

3.6. TOPOGRAPHICAL INVESTIGATIONS
Survey of catchment, L-section of river and the site of important structures
are essential for layout, planning, design and estimate of the structure.
Taking help of whatever maps already exist, it is desirable to make
reconnaissance tours of the site for preliminary stage of investigation, but for final
stage it is essential to carry out topographical surveys and prepare large-scale
maps of selected sites for reservoirs, dams, and other important structures.
The following types of maps are generally required for planning & design of
a scheme.
Type of study Type of map
a) Alternative schemes of (i) General topography of catchments,
developments scale between 1/100,000 and 1/50,000: level contours at 30 m or 15m intervals.
b) Reservoir studies (ii) General purpose —local topography of selected valleys; scale about 1/10,000: CI = 3m or 6m.
Special purpose — detailed
(iii) topography of areas affected by
timber clearance, flooding or property, etc; scale about 1/1000:
level contours at 2m, intervals or closer.
Studies for dams, conduits (iv) Detailed topography of selected
power stations, etc sites; scale from about 1/1000 to
1/250 : level contours at 2m or 1m interval
27

All the above maps may be produced either by ground surveying or aerial
surveying methods. If a ground survey is adopted large scale maps such as (iii)
and (iv) call for precise work with total station or by theodolite and level, while
small —scale maps such as (i) and (ii) are often derived from less precise
tachometer and plane-table surveys.
The main factors influencing choice between aerial and ground survey
methods are
(a) Extent of area: In general, the greater the area to be surveyed the greater
the opportunity for economy by aerial survey as compared with ground
survey. This is particularly the case in undeveloped areas.
(b) Location and access: Distance to nearest habitable camp or supply base
affects speed and cost of both ground and aerial surveys in general, the
more dense the vegetations and difficult the access, the greater the case
for adopting aerial survey, provided that this method will give an acceptable
degree of accuracy.
(c) Climate- Seasonal extremes of temperature, rainfall, snowfall and ice, etc.,
limit the time available for survey work; while mist, low clouds, dust storm
etc., may reduce visibility sufficiently to make aerial photography
impossible at certain times of the year.
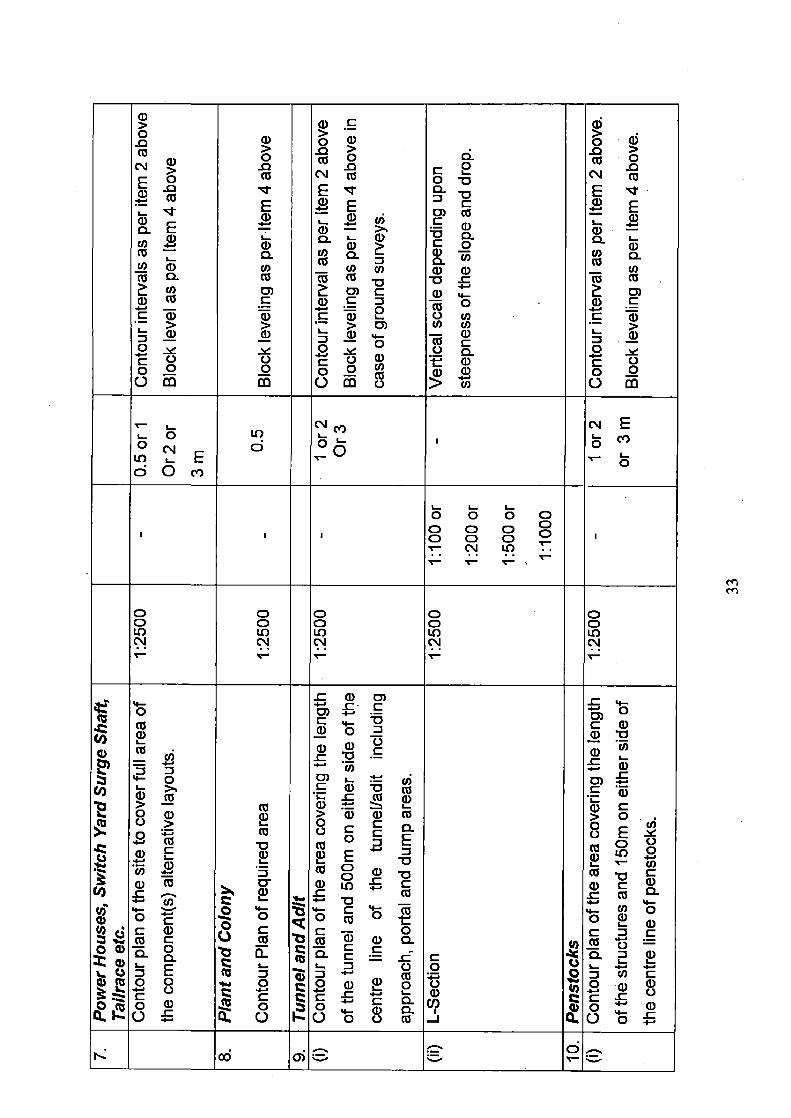
The details of topographical and geological surveying maps of various
structures required for proper planning etc are given in Table 3.2
28

AC I- Ca
CC
co
ca L 0 c ._ Cn a)
0
c:),... In as 03 .c a) a) J
• CD C C 05
U o_ U) a) fir,
co > . Ca . a) . • ED 0 (13
C 0 -0 a) .1-• 8 ifi .a a) _0 _ .c cf, u) E a a) in .1-. •-• 4- a) 0 c (1) -§ (.9 0_1
0 ,(12 LL r
, ....._.
>1. Oa " 1:) t15 CCI 0 .0
E cri ,-..c Q .....
T) a) 4-' a) 4-
>, .. N co
Cf) C LI- CO o ,, ..c - c.) it cu 0 ea
, :•.7..
.0 >
aZiD E
Y 0 2' Cii
a5 1-
c co
0 0- eL a) a)
..---.
.-
U) 0- 0 ..... o = 0
"0 CD
a) 0 sa o 0
w
D . E 5:<- CO
z..,' :.
_1 LL i
?
Cont
ou
r
Inte
rval
Sca
le
Ho
rizo
ntal
Ver
tica
l
Or) 0 0 r • • r
CD 0 x--
CV CZ) CD 0 0- r• • •
0 0 0 CD' • •
Are
a t
o b
e co
vere
d/Ex
tent
of
surv
eys
r
stre
am w
ithin
M
WL+
5 m
or th
e fa
r th
ese
p oin
t af
fect
ed b
y bac
k w
ater
L-S
ect
ion to
be
Dow
nstr
eam
10 km
fro
m the
axi
s of
the
stru
ctur
e or
up
to
near
est hea
dw
ork
whi
chev
er is
les
s.
• r .---.. z..7... ..-. := ...-L.

Leve
ling at 50 m
or
less
in
terv
als.
Fol
low
ing
item
s shall
be s
how
n o
n
the
cros
s se
ctio
ns -
(a)
Dat
e of
surv
ey a
nd w
ater
level
on that
day
(b)
Min
imum
Wat
er L
evel
(c) Max
imum
hi
stor
ical
/Obs
erve
d
H F
L
(d)
Rapi
ds
and Rock
out
crop
s et
c.
O-c?
Olis
Cont
our
inte
rval
for
, slo
pe les
s th
an
10°
to
horizo
ntal
— 1
m o
r le
ss,
I I I
0./
8 r
0 0 r r
0 0 r . . r
0 0 r . . N--
1
0 0 I.0 C.'4 r
0 0 in 04 . . r
0 0 LO C4 ..r-
0 0 LO C.1 r
Riv
er S
urv
eys
(b)
X-S
ect
ion
Ups
trea
m
X-S
ection
@ 2
00
m int
erva
l up
to M
WL+
5m
or 1
km
on e
ithe
r si
de o
f the
fi r
m b
ank
which
ever
is les
s and fo
r a d
ista
nce
of 2
km fro
m
the a
xis of
the
str
uctu
re a
nd t
her
eaft
er a
t
one
km inte
rval
cor
resp
ondin
g to
the
leng t
h
of the
L-Sect
ion.
Dow
n s
trea
m
X-S
ect
ion @
200 m
in
terv
al u
n to
hist
oric
a l/
obse
rved
HFL
+1 m
on e
ither
sid
es o
f fir
m
bank fo
r a d
ista
nce
of 2 to 5
km f
rom
the
axis
of
the s
truc
ture
depen
ding
up
on the
mea
nder
ing
nat
ure
of the
rive
r.
Alo
ng the
axis
of t
he
stru
ctur
e
Res
erv
oir
Con
tour
Pla
n cov
erin
g an
are
a up
to a
n
e lev
atio
n of M
WL+
5m.
..-.. . - ..--. r--.
0 m

slop
e 10
° to
30°
— 2
m a
nd
slo
pe
mor
e th
an 3
0° —
3 m
.
Con
tour
in
terv
als a
s p
er it
em
2
abov
e. B
lock
leve
ling
to b
e on
10
m
grid
bas
is.
Bloc
k le
velin
g o
n 5
0 m
or
less
grid
basi
s de
pend
ing
up
on t
he s
lope
of
the
land
.
Leve
ling
at 5
0 m
or l
ess
inte
rval
.
E co L
o L() ci "
in E a ,- O 0
.
. i O O •,-• • • •,-.
a a , • • .-
a OC) (.**1 't-'
a a LO C.1 x
a a LO CN 1-"
a a LO CN "-
Grid
pla
n w
ith c
onto
urs
of t
he s
ite c
over
ing
the
area
up
to 2
50 m
up-
stre
am a
nd
500
m
dow
nstre
am o
f the
axi
s ex
tend
ing
up to
an
elev
atio
n of M
WL+
5 m
or
mor
e de
pend
ing
upon
the
site
con
ditio
ns, (
tail
chan
n el a
rea
shal
l be
adeq
uate
ly c
over
ed).
Grid
pla
n w
ith c
onto
urs
of t
he s
ite c
over
ing
an a
rea
up to
1 km
on
eith
er s
ide
of th
e fir
m
bank
and
10
0m fro
m
the
up
stre
am/d
own
stre
am t
ip o
f the
gui
de b
unds
, par
alle
l to
the
flow
(ta
il ch
anne
l are
a s
hall be
ade
quat
ely
cove
red)
.
Wat
er C
ondu
ctor
Sys
tem
(i)
L-Se
ctio
n
(ii)
Cros
s se
ctio
n at
50m
inte
rval
(iii)
Strip
con
tour
Pla
n co
ver
150m
on
eith
er
ri
'CI Ili

Bloc
k le
velin
g as
per
item
4 a
bove
Bloc
k le
velin
g as
per
item
4 a
bove
Bed
leve
l/bank
leve
l and
FSL
of t
he
cana
l a
nd
HF
L of dr
ain
to
be
indi
cate
d o
n th
e cr
oss-
sect
ion.
Ref
er it
em 1
als
o
1.0 ci Lo
0
I 0 0 . . ‘ \- - 0 0 .,— . . .--
1:15
00
0 1.0 c1
0 1.0 c1
0 0 0 . . t-
0 0 In . . T-
side
of th
e ce
ntre
lin
e o
f th
e ca
na
l or
depe
ndin
g up
on t
he r
equi
rem
e nt w
hich
ever
is m
ore.
Can
al Str
uctu
re
Grid
pla
n w
ith c
onto
urs
of t
he s
ite to
cov
er
an a
rea
up
to 3
00m
on
eith
er s
ide
of th
e
cent
re li
ne o
f the
can
al -
100m
do w
nstr
eam
of t
he p
oint
of
exi
t of w
ater
and
100
m
ups t
ream
of t
he p
oint
of w
ater
inle
t.
Cro
ss s
ectio
n of
the
drai
n al
ong
t he
cent
re
line
of th
e ca
nal
Dra
inag
e s
urv
eys
for u
pst
ream
an
d
dow
nstre
am of th
e ce
ntre
lin
e o
f th
e ca
nal
for a
dequ
ate
leng
th a
s re
quire
d fo
r hyd
raul
ic
Cal
cula
tions
.
For P
lan
Long
itudi
nal a
nd Cro
ss s
ectio
ns
,,-; ...1.0
r''''' ■••••
■•■■ "•■■■•"'
t... : = ••• moo
Con
tour
inte
rval
s as
per i
tem
2 a
bove
Bloc
k le
vel a
s p e
r Ite
m 4
abo
ve
Bloc
k le
velin
g as
per
Item
4 a
bove
Con
tour
inte
rval
as
per
Item
2 a
bove
Bloc
k le
velin
g as
per
Ite m
4 a
bove
in
case
of g
roun
d su
rvey
s.
Con
tour
inte
rval
as
per I
tem
2 a
bove
.
Bloc
k le
velin
g as
per
Item
4 a
bove
.
0.5
or 1
Or 2
or
3m
10 ci 8 , „-,-,
.,-- ....,
N E i_. co o
v-• 8
. . O 0 O ,-- .,..
Le; o o N ,
,I5 cp c).„ .1%). ,
ED O 0 • •
1:25
00
o O
(74 e•-•
LO a a U) CNI . . 1-
o o LU CN! N- 1:
2500
Po
wer
Ho
use
s, S
wit
ch Y
ard
Su
rge S
haft
, Tai
lrace
etc
.
Con
tour
pla
n of
the
site
to c
over
full
area
of
t he
com
pone
nt( s
) alte
rnat
ive
lay o
uts.
Pla
nt
an
d C
olo
ny
Con
tour
Pla
n of
req u
ired
area
Tun
nel
and
Ad
it
C
onto
ur p
lan
of t h
e ar
ea c
ove r
ing
the
leng
th
of th
e tu
nnel
and
500
m o
n ei
ther
sid
e of
t he
cen t
re
line o
f t h
e tu
nn
el/a
dit i
nc
ludi
ng
appr
oach
, por
tal a
n d d
ump
a rea
s.
C 0
7..) N co
Pen
sto
cks
Con
tour
pla
n of
t he
area
cov
erin
g th
e le
ngth
of
the
stru
ctur
es a
nd 1
50m
on
eit h
er s
ide
of
t he
cent
re li
ne o
f pen
stoc
ks.
O,-, ., :7....

Ver
tical
sca
le d
epen
ding
upo
n
stee
pnes
s of
the
slop
e.
Dep
endi
ng u
pon
the
loca
tion
of th
e
area
.
Sam
e as
reco
mm
ende
d un
der e
ach
item
abo
ve o
r oth
erw
ise
stat
ed in
the
tex t
.
Show
ing
loca
tion
of s
truct
ures
, bo
re-
hole
s, tri
al p
its, d
rifts
an
d p
oint
s
10 m
or
less
As
spec
i-
fied
o o 8 o o c c: a
(..1 IP. • • N— 'l— l-
0 0 In (74.
1:10
000
or
1: 5
0000
1:25
00
L-S
ectio
n
Soi
l Con
serv
atio
n S
urve
y
Plan
of a
rea
subj
ect t
o er
osio
n, s
lides
and
slip
s. Geo
logi
cal m
aps
Res
ervo
ir an
d ri
ver v
alle
y st
ruc t
ures
(D
ams,
Bar
rage
, Tun
nel,
Pow
er H
ouse
, Pen
stoc
ks
impo
rtan t
stru
ctur
es o
n ca
nal a
nd w
ater
cond
ucto
r sys
tem
)
Foun
datio
n in
vest
igat
ion
map
s
C ai CL
. cV cM

whe
re i
n s
itu tes
ts w
ere
cond
ucte
d
etc.
Show
ing
logs
of b
oreh
oles
, tri
al p
its,
drift
etc
. and
oth
er fe
atur
es o
f the
foun
datio
ns.
Loca
tion
of di
ffere
nt m
ater
ials
of
cons
truct
ion
pit/d
rill
hole
s.
Show
ing
prof
i le a
long
the
grid
line
s
up to
the
dept
h ex
plor
ed
O fa f.12
a) w a) a) a) ti > _c i_ C n O 1 b :6 i- ..0 0 C Cl) CO 4-
. V- e) Lo ci E
I
0 0 . . T-'
0 0 li- . .
0 0 LO C\! .%- 1:
2500
0 Lf) C1 ..t-
1:10
000
or
11:1
5000
Cro
ss-s
ectio
n
Bor
row
Are
a an
d Q
uar r
ies
C Cu
Sect
ion
CO
Soi
l Sur
veys
C
CL
4 ,- in

3.7. METEOROLOGICAL INVESTIGATIONS
When a proposal is found feasible, a water shed contoure plan should be
prepared showing:
(a) The prominent orographical features.
(b) Normal annual isohyets.
(c) Location of rain gauge stations in and around the catchments area and
discharge sites, (distinguishing between ordinary and self recording
station).
(d) Sites of sediment observation.
(e) Location of pan evaporation stations.
(f) Inter State / International boundaries.
Meteorological Data for the following should be collected for the project
area.
(i) Temperature records of the area, (daily minimum, average and
maximum)
(ii) Daily wind velocity
(iii) Pan evaporation data.
(iv) Rain fall
3.8. OTHER IMPORTANT INVESTIGATIONS
3.8.1. Construction Material Investigations
Before the scheme is feasible it would be necessary to investigate whether
right type of material is available in sufficient quantity.
36

3.8.2. Ecological Surveys
The over all ecology of the region is likely to be effected by construction
and operation of major irrigation and hydro-electric project. It is, therefore,
necessary to make at least surveys and investigation of the following.
3.8.2.1. Affected flora & funa
A survey plan of the areas likely to be submerged constituting as
encroachment on wild life habitat as a result of the proposed structure should be
incorporated in the report. The report should also indicate the area of reserve
forests, wild life sanctuary, national park if any, that may come under
submergence as also the estimate of the wild life population in the area proposed
to be submerged. The quantum of the forest used as cover and grassland used
for grazing by animals in the area proposed to be submerged should also be
indicated, as also the details of such areas in the remaining parts of the sanctuary
/ park. The report should also discuss whether the area to be submerged is of any
special importance to wild life in their annual / seasonal migration. Indication
should be given of the size of any islands that may be created due to the
formation of the lake as well as of the possibilities of alternative proposals for
relocation of the effect wild life in the region. Wherever necessary, the cost of
these should be provided in the project estimate.
3.8.2.2. Historical and cultural repercussions
Sites of great historical and cultural importance should be carefully
looked for during investigations and where such sites can not be avoided; a
complete inventory of these should be made. The feasibility of shifting such
monuments to safe areas should be investigated in consultation with the
Archeological Department.
37

If the area submerged is of outstanding scenic beauty, it should be
investigated as to how best the damage to this amenity of natural heritage can be
minimized
3.8.3. Special Surveys for Hydro Electric Project
The surveys of hydro electric project shall include:
(i) Present position of power supply in region, system loads, load factor,
kWh generated per kW installed.
(ii) Details of major loads to be served, future peak and energy demands,
and anticipated system load factor.
(iii) Investigation regarding earth resistivity in connection with sub station
designs.
(iv) Power evacuation route survey.
38

CHAPTER - 4
LAYOUT OF A RUN-OF-RIVER HYDROPOWER SCHEME
4.0. GENERAL
Hydro power plants exhibit a great deal of variety. Almost every
hydropower project has some special feature not common with other projects of
the same type. In the case of run-of-river scheme, there is practically no storage
to modify the river flow. Whatever flow of water is there in the river at a particular
time, the same is diverted to the turbine for generation of electricity (except in the
monsoon period).
4.1. LAYOUT OF SCHEME
Layout of hydropower scheme mainly depends on the topographical,
geological considerations. Generally layout of every hydropower scheme is
unique, and each project has different challenges due to topographic and
geologic constraints. But the layout of every run-of-river scheme comprises of the
following components/ structures.
Diversion arrangement.
(ii) Intake structure
(iii) Water conductor system:- open channel or conduit/ Tunnel.
(iv) Fore bay / surge tank
(v) Penstock
(vi) Power house
(vii) Tail race system.
39

Fig.4.1 (a) : Typical layout of run-of-river scheme with pondage
Intake Desilting chamber
Power Channel
--Forebay
Penstock
-Power House
\\\NN Tail Race
Fig. 4.1(b) : Typical layout of Run-of-river scheme
40

Diversion Dam
4.1.1. Diversion Arrangement
For run-of-river scheme, diversion arrangement may be barrage /weir or a
low dam. In case of barrage or weir ( generally built on foot hills) the gross head
on turbine is elevation difference between FSL and tail water level but in the case
of a diversion dam ( generally made on non-perennial rivers or in mountainous
terrain) there is additional head on turbine due to rising of water level on U/s of
dam, so in this case the gross head on turbine is elevation difference between
FRL and TWL. When there is a dam for diversion then initial cost for construction
of dam is generally more than cost of barrage/weir. There is extra submergence
also in U/s of dam.
The choice between dam and barrage can be decided by geology,
topography and economy.
(a)
Dam : two types of developments can be possible, in one case power
house is sited at toe of dam ( as shown in fig. 4.2) and in other case
power house can be far away from the dam. In this case some
additional head is available fig. 4.1.
Fig.4.2: Power house at toe of dam
41

(b) Barrage / Weir: In this type of development power house is far away
from the diversion arrangement fig. 4.1 (b). Silt excluders at the intake
are provided to check the silt entry in water conductor system.
4.1.2. Intake Structure
Intake is a structure to draw water from the source and to let it pass into
water conductor system in required quantity and quality. In hydro electric
development general requirement for the quality of water will be that it should be
free from debris, trash, ice and silt.
The intake structure has to perform the following functions:
(i) to minimise sediment entry
(ii) to prevent entry of trash and floating debris
(iii) To ensure and regulate the required quantity.
Intake should ensure smooth entry with minimum disturbance to minimize
head loss. The requirement of assured water supply would fix the location of the
intake in
(a) Plan so that water is always available,
(b) Elevation so that the invert level of the intake is at such location that the
minimum water level is always above this invert level with some water seal,
in case of under pressure conduit for carrying water
As already has been mentioned, the important thing in the location of an
intake is to ensure that water is always available with minimum sediment at the
intake.
42

4.1.2.1. Components of Intake
An intake structure should always have an arrangement by which it may
be possible to control the flow of water. This arrangement is generally provided by
introducing hydraulic gates and sometimes valves in the intake structure. Intake
structure consists of several components to perform the following functions.
The intake opening is provided with bell mouth entry.
Regulating gates are provided. It is also fitted with stop logs or bulk
head.
The intake opening is also fitted with trash rack and its cleaning
arrangement.
The location and river approach to intake is so decided that sediment
entry is minimised. Sediment exclusion and ejection devices are placed
in the upstream and downstream of the intake.
Although the functional requirements of the intake remain the same as
discussed but their shape, layout and operating heads vary according to the
diversion structure and water conductor system.
4.1.2.2. Dam Intake
The dam intake being an integral part of the dam is possible only in
masonry or concrete dams of either gravity or arch type (shown in figure 4.3 ).
In case of an intake required for an earth or rock fill type of dam the
conveyance system will generally be tunnel and so it will come under the category
of a tunnel intake. Tunnel Intake is meant to convey water from a natural tank or
reservoir formed by a dam, to the tunnel.
43

Trash Rack Structure
Service Gate
Trash Rack Inspection Gallery
Mechanical Hoist
Fig.4.3 : Dam Intakes
44

4.1.2.3. Tower Intake
The tower intakes are normally on hill sides, not far off from the dam,
when it is not convenient to provide the dam intake on the upstream face of the
dam. A typical tower intake shown in Figure 4.4
Fig. 4.4 : A typical tower intake
4.1.2.4. Shaft Intake
A vertical or near vertical shaft, driven at the reservoir site, carries water
for desired use.
4.1.3. Head Race Channel I Tunnel
The water from the stream enters through the intake, into the power
channel / power tunnel. In case of power tunnel, flow may be both under pressure
or free flow.
45

4.1.3.1. Head Race Channel
Extra care has to be taken for the following points.
(i) The loss of water during conveyance in the channel is the least so that
production of power is not reduced. For this reason the power channels
are generally lined.
(ii) The slope of the channel is as flat as possible. A flatter slope would
mean less head loss resulting in greater energy.
(iii) Due to flat slope, silt ejector is very essential, otherwise silting will
occur in power channel.
4.1.3.2. Head Race Tunnel
The minimum diameter of the power tunnel is subject to the constraints of
workability during construction. For mechanical construction the minimum
diameter required is 3 m. Some important consideration for HRT.
i) Loss of head during conveyance through the tunnel shall be minimum, for
this reason head race tunnels are normally lined.
ii) Minimum slope, so that the internal pressure does not increase too much
along the length of head race tunnel.
iii) Level of HRT at surge tank location shall be such that the maximum down
surge for critical reservoir level shall be above the HRT by a suitable
margin, so that air will not be sucked into the penstock.
iv) For a given discharge, head loss is proportional to D-5 . Hence to minimise
head loss and hence maximise power generation, diameter of HRT shall be
large.
v) However, larger diameter will increase the construction cost. Based on this,
lower possible diameter shall be preferred.
46
vi) Normally, a balance between investment cost and power generation loss is
made, on the basis of equi-marginal annual cost and annual income from
generation. Such a diameter is known as economical diameter.
vii) The design of free flow tunnel is like a open channel.
4.1.4. Fore Bay/ Surge Tank
In case of head race channel, a fore bay is provided at the down stream
end. A fore bay is a reservoir which furnishes space, immediately available for the
acceptance or delivery of water to meet the requirements of load changes,
generally fore bays are provided for 2 minute of storage of water(').
In case of H.R.T. surge tank is provided at junction of HRT and penstock.
Usually surge tanks are necessary parts of medium and high head plants. This is
particularly true when there is a considerable travel distance between intake and
turbine i.e. through long conduits, considerable inertia effects arise from large
mass of water due to motion.
This mass is of such magnitude that considerable force is required to
accelerate or retard it. The pressure rises resulting from water hammer effects can
be limited by use of relieve valves / deflectors in the case of reduction in load,
however, for starting of the turbine, these are of no use. Hence, there has to be
some provision for supplying the additional water required at the time of start and
to store when load is reduced or turbine is fully stopped. This is achieved by
providing a surge tank.
4.1.4.1. Functions of surge tank
a) Flow regulation.
b) Water-hammer relief of pressure regulation,and
c) Improvement in speed regulation.
47

The surge tank must be of such size and proportions that
(i) It shall contain the maximum possible upsurge for all reservoir
levels and different load conditions.
(ii) The lowest down — surge for critical reservoir level and load
change shall not allow air to be sucked into the penstock.
(iii) The range of surges shall not be so large as to cause
undesirable governor movement or difficulty in picking up the
load.
IS 7396, Part-I-1974 specifies the conditions as below.
a) Maximum upsurge corresponding to
(i) Full load rejection at max. reservoir level.
(ii) Where considered necessary specified load acceptance,
followed by full load rejection at the instant of maximum velocity
in HRT and higher of the two shall be adopted.
b) Minimum down-surge level corresponding to:
(i) Full load rejection at MDDL followed by specified load
acceptance at the instant of maximum negative velocity in HRT.
(ii) Specified load acceptance at load or speed-no-load at the
minimum reservoir level.
4.1.4.2. Types of surge tanks
These are basically of three types;
(i)
Simple Surge Tank: in this type of surge chamber is a plain cylindrical
shaft. It is usually connected to the conduit by a short connecting shaft or
port. The simple surge chamber is a large and costly structure, commonly
not used. Such type of surge tank is shown in Figure 4.5 (a).
48

Fig. 4.5 (a): Simple Surge Tank
(ii)
Restricted Orifice Type Surge Tank:- In such type surge tank, the entry of
water to the tank is through a narrow (as compared to cross-sectional area
of HRT) opening, leading to appreciable friction losse in the passage
creating a deceleration head which retards the flow in head race tunnel.
Restricted orifice type surge tanks are shown in Figure 4.5 (b).
////:r/4", iiiiiiiiii»iii4 /4Y. 4! /////. 4V/, ./ 4,4 V4 V //74'4, //77,1 re' // // /4 OW. /// //4 ////ll. 4474' r
Fig. 4.5 (b) Restricted Orifice Type Surge Tank
(iii)
Differential Surge Tank:- This type of surge tanks are much more efficient
than simple surge tanks (shown in Figure 4.5 c ). This type of surge tank
has an additional internal riser pipe provided with annular ports connected
with the chamber. These annular ports open into the outer surge shaft,
thus, interlinking the riser pipe and surge shaft.
49

/// 1///1//// 1/1/1/1/11//// /I ///h
Fig. 4.5( c ) : Differential Surge Tank
Surge tank /fore bay are always located as close as possible to the
powerhouse in order to reduce the length of penstock to a minimum and
preferably on high ground.
4.1.5. Penstock
Conduits carrying water from the surge tank or fore bay to the generating
machine, are known as penstocks.
These are pressure conduits since they are subjected to appreciable
internal pressure. Pressure will be varying from minimum at the upstream end to
the maximum at the junction with scroll case.
Penstocks are generally of steel. Concrete pipes may be used for small
heads.
4.1.5.1. Number of Penstock
One penstock may be provided for each machine or one penstock may
serve more than one machine or all the machine in a power station. In case, one
penstock serves- more than one unit, at the tail end a suitable branching
arrangement will have to be adopted. The chdice of number of penstocks in a
M1574 ba,
9.32
01•°"P°'

hydro power development will depend upon overall economy, fabrication and
handling feasibilities and operational convenience.
4.1.5.2. Diameter of Penstock
Larger diameter will need greater thickness, since hoop stress in conduit
section varies directly with the diameter. For welded penstocks the maximum wall
thickness lies at about 60 mm, where as riveted penstocks are manufactured up
to about 40 mm wall thickness (16) • Diameter of penstock is directly related to flow
velocity in it. H.K. Barrows has suggested that the maximum velocity in penstock
should not more than 6.4 m/sec, as per USBR criteria maximum permissible
velocity is 0.125V2gH (in m/sec).
4.1.6. POWER HOUSE
In power house complex, turbines, generator, gantry crane and other
accessories are housed. Sometimes inlet valve and transformers are also housed
in power house complex.
A hydropower station, can be either surface or an underground power
house. The choice depends on topography, geology and economy.
4.1.7. Tail Race
For discharging water after the generation of electricity in the power house,
either a tail race channel or a tail race tunnel will be required (choice depends on
the general topography of the area.
4.2. TYPE OF RUN-OF-RIVER SCHEMES
Run-of-river type development does not substantially alter the regime of the
river. It implies that the water is diverted from the river without altering the pattern
51

of flow. It also implies that no storage reservoirs are required. They are of two
types
4.2.1. Run-of-River Scheme with Pondage
In this, pondage is provided at the diversion structure sufficient to store
water for a few hours in a day to be used to supplement the river flows to meet the
peaking demand of a few hours. The pondage in a run-of-river scheme is provided
by putting high gates at the diversion structure. This is the usual practice at
present and it meets the peaking requirement in the grid.
4.2.2. Run-of —River Scheme without Pondage
Diversion structure is provided across the flow of river, and whatever flow
of water is available at any period of time is diverted to generate power. There is
no modification in river flows.
52

CHAPTER - 5
POWER PLANNING
5.0. GENERAL
Power planning involves fixing of design discharge, design head, installed
capacity, energy generation, pondage requirement for peaking etc. This chapter
describes the procedure for fixing above parameters.
5.1. FIXING OF DISCHARGE
The power output of a hydropower plant depends directly on discharge and
net head available on machine.
The year to year and month to month variations of the discharge are large
and long term data gives the average, minimum and maximum discharges at any
site for power generation.
During planning, assumption is made that in future years discharge will fall
within the extremes of past records.
In case of run-of-river scheme, design discharge for power plant can be
fixed with the help of flow duration curve (FDC) which can be prepared with
available historical data.
5.1.1. Flow Duration Curve
The FDC represents the relationship between the magnitude of discharge (
on Y-axis) and frequency of daily, weekly , monthly or some other time interval( on
X-axis) for the project site, providing an estimate of percentage of time a given
stream flow is equalled or exceeded over a historical period.
The flow duration curve can be plotted by two different methods. These
are: (i) total period method and (ii) calendar year method. Both methods utilize the
flow data available for the entire period for which records are available.
53

5.1.1.1. Total period method
The entire available record is used for constructing the flow duration
curve. For example ten years record would produce 120 values of monthly
average flows or 360 ten daily flows. These are first tabulated in the descending
order starting from the highest discharge in the entire period and ending with the
lowest value in the ten year duration. The resulting flow-duration curve would
then be drawn.
5.1.1.2. Calendar year method
In this method, years of different dependability such as 50 %, 90 % are
worked out then from 36 numbers ten daily discharge values, the FDC are made.
Some times 90 % and 50 % dependable synthetic year FDC are also made. For
construction of mean year FDC, each year's average monthly values are first
arranged in descending order. Then the average flow values corresponding to
the wettest month, second wettest month and so on up to the driest month are
found out by taking arithmetic mean of all values of the same rank. These
average values are then used for plotting flow-duration curve. Such a curve would
have only twelve points (36 points if 10 daily flow data are used).
5.1.1.3. Shape of FDC
The shapes of flow duration. curve (Fig. 5.1) which are the characteristics
of the river have been categorized into following categories.
1. Steep drop FDC
2. Moderately flat FDC
3. Flat FDC.
54

Dai
ly/ W
eekl
y/ Te
n da
ily F
low
(cum
ec)
SHAPE OF FLOW DURATION CURVE
0
20
40
60
80
100 % Time Flow Equaled or Excceded
Figure. 5.1: Different shape of floe duration curve
The typical shapes of the above FDCs are shown as in Fig. 5.1(a), 5.1(b)
and 5.1(c) respectively and described below.
In the first case for a certain change in the value of % time discharge is
equalled or exceeded, we get a considerable gain in the magnitude of discharge
as compared to that obtained in third case.
In the first case the large increase in discharge is available for a short
period for energy generation whereas in third case same increase in discharge will
be available for longer time for energy generation.
5.1.2 Review of Literature for use of FDC
Critical review of literature reveals that FDCs are universally used to
estimate the planned energy generation from a run-of-river project. The
hydropower generation from run-of-river project is generally based on 90%
dependability.
55

In case of a run-of-river scheme, ten daily discharge of any particular
dependability is found by arranging the discharge of any particular period in
descending order with rank varying from 1 to n (where n is number of values). The
exceedance probability i.e. % time the flow is equaled or exceeded is calculated
by Weibull method (i.e. m/n+1). This can be adopted for drawing total or yearly
FDCs. A synthetic flow year can be formed having a particular dependable flow in
each ten day period. These flows will not correspond to any particular calendar
year flows. This approach has been recommended by Nigam(19) and is on
conservative side.
According to Masonyi(16) for estimating the total energy of a stream or river
system as the first step using. the average flow duration curve based on 30 to 40
years hydrological data. This will be total area under the average year flow
duration curve and will be the gross energy potential of the river at that site
assuming that head will not materially change with discharge since harnessing of
this energy would not be techno-economically feasible, a reducing factor may be
applied. In some case the energy generation may be 0.75 to 0.80 of the gross
energy. The two probable extreme shapes of flow duration curves are shown in
Fig. 5.1 (a) & 5.1(c). High reduction factor may be applicable to the shape of FDC
indicated by curve shown in Fig. 5.1(c).
Masonyi(16) has further stated that range of technically utilizable power can
possibly be selected on the basis of economic considerations. In the earlier years
the water power capable of being developed was characterized by the discharge
available for 85 to 90% of duration i.e. the discharge available for 325 days in a
year. In many cases, however, the lowest cost of energy production can be
attained by utilizing the flow available approximately 50% of time i.e. 182 days in a
year.
56

In the interest of more effective utilization of undeveloped hydro potential,
in recent years there has been a trend to increase the degree of utilization
towards shorter duration. With the advent in long distance transmission lines,
integrated power grid system, the plant discharge has been selected as high as
Q34 (flow equaled or exceeded for 34% time).
Masonyi(16) has recommended construction of average year FDC and the
selection of discharge for installed capacity in a range of Q34 and Q5° based on
economic considerations.
J.G. Brown(3) described the selection of design discharge, which can be
intercepted from streams with wide and erratic varying flow conditions, on the
basis of economic consideration. To begin with, mean / average discharge is
calculated. As a general rule the maximum discharge which can be intercepted
will be several times the mean discharge depending upon the shape of FDC.
Economics of power generation shall be calculated considering the multiple of
mean flow. In U.K. this multiplying factor is generally 3. The design discharge and
installed capacity are fixed at which the cost of unit generation is minimum.
Literature review has revealed that design discharge with an exceedance
probability on flow duration curve (FDC) as low as 10 to 20% depending on the
shape of FDC has been adopted in some of the run-of-river hydro electric
schemes in European countries (Masonyi(16)). This is decided on the basis of
techno-economic analysis.
The design discharge in the schemes of Ganga Valley corresponds to an
exceedance probability of approximately 30 to 45% on FDC. Some examples are
given in Table 5.1
57

Table. 5.1: Exceedence probability of some existing project
Name of project Exceedence probability i.e. % time
the flow is equaled or exceeded
1. Maneri Bhali hydro project
stage I (3 x 30.0 MW )
46
2. Maneri Bhali hydro project
stage II (4 x 76.0 MW )
33
3. Chilla Hydro project 46 before Tehri dam.
( 4 X 36.0 MW) 33 after Tehri dam
4. Srinagar hydro project 21
(6 x 55.0 MW)
(Source-Reference 12 & 22)
5.2. FIXING OF HEAD
Head depends on the topographical and geological characteristics of site.
Existing natural head must be properly appraised and must be utilized to the
optimum.
The gross head at any instant is the difference between the water level in
the barrage or dam pond or the foe bay and in the tailrace. The gross head is
usually dependent on the variation in reservoir level. Tail water level variations are
small. Hence there will be a range of maximum, minimum, and mean gross head.
In run-of-river schemes the pond level in the diversion structure is practically
constant, hence the gross head is also constant.
The net head at any instant is the gross head minus the losses. These
losses vary with the flow depending on the load through the conduit, so that the
net head varies. During planning stage frictional losses in conduit/ channel are
58

accounted for as other losses are quite insignificant in comparison with friction
losses.
5.3. INSTALLED CAPACITY
When design discharge through FDC procedure has been fixed and design
head is also ascertained the power out put is worked out by
P= 9.81 QH q
The installed capacity is based on economic considerations or feasible
maximum generation. According to J. G. Brown(3), economics of power generation
shall be calculated considering the multiple of mean flow. This multiple can be up
to 3, and the maximum flow through the head race tunnel will be somewhere
between 1.0 to 3 times the mean flow.
Masonyi(16) has recommended that discharge for installed capacity in a
range of Q34 and Q5° based on economic considerations of average year flow
FDC.
The procedure to work it out is to select four or five discharges in the
proposed range. For each discharge there will be an installed capacity and for that
work out the total energy generated and the cost of scheme. In this way for each
discharge one gets the cost of generation per unit of energy. The discharge and
corresponding capacity which gives the minimum cost of per unit generation is
selected as design discharge. Alternative the capacity at which incremental
energy per MW increase in capacity falls sharply, should be selected as optimum
capacity and corresponding to it will be the design discharge.
A procedure which is currently being followed in preparing the feasibility
report of run-of-river hydro schemes is as follows.
Work out unrestricted annual energy generation for all the years for
which discharge data is available.
59

Arrange the annual energy generation for all the years in
descending order.
Select 90% and 50% dependable years.
Select a range of installed capacity for 90% dependable year
Workout with the 90% dependable year discharges and the energy
generation for 4 or 5 installed capacities in the selected range.
Work out the incremental energy per MW increase in installed capacity
and select the capacity beyond which the increase in incremental
energy falls sharply.
While selecting installed capacity it is to be ensured that it will generate -
energy for at least 25 to 30 % of time in a year.
With the selected installed capacities the annual energy generated in
90% and 50% dependable years is worked out for financial studies.
The discharge corresponding to the selected installed capacity is
worked out for design of scheme.
5.4. ENERGY GENERATION
For all hydropower installation, the foremost requirement is to generate
maximum power at the possible minimum cost. It is worked out for 50% and 90%
dependable flows using the installed capacity decided earlier. The financial
aspects are generally worked out for energy availability at 90% dependability.
5.5. PONDAGE
As per Mosonyi(16) " pondage is that rate of storage in run-of-river
developments which can cover daily peaks only".
"Over short periods, such as a day or a week, the natural flow may be at a
uniform rate, high enough to meet the average demand, too high for the hours of
60

low demand, and not high enough for the peak demand. Limited storage will
enable the rate of flow to be varied to suit the variation of demand; short term
storage of this nature is sometimes described as pondage" by J. G. Brown(3).
H. K. Barrows(2) define pondage as the holding back and releasing later of
water at the dam/ barrage of a water power development (1) to equalize daily or
weekly fluctuations in river flow or (2) to permit irregular hourly use of water by
turbines to accord with fluctuations in load demand.
As per Nigam(19) by pondage , some modifications in the withdrawals of
water for generation of electricity is possible.
Pondage takes care of the hour-to-hour fluctuations over a day or
occasionally, day-to-day fluctuations over weekly cycles(6).
Any plant is said to have ample pondage if the capacity of the pond above
the intake is sufficient to take care of hour to hour fluctuations of the load on the
plant throughout the period of a day(5).
Hence pondage in run-of-river schemes can be of help to meet the peak
demand for few hours in a day.
61
CHAPTER -
LUHRI HYDROELECTRIC PROJECT - A CASE STUDY
6.1. THE PROJECT
Luhri Hydro Electric Project is proposed to harness the hydroelectric
potential of river Satluj between KEPU and BINDLA villages in Shimla district of
Himachal Pradesh (fig. 6.1). The proposed project is a run of river type
development. A low dam can be constructed at the site and pondage can be
provided to run the scheme as a peaking station. A water conductor system of
about 30 Km length gives a gross head of about 202 m when a dam of about 80 m
high is built.
6.2. BACKGROUND INFORMATION
Satluj river rises from Rakas Tal fed by Mansarover lake (at about 4570m
above mean sea level) in Nan Khorsam province of Tibet and after flowing in West
direction for a distance of about 300 Km., it enters India near Shipkilla in District
Kinnaur. The Satluj descends from about 2590 meter at Khab to ± 936 meters at
Rampur Town, in Distt. Shimla, the main supply station to Distt. Kinnaur. The
Satluj flows in this whole reach between narrow cliffs and therefore there is no
open ground worth describing all along its banks, thus excluding the possibility of
making any storage Darn.
62


The water of the river is more or less discoloured. Cultivated fields in
terraces are generally at considerable heights from its bank and are thus
immune from the turbidity of the water, which is largest in summer months.
Within the limits of the District Kinnaur the river is not navigable owing to the
rapidity of flow and presence of boulders. After it leaves the boundary of the
District Kinnaur near village Chaura it enters Shimla District.
The Satluj is joined by several tributaries in Nari-khorsam such as
Changchu, Drama Yankti, Chonak, Manglan, Transuo, Summa, Trap etc.
"Immediately after entering the Indian territory near Shipkilla, the river takes a
south-westerly direction on its way to Bhakra gorge about 320 Km away after
crossing, which it emerges into the plains of the Punjab
The significant tributaries streams and rivers that flow into the Satluj river
from south or along its left bank are successively the Tidong, Hogis, Gyamthing,
Baspa, Duling, Sholding, Manglad etc. Likewise those entering from the north or
its right bank are the Spiti River, Ropa, Kirang, Kashang, Pangi, Choling, Bhaba,
Sorang, Kut and Ganwi Khud. In between there are many seasonal streams that
meet the Satluj river and its tributaries. At Khab it receives the Spiti river where
the bed of the stream is still about 2590 meter above the mean sea level.
The fall of Satluj from its source to the plains of India is very uniform. The
height of the bed is about 4570m near Rakas-Tal, 2530m near Shipkilla, 915m at
Rampur, 416 m at Bilaspur and 350m at the Bhakra Dam site.
The total catchment area of the Satluj above the Bhakra dam site is about
56875 Sq.km and above the Nathpa diversion site is about 49820 Sq.km from
Bhakra to Nathpa, 148 Km on a straight line and 193Km by river, the drainage
area is comparatively narrow with an average width of about 35km. This part of
64
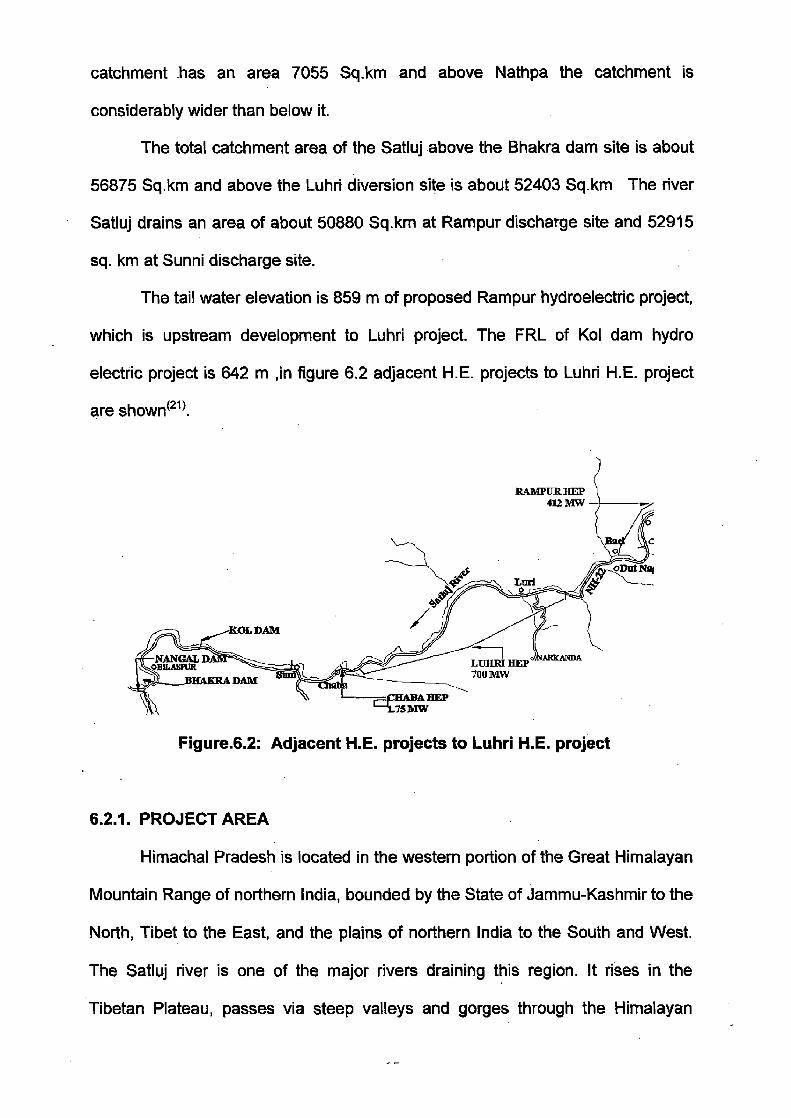
catchment has an area 7055 Sq.km and above Nathpa the catchment is
considerably wider than below it.
The total catchment area of the Satluj above the Bhakra dam site is about
56875 Sq.km and above the Luhri diversion site is about 52403 Sq.km The river
Satluj drains an area of about 50880 Sq.km at Rampur discharge site and 52915
sq. km at Sunni discharge site.
The tail water elevation is 859 m of proposed Rampur hydroelectric project,
which is upstream development to Luhri project. The FRL of Kol dam hydro
electric project is 642 m ,in figure 6.2 adjacent H.E. projects to Luhri H.E. project
are shown(21).
Figure.6.2: Adjacent H.E. projects to Luhri H.E. project
6.2.1. PROJECT AREA
Himachal Pradesh is located in the western portion of the Great Himalayan
Mountain Range of northern India, bounded by the State of Jammu-Kashmir to the
North, Tibet to the East, and the plains of northern India to the South and West.
The Satluj river is one of the major rivers draining this region. It rises in the
Tibetan Plateau, passes via steep valleys and gorges through the Himalayan

Mountains and foothills and meets the Arabian sea across the plains of Northern
India.
, • ' 41P 4
- ..."".• 14.1?"'" '..:4 / ,_ 1. ..,... , .0 ' "k. ,or.1 -“.4e....!: ..'."Tt ':? ' AV •
- , '•b•-■, ..., „.r- - ...."'-':'4,-=•.e-i.- :....)
0 .'' _ ..t .. - 4'4 ..e • ,
,.. 1 4; ...' ...4 ':. • '''.... f '-'': . (1;4' '.•-r- '... .rly • , ?iZillki4-* -
'... ,... ,:r. , „ ',*--t•-• • ,
, , , '
, - 3*.
,:t4..44
...,04%-. ' . _t; 4 i fotsgr
,c :, • '.
S
..,--.!,.. • .,-,,,.....z.,... r . ,
, 1 , s ' A . -;.-1. ..t , '-.•'1.:ft ' -,,, . .7 --rk—p, - -- r `" ,..)P -1-• — '•., , ,•—• 1
.,_., . - +, • ?." _ .21..cY2e:r.' ..,-_41, -' ' S
Fig. 6.3: Dam site view at river Satluj
The project site area is located about 100 km from Shimla, the State
capital, and is an upstream development of the proposed Kol dam Electric Project
(800 MW) on the Satluj river. While the power house will be located near village
Bindla ropeway bridge in Karsog Tehsil of Mandl District., the Dam will be located
near village Kepu, 1.5km upstream of Sainj on NH-22(Fig. 6.3). The reservoir will
extend upto Tail Race of Rampur Hydel Project near Bael village opposite
Duttnagar

6.2.2. SEISMICITY
The project area lies in an active seismic region, zone IV of the Seismic
Zoning Map of India. Available data on seismcity within a radius of 150 kms of the
project shows that earthquakes having a magnitude greater than 5 on the Richter
scale occur at frequent intervals. Important seismic events which have taken
place in the past 150 years and caused significant damage include the 1905
Kangra quake (magnitude 8 +), the 1908 Kullu quake (magnitude 6.0), the 1945
and 1947 Chamba quakes (magnitude 6.5 & 6.6 ), 1975 Kinnaur quake
(magnitude 6.8) and the 1991 Uttarkashi quake (magnitude 6.6).
6.2.3. HYDROLOGY
At Luhri diversion dam site there is no gauging station. The ten daily
discharge data of Sunni discharge site (D/s of Luhri darn site having catchment
are of 52915 Sq KM, Annexure-VII/1 )-and Rampur discharge site (U/s of Luhri
dam site having catchment are of 50880 Sq KM, Annexure-VII/2) is used to
generate the ten daily discharge data for Luhri dam site (having catchment area
of 52403 Sq KM) on the basis of catchment area at Rampur & Sunni gauging site.
6.2.4. GEOLOGY
The project area lies in the formation of Kullu and Shali formations. The
Kullu Group mainly comprise of gneiss with quartzite bands, carbonaceous and
graphitic phyllite and schist with limestone bands. The Shali formation comprises
of slate, dolomite, limestone and quartzite with shale partings. All the rocks are
well foliated. The general trend is N-S with moderate dips toward East. These are
transacted by a number of joints of which the foliation and strike joints are the
most predominant followed in frequency by steeply dipping transverse joints.
Rocks are generally covered by glacial deposits, rock debris, alluvial terraces and
67

fans. The soils of the Satluj valley are relatively poor sandy loam and exposed bed
rock. In the valley bottom there is virtually no soil.
68

CHAPTER - 7
HYDROLOGICAL STUDIES
7.0. GENERAL
Discharge Data at Luhri dam site is not available, but ten daily discharge
data is available at two gauging stations on same river in the vicinity of the project
site.
7.1. AVILABLE FLOW DATA
Ten daily discharge data is available at downstream of proposed dam site
i.e. at SUNNI on same river. This data is available from Jan 1972 to May
2005.Sunni discharge site has a catchment area of 52915 KM2.
(Annexure —VII/1).
Ten daily discharge data of another site is also available which is upstream
of proposed dam site i.e. at Rampur , from this site ten daily discharge data is
available from Jan 1972 to May 2004.( Annexure —VII/2 ).. Rampur site has a
catchment area of 50880 KM2.
7.2. ANALYSIS OF FLOW DATA
After analysis and applying consistency check to above ten daily data of
Sunni and Rampur discharge site, it is established that linear relation exists
between data of both sites, the correlation is given below, and graphically shown
in figure 7.1.
Q Rampur = 0.8828 X Q Sunni +3.8384
(7.1)
r = 0.9915
69
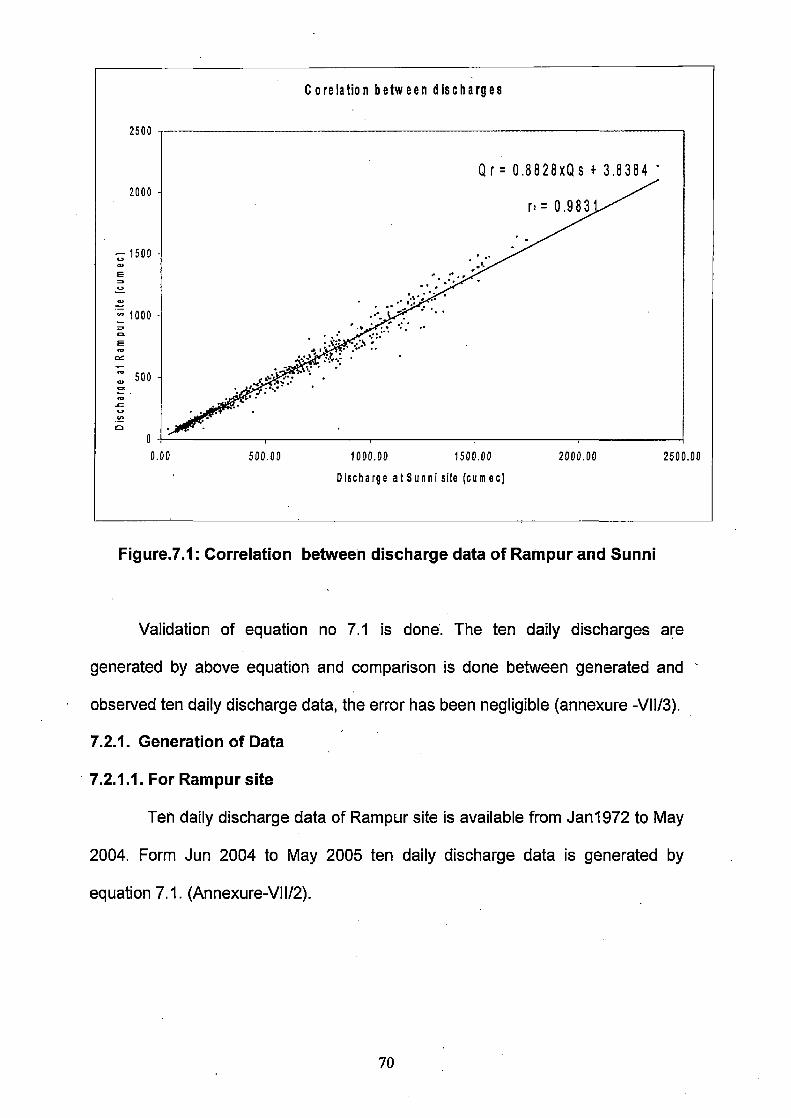
Corelation between discharges
0.00
500.00
1000.00
1500.00
2000.00
2500.00
Discharge at Sunni site (comae)
Figure.7.1: Correlation between discharge data of Rampur and Sunni
Validation of equation no 7.1 is done. The ten daily discharges are
generated by above equation and comparison is done between generated and
observed ten daily discharge data, the error has been negligible (annexure -VII/3).
7.2.1. Generation of Data
7.2.1.1. For Rampur site
Ten daily discharge data of Rampur site is available from Jan1972 to May
2004. Form Jun 2004 to May 2005 ten daily discharge data is generated by
equation 7.1. (Annexure-VII/2).
70

RAMPUR GAGING SITE CATCHMENT AREA OF 50,880 SqKM
LUHRI DAM SITE CATCHMENT AREA OF 52,403 SqKM
SUNNI GAGING SITE CATCHMENT AREA OF 52,915 SqKM
DIRECTION OF FLOW OF RIVER SATLUJ IM*
7.2.1.2. For Luhri dam site
By above line diagram, it is clear that the additional catchment area
between Rampur and Sunni is 2,035 Sq KM. Similarly catchment area between
Luhri dam site and Rampur is 1,523 Sq KM. The difference between catchment
area of Luhri and Sunni is only 512 SqKM, (approximately 1 % of total catchment
area of river Satluj at Luhri dam site)
The long term series at Luhri dam site has been developed on the
proportionate catchment area basis, by using the discharge data at Rampur and
Sunni discharge site.
QLuhri= QRampur+ ()Sunni QRampur)X k
Where k= Al - Ar - 0.7484 As-Ar
Al = catchment area of Luhri Dam site (52,403 KM2)
As = catchment area up to Sunni (52,915 KM2)
Ar = catchment area up to Rampur (50,880 KM2)
The ten daily discharge data at Luhri dam site is given in Annexure -VII/4
71

7.3. CONSTRUCTION OF FLOW DURATION CURVE
Flow Duration Curves is discussed in section 5.1.1.The flow duration curve,
relates flow rate with duration , does not give any sequential information regarding
the flow it has discharge plotted on the Y-axis and the percentage of time
duration for which that magnitude (or more) is available plotted on X-axis. Since
there is considerable difference of opinion on the FDC to be used in power
studies, a comparative study of various FDCs in a case is made and describe
below.
7.3.1. FDC for total Duration
All ten daily discharge values of entire period are used for plotting FDC of
total duration, shown below in Fig. 7.2
FLOW DURATION CURVE OF TOTAL DURATION
2500
2000
1500
1000
500
0 10 20 30 40 50 60 70 BO 90 100
Fig % Time is Equaled or Excceded
Fig. 7.2: FDC of total duration
7.3.2. FDC for Mean Year Flow
Ten daily discharge of same block/month is summed up for all the years
and then divided by total number of years, then this average discharge for ten
daily block is used for FDC. So we get 36 ten daily average flows and they are
arranged in descending order. (Annexure-VII/5). It does not relate to any particular
year data (Fig 7.3).
72

FDC of Mean Year Flow
1200.0
1000.0
800.0
600.0
400.0
200.0
0.0
o o 20.0 40.0 60.0 • 80.0
100.0 120.0
%time' Equalled or Exceacitaci
Fig.7.3: FDC of mean year flow
7.3.3 FDC for 90 % Dependable Year
Total energy generated for entire period is calculated, then these energy
are arranged in descending order . The yearly energy of (n+1)x0.9th rank gives
the 90 % dependable year . In our case n equals to 33 years (as we are having
flow data of 33 years). When the yearly energies are arranged in descending
order then from top 31st row gives the 90 % dependable flow year and that
particular year which corresponds to this , is known as 90 % dependable year. In
our study year 2001-02 is 90% year and ten daily discharge data of this year ie
2001-02 is arranged in descending order and with this data we get FDC for 90%
dependable year. (shown in fig. 7.4, related ten daily flows are given in
Annexure-VII/6)
73

FDC of 90 % Dependable Year
1000 900 -800 -700 -600 -500 -400 -300 -200 -100 - 10
- Dai
ly F
low
in(c
umec
s)
10 20 30 . 40 50 60 . 70 80 90 100 % Time Flow Equaled or Exceeded
0 0
FDC of 50 % Dependable Year
E
.— c 800
• 600 -
74
•
400 -
200
0 0 10 20 30 40 50 60 70
% Time Flow Equaled or Exceeded
1400
1200 -
1000 -
80 90 100
Fig.7.4: FDC for 90% dependable year flow
7.3.4 FDC for 50 % Dependable Year
As describe in 7.3.3 ,if we use (n+1)x0.5 =(33+1)*.5=17th year flow data
then we get FDC of 50 % dependable year similarly as described in above
paragraph. (Annexure-VII/6)
Fig.7.5 : FDC for 50% dependable year flow
74

7.3.5 FDC for 90% and 50 % Synthetic Year Flow
All ten daily discharges of each year are arranged in descending order. In
our case we have 33 years data so we have 33 rows and 36 columns, then we
take 31st rows data for 90% and 17th row data for 50 % synthetic year flow. The
FDC by such discharge data are known as FDC for 90% synthetic year & FDC for
50% synthetic year, and are shown in fig 7.6 & fig. 7.7 respectively.
(Annexure-VI I/7).
FDC for 90% dependable synthetic year
1200
1000 -
800 -
600 -
400 -
200 -
O 0 20 40 60 80 100
Fig.7.6: FDC for 90% synthetic year flow
FDC for5O% dependable synthetic year
1400
100
1200 -
1000 -
800 -
600 -
400 -
200
0 , , , .
0 20 40 60 80
Fig.7.7: FDC for 50% synthetic year flow
75

Comnaricon of different FDC s of river 2400.0
2200.0
2000.0
1800.0
; 1600.0
o 1400.0 _
Is: 1200.0
bw. 1000.0 -
0 800.0 _
600.0
400.0
200.0
0.0 0 10 20 30 40 50 60 70 80 so 100
%of Time is Equalled or Exceeded —o—•M X90 D ---50 D —.-90 S —50 S —all avr —total duration
7.4 COMPARISON BETWEEN DIFFERENT FDCs
FDC drawn with total duration flow data gives the actual picture of past, in
this case for FDC of total duration is constructed with the help of 1188 data in
number.
Fig.7.8: Superimposition of different FDC of river Satluj
Different FDCs OF Bhagirathi River
CIVI
100
Tan
daily
dis
char
ge(c
uman
)
) 0
C: ) 0
0
O
C C
1
.--,,, N.
b....
--- --.....■;___
--"■14■..",----, --...._:....,..- _— • '="'"..---- — —
U 0 10 20 30 40 50 60 70 80 90
%time equalled or excede
90% dependab 50 % depen 90 % —.— 50 % — mean year — - -.-- - — synth. synthet
Fig.7.9: Superimposition of different FDC of river of Ganga basin
76

From above it is evident that there is difference of opinion regarding
selection of the year of FDC to be used. Some suggest 90% dependable synthetic
year, some 90% dependable year and some (Mosonyi & Brown ) advise the use
of average year FDC for deciding the design discharge and installed capacity. In
one case on river Satluj various FDCs have been worked out and superimposed
on each other in the enclosed fig. 7.8. It can be seen that the lower limb of FDCs
from 40% of time to 100% of time it is practically same for all the FDCs, but these
differ in the upper limb between 0 to 40%of time, but average year FDC is found
the near average of all the cases. Similar trend has been observed at one site of
river in Ganga basin. Hence it is suggested to use average year FDC for planning
the scheme. So in our energy studies we have used mean year FDC.
7.5 DESIGN FLOOD ANALYSIS
As stated earlier, no discharge data is available at Luhri dam site. However
24 years (from 1979 to 2004) record of annual maximum discharge in respect of
Satluj river at Sunni site are available, and 42 years ( from 1963 to 2004 )
record of annual maximum discharge at Rampur site is also available. The two
methods have been used for computing the flood discharge of different return
periods.
( i ). Gumbel's method,
( ii ). Log-Pearson type III
7.5.1. Flood Analysis with Sunni Data
Maximum discharge at Sunni site is worked out by above both methods
(Annexure-VII/8 ). The maximum flood discharge at Luhri dam site is deduced as
given below, and are given in Table 7.1.
C1Suni (CALuhri CASuni) 3/4
77

7.5.2 Flood Analysis with Rampur Data
Maximum discharge at Rampur site is worked out by above both methods
(Annexure-VII/9 ). The maximum flood discharge for 1000 years return period, at
Luhri dam site is deduced as given below,and are given in table 7.1.
QLuhri - QRampur (CA Luhri CARampur)3/4
Table.7.1: Maximum flood discharge at Luhri dam site
Description Gumbel's method By Log-Pearson type III
By Rampur Data 7439 cumecs 5427 cumecs
By Sunni Data 8234 cumecs 10284 cumecs
So we adopt maximum flood of 10284 cumecs .
78
CHAPTER-8
POWER POTENTIAL STUDIES
8.0. GENERAL
It is a run of the river scheme with pondage to harness the hydropower
potential of river Satluj. The 33 year discharge data fo Luhri dam site is generated
(Annexure —VII/3).
8.1. POWER STUDIES
Discharge data for 33 years from 1972 to 2005 in ten daily blocks are
available. Energy generation for each year (June to May) has been worked out.
The gross head is taken as 202 m, after calculation of losses (Annexure —VIII/1)
the net head is 162 m.For such head Francis Turbines are proposed to be use for
this project. The efficiency of the generating unit is taken as 92 %. The
environmental releases is taken as 15 % of the minimum ten daily discharge of
mean year. This work out to be 14 cumecs. The unrestricted energy computed are
enclosed. (Annexure —VII/6).
8.2. DISCHARGE DATA
The ten daily discharges reduced at the project site for the 12 months in ten
daily blocks for mean year( Annexure-VII/5 ), for 50 % dependable year(1980-81),
and those of 90 %dependable year(2001-02) enclosed in Annexure —VII/6.
8.3. INSTALLED CAPACITY ANALYSIS:
As per Mosonyi(16), Q34 is around 452 cumec and Q50 comes around 182
cumec, which corresponds 662 MW and 266 MW respectively.
J. G. Brown(3) recommends that maximum flow for power generation can
be taken upto 3 times of mean flow, so by this approach our discharge is worked
79

Installed Capacity v/s Energy Generated
Installed Capacity (MW)
5000.0
4500.0 -
- 4000.0 -
a 3500.0 -
I 3000.0 -
2500.0 - d 0 2000.0
1500.0 - c tu 1000.0 -
500.0 -
0.0 0 200 400 600 800 1000 1200 1400
out equal to 1161 cumec, so we can fix our installed capacity upto 1700 MW by
this criteria.
Fig.8.2: Installed capacity v/s energy generated
Considering the inflows of different years, annual energy generated has
been worked out for different installed capacities (300MW to 1300 MW , with
increment of 50MW and are worked out in Annexure-VIII/2 for mean year flow
and in Annexure-VIII/3 for 90% dependable year flow. It is seen from these
Annexure that the annual energy generation increases from 1996 million units to
4626 MU for mean flow, 1837 MU to 3774 MU for 90 % dependable flow,
1904MU to 4499 MU for 50 % dependable flow, 1927 MU to 4572 MU for 90 %
synthetic year flow, 2006 MU to 4568 MU for 50 % synthetic year flow
respectively, as the installed capacity increases from 300 MW to 1300MW. For
different installed capacities energy generated, incremental increase in energy
and incremental increase in energy per MW for different flows are tabulated in
Annexure-VIII/4. The graph of installed capacity V/s energy generated for mean
year flow is shown in Figure 8.2.
80

Installed capacity Vs Incremental Increase in Energy per MW
Incr
emen
tal Incr
ease
in
Ener
gy p
er M
W
4.5 4 -
3.5 - 3-
2.5 -2-
1.5 - 1-
0.5 - 0
• Mean year
A 90% dependable
300 400 500 600 700 800 900 1000 1100 1200 1300
Installed cap (MW)
8.4. INSTALLED CAPACITY SELECTION
Annexaure-VIII/2 shows the total annual energy generated against
different installed capacities for mean flow. It is seen that with increase of installed
capacity the annual energy generation increases. Installed capacity Vs
incremental increase in energy per megawatt graph is plotted for different flows
(Fig 8.3). For installed capacity of 600 MW, 700 MW, 800 MW and 900 MW,
energy generated, discharge required, corresponding exceedence probability for
different flows are given in Annexure -VIII / 5.
Fig.8.3 : Installed capacity vis incremental increase in energy
Considering the incremental energy/MW increase in MW in all FDCs as
well as the period of minimum 100 days for which the power house can run on
installed capacity, the installed capacity is fixed at 900MW. For 900MW, 615
cumecs of discharge will be required having exceedance probability of 29 % on
Mean Year flow FDC (reference- Fig: 7.3) and which gives 3832 MU of energy.
At the installed capacity of 900 MW the power and energy in ten daily
blocks of the 12 months of the mean year is shown in Annexure-VIII/2. The
comparison between annual energy generated ( for installed capacity of 900 MW)
81

for different ten daily flows are given in Annexure-VIII/6, for mean year and 90 %.
dependable year it is 3832 MU and 3347 MU respectively.
8.5. UNIT SIZE
For the mean year flow, in ten daily blocks the power generated is given in
table 8.1
Table: 8.1 Range of power and number of days
Power range(MW)
No of 10 day block
<100 100-150 10 150-300 9 300-450 2 450-600 2 600-750 3 750-900
>900 10
From Table it is clear that 900 MW power will be generated for 100 days in
a year while 100 to 150 MW will be generated for about 100 days. It is therefore,
proposed to install 6 units of 150 MW each. During this 100 days period when less
than 150 MW power is available, only one unit will be run at 70% of load.
8.6. ENERGY GENERATION
At the installed capacity of 900 MW, power and energy in ten day blocks of
the 12 months for mean year flow and 90 % dependable year is shown in
Annexure-VIII/2 and VIII/3.
Energy generation 100% and 95 % plant availability for different ten daily
flows are given in Annexure —VI11/6 and Villa . For installed capacity of 900 MW
and for different flows corresponding plant load factors and generated energy is
given in Table 8.2
82
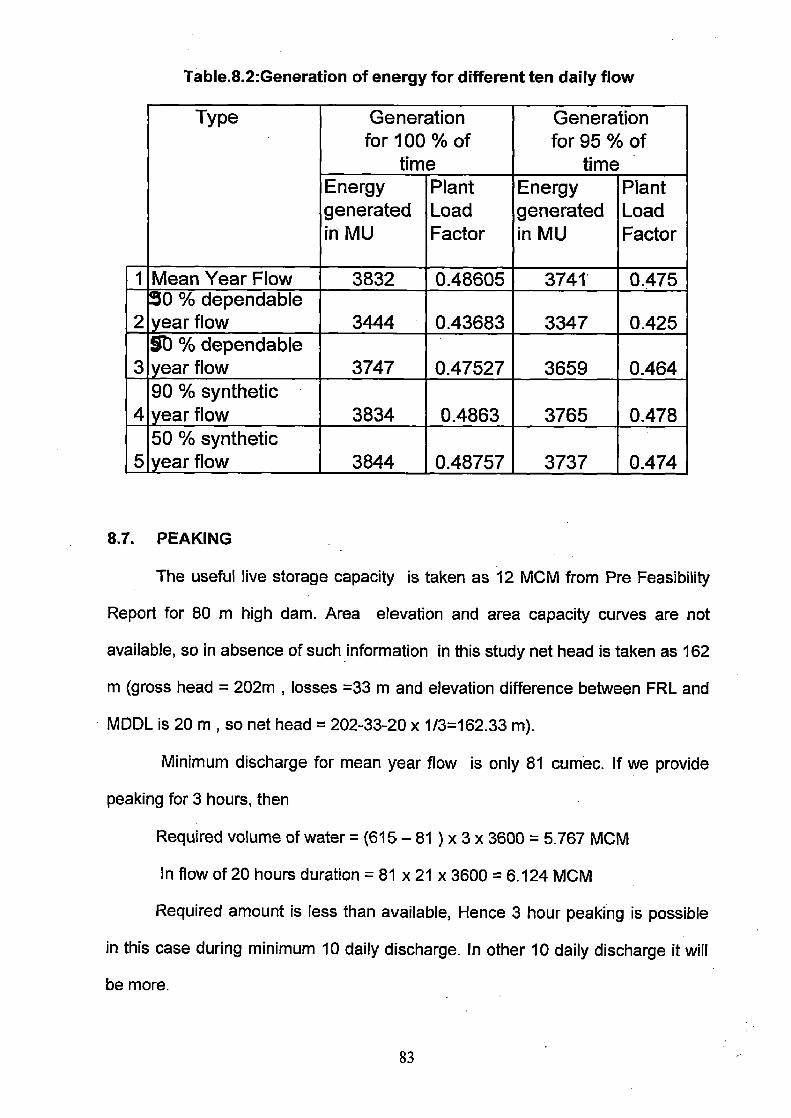
Table.8.2:Generation of energy for different ten daily flow
Type Generation for 100 % of
time
Generation for 95 % of
time Energy generated in MU
Plant Load Factor
Energy generated in MU
Plant Load Factor
1 Mean Year Flow 3832 0.48605 3741 0.475
2 30 % dependable year flow 3444 0.43683 3347 0.425
3 50 % dependable year flow 3747 0.47527 3659 0.464
4 90 % synthetic year flow 3834 0.4863 3765 0.478
5 50 % synthetic year flow 3844 0.48757 3737 0.474
8.7. PEAKING
The useful live storage capacity is taken as 12 MCM from Pre Feasibility
Report for 80 m high dam. Area elevation and area capacity curves are not
available, so in absence of such information in this study net head is taken as 162
m (gross head = 202m , losses =33 m and elevation difference between FRL and
MDDL is 20 m , so net head = 202-33-20 x 1/3=162.33 m).
Minimum discharge for mean year flow is only 81 cumec. If we provide
peaking for 3 hours, then
Required volume of water = (615 — 81) x 3 x 3600 = 5.767 MCM
In flow of 20 hours duration = 81 x 21 x 3600 = 6.124 MCM
Required amount is less than available, Hence 3 hour peaking is possible
in this case during minimum 10 daily discharge. In other 10 daily discharge it will
be more.
83

CHAPTER-9
CONCEPTUAL LAYOUT
Conceptual layout of main components of the project are as following:-
9.1. RIVER DIVERSION WORKS
9.1 .1 . Diversion Tunnel
The river diversion is proposed for the construction of the dam and
appurtenant work , through a diversion tunnel, located on the right bank of the
river Satluj. It is proposed to adopt design diversion discharge as 550 cumecs for
LHEP because the ten daily average flow during the working season ( Oct.- Apr.)
at dam site is about 387 cumecs .For Rampur HEP design discharge for river
diversion has been fixed as 540 cumecs which is up stream development of Luhri
Hydro Electric Project.
9.1.2. Diversion Dam
It is proposed to construct a straight gravity type concrete dam 78m high
(above river bed level) near Kepu village, 1.5 Km u/s of Sainj Village, to divert 769
cumecs of discharge. Out of this, discharge of 154 cumecs is meant for flushing
of sediments through the desilting arrangement. The dam shall be founded on
sound rock below the river bed level. The dam at the top shall be app.342.5m
long. The top of dam, FRL and MDDL are 848m, 845m and 825m respectively.
The distribution of sediment in a reservoir is a complex phenomenon and is
govern by a number of factors relating to the characteristics of the catchment ,
geometry of reservoir, the sediment inflow and the operation of reservoir(23). Live storage is app. 12 Mcm after taking into account siltation of reservoir. The cross-
section of river Satluj at proposed dam site is shown in fig. 9.1
84

Cross-section of river Satluj at proposed dam site
900
880
860
840 - O
820
800 -
780 -
760 0
368.96, 833
0, 871.69 -
se 856.37 344 ; • 8 342.96, 849
111.96,841.17
143.74. 826.39 326.96, 824.7 163.72,820
189.72, 798.75 289.96, 797
201.38, 779.8 267.66, 779.8 47.36. 774.18
100
200
300 400 Distance (m)
Fig.9.1: Cross-section of Satluj river at darn site
To flush the reservoir periodically under sluice should be provided at invert
level of El. 790m. The sluices will be controlled by radial gates from the control
room located at top of the dam itself.
9.2. INTAKE STRUCTURE
The intake structure comprising six no. intakes, proposed in the dam body
itself shall be designed to handle a total discharge of 769 cumecs (615 cumecs for
power generation and 154 cumecs for requirement of silt flushing. The invert level
at El. 811.25m. Each intake should pass 128 cumecs of flow. The rectangular
opening of 10.15m X9.40 m (h) at the start of the intake shall be reduced to 7.2
x6.0(h)m through a suitable bell mouth transition. Vertical lift gates shall be
provided to control the flow of water into the desilting chambers. A suitable
transition is provided to convert the rectangular opening into a 7.10m dia horse
shoe tunnel. The intake tunnels shall lead the water into the desilting chambers.
85

A row of trash rack piers having trash racks up to FRL is proposed to be provided
in front of intake blocks.
9.3. DESILTING ARRANGEMENT
The sediment load is only a fraction of a gm/lit. during low flows, but
increase to an average of 10- 12 gm/lit. in high flow periods(25). To remove
sediment a cut & cover surface desilting arrangement has been proposed on the
left bank of river to arrest the silt particles greater than 0.20mm size from the
water before it enters the head race tunnel. The arrangement comprises six
parallel compartments each 510 m long, 28m high and 15 m wide. The surface
desilting chambers would be of RCC and designed to resist full internal pressure.
Each chamber shall have a 3m wide collection trench in the center. The
sediments from the collection trench will flow down to the flushing tunnel below
this trench, and ultimately flushed out to the river through main flushing tunnel.
9.4. WATER CONDUCTOR SYSTEM:
9.4.1. Head Race Tunnel
The length of head race tunnel, from d/s of desilting tank to the main surge
tank is 29 Km. having 12.50 m finished diameter and circular in section. The
tunnel diameter is designed for discharge of 615 cumecs at a flow velocity of
5.01m/sec. The friction loss in HRT is 31.22 m.
The head race tunnel shall be concrete lined with sections fully
supported/partially supported with steel ribs, besides necessary rock bolting as
required by geological considerations.
9.4.2. Surge Shaft
The main surge tank, located at 29 Km from the 0 RD of head race tunnel,
will be of 36m dia and 164m height. The dia of restricted orifice shall be 5.0 m.
86

Detailed calculations are worked out in Annexure-IX/1, and relative elevations are
shown in figure 9.2
EL. 932.00
ROCK/3E17S (STAGGERED).
10D THICK si-dirc
]2500-P CEINNECT3G SHAFT
EL 667125
EL 654.25
12500 so HRT I1 6550 d• PENSTOCK • (3 Nos.)
(STa
GB
R D)
Fig. 9.2: Surge Shaft
9.4.3. Pressure Shaft
Three penstocks, each 175m long and 6.10m dia would take off from the
surge tank. These would be lined with high tensile ASTM steel of thickness
varying from 30mm to 40mm . Each of the three penstocks will bifurcate (of 4.65
m diameter unit penstock) to feed the six generating units. A butterfly valve has
been provided in each penstock d/s of surge tank to enable closing of penstock
whenever required.
87

9.4.4. Tailrace Tunnel
The tail race tunnel, 12.50m circular section, about 250m long will be
provided to carry the discharge from the draft tube tunnels emanating from the
power house. The invert level of this tunnel at its portal end has been kept at El.
626.25 m. The mouth of tail race tunnel is proposed to be kept submerged by
constructing a weir with crest elevation as 639m.
9.5. POWER HOUSE
An underground power house of size 125m (L) X 25m(W) X 43m(H) would
be located sufficient below the natural surface level. The power house will have
an arched roof with concrete lining and shall house six generating units each of
150 MW capacity. The transformers & GIS would be accommodated in another
parallel cavity located d/s of power hose cavern. Two overhead cranes each of
250 T capacity with crane girders supported on rock at either end will be provided
in the main power house cavity.
9.6. DIMENSIONING. OF DIFFERENT COMPONENTS
9.6.1. Dimensioning of Intake
There are six intakes are provided in concrete dam itself. The invert level
at RL 811.25m. Each intake should pass 128 cumecs of flow. The rectangular
opening of 10.15 m X9.40 m (h). Calculations are work out in Annexure-IX/2 ).
9.6.2. Dimensioning of Desilting Chamber
River Satluj carrying large quantities of harmful sediment during monsoon,
so it may pose serious abrasion to different components of the scheme, which will
require frequent repairs and maintenance and during such period there should
loss of power generation. Himalayan Rivers contains quartz particles which is very
harmful. Laboratory investigations have shown that the rate of erosion is directly
88

R.C.C. El. 793 M
• , . . CHAMBE13-1 Ci-IAM SERA]
; CIAMBER7111•:' • litweER-IV : CHAMBER-V;' HAMBER-IV
" • •••• I : I
• • - .711
t • ; . •
CONCRETE
VARIES FROM 1500 TO 3:3
ANTICIPATED ROCK) INS
Fig. 9.3:
1E000
proportional to sediment concentration, hardness, size, shape, wear resistance of
material, and relative velocity (Fig. 9.3) Detail calculations are given in
Annexure —IX/3.
DRAINAGE HOLES
9.6.3. Head Race Tunnel
HRT is designed on velocity considerations. HRT is supposed to carry
discharge of 615 cumes. Taking velocity of 5.0 m/sec. as limiting so required
cross-sectional area of 123 sq metres, which gives the dia of 12.53 m. So let we
adopt diameter of 12.5 m, so there will be velocity of 5.01 m/sec.
9.6.4. Penstocks
Design discharge = 615 cumecs
Net Head = 202-33 = 169 m (say).
Max. permissible velocity in penstocks ( USBR formula )
V = 0.125 r2gH = 0.125 [2X9.81 X 169 = 7.197 m/sec. say 7 m/sec.
Assuming 3 No. penstocks, discharge through each penstock = 615 = 205 m3 /sec 3
Q = AV
A = 205 7.00
89

= 29.29 m 2
Dia of penstock = 6.105 m Say = 6.10 m
The dia of 6.10 m has been adopted.
Each penstock shall be bifurcated near the d/s end to feed two turbines.
For same head loss,
Dn = D / n"
Where Dn = diameter of unit penstock
D = diameter of main penstock
n = 2 (bifurcation)
Hence Dn = 4.62m (say 4.65 M)
9.6.4.1. Thickness of penstock steel liner
Max. water level 907m ( i/c water hammer pressure ) Min. water level = 634.0m
Head = 907-634 = 273 m
Max. pressure = 27.3 Kg/cm2 using, ASTM, 517
Max. hoop stress = Pd permissible stress = 2550 Kg/cm2 2& (using F.O.S = 2 )
2550 = 27.3x6.55 x 100 2x t x 0.90
(efficiency of congitudinal joints varies between 0.85 +0.095 for welded joints)
t = 27.3X6.55X100 2550 X 2 X 0.90
t = 3.89 cms t = 38.9 mm
say 40mm.
9.6.4.2. Thickness of 4.65m dia. penstock liner
2550 = 27.3X4.65 X 100 2 XtX 0.9
90

27.3X4.65X100 2500X 2X0.9
2.821 cm 28.21 mm (Say 30 mm)
9.6.5. POWER HOUSE
Power house contains hundreds of auxiliary equipments and controlling
devices. In this study only primary dimensioning is done.
9.6.5.1. Selection of turbine
Selection of turbine requires more attention , when the overlapping of
head is there, type of turbine for different head range is given in table 9.1. In our
case study, maximum net head is 169 m, so as per IS 12837: 1989, Francis
turbine is proposed.
Table. 9.1: Type of turbine for different range of head
SI.No. TYPE OF TURBINE RANGE OF MAXIMUM NET HEAD
1. Pelton Above 300 m
2. Francis 30 to 400 m (some times even up to 500 to 600 m)
3. Kaplan 10 to 60 m
4. Bulb 3 to 20 m
5. Deriaz 50 to 150 m
Francis turbine is capable of working in between 125 to 65 % of rated head,
load variation for 50 to 100 % of rated output, having specific speed from 60 to
400 .
9.6.5.2. Main parameters of turbine
Main parameter are calculated (Annexure IX14) as per IS 12800
(Part 1):1993 .Detail of Francis turbine are given in table 9.2
91

Polor."'").S.7" 1•00.7.
600--1 X4680
42.5
80
O
< UJ
Z co< 0
•
A 40/07' Atcato,nir Aeingr ier
40,
4Pr
I • •
•:i0 7r11+-5
TRANSVERSE CENTRE LINE OF MACHINE
Fig.9.4 : Unit bay
92
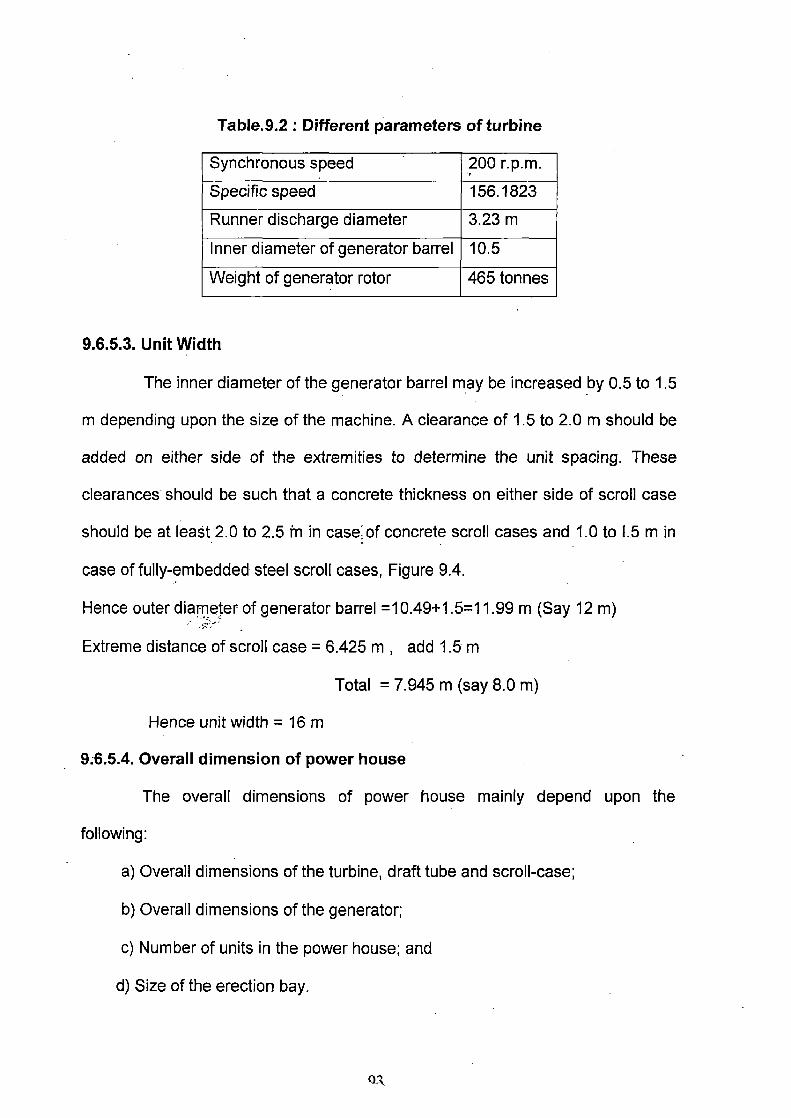
Table.9.2 : Different parameters of turbine
Synchronous speed 200 r.p.m.
Specific speed 156.1823
Runner discharge diameter 3.23 m
Inner diameter of generator barrel 10.5
Weight of generator rotor 465 tonnes
9.6.5.3. Unit Width
The inner diameter of the generator barrel may be increased by 0.5 to 1.5
m depending upon the size of the machine. A clearance of 1.5 to 2.0 m should be
added on either side of the extremities to determine the unit spacing. These
clearances should be such that a concrete thickness on either side of scroll case
should be at least 2.0 to 2.5 rn in case: of concrete scroll cases and 1.0 to 1.5 m in
case of fully-embedded steel scroll cases, Figure 9.4.
Hence outer diameter of generator barrel =10.49+1.5=11.99 m (Say 12 m)
Extreme distance of scroll case = 6.425 m , add 1.5 m
Total = 7.945 m (say 8.0 m)
Hence unit width = 16 m
9:6.5.4. Overall dimension of power house
The overall dimensions of power house mainly depend upon the
following:
a) Overall dimensions of the turbine, draft tube and scroll-case;
b) Overall dimensions of the generator;
c) Number of units in the power house; and
d) Size of the erection bay.

NOTE - Provision for inlet valve, erection of rotor etc should be made in such a
way that the space required is minimum without impairing the operational and
maintenance requirements. ..
9.6.5.5. Length of power house
The length of erection bay may be taken as 1.0 to 1.5 times the unit bay
size as per erection requirement.
The total length L of the power houses can then be determined as follows:
L = Number of units X unit spacing + Length of Erection Bay + K
Where
K= Length required for the E.O.T. crane to handle the last unit. Depending
upon the number and size of the E.O.T. crane, this length is usually 3.0 to5.0
meters. There are two E.O.T. cranes so we take K = 8 m .
9.6.5.6. Width of power house
For determining the width of the power house superstructure, the overall
dimensions of the spiral casing and the hydrogenerator may be drawn with
respect to the vertical axis of the machine. Superstructure columns should be
clear of the downstream extremities by about 2.0 to 2.5 meters.
On the upstream side provision should be made for the following:
a) A clearance of about 1.5 to 2.0 m for concrete the upstream of scroll case;
b) A gallery of 1.5 to 2.0 m width for approaching the draft tube manhole;
c) In case the main inlet valve is also accommodated in the power house, a
valve pit of appropriate size should have to be Provided.
d) A clearance of about 1.5 to 2.0 meters for pressure relief valve in the scroll
case, if required; and
94

e) The spaces as indicated against item (a) to (d) are supposed to be
sufficient for accommodating the auxiliary equipment also but may have to
be reviewed considering the layout of essential equipment and operational
requirements.
Note: The inlet valve gallery, if provided, can be utilized for approaching the draft-
tube man-hole also and hence no separate gallery is needed for this purpose. The
above criteria gives the internal width of the Power House ( excluding column
width ).
9.6.5.7. Height of power house
The height of power house from the bottom of the draft-tube to the centre
line of the spiral casing H, ( see Fig. 9.5 ), can be determined in accordance with
IS 5496: 1969. The thickness of the concrete below the lowest point of draft-tube
may be taken from 1.0 to2.0 m depending upon the type of foundation strata,
backfill conditions and size of the power house.
The height of power house from the centre line of the spiral-casing up to
the top of the generator H2 can be determined, as follows:
H2= Lt+hri-K
Where
Lt = Length of Stator frame
Hf=Height of load bearing bracket
K= 5.5 to 7.0 depending upon the size of the machine
The height of the machine hall above the top bracket of the generator
depends upon the E.O.T. crane hook level and the corresponding E.O.T. crane
rail level, and the clearance required between the ceiling and the top of the crane.
Further the height should depend 'upon the height of the service bay floor from
where the equipment is to be handled.
95

WATER RESOURCES DEVELOPMENT & MANAGEMENT INDIAN INSTITUTE OF TECHNOLOGY — ROORKEE
No. WR/E-21/2006/ LI Dated : July 12, 2006
Assistant Registrar (Acd) PGS&R IIT — Roorkee
Subject : Results of M. Tech Dissertation
Please find enclosed herewith sealed envelopes containing the marks of the Dissertations alongwith the copy of the thesis of the following four M. Tech students for further necessary action at your end please.
SN Name of the Student Enrolment No.
Date of Exam
Title of the thesis
1. Atul Kumar Maurya 048004 11.7.2006 Planning & Layout of a Run-of River Hydropower Scheme with Pondage- A Case Study
2. Daniel Asseh Allan 048006 11.7.2006 Hydro Power Planning in the Basin of River PRA in Ghana
3. In am Udd in Rahman i 048009 10.7.2006 Development of Sick Tube Wells 4. Sanjeev Gupta 048015 11.7.2006 Design of Pre-stressed Cable Anchors for
Stabilization of Himalayan Slopes
Please acknowledge the receipt please.
Encl : As mentioned
(Nayan Sharma) Professor & Chairman, DRC

200 THICK SHEITCRETE
EL. 6654
EL. 660.90
EL. 646.52
EL,639.0 (MDL TiolL ) 11 2
EL. 633.52
H I •"•
.'• : • •
't- s .1".. • :;. •'.
. .
%VIEW DRAINAGE GALLERY EL. 629.72
25000
RUCKBELTS (STAGGERED)
Fig. 9.5 : Sectional elevation of Power House
96
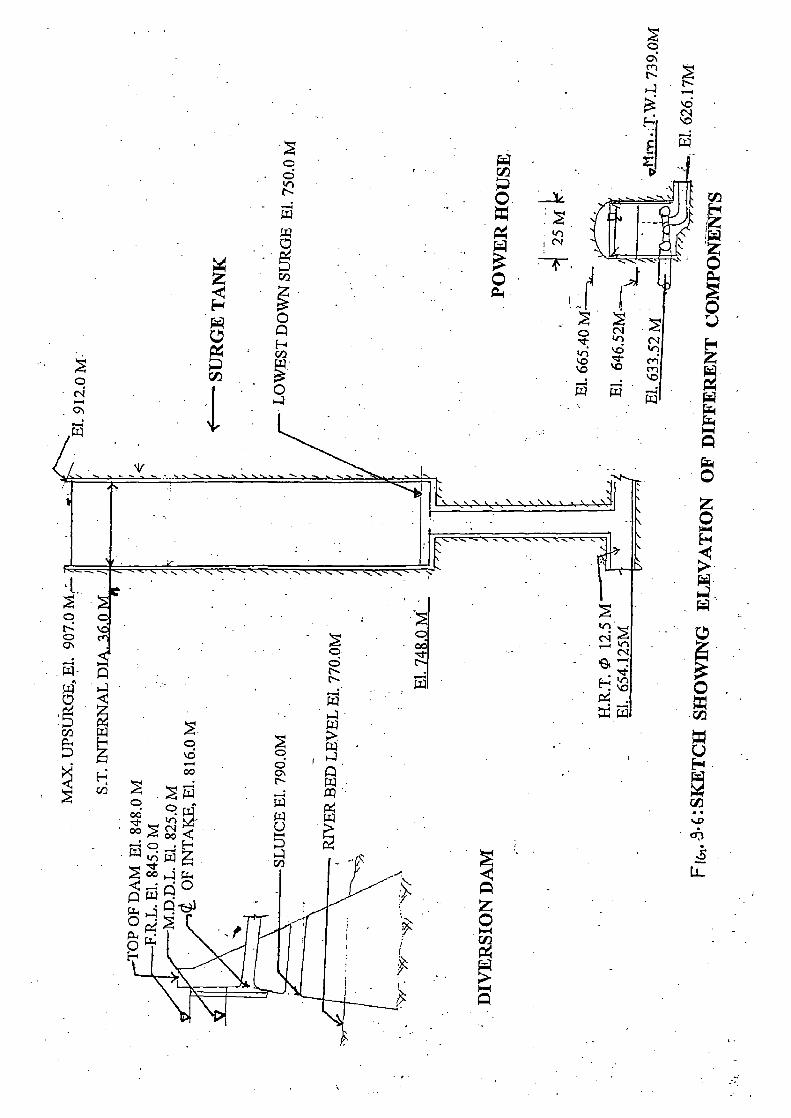
POW
ER
HO
USE
c, 00
DIV
ER
SIO
N D
AM
S.T.
INTE
RN
AL
DIA
, 36.
0
00
SLU
ICE
El.
790.
0M
0 rz
114

The E.O.T. crane hook level and the corresponding crane rail level are
determined by providing adequate clearance for the following cases:
a) Hauling moving major items of equipment viz, turbine runner assembly,
rotor assembly and even entire generator stator.
b) Hauling the main transformer with bushing into the erection bay under
E.O.T. crane girder.
c) Clearance required for undertaking transformers.
d) Unloading of largest package from trailors. A height of 7 to 8.5 metres
between the top erection bay floor and highest hook level may be sufficient.
The height of the power house ceiling above the highest level of the E.O.T.
crane hook may generally vary from 4 to 6.5 m depending upon the width of the
power house superstructure and capacity of E.O.T. crane. Keeping a clearance of
0.5 metre between the highest part of the gantry crane and the ceiling of the
Power house ( Figure 9.4). Calculations of the overall dimensions of the power
house are given in Annex —IX/4, which are
Length = 124 m
Width = 25 m
Height = 43 m
9.6.6. Tail Race Tunnel
TRT is designed same as HRT, on velocity considerations. So we adopt
diameter of 12.5 m, so there will be velocity of 5.01 m/sec.
The relative elevations of main components of Luhri project are show in
Figure 9.6
98

CHAPTER -10
CONCLUSION
• In this study planning and design principles of a run-of-river scheme are
discussed and illustrated by case study.
• Literature review has revealed different criterion for carrying out power
planning study using flow duration curve. A comparative study has been made
of different criterion and it is found that use of mean year FDC as
recommended by Mosonyi shall be adopted.
• A design discharge of around Q34 as suggested by Mosonyi is reasonable. In
the case studied a design discharge of Q29 has been found adequate to
produce optimal energy by running the power house at full installed capacity at
least for about 100 days in a year.
• The basic features worked out in the case study are
Design Head 162 m
Design Discharge 615 cumecs
Installed capacity 900 MW
Energy at 90 % dependability 3444 MU (91.3% of unrestricted energy)
Energy at 50% dependability 3747 MU (75.4% of unrestricted energy)
Energy for mean year 3832 MU (79.8% of unrestricted energy)
• Provision of small pondage in a run-of-river scheme is always
advantageous because power house can be run to meet peaking. In the case
study a small pondage of 6 MCM is required for a peaking of 3 hours in the
minimum 10 daily flow.
99

• Preliminary dimensions of associated structures have been worked out to
illustrate the design principles.
FURTHER SCOPE OF WORK
Detailed topographical, geological and hydrological investigations
should be carried out for this scheme
Detailed economic analysis should be carried out to decide the installed
capacity.
Sediment data should be collected and studies should be carried out to
determine optimal size to be removed on economic consideration.
100
REFERENCES
1 Arora, K.R, (2006), Irrigation Water Power & Water Resources Engineering',
Standard publishers & distributors, Delhi.
2 Barrows, H. K, (1978), 'Water Power Engineering', Tata McGraw-Hill
Publishing Company Ltd, New Delhi
3 Brown, J. Guthri, 'Hydro-Electric Engineering Practice', Vol. 1 (1966), Vol. II
(1970), Vol III (19 ), Blackie & Son Limited, London.
4 Chow, V. T,(1964),' Hand Book of Applied Hydrology',McGraw-Hill Book
Company.
5 Creager, W. P, and Justin, J. D, ( 1963 ), 'Hydro electric Hand Book',John Willy
& Sons.
6 Dandekar, M.M, and Sharma, K.N, (Reprint 1993), Water Power Enginering',
Vikas Publishing House Pvt. Limited, Delhi.
7 Goodman, R. E, (1980),'lntroduction to Rock Mechanics John Wiley & Sons.
8 Grigg, N. S, (1985), 'Water Resources Planning', Mc Graw Hill Book
Company.
9 Hammond, R andMorgan, H.D,(1958),'Water Power Engineering', Heywood &
company Ltd, London.
10 International Course on Small Hydro Development (1- 11 oct 96 ), C.B.I.P,
New Delhi.
11 Jain, V.K, " Hydroelectricty — The Perennial Power House", Water And Energy
International, ( 2004) , Vo161, No 1, Jan. — Mar ,
12 Jha, B.C, (1998),"Forecasting Energy Generation from Run-of-River Projects",
M.Tech. Dissertation, WRDTC , University of Roorkee, Roorkee
13 Kumar, S. Bushan, (2000), ' A Study on Sedimentation problem in Hydropower
Developments in Himalayas', M.Tech. Dissertation, WRDTC , University of
Roorkee, Roorkee.
101

14 Linsley, R. K, & Franzini, J.B, (1972),'Water Resources Engineering', Mc Graw
Hill Book Company.
15 Loitongbam, S.B, (1994), History of Hydropower Development in India',
M.Tech. Dissertation, WRDTC , University of Roorkee, Roorkee.
16 Mosonyi, Emil, 'Water Power Development' Vol. I (1963) & Vol. II (1960),
Publishing House of Hungarian Academy of Sciences, Budapest, Hungary.
17 Mutreja, K.N, (1986), 'Applied Hydrology', Tata McGraw-Hill Publishing
Compny Limited .
18 Naidu, B. S, (2003), Hydropower an Indian Perspective', C B S Publisher &
Distributor, New Delhi
19 Nigam, P.S,(1985),'Hand Book of Hydro Electric Engineering', Nem Chand &
Bros. Roorkee.
20 Prasad. Y, 'Self Sufficiency for India's Power Sector within Five Years',The
International Journal on Hydro Power and Dam, (2005) , Issue Two
21 Pre Fesiabilty Report of Luhri Hydroelectric Project, (2006), Satluj Jal Vidyut
Nigam Limited, Shimla (H.P.).
22 Project Report of Maneri Bhali Hydro Electric Project stage 1, (1966), Irrigation
Design Origination, Roorkee, (U.A.).
23 Purbey, S. (2000), 'A Study on Reservoir Sedimentation in some Dams',
M.Tech. Dissertation, WRDTC , University of Roorkee, Roorkee
24 Subramanya, K, (2004),' Engineering Hydrology',Tata McGraw-Hill Publishing
company Limited, New Delhi.
25 Verma, D.S, (2001),' Hydropower Development in Satluj river basin with
Reference to Sediment Problem', M.Tech. Dissertation, WRD&M, 1.I.T,
Roorkee.
26 www.powermin.nic.in, May 2006, web site of Ministery of Power ,Govt. of
INDIA
102

103

Anne
xure
-VII/
1
CON.WrCOVCOONNOCOMOrOWNCOON.WODY-COMWt...00VCOVI■rWM 0000001■000000rWCOrMA-04VOINWMMt■NWrOistrtsWVCOW0401 CDrry- r r 00 10 Ill CO CD MD CD s- T- C4 CNI C) CO U) It ts CO C4
ACOMt-VWMCONLOWW000Wrh.MMt■COOMVWCOCOLOMWWMMWWCOM Wr000000Y-NVV00000tsCOrt■MVrCOWNWOCONt-W004Nrr0 NCNIC000WCOCOCNIONMWWWVWN rrr
WrOWOrrNWWWW0404WWW.-CON.NtWCONWrWOOMWMWCOMW010 WODt.-t-WWW0rrNMWMOWNMNOMMWWWWWWOMWVMC4NNN O rrrrNNW040)cOLOrNVNY- WWW0404
soNcoaocN,-mmov-mocqcNm(si•-r-mcom.4-Noocor-ocooDcococsioc) 03000 NWOOMMY- MOVNY- WWWNWWVP■Mt■VVWWWWrOOW O rrCVVC0 01,-WMWODVCONO) 04
VVCOLOrNtWIC0rCOODC01■Mt..r000N-WVVWCNCOOCOWCIJI■rWts-OWM WMC00000WOOrVOWOIrMWrVWWC■WON.WWOMF-WMCNIMOMWW O NCOVW0031■0000CONCOWCOVN
MWVWMNOMMNt.MtstsMVOMMCIWWrMOrONCINVrt,MCDOr WWCOMMMMMONVN.04WMOINMWMrWODWrVrVMCOMt-V0NrCI O 11... N.'. V- C4 M MD CID GO 40 CD CD t, 04 00 r 0.1 CD t■ N NN r rrrr
041
NO00040040t-MWt.. 00040WWWt-00Vt-rN1-1010WrWM.NWICVCIOMO CD WWWWWWCONY-WC4VM000.-VVNOOMMV0r00rWCOVMNOMW • ca r.- re4N(NIVMVWCACIWCOMCNINN-WWN04 co v m
II
cocool-cor-oommmNcqcomococ—cr-vmrooco-oLooc.1,--mmm-omoo
rrNO4VVICVVMMONWrOLOWCON
- N E oc.inm-mc, o,mcommvc.1,mmmcor-cmpsomior-mcoco-cDolv,m0. ct I= co M a) co co 00 CD ao CD r (C) 0) (C CD CD CO 00 CO C) r Y- y- C) CO OC) M CO CD C) 0 CO C.) 0) r rre4MVVIN-COrrMOICOW1,-COVC404
le" M- tx1
0
MMCDrOACC)VON.COMOCNINNWrWOrWWVLOWN■WrODVOCNICOrWV NO000MCVVVCCIWOC■rrWMC1100400WWVCOMWVrCOWWWNrMM
rrrrNMCOVVMMCOC■COVr001■OCONN 1). 0 4 WrCOVVVMMWr0t-WONWMON-MVWtsrMt.-WMOCOWN.MN000 1.- NOLOMMMMMONNOrMWMCOVMNWWWMCI NICOWtsWWWN 4 m-co rrY- N' -rWNNWM0Mt■VMCNIC4 0 .-
W 0
i■ 4 OCOMN.WWWWCOMMS C4,92 C,21■0I■Wr.t.rrCOMOVOI 2 W Is-C"D(IDC"'")0000MrNVCCots.MN MCOCO0WOWI■MVC4Nr ° MMWMMMMM NVCOP,""1".""DIN.N.MC00.10.1 0 4) Co
E ,-
0 = 0 ). . M,-GON.-NMTO01.0,--0,—.3-nOm,--comMNWN.G-MinNo,-Ncov,-.0%-, r■ .... e-01molm,—,- ,,MNTTOLONNNTLocra(00,7Gm,rulm,-NmMT■mTrcna-00 -I - MMVW0t-Wt- MWWWV0104 - y- 5 D - to momr--omovvvmmo'c".....rwc".Ncsicvp...aocomomNoo P. 'R r CD CO V IS, vr COO n- o) co co CD '- r r 00V WCD r CD WNW CO -.. -4. 0 ..._ .4.4 , 4 ,44 .., :-. 1r- CN OD F4. el .4- CD OD 111 L47 C4 1.- 1.- C40.3MM(CIMIs."....M.--""*.•fsit1MCNSC4.1.04 .t- 41-4L- .....
V 00 CD CI N. CD N CD v- CD CD CD CD i; Cc;,1 Cc: 41 N 03 04 CO U) 0) y- 0 CO 0 ti .- -MMOWOIMNO M N"MN ICE0,-mWNrcON,-D0 0)
cgmocosto8820g3gAgg2 LgMB2V8g2S22 3 2,73 2gt2Bg mmcommm cvo voao r -A
N 0 st r.. 00c40404mm ,_LomNoinmmor-co m v,t ror■I■GOOcooLOGoN mmwwwwwcom om.-mMCOM D N 0 MW.—,.NOTNoW ,7M,-Dcs0 MLOLDt■-W,_m,OWT■T■LOMNN .-.
sh
0
Z m D ›-
•
Z -J 0 0- I- > 0 z < LU 0 u_ 2 -1 0 0

Annex
ure
-VII
/1
p CD t4 l ;i 53 !1i". !I ! CC) (h CO N. CO2 N. 23 g CO
3 1.:2 V (;11 Z.1 RI g4,
Ca cep 03 CD cn co 0 11) CD Tr up cD N NI' V) CC) N 01 C) OD et C) c') OP NCD up nr 41 03 01 CD cp CC) u) co e- co co Tr co cn Tr r- cy co cD ,r N. co co C)
• cri c, CO CO 0 (.4 41 CO et up 4) CO 04 CD CO CO 0) 03 cr) 4) o) 01 et Cn 0) 04 CD V) N. c, us C4 CD co 00 co co co 00 Cn CD CD e- 00 N 00 e- op 41 CO C) 01 0) 01 N. CD N CD Is CC) er N CD CO 00 r- P-
01 CD N et et CD 474) CD CD er 01 01 CV
01 CD CD C4 MCD CID E .3 RI V CO 53 R ?2 (r7 2 8 13 2 ':72 g8 23 5? 23 53 V 5."..3 23 8 E3 c) °) V' N' r- T- T- cy os CV CO 00 C) CD CD aD CD CD P. 0 co Tr co Cel 04
g 0, c, co N. „, co 00 0) e- QD CV sr CO N. c0 g c4 Tr T.- 4) 03 CD CD e- 01 CD T- T- T- Tr CDN. om C) C) 00 N. °171 CD T- 00 Tr 00 co r- T- c, T- et 4) CD U7 e- rs CD CD T- CD Ps Ul et 01 01 C4 al
cy co 00 CO 03 CD CD 00 N. c0 CD 00 N. 4) CV CV C4
e- 00 CD CD CD CD e- CO 01 CO `R U7 t- N VI N sr CD N sr T- N. 0 Nt 140 co 02 0 C) CD C) CD UP r- NI' co CD e- CV COCV CO CO 4) Tr T- up T- Tr 0.1 CO 03 C) CD OD 41 01 CO0.1 CD 0 0) DO c0 CV v" CD DO DD pp DD DD CD N.' T- y- y- 01 01 01 41 Ul t- 03 03 N. Ca CO et 01 C4
gg CO OD 4) CI Tr N. 01 N. N c) co r Tt CD Tr CO an co N N 2 N. 00 co N. 0 C0 CD Ul N C) 03 00 04 T- CD CV r- C4 et 4) 00 e- 03 C4 U1 CV T- 0.1 04 c, 0 up up up co 00 p- CD sr 01 C4 CV T-
N C4 CV et u) et 400 00 00 CO u) 41 MN
,,.,°' et CD LO 01 LO 03 CO N. N 0 01 0) 0 0 CO VD 0D co.'. co co 0) co Tr co ca a) 0) 0) 00 0 e- Z
•
er CI 01 01 04 04 04 04 CV 4) C) 41 CP U7 CD T- CO 01 CID 01 0 ,o c2 et 00 U7 CD 41 CD 03 41 st 01 01 01 e- 04 CO Met CD 00 CO 00 CD CO CO 0 Tr co C4
D.D II
I- co
41 Ig
N. 00 co „. 02 04 01 CO 01 41 CV C7 Ch C4 N. r- V g s 6.7). ;I. 00 03 a) T- g? CD 00 cif3 s .2 cc 0 c) c) co co CD CD V) C4 UP CID CO g N co c, CD 0 e- g N. 17;) „ '""
c 13) < E Cl) IS it:g co al co 01 co cy co Tr up cn Tr co r- 41 0. co r- CD 00 Is- et 04 co CD 41 01 CI C4 01 CD C4 CV Ul LI. 15 en CD CD cp cD CD CD C7 e- CD e- 0) QD Tr 0 er 01 a) 00 0D P- CD et T Tr Tr r- Tr co 41 CI Cel C4 C4 CV .-
04 01 nr P- 00 CD CD 07 CD et 01 N 0 bC
ct
O CO st Lo co ci) CONNNOet NCO CO in co n CO 7, „, 0, a, C) N Lo cr) co) co .ct C) n' nr nr Cq CD 0D CO nr CD -- 00 000 C) C) 04 CD OD et N 41 CD 41 0) 01 N Nr 04 01 01 01 W) CD ,_ UP 00 ,_ 03 U7 U) CD Cel C4 1-
oe ct - cy up CD 41 C4 CO T- T- C4 ts 0) 04 CD CD P. ,t 2, 2 2 co CD 03 CD r- up g cp (4). (7; 8 8
CD CD C) T- e- C7 0) 00 et CO N p- co 01 c2 C00 c, c2 co Cr) CD T? cm ti nt N CO 00 P- 41 OOrrr cn 0. 00 U) CO cm 0 e-
O 2. g co „ co CD 0) T- 0 OD rs COP- 00 CD 0) CA UP ta g gg ,47. 00 01 CD 03 OD 14) 00 Nt 0 CD 41 04
0 co CD C7 co CD CD CD C4 DP N DP g3 gi ge. el e, cy nr Tr T- T- t; a3 gl r- uo Tr 01 C4 CV C4
-- 0 e- g E
W OD COCA LI) IC) N. N. Ch CD CD nr CO CD N P. 4) 0 g OD N. n■ n■ CD 4) CO CD N- C70) CO N 41 V2 ai CD CD C) CD CD CD C5 e- 00 CV er 4) 4) CD p- C4 4) nr 0) c2 T- U, 0, ul 04 03 CO e- N. ul CD 01 N CV e- CD E cy Nr cy vt u) r- CO P.- rs CO 41 41 Tr N N cy
Cq CO er 0 P- 00 CD CV 1.7 40 N. 4) OD CD CD 0 e- 04 n7 co CD a; is; 00 00 0) 4) 01 CD et 41 et co T- C4 C0 OD CD e- e- TT. CV T- CV T N 1r Ul N P. CV OD Fr, Tr 03 (.4 0 U) 41 01 CD 01 CD CO et 01 01 01 C) GO
CV 04 et Tr Tr N. CD ,_ CD 00 P. 41 0.1 CV -
01- N 0 up co cn co Tr C4 e- c0 U) 00 e- 04 .7,)c E E, g 41 CD et CO 01 T- 01 co Tr TT. 00 TT. CO T- 0.) co co co ••• 00 CO C4 CD C') 0 e- '- CD 0, Tr CV CV C) CD CD CD CD CD 0) CO N. ul et 00 01 N 01 e- cn in co N- LO N
gg 0, oD Tr T- CO et C4 CD CD CD CD gs.! N. 01 CO 41 U) CD 03 er Ul 03 01 CD co CD CD CD CD CD CD C) T- C) 00 CD U) UD CD 41 C') 0, 04 ,_
QD CD CD 23 17.1" a; t.T. gi CD Ul 41 et 01 01 C4
1- T- e- 0.1 0) CD 00 00 T- 0 ,-
2g0)M CO 01 CY CD P- T- P- T7 01 04 OD C4 04 CD 41 Ul 01 04 UP cfp C. CO ul CO CD Ps 04 03 et CD 01 C4 e- r- CD CD T.. VT 00 01 Tt nt CO T- CO 03 Tr 0 CD ;I ul 00 00 CD P.- T- 04 00 N. UD Tr CI T- 04 CD 41 cn P. 0 P. CO P. 00 U1 00 01 oi T-
S z CO cc re >- z _1 (9 EL F- > 0 Z < LL cc CI_ ‹C D D D Lll C) 0 lt.I 0 "1 U.
2 2 < 2 —, ct CO 0 Z 0

Annex
ure -V
11/2
• CO Ul C3 Ul CD Cr 01 CV CD 04 111 U0 U.3 T- oo Tr 03 T■ CD 113 CO c■ U3 co Tr Tr 3 ▪ '2 c) 6') cI T: g2 g 7E; 23 C') 4 2 :3 Low 2 S; 2g c) A 53 2 .51. C:71 "
U) c' C4 Cq Ni v-•
Or
T U) OD at IA 0 CO to C3 CD CD U) U3 „ 03 ;; T■ gl Cr Cr CD 0 CD 07 CD C7 T■ N. 07 OD CV 03 • c, CD CD CI CD 0 .1.-• CI CO 0) 0) F4 a go OD UD c, 0) C3' VD Cr 01 V-. CO U3 C') C4 Cl s■• CD
CD N. ,„ CD 03 CO Ts UD Tr CO CV OD CV of OD r■ U) 03 03 V■ V.. T.. Cri "t 4/ U/ T■ e T■ CO r- el 03 CI CV Tr T. 01 v■ T■
133 C.' CI C° C3 C3 CD C) e- r- el r- r- aa 0 C7 '3" Tr C3 fp N. Tr aa sr Tr CD T. WD Tr el cm cm cm T- 0 N' 4' is is C4 ee e■ e■ C4 04 Tr cm el 03 CI cm co r- m) el cm cm
CO N- U) 01 CD 03 C7 CD Cr CD CD C) Cr Cr 01 CO CO v■ Tr co CD 07 CO 0 U) 00 T■ 03 03 0) CY CO CD Tr
0) T■ CD T■ CO (1) r- 03 03 00 Cr CD CI U) Cr c 01 CD C3 C, CV CO 02 CO N. CV Ul OD Tr cs) T- ER Eg R3 T- T- T-
U) u, uo r- N- 00 CA T■ OD N. U) 00 CV C4 CV v■ V■
g c, „ 0 oa r- CD CO 0 00 CD N. CO 03 01 V) 03 N. T■ O U3 CO CD Tr 02 co 04 0. ,r c,
cn Of co co „ coo no Cn Tr u, 0, T- u, r- CV UD C7 CO Cr T. CV CO sr v■ OD CV N. Tr 07 v■ c0 co 0, 0, v■ s■ 04 Cl Cr CO CD T■ N- N- U7 N- N- N. N. OD 07 CV v■ ‘■. c■
bd
c) 0,
▪ nO O co D 03 D CO CD r- g 2R E..; 2 pi.). 17 23 Et; Ei Fi .(:,1 'AI 7E E,U)
coOD 03 03 COOD OD CO CD CD 00 U7 U) r- OD CO QD
mi
101 04 O 03 co 0,1 0 0 co Tr r- r, op el N- CC3 UD C13 CD em ml c) 03 co ea co ca of ca „ c, cL cn „ op r- r- OD CO 03 CO r r ;; ;7, 1;5 E3 S,3 2 S3 MN."' Eg T.: El 0) P.- P- 't CI C3 CO CO 15 v-
Cr CU
>111 fi2 E3 c, c) co u, CV 01 r■ 03 Cr 01 Tr fq - CD Cr 03 C3 OD ma Tr CD 65 65
co 0 aa CD CD Ts CO OI T■ CD CO t: g g 0 T■ CO C4 v,. 0, 0,
v■ v■ 04 Cr Cr UD Tr Tr co OD „. „. T■ Tr 0, cy cv - ce
-J 000 0 0 0't C3 't CFI 'r CC' Cf 21 2 53 A a? Fc-,3 :f2 23 g 4 g T:1 a3 E.: 2 g! ic.:1 Z? c5,1 E. 0 0
cq co .cr r- co I,- CO DI OD CV CA T O 13 1;2 8 .13 3 C„, c„, z...; 93 4) v. u, r- Tr r- co q) ,7„; r2 ;7„ U3 CD 07 T■ V. CO 03 00 CO Cr v•-• Cr
CD ,_ CD ci) co co cq 0, Ty: .7 R3 :; E; U3 04 Tr c) p: 23 r8 r- " " " (N "
< E 1-- acs Ci CO
it CV U7 C) CO 01 CV CO V- c, Ul 03 op CO 1.0
W t; Eg 2.3 S3 ,):9 S3 Sa SS =1. RI 2 :13 2 5.11 4 2 (P.!. i".1 Fi 143 4 1"; `1" .7! z
• r■ Cel CD „ CO CD 00 r■ Tr Fo, F3 :2 :2 s3 F3
0) ON CD :I 2 2 g3 07 04 C) N. co
0) r- r- nr ea 01 Tr U)
N 0, ,r 0 „ 4? Tr CV Ul CV 07 03 CO Ul Tr co cm T- CD
r- 00 ma 0 Cr CO 01
0 CD co ,„ u, co r- oo CO C) 00 CO C4 r■ 01 10) g 01 T. CO CO CO Cr Ul OD Tr N. Cr CD 04 ,t 01
-J CD C3 CD CD „ CO CD
CD C3 01 co co C4 CD co co Tr 0 a) T- 0, CO Ch UM) CI Cl CID T■ CD et 01 c) co T y- r- Lr- 0) C4 07 Tr co ma Tr 03 -T.. V- 03 CO Ul CO 01 04 CV 0
111 r2 (0 r■ r- CD CI U7 OD CO CD 04 CO C13 CI 7, CD CI CD CO UD OD CD CV N. 01 C) „ CD v■ CD CV CO Tr co co 03 01 CO N. 03 Ul COD C4 ma cm ma c, OD CV OD ma Tr OD ° C3 '1" co ma Tr co cm CV CV QD 'NC C4 C' 1-
A 0, 0 el 0, 0 r OD OD St 01 03 OD CV Cr 03 03 03 : Tr CV CV 03 v■ 0) 00 Cr CD T. 07 07 CV 0, 0, co
CD OD CD CD CD 03 03 CD C3 CI 't f3 C3 IN. CI 74. f3 CI VI CD t3 (5 C3 C4 r." C° 1') C4 C) CO CD 03 V- v■ 04i 0) C4 CV CU U) ,cr U) CD CD CD CO nr OD CV
Oh) 03 co 03 00 03 CV co C7 T■ 04 g r IT 23 .47 Tr Tr r■ co r- CD CO C4 OD 00 C11 0 OD 0
CD CD CO 0) 03 OD CD CO CD ;!: :2 El F3 tr, 23 r, 0 e4 cq 0 c) 2 0) g F,), 03 CO Tr 01 O CD co N V- r-
cm T Tr 03 N. N. 1.■ CD 01 Ul C3 T■ 07 04 Tr 6 03 0 OD CD CD Tr Tr f3 CD UI CD T■ C17 OD 07 CD UI CD OD CD C3 „ co 0, 0. 0. r.„ 0, 0, CD Cl Tr T■ aa el CD OD v■ C4 00 CD CD U) CD 03 U7 07 04 CD CY CD 0 CV CO et 0 03 co 03 CD r- CO u, Tr cm em
IC
U
C, E2 == EE == EE = = == EE == EE = Ea -- == EE == EE = EE := EE == .J C0
5 c .0 4, c
•
3
▪
C3 C.) o U.
co en 0 z°

Ann
exur
e -V
11/2
O 0.4 41 C4 01 DI 1, DO ten zi ;2 ,c; ;2 .12 C0 41 C5 07 CV C) en In 01
• • C3 CD 03 NI. 0) 00 C3 N.: Nf Nf cS co 04 e) e4 " tn tn. 03 03 CO CO v. v. v. cy
g 0, u, q, 0, cD cy cy C3 0 CV V- 0) 01 T. Ch CD en in 04 N CO CO Nt N ob „3. cp op e) ,. cD CD I- 0 1*.- 47 CD Dn 1.1 00 IN CO 0 CI Ps Ch 00 41 01 C1 Nn 0) CO tn. ten tn. CV v- v- v- CV 04 CV St St 41 Nt St 41 St N N
0) Tr 0 CD 07 et C4 03 "3 sr OD OD 0 CD 10 04 07 CO 0 0n CV S. sr 00 41 0 c, 0 47 N. a) CD CD CI y- c, 07 CV cl cn CO N. CO 10 CD DO CO e- Nt 't 02 C\I C2 CD CD 03 0 u) 0 0 CO CV CV 0 0. cn r. 0 N. N. 0 10 Yr co c4 CV
CV 0 Is UD 4) 41 CD oD C5 el el sr up e- co Cr CD (1) N. N. cl st U7 CD CV 00 sr 0 CV V- CO sk v- 0 op O 03 r_ qp C3 e- 04 sr CD CD e. N. 0 ul CD CO CV 03 47 CD CD 47 03 DD 47 07 CNI 04 N c,
T■ o3 Ns U7 0 ,t0 C0 CV ce 04
0 .4. ° u' u) m 't 'r ep "5 e3 45 13 8 S3 8 3 SS rc:i .(J s S3 R 23 t3 R :1 yt: g - CD CO 0) CD 03 CO OD CO CO en T- C4 Cq 0 40 4. CV CD pi
CD
it f1:1 LL 2 , g 0, 0, 0 0 co yr 0 N. C3 0 CO CO Tr 03 vs 41 OD (0 03 03 41 0 0 T■ Tr Tr C) 00 07 OD C)
3 < 04 01 0 OD CD CD sv 0 40 0 OD CI 04 CO 0) CD CV CO CO UP Tr sr (0 04 s- C3 CD a. 15
N
0) .0- yr no Tr 0 0) cD 47 MO cl C4
2 g 1 0) cD - CO CI C) CD v- V-. 4) 03 sr 00 CD V-. N om 0 OD sr 10 (0 ro:5 e- Tr 0 Ul CD C5 4) Cl CI CV OD CD DD rn
sr co co 0 C4 04 CV C4 CA er 0) ec; sg si rc,.z sg g 2 N. M M M En 2 c,4 si ca,), RI co r. CO 41 V) 01 CV vs
LLI c4 04 cD e- e- (I ts. 0 V; c76 o3 N. Cn CD C4 OD Cn C) sr CD Ul C3 sr CV CD up C3 • cn CD 47 e7 0 y- e- e- 0 C4 C4 Tr 01 Cg co 03 ,- 0, v- 03 4. C3 0 a) N. ,r 0 03 N. up Tr • Ch CO 03 co co co c0 03 CO T.. 7' CI 07 07 .. OD 0 CO CD CO 07 Sr Sr 01 CV NN
-1
-J
Q 01 ts CO Tr CV CV CV CD CO ry U) 1.■
CO 0 rs co OD CV CO CD Ch C4 0 0 co 47 10 CD CD
C) CO CD 0 CD CD 0 0 C3 v- CO CO CV 0 CO r co V- 0 T■ Tr 03 03 0 Sr CD M M 0, g? cg si; cm e- C3 CD 417.
cr) y- cv y- 04 07 ‘10 CO CO N. N. e- t- U3 Y:0 07 01 r.. T.. V■ .,, l.... (1) LL O ,TN 0, 10NN0 ,c0c0t0 — 0,1 ,:t N. gi) 2 .- (.0 FINN'!" LO V It 4- Ni s, 94.) 2 re; Fs, co ,_‘-- <
55 ..- C) CD C3 0 0 C3 C4 07 07 e- et qD ,r 03 0 0 „D. F. c7 op (e) e- et et Tr oo I: e- CV 0 CI 0 41 41 ,- 1... cn CD cn (04) sr 0 N
Q. 0 III CI e
LIJ AT 11) CT (1) t0 COW 0.- CV 0 C3 CI 0 0 CD C) CD CO Sr 03 0 v- CD 10 0... CV 0.- CT C) ,...- CT C2 41 CO 07 0... 0... 0 CD B... ,-,..-,- co 0 cD C2 Cr CD 01 07 CID v- c) (0 (0 CD 01 sr e- u) 01 01 u) CO N. N. 04 Co 43 sr 07 Cy C4 e- C4 To
e- NOM 0 co 0 0. 03 03 03 CO CO 40 0 CY 04 0) 0 N IX
CL • oo 2 op or, o, OD C3 co 0 yr uo yr yt N. ;1 s 53 60 60 N. V- V.. 07 CA 03 vt CV C7 47 0 CA
e- • Ch ,- CD CO CD CD .,E CD c1 sr 00 03 03 vn 't Cr rl CD 07 CV 01 CD ul C4 CD to sr ,- cq Cl) CV CV 41 tv. CO ,- ,. CD Ch rn NN CU
ND Cl a)
M 0 „ 0 00 .0. Nr ul 03 03 04 cn e- 0 01 yr co cn r- CD CV CV 03 CO yr 03 0 43 41 CD 03 0 OD 01 a) ▪ E5 c) et, C2 C2 CD CD 0 s- CV v- sr CO 0 41 co CD 4) CD r-- c) Lo cy sr CD 07 Ch CO Nr CO 0 C4 C4 OO • Vn CV Sr 01 yr yr CO OD CO 0 0 41 47 sr MN
0)
.°) z CM
01 v- el Nr CV 03 s- CO 07 Sr 01 43 tn Sr 41 CD Cl CO 14 07 C) CV sr Nr tn Sr CD CV 47 0 V) CD tn sr c)0 CO CD sv ,- 07 u) CV sr e- P. 00 sr CD CD r.. op 0 oD 0 e- c3 e. co ul c0 C4 Cy e- c) c) N Nn CV 04 sr 01 sr tn CO 0 OD ,. CO tn OD CV 04 3..
CO 2 0
Z; N C2 C2 1.2 C12 cL2 ri5 i; 112 (u3 0) N. gi gl 72 cn 03 03 CD CO Ch CD ,_ v- CV vn CV CO 47 U) C) Nn O 07
,,, 0, 00 CV s- 04 en r- r- CD C2 el 04 CD co 6 !i?. 2 CO CD tn. 05 04 CO CD vn Nr C1 03 N yr c) cq O 0 65 ob 0 CD 0 0 e- yr co yr y- uo 01 CV 0 0 CO 4) 07 CV 01.1.- CV Yr C3 U) Tr Tr CO 09 r. E C4 et Co N. N. OP 03 CD CO tn. CO Nr 0 NN Nn
0% 22 CV CO 03 0 CO CV OD 01 ce) sr 0 CD en CD N CD 0 et 0 5.! 2:1), c) r.„ ,- c) u) CD CO C4 CI Ul a) 0 3 E5 cv 0 0 0 0 CD CD v- 04 0 sr 0 CD v- rn to 0 CV ;7: 4- CD 0 0 40 N. CV OD 40 Sr 0 01
01 0 OD QD rn T. CD tn. 47 V) 01 04 0 DZ
SC C) CD == == := := == == == := := == == := := = 15 co
6 .0 C co
•
0. (0 •
en
•
0.
•
o 601 0 -,ri 6 2
•
0

Annexure-VII/3
Establishment of relationship between discharge series of Sunni & Rampur
Useing linear relation Y = B X + C
Where B- EXY -(EXY)2 /n
E X2 - )0' in
C= . Y
And coefficient of correlation r EAX E. AY
Y = Discharge of Rampur site X = Discharge of Sunni site
and V=EY/n
So we get B= 0.8828 A= 3.8384 R= 0.9915
Calculations are shown below.
Osun Q RAM
Rampur discharge generated
% error
year month X Y rX X"Y AX AY MAY Axe AY'
1972 JAN I 90 84 8100 7560 -308 -272 83792 95164 73779 83 0.8 II 83 78 6889 6474 -315 -278 87586 99531 77075 77 1.1 Ill 82 77 6724 6314 -316 -279 88180 100163 77631 76 1.0
FEB 1 82 77 6724 6314 -316 -279 88180 100163 77631 76 1.0 II 82 77 6724 6314 -316 -279 88180 100163 77631 76 1.0 III 83 79 6889 6557 -315 -277 87271 99531 76520 77 2.4 A
MAR I 88 83 7744 7304 -310 -273 84646 96402 74323 82 1.8 II 91 85 8281 7735 -307 -271 83213 94548 73237 84 1.0 III 115 110 13225 12650 -283 -246 69631 80364 60331 105 4.2
APR I 116 107 13456 12412 -282 -249 70233 79798 61813 106 0.7 II 142 133 20164 18886 -256 -223 57100 65785 49561 129 2.9 III 150 142 22500 21300 -248 -214 53082 61745 45635 136 4.0
MAY 1 185 174 34225 32190 -213 -182 38774 45576 32987 167 3.9 II 315 280 99225 88200 -83 -76 6313 6970 5719 282 0.7 III 553 538 305809 297514 155 182 28180 23875 33261 492 8.5
JUN I 590 490 348100 289100 192 134 25735 36678 18057 525 7.1 II 737 688 543169 507056 339 332 112514 114592 110474 654 4.9 III 898 810 806404 727380 500 454 226968 249514 206458 797 1.7
JUL I 1030 910 1060900 937300 632 554 350097 398810 307334 913 0.3 II 924 814 853776 752136 .526 458 240883 276165 210109 820 0.7 III 1044 924 1089936 964656 646 568 366895 416688 323052 925 0.2
AUG I 951 1116 904401 1061316 553 760 420119 305272 578173 843 24.4 II 880 786 774400 691680 482 430 207232 231856 185224 781 0.7 III 717 605 514089 433785 319 249 79430 101451 62189 637 5.3
SEP I 717 590 514089 423030 319 234 74652 101451 54933 637 7.9 II 526 417 276676 219342 128 61 7826 16260 3767 468 12.3 III 256 102400 320 320 81920 -78 -100 7819 9925 286 11.8
OCT I 226 208 51076 47008 -172 -148 25463 29751 21793 203 2.2 II 200 183 40000 36600 -198 -173 34263 39397 29799 180 1.4 III 165 150 27225 24750 -233 -206 48010 54516 42281 150 0.3
NOV I 146 135 21316 19710 -252 -221 55704 63749 48675 133 1.7
SIE ex2 E eye
1

Annexure-VII/3
II 132 120 17424 15840 -266 -236 62790 71015 55518 120 0.3 III 117 108 13689 12636 -281 -248 69702 79234 61317 107 0.8
DEC I 108 100 11664 10800 -290 -256 74255 84382 65343 99 0.8 II 107 100 11449 10700 -291 -256 74511 84964 65343 98 1.7 III 104 98 10816 10192 -294 -258 75866 86722 66370 96 2.4
1973 JAN I 99 92 9801 9108 -299 -264 78951 89692 69497 91 0.6 II 88 91 7744 8008 -310 -265 82162 96402 70025 82 10.4 III 96 91 9216 8736 -302 -265 80045 91498 70025 89 2.7
FEB I 94 88 8836 8272 -304 -268 81488 92712 71622 87 1.3 II 95 89 9025 8455 -303 -267 80916 92104 71088 88 1.5 III 100 93 10000 9300 -298 -263 78369 89094 68971 92 0.9
MAR 1 100 93 10000 9300 -298 -263 78389 89094 68971 92 0.9 II 105 98 11025 10290 -293 -258 75609 86134 66370 97 1.5 III 153 142 23409 21726 -245 -214 52442 60263 45635 139 2.2
APR 1 194 180 37636 34920 -204 -176 35912 41815 30843 175 2.7 II 244 226 59536 55144 -154 -130 20025 23866 16802 219 3.0 III 684 630 467856 430920 286 274 78338 81518 75283 608 3.5
MAY I 1424 1311 2027776 1866864 1026 955 979752 1051679 912745 1261 3.8 II 604 557 364816 336428 206 201 41386 42236 40553 537 3.6 III 839 772 703921 647708 441 416 183420 194052 173370 745 3.6
JUN I 1139 1024 1297321 1166336 741 668 494942 548361 446728 1009 1.4 II 2375 2215 5640625 5260625 1977 1859 3675084 3906607 3457282 2100 5.2 III 1753 1616 3073009 2832848 1355 1260 1707198 1834708 1588550 1551 4.0
JUL I 1400 1278 1960000 1789200 1002 922 923773 1003030 850779 1240 3.0 II 1523 1395 2319529 2124585 1125 1039 1168794 1264531 1080304 1348 3.3 III 1161 1045 1347921 1213245 763 689 525659 581427 475240 1029 1.6
AUG I 1002 894 1004004 895788 604 538 324918 364229 289850 888 0.6 II 991 884 982081 876044 593 528 313071 351073 279182 879 0.6 III 1005 987 1010025 991935 607 631 382939 367859 398637 891 9.7
SEP I 956 849 913936 811644 558 493 275064 310822 243421 848 0.1 II 683 567 466489 387261 285 211 60140 80948 44680 607 7.0 III 488 440 238144 214720 90 84 7553 8013 7119 435 1.2
OCT I 281 255 78961 71655 -117 -101 11822 13803 10125 252 1.2 II 218 202 47524 44036 -180 -154 27727 32575 23600 196 2.8 HI 203 188 41209 38164 -195 -168 32768 38215 28098 183 2.6
NOV I 181 168 32761 30408 -217 -188 40805 47300 35202 164 2.6 II 156 145 24336 22620 -242 -211 51073 58800 44362 142 2.4 III 129 120 16641 15480 -269 -236 63497 72623 55518 118 1.9
DEC I 116 108 13456 12528 -282 -248 69950 79798 61317 106 1.6 II 108 100 11664 10800 -290 -256 74255 84382 65343 99 0.8 III 104 96 10816 9984 -294 -260 76455 86722 67404 96 0.4
1974 JAN I 101 85 10201 8585 -297 -271 80507 88498 73237 93 9.4 II 98 90 9604 8820 -300 -268 79816 90292 70556 90 0.4 III 98 91 9604 8918 -300 -265 79516 90292 70025 90 0.7
FEB I 99 92 9801 9108 -299 -264 78951 89892 69497 91 0.8 II 93 87 8649 8091 -305 -269 82061 93322 72158 86 1.2 III 94 88 8836 8272 -304 -268 81488 92712 71622 87 1.3
MAR I 98 90 9604 8820 -300 -266 79616 90292 70556 90 0.4 II 108 101 11664 10908 -290 -255 73964 84382 64833 99 1.8 III 149 138 22201 20562 -249 -218 54294 62243 47360 135 1.9
APR I 160 148 25600 23680 -238 -208 49515 56876 43107 145 2.0 II 177 164 31329 29028 -221 -192 42442 49056 36719 160 2.4 III 230 213 52900 48990 -168 -143 24030 28388 20341 207 2.9
MAY I 332 306 110224 101592 -66 -50 3299 4420 2462 297 3.0 II 299 276 89401 82524 -99 -80 7921 9897 6340 268 3.0 III 251 232 63001 58232 -147 -124 18233 21752 15283 225 2.8
JUN I 430 344 184900 147920 32 -12 -366 993 135 383 11.5 II 630 536 396900 337680 232 180 41760 53599 32536 560 4.5 III 529 438 279841 231702 131 82 10751 17034 6786 471 7.5
. JUL I 639 538 408321 343782 241 182 43864 57847 33261 568 5.6 II 1168 1053 1364224 1229904 770 697 536641 592152 486335 1035 1.7 III 1074 964 1153476 1035336 676 608 410967 456319 370122 952 1.2
AUG I 1072 962 1149184 1031264 674 606 408403 453621 367693 950 1.2
2

II III
1059 725
902 628
1121481 525625
955218 455300
661 327
546 272
360890 88935
436279 106611
298528 74189
939 644
Annexure-VII/3
4.1 2.5
SEP I 562 471 315844 264702 164 115 18866 26737 13312 500 6.2 II 408 319 166464 130152 10 -37 -348 91 1341 364 14.1 III 312 253 97344 78936 -86 -103 8875 7480 10532 279 10.4
OCT I 199 184 39601 36616 -199 -172 34236 39795 29454 180 2.4 II 185 170 34225 31450 -213 -186 39628 45576 34456 167 1.7.
III 148 137 21904 20276 -250 -219 54762 62743 47796 134 1.8 NOV I 135 123 18225 16605 -263 -233 61293 69425 54114 123 0.0
II 121 113 14641 13673 -277 -243 67325 76999 58866 111 2.1 III 110 102 12100 11220 -288 -254 73167 83224 64325 101 1.0
DEC I 103 93 10609 9579 -295 -263 77601 87312 68971 95 1.9 II 100 93 10000 9300 -298 -263 78389 89094 68971 92 0.9 III 94 88 8836 8272 -304 -268 81488 92712 71622 87 1.3
1975 JAN I 91 103 8281 9373 -307 -253 77678 94548 63618 84 18.3 II 81 84 6561 6804 -317 -272 86237 100797 73779 75 10.3 III 103 76 10609 7828 -295 -280 82625 87312 78189 95 24.7
FEB I 115 107 13225 12305 -283 -249 70481 80364 61813 105 i.5 II 119 111 14161 13209 -279 - -245 68369 78112 59840 109 1.9 III 117 109 13689 12753 -281 -247 69421 79234 60823 107 1.7
MAR 1 130 123 16900 15990 -268 -233 62456 72085 54114 119 3.6 II 146 136 21316 19856 -252 -220 55452 63749 48234 133 2.4 III 154 143 . 23716 22022 -244 -213 51983 59773 45209 140 2.2
APR 1 205 190 42025 38950 -193 -166 32046 37437 27431 185 2.7 II 214 198 45796 42372 -184 -158 29079 34035 24845 193 2.6 III 304 281 92416 85424 -94 -75 7051 8928 5569 272 3.1
MAY I 364 335 132496 121940 -34 -21 711 1189 425 325 2.9 II 629 569 395641 357901 231 213 49186 53137 45530 559 1.7 III 559 472 312481 263848 161 116 18680 25765 13544 497 5.4
JUN I 785 685 616225 537725 387 329 127309 149393 108489 697 1.7 II 1495 1367 2235025 2043665 1097 1011 1108989 1202343 1022883 1324 3.2 III 1497 1373 2241009 2055381 1099 1017 1117603 1206733 1035056 1325 3.5
JUL I 854 751 729316 641354 456 395 180100 207493 156323 758 0.9 II 1749 1613 3059001 2821137 1351 1257 1698105 1823888 1580997 1548 4.0 III 1256 1138 1577536 1429328 858 782 670899 735330 612114 1113 2.2
AUG I 1540 1413 2371600 2176020 1142 1057 1207010 1303054 1118046 1363 3.5 II 1685 1551 2839225 2613435 1287 1195 1537869 1655118 1428926 1491 3.8 III 1071 960 1147041 1028160 673 604 406452 452275 365271 949 1.1
SEP I 717 620 514089 444540 319 264 84208 101451 69895 637 2.7 II 552 460 304704 253920 154 104 16023 23567 10895 491 6.8 III 382 326 145924 124532 -16 -30 488 272 878 341 4.6
OCT I 277 256 76729 70912 -121 -100 12103 14759 9925 248 3.0 II 236 218 55696 51448 -162 -136 22362 26402 18940 212 2.7 III 216 200 46656 43200 -182 -156 28399 33301 24219 195 2.7
NOV I 195 181 38025 35295 -203 -175 35533 41407 30493 176 2.8 II 180 167 32400 30060 -218 -189 41212 47736 35579 163 2.5 III 153 142 23409 21726 -245 -214 52442 60263 45635 139 2.2
DEC I 132 122 17424 16104 -266 -234 62257 71015 54580 120 1.3 II 125 107 15625 13375 -273 -249 67995 74795 61813 114 6.7 III 118 103 13924 12154 -280 -253 70857 78672 63818 108 4.9
1976 JAN I 111 100 12321 11100 -287 -256 73488 82648 65343 102 1.8 II 106 99 11236 10494 -292 -257 75059 85548 65855 97 1.6 III 102 95 10404 9690 -296 -261 77271 87904 67924 94 1.2
FEB I 101 94 10201 9494 -297 -262 77829 88498 68447 93 1.1 II 102 97 10404 9894 -296 -259 76678 87904 66886 94 3.2 III 113 105 12769 11865 -285 -251 71549 81502 62812 104 1.3
MAR I 116 109 13456 12644 -282 -247 69668 79798 60823 106 2.5 II 115 107 13225 12305 -283 -249 70481 80364 61813 105 1.5 III 135 126 18225 17010 -263 -230 60503 69425 52727 123 2.4
APR I 141 131 19881 18471 -257 -225 57837 66299 50456 128 2.1 II 180 167 32400 30060 -218 -189 41212 47736 35579 163 2.5 III 351 321 123201 112671 -47 -35 1644 2255 1199 314 2.3
MAY I 324 299 104976 96876 -74 -57 4218 5548 3206 290 .3.1
3

Annexure-VII/3
II 423 390 178929 164970 25 34 843 601 1182 377 3.3 III 540 498 291600 268920 142 142 20148 20026 20271 481 3.5
JUN I 956 849 913936 811644 558 493 275064 310822 243421 848 0.1 II 761 662 579121 503782 363 306 111066 131416 93867 676 2.1 III 558 467 311364 260586 160 111 17766 25445 12405 496 6.3
JUL I 709 812 502681 575708 311 456 141711 96419 208280 630 22.4 II 1400 1227 1960000 1717800 1002 871 872696 1003030 759298 1240 1.0 M 1517 1390 2301289 2108630 1119 1034 1156965 1251073 1069936 1343 3.4
AUG I 938 833 879844 781354 540 477 257551 291075 227899 832 0.1 II 812 697 659344 565964 414 341 141164 170994 116538 721 3.4 III 654 558 427716 364932 256 202 51710 65287 40956 581 4.2
SEP I 599 509 358801 304891 201 153 30754 40206 23524 533 4.6 II 415 329 172225 136535 17 -27 -440 273 709 370 12.5 III 322 264 103684 85008 -76 -92 7008 5850 8395 288. 9.1
OCT 1 230 215 52900 49450 -168 -141 23693 28388 19775 207 3.8 II 191 178 36481 33998 -207 -178 36854 43050 31550 172 3.1 III 177 184 31329 32568 -221 -172 38012 49056 29454 160 13.0
NOV I 158 147 24964 23226 -240 -209 50171 57834 43524 143 2.5 II 144 134 20736 19296 -254 -222 56400 64763 49117 131 2.3 III 131 120 17161 15720 -267 -236 63026 71549 55518 119 0.4
DEC I 110 102 12100 11220 -288 -254 73167 83224 64325 101 1.0 II 101 94 10201 9494 -297. -262 77829 88498 68447 93 1.1 III 101 103 10201 10403 -297 -253 75152 88498 63818 93 9.7
1977 JAN I 99 92 9801 9108 -299 -264 78951 89692 69497 91 0.8 II 86 69 7396 7654 -312 -267 83316 97648 71088 80 10.4 III 96 90 9216 8640 -302 -266 80347 91498 70556 89 1.6
FEB I 93 86 8649 7998 -305 -270 82366 93322 72697 86 0.1 II 94 89 8836 8366 -304 -267 81183 92712 71088 87 2.4 M 94 88 8836 8272 -304 -268 81488 92712 71622 87 1.3
MAR I 93 87 8649 8091 -305 -269 82061 93322 72158 86 1.2 II 100 94 10000 9400 -298 -262 78091 89094 68447 92 2.0 III 108 102 11664 11016 -290 -254 73674 84382 64325 99 2.8
APR I 135 126 18225 17010 -263 -230 60503 69425 52727 123 2.4 II 107 103 11449 11021 -291 -253 73636 84964 63818 98 4.6 III 118 113 13924 13334 -280 -243 68052 78672 58866 108 4.4
MAY I 128 118 16384 15104 -270 -238 64274 73163 56465 117 1.0 II 145 138 21025 20010 -253 -218 55164 64255 47360 132 4.5 III 268 233 71824 62444 -130 -123 16001 17027 15036 240 3.2
JUN I 473 379 223729 179267 75 23 1742 5552 546 421 11.2 II 339 252 114921 85428 -59 -104 6164 3539 10738 303 20.3 III 723 710 522729 513330 325 354 115000 105309 125583 642 9.6
JUL I 1450 1314 2102500 1905300 1052 958 1007747 1105681 918486 1284 2.3 II 1548 1403 2396304 2171844 1150 1047 1203974 1321382 1096998 1370 2.3 III 1200 1083 1440000 1299600 802 727 583003 642424 529077 1063 1.8
AUG I 1538 1433 2365444 2203954 1140 1077 1227686 1298492 1160741 1362 5.0 II 1016 853 1032256 866648 618 497 307137 381323 247384 901 5.6 M 737 642 543169 473154 339 286 96943 114592 82012 654 1.9
SEP I 730 620 532900 452600 332 264 87645 109901 69895 648 4.6 II 587 457 344569 268259 189 101 19111 35537 10277 522 14.2 III 395 327 156025 129165 -3 -29 100 12 819 353 7.8
OCT I 257 233 66049 59881 -141 -123 17349 20018 15036 231 1.0 H 207 189 42849 39123 -191 -167 31906 36667 27763 187 1.3 III 181 167 32761 30227 -217 -189 41023 47300 35579 164 2.0
NOV I 171 157 29241 26847 -227 -199 45184 51750 39451 155 1.4 II 156 144 24336 22464 -242 -212 51316 58800 44784 142 1.7 III 149 133 22201 19817 -249 -223 55541 62243 49561 135 1.8
DEC I 120 122 14400 14640 -278 -234 65061 77555 54580 - 110 10.0 II 124 114 15376 14136 -274 -242 66322 75343 58382 113 0.6 M 113 105 12769 11865 -285 -251 71549 81502 62812 104 1.3
1978 JAN I 101 92 10201 9292 -297 -264 78424 88498 69497 93 1.1 II 853 88 727609 75064 455 -268 -121638 206583 71622 757 760.1 III 94 88 8836 8272 -304 -268 81488 92712 71622 87 1.3
FEB I 94 88 8836 8272 -304 -268 81488 92712 71622 87 1.3
4
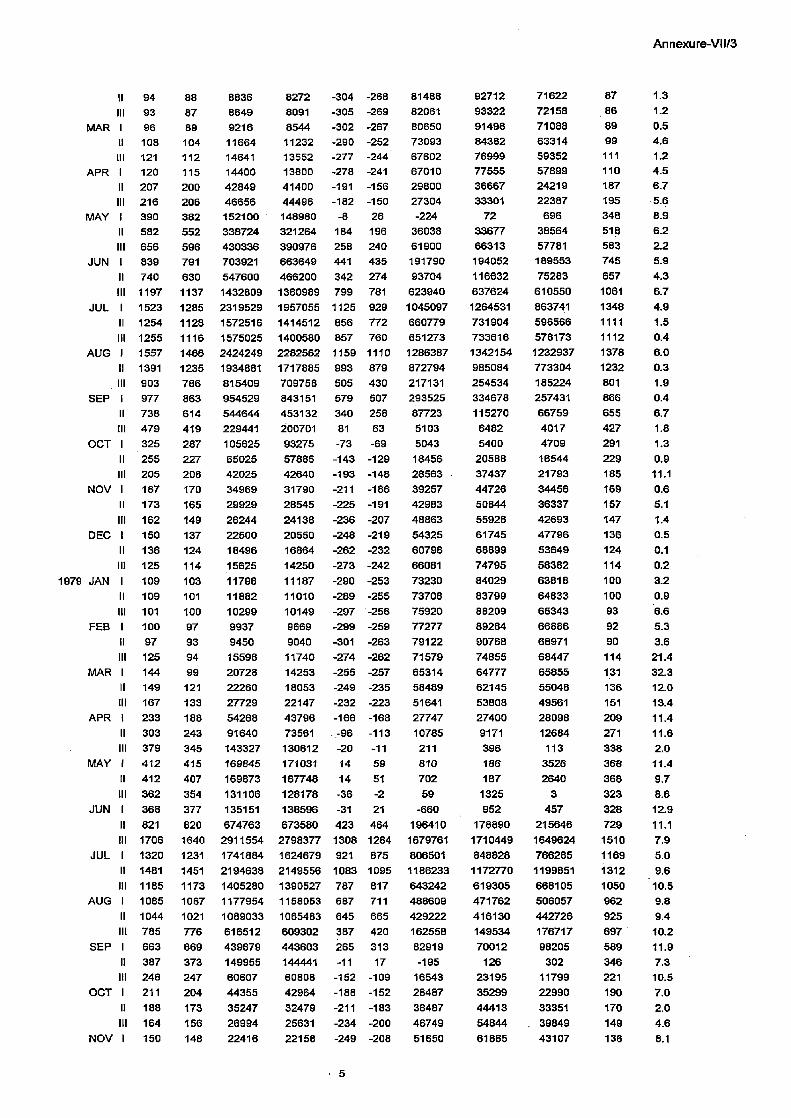
II III
94 93
88 87
8836 8649
8272 8091
-304 -305
-268 -269
81488 82061
92712 93322
71622 72158
87 86
An nexu re-V1I/3
1.3 1.2
MAR I 96 89 9216 8544 -302 -267 80650 91498 71088 69 0.5 II 108 104 11664 11232 -290 -252 73093 84382 63314 99 4.6 III 121 112 14641 13552 -277 -244 67602 76999 59352 111 1.2
APR I 120 115 14400 13800 -278 -241 67010 77555 57899 110 4.5 II 207 200 42849 41400 -191 -156 29800 36667 24219 187 6.7 III 216 206 46656 44496 -182 -150 27304 33301 22387 195 5.6
MAY I 390 362 152100 148980 -8 26 -224 72 696 348 8.9 II 582 552 338724 321264 184 196 36038 33677 38564 518 6.2 III 656 596 430336 390976 258 240 61900 66313 57781 583 2.2
JUN I 839 791 703921 663649 441 435 191790 194052 189553 745 5.9 II 740 630 547600 466200 342 274 93704 116632 75283 657 4.3 III 1197 1137 1432809 1360989 799 781 623940 637624 610550 1061 6.7
JUL I 1523 1285 2319529 1957055 1125 929 1045097 1264531 863741 1348 4.9 II 1254 1128 1572516 1414512 856 772 660779 731904 596566 1111 1.5 III 1255 1116 1575025 1400580 857 760 651273 733616 578173 1112 0.4
AUG I 1557 1468 2424249 2282562 1159 1110 1286387 1342154 1232937 1378 6.0 II 1391 1235 1934881 1717885 993 879 872794 985084 773304 1232 0.3 III 903 786 815409 709758 505 430 217131 254534 185224 801 1.9
SEP I 977 863 954529 843151 579 507 293525 334678 257431 866 0.4 II 738 614 544644 453132 340 258 87723 115270 66759 655 6.7 III 479 419 229441 200701 81 63 5103 6482 4017 427 1.8
OCT I 325 287 105625 93275 -73 -69 5043 5400 4709 291 1.3 II 255 227 65025 57885 -143 -129 18456 20588 16544 229 0.9 III 205 208 42025 42640 -193 -148 28563 37437 21793 185 11.1
NOV I 187 170 34969 31790 -211 -186 39257 44726 34456 169 0.6 II 173 165 29929 28545 -225 -191 42983 50844 36337 157 5.1 III 162 149 26244 24138 -236 -207 48863 55926 42693 147 1.4
DEC I 150 137 22500 20550 -248 -219 54325 61745 47796 136 0.5 II 136 124 18496 16864 -262 -232 60798 68899 53649 124 0.1 III 125 114 15625 14250 -273 -242 66081 74795 58382 114 0.2
1979 JAN I 109 103 11796 11187 -290 -253 73230 84029 63818 100 3.2 II 109 101 11882 11010 -289 -255 73708 83799 64833 100 0.9 III 101 100 10299 10149 -297 -256 75920 88209 65343 93 6.6
FEB I 100 97 9937 9669 -299 -259 77277 89284 66886 92 5.3 II 97 93 9450 9040 -301 -263 79122 90768 68971 90 3.6 III 125 94 15598 11740 -274 -262 71579 74855 68447 114 21.4
MAR I 144 99 20728 14253 -255 -257 65314 64777 65855 131 32.3 II 149 121 22260 18053 -249 -235 58489 62145 55048 136 12.0 III 167 133 27729 22147 -232 -223 51641 53808 49561 151 13.4
APR I 233 188 54268 43796 -166 -168 27747 27400 28098 209 11.4 II 303 243 91640 73561 . -96 -113 10785 9171 12684 271 11.6 III 379 345 143327 130612 -20 -11 211 396 113 338 2.0
MAY I 412 415 169845 171031 14 59 810 186 3526 368 11.4 II 412 407 169873 167748 14 51 702 187 2640 368 9.7 III 362 354 131106 128178 -36 -2 59 1325 3 323 8.6
JUN I 368 377 135151 138596 -31 21 -660 952 457 328 12.9 II 821 620 674763 673580 423 464 196410 178890 215646 729 11.1 III 1706 1640 2911554 2798377 1308 1284 1679761 1710449 1649624 1510 7.9
JUL I 1320 1231 1741884 1624679 921 875 806501 848828 766285 1169 5.0 II 1481 1451 2194638 2149556 1083 1095 1186233 1172770 1199851 1312 9.6 III 1185 1173 1405280 1390527 787 817 643242 619305 668105 1050 10.5
AUG I 1085 1067 1177954 1158053 687 711 488609 471762 506057 962 9.8 II 1044 1021 1089033 1065483 645 665 429222 416130 442726 925 9.4 III 785 776 616512 609302 387 420 162558 149534 176717 697 10.2
SEP I 663 669 439679 443603 265 313 82919 70012 98205 589 11.9 II 387 373 149955 144441 -11 17 -195 126 302 346 7.3 III 246 247 60607 60808 -152 -109 16543 23195 11799 221 10.5
OCT I 211 204 44355 42964 -188 -152 28487 35299 22990 190 7.0 II 188 173 35247 32479 -211 -183 38487 44413 33351 170 2.0 III 164 156 26994 25631 -234 -200 46749 54844 39849 149 4.6
NOV I 150 148 22416 22158 -249 -208 51650 61885 43107 136 8.1
5

Annexure-V11/3
II 132 133 17316 17501 -267 -223 59417 71234 49561 120 9.8 III 123 124 15096 15235 -276 -232 63840 75967 53649 112 9.4
DEC I 111 117 12400 13028 -287 -239 68516 82445 56941 102 12.7 II 98 111 9555 10850 -301 -245 73567 90442 59840 90 18.8 III 94 104 8763 9736 -305 -252 76714 92949 63314 86 16.8
1980 JAN I 92 90 6392 8245 -307 -266 81514 94173 70556 85 5.9 H 85 90 7148 7609 -314 -266 83390 98559 70556 78 12.8 III 88 90 7713 7904 -311 -266 82519 96512 70556 81 9.6
FEB I 91 94 8202 8513 -308 -262 80560 94816 68447 84 10.9 II 89 89 7988 7955 -309 -267 82416 95549 71088 83 7.0 III 100 94 10092 9443 -298 -262 77971 88821 68447 93 1.6
MAR I 92 96 8552 8878 -306 -260 79447 93642 67404 85 11.0 II 89 89 8009 7965 -309 -267 82384 95475 71088 83 6.9 III 96 102 9287 9830 -302 -254 76624 91274 64325 89 12.8
APR I 118 120 14000 14198 -280 -236 66014 78493 55518 108 9.8 II 159 150 25231 23827 -240 -206 49276 57428 42281 144 4.0 III 234 234 54835 54795 -164 -122 19985 27000 14792 211 10.0
MAY 1 352 258 123793 90775 -47 -98 4554 2176 9530 314 21.9 II 401 387 160860 155216 3 31 81 7 985 358 7.5 III 465 433 215982 201232 66 77 5126 4389 5987 414. 4.4
JUN I 733 716 537490 524926 335 360 120600 111991 129872 651 9.1 II 853 865 727093 737583 454 509 231365 206308 259465 757 12.5 III 1136 1106 1289367 1255866 737 750 553040 543194 563065 1006 9.0
JUL I 1107 1081 1226131 1197000 709 '725 514163 502428 526172 981 9.2 H 1312 1140 1721531 1495761 914 784 716595 834638 615247 1162 1.9 III 1207 1151 1456076 1388888 808 795 642819 653177 632624 1069 7.1
AUG I 1317 1221 1734390 1608011 918 865 794828 843599 748877 1166 4.5 II 810 756 655471 612067 411 400 164605 169024 160302 719 5.0 III 709 665 502766 485706 311 329 102296 96456 108489 630 8.1
SEP I 535 517 286348 276654 137 161 22049 18667 26043 476 7.9 II 407 393 165432 159846 8 37 308 68 1397 363 7.7 III 293 279 85690 81671 -106 -77 8103 11185 5871 262 6.0
OCT I 238 227 56625 54017 -161 -129 20647 25769 16544 214 5.8 II 188 185 35516 34864 -210 -171 35836 44113 29112 170 8.0 III 161 148 25803 23774 -238 -208 49384 56574 43107 146 1.6
NOV I 140 136 19662 19070 -258 -220 56721 66701 48234 128 6.2 II 125 120 15596 14986 -274 -236 64467 74857 55518 114 4.9 III 114 101 12976 11505 -285 -255 72459 80982 64833 104 3.4
DEC I 101 96 10132 9663 -298 -260 77322 88700 67404 93 3.4 II 93 100 8662 9307 -305 -256 78072 93280 65343 86 14.0 III 85 96 7159 8122 -314 -260 81490 98519 67404 79 18.2
1981 JAN I 86 83 7400 7140 -312 -273 85184 97632 74323 80 3.9 II 36 78 1307 2819 -362 -278 100594 131290 77075 36 54.2 III 79 87 6287 6898 -319 -269 85743 101885 72158 74 15.1
FEB I 81 78 6623 6348 -317 -278 88036 100556 77075 76 3.0 II 78 77 6060 5994 -321 -279 89338 102812 77631 73 5.8 III 81 63 6628 5129 -317 -293 92783 100537 85628 76 20.2
MAR I 97 83 9321 8013 -302 -273 82316 91168 74323 89 7.3 II 94 85 8831 7988 -305 -271 82408 92728 73237 87 2.1 III 131 108 17086 14117 -268 -248 66306 71702 61317 119 10.4
APR I 128 105 16403 13448 -270 -251 67772 73123 62812 117 11.3 H 220 196 48290 43071 -179 -160 28530 31946 25480 198 0.9 III 261 250 68297 .65334 -137 -106 14486 18810 11156 235 6.2
MAY I 431 423 185659 182263 32 67 2183 1049 4540 384 9.2 II 459 437 210964 200718 61 81 4950 3699 6622 409 6.3 III 596 576 355572 343468 198 220 43593 39130 48566 530 7.9
JUN I 477 465 227834 221953 79 109 8623 6215 11963 425 8.6 II 448 447 200280 200044 49 91 4481 2405 8350 399 10.8 III 916 930 838390 851542 517 574 297039 267444 329909 812 12.7
JUL I 846 843 715436 713038 447 487 218027 200121 237536 751 11.0 II 1036 1017 1073969 1053942 638 661 421852 406838 437419 919 9.7 III 1277 1243 1629580 1586752 878 887 779174 770996 787438 1131 9.0
AUG I 1383 1293 1912605 1788180 984 937 922832 969208 878675 1225 5.3
6

Annexure-VII/3
II III
1185 1017
1103 784
1404557 1035142
1307210 797657
787 619
747 428
587927 265137
618825 383078
558572 183507
1050 902
4.8 15.1
SEP I 505 490 255499 247680 107 134 14376 11445 18057 450 8.1 II 352 345 123803 121390 -47 -11 495 2174 113 314 8.9 III 300 280 89905 83956 -99 -76 7460 9731 5719 269 4.1
OCT I 229 205 52261 46864 -170 -151 25588 28859 22687 206 0.3 II 171 167 29360 28615 -227 -189 42843 51591 35579 155 7.1
111 152 151 22973 22887 • -247 -205 50525 60968 41871 138 8.8 NOV I 158 146 25024 23096 -240 -210 50372 57743 43942 .143 1.7
II 130 118 16785 15288 -269 -238 63904 72324 56465 118 0.2 111 115 102 13132 11689 -284 -254 72002 80595 64325 105 2.9
DEC I 104 94 10920 9823 -294 -262 76914 86430 68447 96 2.2 II 94 88 8913 8308 -304 -268 81378 92463 71622 87 0.9 III 88 83 7806 7333 -310 -273 84549 96182 74323 82 1.4
1982 JAN I 85 82 7299 7005 -313 -274 85659 98003 74870 79 3.3 II 83 80 6822 6608 -316 -276 87067 99787 75968 77 4.1 HI 82 78 6800 6432 -316 -278 87736 99873 77075 77 1.8
FEB I 83 79 6905 6564 -315 -277 87245 99472 76520 77 2.3 II 85 82 7208 6962 -314 -274 85804 98335 74870 79 3.9 III 87 65 7517 5635 -312 -291 90612 97211 84462 80 23.7
MAR I 123 85 15145 10461 -275 -271 74535 75856 73237 112 32.3 II 118 85 14019 10064 -280 -271 75797 78447 73237 108 27.5 III 157 101 24733 15884 -241 -255 61420 58186 64833 143 41.3
APR I 225 170 50829 38327 -173 -186 32119 29941 34456 203 19.3 II 242 183 58581 44292 -156 -173 27007 24477 29799 218 18.9 III 299 244 89409 72959 -99 -112 11103 9895 12460 268 9.8
MAY I 406 347 164985 140946 8 -9 -66 59 74 362 4.4 II 385 317 148274 122065 -13 -39 516 180 1492 344 8.4 III 415 376 172343 156093 17 20 339 277 415 370 1.5
JUN I 647 633 418883 409685 249 277 68991 61864 76938 575 9.1 II 1248 1237 1557842 1543944 850 881 748861 721904 776825 1106 10.6
111 1024 1006 1048544 1030128 625 650 406809 391248 422990 908 9.8 JUL I 1307 1333. 1708632 1742426 909 977 888104 825664 955266 1158 13.1
II 1301 1326 1691651 1724642 902 970 875424 813872 941631 1152 13.1 III 1332 1297 1774745 1727858 934 941 878972 871813 886190 1180 9.0
AUG I 1231 1156 1514727 1422738 832 800 666119 692651 640603 1090 5.7 II 1245 900 1550226 1120573 847 544 460867 716722 296346 1103 22.6 III 795 712 631464 565789 396 356 141183 156943 127004 705 0.9
SEP I 516 491 266641 253539 118 135 15959 13897 18327 460 6.4 II 561 415 314515 232739 162 59 9639 26351 3526 499 20.2 III 298 290 88890 86462 -100 -66 6585 10069 4306 267 7.9
OCT I 213 198 45268 42127 -186 -158 29274 34493 24845 192 3.2 II 182 179 33228 32629 -216 -177• 38186 46742 31196 165 8.0 III 165 173. 27070 28464 -234 -183 42726 54735 33351 149 13.8
NOV I 145 143 21134 20789 -253 -213 53817 64065 45209 132 7.6 II 134 130 17895 17390 -265 -226 59726 70074 50906 122 6.2 III 120 114 14343 13653 -279 -242 67346 77687 58382 110 3.9
DEC I 103 100 10532 10262 -296 -256 75629 87534 65343 94 5.6 II 99 96 9723 9466 -300 -260 77857 89930 67404 91 5.3 III 86 90 7359 7721 -313 -266 83061 97782 70556 80 11.6
1983 JAN I 88 86 7824 7607 -310 -270 83591 96119 72697 82 4.7 II 94 89 8806 8352 -305 -267 81226 92809 71088 87 2.6 III 98 88 9524 8588 -301 -268 80527 90539 71622 90 2.3
FEB I 93 88 8643 8181 -306 -268 81764 93342 71622 86 2.4 II 92 88 8435 8082 -307 -268 82064 94029 71622 85 3.5 III 90 88 8049 7895 -309 -268 82634 95338 71622 83 5.6
MAR I 95 90 9036 8555 -303 -266 80598 92070 70556 88 2.5 II 109 97 11947 10602 -289 -259 74790 83629 66886 100 3.4 III 122 103 14851 12552 -277 -253 69881 76520 63818 111 8.2
APR I 147 134 21666 19724 -251 -222 55692 63147 49117 134 0.2 II 173 150 29949 25959 -225 -206 46353 50818 42281 157 4.4 III 227 199 51626 45216 -171 -157 26825 29334 24531 204 2.7
MAY I 367 337 134732 123699 •-31 -19 585 988 347 328 2.7
7

Annexure-Vin
II 593 577 352047 342354 195 221 43135 37966 49008 528 8.6
III 634 539 402170 341817 236 183 43219 55546 33627 564 4.6
JUN I 820 776 673125 636663 422 420 177381 178047 176717 728 6.2 II 699 651 488573 455036 300 295 88759 90296 87248 621 4.6 III 956 908 914118 868134 558 552 308010 310928 305120 848 6.6
JUL I 1090 1010 1187989 1100848 691 654 452477 478121 428209 966 4.4 II 715 667 511831 477188 317 311 98687 100449 96956 635 4.7 III 1288 1193 1658515 1536385 889 837 744719 790938 701200 1141 4.4
AUG I 1361 1270 1851959 1728301 962 914 879979 926177 836085 1205 5.1
II 1153 937 1328673 1080062 754 581 438471 568809 337999 1021 9.0
III 1210 1098 1464188 1328620 812 742 602476 658614 551123 1072 2.4 SEP I 941 841 885914 791574 543 485 263435 294571 235591 835 0.7
II 710 616 503919 437281 311 260 81078 96961 67796 631 2.4
III 442 414 195242 182931 43 58 2532 1881 3408 394 4.9 OCT I 290 286 84156 82968 -108 -70 7546 11748 4847 260 9.1
II 232 227 53897 52700 -166 -129 21394 27666 16544 209 8.0
III 194 212 37817 41227 -204 -144 29302 41624 20628 176 17.2
NOV 1 171 167 29308 28590 -227 -189 42872 51661 35579 155 7.2
II 147 142 21645 20892 -251 -214 53697 63183 45635 134 5.8
III 133 129 17591 17109 -266 -227 60249 70680 51358 121 6.3 DEC I 120 114 14310 13637 -279 -242 67380 77765 58382 109 4.0
II 110 101 12113 11116 -288 -255 73440 83190 64833 101 0.0 III 101 105 10160 10584 -298 -251 74608 88619 62812 93 11.6
1984 JAN 1 94 92 8772 8617 -305 -264 80359 92918 69497 87 6.0 fl 89 86 7858 7623 -310 -270 83541 96003 72697 82 4.5 III 85 84 7164 7110 -314 -272 85247 98498 73779 79 6.5
FEB I 81 81 6592 6577 -317 -275 87136 100675 75418 76 6.8 II 84 80 7104 6743 -314 -276 86600 98721 75968 78 2.2 III 105 82 11057 8623 -293 -274 80263 86044 74870 97 17.9
MAR I 105 93 11053 9777 -293 -263 77042 86057 68971 97 3.9 II 119 111 14249 13250 -279 -245 68279 77907 59840 109 1.6 III 141 115 19878 16214 -257 -241 61960 66305 57899 128 11.6
APR I 153 146 23388 22328 -246 -210 51474 60296 43942 139 4.9
II 156 157 24427 24538 -242 -199 48106 58659 39451 142 9.7
III 238 239 56860 56990 -160 -117 18664 25611 13601 214 10.3 MAY I 317 319 100472 101115 -82 -37 2985 6644 1341 284 11.1
II 463 450 214409 208370 65 94 6093 4168 8907 413 8.3
III 667 618 445168 412335 269 262 70507 72212 68842 593 4.1
JUN I 1011 929 1022076 939198 612 573 351188 375146 328761 896 3.5
II 840 767 706338 644617 442 411 181809 195323 169231 746 2.8 III 763 709 581941 540861 364 353 128758 132762 124875 677 4.5
JUL I 857 798 734438 683881 459 442 202833 210229 195697 760 4.7 II 573 542 328223 310516 174 186 32508 30423 34736 510 6.0
III 854 773 729368 660165 456 417 190134 207520 174203 758 2.0 AUG I 794 726 629821 576163 395 370 146346 156125 137179 704 3.0
II 878 797 771172 699897 480 441 211719 230091 194814 779 2.2 III 832 747 692747 621739 434 391 169790 188207 153176 739 1.1
SEP I 686 610 470898 418594 288 254 73193 82791 64708 610 0.1 II 400 386 159719 154264 1 30 35 1 923 357 7.6 III 238 229 56649 54504 -160 -127 20320 25752 16033 214 6.6
OCT I 175 171 30722 29972 -223 -185 41210 49823 34086 159 7.3 II 152 149 23224 22707 -246 -207 50848 60561 42693 138 7.1
III 137 134 18795 18371 -261 -222 57930 68325 49117 125 6.8
NOV I 121 116 14565 14000 -278 -240 66567 77173 57419 110 4.8
II 105 99 11025 10395 -293 -257 75315 86133 65855 97 2.5
III 97 92 9330 8886 -302 -264 79587 91141 69497 89 3.1
DEC I 90 87 8047 7804 -309 -269 82946 95347 72158 83 4.6
II 88 84 7819 7428 -310 -272 84220 96138 73779 82 2.5
III 83 80 6903 6647 -315 -276 86932 99479 75968 77 3.5
1985 JAN I 82 77 6709 6307 -317 -279 88205 100221 77631 76 1.1
II 76 65 5812 4955 -322 -291 93653 103845 84462 71 9.4
III 75 72 5596 5386 -324 -284 91802 104767 80442 70 2.9
FEB I 72 69 5233 4992 -326 -287 93481 106371 82153 68 1.9
8

Annexure-V1 I/3
II 71 68 5054 4834 -327 -288 94166 107186 82727 67 2.1 III 73 70 5317 5104 -326 -286 92990 105995 81581 68 2.6
MAR I 83 79 6899 6562 -315 -277 87253 99492 76520 77 2.3 II 88 84 7742 7391 -310 -272 84338 96409 73779 82 3.0 M 94 89 6813 8355 -305 -267 81215 92785 71088 87 2.6
APR I 93 89 8575 8242 -306 -267 81556 93566 71088 86 3.8 II 116 110 13488 12775 -282 -246 69351 79721 60331 106 3.3
III 152 144 22972 21825 -247 -212 52254 60970 44784 138 4.4
MAY I 202 194 40835 39203 -196 -162 31744 38577 26122 182 6.1
II 443 223 196546 98864 45 -133 -5948 2011 17589 395 77.2 M 622 559 387329 347898 224 203 45530 50118 41362 553 1.0
JUN I 711 549 505065 390163 312 193 60371 97464 37395 631 15.0
II 737 611 542823 450163 338 255 86389 114433 65217 654 7.1 M 763 724 581941 552304 364 368 134223 132762 135702 677 6.5
JUL I 788 709 620502 558493 389 353 137546 151503 124875 699 1.4 II 828 800 685166 662198 429 444 190754 184266 197471 735 8.2 III 784 833 614536 653008 385 477 183999 148562 227889 696 16.5
AUG I 862 713 743607 614839 464 357 165766 215148 127718 765 7.3 II 948 825 898386 781962 549 469 257850 301781 220315 841 1.9 M 878 735 771233 645476 480 379 181992 230124 143927 779 6.0
SEP I 697 588 485456 409687 298 232 69309 88960 53999 619 5.3
II 476 397 226640 188999 78 41 3210 6019 1712 424 6.8
III 348 278 121257 96805 -50 -78 3902 2527 6025 311 12.0
OCT I 246 228 60357 56014 -153 -128 19502 23351 16288 221 3.2
II 330 258 108771 85090 -69 -98 6705 4717 9530 . 295 14.3
III 188 180 35301 33819 -211 -176 36986 44353 30843 170 5.7
NOV I 154 149 23776 22975 -244 -207 50476 59679 42693 140 6.1
II 134 129 18014 17314 -264 -227 59890 69838 51358 122 5.2
III 118 114 13889 13435 -281 -242 67808 78755 58382 108 5.4
DEC I 102 99 10352 10073 -297 -257 76151 88057 65855 94 5.4
II 205 90 41997 18444 -194 -266 51413 37464 70556 185 105.3
III 89 85 7836 7524 -310 -271 83884 96078 73237 82 3.5
1986 JAN I 81 78 6503 6290 -318 -278 88241 101024 77075 75 3.8
II 76 67 5775 5092 -322 -289 93078 104000 83303 71 5.9 III 75 73 5677 5500 -323 -283 91327 104419 79876 70 3.6
FEB I 81 77 6489 6203 -318 -279 88583 101080 77631 75 2.7 II 81 78 6599 6336 -317 -278 88076 100648 77075 76 3.1
III 82 80 6667 6532 -317 -276 87327 100384 75968 76 5.1 MAR I 93 90 8639 8365 -306 -266 81159 93356 70556 86 4.6
II 113 102 12786 11534 -285 -254 72387 81460 64325 _ 104 1.6 III 116 104 13377 12028 -283 -252 71166 79992 63314 106 1.9
APR I 125 116 15570 14475 -274 -240 65586 74915 57419 114 1.7 II 192 177 36797 33953 -207 -179 36914 42709 31906 173 2.2
III 262 235 68875 61673 -136 -121 16410 18509 14550 236 0.2
MAY I 296 278 87459 82214 -103 -78 7976 10558 6025 265 4.7
II 505 476 255470 240590 107 120 12875 11439 14491 450 5.5
III 253 261 63772 65911 -146 -95 13811 21303 8954 227 13.1
JUN I 321 301 103303 96744 -77 -55 4210 5941 2984 288 4.5 H 896 801 801936 717302 497 445 221362 247031 198361 794 0.8 III 1527 1349 2330775 2059501 1128 993 1120729 1272838 986798 1352 0.2
JUL I 1104 946 1218437 1044222 705 590 416418 497508 348545 978 3.4 II 1238 1104 1533071 1366942 840 748 628402 705073 560068 1097 0.6
III 1493 1365 2229798 2038287 1095 1009 1105030 1198510 1018842 1322 3.1 AUG I 1282 1115 1643307 1429336 883 759 670856 780448 576653 1136 1.8
II 1163 977 1351760 1135911 764 621 474835 583950 386109 1030 5.4
III 861 741 740901 637820 462 385 178148 213694 148515 764 3.1 SEP I 638 567 406866 361667 239 211 50598 57300 44680 567 0.0
II 360 346 129418 124473 -39 -10 373 1501 93 321 7.1 III 280 247 78381 69152 -119 -109 12874 14047 11799 251 1.6
OCT I 209 203 43662 42418 -190 -153 28927 35922 23294 188 7.2 II 195 178 37991 34695 -204 -178 36159 41442 31550 176 1.2 III 163 152 26569 24776 -235 -204 47950 55454 41462 148 2.8
NOV I 148 142 21875 21002 -251 -214 53530 62792 45635 134 5.3
9_

Annexure-VII/3
II 136 134 18450 18201 -263 -222 58210 68987 49117 124 7.6 III 129 127 16638 16382 -269 -229 61613 72629 52269 118 7.3
DEC I 125 123 15609 15367 -274 -233 63634 74830 54114 114 7.2 II 123 121 15135 14886 -275 -235 64630 75880 55048 112 7.1 III 120 117 14395 14038 -279 -239 66458 77566 56941 110 6.2
1987 JAN I 113 111 12783 12550 -285 -245 69821 81466 59840 104 6.6 II 109 97 11902 10582 -289 -259 74843 83747 66886 100 3.2 III 107 105 11412 11217 -292 -251 73096 85064 62812 98 6.5
FEB I 104 103 10786 10697 -295 -253 74431 86808 63818 96 7.3 II 105 104 11052 10933 -293 -252 73815 86058 63314 97 7.1 M 109 105 11902 11455 -289 -251 72528 83747 62812 100 4.6
MAR I 108 106 11601 11417 -291 -250 72585 84552 62312 99 6.7 II 112 110 12605 12350 -286 -246 70301 81920 60331 103 6.4 III 125 120 15616 14996 -274 -236 64448 74814 55518 114 4.9
APR I 145 138 21132 20061 -253 -218 55085 64069 47360 132 4.2 II 145 135 21158 19637 -253 -221 55824 64023 48675 132 2.0 III 200 190 39830 37919 -199 -166 32944 39566 27431 180 5.3
MAY I 282 226 79575 63753 -116 -130 15087 13548 16802 253 11.9 II 285 209 81344 59609 -113 -147 16609 12832 21498 256 22.3 III 371 325 137481 120505 -28 -31 848 767 938 331 1.9
JUN I 887 785 787225 696497 489 429 209867 238897 184365 787 0.3 II 816 685 665239 558701 417 329 137395 174002 108489 724 5.7 III 879 768 772247 674900 480 412 198060 230678 170055 780 1.5
JUL I 1237 1081 1530328 1337267 839 725 608285 703213 526172 1096 1.4 II 1048 977 1098671 1024067 650 621 403702 422096 386109 929 4.9 III 1210 1133 1463546 1370671 811 777 630674 658183 604315 1072 5.4
AUG I 963 894 927371 860923 565 538 303922 318677 289850 854 4.5 II 854 804 729633 686765 456 448 204325 207662 201042 758 5.7 III 823 760 677845 625718 425 404 171790 180478 163521 731 3.9
SEP I 656 640 430264 419805 257 284 73215 66285 80870 583 8.9 II 463 436 214677 202013 65 80 5212 4205 6460 413 5.3 III 385 310 148244 119357 -13 -46 614 181 2081 344 10.9
OCT I 229 213 52248 48687 -170 -143 24233 28869 20341 206 3.5 II 176 169 30876 29696 -223 -187 41574 49627 34828 159 5.9 III 158 150 24896 23668 -241 -206 49494 57938 42281 143 4.6
NOV I 139 137 19350 19057 -259 -219 56707 67279 47796 127 7.6 II 129 127 16660 16392 -269 -229 61594 72583 52269 118 7.3 III 123 123 15086 15107 -276 -233 64125 75989 54114 112 17
DEC I 118 116 13889 13671 -281 -240 67246 78755 57419 108 7.0 II 113 112 12838 12690 -285 -244 69477 81329 59352 104 7.3 III 109 108 11902 11782 -289 -248 71660 83747 61317 100 7.3
1988 JAN I 107 106 11443 11339 -292 -250 72769 84981 62312 98 7.3 II 108 105 11699 11357 -290 -251 72762 84289 62812 99 5.4 III 101 100 10236 10117 -297 -256 76000 88394 65343 93 6.8
FEB I 86 84 7457 7254 -312 -272 84782 97425 73779 80 4.7 II 74 71 5455 5244 -325 -285 92396 105382 81010 69 ' 2.8 III 88 73 7685 6400 -311 -283 87845 96609 79876 81 11.3
MAR I 83 76 6842 6286 -316 -280 88297 99712 78189 77 1.1 II 102 84 10482 8600 -296 -272 80429 87679 73779 94 12.2 III 102 91 10422 9290 -296 -265 78433 87851 70025 94 3.3
APR I 110 98 12169 10811 -288 -258 74240 83043 66370 101 3.3 II 286 255 81570 72829 -113 -101 11358 12742 10125 256 0.4 III 339 319 115059 108206 -59 -37 2171 3514 1341 303 4.9
MAY I 510 474 260305 241835 112 118 13224 12480 14013 454 4.2 II 591 553 349569 326958 193 197 38046 37156 38958 526 4.9 III 615 562 378187 345613 216 206 44677 46865 42591 547 2.7
JUN I 628 580 393971 364049 229 224 51424 52526 50345 558 18 II 642 582 411816 373486 243 226 55064 59167 51246 570 2.0 III 1096 995 1200388 1090144 697 639 445733 485998 408803 971 2.4
JUL I 1120 975 1254305 1091959 721 619 446863 520521 383628 993 1.8 II 1157 1015 1339677 1174806 759 659 500439 576017 434778 1026 1.0 III 1295 1128 1677812 1461103 897 772 692681 804282 596566 1147 1.7
AUG I 1298 1054 1684449 1367948 899 698 628104 808880 487730 1150 9.1
10

Annexure-V11/3
II III
1071 823
871 646
1146259 677518
932523 531732
672 425
515 290
346410 123302
451784 180310
265613 84319
949 730
9.0 13.1
SEP I 559 504 312519 281753 161 148 23822 25776 22016 497 1.3
II 418 386 174482 161236 19 30 584 370 923 373 3.5
III 727 427 528124 310310 328 71 23428 107738 5095 645 51.1
OCT I 340 270 115386 91715 -59 -86 5035 3458 7331 304 12.5
H 219 205 48066 44944 -179 -151 26999 32129 22687 197 3.7
HI 174 166 30343 28916 -224 -190 42531 50307 35957 158 5.1
NOV I 156 151 24484 23628 -242 -205 49521 58569 41871 142 6.0
U 144 141 20660 20267 -255 -215 54675 64897 46063 131 7.3
III 137 135 18870 18545 -261 -221 57609 68183 48675 125 7.3
DEC I 131 128 17250 16812 -267 -228 60809 71367 51812 120 6.4
II 125 124 15737 15555 -273 -232 63242 74551 53649 115 7.6
III 133 124 17597 16449 -266 -232 61573 70667 53649 121 2.5
1989 JAN I 133 122 17602 16186 -266 -234 62100 70657 54580 121 0.9 II 126 106 15758 13306 -273 -250 68136 74504 62312 115 8.2 III 113 108 12661 12152 -286 -248 70811 81775 61317 103 4.5
FEB I 112 106 12611 11904 -286 -250 71439 81904 62312 103 2.9 II 109 103 11840 11208 -290 -253 73178 83911 63818 100 3.0
M 107 102 11360 10871 -292 -254 74034 85208 64325 98 4.0 MAR I 111 108 12389 12021 -287 -248 71112 82472 61317 102 5.5
II 117 113 13723 13237 -281 -243 68260 79154 58866 107 5.1 HI 131 123 17227 16144 -267 -233 62165 71415 54114 120 2.7
APR I 133 124 17587 16444 -266 -232 61582 70687 53649 121 2.5 II 142 136 20130 19296 -257 -220 56356 65846 48234 129 5.1
III 146 140 21297 20431 -253 -216 54456 63783 46493 133 5.2
MAY I 182 161 32972 29235 -217 -195 42215 47048 37878 164 1.9
II 312 290 97504 90554 -86 -66 5659 7436 4306 279 3.6
III 560 512 314058 286929 162 156 25321 26219 24454 499 2.6 JUN I 985 879 969614 865542 586 523 306805 343635 273923 873 0.7
II 745 675 555517 503098 347 319 110774 120301 102002 662 2.0 III 663 634 439822 420463 265 278 73688 70069 77494 589 7.0
JUL I 792 720 627462 570330 394 364 143433 154952 132771 703 2.3 II 1145 1036 1312164 1186735 747 680 508249 558026 462913 1015 2.0 III 1308 1183 1711946 1547853 910 827 752853 827968 684553 1159 2.0
AUG I 851 740 724756 629981 453 384 174061 205064 147746 755 2.1 II 781 694 610130 542089 383 338 129470 146399 114499 693 0.1 III 881 757 776931 667248 483 401 193845 233241 161103 782 3.3
SEP I 597 535 355918 319175 198 179 35535 39244 32176 531 0.8 II 378 361 142678 136360 -21 5 -112 431 29 337 6.6 III 315 279 99147 87851 -84 -77 6406 6991 5871 282 1.0
OCT I 226 220 50992 49679 -173 -136 23418 29815 18394 203 7.6 II 189 185 35857 35032 -209 -171 35682 43734 29112 171 7.6
III 177 170 31270 30062 -222 -186 41144 49130 34456 160 5.9 NOV I 162 158 26396 25670 -236 -198 46643 55704 39055 147 6.8
II 146 142 21210 20680 -253 -214 54015 63933 45635 132 6.8 III 138 133 19067 18365 -260 -223 57971 67809 49561 126 5.5
DEC 1 114 125 12938 14218 -285 -231 65668 81078 53187 104 16.6
H 120 116 14354 13898 -279 -240 66778 77662 57419 110 5.5
III 121 115 14728 13956 -277 -241 66683 76800 57899 111 3.5
1990 JAN I 105 101 11130 10655 -293 -255 74602 85842 64833 97 4.0 II 101 89 10285 9026 -297 -267 79206 88250 71088 93 4.9
M 101 99 10265 10030 -297 -257 76261 88310 65855 93 5.8 FEB I 104 103 10883 10745 -294 -253 74313 86533 63818 96 6.9
II 108 102 11760 11061 -290 -254 73561 84124 64325 100 2.4 III 107 101 11352 10761 -292 -255 74335 85229 64833 98 3.1
MAR I 108 102 11717 11041 -290 -254 73612 84239 64325 99 2.6
II 114 119 12938 13535 -285 -237 67377 81078 55990 104 12.4 III 201 147 40581 29613 -197 -209 41107 38824 43524 182 23.6
APR I 186 137 34454 25430 -213 -219 46538 45312 47796 168 22.4
II 194 179 37760 34783 -204 -177 36061 41684 31196 175 2.0
III 252 240 63367 60415 -147 -116 16969 21538 13369 226 5.8 MAY I 360 413 129898 148851 -38 57 -2184 1450 3292 ' 322 22.0
11

A n nexu re-V11/3
II 966 902 932716 871127 567 546 309952 321813 298528 856 5.1 III 869 759 755805 659852 471 403 189944 221732 162713 771 1.6
JUN I 859 736 737204 631934 460 380 175019 211710 144687 762 3.5 II 731 729 535058 533246 333 373 124331 110882 139410 650 119 III 1396 1340 1948378 1870430 997 984 981775 994721 968998 1236 7.8
JUL I 1261 1068 1590929 1347090 863 712 614663 744483 507481 1117 4.6 II 1172 889 1372636 1041548 773 533 412359 597698 284491 1038 16.8 III 961 850 923464 816825 562 494 278079 316388 244409 852 0.3
AUG I 1058 937 1118326 990886 659 581 383141 434311 337999 937 0.0 II 1048 828 1099045 868037 650 472 306982 422328 223140 929 12.2 III 857 722 734944 618963 459 366 168095 210500 134232 761 5.4
SEP I 743 618 551823 459080 344 262 90353 118585 68842 660 6.7 II 546 476 297892 259798 147 120 17733 21700 14491 486 2.0 III 407 320 -165521 130190 6 -36 -298 70 1269 363 13.4
OCT I 265 241 70265 63883 -133 -115 15292 17799 13138 238 1.3 II 225 207 50641- 46582 -173 -149 25779 30085 22089 203 2.2 III 190 174 36246 33127 -208 -182 37796 43307 32987 172 1.2
NOV / 158 153 24928 24157 -241 -203 48751 57888 41056 143 6.4 II 154 148 23675 22772 -245 -208 50788 59838 43107 140 5.6 III 145 142 21152 20652 -253 -214 54057 64033 45635 132 6.9
DEC I 138 134 19126 18532 -260 -222 57664 67698 49117 126 6.0 II 133 130 17737 17314 -265 -226 59859 70386 50906 121 6.6 III 120 112 14346 13415 -279 -244 67900 77679 59352 110 2.2
1991 JAN I 112 91 12622 10224 -286 -265 75718 81874 70025 103 13.2 II 104 80 10789 8310 -295 -276 81203 86798 75968 96 19.4 M 96 87 9286 8384 -302 -269 81157 91277 72156 89 2.2
FEB I 96 90 9256 8659 -302 -266 80292 91372 70556 89 1.4
II 99 90 9803 8911 -299 -266 79548 89687 70556 91 1.4 III 99 93 9784 9199 -300 -263 78674 89742 68971 91 2.0
MAR I 116 98 13541 11404 -282 -258 72681 79593 66370 107 8.7
II 134 108 18060 14514 -264 -248 65397 69749 61317 122 13.4
III 162 146 26339 23695 -236 -210 49512 55788 43942 147 0.8
APR I 221 200 48865 44211 -177 -156 27613 31482 24219 199 0.5
II 198 185 39188 36623 -201 -171 34214 40211 29112 179 3.5 III 235 232 55396 54604 -163 -124 20166 26609 15283 212 8.8
MAY I 383 360 147046 138048 -15 4 -66 226 19 342 4.9
II 511 507 261234 259133 113 151 17049 12684 22915 455 10.2 III 612 571 375010 349669 214 215 46068 45751 46387 544 4.6
JUN I 1029 1074 1059733 1105611 631 718 453258 398094 516065 913 15.0
II 1361 1166 1853155 1587283 963 810 780247 927023 656711 1206 3.4 III 1181 1112 1395726 1313726 783 756 592184 612967 572106 1047 5.9
JUL I 1453 1318 2109902 1914461 1054 962 1014407 1111051 926169 1286 2.4
II 1261 1182 1589929 1490412 862 826 712699 743799 682899 1117 5.5 HI 1227 1079 1505787 1324047 829 723 599404 686610 523274 1087 0.8
AUG I 1002 833 1003954 834645 603 477 288092 364199 227889 888 6.6
II 705 642 496847 452529 306 286 87742 93873 82012 626 2.5
III 796 681 634382 542404 398 325 129498 158400 105870 707 3.8
SEP I 704 564 495019 396817 305 208 63574 93080 43421 625 10.8
II 506 449 255771 227076 107 93 10015 11503 8719 450 0.3
III 303 253 91682 76606 -96 -103 9821 9158 10532 271 7.2
OCT I 231 221 53571 51151 -167 -135 22486 27900 18123 208 5.8
II 195 183 38024 35685 -203 -173 35127 41407 29799 176 3.8
III 173 163 30048 28255 -225 -193 43368 50689 37104 157 3.8
NOV I 159 149 25230 23667 -240 -207 49516 57430 42693 144 3.3
II 144 137 20754 19737 -254 -219 55623 64731 47796 131 4.4
III 131 128 17291 16832 -267 -228 60773 71284 51812 120 6.3
DEC I 125 122 15593 15234 -274 -234 63923 74865 54580 114 6.5
II 123 120 15156 14773 -275 -236 64885 75833 55518 113 6.2
III 121 119 14676 14416 -277 -237 65625 76918 55990 111 6.9
1992 JAN I 116 112 13526 13026 -282 -244 68747 79629 59352 107 4.9
II 114 111 12896 12605 -285 -245 69700 81183 59840 104 6.2
III 116 113 13456 13108 -282 -243 68538 79798 58866 106 6.0
FEB I 127 114 16125 14476 -272 -242 65601 73713 58382 116 1.7
12

Annexure-VII/3
II 118 112 13871 13191 -281 -244 68388 78798 59352 108 3.7
III 126 108 15910 13622 -272 -248 67441 74176 61317 115 6.7
MAR I 112 111 12479 -12400 -287 -245 70152 82240 59840 102 7.7
II 121 118 14523 14221 -278 -238 66053 77269 56465 110 6.6
111 145 133 20982 19265 -254 -223 56465 64330 49561 132 1.0
APR I 137 134 18783 18365 -261 -222 57940 68349 49117 125 6.8
II 155 152 23964 23530 -244 -204 49620 59381 41462 140 7.6
III 223 226 49670 50368 -176 -130 22764 30842 16802 201 11.2
MAY I 270 247 73033 66751 -128 -109 13930 16445 11799 242 1.9
II 429 414 184445 177801 31 58 1809 960 3408 383 7.5
III 410 377 168210 154621 12 21 249 136 457 366 2.9
JUN I 481 485 231094 233150 82 129 10639 6763 16738 428 11.7
II 782 740 611698 578762 384 384 147457 147168 147746 694 6.2
III 1081 907 1168329 980370 682 551 376263 465679 304016 958 5.6
JUL I 649 602 421256 390723 251 246 61731 62778 60702 577 4.2
11 980 876 960039 858319 581 520 302511 337944 270792 869 0.8
III 1254 1047 1572611 1312978 856 691 591509 731969 478002 1111 6.1
AUG 1 1059 863 1120490 913513 660 507 334892 435661 257431 938 8.7
II 973 780 945953 758629 574 424 243641 329608 180096 862 10.6
Ill 858 692 735435 593442 459 336 154427 210763 113149 761 10.0
SEP 1 753 614 567219 462428 355 258 91634 125779 66759 669 8.9
II 535 404 286572 216271 137 48 6620 18725 2340 476 17.9
111 292 227 85178 66251 -107 -129 13715 11371 16544 261 15.2
OCT i 239 214 57246 51202 -159 -142 22550 25353 20057 215 0.5
II 194 180 37743 34970 -204 -176 35864 41702 30843 175 2.6
III 165 152 27177 25058 -234 -204 47573 54584 41462 149 1.7
NOV I 144 135 20713 19429 -255 -221 56163 64803 48675 131 3.0
II 136 126 18531 17152 -262 -230 60243 68831 52727 124 1.6
III 131 123 17243 16151 -267 -233 62151 71382 54114 120 2.6
DEC I 122 119 14819 14486 -277 -237 65487 76593 55990 111 6.5
II 110 107 12179 11808 -288 -249 71636 83018 61813 101 5.4
III 106 104 11245 11029 -292 -252 73585 85523 63314 97 6.3
1993 JAN I 106 105 11281 11152 -292 -251 73250 85423 62812 98 7.0
II 106 94 11281 9984 -292 -262 76465 85423 68447 98 3.8
IH 105 ' 103 11014 10810 -294 -253 74154 86164 63818 96 6.3
FEB 1 105 100 10942 10460 -294 -256 75123 86366 65343 96 3.8
II 105 103 10975 10790 -294 -253 74202 86275 63818 96 6.5
III 107 104 11403 11105 -292 -252 73399 85091 63314 98 5.7
MAR I 107 104 11453 11130 -291 -252 73340 84953 63314 98 5.5
II 117 115 13773 13496 -281 -241 67646 79032 57899 107 6.6
- III 139 125 19201 17321 -260 -231 59943 67557 53187 126 0.9
APR I 126 118 15860 14861 -273 -238 64764 74283 56465 115 2.5
II 149 148 22063 21983 -250 -208 51896 62476 43107 135 8.8
III 254 262 64578 66580 -144 -94 13516 20841 8765 228 12.9
MAY I 458 439 209769 201064 60 83 4963 3543 6952 408 7.0
II 299 251 89304 75008 -100 -105 10425 9930 10946 268 6.6
III 472 480 223094 226717 74 124 9184 5453 15470 421 12.3
JUN I 527 493 277400 259657 128 137 17612 16436 18872 469 4.9
II 755 654 570725 494073 357 298 106514 127433 89029 671 2.6
III 640 578 409335 369800 241 222 53661 58229 49451 569 1.6
JUL I 737 699 543753 515440 339 343 116374 114860 117908 655 6.3
II 1089 876 1186309 954120 691 520 359420 477056 270792 965 10.2
III 715 607 511450 434101 317 251 79604 100281 63190 635 4.6 AUG I 758 659 574709 499585 360 303 109097 129319 92038 673 2.1
II 631 552 398748 348569 233 196 45752 54279 38564 561 1.7
111 557 522 310677 290955 159 166 26437 25249 27681 496 5.0
SEP I 521 448 271108 233265 122 92 11288 14931 8533 463 3.5
II 481 396 231710 190620 83 40 3346 6869 1630 429 8.3
III 290 234 84263 67926 -108 -122 13160 11708 14792 260 11.2
OCT I 215 198 46434 42666 -183 -158 28845 33489 24845 194 2.0
II 176 165 31080 29089 -222 -191 42354 49368 .36337 159 3.3
III 150 146 22634 21965 -248 -210 51995 61525 43942 137 6.4
NOV I 137 135 18839 18530 -261 -221 57633 68241 48675 125 7.4
13

Annexure-VII/3
H 133 130 17626 17259 -266 -226 59953 70609 50906 121 6.9
III 129 126 16616 16242 -270 -230 61902 72675 52727 118 6.6 DEC I 123 120 15173 14782 -275 -236 64869 75794 55518 113 6.2
II 112 108 12503 12076 -287 -248 70986 82180 61317 103 5.0
III 105 102 11033 10714 -293 -254 74425 86111 64325 97 5.3 1994 JAN I 103 102 10698 10550 -295 -254 74833 87059 64325 95 6.7
II 105 93 10937 9726 -294 -263 77186 86380 68971 96 3.4 III 75 99 5693 7470 -323 -257 82898 104351 65855 70 28.8
FEB I 99 97 9836 9620 -299 -259 77408 89585 66886 91 5.8 II 100 98 9952 9776 -299 -258 76959 89238 66370 92 6.2 III 103 100 10559 10276 -296 -256 75596 87456 65343 95 5.4
MAR I 101 99 10199 9998 -297 -257 76344 88503 65855 93 6.1 II 116 116 13465 13460 -282 -240 67681 79777 57419 106 8.4 III 126 134 15979 16939 -272 -222 60299 74027 49117 115 13.9
APR I 137 145 18903 19936 -261 -211 54972 68119 44362 125 13.6 H 128 114 16485 14637 -270 -242 65261 72950 58382 117 2.8 M 137 140 18772 19181 -261 -216 56380 68370 46493 125 10.9
MAY I 238 237 56583 56376 -161 -119 19053 25797 14071 214 9.8
II 280 287 78325 80322 -119 -69 8140 14071 4709 251 12.6
III 613 584 375758 357987 215 '228 48988 46012 52156 545 6.7 JUN I 789 714 622422 563301 390 358 139929 152452 128434 700 1.9
II 676 647 456343 437069 277 291 80725 76754 84900 600 7.2 III 1317 1023 1734942 1347467 919 667 613110 843984 445392 1167 14.0
JUL I 1365 1264 1861999 1724792 966 908 877551 933281 825149 1208 4.4 II 1200 1059 1439048 1270380 801 703 563487 641789 494739 1063 0.4 III 1491 1308 2224070 1950662 1093 952 1040801 1194311 907022 1320 0.9
AUG I 1442 1263 2080534 1821759 1044 907 947229 1069768 823333 1277 1.1 II 1182 937. 1396020 1107096 783 581 455245 613162 337999 1047 11.7
III 1145 904 1311441 1035244 747 548 409470 557554 300717 1015 12.3 SEP I 978 761 956294 744184 579 405 234882 335724 164330 867 13.9
II 563 451 316692 253802 164 95 15667 26984 9097 501 11.0 III 316 256 100051 80975 -82 -100 8187 6753 9925 283 10.6
OCT I 258 229 66377 58999 -141 -127 17835 19839 16033 231 1.0 II 208 198 43072 41092 -191 -158 30098 36461 24845 187 5.5
III 175 164 30591 28684 -224 -192 42844 49990 36719 158 3.5
NOV I 153 151 23380 23089 -246 -205 50252 60310 41871 139 8.1
II 144 142 20705 20433 -255 -214 54387 64817 45635 131 7.8
III 135 133 18258 17971 -263 -223 58631 69360 49561 123 7.4
DEC I 129 115 16642 14835 -269 -241 64844 _ 72621 57899 118 2.4
H 125 123 15705 15414 -273 -233 63545 74620 54114 114 6.9
III 122 119 14852 14502 -277 -237 65454 76518 55990 111 6.4
1995 JAN I 117 115 13648 13435 -282 -241 67774 79332 57899 107 7.0
II 112 110 12497 12297 -287 -246 70420 82196 60331 103 6.8
III 107 116 11495 12437 -291 -240 69795 84839 57419 98 15.1
FEB I 105 104 10945 10880 -294 -252 73944 86358 63314 96 7.5
II 109 106 11853 11540 -290 -250 72295 83878 62312 100 5.7
III 115 109 13176 12512 -284 -247 69967 80487 60823 105 3.5
MAR I 112 107 12568 11995 -286 -249 71201 82014 61813 103 3.9
II 106 102 11232 10810 -293 -254 74187 85560 64325 97 4.5
III 131 100 17046 13056 -268 -256 68488 71785 65343 119 19.1
APR I 131 120 17145 15713 -268 -236 63040 71581 55518 119 0.5
II 142 132 20159 18741 -257 -224 57361 65795 50007 129 2.1
III 167 160 27861 26707 -232 -196 45300 53624 38268 151 5.5
MAY I 223 215 49904 48029 -175 -141 24622 30658 19775 201 6.5
II 672 600 451276 403063 273 244 66785 74685 59720 597 0.5
III 389 360 151119 139946 -10 4 -43 95 19 347 3.6
JUN I 739 669 546359 494499 341 313 106760 116060 98205 656 1.9
II 1031 893 1062383 920433 632 537 339748 399719 288774 914 2.3
III 587 524 344189 307418 188 168 31687 35415 28351 522 0.4
JUL I 894 748 799811 668952 496 392 194554 245853 153960 793 6.1
II 1008 818 1016309 824643 610 462 281881 371655 213792 894 9.3
III 1032 851 1065646 878488 634 495 313977 401722 245398 915 7.5
AUG I 1035 820 1071474 848799 637 464 295638 405303 215646 918 11.9
14

Annexure-VII/3
II 913 925 833338 844408 514 569 292880 264594 324190 810 12.5 III 790 657 624576 519228 392 301 118084 153519 90828 702 6.8
SEP I 838 582 702979 487971 440 226 99595 193558 51246 744 27.8 II 500 377 249711 188391 101 21 2164 10246 457 445 18.0 III 301 270 90391 81176 -98 -86 8377 9572 7331 269 0.3
OCT 1 236 220 55663 51905 -163 -136 22046 26424 18394 212 3.6 H 202 191" 40757 38560 -197 -165 32365 38652 27101 182 4.7 III 170 160 28977 27236 -228 -196 44653 52103 38268 154 3.7
NOV I 146 140 21439 20499 -252 -216 54351 63537 46493 133 4.9 II 140 135 19461 18833 -259 -221 57138 67073 48675 127 5.9 III 134 129 17874 17246 -265 -227 60008 70116 51358 122 5.5
DEC I 128 123 16277 15693 -271 -233 63018 73389 54114 116 5.3 II 120 117 14291 13987 -279 -239 66561 77807 56941 109 6.5 III 118 127 13856 14949 -281 -229 64192 78835 52269 108 15.2
1996 JAN I 115 112 13116 12827 -284 -244 69179 80634 59352 105 6.3 H 110 108 12138 11899 -288 -248 71393 83125 61317 101 6.4 III 106 105 11271 11147 -292 -251 73263 85452 62812 98 7.1
FEB I 103 102 10585 10494 -296 -254 74971 87380 64325 95 7.2 II 106 102 11224 10806 -293 -254 74195 85580 64325 97 4.5 III 122 105 .14937 12833 -276 -251 69240 76325 62812 112 6.4
MAR 4 112 107 12541 . 11983 -286 -249 71230 82082 61813 103 4.0 II 132 123 17324 16189 -267 -233 62079 71217 54114 120 2.4 III 140 131 19577 18329 -259 -225 58080 66857 50456 127 2.8
APR I 144 138 20865 19934 -254 -218 55285 64536 47360 131 4.8 II 227 218 51621 49530 -171 -138 23572 29338 18940 204 6.2 III 366 345 133715 126156 -33 -11 349 1077 113 327 5.3
MAY I 388 361 150159 139889 -11 5 -59 121 29 346 4.2 II 365 342 133539 124977 -33 -14 450 1093 ' 186 326 4.5 III 549 564 301805 309843 151 208 31440 22765 43421 489 13.3
JUN I 607 567 367857 343892 208 211 43972 43275 44680 539 4.9 H 1136 1029 1289470 1168479 737 673 496321 543261 453436 1006 2.2 III 1574 1483 2475963 2333529 1175 1127 1324705 1380703 1270979 1393 6.1
JUL I 888 771 788402 684586 489 415 203300 239546 172538 788 2.2 II 1060 936 1124609 992606 662 580 384204 438231 336837 940 0.4 III 1088 1026 1184828 1116799 690 670 462568 476116 449405 965 6.0
AUG I 1094 937 1196039 1024737 695 581 404144 483233 337999 969 3.4 II 1259 912 1585880 1148497 861 556 478946 741030 309555 1116 22.3 III 803 645 644381 517763 404 289 116980 163416 83739 712 10.5
SEP I 669 545 448179 364857 271 189 51316 73428 35864 595 9.1 II 545 444 297017 241977 147 88 12948 21464 7810 485 9.2 III 322 304 103440 97773 -77 -52 3968 5908 2665 288 5.3
OCT I 257 244 65896 62635 -142 -112 15826 20103 12460 230 5.6 II 205 192 41875 39290 -194 -164 31719 37579 26773 184 3.9 III 170 163 28741 27633 -229 -193 44102 52421 37104 154 5.8
NOV I 151 149 22757 22478 -248 -207 51166 61321 42693 137 8.0 II 139 136 19388 18937 -259 -220 56936 67208 48234 127 6.8 III 133 131 17685 17421 -266 -225 59638 70491 50456 121 7.5
DEC I 128 126 16322 16097 -271 -230 62166 73295 52727 117 7.4 II 121 118 14719 14316 -277 -238 65860 76819 56465 111 6.0 III 114 111 12909 12612 -285 -245 69685 81149 59840 104 6.2
1997 JAN I 109 108 11960 11811 -289 -248 71594 83593 61317 100 7.1 II 105 104 11009 10912 -294 -252 73867 86178 63314 96 7.2 M 103 102 10580 10491 -296 -254 74978 87397 64325 95 7.2
FEB I 103 102 10592 10498 -296 -254 74963 87360 64325 95 7.2 II 103 102 10522 10463 -296 -254 75049 87561 64325 94 7.5 III 101 100 10285 10142 -297 -256 75938 88250 65343 93 6.6
MAR I 102 101 10349 10275 -297 -255 75561 88065 64833 94 7.3 H 111 109 12327 12102 -287 -247 70894 82632 60823 102 6.6 III 109 106 11863 11545 -290 -250 72283 83851 62312 100 5.7
APR I 114 112 13034 12787 -284 -244 69266 80837 59352 105 6.6 H 135 130 18105 17492 -264 -226 59549 69659 50906 123 5.7 III 169 165 28629 27918 -229 -191 43707 52572 36337 153 7.1
MAY I 144 221 20660 31765 -255 -135 34295 64898 18123 131 40.8
15
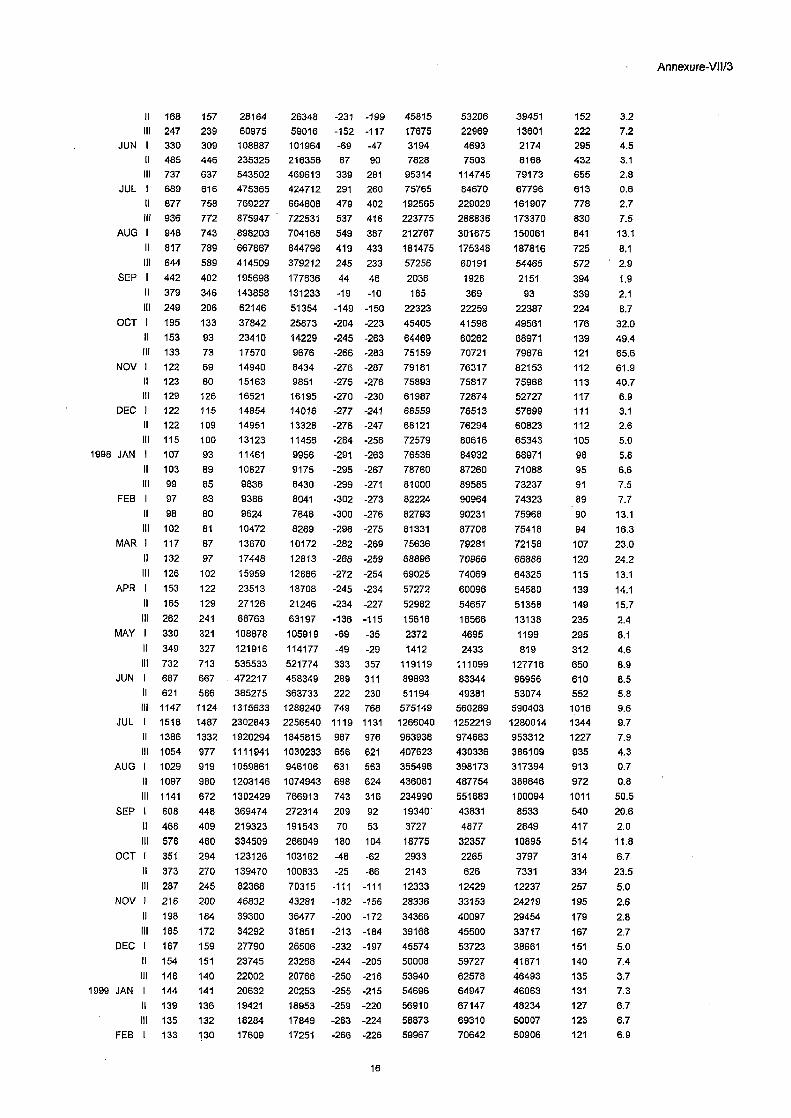
Annexure-V11/3
II 168 157 28164 26348 -231 -199 45815 53206 39451 152 3.2 III 247 239 60975 59016 -152 -117 17675 22969 13601 222 7.2
JUN I 330 309 108887 101964 -69 -47 3194 4693 2174 295 4.5 II 485 446 235325 216356 87 90 7828 7503 8168 432 3.1 III 737 637 543502 469613 339 281 95314 114745 79173 655 2.8
JUL I 689 616 475365 424712 291 260 75765 84670 67796 613 0.6 II 877 758 769227 664808 479 402 192565 229029 161907 778 2.7 III 936 772 875947 722531 537 416 223775 288836 173370 830 7.5
AUG I 948 743 898203 704168 549 387 212767 301675 150061 841 13.1 II 817 789 667867 644796 419 433 181475 175348 187816 725 8.1 III 644 589 414509 379212 245 233 57256 60191 54465 572 2.9
SEP I 442 402 195698 177836 44 46 2036 1926 2151 394 1.9 H 379 346 143858 131233 -19 -10 185 369 93 339 2.1 III 249 206 62146 51354 -149 -150 22323 22259 22387 224 8.7
OCT 1 195 133 37842 25873 -204 -223 45405 41598 49561 176 32.0 II 153 93 23410 14229 -245 -263 64469 60262 68971 139 49.4 III 133 73 17570 9676 -266 -283 75159 70721 79876 121 65.6
NOV I 122 69 14940 8434 -276 -287 79181 76317 82153 112 61.9 II 123 80 15163 9851 -275 -276 75893 75817 75968 113 40.7 III 129 126 16521 16195 -270 -230 61987 72874 52727 117 6.9
DEC 1 122 115 14854 14016 -277 -241 66559 76513 57899 111 3.1 II 122 109 14951 13328 -276 -247 68121 76294 60823 112 2.6 III 115 100 13123 11456 -284 -256 72579 80616 65343 105 5.0
1998 JAN I 107 93 11461 9956 -291 -263 76536 84932 68971 98 5.8 II 103 89 10627 9175 -295 -267 78760 87260 71088 95 6.6 III 99 85 9836 8430 -299 -271 81000 89585 73237 91 7.5
FEB I 97 83 9386 8041 -302 -273 82224 90964 74323 89 7.7 II 98 80 9624 7848 -300 -276 82793 90231 75968 90 13.1 III 102 81 10472 8289 -296 -275 81331 87708 75418 94 16.3
MAR I 117 87 13670 10172 -282 -269 75636 79281 72158 107 23.0 II 132 97 17448 12813 -266 -259 68896 70966 66886 120 24.2 III 126 102 15959 12886 -272 -254 69025 74069 64325 115 13.1
APR I 153 122 23513 18708 -245 -234 57272 60096 54580 139 14.1 II 165 129 27126 21246 -234 -227 52982 54657 51358 149 117 III 262 241 68763 63197 -136 -115 15618 18566 13138 235 2.4
MAY I 330 321 108878 105919 -69 -35 2372 4695 1199 295 8.1 II 349 327 121916 114177 -49 -29 1412 2433 819 312 4.6 III 732 713 535533 521774 333 357 119119 111099 127718 650 8.9
JUN I 687 667 472217 458349 289 311 89893 83344 96956 610 8.5 II 621 586 385275 363733 222 230 51194 49381 53074 552 5.8 III 1147 1124 1315633 1289240 749 768 575149 560289 590403 1016 9.6
JUL I 1518 1487 2302843 2256540 1119 1131 1266040 1252219 1280014 1344 9.7 II 1386 1332 1920294 1845815 987 976 963938 974683 953312 1227 7.9 III 1054 977 1111941 1030233 656 621 407623 430336 386109 935 4.3
AUG I 1029 919 1059861 946106 631 563 355496 398173 317394 913 0.7 II 1097 980 1203146 1074943 698 624 436061 487754 389846 972 0.8 III 1141 672 1302429 766913 743 316 234990 551683 100094 1011 50.5
SEP I 608 448 369474 272314 209 92 19340' 43831 8533 540 20.6 II 468 409 219323 191543 70 53 3727 4877 2849 417 2.0 III 578 460 334509 266049 180 104 18775 32357 10895 514 11.8
OCT I 351 294 123126 103162 -48 -62 2933 2265 3797 314 6.7 II 373 270 139470 100833 -25 -86 2143 626 7331 334 23.5 III 287 245 82368 70315 -111 -111 12333 12429 12237 257 5.0
NOV I 216 200 46832 43281 -182 -156 28336 33153 24219 195 2.6 II 198 184 39300 36477 -200 -172 34366 40097 29454 179 2.8 III 185 172 34292 31851 -213 -184 39168 45500 33717 167 2.7
DEC I 167 159 27790 26506 -232 -197 45574 53723 38661 151 5.0 II 154 151 23745 23268 -244 -205 50008 59727 41871 140 7.4 III 148 140 22002 20766 -250 -216 53940 62578 46493 135 3.7
1999 JAN I 144 141 20632 20253 -255 -215 54696 64947 46063 131 7.3 II 139 136 19421 18953 -259 -220 56910 67147 48234 127 6.7 M 135 132 18284 17849 -263 -224 58873 69310 50007 123 6.7
FEB I 133 130 17609 17251 -266 -226 59967 70642 50906 121 6.9
16

Annexure-V1113
II 125 120 15545 14962 -274 -236 64515 74969 55518 114 5.1
III 128 121 16269 15434 -271 -235 63568 73406 55048 116 3.8
MAR I 126 121 15822 15220 -273 -235 63982 74365 55048 115 5.1
II 127 125 16159 15890 -271 -231 62584 73641 53187 116 7.2
III 127 125 16234 15926 -271 -231 62516 73481 53187 116 6.9
APR I 152 148 23146 22517 -246 -208 51147 60687 43107 138 6.7
II 201 194 40250 38921 -198 -162 31979 39150 26122 181 6.7
III 359 313 128645 112264 -40 -43 1697 1585 1817 320 2.4 MAY I 395 339 155867 133837 -4 -17 61 14 276 352 3.9
II 463 401 214554 185743 65 45 2936 4188 2059 413 2.9
III 609 504 370719 306869 210 148 31216 44260 22016 541 7.4 JUN I 310 274 96023 84906 -89 -82 7233 7852 6662 277 1.2
II 660 533 435533 351753 261 177 46377 68363 31463 586 10.0
III 839 648 703773 543615 440 292 128770 193975 85484 744 14.9
JUL I 963 754 927016 725964 564 398 224816 318469 158704 854 13.2
II 938 735 879524 689305 539 379 204614 290891 143927 832 13.2
III 1031 736 1063519 759015 633 380 240697 400416 144687 914 24.2
AUG I 1355 1037 1836029 1405136 957 681 651747 914922 464274 1200 15.7
II 1011 731 1021978 738989 612 375 229897 375087 140908 896 22.6
III 848 634 719575. 537808 450 278 125212 202313 77494 753 18.7
SEP I 583 433 339338 252234 184 77 14241 33871 5987 518 19.7
II 469 365 219854 171144 70 9 660 4956 88 418 14.5
III 398 299 158124 118897 -1 -57 47 1 3206 355 18.7
OCT I 254 220 64427 55842 -145 -136 19619 20927 18394 228 3.6 II 198 185 39390 36717 -200 -171 34127 40007 29112 179 . 3.2 III 180 170 32563 30677 -218 -186 40472 47539 34456 163 4.0
NOV I 169 162 28590 27392 -229 -194 44417 52625 37490 153 5.5 II 159 152 25334 24193 -239 -204 48731 57274 41462 144 5.0
III 149 138 22343 20628 -249 -218 54190 62006 47360 136 1.6
DEC I 138 120 19099 16584 -260 -236 61330 67750 55518 126 4.9
11 130 126 16976 16417 -268 -230 61584 71928 52727 119 5.7 III 121 117 14528 14102 -278 -239 66326 77258 56941 110 5.8
2000 JAN I 118 115 13889 13553 -281 -241 67527 78755 57899 108 6.2 II 116 113 13498 13128 -282 -243 68494 79697 58866 106 5.8
III 115 113 13188 12977 -284 -243 68819 80455 58866 105 6.9
FEB I 113 .110 12847 12468 -285 -246 70037 81305 60331 104 5.5
II 114 111 13106 12707 -284 -245 69474 80659 59840 105 5.5 III 127 110 16251 14023 -271 -246 66566 73445 60331 116 5.8
MAR I 113 110 12860 12474 -285 -246 70023 81272 60331 104 5.5
II 117 114 13703 13345 -281 -242 67999 79201 58382 107 6.0 III 122 120 14910 14653 -276 -236 65122 76386 55518 112 7.0
APR I 140 137 19714 19236 -258 -219 56422 66604 47796 128 6.7 II 158 150 25073 23752 -240 -206 49379 57668 42281 144 4.2
III 181 166 32705 30020 -218 -190 41270 47368 35957 163 1.5 MAY I 214 198 45941 42439 -184 -158 29026 33910 24845 193 2.5
II 480 396 230123 189966 81 40 3280 6597 1630 427 .7.9 III 524 414 274653 216966 .126 58 7331 15772 3408 466 12.7
JUN I 456 338 207692 154038 57 -18 -1009 3277 311 406 20.2 II 526 451 276886 237316 128 95 12181 16311 9097 468 3.9 III 618 537 381328 331607 219 181 39727 47975 32898 549• 2.2
JUL I 622 465 386814 289204 223 109 24441 49933 11963 553 18.9 II 822 636 675196 522603 423 280 118660 179113 78611 729 14.7 III 1139 926 1298387 1055147 741 570 422639 549054 325330 1010 9.0
AUG I 1037 918 1074656 951650 638 562 358892 407261 316268 919 0.1 II 678 588 459410 398545 279 232 64906 78015 53999 602 2.4 III 593 535 351522 317198 194 179 34872 37794 32176 527 1.4
SEP I 557 505 310106 281220 158 149 23659 25086 22313 495 1.9 II 356 325 126620 115647 -43 -31 1306 1819 938 318 2.2 III 250 235 62564 58780 -148 -121 17895 22010 14550 225 4.4
OCT I 198 167 39222 33073 -200 -189 37808 40177 35579 179 7.0 II 185 154 34386 28557 -213 -202 42956 45391 40652 168 8.8 III 172 144 29576 24765 -227 -212 47934 51306 44784 156 8.1
NOV I 160 140 25524 22367 -239 -216 51474 56989 46493 145 3.5
17

Annexure-V1113
II 148 133 21921 19692 -250 -223 55751 62714 49561 135 1.2 III 137 123 18694 16817 -262 -233 60892 68519 54114 125 1.3
DEC I 128 116 16311 14815 -271 -240 64883 73318 57419 117 0.5 II 122 102 14764 12394 -277 -254 70248 76717 64325 111 8.9 III 111 100 12259 11072 -288 -256 73560 82810 65343 102 1.6
2001 JAN I 109 96 11933 10487 -289 -260 75096 83665 67404 100 4.5 II 100 95 10006 9503 -298 -261 77785 89077 67924 92 3.0 III 97 93 9472 9051 -301 -263 79092 90699 68971 90 3.5
FEB I 86 84 7411 7231 -312 -272 84855 97593 73779 80 5.0 II 85 84 7222 7138 -314 -272 85155 98285 73779 79 6.1 III 87 86 7599 7497 -311 -270 83938 96917 72697 81 6.1
MAR I 87 85 7489 7356 -312 -271 84420 97310 73237 80 5.6 If 84 83 7135 7011 -314 -273 85608 98605 74323 78 5.5 III 98 95 9593 9304 -301 -261 78329 90327 67924 90 4.9
APR I 106 101 11178 10678 -293 -255 74544 85710 64833 97 3.8 II 116 109 13504 12667 -282 -247 69616 79681 60823 106 2.4 III 129 118 16726 15261 -269 -238 63958 72446 56465 118 0.0
MAY I 189 168 35680 31734 -210 -188 39325 43930 35202 171 1.5 II 321 250 103340 80366 -77 -106 8135 5932 11156 288 15.1 III 268 214 71845 57360 -130 -142 18474 17016 20057 240 12.4
JUN I 393 300 154661 117981 -5 -56 290 27 3094 351 17.0 II 556 419 309459 233086 158 63 10001 24902 4017 495 18.1 III 544 389 296070 211664 146 33 4861 21210 1114 484 24.5
JUL I 715 527 510822 376656 316 171 54195 100003 29370 635 20.5 II 857 612 735055 524700 459 256 117643 210559 65729 761 24.3 III 812 666 659544 540874 414 310 128383 171095 96334 721 8.2
AUG I 743 608 552383 451881 345 252 87004 118845 63694 660 8.5 II 922 712 849594 656275 523 356 186474 273789 127004 818 14.8 III 664 548 440393 363664 265 192 51006 70296 37009 590 7.6
SEP I 480 417 230803 200335 82 61 5029 6713 3767 428 2.6 II 302 267 91227 80644 -96 -89 8548 9302 7854 270 1.3 III 204 186 41431 37859 -195 -170 33067 38002 28772 184 1.3
OCT I 166 148 27480 24534 -233 -208 48317 54156 43107 150 1.5 II 151 137 22683 20633 -248 -219 54192 61443 47796 137 0.1 III 137 128 18761 17532 -262 -228 59527 68391 51812 125 2.5
NOV I 160 127 25642 20337 -238 -229 54494 56813 52269 145 14.3 II 124 117 15482 14558 -274 -239 65397 75109 56941 114 2.8 III 105 101 10921 10555 -294 -255 74854 86425 64833 96 4.9
DEC I 95 90 8936 8508 -304 -266 80737 92389 70556 87 3.0 II 88 85 7811 7512 -310 -271 83921 96165 73237 82 3.7 III 86 82 7416 7062 -312 -274 85471 97574 74870 80 2.6
2002 JAN I 83 81 6885 6721 -316 -275 86646 99545 75418 77 4.8 II 80 78 6406 6243 -318 -278 88409 101410 77075 74 4.5 III 78 75 6068 5842 -321 -281 89965 102779 78749 73 3.2
FEB I 77 - 75 5958 5789 -321 -281 90164 103234 78749 72 4.0 II 81 79 6516 6377 -318 -277 87901 100974 76520 75 4.9 III 78 76 6100 5936 -320 -280 89587 102645 78189 73 4.2
MAR I 98 91 9591 8912 -301 -265 79534 90333 70025 90 0.8 II 108 100 11568 10755 -291 -256 74369 84641 65343 99 1.2 III 119 112 14076 13288 -280 -244 68176 78312 59352 109 3.1
APR I 131 122 17031 15922 -268 -234 62607 71814 54580 119 2.4 II 166 144 27594 23921 -232 -212 49175 53996 44784 150 4.5 III 242 195 58379 47116 -157 -161 25197 24608 25800 217 11.4
MAY I 334 291 111847 97320 -64 -65 4139 4103 4176 299 2.8 II 886 776 784572 687350 487 420 204839 237437 176717 786 1.3 III 677 570 458438 385936 279 214 59724 77615 45957 602 5.5
JUN I 818 690 669118 564418 420 334 140275 175989 111808 726 5.2 II 1089 869 1186667 946639 691 513 354670 477283 263556 966 11.1 III 912 657 832639 599506 514 301 154909 264201, 90828 809 23.2
JUL I 964 797 928632 768033 565 441 249453 319416 194814 855 7.2 II 841 712 706733 598560 442 356 157586 195530 127004 746 4.8 III 755 583 570482 440342 357 227 81132 127318 51700 671 15.0
AUG I 808 624 653527 504448 410 268 110014 168038 72026 718 15.0
18

Annexure-V11/3
II 969 785 939587 760918 571 429 245104 325854 184365 860 9.5
III 810 659 655779 533659 411 303 124784 169181 92038 719 9.1
SEP I 779 492 606426 383137 380 136 51857 144588 18599 691 40.5
II 507 408 256680 206708 108 52 5665 11696 2743 451 10.6 III 291 254 84764 73950 -107 -102 10909 11523 10327 261 2.7
OCT I 213 186 45196 39542 -186 -170 31532 34556 28772 192 3.0
II 190 162 35970 30724 -209 -194 40434 43610 37490 171 5.7 III 171 151 29329 25860 -227 -205 46496 51633 41871 155 2.7
NOV I 151 138 22949 20905 -247 -218 53753 61008 47360 138 0.3
II 141 124 19770 17435 -258 -232 59731 66502 53649 128 3.2
III 134 125 18048 16793 -264 -231 60917 69771 53187 122 2.0
DEC I 126 121 15815 15217 -273 -235 63988 74381 55048 115 5.1
II 127 113 16224 14393 -271 -243 65778 73502 58866 116 2.9
LII 96 96 9124 9170 -303 -260 78657 91788 67404 88 8.2
2003 JAN I 80 65 6431 5250 -318 -290 92356 101311 84193 75 14.0
II 82 57 6688 4702 -317 -298 94418 100303 88878 76 32.2
III 73 59 5379 4317 -325 -297 96489 105720 88064 69 16.5
FEB I 76 69 5797 5284 -322 -286 92262 103907 81923 71 2.4
II 76 70 5750 5340 -323 -285 92022 104108 81340 71 0.5
III 81 72 6613 5876 -317 -283 89872 100595 80293 76 4.7
MAR I 100 81 9983 8044 -299 -275 82141 89145 75687 92 14.3
II 88 77 7821 6792 -310 -279 86449 96129 77744 82 6.7
III 128 104 16410 13287 -270 -252 68111 73107 63456 117 12.7
APR I 142 113 20114 15956 -257 -243 62399 65875 59107 129 14.7
II 206 186 42243 38150 -193 -170 32803 37232 28902 185 0.2 M 259 233 67282 60529 -139 -122 17007 19348 14950 233 0.2
MAY I 278 264 77104 73236 -121 -92 11099 14595 8441 249 5.6
II 618 552 381650 340852 219 196 43007 48089 38461 549 0.5
M 839 728 704058 610512 441 372 163890 194124 138364 745 2.3
JUN I 1170 1026 1368217 1200193 771 670 517057 594783 449488 1036 1.0 II 1087 904 1180705 982660 688 549 377582 473504 301092 963 6.5 III 915 776 837031 709894 516 420 217050 266677 176659 812 4.6
JUL I 954 798 910529 761528 556 442 245879 308836 195756 846 6.0 II 859 656 737739 563225 460 300 138182 211997 90069 762 16.2 III 929 759 862804 704565 530 403 213689 281310 162323 824 8.6
AUG I 1010 775 1020346 782688 612 419 256411 374098 175747 896 15.6 II 782 632 610754 494096 383 277 105948 146705 76514 694 9.7 III 686 553 470906 379254 288 197 56697 82794 38826 610 10.3
SEP I 630 498 396354 313422 231 142 32863 53398 20225 560 12.4 H 462 366 213746 169405 64 11 689 4076 117 412 12.4 LII 337 287 113593 96648 -61 -69 4232 3776 4742 301 5.1
OCT I 205 172 42148 35373 -193 -183 35416 37321 33608 185 7.4 II 180 147 32255 26450 -219 -208 45605 47912 43409 162 10.3 III 154 141 23868 21751 -244 -215 52417 59532 46153 140 0.4
NOV I 142 134 20255 19073 -256 -222 56769 65621 49111 129 3.4 H 132 126 17427 16606 -266 -230 61243 71009 52821 120 4.3 III 113 105 12675 11865 -286 -250 71542 81741 62616 103 2.1
DEC I 106 96 11178 10202 -293 -259 75863 85710 67148 97 0.7 II 104 90 10750 9379 -295 -265 78172 86908 70313 95 5.4 III 100 87 10031 8755 -298 -268 80015 89000 71937 92 5.5
2004 JAN I 99 86 9800 8514 -299 -270 80747 89694 72692 91 6.1 II 92 85 8396 7827 -307 -270 82915 94159 73014 85 0.8 M 90 65 8034 5806 -309 -291 89828 95391 84590 83 28.1
FEB I 88 66 7730 5803 -311 -290 89947 96452 83881 81 23.4 H 87 76 7527 6616 -312 -279 87085 97173 78044 80 5.5 LII 87 78 7540 6775 -312 -278 86514 97128 77060 80 3.2
MAR I 86 79 7439 6783 -312 -277 86484 97491 76720 80 1.7 II 93 82 8558 7566 -306 -274 83788 93622 74987 86 4.5 III 105 92 11128 9691 -293 -264 77279 85847 69566 97 5.5
APR I 107 97 11342 10304 -292 -259 75588 85256 67016 98 1.1 II 115 100 13197 11489 -284 -256 72494 80432 65340 105 5.2 III 131 116 17033 15179 -268 -239 64132 71811 57275 119 2.4
MAY I 126 112 15971 14164 -272 -244 66271 74044 59314 115 3.0
19

Annexure-V11/3
11 236 201 55507 47417 -163 -154 25143 26532 23828 212 5.2
III 313 279 98025 87241 -85 -77 6574 7292 5925 280 0.6
466627 416435 364761104 323809387 1594 1422 157299108 178181453 141254904 411944
Average 398 356 Average Error = 0.71
B = 0.8828
A= 3.8384 r= 0.9915
GENERATION OF ()SUNNI
(cumec)
RAMPUR DISCHARGE DATA ( FROM JUN-2004 TO MAY-2005 ORAMPUR
(Generated)
(cumec)
JUN I 282.06 253
II 456.8 407
III 466.55 416
JUL I 606.65 539
II 539.99 481
III 538.14 479
AUG 1 639.85 569
11 635.9 565
III 473.42 422
SEP I 303.94 272
11 324.93 291
III 209.45 189
OCT I 173.72 157
11 152.23 138
III 146.9 134
NOV I 123.06 112
II 107.46 99
111 93.97 87
DEC I 81.89 76
II 79.49 74
III 76.06 71
JAN I 76.65 72
II 79.52 74
III 76.42 71
FEB I 79.716 74
II 86.319 80
III 94.311 87
MAR I 95.501 88
II 108.2 99
III 131.66 120
APR I 120.38 110
II 141.72 129
III 226.91 204
MAY I 335.36 300
II 343.61 307
III 242.69 218
20

An ne
xure
-V11
14
480-0-a- com mm r.-COvra-NNW0 0000a-NWNWM0-CIWO
M•‘- rs-C°"""MNr.-1-100.1a-0..WVMMCNIM m000 coN. commm CDP...M0000,-N A-Ca1011.0100WWC"="-""C)0..WWWN
EMWCOVIOWN-CalVC00..07CCIONMa-g c98C0640-NWWWVCOMMC00.M g Fi a-000000a-CNIVVOCOWWWWW VIDLOWMINP..WMCNICSIa-a-o
NN010 0)COWCO10N
u) 0mmmua ""-Da3.,-cm 0000wrmal ""="1"°0°'-",-,- Ncoommo cc"="c omcocrmNNN ,- mmli..-Ncomcom,- ,,- NNvc4mao Nt° " Nr"'- womNN
CO r °:
▪
"-C"1."0""NMNa-00000-.0WONMNa-COLOWY-WWW1-00-. co McOrsNIMWMMa-m-CNIMOWN-0.-0-COP--ODOWWVMOIM
comm ,r ,_ mm Ntsa-COMI■OLOONMNI.00,-00.-1■COWNWOC.1,,,, mmcomscomm 0WWW010WMNWM0--Ina-WMCntsLOWN0 a5 ,55a5W
LV Y C NMal-COMW COWMOIN
W O m 00..0..005CD00)0C)01V10°:'"WWW0) MOWNWWN gig30212(740WNLOWN-OWNr180g322,COMWC7,01,-N001,-00
E2 a-ra-a-NOIWWWWM,_0-„„MOVNN
O ,
momNr...m.- coLo‘rW .crov- com.- NomooN wi.„ .4 2g ;; g; ;S ;.; N ?a g COO i? cq C3 ;3 2 4 Z; ;= G El gl gl -t 0, -- 0 0) 03
me4-4- cm og iSiBimNoomo4-0t, N mr... .1"02 2'124c7 -"Vc,11 c7, 14(4WS44C-nol°"m'282RA N'-°°"3 W.c WO
co mr..-twool,..muogSg22com mmocon. • 00'-c003 0 ,-mmcvotoNts),_ N mogocommomN,-Sl om MODWWMWMMWM„Nmmvi, 00
s
•
i2N6 — m .f...mN,Ncon.m-00—grA cp,mrnm,rst 0 o mm —mv,,Nm,---------co=0,,tocogw11mEs
O E 0
;CI? Pm.- NNN,I.N-MM6MCON N22 CARAMNI- WNI- WCOCOMI- MNMN N. Nr 0 CO ,— ,:r 0 OD I'. LO 'TON gi TcnEmmoco VA.%gccVIZ--TNNLomoomi...qmNN
w O I.. . 0 el ap r. ul el CD CD 0.. CD a) " " Ll 01 N at CO N' 04 0.. 0,s 01 ill y- y- y- W M;33gRS1VROC90,-NVIOaa-W,T 17-001,-1000.-WW ,TNN,- < .1-. Calm'Cnt... „.0/0..P..I.OWNN = C.) N M o wNrom4 ,—.4- mmmt....mcommoupinoVaNmoomr,.mcomm.- com m N4- O
r.. m 000 m 0a-.4-a-MMI...a0a-n-NNM0101 m .....-WMP..MONW0-WvtN0 m 0 0i MCOM'1001 0-WWMODN a■ r.- C
R . 0 cot....m,-0.,....tN.0, (0...., 00.-0,0„m.N,,,am..,ru
O irggS---Nvwc9T,i4P)(130(12(4W .92gSFARW4z.1°"-u7NN—gi z , .... a)w 1.- a. . g,owN ,_ No ..,....T.0c,....vo, w ,tm ..1... 0d a-a-a-a-CNIMNNatWZOCO MN .e. W El 0
M . moomo c No °L - "wv ° mNra)1vmomrNrmN
c
IsNmm "mcow coimmmr-- °) mcsi mm r--m ° 1.0N,-clom mmwommmm,_,..„.Nomwco mv,- mmomo..4.NN 4- ,-04,-- to
W " VNOWNCOMWWWBOtMCOMMOI MMWCOWN vM 1"" - •arV000.-0N0 C) WWW0-OCWCMWWWNMN 0 O
0 E — = -7.--=E — ==.46
Sc 0 cm 0 • = • 3 = 0 0 0 O -) 2
•
Cl) .0 • o

An
nexu
re-V
II/4
O ch Co m e. Up st V. O 4) co 4) ce, 41 04 st c, el 0, 04 e, 0, 01 CD r. r. r. co CD Ch ,„ ,„ r, ea e, vm
g CO 0 02 CV nr Co nr O N 0) r- Nr 41 if CD Up CI CSI OD CD 42 CO 4:t CD C4 !I. CD ONO OD DI co CD CD DO 03 00 00 00 cD CD C) e-
N CV
N CD
N- 4) en
N 04 04 v. 02 cn v.
0 er sr cv CO co ODhffi
01 cv co Cm sit 42 41 4, OP 0 St 04 01 c4
02 et e- C3 CO CD sr et CD uo up N ". C.1 •"- "- co nr 0 ul 00 CO er ol DO 03 er e- e- CD e- 01 CD n_ c, r_ r, r„ r, r, r, co 0, 04 07 CD 0
COO T c, 00 T- 0 00 uo nr COD Ch 00 01 CA V- 41 sr c1 e- CD CD T- cm N N 00 c0 CD op 00 CD r- aD ul st 02 04 e- T-
g N c) N. r„ c, 0, 0 co r. 00 T Tr 03 OD c0 N 00
N CV 01
N V- CV 04 OD 02 00 00 0 04 4) Tr CO
„ 0D 03 V- P. °a r- co CD e- CV CO V) N 41 41 c0 „ nr cy co '-CO N r- CD c0 03 co 03 CO nr co co 04 01 co TTTT N 02 00 CO -- CD 0) 03 N- N. CD N- V. yr cy CV CV 04
c2 • g OD co a) 0, 0, r„ a, ,r r_ nr nr co Tr cr, 01 42 V- 00 42 CD Ca Ul et vl C0 CV 00 et 0, 0, et (3 CD CD 00 00 cc3 00 c0 cn C) C4 oD 42 V. N (0 CO c0 r- CD 0 01 CCD CD CD sr 01 4) CV CD cn coo co
N r T- T- T- T- C2 04 C.2 42 42 VD t- t- 00 st 04 CN al II I- co
2; r- 41 et 00 er 00 01 0 c4 CD 0- C3 CD OD r. r. CV VD t; 00 et 03 0 CD 03 u, up er 01 41 r- CD < o CV e- e- Ci et CO r. s- U2 CD 0,1 C2 CD 00 V. Ul t- st sr et CAV—CO U2 st 01 Cl T CD
2 E cy nr nr CO Co a) r- ca C5 41 42 M N CV
< E
L cr, CD et 0.1 er 0 41 e- CD r- T 00 cm T op T cD r. c) 07 02 up 41 co r- r- st CD CD er 01 02 00 cv 04 cv uo CD et 03 er 00 CD CV CD e- CO 42 st CD et sr r. et CD V- up uo Tr co 04 cy
T- co co nr uo co CO CD CD CO " cn P. 42 et cl N C)
00 .4- c) „ „ 0. cD c.) c) uo up r- op nr 01 01 .17. CD g 1,15 g/j 0D V, 02 rs r- ap cy uo cy uo co up cD cD cn CO CD CD C4 01 et ul cm er cv op e- 01 0, 0, 0, a) e- 42 el cD 0 g g co op " " "
▪ ti CD Co co ol cy T- N T- oo nr 02 03 vl 40 41 40 Co cv e- N- ul CD cD CD 04 e- 03 CD 00 03 CD 01 00 CD CD e- ai C0 CD cD CD C2 CD e- 0 e- 0) 0 CD CO "4" CV N. e- r- er cn cn e- 01 cl r- 02 N- C') e- CD e- 04 e-
04 01 et N- CO CD 00 c0 CD CD et 00 CV
- J
nr O CO ce) 4) CD e- Cn CD 01 42 C) e- O 07 P. g z CD ../45 ;2 z; p! 2 2 g 0- s 53 g c' " " cq " g3 2 113 2 53 -- 2 13 F. F. F r- 0 42 T,-)NN
CJ- 0
11) CD e- CD et CD 02 e- cl 03 0) 42 e- et N N CO e- 00 CD e- CO N- sr CO 01 CV 0) 00 Ul 03 01 CO 0) CD Ei T CD 0 CD e- e- CD 04 CV CO 01 42 03 CV CD V- ul CO OD c0 e- 41 0 CO 01 CD ao Nr co co e4 n- 04 CV CD 02 V- CD 41 OD CD CD 0 CO V- r. sr NN
0 C OO,_ Of o 01 CD aa op cn a) oo 03 CV c) co r- CD-Ln ▪ co CD CD CD CO Cn CD CD e- 04 vl eV _ 0, a, „3. co., 04 01 U) e- 0 0 CV CV CO 42 Ul ul T C4
" C4 r: e4 e, Nt CD g S3 i3 23 ca N- "' 't cr) C4 C4 'C■1 P4
0
GO 0 02 nr co nr co r- Tt op OD 01 v. nr 00 0 Nr oa s 00 0, ,- o0 CV CD e- 01 cn r- c4 00 CV e- 13 O
co CD CD CD CD C2 CD CD e- 00 cy Nr U0 LAI 00 T 07 04 CV 0 CO 00 Tr CD 03 r- e- Tr co co cy 04 T CD a, e-■ 01 et CV et 42 V- co r- QD 40 al sr CV CV
▪
N m CO nr CO cy cy CD CV D3 nr Tr mr CD c4 cy N- ergo gg et 0D al e- T- T CV s- 04 T 04 et 02 CV DD CV CD OD V- if, 01 — — vu T T Q, E g A Z.71 23 1■3'
NN e4 ,r nr Tr „_ CO CD cn CO rs al 01 CV 17 z UJ
I- cy oa ul ul MN e-
cv Nr CD co co CD CD 01 e- CO cy n- 0
▪ 1
cn Nr n/ is" r*- e- CV 41 e- cD 01 r- e- C) Nr nO Cn 1/2 00 0 CO CD CD cy co r- ao nr co cy c4 e4 co ,_ cn co co cn co T- e4 v, u, CO C3 00 TSN co a, N. CO ,r e„ CD
o cn o) N- Nt r- 0 t- o oo co 0 04 et C) 01 00 e- C") C) rs 01 CO e- OP 42 O
C) CD 0 C) CD CD e- c0 CO et N. Co nr cy co ° •-• CD 00 Cq 0) CV e- CV 03 53 gi COg3 ti3 14- Cri Ca CO CV 01 cn oa oa 5;2 cn cn oa r- ua co cy v. O
Cn CD e- e- r- 41 CD QD CD C) CD et CID r. 00 00 OD 0 NI. ",72 C, 0 CD e- vt er 00 42 e- Ul r- - CD 0 a; r- CC) Cl CV T T CD CD e- e- CI Met st r- CD et DI 04 ul V- CV ul DI op r- C.4 c0 V- CD er 01 T T 04 15 co 00 CD N- cor. OD V. 03 07 0, N
v- iC
- = - = - = E E - = .01 - = - = - = - = EE - = - = -_°-_ E
CO
.et .0 1..
•
0.
0 o a) 0a 2 0

An ne
xu re
-V11
/5
Ch 00 P. C3 Nr (\I (r) CD CD C) T- N CD N 01 N r- 111 r- CD r- r- r- C. 111 r- QD CD CD CD V U, N 03 T- U3 co '° r- cq to on t4 p„ et Ty 0 N n- Cs ,r VI 01 N CI 07 N r- r- 0 C3 T- N 01 V V P. CD V 0 CID
01 un -4. C4 00 EJ 0 0 04 04 0 u, ,r U3 01 C4 cn
03 01 03 CV on V- gg g g U3 CV N r- UD 0 V OD CD co on Ps 00 CO ts C. V- 0, 0, ,t P. 03 V N 01 OD Cs CID 03 Ul V V CD Q1 Ul U) C4 C. U) 01 C4 C4 T- T- CD C) 0 CD 02 r- 03 00 cn CD F P;-, 2 2 2 CD r's 03 03 N 03 .1.7. C) I- co co OD ea .4. en 04 VN CD
00 W C4 (4 't vt ""- CD (ID ge- CD U3 N co T- C3 0 Ul CD V 07 CD CO Q0 CID V Ul 00 C■ CV V V 07 C■ 03 03 CD .4. .4. aS T- TT CD 01 ,r cm -- on cm un r- c, co QD V 01 cm cm cm T- T- CD C3 CD CD CD CD T- cm ,r .4- CD QD U3 0 CD C■ NM/000V ,- W COCO' 'WCOCINN NNM VN co T-
CO 0? 0 01 03 r- Ul Cs CV CO CO r- r- N (13 (v) (r) N- I- CO 03 CD .4- c, T- CI CD Vi 00 CO u, T- qp 40 (DO 1,- m10101.----vwomNr.- mom.- ors cocoNr.scococom ;=.- Voiong/Tr n vm 03 U3 r- r- N 00 N 03 0 CO W .4- en cm en co o cn e-
143 CO CD N CD N a) Tr OD n- r- QD CO V N U3 C3 ,r un CD Ps 01 on ,r CY CD N CV C■ 07 N Up g 92 g? CAO oo,,,-,romr-unT- oomr-mmNo acoaw.,,,,,,,,, o, a ,a :vm-ivg- NV W MWNWOWNWWWMN MO 0
OD 03 • T- • CD V 4.! 01 s gg gg W U3 Ul CD r- CD CD UD CV 03 00 CV 01 00 a) 01 CD CI Cs CD op o 0 03 V c, 03 01 03 0) CD C- ,r OD T- CD CD CD 03 03 03 03 CD CD /4/ 4) I- UD CO gI3 00 QD CD ,_ Cs C*1 PI CD co op .4 . cm cy
N 07V .4- CI CD r on
(.9 ,..v ar-- ,„,-N inC° t 0 Tr CO CAN N. Lo 00N0^(00)(0 cv cov ejt•Ntr, 0000 c`-; • v" cm c) co ol en cy T- r- CA 0 00 UD Nr 01 T- C) co co 03 CD CD CD 73; 00 cn t.;:2 gg ZE, co 0 Is 1O 111 CV IN Cr CO co e- T.
R :1 - r- CD U1 gg 2 2 CD N CD Ul 07 0 r- C■ N 0, t. Ul T- C4 TC r- It 2 22 °I r.:7: 52 22 52 I's vr ,r T- u) CD W) CD N Cs 14/ t4 C3 CD 03 03 OD CO OD 03 02 ;: ;1 .1.74 Z.1 Z:ei i5 M O MWMNN V- V- V-. V-. 0)
cc, c0 s- CO el cn O .11 N CO 142 P3 F2 gl ;I; Fi :3 2 g3 7 8 2R 28 28 g? ;3 ;3 ?? ER Sg Ell it ic,51 E; i} w n T-
Z 0 • 0? 0182/71. % 071 2M0VW0VNCDNMM.- MNV NN UJ co pi 2 up 04 T- c) o ??, op 1- o 03 .4- co cm T- CD 2g g gg gg g gg 2g 2 2 2 to on 2R Li.; co :E MNN T- r-NMMV VN
0 Z O ciS Cs CV 2 2 Fl 3 g v. co ,r u, 03 OD 01 CAI-MN his r 0 0, C. 01 N 03 N 03 C3 OD r- CD T- ,- el- cm cy in on L-6- a z„; 00 C. V CD N CD C) CD CD CD T- 01 N C4 CO C. U3 02 e- P V-. N 07 V T: 01 ‘r a) n (0
Ch Cs 0 (13 C4 (:.L1 U7 CO N V 00 T- 01 OD 03 C1 ap T- C4 T- 0 e- 0, 0, 0, eq ,p N. CD CD V 03 0 r- co ,r r- ,r T- I- r- T- CD u) r- un c) r- co un cy cy T- a (13 CD CD CD CD CD CD CD (C) V CM Ul 41C c. ,p 0, p, ul 44) CD p, 0- co en cm CV CID r- r- T- C4 C4 01 Ul V01 0 0 r-
CD U0 Ul U) L3 2 0,1 01 OCD CO C. Q3 03 CD Ul 04 00 03 CD Pj P■ T- 01 01 CV CO 1.3 g3 2g 23 q 113 eq N 01 07 01 T- 0) Ch C) N (0 C- Ul V N CD CD CD 03 CD CD CD CD CD CD V 0 Mt■LON M.T MN. CMDUN) OVIN N
uecc ) cn oocoNNNNr-oo,4- o,roa ,,,rmooNvcounco en 24. (4.22g3goNor-m,mr-nmc.le-000 a o,-mor.,re-e-N mu) .... WWMNNN COMVO VO
03 QD U3 .4- c° (13 't c' e- co co r- T- u, cm co oo 000.--mv 'TN om.comcocol. me- 0022aVg.-..- e- N,runoe-mtne-m une- Tr 0 Up = F. F. F. In co N NNNMW141 Mr
03 O;.. CD CD CD CD 04 11) g cn Op u)..4- co op on r- co cm p, „ „ p, 04 0, „ W U2 C■ ,r QD (3 22 4 01 c, r- CV r- CD 01 -- to r- r- T- CD N U1 C4 T- CD 0 CD CD CD CD CD CD co C) It (1/ N 0) 03 T- r, N. N. Cr) co cn cn up ,r cm cm co T-
Ul U) CID (2 OD 01 W cm CO CD U1 U3 22 CD 47 01 vt OD 03 s cp g E9 El CV CV C4,1 CONN. Ca Ca a) CO CO Ca00ICa CO TrINN-00c-) co 0":00, 00.) ,_,....._ z\r•i ,s.t.,Ltil2 T on r- op 03 C) CD co C10 CO et en N C4 01
C4 01 co
U7; U
1974
-75
1975
- 76
1976
-77
= .. = -- ----- -- = = -- -- -- -- -- -- -- -- -- 0 2 -- --
4.. m 0 la c CD a > 0 c m W >, ----... o cio og, -5 m w t o o m o < 8. o m m E=3 n < cn 0 z 0 n ti. 2 < 5 .0M.S>.-

Or) cc) 01 et
0CO
U) N Cr)
t".• N.'
Anne
xure
-M1/
5
CA
LC
ULA
TIO
N O
F M
EA
N T
EN
DA
I LY
FLO
W
en Et gl Et cm c r. CD en cm 03 C) cn co r- Tr co e- 01 u, 02 C.9 1:4 4 g 4; 4; :7. s CD "I CD CD 61 CD CV cl Ch Ps U) 0, 04 e- e- CD CD a- CD CD CD CD c2 C° C.) U) C) CD CD CD CD DI) CD CV PI 4 10 1/ C CD CO 03 CD CD ,.. CD Ps CD et C1 04 03 0 E
N E u
N- S3 m u, .4- Tr co Lio co cm ao c) CD CD et C) CD et CD U1 04 ,_ 00 W) Ul „ U) CO U) V) et 8 gl f4 g g ti cm
r- ml 0/ C4 CV CV e- CD Ch e- CD Ps et et 01 CD co op ps 02 co co T_ T_ 0‘1 0, 0, 01 CV et et 0 Ul Ul CD OD Tr 01 el CV
A. 17. Ul 03 CD y- et 01 OD 03 ct Ps C4 e- °) C3 Ps CO CD 01 0.1 Tr u) Tr CD E2 g 1:-‘71 a NM c° C) C° 'cr cD "1 c4 CD T..- L° vl T- CI C) cn CD CD 03 03 00 CO a) cn uu ° co 0) oo ea r-- co u) Tr ce V.. V..
Tr 03 el OD 01 03 N 04 01 N CV N DO 01 0 03 0 MI CI et CO c, et
N C) e-
(0 CV
ti CD CO 00 CD oo aa Tr 01 cc, N 01 0) P' CD CD Tr mo ca al ao cm 01 co Lc) rs C5
02 CO 00 ts Ps ON) r- r- Tt cm cm CD Ps P. Ps Ps ts Ps CD 00 C4 CV 01 a, O;
c0 P` OD 0 0
C3 CV Ul OD OD Ul CD CD Ul Ul 07 CD e- Ps U) D) 'cr el 00 LO 01 CD Ps Is CD CO 0 1.,1- g? T: gi 8 g 01 co
r- cm CD 00 CD P- CD OD 01 co cn CD CD et 01 U) CV CD CD OD OD 00 00 P. P. 03 r. cn "g cm r) 03 CD 01 U1 Ul ao r- r- r- OD ao Tr cm
CD Is Is 01 U) CI CO Tr oo ao 0 00 Ul V) ct 00 u) r. op 0 C11 0 al c0 Ps C° et et et 0) N. CD LO et V) e- 0 0 CDco °co e0D) c°02 el* cols- T_ODTP O to .17111,)] 7.4P- et ul in u) r- (0 U) U) 01 cm co
P.■ T- 03 T- 0 ts ts 2 — Tr ul el 0, ul ul 03 Ps P- Ps et CD CD Ps Ul et 01 et 01 01 0 CV CD CD P- 0 CD OD N.' r.... O C4 CO e- 00 Ul et CD et et P. et CD ts CD Ul et 01 C4 01 Ul Fs 1- Ul CD 0() C1 CD Ps CD OD CO °I CD Ps 0 et 01 01 01 et et V) e-
. e-
04 01 04 17. g; gR g3 03 el a, N. N.. OD CV Ul C4 ul 01 CD 01 CD Cr CI et 0 U) r- T- CD Ps 1- 03 V) MCN) 9? V- ;1 0 25 25 23 CD U) et VI Tr r- V- cn OD CD 14) et et CI C7 07 CV CV CV 01 CV Ul CD Tr oo Tr OD U) C4 O O CD Ul et U) 01 01 01 04 01 07 Tr u) Tr Tr
r-
U) U7 01 e- Ps 0 CD C) CD C/ 03 0 00 00 CO C4 03 C) CO Cr 0 up up CD 01 0 CO 0 Is CO ct Ps cv t. T-• I's Cr 01 CD e- 01 07 Is 01 el r- CD 04 CV e- e- C) C3 CD CD CD CD C11 CV et Ul Ul CV et C4 CO et Ps 0 03 OD OD 00 CD Tr 01 CV CV 01 01 Ps
ul ul Tr cc) co
Tr 4.. T„; c. g2 a; m c, .4- 04 cti 0 00 PI r- r- CI Ch ul 07 01 C4 e- CV e- 03 Tr co 03 01 U) Ul CD Ul Cn T- 121 U) CD CD CD t- 0 V) N T- I) C) OD Ul 01 P1 CV CI V-. CD CD 0 0 CD CD CD e- C) V- 0.) CD CD CD Tr co cm u) „_ oo r- CD Ul 01 CV CV CV P1 CV
r-
Tr N OD V- U3 CD ts e- CID Ps et CD 01 cm CD OD Ul o3 PO a) Cb CD et 0 0 V) Ul 03 y- 0 03-01 Ul y- e- C3 01 e- CD CV CD Is U7 CD op co V-. Ul Ps CD Ch 01 OCD et 01 PI 01 Y- CV V- 1- CD 0 0 V- P7 CI Tr 01 0 OD CD V) OD CD Ps cn ul oo co cn CD cn r. Ps et CV CV CV 01 07 el u, el 01
e-
g! 23 2 Fi .1!) P.! S1 Q (c.,9 ;= 8 8 23 V ;= 8 21 Z.; SI ?4 Ps CD CV CD V) Tr 7:1-
CO CD Tr 00 8 m c.1 CD CV OCD e- it CO ts CV 00 CV e- et 0/ C4 ,. co co 04 e- CD 03 CD 0 03 0D C4 0 r- T- OD y- cv cv e2 op (T) T- 0 CD r- T- r- Tr r) CD CV 01 e- CD CD 0 63 CD CD C3 CD C11 OD CV CI VI OD CD I, P. CD Ps ,_ CD Ps CD Ul Ul et CV 01 (1) co
0) C4 C4 r; N g Tr CO CO CV CO 01 e- N N et cn r- ca CO OD 01 U) 0) et OD CO U) et co CO el N- Tr NCO') co r- cp e) ul c2 CV e- V- 0 Is- el CD CD et 01 CV CV e- CD 0 CD CD CD CD CD CD e- 01 04 et ul Ul o3 Ps Ps P. et r, CD CD CD CO Ul CV CV 01 et CV et V) r-
r-
co rN Or 8 CD CD P. CD CV CD CD C4 V- 0 04 e- et 01 e- Ul 01 Ul et CD CV 04 0 04 03 et et et OD IC) 00 c) 0, ,r ,_ OD 00 CD CID 0 CD CV CD t- Ul et VI CV 01 CV e- e- e- e- 04 e- CV et 01 U1 CV ao 0 N 01 CD CD r- CD et CV 01 CV CV et et et 01
r-
en Tr r- oo N V) 01 P.:, 01 01 I- 03 Ln en r- CD Ps cm un r. cm ea r. op ,r up N. cm co co a) up ul OD CD CV N N 01 D3 17. 01 6 CD 01 1- cm op U) 01 03 CI 0 et 07 CI V- C' CD CD CO CD CD e4 e4 e.) 0 '4 CO CO Ps CI se cn cn co r- u) el cm cm
r- cm 143 T- 07 Ps V- C) V"
01 OD op CD eh ;12 P: P1 Ch CD e- et QD et op U) e- 0 Ps P- CD 0 et 0 e- et 0- LO Ps ul so p is 64. g: s 4 0 0
0 UD U) CV U) ts „.- est CO Ul 03 ts 0 01 OD P- CD et PI s- y- CV 0 co CD CD CD CD CD V- UJ CD P. CD r■ ,_ 00 Ps c0 Ul Cl PI CV N C') CD 03 et CM
1- 74 Z5'—
b 0 3, 0 5 CD 0. > 0 C .0 W >. L.: C I tli 0 -9 = to t) 0 a) cc 0 < 'EL a3 > 0 E
3 --, < u) 0 Z 0 -) u- 2 < 2 < cC .E >,
1989
-90 1990-91
1991-9
2 1
992-9
3 1
993-9
4 1
994-9
5 1
995-96 19
96-97 19
97-98 1998-9
9 1
999-2
000 2
00
0-01 2
00
1-02 2
002
-03 20
03-0
4 20
04-0
5

Efficie=
0.92
CA
LC
ULA
TIO
N O
F D
ISC
HA
RGE
FO
R 9
0%
AN
D 5
0%
DE
PE
ND
AB
LE
YE
AR
An
nex
ure-
VII/
6
co co >-
Ci
C C 0 =N r.co
e To' w
750
-o z
co 2 C
V WOOCOVOMMNWWWW NVWW.-NNNWCIVOMMNWWWWWWWVM WW‘"- WNWMWW ("WWWNIOWWVVVCOMMOINNVVWNONVWW0) NNVWVVWVCIMN.-v- rrra- m
M PT C"-- WC/NWWWNWWW NONONVVCOODONVO mr..--Yro moo MO_WCNIC"- WW"WWW VWVM MNOWCONNNIGNC017007103030 NN ONI-NNNWNWO mv ,NNN Fi NOVWWWW .- r .--N.- A-NI- a-a-a-v.
WWWWWWWW0VMOI-VNWNWWWW MCDCOVWVOWN07§ 01-ChIWWNWODCOMMOMMCDMVM,0°MNIDNO.-Ner0Nomov o COW C.'ICNIWWWWWVON 00WWCO NNCOCOM0 1-
N a-NNV. w 284glasiVAIVg 644AMCDMVMWNWNO N OCOONODMONNO mmv A s_,_,N .,:mvmmN01 ,_„_COODODLOVVWCOCOM N ONNNNWVOWN,..., 04m
W N . NMINWW"WWNWONWWCOVM,-ONNVWWWWWNCOMMONNON
O-COVWWWWWWNWOMVNCONOMOVNV WWWWVra= N WVWC - W''VWWNWONNNN 0) Nolocom co ,-c404,-04,-,-..- 1-
omoNe°Nm,-omoyrr-ommo.-N-r- r.. om‘-covor- GWOOWWW000COVWWWWWWWOONWVWWWNWWOOCOMNON'9
VCONV .-VOCIDWWWN ,-,-,-. MCOmNNNNWO 0,00 I-
0) ILI Z.7422 r17.2 22Va-VOWOMOVOCOa-NWNNOWNNOWWWN
M
N l'." WWNVC"- NVONWOOVT-COWNNOWNCOCOMOLOWVWVWOMOW COCL.WWCO NONWN WVOWWW NWNMOW0010 N W C) r.■ CI Ca (') co co u) yr C7) 01 CV CV r)4 Cs) Cs) C) W .. N.,Oly CO 5.
N.- CO CO 0 Ole-00W LONN-N- ONOMNVW N- N .S oa-NNNVZ;(1)0,-01,0).-NCOVNv-g222Pgr: r 1SIT:g0.-NVZ. ONON—`03NWOCONN e- a- a- N i_
NCOCOWNWVIONcOm-cr 0 WWOCOONNCOMCON 0WONNW ,- NOWNWOONWMCOV M m
NowN yovinw0N ONNOWVVWWWWWWWNCOMVVW"C"°) a- .-4-1-,,
CD 1'7 WWWWr.- "V""NCONNWWWW0)COWNW 100-W"CNICnWN.MWWWW N WWWWWWV0V)(el Wr'N"VNMCIWV N Ov-a-,-.TNT-mm NNVVVNCOMW WW W ,04 ,"_ 01 ,_ 01N ,..ONI7)MC7INNN NV ION ,_
WWNV‘- NVI'WCDMVCONWNWWWW0 0 OVWCOVA-WITI C) Yr 'r ".) ,- c) '" °) e'l C4 N a- in in .- cr) r- ua co .- o c) ol" Eg 2 2 6-- t; 0 Eg ,- N U3 N C) C) y- 15 N. 7 7 co r"- " v CMO c' co tn r) cy cv ,- N.. 0/ m yr u) I._
co co Ql CD W OD CV 0 W Tr CD CO WMON,-OCOWWWWW COVW,-e-NWOOOWVNWOMOWWWOWW"NN , 01 ,„„„,_„.0WWWVOWWWWNNOMMNVVWWW,C2VNCI,:M
co r- 4 NOWNWWWWVWCIVIOVNNWNWWWN OIDI-CON0)..-VNOrNAO N IL LI.s 2 c1S 1248Cga i.UMNIOWNNI-1-ENVIOVWWONWT-ONW M NNNVWCON
VNNOWNWWNWNW.-NI-WW MrVONNWVW0C076 OCOMMONWWWCONNWWWW.-OVWVWWWNW00,-NMWMCOVONZ
MOVW WWWWWWN OWWNWWWW ra-v-v. NWWW F._
co co LLAVV2T,7,2 07, c7Aga-01-NCOOWNVMMNONNCONI-OCOV,C00.- m001. 0 .4. 0momcsi ,„MNNOVVMMONNONNNNWMIOWN,_COMN
CD
V t7 WWN""1- WWNWWW N MVWCOVMa-OONWOOWMCOVOMMO MO_WWWWWWWWVWCINOMOOVOINN , mmTj- m ,- 01- mvmmcomN _. NNN,..-NCIMOMv-00V O') T-CONT-N NNN ........ v-ra-rrNNOVVM
NCOONa-MNTI a("482 122rqgSSCTSC93 Ca2 8%1 09@ggCeMPggWVWN-EN0115
F2r:/”;MMOMOVNN r.rrNvaNN 1_
OMMNW
w grs7.4F. cV4/2282COVNIOOLONNVOCON-WWVO,CINOI mmm W .. Nmmcommojo4N „...„.NOIOVVCIMMOINNOINNNOWWWN". N ;ICA
IV N MO.-0Nr.N 1 m __. NaCOVWCOMMCONVMONCOMOOMMOMMOOWWN NO-OmWVC)WWWWCOONOW.-WWVWCONNOr.s-a-NNWWWWW5IV,.:! g; WWC"""VNCOCONVMNN Nmm—co
N e- 5-•
a-a-NCONMNION-WONNNOW.- CO 0 un o e4 co o a LI, .- OD CO 03 2 F.- ‘r r,_ r.. co 0 CD OD yr cy y- c) C4 .- a) Cr) in '' Ca C5 ''t g C5 CO I, N Lc) °3 r. c) .- mr-cooms_m000voicv moomnor-Noo 03,_,_ 0, m 0 CD,_1000 1_
0 =="'-..=—=--=—=`-..-.== .. — .. = .. =—■E—== .., co
C a a. .., o c _a tY s. >, ° a) 0 0> 0 co 0 < o. co
n —, < U) 0 Z 0 —) u. E < 2

An
nex
ure
-V11
/6
CA
LC
ULA
TIO
N OF DIS
CH
AR
GE
FOR
90
% A
ND
50
% D
EP
EN
DAB
LE
YE
AR
>- NCO N
sl• 0 -
,-
,,,C II II
8 2 1
203 E W
Luc CY 09 CO
To 0 0 Z
c < -5 -a a
III
0
CD OD cij gg F„Iagg gg gig 21 g r.,:: gg gg gg 7 C7 3 CO CD N CD N. ts CO CO I- CO 01 PI CD N. Tr 03 OD s- Ul Ns 0, CO OD
cq 04 ,4 0.4 cq 0, 0,1 co 00 04 ,- ,- 03 ,- 0) Sr Tr co co to CV 04 04 CV CV C4 s. CV 07 CO 07 OD 03 CD CD CV s- 1.
CO • 0? d, CD s- 04 CD Tr UD CD N.-. 07 UD CO CI Ul CO Sr C) Ns Ps OD Tr T- NP CO Ill 01 ill 03 CV
40 0- Ul '- CD CD °2 Vr D3 Cq "- WI mr 03 01 00 in- CD Ns V) 04 00 C) CO rft CD 6D r' 63 es sr sr U7 Ul Cl) CD C) g7 co 00 C) C3 T. '- ' ' 63 C4 cn CO Tr Cl sr CV 01 s- ,_ ,_ c, ,_ o) co co co co co ,_ ,_ ,_ ,_ pq 02 ,r N ,g cm 1-
03 4-. 0)t N. 04 T. 01 OD U) CV N. ts OD 01 OD CD el 04 0) t cm r- Tr m- 16
a ua co 03 III C5 03 s-. C) CV Ul nr s- CI cn r- co m- CD 0,N CO g 09 8 ;3 60 6° r(75 p gg gg ca r,-.: A tc,:;-1 11 gi 5 OD OD I,. Ns OD Ns OD CD OD OD sr 07 CV CN T. T- e- y- y- 1-
• co• - uj ;) g gg ,T; gg ;.9. gg gg gg g?, g OD CO OD Ns Ns ,- OD OD OD QD CO s• CI C) CD OD Tr 03 C3 Ns Ul 03 Ul Z,3 CA 07
co N o4 pm ,■ cl 01 04 co c, ,_ Ps 0 Tr Sr CI 0) N N N N N N N N N s- CV N co cm ea sr CO o, 0 mr
ua 6? 33 W2 s- CO CID 63 sl. W2 125 0) St St s- co Tr co c) r- c) t.... co Tr I.-. CO N P. CO vi. OL N 63 t` '- CD CD "-. 6.1 CD ma LO 04 Cs) 0 r. u) C7) T- m- CD CD co l'.. CD "1. C4 in CD C) s- s- Tr co r- Tr u) 02 Tr r- C3 04 03 s' Cq s- cn w m cy cv co co OD CO CO CO CD 0, 01 co W s- s- s- T. T. T. T. TT V.
... CO 00 U7 00 T. 0 07 sr r- C7 CV CV C7 OD CV CO a N. CD 07 04 Ul 04 OD sr CD Ul CO 04 CD CI CV CD CD - U) 0) CO 0. 0) CD CO CO 03 03 01 CD CO (1,3 gg gg g gg a co OD 0.. OD Ul 03 Ns OD Ns QD 07 CV ,-. CO 00 0- Ns CO CO Ul UD 41 CD 01 03 P. P. P. 0, 0 0
• I--
CO CD OD CD 04 NW s- s- 0. CID OD 03 07 Ns CD Lij gl gl %I ty3 g W. W. gg 4! ;7). RI :I- '8 P2 it: 53 3? 4 cor-- 2 col- Nc° 2 5,71 4 A A Tr; 8 C,," V- 53 g2 ,9 V N 53
4 00 co „ c) Tr 03 OD QD 00 ts CD 07 U) CV 0.. C) 07 CO N N 0- 03 CD 07 CO U) CO s. 03 s- 03 OD Sl• 04 0.. co ci. 0 co 0 sr CD ts1 ° 62 C2 s- CO s. CD s- N.- N o) r. U) 05 N .- C) C) OO C) N N co r- c) CD CV Sr Ul 05 02 e- cm 01 U) 0 OD CD U) N. CD CD OD sr CI CV CI CV CV 0) ,,0 OD c0 CO .- N'
Ul 07 C7 W CD CD sr sr 00 CV 04 s. U) N. U) 03 04 CO sr 01 C0 N. N U) 01 OD.s- 713 a co Ns CO 6D OD 63 Cq DD F. CD Ns CV Ns CO U5 00 e- CD gg gg g2 g g! 18 gg o„co ,,,i2 .,, v ..1: gil gi 4 g 1.12. r- ua co .:2 0 C4 6D CO CD ua Tr cm Cri m- r- T-
,, N y- N 01 CD SP CO CD CV On Sr CO CD 03 C) C) OD N N. 0) CD CO CO T. Ns N- s- 07 CV C, co Sr CV Z.; g 5 l'... 111 51 4! 53 3?
U) 53 V. v. gl, N N CD OD U) 14) Sr st CO Cr) N N N N 07 N N CI CV 07 Tr Tr oa r- NN W g
M C4 CD CO C7 CI Nt T. C.1 '-' CO 03 04 Ul U7 07 1.-. Nt 0 CO CO 1,.. CO Ul 0) sr CV C) N. Ul s- C) NI' T- ill T. CA . CV CL Tsf C3 1‘. C) CO e- Ul Ns s- ,, „„ CO Tr cm co r- ul cm cm c) c) co u) cn cm co c) Tr r- 02 c0 OD Sr CO 03 CD Ns OD s- ,... i„.. 7„.T. „ cm cm CV 07 V) OD OD 0 F
-- oa 0 co OD Ul 0) OD C3 69 Fq E :,i' 0469 ',.'1 F2 i[ P.. CS E RI 2 rci3 2 co— :2 ZI CD sr °I Nt CI' '- CD t.. 63 CD C4 CD 01 Cl) CD Tr r- co 4 OD CO Ns ts Ns CO ts ts ts. 03 01 ,- 04 02 0., u, 0 I-
W cs3'- El V g Iii OS 5! 8 U) g V CD 07 U) CI CD C) Sr s- CO OD Ul sr CO Nt U) CO U) Sr C) CO CO U7 gis g ;3 0)
,_ „ 04 0, ,r ,r „, „ ,_ ,_ co r. cia u) an Tr co CO 04 CV CA CV 01 04 04 TT 0/ 0) U) CD Ns CD OD T. . T. Tr
N 1 co mr sr u) °) sr °2 C4 '- 00 s- s- Ul 03 ...-. OD co CV CO Ul N. 05 C) OD U7 OCA CD CI CO C4 I,- C4
CD CD T. TT T. X.. VT C4 01 0/ 0 0 U/ ii CL (.03-. cool gl -, 5,,). gg gg gg gg R. 54). 7,,-i. 8 gil gl ca ua Tr cm m- c) CD CD D3 C7 CI gg Tr Tr OD 03 s- CD 10 s- Ns
41..
0 gg mcn gg ;...3 F.1.: S g? 53 L,,,g gg-0„,33 gg CDN ;7. F 0- „ ca 00 ..- 00 0... co c„- „ „ ,,G) gR cl 7. r.: 7.. A; J Tr Tr co op c) cm cl T- cn Tr „ N CV y- y- et- r-0 co co r- r- r- CO 0D ua r.- OD cn co -- s- .- .- -- -- o y- y- T. TT .- N CV 01 CI PI
,- 01 T. T. C) 0 CO sr QD TT rS W LO CD 0) co Tr ua Tr r- „ 07 CO Ns CO s- Ul sr co Tr c) oa co ua m- CO CO CV co oa r. co oa co co . g gl 1;
CV 04 01 07 Tr Tr et CV 01 s-. , CD N QD Ul Tr co CI C7 CV 01 04 TT N N CV T. N N sr 01 N 03 •• cn Ts s-. 04 ,r
F op to T- cn CD Ul CI N
CO Is. Ul co N 01 C) CO CD EL st 63 N 63 63 C4 N C2 V) co c) cm a 03 53 zil 2 °' rci ZS D3 63 F.. CD C4 " " " " C‘i t'' N " s- s- CO U1 CD U7 CD Nr 02 CD CV CD 0 03 Ns 03 N. 0 1,, 0 ,t o, 0, Z.; Tr co co co co ,_ ,_ ,_ ,_ ,4 eg 0 u) 02 C) ,..
• ,,2 41 Zt CO 53 P2 P2 gg g; P....: C) U) .z..;, g q U)0 -, CO 0. 00 0- co r. co CD CO s- gg gg 4 1,2 V. I:: .Ti ,, , 0- c) cui ,- cv ,... ,, u, ,, cu ,u ,_ ,_ ,_ ,.. CD CO 03 Ps ts 00 CD OD OD CO N. N■ Z.: ,r. CV CV Sr Tr ul g
W NW) 01 CO' ,00 '-'1 iI; It WS' IC..; 2 O
N D3 CD N- N "-. DD ID s- N t. Up CD P.- CO 't 63 CO N ts ° t'. 1.:2 2 I: '- s- CV 10 Nt Ill Nt CO 01 CN C4 TT 00 CO OD Ul sr sr CO CI CO C5 01 01 CI CV CV 04 CV 04 CO CI U7 Ns ,- ,- ,_ ,_ u,
0
:g CL 8 8 8 P: g g g 18 A 57). 5? 53 2 5? r'.= cnc° P! 53 4 5:1- 2 (.:?. 2 0°' „-`'' 72 A y-a) ';12 cm`' we' 53 51 53 El L'it rm. co sr 63 N. WD 1. co ua 01 CV CV 04 04 05 sr U7 CO co N- N T. N 1- y- ..- I- v-.
a g-3 ,riE., P2 000' 53 a3 ti; 4 gg 7,3 IC.? F.1 gg gi. 4 gg, V. gg co r. rq r. cs, 4 r. 0 0 co ua Tr gg q gl ,711 g .°2 4 4. c) ,, 0, CO CV Tr T- c) 0 r. 0 ,, csi CD 03 07 0. Ns P. P. P. 03 P. P. CO ,_ - yi y) y) E_
O 03
o. ea o.
-3 a) 0 u.
=

Ann
exur
e -V1
1/6
CA
LCU
LATI
ON
OF
DIS
CH
ARG
E FO
R 90
% A
ND
50%
DEP
ENDA
BLE
YEA
R
cov w g8g,c2g2.7.00 4,7Nr-Nr-tnNoml. ,0N-m-NcoNwl-mrmcoN ,,,,,,, mv ,,,,..mNwovvvmmommm00Nmm..400)_(4.
M , -4 00 VN".- C4 M.SNOWONOWNO.O.VON<NOLOON<N-VNOM N1100°M<e)WC""N<CONLO CON-030 m 0<tr,0011,-.1.0.-0N00N& 'TMCOMMCOMMCOLON-000.11•01,-
.1-, ...... WWWW
0032002100NNrWNCONCOMO0N M<OdNa)00 74 oW0 NV,_0<0000W<NNI-NN<OCDNC4 M 0 M 0NNON<COVWC,CO
stt.-°00,_,0001..-VNN 00003000000 ,N,2
Nr0(1) w S232"73,SgSNLON<C30<COCO<COMMOOONFNMOCOVCO v0 03 0 ,,,"4„4-4. 0N0IN ,_.ONWO01.1.COM.ICICOMM010303COVVV N 0
N T gog e7,3g,c2141-gr-covvommw cowcomm oor-oNt-- ‘-o_ w ,„„„R_tAlmo‘-wNomnommv.1-4wmunvimmr-c, ocoow 0 «<N«<-<'"° .""1"04 NOWW0 <
1.'"W 0 000.:1.NWtOWNNWN 0 N co NO N N 1,- st 1... ,... CO 1. c4„... 0 23 ,ri., g 0, .- C) 0) C0 0, CO CA C4 C3 C3 C30/ . CO lg „, 0 T.. C3 0 m 0 N N Tr n 0 C"-.""- 001■WVNC74 ......... '-««-< «NNI-M- I-
00,th.°) wc9),,T"9;-"TA23 6:_IWS8ONWOCOCOMNOCOO<WWWVOCO<OIN NI., N „,,r00000N%_,_WC■CDO WNCONNNWNFOI cC1C4 < ,,,
0) , 00000.q«COO NN0 ,N0N 0 00-C"":")WVMN0.4.00000703P1M1 NWI T;IgggI NW° 0 <00N0C9Vvt<ONw00,,,,, WNW 0 «N NNNOON.03 <
.crr..224 090)F2000NV<OWNW03<MCOV .tNrCl<<NFOCOT3 CI < < < NOW<P.VONNrCOCON<OMVC"- M°M< app„0.<0 0 0 000 ,00NN 0000000 VOWNWWW 0 «N<NCOVID I_
m 0) wc7,9 141'6 01.3 c%gGgli g4gV<NNOMCDF, <NOWNWWW0NCONNRAw'03
0N04040 .1. Noi NC000V ,TCOMVWCOLOCOMNMOICD0WW,_ 0 Z,7,0) Tr
0 T 00 03%v 00001 0concowww%—mominNmr-Nommw,tmcomm29 0711. 0 vm ,- -v 00 N0ANNowm 0) ,00,_,,a_oc„..0„rwojNzTimcoommmc4Nmmomvmmul-4N„
a, •t- N- ...... ''' NNNO0 <
VVNOVMOILOCONONOV<N<COMMCO TO 0 ..4- %—.4- m °0 0.4. mcomm r...m .tocloom ovNc"1 " Cq g v 2 (regi c""°•-
mr...mr...,7 01 minommoic74 cow030,0,00 —tI- --0,22212
—0-00000000,1- 0 00 ,,.. w--,...,-0NN0000N0 --o ulm — mw - r-opsr mco vo-r —wr- 00 c0 ,,,,,„,,,N__,,...r.00.4-4-4. 0.4,r0000,,, 0 ,4-4,1- 0_,,0
v
0 C 00 .4. VMNN.CCINWN<C11 C0000NOOCON < C0.0.<0000<NW< COO_COCOV CCNC+CO00);-; co com0000, r,r ,- Nomvcvoi RCOWC■Whh-0Nr.SCOOVVWC, COMMNW N.:Ft, CO <
NCOMC") °"") 0<COrs03NO3<WWW<COON 0O<W°C"INDOWWWOOLOVNN«, r*- rsc°'-4)(NL""°°NnV w000<NNOtsw,m0mc,4 <0000000«NWWWW0 N0 1._
t•-0.t0C.-..tt-.00.4-04 N<WNN w0N0,00 ,J00N0 ,N VW0Vr000001,-MCOM'M<O‘TOMMCO„. '„ 0 ,1 , NNNVCOV.CONCON«N'W0 .701 MMOICOMCINNNNNWW W,, .. ,_, 0 0
co 2 n gikit A,71 2ag sgmel cvp ,.- mmor...NincoNcoNmommo,lom
Lomm- mmmNo m o m cvNmcom ..- mm 0 ...- NI-Nnvr....mcv ,- zi;awwil --, olvr...com W "
comrsVc".° NcomcoNN ,- oNminmo stor...comra 0 sr OD OD s-- r's CO 04 M cc) Tr m ,. m Tr cy ,.
C3 0 CO 00, OD C.-, N CO 0 I, .4. 0 COW NCO aa co 4- W C... 03 ''' C) '' M M F- co Tr 01 N W «..-
M w gE,r2e..2,TSP5r52ROCONWOMOWCO<IONW<NWO ,SNOLOVOCO
.,... 000vmv00 ,1 ,_00030.1-VVMMVCOMMOWNCOM ,TVVOW03 0
N 51 cu CD ci. Tr ',2 ',7- g3 q- CO' S4 7: g 2 0 : S3 S3 71 I I:: t5 71; 2 1 4 SR 2 z; S3 2 2 q 2 2 2 Si 17.-. 2 2 .. .4-CN"- ON•- N*W WIAICINNN NWWW 0 «N«<
!T- i i NMW°C*""P.-03NOWN.N<TC-001.0 00000VN0M D OOLOU")CDVN°<0,1-00t■VON«00C"Cs":"-VV/W<MN00It C
00 c2-0<tl.N< 000 " WWWWWWWW ««NN..., 1_
U D r Y 0 — =
; _ _ = =
2 J 0
C 0 0 t o m m m I. ›. . 8 . . 0 4 a m
n n 4 Cl) 0 Z 0 n U 2 4 2

Annex
ure
-VII
/6
CA
LC
ULA
TIO
N O
F D
ISC
HA
RG
E FO
R 9
0%
AN
D 5
0% D
EP
EN
DA
BLE
co co a)
>- cal
CO
COII II = -0 = 8 2 0 0
X• E 2) o •-• • co Lu 0 a --, o 3 Z C <
•
-5 -co C
C
C 7
AW w 0.- 14-' 1.--") 12 au) '8 44 (NW) 0'- 2 410 C9 C171 Cir OVI I% 00 Vt.. 4 Fr ::i. c%) c%) c%) mu' .14' r, C.,' C9 N iery in° tor' (Da' 2 2 r.- = N N el el el 0 CO = = = = e-
00 0 N CD CO 0° ,_° NC° NG' 0.v ,„.9 07 CD I, 0 CO In 0 sr 0 V 147 CO V 1-- CO N. V CD 0 sr- o 0.- V CO 03 N 0 0 CL = G) N. N Cs4 Cr) CD sr C0 a- CD N. CD U) 10 sr sr st V U) .0. U) 10 CO 0 CO CO U) 0 Fn) sr co 7 c'l " c'l ° el 7 N. co in co N C V N 01 e- = = N N N CO 0- al .-
N. '0' Ns 0 CO CO '- 0 0 s-• 0) 0) = .- V Cr) Cr) 07 0 U) CO CO s- 0 0 0 CD 0 N CO CO 01 CO CO U) N o cricos- Na) r-sr w eiroocoNincococotosrcoNs- 0000poopooN-4- 00srao 0 N 0 r- co co a) " co N. U) 'V 0 N sr V 1._
V CO 0 r-str-oosr sroomr-s- oco coa, o.0. 03 co cop0. co o r-coNco 0C.4 • W 0 = CD Cs4 0- 0) sr 0- CD CD 141 03 •■- s-O NC000 0. ,7.,, 0. 0. 0. .7,. (.7,3 co 0 0. (so e- or to s- N ea co in sr co co 0 0 .-- s- s- N
a) ci) N sr ° l's ° c" 't ° ° a) or 04 Cs1 N. ier 0 sr U) 0) sr co CD N co co 0 sr N U) U) o 0 r- co sr s- co a_ N rt- V CC' C° ° V 't /*••• o sr co r- co co a) co sr N 0 cr) co co r- r- co co co co co 0 r-- co 0 0 0 co 0) co 0 7 0) 't 'I -0 .°. CO co r-- sr sr co tse Cs1 es1 N N Cs1 C0 V 0 CO CO 01 s- N •-•
• 0 (000 0,C0 Nr..' 0° 0C° N''.- coC0 0° 8 .-a- na) mir) No? men coN ow cos- rpm Los- mar 0,N NO) N1f) NO CO 0 N 1- CO co N. U) co N. sr co ii
co co co co ce) co -5 CO 0 ..- .4. ° ° cr) ° ° U) sr U) CO el N n- 1- 1.- 1.-• N- 1- PI 01 VT U) ii_
Lu ,z, 0 ‘2. 0 0) x ,- N. .„,, N co co co o co sr oNNN .-- o N 03 NCO CO el CO = C4. LO 1101 ,_° ° NI° Zco V
co N U) = NI 0 0 CD CO N ID N N N ,, cs4 04 ,_ ,_ N 141 st V 0) CO CO el (*) CO el CO Cs1 N CO C1) V- ,_ ,_ N CO
co co (,) O) a ifir; con't '-0" ii, c,,,"-c° oica9 , ,09 v -.0 zi)-- u .9N c,,,Ne° N•47 CC7 U) MC) st't cots Lou' Inv" sr" cei NW) s-C7' =°:' .-C° N COm CD° U) cn" or' U) in°' al "1. cr, = = = = = N CO V V ?- .1-
a- a- CO N. CO ..- C■1 CD CD CD N. V 0 V V „,., 0 V CD 0 N 0 0 N 0 0 0 0 00) 00 0L-. 4 4.3 •Cl. 0 CD 70 0 = 01 CD tO 01 CO CO 0) = .- 141 N CO N 0 ,e, ,e, s- 0 0 •- C.° •- 0 CD at CO CO 03 CO CO N. CO "ch 0 N .- 1- 1- - - 1- 1- 1- 0) al co c° N- C° C° W ,6- a- 1- 1- N CO CO Ps i_
Cal IA 3 3 ,,,a) 0C° LnC° 0C° Wco 6° 53 ,,_C° ,....1." C°0 al• ,....03 CD co sr N 0 r-- CO en N st = s- sr = sr co 0 Csi V" CI r) co N 0.1 0, U) C0 co 0. cr, 0. cs, 04 .,_ ,_ co - U) st .41- .7 V el el Cr) el CO 01- CO C0 el CO CO co sr U) 0 U) OD OD V
N Cric CV .- r.". U.) Si. CC) ‘- CI L° commosrina)Nrococommcn000)r-cot-cocoinincos-co co a. in 0 Nt. ° C° NI- NCD CD ° = CO sr in r-- N a) co r- co U) sr co 0 0 co C•1 N N '4' CO V N. N a- N el 0 CO CO N N .0- in LO CD 0 0 N ,„1. 0 N N N N N CO co er. N e-
• e7 0° N. Ul ° Loa) 0.° Lo° co 'V CO CO 0 N sr CD V CO 0) CD co 0 a, a, co N. co 1.._ .0 o 0 7or 0) OCO0L0VE,00,_ V N CI CI sr CO 0 cr) N e- = 0 0 0 c7., 0 0 0 0 0 0, 0 0 •-• 4 7 er an co in ,._ co ,_ ,._ ,... „....
N. CO LO CO N N F.
W "te° 'tin °In 613 MN CU)
V.)°) '(2 e'31s- °is 2 OW N. co") UO
srw VV N ma' coN ‘sT. Min .40 Olin F1 CON NO
C.11 '17.' VC° Vin g CNICNI N CN7 ° CNIID N CO = N 01 CO el CI N N = e- e- = N 0
co ail ° sr cl 't Cl 'cl. 0° ‘- 0 co a) .-- to N CO sr el in 0 o sr o co Ca CI) CO CO n up in CO 10 IL °I C° = ° C° Csi ‘- CO 0 = N N G co r- to in o Ns. sr MMM in '.7. co o'3. co o o co o CO cr) 0 sr 03 N CO st V CO 0 e- CO ,i. 0 N N CO U) CO U) N- CD a-
CONK sr CO CO l',. N 0, 0 115 0) CO mV s- sr 0) N 0.1 CO 0 0 c.,/ 0 e- sr /... /47 V 0) a- CD N CO C) TO a 0 03 1.17 sr sr N. CO
V CD 1411 N. = CO ID CO N = = 0 0 0 a, a, co 0., ci 0, .- CSI N = CD CO 0 N 0) 1.11 CO CD CD CO CD N. N. sr N C0 = = = N 1.1 CO V) in ,_ .
• in 7 in Nr " CD ° c") ai '''' .7 co r-- .1- 0) to N co a) 1-_ co sr N or co co sr NNOV CO CO 't " 031' al ,T, ,c1 C.,7 40 „?,. Lou, ,c0 ,,.,00 ...'•- ,,,,‘-- ,_°3 ,2 CO CD WI. •7 sr sr en 0 sr el V) In VI V) 01 C,) CO at V V LO IN 4,,,C4 11. 1.0
10
In cr? 0 ts r-- co or co N N co o p CD 0) = N 0 CD el NNONON OD 111 N CO CD 0. CI .4- CO 0 0- aisr a_ ...° tom r....a) OM) co° 0° cal (07 o(i) g., N.E• vcv msr esiN NC.1 No op N. 03 03 U) co sr sr CI co sr sr co in COCONOCOVI 0 = = = = C0 N s- a- = N CO N. AO ,-
CO V CD ° ° .- ° 'C. "-- 0 CO CO = CO CO CD e- .1- .1.- 0- N 0 0. co r.... 0 sr 0 s- I-- 0 03 E to 0 " " ° ° ° ° r.- 0 N CO 0) cr) 4) cl N C0 = = 0 0 rs' I° '.- 0 .1- CV an o sr co 0 r... a, 0,1 CO ',''' V el I- 0 ,:, U) c., ,,,, 0 0) 0) 0) CO CO 01 ,_ ,_ „_. „.., N 0 MF..
CO C° uL ',N.' U) ,-.V 00 inia3 CO0 U) „_C:' 8° r..,7 2 N CD CO N CO s- 0 CO .7 147 ', ', co 0 0 U) 0 CD V V CD CI CO V N ec- ,.. NNN0NNNN ,_ ,_ 0) CO U) U) V ar V CO CO DI CO CO 0.1 CO CI N CO CO V at CO at N. 0) N CO M
sr cni N N- N 3 •;1- in • sr sr c-r ce) C001030)CON.CONNOCO at 0 0 co a) N CO N l'. U) en C. co NI' a) cp co in N 0 co 0 co a) N. N co to sr co co or 09 N N N Cs1 sr 0 co a> Or-) or Cs; co a)a, h. ° co ° v co ° co N N co co N CV ,1-- .-- .-- '1. CO CO CO a'
N V CD 0 at N V' CD N sr co CO N N a) en co co V' CO N. 0 0 CO 0 0 0 CO V 11) V af• 03 N .b. 0 0 .- .- ,- N. N- C) CO CO at CO CD 11) 01 N a- a- 0 0 0 0 0 ChD 0 0 0 0 0 .a- (NI .- csi NI co 01 0 Lel N co N ° 0 rs 0 to sr sr N N N CO i_.
Y
0 - - .... -. - - .... ,, .... _ ... .... ... ... _ .. .... _ .... ....
CO
-) 0 24 0 z 0 co 4 -, co u- < 2

CA
LC
ULA
TIO
N OF DIS
CH
AR
GE
FO
R 90
% A
ND
50 %
DE
PE
ND
AB
LE
YE
AR
D
00 Cn 03 CD Cn st V V zg r C4 CO el CO el C4 P. CD 02 Uf V CO P. Ul 04 M C4 C4 r tt CD 01 et = >. t. m Ps at en r CM Ps Ps 03 U3 C4 r CO 03 Ps 03 r a- 03 C.4 C4 03 Ul P. r P. Co el CO of • CD r4 C4 r C4 0 CP a- CD 0 el 01 C) N C5 0 CD CD N e4 413 03 UM Ps 03 CO St CO P. 03
N CO
U1 U2 sr CO at 10 UM at V 14 ND sr sr UM U) at V U/ U) V el at st M M) al 0 01 at at c4
W
0 C 01 sr 0 CO Ps 03 CA e- N el at ul N. CO CD C3 e. N 0 st ul 03 N. 03 C) 0 r N el V o N. Ns ps p;. 03 03 0? 0? 03 0? 0? 03 03 03 CD CD CD CO CD CD CD CD CD CD CD C3 C? C) 0
N sr u% c6 r- co ch cv 0% sr to CO r!. oS ch 04 % 05 rt. o% c;4 0.) 0% Ns r- r- r- Ps Ns N. N. 02 c0 CO 02 03 03 03 CO 03 03 CD cn cD CA
0) 0) CD CD CD 0 0 0 0 0
7 ce CD CD CD CD CD CP CD CD CD CD CD CD CD CD CD CA CD coCD CD CD CP CD CD Cn CD CO 0 CD 0 C3 0 CD C4 C4 C4 Ol
'-VC4C"""C40(°N-ONONNNCONONCOVVILONWNVOVCI°N'COS LLIZTDW":" 0°00VWCIONNNNNNNNNNNMVCOVN'-,_WO5 rrNrrNNr r N
W 9 rM0C4NOCOMMNNOONNOCOMV o ,m ,00WV03NNCINCD0 VMONVVVVC0030rVNN003WOr mommomm OrrCIOMMOWON 0 0') CO CO co N N CO CO CD V at NN CIVVM ID N
r0003,0103VWNN0000c0 m ,„„ „...,$. I m0N OVWNNOCI.-§ ClOolettsr000V0300001010,7, wwiT"wwmz=0C.Il ag CAR4s!
NatatWOWOCOVN0
LIJ 53 g 2; t2 72 ..3 7,1 ES 4 S - 8 U3 S3 71. Ti. A A S3 SO FS Es1 E.71 g RI gi n .:-, x pi, A ,i). ,93 1!? ..1' fi 0000NCICONNNrr r 1.
V 9 N‘- mr-:"-NrNovmoomo,-,-m.-o.r-.-ommm.-oNNmo.-m mmmow omeoNinmminconvmmN,-.-00000.-Nmvom.-N 0 mioNm,Nmo 000 ,4NNN mv O N
MOM 0 C5 2 l'.1 U3 E 3 PI 01'g 4 CLI A' F o9 mi.' i',3 (9 s-u:' 6; gg S3 S3 SO PE Sg g3 g i!: g gi' :3 5? t; - CD '' C° 0
°MONCOMNOWIM Vr. C4 C4 1.- ,.,
°2"."3"""""""etN.MONM MCDNNN rCOMONNOVrWW0N-CDWt.""r" ":"-tn'IWO)000VV7tel000NNN&NrNNVIC0000071°0 NOINOINNNCINN, Nel v
M 9 cc"- °1--.- °"'mmclvo,.--Noimomoloo 0 „m commmmomm o NmcsicnoaNcoNoN 0 '- coomv-Nor-Ncom.,g 0 ,..-oonnnrom 0 ‘—kro4m.-mom,o 0mNoiN - a-a-a-a-NO/MM.- CP `' N
_NRIsroaomoocoomNoNsrNo-o c,1040, 000w N wor-oor-nTss urs. 6 0000V0000WMC000Nrrr ommmmom;;N ONOCIOWC001 0
N,_COMNWNMNOVN rrNNWNE_
"s :="DWWNNNWW COCONIMINCIWONO0r0CM WNN''N''. °W000LOVVVOlerINNNNNNNNs-N0VVONM. rrrNNNNMNr rNNm
cv Q
0 NV' oulqm co CO N. . . ,- . . ,- c. ,- 0 03 sr c) w c) sr sr 0 0, M°
rfiN 0 ,_,,,,,,000Nr ON) NOW01.-000 00mmo NMWOrrW 01 0 mrsp..01 ---CDCOVNNrrN rrrrNVIV,..M o ...-,-,..- N
WCOrelNrWOr0OUINCIrW0 0 , C5 M 0 M m co 0 CD Ul 04 0 P.. CO st 0 C4 el CD c„.. g: ;: 2 83 2 2 s s gg Eg :3 ZE ti: 5g 0 3 CO 11
00VCONNWCOOVN rrrNCIWO I_
,.. wWP Wcg r8 ;"4"Mr;ZNNNWOWNCOOONON0000cONN000gOr
,_,.. N ,.. N .4. 0NN „COOLOOVVVVIC001000NNNNN0101000,_CD E
1:Ci M S3 (7,-; F ',3 EN rc..; g '..! S3 q- 2 gg g E3 Eg g SO Eg [Zi A A Cl 8 E3 E3 t3 21 Fl M '4 8 W VN O rrr NVM ' g COO N. CO 03 U/ 't 0 CO N. at 0 C4 C4 N C4
N
N NCIOICOr tscIrVO A NWVrrOOrM,"Nmc,".mNom ,_ON000 OrM0300 0 0.000 CINCO0VOrrO mommrs i, md0 0rNOV 0
VV0cON,_00M00N rra-NN I_
0 - .._- _ _- ....- _.. ....- _-. _.- _._ 0-==--= . -= . -="-=--= =--=--=--=-==-='E J m
c o a = m m
Z m w <
n n 4 co 0 z 0 -) ii. 2 < 2
Annex
ure-
VII/
6

CA
LC
ULA
TIO
N O
F DIS
CH
AR
GE
FO
R 9
0%
AN
D 5
0%
DE
PE
ND
AB
LE
YE
AR
DIS
CH
AR
GE
FO
R
depe
ndab
le y
ear
o )r)
,■.■
A 0 0
I 7
29
O ic) co
C° " ‘-'
'— ° '- T
0.) oi° ',.
C.) OM) •-• 1,
C./ c,9 N.-
CD a) 1,
CO 0 1,-
r-• el to
CO o a
a) co CV
u) co CV
co as •■-•
co in .—
0) co I—
a N .—
.-
.- o 0
n— Lo C°
co C°
„) co
0 r.-
‘- co
.- co
C° P--
N- Is-
CI 0) C‘i
0) tr) N ,-
N ,- Na-
r: c.,
cn in N
a) N a 45
4
591
522
I 5
05
co CO
CD r`..
ta C--
01 O I's
Ch CD 00
I 6
35
la CO NY
CI 0) N
0 0
.-- CO
I', 1'
40 CO
N Ul
01 N
.7 000
f co in co
„ co
0 co
I LL
I
,, ,.... , o,
co ,
co 0,
CD o r-
14, .-
CO cs,i
.- ca ,-
0 cn NCO
Cr N 85
8 65
0
CD
• O. .o ex
ca • —3
•
0 a)
•
co U.
•
2 2
L. 1... ,0 as a a, a a.
o 03 .c,
C ID O.n3 W 0 CI O "cl ,---• ,, a) D ..- t 00 CD •-• CD CO CD CO 0 CO CO 01 0 40 C.. r. ..- a N co a CD o 0 1..- N IQ CO C) CO N 0 CD 0 .c .--, V' 0 CD .7 (0 N I. OC) Is ID 40 10 CO 0 0/ P. Is CD CD 0 0 I, gr OPCI kr) C7I CO 01 N 10 In ••-• N CI 01 0 0 CO CO PI 0 N
COC) 01 CD N N CO CO 40 N. CO CO CO Vt 40 C. 40 N CO W E) ID CD .7" CD CO 10 I0 .7 .7 ID In V' .7' CO v a a en to et r) in .3. et r) in NI. ci rs er gr 4.4 ea 2 a)
i). c c 0 D Iii a) ..... ,a3 g•. 2 ' = )., 0 ca O 5 ) B - w
m a) -o 'm C o ca ll g To o
CO .41' co co r... co co (7, , N CO .0 it) (0 Cs- CO 0) 0 v- N el .1- u) co r- co a) o ,- N CO .0 la 50 a) O .2 ts I, t... N. I, 1", N. 0? C? CO CO CO CO 0? 0? CO CO 0) 01 CD o a) cr) 0) CO 0) CO N 0 0 0 0 0 5. 'a >,
W 141 A 4 12) (6 I.:. CO a, o 4 csil co' .01. COco r4. CO CAO I-' c4) ci) 4 uS a!) R ai ci) )2) ,.!- (41 cl) 4 13 gl. 2) ca •-• r- r- Fs- C- 1.-- 1,-- r- r-- CO CO CO CO (0 CO CO CO CO CO 0) 0 cn a) cr) cn cr, a) a) cn o o o o o e. 0 C = o) a) cn a) cn a) a) a) a) cn cn cn cn cr, cs) cr) cn a) cr) cn cn cn en cr) a) a) a) cn o ca o o o 0 CO c co 0 W
o) cu NNN7. N
CO ? :a B ci ,_ 0, r, .„. it, co , co co 0 r- N co a 40 CD C-• CO 00 r. N CI et 0 COC) CO 00 r- NCI I) Z NNOINNNNNNNVICICICI CO O CO
An
nex
ure
-VII
/6
43 CO CO CD • ra. o. a, eu ra. tr r..-i %I 73 . e, 'e ' co .- 0 0 0
01 it") ET
0 .17, CU CO r. el
T E
CI 8 = >I. CD 0 I- CO la 0 CD CD CO CO N 0 CO N. N. "ct ■-• CD h 0 CD 0 N CO CO CO 0 0 0 N 0 CO 01 CO II x CO .0 o a is. cn r's CO 40 N 0 . CO CD 0 CO l's l's CO 0 •t- ts 0 CO lf) CO CO In N U-) Ps 0 CO 0) If) 0), ,C7 C .0 >. C1I c..73 FA %a Ill Cc, V/ CI 04 0,1 CSII 0 0 0) 0) CO CD CO 1,.. CO CD La Nr CO N N N 0 CO CO C.- ca CO 0 c
Iii u) u) u) to is) u) Lr) u) a a I' .7 VI a a nr a 'a vr a a a a cn CO CO 0 N ... AQ co E 8 ' 6 i, -0 u„ u, 11 tti e "al III T ,0 i_
67 E ;.-.. 0
I Z -- 7 1.)
aco .... €0 ''''

Annexure-V11/7 CALCULATION OF TEN DAILY FLOW FOR90% 50% SYNTHETIC YEAR FLOW
Ten Daily Discharge Data (cumec) arranged in Descending order for lurhi dam site
SI. No.ceedence Orobabili I
JUN II III I
JUL ll III I
AUG II III I
SEP II III •
1 2.9 565 725 876 1000 896 1014 993 856 689 685 499 304 2 5.9 1110 1720 1719 1369 1491 1132 975 964 1001 929 654 476 3 8.8 408 606 506 614 1139 1046 1044 1020 701 539 386 297 4 11.8 760 1463 1466 828 1715 1226 1508 1651 1043 693 529 368 5 14.7 929 736 535 735 1357 1485 912 783 630 576 393 307 6 17.6 449 317 720 1416 1512 1171 1512 975 713 702 554 378 7 20.6 827 712 1182 1463 1222 1220 1534 1352 874 948 707 464 8 23.5 370 821 1690 1298 1474 1182 1081 1038 783 665 384 246 9 26.5 729 856 1128 1101 1269 1193 1293 796 703 531 403 289 10 29.4 474 447 919 845 1032 1268 1360 1165 959 502 350 295 11 32.4 644 1245 1020 1314 1307 1323 1212 1158 774 510 524 296 12 35.3 809 687 944 1070 703 1264 1338 1098 1182 916 686 435 13 38.2 990 822 749 842 565 834 777 858 811 667 396 236 14 41.2 670 705 753 768 821 796 825 917 842 669 456 331 15 44.1 316 872 1482 1064 1204 1461 1240 1116 831 620 356 272 16 47.1 862 783 851 1198 1030 1191 946 842 807 652 457 366 17 50.0 616 627 1070 1084 1122 1253 1237 1020 779 545 410 651 18 52.9 958 728 656 774 1118 1277 823 759 850 581 374 306 19 55.9 828 731 1382 1213 1101 933 1027 993 823 711 528 385 20 58.8 1041 1312 1164 1419 1241 1190 960 689 767 669 492 290 21 61.8 482 772 1037 637 954 1202 1009 924 816 718 502 276 22 64.7 518 730 624 728 1036 688 733 612 549 502 460 276 23 67.6 770 668 1243 1339 1164 1445 1397 1120 1085 923 535 301 24 70.6 722 996 571 858 960 987 981 916 757 774 469 293 25 73.5 597 1109 1551 859 1029 1073 1054 1172 763 638 520 317 26 76.5 325 475 712 671 847 895 896 810 630 432 371 238 27 79.4 682 612 1141 1510 1372 1035 1002 1068 1023 568 453 549 28 82.4 301 628 791 910 887 957 1275 941 794 545 443 373 29 85.3 426 507 597 583 775 1086 1007 655 578 544 348 246 30 88.2 370 522 505 668 796 775 709 869 635 465 293 199 31 91.2 786 1034 848 922 808 712 762 923 772 707 482 282 32 94.1 1134 1041 880 915 808 886 951 744 653 596 438 324 33 97.1 275 444 454 590 525 523 622 618 460 296 316 204
Synthetic year with 90 % dependable discharge
786 1034 848 922 808 712 762 923 772 707 482 282
Synthetic year with 50 % dependable discharge
616 627 1070 1084 1122 1253 1237 1020 779 545 410 651
1

Annexure-VII/7 CALCULATION OF TEN DAILY FLOW FOR90% 50% SYNTHETIC YEAR FLOW
Ten Daily Discharge Data (cumec) arranged in Descending order at lurhi dam site
I OCT
II Ill I NOV
II III I DEC
II Ill I JAN
II III I FEB
II III
222 196 161 143 129 115 106 105 103 97 89 95 93 94 98 275 214 199 178 153 127 114 106 102 97 96 96 97 92 93 195 181 145 132 119 108 101 98 93 94 82 96 113 117 115 272 232 212 192 177 150 130 121 114 108 104 100 99 101 111 226 188 179 155 142 128 108 99 102 97 87 95 91 93 93 251 203 178 168 153 145 121 122 111 99 661 93 93 93 92 315 248 206 183 171 159 147 133 122 107 107 101 99 96 117 209 184 162 149 132 123 113 101 96 91 86 88 91 89 99 235 188 158 139 124 111 100 95 88 85 70 81 81 78 77 223 170 151 155 127 111 102 93 87 85 82 81 82 84 81 209 182 167 145 133 118 102 98 87 88 93 95 92 91 89 289 231 199 170 146 132 118 108 102 93 88 85 81 83 99 174 152 136 120 104 95 89 87 82 81 73 74 72 70 72 241 312 186 153 133 117 101 176 88 80 74 75 80 80 81 208 191 160 146 135 129 124 123 119 113 106 106 104 105 108 225 174 156 139 129 123 117 113 109 107 107 101 86 73 84 322 216 172 155 143 137 131 125 131 130 121 111 111 107 105 224 188 175 161 145 137 117 .119 120 104 98 101 104 107 105 259 221 186 157 152 145 137 132 118 107 98 94 95 97 97 229 192 171 156 142 131 124 122 121 115 113 115 124 116 122 233 191 162 142 134 129 121 110 106 106 103 105 103 104 106 211 174 149 137 132 128 122 111 104 103 102 81 99 99 102 250 205 172 152 143 135 126 125 121 116 111 109 105 108 113 232 199 168 145 138 133 126 119 120 114 110 106 103 105 118 254 202 168 150 138 133 127 121 113 109 105 103 103 102 101 179 138 118 109 112 128 120 119 111 104 100 96 93 94 97 337 347 276 212 195 182 165 153 146 143 139 134 132 124 126 245 195 178 167 157 147 134 129 120 117 115 114 113 114 123 190 178 165 155 144 133 125 117 108 106 99 96 86 85 87 161 147 135 152 123 104 93 88 85 83 80 77 77 80 78 206 183 166 148 136 132 125 124 96 77 76 70 74 75 79 197 172 151 140 130 111 103 100 97 96 90 83 82 84 85 170 149 144 120 105 92 81 78 75 75 78 75 78 85 93
206 183 166 148 136 132 125 124 96 77 76 70 74 75 79
322 216 172 155 143 137 131 125 131 130 121 111 111 107 105
2

Annexure-VII/7 CALCULATION OF TEN DAILY FLOW FOR90% 50% SYNTHETIC YEAR FLOW
Ten Daily Discharge Data (cumec) arranged in Descending order at lurhi dam site
I MAR
II 111 I APR .
11 III I MAY
11 III
98 103 150 191 240 670 1396 592 822 96 106 146 157 174 226 326 293 246
128 144 151 201 210 298 357 614 537 114 113 133 139 177 344 318 415 529 92 99 107 133 106 117 126 143 259 94 107 119 119 205 214 388 575 641 133 142 158 222 288 370 413 411 360 93 89 98 119 157 234 328 398 457 93 92 125 122 214 259 429 454 591
114 110 143 212 227 285 391 368 405 94 106 117 144 167 220 360 589 610 102 117 134 151 157 239 318 460 655 82 87 93 92 115 150 200 388 606 92 110 113 123 188 256 291 498 255 107 112 124 144 143 197 268 266 359 81 98 99 107 278 334 501 582 602 111 116 129 130 140 144 176 307 548 107 115 188 173 191 249 374 950 842 112 128 158 216 195 235 378 510 602 112 120 142 136 154 224 264 426 402 106 117 135 124 148 256 453 287 474 101 116 128 139 125 138 238 282 606 111 105 123 128 140 165 221 654 382 111 130 138 143 225 361 381 360 553 102 111 108 114 133 168 163 165 245 109 123 120 146 156 257 328 344 727 125 127 127 151 199 347 381 448 583 113 116 122 140 156 177 210 459 496 86 84 97 105 114 127 184 304 254 96 106 117 128 161 230 324 858 650 95 86 122 134 201 253 274 601 811 84. 90 102 104 111 127 123 227 304 94 106 129 118 139 221 326 334 237
95 86 122 134 201 253 274 601 811
111 116 129 130 140 144 176 307 548
3

An nexure-VII/7 CALCULATION OF TEN DAILY FLOW FOR90% 50% SYNTHETIC YEAR FLOW
Month Block Ten Daily Flow of Ten Daily Flow of 90 % Synthetic.
year 50 % Synthetic.
year
Jun I 786 616 II 1034 627 III 848 1070
Jul I 922 1084 II 808 1122 III 712 1253
Aug I 762 1237 II 923 1020 III 772 779
Sep I 707 545 II 482 410 III 282 651
Oct I 206 322 II 183 216 III 166 172
Nov I 148 155 II 136 143 III 132 137
Dec I 125 131 II 124 125 III 96 131
Jan I 77 130 II 76 121 III 70 111
Feb I 74 111 H 75 107 III 79 105
MAR I 95 111 II 86 116 III 122 129
Apr I 134 130 II 201 140 III 253 144
May I 274 176 II 601 307 III 811 548
4

Annexure-VII/8
Maximum flood at Luhri site by Gumbel's Method (using Sunni Data)
XT = Xmean+ Kan-1
where 6n..1= standard deviation of the sample of size N
K = frequency factor expressed as
K =( YT - Yn)/ Sn
in which yT = reduce variate , a function of T and Fs given by(17)
yt = -[ 0.834 + 2.303 log log(T/T-1)]
and yn = reduce mean, a function of sample size N and is given in table 7.3 (reference 24 )
= 0.532
Sn = reduced standard deviation, a function of a sample size N and is given in table 7.4 (ref. 24 )
= 1.0961
Table to calculate reduce variate yT and maximum flood.
T in years TAT-1) log(T/T-1) loglog(T/T-1) YT K Maximum flood (Xmean+K an-1)
( at Sunni site) 10000 1.0001 4.3432E-05 -4.362194 9.212133 7.91911 8294 1000 1.001 0.00043451 -3.3619985 6.908682 5.81761 6598 500 1.002 0.00086946 -3.060751 6.214910 5.18466 6087 400 1.00251 0.0010871 -2.9637322 5.991475 4.98082 5923 200 1.00503 0.00217692 -2.6621577 5.296949 4.34718 5411 100 1.0101 0.00436481 -2.3600351 4.601161 3.7124 4899 50 1.02041 0.00877392 -2.0568061 3.902824 3.07529 4385
20 1.05263 0.02227639 -1.6521551 2.970913 2.22508 3699 10 1.11111 0.04575749 -1.3395378 2.250956 1.56825 3169 5 1.25 0.09691001 -1.0136313 1.500393 0.88349 2616 2 2 0.30103 -0.5213902 0.366762 -0.1508 1781
S.No. Year Flood Peak
(Cumecs) X (X-Xmean) (X-Xmean)2
1 1979 2135 231.9 53791.4
2 1980 1781 -122.1 14901.2
3 1981 1674 -229.1 52473.2

4 1982 1681 -222.1 49315.2 5 1983 1719 -184.1 33881.9
6 1984 1131 -772.1 596092.6 7 1985 1368 -535.1 286300.3 8 1986 2057 153.9 23694.3 9 1987 1419 -484.1 234324.1
10 1988 2114 210.9 44491.3 11 1989 2242 338.9 114873.3
12 1990 2794 890.9 793755.6
13 1991 1689 -214.1 45826.1 14 1992 1562 -341.1 116329.0
15 1993 1831 -72.1 5194.1
16 1994 2029 125.9 15858.3
17 1995 1859 -44.1 1942.2
18 1996 1732 -171.1 29265.1
19 1997 2600 696.9 485710.9
20 1998 1788 -115.1 13241.2
21 1999 2001 97.9 9590.2
22 2000 5253 3350.1 . 11223434.4
23 2001 1587 -316.1 99900.5
24 2002 1412 -491.1 241150.1
25 2003 1239 -663.7 440473.1
26 2004 782 -1120.8 1256281.9
N :26 sum 16282092
average 1903.07035
and an_i = [X(x- xmean)2 /(N-1) l"
= 807.021478
Calculation of maximum flood for Lurhi site ( by area )
Catchment area of Luhri = 52403 sq km
Catchment area of Sunni )= 52915 sq km
Qsunni *(CA of Lurhi/ CA of Sunni )314
T(in years) Q Sunni Q Luhri
10000 8294 8233.738
1000 6598 6550.06069
100 4899 4863.40517
Annexure-VII/8
(contd.)

Annexure-V11/8
(contd.)
Maximum flood at Luhri site by Log-pearson Type Ill (by using Sunni Data)
In this methoe, Z = log Q
For this Z series, for any recurrence interval T, Zt = Zmean + Kzaz
where lc = a frequency factor which is a function of recurrence interval T and the coefficient of skew C.
az = standard deviation of the Z variate sample
= IF ( Z - Zmean )2 i( N-1) 0.5
0.14834
Cs = coefficient of skew of variate Z
= NE( Z-Zme„)3 / (N-1)(N-2)(az)3
= 0.71505
Kz = function of Cs & T and given in table 7.6 (reference 24 )
and ZT = Zmean 4- K, a,
and max. discharge = antilog (ZT)
As we are using the data of Sunni site for above method, so we get maximum flood for Sunni site,
so by area corelation we can calculate the maximum flood at Luhri site.
Catchment area of Luhri (in SqKM)= 52403
Catchment area of Sunni (in SqKM)= 52915
Qluhri = Qsunni *(CA of Lurhi/ CA of Sunni 3/4
T in
years
Kz ZT maximum
flood at
Sunni site
Q Luhri
1000 5.14183 4.015319219 10359 10283.767
200 3.8594 3.825077604 6685 6636.0648
100 3.30308 3.742551728 5528 5487.629
50 2.73592 3.658416388 4554 4521.155
25 2.18867 3.577233573 3778 3750.305
10 1.35445 3.453482231 2841 2820.4295
2 -0.2304 3.218376608 1653 1641.3818

Annexure-VII/8
S.No. Year Flood Peak
(Cumecs)
Q
Z = log Q ( earl) (Z'Zmean)2
(contd.) (Z-Zmean)3
1 1979 2135 3.3293979 0.0768414 0.0059046 0.00045372 2 1980 1781 3.2506639 -0.0018926 3.582E-06 -6.779E-09 3 1981 1674 3.2237555 -0.028801 0.0008295 -2.389E-05 4 1982 1681 3.2255677 -0.0269888 0.0007284 -1.966E-05 5 1983 1719 3.2352759 -0.0172806 0.0002986 -5.16E-06 6 1984 1131 3.0534626 -0.1990939 0.0396384 -0.0078918 7 1985 1368 3.1360861 -0.1164704 0.0135653 -0.00158 8 1986 2057 3.3132343 0.0606778 0.0036818 0.0002234
9 1987 1419 3.1519824 -0.1005741 0.0101151 -0.0010173
10 1988 2114 3.325105 0.0725485 0.0052633 0.00038184
11 1989 2242 3.3506356 0.0980791 0.0096195 0.00094347 12 1990 2794 3.4462264 0.1936699 0.037508 0.00726418 13 1991 1689 3.2276296 -0.0249268 0.0006213 -1.549E-05
14 1992 1562 3.193681 -0.0588754 0.0034663 -0.0002041 15 1993 1831 3.2626883 0.0101319 0.0001027 1.0401E-06 16 1994 2029 3.307282 0.0547256 0.0029949 0.0001639 17 1995 1859 3.2692794 0.0167229 0.0002797 4.6767E-06
18 1996 1732 3.2385479 -0.0140086 0.0001962 -2.749E-06 19 1997 2600 3.4149733 0.1624169 0.0263792 0.00428443 20 1998 1788 3.2523675 -0.000189 3.57E-08 -6.747E-12 21 1999 2001 3.3012471 0.0486906 0.0023708 0.00011543 22 2000 5253 3.7204247 0.4678683 0.2189007 0.1024167 23 2001 1587 3.2005769 -0.0519795 0.0027019 -0.0001404 24 2002 1412 3.1498347 -0.1027218 0.0105518 -0.0010839
25 2003 1239 3.0932076 -0.1593489 0.0253921 -0.0040462 26 2004 782 2.8933348 -0.3592217 0.1290402 -0.0463541
N = 26 5.329E-15 0.550154 0.05386814
Zmean = 3.2525565

Annexure-V11/9
Maximum flood at Luhri site by Gumbel's Method (using Rampur Data)
XT = Xmean+ KO'n-1
where an_1= standard deviation of the sample of size N
K = frequency factor expressed as
K =( YT - Yn)/Sn
in which yT. = reduce variate , a function of T and is given by
yt = -[ 0.834 + 2.303 log log(T/T-1)]
and yn = reduce mean, a function of sample size N and is given in table 7.3 (reference24 )
= 0.5448
Sn = reduced standard deviation, a function of a sample size N and is given in table 7.4 (ref. 24 )
= 1.1458
Table to calculate reduce variate yr and maximum flood.
T in years TAT-1) log(TIT-1) loglog(T/T-1) YT
1
K Maximum flood
(Xmean+K CY n-i)
( at Rampur site)
10000 1.0001 4.3432E-05 -4.362194 9.212133 7.56444 7276
1000 1.001 0.00043451 -3.3619985 6.908682 5.5541 5807
500 1.002 0.00086946 -3.060751 6.214910 4.9486 5364
400 1.00251 0.0010871 -2.9637322 5.991475 4.7536 5222
200 1.00503 0.00217692 -2.6621577 5.296949 4.14745 4779
100 1.0101 0.00436481 -2.3600351 4.601161 3.5402 4335
50 1.02041 0.00877392 -2.0568061 3.902824 2.93072 3890
20 1.05263 0.02227639 -1.6521551 2.970913 2.1174 3295
10 1.11111 0.04575749 -1.3395378 2.250956 1.48905 2836
5 1.25 0.09691001 -1.0136313 1.500393 0.834 2358
2 2 0.30103 -0.5213902 0.366762 -0.1554 1635

S.No. Year Flood Peak
(Cumecs) X (X-Xfnean) (X-Xmeanf
1 1963 1092.5 -655.7 429958.0 2 1964 1393.8 -354.4 125607.8 3 1965 1083.3 -664.9 442107.8 4 1966 2256.3 508.1 258153.6 5 1967 1850.4 102.2 10442.4 6 1968 2384 635.8 404226.6 7 1969 1999 250.8 62894.7 8 1970 1261 -487.2 237375.4
9 1971 1677 -71.2 5071.1
10 1972 1287 -461.2 212716.4
11 1973 3053 1304.8 1702472.1 12 1974 1871 122.8 15076.9
13 1975 2427 678.8 460753.4 14 1976 1999 250.8 62894.7
15 1977 2356 607.8 369406.4 16 1978 2118 369.8 136743.3
17 1979 2740 991.8 983643.8 18 1980 1967 218.8 47868.3
19 1981 1698 -50.2 2521.2 20 1982 1531 -217.2 47181.0
21 1983 1621 -127.2 16182.9 22 1984 1059 -689.2 475013.0
23 1985 1230 -518.2 268543.5 24 1986 1812 63.8 4068.9
25 1987 1390 -358.2 128315.7 26 1988 1507 -241.2 58183.2 27 1989 1659 -89.2 7958.8
28 1990 1299 -449.2 201791.3 29 1991 1563 -185.2 34303.4
30 1992 1138 -610.2 372358.5 31 1993 944 -804.2 646756.7 32 1994 1830 81.8 6689.3 33 1995 1082 -666.2 443838.2 34 1996 1609 -139.2 19379.9 35 1997 2577 828.8 686889.8
Annexure-V1119
(contd.)

36 1998 1586 -162.2 26312.7
37 1999 1388 -360.2 129752.6
38 2000 5101 3352.7 11240845.9
39 2001 1105 -643.0 413457.0 40 2002 1119 -628.8 395435.9 41 2003 1261 -487.1 237309.2
42 2004 1500 -248.2 61609.1
Annexure-VII/9
(contd.)
N .42 sum 21892110.2
average . 1748.21184
and an-1= [E(x- Xmean)2 4N-1) r
= 730.721497
Calculation of maximum flood for Lurhi site ( by area )
Catchment area of Luhri = 52403 sq km
Catchment area of Rampur = 50880 sq km
QLuhri = Q Rampur *(CA of Lurhi/ CA of Rampur )314
T(in years) Q Rampur Q Luhri
10000 7276 7438.74166
1000 5807 5936.88466
100 4335 4431.96057

Annexure-V11/9 (contd.)
Maximum flood at Luhri site by Log-pearson Type III (by using RampurData)
In this method, Z = log Q
For this Z series, for any recurrence interval T, Zt = Zmean Kzaz
where Kz = a frequency factor which is function of recurrence interval T and the coefficient of skew C,
az = standard deviation of the Z variate sample
= [E ( Z -Zmean )2 /( N1-1) f5
0.15308
Cs = coefficient of skew of variate Z
= NE( Z'Zmean)3 / (N-1)(N-2)(clz)3
= 0.0951
K, = function of Cs & T and given in table 7.6 (reference24 )
and ZT = Zmean + Kz az
and max. discharge = antilog (ZT)
As we are using the data of Sunni site for above method, so we get maximum flood for Sunni site,
so by area corelation we can calculate the maximum flood at Luhri site.
Catchment area of Luhri (in SqKM)= 52403
Catchment area of Rampur (in SqKM)= 50880
Ckuhri = QRampur *(CA of Lurhi/ CA of Rampur )314
T in
year
lc ZT maximum
flood at
Sunni site
0 Luhri
1000 3.22789 3.731397365 5388 5427
200 2.66539 3.647953422 4446 4478
100 2.11773 3.56671123 3687 3714
50 2.1044 3.564733455 3671 3697
25 1.78333 3.517104604 3289 3313 .
10 1.29151 3.444145158 2781 2801 2 -0.0162 3.250158222 1779 1792

S.No. Year Flood Peak (Cumecs)
Q Z = log Q ( Z-Z 1 mean, 177 1 . ---mean,2
Annexure-VII/9 (contd.)
(77 I , ---meanf3
1 1963 1093 3.0384 -0.2141 0.0459 -0.0098 2 1964 1394 3.1442 -0.1084 0.0117 -0.0013 3 1965 1083 3.0347 -0.2178 0.0474 -0.0103 4 1966 2256 3.3534 0.1008 0.0102 0.0010 5 1967 1850 3.2673 0.0147 0.0002 0.0000 6 1968 2384 3.3773 0.1247 0.0156 0.0019 7 1969 1999 3.3008 0.0483 0.0023 0.0001 8 1970 1261 3.1007 -0.1518 0.0231 -0.0035 9 1971 1677 3.2245 -0.0280 0.0008 0.0000 10 1972 1287 3.1096 -0.1430 0.0204 -0.0029 11 1973 3053 3.4847 0.2322 0.0539 0.0125 12 1974 1871 3.2721 0.0195 0.0004 0.0000 13 1975 2427 3.3851 0.1325 0.0176 0.0023 14 1976 1999 3.3008 0.0483 0.0023 0.0001 15 1977 2356 3.3722 0.1196 0.0143 0.0017 16 1978 2118 3.3259 0.0734 0.0054 0.0004 17 1979 2740 3.4378 0.1852 0.0343 0.0064 18 1980 1967 3.2938 0.0412 0.0017 0.0001 19 1981 1698 3.2299 -0.0226 0.0005 0.0000 20 1982 1531 3.1850 -0.0676 0.0046 -0.0003 21 1983 1621 3.2098 -0.0428 0.0018 -0.0001 22 1984 1059 3.0249 -0.2277 0.0518 -0.0118 23 1985 1230 3.0899 -0.1627 0.0265 -0.0043 24 1986 1812 3.2582 0.0056 0.0000 0.0000 25 1987 1390 3.1430 -0.1095 0.0120 -0.0013 26 1988 1507 3.1781 -0.0744 0.0055 -0.0004 27 1989 1659 3.2198 -0.0327 0.0011 0.0000 28 1990 1299 3.1136 -0.1389 0.0193 -0.0027 29 1991 1563 3.1940 -0.0586 0.0034 -0.0002 30 1992 1138 3.0561 -0.1964 0.0386 -0.0076 31 1993 944 2.9750 -0.2776 0.0771 -0.0214 32 1994 1830 3.2625 0.0099 0.0001 0.0000 33 1995 1082 3.0342 -0.2183 0.0477 -0.0104 34 1996 1609 3.2066 -0.0460 0.0021 -0.0001 35 1997 2577 3.4111 0.1586 0.0251 0.0040 36 1998 1586 3.2003 -0.0523 0.0027 -0.0001 37 1999 1388 3.1424 -0.1102 0.0121 -0.0013 38 2000 5101 3.7077 0.4551 0.2071 0.0943 39 2001 1105 3.0434 -0.2091 0.0437 -0.0091 40 2002 1119 3.0490 -0.2036 0.0414 -0.0084 41 2003 1261 3.1007 -0.1518 0.0230 -0.0035 42 2004 1500 3.1761 -0.0765 0.0058 -0.0004
N = 42 -1.572801 0.960735 0.013320
Zmean 3.215109

Annexure-VIII/1
CALCULATION OF LOSSES
Taking installed capacity= 900 MW
FIXING OF HEAD As per LHEP some important levels are taken for this
study ae given below.
FRL
MDDL
Normal TVVL
Gross head
Combined efficiency
Gross Head Assume Losses So Net Head And Net rated net head =
845m
825m
643m 202m
92%
202.00 m 33.00 m
169.00 m 162.33 m
Installed Capacity Required Discharge
HRT Diameter restricting flow velocity to Required Diameter
Say Now flow velocity in HRT =
900.00 MW 614.30 Cumecs 615.00
5.00 m/sec 12.51 meters 12.50 meters 5.01 m/sec

Annexure-VIII/1
A.5 HEAD LOSS CALCULATIONS UPTO SURGE SHAFT :
i) Head Losses in HRT :
Velocity through tunnel = v = 5.01 M/Sec
Length of HRT = 29 KM
Length of HRT = 29000 m flow in HRT = 615 cumecs
Diameter of HRT= 12.5 Velocity of flow = 5.01 m/sec Head loss by Mannings formula
hf= V2 n2 L / R1.3333
where R = Hydraulic mean depth .=R/P
= 3.125 m for concret lined tunnels n may varies from 0.010 to0.018
taking n = 0.014 So hf= 31.22 m
ii) Trash rack losses
ht = Kt V2/ 2 g where
Kt = 1.45+0.45(an/at)-(an/at)2 an .= net area through trash rack bars at .= Gross area of opening
V 1.309828 ( as per Justin & Greager we can take v up to 1.5 m/sec )
an/at = 0.7 assume so ht = 0.111 m
i i

Annexure-VIII/1
iii) Entrance losses : Opening size of Bell mouth= 10.15m X 9.4 m (h)
V= Q/A =769/6 =1.31 m/sec 10.15x9.4
Ke.v2 0.16x(1.31)2 : he= me 0.16 for square bell mouth 2g 2x9.81
Entrances = 0.014 m
iv) Bend Losses :
v = 5.01m/Sec.
h = Kb. V2 2g
= 0.0375x(5.02)2 = 0.0375x 1.2388= 0.048m 2x9.81
v) Gate loss
Gate opening size = 7.2mX6.0m (h)
Area = 43.2 m2
V = 768.9 X 1 = 2.96 m/sec 43.2 6
Loss = 0.10 x (2.96)2 2 X 9.81
= 0.045 m

Annexure-VIII/1
Head loss in penstock
Length of Penstock = 175 m flow in each penstock = 225.5 cumecs
Diameter of penstock= 6.55 Velocity of flow = 6.69 m/sec Head loss by Mannings formula
hi= V2 n2 L R1.3333
where R = Hydraulic mean depth .=R/P
1.638 m for concret lined tunnels n may varies from 0.012 to0.018
taking n = 0.011 So hf= 0.491 m
Total Losses = 31.22 + 0.111 + 0.014+0.048*3+0.045+0.49 = 32.024 m
But assumed head loss =33.0 m
Hence take net rated head = 162 m
Required Discharge = 615 cumec
Diameter of HRT = 12.50 m
Installed capacity = 900 MW
iv
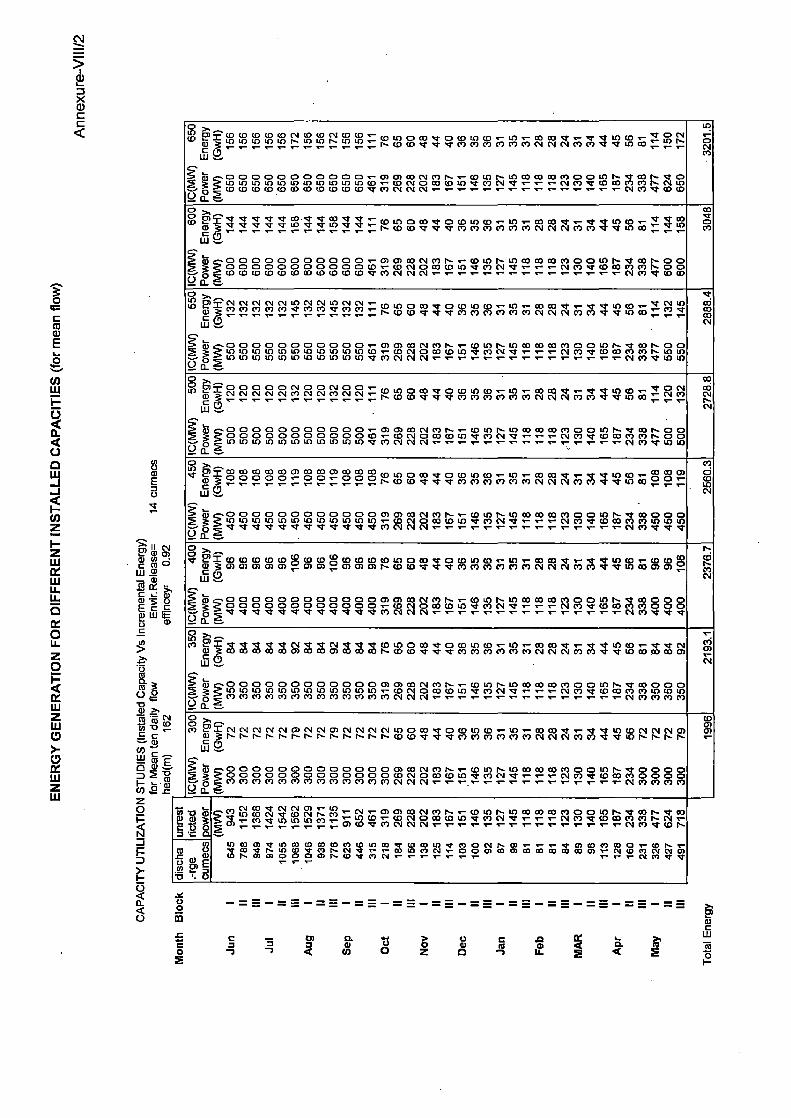
14 c
um
ecs
SII oi cu ED LO • C N ° W W — a) ▪ re C CO '5 8 e c W E C
to
O fti a Co0 o
>,
-0 a)
E fin)
co — 3 2 -p, I-
• , .c
0
0
EN
ER
GY
GE
NE
RA
TIO
N F
OR
DIF
FE
RE
NT
IN
STA
LL
ED
CA
PA
CIT
IES
(for
mea
n f
low
)
An
nex
u re
-VI1
1/2
Mo
nth
Blo
ck
0 > ..... ID 0) = 0 cD cD ED 0 N CD CO N cS3 GO r cl• 0 Cal CD alt- LO 10 LO tr) uo h. an on r■ Lo En r colD tO t::, co ,1- 0 (-0 to CD `" u/ '''' c° c0 cr '" Tr 1. ID COCD .`- r to N.- r-- cD (0 NT a- a' CY) CO CO 0) 01 CO N N N CO CY) NT a' U700 rrr
0 W......
if) §-. 0 0 0 0 0 0 0 Co 0 0 c) r 0) 0) c0 CV or) 1,- a- 43 ti) To- 111 c0 c0 c0 0) Co Co 111 r-. -a- co rs -4. o to to in En 0 LO 0 co in in co or- COLI
CV NOD 0 to •ti- co N •a• a- r r N CY) a* CO co co co T.- N in 0 ., ED cD c.0 c0 0 (Co c0 10 (13 0 ED a' V) CV N N N V) 'cr CO cro
C.)
32
01
.5
O ---CO
0) ,... = .4- •a- co (0 0(0 ,I. 0(0 c0 CO .,-- In 1/■ CO CO 'Cr a- 'RI. ‘t 1.0 (I5 .- Tr X ,,,C° N V' Nt V" a- a- 0 a- NI- uo 'at •a• r Ts. CO (0 V 'I V' 03 01 01 01 CO co N ca N co co NI- NI- IC) co '' -,1 — c 0
LU ...,..
toe.00000000000 ,,-MCMcONMN...-6.0or-Loco CO co co o o to ).... •I'CON•00 n c:),D000000000 ED r CD CV 0 c0 0 LO V' cr) N NT a- r r N 01 NT (.0 c0 01 CO ho- 00
(0 CD CO CD CO CO CD CO 0 a) CD •ct CO N EN N N CO ' to 0 .c..5 ci.
30
48
9, >, — micycNoloscsiocsiolinc.104‘- to ... CO 121 CI CO NI, C3 CO CO LO .- in ••-• co co Tr .- NT ,00r in co r .q. CV in a) co co co co co ..a- co co Nr CO 0-1 a- I... co co v. v. v. c„, 0 („) cv ,...) cv c•si (.,, (NI c,) c,) „4,. NI. to co r in a-
c o a- r a- w —
§.. t3 §. co co 0 0 CI CD 0C) CI 0 0 .1- CD CD CO N CQ la- a- CD LO to- LO CO c0 c0 co co co LO 0.- '1 CO I,- Cs 0 2 to to tr) to tr) tc) tr) to to to tr) co ..- co cti o co 0 ID '1' In CV 'Cr ', ‘' N C') V' CO 03 CQ LO LCI 0 LO tfl If) LC) LI) ID ID LO LO LC) of) V' CO N N CV (V 0") V' 10 0 -c-) eL
28
88
.4
O >, _ CO ,...0, i c. c) co co ONOCONOC) a- co `V ON 0 1.0 0 c0 V' C)(01110a-LOr 0303.7,- 'I' NI' 1.0 ,-• a) N CV N CV N C') N (N1 C.1 C‘I CNI ‘- 1".• C1) CD 1- .4- xt co CQ CQ co co CO N CV N CO CO a" v- in co s- N Cq r r r C co
LLI ..... .
§' if) c. 0 c) co c) 0 0 0 c) co co co .- CD CD 03 N 0) Po- r CO 10 c- to co co co MOO Co r-. er co r•-• o o 2 5 Co co 0 o co C) C) c) co c) CD ci1 a- CON 0 03 (13 0'U CO N NI" .1- a- r N CO al• OD 0:11 0) CO T.- C) Co 0 5 to Lc-) to to to to uo in in 10 LO V CY) CV N N CV CO aoh 10 to
co CD CV 0- N
O ,, vt-Lr) a De i; 60 6 0 0° D 60 oc 0 ,a ) oc 0 0°3 ...9 6° 0°3 ow co tc) o 03 a" 0 (0 Lo CO or LO a- CO 03 a. r 'V "Dr ID (0 ,- CD CD (3)
r•-• CD CD •rr ‘r co co co co co co N N N co co 1. NI. to co ° ° ' r r I- c cb- w
r.,c..c,c,cociococicDcoc,oc000cncONC•3 1,- r CD 1.0 h.- ILO CO CO CO CO 0 C) %C) r- •cl co o o o 5 LO ID I.0 LD LO LC) 10 LI1 CO LO tr) til •a- a) CV 0 CO CO U") NT col N a' r a- r CV CO a' CO CO co CO 111 0 LO .--• 0 NT 'V •1' '1" V' 'ct 1' V' I' 'V Cr) N N N N CO V 'V •ct 0 a_ e„,
co d CD LO 0,
0 >, o .. NI- 1 co CO CD CI CO CD CO (0 CD CO C13 CO CO LC) 0 03 olor 0 cf) L1) co r 0 r a) 03 a' r mt ml• LO 0 r CD (t3 CD a) a) a) a) cn a) a) a) ° a) cr) a) r. CD CD 'V 4i- a- CO CY) 01 el CO CO Cal N CV CO 0') a' .4. to co a) co ° c 0 W.......
§.. if).0000000000000)0)CONCON- co in 1.-- to co CO co co 001o r. Nt 00000 3 5 o o o o o o o o o o o o .t- CO N 0 CO CD i.C-3 V C0 Cs) cr •-• •-• v- N Cy) oct CO 03 CO CO 0 0 0 0 — a' •ET NT NT TT a' a' NT NT "ET N.T Nt Cr) N N N Csi MVV '4'
6 o_
I.- 0) I; CV
co „, 0 n,1^ VI c,' I V' '1 'cl- ct •.:1- N V V' N Ict •ct V' 0 to o »o V- 0 CO LO CO .- 0 T- c0 CO 'V N- ..¢ 'ot LO 0 r Nt- V. N (LI 30OCDCO c0 0) 03 03 0) Go c0 c0 I,. CD CO a' at "Lt 0) 01 01 01 el 01 N N N cr) 01 .or a- LO c0 co Go 0) rn
W _,:f.. •
§' j 0 0 0 0 0 0 0 0 0 0 0 0 0) CO CON Cr) la- a- CD LO ra. LC) CO CO COM CI 0 In I,. V' CO 0 0 0 §" to In to to to 0 0 LO LO 0 0 0 .- 0 CV 0 co 0 Lo a' co N cr v- •-• a- N co .cr CO GO 01 01 0 in 0 i...5 6 en co co cet to v., CO CO Cr) CO col 01 col CV N N N 03 (Y) CO 03
.,- C') 0) r
0 0) --• Cr) a-. INNN CNI CNI ONNO)N CV N N In Co c0 .or 0 CD LO 0 r 0 a- (0 03 a' .- •IT LO CO NNNO) 0 3hh h- 1,- r-- h- 1,- 1,- Is),. T.- T.- Is. CD CD V "Cr Nt CO PI el 01 M CO N N N CO co 'a- NT 0 r r.- 1.-- 1,-
Ili 0
b3§.(0e3oc)c)ociocDc)c)c)c)a) co CV cr) I,- .- 0 0 I,- LO CO CO COM 0 0 to ho- .70000 2 tc000 00o0CDC)000cON00300 Tr cq cv NI- .- .- ,- calcoaocoo30)0000 6 CO CO CO CO CO CO Cf) CQ CQ Cr) CQ CI el C 'a I N N . N CO CO CO CO (......5.0. 5
01 0) a-
rn (D M N c0 co CV a) u3
'c o a2
3
,„cv ,,,u) a-- cal cn co cv co in N. to co co co o r•-. •tt co — — CO a- CD N CO CD LO a' 01 N rrol-N 01 CD CO co 0) N a-
u) k° `- 1D ..tr c%) CV N N •Et CO h•-•
LO CO 0) N• U) CO CD CO CO V) CO CO IV CO CO U) 0) 0 N t•-• 0) C• D CO (0 CO 03 0 r co • cu c") :11 $1
▪ co .0- 1.0 CO V' CQ ts Cal •al• CO ID N x- 0 0 01 CO CO I, CI) 0) 0 0 0 0 Cs CD sr N st 1- v-
- _ - - -- ------------ — — — — — — -- — >.
Er' a) C
C a) O. IS > t.) e Jo Ce L.
▪
>, W O 0 a) 0 o o at
n < cn 0 Z 0 n u- 2 < 2 o H

An
ne
xure
-VIII
/2
= 8
EN
ER
GY
GEN
ERA
TIO
N F
OR
DIF
FER
ENT
INS
TA
LLE
D C
AP
AC
ITIE
S (fo
r m
ean
flow
)
8 E
Mo
nth
Pe
riod
Sp>, —eme3-4- -40—rogv000000.10000 0 .00,r .1 ,1.00--4.00 —mccue,RARA N ,RA-00,1a-v0m0c7m;;NNN;7,mv-v00—vo c o W.-- c.mc(38888888.-N.-omooNmn,-mOr-10==c0m0OwN3c0r-Nrc0
M35.4. ,-11140.-CONOMWOctMN,t,-.,-M,tWW MN-Nr Z.522
cn CDOctOINNN NMetWN
42
38
. 4
Fri ›— ol:PitoNN0INt-cNcmoromomTracomw‘-m—mcost,......tiow VOW
Nr ,-WRIWRIV4 La rci LRI NCOLONt ,t•TMMMMODMNNNM01,1-1- WrOar,°2 C0 W..-.
§- tc.0129EBESSR,-N-00=NOIN ,-W6NOW03=0109WNVO3N,tW 5,1•0 0000000 nMx-CONOCOMM ,:40IN NMDTWCOMMNN ,- 0 00.101NNN NM,t(ON Ulem 1-..—r- ...
414
0
8,-- 02=2929.RAs0-3- 0,rg-0000.a.0000.,0,00v,.0-000.0 —4, 616,616,-616,m,-,—;r-00.4.1a-mommmoNNNoovv-00,-=y20 C w.... ,- OO
N
000000000Vea 0 c 0 w'')vmc"---c"""wcagMg■z 62z
404
1.6
0,_ L00 00000000E-- ‘t00 0,m ,_coulocoNtoconcomcov‘ovinco.-,_ mo 03cAgliccnRRI RJAIR c oal- :rmmmmmmcvnicNimm1- 1- Loco,„ c0 w..., ...41c-m0000tm000,-N,-omocvon ,--color-L(comoomoomr-.1cor-vro) 25a Loigig02 16M2CTAirni cc1R wwwvmcl imvu3w Wgrojr7-
394
3.2
8,-- c, Ep 3: OD OD (D QD OD CO 4D OD OD 43 t. *. QD u, c, 0* 4t c, 0 0 0 ,, u, ,_ 0 0 ,* ,. ,, ,t to 0 N. Z! 114 Si 3 A NN c, 0, „ ;3 ;; ;; gl z.,; ,- t. 0 v3 If It It 01 01 01 0) 01 (1 04 04 04 0) 01 If et w) 03 ,. N. N. C0 D. W...
t ,c, c, c, c, c, c, c, CD C5 CD CV p. CD 0 OD 04 M t. V. OD UD b. QD OD o) co ro c) C5 OD P. It OD t. It m L!ol uguras12222124vA R R""mN""Nmv"Ria4v:
3831.9
53›. c°47iMAAAMIAL%-=;e22I4g,9M72,72RA;;344.130'34F 8 .0 W... §..6c.00DOODODOCNc-OMMNCINN-010NOCOODW0100WN,t03NNFW
5L0222222209092LSWc9Ric9""c""---"m'"°mW4g17. 6--,2
37
09
. 5
8,— camoiNNN-Nc-I—Nr---000m1-0000-0-00v—vv00—voc, wo, m00,0,n00,74 0mT=1,00.1-a—qmmm00m04Nolmmvv00—gm .0 w.... ,6,0000000000N-0000,0,--00,..000000000N.T0Nv0
z 582222209288V4VRAT,""("`--'"""wmRgMgr. 622 3
587.
1 0, 0 — 1....ex00000030-0000v0000 0 001- ‘r1-00,-3- 00 0300.3.0.30, 03-30,030-00.Tv‘rmm0F,m;NNc.a;mvv000 co — w ......
,.5,00000000000,-0000,m,..-00N00000000E—T0N-4.0 z(11."gLg'grile=!PPL,SW(VM9"°"'"" —"(""mccli Li ,2 2
t. g
8 Nei-0303.0mco ,0.3coincoN-0000,1.0000-0-00,3--vv00,-rou, a)(0coocomwtooDwm N.00.44-vmm00,0m0,Nolmmv.3.000,2 c o W.....
§'be.,000000c)ciaciol.-comwoimr-s-oor,moommmoomrs.4.0)nvo 2 r9-RPRI5).15).P.RP-roWc7IRARI °""`""`"e""°3112 /4g1T. 0 c)
33
37
.6
"S > 0. 0 an
i A Dai Q o. 0 u. 0

An
ne
xure
-VI1
1/2
2 sz,-, N co ct
1113 >. EP 0
a)
C C uj
C) cn r- r- nr CV 04 T- r- up nr nr nr CV C) 0 OCD a) 1.0 u) 6 00 pi 00 00 C0 00 6 CV CV CV CV 04 CV CV CV CV T- i' i i
F
c ,,, CD N 05 E co EP 2 2 m o o C c c La
cl (0 a) a) 0. UP "J. .- "- "2: "1: Nt °I yr nr nr co r- 01 CV 2 r- or) ci 05 CA Oi MCO r4 ca ca cv T- 05 06 CO ,f 6 6 6 ‘d CD 03 co ua u) to ul r) cy 04 CV cv n- co co co CD r- r- r-
>. ,,-„, P2 I a) 3 c CD LU ....
CD 7- r- 01 00 Tr C) U) CD 0- i• 1.0 CD CV OD C3 Tr 03 up r- CD CO cd cla ca cd °a oi n- r.... ni r: CA n— CO n- ci CO CV aD CD C4 Cn CD r- a) cy co Tr C3 01 CO MOM 0) nr nr Tr 00 00 c3 r- up co 7- cl u) 1,- co cD CV VI Tr Ul 0- OD CD CD .1- 04 00 Tr u1 T- C4 CV CV CV 01 01 00 ol ol 00 CO CD 01 nr nr nr nr NT Tr
T-CO cy OD ir
4.1 Z. 1) 'a' CO ca §' IS a c 8g
0000000000000088888538 Ca u) co ul CD in 0 111 CD LO CD 121 CD Ul „ 01 CO nr nr a) a) aD CO r- r- c0 c0 CD Cn %, C) 1. '- 04 04 01
c? ,.., cf) T.- EP c g : A X X ! X X c7 A:z '. aD in 0 0
c co 0 0 - 1 - c3 a) n - T
cor t l co n N c° CcmD C0
6N6i66165Z;;7-o aan N nooooocvvyo TuopT N,, 0../
4:‘,01 El 8 g 8 8 8 8 2,4 .- 04 T- CD CD o3 01 el T*- N. OD ul r- 41 OD OD CO 00 CD CD ul r- Tt 00 r- Tr 03 5 g ,_ co co co 00 co 00 ,- g 0 CO i.,-,3. CO Fl pi 03 CO cc) Tr co Cl nr n- n- ,- cv co nr CD CO pi CO 4 fj 1...: 6 0°. 2
462
6.1
8 >,...-- 0 EP:r 0 r. 04 CV 04 00 CV 01 CD co r- n- VD u) CD c0 Tr CD aD u) CD 7- Ul 7- 03 c0 Tr T- Tr Tr uo co T- I' 8 Ea T- a) 3N 2.;-, .„; 2; 7; g 2.; 2; 53 77, L,r2 Z: r- up 0 nr nr nr co cn op el co co cv cy cy op o5 1- yr in co ;"' C 0
LU ..--
c.c., &I 8 3 8 3 8 8 .14 , 04 T- cn co CO CV 01 r- n- co in r- U) CO CO CO 01 C3 CD Ul I.. Nf CO F- ni- CO 2 s g ,_ „ co 0, „ „ „ ,_ g Is v3). g 2Q q 8 co co cr) nr co cy Tr T- T- T- cy co Tr ea co oo op r- o4 n-
CY CO .7 (12 r- z.4.
45
52
.9
8 >,..— c4 2):C RI i'r..= 8 8 8 8 8 8 8 F-2 rri '- ta 0 O NO 1 0 0 ° UP '- In '- a3 (13 U3 (13 '- Nr C3 Si a) 3 cv tq 65 on co co co co co CV T- ;:. 0- CO OD Nf NT Tr r) co v.) co 01 CO CV CV 01 CI nr in co —, r_ .
LLI .....
43 c. m El 8 8 8 8 8 8 ic3 c., .- cn cn CDN 01 r- T- co in r- u) op co op co CD C) U) 0+ Nf 03 t, ir OD 2 5 a n- cy cl cY 01 CV Cv T- .1.1-, 2 w. ;; 2?, Fl 2i1 " " " Tr " " I- .- .- — " " Tr (0 "
CV 2 1;.. gl, ;7
6 c2 2
44
79
.7
8 _ - . 01 EP= 0 /*-- co oo co c° IX) CD (3) I."- .- CD a) C3 co nr C3 CD co a) T- ul T- c0 CO Tr T- Tt 1. al cp ,- Tr CDD C3
T- (1) 3 1 t; RI 2 2, z; p, 2 g & 0 -- I, co CD nr Ni nr op co co 00 CO 00 CV 01 CV 01 03 Tt Tr u) Or Z. _ t3.2 C 0 IA ......
§.' '6 §.cip Fil El 8 8 8 8 8 ig .- 04 7- C4 C4 al C4 01 1,- T- VD Cil 0... U1 CO 03 CO 01 ca Ca ul r- 1 OD P.■ NI' 03 2 > V ,,_ Ncsi eN1 (NI 04 (4 , a- 111 CO 1- CO CVOCO CD in Nr MN V T- A- T--0101 Nrwocominr-e.1.-
6 CT) CD OD Nf 01 CV 0,1 01 CV 01 Tt aD r- 050. 2
44
06
. 5
O --
,_ FPI "3 2? 2? 2? 2? Tr 2 2? ,g; a' r,, ;:. up up c7 oD Tr C) a) c0 aD 77 al 77 03 OD nr 77 Tr Tr Ul CD 7 't Si FR a) Fl b--, N bi Ki g .c,,i t.,-, i.„-5 ;1 -- „._ r- C.13 COTr Tr Tr Cl 01 01 up 0) 00 04 01 04 C7 CD TT Tt u) 00 -- C (9 UJ .....
v.) r, CD cD C) C) CD CD Ca 111 ,_ 04 T- 0) 0) CON CO rT i- a) ul r- 111 op o3 00 CO ID Ca ul r- nr CO t. Nt 03 2 - 5-.1 in in up tn al up tr) co _. ID (1) T- (0 CV CD CO OD Ul NT COCV nr n- n-- '- CV 01 Nr op NO co co r- ca > a) a) UP .1010104N IN CI Nt a, F-
6(2 2
43
32
.8
o. a) co 0 II. 2 Q 2
a)
0 F-
EN
ER
GY
GE
NE
RA
TIO
N FO
R D
IFF E
RE
NT IN
STA
LLE
D CA
PA
CITI
ES
(fo
r m
ean
flo
w)
14
cu
mec
s
Mo
nth
Blo
ck

IC(M
W)
650
Power En
ergy
(M
W) (
Gw
H)
2 (Li; ,i9 tra? ua i N ,N2 fp, (0 N N,.., fg co it) c .1 N. r` OD co r co co n a v., Tr NCOODCON00‘-CDSSNrs ----- -- — 000LLIvt•crd'CIL9NNNNNNNNN-NOIttstlOts-,,...,_
0 0 0 0 0 0 0 0 0 0 c0 s- LO LO CO T- 0 N- CO N. V 0 0 esi c„, c, 0 V .i- N. I' CO C,) 0 0 N LO LO DI LO Ul 10 LO LO Ill 0 1,- •,- 0) N. 0 LO CO 1, 0 0 0 co 0 0 N CI LO CO .- .,- LO LO LO LOCDOCOCOCDCDCOLOCOVNNe-e-N •,-* ,- .- gr- N CI Nt CO CO
29
06
I
IC(M
W)
600
Pow
er E
ner
gy
(MW
) (
Gw
H)
,U") 41. 3 3 .3 °Dun 3 3 coin 3 CO LO N N. N. CO CO r CO CO N- I" el cr N 01 CO 0 N 0 0 .- CO a"t - - - - "" - -- - — - 0 CO LO Tt 1-1 C.) C'? NNNNNNNN .- N CI NI-1 LO N. ,..° ,Tt ,_I°
0000000000031-1OLOCON-0).- CONVO cocsic,, m 0Tt•-1, VIDC`100 N 0 0 0 0 0 0 0 0 0 0 N. ,-- 0 N. 0 LI) CO 1- 0 0 0 cno, mom 01 VI 111 CO ‘- ,- 11100 lil CO CDC 0 CO CO CO CO CO CD V CNI N s- s- Cy e-- , T- •t- C N, I CO V' COCO
ffl,
IC(M
W)
550
Pow
er E
ne
rgy
(MW
) (
Gw
H)
Lr)CNI CNI CNI C \ I ir "NI it) N CO 10 N N. r.- COCO ,- CO CD I■VerletC■1 Cf) CO CD C\100 .- C D ° "" CNIC""""".". ") CDC.041 )CICNINCsINNC■INC■1 ,-C■10)d•d*LON-P.C,2Z-r
0000000000 CO .- LO ItI CD •-• 0) •,- CD N. cr 0,0 cs, rsi 1, ,, 0 V' .-- r ■ V CD C ,100 CV CO Ul LO LO LO LO LO LO LO Co N- .- 0 N. 0 11) CO .- 0 0 0 0., 0 a) 0) 0) N C•1 LO CCD •-• "i- LO LO LO to in lo Lo u.) Lo Lo to to to 1- cv cv ,-- .- cv 1- .- ‘-- .- N CI NI• LO 10
66 pi
IC(M
W)
500
Pow
er
Ener
gy
(MW
) (
Gw
H)
°°°°°N°c"ic'coincyr.r.coco oacor...a- covc..1cococacvoo.-co m c"1 2 " N " NCNICICNINCI N co ao in Tt Tr vr ol c7) NNNNNNNN N- N en vr Ti. Le) r- F. c,2 01
0 0 0 0 0 0 0 0 0 0 w s r 0u o O L0O - -0 0 0 o c o , , 0 V U C .D - O 01 0 0 0LOOO0OO000LrNN--N 000ma--‘ - NOVOO
7,
IC( M
W)
450
Pow
er E
nerg
y
1(MW
) (
Gw
H)
cc""c"":7"3""c' co to cs, N. h- co co co co r. Tr v.) Tr cm c.,) a00 c4 o o .-. co ,°3 ,-,c0(9 C3D°C)C-°C-D OCOLONtstNYCOM. CNINCNNNNCNIN ,-- NCOVVIOts.=:--;N
0 0 0 0 0 0 0 0 0 0 CO.,-. Ill LO CO.- 0) ‘- CON. V 0 co (.4 N rs M O 1' .- N. V' 0 0 0 0 10 LO 1.0 it, 41 In en 41 47 10 0 r•-•ol"- 0 LA 07 .- 0 0 0 0) a) cl, 0) 0) N CI tO CO L-41 tO in V 'V V cr V' Nt cr •Lt Tr 'V 'V N N •,- ,- N a--,..-1-0101'crccr
IC(M
W)
400
Pow
er E
ne
rgy
(MW
) (
Gw
H)
0 0 0 CO CD CD (JD CD CO CD CO CO LO N N. N. CO CO ,a- CO 0 N. ,i• CO cr C,4 CI CO 0 N 0 0 .- 0 CO CO — 0 0) 0 cn cn ° co co c' cn cm co in v. Nr NJ- CI CO NNNNNCNINN e- NCI V' T7 LO N. a) a).‘g
00000000000 .,- in in CO.- a) .,-- co N. Tr 0 co ,,,, c,, , cf, Ott ,-1....1 f0000 0 0 0 0 0 0 0 0 0 0 0). 1- 0) N. 0 LO C.) ,--000 0 ,,,, c,.,,,Nmio co a-- a-. 0 0 0 VVVV ,7•7 ,4:1cts7.1NCNI‘- ,-C4 a- .- .- e- N Cf) Nt NI• V'
w z,-,
IC(M
W)
350
Pow
e r
Ener
gy
(MW
) (
Gw
H)
,t -4- ‘14- N•td- CNINF.*LONN-N-03C0‘--03CON-NrCITtNCOCOONOON-CONPN, CO CO CO CO CO 0) CO CO 0) CO 03 CO LO 'IV ct r) CI NNNNNNCNIN .- N te) mal 10 N. CO CO 0
00000000000%-IOLOc0.-0).-CON•crOwN(N r,m0mr•-N-stC.0000 MLO LO 1.11 LO 10 10 10 LO 10 LO LO N. %- 0) N. 0 LO cl .- 0 0 0 a, ,, a., , a, N r) Ir) co ..-. , u.) Ir) to co co CO CO V) C,) CO VI el CO N N g- ‘- N ..- ,c- e- T- CV CI Cr) C.1 CI
0 a
IC(M
W)
300
Pow
er
Ener
gy
(MW
) (
Gw
H)
CNI NNNN 0 N N 0 N N It) N N. N. CO CO 1- CO GO h• 'V CI et L\ I CI CO 0) N 0 0 a- csi N N 0 NN.N.N.I.-1■N.N.N.N.h.COlantcrcl*COMNNCNINNNNNN-NOIVVION.N.N.N.
00000000000N- toocc1,-0)‘-forsd• O ca c,I NN. 0,01',- 1,-st0000 00000000000N-0N009 - 000 00000 NML000-0000 MIIIIVIIMMINN--N - — — ‘..- Cs1 Cr) 01 CI CO Tota
l=
18
37
I
Annexure
-V11
1/3
EN
ER
GY
CA
LCU
LATI
ON
FO
R D
IFFE
RE
NT I
NST
ALLE
D C
AP
ACI
TIES
( F
OR 9
0 Per c
ent
e D
EPEN
DABLI
TY)
z 0 it) co cm co in (,?. co co or) co to in co •-• cr) co r. o %). co ce) o
2.3 a) 3 CNI.4.`-'41 ‘-,- N CDU'prMN-C::"-°°°(#)CCIU316-)63 V- Ca2 F-.Z■-1; 14 2 ts Lo (.0 01 C‘I CN1
CD LO CV 1.0 r". CO 0) 0 0 v. wi (.4 CO 0 74/. g CO E3 P. CO g ' ° N- N- N. CD CO CD CD CO ("3 ° ‘- r CV CI 0 CO
• C) .0
•
>1 a) • 0
-
u.
Mo
nth
Blo
c k
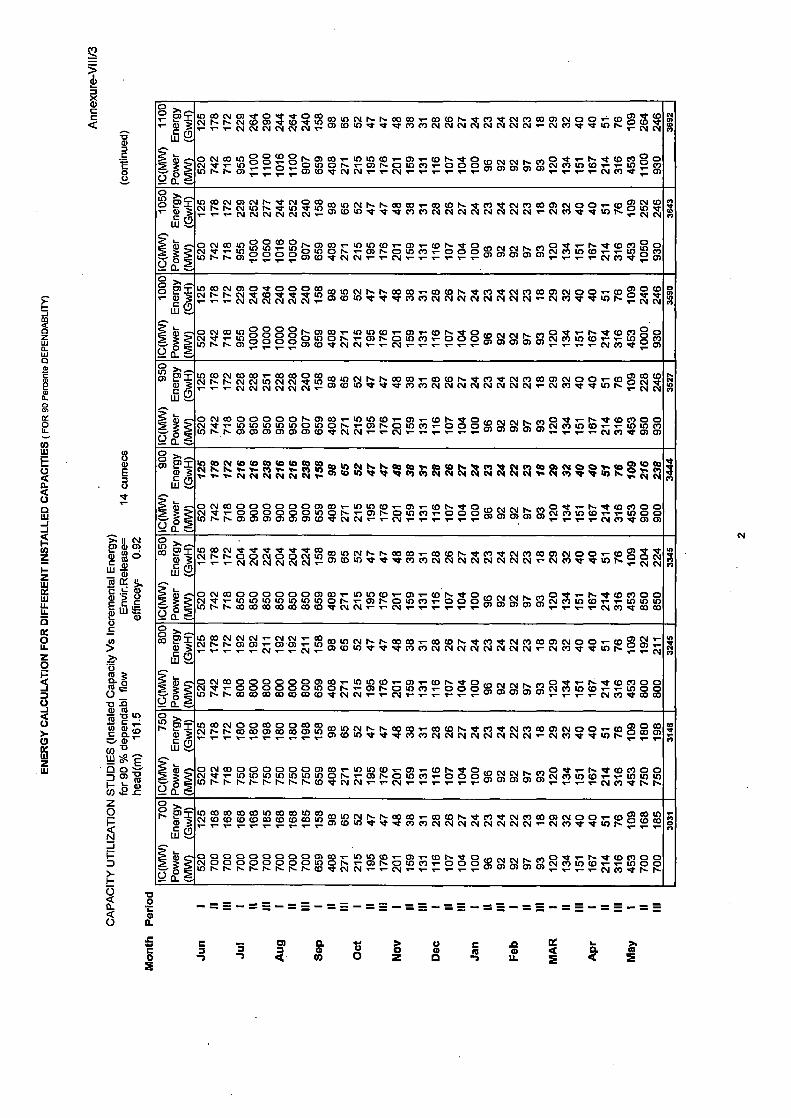
Ann
exur
e-V
III/3
a)
0 O IC
(MW
) 11
00
Pow
er
Ener
gy
(MW
) (
Gw
H)
„I") °Dr, r, NO) S 0° , , , ,, . , 3 . cbc 0 , 0. LoN ,Ns.. vr, vela mop c.„..- Nco Nco "N. NNI. Nr) gi No, Nr) ._co No) roN .51. .5). in.- esco , . . . - - - OINNCVNNe-
0 0 N CO LC) c,C) 8 ,..(° c9 t, 0, CO. LO to CO ,... 0) .■-• CD ts. 'r 0 to c.,1 04 ,, co ca ‘1.*-- ,- i- sit 03 M O O cv el in CD 1- e- ocr) 01 NI- .- u-) 0 o to o te 1- 0) N. 0 LC) Cr) a- 0 0 0 co a, a, 0, ct, , , N Cs, ,,,, ..- 0, LO N. N. 0) ,.._ '-' CD CD et N N e- e- CN
IC(M
W) 1
05
0
Pow
er E
ne
rgy
( MW
) (
Gw
H) 0 CV CD tr)C.3 " CD " rs%r " C)C° C0111Nh.h■COCOI-COCOP■Mr co .4. cv 0 0 0 cv 0 0 .-- 0 0 la ,,, (,. N. N' " L° N' V. I° Ni. tr) CD M LO Nt 'V 'et Cc) VI t \ I 0.1 CV CV CV CV CV N e- 01 CI wt 'cr to r- ,- c,1 oi e- a- e- NCVNNNN ..-
0 CV CO 1,0 RI .9 CD C3 N. 0) CO •-• LC) LC) M .-- 0) 1- CO r- Tr o 0 c„, c„ r, 0 o Nr- 1,- ct CD Cr) Lo 0 .‘- in 0 In 0 h. gr. (3) N- 0 LO C•3 l- 000 0 0 a) 0) 0) a) NJ c.7 If) CD e-- .- tO 0 el " V. '... u) c)000 to r- rs a) a) CD I' 01 01 e- e- CV C ., •, V. 0) I- .1- N- e- N r) sit ,_ 0)
q a ...,
IC(M
W)
1000
Po
wer
En
erg
y (M
W) (
Gw
H)
Ln CO " a) CM' 't (7) e g:) CO 03 LI) CV rsr-cacoT-oacor-TrolTrNcocoo)NooT-co8;3 44. NI N' 1*- N Tr cp Nr Nr Tr LC) CD CO In Tr mr .4. co co cv cv cv NNNN N s- N 09 Tr Tr tr) r- _ or or .- ,-. T- N N N CV CV CV N-
o CV CO U) 8 8 8 0° r- o) CO.- to to to .- 0) T- co or- Tr o 0 (.4 cl r„ ,„.) No coTr zi; cot. ,...,:r ,_co cnu, 0° c,o N et s- LO 0 M Oh e- (3) 3... 0 LO CI e- 0 o to r.- r. a) 0. ° ° 0 co to yt CV CV e- .- CN ,• N. ,, ,. 0) 0) 0) 0) 0) ...... ,.. ,, (NI 0, 1. c) 0,
35 9
0
IC(M
W)
950
Pow
er
Ener
gy
(MW
) (
Gw
H)
n r,C° Nr.... Na3 NC° to- csi°3 (c3N1 .4.C3 2 ow 2 f.8 N. N. vim moo co.- Nco NW csiN (4,7 p cver 01 c,c1 ,_c 0 gi %, or or ro tor, ig oic44° c4,1° .- a- 1- CV CV CV CV CV CV e-
O N co o o 0 o o N. 0) CO s- in 0 O e- O. to 0d• 0 (0 oi cm co 0 Nr .- N. ei• to 03 0 0 NV's- owing° 10 0 LO N. .r. 0.) N. 0 LO CI e- 0 0 0 0) a) a) cy) cl) CNA CI III CO ,-- c7 v.10 09 coel CO Is. N. a) 0) 0) 0) CD 0) CD et N a- CV .L-- e- CV e- a- e- e- 0.1
IC(M
W)
9001
Po
wer E
ne
rgy
(MW
) (
Gw
H)
'4) 413 °4 4° (4) 4° '43 4° '33 °3 co to Csi N. ts. Go 00 es. co ta r. er in v‘i in CO at N o cz v.) ca 0 „, ,..) ..... v.. e- N N Csi N N Csi es
0) CD 03 N r. N. .. V." C'.) l'" V"' " " 0) M ID Vt V 13' 01 0) CV 01 01 CV CV CV 01 0. CV CI 'V Nt in n. ,.. csi c4
0 CV CO 0 0 0 0 0 0 CD CO %- to OO •-• Or CD N •Ch 0 to 03 c.4 ts ty., 0 eh e- N. et CD Cc) 0 0 CV Nt e- 0 0 0 0 0 0 tin 0 N. e- 0) N.. 0 LO CI e- 0 0 0 co 0 0, 0.) 0.) 01 Cc) tO CO 1-- e- 10 2 c) In N. N. CD (3) 0 CD CD CD M 'Ll' CV N 1- e- CV e- e- e.. .- N 03 so a) CO
1
IC(M
W)
8501
Pow
er E
ne
rgy
(MW
) (
Gw
H)
1° C° Nr Nr .4. Nr Nr .4. C° CO 03 N N N Op CO •-• CO CD 1•••• et in sit N el c0 0) N 0 0 s- OD 8 cl- A CV N. N. 0 0 N 0 0 04 LO 13., 0 ,r, „4. ,3, ,„*. c„, c.) c.4 oi 03 csi 04 ,..4 c.,3 oi .r. (..4 0.) „4. ,4. 0 1.... ,_ cs 4 cl e- e- e- CVNCVNCVNe-
0 CV CO 0 0 0 0 0 0 CD 00 e- It) ID CD e- 0) e- CD N. et 0 co c„, c.„1 i„. M O et e- N. et o cr) o 0 N sit ID tO tO tt, 1.0 1.0 0 N. ,- 03 N. 0 LO Cc) e- 0 0 0 0.) 6:0 0, 0.) 0.) 01 07 01 CD Lt") 60 60 LO N. te. 03 13)0303030301•NNs- s-csi e- e- s-• se C.4 0) .0-
i n
IIC(M
W)
800
Pow
er E
ne
rgy
(MW
) (
Gw
H)
1° C° " NI " CO to CV N N. 03 CO e- CO CO r-- .4- co 4- cv co co cm c.1 0 o ,- (f) g 6.4 N N. N' 0) C3) .-. 0) CY) L° 0) CD Lc) Tr v so• r) 07 CV CV CV N CV CV CV CV 1- CV CO Tr Tr in r- ,_ ,- Fr N s- s- N e-
oN030o00000)03e-ognos- 0) e- C13 te. et 0 0 cs, c.,1 r„ crj o Tr •-• r..- .d. (0 cr, 8 8 N Tr T- 0 CD 0 0 0 0 gn 0 rs. e- a) is- o LO 0, •- 0 0 0 0) co 0) a, a, CV 0) 1.0 CO ,- ,-- IR co a, ION.N.OZICOCOOOCOCOCONt CV CV e- e- N .- e- e- e- N CI et
4 ti,
IC(M
W)
750
Pow
er
Ener
gy
(MW
) (
Gw
H)
Li' '':' N 0 0 c° 0 0 c° c° 03 in N rs. N. IX) 03 .- 03 co rs- et 01 Tr N cl oo o) N co o ,- to 8 8 8 N N. N. C° C° MC° CC/ (3) 1° 0) co If) NT Ni* 't CO Cl C4 NNNCNINNN s- N ce) V sit In Is- „ ,-
0 CV CO 0 0 0 0 0 0 0) CO v- ID 111 CD. O. CD N. et 0 0
- r. Tr co 0 o o V•t T LO 10LOLOLOIDIDONTDN0101-000 404 v i.,N7DO-.- 10 10 1.0 10 s- ----- NCOn NN -- N 00000 ----N0er.i.
.i...w „
IC(M
W)
700'
Po
w er E
ne
rgy
(MW
) (
Gw
H) 1
Lc":":":"° Ln c° CO 16 c°,33001 rs. N. co CO s- CO CO N. et 01 et CV 0) CO CD 01 0 0 e- CO 0°) coC° col° N(0 (° (0 (0 C° CD C.° °° LC) 0) co to Tr. .4- .a. co co N N N N N N N 01 s- N cg) Nr st in t■ ,- ,.. ,_
N o ca 0 0 0 0 0 0 0) CO tO 10 CO T-- Ct) 11- tD N sit o co csi Cc, r„ ,.„) o V' .r- N. 'et CD en 0 cg_ CV 0 0 0 0 0 0 0 0 ID 0 N. •-• CD N. 0 CO el .1.- 0 0 0 a) 0.) a) a) 0) MN 01 10 CO r. (7) 14 ro. le. tO N. N. N N. N. N N. I. CD •tr C.I CV ,-- ,- CV .-- N-• N-• VSI
I 3
03
1
• 0.
•
0 0 .0 • 0 Z D
•
-) u.
EN
ERG
Y C
ALC
ULA
TION
FO
R D
IFFE
RE
NT
INS
TALL
ED C
APA
CIT
IES
( FO
R 9
0 P
erce
nts
DE
PEN
DA
BLI
TY
)
14 c
umec
s
Mon
t h Per
iod

ea a) 0 0 0 U.
Mon
t h B
lock
In
crem
enta
l In
crea
se in
E
ng - y
per
MW
CD 41 at CV C) CO ti ti 111 00 CD CD CD 07 01 e7. C) 01 41 ,gr C) C5 06 C') C') Oi ("4 c4 e4 e4 e4 c4 e4 c4 T-.— T-. T- ca ci ci ca
Incr
emen
tal
Incr
ease
in
Ener
gy( G
wH
)
Tr. u? CO CN 4) Ci) Ci) i'": "-- CO CO CO c) us T- cm OD C) DJ '524. a) 06 6 u, ui u) Ti ai oi 6 ei c4 ei cn 0.: ei Ci (71" ...... ts ts CD eT et VD VD 01 T- cb cb „ 0, a, ,.), .4. 0, 04 04 CD
>. ...... pm a.)
W co
...-.
it 00 et C1 CV QD N OD 41 43 Cl 03 et Tr cm T- es CD C) 04 CV t--NTruoTtTrouri— ww44r-mcie464TrTi m ,-.covmmr-onTrTrTrTremoaTrmmmr-r, W0e-CIetWrsC10e-NO0etIOWWC00-Pststs. e-NNNNNNNCIMMMCIMMOIMMMMM
Inst
a lle
d ca
pac i
ty
(MW
)
CD CD CD CD CD C) CD CD 0 CD C) CD CD CD 0 CD CD 0 CD CD CD CD 41 CD U) CD U) CD CD U) 0 41 CD U) CD 41 CD 41 CD 41 CD 41 cp cp ,_ ,_ e4 04 up CO VI Tr Tr us U) CO CD 0- ts CO 03 CD CD
1C(M
W) 1
350
Powe
r En
ergy
W
W) (
wH
)
NF- F.! gi g g 4 Es 5,. 2 2g .43 cm ..... ,_ 0. 0 — co 0 ....- .4- m ,r C4 CI 03 CD cy ca CD e- ua Es Es $,Ii ,_ „- „- c..1 CV C4 cm es 04 T W.CrVt‘rOMCNINNOINCNINNV-NMVI'VTWN,NN,
0 CNI co uti N CO 03 N- I.0 1C) CD N— Ps et 0 up u404 1.... ee) 0 et e- N et CD CI p0o, C4 et e- CO „_ cp e4 CD 4, CD 10. V... CD Ps CD 41 01 e- 0 CD CD CD CD CD CD CD
V V t2. (.2 ;71 ;; V. 5;2 0) 41 ts 0- Or 7, ,- ,- CD CD et CV CV ..-• e- C4
4
1C(M
VV)
1300
1 Po
w er
Ener
gy
(MW
)
ID CO CV cm Tr Tr Tr 00 CC) 0041 CV 0- 0- 03 CO 77 CO CO 0- et C') et C4 es CD cm cv 0 0 ,- 0 Es CO w. • !, t72 El El E,,,, g Es g t.9. CD CD 4) et Tr Tr C9 c1 CV CV 04 CV N CV 0.1 C4 e- CV 01 et et 41 Is. „_ cq cq
CD C4 03 41 .C.) 1..„ to 41 QD e- CD e- OD 0-. et CD CO 04 e4 us 0, CD et e- t.... nt (.0 ol g c) cv Tr T- in .... ED es, 0 LO CD Ps V-. CD 0. CD CO 01 .,. C) CD CD CO CD CD CD 01 CV CI 41 QD e- l.. in (44 0/ us rs r- CD ,_ CD CID et 01 C4 N. .l. cy .- ..- •,- a- cYc") 1* , 0)
IC(M
W) -
--*1
250
Pow e
r En
ergy
(M
W) (
Gw
H)
41 CO CV CD et ..! Tr CD 0 OD oa us cm r- r- Co CO CO CO Ps. Tr co Tr cv CI 03 CO C1/41 CD Or CO 00 CC) .- t::: 1,::
(N 1...,-, El A Es .g; te CD CD 41 et et et VI cu C4 C4 CV CV N N C4 N T' CV co Tr Tr uo r- F Eg g
CD N OD 41 S? V 4° E.;), Ps CD CO e- 41 41 CO r- co T- CO 0- Tr 0 co e4 e4 0. „ ca Tr T- r- Tr up co X C cy Tr T- to - - E, c„,.., CD 41 0r- T- cn r- co ID 00 e- CD CD CD CO CD CD CD cm N C, 40 DO e- .0 cq C'? 41 l's Ps CD ,- ,- ,- ,- CD CID et CV N .... V. CV w- e- e- e- 04 00 Tr CD
_r
r'. pi
IC(M
W)
1200
1 Po
wer
Ener
gy
(MW
) (
Gw
H)
41 CO CV 0) Tr Tr Tr 03 CD OD CO 4) e4 u... 0s CC OD e- 03 CO 0s et 01 et C4 01 OD C) 04 CD CD e- QD Es gs (47 cy r- r-- cy r- co vr 00 Tr uo 0) CD 41 CP Tr Tr co co ey 01 01 N CV 01 CV C4 e- Di 01Tr Tt ul N- T- cy cy e- 1.- N. Cq CV 04 cy CV 04 e-
CD O 04 OD 41 %) V 5,12 Es ....- cm co ,- 43 41 CD e- CD V... co r- Tr cs 0 e4 el us 0, CD et e- 0s et CD 01 cp 1;2 01 et e- 40 ,_ SO N O 04 CD 41 C) Ps e- CI) 0- 0 141 01 e- 000 CD CD CO CD CD N 01 1.0 CO e- e- 41 e4 vp CO is Is. CD ,- .i.- ,- CD CO et N N r .i. 01 V-. .1. 1r' V- C.4 0/ er CD
2
PIN
IC(M
W) 1
150
Pow e
r En
ergy
(M
W) (
Gw
H)
CD QD OD IC) Cup CN Cr) V Vr Nr 43 C) CC) co uo cy r- r- CD CO 7: OD CO Is. Tr co Tr 01 CI Co C) 04 CD Or e- CO cp 04. .c,:2 t: ;I- fl t Eg g .,.., gi ''2 CO CO 141 et et et 00 ce) C4 C4 CV CV CV 01 CV C4 e- NI CO eh at 41 ts ,_ 04 e4
CD 04 OD 41 .7. V 0 2 ,.... CD 03 V". in 10 QD e- CD e- CD ts et CD up 04 04 1..., 0, 0 et e- 0s et CD 00 lis CD CV et e- 41 '- CD 41 CD 0- e- CD 0- 0 49 01 ... CD CD CD CD OCA CD cn 5;2 Fg Lx2 ise Ni T; 1.4? T- f2 .3 1,- F- cm v- ;: (,:2 '- co CO Tr cy cy .-- ,-. Cs/
42c9 t,,,l,
Ann
exur
e-V
II I/3
0
-03 au au 0 2 0 G
Cn C
CD CO 12
L.10 — CO
0 w ..-:
0
14 c
umec
s
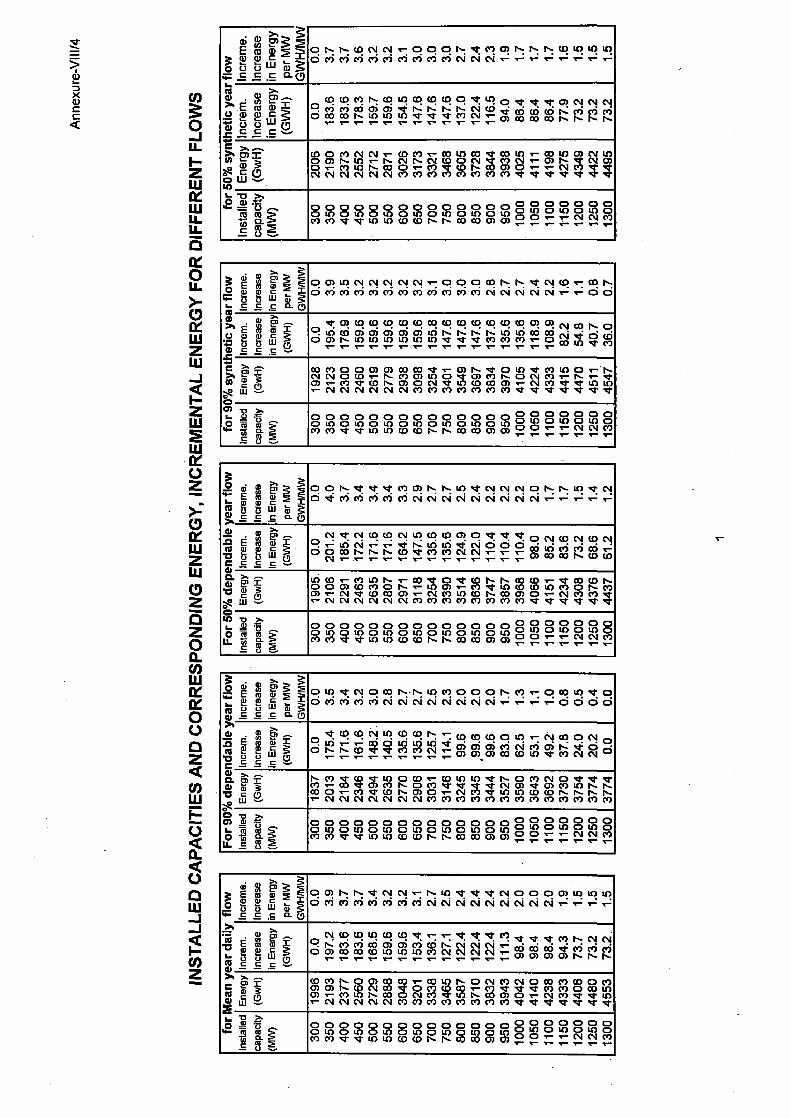
Ann
exur
e-V
I111
4
CO
0 -J LL
z LU
LIU LL IL a cc 0 LL >-
re
-J
UL
LU
z
>: 0 iuz 0
❑ O 2
co
0
a
iu
a.
-J - J
U)
flow
In
crem
e.
Incr
ease
in
Ene
rgy
per M
W
GW
H/M
W
CD Os Ns CO C4 CV T- C) CD CD Ps it 01 CI Ns Ns Ns OD. Ul 41 Ul cS 6 6 6 pi 6 6 6 6 6 c4 c4 N.
a) ci, el N. as us CO CO U5 CD Cr Ul 0 ,r Tr Tr co C4 C.) CV C) Oi 6 6 6 6 Ti r-: CV MD 4 aD co a, 0.: 0i P3 0, Cj OD OD ts 4, UD UD Tr Tr Tr co cu ..- CD 00 OD OD 1... t■ t. t.
OD CD 01 CV CV V CD 01 .t- 03 ill 03 Cr OD Ul T' 03 Ul CO esil us cs CO Ps Ul — N. CV N. CV CO CD CV sr 01 CV T CD Ns It CM CD CD T- 01 Ul Ns 03 CD T 0/ sr QD Ns OD CD CD %• •• CV CV CV CV CV CV CV Cl CO Q1 V, es VI 07 01 Tr Tr Tr Tr Tr sa.
for
Inst
alle
d ca
paci
ty
(MW
) CD C) CD CD C3 C3 CD CD CD CD CD CO CD CD CD CD CD CD CD C) C) CD U CD 14) CD UP C) C) U) C) U) C) Ul CD Ul C3 U1 CD Ul CD Ul C) CD et. T.. CV CV 01 01 01 Tr Tr us us (Co CO Ps Ps CO 03 CO CD 3r
flow
In
crem
e.
Incr
ease
in
Ene
rgy
per M
W
GW
H/M
W
CD CD U7 CV CV CV CV CV ,e CD CD CD 03 Ns Ns nt C4 QJ T7 03 N■ O Oi 6 6 Ci 6 6 6 6 6 6 CT) c4 c4 csi c4 c4 T- T- cS 6
Tr 07 CO CO DD OD CO OD CO CD CO CO OD CO CO CD 0,1 co N- 0 C) ui 6 6 6 6 6 6 ui r.: r.... r... r.: ui CC) 6 - • •
6 co r- us us us us us 10 Tr Tr Tr es co ors T- C3 eq CI) CO 'Cr CO
4... — C5.% 2, to w ,. c (9 ,I,R, w 0
. OD 01 CD CD CD CD OD OD it •,' CD Ps Cr CD U7 Cr 01 40 CD T-. r- C4 CV CD OD CO Ul CD Tr CD 01 Ns CD CV CO .... CD %-. OD Tr OD ts CD ON CV Nt Ul OD 03 CD c- C4 01 Tr cr Ul U, T. CA CV C4 CV C4 CV 01 CI 01 01 01 01 01 Cf. Ct it Wir Wr NI- .4-
cn -0 >. 1- 1.) z 0 To or 1.1■ .-4 0_
8
§' F...
o o o o o o o o o o o o OO c9 8 8 uS 8 ,S) 00 CD 01 CD 41 CD 41 CD Ul CD Ul CD 47 CD 41 0) op Tr Tr U) us co CO Ns r- co as co co CV CV CO
•
CD CD Ns Cr Cr Cr 01 CD Ns Ns Ul Cr NN CV C3 Ns Ns Uj Tr CV 6 Ti 6 pi 6 6 6 csi c4 c4 c4 c4 csi N. N. e4
Incr
em.
Incr
ease
in
Ene
rgy
(GW
H) N Tr C4 DJ DJ CV UD CO OD cn CD Cr N Tr CD CV CO C4 CO C4
CI! ,- Wi esi N-. v- 4 N.: 6 CO Ci c4 cS cS d - • - • • C) CD 03 N■ N. Ns CO Tr cs ol csi 04 T- T- T- co 0 01 m co T-
cy op 03 Ns OD CO
U) OD T- 01 D1 r.... T- 02 N CD Nr CD Ns Ns OD CO .— Tr 03 UD Ns
C) OCA CD 01 CD Is ,E la CD .— 01 V 41 CO CO U7 01 CD Ns OD
CV nt CO OD CD a. CV 01 Ul CO Ns 00 co Tr T- CV 01 01 It
c- CV CV CV CV CV CV 01 01 CO 01 CO 01 01 os Tr N- N- Tr Tr NT 0 Ul
o U
v
E
,> .
0
—
o o o o o o o o o o o o o o 0 0Ul 00 0 0 0 0D CU,DU CDUlCDUlDUlDU,DOD
cocTTIU 00 0r-r-oo n 0oC3 VV0
CJ UJ Tr CV CJ Oj Is LIJ CD. C5 C5 C5 Ns C') DI U) Wr. C) 00 0/ 01 a) CM CV CV CV 04 (N C4 CV ‘• V C) C)
O Tr al CO C`.1 al CO CO T- CO OD CO CD MD C4 OD C) C4 0 ui T- 6 6 ui ui ui 6 6 cn 6 c4 6 CD NZ Ci Ci ci O Ps N- OD Tr Tr co os cu T- CD co. co as as U) N- os est ey
Ps 01 Tr CO Tr 41 CD OD T' OD CO UI CD V, CV CD ‘r N- ,r 03 N- CD 01 Ns CD 01 N- N- Tr Tr 04 co Tr 0) Q7 4) Ns Ns
OD C3 T- 0/ N- CO N■ CD CD CV ol Nr MD 0 CO CO Ns Ns Ns r. T- C4 C4 CV CV C4 CV C4 01 CO 01 01 Cr) 01 01 01 01 07 01 01 01
C) CD CD CD CD CD CD cn CD cn CD CD CD CD CD C3 C) C3 CD C5 CD CD UD C) V) CD U7 CD U) C) V) CD U) CD Ul CD 0 CD U) CD U) CD 01 C') N- N- us us co OD r- 0- co co cn cn CD CD T- CV CV 01
CD CD Ns Ps Cr C4 C4 T-• Ns Ul Tr Tr Tr Cq C) C) C) Cq Ull Ul (q (7 Vi C') Oi Oi C') 01 ei csa c4 esi c4 c4 c4 c4 c4 csi T- T- T- T-
Incr
em.
Incr
ease
in
Ene
rgy
(GW
H) .
04 al al 14) CI) CC) Tr T- T- 1: Tr. Nt 01 Tt Tr Tr oo r- CV CV CD .N. r) P, 6 6 6 oi 6 0.: CV CV esi T- 6 6 oD .4: pi co 0, Ci CD OD OD OD U, U, U, 01 CV CV CV N'— CD CO CO CO Ns Ns r-
as OD P.. C) CD OD OD Y- OD U, t. CD CV CO CV C) CO 01 OD C) r, CD 0) 1,- (C) rq 03 .4- 0 V) CO O.- 01 Tr N- N- CD 07 CD OD 111 CD 14/ r.... OD CD CV CD Tr us r- OD CD CD ‘.
Tr oo Tr Tr 0
v- cu C4 CV CV CV 01 01 01 01 01 01 01 01 Tr er Tr Tr Tr Tr Tr
O ■ _ W W E
M t§
0- ii
000000 000000coo ,o 0o0,000 CD Ul CD UD 0 0 0 U, CD U, CD Ul CD Ul C) CD .T . 'T-• CV CV 01 OD co Tr Tr us us us CO Is Ns OD OD CO CD
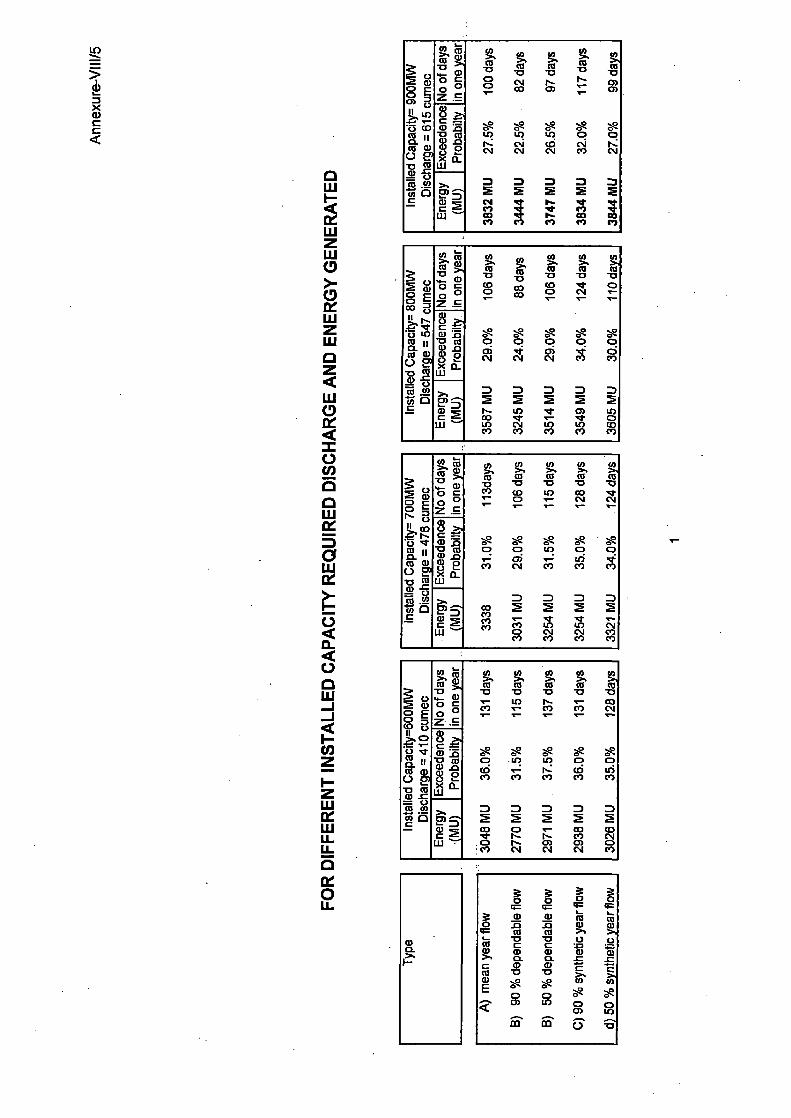
A) m
ean
y ear
flow
B) 5
0 %
depe
n dab
le fl
ow
B)
90 %
depe
n dab
le fl
ow
C)
90
% s
ynth
etic
year
flow
d) 5
0 %
sy n
thet
ic ye
ar fl
ow
Ann
exur
e-V1
11/5

O 0
0 a)
;171
0 1:11
M C
O OD
a) .0
C a) "a?.
O
.a3 co
C co
E
Annex
ure
-VI1
1/6
m ,..,_mom,...0 T- r-0100.,C41.0 a- 1,WgMODIO V T-TrODN mg4 • .
•
1-10050000000COMMOD NNNNNNNNN ,-,- 04 ,-NOOVVVOVV0707 CON001VVVVM!g c,103
0 0 tati
• WWWW WMCI3WW(Ct r..-010)1,[0-0)0.— NN ,— .—,— COMONNIMV ,-. 650 -C ).,c) ..... m 4) CA aa 0 0 Tr Tr Tr m m no CV 04 01 CV CV 1- 01 N Tr sr m co CD c4 cm CO oco NNNNNNNNNN1-. 0
Z15 .g „5 ,1,
C4 0 4) CC' C° C° 4) C° 4) 4) r" 0 0 CA Tr 0 0 LO CD LID T" 03 03 Ts. .- Tr .4. mo co s- g3 N cm cm cm cm [...1 Z.; Z.; fl F1 V N. up up 0 CD OD CD OD OD N N N OD 00 T/ sr ua 03 r" r- OD
te Eg Eg a; 2g Eg El g Eg 0 mo co — co uo CO at (,) 0 at U) at a" at OD 6) 4) OD 04 „ ,r ,r cm N r■ OD U) Tr Tr Tr 07 Tr Tr co co co co cy no m Tt Tr Tr Tr to ?„ co
Tr
C O
C
0
C
0 03 OD c, 05 0 CD CD co cy co co co r- co co r- co m co s- c4 c4 4-- 4- OD 03 0 01 N 0 Tr e" „ 4) CD CC) CD 1* co 0 U) U) V V Z1: 0 CD CO N N N N N r" N Tr sr aa co co c, 0 CV OD N 01 N N N CD 01 N T-
co u) r" r" C) UD CD 4) N N 03 U) cr o 03 OD u) CD 0 07 CV 03 OD N 00 00 CD 0 4) ° co U, CD 0) OD U) Tr N. U3 4) rlmNrottoTr 01 0 0 NNN CV 01 N N Tr 01 r■ 03 N CI 00 CD Nr cy 01 T:
to co N co sr Tr 4 CD CD W 00 0 CV n. r- co 03 r- OD 0 N" Tr m Tr cy m m m 01 CD CD r- 0 Eg g 4 ti cm p. F. CV cn c"r m aa 4r Tr Tr no co cy cv c4 CV 01 01 01 a" CI m Tr VNO r, c, cm r" CV N CV N CO r 07
cg..) 4, Eg <42 s 7 N. 0 00 V CI CO UD up 0 0.- OD OD 7t .1- 0 CO 11" `r c) 92 8 NN cm co co co Tr co co op T- N 0 co Tr Tr C7 CO CI Cg 07 00 CI N CV 07 VI at V' MI CO ,'"" OD
Tr
-0 oto o.0 og
o N c, cm N cm N ,.. CD 03 U7 V V V 07 0 01 N CV N 04 CV N N r" N 01 VVONV c71 g
13 )
CO co
• T E
c, mm
• N E >4
g g ,r'cr ov V V tiE, ;: V N. CO CV r" Ul T- OD 0 00 Cl 0 0 OD CI N. 7.1. a" CO ao CD 111 N. 03 1" m Ul OD OD r- Tr 4- r- co uo co 07 CD OD N N N 0 V V 00 CO at at OD N. 03 CD 01 04 03
co r■ 0 CO Tr C4 CV 01 01 Tr .
; NN CO N g NO M V N h0 0 0MNT-O c, op co ,o CO 0m OD 01 CD CD CD 4) r"VN0)."0000r-.0° 0").6. NMNN 4") 00C7DWCOM''°°N"PC° 1° C1 03 00 CV CV CV CV OD 01 OD :
C7 Eg 2; 2 ,sz E; un CO 00 07 Tr C) 00 0 r" 0 CO N Tr m F. co cm CO rr CI 03 CV N. N. 07 'V CD CV 0 U) OD r" CO r- CD 152 0, vc, g K, 63 63 Tr N rm 0 0 c73 Cp CO CO CD T". .: $2 $2 143 8 1,
07 0 0 CD ,,_ CO OD Tr CD 0 Tr r" r■ Tr 01 3 C) V ;2 71 g 6 a; 23 '12 ?? 0 U7 M r- CD CD CD 2g Eg Eg L„.12 to r- r, CD ,- CD OD V CI 01 T- 1- CV
co g N. N g Eg EN2 2; r N T CD CD OD N CV N r- 0 V N U7 03 03 03 07 CD 0 Ul OD OD OD 0 Tr t- 'r 4.- co Tr ua ua co s- 'm Lc1 Ci CO 43 4) q) N T' N 6) Om ro N CO 0 Tr 00 N CV N N 07 V OD N.
T g 2 v 0 E2 Eg Eg 2 Eig m — 0 r" M CV M r" 0) M r" r" 0" 0 r- .._ ._ fl, O 4, op CD CD r- CV CV CD OD CO CO CO CD CD U, Tr 04 CV 1- 1- T- T- C) . - . - - - N. C4 ID CID Up CD C4 Cr3 g
>, Oft.WMWMN 0000,Orl-N000
0 N LO
0
..-. IS Zr9. 01 i,1 V 00 Tr oa CO CD 03 01 03 OD 04 en CV rr N OD r- CD 6 = 0 N 0 07 0 CD CD Tr 0 A OM)( cn 03 03 cn mo up ea c4 4- s- ,- r)) ro N 0 0 T" LO r" N M c' t- m c) r- Is-
>, co r- ,_ co o N aa N co r- CO Tr cy co 43 4) 4) 000 4) N i:i V 1;12 (C1 R :3 P. . . m- -
E W g "'N"1"141"''gr31-2.'gc7ig4n,(28,10-;tizVac7sZcaPrTifIRii '15 CD ZI a- CD C4 a- p, m TA; m cm cm m oc
.c < ----
oc 1:)
Go cp
•
OD CO
N U) 1-• CD U7 r" 01 OD CD 0 a 0 0 0 CO 10 OD 0001 M CI OD ts CO at VI Z.; 0, CD Eg g Eg 8 Eg g N Eg 8 71. $2 6.2
co co to Tr CO N 0- 0 CO OD Tr cv s- CV 01 0 1D
c " „ „ tomman'iRc4commconcovcommTrmo Nt.„ 0 ,_,_,_„„. 0 vE8 c4791(.4 77) a) a) ecr 6) ‘2. Ei .15 dr co N 4) 4) ° C) C) CD OD 01 OD 03 03 CO CO CO m ,r ,r 0N0)0) ON0 MN r-T-r-
6 a 0) O.
•
> 0 C .0 0 4:c v1 0 Z 0 li 2

N O
C
Co C w 13 Co
Co Co
co
•
0 • m
E >
0 Co
Co 76
C N
O
to"
T
co
..o CD -o a
C Co
C
1/)
2i
uo
o co
;13
m
Z
5
Anne
xure
N11
1/7
6-* 1, ,c2 1,1`. g4 ,c14 N. 03 N. CD t. CI CD 0 CD N N 03 03 0,r"
el e4 e4 04 04 04 04 04 04 04 ,„ TO et TO 0 co It co co co CO CO CV 00 V C0a) V V CD CI) P.
CD 03 U3 CO OD 05 0 0 03 oa OD 00 T■ 0,2 , 0, CD TO 03 03 T" CD I, co y- n- CD N N N N N N cm N N N T- °D ° a' CO
'a Tr co co co N N `ZI g 53 0" 09 :3 2 ,- C4 - CI
cn 000 43 a) gi), 43 4) RI cy Tr co co cm N. N CD t■ r- Tr co mo cm T- r- QD OD t. CV n.C.3 C4 CO
N CV C4 CV C4 F.) Ei co 0'V co 01 N CV CV N N CI NN It 07 CO 03 co
CD CO 0 1.." 0 0 Tr oa co 03 co C3 03 C) CO N co Tr Tr 03 03 C) U) 0) 0) C4 01 n- t. tft r. 03 03 CON N Tr
2:71 Z'st, N N Eg CD OD It cr It IT 07 00 C4 N C4 CV N C4 00 CO CO st fs. c,4' 01 01
47 OD CO N
CD CO OD 03 0 0 CO 03 CD LO 07 r. CO C4 03 It 01 nt co co ca r- r. CV CD C4 rn Ls) 4 8 5 N C) C3 N. 113 u) Tr Tr co co co co cm co co C4 CV N 01 CI Tr cm C4 C4 C4 CV N C4 C4 C4 C4
0,, 03 g g ta g 8 2 p: F.2 23 N. 00 (.4 C0 T" CD O.4 07 CD OD OD N etN It CA CD CV V) nt 03 01 N CY „ „ „ „ „ „ C4 n r. C4 r. 43 4/ "1- Tr Tv co co Tr co 07 cs 07 07 C4 07 co Tr 0 It It CO CO
C) C6 C6 47 la CD r) 43 43 CO It CO CO T- co r- r- co T- T- co C3 CD 0. r- Tr CD 0 C4 0 t. 43 Eg NK) c' 43 4) 1. C3 t. C6 al oa CO us Tr Tr co co co co cm cm cm cm cm T- cm cm Tr Tr OD 03 03 33 04 0 C4 CO N C4 N 07 N
• OD C4 03 N 03 0 C4 C) g34 4. 4 gi Eg 171' 03 CO et F1 F)NNNN g!-Pii E3 ;71 " C4 (I) It 07 rs C4 eq
CD CO P■
QD al Ca a) " 4) 43 P CO N .d. CO CO C1 (0 CO CU CI CO N CO OCA N M 007 mr) CO C.° 43 43 N C6 43 C4 4/ cn U3 Tr Tr Tr co co cm cm cm cm CV CV CV CV V' CV 00 C7 07 Tr r- u) T.- T.- T.- C4 C4 N N C4 C4 N-
T7 CV 04 0
0 01 0 CO CV CM CO 01 0 03 CD U) CI t. 0) C4 02 Tr co Tr CU ca r- r- cm o cm T- co cn P. „ co N CI CO • CO N CO CD
c) Tr cD r. '0; to Tr Tr co co co co cm co ca cv cm cm es 07 Tr Tr in r- co N N CO 00 V) CO CO N N Tr
re Q
r- r,
- "
„ca 0"- 0° 0" „° N 0 N It (0 0 It It CO CO r. co r. „ 0 cn c-- CD C4 43 0 Et ............ oto mt. NCO NO) c.4.- 03 CO 0 n- 03 03 N. 0 0 o .7 l4 (42 ict c va ;
N OW) CD co 0 0 co 0 0 CO WT- cm.a. NT- coo Tr or-INocvoT- cor.cm ▪ s co co r■ Co O .c.• N N N 0.
01 0 .0. r, o, 0 co to co
Net CO CV 0) P. N. CO CO CO Wet VI CI N CO It CO CO OD CV N0 It U
co co E o)
Nm 14 8 4 r,-.3 is- 03 CM In 0/ et C4 It CO CD 4) 4) 0
CO N. S3 53 A ca t- ul V.. 0 ci,ch 4 03°' CON r9Nr N. g
g g 23 83 SS .8 S3 Eg t; 2.3 S3 13 A :.? 21 g S3 13,3 sg :I. Z7 g 0 53 Fl! C4 CO It - 03 Tr r. O) O_Or co OD U) CI
Tr 63 4/ U) '3. 6/ (.3 133 to co co co CO t. CV 07 03 V) oa T.- co cm cm cm r- co co r. 03 N CI CI CD
CO 8 z...; 2 T. 8 E; z? .,44 ;I cm N. to Tr 03 N CV C9 T' V' CV 00 N. cm cm to C) co OD N M IP 43 CO
CI >. C.) a)
a,
g 8 LO •-• VD r- 03 N CO.• CO Mn Ir. 1..■ CO 4,„ 4.•,„ 03 ,- N CO CO 0 CI 00 It Cc, 4; 03 0 C7 T- CV C4 0 CO 01 CO 00 C) co Tr N C4 r. CD CD CD CD CD CD T- T" C4 CO 0 CD 01 41 N. 0 CO CO 03 CV N CO
C) 'a!: CI 04 TO W etm 03 mW 01 03 OD CI CO C4 Ir CI 03 I" C) NMNCOO C4 0) 0 U) C4 C3 0 C° C) OT OT O 11..- C7 CD CD 0) nt C3 0 0) OD 03 CO CO CI CI 1". 00 CO ,, CO (,)
COu3 (I; C3 C4 OD CO 0 02 CD • P. , 03 CO INT 03 t■ CO t. OD ,r .- CV N 0.
0 04 Tr r- CD CD ,.. 03 0 0, 4, C4 m N. CD 41 r et 'U)C) T- Tr c, cy OD CO r- CO t. CI t■ N T- Nr 43 P... CD 4) 453 CI in
CO P: ts 0 03 cy 04 CD 02 07 t. P. WI 47 CO CO OD .1;7. ; 03
0 COof N U)COrr CD 41 t. CO 03 CD c, 00 o 03 04 00 erN WO ,r 0 2 53 %! g2 P?. 0 2 g ":" m c' " N- 43 a) ° ° a) 42 C) Z1 g
MCO
41 03 CD at U3 °3 03 0 C0 O3 10 03 V, U3 03 to Tr 23 8 c, r, 0 „_ „ 03 00 CO C) (oIt NCO 01 6, Fin 60 oc., v‘r 11) 0)N 0.) eo e0 a) 03 03 03 03 cc 4- CV CO 0 CVCNICID
rrr NM Tr Tr
C: CD Co 0 E
Co E
w
‹C
U) 25
c 3
•
Co 0. 0 •-j • co 0 • 0 2

DESIGN / DIMENSIONS OF SURGE SHAFT :
According to Thoma, for stability conditions of surge system, the limit cross-
sectional area of surge tanks with small amplitude is given as
F (Thoma) = n.l.f / 2g BHo ( Ref P- 177, high head plant Vol.1, EMIL
MOSONYI)
Where n= F.O.S = 1.5
I= length of tunnel= 29000 m.
f= Area of x-section of tunnel
=( x 12.52) = 122.79m2 4
B = Constant = YN2 Where
Y= Head losses upto surge tank= 33m say.
V= Q/A = 615 = 5.01 m/sec
122.79
B =33/(5.01)2 = 1.314
Ho = Net Head = 202-33 = 169 m.
f= x d2 H (m)
Y (m)
Ho V= q/f B= YN2 F Diameter of surge tank (m2) M/sec. (m2) (m)
122.79 202 33 169 5.01 1.314 1225.94 40.43
For great amplitudes, Thoma formula modified by Charles Jalger gives the critical
area as defined below( Ref P- 178, high head plant Vol.1, EMIL MOSONYI, 1960)
Fan = n* I . f 2g B Ho
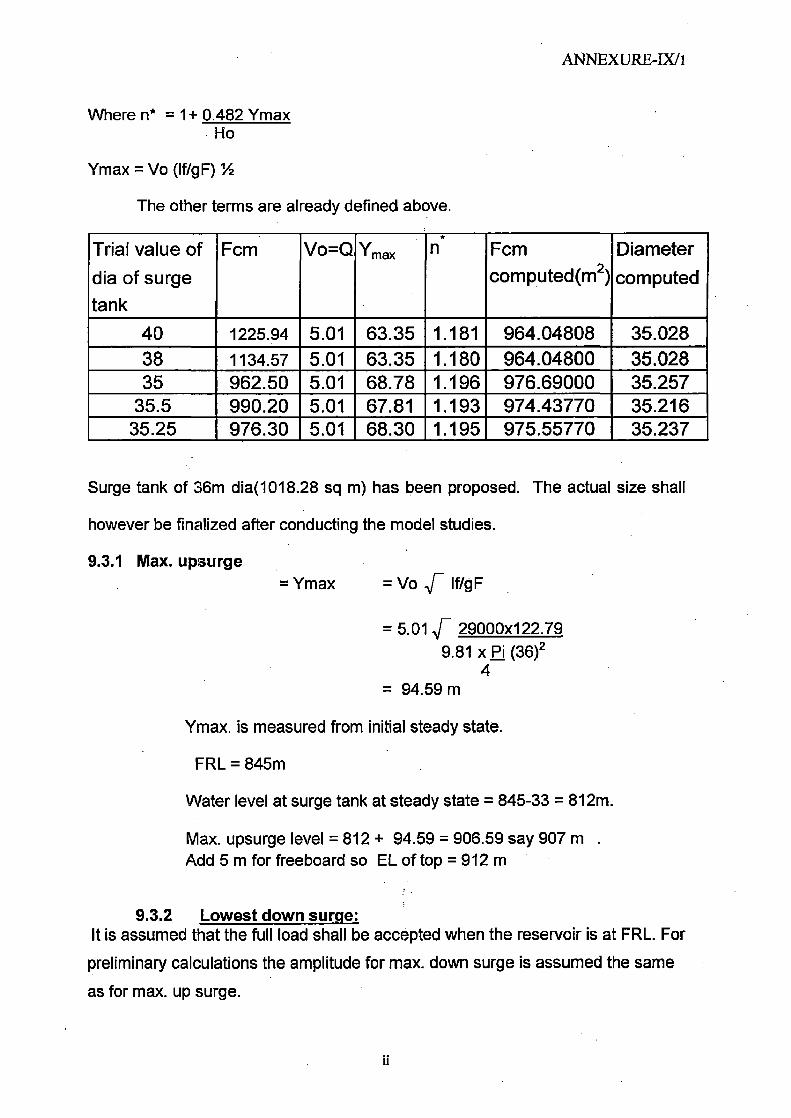
ANNEXURE-IX/i
Where n* = 1+ 0.482 Ymax Ho
Ymax = Vo (If/gF) 1/2
The other terms are already defined above.
Trial value of dia of surge tank
Fcm Vo=Q Ymax n Fcm computed(m2)
Diameter computed
40 1225.94 5.01 63.35 1.181 964.04808 35.028 38 1134.57 5.01 63.35 1.180 964.04800 35.028 35 962.50 5.01 68.78 1.196 976.69000 35.257
35.5 990.20 5.01 67.81 1.193 974.43770 35.216 35.25 976.30 5.01 68.30 1.195 975.55770 35.237
Surge tank of 36m dia(1018.28 sq m) has been proposed. The actual size shall
however be finalized after conducting the model studies.
9.3.1 Max. upsurge = Ymax = Vo If/gF
= 5.01r 29000x122.79 9.81 x Pi (36)2
4 = 94.59 m
Ymax. is measured from initial steady state.
FRL = 845m
Water level at surge tank at steady state = 845-33 = 812m.
Max. upsurge level = 812 + 94.59 = 906.59 say 907 m . Add 5 m for freeboard so EL of top = 912 m
9.3.2 Lowest down surge: It is assumed that the full load shall be accepted when the reservoir is at FRL. For preliminary calculations the amplitude for max. down surge is assumed the same as for max. up surge.
ii
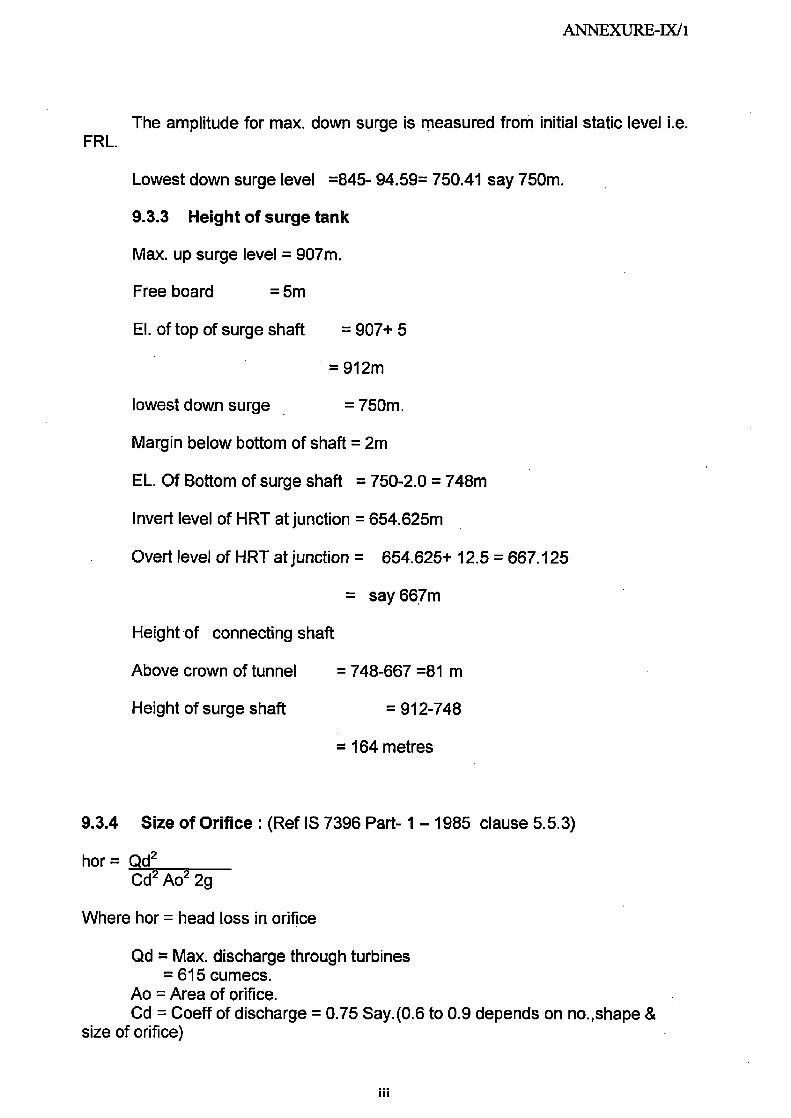
ANNEXURE-IX/1
The amplitude for max. down surge is measured from initial static level i.e. FRL.
Lowest down surge level =845- 94.59= 750.41 say 750m.
9.3.3 Height of surge tank
Max. up surge level = 907m.
Free board = 5m
El. of top of surge shaft = 907+ 5
= 912m
lowest down surge = 750m.
Margin below bottom of shaft = 2m
EL. Of Bottom of surge shaft = 750-2.0 = 748m
Invert level of HRT at junction = 654.625m
Overt level of HRT at junction = 654.625+ 12.5 = 667.125
= say 667m
Height of connecting shaft
Above crown of tunnel = 748-667 =81 m
Height of surge shaft = 912-748
= 164 metres
9.3.4 Size of Orifice : (Ref IS 7396 Part- 1 — 1985 clause 5.5.3)
hor = Qd2 Cd2 Ao2 2g
Where hor = head loss in orifice
Qd = Max. discharge through turbines = 615 cumecs.
Ao = Area of orifice. Cd = Coeff of discharge = 0.75 Say.(0.6 to 0.9 depends on no.,shape &
size of orifice)

ANNEXURE-IX/1
hor = (615)2 = 34271.15
0.752 x Ao2 x 9.81 x2 Ao 2
Z*+ 1 hf < hor < Z* + 3 hf. r 2 4 V-2 4
WHERE Z* = Surge height corresponding to change In discharge neglecting friction & orifice loss.
Vo ( L/g) X ( At/ AS)
5.01 .T(29000/9.81) X 122.79/1018.29= 94.6
Where At= area of HRT= 122.79, As= Area of surge shaft=1018.29.
[ 94.6+ 1 (33) ], < 34271.15 < [ 94.6 + 3 (33)] 1r 2 4 Ao2 r 2 4
or 75.15 < 34271.15 < 91.35 Ao2
By trial orifice dia. as 5.0 m satisfies the above eq.
Ao = Pi_(5.0)2 = 19.64 m2 4
Ao2 = 385.84 m2
75.15 < , 34271.15 < 91.35 385.84
75.15 < 88.82 < 91.35
Hence O.K.
Dia of orifice be kept as 5.0 m..
iv

ANNEXURE-IX/2
Design steps for Intake design ( as per IS 9761:1995)
Each intake is supossed to discharge of 769/6 = 128 cumecs FRL = 845 m
Assumed centre line of tunnel of intake = 816 m
Assume height of tunnel at gate opening= 6 m (say D)
Head = 32 m
maximum permissible velocity at gate opening = 0.12 X (2gH)0.5
.= 3.01 m/sec
discharge to pass by each intake = 128 cumecs
width of gate opening be = Q/v D
7.095 m
So velocity v = 3.007 m/ sec
Assuming that intake tunnel having slope of 1:50, e = 1.457 0.02544 radians
0.791 h2 - [ + 0.077 tang] D cos 6
So h1 = 4.58729 Heice h2 = 4.759 m
fid
Now he = h1+ h2 9.347 m
To avoid vortex formation (to check the air entrance in tunnel )
( i) Fr = v/ (gD)0.5 1/3
so Fr = 0.314 OK
(ii) As per USBR , water seal = 0.3 he = 2.80397 m
hence MDDL = 823.56 m (OK ,we are taking at 825 m)
= [ (1.21 tan2e +0.0847)°- s 1 + 1.10 tang ] D 2cose
1

ANNEXURE-IX/2
Profile of roof is given by
X 2 Y 2
(1.10)2 (0.291 ID)2 =1
Profile of side wall is given by
X 2 ± Y 2 (0.55 b e )2 (0.2143 be)2 = 1
So width of intake at face = width at gate opening + 2 b2
where b2 = 0.2143 be
so intake width = 10.14 m say 10.15 m
Hence invert level of intake = 811.241 m say 811.25 m

Design of Desiltinq Arrangement ANNEXURE-IX/3
Design to arrest the particles size grater then 0.2 mm Design discharge = 615 cumecs total discharge required including flushing = 615 / 0.8 = 768.75 cumecs
so flushing discharge = 153.75 ( 20% of total inflow) Average discharge= 691.88 No of chambers = 6 Average discharge through each chamber = 692 / 6 = 115.31 cumec
Let us take depth of flow = 28 Assume width of chamber 15 So Flow through velocity U = 0.2746 m/sec
Hence cross sectional area of each chamber= 420.00 sq m
hence U = 0.275 m/sec
Settling velocity w= 0.028 m/sec (using Sudry's curve, Masony,Page 36, vol-11,1960)
Now We w-wl where, ck;= aU and we is effective fall velocity And a= 0.132/A where h is depth of flow in m
= 0.0068 so We 0.021 m/sec
L = length of chamber = Uh/we = L= 363.46 m
As per Velikanov approach The settling length = A 2V20Ih-0.2)2/7.51XW2
so a= 1.0465 For this value of A, the Velikanov's curve gives an efficiency of 92.5%
again In order to achieve efficiency of 94 % A= 1.09 The settling length = 511.8 m
As per Camp's approach for efficiency, the two parameters to be used are worked out as below (wD3/6) / ( n U-Vg) = 4.0529 (wL) / ( UD ) = 1.3238
for above values curve gives efficiency of 100 %
Hence 6 chambers of 510 m length, 15 m width and 28 m deep should be provided

ANNEXURE-IX/4 DIMENSIONING OF POWER HOUSE
total capacity = 900 MW No of units= 6 unit capicity= 150 MW 150000 KW Max Head = 168 M Rated Head= 162 M Minim Head= 148 M
Trail specific Speed n's= 165 from fig 1 of Is 12008 part 1
Trail Synchoronus speed = n's*H1.25/(1.358*P)0.5 where P is power in KW
Trial Synchoronus speed in rpm (n') = 211 rpm
the rotational/synchronous/rated speed of the turbine in revolution per minute is
is determined from the formula as Rated speed in r. p. m., n = 60*f /p
where f =frequency incycles per second = 50 p= number of pairs of poles
The selection of rated speed by the above formula is subject to the following considerations: a) An even numer of pairs of poles should be preferred for the generator, through
standdard generators with odd number of pairs of poles are also available; and b) If the head is expected to vary less than 10% from the design head,the next greator:
speed should be chosen. A head varying in excess of 10% from the design head
suggests the next lower speed.
on account of heavy silt abrasion is apprehended then a lower value may be adopted.
Let us take no of pair of poles= 13
Synchoronus speed for 13 pairs of poles=
231 r p m Synchoronus speed for 14 pairs of poles=
200 r p m
let us take no of pair of poles= 15
As this is for run of the river devlopment so silt will more so adopt less speed as 200
Synchoronus speed for 15 pairs of poles= 200
so corrected specific speed= 156
SETTING OF TURBINE
In reaction turbine , the setting of turbine with respect of minimum tail water level
should be fixed from the consideration of cavitation. The suction height of distributor
centre line above the minimum tail water level can be determined from the following
formula.
Hs = Hv
1

ANNEXURE-IX/4 Hs = suction head in metres; Hb= Barometric pressure in metres of water column; Hv= Vapour pressure a = Thoma's cavitation coefficent , which can be obtained from Fig. 3
of IS 12800 part1 Here Hb= 10 M
Hv= 0.4 M CY = 0.09 from fig. 3 corresponding to specific speed of 156.22 (IS 12800_1)
So Hs= -4.98 With a further margin of 0.5 m , the center line of distributer should be set 4.98 + 0.5 = 5.48 metres below minimum tailrace level.
So EL of centre line of distributer = 639 - 5.48 = 632.52m (say 632.5 m) SIZE OF RUNNER
156.1823
The runner discharge diameter determined by the peripheral velocity coefficient K,
Discharge diameter , D3=60(2gH)0.5Ku/rrn Ku = Peripheral velocity coefficient whichh is defined as Ku = TrDnst60(2gH)0.5
H= 162 n= 200 Ku = 0.6 from fig. 6 corresponding to specific speed of 181.04 (is 12800_1) So D3= 3.229 m
156.182274
SPIRAL CASE Metallic spiral casing should be used for gross head generally above 30 meters.
DIMENSIONS OF SPIRAL CASE
As the gross head above the turbine is more than 30 meters , metallic spiral casing should be used, The main dimension of the spiral casing as determined in accordance with Fig. 8, 9 and 10 (of IS 12800 part I ) work out to be as shown below
A = 1 X 3.23 3.49 meters B = 1 X 3.23 .= 4.68 meters C = 2 X 3.23 5.30 meters D = 2 X 3.23 5.84 meters E = 1 X 3.23 .= 4.46 meters F = 2 X 3.23 .= 5.75 meters G = 2 X 3.23 4.84 meters H.= 1 X 3.23 .= 4.20 meters I = 0.21 X 3.23 0.68 meters L = 0.95 X 3.23 .= 3.07 meters M = 0.6 X 3.23 .= 1.94 meters
SIZE OF DRAFT TUBE

ANNEXURE-IX/4 SIZE OF DRAFT TUBE
The various dimensions of draft tube shown in Fig. As determined in accordance with IS 5496: 1969 should be as below:
Height of draft tube at exit end h= 0.94*D3 to 1.32*D3 As the specific speed of turbine is lower side,'h' will be on higher side.
Taking h=1.2*D3 Hence h = 3.875 Depth of draft tube H1 for Francis turbine = 2.5 to3.0 D3 Taking H1= 2.75D3 Hence H1= 8.88 Length of draft tube L = 4 to 5 D3 Taking L =4.5 D3 Hence L= 14.5 Clear width 'B' of the draft tube at exit end = 2.6 to 3.3 D3 Taking B = 3 D3, Hence B = 9.69
since the clear width of the draft tube is excessive, a pier of 1.5 meters width should be introdused in the centre of the draft tube. The total width thus . 11.1867 m (say 11.2 m)
Since power in KW = 9.8*Q*H*ri wher€ Q = discharge
H = rated head n = efficency of machine
Assuming efficency of machine to be 92% ie 0.92 Q= 102.6 cumecs so velocity at exit end of draft tube, Ve= 2.733 m/sec
In accordance with 2.5 of IS 5496: 1969, minimum submergence at the outlet end of draft tube should be greater than 0.3 metre, or
V2e/2g ie 0.381 m say 0.4 m.
Keeping bed slope 1 vertical to 10 horizontal at the bottom of the draft tube, the exit end of draft 1.45 meters above the bottom of draft tube.
1.453 .+ 3.874682 Hence top of exit end of draft tube will be 1.45 .+ 3.875 .= 5.328 meters above the bottOm of the draft tube.
Since height of draft - tube below centre line of guide apparatus is 8.879 meters and the centre line of guide apparatus it self is 5.48 metres below the minimum tail water level, the top of the exit end of draft tube will be 5.48 .+ 8.879 .- 5.327688 is = 9.032 meters below minimum tail water level, which is in order.
GENERATOR PARAMETERS
Air Gap Diameter 'Dg' Total number of pair of I 15 Rated KVA of generator = 166666.67
166667
3

ANNEXURE-1X/4 From Fig.15, Vr (peripheral rotor velocity)= 71 m/sec
Dg = 60*Vr / ( -en) = 6.78 m
Outer core diameter Do = Dg ( 1+-rr/2p)
where p is number of pair of poles 7.49 meters
Stator frame diameter Of Do + 1.2 metres
8.69 metres
Inner diameter of generator barrel Db Df+ 1.6 to 2.0 m 8.4863: 1.8
10.49 meters Outer diameter of generator barrel =12.0 m
Core length of stator 'Lc'=W/(KoDg2n) W= 166667 KVA
Ko= 6.8 from Fig. 16 ( IS 12800_1) hence Lc= 2.666 metres
say 2.66594 m
Length of stator frame 'Lf = Lc + 1.5 to 1.6 m hence Li 1-"' 4.16594 m
Axial hydraulic thrust Ph = KD3Hmax where
K Axial hydraulics thrust coefficient 0.15
D3= 3.2289 (discharge diameter in m) Hence Ph= 262.7 tonnes
Weight of generator rotor Wr = As Dg = 6.78 m
Wr/Lc = 175 ( Fig. 18 of IS 12800 Part 1)
hence Wr= 466.54 tonnes
Weight of turbine runner = 22 tonnes (from Fig. 19 of IS 12800 part 1)
Height of load bering bracket thf = Total weight of rotating part + axial thrust 357+18+238.7
751.27 tonnes let us provide 6 arms in bearing bracket Load on each 125.212 tonnes height of load bearing bracket hj = KDf0.5 (for suspended type of construction)
(KDg)0.5 (for umbrella type construction) K = 0.85 (Sec. 5.7.1 of IS 12800 part 1)
so hj= 2.50574 m for suspended type 2.40063 m for umbrella type
4

ANNEXURE-V/4 OVERALL DIMENSIONS OF POWER HOUSE
the extremities of scroll case 6.42552 the extremities of draft tube 5.59 the extremities of generator 6 as per section 7.2.2
the extremities of scroll case/draft tube/generator in longitudinal direction are at 6.425515 on spiral inlet side and 6.0 m on opposite side of the transverse centre line of the
machine. Adding 1.5 to 2 metres to these dimensions, the size of the unit bay in longit. direction or unit spacing work out to be 16 metres.
Length of erection bay = 0.7 to 1.5 times the unit bay size = 1.25 x 16 = 20 m
Space required for the EOT. crane to handle the last unit will depend upon the number and size of the crane. For preliminary purpose assuming it to be 3 to 5 metres (8 metres in the present case , as its proposed to provide two nos of EOT crane having 250 Tonne capacity each)
Total length of power house cavity = 124
From Fig. , the distance of the inner face of downstream columns from the longitudinal centre line of machine works out to be 6.0 + (1.5 or 2.0 m, say 1.5 m)=7.5 m
Distance of the inner face of upstream columns from the longitudinal centre line of machine = 6.5 ( extremity of draft-tube/scroll-case/ generator barrel ) + 4..0 ( For accommodating
control valve) + 2 m( for draft tube manhole) + 2 m (for Pressure relief valve)= 14.5 m
Hence Inner width of power house = 14.5 +7.5 = 22 m width of machine hall .= 25 m including columns.
Height of Machine Hall:-
Total height of machine = From the size of draft-tube as already calculated above,.H1= 8.87948 m And H2=Lf+hf+K As already calculated, Lf = 4.1659401 hj = 2.506 ( For suspended type machine ). K = 5.5 to 7.0, Say 6.0 m. ( As per IS 12800 Part 1)
H2= 4.166+2.5+6 = 12.7 Hence Total height of machine = 8.88 + 12.7 = 21.55 m
Total height of machine hall will depend upon type of foundation, height of E.O.T. crane, size of assemblies, type of roof and can be determined accordingly.

ANNEXURE-IX4 The maxamium possible length of generator unit = 2h1+Lf+ some length for coupling
.=2X2.505+4.166+3= 12.177
let assume (a) height of hook = 2 m (b) Head room/ Depth of E.O.T. crane= 2.5 m ( c) cleare distance between roof and E.O.T. crane= 0.5' (d) crown height as roof will be arch = 4 m
hence Height of Machine Hall = 42.729
say 43 metres EL of foundation of power house =632.5-8.8 = 624.7 m
6


