Embed Size (px)
Citation preview

October 14, 2016
Dear Audit, Compliance and Governance (ACG) Committee Members,
We look forward to our meeting on Friday, October 21st at the Connecticut Green Bank in Rocky
Hill from 8:00 a.m. to 9:00 a.m. We will discuss the following agenda items:
1. Proposed draft revisions to Green Bank Bylaws and Operating Procedures;
2. Proposed draft Comprehensive Annual Financial Report (CAFR);
3. 2016 Legislative and Regulatory Update;
4. FY 2016 Compliance Reporting;
5. Evaluation Framework: Societal Performance Economic Development Metrics; and
6. Updated Banking Resolutions.
The materials for the meeting can be found in the link to the Board of Director’s ACG package.
As always, please let me know if you have any questions.
Sincerely,
Brian Farnen
General Counsel & Chief Legal Officer

AGENDA
Audit, Compliance and Governance Committee of the Connecticut Green Bank
845 Brook Street Rocky Hill, CT 06067
Friday, October 21, 2016 – Special Meeting
8:00-9:00 a.m.
Staff Invited: George Bellas, Brian Farnen, Bryan Garcia, Bert Hunter, Matt Macunas and Eric Shrago
1. Call to order 2. Public Comments – 5 minutes
3. Approve Meeting Minutes for May 25, 2016 Regular Meeting* – 5 minutes
4. Discuss proposed draft revisions to Green Bank Bylaws and Operating Procedures** – 5
minutes
5. Discuss proposed draft Comprehensive Annual Financial Report (CAFR)** – 20 minutes
6. 2016 Legislative and Regulatory Update –5 minutes
7. Discuss FY 2016 Compliance Reporting – 5 minutes
8. Discuss Evaluation Framework: Societal Performance: Economic Development Metrics** – 5 minutes
9. Discuss Updated Banking Resolutions – 5 minutes**
10. Adjourn *Denotes item requiring Committee action ** Denotes item requiring Committee action and recommendation to the Board for approval
Join the meeting online at https://global.gotomeeting.com/join/351545757
Or call in using your telephone:
Dial +1 (872) 240-3412 Access Code: 351-545-757
Next Regular Meeting: Wednesday, May 24, 2017 from 8:30-9:30 a.m.
Connecticut Green Bank, 845 Brook Street, Rocky Hill, CT (Pending Approval from CGB BOD)

RESOLUTIONS
Audit, Compliance and Governance Committee of the Connecticut Green Bank
845 Brook Street Rocky Hill, CT 06067
Friday, October 21, 2016 – Special Meeting
8:00-9:00 a.m.
Staff Invited: George Bellas, Brian Farnen, Bryan Garcia, Bert Hunter, Matt Macunas and Eric Shrago
1. Call to order 2. Public Comments – 5 minutes
3. Approve Meeting Minutes for May 25, 2016 Regular Meeting* – Matt Ranelli - 5 minutes
Resolution #1
Motion to approve the minutes of the Audit, Compliance and Governance Committee meeting for May 25, 2016. Second. Discussion. Vote
4. Discuss proposed draft revisions to Green Bank Bylaws and Operating Procedures** – Brian Farnen -5 minutes Resolution #2
RESOLVED, that the Audit, Compliance, and Governance Committee hereby recommends to the Board of Directors of the Connecticut Green Bank approval of the revisions to the Green Bank Bylaws. RESOLVED, that the Audit, Compliance, and Governance Committee hereby recommends to the Board of Directors of the Connecticut Green Bank approval of the revisions to the Green Bank Operating Procedures, which shall be contingent upon no material or substantive revisions pursuant to the public notice and comment period under CT Gen Stat § 1-121. Discussion. Vote
5. Discuss proposed draft Comprehensive Annual Financial Report (CAFR)** – George Bellas and Marcum - 20 minutes Resolution #3
WHEREAS, Article V, Section 5.3.1(ii) of the Connecticut Green Bank (“Green Bank”) Operating Procedures requires the Audit, Compliance, and the Governance Committee (the “Committee”) to meet with the auditors to review the annual audit and formulation of

an appropriate report and recommendations to the Board of Directors of the Green Bank (the “Board”) with respect to the approval of the audit report; NOW, therefore be it: RESOLVED, that the Committee hereby recommends to the Board of Directors for approval the proposed draft Comprehensive Annual Financial Report (CAFR) contingent upon no further adjustments to the financial statements or additional required disclosures which would materially change the financial position of the Green Bank as presented. Discussion. Vote
6. Discuss IT Vendor Escalation Documentation* – Eric Shrago - 5 minutes Resolution #4
Motion to approve the IT Vendor Escalation Documentation. Second. Discussion. Vote
7. 2016 Legislative and Regulatory Update –5 minutes
8. Discuss FY 2016 Compliance Reporting – 5 minutes
9. Discuss Evaluation Framework: Societal Performance: Economic Development Metrics** – 5 minutes Resolution #5 RESOLVED, that the Audit, Compliance and Governance Committee hereby recommends to the Board of Directors for approval of the proposed draft Economic Development: Societal Performance documentation in the memo to the Department of Economic and Community Development of September 13, 2016 to support the Evaluation Framework. Second. Discussion. Vote
10. Discuss Updated Banking Resolutions – 5 minutes** RESOLUTION #6 RESOLVED, that Audit, Compliance and Governance Committee (the “Committee”) recommend that for any FDIC insured bank requiring a particular form of resolution of the Connecticut Green Bank (“Green Bank”) Board of Directors for opening a bank account or for other bank account matters, the President and CEO of the Green Bank is authorized to approve the form of such resolutions after review and approval by the General Counsel of the Green Bank, RESOLVED, the Committee recommends that upon such approval, each resolution is adopted and the Secretary or Assistant Secretary as applicable is authorized to certify the adoption of all such resolutions. RESOLVED, that the Committee recommends that the Board of Directors authorize the President and CEO to open such bank accounts as are necessary or desirable in the ordinary course of business for the Green Bank and any affiliates it controls that are in existence as of the date of this resolution or to be created by the Board of Directors including but not limited to:

CEFIA Holdings LLC
CT Solar Loan I LLC
CEFIA Services Inc.
CT Solar Lease 2 LLC
CGB Meriden Hydro LLC RESOLVED, that the Committee recommends that the Board of Directors authorize the following Green Bank employee positions to draw checks and initiate and release wire or ACH transfers from such accounts in accordance with the established signatory authority as stated in the Green Bank internal control procedures manual:
President and CEO
Vice President Finance and Administration
Executive Vice President and Chief Investment Officer
Vice President, Commercial and Industrial Programs
Managing Director, Statutory and Infrastructure Programs
Director of Operations RESOLVED, that the Committee recommends that the Board of Directors affirm that as of the date of this resolution these positions are occupied by the following individuals:
President and CEO - Bryan Garcia
Vice President Finance and Administration - George Bellas
Executive Vice President and Chief Investment Officer – Roberto Hunter
Vice President, Commercial and Industrial Programs – Michael Dykes
Managing Director, Statutory and Infrastructure Programs – Dale Hedman
Director of Operations – Eric Shrago
Secretary – Matthew Ranelli
11. Adjourn *Denotes item requiring Committee action ** Denotes item requiring Committee action and recommendation to the Board for approval
Join the meeting online at https://global.gotomeeting.com/join/351545757
Or call in using your telephone:
Dial +1 (872) 240-3412 Access Code: 351-545-757
Next Regular Meeting: Wednesday, May 24, 2017 from 8:30-9:30 a.m. Connecticut Green Bank, 845 Brook Street, Rocky Hill, CT
(Pending Approval from CGB BOD)

Audit, Compliance and Governance
Committee of the Connecticut Green
Bank
Agenda Item #1
Call to Order
October 21, 2016
Special Meeting
Audit, Compliance and Governance
Committee of the Connecticut Green
Bank
Agenda Item #2
Public Comments
October 21, 2016
Special Meeting

Audit, Compliance and Governance
Committee of the Connecticut Green
Bank
Agenda Item #3
Approval of Meeting Minutes of May 25, 2016
(Regular Meeting)
October 21, 2016
Special Meeting

Audit, Compliance and Governance
Committee of the Connecticut Green
Bank
Agenda Item #4
Discuss Proposed Draft Revisions to Green
Bank Bylaws and Operating Procedures
October 21, 2016
Special Meeting

Connecticut Green Bank Proposed Revisions to Bylaws
October 21, 2016
Special Meeting
Conform Board and Committee schedules set to our fiscal year, not calendar
year
Board meetings must be 6 times a year, but don’t have to be regularly scheduled
meetings
Delete section related to being within Connecticut Innovations, Inc. (CI) for
administrative purposes
Connecticut Green Bank Proposed Revisions to Operating Procedures
October 21, 2016
Special Meeting
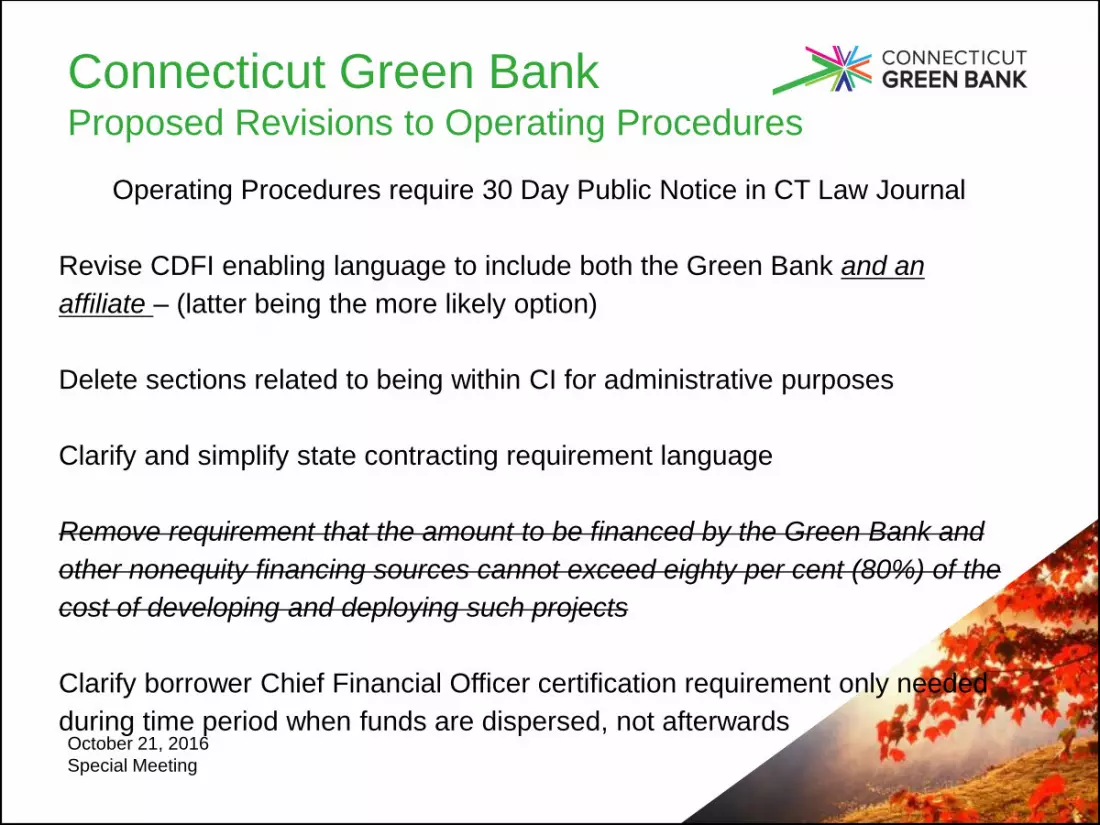
Operating Procedures require 30 Day Public Notice in CT Law Journal
Revise CDFI enabling language to include both the Green Bank and an
affiliate – (latter being the more likely option)
Delete sections related to being within CI for administrative purposes
Clarify and simplify state contracting requirement language
Remove requirement that the amount to be financed by the Green Bank and
other nonequity financing sources cannot exceed eighty per cent (80%) of the
cost of developing and deploying such projects
Clarify borrower Chief Financial Officer certification requirement only needed
during time period when funds are dispersed, not afterwards

Audit, Compliance and Governance
Committee of the Connecticut Green
Bank
Agenda Item #5
Discuss FY 2016 Draft Comprehensive
Annual Financial Report (CAFR)
October 21, 2016
Special Meeting

Results of Annual Financial Audit and Status of
2016 Comprehensive Annual Financial Report
(CAFR)
October 21, 2016
Special Meeting
• The draft 2016 CAFR is substantially complete. Three footnote disclosures
remain to be completed pertaining to program loans, financing activities, future
commitments and loan guarantees. No material changes to the net financial
position of the Green Bank is anticipated before the issuance of the CAFR to
the public.
• The structure, financial statement disclosures and financial statement statistics
presented in the 2016 draft CAFR are consistent with presentations made in
the 2015 CAFR.
• GFOA Certificate of Achievement in Financial Report update
• Blum Shapiro will now present the results of its financial audit of the Green
Bank and FY2016 Financial Highlights.

Audit, Compliance and Governance
Committee of the Connecticut Green
Bank
Agenda Item #6
2016 Legislative and Regulatory Update
October 21, 2016
Special Meeting

Connecticut Green Bank
2017 Legislative ConceptsPolicy Description Green Bank Role
Defense Defend our funding sources and potential cash sweeps Lead –Number one legislative priority
R-PACE Full policy, CGB administration Lead
C-PACE Technical tweak Lead
Local manufacturing incentive Remove an unused residential solar “kicker” incentive, and possibly replace with incentive for local labor. US-India trade dispute says an existing 5% kicker may be against WTO obligations.
Lead
Accessing low-cost federal capital Open our enabling statute to allow us to match USDA loan guarantee definitions for “eligible borrowers”
Lead, seek support of DEEP and also utilities and EEB. Necessity of this legislative change TBD.
Data Coordination Standardized definition for census tract data sources and “distressed communities” between CGB and EDCs. For statutory DEEP reporting in 16-245ee.
Defer to DEEP to lead. CGB support.
Lead By Example Performance contracting on state buildings has the potential to count against either the spending cap or bonding cap (or both).
Defer to DEEP to lead, with Treasurer’s Office. CGB support.
Anaerobic digester pilot expansion Others might propose more AD activity No – likelier to be either be DEEP or third party proposal if we see it
Renewable Thermal Technologies Policies that might flow from a 2016 draft Comprehensive Energy Strategy Support DEEP’s lead
Electric Vehicles Policies that might flow from a 2016 draft Comprehensive Energy Strategy Support DEEP’s lead
Grid 2.0 catch-all Policies that might flow from a 2016 draft Comprehensive Energy Strategy Support DEEP’s lead
Rate Design Fixed/variable charge type of debate Advocates lead – potential CGB support
October 21, 2016
Special Meeting

Audit, Compliance and Governance
Committee of the Connecticut Green
Bank
Agenda Item #7
Discuss FY 2016 Compliance Reporting
October 21, 2016
Special Meeting

Connecticut Green Bank FY 2016 Compliance Reporting
October 21, 2016
Special Meeting

Audit, Compliance and Governance
Committee of the Connecticut Green
Bank
Agenda Item #8
Draft Evaluation Framework: Societal
Performance: Economic Development Metrics
October 21, 2016
Special Meeting

Evaluation Framework“Big Picture” or Architecture
Evaluation Framework
Customer Data Privacy Policy
Data Collection and
Analysis Protocol
Smart-E Loan
C-PACE
Other
Societal Benefits
Energy
Energy Efficiency (PSD and SRS)
Renewable Energy (Power Clerk &
Locus)
Others (e.g., RTT, AFV and
Infrastructure)
Environment (DEEP)
CO2 Emissions (EPA AVERT)
Equivalencies (EPA AVERT)
Public Health (EPA COBRA)
Economy (DECD)
Investment
Direct, Indirect, and Induced Jobs
Others (e.g., GDP growth)

Evaluation FrameworkSocietal Perspective – Economy
Overview – updated prior
analysis done by Navigant
Consulting for DECD, CCEF,
and CEEF in 2009 and 2010.
Focus – specifically targeted the
products and services portion of
the RE/EE Value Chain with a
focus on investment leading to
direct, indirect, and induced jobs-
years.
Documentation – Final Report,
Calculator, CGB Request for
Approval, DECD Approval, and
Fact Sheet.
Next Step – use for FY 2017
CAFR

Evaluation FrameworkFY 2017 – Data Collection and Environment
Evaluation Framework
Customer Data Privacy Policy
Data Collection and
Analysis Protocol
Smart-E Loan
C-PACE
Other
Societal Benefits
Energy
Energy Efficiency (PSD and SRS)
Renewable Energy (Power Clerk &
Locus)
Others (e.g., RTT, AFV and
Infrastructure)
Environment (DEEP)
CO2 Emissions (EPA AVERT)
Equivalencies (EPA AVERT)
Public Health (EPA COBRA)
Economy (DECD)
Investment
Direct, Indirect, and Induced Jobs
Others (e.g., GDP growth)

Audit, Compliance and Governance
Committee of the Connecticut Green
Bank
Agenda Item #9
Discuss Updated Banking Resolutions
October 21, 2016
Special Meeting

Connecticut Green Bank Updated Banking Resolutions
Revised set of resolutions will authorize the President and CEO and the VP -
Finance and Administration to set up bank accounts when a need to do so arises
pursuant to:
• an applicable Board authorization and
• consistent with our governance documents
For the purposes of such things as the creation of a SPEor a loan program that
requires the establishment of a bank account.
October 21, 2016
Special Meeting

Audit, Compliance and Governance
Committee of the Connecticut Green
Bank
Agenda Item #10
Adjourn
October 21, 2016
Special Meeting

AUDIT, COMPLIANCE, & GOVERNANCE COMMITTEE OF THE
CONNECTICUT GREEN BANK
Draft Minutes – Regular Meeting
Wednesday, May 25, 2016
8:30 – 9:30 AM
A regular meeting of the Audit, Compliance, and Governance Committee (“Audit Committee”)
of the Board of Directors of the Connecticut Green Bank (the “Green Bank”) was held on May
25, 2016, at the office of the Connecticut Green Bank, 845 Brook Street, Rocky Hill, CT in the
Albert Pope Board Room.
1. Call to order: Mr. Ranelli, Chairperson of the Audit Committee, called the meeting to
order at 8:32 a.m. Audit Committee members participating: Matthew Ranelli, John
Harrity, & Patricia Wrice.
Staff Attending: Bryan Garcia, Brian Farnen (by phone), George Bellas, Bert Hunter,
Cheryl Samuels, Jane Murphy, and Eric Shrago.
2. Public Comments
There were no public comments.
3. Approve Meeting Minutes for December 4, 2015 Regular Meeting
Matt Ranelli requested that a typo be fixed listing him as T. Ranelli.
Upon a motion made by John Harrity, seconded by Pat Wrice, the
Committee unanimously approved the minutes from the December 4, 2015
meeting.
Resolution #1
Motion to approve the minutes of the Audit, Compliance and Governance Regular
Meeting for December 4, 2015
4. Review Audit RFP Process and Recommendation
George Bellas provided an overview of the Audit RFP Process. He stated that since the
Green Bank has used the same accounting firm to provide audit services for six
consecutive years we are statutorily obligated to change to a new accounting firm. He
explained that they received three proposals in response to the RFP. Based upon the
recommendation of the staff audit evaluation team that reviewed and scored each
response based upon a myriad of scoring factors, staff is recommending Blum Shapiro to
provide audit services for the fiscal years 2016 through 2018

Connecticut Green Bank: Audit, Compliance, & Governance Committee, May 25, 2016 Subject to changes and deletions
2
George Bellas explained that Blum Shapiro is familiar with the Green Bank and that the
audit evaluation team believes that they had the best overall response and that the hours
that they proposed make sense. Matt Ranelli advised that there is a large difference
between the hours estimated with Blum Shapiro and RSM. He questioned if it is a fixed
price. George Bellas explained that it is a fixed price.
Brian Farnen explained that with Jane Murphy on board in the position of Controller, this
should reduce the hours needed to complete the audit. George Bellas reiterated that
thought stating the process of preparing the necessary financial statements and schedules
should be more efficient..
Matt Ranelli questioned the sustainability and diversity responses. George Bellas
explained that sustainability accounting is an evolving area of practice in the accounting
field and the profession is developing standards, and individual firms are gaining
experience as the demand for such engagements grows. He explained that staff is
working with our current accounting firm, Marcum to develop a scope of engagement to
provide a report to the Green Bank on its internal data collection system used to develop
and report on sustainability metrics included in the annual CAFR. He explained that
right now there are no established reporting standards in the United States pertaining to
sustainability accounting. .
Bryan Garcia stated that this is a very new process and that once the Green Bank begins
issuing Green Bonds they must have accurate accounting for the use of proceeds in a
format required by the bond investors. He explained that they are defining how the
Green Bonds are going to be tracked and monitored in order to speak to the societal
benefit (e.g., GHG emission reductions). Matt Ranelli noted the challenges with
reporting emission reductions given that the REC goes into the Class I RPS. Bryan will
work with DEEP on the appropriate way to communicate the Connecticut Green Bank’s
contribution to emission reductions through its programs. Matt Ranelli also commented
that since this is a multiple year contract, the firm selected should be asked to report back
annually on their standing in the areas of diversity and sustainability. Staff agreed with
this view.
John Harrity stated that as for firm size and location Blum Shapiro is an excellent fit. He
stated that they are not too large, yet not too small, yet they seem large enough to handle
the complexity of the business of the Green Bank.
Matt Ranelli questioned if this was a three-year agreement. George Bellas stated that is,
but the Green Bank will only enter into a PSA with the firm for one fiscal year at a time.
During this three year period if the Green Bank determined a need to engage another firm
to perform the audit it could do so..
Matt Ranelli requested that they have a motion to approve Blum Shapiro, but asked staff
to reach out to Blum Shapiro requesting clarification and further information on some of
the terms and conditions that were discussed with staff during the meeting.

Connecticut Green Bank: Audit, Compliance, & Governance Committee, May 25, 2016 Subject to changes and deletions
3
Upon a motion made by John Harrity, and seconded by Pat Wrice, the
Committee voted unanimously in favor.
Resolution #2
RESOLVED, that the Audit, Compliance and Governance Committee hereby
recommends to the Board of Directors for approval of Blum Shapiro as the auditor of the
Connecticut Green Bank based on the Audit RFP review and evaluation process.
5. Review CT SL2 LLC audited financial statements issues May 11, 2016
George Bellas provided an overview of the audited financial statements of CT Solar
Lease 2 LLC, CTSL2. He explained that CT SL2 is required to engage an accounting
firm to issue an annual audit report on its financial statements which is to be distributed
to CT SL2’s equity investor and its creditors.. He explained that for the year ending
December 31, 2015the accounting firm engaged by CT SL2, Marcum, issued an
unqualified, “clean” opinion. Marcum also did not bring to management’s attention any
material weaknesses in internal accounting controls that needed to be corrected.. He did
advise that with the complexity of some of CT SL 2’s activities, staff had some
complicated accounting issues to work through, but that it took a team effort to work
through these challenges and complete the preparation of the financial statements in a
timely manner. He explained that the audit report was being presented to the Committee
for their review and to answer any questions they might have on CT SL2’s activities for
informational purposes and that he wanted to the Committee to see it.
Matt Ranelli advised that typically Marcum has always contacted the Committee
members individually. He explained that they did contact him to see if he had any
concerns. George Bellas noted that ordinarily staff would have circulated a draft of the
audit report in advance to obtain any comments from Committee members, but due to
time constraints involving the report issuance deadline, this effort was overlooked this
year. Staff will make sure the report is available sooner to the Committee next year to
give them the ability to review it before its issuance.
John Harrity stated that there has been remarkable growth between 2014 and 2015.
George Bellas stated that it has been a total team effort. Bert Hunter stated that revenues
will significantly accelerate in the months ahead and that the Committee is not seeing the
full revenue effect that they will see next year when a majority of the contracted revenues
will be in place for a complete year.
The Committee would like George Bellas and Bryan Garcia to extend appreciation on
behalf of the Board of Directors to Marcum for their services on prior audits of the Green
Bank.
Resolution #3

Connecticut Green Bank: Audit, Compliance, & Governance Committee, May 25, 2016 Subject to changes and deletions
4
RESOLVED, that the Audit, Compliance and Governance Committee hereby
recommends to the Board of Directors for approval the proposed CT SL2 LLC audited
financial statements issued May 11, 2016.
Second. Discussion. Vote
6. Modification of Internal Control Procedure CGB 101— Purchasing and Accounts
Payable, and CGB 102 – Consulting and Advisory Services to reflect the hiring of
Eric Shrago, Director of Operations, to replace Mackey Dykes, COO
George Bellas welcomed Eric Shrago as Director of Operations to replace Mackey
Dykes. Bryan Garcia explained that it had been a very competitive hiring process. He
explained that Eric was the perfect fit for the position.
Matt Ranelli asked Eric Shrago to provide a bit of his background. Eric Shrago stated
that he was at Goldman Sachs for just over nine years. He explained that he had spent a
lot of his career building new business. He stated that he had left Goldman Sachs in 2011
and went to a financial tech firm. He explained that he decided to pursue his Masters at
Columbia. He explained that he had graduated in May 2015 and spent about nine months
doing consulting on his own.
George Bellas explained that Mackey Dykes has moved on to manage Commercial,
Industrial, and Institutional Programs. He requested that the Committee replace Mackey
Dykes name with Eric Shrago on purchasing, accounts payable, consulting and advisory
services, and on credit cards. He requested that the Committee approve these changes
and recommend them to the Board.
Upon a motion made by Pat Wrice, seconded by John Harrity, the
Committee voted unanimously in favor of the changes.
Resolution #4
RESOLVED, that the Audit, Compliance and Governance Committee hereby
recommends to the Board of Directors for approval the proposed revisions to the current
internal accounting control policies.
7. Review Draft Evaluation Framework and Recommendation
Bryan Garcia provided an overview of the Draft Evaluation Framework and
Recommendation. He stated that they are developing their own systems to collect
information on projects that the Connecticut Green Bank supports. He explained that in
some cases they monitor the performance of projects over time. He explained, that in the
past, that they have not had a formal evaluation framework to work from. He explained
that they are going to have to have this foundation when they move into the Green Bond
world in order to account for use of proceeds and to track and monitor system
performance.

Connecticut Green Bank: Audit, Compliance, & Governance Committee, May 25, 2016 Subject to changes and deletions
5
Bryan Garcia explained that Andy Brydges was the lead on this, but when Andy left in
March Bryan Garcia took over the lead. He explained that through an RFQ process in
2013, that they have decided on a company, Opinion Dynamics and Dunsky Energy
Consulting to assist them in developing the framework.
Bryan Garcia explained what the evaluation framework is and isn’t. . He explained that
the Connecticut Green Bank is very critical of assessing its impact, and that the
evaluation framework is a management tool for the organization in helping to constantly
look at how it is performing to targets. He explained that this is going to be an ongoing
data integration system, less driven by incentives and less punitive. It will be more
focused on their mission of doing more of what the Connecticut Green Bank does as an
organization.
Bryan Garcia explained the process framework and that they will look at the market
potential (e.g., total available market), what are the key performance indicators, what data
are they collecting and analyzing, as well as what human and financial resources are
being devoted to products and programs through the annual budget and accounting
processes. He explained that they report out impact through the non-financial statistics
section of the CAFR. He explained that they will look at how the Connecticut Green
Bank measures its social impact.
Bryan Garcia explained that on the efficiency side data collection is estimated, but
renewables can be metered. On the environmental side he explained that they are
working with DEEP on how to collect and analyze data on clean energy and what the
associated greenhouse gas emissions and criteria pollutant reductions are. He explained
that historically EPA data has been used through e-Grdi, but not they are transitioning to
AVERT. He explained that DEEP suggested that the Connecticut Green Bank use the
EPA AVERT tool.
Matt Ranelli questioned how the REC’s are being handled. Bryan Garcia stated that the
Connecticut Green Bank is helping Connecticut to hit meet its Class I RPS through the
installation of instate clean energy projects. Matt Ranelli questioned if this accounts for
the REC’s being sold back into the market. Bryan Garcia advised that it does not and
noted that he will work with DEEP through the process to properly communicate this.
Matt Ranelli requested a modified resolution to provide comments prior to the Board
Meeting, conditioned on whatever comments that they might have.
Upon a motion made by John Harrity, seconded by Pat Wrice, the
Committee voted unanimously to approve the modified resolution.
Resolution #5
RESOLVED, that the Audit, Compliance and Governance Committee provides a
conditional recommendation to the Board of Directors for approval of the proposed draft
Evaluation Framework subject to written comments from the members of the Committee
before the next Board of Directors meeting.

Connecticut Green Bank: Audit, Compliance, & Governance Committee, May 25, 2016 Subject to changes and deletions
6
8. 2016 Legislative and Regulatory Update
Brian Farnen provided an overview of the Legislative and Regulatory update. He
explained that it had been an overall successful session. Brian explained that Green Bank
offered a suite of legislative proposals, and also worked to defend its operating budget by
educating policymakers on the negative impact of fund sweeps on the Green Bank and
our unique model. He explained that there had been four overall that needed to be
addressed. They were (1) technical changes to the Solar Home Renewable Energy Credit
(“SHREC”) policy to enable master purchase agreements to proceed, (2) a technical fix to
the C-PACE enabling statute, (3) a redraft of the Green Bank’s authorizing statute so that
it is not within Connecticut Innovations (“CI”) for administrative purposes and allows for
direct access to the same powers, and (4) overhauls the existing Residential PACE (“R-
PACE”) statute to operationalize the program
He explained that he had met with the Majority and Minority Leaders in the House and
Senate, all the statewide constitutional offficers and that we were going to continue that
outreach.
Brian Farnen discussed three bills that were combined into one related to the Connecticut
Green Bank Administrative Authority plus the technical fixes to CPACE and SHREC.
He explained that as a result of the passage of the bill, the Green Bank is no longer within
Connecticut Innovations for administrative purposes. He also provided clarification on
the SHREC. He stated that the Green Bank and the electric utilities needed this
legislative change to move forward with implementation of the SHREC legislation from
last year.
Brian Farnen discussed RPACE explaining that staff wanted to enact residential PACE,
similar to what was done on the Commercial PACE side. He explained that the Green
Bank is making progress, but that the biggest hurdle is with FHFA, and the bill failed to
achieve passage in this year’s session.
Matt Ranelli requested that the rate design issue be brought back for discussion at the
next meeting of the ACG Committee.
9. Discuss FY 2016 Compliance Reporting
To be taken up next time.
10. Discuss Board Member Appointments Ending During FY 2016
To be taken up next time.
11. Discuss Draft Succession Plan

Connecticut Green Bank: Audit, Compliance, & Governance Committee, May 25, 2016 Subject to changes and deletions
7
Matt Ranelli noted that Bryan Garcia should check to see if senior staff indeed are likely
to stay over the long-term as was stressed in the document with all of the “D’s” in the
table. Bryan Garcia requested that if the Committee members had additional comments,
they can send them to him prior to June 10th. The Succession Plan will be discussed at a
future meeting of the Board of Directors.
12. Adjourn
Upon a motion made by John Harrity, seconded by Pat Wrice, the Audit
Committee members voted unanimously in favor of adjourning the May 25,
2016 meeting at 9:38 a.m.
Respectfully Submitted,
Matthew Ranelli, Chairperson of the Audit,
Compliance, and Governance Committee

Memo
To: Audit, Compliance & Governance Committee of the CGB Board of Directors
From: Brian Farnen, General Counsel and Chief Legal Officer
CC: Bryan Garcia, Suzanne Kaswan and Eric Shrago
Date: October 21, 2016
Re: Proposed Draft Revisions to Green Bank Bylaws and Operating Procedures
The Bylaws and the Operating Procedures of the Connecticut Green Bank have been revised for the Audit, Compliance & Governance (ACG) Committee’s review and consideration.
Proposed revisions to Bylaws:
Conform Board and Committee schedules set to our fiscal year, not calendar year
Board meetings must be 6 times a year, but don’t have to be regularly scheduled meetings
Delete section related to being within Connecticut Innovations, Inc. (CI) for administrative purposes
Proposed Revisions to the Operating Procedures:
Revise CDFI enabling language to include both the Green Bank and an affiliate – (latter being the more likely option)
Delete sections related to being within CI for administrative purposes
Clarify and simplify state contracting requirement language
Remove requirement that the amount to be financed by the Green Bank and other nonequity financing sources cannot exceed eighty per cent (80%) of the cost of developing and deploying such projects
Clarify borrower Chief Financial Officer certification requirement only needed during time period when funds are dispersed, not afterwards
Please note that both documents require a 2/3rds majority of the Board of Directors after the ACG
Committee recommends approval. The Operating Procedures must also go out for public notice for thirty
days in the Connecticut Law Journal pursuant to CT Gen Stat § 1-121. If we receive any material or
substantive comments pursuant to this public notice, we will bring back any worthy revisions for
consideration to the ACG Committee for review and approval before final review and consideration by the
Board which will occur after the public comment period.

Resolution
RESOLVED, that the Audit, Compliance, and Governance Committee hereby recommends to the
Board of Directors of the Connecticut Green Bank approval of the revisions to the Green Bank
Bylaws.
RESOLVED, that the Audit, Compliance, and Governance Committee hereby recommends to the
Board of Directors of the Connecticut Green Bank approval of the revisions to the Green Bank
Operating Procedures, which shall be contingent upon no material or substantive revisions
pursuant to the public notice and comment period under CT Gen Stat § 1-121.

1
CONNECTICUT GREEN BANK
BYLAWS
PURSUANT TO
Section 16-245n of the
Connecticut General Statutes
Adopted: June October 17, 201521, 2013
Revised: October 17, 2014[ ]

2
ARTICLE I
NAME, PLACE OF BUSINESS
1.1. Name of the Green Bank. The name of the Green Bank shall be, in accordance with the
Statute, the "Connecticut Green Bank".
1.2. Office of the Green Bank. The office of the Green Bank shall be maintained at such
place or places within the State of Connecticut as the Board may designate.
ARTICLE II
BOARD OF DIRECTORS
2.1. Powers. The powers of the Green Bank are vested in and exercised by a Board of
Directors which may exercise all such authority and powers of the Green Bank and do all
such lawful acts and things as are necessary to carry out the Comprehensive Plan and the
purposes of the Green Bank as provided in the Resolution of Purposes, or as are
otherwise authorized or permitted by the Statute or other provisions of the General
Statutes, including the authorization of expenditures and use of funds from the Clean
Energy Fund created by Section 16-245n(c) of the General Statutes, formerly known as
the Renewable Energy Investment Fund, and the Green Connecticut Loan Guaranty Fund
created by Section 16a-40f(b) of the General Statutes.
2.2. Chairperson. The Chairperson of the Board shall be appointed by the Governor. The
Chairperson shall perform the duties imposed by the Statute, these Bylaws, and by
resolution of the Board, and shall preside at all meetings of the Board which he or she
attends. At each meeting the Chairperson shall submit such recommendations and
information as the Chairperson may consider appropriate concerning the business, affairs,
and policies of the Green Bank. The Chairperson shall serve at the pleasure of the

3
Governor but no longer than the term of office of the Governor or until the Chairperson’s
successor is appointed and qualified, whichever is longer.
2.3. Vice Chairperson. The Board shall elect from its members a Vice Chairperson. The
Vice Chairperson shall perform the duties imposed by the Statute, these Bylaws, and by
resolution of the Board. In the absence or incapacity of the Chairperson, the Vice
Chairperson shall perform all the duties and responsibilities of the Chairperson. In the
absence or incapacity of the Vice Chairperson, or in case of his or her resignation or
death, the Board shall elect its members an acting Vice Chairperson during the time of
such absence or incapacity or until such time as the Board shall elect a new Vice
Chairperson. The Vice Chairperson shall serve until a successor is elected by the Board.
2.4. Secretary. A Secretary may be elected by the Board. The Secretary shall perform the
duties imposed by the Statute, these Bylaws, and by resolution of the Board. In the
absence or incapacity of the Secretary, or in case of a resignation or death, the Board
shall elect from their number an acting Secretary who shall perform the duties of the
Secretary during the time of such absence or incapacity or until such time as the Board
shall elect a new Secretary. The Secretary shall serve until a successor is elected by the
Board.
2.5. Delegation of Powers. The Board may, by resolution, delegate to the President or other
officers of the Green Bank such powers of the Green Bank as they believe are necessary,
advisable, or desirable to permit the timely performance of the functions of the Green
Bank and to carry out the plans, policies, procedures, and decisions of the Board, except
that such delegation shall not include any duties or responsibilities required by the Statute

4
or these Bylaws to be performed by the Chairperson or the Board or otherwise in conflict
with law.
2.6. Directors. The Directors shall be appointed and serve as provided in the Statute.
ARTICLE III
OFFICERS AND EMPLOYEES
3.1. Officers. The Board shall have the power to create positions for such officers as it may
deem to be in the interests of the Green Bank, and shall define the powers and duties of
all such officers. All such officers shall be subject to the orders of the Board and serve at
its pleasure. Such officers shall include a President and may include a Director of Finance
and Chief Investment Officer, a General Counsel and such other officers as the Board
may determine to be appropriate. The Board shall be responsible for determining or
approving compensation for each officer.
3.2. President. The Board shall hire a President. The President shall be the chief executive
officer of the Green Bank and shall have such duties and responsibilities as may be
determined by the Board, except that the duties and responsibilities of the office of
President shall not include those required by the Statute or these Bylaws to be performed
by the Chairperson or the Board or otherwise in conflict with law. The President shall be
a non-voting, ex officio member of the Board pursuant to the Statute. The Board may
delegate to such other person or persons all or part of the duties of the President. The
President may, with the approval of the Board, assign or delegate to the officers and
employees of the Green Bank any of the powers that, in the opinion of the President, may
be necessary, desirable, or appropriate for the prompt and orderly transaction of the
business of the Green Bank.

5
3.3. Acting President. The Board may, by resolution adopted by a majority vote, appoint
some other person to serve as Acting President and perform the duties of the President in
the event of the death, inability, absence, or refusal to act of the President. The Acting
President shall be subject to all of the same restrictions placed upon the President.
3.4. Chief Investment Officer. The Board may appoint a Chief Investment Officer (CIO).
The CIO shall have such duties and responsibilities as may be determined by the Board,
except that the duties and responsibilities of the office of CIO shall not include those
required by the Statute or these Bylaws to be performed by the Chairperson or the Board
or otherwise in conflict with law. The CIO shall not be a Director.
3.5. General Counsel. The Board may appoint a General Counsel. The General Counsel shall
be the chief legal officer of the Green Bank and shall have such duties and
responsibilities as may be determined by the Board, except that the duties and
responsibilities of the office of General Counsel shall not include those required by the
Statute or these Bylaws to be performed by the Chairperson or the Board or otherwise in
conflict with law. The General Counsel shall not be a Director.
3.6. Additional Officers and Other Personnel. The Green Bank may from time to time
employ such other personnel as it deems necessary to exercise its powers, duties, and
functions pursuant to the Statute and any and all other laws of the State of Connecticut
applicable thereto. The President shall develop a staffing plan which shall include
without limitation a chart of positions and position descriptions for the Green Bank,
personnel policies and procedures, and related compensation levels. Such staffing plan
may provide for officers of the Green Bank in addition to those specifically provided for
in these Bylaws, and the appointment of such officers shall be in the discretion of the

6
President, except as the Board may otherwise determine. The President shall deliver the
staffing plan to the Budget and Operations Committee for its review and approval
pursuant to Article V, Section 5.3.2 hereof.
3.7. Signature Authority; Additional Duties. The President and officers of the Green Bank
shall have such signature authority as is provided in the Green Bank’s Operating
Procedures, and as may from time to time be provided by resolution of the Board. The
officers of the Green Bank shall perform such other duties and functions as may from
time to time be required.
ARTICLE IV
BOARD MEETINGS
4.1. Regular Meetings. Regular meetings of the Board or any Committee for the transaction
of any lawful business of the Green Bank shall be held in accordance with a schedule of
meetings established by the Board or such Committee, provided that the Board shall meet
at least six (6) times per calendar fiscal year through either a regularly scheduled or
special meeting.
4.2. Special Meetings. The Chairperson may, when the Chairperson deems it expedient, call
a special meeting of the Board for the purpose of transacting any business designated in
the notice of such meeting. The Committee Chair of any Committee may, when the
Committee Chair deems it expedient, call a special meeting of such Committee for the
purpose of transacting any business designated in the notice of such meeting.
4.3. Legal Requirements. All meetings of the Board or any Committee shall be noticed and
conducted in accordance with the applicable requirements of the Statute and the
Connecticut Freedom of Information Act, including without limitation applicable
7
requirements relating to the filing with the Secretary of the State of any schedule of
regular meetings and notices of special meetings, meeting notices to Directors and
Committee members, public meeting requirements, the filing and public availability of
meeting agenda, the recording of votes and the posting or filing of minutes, the addition
of agenda items at any regular meeting, and the holding of any executive session.
4.4. Order of Business. The order of business of any meeting of the Board or any Committee
shall be as set forth in the agenda for such meeting, provided that the Board or
Committee may vary the order of business in its discretion.
4.5. Organization.
4.5.1. At each meeting of the Board, the Chairperson, or in the absence of the
Chairperson, the Vice Chairperson, or in the absence of both, a Director chosen
by a majority of the Directors then present, shall act as Presiding Officer. The
Secretary, or a staff member designated by the President, shall prepare or direct
the preparation of a record of all business transacted at such meeting. Such
record when adopted by the Directors at the next meeting and signed by the
Chairperson or the Secretary shall be the official minutes of the meeting.
4.5.2. At each meeting of a Committee, the Committee Chair, or in the absence of the
Committee Chair any other Committee member designated by the majority of
the Committee members then present, shall act as Presiding Officer. The
President, a staff member designated by the President, or any Committee
member chosen by the Presiding Officer, shall prepare or direct the preparation
of a record of the business transacted at such meeting. Such record when
adopted by a majority of the Committee members in attendance at the next

8
meeting and signed by the Committee Chair shall be the official minutes of the
Committee meeting.
4.6. Attendance. A Director or a member of a Committee may participate in a meeting of the
Board or of such Committee by means of teleconference, videoconference, or similar
communications equipment enabling all Directors and Committee members participating
in the meeting to hear one another, and participation in a meeting pursuant to this Section
shall constitute presence in person at such a meeting. Directors or their designees who
miss more than three (3) consecutive meetings shall be asked to become more active on
the Board. In the event of further absence, the Board may decide by majority vote to
recommend to the appointing authority that the appointment be reconsidered.
4.7. Quorum.
4.7.1. A majority of the Directors then in office shall constitute a quorum for the
transaction of any business or the exercise of any power of the Green Bank.
4.7.2. A majority of the Director-members of a Committee shall constitute a quorum,
provided that, except in the case of an advisory committee, such quorum shall
consist of a minimum of three (3) Directors, at least one (1) of which shall not
be a State employee.
4.8. Enactment. When a quorum is present, an affirmative vote of a majority of Directors in
attendance at Board or Committee meetings shall be sufficient for action, including the
passage of any resolution, except as may otherwise be required by these Bylaws or
applicable law. Non-Director members of any Committee may participate in the
Committee’s discussions and deliberations and may join in the Committee’s
recommendations to the Board, but shall not have a vote on any matters as to which the

9
Committee is exercising the powers of the Board, including without limitation, any
funding decisions.
4.9. Designation of Substitutes for Directors. If authorized by the Statute, then a Director
may appoint a designee to serve as the Director’s representative on the Board with full
power to act and to vote on that Director’s behalf. For the purposes of maintaining
consistency and efficiency in Board matters, alternating attendance between the Director
and his or her designee is strongly discouraged. If not authorized by statute, then a
Director may not name or act through a designee. An authorized appointment of a
designee shall be made by filing with the Board a short bio of the designee, the
designee’s CV, and a certificate substantially similar to the following:
"Certificate of Designation
I, ____________________________, a member of the Board of Directors of the
Connecticut Green Bank, do hereby designate __________________ [Name & Title] to
represent me at the meetings of the Board or committees thereof with full powers to act
and vote on my behalf. This designation shall be effective until expressly revoked in
writing.
_________________________________________
[Name]"
ARTICLE V
COMMITTEES
5.1. Delegation Generally. The Board may delegate any and all things necessary or
convenient to carry out the purposes of the Green Bank to three (3) or more Directors,
provided that at least one (1) of which shall not be a State employee, and, to the extent of

10
powers, duties, or functions not by law reserved to the Board, to any officer or employee
of the Green Bank as the Board in its discretion shall deem appropriate.
5.2. Appointments; Quorum; Transaction of Business; Recordkeeping.
5.2.1. Appointments. The Chairperson shall appoint all Committee Chairs. The
Committee Chair need not be a Director on the Deployment Committee any ad
hoc committee, or an advisory committee.
5.2.2. Quorum. If necessary to achieve a quorum at any meeting of a Committee
other than an advisory committee, then the Chairperson or the Vice Chairperson
may sit, participate, and vote as an alternate member of such committee at such
meeting.
5.2.3. Report of Committee Actions. Each Committee shall report to the Board on
such Committee’s actions and activities at the regular Board meeting next
following each Committee meeting.
5.2.4. Recordkeeping. Committee recordkeeping shall be in accordance with Article
IV, Section 4.5.2 hereof.
5.3. Standing Committees. The Green Bank shall have four (4) Standing Committees of the
Board consisting of an Audit, Compliance, and Governance Committee, a Budget and
Operations Committee, a Deployment Committee, and a Joint Committee of the Energy
Conservation Management Board and the Connecticut Green Bank. Each Standing
Committee may form subcommittees in its discretion, but no such subcommittee shall
exercise powers of the Board unless authorized by the Board to do so.
5.3.1. Audit, Compliance, and Governance Committee. The Audit, Compliance,
and Governance Committee shall consist of no less than three (3) Directors

11
appointed by the Chairperson on a biennial basis, at least one (1) of which shall
not be a State employee. The principal functions, responsibilities, and areas of
cognizance of the Audit, Compliance, and Governance Committee shall be as
follows: (i) recommendation to the Board as to the selection of auditors; (ii)
meetings with the auditors to review the annual audit and formulation of an
appropriate report and recommendations to the Board with respect to the
approval of the audit report; (iii) review of the audit and compliance findings of
the Auditors of Public Accounts, and meetings with the staff auditors there as
appropriate; (iv) review with the auditors, President, and senior finance staff of
the adequacy of internal accounting policies, procedures and controls; (v)
review of the sufficiency of financial and compliance reports required by
statute; (vi) recommendation to the Board as to the selection of the Green
Bank’s ethics liaison and ethics compliance officer(s); (vii) review of the
adequacy of employee education and training on ethics and related legal
requirements; (viii) review and approval of, and in its discretion
recommendations to the Board regarding, all governance and administrative
matters affecting the Green Bank, including but not limited to matters of
corporate governance, corporate governance policies, committee structure and
membership, management qualifications and evaluation, and Board and
Standing Committee self-evaluation; (ix) oversight of the Green Bank’s legal
compliance programs, including but not limited to compliance with state
contracting and ethics requirements; (x) management succession planning; (xi)
oversight of any Director conflict of interest matters; (xii) as-needed review of

12
any staff recommendations to the Board regarding the Green Bank’s regulatory
or policy initiatives including but not limited to the Comprehensive Plan and
other clean energy regulatory or policy evidentiary matters before the Public
Utilities Regulatory Authority and other state and federal commissions and
tribunals that may affect clean energy development and/or the Green Bank’s
statutory mandate; (xiii) acting as a resource to the appointing authorities with
respect to the identification and recruitment of qualified and interested private
sector Director candidates; and (xvi) the exercise of such authority as may from
time to time be delegated by the Board to the Audit, Compliance, and
Governance Committee within its areas of cognizance.
5.3.2. Budget and Operations Committee. The Budget and Operations Committee
shall consist of no less than three (3) Directors appointed by the Chairperson on
a biennial basis, at least one (1) of which shall not be a State employee.
Additionally, the Chairperson or the Vice Chairperson shall be a non-voting ex
officio member of the committee, subject to the provisions of Article V, Section
5.2.2 hereof. The principal functions, responsibilities, and areas of cognizance
of the Budget and Operations Committee shall be as follows: (i) to recommend
and monitor compliance with prudent fiscal policies, procedures, and practices
to assure that the Green Bank has the financial resources and financial strategy
necessary to carry out its statutory responsibilities and mission, including
oversight of the Green Bank’s budget process, asset and liability management,
asset risk management, insurance and loss prevention, and performance
measurement; (ii) recommendation to the Board as to approval of the annual

13
operating budget and plan of operation; (iii) oversight of space planning and
office leases, systems, and equipment, and procedures and practices with respect
to purchasing; (iv) to recommend and monitor compliance with policies,
programs, procedures, and practices to assure optimal organizational
development, establishment of policies, programs, procedures and practices to
assure optimal organizational development, the recruitment and retention of
qualified personnel and the just and fair treatment of all employees of the Green
Bank, including employment policies and practices, employee training,
development, evaluation and advancement, employee compensation and
benefits, and matters of employee separation and severance; (v) review and
approval of the Green Bank staffing plan as developed by the President; (vi)
with respect to reallocation of amounts between approved budget line items in
excess of ten thousand dollars ($10,000) but not exceeding seventy-five
thousand dollars ($75,000) in total, approval of such reallocation; (vii) with
respect to increases to the operating budget or unbudgeted disbursements in
amounts in excess of ten thousand ($10,000) but not exceeding seventy-five
thousand ($75,000), approval of such increases; and (viii) the exercise of such
authority as may from time to time be delegated by the Board to the Budget and
Operations Committee within its areas of cognizance.
5.3.3. Deployment Committee. The Deployment Committee shall consist of no more
than six (6) members total, consisting of no less than three (3) Directors and up
to three (3) non-Directors, all appointed by the Chairperson on a biennial basis,
and at least one (1) of the Director-members shall not be a State employee.

14
Additionally, the State Treasurer, or her or his designee, shall be a voting ex
officio member of the committee. Additionally, the Chairperson or the Vice
Chairperson shall be a non-voting ex officio member of the committee, subject
to the provisions of Article V, Section 5.2.2 hereof. The non-Director members
of the Deployment Committee shall each have expertise in such areas as: project
finance, levelized cost of clean energy, investment banking, commercial
lending, tax-exempt or tax-advantaged financing or municipal banking, or clean
energy policy. The principal functions, responsibilities, and areas of cognizance
of the Deployment Committee shall be as follows: (i) to recommend and
monitor compliance with program, project, and investment guidelines, criteria,
policies, and practices supporting the Green Bank’s statutory mission and
management of such by the Green Bank’s professional staff; (ii) with respect to
loans, loan guarantees, loan loss reserves, credit enhancements, debt support
programs, debt, debt-like, grants, equity, near-equity, and related measurement
and verification studies and evaluation audit funding requests, including but not
limited to the On-Site Renewable Distributed Generation Program, the
Residential Solar program, the Combined Heat and Power pilot program, the
Anaerobic Digestion pilot program, and the Condominium Renewable Energy
grant program, between three hundred thousand dollars ($300,000) and two
million five hundred thousand dollars ($2,500,000), evaluation and approval of
such requests on behalf of the Board so long as such approval is within the
Green Bank’s approved Operations and Program Budget; (iii) with respect to
loans, loan guarantees, loan loss reserves, credit enhancements, debt support

15
programs, debt, debt-like, grants, equity and near-equity funding requests which
exceed two million five hundred thousand dollars ($2,500,000), evaluation of
such requests and recommendation to the Board regarding such requests; (iv)
oversight of policies and practices relating to the evaluation and
recommendation of initial investments, follow-on investments, investment
modifications and restructurings, and the sale or other disposition of
investments by the Green Bank’s professional investment staff; (v) oversight of
policies and practices relating to investment management by the Green Bank’s
professional investment staff, including implementation of investment exit
strategies; (vi) except to the extent of any investment powers expressly reserved
to the Board itself in any resolution of the Board, to approve on behalf of the
Board investments, follow-on investments, investment modifications and
restructurings, and the sale or other disposition of investments; (vii) to review
and recommend to the Board the issuance of bonds, notes or other obligations of
the Green Bank, and upon such approval, to sell, issue and deliver such bonds,
notes or obligations on behalf of the Green Bank; and (viii) the exercise of such
other authority as may from time to time be delegated by the Board to the
Deployment Committee within its areas of cognizance.
5.3.4. Joint Committee of the Energy Conservation Management Board and the
Connecticut Green Bank. The Standing Committee Related to the Joint
Committee of the Energy Conservation Management Board and the Board of
Directors of the Green Bank shall consist of no more than (2) voting Directors and
(2) nonvoting members who shall be appointed by the Chairperson on a biennial

16
basis to serve on both this Standing Committee and the Joint Committee. Said
Directors of this Standing Committee shall be charged with joining with four (4)
members, no more than (2) voting Directors and (2) nonvoting members, from the
Energy Conservation Management Board to form the Joint Committee as required
pursuant to 16-245m(d)(2) of the General Statutes.
5.3.4.1. The principal functions, responsibilities and areas of cognizance of this
Standing Committee shall be as follows: (i) to work with the Joint
Committee to examine opportunities to coordinate the programs and
activities contained in the plan developed under section 16-245n (c) of
the General Statutes with the programs and activities contained in the
plan developed under section 16-245m(d)(1) of the General Statutes;
and (ii) to work with the Joint Committee to provide financing to
increase the benefits of programs funded by the plan developed under
section 16-245m(d)(1) of the General Statutes so as to reduce the long-
term cost, environmental impacts and security risks of energy in the
state.
5.3.4.2. This Standing Committee, in consultation with and upon approval of
the Joint Committee, is authorized to vote and allocate funding in an
amount not to exceed three hundred thousand dollars ($300,000.00) per
program or project so long as such program or project is within the
Green Bank’s approved Operations and Program Budget, consistent
with the Green Bank’s Comprehensive Plan, within an approved
program of the Board or Deployment Committee and consistent with
17
the credit and investment guidelines, criteria, policies, and practices
approved by the Board. No resolution of the Joint Committee to
approve an expenditure of funds may be approved without an
affirmative vote of at least two (2) voting Directors of the Connecticut
Green Bank.
5.3.4.3. Notwithstanding anything contained in these Bylaws to the contrary,
the Joint Committee may adopt its own bylaws which shall govern the
conduct and operations of the Joint Committee. If there are conflicting
provisions between these Bylaws and any bylaws adopted by the Joint
Committee, these Bylaws shall be controlling.
5.3.5. Additional Standing Committees or ad hoc committees of the Board may be
formed by the Board at its discretion by resolution setting forth the purposes and
responsibilities of such additional Standing Committee or ad hoc committee.
Each additional Standing Committee or ad hoc committee shall have at least
three (3) members who are Directors, at least one (1) of which shall not be a
State employee.
5.4. Advisory Committees.
5.4.1. The Board may form such advisory committees as the Board in its discretion
may determine to be appropriate to advise and assist the Board, any Standing
Committee of the Board, or management of the Green Bank in the performance
of its statutory responsibilities. Such advisory committees may include as
members such individuals as may be knowledgeable in the subject matter
whether or not Directors or employees of the Green Bank.

18
5.4.2. Members of an advisory committee who are not Directors or employees of the
Green Bank shall be considered "members of an advisory board" for purposes
of the Connecticut Code of Ethics for Public Officials.
5.4.3. Public confidence in the recommendations and other actions of an advisory
committee requires that advisory committee members avoid both actual
conflicts of interest and situations that might give the appearance of a conflict of
interest. It is to be expected, however, that many advisory committee members
will have outside business or professional interests relating to the Green Bank’s
statutory mission. It is not intended that such outside business or professional
interests be considered a conflict of interest, provided that an advisory
committee member shall not participate in any deliberation or vote, and shall
not take any other affirmative action as an advisory committee member, with
respect to a matter in which such member has an interest which is in substantial
conflict with the proper discharge of the duties and responsibilities of
membership on the advisory committee. For this purpose, the determination of
whether an advisory committee member has an interest which is in substantial
conflict with the duties and responsibilities of membership on the advisory
committee shall be made in the same manner as provided in Section 1-85 of the
Connecticut General Statutes for conflicting interests of public officials. In
addition to disclosures required by law, the existence and nature of any such
substantial conflict shall be promptly disclosed to the Committee Chair.

19
ARTICLE VI
FISCAL YEAR
6.1. Fiscal Year. The fiscal year of the Green Bank shall extend from July 1 through the
following June 30 except as the same may be otherwise determined by resolution of the
Board.
ARTICLE VII
CONFLICTS OF INTEREST
7.1. Public confidence in the recommendations and other actions of the Board and
Committees requires that Directors avoid both actual conflicts of interest and situations
that might give the appearance of a conflict of interest. Given the statutory qualifications
for membership on the Board, it is to be expected, however, that some Directors will have
outside business or professional interests relating to the Green Bank’s statutory mission.
It is not intended that such outside business or professional interests be considered a
conflict of interest, provided that a Director shall not participate in any deliberation or
vote, and shall not take any other affirmative action as a Director or Committee member,
with respect to a matter in which such Director has an interest which is in substantial
conflict with the proper discharge of the duties and responsibilities of membership on the
Board or such Committee. For this purpose, the determination of whether a Director has
an interest which is in substantial conflict with the duties and responsibilities of
membership on the Board or a Committee shall be made in the manner provided in
Section 1-85 of the Connecticut General Statutes for conflicting interests of public
officials. The existence and nature of any potential conflict of interest shall be promptly
disclosed to the Chairperson (or, in the case of the Chairperson, to the Vice Chairperson)
and otherwise as may be required by Section 1-86 of the Connecticut General Statutes.

20
7.2. With respect to potential conflicts of interest, as defined in Section 1-86(a) of the
Connecticut General Statutes and pursuant thereto and pursuant to Section 1-81-30(c) of
the Regulations of Connecticut State Agencies, the Member shall either (1) excuse
himself or herself from participating in any deliberation or vote on the matter and may
not otherwise take any affirmative action on the matter or (2) shall prepare a written
statement prepared under penalty of false statement describing the matter requiring action
and the nature of the potential conflict and explaining why, despite the potential conflict,
such Member is able to vote and otherwise participate fairly, objectively, and in the
public interest, and shall deliver a copy of such statement to the Office of State Ethics
and shall enter a copy of the statement in the minutes of the Board or committee, as
applicable.
7.3. In addition to the steps described in Section 7.1 and 7.2, above, a conflicted or potentially
conflicted Director:
7.3.1. is strongly encouraged to leave the room during discussion and vote on the
matter at hand; and
7.3.2. shall not participate in such discussion and vote; and
7.3.3. shall not have access to non-public confidential information regarding the
matter at hand.
ARTICLE VIII
COMPENSATION
8.1. No Director or Committee member shall at any time receive or be entitled to receive any
compensation for the performance of his or her duties as a Director, but may be

21
reimbursed by the Green Bank for reasonable and necessary expenses incurred in the
performance of such duties.
ARTICLE IX
PARLIAMENTARY AUTHORITY
9.1. Robert’s Rules of Order, current revised edition, shall govern the proceedings of the
Board when not in conflict with these Bylaws.
ARTICLE X
ROLE OF CONNECTICUT INNOVATIONS, INC.
10.1. For Administrative Purposes Only. Pursuant to the Statute, the Green Bank is within
Connecticut, Innovations, Incorporated, for administrative purposes only. The
relationship between the Green Bank and Connecticut Innovations, Inc., will be governed
by the Statute, Conn. Gen. Stat. § 4-38f as if applicable to the relationship between the
Green Bank and Connecticut Innovations, Incorporated, and other applicable law, and
shall be memorialized in a contract for services.
ARTICLE XI
AMENDMENT
1.1.10.1. Amendment or Repeal. These Bylaws may be amended or repealed or new
Bylaws may be adopted by the affirmative vote of a Super Majority of the Directors then in
office. The Green Bank may adopt rules for the conduct of its business, and the adoption of
such rules shall not constitute an amendment of these Bylaws.

22
ARTICLE XII
DEFINITIONS
1.1.11.1. Definitions. Unless the context shall otherwise require, the following words and
terms shall have the following meanings:
1.1.1.11.1.1. "Green Bank" means the Connecticut Green Bank, as created and existing
pursuant to the Statute.
1.1.2.11.1.2. "Board" means the board of directors of the Green Bank appointed and
serving pursuant to the Statute.
1.1.3.11.1.3. "Chairperson" means the Chairperson of the Board appointed pursuant to
the Statute.
1.1.4.11.1.4. "Committee" means any committee of or formed by the Board, including
any Standing Committee, ad hoc committee, or advisory committee.
1.1.5.11.1.5. "Committee Chair" means the Chairperson of a Committee.
1.1.6.11.1.6. "Comprehensive Plan" means the plan developed by the Green Bank
pursuant to section 16-245n(c) of the General Statutes.
1.1.7.11.1.7. "Connecticut Freedom of Information Act" means the Connecticut
Freedom of Information Act, Connecticut General Statutes § 1-200 et seq., as
amended.
1.1.8.11.1.8. "Director" means a voting member of the Board appointed pursuant to the
Statute.
1.1.9.11.1.9. "General Statutes" means the Connecticut General Statutes, as amended.
1.1.10.11.1.10. "Majority", whether capitalized or lowercase, means one more than
half.

23
1.1.11.11.1.11. "President" means the President of the Green Bank hired by and
serving at the pleasure of the Board of Directors of the Green Bank.
1.1.12.11.1.12. "Presiding Officer" has the meaning attributed to that term in
Article IV, Section 4.5 of these Bylaws.
1.1.13.11.1.13. "Resolution of Purposes" means a resolution of the Board adopted
pursuant to the penultimate sentence of Section 16-245n(d) of the General
Statutes.
1.1.14.11.1.14. "Secretary" means the Secretary of the Board elected pursuant to
the Statute and these Bylaws.
1.1.15.11.1.15. "Standing Committee" means a Standing Committee established
by these Bylaws or another standing committee appointed by the Board for a
specified period of time for the purpose of carrying out one or more functions of
the Green Bank.
1.1.16.11.1.16. "Statute" means Connecticut General Statutes § 16-245n, as
amended.
1.1.17.11.1.17. "Super Majority" means two thirds rounded up to the next whole
integer.
1.1.18.11.1.18. "Vice Chairperson" means the Vice Chairperson of the Board
elected pursuant to these Bylaws.
ARTICLE XIII
AUTHORITY
13.1. These Bylaws are adopted pursuant to the Statute and effective as of May 18, 2012[ ].

1 1976269v3
CONNECTICUT GREEN BANK
OPERATING PROCEDURES
PURSUANT TO
Section 16-245n of the
Connecticut General Statutes
Adopted December 16, 2011July 18, 2014
Revised July 18, 2014[ ]

2
I. DEFINITIONS
Definitions of terms used in these Operating Procedures are as stated in the Green Bank’s
Bylaws or in Section 16-245n of the General Statutes.
Clean Energy Project: An activity that (i) promotes investment in clean energy; (ii) fosters the
growth, development, and commercialization of clean energy sources and related enterprises;
(iii) stimulates demand for clean energy and deployment of clean energy sources that serve end
use customers in this state; or (iv) supports the development of advanced technologies that
reduce energy use from traditional sources. For purposes of this definition, “clean energy” has
the meaning as provided in Connecticut General Statutes § 16-245n(a), as may be amended from
time to time.
II. GENERAL PURPOSES
The general purposes of the Connecticut Green Bank shall be as prescribed in Section 16-245n
of the General Statutes, and in a resolution of purposes adopted by the Board pursuant to Section
16-245n(d)(1) of the Connecticut General Statutes, including implementation of the
Comprehensive Plan (all together referred to in these Operating Procedures as “the purposes of
the Green Bank”).
III. GOVERNANCE
The Green Bank, a quasi-public authority of the State of Connecticut, shall be governed by a
Board of Directors comprised of a number and appointed in a manner as prescribed in Section

3
16-245n(e) of the General Statutes. The affairs of the Board shall be conducted in accordance
with applicable law, the Green Bank’s Bylaws, and such policies with respect to corporate
governance as may be adopted by the Board.
IV. ADMINISTRATION
The affairs of the Green Bank shall be administered in accordance with applicable law, the
Bylaws, these Operating Procedures and other administrative policies as may be adopted by the
President in consultation with the Board. The Board shall appoint a President and such other
officers as provided in the Bylaws. Under the direction of the Board, such officers shall conduct
the business of the Green Bank and shall have such authority as is conferred by applicable law,
the Bylaws, these Operating Procedures, and the Board. References in these Operating
Procedures to approval by the Board shall mean and include approval by the Board or by any
duly constituted committee thereof authorized to act on behalf of the Board pursuant to the
Bylaws of the Green Bank.
V. ADOPTION OF ANNUAL OPERATING BUDGET AND PLAN OF OPERATION
Sixty (60) days prior to the close of each fiscal year, the President shall cause to be prepared a
suggested Annual Operating Budget for the forthcoming fiscal year, which shall also comprise
the Annual Plan of Operation. The suggested Annual Operating Budget for the forthcoming
fiscal year shall be considered by the Board prior the close of the then current fiscal year,
modified if deemed necessary, and adopted to be effective beginning the first day of the
forthcoming fiscal year.

4
Any expenditure that exceeds the amount annually budgeted for a specific line item in the
Annual Operating Budget by an amount greater than ten thousand dollars ($10,000) shall require
the approval of the Board.
The Annual Operating Budget shall incorporate the Green Bank’s Annual Plan of Operation by
specifying operating, programmatic, investment, and other expenses for the forthcoming fiscal
year.
VI. COMMUNITY DEVELOPMENT FINANCIAL INSTITUTION
The Green Bank or an affiliate may seek to qualify as a Community Development Financial
Institution under Section 4702 of the United States Code. If approved as a Community
Development Financial Institution, then the Green Bank would be treated as a qualified
community development entity for purposes of Section 45D and Section 1400N(m) of the
Internal Revenue Code.
VII. PERSONNEL POLICIES
All employees shall be exempt from the classified service and shall have all rights and benefits
provided by applicable law. Grade classifications for each job title shall be established by the
President, subject to Board approval.
Hiring & Promotions: The President shall, in accordance with the Green Bank’s Bylaws,
establish a schedule of positions and total staffing levels for the Green Bank. The schedule of
positions shall describe the signature authority, if any, of each position. The President, acting on
5
behalf of the Board, may from time to time fill any position on such schedule of positions and
within such total staffing levels, except as may otherwise be provided in the Bylaws or any
applicable resolution of the Board. The creation of any new Director-level position shall require
the separate approval of the Board. For these purposes, “Director-level” means a Green Bank
staff position one level under the officers in the Green Bank’s staff organizational chart.
Whenever possible, the Green Bank shall maintain an identifiable career path for each class of
positions on the schedule of positions approved by the Board. If the President determines it to be
appropriate, then a current employee’s position may be reclassified to another position within
said career path. New positions approved by the Board and existing positions that become
available as a result of a current employee vacating such position shall be posted internally and,
if the President determines it to be appropriate, then publicly advertised in a manner reasonably
designed to reach a range of possible applicants. A current employee shall be eligible for
reclassification or promotion to an existing or new position only if such employee has at least six
(6) months of service with the Green Bank and meets the minimum qualifications for such
position.
Notwithstanding any other provision of this section or any employee handbook or other
personnel policies of the Green Bank, the position of the President, the manner of the conduct of
any search for qualified applicants for such position, and the terms and conditions of
employment in such position, including matters of compensation, dismissal, and severance, shall
be in the discretion and subject to the approval of the Board. Hiring and promotion shall in all
cases be in accordance with the Green Bank’s Affirmative Action Plan and applicable statutes.

6
Compensation and Benefits: The Board shall establish and may from time to time modify
reasonable compensation plans and employee benefits programs and policies as the Board
determines to be necessary or appropriate to attract and retain qualified employees and carry out
the Green Bank’s statutory mission, including:
(a) A compensation plan, which shall consist of sufficient salary grades to provide such
compensation rates as may be determined to be necessary or desirable for all job
classifications within the Green Bank, and which may include an incentive compensation
program for all jobs classifications;
(b) An employee benefits program, which may include, but is not limited to, vacation days,
holidays, sick days, group health, life, and disability insurance, tuition reimbursement,
length of service awards and other benefits, including eligibility criteria and benefit
levels;
(c) A performance evaluation system, which may be used to determine merit increases in
salary and incentive compensation levels;
(d) Policies with respect to compensatory time, flex-time, and telecommuting;
(e) Policies with respect to severance pay and benefits;
(f) Policies with respect to business and travel reimbursement; and
(g) Other reasonable compensation and employee benefits programs and policies as the
Board determines to be necessary and appropriate to attract and retain qualified
employees.

7
The President shall be empowered to administer the Green Bank’s compensation plan and
employee benefit programs and policies as approved by the Board, and shall have the authority
to approve performance evaluations, determine merit increases and incentive compensation
payments, and carry out such other duties and responsibilities as appropriate within the overall
salary and employee benefits administration plan, except that performance evaluations and
determination of merit or other salary increases and bonus payments for the position of President
shall be reserved to the Board or the committee of the Board with responsibility for matters of
compensation. The President has the authority to establish and modify certain employee policies
involving workplace flexibility that do not in the aggregate have an adverse financial impact on
the Green Bank. The Board shall review the Green Bank’s compensation plan and employee
benefit programs a part of its annual review of the Green Bank’s Operating Budget and Plan of
Operation.
Dismissal: Employment with the Green Bank is at-will, which means that either the employee or
the Green Bank may terminate the relationship at any time and for any reason, with or without
cause. The President may impose any level of disciplinary action, including termination, based
upon the severity of the offense requiring discipline and the employee’s past work record. This in
no way alters the at-will employment policy.
Coordination with and Administration by Connecticut Innovations, Incorporated: To the extent
permitted by any contract for administrative support and services between the Green Bank and
Connecticut Innovations, Incorporated, personnel policies, compensation plans, and benefit

8
programs and polices of the Green Bank may be coordinated and/or combined with, and
administered by, Connecticut Innovations, Incorporated, subject to appropriate cost sharing.
VIII. PURCHASE, LEASE, ACQUISITION POLICY
FOR REAL AND PERSONAL PROPERTY
The Green Bank, acting through the President or another duly authorized officer, shall have the
authority to invest in, acquire, lease, purchase, own, manage, hold, and dispose of real and
personal property, and to lease, convey, or deal in or enter into agreements with respect to such
real and personal property, on any terms necessary or incidental to the carrying out of the
purposes of the Green Bank.
Procurement Procedures: The Green Bank may purchase, lease, or acquire real and personal
property on a bid, negotiated, or open-market basis, including through a sole-source procurement
or in such other manner as the President determines to be appropriate and in the best interests of
the Green Bank in the circumstances, provided that in the case of any contract or agreement for
the purchase, lease, or acquisition of real or personal property requiring an expenditure by the
Green Bank in excess of seventy-five thousand dollars ($75,000), wherever possible bids or
proposals shall be solicited from at least three (3) qualified parties. The requirements of this
subsection shall not be applicable to transactions entered into by the Green Bank primarily for
the purpose of providing financial assistance pursuant to Articles XII, XIII and XIV of these
Operating Procedures. To the extent permitted by any contract for administrative support and
services between the Green Bank and Connecticut Innovations, Incorporated, space, systems,
supplies and other property, goods or services necessary for the business operations of the Green

9
Bank may be provided by Connecticut Innovations, Incorporated, subject to appropriate cost
sharing, and in such cases the procurement procedures of Connecticut Innovations, Incorporated
shall apply thereto.
IX. CONTRACTING FOR PROFESSIONAL SERVICES
The Green Bank, acting through the President or another duly authorized officer, shall have the
authority to engage accountants, attorneys, appraisers, financial advisers, investment advisors,
underwriters, investment managers, investment bankers, brokers, architects, construction
managers, engineers, and other consultants and professionals on any terms necessary or
incidental to the carrying out of the purposes of the Green Bank. In the absence of a conflict of
interest, such consultants and professionals may be those also providing services to Connecticut
Innovations, Incorporated.
Procurement Procedures: Contracts for professional services shall be awarded by the Green Bank
in such manner, including on the basis of a sole-source procurement, as the Board determines to
be appropriate and in the best interests of the Green Bank in the circumstances, provided that (i)
for such contracts requiring an expenditure by the Green Bank up to and including seventy-five
thousand dollars ($75,000) over a period of one (1) fiscal year, the President has sole approval
authority; (ii) for such contracts requiring an expenditure by the Green Bank over seventy-five
thousand dollars ($75,000) and up to and including one hundred fifty thousand dollars
($150,000) over a period of one (1) fiscal year, the President and the Chairperson must both
approve the expenditure; and (iii) for such contracts requiring an expenditure by the Green Bank
of over one hundred fifty thousand dollars ($150,000), such contract shall, whenever possible, be

10
awarded on the basis of a process of competitive negotiation where proposals are solicited from
at least three (3) qualified parties. To the extent permitted by any contract for administrative
support and services between the Green Bank and Connecticut Innovations, Incorporated,
professional services may also be provided by consultants and professionals selected by and
under contract to Connecticut Innovations, Incorporated, subject to appropriate cost sharing. The
provisions of Section 1-127 of the General Statutes shall apply to the engagement of auditors by
the Green Bank.
X. STATE CONTRACTING REQUIREMENTS
Any solicitation of bids or proposals by the Green Bank, and any award of a contract by the
Green Bank, shall be subject to all state procurement and contracting requirements applicable to
quasi-public agencies of the statethe Green Bank as a quasi public agency of the state, including
without limitation the following to the extent applicable in the circumstances:
Section 9-612 of the General Statutes, as amended, relating to campaign contributions by state
contractors and their principals and related notices to state contractors and prospective state
contractors;
Section 4-252 of the General Statutes relating to affidavits as to gifts from contractors under
certain large state contracts;
Section 4a-81 of the General Statutes relating to affidavits with respect to consulting fees;
Section 3-13l of the General Statutes relating to the prohibition of finder’s fees in connection
with investment transactions;
Section 3-13j of the General Statutes relating to the disclosure of third party fees attributable to
investment services contracts;

11
Section 4-61dd of the General Statutes relating to whistleblower protections; and
Section 4a-60 and 4a-60a of the General Statutes relating to non-discrimination in state
contracting and documentation of contractor adoption of a corporate policy supporting the non-
discrimination agreements and warranties required by Sections 4a-60 and 40a-60a.
XI. FUNDING SOURCES AND PROCEDURES OF
GENERAL APPLICABILITY TO FINANCIAL ASSISTANCE
Funding Sources: Funding sources specifically authorized by the Statute include, but are not
limited to:
(a) Funds repurposed from existing programs providing financing support for clean energy
projects, provided any transfer of funds from such existing programs shall be subject to
approval by the General Assembly and shall be used for expenses of financing, grants,
and loans;
(b) Any federal funds that can be used for the purposes specified in Section 16-245n(c) of the
General Statutes;
(c) Charitable gifts, grants, and contributions, as well as loans from individuals, corporations,
university endowments, and philanthropic foundations;
(d) Earnings and interest derived from financing support activities for clean energy projects
backed by the Green Bank;
(e) If and to the extent that the Green Bank or an affiliate qualifies as a Community
Development Financing Institution under Section 4702 of the United States Code, then
funding from the Community Development Financing Institution Fund administered by

12
the United States Department of Treasury, as well as loans from and investments by
depository institutions seeking to comply with their obligations under the United States
Community Reinvestment Act of 1977; and
(f) The Green Bank may enter into contracts with private sources to raise capital. The
average rate of return on such debt or equity shall be set by the Board.
Procedures of General Applicability to Financial Assistance:
(a) For clean energy projects, the amount to be financed by the Green Bank and other
nonequity financing sources cannot exceed eighty per cent (80%) of the cost of
developing and deploying such projects.
(b) For energy efficiency projects the amount to be financed by the Green Bank and other
nonequity financing sources cannot exceed one hundred per cent (100%) of the cost of
financing such projects.
(c)(a) The Green Bank may assess reasonable fees on its financing activities to cover its
reasonable costs and expenses, as determined by the Board.
(d)(b) The Green Bank shall make information regarding the rates, terms, and conditions
for all of its financing support transactions available to the public for inspection,
including formal annual reviews by both a private auditor conducted pursuant to Section
16-245n(f)(2) of the General Statutes and the Comptroller, and providing details to the
public on the Green Bank’s Web site; provided that public disclosure shall be restricted
for patentable ideas, trade secrets, proprietary or confidential commercial or financial
information, disclosure of which may cause commercial harm to a nongovernmental

13
recipient of such financing support and for other information exempt from public records
disclosure pursuant to Section 1-210 of the General Statutes.
(e)(c) Any entity that receives financing for a clean energy project from the Clean
Energy Fund (Fund) shall provide the board an annual statement during the time period
that funds are dispersed, certified as correct by the chief financial officer of the recipient
of such financing, setting forth all sources and uses of funds for such project in such
detail as may be required by the Green Bank. The Green Bank shall maintain any such
audits for not less than five (5) years. Residential projects for buildings with one to four
dwelling units are exempt from this and any other annual auditing requirements, except
that residential projects may be required to grant their utility companies’ permission to
release their usage data to the Green Bank.
XII. FINANCIAL ASSISTANCE—GRANTS, LOANS OR LOAN GUARANTEES,
DEBT AND EQUITY INVESTMENTS
The procedures in this section are generally applicable to the award of grants, loans or loan
guarantees, and debt and equity investments for clean energy projects when the Board
determines that one of the following methods be used in the selection and award process: (i)
competitive selection and award; (ii) programmatic selection and award; or (iii) strategic
selection and award. The factors to be considered in choosing the appropriate selection and
award method, and the general procedures to be followed in each such case are set forth below.

14
Competitive Selection and Award
Applicability: Competitive selection and award shall be the preferred method when the
Board determines that it is appropriate in the circumstances to invite and consider
proposals for a particular clean energy project or projects in a competitive process under
an established schedule and pursuant to formal qualification and selection criteria so that
proposers and proposals may be evaluated fairly and thoroughly on a comparative basis.
Issuance of RFP: A request for proposals (RFP) shall be published or distributed in a
manner that the Green Bank determines will promote broad participation in the
competitive process. Deadlines for particular stages in the competitive selection process
will be set forth in the RFP. Notice of the RFP shall be posted on the Web site of the
Green Bank, may be published in one or more major daily newspapers published in the
State, and may also be posted on the Web site of the Connecticut Department of
Administrative Services. The RFP itself shall also be posted on the Web site of the Green
Bank and shall be mailed to or otherwise made available to interested parties in a
reasonable manner.
Eligibility: Each RFP shall be issued pursuant to guidelines established by the Green
Bank consistent with the Green Bank’s Comprehensive Plan and Annual Operating
Budget. Such guidelines shall at a minimum set forth: (i) proposer qualification
requirements; (ii) project eligibility criteria; (iii) the nature and amount of financial
assistance available from the Green Bank under the program; (iv) the principal selection
criteria; (v) any mandatory terms and conditions under which such funding is available;
(vi) applicable application, processing, or other program fees; and (vii) the process by

15
which proposals will be considered and acted upon. Such guidelines may be modified, in
whole or in part, from time to time and at any time by the Green Bank, consistent with
the authorizing resolution of the Board.
Selection Criteria: Selection criteria shall include, as applicable, (i) the eligibility of the
proposer; (ii) the proposer’s qualifications and experience; (iii) the financial feasibility of
the project, including the availability and firmness of required financing; (iv) the cost-
effectiveness of the project; (v) the technological characteristics of the project, including
the potential for technological improvements and advancements; the project’s operational
feasibility and commercial applicability; (vi) the jobs created by the project; (vii) the
environmental benefits stemming from the project; and (viii) the contributions to be made
by the project toward the statutory purposes of the Green Bank and the furtherance of the
Comprehensive Plan. Other selection criteria may be established for any RFP, and any
weighting of selection criteria shall be in the discretion of the Green Bank as provided in
such RFP. If appropriate in the circumstances, then an RFP may be first issued as a
request for qualifications, following which those respondents found to be qualified are
invited to respond to a final RFP.
Selection Process: The selection process shall be designed to provide for a fair and
thorough evaluation of each eligible and qualified proposal, and shall be described in the
RFP. The selection process may include the use of a review or scoring team, which may
include members of any advisory committee, members of the staff of the Green Bank,
and independent members with relevant industry, academic, or governmental experience.
No member of any such review or scoring team shall have any financial or other personal
interest in any proposed project. Any such review or scoring team shall act in an advisory

16
capacity only and shall not constitute a committee or subcommittee of the Board, and the
members of any such review or scoring team shall not be deemed to be public officials as
a result of their service thereon. If the Green Bank determines that the responses to the
RFP have been insufficient in number or quality to achieve the objectives of a
competitive selection and award process or otherwise determines it to be in the best
interest of the Green Bank, then the RFP may be extended, withdrawn and reissued, or
cancelled at any time.
Selection Decision: One or more proposers may be selected for the purpose of entering
into negotiations, if applicable, with respect to a project. Such selection shall be made by
the Green Bank after taking into account the established selection criteria, any report or
recommendation by staff of the Green Bank, the report of any review or scoring team,
and the results of any review and recommendation by any advisory committee to the
Board, applied on an equitable basis. If more than one proposal is selected, then they may
be ranked in order of preference, which ranking may be based on the recommendation of
staff of the Green Bank, such advisory committee, or the review or scoring team.
Notification to Proposers; Effect of Selection: All proposers shall be promptly notified of
the results of the selection process. Such results may also be posted on the Web site of the
Green Bank. Any such selection and notification is solely for the purpose of qualification
for possible negotiation and does not constitute a financing commitment or the award of a
contract.
Negotiation: The Green Bank may enter into good faith negotiations with one or more of
the selected proposers at such time and in such order as the Green Bank may determine in

17
its discretion consistent with the terms of the RFP. The commencement of such
negotiations does not signify a commitment to provide financial assistance or to enter
into a contract with a proposer. Either the proposer or the Green Bank may terminate
such negotiations at any time for any reason. The Green Bank reserves the right to enter
into negotiations with any other proposer at any time. Such negotiations shall not be
limited to the scope or terms of the proposal but may include such other matters or
different terms as the Green Bank may determine to be in the best interests of the Green
Bank.
Award: Upon mutual agreement regarding the terms and conditions of the financial
assistance, the Green Bank and the selected proposer may enter into a contract which
memorializes the agreed-upon terms and conditions subject to all necessary Green Bank
approvals, including the Board or a duly authorized committee of the Board.
Fees and Expenses: The Green Bank may impose reasonable application, processing, or
similar fees in connection with the submission and processing of proposals, and may
require, as a condition of negotiation with any selected proposer, that such proposer agree
to pay costs incurred by the Green Bank, including fees and disbursements of the Green
Bank’s counsel, consultants, and other professional advisors. Any pre-established
application, processing, or other program fees shall be set forth in the RFP.
State Contracting Requirements: Any RFP shall be subject to, and any definitive
financing or contracting documents shall include, such provisions as may be required by
applicable laws or executive orders, including with respect to non-discrimination and
affirmative action.

18
Other Terms and Conditions: Any RFP may be subject to and include such other terms
and conditions, not inconsistent with the requirements of these procedures, as the Green
Bank may determine in its discretion to be appropriate and in the best interests of the
Green Bank.
Programmatic Selection and Award
Applicability: Programmatic selection and award shall be the preferred method when the
Board determines that it is appropriate in the circumstances to invite applications on a
continuing or periodic basis for clean energy projects with identified characteristics and
to consider such applications under pre-established program-based qualification,
eligibility, and selection criteria, but that it is not necessary or appropriate to evaluate
such applications on a comparative basis as part of a competitive RFP process. Any such
program may be discontinued, suspended, extended, or expanded at any time by the
Board based on its determination of what is appropriate and in the best interests of the
Green Bank.
Program Guidelines: Each such program shall be authorized by resolution of the Board
and operated and administered by the Green Bank pursuant to program guidelines
established by the Green Bank consistent with such Board authorization, which shall at a
minimum set forth: (i) applicant qualification requirements; (ii) project eligibility criteria;
(iii) the nature and amount of financial assistance available from the Green Bank under
the program; (iv) the principal selection criteria; (v) any mandatory terms and conditions
under which such funding is available; (vi) the application process, including a standard
application form; (vii) applicable application, processing, or other program fees; and

19
(viii) the process by which applications will be considered and acted upon. Such program
guidelines may be modified, in whole or in part, from time to time and at any time by the
Green Bank, consistent with the authorizing resolution of the Board. A general
description of each such program, including the applicable program guidelines, and all
such modifications, if any, shall be posted on the Web site of the Green Bank.
Approval; Terms and Conditions of Award: Applications shall be subject to the approval
of the Board, or of the President or other officer of the Green Bank if and to the extent so
authorized in the authorizing resolution of the Board, after taking into account any report
or recommendations of the staff of the Green Bank or an advisory committee, if
applicable. Financial support for a project under any such program shall be in such
amount, and shall be subject to such project-specific terms, conditions, and requirements,
as may be determined by the Green Bank within the limits established by the authorizing
resolution of the Board and consistent with the program guidelines.
Fees and Expenses: The Green Bank may impose reasonable application, processing, or
similar fees in connection with the submission and processing of proposals, and may
require, as a condition of negotiation with any selected proposer, that such proposer agree
to pay costs incurred by the Green Bank, including fees and disbursements of the Green
Bank’s counsel, consultants, and other professional advisors. Any pre-established
application, processing, or other program fees shall be set forth in the applicable program
guidelines.
20
Strategic Selection and Award
Applicability: While the utilization of an open and public process, either competitive or
programmatic, for awards from the Green Bank is anticipated most often to be in the best
interest of the Green Bank and is to be strongly preferred, there are nevertheless
recognized to be certain circumstances in which, based on special capabilities,
uniqueness of the opportunity, urgency of need, cost, and similar factors, the public
interest and the strategic mission of the Green Bank is best served by direct participation
by the Green Bank in, and funding of, a particular clean energy project outside of an
existing program and absent a competitive process of selection and award. Such strategic
selection and award method may be utilized upon an affirmative resolution, adopted by a
two-thirds majority of the members of the Board present at a meeting of the Board,
determining that the advantages of strategic selection and award clearly outweigh the
general public interest in an open and public process based on a finding that at least three
(3) of the following characteristics are present and are of predominant importance to the
Green Bank:
(a) Special Capabilities: The opportunity is presented by a party with
exceptional experience, expertise, or availability, or holding patent or
other proprietary rights of special value to the Green Bank.
(b) Uniqueness: The opportunity is one-of-a-kind by virtue of location, high
visibility, and leverage with other already committed public or private
funding or similar unique attributes.
(c) Strategic Importance: The opportunity has exceptionally strong
compatibility with the mission of the Green Bank, including the jobs

21
created by the project or the environmental benefits stemming from the
project, or offers the Green Bank an organizational role, participation in
governance, a formative or other key role in the industry, high funding
leverage potential, broad market reach, exceptional educational or public
relations value, or similar special strategic advantages important to the
Green Bank.
(d) Urgency and Timeliness: There is an urgent need to act on the opportunity
as a result of public exigency or emergency, or a strategically important
opportunity would become unavailable as a result of delay, or it would
take an unacceptable length of time for a similar opportunity to reach the
same level of readiness.
(e) Multiphase Project; Follow-on Investment: The opportunity relates to the
next phase of a multiphase proposal or the expenditure is necessary to
support or protect an existing the Green Bank investment or initiative.
Other Requirements: Awards made by strategic selection and award shall to the extent
applicable be otherwise subject to the same procedures set forth with respect to
competitive selection and award under the headings “Negotiation”, “Award”, “Fees and
Expenses”, “State Contracting Requirements”, and “Other Terms and Conditions”.

22
XIII. ISSUING AND RETIRING BONDS, BOND ANTICIPATION NOTES, AND
OTHER OBLIGATIONS OF THE GREEN BANK
The Board shall approve the issuance and retirement of all bonds, bond anticipation notes, and
other obligations of the Green Bank. Such approval may include, but not be limited to, their
form, denominations, maturities, rates, prices, public or private sales, and other provisions
important or necessary for their issuance or retirement, including the payment of all expenses,
premiums, and commissions in connection therewith.
XIV. SURPLUS FUNDS
Surplus funds generated through the sale of bonds, bond anticipation notes, or other obligations
of the Green Bank, to the extent not needed for the payment of interest and principal due on any
payment of said bonds, bond anticipation notes, or other obligations, if any accrued by the Green
Bank, shall be withdrawn and transferred to the Green Bank’s Operating Account at such times
as is permitted under applicable resolutions for the bonds, bond anticipation notes, or other
obligations to be used for any lawful purposes of the Green Bank.
XV. PERIODIC REVIEW; AMENDMENT OF PROCEDURES
At least annually, the Audit, Compliance, and Governance Committee of the Board shall meet to
review and discuss the matters addressed by these Procedures and, if deemed necessary, to make
recommendations for amendment of these Procedures to Board. Amendments to these
Procedures shall be effective only upon adoption of such amendments by a two-thirds vote of the
Board.
* * *

Memo
To: Members of the Connecticut Green Bank (the “Green Bank”)) Audit Committee
From: George Bellas
CC: Bryan Garcia, Brian Farnen, Bert Hunter, Mackey Dykes
Date: October 21, 2016
Re: Results of annual financial audit of the Green Bank and the Green Bank 2016 draft CAFR
Dear Committee members:
Results of Annual Financial Audit:
Blum Shapiro and Company Performed the annual financial audit of the Green Bank for the fiscal year ending June 30, 2016. They will be presenting the results of their audit to the Committee during the meeting. A copy of their presentation is included in the materials you have received. The audit itself went well with no material internal control weaknesses identified or material adjustments to the financial books and records recorded.
Green Bank 2016 draft CAFR:
I am enclosing the draft Green Bank 2016 CAFR for your review. The major sections of the CAFR are as follows:
1. Financial Audit Section
2. Statistical Section
Financial Section:
This section contains Management’s Discussion and Analysis of the results of operations for the current and prior fiscal years as well as the audited financial statements and related footnotes.
The financial statements themselves, comprised of the Statement of Net Position, the Statement of Revenues, Expenses and Changes in Net Position and the Statement of

Cash Flows have been completed except for some additional disclosures in the Statement of Cash Flows which will be completed by the date of the Committee meeting. The related footnotes are materially complete except for the following additional disclosures which will be complete by the date of the Committee meeting:
Note 8 – Program Loans: Completion of the repayment schedule for program loans.
Note 9 – Financing Activities – Updating the Solar Mosaic note payment schedule and adding narrative and a repayment schedule for the Reinvestment Fund note payable.
Note 15 Commitments and Loan Guarantees – Adding narrative and a schedule for program loan guarantees of the Green Bank.
In addition, there is general clean-up for typos and grammar in the footnote narratives. We do not anticipate any further adjustments to the financial statements themselves which would have a material impact on the financial position of the Green Bank.
Statistical Section
The statistical section is broken out into two subsections:
Financial Statistics:
Financial Statistics are organized in tables as follows:
Net Position by Component
Changes in Net Position
Operating Revenue by Source
Significant Sources of Operating Revenue
Outstanding Debt by Type
Demographic and Economic Information
Principal Employers for the State of Connecticut
FTE’s by Function
Operating Indicators by Function
No additional changes to the data in these tables is anticipated.

Non-Financial Statistics:
The non-financial statistical section contains statistical data and narrative pertaining to the Green Bank’s current programs. There is a table of contents in the front of this section for the reader’s use.
In conclusion I wish to thank the committee members for their effort in reviewing this document. Our goal is to provide readers with a comprehensive overview of the financial and programmatic activities of the Green Bank on an annual basis.
RESOLUTION:
WHEREAS, Article V, Section 5.3.1(ii) of the Connecticut Green Bank (“Green Bank”) Operating Procedures requires the Audit, Compliance, and the Governance Committee (the “Committee”) to meet with the auditors to review the annual audit and formulation of an appropriate report and recommendations to the Board of Directors of the Green Bank (the “Board”) with respect to the approval of the audit report;
NOW, therefore be it:
RESOLVED, that the Committee hereby recommends to the Board of Directors for approval the proposed draft Comprehensive Annual Financial Report (CAFR) contingent upon no further adjustments to the financial statements or additional required disclosures which would materially change the financial position of the Green Bank as presented.


CONNECTICUT GREEN BANK (A Component Unit of the State of Connecticut)
COMPREHENSIVE ANNUAL
FINANCIAL REPORT
FISCAL YEAR ENDED JUNE 30, 2016
(With Summarized Totals as of and for Fiscal Year Ended June 30, 2015)
Department of Finance and Administration
845 Brook Street
Rocky Hill, Connecticut

CONNECTICUT GREEN BANK
TABLE OF CONTENTS
I. Introductory Section
Letter of Transmittal ............................................................................................................... I
Board of Directors................................................................................................................ IV
Organizational Chart .............................................................................................................. V
GFOA Certificate of Achievement in Financial Reporting ................................................. VI
II. Financial Section
Independent Auditors’ Report.............................................................................................1
Management’s Discussion and Analysis (unaudited) ........................................................4
Basic Financial Statements
Financial Statements Statement of Net Position ...............................................................................................13
Statement of Revenues, Expenditures and Changes in Net Position ..............................15
Statement of Cash Flows ................................................................................................17
Notes to Financial Statements ............................................................................................19
Required Supplementary Information
Schedule of Green Bank’s Proportionate Share of the Net Pension Liability ................66
Schedule of Green Bank’s Proportionate Share of Contributions to the
State Employee’s Retirement System (SERS) ..........................................................67
III. Statistical Section (unaudited) ...........................................................................................68
Financial Statistics ..............................................................................................................69
Introduction........................................................................................................................70
Financial Trends
Net Position by Component ............................................................................................71
Changes in Net Position ..................................................................................................72
Revenue Capacity
Operating Revenue by Source ........................................................................................75
Significant Sources of Operating Revenue .....................................................................76
Debt Capacity
Outstanding debt by type ................................................................................................77

CONNECTICUT GREEN BANK
TABLE OF CONTENTS
Financial Statistics (continued)
Demographic and Economic Information
Demographic and Economic Statistics ...........................................................................78
Principal Employers ........................................................................................................79
Operating Information
FTE’s by Function ..........................................................................................................80
Operating Indicators by Function ...................................................................................81
Capital Asset Statistics by Function ...............................................................................82
Non-Financial Statistics ......................................................................................................83
Introduction........................................................................................................................84
1. Statement of the Connecticut Green Bank ................................................................85
2. Background and Market
Governance ............................................................................................................87
Communities ..........................................................................................................91
Income..................................................................................................................101
Small to Minor Owned Business Procurement ....................................................103
3. Measures of Success
Attract and Deploy Capital ..................................................................................104
Green Bank ..........................................................................................................107
Public Benefits .....................................................................................................109
4. Market Transformation
Program Logic Model ..........................................................................................112
Cost Effectiveness of Subsidiaries
Case of the Residential Solar Investment Program...........................................118
Financial Warehouse and Credit Enhancement Structures
Case of the CT Solar Loan ................................................................................126
Case of the CT Solar Lease ...............................................................................131
Case of the Smart-E Loan .................................................................................136
Case of the Low Income Solar Lease and
Energy Efficiency Energy Savings Agreement (ESA) ..............................143
Case of the Commercial Property Assessed Clean Energy (C-PACE).............146

INTRODUCTORY SECTION

I
October XX, 2016
We are pleased to present a Comprehensive Annual Financial Report (CAFR) of the Connecticut
Green Bank (“Green Bank”) for the fiscal year ending June 30, 2016 accompanied by summarized
totals as of and for the fiscal year ended June 30, 2015.
Management assumes full responsibility for the completeness and reliability of the information
contained in this report based upon a comprehensive framework of internal controls that it has
established for this purpose. To provide a reasonable basis for making these representations, the
management of Green Bank has established a comprehensive internal control framework that is
designed both to protect the entity’s assets from loss, theft, or misuse, and to compile sufficient
reliable information for the preparation of Green Bank’s financial statements in conformity with
accounting principles generally accepted in the United States of America (GAAP). Because the
cost of internal controls should not outweigh the benefits, Green Bank’s comprehensive framework
of internal controls has been designed to provide reasonable, rather than absolute assurance that
the financial statements will be free from material misstatement. As such, management asserts
that this financial report is complete and reliable in all material respects to the best of
managements’ knowledge and belief.
Blum Shapiro & Company has issued an unmodified opinion on the Green Bank’s financial
statements for the fiscal year ending June 30, 2016. The independent auditors’ report is presented
in the financial section of this report. This letter of transmittal is designed to complement the
Management’s Discussion and Analysis (MD&A) and should be read in conjunction with it. The
Green Bank’s MD&A can be found immediately following the report of the independent auditors.
The Government Finance Officers Association of the United States and Canada (GFOA) awarded
a Certificate of Achievement for Excellence in Financial Reporting to the Connecticut Green Bank
for its comprehensive annual report for the fiscal year ended June 30, 2015 and June 30, 2014. In
order to be awarded a Certificate of Achievement, a government must publish an easily readable
and efficiently organized comprehensive annual financial report. This report must satisfy both
generally accepted accounting principles and applicable legal requirements.
A Certificate of Achievement is valid for a period of one year only. We believe that our current
comprehensive annual financial report continues to meet the Certificate of Achievement Program’s
requirements and we are submitting it to the GFOA to determine its eligibility for another
certificate.

I
Profile of the Connecticut Green Bank
The Green Bank1 was established in a bipartisan manner by the Governor and Connecticut’s
General Assembly on July 1, 2011 through Public Act 11-80 as a quasi-public agency that
supersedes the former Connecticut Clean Energy Fund. As the nation’s first state green bank, the
Connecticut Green Bank makes green energy more accessible and affordable for all Connecticut
citizens and businesses by creating a thriving marketplace to accelerate the growth of green energy.
We facilitate green energy deployment by leveraging a public-private financing model that uses
limited public dollars to attract private capital investments. By partnering with the private sector,
we create solutions that result in long-term, affordable financing to increase the number of green
energy projects statewide.
The Green Bank’s vision is to lead the green bank movement by accelerating private investment
in clean energy deployment for Connecticut to achieve economic prosperity, create jobs, promote
energy security and address climate change. By accelerating the growth of green energy we
contribute to a better quality of life, a better environment and a better future for Connecticut. The
Green Bank’s mission is to support the Governor’s and Legislature’s energy strategy to achieve
cleaner, cheaper and more reliable sources of energy while creating jobs and supporting local
economic development.
To achieve its vision and mission, the Green Bank has established the following three goals:
1. To attract and deploy capital to finance the clean energy2 goals for Connecticut, including:
2. To develop and implement strategies that bring down the cost of clean energy in order to
make it more accessible and affordable to consumers.
3. To reduce reliance on grants, rebates, and other subsidies and move towards innovative
low-cost financing of clean energy deployment.
These goals support the implementation of Connecticut’s clean energy policies be they statutory
(i.e., Public Act 11-80, Public Act 13-298, Public Act 15-194), planning (i.e., Comprehensive
Energy Strategy, Integrated Resources Plan), or regulatory in nature. The powers of the Green
Bank are vested in and exercised by a Board of Directors that is comprised of eleven voting and
two non-voting members each with knowledge and expertise in matters related to the purpose of
the organization. The Board of Directors and Staff are governed through the statute, as well as an
Ethics Statement and Ethical Conduct Policy, Resolutions of Purposes, Bylaws, and
Comprehensive Plan.
1 Public Act 11-80 repurposed the Connecticut Clean Energy Fund (CCEF) administered by Connecticut Innovations, into a
separate quasi-public organization called the Clean Energy Finance and Investment Authority (CEFIA). Per Public Act 14-94, CEFIA was renamed to the Connecticut Green Bank.
2 Public Act 11-80 defines "clean energy" broadly and includes familiar renewable energy sources such as solar photovoltaic, solar thermal, geothermal, wind and low-impact hydroelectric energy, but also includes fuel cells, energy derived from anaerobic digestion (AD), combined heat and power (CHP) systems, infrastructure for alternative fuels for transportation and financing energy efficiency projects.

I
Initiatives and Results
Accelerate the Growth of Green Energy
The Green Bank makes green energy more accessible and affordable for all Connecticut citizens
and businesses by creating a thriving marketplace to accelerate the growth of green energy. As a
result of the efforts undertaken over the past five years, we are deploying more green energy in
our state than ever before (see Table 1).3
Table 1. Project Investments between FY 2012 through FY 20164
FY 2016 FY 2015 FY 2014 FY 2013 FY2012 Total
Total Investment
($ MM) $ 314.1 $ 335.5 $ 140.2 $ 111.1 $ 15.0 $ 915.8
Green Bank
Investment ($ MM) $ 48.0 $ 55.7 $ 37.8 $ 18.6 $ 4.8 $ 165.0
Leverage Ratio 6.6 : 1.0 6.1 : 1.0 3.7 : 1.0 6.0 : 1.0 3.1 : 1.0 5.6 : 1.0
% of Funding
Approved as Grants 43% 50% 48% 67% 100% 51%
Installed Capacity
(MW) 74.4 65.5 26.1 23.5 2.9 192.3
By using $165.0 million of ratepayer funds, we have attracted over $750.8 million of private
investment in clean energy for a total investment of $915.8 million. This is supporting the
deployment of 192.3 MW of renewable energy and producing and saving an estimated 1.3 million
MMBtu of clean energy while creating over 11,000 job-years and reducing an estimated 2.1
million tons of CO2 emissions over the life of the projects.
We Grow Businesses and We Help People Thrive
As leaders in the green bank movement – through innovation, education, and activation – we
accelerate the growth of green energy. By generating a robust, flourishing green energy
marketplace, we grow businesses and help people thrive. Within this marketplace the Green Bank
partners with contractors and capital providers to offer a diverse portfolio of programs that benefit
homeowners, businesses, and institutions. The Green Bank is demonstrating how public resources
can be better invested in ways that attract more private investment in our communities, lead to the
deployment of more green energy by local contractors, and most importantly providing positive
value to our consumers.
The Green Bank helps make homes more energy efficient and sustainable by promoting awareness
and offering flexible financing solutions to homeowners and multifamily building owners who
seek assistance to make green energy upgrades. We make green energy more attractive to
everyone so that residents can integrate it into their lives. The benefits are many – from reducing
the burden of energy costs, to improving comfort and health in the home, to a cleaner environment.
More green homes mean greener, healthier communities.
The Green Bank makes green energy investments smarter and safer for businesses, including
commercial and industrial customers, and institutions, including multifamily and not-for-profit
3 Connecticut Green Bank – Investment and Public Benefit Performance from Clean Energy Projects from FY 2012 through FY
2015 – Board of Director Memo of October 16, 2015 4 Includes approved, closed and completed transactions approved by the Board of Directors consistent with its Comprehensive
Plan and Budget.

II
organizations, with affordable, long-term financing for energy upgrades. We demonstrate how
green energy improvements are smart investments that lower operating costs. We inspire them to
embrace cleaner and more reliable sources of energy to power their buildings which stimulates a
healthier local economy. Healthy buildings mean healthy businesses and institutions.
The Green Bank makes green energy more accessible and affordable to grow businesses and help
people thrive.
Leading the Green Bank Movement
The Connecticut Green Bank is a leader in the green bank movement. The Connecticut Green
Bank and its programs serve as models for other states across the country.
This year, we have seen several of our programs serving as replicable and scalable models,
including:
Commercial Property Assessed Clean Energy (C-PACE) for commercial, industrial,
multifamily, and non-profit buildings with Hannon Armstrong
Solar for All residential solar PV lease and energy efficiency energy savings agreement for
low-to-moderate income households with PosiGen
The Connecticut Green Bank is leading a movement to use public funds more responsibly by
attracting and deploying more private investment in green energy for the state’s economy and
environment.
In a study done by the Center for America Progress,5 it is estimated that the U.S. needs at least
$200 billion in efficient and renewable energy annually for 20 years to reduce carbon emissions
and avert climate disaster. The Natural Resources Defense Council and Coalition for Green
Capital estimate that based on Connecticut, its market size, growth rate, and private-public
leverage ratio, that a green bank – like the Connecticut Green Bank – successfully operating in
every state in America would yield $200 billion in national annual investment within 5 years, with
90% of funds coming from private sources and all public contributions returned over 10 to 20
years.
Responsible Public Investment in Green Energy The Green Bank receives funding through a number of sources, including a Systems Benefit
Charge, the Regional Greenhouse Gas Initiative (RGGI), renewable energy certificate (REC) sales
and the federal government. The Green Bank’s predecessor organization’s programs were all
structured as grants, which meant the funds were spent with no expectation of return. This model
put the organization at the mercy of these funding streams which, while reliable, are largely
determined by activities outside of our control such as levels of state electricity use and RGGI
allowance prices. With the transition to a new financing model, the Green Bank is able to invest
its funds in activities that earn a return and begin to build revenue streams that can be reinvested
in green energy in Connecticut.
5 Green Growth: A U.S. Program for Controlling Climate Change and Expanding Job Opportunities by the Center for American
Progress (September 2014)

III
Acknowledgements
First and foremost, we would like to thank the Staff of the Connecticut Green Bank. In our first
five years, through their hard work, commitment and innovation, we have built a model that is
delivering results for our state and serving as a model across the country and around the world.
We are grateful to our independent auditors, Blum Shapiro & Company, for their assistance and
advice during the course of this audit, and for supporting our interests in continuing to disclose not
only our financial position, but also the public benefits to society resulting from our public-private
investments.
Finally, we thank the Board of Directors for their continued leadership and guidance as we
continue to prove that there is a new model for how government is able to play a part in deploying
more green energy at a faster pace while using public resources responsibly.
Respectfully submitted,
Bryan T. Garcia
President and CEO
George Bellas
Vice President – Finance and Administration

IV
Board of Directors
Connecticut Green Bank Position Status Voting Name Organization
State Treasurer (or designee) Ex Officio Yes Bettina Ferguson Treasurer’s Office
Commissioner of DEEP6 (or designee) Ex Officio Yes Robert Klee7 DEEP
Commissioner of DECD8 (or designee) Ex Officio Yes Catherine Smith9 DECD
Residential or Low Income Group Appointed Yes Pat Wrice Operation Fuel
Investment Fund Management Appointed Yes Norma Glover NJG Associates
Environmental Organization Appointed Yes Matthew Ranelli10 Shipman & Goodwin
Finance or Deployment Appointed Yes Thomas Flynn Environmental Data Resources
Finance of Renewable Energy Appointed Yes Reed Hundt11 Coalition for Green Capital
Finance of Renewable Energy Appointed Yes Kevin Walsh GE Energy Financial Services
Labor Appointed Yes John Harrity IAM Connecticut
R&D or Manufacturing Appointed Yes Mun Choi University of Connecticut
President of the Green Bank Ex Officio No Bryan Garcia Connecticut Green Bank
Board of Connecticut Innovations12 Ex Officio No (unfilled) (unfilled)
Discretely Presented Component Units Position Name
President Bryan Garcia
Treasurer George Bellas
Secretary Brian Farnen
Chief Investment Officer Roberto Hunter
6 Department of Energy and Environmental Protection 7 Vice Chairperson of the Board of Directors and Chairperson of the Budget and Operations Committee 8 Department of Economic and Community Development 9 Chairperson of the Board of Directors 10 Secretary of the Board of Directors and Chairperson of the Audit, Compliance and Governance Committee 11 Chairperson of the Deployment Committee 12 It should be noted that several members of the Board of Directors of the Green Bank currently serve on the Board of Directors of Connecticut Innovations, including Mun Choi and Catherine Smith.

V
Organizational Chart
Statutory & Infrastructure
Residential Commercial & Industrial
Institutional
Legal & Policy
Accounting
Operations
Marketing
Finance
Board of Directors
President & CEO

VI

FINANCIAL SECTION

1
INDEPENDENT AUDITORS’ REPORT
To the Board of Directors
Connecticut Green Bank
Report on the Financial Statements
We have audited the accompanying financial statements of the business-type activities and
discretely presented component units of the Connecticut Green Bank (CGB) (a component unit of
the State of Connecticut) as of and for the fiscal year ended June 30, 2016, and the related notes to
the financial statements, which collectively comprise CGB’s basic financial statements, as listed
in the table of contents.
Management’s Responsibility for the Financial Statements
Management is responsible for the preparation and fair presentation of these financial statements
in accordance with accounting principles generally accepted in the United States of America; this
includes the design, implementation, and maintenance of internal control relevant to the
preparation and fair presentation of financial statements that are free from material misstatement,
whether due to fraud or error.
Auditors’ Responsibility
Our responsibility is to express opinions on these financial statements based on our audits. We
conducted our audits in accordance with auditing standards generally accepted in the United States
of America and the standards applicable to financial audits contained in Government Auditing
Standards, issued by the Comptroller General of the United States. Those standards require that
we plan and perform the audit to obtain reasonable assurance about whether the financial
statements are free from material misstatement.
An audit involves performing procedures to obtain audit evidence about the amounts and
disclosures in the financial statements. The procedures selected depend on the auditors’ judgment,
including the assessment of the risks of material misstatement of the financial statements whether
due to fraud or error. In making those risk assessments, the auditor considers internal control
relevant to the entity’s preparation and presentation of the financial statements in order to design
audit procedures that are appropriate in the circumstances, but not for the purpose of expressing
an opinion on the effectiveness of the entity’s internal control. Accordingly, we express no such
opinion. An audit also includes evaluating the appropriateness of accounting policies used and the
reasonableness of significant accounting estimates made by management, as well as evaluating the
overall presentation of the financial statements.

2
We believe that the audit evidence we have obtained is sufficient and appropriate to provide a basis
for our audit opinions.
Opinions
In our opinion, the financial statements referred to above present fairly, in all material respects,
the respective financial position of the business-type activities and the discretely presented
component units of the Connecticut Green Bank as of June 30, 2016, and the respective changes
in financial position and cash flows for the year then ended in accordance with accounting
principles generally accepted in the United States of America.
Change in Method of Accounting for Pensions
As described in Note 2 to the financial statements, CGB changed its method for accounting and
financial reporting for pensions as a result of the adoption of Governmental Accounting Standards
Board (GASB) Statement No. 68, Accounting and Financial Report Reporting for Pensions – an
Amendment of GASB Statement No. 27 and GASB Statement No. 71, Pension Transition for
Contributions Made Subsequent To the Measurement Date – an Amendment of GASB Statement
No. 68, both effective July 1, 2014. Our opinion is not modified with respect to this matter.
Other Matters
Required Supplementary Information
Accounting principles generally accepted in the United States of America require that the
Management’s Discussion and Analysis and schedule of Green Bank’s proportionate share of the
net pension liability and proportionate share of contributions to the state employees’ retirement
system (SERS) be presented to supplement the financial statements. Such information, although
not a part of the financial statements, is required by the Governmental Accounting Standards Board
who considers it to be an essential part of financial reporting for placing the financial statements
in an appropriate operational, economic, or historical context. We have applied certain limited
procedures to the required supplementary information in accordance with auditing standards
generally accepted in the United States of America, which consisted of inquiries of management
about the methods of preparing the information and comparing the information for consistency
with management’s responses to our inquiries, the financial statements, and other knowledge we
obtained during our audit of the financial statements. We do not express an opinion or provide
any assurance on the information because the limited procedures do not provide us with sufficient
evidence to express an opinion or provide assurance.
Other Information
The introductory section, financial statistical section and other statistical section have not been
subjected to the auditing procedures applied in the audit of the basic financial statements, and
accordingly, we do not express an opinion or provide any assurance on them.

3
Other Reporting Required by Government Auditing Standards
In accordance with Government Auditing Standards, we have also issued our report dated XXXX
XX, 2016, on our consideration of the Connecticut Green Bank’s internal control over financial
reporting and on our tests of its compliance with certain provisions of laws, regulations, contracts,
and grant agreements and other matters. The purpose of that report is to describe the scope of our
testing of internal control over financial reporting and compliance and the results of that testing,
and not to provide an opinion on internal control over financial reporting or on compliance. That
report is an integral part of an audit performed in accordance with Government Auditing Standards
in considering the Connecticut Green Bank’s internal control over financial reporting and
compliance.
Hartford, CT
XXXX XX, 2016
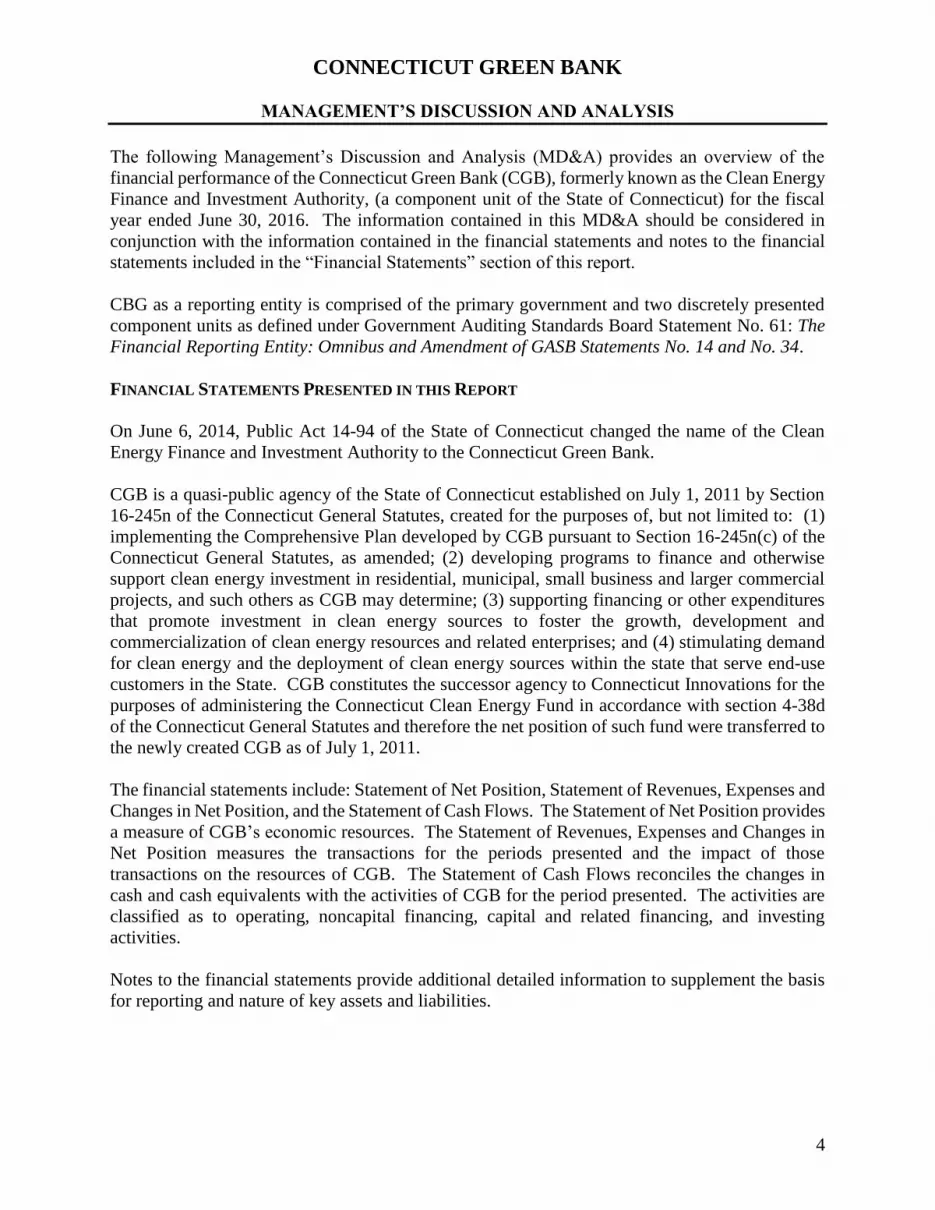
CONNECTICUT GREEN BANK
MANAGEMENT’S DISCUSSION AND ANALYSIS
4
The following Management’s Discussion and Analysis (MD&A) provides an overview of the
financial performance of the Connecticut Green Bank (CGB), formerly known as the Clean Energy
Finance and Investment Authority, (a component unit of the State of Connecticut) for the fiscal
year ended June 30, 2016. The information contained in this MD&A should be considered in
conjunction with the information contained in the financial statements and notes to the financial
statements included in the “Financial Statements” section of this report.
CBG as a reporting entity is comprised of the primary government and two discretely presented
component units as defined under Government Auditing Standards Board Statement No. 61: The
Financial Reporting Entity: Omnibus and Amendment of GASB Statements No. 14 and No. 34.
FINANCIAL STATEMENTS PRESENTED IN THIS REPORT
On June 6, 2014, Public Act 14-94 of the State of Connecticut changed the name of the Clean
Energy Finance and Investment Authority to the Connecticut Green Bank.
CGB is a quasi-public agency of the State of Connecticut established on July 1, 2011 by Section
16-245n of the Connecticut General Statutes, created for the purposes of, but not limited to: (1)
implementing the Comprehensive Plan developed by CGB pursuant to Section 16-245n(c) of the
Connecticut General Statutes, as amended; (2) developing programs to finance and otherwise
support clean energy investment in residential, municipal, small business and larger commercial
projects, and such others as CGB may determine; (3) supporting financing or other expenditures
that promote investment in clean energy sources to foster the growth, development and
commercialization of clean energy resources and related enterprises; and (4) stimulating demand
for clean energy and the deployment of clean energy sources within the state that serve end-use
customers in the State. CGB constitutes the successor agency to Connecticut Innovations for the
purposes of administering the Connecticut Clean Energy Fund in accordance with section 4-38d
of the Connecticut General Statutes and therefore the net position of such fund were transferred to
the newly created CGB as of July 1, 2011.
The financial statements include: Statement of Net Position, Statement of Revenues, Expenses and
Changes in Net Position, and the Statement of Cash Flows. The Statement of Net Position provides
a measure of CGB’s economic resources. The Statement of Revenues, Expenses and Changes in
Net Position measures the transactions for the periods presented and the impact of those
transactions on the resources of CGB. The Statement of Cash Flows reconciles the changes in
cash and cash equivalents with the activities of CGB for the period presented. The activities are
classified as to operating, noncapital financing, capital and related financing, and investing
activities.
Notes to the financial statements provide additional detailed information to supplement the basis
for reporting and nature of key assets and liabilities.

CONNECTICUT GREEN BANK
MANAGEMENT’S DISCUSSION AND ANALYSIS
5
FINANCIAL HIGHLIGHTS OF FISCAL 2016
NET POSITION
Net position increased by $18.2 million to $127.4 million at June 30, 2016 and cash and cash
equivalents increased by $9.1 million in 2016 to $57.8 million.
The acquisition of $3.5 million in bonds was a part of the proceeds received by CGB as a result of
the sale of CPACE program loans during fiscal years 2014 through 2016. See Note 6. Solar lease
notes decreased $811,000 as a result of scheduled principal repayments. See Note 7. The decrease
in program loans in 2016 to $33.3 million as compared to $40.5 million in 2015 was primarily a
result of the sale of CPACE loans held in the CGB portfolio to an outside investor. See Note 8.
Capital assets increased to $57.9 million in 2016 compared to $27.0 million in 2015 as a result of
the continued acquisition of solar equipment by CT Solar Lease 2 LLC. See Note 1 for further
discussion of CT Solar Lease 2 LLC’s operations.
As of June 30, 2016, the Board of Directors designated $95.3 million in net position to fund
contingent grant, loan and investment commitments as described in Note 15. These grants, loans
and investments are expected to be paid or funded over the next one to six fiscal years.
The following table summarizes the net position of the reporting entity at June 30, 2016 and 2015
(in thousands):

CONNECTICUT GREEN BANK
MANAGEMENT’S DISCUSSION AND ANALYSIS
6
Increase
2016 2015 (Decrease)
Cash and cash equivalents 57,822$ 48,693$ 9,129$
Bonds receivable 3,492 1,600 1,892
Portfolio investments 1,000 1,000 --
Solar lease notes 9,008 9,819 (811)
Program loans 33,268 40,518 (7,250)
Capital assets, net 65,927 26,971 38,956
Other assets 6,061 8,972 (2,911)
Total Assets 176,578 137,573 39,005
Deferred Outflows of Resources
Deferred amount for pensions 2,573 1,669 904
Total Deferred Outflows of Resources 2,573 1,669 904
Current liabilities 6,612 6,825 (213)
Unrearned revenue 6,258 2,519 3,739
Pension liabilities 16,096 14,900 1,196
Other long term liabilities 2,528 1,093 1,435
Long term debt, less current maturities 18,648 3,546 15,102
Total Liabilities 50,142 28,883 21,259
Deferred Inflows of Resources
Fair value of interest rate swap 1,628 660 968
Deferred amount for pensions (3) 532 (535)
Total Deferred Outflows of Resources 1,625 1,192 433
Invested in capital assets 57,864 26,971 30,893
Restricted Net Position:
Non-expendable 1 1 --
Restricted - energy programs 9,750 8,799 951
Unrestricted 59,769 73,396 (13,627)
Total Net Position 127,384$ 109,167$ 18,217$

CONNECTICUT GREEN BANK
MANAGEMENT’S DISCUSSION AND ANALYSIS
7
CHANGES IN NET POSITION
Revenue from interest on cash deposits and promissory notes increased $ 705,000 to $3.0 million
in 2016. CGB received $6.5 million from the State in RGGI auction proceeds during the year as
compared to RGGI auction proceeds of $16.6 million in 2015. Public Act 13-247, see Note 11,
allowed the Commissioner of the Connecticut Department of Energy and Environmental
Protection to transfer additional RGGI auction proceeds to CGB to be used to support energy
efficiency financing opportunities. This increase in RGGI auction proceeds helped offset
payments to the State by CGB required under Public Act 13-247 during fiscal year 2015.
Total expenditures for grants and programs in 2016 were $27.2 million, an increase of $5.1 million
when compared to the total expenditures of $22.1 million in 2015. Included in these totals are
payments representing financial incentives to residential and commercial property owners to install
renewable energy or energy efficiency measures of $12.8 million in 2016 and 11.3 million in 2015.
These financial incentives and the associated costs to administer these payments fluctuate from
year to year as they are based on the achievement of contract milestones established by each CGB
program.
General and administrative expenses increased by $1.5 million in 2016 to $4.6 million compared
to $3.1 million in 2015 primarily as a result of new marketing and branding initiatives undertaken
in 2016.
The following table summarizes the changes in net position between June 30, 2016 and 2015 (in
thousands):

CONNECTICUT GREEN BANK
MANAGEMENT’S DISCUSSION AND ANALYSIS
8
Changes in Net Position
(in thousands)
Increase
2016 2015 (Decrease)
Revenues 37,788$ 46,294$ (8,506)$
Operating Expenses
Grants and programs 27,228 22,131 5,097
General and administrative expense 4,630 3,117 1,513
Total Operating Expenses 31,858 25,248 6,610
Operating Income 5,930 21,046 (15,116)
Non-Operating Revenues (Expenses)
Interest earned 3,017 2,312 705
Interest expense (731) (119) (612)
Investment loss (3) (1,180) 1,177
Unrealized loss on interest rate swap (968) (660) (308)
Provision for loan losses (1,022) (564) (458)
Capital contribution 12,294 6,844 5,450
Distribution to member (301) (105) (196)
Payments to State of Connecticut -- (19,200) 19,200
Net Change 18,216$ 8,374$ 9,842$

CONNECTICUT GREEN BANK
MANAGEMENT’S DISCUSSION AND ANALYSIS
9
FINANCIAL HIGHLIGHTS OF FISCAL 2015
NET POSITION
Net position increased by $8.4 million to $109.1 million at June 30, 2015 and cash and cash
equivalents decreased by $32 million in 2015 to $48.7 million.
The acquisition of $1.6 million in bonds was a part of the proceeds received by CGB as a result of
the sale of CPACE program loans during fiscal year 2014. See Note 6. Solar lease notes decreased
$0.7 million as a result of scheduled principal repayments. See Note 7. The increase in program
loans in 2015 to $40.5 million as compared to $13.4 million in 2014 was primarily a result of
increased CGB financings of CPACE and residential solar projects. See Note 8. Capital assets
increased to $27.0 million from $3.1 million in 2015 as a result of the continued acquisition of
solar equipment by CT Solar Lease 2 LLC. See Note 1 for further discussion of CT Solar Lease
2 LLC’s operations.
As of June 30, 2015, the Board of Directors designated $89.5 million in net position to fund
contingent grant, loan and investment commitments as described in Note 15. These grants, loans
and investments are expected to be paid or funded over the next one to six fiscal years. In addition
to these commitments, an additional $23 million has been designated by the Board to fund future
program commitments.
The following table summarizes the net position at June 30, 2015 and 2014 (in thousands):

CONNECTICUT GREEN BANK
MANAGEMENT’S DISCUSSION AND ANALYSIS
10
Increase
2015 2014 (Decrease)
Cash and cash equivalents 48,693$ 80,925$ (32,232)$
Bonds receivable 1,600 1,600 --
Portfolio investments 1,000 1,000 --
Solar lease notes 9,819 10,544 (725)
Program loans 40,518 13,403 27,115
Capital assets, net 26,971 3,074 23,897
Other assets 8,971 9,943 (972)
Total Assets 137,572 120,489 17,083
Deferred Outflows of Resources
Deferred amount for pensions 1,669 -- 1,669
Total Deferred Outflows of Resources 1,669 -- 1,669
Current liabilities 6,825 4,801 2,024
Unrearned revenue 2,519 469 2,050
Pension liabilities 14,900 14,305 595
Other long term liabilities 1,093 -- 1,093
Long term debt, less current maturities 3,546 121 3,425
Total Liabilities 28,883 19,696 9,187
Deferred Inflows of Resources
Fair value of interest rate swap 660 -- 660
Deferred amount for pensions 532 -- 532
Total Deferred Outflows of Resources 1,192 -- 1,192
Invested in capital assets 26,971 3,074 23,897
Restricted Net Position:
Non-expendable 1 1 --
Restricted - energy programs 8,799 9,096 (297)
Unrestricted 73,396 88,622 (15,226)
Total Net Position 109,167$ 100,793$ 8,374$
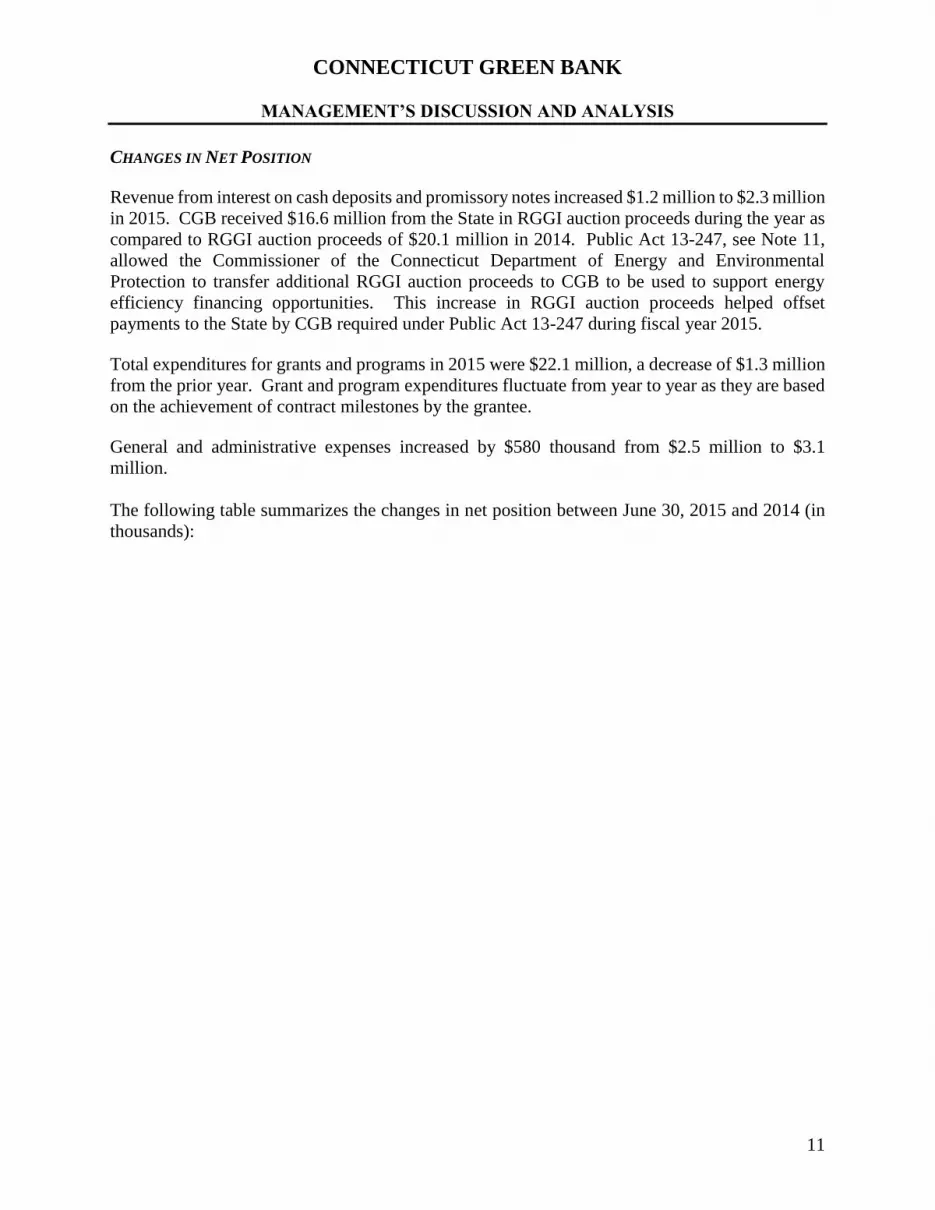
CONNECTICUT GREEN BANK
MANAGEMENT’S DISCUSSION AND ANALYSIS
11
CHANGES IN NET POSITION
Revenue from interest on cash deposits and promissory notes increased $1.2 million to $2.3 million
in 2015. CGB received $16.6 million from the State in RGGI auction proceeds during the year as
compared to RGGI auction proceeds of $20.1 million in 2014. Public Act 13-247, see Note 11,
allowed the Commissioner of the Connecticut Department of Energy and Environmental
Protection to transfer additional RGGI auction proceeds to CGB to be used to support energy
efficiency financing opportunities. This increase in RGGI auction proceeds helped offset
payments to the State by CGB required under Public Act 13-247 during fiscal year 2015.
Total expenditures for grants and programs in 2015 were $22.1 million, a decrease of $1.3 million
from the prior year. Grant and program expenditures fluctuate from year to year as they are based
on the achievement of contract milestones by the grantee.
General and administrative expenses increased by $580 thousand from $2.5 million to $3.1
million.
The following table summarizes the changes in net position between June 30, 2015 and 2014 (in
thousands):

CONNECTICUT GREEN BANK
MANAGEMENT’S DISCUSSION AND ANALYSIS
12
REQUESTS FOR INFORMATION
This financial report is designed to provide a general overview of CGB’s finances. Questions
concerning any of the information provided in this report or request for additional financial
information should be addressed to the Office of Finance and Administration, 845 Brook Street,
Rocky Hill, Connecticut 06067.
Changes in Net Position
(in thousands)
Increase
2015 2014 (Decrease)
Revenues 46,294$ 48,754$ (2,460)$
Operating Expenses
Grants and programs 22,131 23,439 (1,308)
General and administrative expense 3,117 2,537 580
Total Operating Expenses 25,248 25,976 (728)
Operating Income 21,046 22,778 (1,732)
Non-Operating Revenues (Expenses)
Interest earned 2,312 1,142 1,170
Interest expense (119) -- (119)
Investment loss (1,180) -- (1,180)
Unrealized loss on interest rate swap (660) -- (660)
Provision for loan losses (564) (1,311) 747
Capital contribution 6,844 201 6,643
Distribution to member (105) (12) (93)
Payments to State of Connecticut (19,200) (6,200) (13,000)
Net Change 8,374$ 16,598$ (8,224)$

CONNECTICUT GREEN BANK
STATEMENT OF NET POSITION
JUNE 30, 2016
(With Summarized Totals for June 30, 2015)
The accompanying notes are an integral part of these financial statements.
13
Total Primary
Government
Assets
Current Assets
Cash and cash equivalents 41,569,388$ 1,381,506$ 5,121,165$ --$ 48,072,060$ 39,893,649$
Accounts receivable 1,408,922 21,700 -- -- 1,430,621 35,155
Utility remittance receivable 2,670,634 -- -- -- 2,670,634 2,518,850
Other receivables 264,197 165,805 -- -- 430,002 313,228
Due from component units 44,346,437 574,723 4,407,273 (49,328,433) -- --
Prepaid expenses and other assets 3,286,803 959,003 -- -- 4,245,806 1,030,251
Contractor loans 2,272,906 -- -- -- 2,272,906 3,112,663
Current portion of solar lease notes 845,479 -- -- -- 845,479 803,573
Current portion of portfolio investments 884,739 -- -- -- 884,739 10,264,825
Total Current Assets 97,549,505 3,102,737 9,528,438 (49,328,433) 60,852,247 57,972,194
Noncurrent Assets
Portfolio investments 1,000,000 -- -- -- 1,000,000 1,000,000
Bonds receivable 3,492,282 -- -- -- 3,492,282 1,600,000
Solar Lease Notes, less current portion 8,162,635 -- -- -- 8,162,635 9,015,437
Program loans, less current portion 32,382,778 -- -- -- 32,382,778 30,253,119
Renewable Energy Certificates 812,772 -- -- -- 812,772 933,054
Investment in component units 100 -- 20,982,892 (20,982,992) -- --
Capital assets, net of depreciation and amortization 248,752 65,678,491 -- (8,063,456) 57,863,787 26,971,087
Asset retirement obligation,net -- 2,261,472 -- -- 2,261,472 1,029,196
Restricted assets: -- -- -- -- -- --
Cash and cash equivalents 5,249,983 4,500,000 -- -- 9,749,983 8,799,005
Total Noncurrent Assets 51,349,302 72,439,963 20,982,892 (29,046,448) 115,725,709 79,600,898
Total Assets 148,898,807$ 75,542,701$ 30,511,330$ (78,374,881)$ 176,577,957$ 137,573,092$
Deferred Outflows of Resources
Deferred amount for pensions 2,572,833 -- -- -- 2,572,833 1,669,961
Total Deferred Outflows of Resources 2,572,833$ -$ -$ -$ 2,572,833$ 1,669,961$
CT Solar Lease
2 LLC
CEFIA Solar
Services Inc. Eliminating Entries
2016 Total
Reporting Entity
2015 Total
Reporting Entity
Discretely Presented Component Units
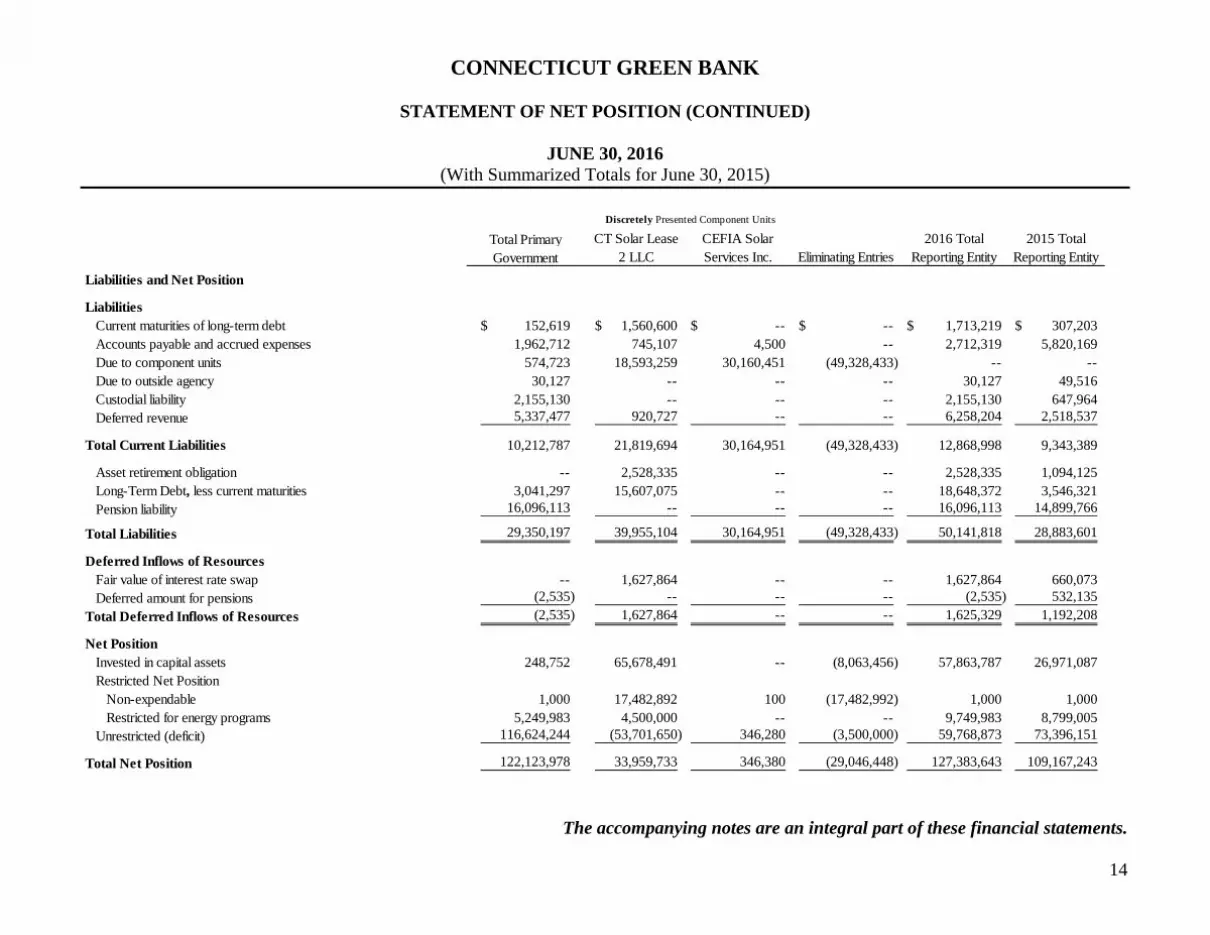
CONNECTICUT GREEN BANK
STATEMENT OF NET POSITION (CONTINUED)
JUNE 30, 2016
(With Summarized Totals for June 30, 2015)
The accompanying notes are an integral part of these financial statements.
14
Total Primary
Government
Liabilities and Net Position
Liabilities
Current maturities of long-term debt 152,619$ 1,560,600$ --$ --$ 1,713,219$ 307,203$
Accounts payable and accrued expenses 1,962,712 745,107 4,500 -- 2,712,319 5,820,169
Due to component units 574,723 18,593,259 30,160,451 (49,328,433) -- --
Due to outside agency 30,127 -- -- -- 30,127 49,516
Custodial liability 2,155,130 -- -- -- 2,155,130 647,964
Deferred revenue 5,337,477 920,727 -- -- 6,258,204 2,518,537
Total Current Liabilities 10,212,787 21,819,694 30,164,951 (49,328,433) 12,868,998 9,343,389
Asset retirement obligation -- 2,528,335 -- -- 2,528,335 1,094,125
Long-Term Debt, less current maturities 3,041,297 15,607,075 -- -- 18,648,372 3,546,321
Pension liability 16,096,113 -- -- -- 16,096,113 14,899,766
Total Liabilities 29,350,197 39,955,104 30,164,951 (49,328,433) 50,141,818 28,883,601
Deferred Inflows of Resources
Fair value of interest rate swap -- 1,627,864 -- -- 1,627,864 660,073
Deferred amount for pensions (2,535) -- -- -- (2,535) 532,135
Total Deferred Inflows of Resources (2,535) 1,627,864 -- -- 1,625,329 1,192,208
Net Position
Invested in capital assets 248,752 65,678,491 -- (8,063,456) 57,863,787 26,971,087
Restricted Net Position
Non-expendable 1,000 17,482,892 100 (17,482,992) 1,000 1,000
Restricted for energy programs 5,249,983 4,500,000 -- -- 9,749,983 8,799,005
Unrestricted (deficit) 116,624,244 (53,701,650) 346,280 (3,500,000) 59,768,873 73,396,151
Total Net Position 122,123,978 33,959,733 346,380 (29,046,448) 127,383,643 109,167,243
2016 Total
Reporting Entity
2015 Total
Reporting Entity
Discretely Presented Component Units
Eliminating Entries
CT Solar Lease
2 LLC
CEFIA Solar
Services Inc.

CONNECTICUT GREEN BANK
STATEMENT OF REVENUES, EXPENSES, AND CHANGES IN NET POSITION
FOR THE YEAR ENDED JUNE 30, 2016
(With Summarized Totals for the Year Ended June 30, 2015)
The accompanying notes are an integral part of these financial statements.
15
Total Primary CT Solar CEFIA Solar
Government Lease 2 LLC Services, Inc. Eliminations
Operating Revenues
Utility remittances 26,605,084$ --$ --$ --$ 26,605,084$ 27,233,987$
Grant revenue 589,917 -- -- -- 589,917 192,274
RGGI auction proceeds 6,481,562 -- -- -- 6,481,562 16,583,545
Energy system sales 32,767,009 -- -- (32,767,009) 0 16,688
REC sales 2,419,990 233,793 -- -- 2,653,783 1,474,488
Other income 387,320 2,182,803 126,075 (1,238,311) 1,457,887 793,435
Total Operating Revenues 69,250,883 2,416,595 126,075 (34,005,320) 37,788,234 46,294,417
Operating Expenses
Cost of goods sold - energy systems 28,826,976 -- -- (28,826,976) -- --
Grants and program expenditures 25,261,516 3,078,633 -- (1,112,236) 27,227,913 22,130,677
General and administrative expenses 4,445,648 305,217 4,750 (126,075) 4,629,540 3,117,376
Total Operating Expenses 58,534,141 3,383,850 4,750 (30,065,287) 31,857,453 25,248,053
Operating Income 10,716,743 (967,254) 121,325 (3,940,033) 5,930,780 21,046,364
Nonoperating Revenue (Expenses)
Interest income - prommisory notes 2,895,503 -- -- -- 2,895,503 2,217,368
Interest income - short term cash deposits 92,536 27,777 300 -- 120,613 93,949
Interest expenses LT debt (61,795) (669,043) -- -- (730,838) (119,345)
Interest income - component units 60,127 -- -- (60,127) -- --
Interest expense - component units -- (60,127) -- 60,127 -- --
Payments to State of Connecticut -- -- -- -- -- (19,200,000)
Distributions to member -- (301,548) -- -- (301,548) (104,579)
Realized loss on investments (2,936) -- -- -- (2,936) (1,180,285)
Unrealized gain (loss) on interest rate swap -- (967,791) -- -- (967,791) (660,073)
Provision for loan losses (1,021,826) -- -- -- (1,021,826) (563,825)
Total Nonoperating Revenue (Expenses) 1,961,609 (1,970,732) 300 -- (8,823) (19,516,790)
2016 Total
Reporting Entity
2015 Total
Reporting Entity
Discretely Presented Component Units
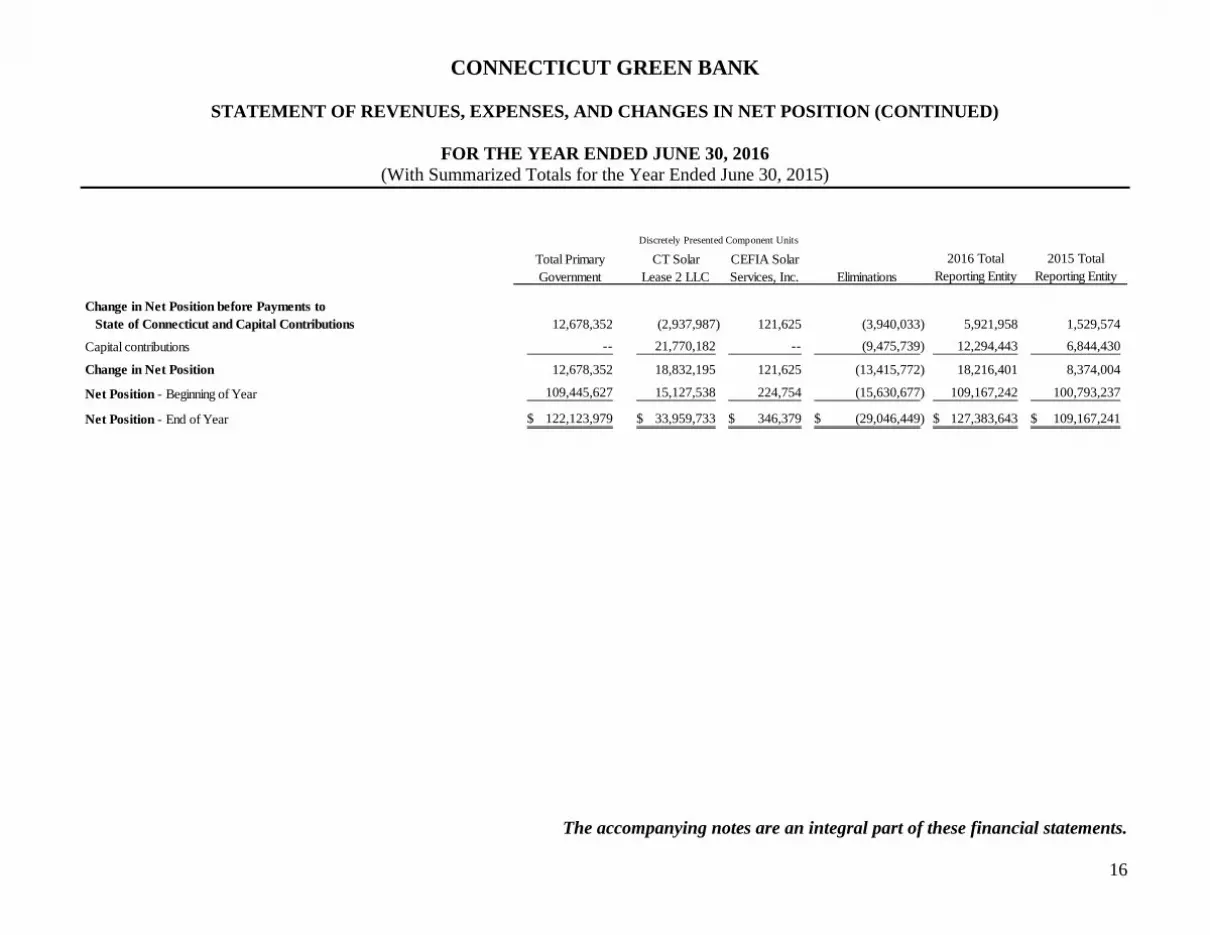
CONNECTICUT GREEN BANK
STATEMENT OF REVENUES, EXPENSES, AND CHANGES IN NET POSITION (CONTINUED)
FOR THE YEAR ENDED JUNE 30, 2016
(With Summarized Totals for the Year Ended June 30, 2015)
The accompanying notes are an integral part of these financial statements.
16
Total Primary CT Solar CEFIA Solar
Government Lease 2 LLC Services, Inc. Eliminations
Change in Net Position before Payments to
State of Connecticut and Capital Contributions 12,678,352 (2,937,987) 121,625 (3,940,033) 5,921,958 1,529,574
Capital contributions -- 21,770,182 -- (9,475,739) 12,294,443 6,844,430
Change in Net Position 12,678,352 18,832,195 121,625 (13,415,772) 18,216,401 8,374,004
Net Position - Beginning of Year 109,445,627 15,127,538 224,754 (15,630,677) 109,167,242 100,793,237
Net Position - End of Year 122,123,979$ 33,959,733$ 346,379$ (29,046,449)$ 127,383,643$ 109,167,241$
2016 Total
Reporting Entity
2015 Total
Reporting Entity
Discretely Presented Component Units

CONNECTICUT GREEN BANK
STATEMENT OF CASH FLOWS
FOR THE YEAR ENDED JUNE 30, 2016
(With Summarized Totals for the Year Ended June 30, 2015)
The accompanying notes are an integral part of these financial statements.
17
Total Primary CT Solar CEFIA Solar Eliminating
Government Lease 2 LLC Services, Inc. Entries 2016 2015 2014
Cash Flows from Operating Activities
Sales of energy systems 35,128,140$ --$ --$ (35,128,140) --$ 10,943$ --$
Sales of Renewable Energy Certificates 2,443,524 - - - 2,443,524 1,705,932 378,444
Utility company remittances 26,453,300 -- -- -- 26,453,300 28,117,538 26,981,768
Grants 1,050,204 -- -- -- 1,050,204 139,487 400,766
RGGI auction proceeds 5,313,666 -- -- -- 5,313,666 21,078,165 17,520,889
Other income 454,393 865,226 -- -- 1,319,620 688,944 204,322
Lease payments received -- 977,337 -- -- 977,337 519,377 451,339
Grant and program expenditures (13,219,423) (1,543,473) -- -- (14,762,895) (11,331,214) (7,897,133)
Grants, incentives and credit enhancements (10,718,424) -- -- -- (10,718,424) (9,800,594) (13,313,611)
Purchases of energy equipment (34,278,293) -- -- -- (34,278,293) (19,989,550) --
General and administrative expenditures (4,350,882) (179,791) (4,450) -- (4,535,123) (3,806,822) (2,354,525)
Net Cash Provided by (Used in) Operating Activities 8,276,206 119,300 (4,450) (35,128,140) (26,737,083) 7,332,206 22,372,259
Cash Flows from Non-capital Financing Activities
Payments to State of Connecticut -- -- -- -- -- (19,200,000) (6,200,000)
Advances to CGB component units (15,762,500) -- (3,413,198) 19,175,698 -- -- --
Advances from CGB and component units 217,500 3,413,198 15,545,000 (19,175,698) -- -- --
Repayments of Advances (to) from component units -- (8,350,000) 8,350,000 -- -- -- --
Net Cash Provided by (Used in) Non-capital Financing Activities (15,545,000) (4,936,802) 20,481,802 -- -- (19,200,000) (6,200,000)
Cash Flows from Capital and Related Financing Activities
Purchase of capital assets (67,645) (35,128,140) -- 35,128,140 (67,645) (89,808) (79,713)
Proceeds from long-term debt 2,510,837 15,000,000 -- -- 17,510,837 3,932,272 122,463
Repayment of long-term debt (170,445) (702,275) -- -- (872,720) (232,432) --
Interest expense (61,795) (705,522) -- -- (767,318) (89,585) --
Capital contributions from/(to) component entities -- 15,425,739 (15,425,739) -- -- -- --
Capital contributions from Firststar Development, LLC -- 12,294,443 -- -- 12,294,443 6,844,430 201,434
Return of capital to Firststar Development, LLC -- (219,969) -- -- (219,969) (86,336) (12,584)
Net Cash Provided by (Used in) Capital and Related Financing Activities 2,210,952 5,964,275 (15,425,739) 35,128,140 27,877,628 10,278,541 231,600
Cash Flows from Investing Activities
Return of principal on WC & program loans 26,646,236 -- -- -- 26,646,236 2,332,356 7,022,954
Interest on short-term investments, cash, solar lease notes and loans 2,200,748 14,016 300 -- 2,215,065 887,457 450,899
Discretely Presented Component Units

CONNECTICUT GREEN BANK
STATEMENT OF CASH FLOWS (CONTINUED)
FOR THE YEAR ENDED JUNE 30, 2016
(With Summarized Totals for the Year Ended June 30, 2015)
The accompanying notes are an integral part of these financial statements.
18
Total Primary CT Solar CEFIA Solar Eliminating
Government Lease 2 LLC Services, Inc. Entries 2016 2015 2014
Cash Flows from Investing Activities (Continued)
Interest on short-term investments and cash deposits -- -- -- -- -- -- --
Interest on solar lease notes -- -- -- -- -- -- --
Program loan disbursements -- -- -- -- -- -- --
CPACE program loan disbursements (14,888,372)$ --$ --$ --$ (14,888,372)$ (22,181,032)$ (14,700,337)$
Grid Tied program loan disbursements (911,249) -- -- -- (911,249) (1,166,205) (2,375,000)
AD/CHP program loan disbursements -- -- -- -- -- -- (150,000)
Alpha/Operational Demo program loan disbursements (350,000) -- -- -- (350,000) (100,000) (516,200)
Energy Efficiency program loan disbursements -- -- -- -- -- (89,000) (75,000)
Campus Efficiency NOW program loan disbursements -- -- -- -- -- (396,662) (315,669)
HOPBI program loan disbursements (1,684,862) -- -- -- (1,684,862) (4,443,148) --
Residential Solar Loan program disbursements (3,037,973) -- -- -- (3,037,973) (5,486,610) (805,484)
Net Cash Used in Investing Activities 7,974,529 14,016 300 -- 7,988,845 (30,642,844) (11,463,837)
Net Increase (Decrease) in Cash and Cash Equivalents 2,916,686 1,160,790 5,051,913 -- 9,129,390 (32,232,097) 4,940,022
Cash and Cash Equivalents - Beginning of Year 43,902,687 4,720,716 69,252 -- 48,692,655 80,924,749 77,641,671
Cash and Cash Equivalents - End of Year 46,819,373$ 5,881,506$ 5,121,165$ --$ 57,822,045$ 48,692,652$ 82,581,693$
Reconciliation of Operating Loss to Net Cash
Provided by (Used in) Operating Activities:
Operating income (loss) 10,716,743$ --$ --$ --$ 10,716,743$ 21,046,364$ 22,221,885$
Adjustments to reconcile operating loss
to net cash provided by (used in) operating activities:
Depreciation -- -- -- -- -- 519,502 141,343
Other -- -- -- -- -- -- 671,994
Changes in operating assets and liabilities:
(Increase)decrease in operating assets -- -- -- -- -- (16,743,102) (7,812,250)
(Decrease)increase in operating liabilities -- -- -- -- -- 2,509,442 7,149,287
Net Cash Provided by (Used in) Operating Activities 10,716,743$ --$ --$ --$ 10,716,743$ 7,332,206$ 22,372,259$
Discretely Presented Component Units

CONNECTICUT GREEN BANK
NOTES TO FINANCIAL STATEMENTS
FOR THE YEAR ENDED JUNE 30, 2016
19
NOTE 1 – NATURE OF OPERATIONS AND SIGNIFICANT ACCOUNTING POLICIES
NATURE OF OPERATIONS
The Connecticut Green Bank (CGB) was established in July 2011 under Title 16, Sec. 16-245n
of the General Statutes of the State of Connecticut as the successor entity of the Connecticut
Clean Energy Fund. CGB, a component unit of the State of Connecticut, was created to
promote energy efficiency and investment in renewable energy sources in accordance with a
comprehensive plan developed by it to foster the growth, development and commercialization
of renewable energy sources and related enterprises and stimulate demand for renewable
energy and deployment of renewable energy sources which serve end-use customers in the
State. CGB constitutes the successor agency to Connecticut Innovations Incorporated (CI), a
quasi-public agency of the State of Connecticut, for the purposes of administering the Clean
Energy Fund in accordance with section 4-38d of the Connecticut General Statutes and
therefore the net position of such fund were transferred to the newly created CGB as of July 1,
2011. Pursuant to Connecticut General Statute 4-38f, CGB is within CI for administrative
purposes only.
On June 6, 2014 Public Act 14-94 of the State of Connecticut changed the name of the Clean
Energy Finance and Investment Authority to the Connecticut Green Bank.
PRIOR-PERIOD SUMMARIZED FINANCIAL INFORMATION
The basic financial statements include certain prior-year summarized comparative information
in total but not at the level of detail required for a presentation in conformity with accounting
principles generally accepted in the United States of America. Accordingly, such information
should be read in conjunction with CGB’s financial statements for the year ended June 30,
2015, from which the summarized information was derived.

CONNECTICUT GREEN BANK
NOTES TO FINANCIAL STATEMENTS
FOR THE YEAR ENDED JUNE 30, 2016
20
NOTE 1 – NATURE OF OPERATIONS AND SIGNIFICANT ACCOUNTING POLICIES (CONTINUED)
RECENTLY ADOPTED ACCOUNTING PRONOUNCEMENTS
In June 2012, the GASB issued Statement No. 68, Accounting and Financial Reporting for
Pensions (GASB 68). The primary objective of this Statement is to improve the accounting
and financial reporting by state and local governments for pensions. It also improves
information provided by state and local governmental employers about financial support for
pensions that are provided by other entities. The provisions of this Statement are effective for
financial statements for periods beginning after June 15, 2014. The implementation of this
standard resulted in an adjustment to reduce CGB’s beginning net position by $15,430,912 as
of July 1, 2014.
In November 2013, GASB issued Statement No. 71, Pension Transaction for Contributions
Made Subsequent to the Measurement Date, an amendment of GASB 68 (GASB 71). The
objective of this statement is to address an issue regarding application of the transition
provisions of GASB 68. The issue relates to amounts associated with contributions, if any,
made by a state or local government employer on non-employer contributing entity to a defined
benefit pension plan after the measurement date of the government’s beginning net pension
liability. The provisions of this Statement are effective for financial statements for the periods
beginning after June 15, 2015. The implementation of this standard resulted in an adjustment
to increase CGB’s beginning net position by $1,125,502 as of July 1, 2014.
PRINCIPAL REVENUE SOURCES
The Public Utility Regulatory Authority (PURA) assesses a charge per kilowatt-hour to each
end-use customer of electric services provided by utility companies (excluding municipally
owned entities) in the state, which is paid to CGB and is the principal source of CGB’s revenue.
CGB may deploy the funds for loans, direct or equity investments, contracts, grants or other
actions that support energy efficiency projects and research, development, manufacture,
commercialization, deployment and installation of renewable energy technologies.

CONNECTICUT GREEN BANK
NOTES TO FINANCIAL STATEMENTS
FOR THE YEAR ENDED JUNE 30, 2016
21
NOTE 1 – NATURE OF OPERATIONS AND SIGNIFICANT ACCOUNTING POLICIES (CONTINUED)
PRINCIPAL REVENUE SOURCES (CONTINUED)
REPORTING ENTITY
CGB, as the primary government, follows the reporting requirements of Governmental
Accounting Standards Board (GASB) Statement No. 61 (The Financial Reporting Entity
Omnibus – an Amendment of GASB Statements No. 14 and No. 34) (the Statement) regarding
presentation of component units. The Statement modifies certain requirements for including
component units in the reporting entity, either by blending (recording their amounts as part of
the primary government), or discretely presenting them (showing their amounts separately in
the reporting entity’s financial statements). To qualify as a blended component unit, the unit
must meet one of the following criteria: (1) have substantively the same governing body as
that of the primary government, and either (A) a financial benefit or burden relationship exists
between the unit and the primary government, or (B) management of the primary government
(below the level of the governing body) has operational responsibility of the unit; (2) the unit
provides services or benefits exclusively or almost exclusively to the primary government; or
(3) the unit’s total debt outstanding, including leases, is expected to be repaid by resources of
the primary government. A unit which fails to meet the substantively the same governing
requirement may still be included as a discretely presented component unit, if the primary
government has appointed the voting majority of the component unit’s governance or met other
criteria specified in the Statement such as whether or not it would be misleading were the entity
to be excluded.

CONNECTICUT GREEN BANK
NOTES TO FINANCIAL STATEMENTS
FOR THE YEAR ENDED JUNE 30, 2016
22
NOTE 1 – NATURE OF OPERATIONS AND SIGNIFICANT ACCOUNTING POLICIES (CONTINUED)
REPORTING ENTITY (CONTINUED)
CGB established four legally separate for-profit entities whose collective purpose, at the
present time, is to administer the CGB’s solar energy programs. CGB believes to exclude any
of the entities from these financial statements would be misleading. Each entity is listed below,
along with whether it is included as a blended component unit (blended) or qualifies as a
discretely presented component unit (discrete) within these financial statements based on the
criteria previously described.
CEFIA Holdings LLC (blended)
A Connecticut limited liability company (LLC), 99% owned by CGB (1% owned by CI),
established to fund a portfolio of residential solar loans and, through its CT Solar Lease 2
program, to enable investment in solar photovoltaic and solar thermal equipment for the
benefit of Connecticut homeowners, businesses, not-for-profits and municipalities (the
“End Users”). CEFIA Holdings LLC acquires the initial title to the solar assets and
contracts with independent solar installers to complete the installation of the solar assets
and arrange for the leasing of the solar assets (or sale of energy under power purchase
agreements) to the End Users. CEFIA Holdings LLC is also responsible for procuring
insurance for the solar assets, operation and maintenance services as well as warranty
management services for the ultimate owner of the solar assets, CT Solar Lease 2 LLC, to
which CEFIA Holdings LLC sells the residential and commercial projects before the
projects are placed in service. After acquiring the residential and commercial projects, CT
Solar Lease 2 LLC administers the portfolio of projects with the assistance of AFC First
Financial Corporation. CGB’s board of directors acts as the governing authority of CEFIA
Holdings LLC. CGB appoints CGB employees to manage the operations of CEFIA
Holdings LLC. CGB is also financially responsible (benefit/burden) for CEFIA Holdings
LLC’s activities.
CT Solar Loan I LLC (blended)
A limited-liability company, wholly-owned by CEFIA Holdings LLC, CT Solar Loan I
LLC was established to make loans to residential property owners for the purpose of
purchasing and installing solar photovoltaic equipment. CGB’s board of directors acts as
the governing authority of CT Solar Loan I LLC. CGB appoints CGB employees to
manage the operations of CT Solar Loan I LLC. CGB is also financially responsible
(benefit/burden) for CT Solar Loan I LLC’s activities.

CONNECTICUT GREEN BANK
NOTES TO FINANCIAL STATEMENTS
FOR THE YEAR ENDED JUNE 30, 2016
23
NOTE 1 – NATURE OF OPERATIONS AND SIGNIFICANT ACCOUNTING POLICIES (CONTINUED)
REPORTING ENTITY (CONTINUED)
CEFIA Solar Services, Inc. (discrete)
A Connecticut corporation, 100% owned by CEFIA Holdings LLC, established to share in
the ownership risks and benefits derived from the leasing of solar photovoltaic and solar
thermal equipment and the sale of energy under power purchase agreements as managing
member of CT Solar Lease 2 LLC. CEFIA Solar Services, Inc. (“Solar Services”) has a
one percent ownership interest in CT Solar Lease 2 LLC and is its managing member.
Solar Services is responsible for performing all management and operational functions
pursuant to the Operating Agreement of CT Solar Lease 2 LLC. CGB through CEFIA
Holdings LLC directly appoints the board of directors of Solar Services. The primary
government’s intent for owning a controlling interest in Solar Services is to enhance its
ability to offer financing options to commercial entities and residents of Connecticut
wishing to install renewable energy equipment. CGB believes that to exclude Solar
Services from these financial statements would be misleading.
CT Solar Lease 2 LLC (discrete)
A Connecticut limited-liability company, CT Solar Lease 2 LLC acquires title to the
residential and commercial solar projects from the developer, CEFIA Holdings LLC, using
capital from its members along with non-recourse funding from participating banks.
Repayment to participating banks is predicated upon the property owner’s payment to CT
Solar Lease 2 LLC of their obligations under leases and power purchase agreements, as
well as revenue earned from production-based incentives. CT Solar Lease 2 LLC is owned
ninety-nine percent (99%) by Firstar Development, LLC, a Delaware limited liability
company, as the Investor Member and one percent (1%) by CEFIA Solar Services Inc., as
the Managing Member. The primary government’s intent to provide management services
through Solar Services is to directly enhance its ability to provide financing options to
commercial entities and residents of Connecticut wishing to install renewable energy
equipment. Although CGB has a minority membership interest in CT Solar Lease 2 LLC,
CGB believes that to exclude it from these financial statements would be misleading.
Advances between the primary government (CGB) and its component units, or between the
component units themselves, involved establishment of funds to provide for loan loss reserves
as well as pay certain organizational costs. Advances were eliminated in preparing the
combining and reporting entity financial statements.
Condensed combining information for the primary government (CGB) and its two blended
component units (CEFIA Holdings LLC and CT Solar Loan I LLC) is presented as follows:

CONNECTICUT GREEN BANK
NOTES TO FINANCIAL STATEMENTS
FOR THE YEAR ENDED JUNE 30, 2016
24
NOTE 1 – NATURE OF OPERATIONS AND SIGNIFICANT ACCOUNTING POLICIES (CONTINUED)
CONDENSED, COMBINING INFORMATION – STATEMENT OF NET POSITION
Total Primary
Government
Assets
Current Assets
Cash and cash equivalents 34,513,689$ 3,042,146$ 4,013,553$ --$ 41,569,388$
Accounts receivable 1,408,922 -- -- -- 1,408,922
Utility remittance receivable 2,670,634 -- -- -- 2,670,634
Other receivables 189,894 -- 74,303 -- 264,197
Due from component units 40,965,279 -- 20,269,002 (16,887,844) 44,346,437
Prepaid expenses and other assets 503,585 21,851 2,761,368 -- 3,286,803
Contractor loans 2,272,906 -- -- -- 2,272,906
Current portion of solar lease notes 845,479 -- -- -- 845,479
Current portion of portfolio investments 690,557 194,182 -- -- 884,739
Total Current Assets 84,060,944 3,258,179 27,118,226 (16,887,844) 97,549,505
Noncurrent Assets
Portfolio investments 1,000,000 -- -- -- 1,000,000
Bonds receivable 3,492,282 -- -- -- 3,492,282
Solar Lease Notes, less current portion 8,162,635 -- -- -- 8,162,635
Program loans, less current portion 28,509,165 3,873,614 -- -- 32,382,778
Renewable Energy Certificates 812,772 -- -- -- 812,772
Investment in component units 99,000 -- 100 (99,000) 100
Capital assets, net of depreciation and amortization 248,752 -- -- -- 248,752
Asset retirement obligation,net -- -- -- -- --
Restricted assets: -- -- -- -- --
Cash and cash equivalents 4,949,139 300,844 -- -- 5,249,983
Total Noncurrent Assets 47,273,744 4,174,458 100 (99,000) 51,349,302
Total Assets 131,334,689$ 7,432,636$ 27,118,326$ (16,986,844)$ 148,898,807$
Deferred Outflows of Resources
Deferred amount for pensions 2,572,833$ -- -- -- 2,572,833
Total Deferred Outflows of Resources 2,572,833$ -$ -$ -$ 2,572,833$
Eliminating
Entries
CT Solar Loan I
LLC
CEFIA Holdings
LLCCGB

CONNECTICUT GREEN BANK
NOTES TO FINANCIAL STATEMENTS
FOR THE YEAR ENDED JUNE 30, 2016
25
NOTE 1 – NATURE OF OPERATIONS AND SIGNIFICANT ACCOUNTING POLICIES (CONTINUED)
CONDENSED, COMBINING INFORMATION – STATEMENT OF NET POSITION (CONTINUED)
Total Primary
Government
Liabilities and Net Position
Liabilities
Current maturities of long-term debt --$ 152,619$ --$ --$ 152,619$
Accounts payable and accrued expenses 1,739,809 3,041 219,862 -- 1,962,712
Due to component units 574,723 4,072,500 12,815,344 (16,887,844) 574,723
Due to outside agency 30,127 -- -- -- 30,127
Custodial liability 1,327,343 -- 827,787 -- 2,155,130
Deferred revenue -- -- 5,337,477 -- 5,337,477
Total Current Liabilities 3,672,002 4,228,160 19,200,470 (16,887,844) 10,212,787
Asset retirement obligation -- -- -- -- --
Long-Term Debt, less current maturities -- 3,041,297 -- -- 3,041,297
Pension liability 16,096,113 -- -- -- 16,096,113
Total Liabilities 19,768,115 7,269,457 19,200,470 (16,887,844) 29,350,197
Deferred Inflows of Resources
Fair value of interest rate swap -- -- -- -- --
Deferred amount for pensions (2,535) -- -- -- (2,535)
Total Deferred Inflows of Resources (2,535) -- -- -- (2,535)
Net Position
Invested in capital assets 248,752 -- -- -- 248,752
Restricted Net Position
Non-expendable -- -- 100,000 (99,000) 1,000
Restricted for energy programs 4,949,139 300,844 -- -- 5,249,983
Unrestricted (deficit) 108,944,051 (137,664) 7,817,857 -- 116,624,244
Total Net Position 114,141,942 163,180 7,917,857 (99,000) 122,123,978
CEFIA Holdings
LLC
Eliminating
EntriesCGB
CT Solar Loan I
LLC

CONNECTICUT GREEN BANK
NOTES TO FINANCIAL STATEMENTS
FOR THE YEAR ENDED JUNE 30, 2016
26
NOTE 1 – NATURE OF OPERATIONS AND SIGNIFICANT ACCOUNTING POLICIES (CONTINUED)
CONDENSED, COMBINING INFORMATION – STATEMENT OF REVENUES, EXPENSES AND CHANGES IN NET POSITION
Eliminating Total Primary
Entries Government
Operating Revenues
Utility remittances 26,605,084$ --$ --$ --$ 26,605,084$
Grant revenue 807,417 -- -- (217,500) 589,917
RGGI auction proceeds 6,481,562 -- -- -- 6,481,562
Energy system sales -- -- 32,767,009 -- 32,767,009
REC sales 2,419,990 -- -- -- 2,419,990
Other income 380,245 388 6,687 -- 387,320
Total Operating Revenues 36,694,299 388 32,773,696 (217,500) 69,250,883
Operating Expenses
Cost of goods sold - energy systems -- -- 28,826,976 -- 28,826,976
Grants and program expenditures 24,948,249 319,816 210,951 (217,500) 25,261,516
General and administrative expenses 4,417,256 17,142 11,250 -- 4,445,648
Total Operating Expenses 29,365,506 336,958 29,049,177 (217,500) 58,534,141
Operating Income 7,328,793 (336,570) 3,724,519 -- 10,716,743
Nonoperating Revenue (Expenses)
Interest income - prommisory notes 2,585,070 310,432 -- -- 2,895,503
Interest income - short term cash deposits 83,372 338 8,826 -- 92,536
Interest expenses LT debt -- (61,795) -- -- (61,795)
Interest income - component units 60,127 -- -- -- 60,127
Interest expense - component units -- -- -- -- --
Payments to State of Connecticut -- -- -- -- --
Distributions to member -- -- -- -- --
Realized loss on investments (2,936) -- -- -- (2,936)
Unrealized gain (loss) on interest rate swap -- -- -- -- --
Provision for loan losses (1,021,826) -- -- -- (1,021,826)
Total Nonoperating Revenue (Expenses) 1,703,808 248,975 8,826 -- 1,961,609
CT Solar Loan I
LLC
CEFIA
Holdings LLCCGB

CONNECTICUT GREEN BANK
NOTES TO FINANCIAL STATEMENTS
FOR THE YEAR ENDED JUNE 30, 2016
27
NOTE 1 – NATURE OF OPERATIONS AND SIGNIFICANT ACCOUNTING POLICIES (CONTINUED)
CONDENSED, COMBINING INFORMATION – STATEMENT OF REVENUES, EXPENSES AND CHANGES IN NET POSITION (CONTINUED)
Eliminating Total Primary
Entries Government
Change in Net Position before Payments to
State of Connecticut and Capital Contributions 9,032,601 (87,594) 3,733,345 -- 12,678,352
Capital contributions -- -- -- -- --
Change in Net Position 9,032,601 (87,594) 3,733,345 -- 12,678,352
Net Position - Beginning of Year 105,109,340 250,775 4,184,512 (99,000) 109,445,627
Net Position - End of Year 114,141,941$ 163,181$ 7,917,857$ (99,000)$ 122,123,979$
CT Solar Loan I
LLC
CEFIA
Holdings LLCCGB

CONNECTICUT GREEN BANK
NOTES TO FINANCIAL STATEMENTS
FOR THE YEAR ENDED JUNE 30, 2016
28
NOTE 1 – NATURE OF OPERATIONS AND SIGNIFICANT ACCOUNTING POLICIES (CONTINUED)
CONDENSED, COMBINING INFORMATION – STATEMENT OF CASH FLOWS
CT Solar CEFIA Eliminating Total Primary
CGB Loan I LLC Holdings LLC Entries Government
Cash Flows from Operating Activities
Sales of energy systems --$ --$ 35,128,140$ --$ 35,128,140$
Sales of Renewable Energy Certificates 2,443,524 - - - 2,443,524
Utility company remittances 26,453,300 -- -- -- 26,453,300
Grants 1,050,204 -- -- -- 1,050,204
RGGI auction proceeds 5,313,666 -- -- -- 5,313,666
Other income 454,393 -- -- -- 454,393
Lease payments received -- -- -- -- --
Grant and program expenditures (12,646,408) (364,597) (208,417) -- (13,219,423)
Grants, incentives and credit enhancements (10,718,424) -- -- -- (10,718,424)
Purchases of energy equipment -- -- (34,278,293) -- (34,278,293)
General and administrative expenditures (4,327,471) (17,094) (6,317) -- (4,350,882)
Net Cash Provided by (Used in) Operating Activities 8,022,784 (381,692) 635,113 -- 8,276,206
Cash Flows from Non-capital Financing Activities
Payments to State of Connecticut -- -- -- -- --
Advances to CGB component units (15,762,500) -- -- -- (15,762,500)
Advances from CGB and component units -- 217,500 -- -- 217,500
Repayments of Advances (to) from component units 10,389 (219,239) 208,850 -- --
Net Cash Provided by (Used in) Non-capital Financing Activities (15,752,111) (1,739) 208,850 -- (15,545,000)
Cash Flows from Capital and Related Financing Activities
Purchase of capital assets (67,645) -- -- -- (67,645)
Proceeds from long-term debt -- 2,510,837 -- -- 2,510,837
Repayment of long-term debt -- (170,445) -- -- (170,445)
Interest expense -- (61,795) -- -- (61,795)
Capital contributions from/(to) component entities -- -- -- -- --
Capital contributions from Firststar Development, LLC -- -- -- -- --
Return of capital to Firststar Development, LLC -- -- -- -- --
Net Cash Provided by (Used in) Capital and Related Financing Activities (67,645) 2,278,597 -- -- 2,210,952
Cash Flows from Investing Activities
Return of principal on WC & program loans 25,636,808 1,009,428 -- -- 26,646,236
Interest on short-term investments, cash, solar lease notes and loans 1,923,774 268,148 8,826 -- 2,200,748

CONNECTICUT GREEN BANK
NOTES TO FINANCIAL STATEMENTS
FOR THE YEAR ENDED JUNE 30, 2016
29
NOTE 1 – NATURE OF OPERATIONS AND SIGNIFICANT ACCOUNTING POLICIES (CONTINUED)
CONDENSED, COMBINING INFORMATION – STATEMENT OF CASH FLOWS (CONTINUED)
CT Solar CEFIA Eliminating Total Primary
CGB Loan I LLC Holdings LLC Entries Government
Cash Flows from Investing Activities (Continued)
Interest on short-term investments and cash deposits -- -- -- -- --
Interest on solar lease notes -- -- -- -- --
Program loan disbursements -- -- -- -- --
CPACE program loan disbursements (14,888,372)$ --$ --$ --$ (14,888,372)$
Grid Tied program loan disbursements (911,249) -- -- -- (911,249)
AD/CHP program loan disbursements -- -- -- -- --
Alpha/Operational Demo program loan disbursements (350,000) -- -- -- (350,000)
Energy Efficiency program loan disbursements -- -- -- -- --
Campus Efficiency NOW program loan disbursements -- -- -- -- --
HOPBI program loan disbursements (1,684,862) -- -- -- (1,684,862)
Residential Solar Loan program disbursements (2,489,159) (548,813) -- -- (3,037,973)
Net Cash Used in Investing Activities 7,236,939 728,763 8,826 -- 7,974,529
Net Increase (Decrease) in Cash and Cash Equivalents (560,033) 2,623,929 852,789 -- 2,916,686
Cash and Cash Equivalents - Beginning of Year 40,022,862 719,061 3,160,764 -- 43,902,687
Cash and Cash Equivalents - End of Year 39,462,829$ 3,342,990$ 4,013,553$ --$ 46,819,373$
Reconciliation of Operating Loss to Net Cash
Provided by (Used in) Operating Activities:
Operating income (loss) 7,328,793$ (336,570)$ 3,724,519$ --$ 10,716,743$
Adjustments to reconcile operating loss
to net cash provided by (used in) operating activities:
Depreciation -- -- -- -- --
Other -- -- -- -- --
Changes in operating assets and liabilities:
(Increase)decrease in operating assets -- -- -- -- --
(Decrease)increase in operating liabilities -- -- -- -- --
Net Cash Provided by (Used in) Operating Activities 7,328,793$ (336,570)$ 3,724,519$ --$ 10,716,743$

CONNECTICUT GREEN BANK
NOTES TO FINANCIAL STATEMENTS
FOR THE YEAR ENDED JUNE 30, 2016
30
NOTE 1 – NATURE OF OPERATIONS AND SIGNIFICANT ACCOUNTING POLICIES (CONTINUED)
MEASUREMENT FOCUS, BASIS OF ACCOUNTING AND FINANCIAL STATEMENT PRESENTATION
All entities are enterprise funds. Enterprise funds are used to account for governmental
activities that are similar to those found in the private sector in which the determination of net
income is necessary or useful to sound financial administration.
BASIS OF PRESENTATION
These financial statements are reported using the economic resources measurement focus and
accrual basis of accounting. Revenues are recognized when earned, and expenses are
recognized when the liability is incurred, regardless of the timing of the related cash flows.
REVENUE RECOGNITION
CGB, in addition to utility assessments and RGGI auction income, recognizes revenue from
grants as expenses are incurred.
CT Solar Loan I LLC derives revenue from interest earned on residential solar loan products.
CEFIA Holdings LLC derives revenue from the sales of photovoltaic energy systems to CT
Solar Lease 2, LLC. This amount was eliminated to arrive at the total reporting entity revenue.
CEFIA Solar Services, Inc. revenue consists of an administrative fee from CGB. This amount
was eliminated to arrive at the total reporting entity revenue.
CT Solar Lease 2 LLC derives revenue from the following sources: operating leases, energy
generation, performance based incentives (PBIs) and the sale of Solar Renewable Energy
Certificates (SRECs) to third parties.
Rental income from operating leases for residential and certain commercial scale solar
facilities is recognized on a straight-line basis over the term of each underlying lease.
Energy generation revenue will be recognized as electricity is generated, based on actual output
and contractual prices set forth in long term PPAs associated with certain commercial scale
facilities.
Revenue from the sale of SRECs to third parties is recognized upon the transfer of title and
delivery of the SRECs to third parties and is derived from contractual prices set forth in SREC
sale agreements associated with commercial scale facilities.

CONNECTICUT GREEN BANK
NOTES TO FINANCIAL STATEMENTS
FOR THE YEAR ENDED JUNE 30, 2016
31
NOTE 1 – NATURE OF BUSINESS AND SIGNIFICANT ACCOUNTING POLICIES (CONTINUED)
OPERATING VS. NON-OPERATING REVENUE (EXPENSE)
All entities distinguish operating revenues and expenses from non-operating items. Operating
revenues consist of utility customer assessments, grants for operating activities, and other
revenue generated in connection with investments in clean energy programs. Operating
expenses consist of operating costs, including depreciation on capital assets and grants and
programs. Non-operating revenue (expense) consists of investment earnings, and other items
not considered operational by management.
USE OF ESTIMATES
Management uses estimates and assumptions in preparing these financial statements in
accordance with accounting principles generally accepted in the United States of America.
Those estimates and assumptions affect certain reported amounts and disclosures in the
financial statements. Actual results could vary from the estimates that were used.
USE OF RESTRICTED VS. NON-RESTRICTED RESOURCES
When both restricted and unrestricted amounts are available for use, the policy is to use
restricted resources for their intended purposes first and then unrestricted resources.
CASH AND CASH EQUIVALENTS
Cash equivalents consist of cash and highly liquid short-term investments with an original term
of 90 days when purchased and are recorded at cost, which approximates fair value.
CAPITAL ASSETS
Capital asset acquisitions exceeding $500 are capitalized at cost. Maintenance and repair
expenses are charged to operations when incurred. Depreciation is computed using straight-
line methods over the estimated useful lives of the assets, which range from two to thirty years.
Leasehold improvements are amortized over the shorter of their useful life or the lease term.

CONNECTICUT GREEN BANK
NOTES TO FINANCIAL STATEMENTS
FOR THE YEAR ENDED JUNE 30, 2016
32
NOTE 1 – NATURE OF BUSINESS AND SIGNIFICANT ACCOUNTING POLICIES (CONTINUED)
CAPITAL ASSETS (CONTINUED)
The estimated useful lives of capital assets are as follows:
Asset Years
Solar lease equipment 30 years
Furniture and equipment 5 years
Leasehold improvements 5 years
Computer hardware and software 2-3 years
For capital assets sold or otherwise disposed of, the cost and related accumulated depreciation
and amortization are removed from the accounts, and any related gain or loss is reflected in
income for the period.
All solar facilities are owned by CT Solar Lease 2 LLC and are stated at cost and include all
amounts necessary to construct them. Systems are placed in service when they are ready for
use and all necessary approvals have been received from local utility companies. Additions,
renewals, and betterments that significantly extend the life of an asset are capitalized.
Expenditures for warranty maintenance and repairs to solar facilities are charged to expense as
incurred. Solar facilities in process represent facilities which are in various stages of
construction or have not yet received the necessary utility company approvals.
IMPAIRMENT OF LONG-LIVED ASSETS
CT Solar Lease 2 LLC reviews its solar facilities for impairment whenever events or changes
in circumstances indicate that the carrying value of an asset may not be recoverable. When
recovery is reviewed, if the undiscounted cash flows estimated to be generated by an asset is
less than its carrying amount, management compares the carrying amount of the asset to its
fair value in order to determine whether an impairment loss has occurred. The amount of the
impairment loss is equal to the excess of the asset’s carrying value over its estimated fair value.
No impairment loss was recognized during the fiscal year ending June 30, 2016.

CONNECTICUT GREEN BANK
NOTES TO FINANCIAL STATEMENTS
FOR THE YEAR ENDED JUNE 30, 2016
33
NOTE 1 – NATURE OF BUSINESS AND SIGNIFICANT ACCOUNTING POLICIES (CONTINUED)
ASSET RETIREMENT OBLIGATIONS
CT Solar Lease 2 LLC (CT SL2) is required to recognize its liability related to asset retirement
obligations when it has the legal obligation to retire long-lived assets. Upon the expiration of
operating leases or a PPA’s initial or extended terms, customers generally have the option to
purchase the solar facilities at fair market value or require CT SL2 to remove the solar facilities
at its expense.
Asset retirement obligations are recorded in the period in which they are incurred and
reasonably estimable, including those obligations for which the timing method of settlement
are conditional on a future event that may or may not be in the control of CT SL2. Retirement
of assets may involve efforts to remove the solar facilities depending on the nature and location
of the assets. In identifying asset retirement obligations, CT SL2 considers identification of
legally enforceable obligations, changes in existing law, estimates of potential settlement dates,
and the calculation of an appropriate discount rate to be used in calculating the fair value of
the obligations. For those assets where a range of potential settlement dates may be reasonably
estimated, obligations are recorded. CT SL2 routinely reviews and reassesses its estimates to
determine if an adjustment to the value of asset retirement obligations is required.
The aggregate carrying amount of asset retirement obligations recognized by CT SL2 was
$2,528,335 and $1,094,125 at June 30, 2016 and June 30, 2015 respectively. The following
table shows changes in the aggregate carrying amount of CT SL2’s asset retirement obligation
for the year ended June 30, 2016:
Balance - June 30, 2015 1,094,125$
Additional accruals 1,328,366
Accretion expense 105,843
Balance - June 30, 2016 2,528,334$

CONNECTICUT GREEN BANK
NOTES TO FINANCIAL STATEMENTS
FOR THE YEAR ENDED JUNE 30, 2016
34
NOTE 1 – NATURE OF BUSINESS AND SIGNIFICANT ACCOUNTING POLICIES (CONTINUED)
PORTFOLIO INVESTMENTS
CGB carries all investments at fair value. Fair value is defined as the price that would be
received to sell an asset or paid to transfer liability by in an orderly transaction between market
participants at the measurement date. As discussed in Note 4, CGB’s portfolio investments
are managed by CI. Fair value is determined by CI’s independent valuation committee
(“Committee”) using United States Private Equity Valuation Guidelines promulgated by the
Private Equity Investment Guidelines Group. In the absence of readily determinable market
values, the Committee gives consideration to pertinent information about the companies
comprising these investments, including, but not limited to, recent sales prices of the issuer’s
securities, sales growth, progress toward business goals and other operating data. CI has
applied procedures in arriving at the estimate of the value of such securities that it believes are
reasonable and appropriate. CGB management reserves the right to establish a reserve in
addition to the reserve recommended by the Committee to further account for current market
conditions and volatility. Due to the inherent uncertainty of valuation, those estimated values
may differ significantly from the amounts ultimately realized from the investments, and the
differences could be material. CGB reports gains as realized and unrealized consistent with
the practice of venture capital firms. The calculation of realized gains and losses is independent
of the calculation of the net change in investment value.
All of CGB’s portfolio investments are uninsured against loss and unregistered, and are held
in the administrator’s name.
NET POSITION
Net position is presented in the following three categories:
Investment in Capital Assets represent capital assets, net of accumulated depreciation
and amortization that are attributable to those particular assets.
Restricted Net Position represent assets whose use is restricted through external
restrictions imposed by creditors, grantors, contributors and the like, or through
restrictions imposed by laws or through constitutional provisions or enabling
legislature, and includes equity interest within CGB’s component units by outside
entities.
Unrestricted Net Position represents assets which do not meet the definition of the two
preceding categories.

CONNECTICUT GREEN BANK
NOTES TO FINANCIAL STATEMENTS
FOR THE YEAR ENDED JUNE 30, 2016
35
NOTE 1 – NATURE OF BUSINESS AND SIGNIFICANT ACCOUNTING POLICIES (CONTINUED)
GRANTS AND PROGRAMS
Expenditures for grants and programs are recorded upon the submission of invoices and other
supporting documentation and approval by management. Salaries, benefits and overhead
expenses are allocated to program expenses based on job functions.
RECLASSIFICATIONS
Certain amounts in the 2015 summarized information have been reclassified to conform to the
2016 presentation.
SUBSEQUENT EVENTS
CGB has performed a review of events subsequent to the statement of net position date through
October xx, 2016, the date of the financial statements where available to be issued. Except as
described below, no additional events requiring recording or disclosure in the financial
statements were identified.
NOTE 2 – CHANGE IN METHOD FOR ACCOUNTING FOR PENSIONS
On July 1, 2014, CGB adopted GASB 68 and GASB 71. GASB 68 requires cost-sharing
employers to recognize liabilities, deferred outflows of resources, deferred inflows of
resources, and expenses for their proportionate share of the pension plan’s total. As the State
Employees’ Retirement System (SERS) did not have a practical way to provide each of its
cost-sharing employers with all of the information needed to fully restate their prior period
financial statements, CGB has elected to apply the “cumulative effect” method, as discussed
in GASB 68, by restating beginning net position as of July 1, 2014. As of July 1, 2014, CGB
recorded an adjustment to reduce beginning net position by $15,430,912 in accordance with
GASB 68, as amended.

CONNECTICUT GREEN BANK
NOTES TO FINANCIAL STATEMENTS
FOR THE YEAR ENDED JUNE 30, 2016
36
NOTE 2 – CHANGE IN METHOD FOR ACCOUNTING FOR PENSIONS (CONTINUED)
GASB 71 requires that, at transition, a government recognize a deferred outflow of resources
for its pension contributions, if any, made subsequent to the measurement date of the net
pension liability and the end of the government’s report period. The provisions of the
Statement are required to be applied simultaneously with the provisions of GASB 68. As of
July 1, 2014, CGB recorded an adjustment to increase beginning net position by $1,923,687
for contributions made to SERS from July 1, 2013 through June 30, 2014.
As of July 1, 2014, the cumulative effect of adopting GASB 68 was a $14,305,410 reduction
to beginning net position. The following table shows the impact of the “cumulative effect”
method of adopting and implementing GASB 68 and GASB 71 on beginning net position.
Statement of Revenue, Expenses and Changes in Net Position
Net position, beginning of period,
July 1, 2014 (as previously started) 98,500,605$
Cumulative effect of adopting
GASB 68 and GASB 71 (14,305,410)
Net position, beginning of period,
July 1, 2014 (as restated) 84,195,195$
NOTE 3 – FAIR VALUE MEASUREMENTS
The framework for measuring fair value provides a fair value hierarchy that prioritizes the
inputs to valuation techniques used to measure fair value. The hierarchy gives the highest
priority to unadjusted quoted prices in active markets for identical assets or liabilities (Level 1)
and the lowest priority to unobservable inputs (Level 3). In determining fair value, CGB
utilizes valuation techniques that maximize the use of observable inputs and minimize the use
of unobservable inputs. CGB also considers nonperformance risk in the overall assessment of
fair value.
Investments are measured at fair value utilizing valuation techniques based on observable
and/or unobservable inputs. Observable inputs reflect readily obtainable data from
independent sources, while unobservable inputs reflect market assumptions. These inputs are
classified into the following hierarchy:
Level 1 – Unadjusted quoted prices in active markets that are accessible at the measurement
date for identical assets of liabilities. CGB’s Level 1 securities were valued at the closing
price reported on the active markets on which the individual securities are traded.

CONNECTICUT GREEN BANK
NOTES TO FINANCIAL STATEMENTS
FOR THE YEAR ENDED JUNE 30, 2016
37
NOTE 3 – FAIR VALUE MEASUREMENTS (CONTINUED)
Level 2 – Inputs other than quotes prices in active markets for identical assets and liabilities
that are observable either directly or indirectly for substantially the full term of the asset or
liability. Level 2 inputs include the following:
Quotes prices for similar assets and liabilities in active markets
Quotes prices for identical or similar assets or liabilities in markets that are not
active
Observable inputs other than quotes prices that are used in the valuation of the
asset or liability (e.g., interest rate and yield curve quotes at commonly quotes
intervals)
Inputs that are derived principally from or corroborated by observed market data
by correlation or other means
Level 3 – Unobservable inputs for the asset or liability (supported by little or no market
activity). Level 3 inputs include management’s own assumptions about the assumptions
that market participants would use in pricing the asset or liability (including assumptions
about risk).
The asset or liability’s fair value measurement level within the fair value hierarchy is based on
the lowest level of any input that is significant to the fair value measurement. Valuation
techniques used need to maximize the use of observable inputs and minimize the use of
unobservable inputs.

CONNECTICUT GREEN BANK
NOTES TO FINANCIAL STATEMENTS
FOR THE YEAR ENDED JUNE 30, 2016
38
NOTE 3 – FAIR VALUE MEASUREMENTS (CONTINUED)
The following table sets forth by level, within the fair value hierarchy, CGB’s fair value
measurements at June 30, 2016:
Level 1 Level 2 Level 3 Total
Cash and cash equivalents 57,822,043$ --$ --$ 57,822,043$
Portfolio investments -- -- 1,000,000 1,000,000
57,822,043$ --$ 1,000,000$ 58,822,043$
Level 1 Level 2 Level 3 Total
Primary Government:
Cash and cash equivalents 46,819,372$ --$ --$ 46,819,372$
Portfolio investments -- -- 1,000,000 1,000,000
Discretely Presented
Component Units:
CEFIA Solar Services, Inc. 5,121,165 -- -- 5,121,165
CT Solar Lease 2 LLC
Cash and cash equivalents 5,881,506 -- -- 5,881,506
57,822,043$ --$ 1,000,000$ 58,822,043$
Investment assets at Fair Value as of June 30, 2016

CONNECTICUT GREEN BANK
NOTES TO FINANCIAL STATEMENTS
FOR THE YEAR ENDED JUNE 30, 2016
39
NOTE 3 – FAIR VALUE MEASUREMENTS (CONTINUED)
The following table sets forth by level, within the fair value hierarchy, CGB’s fair value
measurements at June 30, 2015:
There were no transfers between levels during the years ended June 30, 2016 and 2015.
Furthermore, there were no changes in level 3 assets during 2016 or 2015, respectively.
Level 1 Level 2 Level 3 Total
Cash and cash equivalents 48,692,654$ --$ --$ 48,692,654$
Portfolio investments -- -- 1,000,000 1,000,000
48,692,654$ --$ 1,000,000$ 49,692,654$
Level 1 Level 2 Level 3 Total
Primary Government:
Cash and cash equivalents 43,902,687$ --$ --$ 43,902,687$
Portfolio investments -- -- 1,000,000 1,000,000
Discretely Presented
Component Units:
CEFIA Solar Services, Inc. 69,252 -- -- 69,252
CT Solar Lease 2 LLC
Cash and cash equivalents 4,720,716 -- -- 4,720,716
48,692,655$ --$ 1,000,000$ 49,692,655$
Investment assets at Fair Value as of June 30, 2015

CONNECTICUT GREEN BANK
NOTES TO FINANCIAL STATEMENTS
FOR THE YEAR ENDED JUNE 30, 2016
40
NOTE 4 – CASH AND CASH EQUIVALENTS
The following is a summary of cash and cash equivalents for the reporting entity at June 30:
2016 2015
Checking 4,499,264$ 4,680,259$
Money Market 10,103,292$ 2,616,390$
State Treasurer's Short-Term Investment Fund 33,469,504 32,597,000
Unrestricted cash and cash equivalents 48,072,060 39,893,649
Checking - restricted 1,109,782 1,670,516
Money Market - restricted 5,001,190 3,500,000
State Treasurer's Short-Term Investment Fund - restricted 3,639,011 3,628,489
Total cash and cash equivalents 57,822,043$ 48,692,654$
Primary CT Solar CEFIA Solar
Government Lease 2 LLC Services, Inc. Total
Checking 4,179,675$ 244,856$ 74,733$ 4,499,263$
Money Market 3,920,210 1,136,651 5,046,432 10,103,292
State Treasurer's Short-Term
Investment Fund 33,469,504 -- -- 33,469,504
Unrestricted Cash and
Cash Equivalents 41,569,388 1,381,506 5,121,165 48,072,059
Restricted Cash
Checking 109,783 1,000,000 -- 1,109,783
Money market 1,501,190 3,500,000 -- 5,001,190
State Treasurer's Short-Term
Investment Fund 3,639,011 -- -- 3,639,011
46,819,372$ 5,881,506$ 5,121,165$ 57,822,043$
Cash and cash equivalents as of June 30, 2016

CONNECTICUT GREEN BANK
NOTES TO FINANCIAL STATEMENTS
FOR THE YEAR ENDED JUNE 30, 2016
41
NOTE 4 – CASH AND CASH EQUIVALENTS (CONTINUED)
STATE TREASURER’S SHORT-TERM INVESTMENT FUND
The State Treasurer’s Short-Term Investment Fund is a Standard & Poors AAAm investment
pool of high-quality, short-term money market instruments managed by the Cash Management
Division of the State Treasurer’s Office, and operates in a manner similar to Money Market
Mutual Funds. It is the investment vehicle for the operating cash of the State of Connecticut
Treasury, state agencies and authorities, municipalities, and other political subdivisions of the
State. The value of CGB’s position in the pool is the same as the value of pool shares.
Regulatory oversight is provided by an investment advisory council and the State Treasurer’s
Cash Management Board.
INVESTMENT MATURITIES
The State Treasurer’s Short-Term Investment Fund itself has no maturity date and is available
for withdrawal on demand.
Primary CT Solar CEFIA Solar
Government Lease 2 LLC Services, Inc. Total
Checking 4,495,298$ 161,841$ 23,120$ 4,680,259$
Money Market 2,511,383 58,875 46,132 2,616,390
State Treasurer's Short-Term
Investment Fund 32,597,000 -- -- 32,597,000
Unrestricted Cash and
Cash Equivalents 39,603,681 220,716 69,252 39,893,649
Restricted Cash
Checking 670,516 1,000,000 -- 1,670,516
Money market -- 3,500,000 -- 3,500,000
State Treasurer's Short-Term
Investment Fund 3,628,489 -- -- 3,628,489
43,902,686$ 4,720,716$ 69,252$ 48,692,654$
Cash and cash equivalents as of June 30, 2015

CONNECTICUT GREEN BANK
NOTES TO FINANCIAL STATEMENTS
FOR THE YEAR ENDED JUNE 30, 2016
42
NOTE 4 – CASH AND CASH EQUIVALENTS (CONTINUED)
INTEREST RATE RISK
CGB manages its exposure to declines in fair value by limiting the average maturity of its cash
and cash equivalents to no more than one year.
CREDIT RISK
Connecticut General Statutes authorize CGB to invest in obligations of the U.S. Treasury
including its agencies and instrumentalities, commercial paper, banker’s acceptance,
repurchase agreements and the State Treasurer’s Short-Term Investment Fund.
Investment ratings for the Fund’s investment are as follows:
Standard
& Poor's
State Treasurer's Short-Term Investment Fund AAAm CONCENTRATION OF CREDIT RISK
CGB’s investment policy does not limit the investment in any one investment vehicle. The
State Treasurer’s Short-term Investment Fund is not subject to this disclosure.
CUSTODIAL CREDIT RISK - DEPOSITS
In the case of deposits, this represents the risk that, in the event of a bank failure, CGB’s
deposits may not be returned to it. CGB does not have a deposit policy for custodial credit
risk. As of June 30, 2016 and 2015, $19,019,356 and $12,212,054, respectively, of CGB’s
bank balances were exposed to custodial credit risk. Primary government consisted of
$8,727,950 and $7,795,388 as of June 30, 2016 and 2015, respectively. CT Solar Lease 2,
LLC consisted of $5,420,241 and $4,416,666 as of June 30, 2016 and 2015, respectively.
CEFIA Solar Services, Inc. consisted of $ 4,871,165 as of June 30, 2016. CEFIA Solar
Services, Inc. had no balances exposed to credit risk as of June 30, 2015. Funds held by banks
on behalf of CGB, CT Solar Lease 2 LLC and CEFIA Solar Services included contractual
requirements to maintain $6,000,346 in deposits with financial institutions participating
various lease and loan programs, representing loan loss and lease maintenance reserves and
guaranty pledge accounts.
CUSTODIAL CREDIT RISK - INVESTMENTS

CONNECTICUT GREEN BANK
NOTES TO FINANCIAL STATEMENTS
FOR THE YEAR ENDED JUNE 30, 2016
43
For an investment, this represents the risk that, in the event of the failure of the counterparty,
CGB will not be able to recover the value of the investment. CGB does not have a policy
relating to the credit risk of investments. As of June 30, 2016 and 2015, CGB had no reportable
credit risk.
NOTE 5 – PORTFOLIO INVESTMENTS
The former Connecticut Clean Energy Fund (CCEF) invested in emerging technology
companies as equity and debt investments in Operational Demonstration projects. Based on a
memorandum of understanding between CGB and CI, CI manages these investments on behalf
of CGB.

CONNECTICUT GREEN BANK
NOTES TO FINANCIAL STATEMENTS
FOR THE YEAR ENDED JUNE 30, 2016
44
NOTE 6 – BONDS RECEIVABLE
Subordinate Series 2014B-1 and 2014C-1
This Series represents two $800,000 bonds received in connection with the CGB’s May 2014
sale of C-PACE Loans to Clean Fund Holdings, LLC (CFH). CFH paid CGB approximately
$6.4 million in cash along with two bonds issued to CGB through Public Finance Authority.
The 2014 Series bonds carry interest of 5.30% per annum with a maturity date of September
10, 2034. The bonds are secured by the C-PACE Loans sold to CFH. CGB received a principal
repayment of $8,858 for each bond as a result of a C-PACE loan payoff in 2016. At June 30,
2016, management believes no valuation allowance is necessary on these bonds.
Each bond required semi-annual interest-only payments to CGB starting September 10, 2014
and continuing to September 10, 2034. Starting March 10, 2030 and every six months
thereafter, principal payments, along with the required interest is to be paid to CGB.
Subordinate Series 2015B-1 and 2015C-1
This Series represents two $955,000 bonds received in connection with the CGB’s August
2015 sale of C-PACE Loans to Clean Fund Holdings, LLC (CFH). CFH paid CGB
approximately $7.7 million in cash along with two bonds issued to CGB through Public
Finance Authority. The 2015 Series bonds carry interest of 5.52% per annum with a maturity
date of August 13, 2035. At June 30, 2016, management believes no valuation allowance is
necessary on these bonds.
Each bond required semi-annual interest-only payments to CGB starting September 15, 2015
and continuing to August 13, 2035. Starting September 10, 2032 and every six months
thereafter, principal payments, along with the required interest is to be paid to CGB.
Principal maturities of these bonds are as follows:
Year ended June 30, 2014B-1 2014C-1 2015B-1 2015B-1 Total
2017 -- -- -- -- --
2018 -- -- -- -- --
2019 -- -- -- -- --
2020 -- -- -- -- --
2021
2022 - 2026 -- -- -- -- --
2027 - 2031 277,500 277,500 -- -- 555,000
2032 - 2036 513,641 513,641 955,000 955,000 2,937,282
791,141$ 791,141$ 955,000$ 955,000$ 3,492,282$

CONNECTICUT GREEN BANK
NOTES TO FINANCIAL STATEMENTS
FOR THE YEAR ENDED JUNE 30, 2016
45
NOTE 7 – SOLAR LEASE NOTES
In June of 2008 the predecessor of the CGB, the Connecticut Clean Energy Fund (CCEF)
entered into a Master Lease Program Agreement with CT Solar Leasing LLC, a third party
leasing company, AFC First Financial Corporation, a third party servicer, and Firstar
Development LLC, the tax equity investor, to develop a residential solar PV leasing program
in Connecticut. CCEF purchased a total of $13,248,685 of promissory notes issued by CT
Solar Leasing LLC during the period commencing in April of 2009 and ending in February of
2012 to fund the program. Each nonrecourse promissory note is secured by the payments under
a specific PV equipment lease, with a rate of interest of 5% and a term of 15 years. Future
principal repayments under the program and the current loss reserve are as follows:
Future principal repayments
2017 845,479$
2018 888,736
2019 934,205
2020 982,001
2021 1,032,242
2022-2025 4,416,442
9,099,105
Less reserve for losses: (90,991)
9,008,114$
Current portion 845,479$
Non-current portion 8,162,635
9,008,114$

CONNECTICUT GREEN BANK
NOTES TO FINANCIAL STATEMENTS
FOR THE YEAR ENDED JUNE 30, 2016
46
NOTE 8 – PROGRAM LOANS
Outstanding principal balances by program for the years ending June 30, 2016 and 2015 are as
follows:
Scheduled repayments of principal under these loans as of June 30, 2016 is as follows:
2016 2015
Connecticut Green Bank
CPACE Program benefit assessments 19,335,073$ 29,379,287$
CPACE Promissory notes 1,553,884 --$
Gried-Tied Program term loans 8,701,188 7,722,894
Multifamily/Affordable housing program loans 2,467,231 --
Alpha/Operational Demonstration program loans 1,136,421 836,421
Other program loans 680,737 1,746,443
CT Solar Loan I LLC
Residential Solar PV Program loans-WIP 26,233 892,866
Residential Solar PV Program loans-Complete 4,041,563 3,584,829
37,942,330 44,162,741
Reserve for loan losses (4,674,813) (3,644,796)
33,267,517$ 40,517,945$
2017 2018 2019 2020 2021 Thereafter Total
Connecticut Green Bank
CPACE Program benefit assessments-
in repayment -- -- -- -- -- -- --
Gried-Tied Program term loans -- -- -- -- -- -- --
Multifamily/Affordable housing term loans -- -- -- -- -- -- --
Alpha/Operational Demonstration
program loans -- -- -- -- -- -- --
Other program loans -- -- -- -- -- -- --
CT Solar Loan I LLC
Residential Solar PV
Program loans - in repayment -- -- -- -- -- -- --
-- -- -- -- -- -- --
Reserve for loan losses -- -- -- -- -- -- --
--$ --$ --$ --$ --$ --$ --$

CONNECTICUT GREEN BANK
NOTES TO FINANCIAL STATEMENTS
FOR THE YEAR ENDED JUNE 30, 2016
47
NOTE 8 – PROGRAM LOANS (CONTINUED)
Benefits assessments under the C-PACE program will finance energy efficiency upgrades and
the installation of renewable energy equipment on non-residential property. The assessments
carry interest rates ranging from 5.0% to 6.0% with terms ranging from 10 to 20 years.
The grid–tied term loan represents the financing of two projects. The first project is the 15
megawatt Dominion Bridgeport Fuel Cell Park from Project 150. Interest is paid monthly on
the outstanding principal balance at a rate of 5.0% until 2022 when principal payments
commence over a 48-month period. The second project is the 5 megawatt wind turbine project
in Colebrook. Interest on the revolving term loan is paid quarterly at prime plus 3%. Interest
on the non-revolving term loan is paid quarterly based on the project’s cash flows. The
minimum rate of interest on the non-revolving term loan is 10%. Principal under both loans is
repaid at maturity which is 15 years from the date the project was placed in service. The project
was placed in service in November of 2015.
Pre development loans finance a clean energy facility developer’s costs associated with
acquiring site control, environmental assessments, impact studies, permitting costs and facility
design. Repayments of principal begin when one of the following milestones is achieved: the
closing of permanent financing of the project, commencement of commercial operation, or the
sale of the project or its assets. Interest on repayments is at a rate of prime plus 1%. The
projects financed continue to be under development and are investments of the organization
that are consistent with its Comprehensive Plan and budget.
Operational demonstration program loans are residual transactions of the programs of the
Connecticut Clean Energy Fund. The loans finance the development of emerging clean energy
technologies. Repayment of each loan is based upon the commercial success of the technology
and carries an interest rate of 6%. If commercial success is not achieved after ten years from
the date of the loan agreement, the loan converts to a grant. Connecticut Innovations assists in
overseeing these loans.
Other program loans represent the financing of feasibility studies for various renewable energy
projects or energy efficiency upgrades and bridge loans to developers of solar PV projects for
low to moderate income housing that fall inside the organization’s Comprehensive Plan and
Budget.
The residential solar PV loan program administered by CT Solar Loan I LLC, makes loans to
residential property owners for the purpose of installing solar photovoltaic equipment. Loans
carry an interest rate ranging from 6.49% to 6.75% with a term of 15 years.

CONNECTICUT GREEN BANK
NOTES TO FINANCIAL STATEMENTS
FOR THE YEAR ENDED JUNE 30, 2016
48
NOTE 9 – FINANCING ACTIVITIES
LONG-TERM DEBT - LINE OF CREDIT – PRIMARY GOVERNMENT
(to be updated)
Solar Mosaic Line of Credit
During 2014, CT Solar Loan 1 LLC entered into a $4,000,000 line of credit (LOC) with Solar
Mosaic, Inc. (Mosaic). The LOC was amended in June 2015 to $1,100,000. Borrowings on
the LOC immediately turn into a term note with predefined repayment terms at the time of
borrowing. No further borrowings are available after June 30, 2015. The LOC had $3,873,912
available at June 30, 2014. Borrowings on the LOC bear interest at 6.4586% (Base Rate) and
have the option to buy-down the interest rate to 6.00% (Reduced Rate) by making a payment
on the borrowing date of 2.875% of the principal amount of the loan (Rate Buy-down Amount).
As of June 30, 2015 and 2014 there was $853,525 and $126,088, respectively, outstanding
which matures in March 2029.
In connection with the LOC, CT Solar Loan 1 LLC is required to establish and maintain a
collections account, debt service reserve account and a loan loss reserve account. Deposits
shall be made into the collections account for all payments received by residential borrowers.
The debt service reserve account is required to have no less than six months forward-looking
principal and interest payments for the loans outstanding. The loan loss reserve account
required a one-time deposit of $300,000 as of June 30, 2014 which was reduced to $82,500 as
of June 30, 2015.
Future maturities on borrowings on the LOC are as follows:
The Reinvestment Fund Line of Credit
(To be added)
Years ending June 30, Principal Interest Total
2017 50,129$ 47,022$ 97,151$
2018 52,937 43,938 96,875$
2019 55,910 40,680 96,590$
2020 59,058 37,240 96,298$
2021 -- -- --$
2022 - 2026 346,592 127,414 474,006$
Thereafter 241,796 24,495 266,291$
806,422$ 320,789$ 1,127,211$

CONNECTICUT GREEN BANK
NOTES TO FINANCIAL STATEMENTS
FOR THE YEAR ENDED JUNE 30, 2016
49
NOTE 9 – FINANCING ACTIVITIES (CONTINUED)
LINE OF CREDIT –DISCRETELY PRESENTED COMPONENT UNIT – CT SOLAR LEASE 2, LLC
CT Solar Lease 2, LLC has a $24,000,000 line of credit agreement (Additional LOC) with First
Niagara Bank, N.A. (First Niagara) as the Administrative Agent and Lender along with an
additional participating lender. The additional LOC is broken down by lender as follows:
Funds may be drawn down in no more than xxx total advances by October 1, 2016. With the
exception of the final advance, each advance must be in the principal amount of $2,400,000 or
a whole multiple of $100,000 in excess of $2,400,000. Each loan funding will be shared by
all participating lenders in accordance with their pro-rata share of the total facility
commitment. As of June 30, 2016 and 2015, $18,000,000 and $3,000,000, respectively, had
been advanced under the additional LOC. Principal repayments of $832,325 were made as of
June 30, 2016. No principal repayments were made as of June 30, 2015.
Each advance will be amortized separately. CT Solar Lease 2 LLC has the option with each
advance of selecting between the LIBOR rate or the base rate which is defined as the highest
of (a) the Federal Funds Effective Rate plus one-half of 1 percent, (b) First Niagara’s prime
rate, and (c) the LIBOR rate plus 1 percent. CT Solar Lease 2 LLC may also elect to convert
an advance from one rate to the other by following the process outlined in the credit agreement.
Payments of interest with respect to any LIBOR rate advances are due on the 15th day of the
month following each calendar quarter end. Payments of interest with respect to any base rate
advances are due monthly. Payments of principal with respect to all advances are due on the
15th day of the month following each calendar quarter end. Principal payments on each
advance will be based on a modified 15year amortization schedule as outlined in the credit
agreement.
First Niagara Bank, N.A 15,000,000$
Webster Bank, National Association 9,000,000
24,000,000$

CONNECTICUT GREEN BANK
NOTES TO FINANCIAL STATEMENTS
FOR THE YEAR ENDED JUNE 30, 2016
50
NOTE 9 – FINANCING ACTIVITIES (CONTINUED)
LINE OF CREDIT –DISCRETELY PRESENTED COMPONENT UNIT – CT SOLAR LEASE 2, LLC
(CONTINUED)
Within one month of each advance, CT Solar Lease 2 LLC is required to enter into an interest
rate swap contract with respect to a minimum amount of 75% of such advance. If one of the
participating lenders is the counterparty to the swap contract, such contract will be secured by
the collateral of the credit agreement; otherwise, the swap contract will be unsecured. See
Note 10.
Certain obligations of CT Solar Lease 2 LLC under the credit agreement are guaranteed by
CGB. This credit agreement is secured by all assets of CT Solar Lease 2 LLC as well as CEFIA
Solar Services (the “Managing Member”) interest in CT Solar Lease 2 LLC. There are no
prepayment penalties. There are certain debt service coverage ratios CT Solar Lease 2 LLC
must maintain related to each separate advance and which require the separate measurement
of the net operating income with respect to the projects purchased with each advance.
NOTE 10 – INTEREST RATE SWAP AGREEMENT
CT Solar Lease 2 LLC entered into an interest rate swap agreement with First Niagara (the
Swap Agreement) in September 2014 in anticipation of making its first draw down on the
credit agreement. Payments made and received are based on a notional amount of $19,374,375
and $11,804,925 as of June 30, 2016 and 2015, respectively. The agreement provides for CT
Solar Lease 2 LLC to receive payments based on the 1 month USD-LIBOR-BBA (0.44205%
and 0.18550% at June 30, 2016 and 2015, respectively) and to make payments based on an
interest rate of 2.78%. The agreement matures on December 15, 2025. The fair value of the
interest rate swap agreement as of June 30, 2016 and 2015 were deferred inflows of $1,627,864
and $660,073, respectively which is represented as the fair value of the interest rate swap on
the accompanying 2016 and 2015 Statement of Net Position. CGB used the dollar-offset
method for evaluating effectiveness of the interest rate swap agreement.

CONNECTICUT GREEN BANK
NOTES TO FINANCIAL STATEMENTS
FOR THE YEAR ENDED JUNE 30, 2016
51
NOTE 11 – PAYMENT TO STATE OF CONNECTICUT
The Connecticut Legislature passed Public Act 13-247 pertaining to the State’s budget for the
biennium ending June 30, 2015 and signed into law on June 19, 2013. This Act required the
Connecticut Green Bank to transfer $19,200,000 to the State’s General Fund during fiscal year
2015. No payments to the State were made in fiscal year 2016.
NOTE 12 – RELATED PARTY TRANSACTIONS AND OPERATING LEASES
DUE TO OUTSIDE AGENCY
CGB utilizes the services of CI, as provided in the General Statutes of the State of Connecticut.
CI provides services to CGB, at cost, for its operations. Such services include, but are not
limited to, staff for human resources and information technology support, office space,
equipment, supplies and insurance. Expenses billed to CGB by CI totaled $58,401 and
$477,161 for the years ended June 30, 2016 and 2015, respectively. As of June 30, 2016 and
2015, amounts due to CI were $30,127 and $49,516, respectively.
UNUSED COMMITMENT FEE
The Investor Member of CT Solar Lease 2 LLC is entitled to an annual fee due within 30 days
of the end of each calendar year, calculated on a monthly basis, based on the amount of the
Investor Member’s unfunded capital contributions. The fee for each month is equal to 1.25
percent times the amount by which the Investor Member’s contribution cap exceeds the total
capital contributions funded as of the last day of the month in question divided by twelve.
Amounts not paid timely accrue interest at the US Bank Prime Rate in effect on the due date
plus 2 percent. The unused commitment fee totaled $99,486 and $252,135 for the years ended
June 30, 2016 and 2015, respectively, and is included in accounts payable and accrued
expenses on the accompanying statement of net position.
PRIORITY RETURN
The Investor Member is the Tax-Equity Investor and is entitled to substantially all of the tax
benefits of CT Solar Lease 2 LLC until January I of the year which is five years after the date
the last project is installed, which is anticipated to be January 1, 2021, the Flip Date.

CONNECTICUT GREEN BANK
NOTES TO FINANCIAL STATEMENTS
FOR THE YEAR ENDED JUNE 30, 2016
52
NOTE 12 – RELATED PARTY TRANSACTIONS AND OPERATING LEASES (CONTINUED)
PRIORITY RETURN (CONTINUED)
The investor Member of CT Solar Lease 2 LLC shall be due a cumulative, quarterly
distribution equal to 0.5% of its paid-in capital contributions in respect of projects beginning
at the end of the first quarter after the first project acquisition capital contribution is made and
continuing until the “Flip Date.” To the extent the priority return is not paid in a quarter until
the Flip Date, unpaid amounts will accrue interest at the lower of 24% per annum or the highest
rate permitted by law.
In accordance with the Operating Agreement all amounts and accrued interest due on the
Priority Return are to be paid from net cash flow prior to certain required payments due under
the Credit Agreement. The Investor Member was paid a priority returns of $299,831 and
$26,159 for the years ended June 30, 2016 and 2015, respectively.
ADMINISTRATIVE SERVICES FEE
The Managing Member of CT Solar Lease 2 LLC, CEFIA Solar Services, Inc. provides
administrative and management services to the Company and earns a quarterly fee initially
equal to $30,000 per quarter beginning July 1, 2013. The amount of the fee increased 2.5
percent each July 1st beginning July 1, 2014. The administrative services fee totaled $130,075
and $123,000 for the years ended June 30, 2016 and 2015, respectively, and is included in
accounts payable and accrued expenses on the accompanying statement of net position.
PREPAID PRIORITY RETURN
The investor member of CT Solar Lease 2 LLC will be paid a prepaid priority return with
respect to each residential energy system project where the customer has made a prepayment
to CT Solar Lease 2 LLC. The prepaid priority return is a one-time distribution to the investor
member equal to 4.2055% of each prepaid project’s purchase price. The prepaid priority return
will be paid to the investor member on the date it makes its initial acquisition capital
contribution with respect to the purchase of the prepaid project. During the years ended June
30, 2016 and 2015, the investor member was paid $1,717 and $72,402, respectively, related to
the prepaid priority return.

CONNECTICUT GREEN BANK
NOTES TO FINANCIAL STATEMENTS
FOR THE YEAR ENDED JUNE 30, 2016
53
NOTE 12 – RELATED PARTY TRANSACTIONS AND OPERATING LEASES (CONTINUED)
PAYROLL TAXES AND FRINGE BENEFIT CHARGES
Pursuant to state statute, CGB is subject to fringe benefit charges for pension plan and medical
plan contributions which are paid at the state level. CGB’s employer payroll taxes are also
paid at the state level. CGB reimburses the state for these payments. The reimbursement for
2016 and 2015 was $3,691,048 and $3,061,004, respectively, comprising 74.30% and 75.80%,
respectively, of gross salaries.
OPERATING LEASES
During 2014, CGB entered into a non-cancellable operating lease with an unrelated entity for
its main office space. The lease calls for monthly escalating payments beginning at $12,567
through December 31, 2020. Rent expense related to this lease for the years ended June 30,
2016 and 2015 was $ 159,498 and $154,572, respectively.
In addition, CGB has a non-cancelable operating lease for an additional office space from an
unaffiliated entity which calls for initial monthly payments of $7,333, with escalating
payments through December 2020. Rent expense related to this lease for the years ended June
30, 2016 and 2015 amounted to $ 105,422 and $97,723, respectively. CGB also began sub
leasing additional office space from CI in March of 2016. Initial monthly payments are
$5,665.50 with escalating payments through December 2020. Rent expense related to this sub
lease was $22,662 for the year ended June 30, 2016.
In addition, CGB leases office equipment on a month-to-month basis. Rent expense related to
the office equipment for the years ended June 30, 2016 and 2015 was $13,465 and $6,439,
respectively.
Future minimum lease payments for office rentals are as follows:
Years ending June 30,
2017 325,318$
2018 333,379
2019 341,440
2020 349,501
2021 176,766
Thereafter --
1,526,404$

CONNECTICUT GREEN BANK
NOTES TO FINANCIAL STATEMENTS
FOR THE YEAR ENDED JUNE 30, 2016
54
NOTE 13 – CAPITAL ASSETS
Capital asset activity for reporting entity for the years ended June 30, 2016 and 2015 are as
follows:
Primary Government
Balance, Balance,
2016 July 1, 2015 Additions Deletions Adjustments June 30, 2016
Capital assets being depreciated:
Solar lease equipment --$ --$ --$ --$ --$
Furniture and equipment 222,701 11,417 (7,054) (57,641) 169,423
Computer hardware and software 128,627 35,963 (9,400) 57,641 212,831
Leasehold improvements 153,657 72,187 -- -- 225,844
Capital assets not being depreciated:
WIP solar lease equipment -- -- -- -- --
Construction in progress 7,141 23,090 (25,729) -- 4,502
512,126 142,657 (42,184) -- 612,600
Less accumulated depreciation
and amortization:
Solar lease equipment -- -- -- -- --
Furniture and equipment 122,149 60,653 (4,125) (75,598) 103,078
Computer hardware and software 50,906 26,124 (1,055) 75,598 151,573
Leasehold improvements 75,232 33,964 -- -- 109,196
248,287 120,741 (5,181) -- 363,848
Capital assets, net 263,839$ 21,916$ (37,003)$ --$ 248,752$
Balance, Balance,
2015 July 1, 2014 Additions Deletions Adjustments June 30, 2015
Capital assets being depreciated:
Solar lease equipment --$ --$ --$ --$ --$
Furniture and equipment 338,938 18,353 (134,590) -- 222,701
Computer hardware and software 88,337 57,480 (17,190) -- 128,627
Leasehold improvements 139,682 13,975 -- -- 153,657
Capital assets not being depreciated:
WIP solar lease equipment -- -- -- -- --
Construction in progress 7,141 -- -- -- 7,141
574,098 89,808 (151,780) -- 512,126
Less accumulated depreciation
and amortization:
Solar lease equipment -- -- -- -- --
Furniture and equipment 205,820 50,919 (134,590) -- 122,149
Computer hardware and software 33,845 34,250 (17,189) -- 50,906
Leasehold improvements 44,501 30,731 -- -- 75,232
284,166 115,900 (151,779) -- 248,287
Capital assets, net 289,932$ (26,092)$ (1)$ --$ 263,839$

CONNECTICUT GREEN BANK
NOTES TO FINANCIAL STATEMENTS
FOR THE YEAR ENDED JUNE 30, 2016
55
NOTE 13 – CAPITAL ASSETS (CONTINUED)
Discretely Presented Component Units
Balance, Balance,
2016 July 1, 2015 Additions Deletions Adjustments June 30, 2016
Capital assets being depreciated:
Solar lease equipment 21,011,832$ 29,240,167$ --$ (2,717,508)$ 47,534,490$
Furniture and equipment -- -- -- -- --
Computer hardware and software -- -- -- -- --
Leasehold improvements -- -- -- -- --
Capital assets not being depreciated:
WIP solar lease equipment 6,014,560 18,206,739 (11,067,035) (1,222,525) 11,931,740
Construction in progress -- -- -- -- --
27,026,392 47,446,906 (11,067,035) (3,940,033) 59,466,230
Less accumulated depreciation
and amortization:
Solar lease equipment 319,144 1,532,051 -- -- 1,851,195
Furniture and equipment -- -- -- -- --
Computer hardware and software -- -- -- -- --
Leasehold improvements -- -- -- -- --
319,144 1,532,051 -- -- 1,851,195
Capital assets, net 26,707,248$ 45,914,855$ (11,067,035)$ (3,940,033)$ 57,615,035$
Balance, Balance,
2015 July 1, 2014 Additions Deletions Adjustments June 30, 2015
Capital assets being depreciated:
Solar lease equipment 1,035,159$ 22,753,915$ --$ (2,777,242)$ 21,011,832$
Furniture and equipment -- -- -- -- --
Leasehold improvements -- -- -- -- --
Computer hardware and software -- -- -- -- --
Capital assets not being depreciated:
WIP solar lease equipment 1,759,111 4,847,060 -- (591,611) 6,014,560
Construction in progress -- -- -- -- --
2,794,270 27,600,975 -- (3,368,853) 27,026,392
Less accumulated depreciation
and amortization:
Solar lease equipment 9,865 309,279 -- -- 319,144
Furniture and equipment -- -- -- -- --
Computer hardware and software -- -- -- -- --
Leasehold improvements -- -- -- -- --
9,865 309,279 -- -- 319,144
Capital assets, net 2,784,405$ 27,291,696$ --$ (3,368,853)$ 26,707,248$

CONNECTICUT GREEN BANK
NOTES TO FINANCIAL STATEMENTS
FOR THE YEAR ENDED JUNE 30, 2016
56
NOTE 13 – CAPITAL ASSETS (CONTINUED)
Total Reporting Entity
Balance, Balance,
2016 July 1, 2015 Additions Deletions Adjustments June 30, 2016
Capital assets being depreciated:
Solar lease equipment 21,011,832$ 29,240,167$ --$ (2,717,508)$ 47,534,491$
Furniture and equipment 222,701 11,417 (7,054) (57,641) 169,423
Computer hardware and software 128,628 35,963 (9,400) 57,641 212,832
Leasehold improvements 153,657 72,187 -- -- 225,844
Capital assets not being depreciated:
WIP solar lease equipment 6,014,560 18,206,739 (11,067,035) (1,222,525) 11,931,739
Construction in progress 7,141 23,090 (25,729) -- 4,502
27,538,519 47,589,563 (11,109,218) (3,940,033) 60,078,831
Less accumulated depreciation
and amortization:
Solar lease equipment 319,144 1,532,052 -- -- 1,851,196
Furniture and equipment 122,149 60,653 (4,125) (75,598) 103,079
Computer hardware and software 50,906 26,124 (1,055) 75,598 151,573
Leasehold improvements 75,232 33,964 -- -- 109,196
567,431 1,652,793 (5,180) -- 2,215,044
Capital assets, net 26,971,088$ 45,936,770$ (11,104,038)$ (3,940,033)$ 57,863,787$
Balance, Balance,
2015 July 1, 2014 Additions Deletions Adjustments June 30, 2015
Capital assets being depreciated:
Solar lease equipment 1,035,159$ 22,753,915$ --$ (2,777,242)$ 21,011,832$
Furniture and equipment 338,938 18,353 (134,590) -- 222,701
Computer hardware and software 88,337 57,480 (17,189) -- 128,628
Leasehold improvements 139,682 13,975 -- -- 153,657
Capital assets not being depreciated:
WIP solar lease equipment 1,759,111 4,847,060 -- (591,611) 6,014,560
Construction in progress 7,141 -- -- -- 7,141
3,368,368 27,690,783 (151,779) (3,368,853) 27,538,519
Less accumulated depreciation
and amortization:
Solar lease equipment 9,865 309,279 -- -- 319,144
Furniture and equipment 205,820 50,919 (134,590) -- 122,149
Computer hardware and software 33,845 34,250 (17,189) -- 50,906
Leasehold improvements 44,501 30,731 -- -- 75,232
294,031 425,179 (151,779) -- 567,431
Capital assets, net 3,074,337$ 27,265,604$ --$ (3,368,853)$ 26,971,088$

CONNECTICUT GREEN BANK
NOTES TO FINANCIAL STATEMENTS
FOR THE YEAR ENDED JUNE 30, 2016
57
NOTE 14 – GRANT PROGRAMS
CGB, the primary government, recognizes grant revenue based on expenditures or fulfillment
of program requirements. For the year ended June 30, 2016 and 2015, CGB recognized related
grant revenue of $589,917 and $143,615, respectively under Department of Energy programs.
NOTE 15 – COMMITMENTS AND LOAN GUARANTEES
As of June 30, 2016 and 2015, the Board of Directors designated a portion of CGB’s
unrestricted net position to fund financial incentives for specific commercial and residential
projects in the following areas:
Commitments:
These commitments are expected to be funded over the next one to six fiscal years and are
contingent upon the completion of performance milestones by the recipient. All commitments
are those of the primary government.
Loan Guarantees:
(to be updated)
2016 2015
Solar PV 56,457,195$ 45,017,128$
AD/CHP programs 15,462,247 14,462,247
CPACE 11,563,681 15,178,559
Multifamily/LMI Solar PV and energy efficiency programs 9,510,841 12,000,000
Energy efficiency programs 1,130,000 277,763
Education and outreach 706,900 694,120
Other technologies 271,795 271,795
Alpha and operational demonstration programs 165,000 465,000
Wind -- 1,102,888
95,267,659$ 89,469,500$

CONNECTICUT GREEN BANK
NOTES TO FINANCIAL STATEMENTS
FOR THE YEAR ENDED JUNE 30, 2016
58
NOTE 16 – PENSION PLAN
All employees of the CGB participate in the State Employees’ Retirement System (SERS),
which is administered by the State Employees’ Retirement Commission. The CGB has no
liability for pension costs other than the annual contribution. The latest actuarial study was
performed on the plan as a whole, as of June 30, 2012, and does not separate information for
employees of the CGB. Therefore, certain pension disclosures pertinent to CGB otherwise
required pursuant to accounting principles generally accepted in the United States of America
are omitted. Based upon the 2012 valuation, the Plan, as a whole, utilized the project unit
credit cost method to develop employer contributions, and included the following actuarial
assumptions: (1) investment return of 8% (previously 8.25%); (2) price inflation of 2.75%
(previously 3%) for cost of living adjustments; (3) projected salary increases of 4% to 20%,
Social Security wage base increases of 3.50% per annum; (4) payroll growth of 3.75% per
annum; and (5) the RP-2000 Mortality Table. Information on the total plan funding status and
progress, contribution required and trend information can be found in the State of
Connecticut’s Comprehensive Annual Financial Report available from the Office of the State
Comptroller, 55 Elm Street, Hartford, CT 06106.
PLAN DESCRIPTION
SERS is a single-employer defined benefit public employee retirement system (PERS)
established in 1939 and governed by Sections 5-152 and 5-192 of the Connecticut General
Statutes. Employees are covered under one of three tiers. Tier I and Tier IIA are contributory
plans, and Tier II is a noncontributory plan.
Members who joined the retirement system prior to July 1, 1984 are enrolled in Tier I. Tier I
employees who retire at or after age 65 with 10 years of credited service, at or after age 55
with 25 years of service, or at age 55 with 10 years of credited service with reduced benefits
are entitled to an annual retirement benefit payable monthly for life, in an amount of 2 percent
of the annual average earnings (which are based on the three highest earning years of service)
over $4,800 plus 1 percent of $4,800 for each year of credited service. Tier II employees who
retire at or after age 60 with 25 years of service, or at age 62 with 10 years of service, or at age
65 with 5 years of service, are entitled to one and one-third percent of the average annual
earnings plus one-half of one percent of the average annual earnings in excess of the salary
breakpoint in the year of retirement for each year of credited service. Tier II employees
between the ages of 55 and 62 with 10 years but less than 25 years of service may retire with
reduced benefits. In addition, Tier II and Tier IIA members with at least five but less than ten
years of actual state service who terminate their state employment July 2, 1997 or later and
prior to attaining age 62 will be in deferred vested status and may commence receipt of normal
retirement benefits on the first of the month on or following their sixty-fifth (65) birthday.

CONNECTICUT GREEN BANK
NOTES TO FINANCIAL STATEMENTS
FOR THE YEAR ENDED JUNE 30, 2016
59
NOTE 16 – PENSION PLAN (CONTINUED)
Employees hired on and after July 1, 1997, will become members of Tier IIA. Tier IIA plan
is essentially the existing Tier II plan with the exception that employee contributions of 2
percent of salary are required. Tier I members are vested after ten years of service, while Tier
II and Tier IIA members may be vested after five years of service under certain conditions, and
all three plans provide for death and disability benefits.
Employees hired on or after July 1, 2011 are covered under the Tier III plan. Tier III requires
employee contributions of two percent of salary up to a $250,000 limit after which no
additional contributions will be taken on earnings above this limit. The normal retirement date
will be the first of any month on or after age 63 if the employee has at least 25 years of vested
service or age 65 if the employee has at least 10 but less than 25 years of vested service. Tier
III members who have at least 10 years of vested service can receive early reduced retirement
benefits if they retire on the first of any month on or following their 58th birthday. Tier III
normal retirement benefits include annual retirement benefits for life, in the amount of one and
one-third percent of the five-year average annual earnings plus one-half of one percent of the
five-year average annual earnings in excess of the salary breakpoint in the year of retirement
for each year of credited service plus one and five-eighths of the five-year annual average
salary times years of credited service over 35 years.
The total payroll for employees of the CGB covered by SERS for the years ended June 30,
2016 and 2015 was $4,695,647 and $4,013,411, respectively.
CONTRIBUTIONS MADE
CGB’s contribution is determined by applying a State mandated percentage to eligible salaries
and wages as follows for the years ended June 30:
CGB has contributed the required amount for each of the past three years.
2016 2015 2014 2013
Contributions made:
By employees 208,516$ 171,260$ 139,217$ 104,214$
Percent of current year covered payroll 4.4% 4.3% 4.5% 4.1%
Percent of required contributions 100.0% 100.0% 100.0% 100.0%
By CGB 2,474,182$ 1,974,507$ 1,669,961$ 1,125,649$
Percent of current year covered payroll 52.7% 49.2% 53.5% 44.7%
Percent of required contributions 100.0% 100.0% 100.0% 100.0%
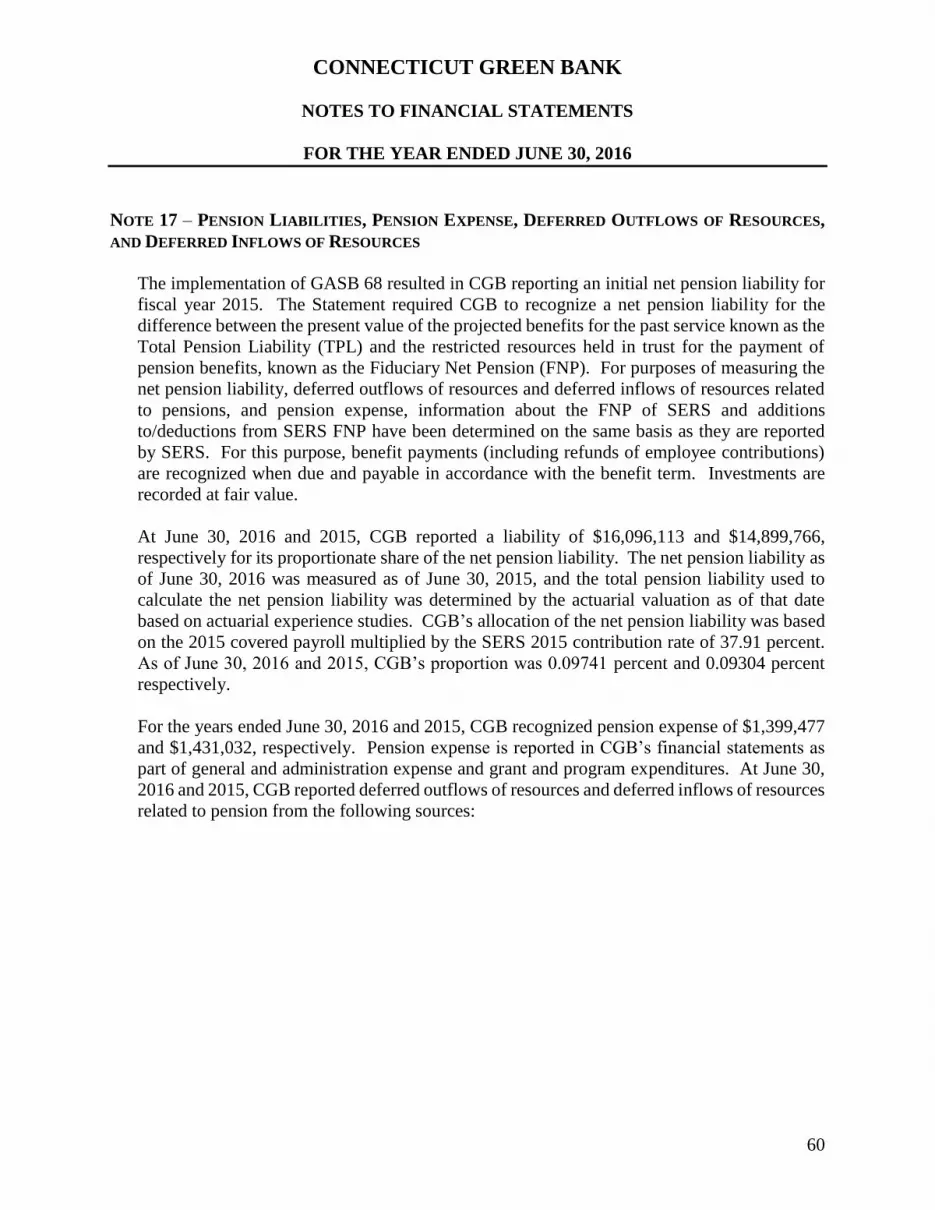
CONNECTICUT GREEN BANK
NOTES TO FINANCIAL STATEMENTS
FOR THE YEAR ENDED JUNE 30, 2016
60
NOTE 17 – PENSION LIABILITIES, PENSION EXPENSE, DEFERRED OUTFLOWS OF RESOURCES,
AND DEFERRED INFLOWS OF RESOURCES
The implementation of GASB 68 resulted in CGB reporting an initial net pension liability for
fiscal year 2015. The Statement required CGB to recognize a net pension liability for the
difference between the present value of the projected benefits for the past service known as the
Total Pension Liability (TPL) and the restricted resources held in trust for the payment of
pension benefits, known as the Fiduciary Net Pension (FNP). For purposes of measuring the
net pension liability, deferred outflows of resources and deferred inflows of resources related
to pensions, and pension expense, information about the FNP of SERS and additions
to/deductions from SERS FNP have been determined on the same basis as they are reported
by SERS. For this purpose, benefit payments (including refunds of employee contributions)
are recognized when due and payable in accordance with the benefit term. Investments are
recorded at fair value.
At June 30, 2016 and 2015, CGB reported a liability of $16,096,113 and $14,899,766,
respectively for its proportionate share of the net pension liability. The net pension liability as
of June 30, 2016 was measured as of June 30, 2015, and the total pension liability used to
calculate the net pension liability was determined by the actuarial valuation as of that date
based on actuarial experience studies. CGB’s allocation of the net pension liability was based
on the 2015 covered payroll multiplied by the SERS 2015 contribution rate of 37.91 percent.
As of June 30, 2016 and 2015, CGB’s proportion was 0.09741 percent and 0.09304 percent
respectively.
For the years ended June 30, 2016 and 2015, CGB recognized pension expense of $1,399,477
and $1,431,032, respectively. Pension expense is reported in CGB’s financial statements as
part of general and administration expense and grant and program expenditures. At June 30,
2016 and 2015, CGB reported deferred outflows of resources and deferred inflows of resources
related to pension from the following sources:

CONNECTICUT GREEN BANK
NOTES TO FINANCIAL STATEMENTS
FOR THE YEAR ENDED JUNE 30, 2016
61
As of June 30, 2016:
Net Difference between projected and actual earnings on
pension plan investments -$ (2,535)$
CGB Contributions subsequent to the measurement date 2,552,833 -
2,552,833$ (2,535)$
As of June 30, 2015:
Net Difference between projected and actual earnings on
pension plan investments -$ (532,135)$
CGB Contributions subsequent to the measurement date 1,669,961 -
1,669,961$ (532,135)$
Deferred Outflows
of Resources
Deferred Inflows of
Resources
Deferred Outflows
of Resources
Deferred Inflows of
Resources

CONNECTICUT GREEN BANK
NOTES TO FINANCIAL STATEMENTS
FOR THE YEAR ENDED JUNE 30, 2016
62
NOTE 17 – PENSION LIABILITIES, PENSION EXPENSE, DEFERRED OUTFLOWS OF RESOURCES,
AND DEFERRED INFLOWS OF RESOURCES (CONTINUED)
The amount recognized as deferred inflows of resources, representing the net difference
between projected and actual earnings, is amortized over a five-year closed period beginning
in the year in which the difference occurs and will be recognized in expense as follows:
ACTUARIAL METHODS AND ASSUMPTION
The total pension liability in the June 30, 2014 actuarial valuation was determined based on
the results of an actuarial experience study for the period July 1, 2007 through June 30, 2011.
The key actuarial assumptions are summarized below:
Inflation: 2.75%
Salary increase: 4.00% -20% including inflation
Investment rate of return: 8%, net of pension plan investment expense,
Including inflation
Cost of living adjustment: 2.30%-3.60% for certain tiers
Mortality rates were based on the RP-2000 Mortality Table for Males or Females, as
appropriate, with adjustments for mortality improvements based on Scale AA.
Discount rate
The discount rate used to measure the total pension liability at June 30, 2015 was the long term
expected rate of return, 8.00 percent. The projection of cash flows used to determine the
discount rate assumed that employee contributions will be made at the current contribution
rates and that employer contributions will be made equal to the difference between the
projected actuarially determined contribution and member contributions. Projected future
benefit payments for all current plan members were projected through the year 2015.
Year 1 (2017) 92,310$
Year 2 (2018) 92,310
Year 3 (2019) 92,308
Year 4 (2020) 231,591
Year 5 (2021) 92,342
600,861$

CONNECTICUT GREEN BANK
NOTES TO FINANCIAL STATEMENTS
FOR THE YEAR ENDED JUNE 30, 2016
63
NOTE 17 – PENSION LIABILITIES, PENSION EXPENSE, DEFERRED OUTFLOWS OF RESOURCES,
AND DEFERRED INFLOWS OF RESOURCES (CONTINUED)
Expected rate of return on investments
The long term expected rate of return on pension plan investments was determined using a log-
normal distribution analysis in which best estimate ranges of expected future real rates of return
(expected returns, net of pension plan investment expense and inflation) are developed for each
major asset class. These ranges are combined to produce the long-term expected rate of return
by weighing the expected future real rate of return by the target asset allocation percentage and
by adding expected inflation.
The target asset allocation and best estimate of arithmetic real rates of return for each major
asset class are summarized in the following table:
Asset Class
Large Cap U.S. Equities 21.0% 5.8%
Developed Non-U.S. Equities 18.0% 6.6%
Emerging Market (non-U.S.) 9.0% 8.3%
Real Estate 7.0% 5.1%
Private Equity 11.0% 7.6%
Alternative Investments 8.0% 4.1%
Fixed Income (Core) 8.0% 1.3%
High Yield Bonds 5.0% 3.9%
Emerging Market Bond 4.0% 3.7%
TIPS 5.0% 1.0%
Cash 4.0% 0.4%
Target
Allocation
Long-term
Expected Real
Rate of Return
Sensitivity of CGB proportionate share of the net pension liability to changes in the discount
rates
The following presents CGB’s proportionate share of the net pension liability calculated using
the discount rate of 8.00 percent, as well as the proportionate share of the net pension liability
using a 1.00 percent increase or decrease from the current discount rate.
7.0% 8.0% 9.0%
CGB's proportionate share
of the net pension liability 19,146,790$ 16,096,113$ 13,525,960$
1% Decrease Discount Rate 1% Increase

CONNECTICUT GREEN BANK
NOTES TO FINANCIAL STATEMENTS
FOR THE YEAR ENDED JUNE 30, 2016
64
NOTE 18 – RESTRICTED NET POSITION
Restricted net position at June 30, 2016 and 2015 consisted of the following:
2016 2015
Primary Government
Non-Expendable
Connecticut Innovations, Inc. equity interest 1,000$ 1,000$
Energy Programs
CGB
Assets restricted for maintaining loan loss
and interest rate buydown reserves 3,748,793 3,999,005
Assets restricted by contractual obligations for maintaining
pledge accounts for loan guarantees 1,200,346 --
CT Solar Loan I LLCAssets restricted by contractual obligations for maintaining
loan loss reserve 300,844 300,000
5,249,983 4,299,005
Discretely Presented Component Units
CT Solar Lease 2 LLC
Assets restricted for maintaining loan loss reserve 3,500,000 3,500,000
Assets restricted for operating and maintenance
reserve 1,000,000 1,000,000
9,749,983$ 8,799,005$

CONNECTICUT GREEN BANK
NOTES TO FINANCIAL STATEMENTS
FOR THE YEAR ENDED JUNE 30, 2016
65
NOTE 19 – RISK MANAGEMENT
CGB is subject to normal risks associated with its operations including property damage,
personal injury and employee dishonesty. All risks are managed through the purchase of
commercial insurance. There have been no losses exceeding insurance coverage, and there
have been no decreases in insurance coverage over the last three years.
NOTE 20 – RENEWABLE ENERGY CREDITS (PRIMARY GOVERNMENT)
CGB owns Class 1 Renewable Energy Credits (RECs) that are generated by certain
commercial renewable energy facilities for which CGB provided the initial funding. Through
its Residential Solar Incentive Program, CGB owns the rights to future RECs generated by
facilities installed on residential properties. On March 23, 2015 CGB entered into a contract
to sell a total of 98,553 RECs generated during the period 2014 to 2016. For the year ended
June 30, 2016 CGB sold its contractual obligation of 30,000 RECs. For the year ended June
30, 2015 CGB sold its contractual obligation of 23,553 RECs. CGB’s remaining obligation is
to sell 45,000 RECs generated or to be generated in 2016 for $49.50 per REC. Based on
historical performance, management believes that the RECs it will receive from funded
commercial facilities and residential facilities will exceed the commitments to sell RECs under
this agreement.
RECs trade on the New England Power Pool (NEPOOL) market. The market price of
Connecticut Class 1 RECs as of June 30, 2016 ranged from $35.00 to $37.50. CGB’s inventory
as of June 30, 2016 has been priced at its cost.

CONNECTICUT GREEN BANK REQUIRED SUPPLEMENTARY INFORMATION
SCHEDULE OF GREEN BANK’S PROPORTIONATE
SHARE OF THE NET PENSION LIABILITY
FOR THE YEAR ENDED JUNE 30, 2016
66
As of June 30,
2016 2015
Green Bank's portion of the net pension liability 0.97410% 0.09304%
Green Bank's proportionate share of the net pension liability 16,096,113$ 14,899,766$
Green Bank's covered employee payroll 4,695,647$ 4,013,411$
Green Bank's proportionate share of the net pension liability as a
percentage of its covered-employee payroll 342.79% 371.25%
Plan fiducuary ner position as a percentage of the total pension liabilty 39.23% 39.54%
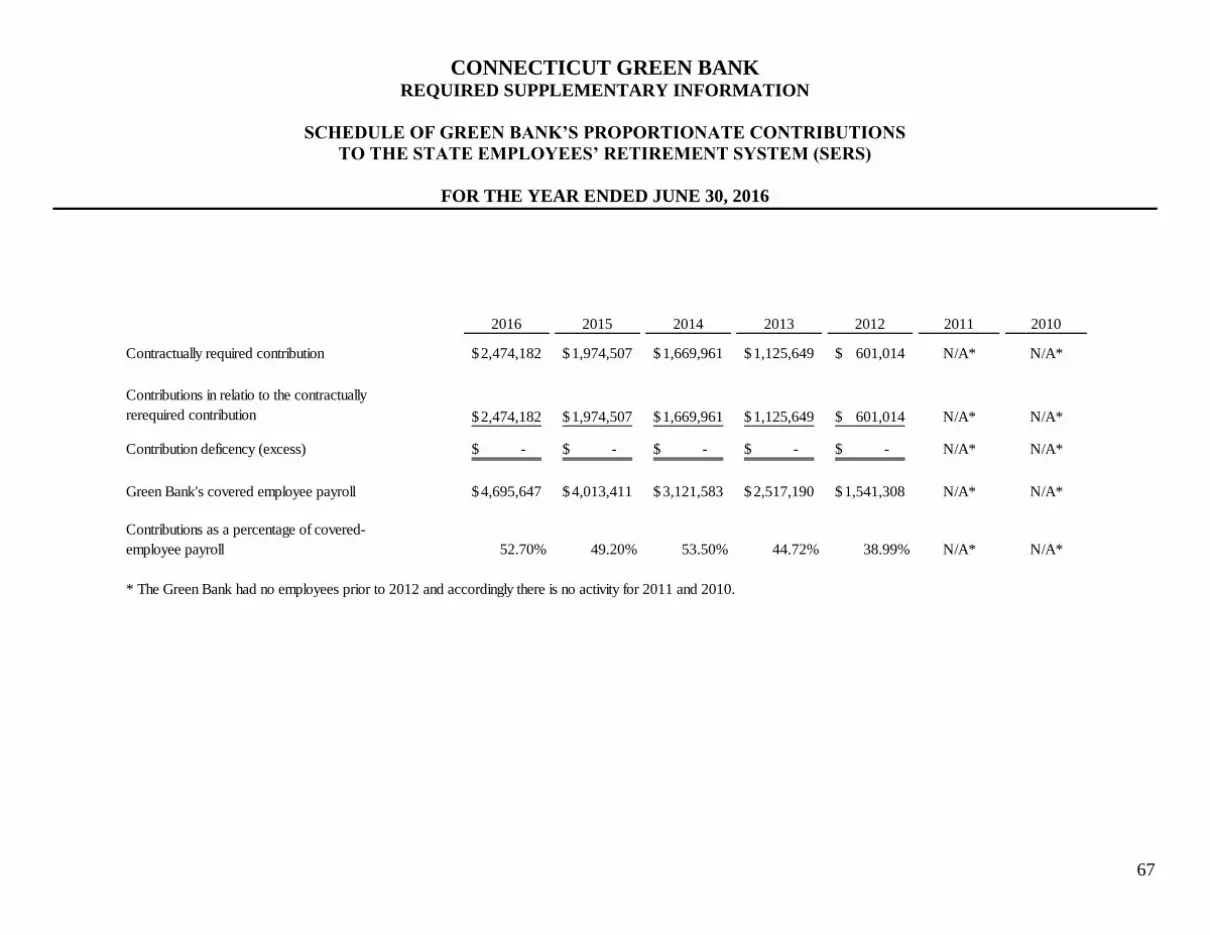
CONNECTICUT GREEN BANK REQUIRED SUPPLEMENTARY INFORMATION
SCHEDULE OF GREEN BANK’S PROPORTIONATE CONTRIBUTIONS
TO THE STATE EMPLOYEES’ RETIREMENT SYSTEM (SERS)
FOR THE YEAR ENDED JUNE 30, 2016
67
2016 2015 2014 2013 2012 2011 2010
Contractually required contribution 2,474,182$ 1,974,507$ 1,669,961$ 1,125,649$ 601,014$ N/A* N/A*
2,474,182$ 1,974,507$ 1,669,961$ 1,125,649$ 601,014$ N/A* N/A*
Contribution deficency (excess) -$ -$ -$ -$ -$ N/A* N/A*
Green Bank's covered employee payroll 4,695,647$ 4,013,411$ 3,121,583$ 2,517,190$ 1,541,308$ N/A* N/A*
52.70% 49.20% 53.50% 44.72% 38.99% N/A* N/A*
* The Green Bank had no employees prior to 2012 and accordingly there is no activity for 2011 and 2010.
Contributions in relatio to the contractually
rerequired contribution
Contributions as a percentage of covered-
employee payroll

68
STATISTICAL SECTION
(unaudited)

69
FINANCIAL STATISTICS
CONNECTICUT GREEN BANK
STATISTICAL SECTION INTRODUCTION
70
This part of the Connecticut Green Bank’s (CGB) comprehensive annual financial report presents
detailed information as a context for understanding what the information about the primary
government and the discretely presented component units in the financial statements, note
disclosures, and required supplementary information says about the benefits of CGB’s
investments.
FINANCIAL STATISTICS
CONTENTS PAGE
Financial Trends ..........................................................................................................................71
These schedules contain trend information to help the reader understand how CGB’s
financial performance and well-being have changed over time.
Revenue Capacity.........................................................................................................................75
These schedules contain information to help the reader assess CGB’s most significant
local revenue sources.
Debt Capacity ...............................................................................................................................77
These schedules present information to help the reader assess the affordability of the
government's current level of outstanding debt and the CGB’s ability to issue
additional debt in the future.
Demographic and Economic Information .................................................................................78
These schedules offer demographic and economic indicators to help the reader
understand the environment within which CGB’s financial activities take place.
Operating Information ................................................................................................................80
These schedules contain service and infrastructure data to help the reader understand
how the information in CGB’s financial report relates to the services CCB provides
and the activities it performs.

CONNECTICUT GREEN BANK
NET POSITION BY COMPONENT
Last Five Fiscal Years
71
Year Ended June 30,
2016 2015 2014 2013 2012
Primary Government
Invested in capital assets, net of related debt 248,752$ 263,839$ 289,932$ 362,505$ 91,329$
Restricted Net Position
Non-expendable 1,000 1,000 1,000 1,000 --
Restricted - energy programs 5,249,983 4,299,005 4,595,715 5,036,656 176,974
Unrestricted 116,624,244 104,881,783 97,754,765 93,717,230 80,920,002
122,123,978 109,445,626 102,641,412 99,117,391 81,188,305
CT Solar Lease 2 LLC
Invested in capital assets, net of related debt 65,678,491 30,830,671 3,538,975 -- --
Restricted Net Position
Non-expendable 17,482,892 8,007,153 1,294,801 100 --
Restricted - energy programs 4,500,000 4,500,000 4,500,000 4,500,000 --
Unrestricted (deficit) (53,701,650) (28,210,286) (5,741,703) (1,616,886) --
33,959,733 15,127,539 3,592,073 2,883,214 --
CEFIA Solar Services, Inc.
Restricted Net Position
Non-expendable 100 100 100 100 --
Restricted - energy programs -- -- -- -- --
Unrestricted (deficit) 346,280 224,654 109,123 -- --
346,380 224,754 109,223 100 --
Eliminations (29,046,448) (15,630,676) (5,549,471) (3,500,100) --
Total Net Position 127,383,643$ 109,167,243$ 100,793,237$ 98,500,605$ 81,188,305$

CONNECTICUT GREEN BANK
CHANGES IN NET POSITION
Last Five Fiscal Years
72
Year Ended June 30,
2016 2015 2014 2013 2012
Primary Government
Operating Revenues 69,250,883$ 72,038,472$ 52,301,283$ 43,343,093$ 39,753,684$
Operating Expenses
Cost of Goods Sold 28,826,976 22,526,874 2,794,270 -- --
Grants and program expenditures 25,261,516 21,111,751 22,948,676 23,634,465 31,122,355
General and administrative expenses 4,445,648 2,984,178 2,408,715 1,811,227 1,387,854
Total Operating Expenses 58,534,141 46,622,802 28,151,661 25,445,692 32,510,209
Operating Income (Loss) 10,716,743 25,415,669 24,149,622 17,897,401 7,243,475
Non-Operating Revenue and (Expenses)
Interest on solar lease notes 2,895,503 2,217,368 1,034,953 583,575 589,007
Interest on short-term investments 92,536 83,761 98,383 103,928 140,786
Interest income 60,127 58,511 57,407 -- --
Interest expense (61,795) (26,985) -- -- --
Realized gain (loss) on investments (2,936) (1,180,285) (350,000) (1,034,605) --
Unrealized gain (loss) on investments -- -- 349,999 378,059 434,702
Provision for loan losses (1,021,826) (563,825) (1,310,933) -- --
Net Non-Operating Revenues 1,961,609 588,545 (120,191) 30,957 1,164,495
Income (Loss) Before Transfers, Capital
Contributions and Member (Distributions) 12,678,352 26,004,215 24,029,431 17,928,358 8,407,970
Capital Contributions -- -- -- 1,000 --
Transfers to State of Connecticut -- (19,200,000) (6,200,000) -- --
Increase in Net Position 12,678,352$ 6,804,215$ 17,829,431$ 17,929,358$ 8,407,970$

CONNECTICUT GREEN BANK
CHANGES IN NET POSITION (CONTINUED)
Last Five Fiscal Years
73
Year Ended June 30,
2016 2015 2014 2013 2012
CT Solar Lease 2 LLC
Operating Revenues 2,416,595$ 210,869$ 1,770$ --$ --$
Operating Expenses
Grants and program expenditures 3,078,633 1,201,123 600,186 -- --
General and administrative expenses 305,217 124,748 127,511 853,480 --
Total Operating Expenses 3,383,850 1,325,871 727,697 853,480 --
Operating Loss (967,254) (1,115,002) (725,927) (853,480) --
Non-Operating Revenue and (Expenses)
Interest on short-term investments 27,777 9,207 8,642 -- --
Interest expense (729,170) (150,871) (57,407) --
Unrealized gain (loss) on investments (967,791) (660,073) -- -- --
Net Non-Operating Revenues (1,669,184) (801,737) (48,765) -- --
Income (Loss) Before Transfers, Capital
Contributions and Member (Distributions) (2,636,439) (1,916,739) (774,692) (853,480) --
Capital Contributions 21,770,182 13,556,783 1,496,135 3,736,694 --
Distributions to Members (301,548) (104,579) (12,584) -- --
Increase in Net Position 18,832,195$ 11,535,465$ 708,859$ 2,883,214$ --$

CONNECTICUT GREEN BANK
CHANGES IN NET POSITION (CONTINUED)
Last Five Fiscal Years
74
Year Ended June 30,
2016 2015 2014 2013 2012
CEFIA Solar Services, Inc.
Operating Revenues 126,075$ 123,000$ 120,000$ --$ --$
Operating Expenses
General and administrative expenses 4,750 8,450 10,877 -- --
Total Operating Expenses 4,750 8,450 10,877 -- --
Operating Loss 121,325 114,550 109,123 -- --
Non-Operating Revenue and (Expenses)
Interest on short-term investments 300 981 -- -- --
Net Non-Operating Revenues 300 981 -- -- --
Income (Loss) Before Transfers, Capital
Contributions and Member (Distributions) 121,625 115,531 109,123 -- --
Capital Contributions -- -- -- 100 --
Increase in Net Position 121,625$ 115,531$ 109,123$ 100$ --$

CONNECTICUT GREEN BANK
OPERATING REVENUE BY SOURCE
Last Five Fiscal Years Ending June 30,
75
Utility Remittances RGGI Auction Proceeds Grant Revenue
Sales of Energy
Equipment
Sales of Renewable
Energy Certificates Other Revenues
Total Operating % of % of % of % of % of % of
Revenues Revenue Annual Revenue Annual Revenue Annual Revenue Annual Revenue Annual Revenue Annual
Primary Government
2016 69,250,883$ 26,605,084$ 38.4 % 6,481,562$ 9.4 % 589,917$ 0.9 % 32,767,009$ 47.3 % 2,419,990$ 3.5 % 387,320$ 0.6 %
2015 72,038,472 27,233,987 37.8 % 16,583,545 23.0 % 192,274 0.3 % 25,912,414 36.0 % 1,474,488 2.0 % 641,763 0.9 %
2014 52,301,283 27,779,345 53.1 % 20,074,668 38.4 % 321,642 0.6 % 3,548,840 6.8 % 376,559 0.7 % 200,229 0.4 %
2013 43,343,093 27,621,409 63.7 % 4,744,657 10.9 % 10,035,250 23.2 % -- -- % 147,000 0.3 % 794,777 1.8 %
2012 39,753,684 27,025,088 68.0 % 2,052,748 5.2 % 10,435,251 26.2 % -- -- % 142,738 0.4 % 97,860 0.2 %
CT Solar Lease 2 LLC
2016 2,416,595$ --$ -- % --$ -- % --$ -- % --$ -- % 233,793$ 9.7 % 2,182,803$ 90.3 %
2015 210,869 -- -- % -- -- % -- -- % -- -- % -- -- % 210,869 100.0 %
2014 1,770 -- -- % -- -- % -- -- % -- -- % -- -- % 1,770 100.0 %
2013 -- -- -- % -- -- % -- -- % -- -- % -- -- % -- -- %
2012 -- -- -- % -- -- % -- -- % -- -- % -- -- % -- -- %
CEFIA Solar Services, Inc.
2016 126,075$ --$ -- % --$ -- % --$ -- % --$ -- % --$ -- % 126,075$ 100.0 %
2015 123,000 -- -- % -- -- % -- -- % -- -- % -- -- % 123,000 100.0 %
2014 120,000 -- -- % -- -- % -- -- % -- -- % -- -- % 120,000 100.0 %
2013 -- -- -- % -- -- % -- -- % -- -- % -- -- % -- -- %
2012 -- -- -- % -- -- % -- -- % -- -- % -- -- % -- -- %
Eliminations
2016 (34,005,320)$ --$ -- % --$ -- % --$ -- % (32,767,009)$ 96.4 % --$ -- % (1,238,311)$ 3.6 %
2015 (26,077,923) -- -- % -- -- % -- -- % (25,895,727) 99.3 % -- -- % (182,196) 0.7 %
2014 (3,668,840) -- -- % -- -- % -- -- % (3,548,840) 96.7 % -- -- % (120,000) 3.3 %
2013 -- -- -- % -- -- % -- -- % -- -- % -- -- % -- -- %
2012 -- -- -- % -- -- % -- -- % -- -- % -- -- % -- -- %
Total Reporting Entity
2016 37,788,234$ 26,605,084$ 70.4 % 6,481,562$ 17.2 % 589,917$ 1.6 % --$ -- % 2,653,783$ 7.0 % 1,457,887$ 3.9 %
2015 46,294,417 27,233,987 58.8 % 16,583,545 35.8 % 192,274 0.4 % 16,688 0.0 % 1,474,488 3.2 % 793,435 1.7 %
2014 48,754,213 27,779,345 57.0 % 20,074,668 41.2 % 321,642 0.7 % -- -- % 376,559 0.8 % 201,999 0.4 %
2013 43,343,093 27,621,409 63.7 % 4,744,657 10.9 % 10,035,250 23.2 % -- -- % 147,000 0.3 % 794,777 1.8 %
2012 39,753,684 27,025,088 68.0 % 2,052,748 5.2 % 10,435,251 26.2 % -- -- % 142,738 0.4 % 97,860 0.2 %

CONNECTICUT GREEN BANK
SIGNIFICANT SOURCES OF OPERATING REVENUE
Last Five Fiscal Years
76
Year Ended June 30,
2016 2015 2014 2013 2012
% of % of % of % of % of
Revenue Total Revenue Total Revenue Total Revenue Total Revenue Total
Utility Remittances*
Eversource 21,223,577$ 79.8 % 21,899,541$ 80.4 % 22,322,100$ 80.4 % 22,144,093$ 80.2 % 22,037,771$ 81.5 %
United Illuminating 5,381,507 20.2 % 5,334,446 19.6 % 5,457,245 19.6 % 5,477,316 19.8 % 4,987,317 18.5 %
Total 26,605,084$ 100.0 % 27,233,987$ 100.0 % 27,779,345$ 100.0 % 27,621,409$ 100.0 % 27,025,088$ 100.0 %
RGGI Auction Proceeds #
Renewables 6,481,562$ 100.0 % 5,631,156$ 34.0 % 7,476,158$ 37.2 % 4,744,657$ 100.0 % 2,052,748$ 100.0 %
Energy Efficiency -- -- % 10,952,389 66.0 % 12,598,510 62.8 % -- -- % -- -- %
Total 6,481,562$ 100.0 % 16,583,545$ 100.0 % 20,074,668$ 100.0 % 4,744,657$ 100.0 % 2,052,748$ 100.0 %
Grant Revenue
Federal ARRA Grants --$ -- % --$ -- % --$ -- % 8,376,681$ 83.5 % 8,738,726$ 83.8 %
DOE Grants 589,917 100.0 % 143,614 74.7 % 321,642 100.0 % 1,622,569 16.2 % 1,645,525 15.8 %
Private Foundation -- -- % 48,660 25.3 % -- -- % 36,000 0.4 % 50,000 0.5 %
Total 589,917$ 100.0 % 192,274$ 100.0 % 321,642$ 100.0 % 10,035,250$ 100.0 % 10,434,251$ 100.0 %
* Revenue based on Statutory rate of 1 mil per kWh generated by the utility.
# The Regional Greenhouse Gas Initiative (RGGI) is a cooperative effort among nine Northeastern and Mid-Atlantic states to reduce greenhouse gas emissions. RGGI holds quarterly
auctions of the member state’s CO2 allowances. At auction, a market-based clearing price is determined from prices submitted in the winning bids and is used to value proceeds
returned to the states. The Connecticut Green Bank receives a portion of Connecticut’s auction proceeds which is recognized as revenue and invested in clean energy programs.

CONNECTICUT GREEN BANK
OUTSTANDING DEBT BY TYPE
Last Five Fiscal Years
77
Primary Government CT Solar Lease 2 LLC CEFIA Solar Services, Inc. Total Reporting Entity
Line of Credit Line of Credit Line of Credit Line of Credit
Advances Available Advances Available Advances Available Advances Available
2016 2,510,837$ -$ 15,000,000$ -$ -$ -$ 17,510,837$ 6,000,000$
2015 853,525$ -$ 3,000,000$ 23,700,000$ -$ -$ 3,853,525$ 23,700,000$
2014 126,088$ 3,873,912$ -$ 26,700,000$ -$ -$ 126,088$ 30,573,912$
2013 -$ -$ -$ 26,700,000$ -$ -$ -$ 26,700,000$
2012 -$ -$ -$ -$ -$ -$ -$ -$
Fiscal
Year

CONNECTICUT GREEN BANK
DEMOGRAPHIC AND ECONOMIC INFORMATION
Last Five Fiscal Years
78
Fiscal
Year Population (1)
Median
Age (1)
Per Capita
Income (1)
Median
Household
Income (1)
Population 3
Years and Over
Enrolled in Public
School (1)
Unemployment
Rate (2)
2016 n/a n/a n/a n/a n/a 5.8%
2015 3,590,886 40.6 39,430 $ 71,346 729,896 5.5%
2014 3,592,053 40.3 39,373 70,048 733,997 6.5%
2013 3,583,561 40.2 37,726 67,098 751,831 7.7%
2012 3,572,213 40.0 36,891 67,276 759,755 8.5%
Sources: (1) US Census Bureau
(2) US Department of Labor

CONNECTICUT GREEN BANK
PRINCIPAL EMPLOYERS – FOR THE STATE OF CONNECTICUT
Last Three Calendar Years
79
2015 2014 2013
Employer (1)
Employees Rank
Percentage of
Total State
Employment (2)
Employees Rank
Percentage of
Total State
Employment (2)
Employees Rank
Percentage of
Total State
Employment (2)
State of Connecticut 51,646 1 2.89% 54,230 1 3.05% 53,951 1 3.10%
United Technologies 24,000 2 1.34 25,000 2 1.40 27,000 2 1.55
Yale New Haven Health System 20,071 3 1.12 18,869 3 1.06 18,639 3 1.07
Hartford Healthcare 18,107 4 1.01 18,597 4 1.05 16,951 4 0.98
Yale University 14,787 5 0.83 14,787 5 0.83 14,750 5 0.85
General Dynamics Electric Boat 9,583 6 0.54 8,896 7 0.50 8,817 6 0.51
Wal-Mart Stores Inc. 8,800 7 0.49 9,289 6 0.52 8,761 7 0.50
The Travelers Cos. Inc. 7,300 8 0.41 7,400 9 0.42 7,400 9 0.43
The Hartford Financial Services Group 7,000 9 0.39 7,000 11 0.39 7,700 11 0.44
Mohegan Sun 6,900 10 0.39 7,300 10 0.41 7,300 10 0.42
Foxwoods Resort Casino 5,301 14 0.30 7,600 8 0.43 7,667 8 0.44

CONNECTICUT GREEN BANK
FTEs BY FUNCTION
Last Five Fiscal Years
80
Year Ended June 30,
2016 2015 2014 2013 2012
Program Services
Statutory & Infrastructure 9.00 8.00 7.00 7.00 9.00
Residential 6.00 6.00 5.00 3.00 1.00
Commercial & Industrial 4.00 2.00 4.00 2.00 --
Institutional -- 1.00 1.00 1.00 1.00
Subtotal Program Services 19.00 17.00 17.00 13.00 11.00
Administrative & Support
Executive 4.00 4.00 4.00 4.00 4.00
Finance 6.00 5.00 4.00 3.00 1.00
Accounting 6.00 5.30 3.50 2.75 2.20
Legal & Policy 3.00 3.00 2.00 2.00 2.00
Marketing 6.00 6.00 5.00 5.00 5.00
Operations 3.90 3.50 3.80 4.00 3.85
Subtotal Administrative & Support 28.90 26.80 22.30 20.75 18.05
Total FTEs by Function 47.90 43.80 39.30 33.75 29.05

CONNECTICUT GREEN BANK
OPERATING INDICATORS BY FUNCTION
Last Five Fiscal Years
81
Year Ended June 30,
2016 2015 2014 2013 2012
Clean Energy Investment ($s in Millions)
CGB Dollars Invested 48.0$ 55.7$ 37.8$ 18.6$ 4.8$
Private Dollars Invested 268.3 281.9 102.8 92.7 10.2
Total Project Investment 314.1 335.5 140.2 111.1 15.0
Number of Clean Energy Projects 8,271 6,543 2,422 1,118 417
Annual Energy Savings of Clean Energy (MMBtu) 419,219 1,086,544 378,877 59,481 9,334
Installed Capacity of Clean Energy (MW)
Anaerobic Digesters 1.0 3.0 3.2 -- --
Biomass -- 0.6 -- -- --
CHP 2.5 0.9 3.0 0.7 --
Fuel Cell -- -- -- 14.8 --
Geothermal -- -- -- -- --
Hydro -- 0.5 -- -- --
Solar PV 70.9 55.4 19.9 8.0 2.9
Wind -- 5.0 -- -- --
Total 74.4 65.5 26.1 23.5 2.9
Lifetime Production of Clean Energy (MWh)
Anaerobic Digesters 82,283 244,404 260,698 -- --
Biomass -- 14,257 -- -- --
CHP 229,129 86,611 274,955 62,781 --
Fuel Cell -- -- -- 1,166,832 --
Geothermal 295 38 84 -- --
Hydro -- 43,898 -- -- --
Solar PV 1,683,858 1,317,343 471,912 189,733 68,388
Wind -- 118,260 -- -- --
Total 1,995,564 1,824,810 1,007,648 1,419,346 68,388
Jobs Created by Year
Direct Jobs (# of Jobs) 1,703 1,455 550 559 88
Indirect and Induced Jobs (# of Jobs) 2,740 2,340 885 1,132 142
Lifetime CO2 Emission Reductions
Emission Reductions (Tons) 885,103 815,600 271,179 178,437 35,459
Home Equivalents (# of Homes) 10,491 10,116 6,499 15,293 326
Cars Off the Road Equivalents (# of Cars) 5,816 5,432 1,630 1,967 236
Acres of Trees Planted Equivalents (# of Acres) 11,643 10,875 3,263 3,937 473

82
Year Ended June 30,
2016 2015 2014 2013 2012
Capital assets being depreciated:
Solar lease equipment 47,534,491$ 21,011,832$ 1,035,159$ --$ --$
Furniture and equipment 169,423 222,701 338,938 335,744 13,049
Computer hardware and software 212,832 128,628 88,337 136,659 28,460
Leasehold improvements 225,844 153,657 139,682 71,470 56,224
Capital assets not being depreciated:
WIP solar lease equipment 11,931,739 6,014,560 1,759,111 -- --
Construction in progress 4,502 7,141 7,141 -- --
60,078,831 27,538,519 3,368,368 543,873 97,733
Less accumulated depreciation and amortization:
Solar lease equipment 1,851,196 319,144 9,865 -- --
Furniture and equipment 103,079 122,149 205,820 146,560 626
Computer hardware and software 151,573 50,906 33,845 18,093 3,807
Leasehold improvements 109,196 75,232 44,501 16,715 1,971
2,215,044 567,432 294,031 181,368 6,404
Capital assets, net 57,863,787$ 26,971,087$ 3,074,337$ 362,505$ 91,329$

83
NON-FINANCIAL STATISTICS

CONNECTICUT GREEN BANK
NON-FINANCIAL STATISTICS INTRODUCTION
84
This part of the Connecticut Green Bank’s (CGB) comprehensive annual financial report presents
detailed non-financial information as a context for understanding the methods management uses
to measure CGB’s success and CGB’s efforts to transform the clean energy market in using its
financial resources.
NON-FINANCIAL STATISTICS
CONTENTS PAGE
1. Statement of the Connecticut Green Bank .........................................................................85
This narrative provides a summary of and commentary on the information included
in the Background and Market, Measures of Success, and Market Transformation
sections.
2. Background and Market
Governance ...........................................................................................................................87
Communities .........................................................................................................................91
Income.................................................................................................................................101
Small to Minority Owned Business Procurement ...............................................................103
3. Measures of Success
Attract and Deploy Capital .................................................................................................104
Green Bank .........................................................................................................................107
Public Benefits ....................................................................................................................109
4. Market Transformation
Program Logic Model .........................................................................................................112
Cost Effectiveness of Subsidies
Case of the Residential Solar Investment Program .......................................................118
Financial Warehouse and Credit Enhancement Structures
Case of the CT Solar Loan ............................................................................................126
Case of the CT Solar Lease ...........................................................................................131
Case of the Smart-E Loan .............................................................................................136
Case of the Low Income Solar Lease and
Energy Efficiency Energy Savings Agreement (ESA) ...........................................143
Case of the Commercial Property Assessed Clean Energy (C-PACE) .........................146

CONNECTICUT GREEN BANK
1. STATEMENT OF THE CONNECTICUT GREEN BANK
85
October XX, 2016
Re: Statement of the Connecticut Green Bank on the Non-Financial Statistics Contents of the
Comprehensive Annual Financial Report for FY 2016 – Background and Market,
Measures of Success, and Market Transformation
Dear Reader:
This is the “Non-Financial Statistics” section of the Comprehensive Annual Financial Report for
FY 2016.
In this section, you will find the following information:
Background and Market – an overview of the organization’s governance, including
engagement of its members at the board and committee levels, along with ethics
compliance and financial interest disclosure requirements. You will also be able to see
the level of investment, deployment and public benefits that are being created within our
local communities, including distressed communities and low income census tracts. And
last, you will see how the organization has made steady progress in terms of ensuring that
Connecticut’s small businesses and minority enterprises have an opportunity to bid on a
portion of the purchases of goods and services that the organization procures.
Measures of Success – as outlined in the organization’s Comprehensive Plan,13 we are
reporting on the following measures of success:
o Attract & Deploy Capital – how we are sourcing projects (as illustrated by
projects in statuses from approved to completed), level of investment by both the
Connecticut Green Bank and the end-use consumer or private investor, and the
private to public leverage ratio being achieved by sector.
o Energy Saved and Generated – how we are quantifying the energy generated
and/or saved by each project. This includes the amount of clean energy deployed
(i.e., MW), estimate of clean energy produced over the life of the projects (i.e.,
MWh), estimate of the annual amount of energy savings (i.e., MMBtu), and the
variety of renewable energy technologies we have invested in by sector.
o Green Bank – how we are building a balance sheet as a result of our financing
focus in terms of asset management (i.e., current vs. non-current assets), ratio of
public funds invested in grants and subsidies versus credit enhancements, loans,
and leases, and the general credit quality of residential borrowers in our financing
programs.
o Public Benefits – how our investment activities are resulting in economic
development (i.e., jobs) and environmental protection (i.e., GHG emission
reductions and equivalencies) benefits.
13 http://goo.gl/GhRL9t

CONNECTICUT GREEN BANK
1. STATEMENT OF THE CONNECTICUT GREEN BANK
86
Market Transformation – an overview of the program logic model for the organization
in terms of its goals:
o Attract and Deploy – to attract and deploy capital to finance the clean energy
policy goals for Connecticut;
o Affordable and Accessible – to develop and implement strategies that bring
down the cost of clean energy to make it more accessible and affordable to
consumers; and
o From Reliance to Markets – to reduce the market’s reliance on grants, rebates,
and other subsidies and move it towards innovative low-cost financing of clean
energy deployment.
The program logic model serves as a foundation for evaluating clean energy deployment
through subsidy and financing programs of the Connecticut Green Bank. As we begin to
evaluate our programs, the reader will see that we have applied the program logic model
to the subsidy (i.e., Residential Solar Investment Program) and financing (i.e., CT Solar
Loan, CT Solar Lease, Smart-E Loan, and C-PACE) programs.
The assembly of the “Non-Financial Statistics” section of the Comprehensive Annual Financial
Report is a process of continuous improvement. For example, the reader can compare FY 2015
with FY 2016 to see that more information is being disclosed to better communicate the level of
impact the Connecticut Green Bank is making.
[Paragraph here on findings from Marcum LLP assessment of the Non-Financial Statistics section
of the CAFR – data collection systems, project status, and project reporting.]

CONNECTICUT GREEN BANK
2. BACKGROUND AND MARKET – GOVERNANCE
87
Board of Directors
Pursuant to Section 16-245n of the General Statutes of Connecticut, the powers of the Connecticut
Green Bank are vested in and exercised by the Board of Directors that is comprised by eleven
voting and one non-voting member each with knowledge and expertise in matters related to the
purpose of the organization (see Table 2).
Table 2. Composition of the Board of Directors of the Connecticut Green Bank for FY 2016
Position Name Status Voting
Commissioner of DECD (or designee) Catherine Smith Ex Officio Yes
Commissioner of DEEP (or designee) Rob Klee Ex Officio Yes
State Treasurer (or designee) Bettina Ferguson Ex Officio Yes
Finance of Renewable Energy Reed Hundt Appointed Yes
Finance of Renewable Energy Kevin Walsh Appointed Yes
Labor Organization John Harrity Appointed Yes
R&D or Manufacturing Mun Choi Appointed Yes
Investment Fund Management Norma Glover Appointed Yes
Environmental Organization Matthew Ranelli Appointed Yes
Finance or Deployment Tom Flynn Appointed Yes
Residential or Low Income Pat Wrice Appointed Yes
President of the Green Bank Bryan Garcia Ex Officio No
The Board of Directors of the Connecticut Green Bank is governed through statute, as well as an
Ethics Statement and Ethical Conduct Policy, Resolutions of Purposes, Bylaws, Joint Committee
Bylaws, and Comprehensive Plan. The Comprehensive Plan for the Connecticut Green Bank
provides a multiyear strategy to support the vision and mission of the organization and the public
policy objective of delivering consumers cheaper, cleaner, and more reliable sources of energy
while creating jobs and supporting local economic development. An Employee Handbook and
Operating Procedures have also been approved by the Board of Directors and serve to guide the
staff to ensure that it is following proper contracting, financial assistance, and other requirements.
The Board of Directors of the Connecticut Green Bank is comprised of eleven (11) ex officio and
appointed voting members, and one (1) ex officio non-voting member. The leadership of the Board
of Directors, includes:
Chair – Catherine Smith, Commissioner of DECD (designated as the Chair of the
Connecticut Green Bank by Governor Malloy)
Vice Chair – Rob Klee, Commissioner of DEEP (voted in by his peers of the
Connecticut Green Bank Board of Directors)
Secretary – Matthew Ranelli, Partner at Shipman and Goodwin (voted in by his peers of
the Connecticut Green Bank Board of Directors)
For FY 2016, the Board of Directors of the Connecticut Green Bank met nine (9) times, including
six (6) regularly scheduled meetings and three (3) special meetings. There was an attendance rate

CONNECTICUT GREEN BANK
2. BACKGROUND AND MARKET – GOVERNANCE
88
of 76% by the Board of Directors and 49 approved resolutions. For a link to the materials from
the Board of Directors meetings that is publicly accessible – click here.
Committees of the Board of Directors
There are four (4) committees of the Board of Directors of the Connecticut Green Bank, including:
Audit, Compliance, and Governance
Budget and Operations
Deployment
Joint Committee of the Energy Efficiency Board and the Connecticut Green Bank
Audit, Compliance and Governance Committee
The Audit, Compliance and Governance Committee (ACG Committee) of the Connecticut Green
Bank is comprised of three (3) ex officio and appointed voting members. The leadership of the
ACG Committee, includes:
Chair – Matthew Ranelli, Partner and Shipman and Goodwin (designated as the Chair by
Catherine Smith)
Members14 – John Harrity and Pat Wrice (designated as a member of the Committee by
Catherine Smith)
For FY 2016, the ACG Committee of the Connecticut Green Bank met two (2) times, including
two (2) regularly scheduled meetings and no special meetings. There was an attendance rate of
83% by the Audit, Compliance and Governance Committee and 5 approved resolutions. For a link
to the materials from the ACG Committee meetings that is publicly accessible – click here.
Budget and Operations Committee
The Budget & Operations Committee (B&O Committee) of the Connecticut Green Bank is
comprised of three (3) ex officio and appointed voting members. The leadership of the B&O
Committee, includes:
Chair – Rob Klee, Commissioner of DEEP (designated as the Chair by Catherine Smith)
Members15 – Mun Choi and Norma Glover (designated as a member of the Committee
by Catherine Smith)
For FY 2016, the B&O Committee of the Connecticut Green Bank met three (3) times, including
three (3) regularly scheduled meetings and no special meetings. There was an attendance rate of
77% by the Budget and Operations Committee and 2 approved resolutions. For a link to the
materials from the B&O Committee meetings that is publicly accessible – click here.
Deployment Committee
The Deployment Committee of the Connecticut Green Bank is comprised of four (4) ex officio
and appointed voting members. The leadership of the Deployment Committee, includes:
14 Note – the Chair and/or Vice Chair of the Board of Directors of the Connecticut Green Bank can attend the Audit, Compliance,
and Governance Committee meeting to establish a quorum 15 Note – the Chair and/or Vice Chair of the Board of Directors of the Connecticut Green Bank can attend the Audit, Compliance,
and Governance Committee meeting to establish a quorum

CONNECTICUT GREEN BANK
2. BACKGROUND AND MARKET – GOVERNANCE
89
Chair16 – Reed Hundt, CEO of the Coalition for Green Capital (designated as the Chair
by Catherine Smith)
Members17 – Bettina Ferguson (ex officio per bylaws), Matthew Ranelli, and Pat Wrice
(designated as a member of the Committee by Catherine Smith)
For FY 2016, the Deployment Committee of the Connecticut Green Bank met five (5) times,
including two (2) regularly scheduled meetings and three (3) special meetings. There was an
attendance rate of 85% by the Deployment Committee and 16 approved resolutions. For a link to
the materials from the Deployment Committee meetings that is publicly accessible – click here.
Joint Committee
Pursuant to Section 16-245m(d)(2) of the Connecticut General Statutes, there is hereby created a
Joint Committee of the Energy Efficiency Board (EEB) and the Connecticut Green Bank. Per
bylaws established and approved by the EEB and the Connecticut Green Bank, the Joint
Committee is comprised of four (4) appointed and voting members, one (1) ex officio and voting
member, and four (4) ex officio and non-voting members. The leadership of the Joint Committee,
includes:
Chair – Eric Brown, Attorney with CBIA (voted in by his peers of the EEB and the
Connecticut Green Bank)
Vice Chair – Diane Duva, DEEP (voted in by her peers of the EEB and the Connecticut
Green Bank)
Secretary – Bryan Garcia, Connecticut Green Bank, and Craig Diamond, Connecticut
Energy Efficiency Fund (voted in by their peers of the EEB and the Connecticut Green
Bank)
Members18 – Bryan Garcia (non-voting), Norma Glover, Bert Hunter (non-voting), and
John Harrity (designated as members of the Committee by Catherine Smith)
For FY 2016, the Joint Committee of the EEB and the Connecticut Green Bank met five (5) times,
including four (4) regularly scheduled meetings and one (1) special meeting. There was an
attendance rate of 95% by the Joint Committee and 3 approved resolutions. For a link to the
materials from the Joint Committee meetings that is publicly accessible – click here.
Statement of Financial Interest
It is required by state ethics laws and a determination of the Governor’s standard that senior-level
staff (i.e., Director level and above) and members of the Board of Directors annually file a
Statement of Financial Interest (SFI). The Governor’s standard is the following:
Governor Malloy has established a standard which requires “filing of Annual
Statements of Financial Interests by all persons in the Executive Branch and Quasi-
Public Agencies who exercise (i) significant policy-making, regulatory or
16 Matthew Ranelli, Partner and Shipman and Goodwin for 11/14/14 & 11/21/14 only* 17 Bettina Ferguson, Reed Hundt, Rob Klee, Patricia Wrice, & Catherine Smith for 11/14/14 & 11/21/14 only* 18 Note – these members are representatives from the Connecticut Green Bank.

CONNECTICUT GREEN BANK
2. BACKGROUND AND MARKET – GOVERNANCE
90
contractual authority; (ii) significant decision-making and/or supervisory
responsibility for the review and/or award of State contracts; or (iii) significant
decision-making and/or supervisory responsibility over staff that monitor State
contracts.”
These statements include information such as names of all associated business, income over $1,000
and a list of all real property as well as any creditors. SFIs that have been filed are available to the
public under the Freedom of Information Act. The SFIs serve two purposes. First, the financial
disclosure provides a checklist or reminder to the official/employee to be mindful of potential
conflicts of interest. Second, the statements serve as a tool to maximize public confidence in
governmental decision making.
With respect to the 2016 SFI filing – required by May 2, 2016 – the Connecticut Office of State
Ethics received the following from the Connecticut Green Bank (see Table 3):
Table 3. Summary of State of Financial Interest Filings with the Office of State Ethics for
FY 2016
Number of SFIs
Submitted
% Submitted
on Time
Senior Staff 10 100%
Board of Directors 7 100%
The Connecticut Green Bank received a Certificate of Excellence Ethics Compliance from the
Connecticut Office of State Ethics.

CONNECTICUT GREEN BANK
2. BACKGROUND AND MARKET – COMMUNITIES
91
Fiscal Year 2016 Approved/Closed/Completed Projects
Communities across Connecticut are demonstrating leadership in their support of green energy.
The Connecticut Green Bank distributes reports to communities on an annual basis to provide them
with a breakdown of their performance. There are many leaders of green energy deployment
across the state, and we have assembled the “Top 5” in energy, environment, and economy for
both FY 2016 as well as FY 2012 through FY 2016.
Table 4. The “Top 5” Energy, Environment, and Economy Metrics for FY 201619
Municipality
Watts/
Capita Municipality
Lifetime
CO2
Emissions
(tons) Municipality
Investment/
Capita
Canaan 171.8 Bridgeport 29,949 Canaan $777.61
Kent 165.4 Manchester 24,760 Kent $498.93
Windsor 90.3 Bloomfield 21,685 Southington $358.57
Bloomfield 85.9 Milford 20,802 Windsor $346.60
Orange 72.4 Waterbury 19,596 Chester $326.25
Table 5. Clean Energy Performance by Municipality (FY 2016)
Municipality
#
Projects
Average
Investment
(Project
Cost)
Median
Investment
(Project
Cost)
Total
Investment
(Project
Cost)
Investment
/Capita MW
Watts/
Capita
Annual
MMBTU
Total
Job
Years
Lifetime
CO2
Emissions
(tons)
Andover 5 $43,707 $37,128 $218,534 $66.16 0.0 15.1 173 3 615
Ansonia 50 $30,368 $27,000 $1,518,394 $78.88 0.4 18.9 1,181 23 4,474
Ashford 21 $31,493 $31,618 $661,347 $153.20 0.1 32.9 464 10 1,749
Avon 35 $32,430 $35,490 $1,135,042 $62.72 0.3 15.4 978 18 3,432
Barkhamsted 17 $35,580 $34,627 $604,867 $159.22 0.2 41.4 510 9 1,936
Beacon Falls 7 $30,049 $27,300 $210,345 $34.77 0.1 8.5 167 3 636
Berlin 47 $32,806 $30,240 $1,541,875 $77.61 0.4 18.2 1,190 24 4,444
Bethany 15 $34,207 $36,855 $513,106 $92.24 0.1 22.6 408 8 1,552
Bethel 41 $34,899 $31,942 $1,430,846 $76.99 0.3 17.6 1,063 22 4,040
Bethlehem 15 $29,877 $29,016 $448,148 $124.24 0.1 26.5 310 7 1,177
Bloomfield 103 $49,138 $22,155 $5,061,227 $247.06 1.8 85.9 5,713 61 21,685
Bolton 28 $28,336 $30,776 $793,412 $159.32 0.2 45.3 768 12 2,777
Branford 65 $33,724 $31,395 $2,192,068 $78.22 0.5 17.6 1,618 34 6,068
Bridgeport 316 $34,114 $27,000 $10,779,927 $74.74 2.3 15.8 9,486 142 29,949
Bridgewater 7 $44,624 $39,028 $312,369 $180.87 0.1 37.8 212 5 805
Bristol 167 $36,867 $31,395 $6,156,742 $101.80 1.4 23.3 4,590 92 17,381
Brookfield 26 $39,157 $35,870 $1,018,073 $61.88 0.2 14.3 764 15 2,901
Brooklyn 42 $27,446 $25,636 $1,152,742 $140.41 0.3 36.9 982 18 3,729
Burlington 31 $68,606 $40,950 $2,126,799 $228.66 0.6 62.1 1,915 27 7,120
Canaan 15 $63,971 $39,312 $959,570 $777.61 0.2 171.8 815 13 3,045
Canterbury 21 $41,368 $32,604 $868,726 $169.28 0.2 39.2 652 13 2,478
Canton 8 $42,236 $38,753 $337,887 $32.83 0.1 8.0 286 5 1,010
19 It should be noted that both Bridgeport and Colebrook are in the “Top 5” in several categories as a result of large investments
in the Dominion Bridgeport Fuel Cell Park and Colebrook Wind Project respectively.

CONNECTICUT GREEN BANK
2. BACKGROUND AND MARKET – COMMUNITIES
92
Municipality
#
Projects
Average
Investment
(Project
Cost)
Median
Investment
(Project
Cost)
Total
Investment
(Project
Cost)
Investment
/Capita MW
Watts/
Capita
Annual
MMBTU
Total
Job
Years
Lifetime
CO2
Emissions
(tons)
Chaplin 3 $37,573 $40,950 $112,718 $48.90 0.0 9.3 70 2 265
Cheshire 59 $34,510 $31,000 $2,036,063 $69.58 0.5 17.3 1,737 33 6,237
Chester 16 $81,441 $36,855 $1,303,059 $326.25 0.1 30.4 406 9 1,498
Clinton 39 $48,406 $32,760 $1,887,829 $142.37 0.5 35.8 1,551 25 5,844
Colchester 46 $38,424 $36,375 $1,767,515 $110.00 0.4 25.1 1,338 27 4,963
Colebrook 4 $41,606 $40,159 $166,425 $112.07 0.0 26.5 128 3 485
Columbia 9 $34,120 $40,065 $307,080 $55.99 0.1 12.9 229 5 871
Cornwall 5 $24,128 $25,935 $120,640 $84.96 0.0 20.2 93 2 353
Coventry 36 $32,319 $29,090 $1,163,477 $93.56 0.3 22.1 891 18 3,384
Cromwell 50 $32,915 $30,043 $1,645,742 $117.51 0.4 29.4 1,334 25 5,068
Danbury 80 $37,629 $36,087 $3,010,357 $37.21 0.7 8.4 2,217 46 8,421
Darien 6 $32,244 $28,002 $193,463 $9.33 0.0 2.2 149 3 565
Deep River 22 $34,214 $27,983 $752,713 $162.61 0.1 32.4 504 12 1,846
Derby 34 $31,194 $30,823 $1,060,581 $82.20 0.3 20.9 874 16 3,319
Durham 20 $44,394 $44,145 $887,879 $120.18 0.2 27.2 651 14 2,473
East Granby 20 $37,814 $38,679 $756,283 $146.91 0.1 28.1 480 12 1,780
East Haddam 24 $33,491 $30,608 $803,783 $88.08 0.2 19.8 586 12 2,228
East
Hampton 39 $36,502 $35,490 $1,423,582 $109.85 0.3 24.7 1,058 22 3,950
East Hartford 222 $24,024 $21,960 $5,333,228 $104.06 1.4 26.7 4,630 83 16,862
East Haven 117 $28,236 $27,225 $3,303,651 $112.92 0.8 26.5 2,615 52 9,545
East Lyme 51 $33,574 $30,340 $1,712,290 $89.37 0.4 20.0 1,241 26 4,716
East Windsor 33 $47,442 $35,490 $1,565,578 $140.26 0.3 25.8 939 25 3,517
Eastford 6 $38,334 $40,268 $230,003 $131.51 0.1 36.9 209 4 794
Easton 8 $45,211 $43,816 $361,689 $48.29 0.1 9.7 347 5 897
Ellington 53 $38,488 $35,490 $2,039,878 $130.74 0.5 30.3 1,534 31 5,829
Enfield 66 $25,678 $24,570 $1,694,775 $37.95 0.4 8.3 1,215 26 4,541
Essex 16 $37,160 $37,538 $594,564 $88.97 0.1 18.5 400 9 1,520
Fairfield 116 $35,681 $30,748 $4,138,963 $69.67 1.0 17.3 3,359 61 12,644
Farmington 39 $31,400 $27,030 $1,224,594 $48.33 0.3 11.1 928 19 3,466
Franklin 7 $34,426 $27,269 $240,981 $125.38 0.1 28.5 177 4 674
Glastonbury 76 $31,919 $32,000 $2,425,863 $70.46 0.6 18.0 2,091 38 7,664
Goshen 5 $32,617 $32,130 $163,083 $54.80 0.0 13.1 126 3 479
Granby 23 $34,286 $30,030 $788,588 $69.90 0.2 17.3 634 12 2,408
Greenwich 24 $37,528 $29,282 $900,674 $14.72 0.2 3.3 686 14 2,461
Griswold 79 $36,193 $32,760 $2,859,267 $239.25 0.7 54.6 2,158 44 8,040
Groton 10 $141,438 $37,360 $1,414,385 $35.26 0.1 1.3 5,313 26 680
Guilford 69 $35,784 $33,768 $2,469,078 $110.35 0.6 26.4 1,972 38 7,284
Haddam 32 $42,828 $37,529 $1,370,506 $164.21 0.3 37.1 1,082 21 3,810
Hamden 170 $28,647 $27,150 $4,870,068 $79.89 1.1 18.2 3,630 76 13,670
Hampton 6 $38,553 $41,362 $231,318 $124.16 0.1 32.1 194 4 738
Hartford 117 $38,552 $19,110 $4,510,554 $36.15 1.1 8.6 5,758 67 19,514
Hartland 6 $36,504 $28,665 $219,023 $103.61 0.0 21.8 150 3 569
Harwinton 32 $35,338 $32,405 $1,130,811 $200.43 0.3 50.4 955 17 3,506
Hebron 29 $37,998 $38,220 $1,101,947 $113.77 0.3 27.2 854 17 3,246
Kent 11 $135,119 $48,195 $1,486,311 $498.93 0.5 165.4 1,598 16 6,070
Killingly 78 $34,808 $26,147 $2,714,986 $156.30 0.7 40.3 2,285 40 8,644
Killingworth 23 $33,552 $30,533 $771,688 $118.27 0.2 30.9 666 12 2,486
Lebanon 19 $32,218 $24,570 $612,147 $83.76 0.2 20.8 494 9 1,877
Ledyard 57 $31,462 $28,109 $1,793,320 $119.15 0.4 29.7 1,565 28 5,499
Lisbon 14 $34,476 $34,808 $482,670 $111.27 0.1 23.0 323 7 1,228
Litchfield 19 $28,501 $28,080 $541,528 $63.97 0.1 17.2 472 8 1,792
Lyme 5 $36,442 $40,308 $182,208 $75.73 0.0 15.8 123 3 468
Madison 24 $36,736 $35,295 $881,659 $48.26 0.2 11.0 705 14 2,534
Manchester 108 $62,626 $24,063 $6,763,588 $116.13 2.0 34.1 6,585 82 24,760

CONNECTICUT GREEN BANK
2. BACKGROUND AND MARKET – COMMUNITIES
93
Municipality
#
Projects
Average
Investment
(Project
Cost)
Median
Investment
(Project
Cost)
Total
Investment
(Project
Cost)
Investment
/Capita MW
Watts/
Capita
Annual
MMBTU
Total
Job
Years
Lifetime
CO2
Emissions
(tons)
Mansfield 30 $34,481 $32,630 $1,034,444 $38.97 0.2 9.1 785 16 2,982
Marlborough 8 $39,727 $40,365 $317,818 $49.63 0.1 11.6 242 5 918
Meriden 132 $31,889 $28,639 $4,209,327 $69.16 1.0 16.4 3,244 65 12,306
Middlebury 8 $39,056 $35,984 $312,444 $41.25 0.1 10.5 259 5 982
Middlefield 26 $33,701 $31,497 $876,234 $198.02 0.2 52.1 747 13 2,839
Middletown 127 $41,125 $32,760 $5,222,895 $109.61 1.3 26.4 4,158 76 15,527
Milford 223 $32,485 $28,080 $7,244,229 $137.31 1.7 32.0 5,642 110 20,802
Monroe 36 $44,563 $43,290 $1,604,267 $82.36 0.4 18.7 1,183 25 4,496
Montville 78 $35,342 $32,786 $2,756,651 $140.85 0.6 31.6 2,042 43 7,612
Morris 6 $39,229 $34,058 $235,373 $98.56 0.0 20.5 159 4 604
Naugatuck 119 $31,982 $30,056 $3,805,881 $119.45 0.9 29.7 3,095 59 11,640
New Britain 127 $65,851 $23,205 $8,363,077 $114.24 3.3 45.3 121,401 52 10,033
New Canaan 10 $53,201 $47,901 $532,010 $26.95 0.1 5.6 357 8 1,357
New
Fairfield 23 $47,524 $47,775 $1,093,061 $78.75 0.2 16.7 753 17 2,859
New
Hartford 18 $36,214 $34,605 $651,851 $93.52 0.2 23.5 532 10 2,022
New Haven 112 $33,292 $24,661 $3,728,701 $28.73 0.8 6.5 3,599 55 10,419
New London 45 $26,511 $20,475 $1,192,999 $43.19 0.3 9.6 939 20 3,263
New Milford 68 $40,312 $35,198 $2,741,210 $97.41 0.6 21.3 1,947 42 7,397
Newington 107 $30,334 $24,570 $3,245,746 $106.20 0.8 27.1 2,733 48 10,220
Newtown 37 $119,927 $36,173 $4,437,281 $161.00 0.7 25.6 5,537 47 8,823
Norfolk 5 $38,996 $38,919 $194,979 $114.09 0.0 26.4 146 3 556
North
Branford 15 $39,660 $40,950 $594,893 $41.29 0.1 8.8 411 9 1,560
North
Canaan 2 $59,725 $59,725 $119,450 $36.03 0.0 7.5 81 2 306
North Haven 126 $33,454 $30,202 $4,215,176 $174.95 1.1 46.4 3,626 65 13,775
North
Stonington 20 $52,305 $37,253 $1,046,109 $197.49 0.3 55.0 1,008 14 3,804
Norwalk 109 $26,658 $24,692 $2,905,716 $33.94 0.8 9.4 2,645 45 9,866
Norwich 25 $11,570 $10,175 $289,254 $7.14 0.0 0.0 305 9 0
Old Lyme 35 $32,793 $32,760 $1,147,752 $150.96 0.3 34.9 872 18 3,267
Old
Saybrook 42 $31,617 $29,060 $1,327,929 $129.66 0.3 28.8 958 20 3,640
Orange 53 $66,574 $31,824 $3,528,429 $252.83 1.0 72.4 3,338 42 12,450
Oxford 34 $42,329 $35,997 $1,439,193 $113.47 0.3 27.1 1,116 22 4,240
Plainfield 60 $33,181 $32,760 $1,990,859 $129.23 0.4 29.0 1,447 31 5,496
Plainville 67 $40,337 $29,172 $2,702,555 $152.55 0.7 41.0 2,494 37 9,297
Plymouth 60 $41,162 $35,768 $2,469,727 $201.73 0.5 42.2 1,675 37 6,363
Pomfret 19 $36,402 $33,278 $691,632 $162.85 0.2 40.1 560 11 2,098
Portland 12 $31,728 $29,249 $380,731 $40.04 0.1 11.6 370 6 1,360
Preston 21 $36,981 $34,125 $776,594 $164.32 0.2 38.1 604 12 2,221
Prospect 23 $36,608 $34,808 $841,988 $89.53 0.2 19.0 653 13 2,207
Putnam 46 $32,719 $28,822 $1,505,077 $157.04 0.4 41.8 1,304 23 4,933
Redding 13 $52,799 $42,000 $686,381 $74.95 0.1 13.4 399 11 1,517
Ridgefield 21 $48,609 $45,045 $1,020,779 $41.43 0.2 8.4 677 16 2,554
Rocky Hill 54 $34,664 $30,498 $1,871,857 $94.97 0.4 21.0 1,342 29 5,097
Roxbury 5 $40,790 $34,125 $203,950 $90.16 0.0 21.7 159 3 605
Salem 27 $41,514 $36,855 $1,120,876 $270.03 0.2 56.3 771 17 2,878
Salisbury 13 $31,473 $24,570 $409,155 $109.37 0.1 26.6 322 6 1,225
Scotland 4 $46,269 $39,741 $185,075 $107.23 0.0 24.9 140 3 530
Seymour 33 $28,134 $22,100 $928,430 $56.13 0.2 15.0 816 15 3,057
Sharon 3 $82,392 $48,600 $247,176 $88.85 0.1 20.6 186 4 705
Shelton 118 $35,005 $32,587 $4,130,618 $104.42 1.0 25.1 3,215 64 12,215

CONNECTICUT GREEN BANK
2. BACKGROUND AND MARKET – COMMUNITIES
94
Municipality
#
Projects
Average
Investment
(Project
Cost)
Median
Investment
(Project
Cost)
Total
Investment
(Project
Cost)
Investment
/Capita MW
Watts/
Capita
Annual
MMBTU
Total
Job
Years
Lifetime
CO2
Emissions
(tons)
Sherman 9 $37,408 $36,855 $336,669 $94.02 0.1 20.4 237 5 902
Simsbury 15 $39,350 $38,363 $590,255 $25.11 0.1 5.0 378 9 1,435
Somers 18 $41,849 $39,418 $753,288 $65.82 0.2 14.8 564 12 2,087
South
Windsor 96 $31,294 $31,142 $3,004,268 $116.86 0.8 30.7 2,563 45 9,737
Southbury 45 $37,309 $33,885 $1,678,907 $84.35 0.5 22.8 1,472 26 5,591
Southington 147 $105,057 $32,760 $15,443,413 $358.57 2.2 51.7 48,977 77 14,970
Sprague 12 $43,127 $44,796 $517,529 $173.43 0.1 35.9 359 8 1,319
Stafford 29 $33,112 $30,030 $960,242 $79.44 0.2 18.2 714 15 2,712
Stamford 77 $76,021 $32,382 $5,853,634 $47.73 0.8 6.5 9,601 97 9,815
Sterling 14 $35,614 $38,558 $498,602 $130.18 0.1 27.6 342 8 1,300
Stonington 90 $33,751 $31,133 $3,037,598 $163.80 0.7 39.1 2,350 46 8,929
Stratford 207 $30,188 $27,000 $6,248,991 $121.61 1.4 27.7 5,118 96 19,491
Suffield 47 $36,090 $33,278 $1,696,230 $107.80 0.4 24.8 1,272 26 4,813
Thomaston 23 $32,479 $26,602 $747,008 $94.71 0.2 22.7 590 12 2,210
Thompson 41 $40,481 $25,500 $1,659,728 $175.48 0.5 50.5 1,568 22 5,880
Tolland 46 $33,673 $30,345 $1,548,935 $102.91 0.4 27.1 1,344 24 5,019
Torrington 53 $31,851 $28,550 $1,688,116 $46.40 0.4 10.9 1,284 26 4,877
Trumbull 86 $37,887 $34,125 $3,258,323 $90.46 0.7 20.6 2,447 49 9,158
Union 2 $20,389 $20,389 $40,777 $47.75 0.0 12.5 35 1 131
Vernon 95 $36,068 $26,887 $3,426,415 $117.43 0.9 30.6 2,998 49 11,009
Voluntown 17 $27,379 $28,080 $465,444 $178.81 0.1 50.5 426 7 1,620
Wallingford 2 $19,925 $19,925 $39,850 $0.88 0.0 0.0 56 1 0
Warren 8 $44,237 $43,567 $353,894 $242.23 0.1 64.7 306 5 1,164
Washington 11 $42,166 $31,224 $463,824 $129.63 0.1 29.7 345 7 1,310
Waterbury 207 $34,121 $28,270 $7,062,995 $64.00 1.6 14.4 5,241 112 19,596
Waterford 92 $33,592 $29,389 $3,090,426 $158.35 0.7 37.9 2,484 48 9,102
Watertown 64 $37,147 $34,125 $2,377,404 $105.60 0.5 23.8 1,740 37 6,610
West
Hartford 145 $27,928 $24,383 $4,049,535 $64.01 1.0 15.3 3,185 62 11,905
West Haven 182 $28,842 $26,559 $5,249,261 $94.47 1.3 23.7 4,282 81 16,204
Westbrook 20 $41,956 $40,440 $839,122 $120.95 0.2 27.1 609 13 2,315
Weston 11 $39,682 $33,768 $436,506 $42.88 0.1 9.6 384 7 1,202
Westport 22 $48,344 $40,446 $1,063,572 $40.30 0.2 9.5 1,205 17 3,102
Wethersfield 81 $36,224 $28,330 $2,934,176 $110.03 0.8 28.6 2,541 42 9,387
Willington 21 $36,373 $35,960 $763,838 $126.44 0.2 30.1 589 12 2,237
Wilton 40 $40,322 $38,450 $1,612,899 $89.30 0.4 22.7 1,408 25 5,053
Winchester 16 $24,279 $22,170 $388,457 $34.55 0.1 9.5 348 6 1,322
Windham 44 $28,527 $25,486 $1,255,200 $49.68 0.3 12.5 995 19 3,780
Windsor 152 $28,499 $24,660 $4,331,842 $346.60 1.1 90.3 3,700 67 13,906
Windsor
Locks 70 $32,260 $21,799 $2,258,231 $77.75 0.6 21.5 2,180 31 7,892
Wolcott 66 $37,779 $34,808 $2,493,426 $149.49 0.5 32.3 1,846 39 6,641
Woodbridge 37 $52,064 $32,634 $1,926,384 $214.28 0.6 66.0 1,935 26 7,306
Woodbury 13 $37,278 $38,936 $484,615 $48.58 0.1 11.7 378 7 1,437
Woodstock 25 $31,611 $35,316 $790,284 $99.23 0.2 24.5 664 12 2,403
Unknown 4 $305,400 $300,640 $1,221,600 - 0.2 0 609 5 2,315
Total 8,271 $37,974 $29,172 $314,086,243 $87.94 74.4 20.8 419,219 4,444 885,103

CONNECTICUT GREEN BANK
2. BACKGROUND AND MARKET – COMMUNITIES
95
Approved/Closed/Completed Projects Fiscal Year 2012 - 2016
Table 6. The “Top 5” Energy, Environment, and Economy Metrics for FY 2012 - 201620
Municipality
Watts/
Capita Municipality
Lifetime
CO2
Emissions
(tons) Municipality
Investment/
Capita
Colebrook 3,426.9 Bridgeport 127,288 Colebrook $15,426.21
Canaan 249.5 Colebrook 62,532 Canaan $1,188.07
Woodbridge 213.7 Putnam 57,622 Southington $1,022.74
Hampton 208.9 Middletown 48,781 Bridgeport $1,010.29
Durham 187.6 Bristol 42,312 Windsor $856.09
Table 7. Clean Energy Performance by Municipality (FY 2012-2016)
Municipality
#
Projects
Average
Investment
(Project
Cost)
Median
Investment
(Project
Cost)
Total
Investment
(Project Cost)
Investment
/Capita MW
Watts/
Capita
Annual
MMBTU
Total
Job
Years
Lifetime
CO2
Emissions
(tons)
Andover 19 $36,684 $36,507 $697,003 $211.02 0.2 45.6 516 11 1,855
Ansonia 84 $34,616 $26,816 $2,907,745 $151.06 0.7 34.2 2,245 43 8,352
Ashford 86 $39,947 $32,664 $3,435,428 $795.79 0.8 185.0 2,613 50 9,838
Avon 96 $49,328 $37,063 $4,735,447 $261.66 1.0 53.0 5,393 74 11,898
Barkhamsted 33 $34,278 $32,898 $1,131,158 $297.75 0.3 72.7 896 17 3,404
Beacon Falls 28 $31,730 $30,585 $888,435 $146.87 0.2 33.4 655 14 2,489
Berlin 127 $33,794 $33,600 $4,291,814 $216.04 0.9 46.8 3,117 66 11,454
Bethany 53 $35,965 $35,000 $1,906,147 $342.65 0.4 76.7 1,408 30 5,258
Bethel 85 $33,132 $31,590 $2,816,242 $151.54 0.6 33.7 2,031 43 7,716
Bethlehem 35 $32,795 $29,453 $1,147,825 $318.22 0.2 66.4 776 18 2,950
Bloomfield 179 $41,037 $25,074 $7,345,671 $358.57 2.3 110.8 7,385 96 27,957
Bolton 56 $32,753 $30,776 $1,834,150 $368.30 0.5 92.2 1,526 28 5,660
Branford 111 $33,660 $31,395 $3,736,217 $133.31 0.8 30.0 2,769 58 10,364
Bridgeport 448 $325,252 $27,000 $145,713,095 $1,010.29 20.9 145.2 838,304 1,398 127,288
Bridgewater 9 $41,193 $38,680 $370,737 $214.67 0.1 44.0 246 6 935
Bristol 356 $40,287 $30,488 $14,342,157 $237.15 3.4 56.5 11,196 204 42,312
Brookfield 101 $54,867 $37,118 $5,541,613 $336.84 1.0 61.6 6,287 80 15,593
Brooklyn 96 $32,024 $30,000 $3,074,328 $374.46 0.7 89.2 2,394 47 9,018
Burlington 123 $46,271 $37,750 $5,691,360 $611.91 1.4 153.6 4,674 82 17,604
Canaan 28 $52,360 $37,729 $1,466,084 $1,188.07 0.3 249.5 1,125 21 4,226
Canterbury 52 $38,945 $32,719 $2,025,128 $394.61 0.4 87.7 1,459 31 5,543
Canton 73 $33,845 $29,400 $2,470,718 $240.06 0.6 58.0 2,033 38 7,356
Chaplin 29 $31,753 $29,168 $920,823 $399.49 0.2 91.0 680 14 2,584
Cheshire 194 $34,578 $33,445 $6,708,084 $229.25 1.6 55.4 5,384 105 19,983
Chester 37 $51,915 $31,200 $1,920,864 $480.94 0.3 65.8 863 18 3,236
Clinton 86 $39,630 $32,845 $3,408,152 $257.03 0.8 62.4 2,698 49 10,199
Colchester 114 $36,764 $33,480 $4,191,041 $260.83 0.9 53.9 2,875 65 10,666
Colebrook 11 $2,082,538 $36,464 $22,907,918 $15,426.21 5.1 3,426.9 288 6 62,532
Columbia 71 $32,536 $32,130 $2,310,077 $421.16 0.5 95.1 1,713 35 6,430
Cornwall 17 $28,676 $28,286 $487,498 $343.31 0.1 76.7 353 8 1,341
Coventry 129 $46,107 $31,395 $5,947,788 $478.31 1.5 120.7 4,882 79 18,517
Cromwell 117 $49,555 $30,240 $5,797,968 $413.99 0.9 62.0 6,904 97 10,709
20 Ibid

CONNECTICUT GREEN BANK
2. BACKGROUND AND MARKET – COMMUNITIES
96
Municipality
#
Projects
Average
Investment
(Project
Cost)
Median
Investment
(Project
Cost)
Total
Investment
(Project Cost)
Investment
/Capita MW
Watts/
Capita
Annual
MMBTU
Total
Job
Years
Lifetime
CO2
Emissions
(tons)
Danbury 196 $37,072 $35,464 $7,266,156 $89.82 1.5 19.0 5,870 113 18,971
Darien 25 $41,263 $39,592 $1,031,567 $49.76 0.2 9.8 659 16 2,503
Deep River 39 $52,780 $31,244 $2,058,418 $444.68 0.5 107.9 1,760 27 6,152
Derby 57 $30,574 $29,451 $1,742,694 $135.07 0.4 32.5 1,375 27 5,172
Durham 165 $34,032 $31,500 $5,615,243 $760.05 1.4 187.6 4,495 86 17,077
East Granby 68 $36,923 $36,334 $2,510,747 $487.71 0.5 103.2 1,779 39 6,543
East
Haddam 60 $45,131 $31,735 $2,707,849 $296.72 0.6 70.7 2,110 37 7,859
East
Hampton 91 $37,080 $35,490 $3,374,322 $260.38 0.7 55.7 2,358 52 8,887
East
Hartford 317 $25,469 $24,098 $8,073,769 $157.53 1.9 37.8 6,493 125 23,863
East Haven 175 $27,775 $26,774 $4,860,704 $166.14 1.1 38.8 3,871 76 13,970
East Lyme 135 $35,052 $33,885 $4,731,982 $246.98 1.0 53.8 3,406 72 12,961
East
Windsor 82 $58,965 $34,902 $4,835,110 $433.18 1.1 103.0 4,015 65 14,848
Eastford 19 $34,441 $30,791 $654,375 $374.14 0.2 97.3 552 10 2,096
Easton 54 $50,773 $33,885 $2,741,742 $366.05 0.7 97.5 2,516 36 8,997
Ellington 118 $40,822 $35,121 $4,817,046 $308.75 1.1 70.3 3,903 72 14,312
Enfield 240 $31,891 $27,338 $7,653,765 $171.40 1.7 38.5 5,860 113 21,752
Essex 45 $31,372 $28,560 $1,411,726 $211.24 0.3 47.0 1,018 22 3,867
Fairfield 288 $35,778 $30,015 $10,304,046 $173.46 2.5 41.3 8,149 163 30,205
Farmington 162 $31,868 $30,725 $5,162,681 $203.74 1.2 49.1 4,093 80 15,357
Franklin 19 $35,970 $31,044 $683,428 $355.58 0.2 81.2 506 11 1,924
Glastonbury 212 $33,721 $29,761 $7,148,914 $207.65 1.7 49.2 5,874 107 21,969
Goshen 17 $37,354 $41,000 $635,023 $213.38 0.1 47.9 462 10 1,756
Granby 72 $33,202 $31,257 $2,390,576 $211.89 0.5 47.5 1,740 37 6,609
Greenwich 103 $30,672 $27,895 $3,159,165 $51.64 0.7 11.3 2,273 49 8,490
Griswold 166 $36,630 $33,953 $6,080,617 $508.80 1.3 111.4 4,369 94 16,398
Groton 25 $76,212 $32,785 $1,905,304 $47.50 0.1 3.6 5,600 34 1,770
Guilford 150 $35,799 $34,199 $5,369,828 $239.99 1.2 54.5 4,011 82 15,032
Haddam 159 $33,762 $31,590 $5,368,236 $643.21 1.3 161.3 4,538 82 16,585
Hamden 360 $27,937 $26,316 $10,057,186 $164.98 2.3 37.1 7,566 157 27,893
Hampton 34 $43,352 $29,458 $1,473,974 $791.18 0.4 208.9 1,285 20 4,795
Hartford 175 $42,638 $19,854 $7,461,708 $59.80 1.5 12.3 8,295 113 25,605
Hartland 21 $31,654 $30,030 $664,728 $314.44 0.2 72.1 513 10 1,878
Harwinton 60 $33,973 $33,274 $2,038,384 $361.29 0.5 87.4 1,640 32 6,079
Hebron 77 $34,891 $34,091 $2,686,591 $277.37 0.6 63.2 1,985 41 7,543
Kent 18 $95,354 $33,808 $1,716,376 $576.16 0.5 183.5 1,772 20 6,734
Killingly 142 $33,235 $29,226 $4,719,429 $271.70 1.2 67.4 3,833 71 14,446
Killingworth 95 $41,608 $37,050 $3,952,751 $605.79 1.0 157.7 3,434 59 12,674
Lebanon 83 $31,188 $30,038 $2,588,627 $354.22 0.6 84.6 2,027 40 7,613
Ledyard 112 $32,813 $30,236 $3,675,039 $244.17 0.8 55.7 2,888 57 10,338
Lisbon 40 $36,133 $35,295 $1,445,317 $333.18 0.3 70.4 1,002 22 3,762
Litchfield 41 $32,001 $33,885 $1,312,030 $154.98 0.3 37.9 1,040 20 3,949
Lyme 17 $34,663 $32,881 $589,270 $244.92 0.1 59.0 460 9 1,748
Madison 83 $33,583 $31,962 $2,787,401 $152.58 0.6 34.5 2,100 43 7,831
Manchester 260 $44,037 $25,707 $11,449,653 $196.59 3.2 54.1 10,485 149 39,426
Mansfield 152 $30,896 $28,835 $4,696,166 $176.93 1.1 39.6 3,407 72 12,943
Marlborough 26 $37,722 $32,641 $980,774 $153.15 0.2 33.8 701 15 2,663
Meriden 241 $40,151 $28,665 $9,676,504 $158.98 1.8 29.7 12,497 158 35,448
Middlebury 26 $37,240 $36,172 $968,235 $127.82 0.2 28.6 731 15 2,672
Middlefield 54 $35,625 $33,323 $1,923,742 $434.74 0.5 102.2 1,467 30 5,573
Middletown 282 $63,089 $32,060 $17,791,132 $373.39 3.8 80.3 44,930 211 48,781
Milford 394 $89,866 $28,793 $35,407,071 $671.11 5.8 109.4 142,849 191 34,155

CONNECTICUT GREEN BANK
2. BACKGROUND AND MARKET – COMMUNITIES
97
Municipality
#
Projects
Average
Investment
(Project
Cost)
Median
Investment
(Project
Cost)
Total
Investment
(Project Cost)
Investment
/Capita MW
Watts/
Capita
Annual
MMBTU
Total
Job
Years
Lifetime
CO2
Emissions
(tons)
Monroe 83 $39,782 $39,015 $3,301,899 $169.51 0.7 37.8 2,390 51 9,078
Montville 180 $34,127 $32,786 $6,142,821 $313.87 1.4 69.9 4,631 96 16,846
Morris 17 $38,777 $36,720 $659,208 $276.05 0.1 53.8 416 10 1,582
Naugatuck 190 $34,312 $30,066 $6,519,282 $204.61 1.4 43.9 4,674 103 17,239
New Britain 233 $57,925 $23,205 $13,496,533 $184.36 4.9 66.9 127,472 115 32,357
New Canaan 51 $41,567 $39,102 $2,119,899 $107.40 0.4 22.1 1,418 33 5,375
New
Fairfield 76 $42,073 $38,738 $3,197,582 $230.36 0.7 48.6 2,187 49 8,308
New
Hartford 70 $35,625 $33,908 $2,493,753 $357.78 0.6 84.6 1,944 39 7,268
New Haven 200 $30,201 $24,661 $6,040,290 $46.54 1.3 10.2 5,193 91 16,299
New London 80 $54,013 $23,352 $4,321,046 $156.45 1.1 40.9 3,980 55 15,192
New Milford 136 $41,282 $37,743 $5,614,403 $199.50 1.2 42.4 3,867 86 14,692
Newington 219 $33,848 $27,300 $7,412,730 $242.55 1.8 57.4 5,837 110 21,885
Newtown 123 $62,027 $34,400 $7,629,349 $276.83 1.5 53.5 8,113 96 18,304
Norfolk 19 $38,214 $34,475 $726,069 $424.85 0.2 91.6 508 11 1,929
North
Branford 49 $36,540 $34,503 $1,790,467 $124.28 0.4 27.9 1,303 28 4,951
North
Canaan 7 $40,761 $34,644 $285,324 $86.07 0.1 18.0 193 4 734
North Haven 227 $33,527 $31,434 $7,610,695 $315.89 1.9 77.9 6,122 118 23,116
North
Stonington 44 $44,657 $38,360 $1,964,925 $370.95 0.5 91.6 1,637 28 6,192
Norwalk 173 $69,347 $26,950 $11,996,993 $140.15 4.3 50.7 147,247 86 17,839
Norwich 126 $13,055 $9,350 $1,644,978 $40.62 0.2 4.1 2,260 44 2,090
Old Lyme 83 $35,623 $33,885 $2,956,737 $388.89 0.7 90.0 2,250 46 8,433
Old
Saybrook 104 $32,066 $30,853 $3,334,875 $325.61 0.7 70.0 2,333 51 8,834
Orange 105 $51,254 $33,614 $5,381,697 $385.62 1.4 100.6 4,636 71 17,291
Oxford 70 $41,431 $37,850 $2,900,149 $228.66 0.7 52.7 2,168 45 8,237
Plainfield 139 $33,002 $32,016 $4,587,230 $297.78 1.0 66.9 3,343 71 12,701
Plainville 163 $48,302 $29,936 $7,873,293 $444.42 2.0 114.8 7,818 106 26,443
Plymouth 126 $38,762 $34,172 $4,883,979 $398.92 1.0 83.9 3,333 75 12,662
Pomfret 57 $32,299 $30,561 $1,841,022 $433.49 0.4 104.4 1,446 28 5,465
Portland 87 $31,128 $28,800 $2,708,097 $284.82 0.7 69.7 2,161 41 8,166
Preston 45 $37,278 $32,868 $1,677,502 $354.95 0.4 80.4 1,251 26 4,679
Prospect 54 $34,214 $32,125 $1,847,553 $196.44 0.4 43.1 1,387 28 4,995
Putnam 86 $55,469 $27,720 $4,770,301 $497.74 1.2 125.7 11,410 87 57,622
Redding 38 $45,706 $43,493 $1,736,827 $189.65 0.3 37.6 1,117 28 4,242
Ridgefield 64 $43,696 $40,832 $2,796,553 $113.51 0.6 23.9 1,916 43 7,261
Rocky Hill 118 $32,951 $30,874 $3,888,169 $197.28 0.9 43.4 2,781 60 10,547
Roxbury 28 $35,799 $33,580 $1,002,359 $443.13 0.3 114.8 842 15 3,199
Salem 50 $38,948 $35,741 $1,947,394 $469.14 0.4 97.9 1,350 30 5,007
Salisbury 38 $32,963 $30,327 $1,252,601 $334.83 0.3 69.7 882 19 3,212
Scotland 9 $37,714 $33,987 $339,426 $196.65 0.1 45.8 259 5 974
Seymour 67 $27,589 $26,458 $1,848,477 $111.76 0.4 26.9 1,457 29 5,490
Sharon 25 $45,492 $38,250 $1,137,312 $408.81 0.2 86.1 777 18 2,953
Shelton 230 $35,878 $31,826 $8,252,015 $208.60 1.8 46.4 6,609 129 22,624
Sherman 23 $36,210 $36,855 $832,835 $232.57 0.2 48.1 572 13 2,121
Simsbury 130 $39,035 $31,797 $5,074,608 $215.84 1.0 41.7 4,032 79 12,089
Somers 51 $56,387 $35,414 $2,875,740 $251.29 0.7 59.7 2,109 38 7,919
South
Windsor 222 $32,380 $32,065 $7,188,374 $279.61 1.7 65.9 5,605 110 20,862
Southbury 91 $38,468 $36,926 $3,500,622 $175.88 0.8 42.2 2,725 54 10,353
Southington 325 $135,534 $33,885 $44,048,596 $1,022.74 5.3 123.6 125,133 176 33,914

CONNECTICUT GREEN BANK
2. BACKGROUND AND MARKET – COMMUNITIES
98
Municipality
#
Projects
Average
Investment
(Project
Cost)
Median
Investment
(Project
Cost)
Total
Investment
(Project Cost)
Investment
/Capita MW
Watts/
Capita
Annual
MMBTU
Total
Job
Years
Lifetime
CO2
Emissions
(tons)
Sprague 28 $36,905 $35,807 $1,033,330 $346.29 0.2 75.7 745 16 2,785
Stafford 110 $31,736 $31,020 $3,490,922 $288.82 0.8 66.0 2,636 54 9,827
Stamford 175 $56,381 $29,438 $9,866,644 $80.45 1.5 12.5 15,919 159 18,761
Sterling 40 $34,838 $33,013 $1,393,533 $363.85 0.3 80.1 994 21 3,778
Stonington 193 $33,009 $31,752 $6,370,823 $343.53 1.5 80.8 4,876 96 18,453
Stratford 348 $29,852 $27,000 $10,388,474 $202.17 2.3 45.4 8,149 159 30,703
Suffield 153 $37,945 $38,085 $5,805,627 $368.96 1.3 82.5 4,304 89 15,987
Thomaston 47 $33,615 $32,130 $1,579,889 $200.32 0.4 44.8 1,153 25 4,352
Thompson 85 $36,654 $26,263 $3,115,549 $329.41 0.8 85.2 2,634 44 9,928
Tolland 141 $36,613 $33,885 $5,162,466 $342.98 1.2 79.4 3,900 80 14,728
Torrington 157 $34,049 $31,044 $5,345,747 $146.93 1.2 31.7 3,855 83 14,203
Trumbull 200 $39,869 $31,872 $7,973,804 $221.38 1.8 51.1 6,304 116 23,551
Union 14 $29,287 $29,793 $410,024 $480.12 0.1 113.1 325 6 1,190
Vernon 183 $33,480 $27,541 $6,126,848 $209.97 1.5 51.3 4,972 90 18,445
Voluntown 33 $49,589 $30,188 $1,636,452 $628.68 0.5 175.4 1,481 21 5,626
Wallingford 3 $25,274 $25,275 $75,822 $1.68 0.0 0.2 86 2 115
Warren 16 $38,302 $31,603 $612,836 $419.46 0.1 101.2 479 9 1,821
Washington 26 $36,330 $30,627 $944,585 $264.00 0.2 57.9 671 15 2,551
Waterbury 369 $36,804 $27,885 $13,580,579 $123.05 3.1 28.0 10,364 209 38,670
Waterford 168 $34,294 $31,398 $5,761,323 $295.20 1.3 67.2 4,400 88 16,158
Watertown 141 $41,100 $35,029 $5,795,125 $257.40 1.4 60.1 4,592 84 17,191
West
Hartford 380 $27,737 $23,799 $10,540,100 $166.59 2.4 37.3 7,864 166 29,084
West Haven 298 $29,152 $25,983 $8,687,337 $156.35 2.1 37.8 6,852 134 26,312
Westbrook 45 $34,686 $32,175 $1,560,872 $224.97 0.4 50.6 1,177 24 4,321
Weston 57 $44,929 $42,984 $2,560,967 $251.59 0.6 57.5 1,986 40 7,211
Westport 116 $39,924 $29,316 $4,631,230 $175.49 0.9 34.9 3,382 72 11,373
Wethersfield 159 $33,553 $28,675 $5,334,988 $200.05 1.3 48.3 4,314 80 15,882
Willington 40 $39,423 $38,906 $1,576,902 $261.03 0.4 58.7 1,154 24 4,382
Wilton 62 $38,863 $38,105 $2,409,505 $133.40 0.6 32.6 1,987 37 7,251
Winchester 39 $30,828 $27,200 $1,202,292 $106.95 0.3 23.5 857 18 3,257
Windham 115 $33,132 $25,740 $3,810,211 $150.79 0.8 33.6 3,228 55 10,349
Windsor 272 $39,336 $27,352 $10,699,403 $856.09 2.0 163.4 10,241 169 24,602
Windsor
Locks 143 $32,668 $28,080 $4,671,505 $160.84 1.1 39.4 3,941 69 14,303
Wolcott 133 $39,053 $34,808 $5,194,009 $311.39 1.1 66.7 3,706 81 13,705
Woodbridge 78 $78,392 $33,885 $6,114,606 $680.16 1.9 213.7 6,279 72 23,668
Woodbury 36 $38,223 $35,629 $1,376,032 $137.95 0.3 30.6 1,058 21 3,765
Woodstock 98 $38,655 $34,561 $3,788,219 $475.67 0.8 100.6 2,629 58 9,869
Unknown 4 $305,400 $300,640 $1,221,600 - 0.2 0 609 5 2,315
Total 18,771 $48,790 $30,188 $915,828,602 $256.43 192.3 53.9 1,953,454 11,594 2,185,779

CONNECTICUT GREEN BANK
2. BACKGROUND AND MARKET – COMMUNITIES
99
DISTRESSED COMMUNITIES21
Connecticut’s “distressed communities” are particularly affected by the state’s high energy
prices. On average, Connecticut’s neediest households owe $2,560 more in annual energy bills
than they can afford22. CGB financing products and marketing efforts seek to bring lower and
more predictable energy costs to homes and businesses in distressed communities.
Table 8. Overview of Distressed and Not Distressed Municipalities, Population, and
Households in Connecticut
Distressed
%
Not
Distressed Distressed Total
# Towns 15% 144 25 169
Population 33% 2,406,785 1,167,312 3,574,097
Households 33% 899,083 438,675 1,337,758
CGB has steadily increased its percentage of projects deployed each year in distressed
municipalities. This has led to nearly $300 million in clean energy projects in these
communities, creating over 3,600 jobs.
21 Distressed Communities as defined by the Department of Economic and Community Development (DECD). DECD
Methodology: Weighted components are summed to measure the rank of the 169 towns. For each component, every town is ranked from 1 to 169, with the best town scoring 1 and worst 169. The top 25 towns with highest total scores are designated distressed municipalities. DECD’s components and weights:
1. Per capita income for 2014, weight 1; 2. % of poverty in population for 2014, weight 1; 3. Unemployment rate for 2015, weight 2; 4. % change in population from 2000 to 2010, weight 1; 5. % change in employment from 2005 to 2015, weight 1; 6. % change in per capita income from 2000 to 2014, weight 1; 7. % of house stock built before 1939 in 2014, weight 1/3; 8. % population with high school degree and higher in 2014, weight 1; and 9. Per Capita Adjusted Equalized Net Grand List in 2016-2017, weight 1.
According to C.G.S. Section 32-9p, a distressed municipality should be based on “high unemployment and poverty, aging housing stock and low or declining rates of growth in job creation, population, and per capita income.” DECD additionally included 1) Level of Per Capita Income, 2) % of population with high school degree and higher and 3) Per Capita Adjusted Equalized Net Grand List (AENGL) to arrive at its ranking. Data sources: Census 2000, Census 2010, 2010-2014 Census American Community Survey (ACS) 5-year Estimates, DOL, DOE Prepared by DECD Research August 18, 2016 http://www.ct.gov/ecd/cwp/view.asp?a=1105&q=251248
22 Home Energy Affordability in Connecticut, http://www.operationfuel.org/wp-content/uploads/Connecticut-2014-HEAG-Final.pdf.

CONNECTICUT GREEN BANK
2. BACKGROUND AND MARKET – COMMUNITIES
100
Table 9. Project Performance – Clean Energy Approved, Closed, and Completed Projects
in Connecticut (FY 2016)23
#
Projects
Investment
(Project Cost)
Investment
/Capita* MW
Watts
/Capita*
Annual
MMBTU
Total
Job
Years
Lifetime
CO2
Emissions
(tons)
Not Distressed 5,719 $226,847,885 $194.33 52.9 45.3 232,607 3,212 642,677
Distressed 2,548 $86,016,759 $35.74 21.3 8.9 186,002 1,227 240,111
Unknown 4 $1,221,600 - 0.2 - 609 5 2,315
Total 8,271 $314,086,243 $87.54 74.4 20.8 419,219 4,444 885,103
% Distressed 31% 27% 29%
Table 10. Project Performance – Clean Energy Approved, Closed, and Completed Projects
in Connecticut (FY 2012-2016)
# Projects
Investment
(Project Cost)
Investment
/Capita* MW
Watts
/Capita*
Annual
MMBTU)
Total
Job
Years
Lifetime
CO2
Emissions
(tons)
Not
Distressed 14,039 $616,511,153 $528.15 135.1 115.8 863,166 7,933 1,573,531
Distressed 4,728 $298,095,849 $123.86 57.0 23.7 1,089,678 3,655 609,933
Unknown 4 $1,221,600 - 0.2 - 609 5 2,315
Total 18,771 $915,828,602 $255.90 192.3 53.8 1,953,454 11,594 2,185,779
% Distressed 25% 33% 30%
* Calculated using the 2016 distressed community designations
23 The Connecticut Green Bank tracks projects through three phases as they move through the pipeline to construction
completion and operation – Approved, Closed, and Completed. Approved signifies that the appropriate authority within the Connecticut Green Bank, whether President & CEO, Deployment Committee, or Board of Directors, has approved the Connecticut Green Bank’s investment in the project. Closed indicates all financial and legal documents have been executed and any additional funding has been secured. Completion indicates all construction and installation is complete and the project is operational.

CONNECTICUT GREEN BANK
2. BACKGROUND AND MARKET – INCOME
101
In addition to looking at funding and clean energy deployment in distressed municipalities, CGB
works to ensure that low to moderate income (LMI) census tracts across the entire state are
benefiting from its programs. CGB defines low to moderate income as 100% or less of area median
income. Tables 11 through 12 group CGB’s projects based upon the average income of their
census tract.
Table 11. Projects by Area Median Income – Clean Energy Deployment in the Residential
Sector (FY 2016)
FY 2016
Income Bands # Projects
Projects
/1,000
Households
Installed
Capacity
(MW)
Watts
/Household
<60% AMI 633 2.8 6.4 28.4
60%-80% AMI 1,057 4.9 7.3 33.9
80%-100% AMI 1,477 6.4 11.7 50.5
100%-120% AMI 2,223 8.0 17.4 62.7
>120% AMI 2,672 6.6 22.4 55.2
Unknown 122 - 1.0 -
Total 8,184 6.0 66.2 48.8
Table 12. Projects by Area Median Income – Clean Energy Deployment in the Residential
Sector (FY 2012-2016)
FY 2012 -2016
Income Bands # Projects
Projects
/1,000
Households
Installed
Capacity
(MW)
Watts
/Household
<60% AMI 1,011 5.4 25.6 114.1
60%-80% AMI 1,906 8.8 13.2 61.1
80%-100% AMI 3,110 13.5 24.5 106.1
100%-120% AMI 5,004 18.0 45.6 164.1
>120% AMI 7,430 18.3 61.8 152.1
Unknown 125 - 1.0 -
Total 18,586 13.6 171.7 125.9
Through such products and initiatives as the LMI solar incentive, it’s partnership with PosiGen,
and its affordable multifamily housing energy financing products, CGB has focused on increasing
its penetration in the LMI market. Tables 13 through 15 illustrate that CGB has made progress on
this goal but still has work to do.

CONNECTICUT GREEN BANK
2. BACKGROUND AND MARKET – INCOME
102
Table 13. Projects by Area Median Income – Number of Clean Energy Projects Above or
Below 100% (FY 2012-2016)
# Projects
100% or
Below
AMI
Over 100%
AMI Total
100% or
Below AMI
FY 2012 62 355 417 15%
FY 2013 184 934 1,118 16%
FY 2014 649 1,773 2,422 27%
FY 2015 1,995 4,545 6,540 31%
FY 2016 3,209 4,925 8,134 39%
Unknown AMI - - 140 -
Total 6,099 12,532 18,771 32%
Table 14. Deployment – Clean Energy Installed Capacity (MW) Above or Below 100% (FY
2012-2016)
MW
100% or
Below
AMI
Over 100%
AMI Total
100% or
Below AMI
FY 2012 0.4 2.5 2.9 14%
FY 2013 16.6 6.9 23.5 71%
FY 2014 9.5 16.6 26.1 36%
FY 2015 17.1 48.3 65.5 26%
FY 2016 28.1 43.3 72.1 40%
Unknown AMI - - 2.4 -
Total 72.4 117.5 192.3 38%
Table 15. Investment – Clean Energy Investment Above or Below 100% Area Median
Income (FY 2012-2016)
Investment
(Project Cost)
100% or
Below AMI
Over 100%
AMI Total
100% or
Below
AMI
FY 2012 $1,901,884 $13,087,685 $14,989,569 13.%
FY 2013 $79,017,723 $32,046,769 $111,064,486 71%
FY 2014 $69,598,876 $70,553,491 $140,152,366 50%
FY 2015 $113,254,360 $222,190,050 $335,444,411 34%
FY 2016 $125,461,942 $179,261,682 $304,723,625 41%
Unknown AMI - - $9,454,145 -
Total $389,234,786 $517,139,671 $915,828,602 38%

CONNECTICUT GREEN BANK
2. BACKGROUND AND MARKET
SMALL TO MINORITY OWNED BUSINESS PROCUREMENT
103
The State of Connecticut’s Supplier Diversity Program was established to ensure Connecticut
small businesses have an opportunity to bid on a portion of the State’s purchases. Through Fiscal
Year 2015, the program required agencies and political subdivisions to set aside 25% of their
annual budgets for construction, housing rehabilitation, and purchasing goods and services (after
approved exemptions by the Department of Administrative Services) to be awarded to certified
small businesses, with 25% of this amount to be awarded to certified minority business enterprises.
Although reporting is no longer required, the Connecticut Green Bank is performing the analysis
to ensure we are still committed to voluntarily meeting our set aside goals.
Table 16. Small Business Procurement (FY 2012-2016)
Year
Small Business
Goal Actual Percentage
FY 2012 $ 59,775 $ 39,520 66%
FY 2013 $ 62,598 $ 59,340 95%
FY 2014 $ 135,320 $ 120,560 89%
FY 2015 $ 221,750 $ 251,980 113%
FY 2016 $ 238,550 $ 510,797 214%
Table 17. Minority Business Enterprise Procurement (FY 2012-2016)
Year
Minority Business Enterprises
Goal Actual Percentage
FY 2012 $ 14,944 $ 31,474 211%
FY 2013 $ 15,649 $ 52,308 334%
FY 2014 $ 33,830 $ 88,427 261%
FY 2015 $ 55,438 $ 153,319 277%
FY 2016 $ 59,638 $ 96,020 161%

CONNECTICUT GREEN BANK
3. MEASURES OF SUCCESS – ATTRACT AND DEPLOY CAPITAL
104
Project Status
The Connecticut Green Bank tracks projects through three phases as they move through the
pipeline to construction completion and operation – Approved, Closed, and Completed. Approved
signifies that the appropriate authority within the Connecticut Green Bank, whether President &
CEO, Deployment Committee, or Board of Directors, has approved the Connecticut Green Bank’s
investment in the project per the Comprehensive Plan and Budget. Closed indicates all financial
and legal documents have been executed and any additional funding has been secured. Completion
indicates all construction and installation is complete and the project is operational. The table
highlights the fact that projects can take some time to move through this pipeline (see Table 18).
The full energy, economic, and environmental benefits from these projects begin to be fully
realized after they are completed.
Table 18. Clean Energy Project Status (FY 2012-2016)
# PROJECTS FY 2012 FY 2013 FY 2014 FY 2015 FY 2016 Total
Approved 0 0 12 43 63 118
Closed 2 2 60 587 4,186 4,837
Completed 415 1,116 2,350 5,913 4,022 13,816
Total 417 1,118 2,422 6,543 8,271 18,771
Clean Energy Investment
The Connecticut Green Bank’s vision is to lead the green bank movement by accelerating private
investment in clean energy deployment for Connecticut to achieve economic prosperity, create
jobs, promote energy security, and address climate change. The Green Bank tracks its progress
towards this vision as “E3” metrics – Energy, Economic, and Environmental. Investment
represents the total amount of private and public funding for clean energy projects, shown in Tables
19 and 20 below.
Table 19. Clean Energy Investment by Source - Public and Private (FY 2012-2016)
FY 2012 FY 2013 FY 2014 FY 2015 FY 2016 Total
Total CGB
Investment $4,809,813 $18,595,710 $37,834,791 $55,698,896 $48,042,380 $164,981,590
Total Private
Investment $10,179,757 $92,655,897 $102,829,679 $281,861,775 $268,299,049 $755,826,156
Total Project
Investment $14,989,569 $111,064,486 $140,152,366 $335,535,937 $314,086,243 $915,828,602
Leverage Ratio
One of the main goals of the Connecticut Green Bank is to attract and deploy private capital to
finance the green energy goals for Connecticut. To that end, the greater the leverage ratio of
private to public funds, the better. The leverage ratios for the Connecticut Green Bank are
increasing over time. Not only that, but a greater percentage of public funds being used are in the
form of loans and leases rather than subsidies and grants.

CONNECTICUT GREEN BANK
3. MEASURES OF SUCCESS – ATTRACT AND DEPLOY CAPITAL
105
Table 20. Leverage Ratio of Private to Public Funds by Sector
Leverage Ratio of Public to Private
Funds by Sector
FY
2012
FY
2013
FY
2014
FY
2015
FY
2016 Total
Commercial, Industrial & Institutional 24 0.0 3.7 1.8 4.5 2.0 2.9
Statutory and Infrastructure 3.1 6.1 4.3 6.4 10.9 6.6
Residential 0.0 0.8 10.5 6.3 5.6 6.2
Total 3.1 6.0 3.7 6.1 6.6 5.6
Clean Energy Produced and Energy Saved
The Connecticut Green Bank’s vision is to lead the green bank movement by accelerating private
investment in clean energy deployment for Connecticut to achieve economic prosperity, create
jobs, promote energy security, and address climate change. The Connecticut Green Bank tracks
its progress towards this vision as “E3” metrics – Energy, Economic, and Environmental. The
data below show the energy benefits in terms of capacity (megawatts [MW]), clean energy
production (lifetime megawatt hours [MWh]), and annual energy savings (MMBTU) – see Tables
21 through 23.
Table 21. Installed Capacity (MW) of Clean Energy (FY 2012-2016)
MW FY 2012 FY 2013 FY 2014 FY 2015 FY 2016 Total
Approved 0.0 0.0 3.2 3.8 3.5 10.5
Closed 0.0 0.0 0.3 10.6 38.8 49.7
Completed 2.9 23.5 22.6 51.1 32.1 132.1
Total 2.9 23.5 26.1 65.5 74.4 192.3
Table 22. Lifetime Production (MWh) of Clean Energy (FY 2012-2016)
MWh
(lifetime) FY 2012 FY 2013 FY 2014 FY 2015 FY 2016 Total
Approved 0 0 260,864 318,157 252,554 831,575
Closed 408 143 6,258 282,920 979,350 1,269,078
Completed 67,980 1,419,204 740,526 1,223,733 763,659 4,215,103
Total 68,388 1,419,346 1,007,648 1,824,810 1,995,564 6,315,757
Table 23. Annual Energy Savings (MMBtu) of Clean Energy (FY 2012-2016)
MMBTU
(annual) FY 2012 FY 2013 FY 2014 FY 2015 FY 2016 Total
Approved 0 0 143,872 438,296 134,684 716,851
Closed 56 19 1,905 464,980 176,220 643,181
Completed 9,278 59,462 233,100 183,267 108,315 593,421
Total 9,334 59,481 378,877 1,086,544 419,219 1,953,454
24 Leverage ratio does not reflect private funding warehouse created in fiscal year 2016. Green Bank C-PACE assets will be
transferred to this warehouse, shifting the leverage ratio towards private funding.
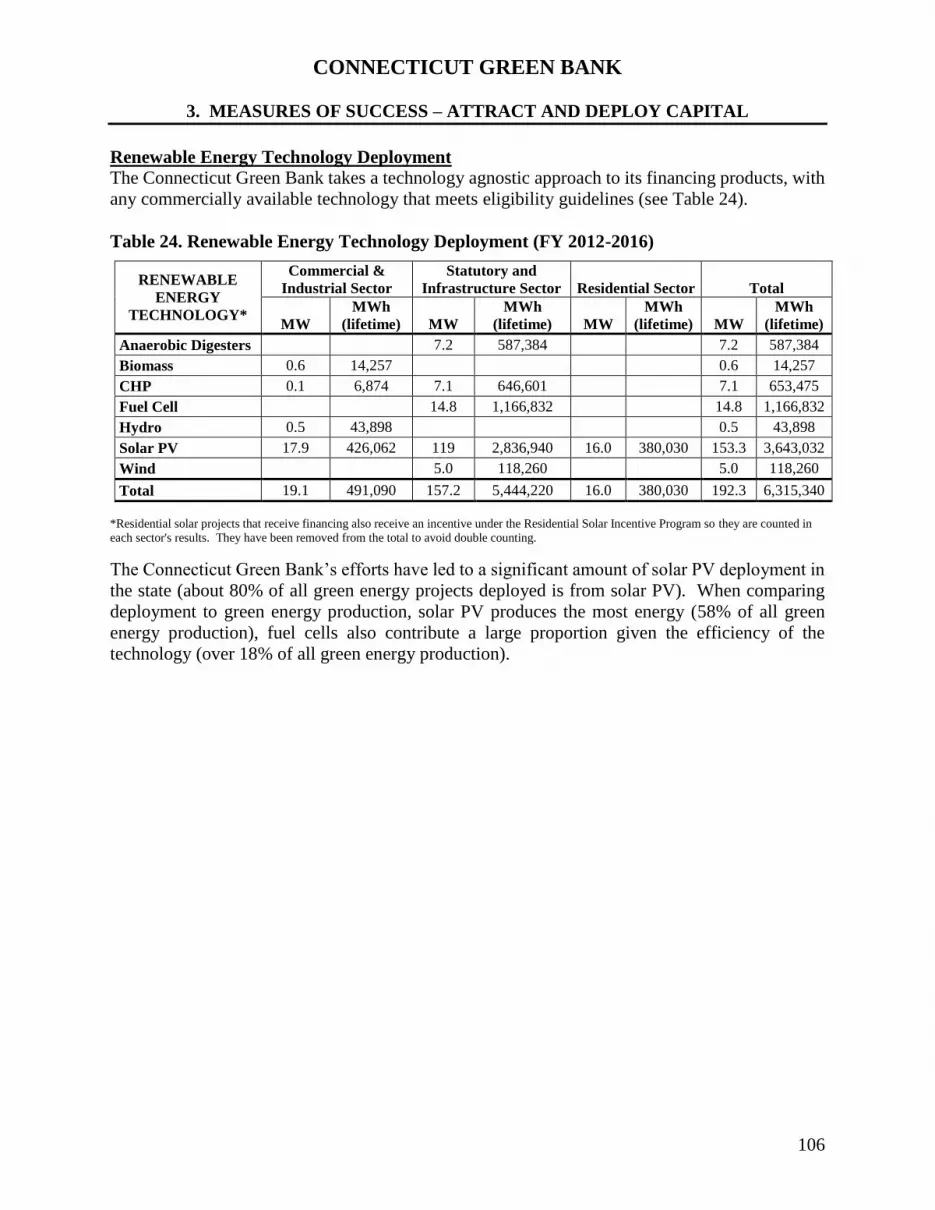
CONNECTICUT GREEN BANK
3. MEASURES OF SUCCESS – ATTRACT AND DEPLOY CAPITAL
106
Renewable Energy Technology Deployment
The Connecticut Green Bank takes a technology agnostic approach to its financing products, with
any commercially available technology that meets eligibility guidelines (see Table 24).
Table 24. Renewable Energy Technology Deployment (FY 2012-2016)
RENEWABLE
ENERGY
TECHNOLOGY*
Commercial &
Industrial Sector
Statutory and
Infrastructure Sector Residential Sector Total
MW
MWh
(lifetime) MW
MWh
(lifetime) MW
MWh
(lifetime) MW
MWh
(lifetime)
Anaerobic Digesters 7.2 587,384 7.2 587,384
Biomass 0.6 14,257 0.6 14,257
CHP 0.1 6,874 7.1 646,601 7.1 653,475
Fuel Cell 14.8 1,166,832 14.8 1,166,832
Hydro 0.5 43,898 0.5 43,898
Solar PV 17.9 426,062 119 2,836,940 16.0 380,030 153.3 3,643,032
Wind 5.0 118,260 5.0 118,260
Total 19.1 491,090 157.2 5,444,220 16.0 380,030 192.3 6,315,340
*Residential solar projects that receive financing also receive an incentive under the Residential Solar Incentive Program so they are counted in
each sector's results. They have been removed from the total to avoid double counting.
The Connecticut Green Bank’s efforts have led to a significant amount of solar PV deployment in
the state (about 80% of all green energy projects deployed is from solar PV). When comparing
deployment to green energy production, solar PV produces the most energy (58% of all green
energy production), fuel cells also contribute a large proportion given the efficiency of the
technology (over 18% of all green energy production).

CONNECTICUT GREEN BANK
3. MEASURES OF SUCCESS – GREEN BANK
107
Assets – Current and Non-Current
The Connecticut Green Bank’s success in shifting to a financing model from a subsidy model is
evident in the change in assets since its inception. The growth of the Green Bank’s financing
programs has led to a steady increase in non-current assets over time as more and more loans and
leases are closed.
Table 25: Current and Non-Current Assets (FY 2013-2016)
Ratio of Public Funds Invested
As the first Green Bank in the country, the Connecticut Green Bank seeks to use limited public
resources to attract private capital investment in clean energy. The Connecticut Green Bank does
this by moving away from the subsidy-based model of supporting clean energy and towards a
financing model. As highlighted below (see Table 26), the Connecticut Green Bank has quickly
moved towards this model, with fewer and fewer funds devoted to subsidies. This trend has
developed even as total investment in clean energy has increased to over $915 million in total from
2012 through 2016, enabling the Connecticut Green Bank to do more at a faster pace while
managing ratepayer resources more efficiently.
Year Ended June 30,
2016 2015 2014 2013 2012
Current Assets
Cash and Cash Equivalents 48,072,060$ 39,893,649$ 71,411,034$ 68,105,014$ 64,672,910$
Receivables 4,531,258 2,867,233 8,253,318 4,545,661 3,305,301
Prepaid Expenses 4,245,806 1,030,251 619,639 520,814 350,302
Contractor Loans 2,272,906 3,112,663 -- -- --
Current portion of solar lease notes 845,479 803,573 766,086 704,032 670,645
Current portion of program loans 884,739 10,264,825 652,447 -- --
Total Current Assets 60,852,247 57,972,194 81,702,524 73,875,521 68,999,158
Non-Current Assets
Portfolio Investments 1,000,000 1,000,000 1,000,000 1,000,000 2,155,525
Bonds Receivable 3,492,282 1,600,000 1,600,000 -- --
Solar Lease Notes - Less current portion 8,162,635 9,015,437 9,778,315 10,536,136 11,064,879
Program Loans - Less current portion 32,382,778 30,253,119 12,750,457 3,788,094 --
Renewable Energy Certificates 812,772 933,054 1,069,390 1,217,491 1,324,614
Capital Assets, Net of Depreciation and Amortization 57,863,787 26,971,087 3,074,337 362,505 91,329
Asset retirement obligation, net 2,261,472 1,029,196 -- -- --
Restricted Assets:
Cash and Cash Equivalents 9,749,983 8,799,005 9,513,715 9,536,656 8,540,684
Total Non-Current Assets 115,725,709 79,600,898 38,786,214 26,440,882 23,177,031
Total Assets 176,577,957$ 137,573,092$ 120,488,738$ 100,316,403$ 92,176,189$

CONNECTICUT GREEN BANK
3. MEASURES OF SUCCESS – GREEN BANK
108
Table 26. Ratio of Capital Invested as Subsidies, Credit Enhancements, and Loans and
Leases (FY 2012-2016)
GREEN BANK
FUNDS
INVESTED* FY 2012 FY 2013 FY 2014 FY 2015 FY 2016 Total
Subsidies
(Grants) $4,809,813 $12,419,798 $17,992,300 $27,816,544 $20,552,219 $83,590,674
% Green Bank
Funds Invested
in Subsidies
100% 67% 48% 50% 43% 51%
Credit
Enhancements
(LLR & IRBS)
$0 $187,122 $512,104 $2,024,733 $2,255,186 $4,979,145
% Green Bank
Funds Invested
in Credit
Enhancements
0% 1% 1% 4% 5% 3%
Loans and Leases
(includes sell
downs)
$0 $5,988,790 $19,330,387 $25,857,619 $25,234,975 $76,411,772
% Green Bank
Funds Invested
in Loans and
Leases
0% 32% 51% 46% 53% 46%
Total $4,809,813 $18,595,710 $37,834,791 $55,698,896 $48,042,380 $164,981,590
* Approved/Closed/Completed
Credit Quality of Residential Borrowers
The credit quality of Green Bank’s residential borrowers reflects the relatively high FICO scores
in the state; 78% of single family house households have a FICO of 680 or higher. The Green
Bank has recently begun to focus on ensuring that credit challenged customers have access to
energy financing products through such initiatives as its partnership with PosiGen and bringing
Capital 4 Change, which has experience serving this market, into the Smart-E program.
Table 27. Credit Quality of Residential Borrowers by product (FY 2012-2016)
Credit Score Ranges
Below
640
640-
679
680-
699
700-
719 720+ Unknown Total
Smart-E Loan 26 75 45 65 501 25 737
CT Solar Lease 1 45 39 78 1,029 1,192
CT Solar Loan - - 11 15 253 279
Total 27 120 95 158 1,783 25 2,208
1% 5% 4% 7% 82% 1%

CONNECTICUT GREEN BANK
3. MEASURES OF SUCCESS –PUBLIC BENEFITS
109
Jobs Created
The Connecticut Green Bank’s vision is to lead the green bank movement by accelerating private
investment in clean energy deployment for Connecticut to achieve economic prosperity, support
the creation of jobs, promote energy security, and address climate change. The Connecticut Green
Bank tracks its progress towards this vision as “E3” metrics – Energy, Economic, and
Environmental. The data below highlights the economic benefits of the Connecticut Green Bank’s
projects (see Tables 28 through 29). Investment represents the total amount of private and public
funding for clean energy projects and direct and indirect and induced jobs quantifies the resulting
job creation25.
Table 28. Direct Job-Years Supported (FY 2012-2016)
Direct Jobs FY 2012 FY 2013 FY 2014 FY 2015 FY 2016 Total
Approved 0 0 0 6 37 43
Closed 1 0 10 148 871 1,030
Completed 88 559 540 1,301 795 3,283
Total 88 559 550 1,455 1,703 4,355
Table 29. Indirect and Induced Job-Years Supported (FY 2012-2016)
Indirect &
Induced Jobs FY 2012 FY 2013 FY 2014 FY 2015 FY 2016 Total
Approved 0 0 0 9 61 70
Closed 1 0 16 237 1,400 1,655
Completed 142 1,131 868 2,093 1,279 5,514
Total 142 1,132 885 2,340 2,740 7,239
25 Jobs estimates are based on multipliers determined as a result of work performed by Navigant Consulting for the Connecticut
Renewable Energy and Energy Efficiency Economy Baseline Study completed in March 2009 and subsequently updated in 2010. This Navigant Study was an independent, third party analysis of Connecticut's clean energy economy. Data were acquired as a result of primary research. Navigant performed a census of over 300 companies, institutions, and organizations identified as active players in Connecticut's renewable energy and energy efficiency economy. Seventy-four (74) key renewable energy and energy efficiency companies were interviewed; 95 additional key companies were researched in detail. All renewable companies in Connecticut were identified and analyzed. Key energy efficiency companies were identified and analyzed, with the overall market size estimated by extrapolation. Company interviews included questions about customers, supply chain, number of jobs, corresponding salaries, and revenue. Detailed interview questionnaires are available in the Methodology section of the Baseline Study, pages 58-81. http://www.ctcleanenergy.com/Portals/0/Phase%201%20Deliverable%20Final%20Full.pdf DECD has approved of the methodology for estimating the economic development benefits (i.e., job-years created) from the investment in clean energy projects. http://ctcleanenergy.com/Portals/0/board-materials/4_DECD%20Findings_Economic%20Development%20Estimates_FY%202013%20Results_CEFIA_121613.pdf

CONNECTICUT GREEN BANK
3. MEASURES OF SUCCESS –PUBLIC BENEFITS
110
CO2 Emission Reductions Supported and Equivalencies
The data below highlight the environmental benefits of these projects as a reduction in carbon
(CO2) emissions and standard equivalencies26 (see Tables 30 through 33).
Table 30. Lifetime CO2 Emissions Reductions (FY 2012-2016)
Lifetime CO2
Emission
Reductions
(Tons) FY 2012 FY 2013 FY 2014 FY 2015 FY 2016 Total
Approved 0 0 86 462 14,769 15,317
Closed 211 74 3,240 173,149 473,491 650,166
Completed 35,248 178,363 267,853 641,990 396,843 1,520,297
Total 35,459 178,437 271,179 815,600 885,103 2,185,779
26 All emissions reductions from renewable energy projects are determined using ISO-New England information, because that is
where the energy will be displaced. This produces results that may be significantly different from emissions savings based on a comparison to national averages. In addition, the generation characteristics of each technology have an impact on the emissions reduction that can be expected. Solar-powered systems will produce only during the daylight hours, which normally coincide with the peak demand period for the utilities. The generating fleet during this time may include peaking plants and reserve plants, which will have lower efficiencies than the “baseload” plants which run 24 hours per day. Consequently, emissions are higher, and the renewable energy systems look better by comparison. The calculations are based on the results of the 2007 New England Marginal Emission Rate Analysis (http://www.iso-ne.com/genrtion_resrcs/reports/emission/2007_mea_report.pdf). The appropriate marginal emissions rates for Connecticut are used to determine the net avoided emissions for each of the technologies evaluated. a. PV systems are analyzed using the average of the Marginal Emission Rates (in Lbs/MWh) for “On-Peak Ozone Season” and
“On-Peak Non-Ozone Season”. The underlying assumptions are that PV systems will be operating primarily during the on-peak periods, and that their output in the five months of the “Ozone Season” (May – September) is about the same as in the seven months of the “Non-Ozone Season.”
b. Fuel cells are also evaluated using the “Annual Average (all hours) Marginal Emission Rates”, because they are expected to produce power continually as “base load” generators. Fuel Cell emissions assume that 50% of the thermal output (“waste heat”) is used to displace natural gas used for heating. This is conservative, since 50% thermal utilization is the minimum standard for CCEF’s acceptance of a fuel cell project.
Emissions estimates for anaerobic digester, wind, and energy efficiency projects were not estimated. To determine the exact avoided CO2 for CHP projects one needs to know what the CHP system is displacing (i.e. boiler, grid, etc.), as well as the efficiencies, in order to determine the existing CO2 emissions and then do the calculation to get the avoided emissions. For general purposes a typical 3.7 MW system operating on natural gas would generate about 13,000 tons of CO2 annually and 195,000 tons over its 15-year life. Typically avoiding 35-50% CO2 overall from the existing infrastructure. Not factoring in the utility transmission and distribution losses. It should be noted that a methodology for estimating the environmental protection benefits from the investment in clean energy projects (i.e., GHG emissions reduced) has not yet been proposed to or approved by DEEP. The Connecticut Green Bank is currently looking into the EPA’s AVERT (Avoided Emissions and Generation Tool) for future estimations of emissions reductions - http://www3.epa.gov/avert/

CONNECTICUT GREEN BANK
3. MEASURES OF SUCCESS – PUBLIC BENEFITS
111
Table 31. Lifetime CO2 Emissions Reduction Energy for Home Equivalents (FY 2012-
2016)
Energy for #
of Homes FY 2012 FY 2013 FY 2014 FY 2015 FY 2016 Total
Approved 0 0 2,070 2,522 1,930 6,522
Closed 2 1 30 1,723 4,925 6,680
Completed 324 15,292 4,399 5,871 3,636 29,522
Total 326 15,293 6,499 10,116 10,491 42,724
Table 32. Lifetime CO2 Emissions Reduction Cars Off the Road Equivalents (FY 2012-
2016)
Cars off the
Road FY 2012 FY 2013 FY 2014 FY 2015 FY 2016 Total
Approved 0 0 1 3 81 85
Closed 1 0 22 1,251 3,098 4,372
Completed 235 1,966 1,608 4,178 2,637 10,624
Total 236 1,967 1,630 5,432 5,816 15,080
Table 33. Lifetime CO2 Emissions Reduction Acres of Trees Planted Equivalents (FY 2012-
2016)
Planting #
Acres of
Trees FY 2012 FY 2013 FY 2014 FY 2015 FY 2016 Total
Approved 0 0 1 6 162 169
Closed 3 1 43 2,504 6,202 8,753
Completed 470 3,936 3,219 8,365 5,279 21,269
Total 473 3,937 3,263 10,875 11,643 30,191

CONNECTICUT GREEN BANK
4. MARKET TRANSFORMATION – PROGRAM LOGIC MODEL
112
The Connecticut Green Bank has published an Evaluation Framework27 and developed a Program
Logic Model (PLM) that presents the green bank model of attracting and deploying private capital
through financing (see Figure 1). This PLM serves as a foundation for evaluating clean energy
deployment through subsidy and financing programs of the Connecticut Green Bank.
Figure 1. Connecticut Green Bank Program Logic Model – Including Subsidies and
Financing
This figure is a generalized market transformation and impact logic model that can be adapted to
apply to a specific program of a green bank, as its market transformation strategies and associated
evaluation frameworks are developed. An example of the green bank model and the financing
market transformation process is the CT Solar Loan.28
As the Green Bank’s capital availability expands to support further clean energy deployment, one
can anticipate that there will be increased coordination between the Green Bank’s programs and
those administered by the utilities. It is thus important to include the various other key participants
in this overall logic model, in order to be able to identify the variety of interactions that can occur
between them, that over the short, medium, and long term can lead to the transformation of the
funding of clean energy projects. In addition, it is important to identify known interventions in the
clean energy environment which can influence the ways in which the Green Bank’s financing
efforts might play out over time.
27 Evaluation Framework – Assessing, Monitoring, and Reporting of Program Impacts and Processes by Opinion Dynamics and
Dunsky Energy Consulting for the Connecticut Green Bank (July 2016) 28 Comprehensive Annual Financial Report for FY 2015 – Market Transformation: Financial Warehouse and Credit Enhancement
Structures Case of the CT Solar Loan (pp. 133-136)

CONNECTICUT GREEN BANK
4. MARKET TRANSFORMATION – PROGRAM LOGIC MODEL
113
The PLM includes three (3) components – Energize CT Market Environment (including Other
Ongoing Market Activities), Green Bank Financing Market Transformation Process, and Societal
Impacts.
Energize CT Market Environment
Energize CT is an initiative of the Green Bank, the Connecticut Energy Efficiency Fund, the State,
and the local electric and gas utilities. It provides Connecticut consumers, businesses and
communities the resources and information they need to make it easy to save energy and build a
clean energy future for everyone in the state. Under this umbrella, the electric and gas investor
owned utilities (IOUs) provide information, marketing, and deliver the energy efficiency programs
that have been approved by the State and supported by the Connecticut Energy Efficiency Fund.
Operating under a statutory mandate that all cost-effective energy efficiency be acquired, with
guidance from the Connecticut Energy Efficiency Board and its consultants, the utilities offer a
variety of programs and encouragements for residential, commercial, and industrial customers to
make decisions to participate in these cost-reducing opportunities. A range of methods are used to
incent customers to participate in the programs, among them targeted information, low cost/no
cost measures, financial incentives, discounted retail products, and product and project financing.
The Connecticut Green Bank, with a statutorily established residential solar PV target of 300MW
by 2022, also markets and delivers its clean energy programs to residential customers. It too relies
on information, marketing, direct incentives, and financing opportunities. 29
Of the Green Bank programs, currently only participants in the Residential Solar Investment
Program (RSIP) are required to receive a home energy assessment (i.e., supported by the utility
efficiency programs), BPI audit, or equivalent. The program participants in the RSIP, with their
individual energy saving projects, may thus receive rebates or incentives from the utilities (which
are intended to overcome barriers to customer participation and to encourage increased selection
of energy efficient measures), the Green Bank, or other levels of government (e.g., state incentives
and Federal tax credits for solar PV and other technologies) as well as opportunities to finance
some or all of the remaining portion of their clean energy project. In the context of a PLM, one
can anticipate similar links between the Green Bank programs and those of the investor owned
utilities (IOU’s).
An impetus for coordination between the utility administered energy efficiency programs and the
Green Bank programs is threefold: 1) more energy savings, and resulting emissions reductions,
could potentially be acquired more economically both to the programs and to the project
participants, 2) delivery efficiencies and greater savings could be found in coordinating financing
that each entity offers to common customer segments within the sphere of program activities that
they offer, and 3) coordination through a Joint Committee of the Energy Efficiency Board and the
Connecticut Green Bank is required by statute.30 It is important to note that there are a number
29 Per Public Act 15-194 “An Act Concerning the Encouragement of Local Economic Development and Access to Residential
Renewable Energy,” the Connecticut Green Bank administers a rebate and performance-based incentive program to support solar PV.
30 Pursuant to Section 15-245m(d)(2) of Connecticut General Statutes, the Joint Committee shall examine opportunities to coordinate the programs and activities contained in the plan developed under Section 16-245n(c) of the General Statutes [Comprehensive Plan of the Connecticut Green Bank] with the programs and activities contained in the plan developed under section 16-245m(d)(1) of the General Statutes [Energy Conservation and Load Management Plan] and to provide financing to

CONNECTICUT GREEN BANK
4. MARKET TRANSFORMATION – PROGRAM LOGIC MODEL
114
of other ongoing market activities that are occurring through Energize CT or outside of the Green
Bank’s market transformation process. From introducing new products, reducing purchasing
barriers, education and awareness programs to workforce development, and improving building
practices – there are a variety of activities that help move the market towards more clean energy
deployment.
Finance Market Transformation Process
The efforts of the Green Bank are exemplified through the financing market transformation
process, which focuses on accelerating the deployment of clean energy – more customers and
“deeper” more comprehensive measures being undertaken – by securing increasingly affordable
and attractive private capital. The Green Bank can enter the process at a number of points (i.e.,
from numbers 2 through 4 in the above PLM figure), such as supplying capital through financing
offers, marketing clean energy financing, or offsetting clean energy financing risk by backstopping
loans, or sharing loan performance data.
Here is a breakdown of each component of the financing market transformation process of the
Green Bank:
Supply of Capital – financing programs aim to increase the supply of affordable and
attractive capital available to support energy savings and clean energy production in the
market place. This is done at the Green Bank by:
a. Providing financing (loans or leases) to customers using Green Bank capital; and/or
b. Establishing structures, programs, and public-private partnerships that connect
third-party capital to support energy savings projects.
Beyond ensuring that financing is available for clean energy projects, the benefits of the Green
Bank’s Supply of Capital interventions can lead to, but are not limited to:
a. Reduced interest rates, which lower the cost of capital for clean energy projects;
b. More loan term options to better match savings cash flows (e.g., longer terms for
longer payback projects, early repayment, or deferred first year payments);
c. Less restrictive underwriting criteria to increase eligibility for and expand access to
financing; and
d. Increased marketing by lenders to leverage clean energy investment opportunities.
Each of these features is intended to increase uptake of clean energy projects, leading to increased
energy savings, clean energy production, and other positive societal impacts. The long-term goal
of the Green Bank’s efforts is to achieve these attractive features in the market with a reduced need
for Green Bank intervention, through the provision of performance data that convinces private
capital providers to offer such features on their own.
increase the benefits of programs funded by the plan developed under section 16-245m(d)(1) of the General Statutes so as to reduce the long-term cost, environmental impacts, and security risks of energy in the state.

CONNECTICUT GREEN BANK
4. MARKET TRANSFORMATION – PROGRAM LOGIC MODEL
115
Consumer Demand – in combination with a comprehensive set of clean energy programs
under the Energize CT initiative, the Green Bank drives demand for clean energy by
marketing financing programs and increasing awareness of the potential benefits stemming
from clean energy projects. Green Bank programs that deliver rebates and incentives – or
connect with customers to support energy savings projects that are eligible for rebates and
incentives – can further help to drive demand for natural gas conversions (e.g., Energize
Norwich in partnership with Norwich Public Utilities)31 as well as reduce the installed costs
of and drive demand for solar PV projects (e.g., Solarize Connecticut). It should also be
noted that through channel marketing strategies (e.g., contractor channels to the customer)
success will be determined by an increase in demand for financing. The results of the
increased demand are expected to, but are not limited to:
a. Increase the number of clean energy projects; and
b. Increase the average savings and/or clean energy production per project.
Increasing affordable and attractive financing offerings in the marketplace is an important
component of unlocking consumer demand and driving greater energy savings and clean
energy production, and is central to the Green Bank’s market transformation efforts.
Financing Performance Data – Green Bank gathers and communicates the performance
of clean energy financing either through its own programs or for other financing options in
the market place. This increases access to valuable information that can help lenders and
customers identify promising clean energy investments. Enabling access to this
information (i.e., data transparency) is important to encouraging market competition.
Ultimately, data on financing performance is expected to play a central part in attracting
more private capital investment to offer affordable and attractive financing offerings on
their own. As the Green Bank increases the access to affordable and attractive capital, and
more customers use financing for their clean energy projects, data demonstrating strong
and reliable performance of these projects may indicate lower and more predictable risk.
Financing Risk Profile – Green Bank can help reduce clean energy financing risk profiles
in a number of ways. For example, it can absorb a portion or all of the credit risk by
providing loan loss reserve (LLR) funds and guarantees or taking the first-loss position on
investments (i.e., subordinated debt). It can also channel or attract rebates and incentives
to finance energy saving projects thus improving their economic performance and lowering
the associated performance risk. In the long run, by making clean energy financing
performance data available to the market, Green Bank programs increase lenders’ and
borrowers’ understanding of clean energy investment risk profiles, which may allow them
to (1) design more affordable and attractive financing products and (2) select projects for
financing to reduce risks.
This element of the PLM plays the key linking role in the Market Transformation feedback
loop, leading to longer term impacts, as the market (1) recognizes the potentially
advantageous risk/return profile associated with clean energy investments and (2) takes
31 Section 52 of Public Act 13-298

CONNECTICUT GREEN BANK
4. MARKET TRANSFORMATION – PROGRAM LOGIC MODEL
116
further steps to increase the supply of affordable and attractive capital with less Green Bank
credit enhancement needed to support demand for clean energy investments.
Ensuring that financing performance and risk profile data are available to the market is
important from various perspectives. For a deeper examination and presentation, please
see the report by the State Energy Efficiency Action Network.32
Societal Impact
The efforts to accelerate and scale-up investment in clean energy deployment by the Green Bank,
lead to a myriad of societal impacts and benefits.
All of the PLM elements ultimately aim to contribute to Green Bank program impacts and benefits.
These include the direct impacts resulting from more clean energy investments supported by Green
Bank financing that result in an increase in energy savings and improvement of public health (e.g.,
asbestos remediation, lead abatement, etc.) to the customer,33 increase in the creation of local in-
state jobs,34 and the reduction of greenhouse gas emissions35 for society. The impacts may also
include consideration of secondary or indirect benefits such as GDP growth and energy savings
supported by lenders who have leveraged Green Bank data or marketing efforts. Figure 2 below
represents the transition over time of the Green Bank’s clean energy impacts and associated
creation of societal benefits.
32 State and Local Energy Efficiency Action Network. (2014). Energy Efficiency Finance Programs: Use Case Analysis to Define
Data Needs and Guidelines. Prepared by: Peter Thompson, Peter Larsen, Chris Kramer, and Charles Goldman of Lawrence Berkeley National Laboratory. click here
33 Green Bank will be working with the Connecticut Department of Energy and Environmental Protection and the U.S. Environmental Protection Agency to develop and approve a methodology for estimating public health benefits from the reduction of criteria pollutants as a result of the production of clean energy and reduction of energy consumption through the use of the Co-Benefits Risk Assessment (COBRA) model – https://www.epa.gov/statelocalclimate/co-benefits-risk-assessment-cobra-screening-model
34 Green Bank is working with the Connecticut Department of Economic and Community Development and Navigant Consulting to update and approve a methodology for estimating economic development benefits from the investment in clean energy projects.
35 Green Bank is working with the Connecticut Department of Energy and Environmental Protection to develop and approve a methodology for estimating greenhouse gas emission reduction benefits from the production of clean energy and reduction of energy consumption through the use of the AVoided Emissions and geneRation Tool (AVERT) - https://www.epa.gov/statelocalclimate/avoided-emissions-and-generation-tool-avert

CONNECTICUT GREEN BANK
4. MARKET TRANSFORMATION – PROGRAM LOGIC MODEL
117
Figure 2. Societal Benefits – Environmental Protection and Economic Development – from
Greater Private Capital Investment
As the Green Bank continues to attract more private investment in Connecticut’s clean energy
economy through the issuance of green bonds, the deployment of clean energy will be accelerated.
The more clean energy that is being deployed, the greater the societal benefits will be.

CONNECTICUT GREEN BANK
4. MARKET TRANSFORMATION – COST EFFECTIVENESS OF SUBSIDIES
CASE OF THE RESIDENTIAL SOLAR INVESTMENT PROGRAM
118
The Connecticut Green Bank contracted with Cadmus Group, Inc., to conduct a cost-effectiveness
analysis of its Residential Solar Investment Program (RSIP).36 As the Connecticut Green Bank’s
only subsidy program, we are applying the Program Logic Model that focuses on rebates and
incentives as the financial driver for customer action rather than financing (see Figure 3).
Figure 3. Program Logic Model for the Residential Solar Investment Program
RSIP Growth and Cost Trends
To provide perspective on program growth, cost and incentive trends, Table 34 illustrates the
increase in RSIP project volume while installed costs and incentives have decreased from fiscal
years 2012 through 2016, grouped by non-Solarize projects, Solarize37 projects and RSIP in total.
Table 34. RSIP Volume, Capacity and Cost Data by Fiscal Year38
Non-Solarize Solarize RSIP Total
Fiscal
Year # P
roje
cts
Inst
all
ed
Ca
pa
city
(kW
)
Inst
all
ed
Co
st
($/W
)
Ince
nti
ve
($/W
)
# P
roje
cts
Inst
all
ed
Ca
pa
city
(kW
)
Inst
all
ed
Co
st
($/W
)
Ince
nti
ve
($/W
)
# P
roje
cts
Inst
all
ed
Ca
pa
city
(kW
)
Inst
all
ed
Co
st
($/W
)
Ince
nti
ve
($/W
)
2012 290 1,956 $5.11 $1.75 290 1,956 $5.11 $1.75
2013 788 5,481 $4.65 $1.54 327 2,444 $3.84 $1.45 1,115 7,924 $4.32 $1.51
2014 1,677 12,116 $4.27 $1.18 715 5,070 $3.80 $1.15 2,392 17,186 $4.07 $1.17
2015 5,631 42,275 $3.91 $0.67 940 7,864 $3.88 $0.74 6,571 50,139 $3.90 $0.68
2016 7,598 59,088 $3.42 $0.35 103 916 $3.84 $0.43 7,701 60,004 $3.43 $0.35
Total 15,984 120,917 $3.76 $0.62 2,085 16,294 $3.85 $0.96 18,069 137,211 $3.78 $0.66
Tables 35 and 36 provide program growth and cost trend data by installer for fiscal years 2016 and
for 2012-2016 combined, grouped by non-Solarize and Solarize projects, and RSIP in total. Data
points provided include # Projects, Installed Capacity (kW), Installed Cost ($/W), and Incentive
($/W). Installed costs vary widely and depend on many factors including equipment/panel quality
36 Per Section 106 of Public Act 11-80 (and revised through Public Act 15-194), the Connecticut Green Bank administers the
Residential Solar Investment Program. 37 Solarize is a community-based marketing program (visit www.solarizect.com for more information) 38 Based on RSIP Market Watch data as of June 30, 2016, end of FY 2015. Cost data includes all reported installed costs without including those projects where financing costs for some third party ownership installers are included as part of the total system cost. Installed capacity data is provided in kW-STC.

CONNECTICUT GREEN BANK
4. MARKET TRANSFORMATION – COST EFFECTIVENESS OF SUBSIDIES
CASE OF THE RESIDENTIAL SOLAR INVESTMENT PROGRAM
119
and efficiency, type of installation (e.g., roof-mount, ground-mount, pole-mount), project location,
site and installation characteristics and other factors.
Table 35. RSIP FY 2016 Volume, Capacity and Cost Data by Installer39
Non-Solarize Solarize RSIP Total
Installer # P
roje
cts
Inst
all
ed
Ca
pa
city
(k
W)
Inst
all
ed C
ost
($/W
)
Ince
nti
ve
($/W
)
# P
roje
cts
Inst
all
ed
Ca
pa
city
(k
W)
Inst
all
ed C
ost
($/W
)
Ince
nti
ve
($/W
)
# P
roje
cts
Inst
all
ed
Ca
pa
city
(k
W)
Inst
all
ed C
ost
($/W
)
Ince
nti
ve
($/W
)
31Solar 1 11 $3.44 $0.49 - - $0.00 $0.00 1 11 $3.44 $0.49
Aegis Electrical Systems, LLC 90 803 $3.92 $0.43 - - $0.00 $0.00 90 803 $3.92 $0.43
All Electric Const. & Comm. LLC 1 15 $3.51 $0.45 - - $0.00 $0.00 1 15 $3.51 $0.45
AllGreenIT, Inc. 19 182 $3.46 $0.46 2 14 $3.54 $0.49 21 197 $3.47 $0.46
Apex Solar Energy 2 24 $2.76 $0.45 - - $0.00 $0.00 2 24 $2.76 $0.45
BeFree Green Energy, LLC 51 471 $3.78 $0.43 15 130 $3.84 $0.48 66 601 $3.79 $0.44
Bonner Electric 2 18 $3.85 $0.42 - - $0.00 $0.00 2 18 $3.85 $0.42
Boston Solar 13 120 $3.51 $0.43 - - $0.00 $0.00 13 120 $3.51 $0.43
Consulting Engineering Services, Inc. 1 13 $3.55 $0.46 1 9 $4.12 $0.12 2 22 $3.78 $0.32
CT Solar Power, LLC 2 17 $3.71 $0.48 - - $0.00 $0.00 2 17 $3.71 $0.48
C-TEC Solar LLC 164 1,468 $3.76 $0.43 5 44 $3.78 $0.45 169 1,512 $3.76 $0.43
Direct Energy Solar 175 1,552 $3.56 $0.39 - - $0.00 $0.00 175 1,552 $3.56 $0.39
Dow Solar 3 16 $7.84 $0.34 - - $0.00 $0.00 3 16 $7.84 $0.34
Duck Feet Solar - - $0.00 $0.00 1 11 $3.71 $0.47 1 11 $3.71 $0.47
Earthlight Technologies 111 997 $4.03 $0.46 1 13 $4.25 $0.58 112 1,010 $4.03 $0.46
Eastern CT Solar 5 45 $3.37 $0.46 - - $0.00 $0.00 5 45 $3.37 $0.46
EcoSolar Installations, LLC 2 8 $4.07 $0.47 - - $0.00 $0.00 2 8 $4.07 $0.47
Emmett O'Brien Technical High
School 1 5 $2.14 $0.47 - - $0.00 $0.00 1 5 $2.14 $0.47
Encon, Inc. 15 144 $4.68 $0.43 23 156 $3.91 $0.42 38 300 $4.28 $0.43
Evergreen Energy, LLC 3 25 $3.47 $0.48 - - $0.00 $0.00 3 25 $3.47 $0.48
Florenton River LLC 1 13 $4.25 $0.47 - - $0.00 $0.00 1 13 $4.25 $0.47
Green Earth Energy 14 132 $3.75 $0.38 - - $0.00 $0.00 14 132 $3.75 $0.38
JD Solar Solutions, LLC 36 291 $3.46 $0.47 - - $0.00 $0.00 36 291 $3.46 $0.47
Litchfield Hills Solar, LLC 11 114 $4.26 $0.45 - - $0.00 $0.00 11 114 $4.26 $0.45
Modern Solar Company 1 14 $5.33 $0.46 - - $0.00 $0.00 1 14 $5.33 $0.46
New England Clean Energy 1 7 $5.87 $0.50 - - $0.00 $0.00 1 7 $5.87 $0.50
Northeast Energy Design Solutions 1 9 $3.25 $0.49 1 8 $4.37 $0.49 2 17 $3.77 $0.49
Northeast Smart Energy LLC - - $0.00 $0.00 1 13 $3.75 $0.47 1 13 $3.75 $0.47
One Roof Energy / Direct Energy
Solar 41 276 $3.77 $0.29 - - $0.00 $0.00 41 276 $3.77 $0.29
One Source Solar, LLC 2 15 $4.00 $0.48 - - $0.00 $0.00 2 15 $4.00 $0.48
OneRoof Energy, Inc. 97 734 $4.36 $0.30 - - $0.00 $0.00 97 734 $4.36 $0.30
PosiGen 334 2,205 $4.48 $0.42 - - $0.00 $0.00 334 2,205 $4.48 $0.42
PurePoint Energy, LLC 30 247 $4.74 $0.47 1 21 $5.99 $0.44 31 268 $4.84 $0.47
R. Pelton Builders 8 94 $3.41 $0.45 - - $0.00 $0.00 8 94 $3.41 $0.45
Real Goods Solar, Inc 20 159 $4.14 $0.36 - - $0.00 $0.00 20 159 $4.14 $0.36
Roof Diagnostics Solar and Electric of
CT 457 3,019 $3.20 $0.37 - - $0.00 $0.00 457 3,019 $3.20 $0.37
Ross Solar Group 124 1,300 $3.92 $0.44 30 306 $3.67 $0.42 154 1,606 $3.87 $0.44
Shippee Solar and Construction LLC 5 45 $3.98 $0.44 - - $0.00 $0.00 5 45 $3.98 $0.44
39 Based on RSIP Market Watch data as of June 30, 2016. Cost data includes all reported installed costs without including those projects where financing costs for some third party ownership installers are included as part of the total system cost. Installed capacity data is provided in kW-STC.

CONNECTICUT GREEN BANK
4. MARKET TRANSFORMATION – COST EFFECTIVENESS OF SUBSIDIES
CASE OF THE RESIDENTIAL SOLAR INVESTMENT PROGRAM
120
Non-Solarize Solarize RSIP Total
Installer # P
roje
cts
Inst
all
ed
Ca
pa
city
(k
W)
Inst
all
ed C
ost
($/W
)
Ince
nti
ve
($/W
)
# P
roje
cts
Inst
all
ed
Ca
pa
city
(k
W)
Inst
all
ed C
ost
($/W
)
Ince
nti
ve
($/W
)
# P
roje
cts
Inst
all
ed
Ca
pa
city
(k
W)
Inst
all
ed C
ost
($/W
)
Ince
nti
ve
($/W
)
Sicuranza Electric 1 10 $4.53 $0.38 - - $0.00 $0.00 1 10 $4.53 $0.38
Skyline Solar 8 56 $4.09 $0.40 - - $0.00 $0.00 8 56 $4.09 $0.40
SolarCity 3,023 22,462 $5.21 $0.33 - - $0.00 $0.00 3,023 22,462 $5.21 $0.33
SON Energy Systems, LLC 1 9 $3.00 $0.49 - - $0.00 $0.00 1 9 $3.00 $0.49
Sound Solar Systems, LLC 1 6 $5.52 $0.49 - - $0.00 $0.00 1 6 $5.52 $0.49
Summer Hill Solar 8 74 $2.92 $0.44 - - $0.00 $0.00 8 74 $2.92 $0.44
SunEdison 96 603 $2.74 $0.33 - - $0.00 $0.00 96 603 $2.74 $0.33
Sungevity, Inc. 365 2,871 $3.67 $0.36 - - $0.00 $0.00 365 2,871 $3.67 $0.36
Sunlight Solar Energy, Inc. 43 386 $3.61 $0.43 11 83 $3.77 $0.43 54 469 $3.64 $0.43
Sunrun Inc 777 6,039 $2.31 $0.30 - - $0.00 $0.00 777 6,039 $2.31 $0.30
Sun-Wind Solutions, LLC 2 16 $3.59 $0.48 - - $0.00 $0.00 2 16 $3.59 $0.48
The Roofing Store, LLC 1 7 $5.50 $0.47 - - $0.00 $0.00 1 7 $5.50 $0.47
Trinity Solar 1,410 11,817 $3.44 $0.34 10 97 $3.83 $0.36 1,420 11,914 $3.45 $0.34
Tuscany Design Build, Inc. 1 20 $3.84 $0.44 1 11 $4.22 $0.31 2 30 $3.98 $0.39
Vivint Solar Developer, LLC 13 85 $4.97 $0.29 - - $0.00 $0.00 13 85 $4.97 $0.29
Waldo Renewable Electric, LLC 3 17 $3.98 $0.52 - - $0.00 $0.00 3 17 $3.98 $0.52
White Oak Development, LLC 1 5 $4.30 $0.46 - - $0.00 $0.00 1 5 $4.30 $0.46
Total 7,598 59,088 $4.10 $0.35 103 916 $3.84 $0.43 7,701 60,004 $4.10 $0.35

CONNECTICUT GREEN BANK
4. MARKET TRANSFORMATION – COST EFFECTIVENESS OF SUBSIDIES
CASE OF THE RESIDENTIAL SOLAR INVESTMENT PROGRAM
121
Table 36. RSIP FY 2012-2016 Volume, Capacity and Cost Data by Installer40
Non-Solarize Solarize RSIP Total
Installer # P
roje
cts
Inst
all
ed
Ca
pa
city
(k
W)
Inst
all
ed C
ost
($/W
)
Ince
nti
ve
($/W
)
# P
roje
cts
Inst
all
ed
Ca
pa
city
(k
W)
Inst
all
ed C
ost
($/W
)
Ince
nti
ve
($/W
)
# P
roje
cts
Inst
all
ed
Ca
pa
city
(k
W)
Inst
all
ed C
ost
($/W
)
Ince
nti
ve
($/W
)
31Solar 19 154 $3.88 $1.02 - - $0.00 $0.00 19 154 $3.88 $1.02
A Better Way Solar 1 10 $3.37 $0.59 - - $0.00 $0.00 1 10 $3.37 $0.59
Aegis Electrical Systems, LLC 381 3,066 $4.18 $0.77 - - $0.00 $0.00 381 3,066 $4.18 $0.77
All Electric Const. & Comm.
LLC 3 33 $3.61 $0.65 - - $0.00 $0.00 3 33 $3.61 $0.65
AllGreenIT, Inc. 75 629 $3.68 $0.83 116 939 $3.53 $0.91 191 1,568 $3.59 $0.88
Alteris, Inc. 1 5 $3.00 $1.05 - - $0.00 $0.00 1 5 $3.00 $1.05
American Solar Partners 3 16 $3.55 $1.73 - - $0.00 $0.00 3 16 $3.55 $1.73
Apex Solar Energy 5 39 $3.04 $0.61 - - $0.00 $0.00 5 39 $3.04 $0.61
Astrum Solar 27 238 $4.32 $1.84 2 21 $4.21 $1.85 29 258 $4.31 $1.84
Atlantic Solar 1 6 $4.41 $1.11 - - $0.00 $0.00 1 6 $4.41 $1.11
BeFree Green Energy, LLC 129 1,156 $4.02 $0.75 363 3,181 $3.74 $0.98 492 4,337 $3.82 $0.92
Bella Casa Verde 2 15 $4.35 $1.13 - - $0.00 $0.00 2 15 $4.35 $1.13
Bonner Electric 14 123 $3.95 $0.88 - - $0.00 $0.00 14 123 $3.95 $0.88
Boston Solar 25 225 $3.59 $0.45 - - $0.00 $0.00 25 225 $3.59 $0.45
Bright Side Solar, LLC 1 4 $5.07 $1.93 - - $0.00 $0.00 1 4 $5.07 $1.93
Burrington Solar Edge 1 6 $3.88 $0.72 - - $0.00 $0.00 1 6 $3.88 $0.72
CatchinRays 2 LLC 30 235 $4.04 $0.76 - - $0.00 $0.00 30 235 $4.04 $0.76
Centurion Solar 16 110 $4.05 $0.83 31 193 $3.98 $1.18 47 303 $4.01 $1.05
Chabot Electric 2 16 $3.14 $0.90 - - $0.00 $0.00 2 16 $3.14 $0.90
Connecticut Solar Electric,
LLC 2 14 $3.71 $1.24 - - $0.00 $0.00 2 14 $3.71 $1.24
Consulting Engineering
Services, Inc. 4 33 $3.43 $0.72 1 9 $4.12 $0.12 5 42 $3.58 $0.59
CS Energy Systems, Inc. 2 26 $3.75 $0.73 - - $0.00 $0.00 2 26 $3.75 $0.73
CT Electrical, LLC 14 94 $5.39 $1.24 - - $0.00 $0.00 14 94 $5.39 $1.24
CT Solar Power, LLC 19 165 $4.18 $0.90 - - $0.00 $0.00 19 165 $4.18 $0.90
C-TEC Solar LLC 371 3,032 $3.99 $0.70 421 2,952 $3.99 $0.90 792 5,984 $3.99 $0.80
DCS 34 185 $4.09 $1.54 1 7 $3.50 $0.61 35 192 $4.07 $1.50
Deak Electric, Inc. 2 16 $5.20 $1.02 - - $0.00 $0.00 2 16 $5.20 $1.02
Direct Energy Solar 434 3,733 $3.73 $0.61 199 1,608 $3.54 $1.08 633 5,341 $3.68 $0.75
Dow Solar 6 29 $7.99 $0.62 - - $0.00 $0.00 6 29 $7.99 $0.62
Duck Feet Solar - - $0.00 $0.00 1 11 $3.71 $0.47 1 11 $3.71 $0.47
Earthlight Technologies 178 1,594 $4.08 $0.56 55 450 $4.00 $0.85 233 2,044 $4.06 $0.63
Eastern CT Solar 7 66 $3.39 $0.52 - - $0.00 $0.00 7 66 $3.39 $0.52
EcoSolar Installations, LLC 15 84 $4.51 $1.18 - - $0.00 $0.00 15 84 $4.51 $1.18
Elektron Solar, LLC 8 64 $4.75 $1.39 - - $0.00 $0.00 8 64 $4.75 $1.39
40 Based on RSIP Market Watch data as of June 30, 2016. Cost data includes all reported installed costs without including those projects where financing costs for some third party ownership installers are included as part of the total system cost. Installed capacity data is provided in kW-STC.

CONNECTICUT GREEN BANK
4. MARKET TRANSFORMATION – COST EFFECTIVENESS OF SUBSIDIES
CASE OF THE RESIDENTIAL SOLAR INVESTMENT PROGRAM
122
Non-Solarize Solarize RSIP Total
Installer # P
roje
cts
Inst
all
ed
Ca
pa
city
(k
W)
Inst
all
ed C
ost
($/W
)
Ince
nti
ve
($/W
)
# P
roje
cts
Inst
all
ed
Ca
pa
city
(k
W)
Inst
all
ed C
ost
($/W
)
Ince
nti
ve
($/W
)
# P
roje
cts
Inst
all
ed
Ca
pa
city
(k
W)
Inst
all
ed C
ost
($/W
)
Ince
nti
ve
($/W
)
Emmett O'Brien Technical
High School 1 5 $2.14 $0.47 - - $0.00 $0.00 1 5 $2.14 $0.47
Encon, Inc. 95 743 $5.41 $0.98 280 1,945 $3.95 $0.96 375 2,688 $4.35 $0.96
Endless Mountains Solar
Services 10 74 $4.86 $1.38 - - $0.00 $0.00 10 74 $4.86 $1.38
Evergreen Energy, LLC 17 137 $3.89 $0.95 1 9 $3.48 $0.61 18 146 $3.87 $0.93
Executive Electric 1 7 $3.91 $1.37 - - $0.00 $0.00 1 7 $3.91 $1.37
Florenton River LLC 1 13 $4.25 $0.47 - - $0.00 $0.00 1 13 $4.25 $0.47
Giuffrida Electric Company,
Inc. 4 26 $4.59 $1.43 - - $0.00 $0.00 4 26 $4.59 $1.43
GM Industries, Inc. 26 256 $8.00 $1.37 - - $0.00 $0.00 26 256 $8.00 $1.37
Green Earth Energy 23 199 $3.93 $0.58 - - $0.00 $0.00 23 199 $3.93 $0.58
Harness the Sun 16 97 $4.15 $1.37 22 193 $3.71 $1.08 38 289 $3.86 $1.18
Infinite Energy Systems 1 11 $5.38 $1.52 - - $0.00 $0.00 1 11 $5.38 $1.52
Intina Energy 3 22 $3.86 $1.13 - - $0.00 $0.00 3 22 $3.86 $1.13
JD Solar Solutions, LLC 147 1,174 $3.71 $0.85 - - $0.00 $0.00 147 1,174 $3.71 $0.85
Leach Services 2 12 $3.70 $1.53 - - $0.00 $0.00 2 12 $3.70 $1.53
Lenz Electric 1 4 $5.71 $1.96 - - $0.00 $0.00 1 4 $5.71 $1.96
Litchfield Hills Solar, LLC 71 557 $4.54 $0.96 - - $0.00 $0.00 71 557 $4.54 $0.96
Macri Roofing, Inc. 2 13 $5.79 $1.58 - - $0.00 $0.00 2 13 $5.79 $1.58
Made in USA Solar LLC 11 79 $4.69 $1.26 - - $0.00 $0.00 11 79 $4.69 $1.26
Mercury Solar Systems, Inc. 2 16 $4.93 $1.63 - - $0.00 $0.00 2 16 $4.93 $1.63
Mister Sparky 6 20 $6.83 $1.90 - - $0.00 $0.00 6 20 $6.83 $1.90
Modern Solar Company 5 41 $5.08 $1.15 - - $0.00 $0.00 5 41 $5.08 $1.15
Moore Energy 4 27 $4.98 $1.59 - - $0.00 $0.00 4 27 $4.98 $1.59
Mystic Solar (Natural Energy
Alternatives, LLC) 4 36 $5.09 $1.61 - - $0.00 $0.00 4 36 $5.09 $1.61
New England Clean Energy 1 7 $5.87 $0.50 - - $0.00 $0.00 1 7 $5.87 $0.50
Next Step Living 129 795 $6.29 $0.88 - - $0.00 $0.00 129 795 $6.29 $0.88
Northeast Energy Design
Solutions 1 9 $3.25 $0.49 1 8 $4.37 $0.49 2 17 $3.77 $0.49
Northeast Smart Energy LLC 12 92 $3.24 $1.18 1 13 $3.75 $0.47 13 106 $3.30 $1.09
One Roof Energy / Direct
Energy Solar 41 276 $3.77 $0.29 - - $0.00 $0.00 41 276 $3.77 $0.29
One Source Solar, LLC 2 15 $4.00 $0.48 - - $0.00 $0.00 2 15 $4.00 $0.48
OneRoof Energy, Inc. 97 734 $4.36 $0.30 - - $0.00 $0.00 97 734 $4.36 $0.30
Paradise Energy Solutions 1 10 $4.08 $0.60 - - $0.00 $0.00 1 10 $4.08 $0.60
PosiGen 383 2,517 $4.49 $0.47 - - $0.00 $0.00 383 2,517 $4.49 $0.47
PurePoint Energy, LLC 90 719 $4.73 $0.77 19 162 $4.49 $0.55 109 881 $4.69 $0.73
R. Pelton Builders 60 457 $4.07 $1.00 - - $0.00 $0.00 60 457 $4.07 $1.00
Real Goods Solar, Inc 190 1,449 $4.14 $0.99 146 1,058 $3.79 $1.24 336 2,507 $3.99 $1.10
Renewable Resources, Inc. 21 130 $4.16 $1.47 11 66 $3.87 $1.29 32 195 $4.06 $1.40
Roof Diagnostics Solar and
Electric of CT 1,027 7,030 $3.40 $0.55 - - $0.00 $0.00 1,027 7,030 $3.40 $0.55
Ross Solar Group 392 3,721 $4.15 $0.82 290 2,524 $3.98 $0.87 682 6,245 $4.08 $0.84

CONNECTICUT GREEN BANK
4. MARKET TRANSFORMATION – COST EFFECTIVENESS OF SUBSIDIES
CASE OF THE RESIDENTIAL SOLAR INVESTMENT PROGRAM
123
Non-Solarize Solarize RSIP Total
Installer # P
roje
cts
Inst
all
ed
Ca
pa
city
(k
W)
Inst
all
ed C
ost
($/W
)
Ince
nti
ve
($/W
)
# P
roje
cts
Inst
all
ed
Ca
pa
city
(k
W)
Inst
all
ed C
ost
($/W
)
Ince
nti
ve
($/W
)
# P
roje
cts
Inst
all
ed
Ca
pa
city
(k
W)
Inst
all
ed C
ost
($/W
)
Ince
nti
ve
($/W
)
Shippee Solar and
Construction LLC 105 815 $3.72 $1.05 14 113 $3.91 $0.60 119 928 $3.75 $0.99
Sicuranza Electric 2 20 $5.45 $0.95 - - $0.00 $0.00 2 20 $5.45 $0.95
Sky View Solar 1 5 $6.03 $1.37 - - $0.00 $0.00 1 5 $6.03 $1.37
Skyline Solar 38 299 $4.21 $0.82 - - $0.00 $0.00 38 299 $4.21 $0.82
SolarCity 6,820 49,515 $5.16 $0.61 4 21 $5.15 $0.59 6,824 49,536 $5.16 $0.61
SON Energy Systems, LLC 2 16 $3.55 $0.87 - - $0.00 $0.00 2 16 $3.55 $0.87
Sound Solar Systems, LLC 6 52 $4.80 $1.20 - - $0.00 $0.00 6 52 $4.80 $1.20
Summer Hill Solar 24 177 $3.19 $0.89 - - $0.00 $0.00 24 177 $3.19 $0.89
Sun Harvest Renewable
Resources, LLC 10 76 $6.07 $1.62 - - $0.00 $0.00 10 76 $6.07 $1.62
Sundoor Solar 2 14 $4.00 $0.86 - - $0.00 $0.00 2 14 $4.00 $0.86
SunEdison 96 603 $2.74 $0.33 - - $0.00 $0.00 96 603 $2.74 $0.33
Sungevity, Inc. 811 6,156 $3.96 $0.65 - - $0.00 $0.00 811 6,156 $3.96 $0.65
Sunlight Solar Energy, Inc. 197 1,517 $4.15 $0.91 94 700 $3.89 $1.00 291 2,217 $4.07 $0.94
Sunrun Inc 777 6,039 $2.31 $0.30 - - $0.00 $0.00 777 6,039 $2.31 $0.30
Sun-Wind Solutions, LLC 17 138 $3.88 $0.96 - - $0.00 $0.00 17 138 $3.88 $0.96
Super Green Solutions 8 70 $3.58 $0.63 - - $0.00 $0.00 8 70 $3.58 $0.63
The Roofing Store, LLC 1 7 $5.50 $0.47 - - $0.00 $0.00 1 7 $5.50 $0.47
Today Electronics USA 1 9 $3.82 $0.71 - - $0.00 $0.00 1 9 $3.82 $0.71
Trinity Solar 2,213 17,766 $3.50 $0.47 10 97 $3.83 $0.36 2,223 17,863 $3.50 $0.47
Tuscany Design Build, Inc. 8 82 $5.38 $0.93 1 11 $4.22 $0.31 9 93 $5.24 $0.86
US Energy Concierge 13 72 $4.38 $0.89 - - $0.00 $0.00 13 72 $4.38 $0.89
Verengo Solar 35 272 $3.61 $1.00 - - $0.00 $0.00 35 272 $3.61 $1.00
Vivint Solar Developer, LLC 13 85 $4.97 $0.29 - - $0.00 $0.00 13 85 $4.97 $0.29
Waldo Renewable Electric,
LLC 42 302 $4.82 $1.13 1 6 $3.82 $0.49 43 308 $4.81 $1.11
White Oak Development, LLC 10 61 $5.84 $1.46 - - $0.00 $0.00 10 61 $5.84 $1.46
Total 15,984 120,917 $4.33 $0.62 2,085 16,294 $3.85 $0.96 18,069 137,211 $4.28 $0.66

CONNECTICUT GREEN BANK
4. MARKET TRANSFORMATION – COST EFFECTIVENESS OF SUBSIDIES
CASE OF THE RESIDENTIAL SOLAR INVESTMENT PROGRAM
124
Rebates and Incentives
The RSIP is a subsidy program that provides incentives to offset the cost for homeowners to install
solar photovoltaic (PV) systems. Incentives are provided either upfront (i.e., through an expected
performance based buy-down or EPBB) for homeowners that want to own a system or over time
based on system production (i.e., through a performance based incentive or PBI) for homeowners
who want to lease a system from a third-party owner. With either incentive type, the Renewable
Energy Credits (RECs) are owned by the Connecticut Green Bank (see Figure 4).
Figure 4. Legal Structure and Flows of Capital for the RSIP41
The subsidy under the RSIP has decreased over time (see Table 37) with the intention of increasing
the number of projects and increasing the amount of clean energy produced (see Table 38) while
at the same time supporting the goal of reducing the market reliance on rebates and incentives and
moving it towards innovative low-cost financing (see Market Transformation: Financial
Warehouse and Credit Enhancement Structures for CT Solar Loan and CT Solar Lease).
Table 37. RSIP Subsidy by Step and Incentive Type
RSIP
Subsidy
by Step Start Date
EPBB
($/W) PBI
($/kWh) LMI
($/kWh)
≤5 kW
5 to 10
kW
>10 kW,
≤ 20 kW ≤10 kW
>10 kW,
≤ 20 kW ≤10 kW
>10 kW,
≤ 20 kW
Step 1 3/2/2012 $2.450 $1.250 $0.000 $0.300 $0.000 N/A N/A
Step 2 5/8/2012 $2.275 $1.075 $0.000 $0.300 $0.000 N/A N/A
Step 3 1/4/2013 EPBB
4/1/2013 PBI $1.750 $0.550 $0.000 $0.225 $0.000
N/A N/A
Step 4 1/6/2014 $1.250 $0.750 $0.000 $0.180 $0.000 N/A N/A
Step 5 9/1/2014 $0.800 $0.400 $0.125 $0.060 N/A N/A
Step 6 1/1/2015 $0.675 $0.400 $0.080 $0.060 N/A N/A
Step 7 4/11/2015 $0.540 $0.400 $0.064 $0.060 N/A N/A
Step 8 8/8/2015 $0.513 $0.400 $0.054 $0.054 $0.110 $0.055
Step 9 2/1/2016 $0.487 $0.400 $0.046 $0.046 $0.110 $0.055
41 The Green Bank incentive is issued to the Contractor on behalf of the Customer. In the case of Third-Party Owned systems, RECs flow from the Contractor to the Connecticut Green Bank.

CONNECTICUT GREEN BANK
4. MARKET TRANSFORMATION – COST EFFECTIVENESS OF SUBSIDIES
CASE OF THE RESIDENTIAL SOLAR INVESTMENT PROGRAM
125
Table 38. Residential Solar PV Systems Approved, In Progress or Completed through the
RSIP Subsidy by Step
RSIP
Subsidy
by Step
Approved
(kW) Completed
(kW) Total
(kW)
Average
Incentive
($/W-STC)
Step 1 0.0 1,380.7 1,380.7 $1.79
Step 2 0.0 5,991.5 5,991.5 $1.63
Step 3 88.2 13,097.5 13,185.7 $1.23
Step 4 644.2 19,002.9 19,647.1 $1.03
Step 5 930.2 12,748.7 13,678.9 $0.75
Step 6 1,767.6 11,001.1 12,768.6 $0.51
Step 7 2,614.8 17,122.3 19,737.1 $0.40
Step 8 626.2 2,476.7 3,102.9 $0.38
Step 8.1 2,850.0 6,658.8 9,508.8 $0.39
Step 8.2 8,671.1 8,775.8 17,446.9 $0.33
Step 9 18,662.2 2,100.4 20,762.5 $0.32
Total 36,854.5 100,356.3 137,210.8 $0.66

CONNECTICUT GREEN BANK
4. MARKET TRANSFORMATION
FINANCIAL WAREHOUSE AND CREDIT ENHANCEMENT STRUCTURES
CASE OF THE CT SOLAR LOAN
126
As the Connecticut Green Bank’s residential solar PV loan program, we are applying the Program
Logic Model that focuses on financing and credit enhancements (see Figure 5).
Figure 5. Program Logic Model for the CT Solar Loan
Financing Program
The CT Solar Loan was a financing product developed in partnership with Sungage Financial42
that uses credit enhancements (i.e., $300,000 loan loss reserve)43 in combination with a $5 million
warehouse of funds and $1 million of subordinated debt from the Connecticut Green Bank.
Through this product, the Connecticut Green Bank lowers the barriers to Connecticut homeowners
seeking to install solar PV installations thus increasing demand while at the same time reducing
the market’s reliance on subsidies being offered through the RSIP. The CT Solar Loan was the
first dedicated residential solar loan product not secured by a lien on the home or tied to a particular
PV equipment OEM supplier. As a loan, capital provided to consumers for the CT Solar Loan is
returned to the Connecticut Green Bank – it is not a subsidy. In fact, approximately 80% of the
loan value is sold to retail investors through a “crowd funding” platform or to institutional investors
without recourse to the Connecticut Green Bank. The financial structure of the CT Solar Loan
product includes origination,44 servicing,45 and financing features in combination with the support
of the Connecticut Green Bank (see Figure 6).
42 Sungage Financial (http://www.sungagefinancial.com/) won a competitive RFP through the Connecticut Green Bank’s Financial Innovation RFP to support a residential solar PV loan program 43 From repurposed American Recovery and Reinvestment Act funds 44 Sungage Financial in partnership with local contractors 45 Concord Servicing Corporation

CONNECTICUT GREEN BANK
4. MARKET TRANSFORMATION
FINANCIAL WAREHOUSE AND CREDIT ENHANCEMENT STRUCTURES
CASE OF THE CT SOLAR LOAN
127
Launched in March of 2013, the CT Solar Loan provided up to $55,000 per loan, with 15-year
maturity terms and affordable 6.49% interest rates (including 0.25% ACH payment benefit) to
provide homeowners with the upfront capital they needed to finance residential solar PV projects.
Figure 6. Legal Structure and Flows of Capital for the CT Solar Loan
The CT Solar Loan provided financing for 279 projects totaling nearly $6.0 million of investment
and 2,193.1 kW of residential solar PV deployment (see Table 39). To date there are no defaults
and as of June 30, 2016 there are 5 delinquencies or 1.8% of loans.
Table 39. CT Solar Loan Metrics
Year
# of
Projects Investment
Installed
Capacity
(kW)
2013 3 $58,974 17.7
2014 140 $2,774,655 1,107.9
2015 136 $3,120,143 1,068.2
Total46 279 $5,953,772 2,193.1
46 Includes approved, closed and completed projects.

CONNECTICUT GREEN BANK
4. MARKET TRANSFORMATION
FINANCIAL WAREHOUSE AND CREDIT ENHANCEMENT STRUCTURES
CASE OF THE CT SOLAR LOAN
128
The CT Solar Loan yields an appropriate rate of return to the capital providers commensurate with
the risks they are taking, provided 19 contractors with an important sales tool, and gave nearly 300
customers the ability to own solar PV through low-interest and long-term financing along with
access to the federal ITC and state incentives (i.e., the RSIP Expected Performance Based
Buydown). Of the $6.0 million invested by the Connecticut Green Bank into the CT Solar Loan,
$1.0 million has been sold to the crowd-funding platform Mosaic, $2.6 million to a Community
Development Financial Institution in The Reinvestment Fund, and the remaining is on the balance
sheet of the Connecticut Green Bank.
In structuring the solar loan product, the Green Bank’s objective was to enable homeowners of
varying financial means to own their own solar PV systems. Prior to the CT Solar Loan’s creation,
a homeowner would need to use their own savings or their own home equity (most often though a
home equity line of credit) to pay for the system which, at that time, often required an investment
exceeding $25,000. The requirement for such a level of personal financial resources dramatically
constrained the “ownership” market for solar PV. So the Green Bank with its partner Sungage
Financial developed the CT Solar Loan which made 15-year financing available at affordable
interest rates without the need to have a lien on the home or limit the purchase to certain
manufacturers who offered financing solely for their panels. In developing the CT Solar Loan, the
Green Bank had to overcome the risk of being unable to sell the loans to private investors which
would have tied up capital resources of the Green Bank and limiting its ability to deploy investment
of additional clean energy. Ultimately, the Green Bank became confident that a sufficient rate of
return could be offered to enable the investments to “clear” the market without a discount (or loss)
to the Green Bank. The combination of crowdsourced funding and a structured private placement
enabled the Green Bank to sell the investments with recourse limited to the underlying consumer
loans as well as a limited loan loss reserve using American Recovery and Reinvestment Act funds
from the US Department of Energy.
The CT Solar Loan was the Connecticut Green Bank’s first residential product graduation. It
started off being the first crowd-funded residential solar PV transaction with Sungage Financial
through Mosaic.47 And then it graduated to a partnership between Sungage Financial and Digital
Federal Credit Union – with no resources from the Connecticut Green Bank.48 The loan offering
from Sungage Financial now includes 5, 10, and 20 year maturity terms at affordable interest rates
and is being offered in California, Florida, Massachusetts, New Jersey, New York, and Texas –
along with solar PV contractors in Connecticut.
Marketing Programs
To accelerate the deployment of residential solar PV through the RSIP and the uptake of the CT
Solar Loan financing product, the Connecticut Green Bank implemented Solarize Connecticut.
Solarize programs are designed to use a combination of group purchasing, time-limited offers, and
grassroots outreach, while local clean energy advocates volunteer and coordinate with their towns
to help speed the process (see Table 40).
47 http://www.businesswire.com/news/home/20140206005031/en/Sungage-Financial-CEFIA-Mosaic-Announce-5-Million#.VgRTgVIXL4Y 48 http://www.spark.ctgreenbank.com/ct-solar-loan-partner-graduates-from-connecticut-green-bank/

CONNECTICUT GREEN BANK
4. MARKET TRANSFORMATION
FINANCIAL WAREHOUSE AND CREDIT ENHANCEMENT STRUCTURES
CASE OF THE CT SOLAR LOAN
129
Table 40. Number of Projects, Investment, and Installed Capacity through Solarize
Connecticut for the CT Solar Loan Financing Product
# of
Projects Investment
Installed
Capacity
(kW)
Solarize 168 $3,273,609 1,285.7
Non-Solarize 111 $2,680,163 907.4
Total 279 $5,953,772 2,193.1
% Solarize 60 55 59
The Solarize Connecticut program provided a significant marketing channel to catalyze origination
for the CT Solar Loan comprising nearly 60 percent of the total projects, investment, and installed
capacity.
Data Accessibility
There were 462 applications into the CT Solar Loan – 279 closed, 96 withdrew, and 87 declined
in underwriting. The household customers that accessed the CT Solar Loan since its launch in
2013 had varying credit scores – see Table 41.
Table 41. Credit Scores of Household Customers Using the CT Solar Loan
Credit Score Ranges
Below
640
640-
679
680-
699
700-
719 720+ Total
CT Solar Loan 11 15 253 279
3.9% 5.4% 90.7
Of the CT Solar Loans approved and closed with household customers, the following table is a
breakdown of the contractors offering the financing product – see Table 42.
Table 42. Residential Solar PV Contractors and the CT Solar Loan
Contractor
# of
Loans $ of Loans
% of
Loans
31Solar 1 $20,298 0.34%
Aegis Electrical Systems, LLC 24 $539,766 9.07%
AllGreenIT, Inc. 7 $112,604 1.89%
BeFree Green Energy, LLC 2 $46,606 0.78%
Catchin Rays 7 $175,248 2.94%
Centurion Solar 4 $107,025 1.80%
C-TEC Solar LLC 45 $926,307 15.56%
DCS 1 $16,440 0.28%
Direct Energy 28 $572,721 9.62%

CONNECTICUT GREEN BANK
4. MARKET TRANSFORMATION
FINANCIAL WAREHOUSE AND CREDIT ENHANCEMENT STRUCTURES
CASE OF THE CT SOLAR LOAN
130
Contractor
# of
Loans $ of Loans
% of
Loans
Earthlight Technologies 8 $191,189 3.21%
EcoSmart Home Services 2 $55,366 0.93%
Encon, Inc. 13 $217,599 3.65%
Northeast Smart Energy LLC 1 $19,960 0.34%
PurePoint Energy, LLC 6 $174,016 2.92%
RGS Energy 18 $360,238 6.05%
Ross Solar Group 72 $1,571,531 26.40%
Shippee Solar and Construction LLC 3 $61,543 1.03%
Sunlight Solar Energy, Inc. 36 $764,760 12.84%
US Energy Concierge 1 $20,556 0.35%
Total 279 $5,953,772 100.00%

CONNECTICUT GREEN BANK
4. MARKET TRANSFORMATION
FINANCIAL WAREHOUSE AND CREDIT ENHANCEMENT STRUCTURES
CASE OF THE CT SOLAR LEASE
131
As the Connecticut Green Bank’s residential and commercial solar PV lease program, we are
applying the Program Logic Model that focuses on financing and credit enhancements (see Figure
7).
Figure 7. Program Logic Model for the CT Solar Lease
Financing Programs
The CT Solar Lease was a financing product developed in partnership with a tax equity investor
(i.e., US Bank) and a syndicate of local lenders (i.e. First Niagara Bank and Webster Bank) that
uses a credit enhancement (i.e., $3,500,000 loan loss reserve),49 in combination with $2.3 million
in subordinated debt and sponsor equity from the Connecticut Green Bank as the “member
manager” to provide up to $75 million in lease financing for residential and commercial solar PV
projects. Through the product, the Connecticut Green Bank lowers the barriers to Connecticut
residential and commercial customers seeking to install solar PV with no up-front investment thus
increasing demand, while at the same time reducing the market’s reliance on subsidies through the
RSIP or being more competitive in a reverse auction through the Zero Emission Renewable Energy
Credit (ZREC) program. As a lease, capital provided to consumers through the CT Solar Lease is
returned to the Connecticut Green Bank, the tax equity investor and the lenders – it is not a subsidy.
The financial structure of the CT Solar Lease product includes origination by contractors, servicing
of lease payments,50 insurance and “one call” system performance and insurance resolution,51 and
financing features in combination with the support of the Connecticut Green Bank (see Figure 8).
49 From repurposed American Recovery and Reinvestment Act funds 50 AFC First Financial 51 Assurant

CONNECTICUT GREEN BANK
4. MARKET TRANSFORMATION
FINANCIAL WAREHOUSE AND CREDIT ENHANCEMENT STRUCTURES
CASE OF THE CT SOLAR LEASE
132
Figure 8. Legal Structure and Flows of Capital for the CT Solar Lease52
Through 6/30/2016, the CT Solar Lease provided financing for 1,192 residential solar PV projects
and 36 commercial solar PV projects totaling $67.3 million of investment and 17,095 kW of clean
energy deployment (see Tables 43 and 44). To date there are no defaults and as of 6/30/2016 there
are 2 delinquencies or 0.2% of the portfolio.
Table 43. CT Solar Lease Metrics – Residential
Year # of Projects Investment
Installed
Capacity
(kW)
2014 60 $2,306,025 461.2
2015 486 $18,370,999 3,966.6
2016 646 $23,187,919 5,145.0
Total53 1,192 $43,864,942 9,572.7
Table 44. CT Solar Lease Metrics – Commercial
Year # of Projects Investment
Installed
Capacity
(kW)
2015 22 $9,836,739 3,154.3
2016 14 $13,663,830 4,367.8
Total 36 $23,500,568 7,522.2
52 It should be noted that the Special Purpose Entity structure includes several entities – CT Solar Lease II, LLC and CEFIA
Holdings, LLC that provide different functions. 53 Includes approved, closed and completed projects.

CONNECTICUT GREEN BANK
4. MARKET TRANSFORMATION
FINANCIAL WAREHOUSE AND CREDIT ENHANCEMENT STRUCTURES
CASE OF THE CT SOLAR LEASE
133
The CT Solar Lease yields an appropriate rate of return to the capital providers commensurate with
the risks they are taking, provided 27 contractors with an important sales tool, and gave 1,228
customers the ability to lease solar PV and lower their energy costs. The CT Solar Lease is the
second “solar PV fund” established using a combination of ratepayer funds and private capital. In
developing this fund, the Green Bank sought to innovate both in the types of credits that would be
underwritten and broaden the sources of capital in the fund. Before these innovations by the Green
Bank, a fund had not been established that would underwrite residential solar PV installations as
well as installations on a “commercial scale” such as for municipal and school buildings,
community oriented not-for-profit structures (all of which can’t take advantage of Federal tax
incentives due to their tax exempt status) as well as a vast array of for profit enterprises. These
commercial-scale projects were historically the most difficult to finance: too small to attract
investment funds and similarly if aggregated to a size worthy of investment, the pool of offtakers
that for the most part are non-investment grade or “unrated” credits are difficult to underwrite in a
manner that would permit deploying solar PV at scale. By prudently assessing these risks and
operational issues – the Green Bank was able to obtain the support of the tax equity investor and
lenders from Main Street – not Wall Street – in the fund. The CT Solar Lease is the first fund to
secure solar leases and power purchase agreements using a PACE lien – an innovation that has
prompted California to introduce legislation to enable the same security arrangement for its
businesses and not for profit organizations. The Green Bank’s leadership and innovation was
recognized by the Clease Energy States Alliance “State Leadership in Clean Energy” award in
2016.
CT Solar Lease and QECBs
The Connecticut Housing Finance Authority (CHFA) is partnering with the Green Bank to
identify buildings among the State Sponsored Housing Portfolio (SSHP), as well as other
affordable multifamily properties, that are well positioned to “go solar”. The Green Bank will
own, operate, and maintain these systems while providing owners with discounted electricity for
20 years through Power Purchase Agreements. Originally, the Green Bank intended to secure the
power purchase agreements and solar leases for these SSHP systems using C-PACE. When a
conflict with CHFA’s bond indenture for the financing for these SSHPs with C-PACE as the
security mechanism was identified, the Green Bank needed to secure an alternative financing
arrangement in order to complete the financing for the SSHP systems. Working with CHFA, the
Green Bank structured incremental debt funding using proceeds from Qualified Energy
Conservation Bonds (QECBs) that CHFA could make available for this purpose. The Green Bank
was able to carve out the SSHP repayment streams from the lenders’ collateral package under the
Connecticut Solar Lease fund, thereby providing repayment assurance that permitted CHFA to
issue the QECBs to Bank of America. With the funding structure in place, the Green Bank was
able to move forward with local contractors to provide financing for more than a dozen solar PV
systems for the SSHP properties, resulting in more than 750 kW of clean renewable energy for
these multifamily dwellings.

CONNECTICUT GREEN BANK
4. MARKET TRANSFORMATION
FINANCIAL WAREHOUSE AND CREDIT ENHANCEMENT STRUCTURES
CASE OF THE CT SOLAR LEASE
134
With respect to the CT Solar Lease and the commercial market, over $23 million is being used to
deploy solar PV systems in the commercial sector (see Table 45).
Table 45. CT Solar Lease Commercial Contractors
Contractor
# of
Leases $ of Leases
% of
Leases
64 Solar 3 $949,536 4.04%
American Solar 9 $4,383,607 18.65%
C-TEC Solar LLC 3 $7,690,234 32.72%
Davis Hill 1 $652,860 2.78%
Deutsche Eco USA Corp. 2 $3,300,960 14.05%
Encon, Inc. 10 $2,667,653 11.35%
Entersolar 1 $1,047,153 4.46%
Northeast Energy Design Solutions 1 $802,125 3.41%
Northeast Smart Energy LLC 3 $589,453 2.51%
Renewable Resources, Inc. 1 $239,883 1.02%
Ross Solar Group 2 $1,177,105 5.01%
Total 36 $23,500,568 100.00%
Given the growth in the market from consumers and the level of interest in providing financing
from local capital providers, the CT Solar Lease is under consideration for expansion as it applies
to commercial customers.
Marketing Programs
To accelerate the deployment of residential solar PV through the RSIP and the uptake of the CT
Solar Lease financing product, the Connecticut Green Bank implemented Solarize Connecticut.
Solarize programs are designed to use a combination of group purchasing, time-limited offers, and
grassroots outreach, while local clean energy advocates volunteer and coordinate with their towns
to help speed the process (see Table 46).
Table 46. Number of Projects, Investment, and Installed Capacity through Solarize
Connecticut for the CT Solar Lease Financing Product
# of
Projects Investment
Installed
Capacity
(kW)
Solarize 326 $11,766,734 2,553.8
Non-Solarize 866 $32,098,208 7,018.9
Total 1,192 $43,864,942 9,572.7
% Solarize 27 27% 27%
The Solarize Connecticut program provided a marketing channel and origination catalyst for the
CT Solar Lease comprising 27 percent of the total projects, investment, and installed capacity.

CONNECTICUT GREEN BANK
4. MARKET TRANSFORMATION
FINANCIAL WAREHOUSE AND CREDIT ENHANCEMENT STRUCTURES
CASE OF THE CT SOLAR LEASE
135
Data Accessibility
1,192 household customers accessed the CT Solar Lease since its launch in 2013 – see Table 47.
Table 47. Credit Scores of Household Customers Using the CT Solar Lease
Credit Score Ranges
Below
640
640-
679
680-
699
700-
719 720+ Total
Solar Lease 1 45 39 78 1,029 1,192
0.1% 3.8% 3.3% 6.5% 86.3%
There were 2,833 applications received through the CT Solar Lease – 1,192 were approved, closed,
or completed, 1,026 withdrawn, and 615 declined. To date, there have been no defaults and there
is presently one delinquency. Of the CT Solar Leases approved and closed with household
customers, the following table is a breakdown of the contractors offering the financing product –
see Table 48.
Table 48. Residential Solar PV Contractors and the CT Solar Lease
Contractor # of Leases $ of Leases % of Leases
Aegis Electrical Systems, LLC 60 $2,158,610 4.92%
AllGreenIT, Inc. 9 $387,576 0.88%
Astrum Solar 54 $2,137,763 4.87%
BeFree Green Energy, LLC 84 $3,535,688 8.06%
Boston Solar 6 $230,580 0.53%
Connecticut Solar Power, LLC 2 $76,523 0.17%
C-TEC Solar LLC 85 $3,061,148 6.98%
Direct Energy 114 $4,373,528 9.97%
Earthlight Technologies 19 $721,551 1.64%
EcoSmart Home Services 3 $118,035 0.27%
Encon, Inc. 139 $4,641,335 10.58%
Litchfield Hills Solar, LLC 17 $682,940 1.56%
PurePoint Energy, LLC 7 $270,117 0.62%
Real Goods Solar, Inc 7 $229,775 0.52%
Renewable Resources, Inc. 4 $136,773 0.31%
RGS Energy 100 $3,547,073 8.09%
Ross Solar Group 88 $3,516,632 8.02%
Sunlight Solar Energy, Inc. 35 $1,251,128 2.85%
Trinity Solar 356 $12,672,388 28.89%
Tuscany Solar 3 $115,785 0.26%
Total 1,192 $43,864,942 100.00%

CONNECTICUT GREEN BANK
4. MARKET TRANSFORMATION
FINANCIAL WAREHOUSE AND CREDIT ENHANCEMENT STRUCTURES
CASE OF THE SMART-E LOAN
136
For the Energize CT Smart-E residential loan program, underwritten and administered by
Connecticut Green Bank, we are applying the Program Logic Model that focuses on financing and
credit enhancements (see Figure 9).
Figure 9. Program Logic Model for the Smart-E Loan
Financing Program
The Smart-E residential loan program is a financing program developed in partnership with
Energize CT and local lenders that uses a credit enhancement (i.e., $2,800,000 loan loss reserve)54
and interest rate buy-downs to stimulate the market for residential energy efficiency and solar loans
in Connecticut. Through the product, the Connecticut Green Bank lowers the cost of capital for
Connecticut residential customers seeking to install solar PV or retrofit their homes and reduces
the loan performance risks to lenders. The Loan Loss Reserve uses $2.8mm in repurposed ARRA
funds to demonstrate the loan economics to lenders, mitigates their losses, and encourages
customers to undertake measures that would prove uneconomical at higher interest rates. The
Interest Rate Buy-downs further encourage additional energy savings as they are reserved
primarily for customers coupling multiple retrofits or solar.
The Smart-E Loan was designed to make it easy and affordable for homeowners to make energy
efficiency and renewable energy improvements to their homes with no cash out of pocket and at
interest rates low enough and repayment terms long enough to make the improvements “cash flow
positive”. At the same time, the Green Bank was intentional in opening conversations with local
54 From repurposed American Recovery and Reinvestment Act funds
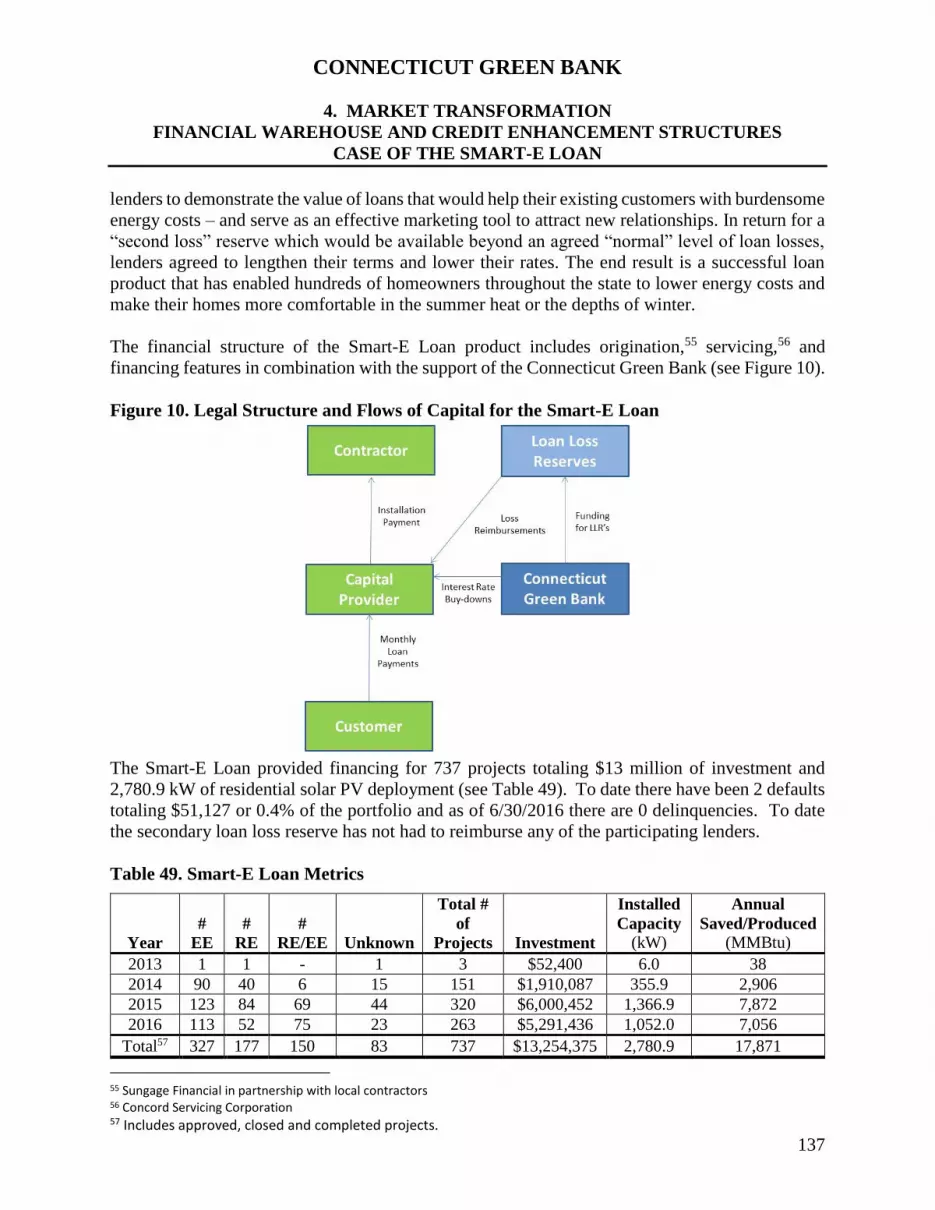
CONNECTICUT GREEN BANK
4. MARKET TRANSFORMATION
FINANCIAL WAREHOUSE AND CREDIT ENHANCEMENT STRUCTURES
CASE OF THE SMART-E LOAN
137
lenders to demonstrate the value of loans that would help their existing customers with burdensome
energy costs – and serve as an effective marketing tool to attract new relationships. In return for a
“second loss” reserve which would be available beyond an agreed “normal” level of loan losses,
lenders agreed to lengthen their terms and lower their rates. The end result is a successful loan
product that has enabled hundreds of homeowners throughout the state to lower energy costs and
make their homes more comfortable in the summer heat or the depths of winter.
The financial structure of the Smart-E Loan product includes origination,55 servicing,56 and
financing features in combination with the support of the Connecticut Green Bank (see Figure 10).
Figure 10. Legal Structure and Flows of Capital for the Smart-E Loan
The Smart-E Loan provided financing for 737 projects totaling $13 million of investment and
2,780.9 kW of residential solar PV deployment (see Table 49). To date there have been 2 defaults
totaling $51,127 or 0.4% of the portfolio and as of 6/30/2016 there are 0 delinquencies. To date
the secondary loan loss reserve has not had to reimburse any of the participating lenders.
Table 49. Smart-E Loan Metrics
Year
#
EE
#
RE
#
RE/EE Unknown
Total #
of
Projects Investment
Installed
Capacity
(kW)
Annual
Saved/Produced
(MMBtu)
2013 1 1 - 1 3 $52,400 6.0 38
2014 90 40 6 15 151 $1,910,087 355.9 2,906
2015 123 84 69 44 320 $6,000,452 1,366.9 7,872
2016 113 52 75 23 263 $5,291,436 1,052.0 7,056
Total57 327 177 150 83 737 $13,254,375 2,780.9 17,871
55 Sungage Financial in partnership with local contractors 56 Concord Servicing Corporation 57 Includes approved, closed and completed projects.

CONNECTICUT GREEN BANK
4. MARKET TRANSFORMATION
FINANCIAL WAREHOUSE AND CREDIT ENHANCEMENT STRUCTURES
CASE OF THE SMART-E LOAN
138
Marketing Programs
To accelerate the deployment of residential solar PV through the RSIP and the uptake of the Smart-
E Loan financing product, the Connecticut Green Bank implemented Solarize Connecticut.
Solarize programs are designed to use a combination of group purchasing, time-limited offers, and
grassroots outreach, while local clean energy advocates volunteer and coordinate with their towns
to help speed the process (see Table 50).
Table 50. Number of Projects, Investment, and Installed Capacity through Solarize
Connecticut for the Smart-E Loan Financing Product
# of
Projects Investment
Installed
Capacity
(kW)
Solarize 106 $2,509,259 964.1
Non-Solarize 631 $10,745,116 1,816.8
Total 737 $13,254,375 2,780.9
% Solarize 14% 19% 35%
The Solarize Connecticut program provided a significant marketing channel and origination
catalyst for the Smart-E Loan comprising nearly 15 to 20 percent of the total projects and
investment and 35% of the installed capacity.58
Data Accessibility
There were 1,260 applications into the Smart-E Loan – 737 closed, 168 withdrew, and 355 declined
in underwriting. The household customers that accessed the Smart-E Loan since its launch in 2013
had varying credit scores – see Table 51.
Table 51. Credit Scores of Household Customers Using the Smart-E Loan
Credit Score Ranges
Below
640
640-
679
680-
699
700-
719 720+ Unknown Total
Smart- E Loan 26 75 45 65 501 25 737
3.4% 10.2% 6.1% 8.8% 68.0 3.4%
Of the Smart-E Loans approved and closed with household customers, the following tables are a
breakdown of the contractors and lenders offering the financing product – see Tables 52 and 53.
58 It should also be noted that Solarize was adapted to support a transition from propane and heating oil to natural gas through
a pilot community-based marketing partnership with Norwich Public Utilities and SmartPower through Energize Norwich. Over 100 Smart-E Loans were originated through this pilot demonstrating that community-based marketing approaches could be adapted to support loan origination strategies.

CONNECTICUT GREEN BANK
4. MARKET TRANSFORMATION
FINANCIAL WAREHOUSE AND CREDIT ENHANCEMENT STRUCTURES
CASE OF THE SMART-E LOAN
139
Table 52. Residential Contractors and the Smart-E Loan
Contractor
# of
Loans $ of Loans
% of
Loans
20/20 Save Green Now 3 $22,550 0.17%
31Solar 8 $141,953 1.07%
72 Degrees Air Conditioning & Heating 1 $11,000 0.08%
A&B Cooling & Heating 1 $14,350 0.11%
A.R. Fonda Mechanical Services 1 $8,275 0.06%
Absolute Air Services 3 $48,907 0.37%
Aegis Electrical Systems, LLC 4 $119,487 0.90%
Aiello Home Services LLC 1 $11,800 0.09%
Air Inc 2 $26,795 0.20%
All Phase Heating & Cooling Contractors 3 $46,332 0.35%
All Time Manufacturing Co Inc 2 $9,000 0.07%
AllGreenIT, Inc. 4 $75,536 0.57%
American Heating and Cooling LLC 1 $10,000 0.08%
American Windows & Siding LLC 4 $81,085 0.61%
Apex Solar 2 $13,500 0.10%
Aspen Heating and Cooling 1 $10,000 0.08%
Bartol Heating & A/C 1 $6,359 0.05%
Bay State Fuel Oil 1 $7,792 0.06%
BeFree Green Energy, LLC 40 $1,096,136 8.27%
Benvenuti Oil 3 $34,289 0.26%
Better Building Performance 1 $4,000 0.03%
Better Way Solar 1 $25,000 0.19%
Billy Carlson Heating & AC, LLC 1 $10,500 0.08%
Bonner Electric 6 $152,593 1.15%
Boston Solar 7 $190,900 1.44%
Brayman Heating & Cooling, Inc. 3 $38,690 0.29%
Brooks Oil 1 $14,531 0.11%
Caprio Homes 1 $13,000 0.10%
Caso HVAC 1 $11,045 0.08%
Cawley's Plumbing & Heating 1 $30,000 0.23%
Chabot Electric 1 $6,626 0.05%
Charter Oak Mechanical Service LLC 3 $35,125 0.27%
Chickos Energy Services 5 $77,443 0.58%
Climate Partners, LLC 12 $188,152 1.42%
Conditioned Air Systems Inc 2 $13,550 0.10%
CT Electrical, LLC 1 $22,000 0.17%
CT Exteriors 1 $4,615 0.03%
C-TEC Solar LLC 67 $1,459,883 11.01%
Currie’s Plumbing and Heating 2 $20,656 0.16%
D&D Heating and A/C 2 $65,000 0.49%
Daniels Energy 1 $10,803 0.08%
DeLia Mechanical 7 $61,200 0.46%
Depco Mechanical LLC 1 $6,450 0.05%

CONNECTICUT GREEN BANK
4. MARKET TRANSFORMATION
FINANCIAL WAREHOUSE AND CREDIT ENHANCEMENT STRUCTURES
CASE OF THE SMART-E LOAN
140
Contractor
# of
Loans $ of Loans
% of
Loans
Dependable Energy 1 $11,540 0.09%
Diamond Plumbing & Heating 1 $7,000 0.05%
Direct Energy 23 $497,659 3.75%
Douglas Mechanical 1 $6,200 0.05%
Dr. Energy Saver 7 $145,426 1.10%
Duct Works 2 $36,250 0.27%
Dunklee 3 $34,175 0.26%
Dutch 1 $11,700 0.09%
Dziengiel Plumbing Unlimited 3 $35,133 0.27%
Earthlight Technologies 4 $110,000 0.83%
East Coast Mechanical 3 $46,686 0.35%
East Hartford Heating and Cooling 2 $15,876 0.12%
Eastern Mechanical 1 $21,100 0.16%
EcoSmart Home Services 9 $243,484 1.84%
Edward M Sikorski 1 $6,350 0.05%
Elm City Energy Solutions 1 $40,000 0.30%
Encon, Inc. 8 $195,381 1.47%
Evergreen Energy, LLC 3 $64,200 0.48%
F.F. Hitchcock Oil Company 1 $9,819 0.07%
Fahan Brothers 1 $40,000 0.30%
For U Builders 3 $67,795 0.51%
Gelo 1 $13,300 0.10%
Giordano Heating and Cooling 1 $10,500 0.08%
Glasco Heating & Air Conditioning, Inc. 24 $203,630 1.54%
GMI Solar 1 $25,000 0.19%
Good Life Energy Savers 3 $35,785 0.27%
Green Earth Energy 2 $32,032 0.24%
Greystone Home Services LLC 1 $14,096 0.11%
Gulick Building & Development, LLC 1 $7,200 0.05%
Harness the Sun 8 $173,784 1.31%
HARP Mechanical 4 $32,928 0.25%
Home Depot 3 $89,334 0.67%
Home Doctor of America 1 $14,250 0.11%
HomePro Rx 1 $24,000 0.18%
Hurlburt's Plumbing and Heating 1 $7,500 0.06%
Independent Mechanical Inc. 1 $1,800 0.01%
Insulation Solutions of CT 1 $39,227 0.30%
Ireland Oil Co., Inc. 1 $8,095 0.06%
Izbicki Plumbing and Heating 8 $74,100 0.56%
Jack Cipriano Plumbing & Heating 1 $8,400 0.06%
James Carboni Plumbing and Heating, Inc. 6 $61,956 0.47%
James Onze 1 $12,280 0.09%
JD Solar Solutions, LLC 27 $733,546 5.53%
John C. Fiderio & Sons, Inc. 1 $3,325 0.03%
Kevin Caswell & Sons Contracting 1 $5,000 0.04%

CONNECTICUT GREEN BANK
4. MARKET TRANSFORMATION
FINANCIAL WAREHOUSE AND CREDIT ENHANCEMENT STRUCTURES
CASE OF THE SMART-E LOAN
141
Contractor
# of
Loans $ of Loans
% of
Loans
King Energy Associates 2 $50,500 0.38%
Lantern Energy 3 $31,417 0.24%
Link Mechanical Services, Inc. 3 $29,157 0.22%
M&G Plumbing and Heating 1 $6,550 0.05%
M. Wallenta 2 $23,200 0.18%
Made in USA Solar LLC 3 $71,000 0.54%
Mainline Heating and Supply 1 $15,648 0.12%
Master Mechanical LLC 1 $7,227 0.05%
MDK 7 $60,706 0.46%
Michael White 1 $13,000 0.10%
Miller Plumbing and Heating 1 $11,000 0.08%
Modern Heating & AC 1 $6,257 0.05%
MTL Heating and Cooling LLC 2 $16,400 0.12%
Nero A/C, Heating & Refrigeration, Inc. 3 $34,199 0.26%
New England Conservation Services, LLC 1 $40,000 0.30%
NP Brulotte & Sons 1 $20,045 0.15%
Nutmeg Mechanical Services, Inc. 5 $110,805 0.84%
One Hour 2 $10,500 0.08%
One Source Solar 1 $40,000 0.30%
Peoples Products 1 $19,267 0.15%
Peter Tavino, PE, PC 1 $30,000 0.23%
Precision Mechanical 2 $12,444 0.09%
PurePoint Energy, LLC 2 $61,821 0.47%
R&W Heating Energy Solutions LLC 65 $732,715 5.53%
Real Goods Solar, Inc 4 $115,940 0.87%
Renewal by Andersen of Southern New England 1 $25,000 0.19%
Riley’s Heating Service Inc. 15 $141,020 1.06%
Ross Solar Group 51 $1,257,530 9.49%
Ryan Oil Company Inc. 1 $12,600 0.10%
Santa Energy 5 $59,575 0.45%
Schede Plumbing & Heating 1 $14,850 0.11%
Scotland Heating & A/C 1 $8,000 0.06%
Secondino Mechanical Services 2 $37,500 0.28%
Shippee Solar and Construction LLC 10 $316,824 2.39%
Silver City Furnace 1 $22,275 0.17%
SLS Heating 1 $8,600 0.06%
Solv It Now 1 $27,710 0.21%
Sonic Development Inc. 1 $30,000 0.23%
Stafford Mechanical Services, Inc. 1 $9,450 0.07%
Stan Pollack Building & Remodeling 1 $25,000 0.19%
Steve Basso Plumbing Heating & A/C LLC 1 $7,345 0.06%
Strohmaier Builders 1 $40,000 0.30%
Summer Hill Solar 7 $83,602 0.63%
Sunlight Solar Energy, Inc. 5 $96,350 0.73%
Super Green Solutions 1 $30,000 0.23%

CONNECTICUT GREEN BANK
4. MARKET TRANSFORMATION
FINANCIAL WAREHOUSE AND CREDIT ENHANCEMENT STRUCTURES
CASE OF THE SMART-E LOAN
142
Contractor
# of
Loans $ of Loans
% of
Loans
Superior Fuel 2 $24,208 0.18%
The Heat People 3 $30,989 0.23%
The Roofing Store, LLC 1 $40,000 0.30%
Tom Buehler Plumbing & Heating 2 $14,920 0.11%
Tomax Heating and Cooling 2 $16,615 0.13%
Total Energy Solutions 3 $59,718 0.45%
Total Mechanical Systems LLC 2 $16,129 0.12%
Tri-City 2 $23,753 0.18%
Tyler Air 1 $6,054 0.05%
Uplands Construction Group LLC 1 $25,000 0.19%
Viglione Heating & Cooling Inc. 8 $75,437 0.57%
Waldo Renewable Electric, LLC 3 $76,859 0.58%
Wesson Energy, Inc. 6 $90,559 0.68%
West Hartford Windows LLC 1 $5,500 0.04%
Westville Crest Plumbing and Heating, Inc. 1 $9,100 0.07%
Wilcox Fuel, Inc. 1 $5,005 0.04%
William Perotti & Sons, Inc. 1 $16,007 0.12%
Yankee Gas 1 $8,000 0.06%
Unknown 79 $1,353,742 10.21%
Total 737 $13,254,375 100.00%
Table 53. Lenders and the Smart-E Loan
Lender
# of
Loans $ of Loans % of Loans
CorePlus Federal Credit Union 183 $ 2,511,003 18.94%
Eastern Savings Bank 182 $ 4,527,516 34.16%
First National Bank of Suffield 38 $ 812,860 6.13%
Ion Bank 40 $ 488,138 3.68%
Liberty Bank 29 $ 380,814 2.87%
Mutual Security Credit Union 10 $ 224,769 1.70%
Nutmeg State Financial Credit Union 157 $ 2,832,971 21.37%
Patriot Bank 41 $ 533,664 4.03%
Quinnipiac Bank & Trust 7 $ 84,056 0.63%
Thomaston Savings Bank 16 $ 238,644 1.80%
Union Savings Bank 23 $ 413,460 3.12%
Workers Federal Credit Union 11 $ 206,481 1.56%
Total 737 $ 13,254,375 100.00%

CONNECTICUT GREEN BANK
4. MARKET TRANSFORMATION
FINANCIAL WAREHOUSE AND CREDIT ENHANCEMENT STRUCTURES
CASE OF THE LOW INCOME SOLAR LEASE AND ENERGY EFFICIENCY
ENERGY SAVINGS AGREEMENT (ESA)
143
For the Connecticut Green Bank’s residential solar PV low-income lease program, we are applying
the Program Logic Model that focuses on financing and credit enhancements (see Figure 11).
Figure 11. Program Logic Model for the Low Income Solar Lease
Financing Program
The Connecticut Green Bank offers a solar PV lease product directly targeted to the low-to-
moderate income (LMI) population of the state through the solar developer PosiGen. The product
was developed in partnership with PosiGen, a senior lender (Enhanced Capital) and a tax equity
investor (U.S. Bank). Connecticut Green Bank supplied the initial senior debt of $5,000,000
which has been subordinated to an additional $5,000,000 lent to the lease fund by Enhanced
Capital to provide $20 million in lease financing for low income residents’ solar projects. This
fund is committed to growing in size with Connecticut Green Bank poised to lend an additional
$5 million once the fund raises an additional $5 million in private capital. The RSIP program’s
performance based incentive (PBI) is targeted toward the LMI population and provides a
significantly higher incentive to customers demonstrating these income requirements.
Through the product, the Connecticut Green Bank lowers the barriers to Connecticut low-income
residential customers seeking to install solar PV with no up-front investment. This increases
demand, while at the same time reducing the market’s reliance on subsidies through the RSIP. As
a lease, capital provided to consumers through the PosiGen solar PV lease and energy efficiency
ESA is returned to the Connecticut Green Bank, the tax equity investor and the lenders. This is in
contrast to traditional subsidies targeted to LMI homeowners, which are effectively grants.

CONNECTICUT GREEN BANK
4. MARKET TRANSFORMATION
FINANCIAL WAREHOUSE AND CREDIT ENHANCEMENT STRUCTURES
CASE OF THE LOW INCOME SOLAR LEASE AND ENERGY EFFICIENCY
ENERGY SAVINGS AGREEMENT (ESA)
144
The financial structure of the Low Income Solar Lease product includes origination,59 servicing,60
and financing features in combination with the support of the Connecticut Green Bank (see Figure
12).
Figure 12. Legal Structure and Flows of Capital for the Low Income Solar Lease
Connecticut represented the first expansion for PosiGen outside of its initial market in Louisiana,
where starting in 2011, it paired solar leasing and energy efficiency services to maximize savings
for low and moderate income customers. Given the strategic emphasis the Green Bank has placed
on driving investment for lower income homeowners, the organization developed a flexible
funding structure to rapidly bring PosiGen to market. The concept started with the Green Bank
being “anchor capital” for PosiGen together with PosiGen’s own resources along with tax equity
from U.S. Bank (U.S. Bank was already an investor in the Connecticut market through the Green
Bank’s Connecticut Solar Lease). Documentation was structured to ultimately facilitate funding
by a senior lender, providing for the subordination of the Green Bank’s loans once this senior
lender could be secured. The Green Bank also integrated a working capital module within the
financing arrangements to enable PosiGen to focus its capital resources on expanding to
Connecticut. With initial capital requirements underwritten by the Green Bank, PosiGen had the
financial backing and capital flexibility it needed to confidently secure its base of operation in
Bridgeport, hire management and local staff, pursue local partnerships with existing energy
efficiency and solar PV contractors, and to resolve supply chain issues. By using its balance sheet
as anchor capital, the Green Bank made it possible for a developer that had proven its business
model in another market to bring its innovative approach to Connecticut to build investment in
solar and energy efficiency for homeowners of more modest means. The investment had the
intended impact: PosiGen was able to establish operations, get a market started and its rapid
success in Connecticut enabled the Green Bank and PosiGen to secure a senior lender and a new
source of tax equity to enable operations to expand to several cities throughout Connecticut.
59 Sungage Financial in partnership with local contractors 60 Concord Servicing Corporation

CONNECTICUT GREEN BANK
4. MARKET TRANSFORMATION
FINANCIAL WAREHOUSE AND CREDIT ENHANCEMENT STRUCTURES
CASE OF THE LOW INCOME SOLAR LEASE AND ENERGY EFFICIENCY
ENERGY SAVINGS AGREEMENT (ESA)
145
The Low Income Solar Lease provided financing for 333 projects totaling $9.8 million61 of
investment and 2,199 kW of residential solar PV deployment (see Table 54). To date, there have
been no delinquencies and no defaults.
Table 54. Low Income Solar Lease
Year
Total #
of
Projects Investment62
Installed
Capacity
(kW)
2016 333 $9,843,865 2,199.1
Total63 333 $9,843,865 2,199.1
Of the low income households that installed solar PV, over 65% of them also participated in the
energy efficiency ESA, resulting in more comprehensive energy efficiency measures being
included in the project.
Marketing Programs
To build the pipeline of projects for the lease, Connecticut Green Bank supports PosiGen’s
marketing campaigns, leveraging the institution’s local experience. This includes assisting with
PosiGen’s outreach efforts through its Solar for All campaigns which are modeled after Solarize
campaigns.
61 Fair Market Value of systems installed 62 Fair Market Value of systems installed 63 Includes approved, closed and completed projects.

CONNECTICUT GREEN BANK
4. MARKET TRANSFORMATION
FINANCIAL WAREHOUSE AND CREDIT ENHANCEMENT STRUCTURES
CASE OF THE COMMERCIAL PROPERTY ASSESSED CLEAN ENERGY (C-PACE)
146
As the Connecticut Green Bank’s commercial and industrial financing program, we are applying
the Program Logic Model that focuses on financing and credit enhancements (see Figure 13).
Figure 13. Program Logic Model for the C-PACE Program
Financing Program
Commercial Property Assessed Clean Energy (C-PACE) is a structure through which commercial
property owners can finance energy efficiency and renewable energy improvements through
financing secured by a voluntary benefit assessment on their property and repaid via the property
tax bill. A tax lien, or benefit assessment, is placed on the improved property as security for the
loan, and the Connecticut Green Bank requires lender consent from existing mortgage holders
prior to approving a C-PACE project. It should be noted, that to date 32 unique banks and 5
specialized lending institutions have provided lender consent to over 70 projects – demonstrating
that existing mortgage holders see C-PACE as adding value to the property and net income to the
business occupying the building as a result of lower energy prices.
The Connecticut Green Bank maintains a $40 million warehouse of capital from which it finances
C-PACE transactions and sells to capital markets upon completion (see Figure 14). Through the
warehouse, funds are advanced to either the customer or contractor during construction based on
the project meeting certain deliverables. Once the project is completed, the construction advances
convert to long term financing whereby the property owner pays a benefit assessment over time to
the municipality at the same time other property taxes are paid on the property. The Connecticut
Green Bank aggregates the benefit assessment liens which are then sold to interested capital
providers. As the benefit assessment payments are made by the property owners, they are then
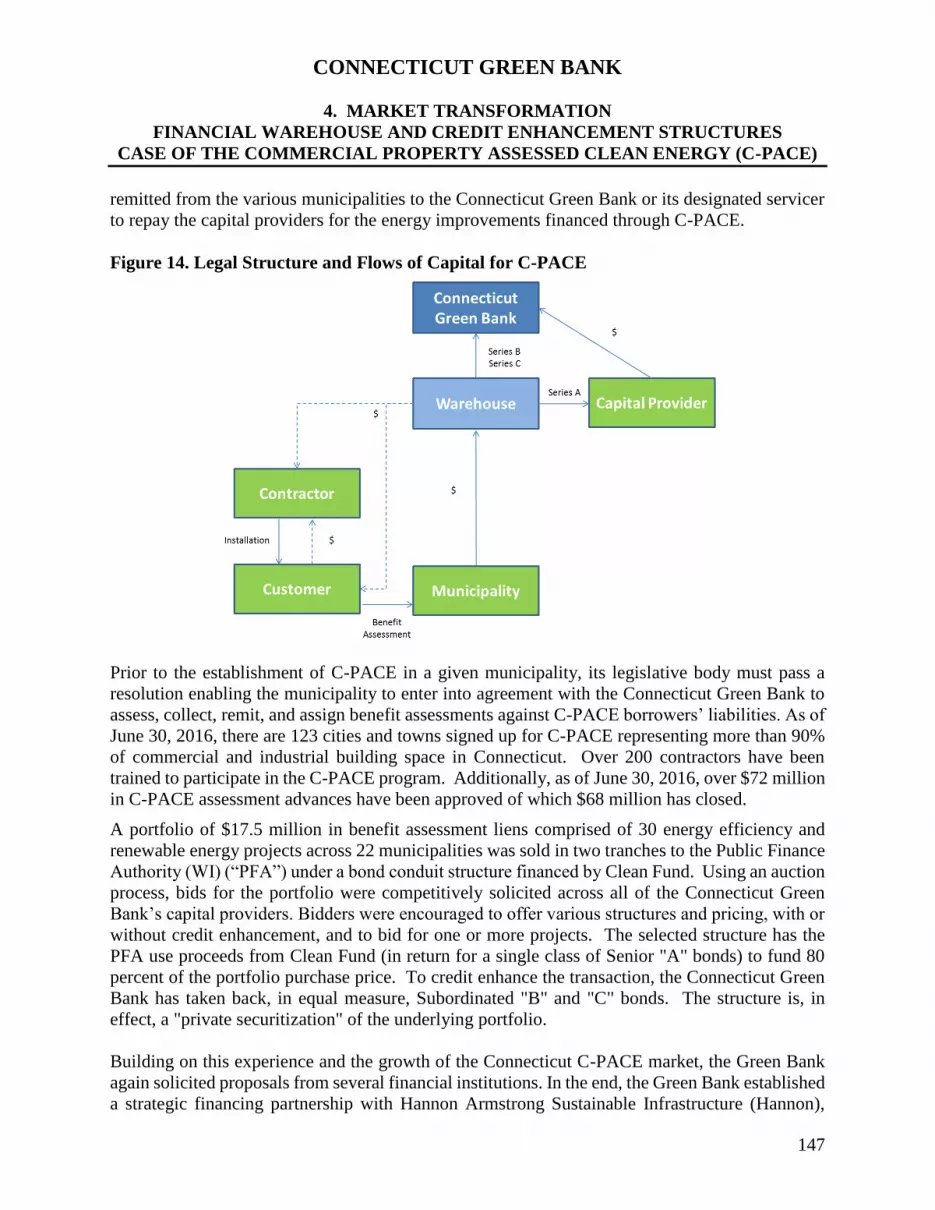
CONNECTICUT GREEN BANK
4. MARKET TRANSFORMATION
FINANCIAL WAREHOUSE AND CREDIT ENHANCEMENT STRUCTURES
CASE OF THE COMMERCIAL PROPERTY ASSESSED CLEAN ENERGY (C-PACE)
147
remitted from the various municipalities to the Connecticut Green Bank or its designated servicer
to repay the capital providers for the energy improvements financed through C-PACE.
Figure 14. Legal Structure and Flows of Capital for C-PACE
Prior to the establishment of C-PACE in a given municipality, its legislative body must pass a
resolution enabling the municipality to enter into agreement with the Connecticut Green Bank to
assess, collect, remit, and assign benefit assessments against C-PACE borrowers’ liabilities. As of
June 30, 2016, there are 123 cities and towns signed up for C-PACE representing more than 90%
of commercial and industrial building space in Connecticut. Over 200 contractors have been
trained to participate in the C-PACE program. Additionally, as of June 30, 2016, over $72 million
in C-PACE assessment advances have been approved of which $68 million has closed.
A portfolio of $17.5 million in benefit assessment liens comprised of 30 energy efficiency and
renewable energy projects across 22 municipalities was sold in two tranches to the Public Finance
Authority (WI) (“PFA”) under a bond conduit structure financed by Clean Fund. Using an auction
process, bids for the portfolio were competitively solicited across all of the Connecticut Green
Bank’s capital providers. Bidders were encouraged to offer various structures and pricing, with or
without credit enhancement, and to bid for one or more projects. The selected structure has the
PFA use proceeds from Clean Fund (in return for a single class of Senior "A" bonds) to fund 80
percent of the portfolio purchase price. To credit enhance the transaction, the Connecticut Green
Bank has taken back, in equal measure, Subordinated "B" and "C" bonds. The structure is, in
effect, a "private securitization" of the underlying portfolio.
Building on this experience and the growth of the Connecticut C-PACE market, the Green Bank
again solicited proposals from several financial institutions. In the end, the Green Bank established
a strategic financing partnership with Hannon Armstrong Sustainable Infrastructure (Hannon),

CONNECTICUT GREEN BANK
4. MARKET TRANSFORMATION
FINANCIAL WAREHOUSE AND CREDIT ENHANCEMENT STRUCTURES
CASE OF THE COMMERCIAL PROPERTY ASSESSED CLEAN ENERGY (C-PACE)
148
publicly listed on the NYSE. The Green Bank and Hannon structure uses a special purpose entity
(SPE) established by Hannon specifically for the Green Bank C-PACE portfolio. The SPE
purchases the benefit assessment liens in tranches that are financed from between 80% and 90%
by Hannon up to a maximum of $100 million with the residual capital provided by the Green Bank.
Data Accessibility
114 customers accessed the C-PACE since its launch in 2013 – see Tables 55 and 56.
Table 55. CPACE Metrics
Year
#
EE
#
RE
#
RE/EE
Total #
of
Projects Investment
Installed
Capacity
(kW)
Annual
Saved/Produced
(MMBtu)
2013 1 - 1 2 $943,952 101.0 1,362
2014 7 14 3 24 $20,429,943 3,416.0 36,923
2015 11 30 10 51 $29,452,897 6,925.3 41,363
2016 7 21 9 37 $21,628,858 5,272.7 32,476
Total64 26 65 23 114 $72,455,651 15,715.0 112,123
Table 56. Types of End-Use Customers Participating in C-PACE
End-Use
# of
Properties
(#)
Annual
Savings/Production
(MMBtu)
Square
Footage
(ft2)
C-PACE
Investment
($)
Industrial 33 37,667 1,464,131 $22,803,305
Multi-family/apartment
(> 5 units) 5 4,680 218,044 $3,184,523
Non-profit 11 4,559 319,269 $3,127,755
Office 20 39,771 1,577,251 $21,067,720
Public assembly 2 748 40,000 $642,194
Retail 36 22,300 975,603 $19,200,221
Warehouse & storage 6 2,275 136,420 $2,393,904
Other 1 123 5,804 $36,029
Total 114 112,123 4,736,522 $72,455,651
To date, there have been 3 delinquencies totaling $4,986,119 or 6.9% of the portfolio and no
defaults.
Of the 114 C-PACE projects, the following is a breakdown of projects by municipality – see Table
57.
64 Includes approved, closed and completed projects.

CONNECTICUT GREEN BANK
4. MARKET TRANSFORMATION
FINANCIAL WAREHOUSE AND CREDIT ENHANCEMENT STRUCTURES
CASE OF THE COMMERCIAL PROPERTY ASSESSED CLEAN ENERGY (C-PACE)
149
Table 57. Cities and Towns Supporting C-PACE Projects
Municipality
# of
Properties
(#)
Annual
Savings/Production
(MMBtu)
Square Footage
(ft2) C-PACE
Investment
($)
Ansonia 1 411 38,896 $205,652
Avon 2 2,649 89,764 $1,059,417
Bloomfield 1 3,227 0 $3,234,075
Bridgeport 14 13,912 693,713 $6,684,513
Bristol 4 2,311 90,951 $2,579,989
Brookfield 1 -93 36,772 $1,164,790
Canaan 1 406 16,200 $425,527
Canton 1 176 15,000 $154,507
Clinton 1 623 0 $624,260
Cromwell 1 4,084 109,032 $2,114,163
Danbury 1 847 19,640 $87,938
Deep River 1 123 5,804 $36,029
East Haddam 2 694 41,450 $732,597
East Lyme 2 192 16,225 $147,185
East Windsor 3 1,904 94,000 $1,693,944
Ellington 1 764 25,760 $502,504
Enfield 1 1,105 57,000 $881,993
Fairfield 2 658 11,700 $673,360
Glastonbury 2 760 49,000 $676,037
Groton 2 5,133 48,500 $921,682
Hartford 9 5,159 363,604 $2,832,671
Killingly 1 171 0 $153,258
Killingworth 1 257 20,000 $261,649
Manchester 4 5,260 97,104 $5,055,353
Meriden 2 6,800 470,000 $3,306,233
Middletown 2 5,256 146,368 $4,100,595
Naugatuck 1 48 53,158 $541,582
New Britain 1 4,113 150,000 $2,842,049
New Haven 1 1,343 28,000 $836,128
New London 6 2,519 258,369 $2,296,519
Newington 1 562 53,200 $794,873
Newtown 2 4,465 202,814 $2,973,807
North Stonington 1 439 30,000 $344,252
Norwalk 1 661 10,000 $559,952
Norwich 1 545 50,000 $366,586
Plainville 4 3,989 236,000 $2,695,236
Putnam 1 9,218 125,000 $2,350,000
Shelton 1 637 37,600 $271,147
Simsbury 1 824 42,456 $685,316
Somers 1 691 48,360 $997,269
South Windsor 1 135 0 $135,200
Southington 2 534 24,325 $457,792
Stamford 5 4,489 258,900 $1,602,497
Stonington 1 230 16,400 $230,636
Stratford 2 897 48,000 $549,244
Torrington 1 116 19,000 $132,325

CONNECTICUT GREEN BANK
4. MARKET TRANSFORMATION
FINANCIAL WAREHOUSE AND CREDIT ENHANCEMENT STRUCTURES
CASE OF THE COMMERCIAL PROPERTY ASSESSED CLEAN ENERGY (C-PACE)
150
Municipality
# of
Properties
(#)
Annual
Savings/Production
(MMBtu)
Square Footage
(ft2) C-PACE
Investment
($)
Trumbull 1 1,066 100,000 $1,012,004
Vernon 1 787 30,044 $519,890
Waterbury 3 1,569 45,953 $1,969,966
Watertown 2 1,010 34,756 $604,107
West Haven 1 267 13,000 $243,296
Westport 2 590 22,700 $265,353
Willington 1 50 10,432 $55,421
Windsor 2 3,855 197,572 $2,175,617
Windsor Locks 1 392 34,000 $336,703
Woodbridge 2 3,294 0 $3,300,960
Total 114 112,123 4,736,522 $72,455,651
Of the C-PACE approved and closed projects, the following table is a breakdown of the contractors
offering the financing product – see Table 58.
Table 58. C-PACE Contractors
Contractor
# of C-PACE
Transactions
$ of C-PACE
Transactions
% of C-PACE
Transactions
3x Solution Inc 1 $1,164,790 1.61%
64 Solar 3 $949,536 1.31%
Action Air Systems Inc. 1 $179,980 0.25%
American Solar 4 $1,554,554 2.15%
Antonio LLC 1 $20,500 0.03%
BeFree Green Energy, LLC 1 $232,714 0.32%
C&N Mechanical 1 $30,434 0.04%
Chabot Electric 1 $234,202 0.32%
Conserv-Inc 1 $559,952 0.77%
Controlled Air 1 $137,368 0.19%
C-TEC Solar LLC 2 $7,306,975 10.08%
Davis Hill 1 $652,860 0.90%
Deutsche Eco USA Corp. 2 $3,300,960 4.56%
Direct Energy 2 $633,103 0.87%
Earthlight Technologies 6 $1,749,571 2.41%
ECNY 1 $243,296 0.34%
Efficient Lighting and Maintenance, Inc. 1 $30,620 0.04%
Efficient Lighting Consultants 1 $541,582 0.75%
Emcor Services 3 $2,973,427 4.10%
Encon, Inc. 6 $2,091,775 2.89%
Energy Solutions Inc. 1 $52,654 0.07%
Entersolar 1 $1,116,629 1.54%
Environmental Systems Corp 1 $107,556 0.15%
ESI Power Corp 3 $905,109 1.25%
Fortunato Construction Group, Inc. 1 $741,702 1.02%
GM Industries, Inc. 2 $506,321 0.70%
Green Earth Energy 29 $19,016,112 26.25%
H. Hulse, Inc. 1 $166,236 0.23%
Harness the Sun 1 $201,072 0.28%

CONNECTICUT GREEN BANK
4. MARKET TRANSFORMATION
FINANCIAL WAREHOUSE AND CREDIT ENHANCEMENT STRUCTURES
CASE OF THE COMMERCIAL PROPERTY ASSESSED CLEAN ENERGY (C-PACE)
151
Contractor
# of C-PACE
Transactions
$ of C-PACE
Transactions
% of C-PACE
Transactions
High Performance Energy Solutions 1 $87,938 0.12%
Inovateus 1 $2,842,049 3.92%
JD Solar Solutions, LLC 2 $370,396 0.51%
JK Energy Solutions 3 $3,405,337 4.70%
Johnson Control 1 $558,716 0.77%
Kurt Kuegler 1 $120,109 0.17%
Lockheed Martin 1 $2,974,349 4.11%
M.J. Fahy & Sons 1 $36,350 0.05%
MSL Group 4 $2,805,767 3.87%
NORESCO 2 $2,274,881 3.14%
Northeast Smart Energy LLC 3 $589,453 0.81%
Nxegen 1 $331,884 0.46%
Oatley Mechanical Services, Inc. 1 $271,147 0.37%
Reliable Combustion Services LLC 1 $384,000 0.53%
Renewable Resources, Inc. 1 $239,883 0.33%
Ross Solar Group 2 $840,889 1.16%
Sarracco Mechanical 1 $218,814 0.30%
Seldera LLC 1 $836,128 1.15%
Smart Energy Services 1 $418,540 0.58%
Sound Solar Systems, LLC 1 $261,649 0.36%
Trane 4 $5,185,781 7.16%
Total 114 $72,455,651 100.00%

1

Agenda:
Engagement Scope and Reporting
Financial Highlights
Required Auditors’ Communications
2

Engagement Scope and Reporting
The audit was performed under the following standards:
Auditing Standards Generally Accepted in the United States of
America (GAAS).
The standards applicable to financial audits contained in
Government Auditing Standards, issued by the Comptroller
General of the United States (GAGAS).
3

Engagement Scope and Reporting (continued)
Reporting Results in the Financial Statements:
Reporting under GAAS:
▪ Unmodified audit opinion.
Reporting under GAGAS:
▪ Reporting on Internal Control and Compliance at the Financial Statement
Level
Under Internal Control
▪ No Material Weakness were identified.
Under Compliance
▪ No instances of noncompliance were identified.
4

Financial Highlights – Statement of Net Assets (in thousands)
5
Increase
2016 2015 (Decrease)
Cash and cash equivalents $ 57,822 $ 48,693 $ 9,129
Bonds receivable 3,492 1,600 1,892
Portfolio investments 1,000 1,000 --
Solar lease notes 9,008 9,819 (811)
Program loans 33,268 40,518 (7,250)
Capital assets, net 57,864 26,971 30,893
Other assets 14,124 8,972 5,152
Total Assets 176,578 137,573 39,005
Deferred Outflows of Resources
Deferred amount for pensions 2,573 1,669 904
Total Deferred Outflows of Resources 2,573 1,669 904

Financial Highlights – Statement of Net Assets (in thousands)
6
Increase
2016 2015 (Decrease)
Current liabilities 6,612 6,825 (213)
Unearned revenue 6,258 2,519 3,739
Pension liabilities 16,096 14,900 1,196
Other long term liabilities 2,528 1,093 1,435
Long term debt, less current maturities 18,648 3,546 15,102
Total Liabilities 50,142 28,883 21,259
Deferred Inflows of Resources
Fair value of interest rate swap 1,628 660 968
Deferred amount for pensions (3) 532 (535)
Total Deferred Outflows of Resources 1,625 1,192 433
Invested in capital assets 57,864 26,971 30,893
Restricted Net Position:
Non-expendable 1 1 --
Restricted - energy programs 9,750 8,799 951
Unrestricted 59,769 73,396 (13,627)
Total Net Position $ 127,384 $ 109,167 $ 18,217

Financial Highlights2016 Financial Analysis
Total assets of the Green Bank increased $39MM during 2016, due
principally to an increase in Capital Assets associated with the acquisition
of solar equipment by CT Solar Lease 2, LLC.
Total liabilities increased $21.2MM due to Line of Credit Draw Downs
associated with CT Solar Lease 2, LLC activity.
Deferred inflows associated with the Fair Value of the Green Bank’s interest
rate swap increased $968 thousand which reflects the decline in the fair
market value of the swap.
7

Financial Highlights – Statement of Changes in Net Assets (in thousands)
8
Increase
2016 2015 (Decrease)
Revenues $ 37,788 $ 46,294 $ (8,506)
Operating Expenses
Grants and programs 27,228 22,131 5,097
General and administrative expense 4,630 3,117 1,513
Total Operating Expenses 31,858 25,248 6,610
Operating Income 5,930 21,046 (15,116)
Non-Operating Revenues (Expenses)
Interest earned 3,017 2,312 705
Interest expense (731) (119) (612)
Investment loss (3) (1,180) 1,177
Unrealized loss on interest rate swap (968) (660) (308)
Provision for loan losses (1,022) (564) (458)
Capital contribution 12,294 6,844 5,450
Distribution to member (301) (105) (196)
Payments to State of Connecticut -- (19,200) 19,200
Net Change $ 18,216 $ 8,374 $ 9,842

Financial Highlights2016 Operating Activity
The Green Bank had operating revenues of approximately $37.7MM for the year ended June 30, 2016 which was a decrease form the prior year of approximately $8.5MM. This was mainly due to a decrease in a decrease in Regional Greenhouse Gas Initiative (RGGI) auction proceeds received.
Total operating expenses increased approximately $6.6MM during 2016, due principally to increases in grant and program expense increases associated with financial incentives to residential and commercial property owners to install renewable energy or energy efficiency measures.
Net Non-Operating Revenues (Expenses) were $18.2MM. This was mostly attributable to capital contributions of $12.3MM received from Firstar Development.
9

Management Responsibilities and Required Auditors’ Communications
Management Responsibilities
Establishing and maintaining effective internal controls over financial reporting
and compliance.
Selection and application of accounting principals.
For the preparation of and fair presentation of the financial statements and all
accompanying information in conformity with U.S. generally accepted accounting
principals.
Making all financial records and related information available to the external
auditors.
10

Management Responsibilities and Required Auditors’ Communications
Management Responsibilities (continued)
Providing access to the external auditors to all information which they are aware
that is relevant to the preparation of the financial statements and any additional
information the auditor may request for the purpose of the audit.
For the design and implementation of programs and controls to prevent fraud and
form informing the auditors about all known or suspected fraud affecting the
entity.
For the preparation of the supplementary information the auditors have been
engaged to report on.
Establishing and maintaining a process for tracking the status of audit findings
and recommendations.
11

Managements Responsibilities and Required Auditors’ Communications
Required communications to those charged with governance (Audit
Committee/Board of Directors):
Auditor Responsibility under generally accepted auditing standards.
Planned Scope & Timing of the Audit.
Significant Findings from the Audit including the auditors views about findings or
issues that the auditor considers to be significant and relevant to those charged
with governance regarding their oversight of the financial reporting process.
Corrected and Uncorrected Misstatements to the financial statements.
12

Contact Information
Ronald W. Nossek, CPA – Engagement Partner
(401) 330-2743
Jessica Aniskoff, CPA – Engagement Manager
(860) 570-6451
13

NOTES:
______________________________________________________________
______________________________________________________________
______________________________________________________________
______________________________________________________________
______________________________________________________________
______________________________________________________________
______________________________________________________________
______________________________________________________________
______________________________________________________________
______________________________________________________________
______________________________________________________________
______________________________________________________________
______________________________________________________________
______________________________________________________________
14

Concepts for 2017 Regular Legislative Session, with Green Bank status.
Policy Description Green Bank Role
Defense Defend our funding sources and potential cash sweeps Lead – Number one legislative priority
R-PACE
Full policy, CGB administration Lead
C-PACE
Technical tweak Lead
Local manufacturing incentive
Remove an unused residential solar “kicker” incentive, and possibly replace with incentive for local labor. US-India trade dispute says an existing 5% kicker may be against WTO obligations.
Lead
Accessing low-cost federal capital
Open our enabling statute to allow us to match USDA loan guarantee definitions for “eligible borrowers”
Lead, seek support of DEEP and also utilities and EEB. Necessity of this legislative change TBD.
Data Coordination Standardized definition for census tract data sources and “distressed communities” between CGB and EDCs. For statutory DEEP reporting in 16-245ee.
Defer to DEEP to lead. CGB support.
Lead By Example Performance contracting on state buildings has the potential to count against either the spending cap or bonding cap (or both).
Defer to DEEP to lead, with Treasurer’s Office. CGB support.
Anaerobic digester pilot expansion
Others might propose more AD activity No – likelier to be either be DEEP or third party proposal if we see it
Renewable Thermal Technologies
Policies that might flow from a 2016 draft Comprehensive Energy Strategy
Support DEEP’s lead
Electric Vehicles Policies that might flow from a 2016 draft Comprehensive Energy Strategy
Support DEEP’s lead
Grid 2.0 catch-all Policies that might flow from a 2016 draft Comprehensive Energy Strategy
Support DEEP’s lead
Rate Design
Fixed/variable charge type of debate Advocates lead – potential CGB support

Memo
To: Nandika Prakash
From: Bryan Garcia
CC: Commissioner Catherine Smith, Chairwoman; Eric Shrago, Director of Operations; Lucy
Charpentier, Manager of Evaluation, Measurement, and Verification
Date: September 13, 2016
Re: Request for Review and Approval – Clean Energy Jobs in Connecticut Study and
Calculator and Evaluation Framework for Societal Perspective for Economic Development Draft Fact Sheet
As you are aware, the Connecticut Green Bank (“Green Bank”), in conjunction with the
Department of Economic and Community Development (“DECD”), engaged Navigant
Consulting to conduct a study with regard to the economic impact (i.e., estimate of direct,
indirect and induced job-years created) from the investment in clean energy deployment in
Connecticut. We appreciate your guidance and assistance throughout that process.
Through its evaluation efforts in general, and specially its “Evaluation Framework: Assessing,
Monitoring, and Reporting of Program Impacts and Processes,” the Green Bank has
assembled the following materials for your review and approval:
Clean Energy Jobs in Connecticut – Final Report by Navigant Consulting (August 10,
2016);
Clean Energy Jobs in Connecticut – Final Calculator by Navigant Consulting (August
10, 2016); and
Evaluation Framework: Societal Perspective (Economic Development) – Draft Fact
Sheet by the Green Bank
If you could review the attached materials and provide an official DECD approval response of
these materials by Friday, October 7, 2016, we would appreciate it. We have provided a link
to a similar response from Michael Lettieri from the DECD of December 16, 2013 as an
example – click here.
We will then provide all of these jointly produced materials to the Board of Directors of the
Green Bank for their review and approval at the October 21, 2016 meeting.
Thank you Nandika for your continuous support.

About the Connecticut Green BankThe Connecticut Green Bank was established by the Connecticut General Assembly on July 1, 2011 as a part of Public Act 11-80. As the nation’s first full-scale green bank, it is leading the clean energy finance movement by leveraging public and private funds to scale-up renewable energy deployment and energy efficiency projects across Connecticut. The Green Bank’s success in accelerating private investment in clean energy is helping Connecticut create jobs, increase economic prosperity, promote energy security and address climate change. For more information about the Connecticut Green Bank, please visit www.ctgreenbank.com
About the Department of Economic and Community Development
The Department of Economic and Community Development is the state’s lead agency responsible for strengthening Connecticut’s competitive position in the rapidly changing knowledge-based global economy. The department administers the Manufacturing Innovation Fund that was created to support and strengthen Connecticut’s manufacturing sector. For more information about the Department of Economic and Community Development, please visit www.decd.org
EVALUATION FRAMEWORK SOCIETAL PERSPECTIVE
One of the indicators that the Connecticut Green Bank will be tracking in its programs and overall portfolio is the extent to which investments in clean energy create value from a societal perspective as it relates to the economic development of the state1. For the Green Bank programs this will be measured as the relationship between investments and associated direct and indirect jobs created. In 2009, and updated in 2010, Navigant Consulting prepared a Connecticut Renewable Energy and Energy Efficiency Economy Baseline Study2, which included a focus on the investments in those energy sectors and the resulting job creation. Since that report was prepared, the availability of new clean energy technologies that have emerged (e.g., DER resources, EVs, electric charging stations, etc.), and a variety of related economic factors (e.g., costs of labor, cost of resource acquisition, etc.) have changed. In coordination with the Connecticut Department of Economic and Community Development (DECD) and with assistance from Eversource Energy
and United Illuminating, The Connecticut Green Bank contracted Navigant Consulting to refresh the investment-jobs portion of its earlier study by providing an updated calculator tool to estimate the economic development benefits from clean energy investments in Connecticut, as reflected in job-years created. The updated study focused on jobs associated with the investment area of the Connecticut Green Bank: renewable energy (RE) and energy efficiency (EE) project development and deployment, and product development and manufacturing. The final value output in the jobs calculator is job-years created per $1 million invested in clean energy projects in Connecticut.
The Connecticut Green Bank, through its Evaluation Framework, and specifically its Societal Perspective metrics, will use the findings of this study to estimate, analyze, and report on the economic development benefits of the investment activity in clean energy deployment in Connecticut that it is an integral part of.
Economic Development Overview
continued >
Results of RE/EE job-years created to investment analysis Below is a summary of the results of the analysis of direct, indirect, and induced job-years created by each million-dollar investment in clean energy deployment in Connecticut:
~ 5 job-years for storage tech installers ~ 9 job-years for residential solar installers ~ 14 job-years for commercial EE installers
~ 7 job-years for EV charging installers ~ 11 job-years for fuel cell manufacturers ~ 15 job-years for RTT installers
~ 7 job-years for commercial solar installers ~ 14 job-years for wind project installers ~ 18 job-years for residential EE installers

Occupation
Solar PV Installation – Residential
Capital Invested
Company Overhead
and Margin
Project Cost after Overhead
and Margin
Labor (% of project
cost)
Non-labor Costs (% of project
costs)
A B C=Ax(1-B) D E=100%-D
$1,000,000 20% $800,000 35% 65%
Weighted Average Wage
Fully BurdenedEmployee Cost
Job-years Created per
Million Dollars Invested
Indirect andInduced Job
Multiplier
Indirect andInduced JobsCreated from
Capital Invested
Total Job YearsCreated from
Capital Invested
F G=Fx1.3 H=Cx(D/G) I J=HxI K=H+J
$55,000 $71,500 3.9 1.3 5.1 9.0
Key Findings Renewable Energy: Employment in the solar industry has grown by approximately 30% since 2010 to become the largest RE industry for jobs in Connecticut.
• The majority of RE jobs are split between the solar and fuel cell industries, with other RE technologies making up the remaining 6% of RE industry jobs
• Installation and engineering jobs account for the largest job type at solar companies
• Manufacturing and engineering jobs account for the largest job types at fuel cell companies
• The majority of solar employees in Connecticut focus on the residential market
Energy Efficiency: Overall employment has remained relatively constant, experiencing most job growth in the residential customer market.
• EE technologies mainly include lighting, HVAC, and building envelope, with the majority of companies participating in multiple technologies
• Installation jobs account for the majority of roles• Most jobs are focused on residential and C&I customer
markets, with the remaining focused on retail and utility• The average number of employees at C&I companies is
90-120, while it is 10-40 at residential companies
Methodology
1 Calculation of total jobs at top companies: Interviewed top companies, 22 total (40 researched)
• 12 RE companies interviewed, 17 researched, 60% of market
• 10 EE companies interviewed, 17 researched, 30% of market
• Asked each company for current total number of RE/EE jobs in relevant job classifications and sections of the RE/EE value chain
2 Extrapolation to represent the total industry of CT: Determined market share for companies in Connecticut
RE/EE industry
• Calculated for non-interviewed companies
• If interviewed companies had X jobs, representing Y% of the market share, then all jobs = X / Y%
3 Estimated jobs created per $1 Million invested using jobs calculator
This analysis mainly considers direct jobs3 in private companies that employ people who are based in Connecticut. A multiplier for calculating indirect jobs4 and induced jobs5 from the number of direct jobs was provided by DECD for the study.
In the example below, the Connecticut Green Bank would apply the Societal Perspective to report the economic development results in its Comprehensive Annual Financial Report in the following manner: “In FY 2016 there was a total investment of $240 million in Residential Solar PV in Connecticut. Through the Connecticut Green Bank’s support, about 940 direct and 1,220 indirect and induced job-years were created in the state from installing nearly 60 MW of Residential Solar PV.”
1 See Section 7 of Connecticut Green Bank’s Evaluation Framework: Assessing, Monitoring, and Reporting of Program Impacts and Process (July 2016)2 Connecticut Renewable Energy and Energy Efficiency Economy Baseline study, Navigant Consulting, Inc. [Completed in March 2009 and subsequently updated in 2010]3 These are existing jobs in the specified Connecticut industries.4 Represents the response as supplying industries increase output in order to accommodate the initial change in final demand.5 Generated by the spending of households who benefit from the additional wages and business income they earn through direct and indirect activity.
Example of Jobs Calculator: Residential Solar
845 Brook Street, Rocky Hill CT 06067 • 300 Main Street, 4th Floor, Stamford CT 06901
860.563.0015 www.ctgreenbank.com © 2016 CT Green Bank. All Rights Reserved.

©2016 Navigant Consulting, Inc.
77 South Bedford Street, Suite 400
Burlington, MA 01803
Tel: +1.781.270.0101
navigant.com
Disclaimer
This workbook (“workbook”) was prepared for Connecticut Green Bank on terms specifically limiting
the liability of Navigant Consulting, Inc. (Navigant), and is not to be distributed without Navigant’s
prior written consent. Navigant’s conclusions are the results of the exercise of its reasonable
professional judgment. By the reader’s acceptance of this workbook, you hereby agree and
acknowledge that (a) your use of the workbook will be limited solely for internal purpose, (b) you will
not distribute a copy of this workbook to any third party without Navigant’s express prior written
consent, and (c) you are bound by the disclaimers and/or limitations on liability otherwise set forth in
the workbook. Navigant does not make any representations or warranties of any kind with respect to
(i) the accuracy or completeness of the information contained in the workbook, (ii) the presence or
absence of any errors or omissions contained in the workbook, (iii) any work performed by Navigant
in connection with or using the workbook, or (iv) any conclusions reached by Navigant as a result of
the workbook. Any use of or reliance on the workbook, or decisions to be made based on it, are the
reader’s responsibility. Navigant accepts no duty of care or liability of any kind whatsoever to you,
and all parties waive and release Navigant from all claims, liabilities and damages, if any, suffered
as a result of decisions made, or not made, or actions taken, or not taken, based on this workbook.
Clean Energy Jobs in Connecticut
August 10, 2016
Prepared for the Connecticut Green Bank

Occupation
Capital
Invested
Company
Overhead
(SG&A) and
Margin (%)
Project Cost
After
Overhead
(SG&A) and
Margin
Renewable Energy A B C=A*(1-B)
Fuel Cell
Fuel Cell Manufacturing 1,000,000$ 20% 800,000$
Fuel Cell R&D/Engineering 1,000,000$ 20% 800,000$
Solar PV
Solar PV Installation - Residential 1,000,000$ 20% 800,000$
Solar PV Installation - Non-Residential 1,000,000$ 20% 800,000$
Renewable Thermal Technologies
Ductless Split Heat Pump 1,000,000$ 20% 800,000$
Geothermal Installation 1,000,000$ 20% 800,000$
Solar Thermal Installation 1,000,000$ 20% 800,000$
Other
Wind Installation 1,000,000$ 20% 800,000$
Hydro Installation 1,000,000$ 20% 800,000$
EV Charging Stations - Installation 1,000,000$ 20% 800,000$
Storage Installation 1,000,000$ 20% 800,000$
Energy Efficiency A B C=A*(1-B)
Residential (Single and Multi-Family)
Lighting 1,000,000$ 20% 800,000$
Home Energy Solutions (HES) - Audits 1,000,000$ 20% 800,000$
HES - Weatherization & HVAC 1,000,000$ 20% 800,000$
Gas Conversion 1,000,000$ 20% 800,000$
Commercial
Small Business Energy Advantage 1,000,000$ 20% 800,000$
Large Commerical and Industrial 1,000,000$ 20% 800,000$
Calculator Notes:
Company Overhead and Margin (C) is assumed to be 20% and include jobs related to sales, marketing, management and other overhead jobs
Labor (D) is the percent of the project cost that is used to pay installers, electricians, project managers and engineers
Non-Labor (E) is the percent of the project cost that is used to cover all other project expenses, including materials and non-labor soft costs
2016 Analysis: RE/EE Job-Years Created from Public Investments Made by Connecticut Green Bank

Weighted Average Wage (F) is distributed amongst installers, electricians and PM/engineers based on wages in CT as reported by the U.S. Department of Labor as of May 2015
The weight for each job type is based on research and/or interview feedback for employee breakdowns for that field/technology
Total Job-Years Created from Capital Invested (H) is the total number of installer, electrician and PM/engineering jobs created for 1 year
Source: Navigant Consulting, Connecticut Green Bank, DECD.
DECD provided multiplier of 1.3 for burden rate and 1.6 for indirect and induced jobs.

Labor
(% of Project
Cost)
Non-Labor
(% of Project
Cost)
Weighted
Average
Wage
Fully
Burdened
Employee
Cost
Direct Job
Years
Created per
Million
Dollars
Invested
Indirect &
Induced
Jobs
Multiplier
D E=100%-D F G=F*1.3 H=C*(D/G) I
40% 60% 50,000$ 65,000$ 4.9 1.3
40% 60% 85,000$ 110,500$ 2.9 1.3
35% 65% 55,000$ 71,500$ 3.9 1.3
25% 75% 50,000$ 65,000$ 3.1 1.3
60% 40% 55,000$ 71,500$ 6.7 1.3
60% 40% 55,000$ 71,500$ 6.7 1.3
50% 50% 55,000$ 71,500$ 5.6 1.3
60% 40% 60,000$ 78,000$ 6.2 1.3
60% 40% 60,000$ 78,000$ 6.2 1.3
25% 75% 50,000$ 65,000$ 3.1 1.3
20% 80% 55,000$ 71,500$ 2.2 1.3
D E=100%-D F G=F*1.3 H=C*(D/G) I
50% 50% 40,000$ 52,000$ 7.7 1.3
70% 30% 55,000$ 71,500$ 7.8 1.3
50% 50% 55,000$ 71,500$ 5.6 1.3
50% 50% 55,000$ 71,500$ 5.6 1.3
50% 50% 50,000$ 65,000$ 6.2 1.3
50% 50% 55,000$ 71,500$ 5.6 1.3
Company Overhead and Margin (C) is assumed to be 20% and include jobs related to sales, marketing, management and other overhead jobs
Labor (D) is the percent of the project cost that is used to pay installers, electricians, project managers and engineers
Non-Labor (E) is the percent of the project cost that is used to cover all other project expenses, including materials and non-labor soft costs
2016 Analysis: RE/EE Job-Years Created from Public Investments Made by Connecticut Green Bank

Weighted Average Wage (F) is distributed amongst installers, electricians and PM/engineers based on wages in CT as reported by the U.S. Department of Labor as of May 2015
The weight for each job type is based on research and/or interview feedback for employee breakdowns for that field/technology
Total Job-Years Created from Capital Invested (H) is the total number of installer, electrician and PM/engineering jobs created for 1 year

Indirect &
Induced
Jobs Years
Created per
Million
Dollars
Invested
Total Job-
Years
Created
from Capital
Invested
J=H*I K=H+J
6.4 11.3
3.8 6.7
5.1 9.0
4.0 7.1
8.7 15.4
8.7 15.4
7.3 12.9
8.0 14.2
8.0 14.2
4.0 7.1
2.9 5.1
J=H*I K=H+J
10.0 17.7
10.2 18.0
7.3 12.9
7.3 12.9
8.0 14.2
7.3 12.9
2016 Analysis: RE/EE Job-Years Created from Public Investments Made by Connecticut Green Bank


/ ©2016 NAVIGANT CONSULTING, INC. ALL RIGHTS RESERVED1 / ©2016 NAVIGANT CONSULTING, INC. ALL RIGHTS RESERVED1
FINAL REPORT
CLEAN ENERGY JOBS IN CONNECTICUT
AUGUST 10, 2016
NAVIGANT REFERENCE NO. 184823

/ ©2016 NAVIGANT CONSULTING, INC. ALL RIGHTS RESERVED2 / ©2016 NAVIGANT CONSULTING, INC. ALL RIGHTS RESERVED2 / ©2016 NAVIGANT CONSULTING, INC. ALL RIGHTS RESERVED2 / ©2016 NAVIGANT CONSULTING, INC. ALL RIGHTS RESERVED2
DISCLAIMER
This report was prepared by Navigant Consulting, Inc. (Navigant) for Connecticut Green Bank. The work presented in this report represents Navigant’s professional judgment based on the information available at the time this report was prepared. Navigant is not responsible for the reader’s use of, or reliance upon, the report, nor any decisions based on the report. NAVIGANT MAKES NO REPRESENTATIONS OR WARRANTIES, EXPRESSED OR IMPLIED. Readers of the report are advised that they assume all liabilities incurred by them, or third parties, as a result of their reliance on the report, or the data, information, findings and opinions contained in the report.
The information provided herein does not reflect the official policy or position of Navigant Consulting, Inc. or the contributors. Navigant, and its subsidiaries and affiliates, hereby disclaim liability for any loss or damage caused by errors or omissions in this report.
August 2016

/ ©2016 NAVIGANT CONSULTING, INC. ALL RIGHTS RESERVED3 / ©2016 NAVIGANT CONSULTING, INC. ALL RIGHTS RESERVED3
CONTRIBUTORS
This study was conducted by Navigant Consulting, Inc. (Navigant) with support from the Connecticut Green Bank (CGB) and Connecticut Department of Economic and Community Development (DECD), and assistance by Connecticut utilities Eversource Energy and United Illuminating (UI).
Note: If this document is referenced, it should be cited as: Navigant Consulting Inc., Connecticut Department of Economic and Community Development, and Connecticut Green Bank. June 2016. Clean Energy Jobs in Connecticut.

/ ©2016 NAVIGANT CONSULTING, INC. ALL RIGHTS RESERVED4 / ©2016 NAVIGANT CONSULTING, INC. ALL RIGHTS RESERVED4
TABLE OF CONTENTS
1. 2016 Study Overview
2. Jobs Impact Based on Dollars Invested
3. Current RE and EE Jobs
4. Appendix

/ ©2016 NAVIGANT CONSULTING, INC. ALL RIGHTS RESERVED5 / ©2016 NAVIGANT CONSULTING, INC. ALL RIGHTS RESERVED5
2016 STUDY OVERVIEWCOMPARISON
• Central focus: To provide detailed inventory/accounting of renewable energy and energy efficiency jobs and wages, jobs impact based on dollars invested, clean energy value chain, and a summary of DECD work
• Study pool: 74 companies interviewed, 95 researched
• Interview focus: Job counts and industry insights
• Technology: Energy efficiency (EE) in general and renewable energy (RE), primarily solar PV and fuel cells
• Central focus: To provide an updated calculator tool to estimate the economic development benefits (i.e., job-years created) from clean energy investments in Connecticut
• Study pool: 31 companies interviewed, 40 researched
• Interview focus: Technology-specific data inputs for calculator
• Additional technologies: New distributed energy resources (DER) such as electric vehicle (EV) charging and energy storage
Connecticut Green Bank requested Navigant refresh their Clean Energy Economy Baseline Study as the industry has evolved.
2009-2010 STUDY1 2015-2016 REFRESH
1Connecticut Renewable Energy and Energy Efficiency Economy Baseline study, Navigant Consulting, Inc. [Completed in March 2009 and subsequently updated in 2010]

/ ©2016 NAVIGANT CONSULTING, INC. ALL RIGHTS RESERVED6 / ©2016 NAVIGANT CONSULTING, INC. ALL RIGHTS RESERVED6
2016 STUDY OVERVIEWAPPROACH
• Focus was on product development and manufacturing as well as project development and deployment jobs across various leading and emerging RE and EE technologies.
• Cross-checking was conducted using CGB, utility, and DECD resources, Navigant’s internal databases, and Connecticut industry experts.
• The state-wide industry size was estimated by extrapolation. Assumptions and methodology were verified by CGB and DECD.
• For market segments not included in utility or Green Bank data, employee counts were updated from the last study based on Navigant’s existing data sources and professional judgement.
• Charts and figures in this presentation represent direct jobs specific to RE and/or EE only and refer to indirect and induced jobs only when specified.
• 40 companies were researched in detail, and 31 interviews were conducted including:- 22 RE/EE companies- Three utilities- Three organizations/institutions- Three subject matter experts (SMEs)
Navigant employed a top-down approach, seeking to interview and research the biggest employers and, using that data, extrapolate to the whole market.

/ ©2016 NAVIGANT CONSULTING, INC. ALL RIGHTS RESERVED7 / ©2016 NAVIGANT CONSULTING, INC. ALL RIGHTS RESERVED7
2016 STUDY OVERVIEWINTERVIEWS
1. Build the initial company database. Navigant developed a company and contact list using information from Connecticut Green Bank, Navigant’s 2010 study, trade organizations, utilities, other public sources, and companies known to the evaluation team.
2. Research primary contact information. Missing email addresses and telephone numbers were researched through online searches and phone calls.
3. Create, test, and revise the interview questions. The interview question set was refined several times with the goal of making it concise while capturing information that was of greatest interest (see next slide).
4. Conduct interviews. Navigant managed the interview process and conducted the interviews. The evaluation team conducted 31 formal interviews of some of the largest RE/EE companies and contacted other stakeholders in this sector to augment the information collected from the formal interviews.
5. Data collection. Navigant worked with Connecticut Green Bank and other Connecticut departments to cross-check and supplement the team’s assumptions and findings.
6. Review and clean the data set. Navigant worked with Connecticut Green Bank and other Connecticut departments to extensively review the analysis and results for accuracy and completeness, following up to verify and correct information as needed.
A focused interview approach was used to gather results from top employers or other sources and extrapolate for all current jobs.

/ ©2016 NAVIGANT CONSULTING, INC. ALL RIGHTS RESERVED8 / ©2016 NAVIGANT CONSULTING, INC. ALL RIGHTS RESERVED8
2016 STUDY OVERVIEWVALUE CHAIN
Based on a recommendation by the CGB, Navigant focused the calculator and jobs study on sections of the value chain most closely associated with project installation, which is the focus of the CGB.
Product Dev. & Mfg.
Mfg. Line Construction O&M
Project Dev. &
Deployment
Generation & RE Credits
(RECs)Off-Taker*
RE/EE Value Chain
Included: Jobs directly related to growth of installed capacityExcluded: Less focused on installed jobs and/or jobs are limited
Products Services
RE examples:Power
electronics, fuel cell mfg.
Solar sales and installation, RE
project developers
EE examples:
Vendors who install EE
technology and upgrades
*Note: An off-taker is an entity that purchases electricity or RECs from an independent power producer or marketer
N/A

/ ©2016 NAVIGANT CONSULTING, INC. ALL RIGHTS RESERVED9 / ©2016 NAVIGANT CONSULTING, INC. ALL RIGHTS RESERVED9
2016 STUDY OVERVIEWJOB TYPES
In line with the value chain segments examined, “jobs types” included in the calculator related to manufacturing, installation, engineering, and project management.
1Specific Occupation titles from Bureau of Labor Statistics – May 2015 State Occupational Employment and Wage Estimates Connecticut http://www.bls.gov/oes/current/oes_ct.htm
General Job Type Example Specific Occupation Types1
Manufacturing Production occupations (e.g., assemblers, fabricators, equipmentoperators, and process workers)
Installers/Field TechniciansInstallation and construction occupations (e.g., solar PV installers, heating, AC and refrigeration mechanics and installers, insulation workers, floor, ceiling and wall)
Electricians Electricians, electro-mechanical technicians, electrical and electronics installers and repairers
Engineers/Project ManagersEngineers (e.g., mechanical, civil, and electrical engineers); management occupations (e.g., project, construction, and engineering managers)

/ ©2016 NAVIGANT CONSULTING, INC. ALL RIGHTS RESERVED10 / ©2016 NAVIGANT CONSULTING, INC. ALL RIGHTS RESERVED10
2016 STUDY OVERVIEWDIRECT VS. INDIRECT JOBS
This analysis mainly considers direct jobs in private companies that employ people who are based in Connecticut. A multiplier for calculating indirect and induced jobs from the number of direct jobs was provided by the DECD for this study.
• For the purpose of this baseline analysis, direct jobs are considered existing jobs in the specified Connecticut industries.
• In policy analysis, direct jobs are commonly defined as the initial change in final demand for the industry sector in question. Direct job impacts describe the changes in economic activity for sectors that first experience a change in demand because of a project, policy decision, or some other stimuli.
• Represents the response as supplying industries increase output in order to accommodate the initial change in final demand. These indirect beneficiaries will then spend money for supplies and services, which results in another round of indirect spending.
• Jobs generated by the spending of households who benefit from the additional wages and business income they earn through direct and indirect activity. The increase in income, in effect, increases the purchasing power of households.
Source: S. Grover, “Energy, Economic, and Environmental Benefits of the Solar America Initiative,” August 2007, NREL/SR-640-41998.
Primary scope (the numbers presented in this report are direct jobs unless otherwise indicated)Secondary scope through use of multipliers
DIRECT JOBS INDIRECT JOBS INDUCED JOBS

/ ©2016 NAVIGANT CONSULTING, INC. ALL RIGHTS RESERVED11 / ©2016 NAVIGANT CONSULTING, INC. ALL RIGHTS RESERVED11
2016 STUDY OVERVIEWDECD ANALYSIS OF INDIRECT AND INDUCED JOBS
Occupation NAICS Code Sector DescriptionElectrician, Installer/Field Technician 23 ConstructionEngineer 541 Professional, technical, and scientific servicesFuel Cell Manufacturing (Solid State) 334 Computer and electronic product manufacturingFuel Cell Manufacturing (Electrochemical Generators) 335 Electrical equipment and appliance manufacturing
DECD provided a multiplier for calculating indirect and induced jobs from the number of direct jobs for this study.• DECD performed the simulations by creating net new jobs in the following sectors that include the
occupations listed below:
• DECD then obtained the multiplier by dividing the total employment generated in the economy by the net new jobs in the above sectors entered as input into Connecticut’s REMI1 model.
• The simulations generated an employment multiplier of 2.3, which means that for each RE/EE job, an additional 1.3 jobs are created, on average, each year.
• This relatively high multiplier most likely reflects the relatively large local supply of labor and intermediate goods; the decrease in the same multiplier over the 2010 study is likely due to the narrower job base classifications used this time around, as well as higher worker productivity in these sectors as companies do more with fewer workers.
1REMI V.1.6.7, Connecticut Single Region Model. REMI is a dynamic input-output model that assesses individual and firm behavioral responses to changes in relative prices over time. This simulation provides the potential regional employment impact of the relevant industry groups in Connecticut.

/ ©2016 NAVIGANT CONSULTING, INC. ALL RIGHTS RESERVED12 / ©2016 NAVIGANT CONSULTING, INC. ALL RIGHTS RESERVED12
2016 STUDY OVERVIEWTECHNOLOGIES
This study includes some additional RE and EE technology industries as compared to the last study, such as EV infrastructure and energy storage.
Technology MarketsFuel cellsSolar PVSolar thermalWindGeothermalSmall hydroEnergy storageEV charging
ResidentialCommercial and industrial (C&I) Utility
Technology* MarketsHigh efficiency heating, ventilation and air conditioning (HVAC)Efficient lightingEfficient home appliancesWater heatingBuilding envelopeDemand response
Residential (including low-income weatherization)C&ISmall business
Renewable Energy Energy Efficiency
*Note: For the purpose of this analysis, Navigant merged all EE technologies and presented the results by market.

/ ©2016 NAVIGANT CONSULTING, INC. ALL RIGHTS RESERVED13 / ©2016 NAVIGANT CONSULTING, INC. ALL RIGHTS RESERVED13
2016 STUDY OVERVIEWRECOMMENDATIONS
Some areas for future investigation include:
Because the focus of this study was the jobs calculator and installation-focused job creation—specifically product and project development jobs—the study could be expanded to address other segments.
Area of Study Analysis Focus
Commercial EE Commercial EE jobs count by job title and customer type
Other RE Manufacturing and R&D
Emerging RE manufacturing and R&D in Connecticut, includingEV charging and storage
RE Utility Employees Number of employees or job-years focused on administering RE programs
Value Chain Segments Other areas of the value chain not explored in this study, including supply chain, operations and maintenance (O&M), academic, etc.

/ ©2016 NAVIGANT CONSULTING, INC. ALL RIGHTS RESERVED14 / ©2016 NAVIGANT CONSULTING, INC. ALL RIGHTS RESERVED14
TABLE OF CONTENTS
1. 2016 Study Overview
2. Jobs Impact Based on Dollars Invested
3. Current RE and EE Jobs
4. Appendix
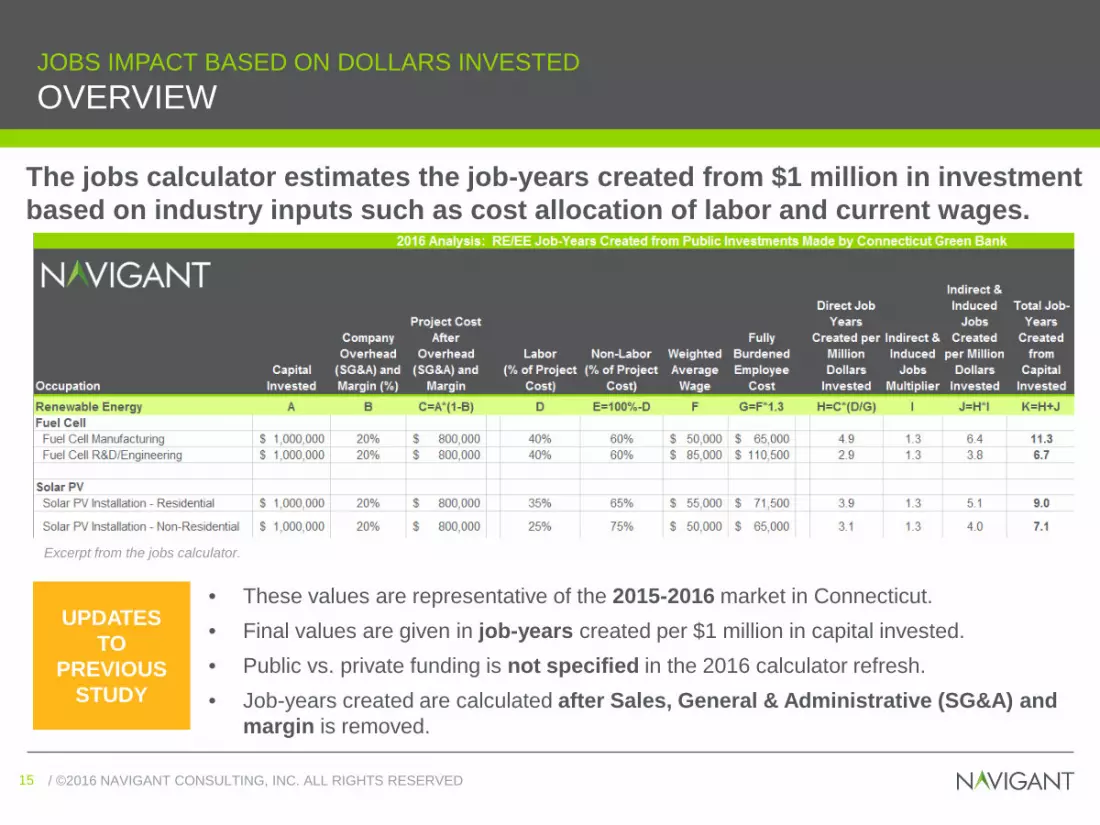
/ ©2016 NAVIGANT CONSULTING, INC. ALL RIGHTS RESERVED15 / ©2016 NAVIGANT CONSULTING, INC. ALL RIGHTS RESERVED15
JOBS IMPACT BASED ON DOLLARS INVESTEDOVERVIEW
The jobs calculator estimates the job-years created from $1 million in investment based on industry inputs such as cost allocation of labor and current wages.
• These values are representative of the 2015-2016 market in Connecticut.• Final values are given in job-years created per $1 million in capital invested.• Public vs. private funding is not specified in the 2016 calculator refresh.• Job-years created are calculated after Sales, General & Administrative (SG&A) and
margin is removed.
UPDATES TO
PREVIOUS STUDY
Excerpt from the jobs calculator.

/ ©2016 NAVIGANT CONSULTING, INC. ALL RIGHTS RESERVED16 / ©2016 NAVIGANT CONSULTING, INC. ALL RIGHTS RESERVED16
JOBS IMPACT BASED ON DOLLARS INVESTEDKEY FINDINGS
A $1 million capital investment creates:• ~5 job-years for energy storage installers• ~7 job-years for EV charging station installers• ~9 job-years for residential solar installers• ~11 job-years for fuel cell manufacturers• ~14 job-years for wind project installers• ~14 job-years for commercial EE installers• ~15 job-years for renewable thermal
technologies (RTT) installers• ~18 job-years for residential EE installers
Job-years created are direct, indirect, and induced.
• More fuel cell manufacturing job-years are created per $1 million investment than solar installation jobs because a larger portion of funding goes toward labor.
• Renewable Thermal Technologies (RTT) and residential EE technologies create the most job-years per investment because labor and material costs are lower for these technologies.
• Investments in residential solar create more job-years from investment than commercial solar because material costs make up a larger portion of overall project cost for commercial customers.
• Other RE technologies such as energy storage and EV charging stations are still new to market and maintain high material costs, with less investment going toward installation labor.
More job-years in EE are created per $1 million capital investment than for RE because material costs and wages are, on average, lower in the EE industry.
FAST FACTS KEY FINDINGS

/ ©2016 NAVIGANT CONSULTING, INC. ALL RIGHTS RESERVED17 / ©2016 NAVIGANT CONSULTING, INC. ALL RIGHTS RESERVED17
JOBS IMPACT BASED ON DOLLARS INVESTEDRESULTS: RENEWABLE ENERGY
RE job-years created per $1 million capital invested per the calculator approach:
Occupation Direct Job-Years Created per $1 Million Invested
Indirect and Induced Jobs Created per $1 Million Invested
Total Job-Years Created from $1 Million
InvestedRenewable EnergyFuel CellFuel Cell Manufacturing 4.9 6.4 11.3Fuel Cell R&D/Engineering 2.9 3.8 6.7
Solar PVSolar PV Installation - Residential 3.9 5.1 9.0Solar PV Installation -Non-Residential 3.1 4.0 7.1
Renewable Thermal TechnologiesDuctless Split Heat Pump 6.7 8.7 15.4Geothermal 6.7 8.7 15.4Solar Thermal 5.6 7.3 12.9
OtherWind Installation 6.2 8.0 14.2Hydro Installation 6.2 8.0 14.2EV Charging Stations - Installation 3.1 4.0 7.1Storage Installation 2.2 2.9 5.1

/ ©2016 NAVIGANT CONSULTING, INC. ALL RIGHTS RESERVED18 / ©2016 NAVIGANT CONSULTING, INC. ALL RIGHTS RESERVED18
JOBS IMPACT BASED ON DOLLARS INVESTEDRESULTS: ENERGY EFFICIENCY
EE job-years created per $1 million capital invested per the calculator approach:
1The municipalities, universities, schools, and hospitals (MUSH) market is included in Commercial.
Occupation Direct Job-Years Created per $1 Million Invested
Indirect and Induced Jobs Created per $1 Million
Invested
Total Job-Years Created from $1 Million
InvestedEnergy EfficiencyResidential (Single and Multifamily)Lighting 7.7 10.0 17.7Home Energy Solutions (HES) - Audits 7.8 10.2 18.0HES - Weatherization & HVAC 5.6 7.3 12.9Gas Conversion 5.6 7.3 12.9
Commercial1
Small Business (e.g., Small Business Energy Advantage) 6.2 8.0 14.2Large Commercial and Industrial (e.g., C-PACE) 5.6 7.3 12.9

/ ©2016 NAVIGANT CONSULTING, INC. ALL RIGHTS RESERVED19 / ©2016 NAVIGANT CONSULTING, INC. ALL RIGHTS RESERVED19
JOBS IMPACT BASED ON DOLLARS INVESTEDMETHODOLOGY
1. Labor allocation: The average of the values provided in company interviews and discussions with SMEs (particularly for wind and storage) was used.
2. Average wage: The wage for each of the four job types analyzed by the calculator was taken from the Bureau of Labor Statistics, or BLS, (CT, 2015) for the most similar occupation titles.
The two key inputs to calculate job-years created for each RE and EE job type are labor allocation of total project cost and average wage.
Job Type for Calculator
BLS Occupation Code*
BLS Occupation Title*
BLS Wage CT*
BLS WageMA**
CT Wage vs. MA
Manufacturing 51-0000 Production occupations $41,730 $39,500 6%
Installers/Field Technicians 47-2231 Solar photovoltaic
installers $37,270 $43,860 -15%
Electricians 47-2111 Electricians $55,750 $64,790 -14%
Engineers/PM/R&D 17-2141 Mechanical engineers $84,520 $91,270 -11%*May 2015 State Occupational Employment and Wage Estimates Connecticut http://www.bls.gov/oes/current/oes_ct.htm**May 2015 State Occupational Employment and Wage Estimates Massachusetts http://www.bls.gov/oes/current/oes_ma.htm

/ ©2016 NAVIGANT CONSULTING, INC. ALL RIGHTS RESERVED20 / ©2016 NAVIGANT CONSULTING, INC. ALL RIGHTS RESERVED20 / ©2016 NAVIGANT CONSULTING, INC. ALL RIGHTS RESERVED20 / ©2016 NAVIGANT CONSULTING, INC. ALL RIGHTS RESERVED20
JOBS IMPACT BASED ON DOLLARS INVESTEDMETHODOLOGY
3. A weighted-average wage was then calculated for each RE and EE offering by multiplying the BLS wages by the job classification breakdown, which was collected through interviews and internal research/experts.
- The job classification breakdown used for residential solar is provided in the pie chart.- The job classification breakdowns used for all other technologies are provided in the table.
Residential Solar Employee Breakdown by Job Type (Average 36 Total Employees)
Employee Breakdown by Job Type*Technology Inst. Elec. Eng.
Commercial Solar 60% 15% 25%
Fuel Cell 60% 0% 40%
Wind 40% 20% 40%
EV Charging Stations 50% 30% 20%
Storage 25% 5% 70%
Lighting 80% 20% 0%
Small Business Energy Advantage (SBEA)
70% 15% 15%
Large C&I 50% 25% 25%*Employee breakdowns were determined based on information collected in interviews, as well as with available internal research for the technologies included in this study.
Source: Navigant Analysis

/ ©2016 NAVIGANT CONSULTING, INC. ALL RIGHTS RESERVED21 / ©2016 NAVIGANT CONSULTING, INC. ALL RIGHTS RESERVED21
JOBS IMPACT BASED ON DOLLARS INVESTEDASSUMPTIONS
The calculator primarily determines job-years per investment for installation-and manufacturing-type labor.• Distribution/supply work is considered indirect.• Subcontracted work is considered indirect.• Assumed 20% for company overhead (SG&A) costs (including jobs) and margin (%).• The wages included are calculated as a weighted average of four different job
classifications:- Installers/Field Technicians- Electricians- Engineers/Project Managers/R&D- Manufacturing
• Excluded from the weighted average wage are the following job types:- Administrative and executive- O&M- Finance and accounting- Sales and marketing

/ ©2016 NAVIGANT CONSULTING, INC. ALL RIGHTS RESERVED22 / ©2016 NAVIGANT CONSULTING, INC. ALL RIGHTS RESERVED22
JOBS IMPACT BASED ON DOLLARS INVESTEDNOTES
• Job-year final values are representative of the 2015-2016 market in Connecticut.• Company Overhead and Margin (C) is assumed to be 20% and accounts for jobs related to
sales, marketing, management, and other overhead jobs and expenses.• Labor (D) is the percentage of the project cost that is used to pay installers, electricians,
project managers and engineers.• Non-Labor (E) is the percentage of the project cost that is used to cover all other project
expenses, including materials and non-labor soft costs.• Weighted Average Wage (F) is distributed among installers, electricians, and PM/engineers
based on wages in Connecticut as reported by the U.S. Department of Labor as of May 2015.• The weight for each job type is based on research and/or interview feedback for employee
breakdowns for that field/technology.• Total Direct Job-Years Created from Capital Invested (H) is the total number of installer,
electrician, and PM/engineering jobs created for 1 year.• Total Indirect and Induced Job-Years (J) is calculated from DECD inputs.
Some assumptions were made and included as notes within the calculator to clarify key variables and inputs to job-year calculation.

/ ©2016 NAVIGANT CONSULTING, INC. ALL RIGHTS RESERVED23 / ©2016 NAVIGANT CONSULTING, INC. ALL RIGHTS RESERVED23
TABLE OF CONTENTS
1. 2016 Study Overview
2. Jobs Impact Based on Dollars Invested
3. Current RE and EE Jobs
4. Appendix

/ ©2016 NAVIGANT CONSULTING, INC. ALL RIGHTS RESERVED24 / ©2016 NAVIGANT CONSULTING, INC. ALL RIGHTS RESERVED24
CURRENT RE AND EE JOBSOVERVIEW
Overall, this analysis estimates Connecticut has 5,300 direct jobs in the product development and manufacturing and project development and deployment segments of the RE/EE value chain.
Note: Indirect and induced jobs can be calculated using a multiplier of 1.3 for all jobs (DECD).1Connecticut Department of Labor, Nonfarm Employment/Residents Employed as of April 2016 http://www1.ctdol.state.ct.us/lmi/ctnonfarmemployment.asp.
OVERALL• 5,300 direct RE/EE jobs• Direct RE/EE jobs account for
0.31% out of a workforce of 1.7 million1
RENEWABLE ENERGY (RE)• 12 companies interviewed, 17 researched,
representing ~60% of the market• 2,500 direct jobs• Primarily solar and fuel cell jobs
ENERGY EFFICIENCY (EE)• 10 key companies interviewed, 20 researched,
representing ~30% of the market• 2,800 direct jobs• Primarily jobs in the residential and C&I market

/ ©2016 NAVIGANT CONSULTING, INC. ALL RIGHTS RESERVED25 / ©2016 NAVIGANT CONSULTING, INC. ALL RIGHTS RESERVED25
CURRENT RE AND EE JOBSRESULTS: RENEWABLE ENERGY
• The total number of direct jobs for the RE industry in 2016 is ~2,500.
- In 2010, the total number of RE jobs was ~1,700.
• 78% of the total fuel cell industry identified.- Leading employers include Doosan Group and
FuelCell Energy.• 68% of the total solar industry identified.
- Biggest contributors include SolarCity and Trinity Solar.
• 26 RE companies identified: 9 companies interviewed, 17 companies researched in detail.
• Of ~2,500 direct jobs:- 44% products- 56% services
• The majority of RE jobs are split between the solar and fuel cell industries, with other RE technologies making up the remaining 6% of RE industry jobs.
• Installation and engineering jobs account for the largest job type at solar companies.
• Manufacturing and engineering jobs account for the largest job type at fuel cells companies.
• The majority of solar employees in Connecticut focus on the residential market.
Employment in the solar industry has grown by approximately 30% since 2010 to become the largest RE industry for jobs in Connecticut.
FAST FACTS KEY FINDINGS

/ ©2016 NAVIGANT CONSULTING, INC. ALL RIGHTS RESERVED26 / ©2016 NAVIGANT CONSULTING, INC. ALL RIGHTS RESERVED26
CURRENT RE AND EE JOBSRESULTS: ENERGY EFFICIENCY
• The total number of direct jobs for the EE industry in 2016 is ~2,800.
- In 2010, the total number of EE jobs was ~2,700.
• 28% of the residential EE industry identified.- Biggest contributors include Competitive
Resources and Energy Efficiencies Solutions.• 27 EE companies identified: 7 companies
interviewed, 20 companies researched in detail• Of ~2,800 direct jobs:
- 23% products- 74% services- 3% utility
• EE technologies mainly included lighting, HVAC, and building envelope, with the majority of companies participating in multiple technologies.
• Installation jobs account for the majority of roles in EE.
• Most EE jobs are focused on the residential and C&I customer markets, with the remaining focused on retail and utility.
- The average number of employees at C&I companies is 90-120 vs. 10-40 at residential companies.
• Percentage of total EE employees participating in the C&I and retail markets was based off the percentage from the 2010 study.
Overall employment in the EE industry has remained relatively constant, experiencing most job growth in the residential customer market.
FAST FACTS KEY FINDINGS

/ ©2016 NAVIGANT CONSULTING, INC. ALL RIGHTS RESERVED27 / ©2016 NAVIGANT CONSULTING, INC. ALL RIGHTS RESERVED27
CURRENT RE AND EE JOBSKEY FINDINGS
The number of direct solar industry jobs in Connecticut is more than 4 times greater than it was 5 years ago, while fuel cell and EE employment numbers have stayed relatively the same.
Direct Jobs: 2010 vs. 2016
Note: The methodologies differ between this and the previous study; therefore, the results may not be 1-to-1 comparable. For example, not as many commercial EE companies were directly identified and interviewed in this study, so other sources were used to estimate the number of commercial EE companies and jobs.
Source: Navigant Analysis

/ ©2016 NAVIGANT CONSULTING, INC. ALL RIGHTS RESERVED28 / ©2016 NAVIGANT CONSULTING, INC. ALL RIGHTS RESERVED28
CURRENT RE AND EE JOBS INDUSTRY REVIEW
The top 10 RE/EE employers represent approximately 50% of total direct jobs in 2010 and 2016, but there has been significant turnover, which is evident in the variances between the lists below.
2016 Top 10 RE/EE Employers*FuelCell Energy, Inc.
SolarCity
Doosan Fuel Cell America, Inc.
Trane
EMCOR
Home Depot
Greenskies Renewable Energy
CED Greentech
Trinity Solar
Competitive Resources
2010 Top 10 RE/EE Employers*United Technologies Corp. (UTC)
FuelCell Energy, Inc.
Sensor Switch
Schuco USA
US Insulation Corp.
Home Depot
Trane
Noble Environmental Power
Alliance Energy Solutions (AES)
Wal-Mart*Utility jobs excluded.

/ ©2016 NAVIGANT CONSULTING, INC. ALL RIGHTS RESERVED29 / ©2016 NAVIGANT CONSULTING, INC. ALL RIGHTS RESERVED29
CURRENT RE AND EE JOBSINDUSTRY REVIEW
• The methodologies differ between this and the previous study; therefore, the results may not be 1-to-1 comparable. • The decrease in employment in the fuel cell industry was related to the bankruptcy of UTC Power in 2013 following acquisition by
ClearEdge. (Doosan acquired the ClearEdge assets in 2014.). Subsequently, in June 2016, Doosan made some additional layoffs.
• The small increase in EE employment was likely due to the industry increase in available residential program funding and technologies.
• The increase in solar employment was driven by technology cost reduction (i.e., hard and soft costs), public policy, incentives, and access to financing.
Parallel to the growth of the solar industry, employment in this market has experienced the greatest increase among technologies.
RE + EE Jobs by Technology: 2010 4,500 Jobs
RE + EE Jobs by Technology: 2016 5,300 Jobs
Source: Navigant Analysis Source: Navigant Analysis

/ ©2016 NAVIGANT CONSULTING, INC. ALL RIGHTS RESERVED30 / ©2016 NAVIGANT CONSULTING, INC. ALL RIGHTS RESERVED30
CURRENT RE AND EE JOBS BREAKDOWN OF JOBS BY PRODUCT, SERVICE, AND UTILITY
• For this study, focus is on those parts of the value chain that, for the most part, have jobs in product and service offerings. - Jobs were classified as offering either
primarily products or primarily services, though companies may offer both.
• Product companies either manufacture and sell to customers or buy from manufacturers and sell to RE/EE installers and developers.
• Service companies provide services such as installation and auditing.
• RE industry service jobs are primarily in solar (~1,300 jobs out of ~1,400 service jobs).
• RE industry jobs at product companies are solely in the fuel cell industry (~1,100 jobs).
• EE industry is mostly service jobs (~2,100 of total EE jobs), with some retail and supply jobs (~600) and minimal utility jobs (~80).
The majority of RE companies and EE companies in Connecticut offer services, with the majority of product jobs belonging to the fuel cell industry.
Note: The “Utility” category includes ~80 EE program administration jobs and <10 RE program administration jobs within Eversource, UI, and Norwich Public Utilities (NPU).
Breakdown by Product and Service Jobs
Source: Navigant Analysis

/ ©2016 NAVIGANT CONSULTING, INC. ALL RIGHTS RESERVED31 / ©2016 NAVIGANT CONSULTING, INC. ALL RIGHTS RESERVED31
CURRENT RE AND EE JOBS JOBS BY CUSTOMER MARKET
• All fuel cell employees are categorized as working in the C&I customer market, which accounts for approximately 1,100 jobs.
• About 40% of the 2,800-plus EE employees serve the C&I customer market as well.
More than half of RE and EE employees studied in the state serve the C&I customer market.
RE + EE Jobs by Customer Market in CT: 2016 5,300 Direct Jobs
Source: Navigant Analysis

/ ©2016 NAVIGANT CONSULTING, INC. ALL RIGHTS RESERVED32 / ©2016 NAVIGANT CONSULTING, INC. ALL RIGHTS RESERVED32
• Navigant specifies the difference between deployment and development as companies in deployment employ their own installers, while project developers subcontract the installation.
• Solar and other RE technologies (apart from fuel cells) account for the majority of the deployment and development jobs.
• All fuel cell employees and the retail and supply portion of the EE industry make up the product development and manufacturing percentage.
More than half of RE and EE employees studied in the state work in the deployment part of the value chain.
RE + EE Jobs by Value Chain in CT: 2016 5,300 Direct Jobs
Note: Direct jobs in deployment and development mostly include installer and engineer job types.
CURRENT RE AND EE JOBS JOBS BY VALUE CHAIN
Source: Navigant Analysis

/ ©2016 NAVIGANT CONSULTING, INC. ALL RIGHTS RESERVED33 / ©2016 NAVIGANT CONSULTING, INC. ALL RIGHTS RESERVED33
CURRENT RE AND EE JOBSJOBS BY JOB TYPE
Most RE and EE employees studied in the state working within the manufacturing and deployment segments have installation jobs, primarily in the solar and EE industries.
RE + EE Jobs by Job Type in CT: 20165,300 Direct Jobs
Source: Navigant Analysis
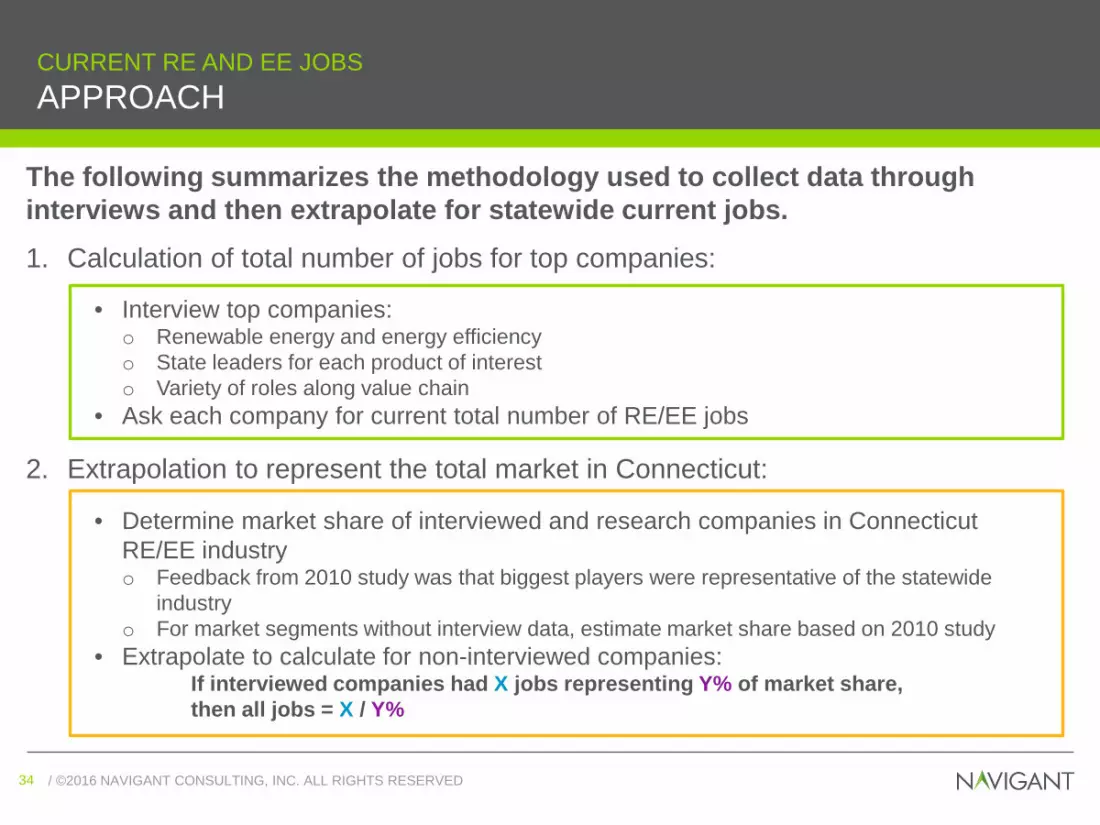
/ ©2016 NAVIGANT CONSULTING, INC. ALL RIGHTS RESERVED34 / ©2016 NAVIGANT CONSULTING, INC. ALL RIGHTS RESERVED34
CURRENT RE AND EE JOBSAPPROACH
1. Calculation of total number of jobs for top companies:
2. Extrapolation to represent the total market in Connecticut:
The following summarizes the methodology used to collect data through interviews and then extrapolate for statewide current jobs.
• Interview top companies:o Renewable energy and energy efficiencyo State leaders for each product of interesto Variety of roles along value chain
• Ask each company for current total number of RE/EE jobs
• Determine market share of interviewed and research companies in Connecticut RE/EE industryo Feedback from 2010 study was that biggest players were representative of the statewide
industryo For market segments without interview data, estimate market share based on 2010 study
• Extrapolate to calculate for non-interviewed companies:If interviewed companies had X jobs representing Y% of market share,then all jobs = X / Y%

/ ©2016 NAVIGANT CONSULTING, INC. ALL RIGHTS RESERVED35 / ©2016 NAVIGANT CONSULTING, INC. ALL RIGHTS RESERVED35
CURRENT RE AND EE JOBSNOTES
1. Green Bank and utility-provided data, as well as industry reports and articles, were used to estimate total market size.
- Publicly available industry reports and internal research were used to estimate the fuel cell market size.- Green Bank data was used for the residential solar market size (assuming Green Bank data captures
100% of the residential solar market).- Utility Zero Emission Renewable Energy Credit (ZREC) data was used for the commercial solar market
size (assuming the top ten installers for small, medium and large commercial projects in the ZREC program represent the commercial solar market).
- Utility EE data was used for the residential EE market size (assuming utility EE data captures 100% of the residential EE market).
- Commercial EE and “Other” RE technology market size were based off market share from the 2010 study (limited interviews and data on these players).
2. Jobs reported by companies interviewed or researched were then divided by the market sizes from the first step to calculate statewide industry size in terms of employment.
- Only full-time employee (FTE) jobs were reported in interviews and research.- LinkedIn current employee counts in Connecticut were used for some companies with missing
information, and a multiplier of three was applied (derived from companies where employee count was reported in interviews divided by the number on LinkedIn).
Various sources of public and private data were used to extrapolate the jobs reported in interviews and literature to statewide industry employment.

/ ©2016 NAVIGANT CONSULTING, INC. ALL RIGHTS RESERVED36 / ©2016 NAVIGANT CONSULTING, INC. ALL RIGHTS RESERVED36
TABLE OF CONTENTS
1. 2016 Study Overview
2. Jobs Impact Based on Dollars Invested
3. Current RE and EE Jobs
4. Appendix

/ ©2016 NAVIGANT CONSULTING, INC. ALL RIGHTS RESERVED37 / ©2016 NAVIGANT CONSULTING, INC. ALL RIGHTS RESERVED37
APPENDIXINTERVIEW GUIDE
PROJECT ECONOMICS6. What is the average/median wage for different
specialties/job classifications that your company uses for your RE/EE work (provide examples)?
7. What is average project cost?8. What is the typical split between labor and material as a
percent of total project cost? 9. Which RE/EE state-funded programs do you participate in?10. What percentage of your project costs are funded by upfront
state incentives (e.g., Connecticut Energy Efficiency Fund, Green Bank)?
11. Of these project economics inputs you provided, what are the market conditions that could trigger them to change?
CURRENT JOBS11. How many FTE (full-time equivalent) employees did you
have working on RE/EE jobs in Connecticut at the end of 2015?
12. What portion of your Connecticut RE/EE employees are in each value chain segment? See dropdown list Value Chain (High-level) and Value Chain (Detailed)
The interview guide for this study was based off the last study, with questions more directed toward the current economy in Connecticut.
YOUR COMPANY1. Please tell us a little about yourself and your role in the
company. 2. Describe your overall business. 3. Describe your RE/EE business.
a. Do you offer primarily RE, EE, or a combination?b. Do you offer primarily products or services?c. To which renewable or energy efficiency technology do
you must closely associate? See dropdown list RE (and Other) Products and EE Products
d. In which area of the value chain does your RE/EE business primarily operate? See dropdown list Value Chain (High-level) and Value Chain (Detailed)
CUSTOMERS4. Which market do you primarily serve? See dropdown list
Market Segment5. What percentage of RE/EE customers are in CT?

/ ©2016 NAVIGANT CONSULTING, INC. ALL RIGHTS RESERVED38 / ©2016 NAVIGANT CONSULTING, INC. ALL RIGHTS RESERVED38
APPENDIXINTERVIEW GUIDE
The following list of dropdowns were used with the interview questions and allowed respondents to identify all that applied.RE Products EE Products Market Segment Value Chain (High-Level) Value Chain (Detailed)Fuel Cell HVAC Residential Mfg. Line Construction R&DSolar PV Lighting Small Business Product Dev. & Mfg. Raw Material SupplierSolar Thermal Appliances Large C&I Deployment Component Mfg.Wind Water Heating MUSH O&M Assembly & TestGeothermal Commercial Refrigeration Utility/IPP Generation and REC RE Deploy: Distributor Hydro Pumps, Motors, Drives Retail Off-Taker RE Deploy: DeveloperHydrogen Building Envelope Other RE Deploy: System IntegratorBiomass Demand Response Multiple RE Deploy: InstallerAnaerobic Digestion Other RE Deploy: Project InvestorCHP Multiple RE Deploy: Business SupportMicrogrids EE Deploy: Supply & WholesaleStorage EE Deploy: Retail & DistributionGrid Infrastructure EE Deploy: Delivery & InstallationAFV Infrastructure EE Deploy: Marketing & Outreach
Other EE Deploy: Evaluation & Consulting
Multiple EE Deploy: Business SupportIn-House O&M Contract O&MFinance & Ownership

/ ©2016 NAVIGANT CONSULTING, INC. ALL RIGHTS RESERVED39 / ©2016 NAVIGANT CONSULTING, INC. ALL RIGHTS RESERVED39
APPENDIXRE CALCULATOR RESULTS (DETAILED)

/ ©2016 NAVIGANT CONSULTING, INC. ALL RIGHTS RESERVED40 / ©2016 NAVIGANT CONSULTING, INC. ALL RIGHTS RESERVED40 / ©2016 NAVIGANT CONSULTING, INC. ALL RIGHTS RESERVED40
APPENDIXEE CALCULATOR RESULTS (DETAILED)

/ ©2016 NAVIGANT CONSULTING, INC. ALL RIGHTS RESERVED41 / ©2016 NAVIGANT CONSULTING, INC. ALL RIGHTS RESERVED41
APPENDIXINTERVIEW TARGETS
• Solar makes up 79% of the RE market in Connecticut based on total number of kilowatts.
• Solar makes up 99.9% of the RE market in Connecticut based on the 15,042 projects reported by the CGB from 2011-2015.
• There are more anaerobic digestion (AD) and combined heat and power (CHP) projects, by count, but more kilowatts from fuel cells.
• The employee-to-kilowatt or employee-to-project count ratio for fuel cell, AD, and wind projects follows a drastically different structure than solar due to average project capacity and technology specifics.
Because solar makes up 79% of the RE industry in Connecticut based on power capacity (kW), it was important to reach out to solar companies.
Market Share of RE Companies: 2011-2015165 MW
Source: Connecticut Green Bank data, Navigant analysis

/ ©2016 NAVIGANT CONSULTING, INC. ALL RIGHTS RESERVED42 / ©2016 NAVIGANT CONSULTING, INC. ALL RIGHTS RESERVED42
APPENDIXRE INTERVIEW TARGETS: SOLAR
• SolarCity holds the greatest share of the solar market in Connecticut based on kilowatts and number of projects.
• The top 10 solar contributors were part of the first priority RE companies to interview.
• For those companies Navigant was able to get an employee count for, this market share was used for extrapolating statewide.
• It was assumed that the Connecticut Green Bank database covered 100% of the residential solar market.- Utility data for the top ten installers for
small, medium and large commercial projects in the ZREC program was used to represent the commercial market
The list of first priority solar companies to contact/research was created based on market share data provided by the Green Bank.
Market Share of Solar Companies: 20156,122 Projects
Source: Connecticut Green Bank data, Navigant analysis

/ ©2016 NAVIGANT CONSULTING, INC. ALL RIGHTS RESERVED43 / ©2016 NAVIGANT CONSULTING, INC. ALL RIGHTS RESERVED43
APPENDIXRE JOBS ANALYSIS
• Solar jobs account for 52% of the overall RE industry (~1,300 jobs).- In 2010, only 18% of RE jobs were solar.
• Fuel cell jobs account for 42% of the RE industry (~1,100 jobs).- In 2010, fuel cells account for 71% of the
total RE jobs.• The “Other” category includes solar
thermal, geothermal, wind, small hydro, EV, energy storage, biomass, and hydrogen.1
The majority of RE jobs are split between the solar and fuel cell industries, with other RE technologies making up the remaining 6% of RE industry jobs.
RE Jobs by Technology in Connecticut 2,500 Direct Jobs
1Few companies from the “Other” category were interviewed for this study given the focus on current leading technologies; therefore, the total percentage of these technologies was generally assumed to be the same as the 2010 study.
Source: Navigant Analysis

/ ©2016 NAVIGANT CONSULTING, INC. ALL RIGHTS RESERVED44 / ©2016 NAVIGANT CONSULTING, INC. ALL RIGHTS RESERVED44
APPENDIXRE JOBS ANALYSIS
• Installation jobs account for the largest job type at solar companies.
• Manufacturing and engineering jobs account for the largest job type at fuel cell companies.- R&D also makes up a portion of the fuel cell
jobs but does not appear in any other technology industry in this study.
• Sales and business development-type jobs made up a larger portion at solar companies as compared to fuel cells.
• Corporate, management, and administrative-type jobs were noted as a portion of employees across all technologies.
Installation-type jobs make up the majority of RE labor, mainly due to the large size of the solar industry in Connecticut.
RE Jobs by Type in Connecticut2,500 Direct Jobs
Source: Navigant Analysis

/ ©2016 NAVIGANT CONSULTING, INC. ALL RIGHTS RESERVED45 / ©2016 NAVIGANT CONSULTING, INC. ALL RIGHTS RESERVED45
APPENDIXRE JOBS ANALYSIS
• The majority of solar employees in Connecticut focus on the residential customer market.
• Some companies reported to work in both residential and non-residential; however, in those cases, the majority of employees focused on residential.
• The non-residential market includes: - Small business- Large C&I- MUSH- There were few, if any, jobs associated with
utility-scale solar
Similar to the trend across the country, residential is the primary customer market for solar in Connecticut.
Solar Jobs by Customer Market in Connecticut 1,300 Direct Jobs
Source: Navigant Analysis

/ ©2016 NAVIGANT CONSULTING, INC. ALL RIGHTS RESERVED46 / ©2016 NAVIGANT CONSULTING, INC. ALL RIGHTS RESERVED46
APPENDIXEE INTERVIEW TARGETS
• Market leaders vary greatly based on annual power capacity (in MMBtu1) and number of projects in the EE market due to different technology offerings.
• Unlike RE, the top EE leaders are closer in market share to each other and to all others.
• For this reason, although just as many EE companies were interviewed and researched as RE companies, a smaller portion of the market was captured—approximately 30%.
The EE market is highly fragmented, with many companies operating; utility data was used to identify the largest players.
Market Share of EE Companies: 201549,210 Projects
Source: Eversource data, Navigant analysis 1million British Thermal Units

/ ©2016 NAVIGANT CONSULTING, INC. ALL RIGHTS RESERVED47 / ©2016 NAVIGANT CONSULTING, INC. ALL RIGHTS RESERVED47
APPENDIXEE JOBS ANALYSIS
• Installation jobs account for the majority of roles in EE.
• Job titles included under installation varied in skill level and trade:- Electricians (master and apprentice)- Plumbers and other HVAC-specific
technicians- Installers of appliances, windows, and
insulation• The retail channel is more important to
EE relative to RE.• Corporate, management, and
administrative-type jobs and sales and business development-type jobs account for only a small portion of EE-related labor.
Installation-type jobs make up 59% of EE-related labor, followed by 23% retail, across all EE technologies.
EE Jobs by Type in Connecticut2,800 Direct Jobs
Source: Navigant Analysis

/ ©2016 NAVIGANT CONSULTING, INC. ALL RIGHTS RESERVED48 / ©2016 NAVIGANT CONSULTING, INC. ALL RIGHTS RESERVED48
APPENDIXEE JOBS ANALYSIS
• The majority of EE employees in Connecticut focus on the residential and C&I customer markets.- Though there are less EE companies focused on
C&I in Connecticut, they hire a larger amount of employees per company.
• The non-residential market includes small business, C&I, and MUSH customers.
• A significant portion of the residential market serves multifamily customers.
• The retail segment includes retail and wholesale suppliers.
• Jobs in the utility sector only include employees who work primarily on EE-related work, such as supporting EE programs and incentives across markets.
Most EE jobs are focused on the residential and C&I customer markets, with the remaining focused on retail and only a few on utility.
EE Jobs by Customer Market in Connecticut 2,800 Direct Jobs
Source: Navigant Analysis

/ ©2016 NAVIGANT CONSULTING, INC. ALL RIGHTS RESERVED49 / ©2016 NAVIGANT CONSULTING, INC. ALL RIGHTS RESERVED49
ANDREW KINROSSDirector, [email protected]
MICHELLE BEBRINManaging Consultant, Project [email protected]
ARIANA [email protected]
navigant.com
CONTACTS

505 Hudson Street | Hartford, CT 06106 | Phone: 860-270-8000
An Affirmative Action/Equal Opportunity Employer An Equal Opportunity Lender
MEMO
To: Bryan Garcia, President and CEO, Connecticut Green Bank Cc: Bart Kollen, Deputy Commissioner, DECD
From: Nandika Prakash, Ph.D., Senior Economist, DECD Re: Request by the Connecticut Green Bank on September 13, 2016 for Review and
Approval of the 2016 Clean Energy Jobs in Connecticut Study, Calculator, and Societal Perspective/Evaluation Framework Draft Fact Sheet
Date: October 14, 2016 Background
The Connecticut Green Bank (“Green Bank”), in conjunction with the Department of Economic and Community Development (“DECD”), engaged Navigant Consulting to conduct a study with regard to the economic impact (i.e., estimate of direct, indirect and induced job-years created) from the investment in clean energy deployment in Connecticut. The Green Bank assembled the following materials for DECD’s review and approval:
� Memo (September 13, 2016); � Clean Energy Jobs in Connecticut – Final Report by Navigant Consulting (August
10, 2016); � Clean Energy Jobs in Connecticut – Final Calculator by Navigant Consulting
(August 10, 2016); and � Evaluation Framework: Societal Perspective (Economic Development) – Draft
Fact Sheet by the Green Bank.
Review
The Connecticut Green Bank wants to estimate the extent to which investments in clean energy create value from a societal perspective as it relates to the economic development of the state. For Green Bank programs this will be measured as the relationship between investments and associated direct, indirect and induced jobs created. In coordination with DECD, the Green Bank contracted Navigant Consulting to refresh the investment-jobs portion of its Connecticut Renewable Energy and Energy Efficiency Economy Baseline Study (2009, 2010) by providing an updated calculator tool to estimate the economic development benefits from clean energy investments in Connecticut, as reflected in job-years created. The updated study focused on jobs associated with the investment area of the Connecticut Green Bank: renewable energy (RE) and energy efficiency (EE) project development and deployment, and product development and manufacturing. The final value output in the jobs calculator is job-years created per $1 million invested in clean

505 Hudson Street | Hartford, CT 06106 | Phone: 860-270-8000
An Affirmative Action/Equal Opportunity Employer An Equal Opportunity Lender
energy projects in Connecticut. DECD provided the indirect and induced jobs multiplier, obtained from simulations run using DECD’s Connecticut REMI model, to use in the updated calculator.
Findings
DECD reviewed The Green Bank’s Final Report, Final Calculator and the Fact Sheet. Our view is that the study is focused and illustrative and the estimates provided by the calculator are reasonable. DECD approves the report, the jobs calculator and the summary fact sheet.

Memo
To: The Audit, Compliance and Governance Committee of the Connecticut Green Bank
From: George Bellas, Vice President Finance and Administration
CC: Bryan Garcia, Brian Farnen, Eric Shrago
Date: October 21, 2016
Re: Updated Banking Resolutions
I am requesting that the Audit, Compliance and Governance Committee recommend that the Green Bank Board of Directors approve the updated banking resolutions set forth below. This revised set of resolutions will authorize the President and CEO of the Connecticut Green Bank and myself to set up bank accounts when a need to do so arises pursuant to an applicable Board authorization and/or consistent with our governance documents such as the creation of a special purpose entity or a loan program that requires the establishment of a bank account. RESOLUTION
RESOLVED, that Audit, Compliance and Governance Committee (the “Committee”)
recommend that for any FDIC insured bank requires a particular form of resolution of the
Connecticut Green Bank (“Green Bank”) Board of Directors for opening a bank account or for
other bank account matters, the President and CEO of the Green Bank is authorized to
approve the form of such resolutions after review and approval by the General Counsel of the
Green Bank,
RESOLVED, the Committee recommends that upon such approval, each resolution is adopted
and the Secretary or Assistant Secretary as applicable is authorized to certify the adoption of
all such resolutions.
RESOLVED, that the Committee recommends that the Board of Directors authorize the
President and CEO to open such bank accounts as are necessary or desirable in the ordinary
course of business for the Green Bank and any affiliates it controls that are in existence as of
the date of this resolution or to be created by the Board of Directors including but not limited
to:
CEFIA Holdings LLC
CT Solar Loan I LLC

CEFIA Services Inc.
CT Solar Lease 2 LLC
CGB Meriden Hydro LLC
RESOLVED, that the Committee recommends that the Board of Directors authorize the
following Green Bank employee positions to draw checks and initiate and release wire or ACH
transfers from such accounts in accordance with the established signatory authority as stated
in the Green Bank internal control procedures manual:
President and CEO
Vice President Finance and Administration
Executive Vice President and Chief Investment Officer
Vice President, Commercial and Industrial Programs
Managing Director, Statutory and Infrastructure Programs
Director of Operations
RESOLVED, that the Committee recommends that the Board of Directors affirm that as of the
date of this resolution these positions are occupied by the following individuals:
President and CEO - Bryan Garcia
Vice President Finance and Administration - George Bellas
Executive Vice President and Chief Investment Officer – Roberto Hunter
Vice President, Commercial and Industrial Programs – Michael Dykes
Managing Director, Statutory and Infrastructure Programs – Dale Hedman
Director of Operations – Eric Shrago
Secretary – Matthew Ranelli


