Embed Size (px)
Citation preview

Augmenting a Microbial Selective Plugging Technique with Polymer Flooding to Increase the Efficiency of Oil Recovery
-A Search for Synergy
Final Report
Project Start Date: 1 June 1999
Project End Date:
31 May 2002
By Lewis R. Brown
Charles U. Pittman, Jr. F. Leo Lynch A. Alex Vadie
W. Todd French
June 2002
DE-AC26-99BC15210
Prepared by Mississippi State University
P.O. Drawer GY Mississippi State, Mississippi 39762

ii
DISCLAIMER
This report was prepared as an account of work sponsored by an agency of the United
States Government. Neither the United States Government nor any agency thereof, nor
any of their employees, make any warrant, expressed or implied, or assumes any legal
liability or responsibility disclosed, or represents that its use would not infringe privately
owned rights. Reference herein to any specific commercial product, process, or service
by trade name, trademark, manufacturer, or otherwise does not necessarily constitute or
imply its endorsement, recommendation, or favoring by the United States Government or
any agency thereof. The views and opinions of authors expressed herein do not
necessarily state or reflect those of the United States Government.

iii
ABSTRACT Nine polymers [two Cr 3+ gelling partially hydrolyzed poly(acrylamides), four
viscosity enhancing 25% hydrolyzed poly(acrylamides) of high molecular weight, one
xanthan polymer, one biologically-produced gelling polymer of proprietary structure, and
a special polymer of moderate molecular weight designed to have a high critical
extension viscosity] were characterized (molecular weight, viscosities in water and brine
solutions, intrinsic viscosities) and they were shown to be noninhibitory to a variety of
oil-degrading microorganisms. Furthermore, they would not serve as a carbon and
energy source for these same microorganisms.
Polymer flooding was shown to increase aerial sweep efficiency in crushed Berea
sandstone/clay/oil sandpacks using simulated injection water containing 56Mn as the
radioactive tracer. Phosphate and nitrate additions also altered sweep pathways by
stimulating microbial growth which facilitated local plugging.
Studies using Berea sandstone cores demonstrated that high molecular weight
25% hydrolyzed poly(acrylamides) adsorbed on the internal surfaces until an equilibrium
layer had formed and further polymer traversed the cores without further adsorption.
Shear degradation of these polymers occurred during flow through the cores according to
viscosity studies.
No evidence was obtained for polymer flooding/MEOR synergy to produce more
oil recovery from live cores obtained from North Blowhorn Creek Oil Field. While
polymer flooding slows the flow rate through cores and redistributes water flow in cores,
its effect is short lived. As soon as the polymer pulse passes through the core the flow
rate again increases. The period required for effective MEOR is much longer. Thus,
microbial growth and its modification of sweep efficiency require a long time frame and
this does not match that of polymer flood pulses. Only continuous polymer flooding
could match up these time frames but this would require greater polymer consumption.
Long pulses or continuous polymer floods would sharply increase costs. Furthermore,
evidence of polymer adsorption within cores suggests that adsorption will seriously
deplete the polymer’s solution concentration as the distance from the wellbore increases.
Shear degradation of the polymer may also reduce its effectiveness.

iv
Magnetic resonance imaging of cores was used successfully to determine the oil
saturation level in cores and the special distribution of oil and water inside the cores
using a combination of inversion recovery (T1) relaxation time distribution experiments
and T2 profiles. Experiments were conducted at pixel resolution sizes of 0.47 mm2.
Difficulties included broad line widths and highly variable proton relaxation times which
were dependent on the core’s rock type and the fact both water and oil give 1H
adsorption. D2O experiments were employed to see oil in the absence of H2O.
Investigations using electron microscopy revealed that the indigenous microflora
in North Blowhorn Creek Oil Field produce considerable quantities of polymer. In fact,
this biopolymer may be the major physical cause for flow redistribution. Further, it was
found that the treatment of samples for electron microscopic examinations significantly
influenced the images obtained. In some cases the treatment resulted in images of
polymer appearing as nannobacteria. The results demonstrated the need to prepare
specimens in at least two different ways in order to obtain an accurate assessment of the
microbial role in MEOR.
From this study, it was concluded that polymer flooding and MEOR are not
synergistic, particularly from an economic standpoint. Evidence was obtained that
microbial permeability profile modification could be made more effective by increasing
the in situ production of polymer by the indigenous microflora.

v
TABLE OF CONTENTS ABSTRACT........................................................................................................v LIST OF TABLES............................................................................................................ vii
LIST OF FIGURES ......................................................................................................... viii
INTRODUCTION................................................................................................1 Objective .................................................................................................1 EXECUTIVE SUMMARY .................................................................................................2
EXPERIMENTAL ..............................................................................................................5
RESULTS AND DISCUSSION..........................................................................................7 Task 1. Select, Characterize, and Test Various Polymers for Their Impact on the Microflora Indigenous to Petroleum Reservoirs in Terms of Their Inhibitory Capabilities and Their Biodegradability. ....7
Chemical Characterization...........................................................................7 Microbiological Evaluation of Polymers ...................................................11
Test for Inhibitory Properties of Polymers ................................................12
Tests for the Ability of Polymers to Support Microbial Growth ...............13
Task 2. Determine the Ability of Selected Polymers to Increase the Aerial Extent (Aerial Sweep Efficiency) of Stratal Material Colonized by Microorganisms in Sandpacks........................................................ 14
Description of Sandpacks ..........................................................................14
Results of Sandpack Experiments..............................................................16
Task 3. Determine the Ability of Selected Polymer Flooding Protocols in Combination With Microbial Selective Plugging Techniques to Increase Oil Recovery From Berea Sandstone Core Plugs Prepared to Mimic a Depleted Oil Sand.................................... 20
Studies of Alcoflood 1285 (Mol wt~20,000,000) Water Solutions in Berea Cores ..........................................................................................................20
Core Flood Experiments ............................................................................22
Initial Magnetic Resonance Imaging Studies Using Berea Sandstone Cores.........................................................................................25
Further Nuclear Magnetic Resonance Imaging Analysis of Berea Sandstone Cores and North Blowhorn Creek Cores ..................................31
Results of NMR Imaging Experiments.......................................................31

vi
Task 4. Determine the Ability of Microbial Selective Plugging Technique in Combination With Selected Polymer Flooding Protocols to Increase Oil Recovery From Live Cores Obtained From Newly Drilled Wells........................................................................................ 40
Coreflood Experiments Using Live Cores.................................................40
Investigation of the Polymer (NaAMB) ....................................................45
Extensional Viscosity Studies....................................................................47
Role of Extensional Viscosity in Polymer Flooding for Mobility Control ........................................................................................49
Experiments on the Polymer NaAMB .......................................................56
Studies Using the Electron Microscope.....................................................62
Task 5. Prepare a Cost/Benefit Evaluation of Adding a Polymer-Flooding Procedure to a Microbial Enhanced Oil Recovery Process Using a Selective Plugging Technique................................................ 74
The Economic Aspects of MEOR and Polymer-MEOR ...........................74
CONCLUSIONS...........................................................................................................79
REFERENCES ..............................................................................................................81
ACKNOWLEDGEMENTS .......................................................................................83

vii
LIST OF TABLES
Table I: Viscosities of Brine and Polymer Solutions and Viscosities of Polymer Solutions After Pumping Through a Berea Core........................................21 Table II: The Relative Amount of Fluids in the Samples ..........................................39 Table III: Viscosity Measurements on NaAMB (Mol wt 1.25 · 106) Determined at
30.3°C in Standard Injection Brine Solutions.............................................46 Table IV: Flow Rates and Pressure Drops over Core A During Injection Water/Water NaAMB/Injection Waterflooding. ..............................................................47 Table V: Viscosity Measurements on RH-1 (Mol wt 1.25 · 106) Determined at
30.3 °C in Standard Injection Brine Solutions...........................................48 Table VI: Comparison of MEOR Methods..................................................................77

viii
LIST OF FIGURES
Figure 1. Photograph of a completely assembled sandpack...........................................15 Figure 2. Schematic of sandpack. ............................................................................15 Figure 3. Photograph of the setup for water-flooding the sandpacks. .....................16 Figure 4. Test using Alcoflood 1285 showing only a slight impact of polymer flooding on the pathway of injection water through the sandpack. ..........17 Figure 5. Test using Alcoflood 1285 showing diversion of the pathway of injection water through the sandpack caused by the injection of polymer. .............17 Figure 6. Test using Alcoflood 1285 showing impact of polymer flooding followed by nutrient additions. ................................................................................18 Figure 7. Test using crosslinking polymer Alcoflood 254S showing impact of polymer flooding followed by nutrient additions. ....................................19 Figure 8. Test using Flocon 4800 showing impact of polymer flooding followed by nutrient additions. .....................................................................................19 Figure 9. Diagrammatic sketch of the core testing assembly. ..................................23 Figure 10. Flow rate for Berea sandstone core when nutrients are added before
polymer. ....................................................................................................24 Figure 11. Flow rate for Berea sandstone core when polymer is added before nutrients.....................................................................................................24 Figure 12. NMR spectrum of oil-depleted Berea Core 1 containing residual North Blowhorn Creek Oil (API gravity 28-35.2). .............................................27 Figure 13. 1-D profile of oil-depleted Berea Core 1 containing residual North Blowhorn Creek Oil (API gravity 28-35.2). The pixel size is
0.47 mm. ...................................................................................................27 Figure 14. 1-D profile of oil-depleted Berea Core 2 containing residual North Blowhorn Creek Oil (API gravity 28-35.2) after an aqueous polymer flooding treatment with Alcoflood 1285. The pixel size is 0.47 mm. ...................................................................................................28 Figure 15. 2-D image of oil-depleted Berea Core 1 containing residual North Blowhorn Creek Oil (API gravity 28-35.2). .............................................28 Figure 16. 2-D image of oil-depleted Berea Core 2 containing residual North Blowhorn Creek Oil (API gravity 28-35.2) after an aqueous polymer
flooding treatment with Alcoflood 1285...................................................29 Figure 17. Inversion-recovery T1 data for the core samples and oil. .........................29 Figure 18. T1 distributions for the core samples and oil. ...........................................30 Figure 19. NMR images of four cores. .....................................................................32 Figure 20. One-dimensional T2 Profile: apparent oil volume per sample length. .....34 Figure 21. Core 1 and Core 4 relaxation distribution figures. ...................................34 Figure 22. The effects of microbial activity on flow rates for D4 Cut #8 Core 1 over time. This was a depleted oil core from the North Blowhorn Creek Oil Field that was treated with KNO3 and Na2HPO4 in the injection water. .35 Figure 23. The effects of Alcoflood 1285 treatment on flow rates over time. D4 cut #8 Sleeve 2 was used. ...............................................................................35 Figure 24. Sleeve One: Two-dimensional profiles. ...................................................36

ix
Figure. 25. Sleeve Two: Two-dimensional profiles....................................................37 Figure 26. One-dimensional profiles. .........................................................................38 Figure 27. Inversion recovery: T1 relaxation distributions. ........................................38 Figure 28. The effects of microbial activity on the flow rate using D4 Cut #15
Core 1.........................................................................................................41 Figure 29. The effects of polymer flooding (Alcoflood 1285) on the flow rate using
D4 Cut #15 Core 2. ....................................................................................41 Figure 30. The effects of microbial activity on the flow rate of injection water
through core D4 Cut #10 Core 1 over time................................................42 Figure 31. The effects of Alcoflood 1285 treatment and microbial activity on the flow
rate of injection water through core D4 Cut #10 Core 2 over time. ..........43 Figure 32. The effects of Flocon 4800 treatment and microbial activity on the flow
rate of injection water through core D4 Cut #9 Core 1 over time. ............44 Figure 33. The effects of microbial activity on the flow rate of injection water
through core D4 Cut #9 Core 2 over time..................................................44 Figure 34. Synthetic equation. .....................................................................................46 Figure 35. Onset of extensional viscosity. ...................................................................51 Figure 36. Determining the flow rate at which the extensional viscosity begins to
contribute. ..................................................................................................53 Figure 37. Specific viscosity vs. concentration for polymer Alcoflood 1285 in
standard brine solution...............................................................................55 Figure 38. Specific viscosity vs. concentration of the polymer NaAMB in standard
brine solution. ............................................................................................56 Figure 39. NaAMB (5 ppm) without prepumping. .....................................................57 Figure 40. NaAMB (5 ppm) after prepumping of 10 core volumes of polymer
solution through core. ................................................................................57 Figure 41. NaAMB (2.5 ppm) after prepumping. .......................................................58 Figure 42. NaAMB (1.0 ppm) after prepumping. .......................................................58 Figure 43. NaAMB (0.5 ppm) after prepumping. .......................................................59 Figure 44. NaAMB (5 ppm) after prepumping after all the above experiments had
been done on the same core. ......................................................................59 Figure 45. NaAMB (50 ppm) after prepumping Alcoflood 1285 polymer.................60 Figure 46. Pure brine solution after prepumping. .......................................................60 Figure 47. Alcoflood 1285 (15 ppm) after prepumping..............................................61 Figure 48. Different concentrations of Alcoflood 1285 polymer solutions. ...............61 Figure 49. EPS biofilm slime covers both rock matrix and the deformed cylindrical
bacteria in air-dried sample........................................................................63 Figure 50. EPS biofilm slime (S) occurs as a more or less continuous coat over both rock and distorted bacteria (B). Sample fixed in 10% glutaraldehyde. ....63 Figure 51. Abundant undeformed bacteria devoid of EPS slime. Ethanol and HMDS
dehydration sample. ...................................................................................64 Figure 52. Well-preserved bacterial body covered with tattered remnant-strings of
EPS. Gluteraldehyde fixation, ethanol and acetone dehydration, and critical point dried sample..........................................................................65
Figure 53. Grain-coating morphologies of EPS biofilm..............................................66 Figure 54. EPS biofilm completely covering bacterial bodies and mineral grains. ....66

x
Figure 55. EPS slime meniscus partially occluding porosity. .....................................67 Figure 56. Sandstone porosity partially filled with EPS biofilm. ...............................68 Figure 57. Large (> 1 µm) and small (< 1 µm) ovoid and spherical bacteria and
bacterial textures grown in less than one wk.. ...........................................69 Figure 58. Bacterium surrounded by thin “halo” of EPS.............................................69 Figure 59. Thick and clotted EPS biofilm developed in two wk growth.....................70 Figure 60. EPS slime (outlined) completely filling porosity between sandstone grains
(G). .............................................................................................................70 Figure 61. Purported nannobacteria drape between mineral crystal grains in
weathered rock from Italy. .........................................................................71 Figure 62. Nannobacteria on mineral surfaces in the Allende Meteorite, which fell to
Earth in 1968..............................................................................................72 Figure 63. Chain and filament-like morphology of EPS slime produced by
dehydration preservation resembles purported nannobacteria...................73 Figure 64. High-magnification image of “nannobacterial textures” produced by
dehydration of EPS biofilm. ......................................................................73

1
INTRODUCTION
In the U. S., the reliance on foreign oil imports is of increasing concern since it
accounts for about 60% of the total demand. The economically recoverable oil reserves
in this country are 27 billion barrels, which amounts to only about a 50-month supply.
There are however, approximately 348 billion barrels of known reserves in this country
that cannot be produced economically with presently employed technology. When
primary production, i.e. production using the reservoirs own energy, becomes
uneconomical, secondary and tertiary methods must be employed. Included among these
methods are waterflooding, polymer flooding, CO2 or N2 flooding, and microbial
enhanced oil recovery (MEOR). Currently, waterflooding is responsible for over 50% of
all oil recoveries in the world oil fields. When waterflooding becomes uneconomical, 1/2
to 2/3 of the original oil in place is still left in the ground.
Work conducted under a recently completed Department of Energy contract
demonstrated the effectiveness of a microbial permeability profile modification (MPPM)
technology in recovering more oil from a nearly depleted oil reservoir (Brown, Vadie,
and Stephens, 2002). This microbial enhanced oil recovery method is less costly than
other secondary or tertiary recovery methods in terms of cost per barrel of incremental oil
recovered other than waterflooding alone. In essence, this MPPM technology diverts
injection water from the larger channels in the reservoir to previously unswept areas
resulting in an increased efficiency of the waterflood operation.
Another secondary oil recovery method, waterflooding with polymers,
accomplishes the same result as the MPPM but works much faster although it is
considerably more expensive and its effectiveness is short-lived. MPPM, on the other
hand, is less expensive and longer lasting but takes more time to become effective. The
question arose as to weather coupling polymer flooding with MPPM would result in a
cost-effective synergy. This project addresses this question.
Objective
The objective of this project is to determine if the effectiveness of a microbial
permeability profile modification technique can be improved through polymer flooding.

2
EXECUTIVE SUMMARY
The objective of this project was to determine if the effectiveness of a microbial permeability profile modification technique could be improved through polymer flooding.
Task 1. Select, Characterize, and Test Various Polymers for Their Impact on the
Microflora Indigenous to Petroleum Reservoirs in Terms of Their Inhibitory
Capabilities and Their Biodegradability.
Task 2. Determine the Ability of Selected Polymers to Increase the Aerial Extent (Aerial
Sweep Efficiency) of Stratal Material Colonized by Microorganisms in
Sandpacks.
Task 3. Determine the Ability of Selected Polymer Flooding Protocols in Combination
With Microbial Selective Plugging Techniques to Increase Oil Recovery From
Berea Sandstone Core Plugs Prepared to Mimic a Depleted Oil Sand.
Task 4. Determine the Ability of Microbial Selective Plugging Technique in
Combination With Selected Polymer Flooding Protocols to Increase Oil
Recovery From Live Cores Obtained From Newly Drilled Wells.
Task 5. Prepare a Cost/Benefit Evaluation of Adding a Polymer-Flooding Procedure to a
Microbial Enhanced Oil Recovery Process Using a Selective Plugging
Technique.
Nine polymers [two Cr 3+ gelling partially hydrolyzed poly(acrylamides), four
viscosity enhancing 25% hydrolyzed poly(acrylamides) of high molecular weight, one
xanthan polymer, one biologically-produced gelling polymer of proprietary structure, and
a special polymer of moderate molecular weight designed to have a high critical
extension viscosity] were characterized (molecular weight, viscosities in water and brine
solutions, intrinsic viscosities) and they were shown to be noninhibitory to a variety of
oil-degrading microorganisms. Furthermore, they would not serve as a carbon and
energy source for these same microorganisms.
Polymer flooding was shown to increase aerial sweep efficiency in crushed Berea
sandstone/clay/oil sandpacks using simulated injection water containing 56Mn as the
radioactive tracer. Phosphate and nitrate additions also altered sweep pathways by
stimulating microbial growth which facilitated local plugging.

3
Studies using Berea sandstone cores demonstrated that high molecular weight
25% hydrolyzed poly(acrylamides) adsorbed on the internal surfaces until an equilibrium
layer had formed and further polymer traversed the cores without further adsorption.
Shear degradation of these polymers occurred during flow through the cores according to
viscosity studies.
No evidence was obtained for polymer flooding/MEOR synergy to produce more
oil recovery from live cores obtained from North Blowhorn Creek Oil Field. While
polymer flooding slows the flow rate through cores and redistributes water flow in cores,
its effect is short lived. As soon as the polymer pulse passes through the core the flow
rate again increases. The period required for effective MEOR is much longer. Thus,
microbial growth and its modification of sweep efficiency require a long time frame and
this does not match that of polymer flood pulses. Only continuous polymer flooding
could match up these time frames but this would require greater polymer consumption.
Long pulses or continuous polymer floods would sharply increase costs. Furthermore,
evidence of polymer adsorption within cores suggests that adsorption will seriously
deplete the polymer’s solution concentration as the distance from the wellbore increases.
Shear degradation of the polymer may also reduce its effectiveness.
Magnetic resonance imaging of cores was used successfully to determine the oil
saturation level in cores and the special distribution of oil and water inside the cores
using a combination of inversion recovery (T1) relaxation time distribution experiments
and T2 profiles. Experiments were conducted at pixel resolution sizes of 0.47 mm2.
Difficulties included broad line widths and highly variable proton relaxation times which
were dependent on the core’s rock type and the fact both water and oil give 1H
adsorption. D2O experiments were employed to see oil in the absence of H2O.
Investigations using electron microscopy revealed that the indigenous microflora
in North Blowhorn Creek Oil Field produce considerable quantities of polymer. In fact,
this biopolymer may be the major physical cause for flow redistribution. Further, it was
found that the treatment of samples for electron microscopic examinations significantly
influenced the images obtained. In some cases the treatment resulted in images of
polymer appearing as nannobacteria. The results demonstrated the need to prepare
specimens in at least two different ways in order to obtain an accurate assessment of the
microbial role in MEOR.

4
From this study, it was concluded that polymer flooding and MEOR are not
synergistic, particularly from an economic standpoint. Evidence was obtained that
microbial permeability profile modification could be made more effective by increasing
the in situ production of polymer by the indigenous microflora.

5
EXPERIMENTAL
In order to facilitate understanding of the results of this project, the detailed
experimental procedures utilized are included in the RESULTS AND DISSCUSION
section. Below is a brief synopsis of those procedures.
Task 1. Select, Characterize, and Test Various Polymers for Their Impact on the Microflora Indigenous to Petroleum Reservoirs in Terms of Their Inhibitory Capabilities and Their Biodegradability.
Classical chemical procedures were employed to characterize the polymers.
Conventional growth studies were used to determine the ability of polymers to support
growth. The disc assay procedure was used to determine the inhibitory properties of the
polymer.
Task 2. Determine the Ability of Selected Polymers to Increase the Aerial Extent (Aerial Sweep Efficiency) of Stratal Material Colonized by Microorganisms in Sandpacks.
Plexiglass sandpacks 6” x 6” x 0.25” were constructed and employed in this task. 56Mn was employed to trace the pathway of flow of injection water through the packs.
Task 3. Determine the Ability of Selected Polymer Flooding Protocols in Combination With Microbial Selective Plugging Techniques to Increase Oil Recovery From Berea Sandstone Core Plugs Prepared to Mimic a Depleted Oil Sand.
Berea sandstone cores 3” long by 1.5” in diameter were employed in this task.
Some of the cores were subjected to analysis using magnetic resonance imaging.
Task 4. Determine the Ability of Microbial Selective Plugging Technique in Combination With Selected Polymer Flooding Protocols to Increase Oil Recovery From Live Cores Obtained From Newly Drilled Wells.
Cores from the North Blowhorn Creek Oil Field were employed in this task.
Electron microscopic studies were also performed.

6
Task 5. Prepare a Cost/Benefit Evaluation of Adding a Polymer-Flooding Procedure to a Microbial Enhanced Oil Recovery Process Using a Selective Plugging Technique.
Data for the evaluation in this task were obtained from work performed in this
study, previous studies, and the literature.

7
RESULTS AND DISCUSSION
Task 1. Select, Characterize, and Test Various Polymers for Their Impact on the Microflora Indigenous to Petroleum Reservoirs in Terms of Their Inhibitory Capabilities and Their Biodegradability. Chemical Characterization
Seven different polymers have been characterized as follows:
Polymers which are soluble (linear) can serve as either gel-forming systems or
related soluble polymers can exert mobility control by viscosity enhancement. The first
two systems described below are gelling systems. When dissolved in water with Cr+3
present, slow gellation occurs after the system has been pumped into the oil-bearing
stratum. This occurs slowly. The time delay allows migration of the polymer out into the
oil-bearing rock prior to gellation.
1. Alcoflood 251S This polymer is a poly(acrylamide). It is used with
crosslinking agents, such as Cr+3 to form a gel down hole, but the polymer
itself, is not crosslinked or gelled.
Mol wt above 5x10⁶
Accurate mol wt and mol wt distribution values could not be obtained
because its dn/dc value was 0.1869 at 250C using 632.8 nm light (dn/dc is
the dependence of refractive index on polymer concentration). This value
of dn/dc makes it very difficult for a refractive index detector to give
strong signals. Strong signals are required for high mol wt polymers
which must be employed in dilute concentrations in order to get gel
permeation chromatography (gpc) measurements. Dialysis experiments
confirmed the as-received polymer was free of any salts.
C C
H
H
H
CO NH2
)(

8
2. KUSP1 is a biologically produced gelling polymer obtained from Kansas
State University.
3. Alcoflood 254S This is a copolymer of acrylamide (75%) and acrylic acid
(25%). It produces strong durable, temperature-tolerant cross-linked gels
from low viscosity solutions when treated with Cr+3. It can be used to
treat production wells with high fluid levels and high water/oil ratios, or
for treating severe channeling problems and fractures.
Mol wt 500,000
Gel-times Conc. Gel Time at 800 F
200 ppm 23.0 h {in API Seawater} 600 ppm 12.0 h {in API Seawater}
359 ppm 20.0 h {600 F API Fresh water} 758 ppm 3.8 h {600 F API Fresh water }
1107 ppm 1.9 h {600 F API Fresh water }
4-7. Alcofloods 1135, 1235, 1275A, and 1285 These 4 polymers are all
acrylamide (70%), acrylic acid (30%) copolymers of random structure.
They are anionic in water since the acrylic acid carboxyl functions are
more acidic than water.
C C
H
H
H
CO NH2
C C
H
H
H
CO OH
.70 .30 )( )([ ]
C C
H
H
H
C C
H
H
H
CO OH
.75 .25 )( ) ([ ]C
O NH2

9
Some Characterization Data
Polymer Solution Mol Wt Ionic Character pH of 1% by wt soln.
1135 13,000,000 anionic 6.8-7.8
1235 ~9,000,000-14,000,000 anionic 6.8-7.8
1275A 18,000,000-24,000,000 anionic 6.8-7.8
1285 ~20,000,000 anionic 6.8-7.8
These polymers were free of added salt according to dialysis experiments.
Viscosity in Water at 1000 F (380 C)
Polymer (conc.) in API Fresh Water in API Sea Water Intrinsic Viscosity
(ppm) (cps) (cps) (dl/g)
1135 (500) 4 2.0
(1000) 14 5.0
1235 (500) 4 2.0 12.0
(1000) 12 3.0
1275A (500) 14 7.0 23-26.5
(1000) 35 14.0
1285 (500) 11 2.5 24.0
(1000) 31 5.0

10
8. Xanthan Polymer (Flocon 4800)
Structure of Flocon 4800
Mol wt distribution 1,000,000 - 2,000,000
This product contains 3-5% polymer in water (as received) and >2000 ppm
formaldehyde as a preservative for storage. Liquid density 0.95-1.00 g/ml.
The working viscosity is 5-40 cps. The viscosity does not change over the pH
range of 5 to 12. This is not a randomly coiling polymer and a big advantage is that its
solution viscosity does not vary strongly as the ionic strength varies (e.g., use in brines).
For example, when Flocon 4800 is used in the 150-1,000 ppm conc. range, the viscosity
of its aqueous brine solutions (containing from 500 to 70,000 ppm of salts) remains in the
range of 5 to 35 cps. This rod-like polymer can maintain relatively unchanged solution
viscosities as the brine concentration changes. Data are shown on page 6.
Flocon 4800 solutions have proven to be pseudo-plastic. Thus, as the shear rate
increases (during stirring), the viscosity decreases. This is because molecules align
during shear in the direction of flow.
A proprietary polymer of microbial origin and unknown structure, KUSP1 was
obtained from Kansas State University. It is described as a gelling polymer, acting by
coordinating transition metal ions present in the brine during waterflooding.

11
Conc of Polymer Shear Rate Brookfield Viscosity (ppm) (sec-1) (cps) 1000 7.3 40 1000 50.0 14 500 9.0 9
Viscosity vs CaCl2 Conc in Water Flocon Conc. Viscosity CaCl2 Conc. (ppm) (cps) (ppm) 500 14.0 0
12.5 10 9.5 100 8.5 1000 9.0 10,000 10.5 100,000
Microbiological Evaluation of Polymers
Tests were conducted to determine if a polymer was (1) inhibitory to microbial
cultures obtained from petroleum reservoirs or (2) would serve as a carbon and energy
source for these cultures. Five cultures were selected for the testing. The cultures and
some of their characteristics are as follows:
Culture #1 is a gram positive bacillus, non-acid fast, non-sporeforming, obligate
anaerobe isolated from the Mabee oil field situated in Andrews Co., Tx.
Culture #3 is a gram negative bacillus, non-acid fast, non-sporeforming,
microaerophile isolated from the Mabee oil field situated in Andrews Co., Tx.
Culture #10 is a gram positive coccobacillus, acid fast, obligate anaerobe isolated
from the Kern river Oil field situated in Kern Co., CA.
Culture #16 is a gram positive coccobacillus, acid fast, microaerophile isolated
from the Kern River Oil field situated in Kern Co., CA.
Culture #17 is a gram positive bacillus, non-acid fast, facultative anaerobe
isolated from the Kern River oil field situated in Kern Co., CA.
All media employed were prepared using simulated production water in place of
distilled water, and was composed of 10.9 g CaCl2, 2.71 g MgCl2, 4.57g, BaCl2, 1.84g
Na2SO4, and 147.8g NaCl in 50 L of distilled water.

12
In preparing media, this simulated production water was supplemented with 1g
NaNO3 and 0.26g NaH2PO4 per L and hereinafter will be referred to as PWB (production
water broth).
Test for Inhibitory Properties of Polymers
The protocol to determine if a polymer is inhibitory to cultures obtained from oil
reservoirs was the disc assay procedure. Tests were conducted using both Bacto-Plate
Count Agar (PCA) and Oil Agar (OA) prepared as follows. The crude oil employed was
obtained from the North Blowhorn Creek Oil Field situated in Lamar Co., AL. PWB was
saturated with oil by vigorously mixing for one h. Granulated agar (1.7%, w/v) was
added to the oil-saturated PWB and dispensed in 18 ml amounts into 20 x 145 mm screw-
capped test tubes. Crude oil (0.18 ml/tube) was added and the medium sterilized in the
autoclave at 121C for 15 min. The PCA was prepared in 18 ml amounts in 20 x 145 mm
screw-capped test tubes and sterilized as above.
A 10% suspension (w/v) of each polymer was prepared by adding 1.0 g of
polymer to 9.0 ml of sterile distilled water. BBL® ½ inch paper discs were placed
aseptically in the 10% polymer solution and allowed to remain for 24 h. The discs then
were taken out of the suspension and allowed to air dry. Under anaerobic conditions, 0.2
ml of the test microbial culture was added to 18 ml of melted and cooled (45 C) OA and
mixed. Approximately 3.5 ml of the inoculated agar was poured into 20, 35x10 mm
plastic petri dishes. After the agar solidified, a polymer-saturated disc was placed on the
surface of the agar. Duplicates were done for each polymer. Plates of inoculated PCA
were prepared using cultures #3, 10, 16, and 17. Plates prepared as above but without
polymer-saturated discs were employed as controls.
The petri plates were incubated in BBL® anaerobic chambers for 20 d at 30 C.
After incubation, plates were examined for zones of inhibition around the discs indicating
inhibition of the culture by the polymer.
The following eight polymers have been tested and shown not to be inhibitory to
the microbial cultures –Alcoflood 251S, KUSP1, Alcoflood 254S, Alcoflood 1135,
Alcoflood 1235, Alcoflood 1275A, Alcoflood 1285, and Flocon 4800.
In addition to the eight polymers cited above, Dr. Hester (University of Southern
Mississippi) has supplied us with a polymer solution of a polymer (DOE/NPTO grant),
which exhibits very large extensional viscosities relative to their shear-based viscosities.
13
Tests have shown that the polymer is not toxic to any of the aerobic or anaerobic
organisms nor is it degraded by them.
Tests for the Ability of Polymers to Support Microbial Growth
Tests of the ability of microbial cultures from oil reservoirs to grow on polymer
and/or degrade the polymer are being conducted using three different media - (1) polymer
in PWB, (2) polymer in PWB supplemented with 1% (v/v) oil, and (3) polymer in PWB
supplemented with 1% (v/v) molasses were sterilized by autoclaving for 15 min at 121C.
A 1.8% polymer suspension (w/v) was prepared by placing 1.8 g of polymer in 100 ml of
distilled water. One ml of the 1.8% polymer suspension was added to 18 ml of each of
the three media listed above to make a 0.1% polymer medium. Under anaerobic
conditions, 10 µl of each of the five microbial cultures were added to two tubes of each
of the three media. Controls were prepared with no cells added to medium plus polymer
and with only media with no cells and no polymer. All of the tubes were allowed to
incubate at 30C and monitored weekly for growth or alterations in the polymer.
Growth was observed in cultures containing molasses plus polymer (Alcoflood
1135, Alcoflood 1235, Alcoflood 1275A, Alcoflood 1285, and 254S) after three wks of
incubation. One of the five cultures showed slight growth in the molasses plus polymer
KUSP1. Also, after three wks, Culture #16 grew slightly in oil medium plus polymer
(Alcoflood 1135, Alcoflood 1275A, Alcoflood 1285, and KUSP1). These results indicate
the lack of inhibitory properties of the polymers. No growth was obtained in samples
containing polymer as the sole source of carbon and energy even after 45 d and therefore
their destruction by microorganisms present in the reservoir does not seem to be a
problem. All of the above tests have been repeated and identical results obtained.

14
Task 2. Determine the Ability of Selected Polymers to Increase the Aerial Extent (Aerial Sweep Efficiency) of Stratal Material Colonized by Microorganisms in Sandpacks. Description of Sandpacks
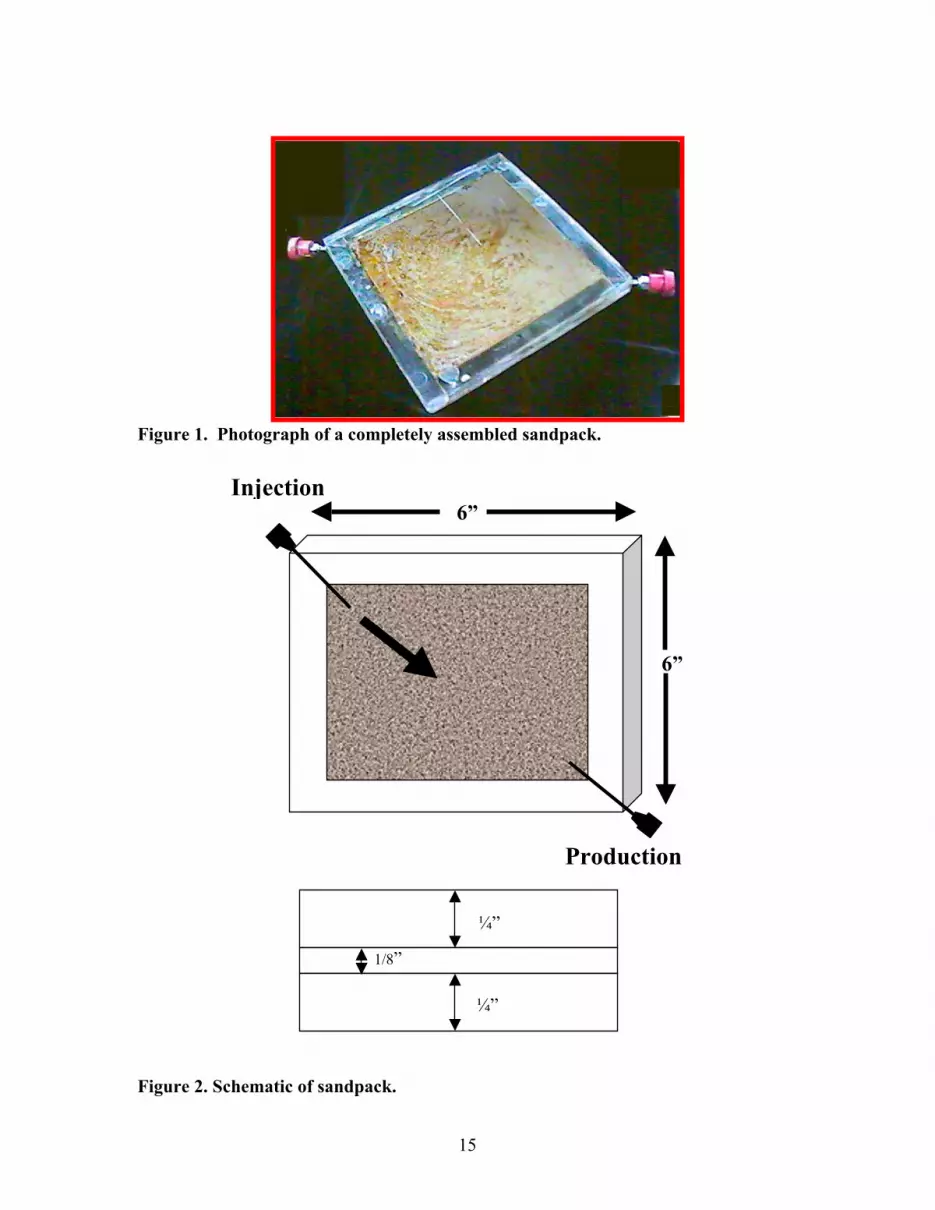
Each Plexiglas sandpack is 6" x 6" by 0.25" and has a total internal volume of
41.49 ml. The sandpacks are fitted with a No.17 hypodermic needle in each of two
opposite corners to serve as a means of introducing liquids into the sandpacks and
collecting the effluent. A 1" diameter plug was glued onto a 1 1/2" x 1 1/2" Plexiglas
base plate to close the sandpack (secured using methylene chloride) following filling with
formation materials.
Originally, the protocol for studies using sandpacks involved tracing the pathway
of the flow of injection water through the sandpack using 36Cl as the tracer. After
consultation with nuclear engineers at Mississippi State University, it was decided that
the flow of injection water through the pack could be adequately achieved using 56Mn.
This switch from 36Cl to 56Mn offered a number of advantages. In the first place, the
half-life of the 56Mn is 2 h vs. 301,000 y for 36Cl, thus reducing problems associated with
the collection and storage of spent injection water. Also, the amounts of 56Mn required
for a given experiment can be generated on site, obviating the need to purchase and store 36Cl . Most importantly, however, since different gamma emitters, emit at different
wavelengths, studies with multiple tracers is possible. For example, the use of 51Cr as a
cross-linker for a polymer would enable us to track the movement and location of the
polymer per se while following the flow of the injection water using soluble 56Mn ions.
Much difficulty was encountered in formulating the packing material in the
sandpacks. The chosen composition of the packing material is 95 g crushed Berea
sandstone, 5 g clay, 11 g oil-microorganism mixture, and 8 ml simulated injection water.
Figure 1 is a photograph of completed sandpack ready for use. Figure 2 is a
diagrammatic sketch of the sandpack showing dimensions. Prior to use in an experiment,
simulated injection water (hereinafter referred to as water) is allowed to flow through the
sandpack to establish a flow path. The water is allowed to flow through the pack using
only the pressure achieved by having the water reservoir situated three ft above the pack
as illustrated in Figure 3.
15
Figure 1. Photograph of a completely assembled sandpack.
Figure 2. Schematic of sandpack.
6”
6”
Injection
Production
¼”
¼”
1/8”

16
Figure 3. Photograph of the setup for waterflooding the sandpacks.
Results of Sandpack Experiments
The injection water employed to track the path of the water through the pack was
prepared as follows. The following ingredients were dissolved separately in 2 L of
distilled water: 10.9 g of CaCl2, 2.71g of MgCl2, 4.57g of BaCl2, 1.84 g of Na2SO4, and
147.8 g of NaCl. Once dissolved, the solutions were mixed in a 50 L carboy. The
volume of this solution was adjusted to 50 L using distilled water. The pH of the
injection water was adjusted to 7.0 using a 10% HCl solution (v/v).
After the path of the water through the pack had been established, a polymer
solution was injected and the path of the injection water again determined using the 56Mn
solution described above. Representative data are shown in Figure 4, and as may be seen,
the path of the injection water was altered to some degree by the injection of the polymer
solution. In other experiments, the polymer solution drastically altered the flow path of

17
the injection water (see Figure 5). Polymer Alcoflood 1285 was employed in the above
tests.
Figure 4. Test using Alcoflood 1285 showing only a slight impact of polymer
flooding on the pathway of injection water through the sandpack. Figure 5. Test using Alcoflood 1285 showing diversion of the pathway of injection
water through the sandpack caused by the injection of polymer.
PPrree--PPoollyymmeerr FFllooooddiinngg PPoosstt--PPoollyymmeerrFFllooooddiinngg
PPrree--PPoollyymmeerr FFllooooddiinngg PPoosstt--PPoollyymmeerr FFllooooddiinngg

18
The polymer classes tested were a polyacrylamide (Alcoflood 1285), a cross-
linking polymer (Alcoflood 254S), and a xanthan polymer (Flocon 4800). All three
classes of polymers were able to alter the path of the injection water as may be seen in
Figures 6, 7, and 8. The Alcoflood 1285 polymer began altering the flow of injection
water at the source of injection while the Alcoflood 254s and Flocon 4800 altered the
flow after moving at least 3 cm into the pack. This is believed to be due to the fact that
the Alcoflood 1285 was more viscous than the other polymers at the concentrations
tested. After the flow of injection water had been established, the packs were
supplemented with nitrogen and phosphorous.
The addition of a nitrogen source and a phosphorous source encouraged the
growth of microorganisms in the newly polymer-established injection water paths
resulting in these paths being altered (Figures 6, 7, and 8). Control packs not receiving
polymer or microbial nutrients were setup to determine if the path of injection water
could be altered by repeated waterfloodings. The control packs showed that repeated
waterfloodings would not alter the flow of the injection water.
Figure 6. Test using Alcoflood 1285 showing impact of polymer flooding followed
by nutrient additions.
PPrree--PPoollyymmeerr FFllooooddiinngg PPoosstt--PPoollyymmeerr FFllooooddiinngg PPoosstt--NNuuttrriieennttss

19
Figure 7. Test using crosslinking polymer Alcoflood 254S showing impact of
polymer flooding followed by nutrient additions.
Figure 8. Test using Flocon 4800 showing impact of polymer flooding followed by
nutrient additions.
PPrree--PPoollyymmeerr FFllooooddiinngg PPoosstt--PPoollyymmeerr FFllooooddiinngg PPoosstt--NNuuttrriieennttss
PPrree--PPoollyymmeerr FFllooooddiinngg PPoosstt--PPoollyymmeerr FFllooooddiinngg PPoosstt--NNuuttrriieennttss
20
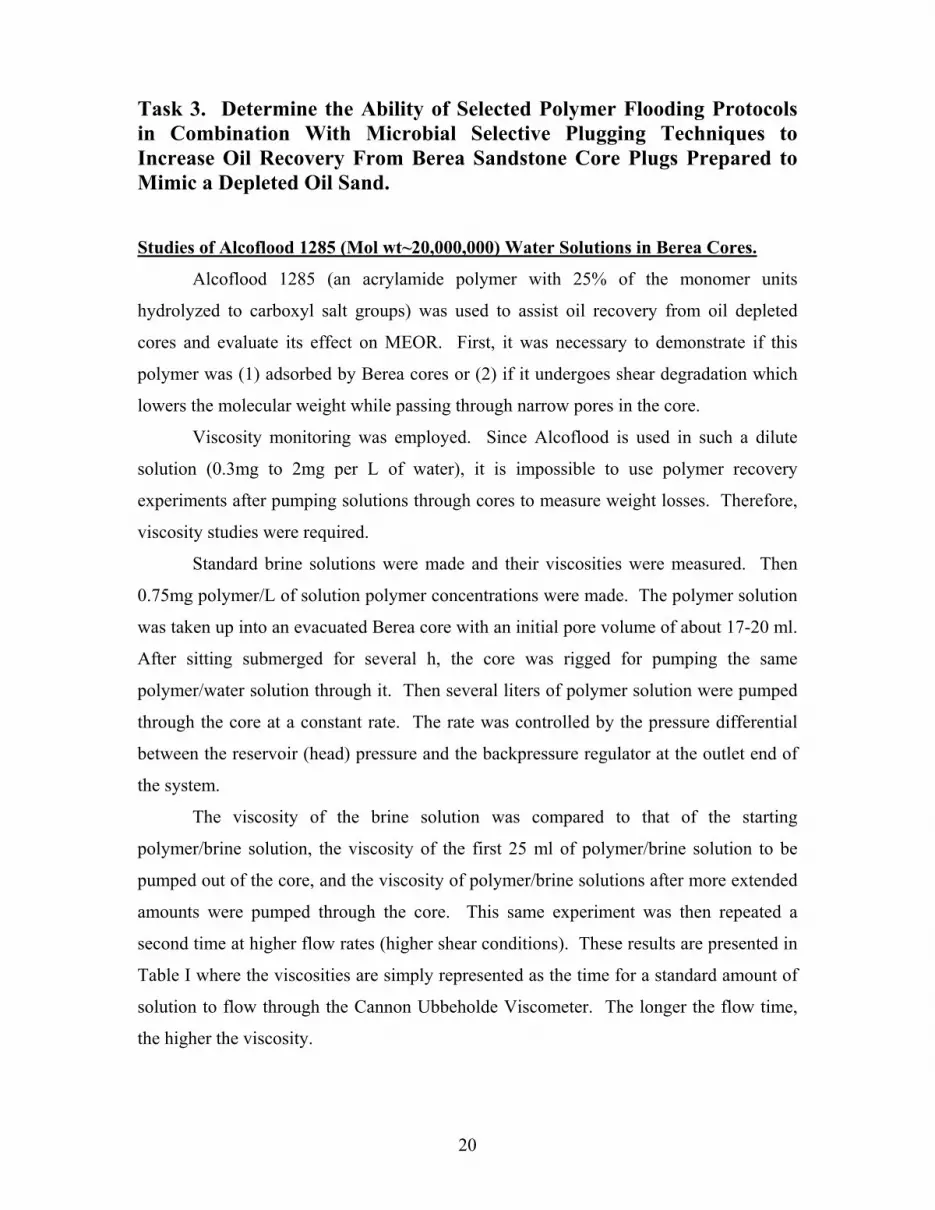
Task 3. Determine the Ability of Selected Polymer Flooding Protocols in Combination With Microbial Selective Plugging Techniques to Increase Oil Recovery From Berea Sandstone Core Plugs Prepared to Mimic a Depleted Oil Sand. Studies of Alcoflood 1285 (Mol wt~20,000,000) Water Solutions in Berea Cores.
Alcoflood 1285 (an acrylamide polymer with 25% of the monomer units
hydrolyzed to carboxyl salt groups) was used to assist oil recovery from oil depleted
cores and evaluate its effect on MEOR. First, it was necessary to demonstrate if this
polymer was (1) adsorbed by Berea cores or (2) if it undergoes shear degradation which
lowers the molecular weight while passing through narrow pores in the core.
Viscosity monitoring was employed. Since Alcoflood is used in such a dilute
solution (0.3mg to 2mg per L of water), it is impossible to use polymer recovery
experiments after pumping solutions through cores to measure weight losses. Therefore,
viscosity studies were required.
Standard brine solutions were made and their viscosities were measured. Then
0.75mg polymer/L of solution polymer concentrations were made. The polymer solution
was taken up into an evacuated Berea core with an initial pore volume of about 17-20 ml.
After sitting submerged for several h, the core was rigged for pumping the same
polymer/water solution through it. Then several liters of polymer solution were pumped
through the core at a constant rate. The rate was controlled by the pressure differential
between the reservoir (head) pressure and the backpressure regulator at the outlet end of
the system.
The viscosity of the brine solution was compared to that of the starting
polymer/brine solution, the viscosity of the first 25 ml of polymer/brine solution to be
pumped out of the core, and the viscosity of polymer/brine solutions after more extended
amounts were pumped through the core. This same experiment was then repeated a
second time at higher flow rates (higher shear conditions). These results are presented in
Table I where the viscosities are simply represented as the time for a standard amount of
solution to flow through the Cannon Ubbeholde Viscometer. The longer the flow time,
the higher the viscosity.

21
Table I: Viscosities of Brine and Polymer Solutions and Viscosities of Polymer Solutions After Pumping Through a Berea Core.
Exp. 1
Flow Rate = 0.034 ml/sec Exp.2
Flow Rate = 0.213 ml/sec
Brine Solution: (ηo sec) 99 99 Brine/Polymer (starting solution)
130.9 125.7
First 25 ml from core 98.5 124.7 Middle Sample
(at 2455 ml pumped) 114.0 (at 850 ml pumped) 116.0
Final Sample (at 3226 ml pumped) 115.3 (at 1700 ml pumped) 113.3
* In both experiments a polymer concentration of 0.75 mg of Alcoflood 1285 per liter of brine was used.
When the core is first filled with polymer solution, essentially all of the polymer
is adsorbed on the internal Berea core surfaces. This can be seen by comparing the
viscosity of the first ~1.5 core vol of solution to be pumped out (25 ml vs ~17 ml pore
vol). The initial polymer solution viscosity of 130.9 cp has dropped to 98.5 cp, which is
essentially the same as that of pure brine solution (99 sec). Thus, the polymer present in
that volume of solution has been adsorbed. After pumping 2455 ml through (e.g. 144
core pore volumes), the viscosity of the exiting polymer was 114 cp. This remained the
same after 3226 ml (190 core void volumes) were pumped through (e.g. 115.3 cp).
Thus, all the internal pore volume surfaces have reached equilibrium-coating levels. The
difference in viscosity between the original polymer solution and that pumped out much
later (130.9 cp – 114 cp = 16.9 cp) must then be due to shear degradation.
In the second experiment, the first 1.5 core void volumes of liquid pumped out of
the core had the same viscosity as that of the initially made polymer solution (125.7 cp
and 124.7 cp, respectively). This contrasts sharply with the first experiment but is
completely logical. In the first experiment, the core surfaces had never previously been
exposed to polymer. This same core, however, was used in the second experiment. By
that time it had had 3226 ml of polymer solution pumped through it (e.g. 2.42 mg of
polymer solution had been pumped into the core before experiment 2 had started). Thus,

22
when experiment 2 began, the core surfaces had already adsorbed all the polymer they
could hold. After 850 ml and 1700 ml of polymer solution had been pumped through
(experiment 2) the viscosities (115 cp and 113.3 cp) were the same as those seen at the
middle and end of experiment one (114.0 cp and 115.3 cp, respectively). Thus, we
suggest shear degradation during flow through the core probably accounted for the
difference in the viscosity between the initial polymer solution and that pumped through
the core. However, if shear degradation accounts for this drop, the amount of shear
degradation in the two experiments was essentially the same despite the fact the flow rate
in the second experiment was about 6.3 times greater.
Core Flood Experiments
The assembly prepared to test polymer flooding and microbial growth is shown in
Figure 9 and several cores prepared to mimic a depleted oil sand. A core was placed in a
vacuum chamber, evacuated, and filled with injection water. The water-saturated core
was placed in the core flood assembly and injection water flowed through the core.
Crude oil from the North Blowhorn Oil Field (Lamar Co., AL) then was pumped through
the core until no more water was present in the effluent. Injection water was again
pumped through the core until no more oil was present in the effluent injection water. At
this point, the core is considered equivalent to a depleted oil sand.
The cores as prepared above were employed in experiments to determine the
effects of microbial activity combined with polymer flooding on the flow rate of injection
water through these cores. When microbial activity is encouraged through the addition of
KNO3 and Na2HPO4 and then followed by an application of polymer, the flow rate is
greatly reduced by the microbial growth and little more plugging seems to have taken
place because of the polymer addition (see Figure 10). This suggests that the flow paths
established prior to the start of the investigation were beginning to become plugged.
Further evidence that established flow paths were being plugged and new flow paths
were being established was shown by the presence of oil 61 d after treatment began. The
impact on flow rates, as shown in Figure 11, was more pronounced initially when the
core was treated first with polymer. Increases in flow rate occurred even after the nutrient
additions began and it was only after 45 d that the flow rate decreased. The flow rate

23
BP: Back Pressure regulator CA: Compressed Air CH: Core Holder FS: Fluid Separator PS: Polymer System N: Nitrogen NS: Nutrient Solution PG: Pressure Guage R: Regulator SW: Simulated production Water V: Valve
Figure 9. Diagrammatic sketch of the core testing assembly.
S W N
S P S
NPG
BP
F S
C
A
PG
CH
R
V V V R
V V
V
V

24
Figure 10. Flow rate for Berea sandstone core when nutrients are added before polymer.
Figure 11. Flow rate for Berea sandstone core when polymer is added before
nutrients.
0.00
2.00
4.00
6.00
8.00
10.00
12.00
14.00
16.00
10 20 30 40 50 60 70 80
N itrate Added
Phosphate Added
Polym er Added
N itrate Added
Phosphate Added
N itrate Added
Phosphate Added
Days
0.00
2.00
4.00
6.00
8.00
10.00
12.00
14.00
16.00
5 10 15 20 25 30 35 40 45 50 55
Flow
Rat
e (m
l/min
)
N itrate Added
Phosphate Added
Polymer Added
Nitrate Added
Phosphate Added
Nitrate Added
Phosphate Added
Days
Flow
Rat
e (m
l/min
)

25
decreased from 8.0 ml/min to 0.8 ml/min with the addition of the polymer solution. The
flow rates slowly increased to 8.0 ml/min with the addition of the nutrient solutions
suggesting that the polymer was being removed from the flow paths. The flow rate was
decreased again 5 d later suggesting that microbial growth was responsible for the
decrease.
Evidence for the plugging of the established flow paths and the establishment of
new flow paths was shown by the presence of oil 37 d after treatment began. In this
experiment, the addition of polymer caused a large decrease in flow rate, but this was
followed by an increase in flow rate. These data suggest that very little growth of the
microflora was occurring until the polymer had been flushed from the core.
It is interesting to note that after 20 d of nutrient feeding, the flow rate had been
reduced 69% while the flow rate after polymer flooding dropped 89% initially but was
reduced only 66% after 20 d.
Other experiments demonstrated that the injection of a polymer solutions
(Alcofloods 1235, 1275A, 1285, and Flocon 4800) through the core resulted in the
recovery of additional oil from the core. Similarly, when the injection water was
supplemented with microbial nutrients (potassium nitrate and disodium hydrogen
phosphate) additional oil was observed in the effluent several days after the injections.
Initial Magnetic Resonance Imaging Studies Using Berea Sandstone Cores
The original plan was to alternate the polymer and nutrient injections in the search
for synergy with the main criterion for success being the recovery of oil from the cores.
However, at the contractor’s meeting held in Denver in June 2000 Gary Walker (DOE)
suggested several individuals for us to contact in regard to techniques being used by
others to increase the amount of information we can obtain in our core experiments.
Discussions of NMR imaging experiments were held with Dr. Ted Watson of Texas
A&M. He then conducted a preliminary magnetic resonance imaging (MRI) experiments
as described below.
Initial attempts were made to image oil-depleted Berea sandstone core by NMR
using a GE2-Tesla CSI-II imager/spectrometer with a 31 cm magnet bore. This
spectrometer was equipped with a 20G/cm shielded gradient-coil set and a birdcage RF
coil. The work was performed at Texas A&M University by Professor Ted Watson (also

26
a DOE/NPTO grant holder). The key question was: can regions of H2O versus regions of
oil clearly be imaged using 1H NMR? If successful, the three-dimensional images would
permit us to directly observe (to high resolution) the locations of oil versus water
throughout the core and follow these as a function of both polymer/waterflooding and
waterflooding after microbial growth. Thus, a direct observation between patterns of
water flow and oil removal would be obtained upon, (a) polymer flooding, (b) MEOR
experiments, or (c) synergism between polymer flooding and MEOR.
The following suite of experiments were performed on two Berea sandstone cores
(about 3.5 in long and 1.25 in dia.).
Core 1. A core was prepared as described above using oil from the North
Blowhorn Creek Oil Field/Lamar Co. AL (API gravity 28-35.2) .
Core 2. This core was identical to Core 1 except that it was subsequently treated
with a polymer flood where 255 ml (12-14 core void volumes) of a polymer solution
(Alcoflood 1285, mol wt ~ 20,000,000: 75 mg per L of standard brine solution) was
pumped through the core.
The cores were:
(a) Profile imaged along longitudinal axis,
(b) Two-dimensional images were made (horizontal slices of 5 mm
thickness taken),
(c) Inversion recovery (T1) experiments were done,
(d) NMR 1H spectra were taken. Also, inversion recovery experiments
were done on both oil and water.
Unfortunately, these experiments proved unable to distinguish between the oil and
water regions of the cores due to severe NMR line-broadening associated with the Berea
sandstone. This can be seen in Figure 12 where a broad 1H line width of ~2000 Hz was
obtained. This width is much larger than the 300 Hz (at 85 MHz) chemical shift
difference between the protons in oil (e.g. C-H) and the protons in water (e.g. O-H). This
means it was necessary to reduce the line broadening. Berea sandstone is particularly bad
in this respect but, it was hoped that the use of cores from the North Blowhorn Creek Oil
Field would reduce this problem.
Figure 13 shows a one-dimensional profile of the 1H signal intensity across the
length of the Core 1 at a pixel size of 0.47 mm. A similar profile of Core 2 shows some

27
fluid loss from one end of the polymer-flooded sample (Figure 14). Two-dimensional
images are shown in Figures 15 and 16 for Cores 1 and 2, respectively. These images are
of 5 mm thick slices taken directly down the center of the cores’ long axes. The
brightened areas indicate greater concentrations of 1H nuclei (e.g. oil and water). The
dark areas are rock. If resonances for oil and water regions could be resolved,
visualization of oil and water distributions would be possible on scale similar to that
shown in these images. Inversion-recovery experiments are shown for the oil sample and
for Cores 1 and 2 in Figure 17.
Figure 12. NMR spectrum of oil-depleted Berea Core 1 containing residual North Blowhorn Creek Oil (API gravity 28-35.2).
Figure 13. 1-D profile of oil-depleted Berea Core 1 containing residual North
Blowhorn Creek Oil (API gravity 28-35.2). The pixel size is 0.47 mm.

28
Figure 14. 1-D profile of oil-depleted Berea Core 2 containing residual North
Blowhorn Creek Oil (API gravity 28-35.2) after an aqueous polymer flooding treatment with Alcoflood 1285. The pixel size is 0.47 mm.
Figure 15. 2-D image of oil-depleted Berea Core 1 containing residual North
Blowhorn Creek Oil (API gravity 28-35.2).

29
Figure 16. 2-D image of oil-depleted Berea Core 2 containing residual North
Blowhorn Creek Oil (API gravity 28-35.2) after an aqueous polymer flooding treatment with Alcoflood 1285.
Figure 17. Inversion-recovery T1 data for the core samples and oil.
Oil signal relaxation occurs at a different rate in the core versus in bulk. This
observation may simply reflect that the signal in the core represents both oil and water.
The relaxation characteristics of Cores 1 and 2 differed. The calculated relaxation

30
distributions are shown in Figure 18. The tall peak in Core 1 belongs to water and the
less intense peak belongs to oil. The interpretation of the relaxation times for Core 2 is
more difficult. Clearly two peaks exist. The taller is assigned to water and the shorter
(fast relaxation ) is assigned to oil.
Several experiments were attempted to get reasonable oil/water contrast in order
to clearly follow changes in water and oil distributions in cores as a function of
treatments.
1. Use D2O instead of H2O. Thus, only the oil protons will be seen and oil
distribution would be clearly imaged.
2. Use different rock samples. For example carbonate rocks have narrow line-
widths, which would give more accurate determinations of the relative
amounts of each fluid phase. Bentheimer sandstone (line-widths of 300-275
Hz) could be used. In live core experiments, the rock from the North
Blowhorn Creek Field should be better than using Berea cores.
3. Image water using Na-23 (a large amount of Na is present in the brine solution
used so water location, independent of oil, could be followed).
4. Add tiny amounts of EDTA to the water used so that the water relaxation
time is changed.
Figure 18. T1 distributions for the core samples and oil.

31
Further Nuclear Magnetic Resonance Imaging Analysis of Berea Sandstone Cores and North Blowhorn Creek Cores In light of the above results, NMR-imaging was next applied to observe water
flow patterns and oil recovery from cores. In order to differentiate water from oil in the
cores, the following four cores were prepared as described below.
• Core 1 was a Berea core, initially filled with injection water containing
1.2% wt EDTA as the manganese salt. This was added to speed up the
relaxation times and, hopefully, increase the water/oil contrast. Crude oil
was pressurized into the core followed by flushing with water (containing
EDTA) until no more oil came out.
• Core 2 was a Berea core that was first filled with D2O, followed by adding
oil and then flushing with more D2O until no more oil emerged. Since
only trace amounts of water protons would be present, this experiment was
intended to observe only the oil and thus the water's location would be
obvious by default.
• Core 3 was treated the same as core 2 but 80% D2O/20% H2O was used.
• Core 4 was taken from the North Blowhorn Creek Oil Field. It was
removed from a section of the field which had already undergone
waterflooding. It was not further treated.
The samples were studied in a GE 2-Tesla CS I-II imager having a 31cm magnet
bore, equipped with a 20 G/cm shielded gradient-coil set and birdcage RF coil. Two-
dimensional slice images were generated. They provided information on the spatial
distribution of the oil. Quantitative one-dimensional images also were obtained and the
fluid present was obtained as a function of the longitudinal direction. Finally, inversion-
recovery experiments gave a distribution of T1 relaxation times in the sample.
Results of NMR Imaging Experiments
Relatively little signal was obtained from Core 4 from North Blowhorn Creek. In
contrast, considerable oil was present in Berea cores 1-3. The oil saturation levels for the
four cores were: Core 1, 21.4%; Core 2, 21.9%; Core 3, 24.7% and Core 4, 4.87%. This
latter value was actually about 3.7% upon correcting for the lower porosity of the North
Blowhorn Creek's core rock. Since Berea Core 2 only can give 1H absorption resonances

32
for the oil (since D2O was used instead of H2O), the agreement among Cores 1-3 was
excellent, clearly demonstrating that the North Blowhorn Creek Core (#4) had much less
oil present due to its very low porosity.
T1 inversion-recovery experiments demonstrated that Cores 2-4 were quite similar
and further supported oil quantitation by this method as being reasonably accurate. The
relaxation time in Berea Core 1 was shorter than 0.1 sec. showing that EDTA did, indeed,
lower relaxation times.
The level of image resolution was approximately 0.47mm. Example images of
these cores can be seen in Figure 19.
Figure 19. NMR images of four cores.

33
The dark areas represent rock and the light areas may be attributed to H2O or oil (in the
case of Berea Core 2 only oil would be observed because D2O was used in place of H2O).
Examination quickly revealed there were no large water channels through which the
water is passing without generally permeating through the cores. Therefore, when
waterflooding is no longer removing any more oil, the passages through which the water
is passing must be generally substantially smaller than 0.4mm in diameter. Thus, water is
flowing through small pores which are likely coated with oil on the sides. Many other
pores may be completely blocked by oil.
The one-dimensional T2 profiles for the four cores are shown in Figure 20.
These are presented in a format that gives the volume of oil detected per sample length
along the length of the cores. Clearly North Blowhorn Creek Core 4 has far less oil than
the other three cores. The reason is that the North Blowhorn Creek core has a
substantially lower porosity and permeability than the Berea cores. Another obvious
feature observed in this figure is the greater oil depletion at the front end of Cores 1-3
versus the oil present at the back end. The flow of water may have moved some of the oil
away from the front end toward the rear. However, this core had been producing only
water as pumping continued (e.g. no more oil emerged as waterflooding continued).
Figure 21 also exhibits the inversion recovery (T1) relaxation distributions of
Core 1 and Core 4. Both of these cores contain water and oil but Core 1 also has
EDTA/Mn salt to lower the relaxation time.
Two new depleted cores were obtained from the North Blowhorn Creek Oil Field.
These were previously waterflooded until no more oil was obtained. Then one core
(Core D4, Cut 8, Sleeve 1) was treated with the nutrients KNO3 and Na2HPO4, which
were added with injection water. The second core (Core D4, Cut 8, Sleeve 2) was treated
with aqueous solutions of Alcoflood 1285 (25% hydrolyzed polyacrylamide, mol wt ~ 22
x 106). In both cases further oil was recovered from these cores. The subsequent effects
on the flow rates are given in Figure 22 for Core D4 Cut #8 Sleeve 1 and Figure 23 for
Core D4 Cut #8 Sleeve 2.
The samples were analyzed using a GE 2T CSI-II imager/spectrometer with 31
cm magnet bore and 20 G/cm shielded gradient-coil set and a bird cage RF coil. Three

34
kinds of experiments were performed on the two samples. (1) Two-dimensional images,
which correspond to a horizontal slice 5 mm thick along the longitudinal axis, were
obtained. These provide qualitative measures of the spatial distribution of the hydrogen
nuclei. (2) One-dimensional images were taken. These are quantitative measures of the
amount of hydrogen nuclei corresponding to slices orthogonal to the longitudinal axis.
Figure 20. One-dimensional T2 Profile: apparent oil volume per sample length.
Figure 21. Core 1 and Core 4 relaxation distribution figures.

35
Figure 22. The effects of microbial activity on flow rates for D4 Cut #8 Sleeve 1 over
time. This was a depleted oil core from the North Blowhorn Creek Oil Field that was treated with KNO3 and Na2HPO4 in the injection water.
Figure 23. The effects of Alcoflood 1285 treatment on flow rates over time. D4 cut
#8 Sleeve 2 was used.
0.00
2.00
4.00
6.00
8.00
10.00
12.00
0 2 4 6 8 10 12 14 Time (d)
Flow
Rat
e Injection Water
Nitrate
Phosphate
0.00
2.00
4.00
6.00
8.00
10.00
12.00
0 2 4 6 8 10 12 14 Time (d)
Flow
Rat
e
Injection Water
Nitrate
Phosphate
Polymer

36
(3) Inversion recovery experiments were run. These provide the distribution of T1
relaxation times, which gives us information about the fluids within the samples.
Figures 24 and 25 show the two-dimensional slice imaging experiments. The
images are taken on a 5 mm slice of central transverse layer. The field of view is 120
mm x 60 mm. This domain corresponds to 128 x 56 blocks with a pixel size of 0.47 mm
x 0.47 mm. In each slice selective imaging gives the magnitude of the magnetization,
which is proportional to the amount of hydrogen nuclei. The signal is represented on a
gray scale. The brighter areas indicate greater amounts of hydrogen nuclei. The signals
from oil versus those from water cannot be differentiated in these images because of the
broad lines associated with the spectroscopic signals.
The two-dimensional image of Sleeve One indicates that there is a relatively large
signal in the center of the sample on the right-hand side of the sample. Sleeve Two
appears to have considerably less fluid, and the fluid appears to be more evenly
distributed.
Figure 24. Sleeve One: Two-dimensional profiles.

37
Figure. 25. Sleeve Two: Two-dimensional profiles.
These results are supported by the one-dimensional profiles shown in Figure 26.
At a given position along the longitudinal axis, the graph is proportional to the number of
hydrogen nuclei corresponding to a unit length along the longitude axis. The actual
volume of fluid per length is calculated based on the supposition that the hydrogen nuclei
density of the observed fluid is that of water, and is thus called the ‘apparent’ volume of
water. However, the reader is reminded that oil and water have not been discriminated in
these signals so this does not actually represent the amount of water, unless water is the
only liquid present. Figure 26 shows that Sleeve One has considerably more liquid than
Sleeve Two. It also shows that there is more fluid in the right-hand side of Sleeve Two.
These observations are consistent with those made with the two-dimensional images
described above.
Figure 27 shows the T1 distributions obtained from the inversion-recovery
experiments. The integral under any segment of the graph is proportional to the amount
of hydrogen nuclei corresponding to that range of relaxation time. Based on our earlier
work, we believe that the taller peak to the right represents water.

38
Figure 26. One-dimensional profiles.
Figure 27. Inversion recovery: T1 relaxation distributions.
The larger relaxation times belong to water and the shorter times belong to oil.
These measurements suggest that the ratio of water to other liquids is about the same for
both samples, and that the samples contain mostly water. The actual fractions of water
and oil are provided in Table II. Clearly far more water than oil remains in each of these
samples.

39
Table II: The Relative Amount of Fluids in the Samples.
Oil Water Sleeve One 0.15% 0.85% Sleeve Two 0.12% 0.88%
40
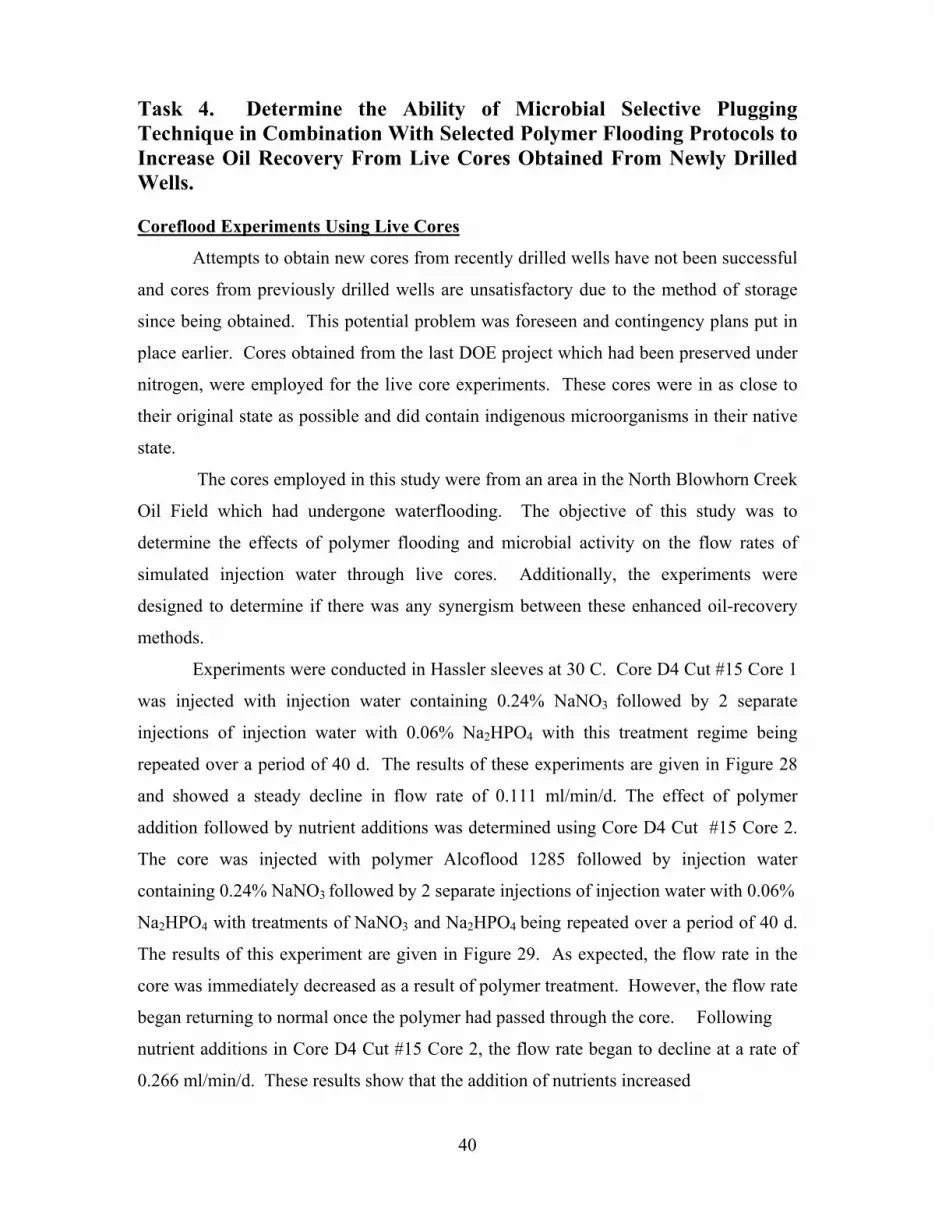
Task 4. Determine the Ability of Microbial Selective Plugging Technique in Combination With Selected Polymer Flooding Protocols to Increase Oil Recovery From Live Cores Obtained From Newly Drilled Wells. Coreflood Experiments Using Live Cores
Attempts to obtain new cores from recently drilled wells have not been successful
and cores from previously drilled wells are unsatisfactory due to the method of storage
since being obtained. This potential problem was foreseen and contingency plans put in
place earlier. Cores obtained from the last DOE project which had been preserved under
nitrogen, were employed for the live core experiments. These cores were in as close to
their original state as possible and did contain indigenous microorganisms in their native
state.
The cores employed in this study were from an area in the North Blowhorn Creek
Oil Field which had undergone waterflooding. The objective of this study was to
determine the effects of polymer flooding and microbial activity on the flow rates of
simulated injection water through live cores. Additionally, the experiments were
designed to determine if there was any synergism between these enhanced oil-recovery
methods.
Experiments were conducted in Hassler sleeves at 30 C. Core D4 Cut #15 Core 1
was injected with injection water containing 0.24% NaNO3 followed by 2 separate
injections of injection water with 0.06% Na2HPO4 with this treatment regime being
repeated over a period of 40 d. The results of these experiments are given in Figure 28
and showed a steady decline in flow rate of 0.111 ml/min/d. The effect of polymer
addition followed by nutrient additions was determined using Core D4 Cut #15 Core 2.
The core was injected with polymer Alcoflood 1285 followed by injection water
containing 0.24% NaNO3 followed by 2 separate injections of injection water with 0.06%
Na2HPO4 with treatments of NaNO3 and Na2HPO4 being repeated over a period of 40 d.
The results of this experiment are given in Figure 29. As expected, the flow rate in the
core was immediately decreased as a result of polymer treatment. However, the flow rate
began returning to normal once the polymer had passed through the core. Following
nutrient additions in Core D4 Cut #15 Core 2, the flow rate began to decline at a rate of
0.266 ml/min/d. These results show that the addition of nutrients increased

41
Figure 28. The effects of microbial activity on the flow rate using Core D4 Cut #15
Core 1.
Figure 29. The effects of polymer flooding (Alcoflood 1285) on the flow rate using Core D4 Cut #15 Core 2.
0.00
2.00
4.00
6.00
8.00
10.00
12.00
0.00 5.00 10.00 15.00 20.00 25.00 30.00 35.00 40.00 45.00Time (d)
Flow
Rat
e
▲ Injection Water
○ Nitrate
■ Phosphate
0.00
2.00
4.00
6.00
8.00
10.00
12.00
0.00 5.00 10.00 15.00 20.00 25.00 30.00 35.00 40.00 45.00Time (d)
Flow
Rat
e
Injection Water
Nitrate
Phosphate
Polymer

42
microbial activity resulting in significant decreases in the flow rate and the benefits of the
polymer initially are short lived. As plugging of flow paths through microbial activity
occurs, injection water should begin to infiltrate unswept areas of the core.
The previous experiment was repeated using two cores from D4 Cut #10 and was
conducted in Hassler sleeves at 30 C. Core D4 Cut #10 Core 1 was treated as described
above for Core D4 Cut #15 Core 1 except that treatment was stopped after 30 d.
The results of this experiment are given in Figure 30 and showed a steady decline
in flow rate of 0.025 ml/min/d which amounts to a 73% decrease over 30 d. The effect of
polymer addition followed by nutrient additions was determined using Core D4 Cut #10
Core 2 and received the same treatment as Core D4 Cut #15 Core 2, described above
except that treatment was stopped after 30 d. As expected, the flow rate in the core was
immediately decreased (84%) as a result of polymer treatment (as shown in Figure 31).
However, the flow rate began to increase once the polymer had passed through the core
and continued to increase even after some nutrient treatments had occurred. These results
suggest that either the number of microorganisms in the core plug was low or the
polymer interfered with the nutrients reaching the microbes. The latter might take place
if some polymer was adsorbed on the microorganism’s surfaces slowing their response to
nutrient treatment. Thus, the benefits of this polymer are short lived and may actually be
deleterious to microbial growth. The plugging of flow paths through microbial activity
(as shown in Figures 28 and 29) did result in the infiltration of injection water into
unswept areas of the core.
Figure 30. The effects of microbial activity on the flow rate of injection water through Core D4 Cut #10 Core 1 over time.
0.00
2.00
4.00
6.00
8.00
10.0
12.0
0.00 5.00 10.0 15.0 20.0 25.0 30.0 35.0Time
Flow
Rat
e
Injection Water
Nitrate
Phosphate

43
Another polymer, Flocon 4800 polymer (Xanthan,) was tested sequentially with
microbial activity for its synergistic effect on the flow rate of fluid through Core D4 Cut
#9 Core 1 (Figure 32). The results from this core were compared to the effects of
microbial activity only on flow rate of fluid through Core D4 Cut #9 Core 2 (Figure 33).
When polymer was employed, the flow rate was initially reduced by 30% but then made
a quick recovery back to normal in approximately 5 d. Therefore, the Flocon 4800 would
have to be added regularly to maintain any positive effects.
The results showed that the Flocon 4800 polymer was not as effective as the
Alcoflood 1285 polymer in the initial reduction of flow rates (30% as compared to 84%).
There was a 0.026 ml/min/d decrease in the flow rate observed for Core D4 Cut #9 Core
2 which only received nutrients.
Figure 31. The effects of Alcoflood 1285 treatment and microbial activity on the flow
rate of injection water through Core D4 Cut #10 Core 2 over time.
0.00
2.00
4.00
6.00
8.00
10.00
12.00
0.00 5.00 10.00 15.00 20.00 25.00 30.00 35.00 Time
Flow
Rat
e (m
l/min
)
Injection Water
Nitrate
Phosphate
Polymer

44
Figure 32. The effects of Flocon 4800 treatment and microbial activity on the flow
rate of injection water through Core D4 Cut #9 Core 1 over time. Figure 33. The effects of microbial activity on the flow rate of injection water
through Core D4 Cut #9 Core 2 over time.
0.00
2.00
4.00
6.00
8.00
10.00
12.00
0.00 5.00 10.00 15.00 20.00 25.00 30.00 Time
Flow
Rat
e
Injection Water
Nitrate
Phosphate
Polymer
0.00
2.00
4.00
6.00
8.00
10.00
12.00
0.00 5.00 10.00 15.00 20.00 25.00 30.00 Time
Flow
Rat
e
Injection Water
Nitrate
Phosphate

45
It was observed that permeability had very little effect on the ability of
microorganisms to reduce the flow rate with the cores from D4 Cut #15 and the cores
from D4 Cut #9. Core 2 from D4 Cut #15 was 2.0X more permeable than core 1 from
D4 Cut #15 and yet the microbial activity in both cores resulted in 65% and 63%
reduction, respectively. Similarly, Core 2 from D4 Cut #9 was 2.8X more permeable
than Core 1 from D4 Cut #9 and microbial activity reduced flow rates 47% and 44%,
respectively. In regard to Core D4 Cut #10 Core 2, the lack of change of flow rate after
the addition of nutrients was probably due to either a lack of a sufficient microbial
population or the nutrients were not getting to them.
Investigation of the Polymer (NaAMB)
A polymer, NaAMB, was synthesized at the University of Southern Mississippi
by Professor Roger Hester by the copolymerization of acrylamide and N-acryloyl-3-
amino-3-methylbutanoic acid. This polymer (designated NaAMP) has a low molecular
weight for a flow control polymer with a MW= 1.25 · 106. (See Figure 34). However, it
has been chemically designed to have a high extensional viscosity (described more in the
following section).
The viscosity behavior of NaAMB was studied in the standard injection water.
These data are summarized in the Table III. The purpose of these data are, not only to
characterize this polymer but also, to eventually see if the polymer adsorbs to the core
and to determine if shear degradation of NaAMB occurs when it is pumped through
Berea cores. Less shear degradation should occur since its molecular weight and coil
hydrodynamic volume is much lower than other mobility control polymers we have
studied. However, these measurements have not yet been made. Viscosity
measurements were made after pumping a polymer solution through a Berea core to
establish whether or not adsorption is occurring and to look for shear degradation at high
and low flow rates through the core.
NaAMB also was tested by pumping it through cores which had been flooded
with simulated injection water until no more oil would come out. The NaAMB polymer
effectively removed more oil. This is a significant result given the low molecular weight

46
NaAMB
• Synthetic parameters: o [M]total = 0.40 M o [M]:[I] = 2000 (0.05 mol% based on [M]total) o NaAMB-10-2: 10 mol% AMBA in feed o Mol wt 1.25 MM (e.g. 1.25 x 10⁶)
Figure 34. Synthetic equation.
Table III: Viscosity Measurements on NaAMB (Mol wt 1.25 · 106) Determined at 30.3°C in Standard Injection Brine Solutions.
Concentration
(g/100cc) to
(sec.) t(soln) (sec.)
t/to nspa ninh
a nra
0.1000 101.6 350.5 3.45 2.45 0.896 2.45 0.0833 101.6 338.4 3.33 2.33 1.016 2.80 0.0714 101.6 295.5 2.91 1.91 0.906 2.67 0.0625 101.6 260.8 2.57 1.57 0.720 2.51 0.0556 101.6 238.8 2.35 1.35 0.541 2.43 0.0500 101.6 227.1 2.24 1.24 0.423 2.47
ansp = t/to-1; ninh = (1/c)ln(t/to); nr = nsp/conc.

47
of this polymer which was also used at a low (500 ppm) concentration. Low molecular
weight polymers give only modest enhancements in the shear viscosity. This suggests
that the critical extension viscosity of NaAMB may have played a role in the removal of
more oil from the core.
Core A This core was saturated with oil (while water wet) at a pressure drop of 190psi
(250psi inlet with 60psi back pressure). Eighteen ml of water was taken up in the core.
Then 395 ml of injection water was pumped through at an inlet pressure of 200psi and a
back pressure of 60psi. Nine ml of oil was collected before no more oil could be
removed. Thus, waterflooding removed 9 of the 18ml of oil in the core. Subsequent
flooding with 385 ml of a 500ppm solution of NaAMB, at an injection pressure of 300psi
and back pressure of 60psi, removed an additional 2 ml of oil (> 20% recovery of the
remaining oil). The flow rate of injection water vs 500ppm of NaAMB in injection water
through the core is instructive. The polymer did not slow down the flow through the core
appreciably (6.67 ml/min for injection water vs. 5.17 ml/min for injection water plus 500
ppm of NaAMB) is shown in Table IV.
Table IV: Flow Rates and Pressure Drops over Core A During Injection Water/Water NaAMB/Injection Waterflooding.
∆P FLOW RATE
Injection Water (start) 140psi 2.54 ml/min
500ppm RH-1 injection water 240psi 5.17 ml/min
Injection Water (after) 40psi 6.67 ml/min
Another core was treated in a similar fashion. Water flooding alone removed 9
ml of oil and polymer flooding (500ppm NaAMB) 1ml more of oil. This core only took
up 11 to 12 ml of oil initially. The polymer flow rate was 0.81 ml/min (∆P=290psi)
while the injection water flow rate was 1.05 ml/min (∆P=290psi).
Extensional Viscosity Studies
Initial studies were performed to determine the extensional viscosities of
polymers used for flow control. The calculation of the approximate extension rate, ε, for
a fluid which is being forced through a porous medium (strata or core) is a very important

48
consideration. When the fluid's extension rate equals the critical extension rate of the
polymer coil, ε c, the polymer coil will rapidly unfold or unwind and extend in the
direction of flow. This event causes energy to be absorbed. Therefore, when the polymer
coil rapidly extends, the fluid flow resistance through the porous media will go up
sharply. When this occurs flow control will increase. In other words, at the critical
extension rate the fluid's effective viscosity goes up thereby helping divert the fluid in
another flow direction where the rate of flow is slower.
Since polymer 1285 from Alcoflood was used in previous experiments, its critical
extensional velocity was studied along with NaAMB (from R. Hester). The structure of
NaAMB has been designed to give a large extension effect. Solutions of these polymers
were pumped at various flow rates through well characterized Berea cores (known
porosity, Φ from the uptake experiments and permeability which was determined
according to k=QLµ/S∆P where Q=volumetric flow rate through a porous media of
length L and cross sectional area S of a Newtonian fluid having a shear viscosity of µ,
where ∆P is the pressure drop across length L). The intrinsic viscosities in the standard
injection solution was determined by dilution viscometry. The polymer solutions of a
known concentration were pumped through cores at a series of different pressure drops
(e.g. a series of flow rates). Plots of the flow rate versus ∆P were made. These plots
should be linear up to the point the fluid's extension velocity reaches the polymer's
critical extension velocity. A change in slope could indicate the point where ε= ε c.
The viscosity behavior of polymer RH-1 was studied in the standard injection
water. These data are summarized in the Table V below. The purpose of these data are,
not only to characterize this polymer but also, to eventually see if the polymer adsorbs to
Table V: Viscosity Measurements on RH-1 (Mol wt 1.25 · 106) Determined at 30.3°C in Standard Injection Brine Solutions.
Concentration
(g/100cc) to
(sec.) t(soln) (sec.)
t/to nspa ninh
a nra
0.1000 101.6 350.5 3.45 2.45 0.896 2.45 0.0833 101.6 338.4 3.33 2.33 1.016 2.80 0.0714 101.6 295.5 2.91 1.91 0.906 2.67 0.0625 101.6 260.8 2.57 1.57 0.720 2.51 0.0556 101.6 238.8 2.35 1.35 0.541 2.43 0.0500 101.6 227.1 2.24 1.24 0.423 2.47
ansp = t/to-1; ninh = (1/c)ln(t/to); nr = nsp/conc.
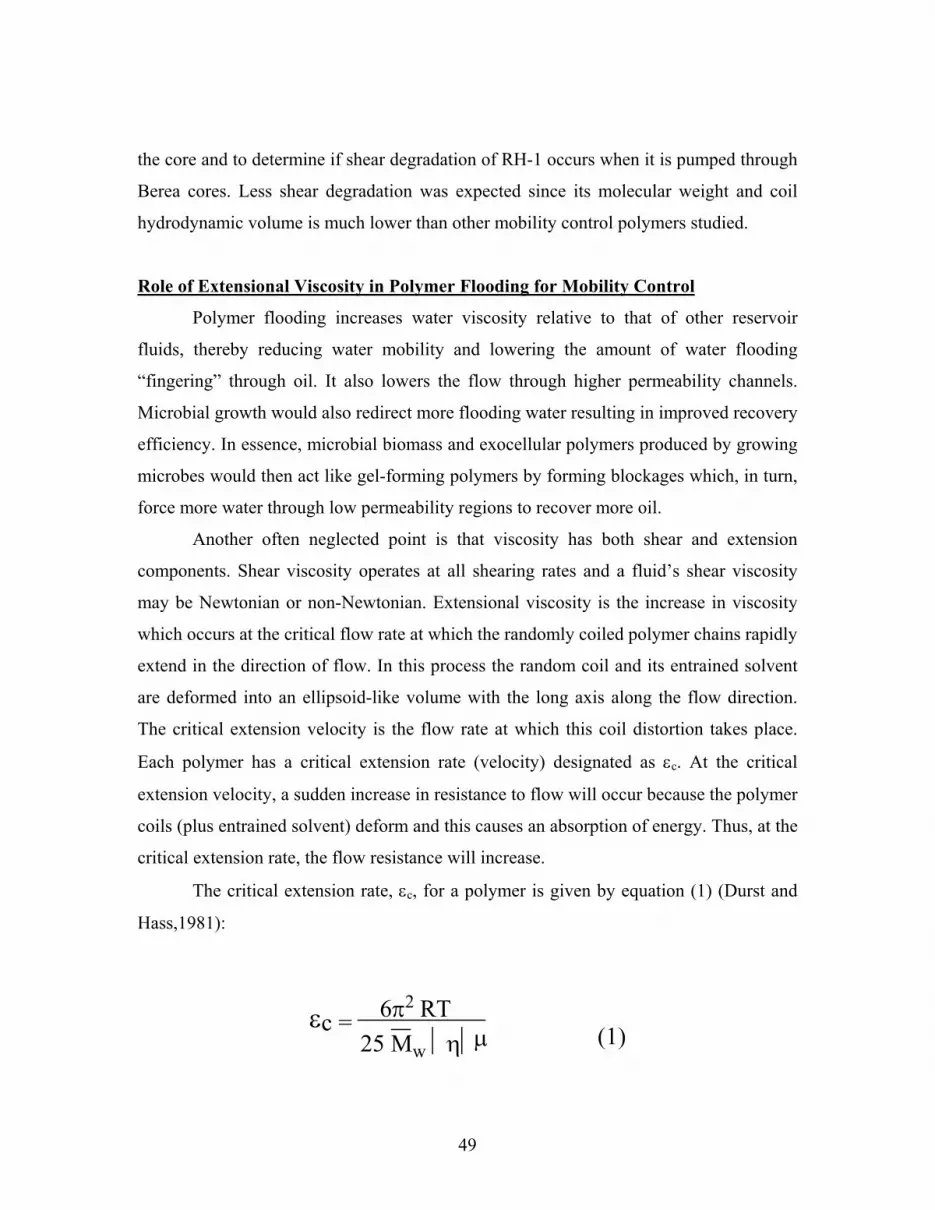
49
the core and to determine if shear degradation of RH-1 occurs when it is pumped through
Berea cores. Less shear degradation was expected since its molecular weight and coil
hydrodynamic volume is much lower than other mobility control polymers studied.
Role of Extensional Viscosity in Polymer Flooding for Mobility Control
Polymer flooding increases water viscosity relative to that of other reservoir
fluids, thereby reducing water mobility and lowering the amount of water flooding
“fingering” through oil. It also lowers the flow through higher permeability channels.
Microbial growth would also redirect more flooding water resulting in improved recovery
efficiency. In essence, microbial biomass and exocellular polymers produced by growing
microbes would then act like gel-forming polymers by forming blockages which, in turn,
force more water through low permeability regions to recover more oil.
Another often neglected point is that viscosity has both shear and extension
components. Shear viscosity operates at all shearing rates and a fluid’s shear viscosity
may be Newtonian or non-Newtonian. Extensional viscosity is the increase in viscosity
which occurs at the critical flow rate at which the randomly coiled polymer chains rapidly
extend in the direction of flow. In this process the random coil and its entrained solvent
are deformed into an ellipsoid-like volume with the long axis along the flow direction.
The critical extension velocity is the flow rate at which this coil distortion takes place.
Each polymer has a critical extension rate (velocity) designated as εc. At the critical
extension velocity, a sudden increase in resistance to flow will occur because the polymer
coils (plus entrained solvent) deform and this causes an absorption of energy. Thus, at the
critical extension rate, the flow resistance will increase.
The critical extension rate, εc, for a polymer is given by equation (1) (Durst and
Hass,1981):
εc = 6π2 RT25 Mw ηµ (1)

50
where R is the gas law constant, T is absolute temperature, η is the intrinsic viscosity of
the polymer in the solvent being used and µ is the shear viscosity of the solvent (not of
the polymer solution).
Any liquid being pumped through a porous medium exhibits what is termed extension
rate (velocity). The liquid’s extension velocity (e.g. extension rate) depends on its
volumetric flow rate and characteristics of the porous rock through which it flows. The
liquid extension rate, εc, is defined by equation (2) (Durst and Hass,1981):
(2)ε = 21/2(V) /φ d
where φ is the rock porosity, d = the rock’s effective particle size diameter and V is the
velocity at which the liquid flows through the porous media (calculated by volume of
liquid pumped per unit time divided by the cross sectional area of the porous media).
When the fluid’s extension rate becomes equal to the polymer’s critical extension rate
(e.g. when ε = εc), the polymer coils elongate and an increase in flow resistance occurs.
This flow resistance can manifest itself over and over if the rock permeability, pore
structure, and flow rates are of the correct magnitude. When a steadily advancing front of
a water-polymer solution enters a pore (see Figure 35), the flow rate must speed up since
the open volume decreases. If the velocity in this pore throat reaches the point where ε =
εc, a sharp increase in viscosity (resistance to flow) occurs causing the fluid which is
directly behind to seek alternate flow channels (e.g. be redirected). As the solution
emerges from the pore into a more open area, its velocity decreases and the extended
polymer now recoils into random coils. Hence, this fluid region can later experience
increased flow resistance again if its velocity accelerates upon encountering another pore.

51
Figure 35. Onset of extensional viscosity.
Two polymers are being used for mobility control: Alcoflood 1285, a 30%
hydrolyzed polyacrylamide with a molecular weight of about 20,000,000 and NaAMB
which is a copolymer with acrylamide (AM) and AMBA (shown below) with a molecular
weight of 12.5 x 10⁶. A key goal of this work is to determine the flow rate ranges through
reservoir rock and Berea sandstone where the extensional viscosity of these two polymers
will become important. This task is exceedingly difficult to achieve because the rock
media is fractal in nature. Furthermore, the εc values of these two viscosity enhancing
polymers are not known. Professor Roger Hester, a DOE contractor at the University of
Southern Mississippi, is investigating this question. We have cooperated with him in
taking his basic research a step closer to practical application by investigating the
extensional viscosity problems in rock cores.

52
C
H
H
C
CO ONa
H
0.7 0.3C
H
H
C
H
CO NH2
Alcoflood 1285
O
NH2
+ NaOH
AM
AMBA
ONMe
MeCO2H
HC O
N NO
CMe
Me
( ) 9
H2
( )1
OO Na
H
Chemical structure of the polymers used.
εc values can be obtained from equation (1) but only if the η values of the very high
molecular weight polymers is known with high accuracy (in the aqueous brine solution
used to flood the cores). Measurements of intrinsic viscosity, η, are exceptionally shear
dependent. Attempts to get accurate η values are underway in Hester’s lab. Also the
molecular weight must be known accurately but this is a daunting task for such high
molecular weight polymers. Thus, experimental measurements have been proposed
where pressure drops would be measured as a function of flow rate through precisely
sized screens of defined shapes. Indeed Professor Hester is attempting to get εc values by
this method. If εc values were known for the polymers, then one could employ equation
(2) and set ε = εc. Since εc would be known, the porosity, φ, for the cores could be
measured and the equation could be solved for V/d. Then experiments could be made
where polymer/brine solutions would be pumped through core samples and a plots of the
volumetric flow rate, Q, versus the pressure drop ∆P would be measured. As shown in
Figure 36, the fluid will experience a higher flow resistance at the critical extension rate,
εc, and this will cause an increase in slope of the Q vs ∆P plots. Thus, for defined
geometry media V (in equation 2) would be known from Q at the value of QA. At this
value the V is εc.

53
∆P
Q (flow rate)QA
Figure 36. Determining the flow rate at which the extensional viscosity begins to contribute.
In our own work, rock media are being used (Berea and North Blowhorn Creek
cores). Thus, we don’t have a defined geometry media. Therefore, the volumetric fluid
flow rate, Q is related to the pressure drop ∆P through equation (3) (Collins, 1976) where
the permeability of the medium must be known.
Q = L µ
S ∆P(3)
k
Q = volumetric flow rate L = length S = cross sectional area µ = the shear viscosity of a fluid employed in permeability measurements of that specific
rock..
Note, the shear viscosity of our standard brine solution can be obtained from the
literature value of µw for water by multiplying µw by the measured (ηbrine/ηw) which is
available from simple viscosity measurements.
By measuring Q vs ∆P one gets QA. Then at QA the critical extension velocity VA
(e.g. εc) is obtained by knowing the rock porosity. This value of VA (εc) is what is needed
for substitution into equation (2) resulting in equation (4) (Durst and Hass, 1981).

54
εc = 21/2(V) /φ dε = (4)
Now all terms are known except d, so the equation can be solved for d. The value
of d accounts for all the geometrical parameters which exist within the fractal rock
structure. Thus, this approach requires a knowledge of εc of the polymer, measurements
of Q vs ∆P on the core and a determination of d from a combination of these
measurements.
The εc values for Alcoflood 1285 and NaAMB were not known. Thus,
experiments concentrated on obtaining Q vs ∆P measurements when pumping polymer
brine solutions through Berea cores and then searching for sharp changes in slope. A
major problem exists. The range of flow rates employed in core measurements may be
too high (or too low) to be in the QA range where the extensional viscosity effects to kick
in (e.g. where the ∆P vs Q slope will change). Equipment limitations did not permit us to
accurately measure the low ∆P values that would be needed to achieve low values of the
volumetric flow rate, Q, through our cores (those values which correspond to fluid flow
through an oil field at a few feet per day or lower). A second consideration is the rock
permeability, k. The lower the permeability becomes, and the greater the ∆P must be at
any constant flow rate. Thus, if k is very low, a ∆P in an easily measured range can be
used and still obtain a low flow rate. If the value QA for a given polymer solution and
rock combination is low this is an advantage. However, the Berea cores have porosity, φ,
values about 0.2 (20%) and the grain sizes in the rock are large enough, so that the Berea
sandstone permeability is high. This means that low ∆P values will give relatively high Q
values, perhaps higher than the magnitude of QA. If this is true, Q values versus ∆P plots
would not be able to locate the point where a change of slope occurs (e.g. QA or from the
value εc).
One approximation method should be mentioned. If sandstone is considered to be
compressed sand grains and spherical shapes are assumed, then the value d (now the
effective diameter of a sand sphere) as obtained from equation (5) (Scheidegger, 1974)
d =1-φφ
180 kφ (5)

55
where k is the permeability (measured with the brine solution employed) and φ is the
porosity. By measuring k and φ for the cores and employing equation (5), an
approximation of d can be obtained. This value of d could be used in equation (2) to give
the fluid extension rate at any velocity (e.g. volumetric flow rate).
The standard brine solution used had the following composition.
10.9g CaCl2
2.71g MgCl2
4.57g BaCl2
1.84g Na2SO4
147.8g NaCl
All these salts are dissolved in 50 L distilled water.
Viscosity measurements were done in Cannon Ubbelohde dilution viscometers.
Using a 75µm capillary diameter the following measurements were obtained on the 1285
and NaAMB polymers (See Figures 37 and 38). Shear effects make accurate
measurements of the η values impossible in this equipment.
Figure 37. Specific viscosity vs. concentration for polymer Alcoflood 1285 in standard brine solution.
0
0 .0 5
0 .1
0 .1 5
0 .2
0 .2 5
0 .3
0 .3 5
0 .4
0 2 0 4 0 6 0 8 0con cen tra tio n (0 .0 0 0 1 g /1 0 0 cc)
spec
ific
visc
osity

56
Figure 38. Specific viscosity vs. concentration of the polymer NaAMB in standard brine solution.
The cores were subjected to a long term (10 or more core volume equivalents
passed through) prepumping period where polymer-brine solutions are passed through the
core to allow the adsorption of polymer on the core internal surface to come to
equilibrium. Thus, in the ∆P versus Q experiments, no change in polymer concentration
within the flood solution can take place as the solution passes through the core. The
prepumping treatment was monitored by comparing the starting viscosity of the polymer
solution with the viscosity of the effluent polymer solution. A lowering of viscosity
occurs due to (a) adsorption on rock surface and (b) shear degradation of the molecular
weight. When the viscosity of the effluent becomes constant with time, then no more
adsorption is occurring. These data are omitted for brevity.
Core porosities were measured by weighing the dry core (w1) and then putting it
under vacuum followed by submerging in the brine solution. The weight (w2) after
submersion was obtained and the porosity calculated from the change in weight, the
densities of the brine and the overall core volume.
Flow rate versus ∆P measurements were performed on cylindrical Berea cores
9.0 cm in length and 3.8 cm in diameter.
Experiments on the Polymer NaAMB
The plots below show experimental values of ∆P versus flow rate of NaAMB
polymer/brine solutions when pumping through a Berea core with a porosity of 20.72%
0
0.5
1
1.5
2
2.5
3
3.5
4
0 500 1000 1500concentration (0.0001g/100cc)
spec
ific
visc
osity

57
(Figures 39-44). This experiment illustrates that the core undergoes internal changes
leading to a higher permeability with time. Note the flow rates in Figure 38 are higher
than the initial experiments at 5.0ppm, as shown in Figure 39.
Figure 39. NaAMB (5 ppm) without prepumping.
Figure 40. NaAMB (5 ppm) after prepumping of 10 core volumes of polymer solution through core.
0
0.05
0.1
0.15
0.2
0.25
0.3
0.35
0.4
0 100 200 300 400
pressure difference(psi)
flow
rate
(ml/s
ec)
0
0.05
0.1
0.15
0.2
0.25
0.3
0.35
0 100 200 300 400
flow
rate
(ml/s
ec)
pressure difference (psi)

58
Figure 41. NaAMB (2.5 ppm) after prepumping.
Figure 42. NaAMB (1.0 ppm) after prepumping.
0
0.05
0.1
0.15
0.2
0.25
0.3
0.35
0 100 200 300 400
pressure dif f erence (ps i)
flow
rate
(ml/s
ec)
0
0.05
0.1
0.15
0.2
0.25
0 100 200 300 400
pressure difference (psi)
flow
rate
(ml/l
)

59
Figure 43. NaAMB (0.5 ppm) after prepumping.
Figure 44. NaAMB (5 ppm) after prepumping after all the above experiments had been done on the same core.
A significantly higher concentration of NaAMB was then used. After prepumping
10 core volumes of 50ppm NaAMB solution through the core, the Q vs. ∆P plot was
obtained. This is shown in Figure 45.
0
0.05
0.1
0.15
0.2
0.25
0.3
0 100 200 300 400pressure difference (psi)
flow
rate
(ml/l
)
0
0.1
0.2
0.3
0.4
0.5
0.6
0.7
0.8
0 100 200 300 400
pres s ure d ifference (ps i)
flow
rate
(ml/l
)

60
Figure 45. NaAMB (50 ppm) after prepumping Alcoflood 1285 polymer.
The plots below show experimental values of ∆P versus flow rate for the 1285
polymer/brine solution when pumped through a Berea core with a porosity of 19.41%.
Pure brine solution was first used and this was followed by various concentrations of
Alcoflood 1285 as shown in Figures 46-48.
Figure 46. Pure brine solution after prepumping.
0
0.05
0.1
0.15
0.2
0.25
0.3
0 100 200 300 400pressure difference
flow
rate
(ml/s
ec)
0
0.2
0.4
0.6
0.8
1
1.2
1.4
1.6
0 100 200 300 400pressure difference (psi)
flow
rate
(ml/s
ec)

61
Figure 47. Alcoflood 1285 (15 ppm) after prepumping.
Figure 48. Different concentrations of Alcoflood 1285 polymer solutions.
0
0.2
0.4
0.6
0.8
1
1.2
1.4
0 100 200 300 400
pressure difference (psi)
flow
rate
(ml/s
ec)
0
0.05
0.1
0.15
0.2
0.25
0.3
0.35
0 50 100
Series1
Series2
Series3
Series4
Series5
Series6
Series7
Series8
brine solution
prssure difference (psi)
flow
rate
(ml/s
ec) 1.5ppm 1285
3.75ppm 12857.5ppm 1285
15ppm 128525ppm 1285
50ppm 1285
75ppm 1285

62
Studies Using the Electron Microscope
An understanding of the spatial relationships between organic matter (bacteria and
biofilm) and the mineral matrix and porosity in a rock is necessary to fully perceive the
MEOR process. Five widely used sample preparation and imaging procedures for
scanning electron microscope (SEM) study of organic-rich samples were investigated.
The purpose of these experiments was to contrast and evaluate these techniques in order
to determine which procedure(s) best preserves the in situ bacterial and biofilm textures
and the relationships between these organic materials and the porosity and rock. The
techniques tested were ethanol dehydration with hexamethyldisilazane (HMDS), which is
the most commonly applied technique for study of biological samples; ethanol
dehydration with critical point drying; ethanol/acetone dehydration with critical point
drying, which is a procedure often used in medical research; 10% glutaraldehyde
fixation; and simple air drying.
Details of the protocols tested are: A) Gluteraldehyde fixation and ethanol
dehydration (Step 1. Fix specimens in 2.5% gluteraldehyde for 2 h; Step 2. Dehydrate in
ethanol, 10-15 min per step: 35%, 50%, 70%, and 95% ethanol; Step 3. Continue
dehydration: 100% ethanol (4 changes) for one h; Step 4. Change to HMDS
(hexamethyldisilazane), 2 changes, 10 min each; Step 5. Air dry sample.); B)
Gluteraldehyde fixation, ethanol dehydration, and critical-point drying (Steps 1-3 from A;
Step 4. Five CO2 flushes in critical-point drier); C) Gluteraldehyde fixation, ethanol
dehydration, acetone dehydration, and critical-point drying (Steps 1-3 from A; Step 4.
Dehydrate in acetone, 10-15 min per step: 35%, 50%, 70%, and 95% acetone; Step 5.
Five CO2 flushes in critical-point drier); D) Gluteraldehyde fixation (Fix sample in 10%
gluteraldehyde for 2 h); E) Air-dry. In the first set of experiments sandstone and
limestone samples were inoculated with bacteria and fed, and were then prepared for
SEM using each of the techniques detailed above.
The results of these experiments showed that no tested protocol correctly
maintains the in situ textures of both the bacteria and the biofilms. Exopolysaccharide
slime (EPS) biofilm occurred as a more or less smooth continuous coating over both rock
and bacteria in air-dried or gluteraldehyde fixed samples (Figure 49). Slight to moderate
curling of the edges of the biofilm was sometimes observed, especially in air-dried

63
samples. In these samples, it was uncommon to observe bacteria completely uncovered
by EPS biofilm. Individual or colonies of bacteria most commonly occurred as lumps
and bumps beneath the slime or as partially emergent bodies. The bacterial bodies
themselves were deformed to varying degree in both procedures (Figure 50).
Figure 49. EPS biofilm slime covers both rock matrix and the deformed cylindrical
bacteria in air-dried sample.
Figure 50. EPS biofilm slime (S) occurs as a more or less continuous coat over both
rock and distorted bacteria (B). Sample fixed in 10% glutaraldehyde.

64
Bacterial shape was well preserved in the dehydration and drying procedures,
however, these techniques greatly changed the morphology of the EPS biofilm from a
continuous coat to curled, desiccated, and tattered remnant sheets and strings. Tangled
nests of vermicelli-shaped bacteria were commonly observed and were frequently
completely devoid of slime (Figure 51). Biofilm fragments also occurred as small (<100
nm) spheres, ovoids, and beaded chains (Figure 52). It was concluded that an accurate
investigation of organic material in rocks requires two samples, one preserved by
glutaraldehyde fixation for characterization of the EPS biofilm, and one by ethanol
dehydration for examination of the bacterial bodies themselves.
Figure 51. Abundant undeformed bacteria devoid of EPS slime. Ethanol and HMDS dehydration sample.

65
Figure 52. Well-preserved bacterial body covered with tattered remnant-strings of
EPS. Gluteraldehyde fixation, ethanol and acetone dehydration, and critical point dried sample.
Several experiments were performed on NBCU bacteria and rocks. In the first
experiment, sandstone samples were inoculated with indigenous NBCU bacteria from a
laboratory culture and incubated for two wks. SEM examination of the samples showed
an EPS slime layer forming an irregular but continuous sheet that draped across sand
grains and stretched across pore throats and crevices. Bacteria were uncommon and
randomly distributed throughout the samples. In places, two different morphologies of
EPS biofilm were present: a beaded, globular layer overlain by a smooth, sheetlike layer
(Figure 53).
In another experiment small pieces of live NBCU core were fed with nitrogen-
and phosphorus-rich nutrients on the same schedule as the NBCU cores that have been
flow tested. After two wks, SEM analysis showed that the sandstone core pieces were so
completely covered with biofilm that the entire mineral surface was obscured (Figure 54).
Fewer bacteria were observed in this experiment than in the experiments using cultured
bacteria.

66
Figure 53. Grain-coating morphologies of EPS biofilm.
Figure 54. EPS biofilm completely covering bacterial bodies and mineral grains.
It has been debated whether the efficacy of MEOR is due to pore blockage by
bacterial bodies or by EPS capsule. These experiments suggest that it is the EPS biofilm

67
that is almost entirely responsible for the plugging of sandstone pores and that this is
accomplished (at least at first) not by completely filling the pore spaces but by stretching
across pore throats in a meniscus or web-like morphology (Figures 54-56).
The growth of the in situ bacteria and the pore-occluding biofilm was studied in a
series of timed experiments in which live NBCU core plugs were fed nitrogen- and
phosphorus-rich nutrients in the flow test apparatus weekly for four wks. The cores were
sampled and imaged on the SEM every three or four d.
Figure 55. EPS slime meniscus partially occluding porosity.

68
Figure 56. Sandstone porosity partially filled with EPS biofilm.
In unfed control samples bacteria were extremely scarce to completely absent and
there was no evidence of organic grain-coats or biofilm. After only a few days feeding
bacteria ranging in size from < 1 µm to several µm in size were obvious in the samples
(Figure 57). The bacteria and nearby mineral grains were often covered with an
exceedingly thin sheath of EPS (Figure 58). In the following wks this proto-biofilm
became thicker and more widespread and often had a clotted or even ropy texture
(Figure 59). At the same time full-size bacteria became more abundant and the small <1
µm varieties became uncommon. After three wks the EPS biofilm covered most mineral
surfaces and completely occluded porosity (Figure 60).

69
Figure 57. Large (> 1 µm) and small (< 1 µm) ovoid and spherical bacteria and bacterial textures grown in less than one wk.
Figure 58. Bacterium surrounded by thin “halo” of EPS.

70
Figure 59. Thick and clotted EPS biofilm developed in two wk growth.
Figure 60. EPS slime (outlined) completely filling porosity between sandstone
grains (G).
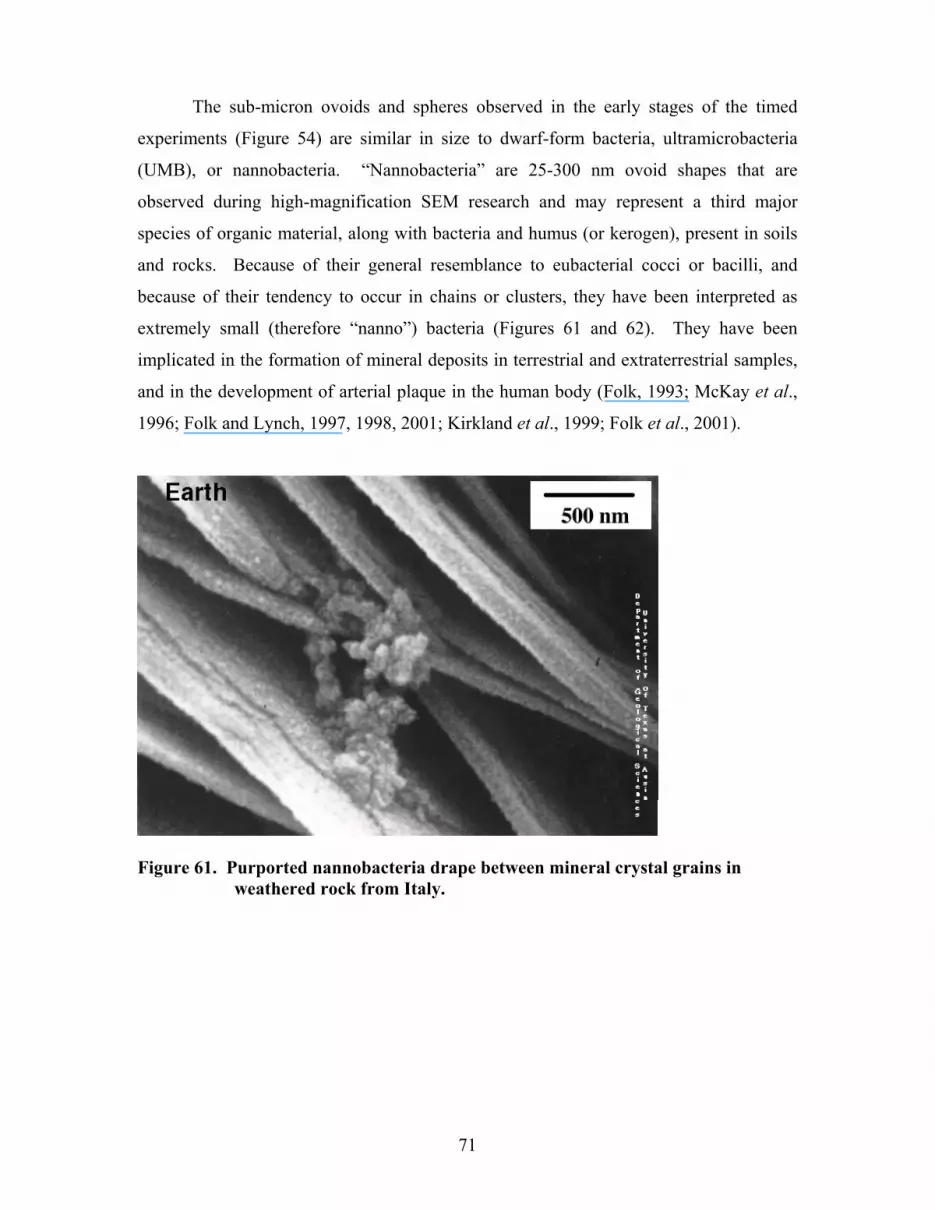
71
The sub-micron ovoids and spheres observed in the early stages of the timed
experiments (Figure 54) are similar in size to dwarf-form bacteria, ultramicrobacteria
(UMB), or nannobacteria. “Nannobacteria” are 25-300 nm ovoid shapes that are
observed during high-magnification SEM research and may represent a third major
species of organic material, along with bacteria and humus (or kerogen), present in soils
and rocks. Because of their general resemblance to eubacterial cocci or bacilli, and
because of their tendency to occur in chains or clusters, they have been interpreted as
extremely small (therefore “nanno”) bacteria (Figures 61 and 62). They have been
implicated in the formation of mineral deposits in terrestrial and extraterrestrial samples,
and in the development of arterial plaque in the human body (Folk, 1993; McKay et al.,
1996; Folk and Lynch, 1997, 1998, 2001; Kirkland et al., 1999; Folk et al., 2001).
Figure 61. Purported nannobacteria drape between mineral crystal grains in weathered rock from Italy.

72
Figure 62. Nannobacteria on mineral surfaces in the Allende Meteorite, which fell
to Earth in 1968. (Photo by Lynch, Department of Geological Sciences, University of Texas at Austin.)
It would be difficult to find a more contentious geologic or biologic topic than the
existence or non-existence of these nannobacteria. Critical attention from the
microbiology community has been focused on the small size of the nannobacteria, which
are often 1/1000th the volume of typical bacteria. Nonetheless, confirmation of the
biological affinity of some of these features, especially the larger ones, has been made
using molecular biology techniques (Spark et al., 2000). However, laboratory
experiments have shown that the suspect textures that can be formed by mineral
precipitation in an organic-rich, though abiotic, environment (Kirkland et al., 1999).
Current research also shows that textures very similar to the purported nannobacteria can
be produced by dehydration of polysaccharide capsule or biofilm (Figures 63 and 64;
Fratesi and Lynch, 2001). The relationship between the textures, different minerals, and
different organic compounds requires further research.

73
Figure 63. Chain and filament-like morphology of EPS slime produced by
dehydration preservation resembles purported nannobacteria.
Figure 64. High-magnification image of “nannobacterial textures” produced by
dehydration of EPS biofilm.

74
Task 5. Prepare a Cost/Benefit Evaluation of Adding a Polymer-Flooding Procedure to a Microbial Enhanced Oil Recovery Process Using a Selective Plugging Technique.
The Economic Aspects of MEOR and Polymer-MEOR
Oil and natural gas are finite commodities and sooner or later their ever-
increasing production (demand) will have to peak. Their discoveries, particularly
mammoth and gigantic reservoirs, have already done so. In 1998, 90% of total global
energy came from fossil fuel (oil and natural gas). At some point in time, production will
peak and new discoveries will decrease. It is believed that the mammoth and gigantic
reservoirs have already been discovered and the world’s energy needs will have to rely on
a greater recovery of known reserves.
The world demand for oil is presently about 22 billion barrels per year and the US
presently imports 10,847,000 barrels of crude oil and products daily. This is about 60%
of total demand (consumption). The US demand for crude oil is expected to have a
moderate growth rate of 2% per year.
The US economy is very sensitive and heavily depended on oil and oil prices.
Recent severe fluctuations of gas prices at the pump have clearly shown that cuts in
world oil production, even by one million barrels, will adversely effect the US economy.
The Estimated Ultimate Recovery (EUR) for the world oil reserves is estimated to
be somewhere between 1,800-2,200 billion barrels. The total proven world oil reserves is
about 1,000 billion barrels of which 2/3 of it located in the most unstable and
unpredictable part of the world, the Middle East.
It is therefore clear that the US economy is vulnerable to the lack of reliable oil
reserves as well as control over the location of much of the world proven oil reserves.
Consequently, the only reliable sources of crude oil are the ones within the US territory.
A total of 41,000 reservoirs have been discovered in the US and a good majority of them
are mature and have passed their primary phase of their production. Many of these
reserves are in danger of being abandoned, although 1/2 to 2/3 of Original Oil In Place
(OOIP) is left behind. Contrary to the common view, when producing wells in an active
oil field are prematurely abandoned it is, practically speaking, almost impossible to bring
them back to their previous production level. Some of the major reasons for these natural

75
phenomena are much higher cost of drilling, problems with lease stipulation, problems
with producing facilities including wellbore and wellbore area (skin) in the reservoirs,
water and/or gas encroachment in the reservoirs, heavy cost of implementation of new
technological tools and equipment, higher cost of labor, and last but not least,
consideration of new local, state, and federal laws, particularly environmental laws.
Considering all other options, it seems in-field "RESERVE GROWTH" is the
most economically prudent alternative to accessing and securing new resources for the
economical recovery of these valuable crude oil reserves.
In field “Reserve Growth” may come from the following sources:
- By-passed oil
- Incompletely drained reservoirs
- Untapped reservoirs compartments
- Deeper pool potentials
- Extension of known pools
- Horizontal drilling
- Development and implementation of more efficient and sophisticated
reservoir characterization, simulation, and data handling. And finally the most
important one of all,
- EOR, Implementation of the most economically and technically suitable
Enhanced Oil Recovery
As stated above, by the time reservoir production is through the primary
production phase, (producing under reservoir's own energy), some 1/2 to 2/3 of OOIP is
left behind. Waterflooding, as the sole means of secondary oil recovery is presently
responsible for over 50 percent of all oil recoveries in world oil fields. Even then,
substantial amounts of OOIP will be left behind. Tertiary oil recovery, where feasible,
can be implemented to recover some of these vastly untapped oil resources.
Tertiary oil recovery includes:
- Steam injection
- In-situ combustion
- Miscible and immiscible gas injection

76
- Polymer flooding
- Surfactant flooding
- Microbial methods
Tertiary oil recovery, mostly thermal miscible and immiscible gas injection, is
responsible for 748,000 barrels of oil daily, which amounts to 12 per cent of total US
daily oil production. Unfortunately, tertiary oil recovery in general, and microbial
recovery in particular, has not been implemented to its full potential mainly due to
economics and lack of documented successes.
The use of microorganisms to enhance oil recovery (MEOR) was proposed some
50 years ago, but unfortunately, to date, field trials for commercial exploitation of this
method have been very few. Using microorganisms indigenous to oil reservoirs could aid
in oil recovery in a number of ways including, the production of acids, solvents, gases,
emulsifiers, and polymers. In particular, using microbially produced polymers and
microbial biomass, the more porous channels of reservoir rocks can be selectively
plugged, and consequently injection water will be forced to flow into tighter and
untapped new channels, thereby increasing the sweep efficiency of waterflooding
operation in the entire reservoir and, not just around the injection wells.
Manipulating the in-situ microflora to alter the natural permeability setting of the
reservoir rock has been termed MPPM (microbial permeability profile modification).
Laboratory experiments on live cores, as well as field implementation of MPPM, have
shown the economic viability and technical superiority of this MPPM method over all
other EOR methods, as a tertiary method in enhancing oil recovery (Table VI).
Implementation of any of the methods shown in Table VI, except MPPM, require
substantial initial capital, costly maintenance and will interfere with the normal day-to-
day production operation, which significantly reduces profit. On the other hand, MPPM
requires minimal initial capital outlay, minimal operation maintenance, and will not
interfere with day-to-day normal field operation and its related income.

77
Table VI: Comparison of MEOR Methods.
Because of the similarities in the mode of operation of MPPM and polymer
flooding for the purpose of enhancing oil recovery, it was reasoned that coupling these
two technologies might result in a synergy that is not only cost effective, but also more
efficient in oil recovery. Keep in mind that polymer flooding is expensive and has a
short-term effectiveness in the complex reservoir environment. On the other hand,
manipulating the indigenous microflora takes a longer period of time but lasts for a
prolonged period of time. Introduction of polymers along with nitrate and phosphate into
the reservoir could bring about a unique solution to problems encountered with polymer
flooding and microbial selective plugging by providing fast and long lasting permeability
profile modification.
Amongst scores of polymers, a few with superior potential for polymer flooding
were chosen and run in Berea sandpacks followed by experiments using live cores in the
following experimental designs:
- Microbial nutrient flooding alone
- Selected polymer flooding alone
- Microbial nutrient flooding in advance of polymer flooding, and
- Polymer flooding in advance of microbial nutrient flooding
The results of these experiments showed that while polymers may increase the
plugging of the reservoir pore channels initially, the short lifespan of their effectiveness
Methods
Additional ExpensesPer Produced
Barrel of Oil, in $
Major Problems
Environmental
Concern Steam Injection 3-5 High cost of operation Not friendly In-situ Combustion 5-10 Lack of control Possible Miscible/Immiscible gas Injection
2-8 Limited resources, not feasible everywhere
No major problem reported
Polymer Flooding 5-10 Expensive, short life Possible Surfactant Injection 8-12 Expensive, inefficient Not friendly MPPM (MEOR) 1-2 None Friendly

78
in the complex reservoir environment was not followed rapidly enough by microbial
growth and accompanying biopolymer production to achieve the synergy desired.
Treatment with polymers in advance of microbial treatment did not help to
increase the effectiveness of microbial plugging. Keep in mind that polymer flooding will
increase the cost of the MEOR-Polymer process by orders of magnitude, while increasing
polymer production by the microflora can be achieved with only a minimal increase in
MEOR cost.
This research project did demonstrate that the indigenous microflora produce
copious quantities of polymers when fed with proper nutrients. This important finding led
to the conclusion that the production of polymer by the indigenous microflora will result
in sufficient plugging and additional plugging by the way of polymer flooding would not
be cost effective. So far as the nature of reservoir microflora is known, a suitable feed and
feeding regime will bring about in-situ production of copious amount of polymers to plug
the wider channels and direct the water flow into untapped channels. Furthermore, this
process unlike polymer flooding, will not be restricted to the wellbore area, but will take
place throughout the reservoir in areas where the injection water carrying the microbial
nutrient reaches.
In short, the United States economy is highly dependent on crude oil resources at
a reasonable price. As the exploration and production of crude oil approaches its
inevitable peak, the US has no other choice but to look for secure and reliable new crude
oil resources. The best source of securing the required oil resources are the billions of
barrels of oil left behind in the U.S. waiting for a cost effective technology to bring them
up. As a vital means of tertiary oil recovery, microbial permeability profile modification
by the in-situ microbial population is indeed superior to all other known methods of
enhancing oil recovery today. It is the cheapest, it is efficient, practically speaking it will
work in every types of reservoir rock and structure, it requires minimal initial capital for
operation and maintenance, it will not interfere with day to day normal field production
operation, it will receive the highest tax credit, and finally it is environmentally friendly.
Substantiated and extensive laboratory works along with active field application attest to
this claim.

79
CONCLUSIONS
Nine polymers (two Cr3+ gelling partially hydrolyzed poly(acrylamides), five
viscosity enhancing 25% hydrolyzed poly(acrylamides) of high molecular weight, one
xanthan polymer and a special polymer of moderate molecular weight designed to have a
high critical extension viscosity) were characterized (molecular weight, viscosities in
water and brine solutions, intrinsic viscosities). None of these polymers inhibited the
growth of five different oil-degrading cultures obtained from petroleum reservoirs.
Further, they were not able to serve as a carbon and energy source for these cultures.
Experiments were conducted in sandpacks to determine if polymers and/or
microbes would alter the pathway of water flowing through the pack. Originally, 36Cl
was to be employed in tracking the water path through the sandpack but it was decided
that since 56Mn could be produced in our laboratory there would be no need to purchase
the 36Cl. Also, since the half-life of 56Mn is only 2.58 hrs vs 301,000 yrs for 36Cl,
disposal of the radioactive waste did not pose a problem. Polymer flooding was shown to
increase aerial sweep efficiency in crushed Berea sandstone/clay/oil sandpacks using
simulated injection water containing 56Mn as the radioactive tracer. Phosphate and
nitrate additions also altered sweep pathways by stimulating microbial growth, which
facilitated local plugging.
In studies using Berea sandstone cores, high molecular weight 25% hydrolyzed
poly(acrylamides) adsorbed on the internal surfaces of Berea cores until an equilibrium
layer had formed and further polymer traversed the cores without further adsorption.
Shear degradation of these polymers occurred during flow through the cores according to
viscosity studies. Both polymer flooding and treatment with microbial nutrients caused
changes in the flow of injection water through the cores. No synergy between polymer
flooding and MEOR was observed.
Other studies were conducted using live cores obtained from the North Blowhorn
Creek Oil Field. Neither polymer flooding nor treatment of the cores with microbial
nutrients produced evidence of a polymer flooding/MEOR synergy to produce more oil
recovery from cores. While polymer flooding slows the flow rate through cores and
redistributes water flow in cores, its effect is short lived. As soon as the polymer pulse

80
passes through the core, the flow rate again increases. The period required for effective
MEOR is much longer. Thus, microbial growth and its modification of sweep efficiency
requires a long timeframe and this does not match that of polymer flood pulses. Only
continuous polymer flooding or a very long (hence expensive) polymer pulse could
match up these timeframes, but this would require greater polymer consumption.
Furthermore, evidence of polymer adsorption within cores suggests that adsorption will
seriously deplete the polymer’s solution concentration as the distance from the wellbore
increases.
Magnetic resonance imaging of cores was used successfully to determine the oil
saturation level in cores and the special distribution of oil and water inside the cores
using a combination of inversion recovery (T1), relaxation time distribution experiments,
and T2 profiles. Experiments were conducted at pixel resolution sizes of 0.47 mm2.
Difficulties included broad line widths and substantial variations in proton relaxation
times which were dependent on the core’s rock type and the fact that both water and oil
give 1H adsorption. D2O experiments were employed to see oil in the presence of H2O.
Investigations using electron microscopy revealed that the indigenous microflora
produce considerable quantities of polymer when supplied with nitrate and phosphate.
One might conclude that this biopolymer is the major physical contribution to the
redistribution of water flow. Further, it was found that the treatment of samples for
electron microscopic examinations significantly influenced the images obtained. In some
cases the treatment resulted in images of polymer appearing as nannobacteria. The
results demonstrated the need to prepare specimens in at least two different ways in order
to obtain an accurate assessment of the microbial role in MEOR.
After the successful demonstration of microbial permeability profile modification
(MPPM) in the North Blowhorn Creek Oil Field, the question arose as to how much of
the alterations of the flow path of injection water was caused by the microbial cells per se
as contrasted to that caused by polymer produced by the indigenous microflora. While
there was no answer to the question at the time, results from this project suggest that
much of the diversion of water flow from the high permeability zones to lower
permeability zones was caused by polymer produced by the microflora. This finding
suggests that increasing the microbial nutrient levels in the injection water will enhance
the impact of MPPM by increasing the microbial polymer production.

81
REFERENCES
Brown, L.R., A.A. Vadie, and J.O. Stephens, 2002, Slowing Production Decline and
Extending the Economic Life of an Oil Field. New MEOR Technology: SPE
Reservoir Evaluation and Engineering; Feb. 2002, 33-41.
Collins, R.E., 1976, Flow of Fluids Through Porous Media, Petroleum Pub. Co., Tulsa,
OK.
Durst, F. and R. Hass, 1981, Dehnströmungen mit verdünnten Polymer lösungen: Ein
theoretisches Modell und seine experimentelle Verifikation, Rheol. Acta, 20,179-
92.
Folk, R. L., 1993, SEM Imaging of bacteria and nannobacteria in carbonate sediments
and rocks: Journal of Sedimentary Petrology, 63, 990-999.
Folk, R. L., and Lynch, F. L., 1997, Nannobacteria are alive on Earth as well as Mars:
Proceedings of the International Symposium on Optical Science, Engineering, and
Instrumentation (SPIE), 3111, 406-419.
Folk, R. L., and Lynch, F. L., 1998, Morphology of nannobacterial cells in the Allende
carbonaceous chondrite, in Hoover, R. B., ed., Instruments, methods, and
missions for astrobiology: Proceedings of the Society of Photo-optical
Instrumentation Engineers, 3441, 112-122.
Folk, R. L., and Lynch, F. L., 2001, Organic matter, putative nannobacteria, and the
formation of ooids and hardgrounds: Sedimentology, 48, 215-229.
Folk, R. L., Kirkland, B. L., Rodgers, J. C., Rodgers, G. P., Rasmussen, T. E., Lieske, C.,
Charlesworth, J. E., Severson, S. R., and Miller, V. M., 2001, Precipitation of
minerals in human arterial plaque: the potential role of nannobacteria: Geological
Society of America annual meeting, abstracts with programs, A-189.
Fratesi, S. E., and Lynch, F. L., 2001, Comparison of organic matter preservation
techniques for SEM study of geologic samples: Geological Society of America
annual meeting, abstracts with programs, A-296.
Kirkland, B. L., Lynch, F. L., Rahnis, M. A., Folk, R. L., Molineux, I. J., and McLean, R.
J. C., 1999, Alternative origins for nannobacteria-like objects in calcite: Geology,
27, 347-350.

82
McKay, D. S., Gibson, E. K., Thomas-Keprta, K. L., Vali, L. H., Romanek, C. S.,
Clemett, S. J., Chillier, Z. D. F., Maechling, C. R., and Zare, R. N., 1996, Search
for past life on Mars: Possible relic biogenic activity in Martian meteorite
ALH84001: Science, 273, 924.
Scheidegger, A.E., 1974, The Physics of Flow Through Porous Media, 3rd Ed., University
of Toronto Press, Toronto, Canada.
Spark, I., Patey, I., Duncan, B., Hamilton, A, Devine, C, and McGovern-Traa, C. 2000.
The effects of indigenous and introduced microbes on deeply buried hydrocarbon
reservoirs, North Sea: Clay Minerals, 35, 5-12.

83
ACKNOWLEDGEMENTS The authors wish to express their sincere appreciation to John E. Parker for his
efforts in the coreflood studies and to Dr. Charles A. Sparrow for his assistance in the
experiments involving radioisotopes.
The SEM analyses were facilitated and assisted by Richard Kuklinski, Kay
Nevels Milam, and Bill Monroe, of the Electron Microscope Center at MSU.
Dr. Shahpoor Vosooghi in the Chemical Engineering Department of Kansas State
University provided the KUSP1 polymer.
The contributions of the following students is acknowledged with thanks Magan
Green and Karen Thompson in Biological Sciences, Zhuguing (Judy) Liu in Chemistry,
Beth Fratesi in Geosciences, and Ali Hemmatabadi in Management and Information
Systems.


