Embed Size (px)
Citation preview
DEVELOPMENTAL BRAIN
RESEARCH
ELSEVIER Developmental Brain Research 96 (1996) 83-96
Research report
Axonal origin and purity of growth cones isolated from fetal rat brain
Kathryn Lohse 1, Steve M. Helrnke, Malcolm R. Wood 2, Santiago Quiroga 3, Becky A. de la Houssaye, Virginia E. Miller, Pascale Negre-Aminou 4, Karl H. Pfenninger *
Department of Cellular and Structural Biology, University of Colorado School of Medicine, 4200, E. 9th Ave., B-I l l , Denver, CO 80262, USA
Accepted 2 April 1996
Abstract
The investigation of the molecular properties of nerve growth cones depends to a significant degree on their isolation from fetal brain in the form of 'growth cone particles' (GCPs). The availability of markers for developing axons and dendrites, as well as glial cells, has made it possible to characterize the GCP fraction in much greater detail than before and to optimize its yield. Marker analyses show that a member of the N-CAM family (5B4-CAM), synaptophysin, and especially GAP-43 and non-phosphorylated tau, are enriched in the GCP fraction. In contrast, MAP2 and, particularly, glial fibrillary acidic protein and vimentin are fractionated away from GCPs. Furthermore, GCP yield can be doubled relative to the original procedure, without compromising purity, by raising the sucrose concentration of the fractionation gradient's uppermost layer. The results indicate that GCPs are highly purified growth cone fragments with very little glial contamination, and that they ~Lre primarily of axonal origin.
Keywords: Growth cone; Axon; Subcellular fractionation; Biochemical markers; Fetal brain; Neurite growth
I. Introduction
The nerve growth cone plays a pivotal role in neurite outgrowth and the formation of neural circuits so that its biochemical and functional analysis is of major interest. Biochemical analysis of growth cones was almost impossi- ble until this laboratory developed a method for their isolation in bulk from fetal rat brain [32]. Shortly there- after, Gordon-Weeks and Lockerbie [12] published a simi- lar technique. These procedures have made it possible to conduct cell biological and molecular studies on growth cones and to develop antibody probes to growth cone proteins. However, when ,growth cone isolation first be- came possible, probes for appropriate markers of growing neurons and for potential contaminants of the growth cone
* Corresponding author. Fax: (1) (303) 270-4729. i Present address: Alpha Specu'a, Inc., 715 Arrowest Ct., Grand Junc-
tion, CO 81505, USA. 2 Present address: Scripps Clinic and Research Foundation, 10666 N.
Torrey Pines Road, 211C, La Jolla, CA 92037, USA. 3 Present address: CIQUIBIC, Universidad Nacional de Cordoba, Ciu-
dad Universitaria, C.C. 61, 5016 Cordoba, Argentina. 4 Present address: TNO Prevention and Health, Gaubius Laboratory,
P.O. Box 2215, 2301 CE Leiden, The Netherlands.
fraction were essentially unavailable. This situation has changed in recent years such that a broad analysis of biochemical markers in different subfractions of fetal brain could be undertaken.
Initially, the identification of isolated 'growth cone particles' (GCPs) was based to a large extent on electron microscopic data. GCPs were found to contain a comple- ment of organelles characteristic of nerve growth cones in vivo and in vitro. Radiolabeled nerve growth cones micro- dissected from cultures were shown to co-purify as identi- cal structures with GCPs [32]. Very few, if any, of the GCPs analyzed contained synaptic vesicles. Likewise, GCPs were devoid of ribosomes, which are present in glial processes and dendrites but absent from axonal nerve growth cones. These observations indicated the virtual absence of synaptosomes and glial fragments from the fraction [32]. Subsequent studies on the biochemical char- acteristics of GCPs provided independent evidence sup- porting further their growth cone origin. The relevant data included the recovery in GCPs of axonally transported proteins of growing neurons [37]. The enrichment in GCPs, relative to whole fetal brain, of phosphoproteins typically found in synaptosomes strongly suggested the neuronal origin of the bulk of GCP protein [19]. Of special interest was the presence in GCPs of proteins expressed at high
0165-3806/96/$15.00 Copyright © 1996 Elsevier Science B.V. All rights reserved. Pll S 0 1 6 5 - 3 8 0 6 ( 9 6 ) 0 0 0 7 6 - 4
84 K. Lohse et al. / Developmental Brain Research 96 (1996) 83-96
levels in differentiating, growing neurons. These include: the 180-250 kDa, polysialylated form of N-CAM (e.g. [4,34]); phorbol ester-binding protein kinase C [29]; the non-receptor tyrosine kinase pp60 ..... [3,11,39,41]; and GAP-43 (pp46, F1 [38]). Indeed, all of these proteins were found to be highly enriched in GCPs [9,16,19,26,28]. The enrichment of GAP-43 in GCPs gained additional signifi- cance when it became known that this protein is expressed primarily in axons and not in dendrites after the initial phase of outgrowth [13,38]. This suggested that GCPs are to a significant degree of axonal origin. Data presented by Saito et al. [36] supported this conclusion. However, im- portant questions remained.
GCPs are of low buoyant density and are collected after an equilibrium spin on the top of a cushion of low sucrose concentration. Increasing the sucrose level of this cushion retains elements of higher density in this 'A band' and, thus, improves the yield of the GCP fraction. However, eventually this will increase the level of contaminants in this fraction. By altering systematically the density of the critical sucrose cushion and probing the resultant fractions for the various biochemical markers it is possible to select the procedure that yields the highest level of GCPs with the lowest level of contaminants. Simultaneously, the na- ture of the GCP fraction can be assessed in greater detail. It should be noted, however, that none of the 'markers' used for growth cone identification is truly growth-cone- specific. Rather, these proteins are enr i ched in growth cones. To overcome this problem, we assessed enrichment of these 'markers' in the GCP preparation and generated balance sheets of recoveries in the GCP and the other fractions. The following biochemical markers were used for these studies: GAP-43 levels [38] were assessed by immunoblot as well as by radiophosphorylation assay us- ing [32P]ATP and endogenous kinase activity; 5B4-CAM, a member of the N-CAM family of adhesion molecules [9,35], was assayed for by immunoblot; and the same technique was used to examine the distribution of a third neuronal marker, synaptophysin, a protein characteristic of synaptic vesicles [1,18,24]. GAP-43 serves not only as a growth-regulated neuronal marker but also as a marker for axons vs. dendrites [13,14]. This latter distinction was enhanced by immunoblot determination of the distribution of two microtubule-associated proteins, MAP-2 and tau reactive with the Tau-1 antibody (epitope non-phosphory- lated), which are characteristic of dendrites and axons, respectively, at least after the initial phase of neurite sprouting [2,20,27,31]. In order to assess glial contamina- tion of the GCP fraction, two different probes were used, antibodies to glial fibrillary acidic protein (GFAP) and vimentin. GFAP is a highly specific intermediate filament protein of mature astrocytes. It just starts to be expressed at 18 days gestation in the rat, when GCPs are typically prepared [7,10]. Thus, it is a marker of somewhat limited value. In contrast, vimentin is expressed in neural precur- sor cells and the various types of developing glial cells,
including radial glia. Yet, it is absent from neurons that have entered terminal differentiation [5,8]. Thus, vimentin is a very useful marker of glial contamination in the GCP fraction.
Using the various probes described above, we addressed the following questions: (a) Is the GCP fraction contami- nated with glial elements, such as processes from radial glia and/or differentiating oligodendrocytes and astro- cytes? (b) Are GCPs derived primarily from axons or dendrites or do they represent a mixture of both types of neurite? (c) Can the yield of GCPs from fetal brain be increased without sacrificing purity of the fraction? The present study provides answers to these questions: The results demonstrate that GCP fractionation can be modified to double the yield relative to the original procedure [32], that the fraction is essentially free of glial contaminants, and that GCPs are primarily of axonal origin.
2. Materials and methods
2.1. G r o w t h cone par t i c l e i so la t ion
The methods were essentially as described by Pfen- ninger et al. [32]. All procedures were carried out on ice or at 4°C. Brains were dissected from fetal rats at 18 days of gestation (F18) and homogenized by five strokes with a slowly rotating (approx. 150 rpm) Teflon-glass homoge- nizer in ~ 8 volumes (w/v) of 0.32 M sucrose containing 1 mM MgC12, 1 mM Tes-NaOH, pH 7.3, and the follow- ing protease inhibitors: 3 I~M aprotinin (Calbiochem), 20 mM benzamidine, 1 mM leupeptin, 1 mM pepstatin A, 0.6 mM phenylmethylsulfonyl fluoride (all from Sigma). The homogenate (H) was spun at 1660 X g for 15 min, and the resultant low-speed supernatant (LSS) was loaded onto discontinuous sucrose density gradients consisting of the following three layers: 0.75-0.89 M (variable, see below), 1.0 M, and 2.66 M sucrose. The gradients were spun to equilibrium at 242 000 X g for 40 min in a Beckman VTi 50 vertical rotor. The following fractions were collected: the A-fraction at the load/0.75-0.89 M sucrose interface; the B-fraction at the 0.75-0.89/1.0 M sucrose interface; and the C-fraction at the 1.0/2.66 M sucrose interface. For further analysis, these fractions were diluted with 3-4 volumes of buffered 0.32 M sucrose and pelleted at 39 800 x g for 30 min. The resulting pellets were resuspended in 0.32 M sucrose for further analysis. Synaptosomes were isolated from adult rat cortex essentially as described by Cohen et al. [6]. Protein amounts were determined by the method of Lowry et al. [25].
One of the critical parameters of GCP fractionation is the sucrose concentration of the uppermost layer of the gradient upon which the load (LSS) is placed. To optimize GCP yields, five different sucrose concentrations were tested: 0.75, 0.80, 0.83, 0.86, and 0.89 M. For discussion purposes, fractions from these gradients are referred to
K. Lohse et al. / Developmental Brain Research 96 (1996) 83-96 85
using the sucrose concentration of the variable layer fol- lowed by the fraction name, for example, the 0.75-A-frac- tion. For comparison, equal amounts of LSS were loaded onto each of the five gradients. Although the same amounts of LSS were loaded, total protein recoveries from the gradients differed somewhat. Although these differences were small, results were e~cpressed in percent rather than absolute values to facilitate comparison of different gradi- ents.
2.2. Electron microscopic procedures
Aliquots of H, LSS, and unpelleted A- and B-fractions from the five gradients were prepared for electron micro- scopic analysis as described [32]. Briefly, aliquots were mixed slowly with increasing amounts of phosphate- buffered glutaraldehyde (1.5%). After 10-15 min, the fixed material was pelleted into the tip of a conical embed- ding capsule. After further glutaraldehyde fixation and washing with arsenate buffer, samples were treated with osmium tetroxide, block-slained with magnesium uranyl acetate and embedded. Thin sections were cut at various levels of the pellets, stained and examined with the elec- tron microscope. Analysis was performed without knowl- edge of the identity of the ,~amples.
2.3. GAP-43 phosphorylation
The method used was l~,asically that described by Hy- man and Pfenninger [17]. The phosphorylation reaction was carried out in a mixture containing 10 mM HEPES (pH 7.2), 120 mM KC1, 12 mM NaC1, 1.62 mM MgSO4, 0.4 mM EGTA, and 0.7 mM CaC12. Aliquots of 60-90 p~g protein were equilibrated for 3 min on ice with the above buffer and 0.02% saponin, in a final volume of 75 izl, and then warmed to 30°C for 2 rain. The reaction was initiated by the addition of [',/- 32 p]ATP (for a final concentration of 5 txM; 25 Ci/mmol) and samples incubated for 20 s at 30°C. The reaction was stopped by the addition of 4 × Laemmli sample buffer (see below) and proteins resolved by gel electrophoresis. GAP-43 bands were identified by autoradiography using molecular weight standards as guides, cut from the gels, and counted on a liquid scintilla- tion spectrometer (Beckman Instruments). Counts recov- ered in the GAP-43 band were normalized to Ixg fraction protein in the phosphorylation assay.
2.4. SDS-polyacrylamide gel electrophoresis (SDS-PAGE)
SDS-PAGE was carried out according to Laemmli [22]. Protein samples were heated to 100°C for 5 min in the presence of SDS and [3..mercaptoethanol before elec- trophoresis. Equal amounts of fraction protein were loaded onto either 5-15% gradient or 8% continuous polyacryl- amide gels and run for a distance of 17 cm in the resolving gel. Molecular weights of resolved proteins were calibrated
using protein molecular weight standards (Gibco-BRL or BioRad) and linear regression analysis.
2.5. Western blot analysis
Proteins resolved by SDS-PAGE were transferred elec- trophoretically at 200 mA for 2-3 h to nitrocellulose using a semi-dry blotting apparatus [40]. Blots were stained with Ponceau S and then rinsed with distilled water and Tris- buffered saline (TBS). Blots were first dried or placed directly in blocking solution (TBS with 5% non-fat dry milk and 0.2% Tween-20) for at least 2 h at room tempera- ture. Using the molecular weight standards as guides, blots were cut horizontally into strips representing specific M r ranges, and these strips were incubated with the appropri- ate primary antibodies in blocking solution for at least 2 h at room temperature or overnight at 4°C. All antibodies, other than our own 5B4 antibody [9] and anti-MAP-2 (clone HM-2; from Sigma), were obtained from Boehringer-Mannheim. Blots were washed in blocking solution, followed by an appropriate secondary antibody conjugated to horseradish peroxidase (HRP). After exten- sive washing, first in blocking solution with 0.1% NP-40 and then in TBS, blots were developed using enhanced chemiluminescence following manufacturer's instructions (NEN or Amersham). X-ray film was contact-exposed to reacted blots for different time intervals. Conditions of antibody binding and film exposure were optimized to keep background low and specific binding high but non- saturated whenever possible. For quantification, optimally exposed X-ray films or subsequent photographic prints were digitized on a Xerox Datacopy GS Plus linked to a Macintosh computer running Maclmage version 2.30 soft- ware. Relative optical densities (O.D.) were determined for corresponding immunoreactive bands in the different frac- tions and normalized to the protein content of these frac- tions.
3. Results
The description of the results of this study is focused on fractions A and B as they change with increasing sucrose concentration of the gradient step separating them. Yield and composition of fraction C are expected to, and do, remain more or less constant in most of these analyses. Numerous data were obtained by densitometric analysis of antigen bands in Western blots. This quantification is limited by the relatively narrow window between a signal level clearly above background binding and saturation of specific binding, but efforts were made to obtain non- saturated blots and optimal exposures. Regardless of these limitations, quantitative Western blot analysis proved to be far more reliable than other immunobinding assays tested. Because the scale of the fractionation experiments did not permit the generation of a sufficient number of data points
86 K. Lohse et a l . / Developmental Brain Research 96 (1996) 83-96
for meaningful statistical analysis we usually show experi- ments representative of the two to three complete analyses that were performed for each marker. Thus, there is some noise in the quantitative assessments. Nevertheless, distinct patterns of marker distribution are evident for the different experiments and gradients.
3.1. Protein yields
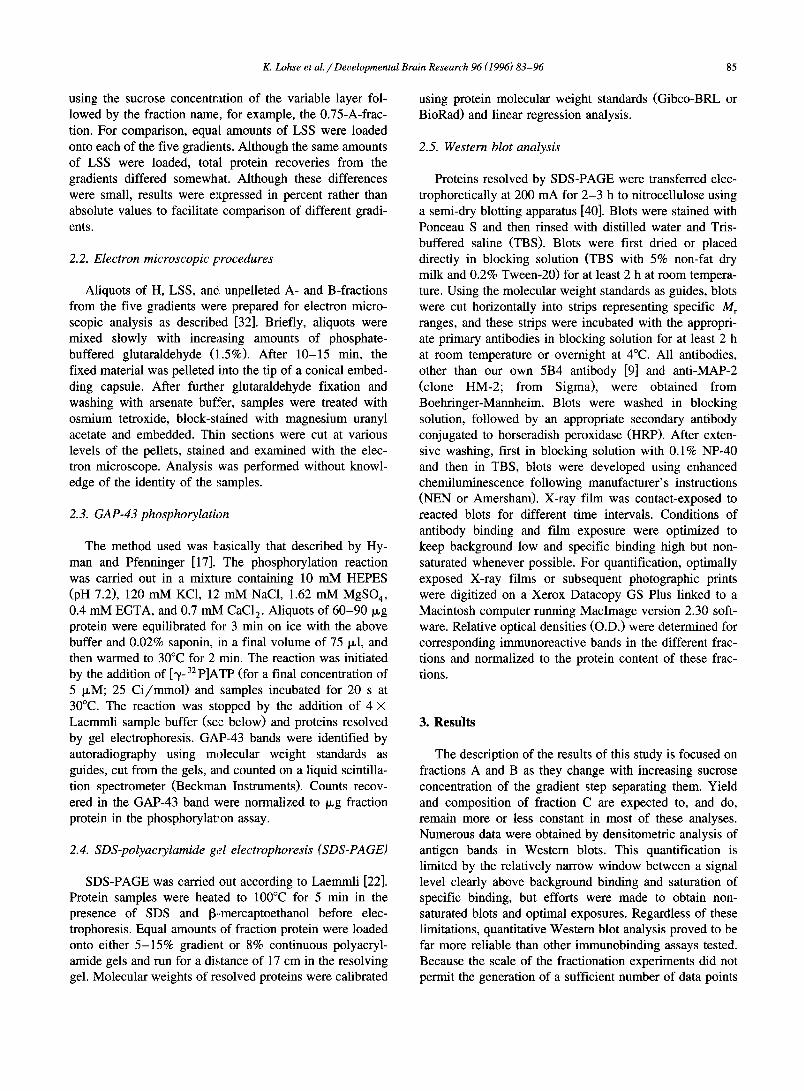
Recoveries of particulate protein in the three LSS sub- fractions, collected from each of the five gradients, were measured to determine overall protein distribution and to assess whether GCP yield could be increased. Data aver- aged from three separate experiments are shown in Fig. 1. Similar amounts of total particulate protein (A + B + C) were collected and amounted to about 16 mg per gradient for an LSS load derived from 15-20 fetal (F18) brains. On average, 78% of the particulate protein of the LSS was recovered from the gradients (all fractions combined), and absolute amounts of protein collected from each gradient differed by 10% or less.
Comparing all gradients, the percentage of protein banding in the C-fraction was essentially constant, at 78 _+ 1% of the total particulate protein recovered from the gradients (Fig. 1A). The protein amounts in the B- and A-fractions changed such that, with increasing sucrose concentration, particulate protein was shifted from B to A as expected (Fig. 1B). This resulted in significant changes at the level of the A-fraction, which contains the GCPs. Because the A-fraction contained the lowest amount of protein of any of the fractions ( < 10%) small increases in
percentage of total were significant. The percentage of protein in the A-fraction could be doubled approximately by increasing the concentration of the top sucrose layer from 0.75 M to 0.83 M. Further raising the sucrose concentration increased the A-yield only moderately (Fig. 1B) but resulted in substantial contamination by non-GCP elements, as shown below.
3.2. Ultrastructure
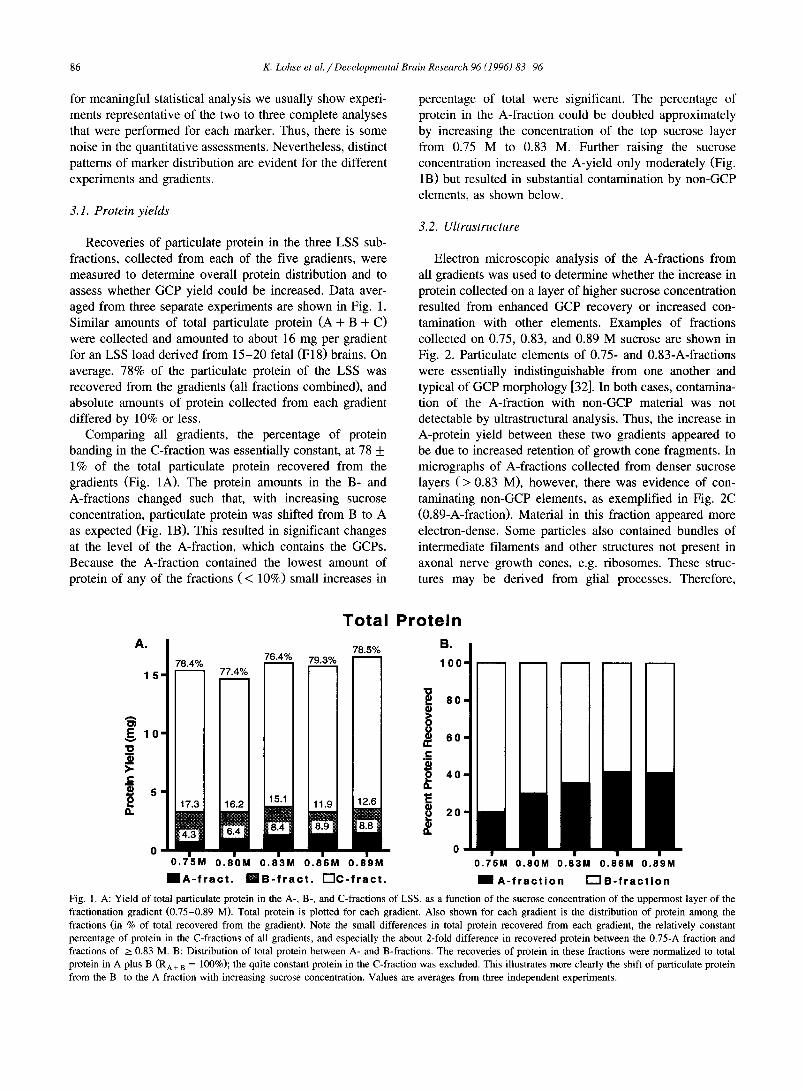
Electron microscopic analysis of the A-fractions from all gradients was used to determine whether the increase in protein collected on a layer of higher sucrose concentration resulted from enhanced GCP recovery or increased con- tamination with other elements. Examples of fractions collected on 0.75, 0.83, and 0.89 M sucrose are shown in Fig. 2. Particulate elements of 0.75- and 0.83-A-fractions were essentially indistinguishable from one another and typical of GCP morphology [32]. In both cases, contamina- tion of the A-fraction with non-GCP material was not detectable by ultrastructural analysis. Thus, the increase in A-protein yield between these two gradients appeared to be due to increased retention of growth cone fragments. In micrographs of A-fractions collected from denser sucrose layers ( > 0.83 M), however, there was evidence of con- taminating non-GCP elements, as exemplified in Fig. 2C (0.89-A-fraction). Material in this fraction appeared more electron-dense. Some particles also contained bundles of intermediate filaments and other structures not present in axonal nerve growth cones, e.g. ribosomes. These struc- tures may be derived from glial processes. Therefore,
A.
1 5
A o~ E l O .o ._ >. c 'E 5
a.
Tota l
78.5% 76.4% 79.3% 78,4%
:1
77.4%
6.4
15.1
8.4
11.9
8 . 9
12.6 J 8.8
P r o t e i n B.
1 0 0 -
8 0 -
6 0 -
F-
4 0 = D.
G) 2 0 "
(1. II / ' L - ~ ' ~ I ~ - - = ' ' ' '9 ~ ' --='='=I===
0 . 7 5 M 0 . 8 0 M 0 . 8 3 M 0 . 8 6 M 0 . 8 M 0 . 7 5 M 0 . 8 0 M 0 . 8 3 M 0 . 8 6 M 0 . 8 9 M
~ A - f r a c t . I B - f r a c t . r " l C - f r a c t . ~ A - f r a c t i o n I ~ l B - f r a c t i o n
Fig. 1. A: Yield of total particulate protein in the A-, B-, and C-fractions of LSS, as a function of the sucrose concentration of the uppermost layer of the fractionation gradient (0.75-0.89 M). Total protein is ploued for each gradient. Also shown for each gradient is the distribution of protein among the fractions (in % of total recovered from the gradient). Note the small differences in total protein recovered from each gradient, the relatively constant percentage of protein in the C-fractions of all gradients, and especially the about 2-fold difference in recovered protein between the 0.75-A fraction and fractions of > 0.83 M. B: Distribution of total protein between A- and B-fractions. The recoveries of protein in these fractions were normalized to total protein in A plus B (RA+ B = 100%); the quite constant protein in the C-fraction was excluded. This illustrates more clearly the shift of particulate protein from the B- to the A-fraction with increasing sucrose concentration. Values are averages from three independent experiments.
K. Lohse et al. / Developmental Brain Research 96 (1996) 83-96 87
sucrose concentrations above 0.83 M may primarily in- crease the amount of contaminating elements instead of raising GCP yield.
with an average of only 23% of GAP-43 being recovered in C-fractions (not shown). Comparing GAP-43 distribu- tions between the A- and B-fractions indicated that R A
3.3. Marker analysis
A series of biochemical markers was used to character- ize the different fractions from each gradient. The distribu- tion of a specific marker antigen was assessed using two different parameters, enrichment and percent recovery. Enrichment (E), a value for marker concentration, was defined as the relative araount of an antigen per unit amount of protein in a sample. Enrichment values were compared both between different fractions from the same gradient and between the same fractions from different gradients. The amount of marker recovered in a fraction thus equalled E × P (P, amount of protein in that fraction). Percent recovery (R) of ant~Lgen was defined as the amount of that antigen in a fraction (E × P) relative to total
antigen recovered in all fi'actions combined (RA+ B +c). For most markers, however, it was more useful to consider the percent recovery in the A- versus B-fractions (R A and R B) relative to the total recovery (RA+ B) in these two fractions, because the recovery in the C-fractions was essentially equal for all gradients (see above). While quan- tification and calculated recoveries varied for each antigen, at least 50% of the amount of each antigen in LSS particulates was recovered in the A-, B-, and C-fractions. To facilitate the review of the data, the key findings (for the 0.83 M gradient) are summarized in Table 1.
3.3.1. Neuronal markers
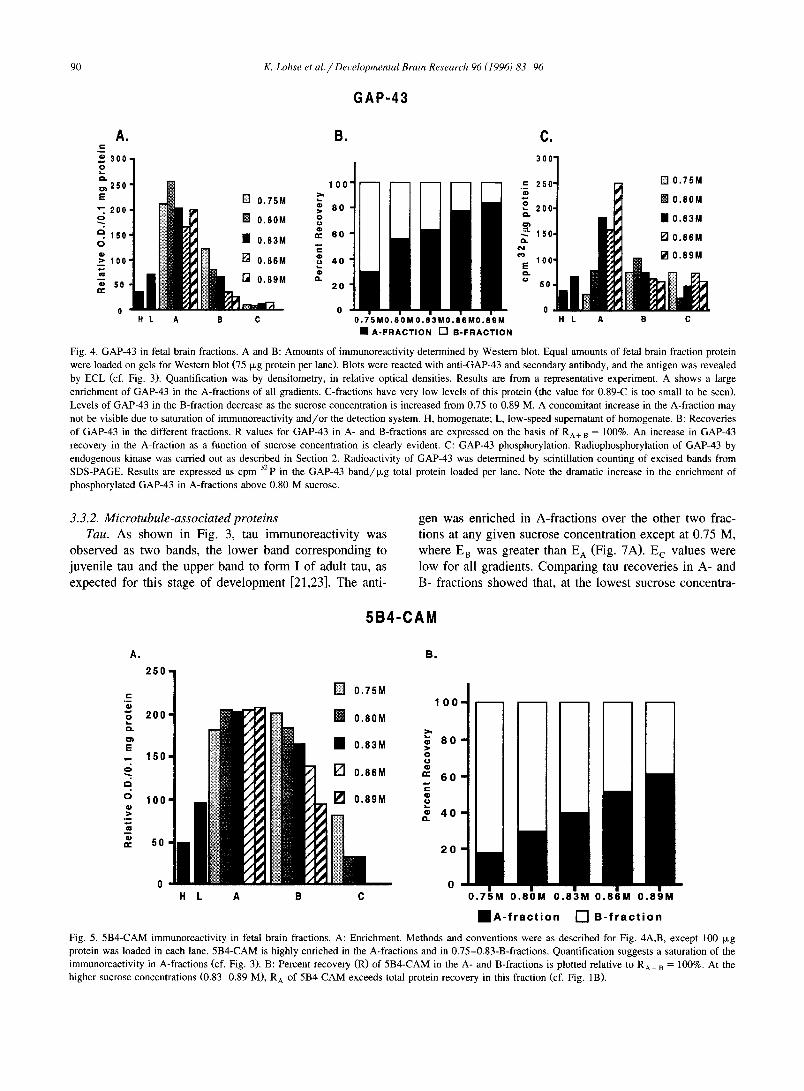
GAP-43. The presence of GAP-43 in the different frac- tions was assessed in two ways. Western blots were pre- pared to measure the enrichment of GAP-43 protein (migrating in this gel at 52 kDa). The results showed the highest E values being those of the A-fractions (Fig. 3 and Fig. 4A,B). E A values were more or less constant for all sucrose concentrations. E B values, however, decreased consistently from 0.75-B to 0.89-B. This suggested that GAP-43 immunoreactivity was being shifted to the A-frac- tion, but that further enrichment in the A-fraction was not detectable because of concomitant increase in protein re- covery and/or , more likely, due to saturation of the GAP- 43 signal. The recovery analysis showed that most of the total GAP-43 (about 77%) was in the A- and B-fractions,
Fig. 2. Ultrastructure of A-fractions from three different sucrose density gradients (A: 0.75-A; B: 0.83-A; C: 0.89-A). Structures (GCP profiles) in the 0.75- and 0.83-A-fractions are essentially identical. GCPs typically are filled with microfilaments and clusters of plasmalemmal precursor vesicles (asterisks). Structures in the 0.89-A-fraction, however, appear more electron-dense, and some of them contain what appear to be intermediate filament bundles as well as ribosomes (arrowhead), and other elements (arrow) not found in axonal nerve growth cones. Magnifi- cation, x20500. Calibration bar, 1 txm.
88 K. Lohse et al. / Developmental Brain Research 96 (1996) 83-96
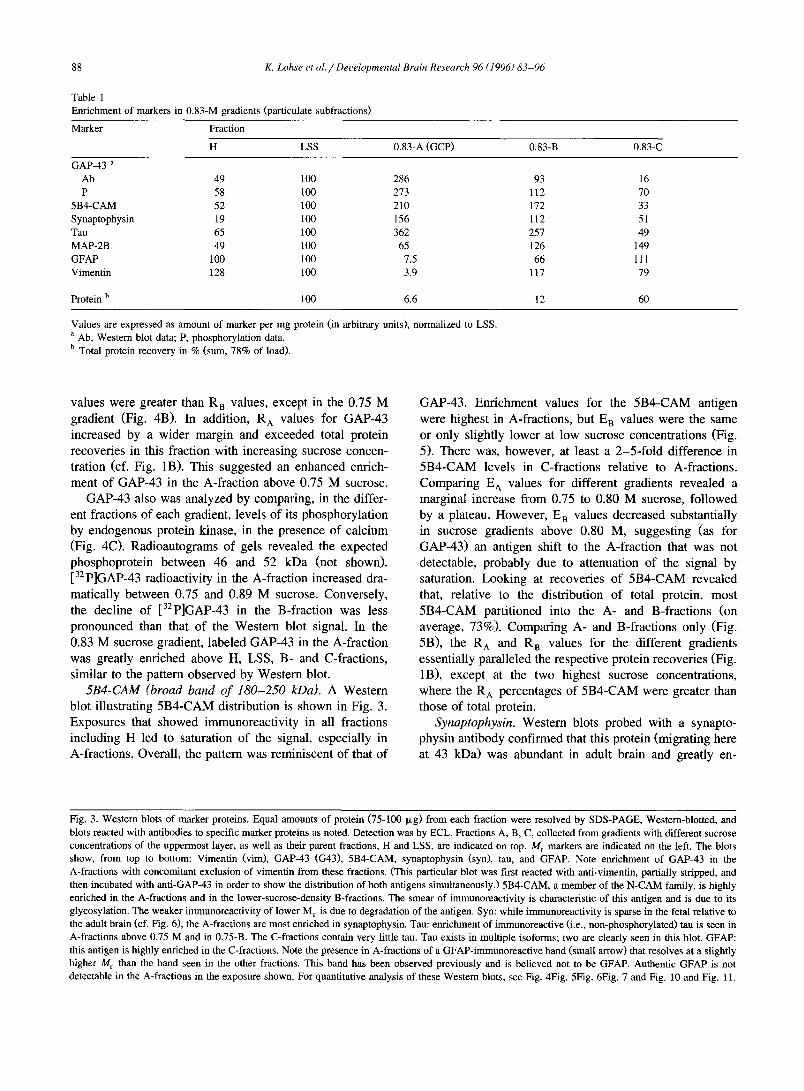
Table 1 Enrichment of markers in 0.83-M gradients (particulate subfractions)
Marker Fraction
H LSS 0.83-A (GCP) 0.83-B 0.83-C
GAP-43 a Ab 49 100 286 93 16 P 58 100 273 112 70
5B4-CAM 52 100 210 172 33 Synaptophysin 19 100 156 112 51 Tau 65 100 362 257 49 MAP-2B 49 100 65 126 149 GFAP 100 100 7.5 66 111 Vimentin 128 100 3.9 117 79
Protein b 100 6.6 12 60
Values are expressed as amount of marker per mg protein (in arbitrary units), normalized to LSS. a Ab, Western blot data; P, phosphorylation data. b Total protein recovery in % (sum, 78% of load).
values were greater than Rn values, except in the 0.75 M
gradient (Fig. 4B). In addition, R A values for GAP-43
increased by a wider marg in and exceeded total protein
recover ies in this fract ion with increas ing sucrose concen-
tration (cf. Fig. 1B). This suggested an enhanced enrich-
ment o f GAP-43 in the A-f rac t ion above 0.75 M sucrose.
GAP-43 also was analyzed by compar ing, in the differ-
ent fractions of each gradient, levels o f its phosphoryla t ion
by endogenous protein kinase, in the presence o f ca lc ium
(Fig. 4C). Rad ioau tograms of gels revea led the expected
phosphoprote in be tween 46 and 52 kDa (not shown).
[32p]GAP-43 radioact ivi ty in the A-frac t ion increased dra-
mat ical ly be tween 0.75 and 0.89 M sucrose. Converse ly ,
the decl ine o f [32p]GAP-43 in the B-fract ion was less
p ronounced than that o f the W e s t e m blot signal. In the
0.83 M sucrose gradient, labeled GAP-43 in the A-f rac t ion
was greatly enr iched above H, LSS, B- and C-fractions,
s imilar to the pattern observed by Western blot.
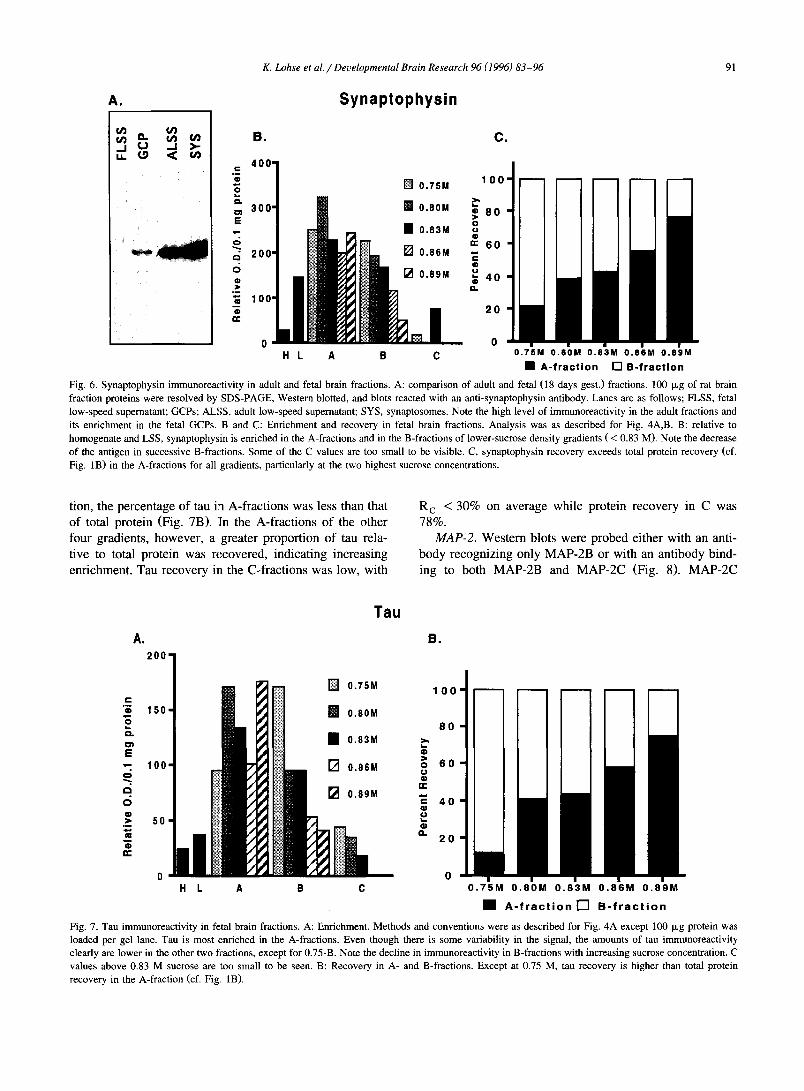
5B4-CAM (broad band o f 180-250 kDa). A Weste rn
blot i l lustrating 5 B 4 - C A M distr ibution is shown in Fig. 3.
Exposures that showed immunoreac t iv i ty in all fractions
including H led to saturation o f the signal, especial ly in
A-fract ions. Overal l , the pattern was reminiscent o f that o f
GAP-43 . Enr ichment values for the 5 B 4 - C A M ant igen
were highest in A-fract ions , but E B values were the same
or only sl ightly lower at low sucrose concentrat ions (Fig.
5). There was, however , at least a 2 - 5 - f o l d di f ference in
5 B 4 - C A M levels in C-fract ions relat ive to A-fract ions.
Compar ing E A values for different gradients revea led a
marginal increase f rom 0.75 to 0.80 M sucrose, fo l lowed
by a plateau. However , E B values decreased substantial ly
in sucrose gradients above 0.80 M, suggest ing (as for
GAP-43) an ant igen shift to the A-frac t ion that was not
detectable, probably due to at tenuation o f the signal by
saturation. Look ing at recover ies o f 5 B 4 - C A M revea led
that, re la t ive to the distribution o f total protein, mos t
5 B 4 - C A M part i t ioned into the A- and B-fract ions (on
average, 73%). Compar ing A- and B-fract ions only (Fig.
5B), the R A and R 8 values for the different gradients
essent ial ly paral le led the respect ive protein recover ies (Fig.
1B), except at the two highest sucrose concentrat ions,
where the R A percentages o f 5 B 4 - C A M were greater than
those o f total protein.
Synaptophysin. W e s t e m blots probed with a synapto-
physin ant ibody conf i rmed that this protein (migrat ing here
at 43 kDa) was abundant in adult brain and greatly en-
Fig. 3. Westem blots of marker proteins. Equal amounts of protein (75-100 Ixg) from each fraction were resolved by SDS-PAGE, Western-blotted, and blots reacted with antibodies to specific marker proteins as noted. Detection was by ECL. Fractions A, B, C, collected from gradients with different sucrose concentrations of the uppermost layer, as well as their parent fractions, H and LSS, are indicated on top. M r markers are indicated on the left. The blots show, from top to bottom: Vimentin (vim), GAP-43 (G43), 5B4-CAM, synaptophysin (syn), tau, and GFAP. Note enrichment of GAP-43 in the A-fractions with concomitant exclusion of vimentin from these fractions. (This particular blot was first reacted with anti-vimentin, partially stripped, and then incubated with anti-GAP-43 in order to show the distribution of both antigens simultaneously.) 5B4-CAM, a member of the N-CAM family, is highly enriched in the A-fractions and in the lower-sucrose-density B-fractions. The smear of immunoreactivity is characteristic of this antigen and is due to its glycosylation. The weaker immunoreactivity of lower M r is due to degradation of the antigen. Syn: while immunoreactivity is sparse in the fetal relative to the adult brain (cf. Fig. 6), the A-fractions are most enriched in synaptophysin. Tau: enrichment of immunoreactive (i.e., non-phosphorylated) tau is seen in A-fractions above 0.75 M and in 0.75-B. The C-fractions contain very little tau. Tau exists in multiple isoforms; two are clearly seen in this blot. GFAP: this antigen is highly enriched in the C-fractions. Note the presence in A-fractions of a GFAP-immunoreactive band (small arrow) that resolves at a slightly higher M r than the band seen in the other fractions. This band has been observed previously and is believed not to be GFAP. Authentic GFAP is not detectable in the A-fractions in the exposure shown. For quantitative analysis of these Western blots, see Fig. 4Fig. 5Fig. 6Fig. 7 and Fig. 10 and Fig. 11.
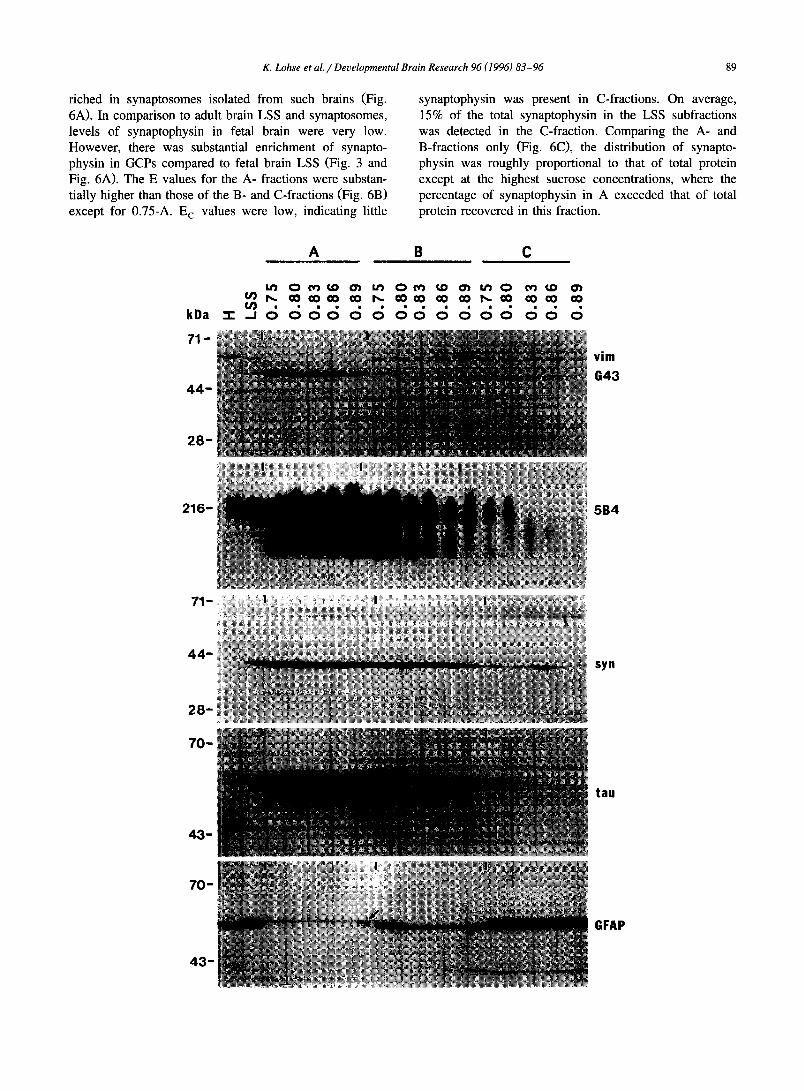
K. Lohse et al. / Developmental Brain Research 96 (1996) 83-96 89
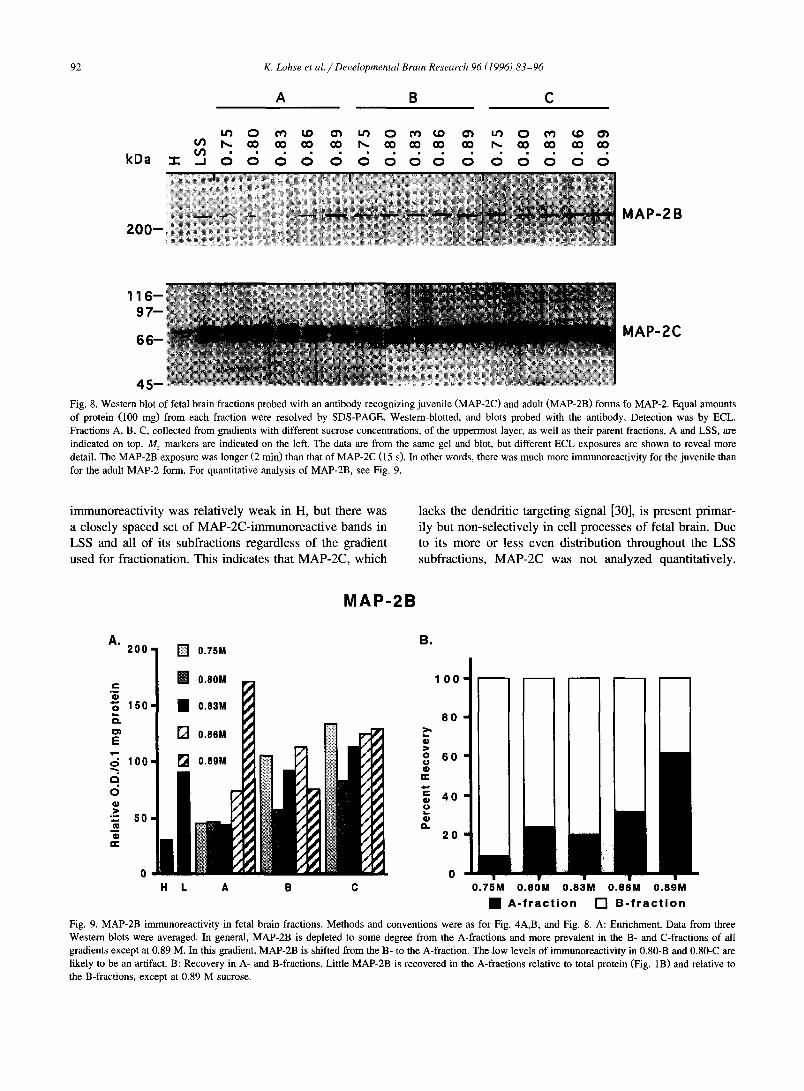
riched in synaptosomes isolated from such brains (Fig. 6A). In comparison to adult brain LSS and synaptosomes, levels of synaptophysin in fetal brain were very low. However, there was substantial enrichment of synapto- physin in GCPs compared to fetal brain LSS (Fig. 3 and Fig. 6A). The E values for the A- fractions were substan- tially higher than those of the B- and C-fractions (Fig. 6B) except for 0.75-A. E c values were low, indicating little
synaptophysin was present in C-fractions. On average, 15% of the total synaptophysin in the LSS subfractions was detected in the C-fraction. Comparing the A- and B-fractions only (Fig. 6C), the distribution of synapto- physin was roughly proportional to that of total protein except at the highest sucrose concentrations, where the percentage of synaptophysin in A exceeded that of total protein recovered in this fraction.
A B C
kDa
71-
4 4 -
2 8 -
i/')
" r .J c~
O 0r~ ~ 03 I ~ O 0r) ~D O~ U 3 0 0r3 "~D O~ C0 CO CO CO P~. C0 CO CO C0 I~ C0 CO CO CO
6c~c; 6 6 6 6 6 6 6 6 c~6 c~
vim
G43
216- 5B4
71-
4 4 -
2 8 -
70 -
43 -
syn
tau
70 -
4 3 -
GFAP
B.
K. Lohse et al. / Deuelopmental Brain Research 96 (1996) 83-96
GAP-43
A , c
3001
cn250 E ~. 200
150 0
> 100
a) 50
lOO :>,
o
gc s o
c
~ 4o CP
2O
90
0 0 H L A B C
C .
300"
0 . 7 5 M 0 . 8 0 M 0 . 8 3 M 0 . 8 6 M 0 . 8 9 M
• A - F R A C T I O N [ ] B - F R A C T I O N
= 250.
i 200
150
100
50
0
[] 0.75M
L A B C
Fig. 4. GAP-43 in fetal brain fractions. A and B: Amounts of immunoreactivity determined by Western blot. Equal amounts of fetal brain fraction protein were loaded on gels for Western blot (75 i~g protein per lane). Blots were reacted with anti-GAP-43 and secondary antibody, and the antigen was revealed by ECL (cf. Fig. 3). Quantification was by densitometry, in relative optical densities. Results are from a representative experiment. A shows a large enrichment of GAP-43 in the A-fractions of all gradients. C-fractions have very low levels of this protein (the value for 0.89-C is too small to be seen). Levels of GAP-43 in the B-fraction decrease as the sucrose concentration is increased from 0.75 to 0.89 M. A concomitant increase in the A-fraction may not be visible due to saturation of immunoreactivity and/or the detection system. H, homogenate; L, low-speed supernatant of homogenate. B: Recoveries of GAP-43 in the different fractions. R values for GAP-43 in A- and B-fractions are expressed on the basis of RA+ B = 100%. An increase in GAP-43 recovery in the A-fraction as a function of sucrose concentration is clearly evident. C: GAP-43 phosphorylation. Radiophosphorylation of GAP-43 by endogenous kinase was carried out as described in Section 2. Radioactivity of GAP-43 was determined by scintillation counting of excised bands from SDS-PAGE. Results are expressed as cpm 32p in the GAP-43 band /~g total protein loaded per lane. Note the dramatic increase in the enrichment of phosphorylated GAP-43 in A-fractions above 0.80 M sucrose.
3.3.2. Microtubule-associated proteins Tau. As shown in Fig. 3, tau immunoreactivity was
observed as two bands, the lower band corresponding to juvenile tau and the upper band to form I of adult tau, as expected for this stage of development [21,23]• The anti-
gen was enriched in A-fractions over the other two frac- tions at any given sucrose concentration except at 0.75 M, where E B was greater than E A (Fig. 7A). E c values were low for all gradients. Comparing tau recoveries in A- and B- fractions showed that, at the lowest sucrose concentra-
5B4-CAM
A.
250
c
200 i . Q.
E 150 T-
a
6 100 4) >
4) ,-,- 50
B.
[ ] 0.75M 1 0 0 -
" Z .o 0.83M > O o
0.86M n- 6 0
_ t ~ ~ l+i+~/L [] 0.89M "~ 4)
2 0
0 H L A B C 0 . 7 5 M . 8 0 M 0 . 8 3 M 0 . 8 6 M 0 . 8 9 M
l l A - f r a c t i o n [ ] B - f r a c t i o n
Fig. 5. 5B4-CAM immunoreactivity in fetal brain fractions. A: Enrichment. Methods and conventions were as described for Fig. 4A,B, except 100 ~g protein was loaded in each lane. 5B4-CAM is highly enriched in the A-fractions and in 0.75-0.83-B-fractions. Quantification suggests a saturation of the immunoreactivity in A-fractions (cf. Fig. 3). B: Percent recovery (R) of 5B4-CAM in the A- and B-fractions is plotted relative to RA+ B = 100%. At the higher sucrose concentrations (0.83-0.89 M), R A of 5B4-CAM exceeds total protein recovery in this fraction (cf. Fig. 1B).
K. Lohse et al . / Deuelopmental Brain Research 96 (1996) 83-96 91
A. Synaptophys in
e . C .
400" c o
O Q. m 300" E
o
,4 2oo- 6 Q
N 100" n-
1 0 0 " [ ] 0.75M
I • 0.e0M ~ 8 o ~ • 0.83M o
m
[] 0.8eM 0
_ _ l { ~ . , ~ / [ ] 0.89M ~ 4 0
2 0
• o H L A B C 0 . 7 5 M 0 . 8 0 M 0 . 8 3 M 0 . 8 6 M 0 . 8 9 M
• A- f ract ion [ ] B- f ract ion
Fig. 6. Synaptophysin immunoreactivity in adult and fetal brain fractions. A: comparison of adult and fetal (18 days gest.) fractions. 100 Ixg of rat brain fraction proteins were resolved by SDS-PAGE, Western blotted, and blots reacted with an anti-synaptophysin antibody. Lanes are as follows; FLSS, fetal low-speed supernatant; GCPs; ALSS, adult low-speed supernatant; SYS, synaptosomes. Note the high level of immunoreactivity in the adult fractions and its enrichment in the fetal GCPs. B and C: Enrichment and recovery in fetal brain fractions. Analysis was as described for Fig. 4A,B. B: relative to homogenate and LSS, synaptophysin is enriched in the A-fractions and in the B-fractions of lower-sucrose density gradients ( < 0.83 M). Note the decrease of the antigen in successive B-fractions. Some of the C values are too small to be visible. C, synaptophysin recovery exceeds total protein recovery (cf. Fig. 1B) in the A-fractions for all gradients, particularly at the two highest sucrose concentrations.
tion, the percentage of tau in A-fractions was less than that of total protein (Fig. 7B). ~[n the A-fractions of the other four gradients, however, a greater proportion of tau rela- tive to total protein was recovered, indicating increasing enrichment. Tau recovery in the C-fractions was low, with
R c < 30% on average while protein recovery in C was 78%.
MAP-2. Western blots were probed either with an anti- body recognizing only MAP-2B or with an antibody bind- ing to both MAP-2B and MAP-2C (Fig. 8). MAP-2C
Tau
A. B. 200
! D0, , ,oo _ C I.. . 0 , 0 , .o
>
6 ~ m 4 0
so -"
0 0 • . H L A B C 0 . 7 5 M 0 . 8 0 M 0 . 8 3 M 0 . 8 6 M 0 . 8 9 M
• A - f r a c t i o n [ ] B - f r a c t i o n
Fig. 7. Tau immunoreactivity in fetal brain fractions. A: Enrichment. Methods and conventions were as described for Fig. 4A except 100 ~g protein was loaded per gel lane. Tau is most enriched in the A-fractions. Even though there is some variability in the signal, the amounts of tau immunoreactivity clearly are lower in the other two fi'actions, except for 0.75-B. Note the decline in immunoreactivity in B-fractions with increasing sucrose concentration. C values above 0.83 M sucrose are Loo small to be seen. B: Recovery in A- and B-fractions. Except at 0.75 M, tan recovery is higher than total protein recovery in the A-fraction (cf. Fig. 1B).
2 0 0 -
K. Lohse et a l . / Developmental Brain Research 96 (1996) 83-96
A B C
U') 0 C~ LD O~ u'l 0 C~ ~D C3~ Lr~ 0 Or) ~D 0') r~ p~ CO CO O0 C:O I~ QO 00 GO CO I~ O0 CO CO CO
1 1 6 - 9 7 -
M A P - 2 B
6 6 -
M A P - 2 B
MAP-2C
4 5 - F i g . 8. Western blot of fetal brain fractions probed with an antibody recognizing juvenile (MAP-2C) and adult (MAP-2B) forms fo MAP-2. Equal amounts of protein (100 nag) from each fraction were resolved by SDS-PAGE, Western-blotted, and blots probed with the antibody. Detection was by ECL. Fractions A, B, C, collected from gradients with different sucrose concentrations, of the uppermost layer, as well as their parent fractions, A and LSS, are indicated on top. M r markers are indicated on the left. The data are from the same gel and blot, but different ECL exposures are shown to reveal more detail. The MAP-2B exposure was longer (2 min) than that of MAP-2C (15 s). In other words, there was much more immunoreactivity for the juvenile than for the adult MAP-2 form. For quantitative analysis of MAP-2B, see Fig. 9.
immunoreactivity was relatively weak in H, but there was a closely spaced set of MAP-2C-immunoreactive bands in LSS and all of its subfractions regardless of the gradient used for fractionation. This indicates that MAP-2C, which
lacks the dendritic targeting signal [30], is present primar- ily but non-selectively in cell processes of fetal brain. Due to its more or less even distribution throughout the LSS subfractions, MAP-2C was not analyzed quantitatively.
B. A. 200
C
150 I., D .
ID)
E
100 a
6
~ so
re"
0
o o
n,.
0 P
[ ] 0.75M
°° I-
H L A B
1 0 0
8 0
6 0
4 0
2 0
0 ~ 0 - C
I
J I
I
92
0.75M 0 .80M 0 .83M 0 .86M 0 .89M
• A - f r a c t i o n [ ] B - f r a c t i o n
Fig. 9. MAP-2B immunoreactivity in fetal brain fractions. Methods and conventions were as for Fig. 4A,B, and Fig. 8. A: Enrichment. Data from three Western blots were averaged. In general, MAP-2B is depleted to some degree from the A-fractions and more prevalent in the B- and C-fractions of all gradients except at 0.89 M. In this gradient, MAP-2B is shifted from the B- to the A-fraction. The low levels of immunoreactivity in 0.80-B and 0.80-C are likely to be an artifact. B: Recovery in A- and B-fractions. Little MAP-2B is recovered in the A-fractions relative to total protein (Fig. 1B) and relative to the B-fractions, except at 0.89 M sucrose.
K. Lohse et al. / Developmental Brain Research 96 (1996) 83-96 93
GFAP
A I 125-
!1o ,5°i 50"
6
25-
D 8... R
[] ° " ' l i L
H L A B C
B.
¢,.
"3
Q.
0 1 E
2 0 -
15 -
10 ,
5"
B1% 89% 93% 85%
I='1"1"1"1"1"1"1"1"~
90%
P ' l
0 0.7Z5M 0.80M 0.83M O.86M 0.89M BBA- f rac t . [ ] B - f r a c t , [ ] C - f r a c t .
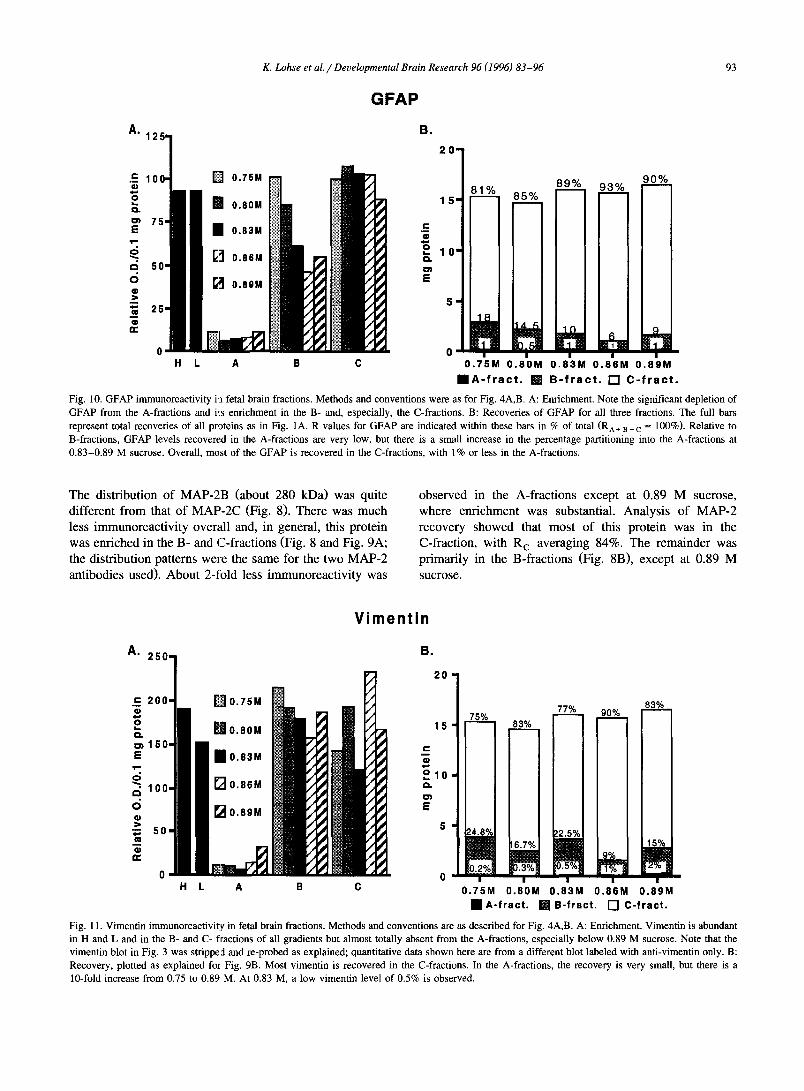
Fig. 10. GFAP immunoreactivity in fetal brain fractions. Methods and conventions were as for Fig. 4A,B. A: Enrichment. Note the significant depletion of GFAP from the A-fractions and i,:s enrichment in the B- and, especially, the C-fractions. B: Recoveries of GFAP for all three fractions. The full bars represent total recoveries of all proteins as in Fig. 1A. R values for GFAP are indicated within these bars in % of total (RA÷ ~ ÷ c = 100%). Relative to B-fractions, GFAP levels recovered in the A-fractions are very low, but there is a small increase in the percentage partitioning into the A-fractions at 0.83-0.89 M sucrose. Overall, most of the GFAP is recovered in the C-fractions, with 1% or less in the A-fractions.
The d i s t r ibu t ion o f M A P - 2 B (abou t 280 kDa) was qui te
d i f fe ren t f r o m tha t o f M A P - 2 C (Fig. 8). T h e r e was m u c h
less i m m u n o r e a c t i v i t y overa l l and, in genera l , th is p ro te in
was e n r i c h e d in the B- and C- f r ac t ions (Fig. 8 and Fig. 9A;
the d i s t r ibu t ion pa t t e rns were the s ame for the two M A P - 2
an t ibod ie s used) . A b o u t 2 - to ld less i m m u n o r e a c t i v i t y was
o b s e r v e d in the A- f r ac t i ons excep t at 0 .89 M sucrose ,
w h e r e e n r i c h m e n t was subs tant ia l . A n a l y s i s o f M A P - 2
r ecove ry s h o w e d tha t m o s t o f this p ro te in was in the
C-f rac t ion , wi th R c ave rag ing 84%. T h e r e m a i n d e r was
p r imar i l y in the B- f r ac t ions (Fig. 8B), excep t at 0 .89 M
sucrose.
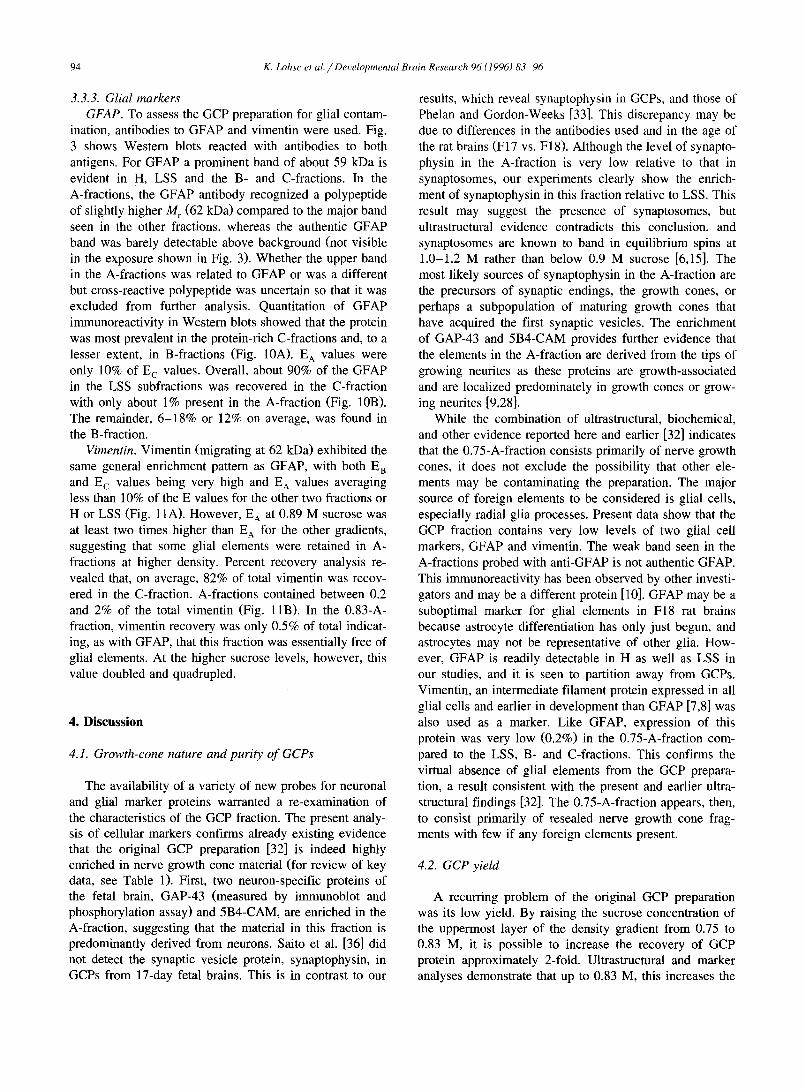
Vimentin
A. 250-
.E 200-
r ,~
~ l e O -
,.; 100-
d
== 50
B.
[ ] 0.75M ~ , _
no.8oM
Bo.03M
[]0.SeM
[ ] 0.89M
H L A B
20
75% 15 I -" -" 83%
.E
E
5 1 2 ~ 16.7%
o.2% ~Tg~ 0 z z
C 0.75M 0.80M
77% 90% 83%
[ ]A - f rac t . [ ]B - f rac t .
!2.5'~
'3 ' ' 0.8 M 0.86M 0.89M
[ ] C - f r ac t .
Fig. 11. Vimentin immunoreactivi(y in fetal brain fractions. Methods and conventions are as described for Fig. 4A,B. A: Enrichment. Vimentin is abundant in H and L and in the B- and C- fractions of all gradients but almost totally absent from the A-fractions, especially below 0.89 M sucrose. Note that the vimentin blot in Fig. 3 was stripped and re-probed as explained; quantitative data shown here are from a different blot labeled with anti-vimentin only. B: Recovery, plotted as explained for Fig. 9B. Most vimentin is recovered in the C-fractions. In the A-fractions, the recovery is very small, but there is a 10-fold increase from 0.75 to 0.89 M. At 0.83 M, a low vimentin level of 0.5% is observed.
94 K. Lohse et al. / Developmental Brain Research 96 (1996) 83-96
3.3.3. Glial markers GFAP. To assess the GCP preparation for glial contam-
ination, antibodies to GFAP and vimentin were used. Fig. 3 shows Western blots reacted with antibodies to both antigens. For GFAP a prominent band of about 59 kDa is evident in H, LSS and the B- and C-fractions. In the A-fractions, the GFAP antibody recognized a polypeptide of slightly higher M r (62 kDa) compared to the major band seen in the other fractions, whereas the authentic GFAP band was barely detectable above background (not visible in the exposure shown in Fig. 3). Whether the upper band in the A-fractions was related to GFAP or was a different but cross-reactive polypeptide was uncertain so that it was excluded from further analysis. Quantitation of GFAP immunoreactivity in Western blots showed that the protein was most prevalent in the protein-rich C-fractions and, to a lesser extent, in B-fractions (Fig. 10A). E A values were only 10% of E c values. Overall, about 90% of the GFAP in the LSS subfractions was recovered in the C-fraction with only about 1% present in the A-fraction (Fig. 10B). The remainder, 6-18% or 12% on average, was found in the B-fraction.
Vimentin. Vimentin (migrating at 62 kDa) exhibited the same general enrichment pattern as GFAP, with both E B and E c values being very high and E A values averaging less than 10% of the E values for the other two fractions or H or LSS (Fig. 11A). However, E A at 0.89 M sucrose was at least two times higher than E A for the other gradients, suggesting that some glial elements were retained in A- fractions at higher density. Percent recovery analysis re- vealed that, on average, 82% of total vimentin was recov- ered in the C-fraction. A-fractions contained between 0.2 and 2% of the total vimentin (Fig. 11B). In the 0.83-A- fraction, vimentin recovery was only 0.5% of total indicat- ing, as with GFAP, that this fraction was essentially free of glial elements. At the higher sucrose levels, however, this value doubled and quadrupled.
4. Discussion
4.1. Growth-cone nature and purity of GCPs
The availability of a variety of new probes for neuronal and glial marker proteins warranted a re-examination of the characteristics of the GCP fraction. The present analy- sis of cellular markers confirms already existing evidence that the original GCP preparation [32] is indeed highly enriched in nerve growth cone material (for review of key data, see Table 1). First, two neuron-specific proteins of the fetal brain, GAP-43 (measured by immunoblot and phosphorylation assay) and 5B4-CAM, are enriched in the A-fraction, suggesting that the material in this fraction is predominantly derived from neurons. Saito et al. [36] did not detect the synaptic vesicle protein, synaptophysin, in GCPs from 17-day fetal brains. This is in contrast to our
results, which reveal synaptophysin in GCPs, and those of Phelan and Gordon-Weeks [33]. This discrepancy may be due to differences in the antibodies used and in the age of the rat brains (F17 vs. F18). Although the level of synapto- physin in the A-fraction is very low relative to that in synaptosomes, our experiments clearly show the enrich- ment of synaptophysin in this fraction relative to LSS. This result may suggest the presence of synaptosomes, but ultrastructural evidence contradicts this conclusion, and synaptosomes are known to band in equilibrium spins at 1.0-t .2 M rather than below 0.9 M sucrose [6,15]. The most likely sources of synaptophysin in the A-fraction are the precursors of synaptic endings, the growth cones, or perhaps a subpopulation of maturing growth cones that have acquired the first synaptic vesicles. The enrichment of GAP-43 and 5B4-CAM provides further evidence that the elements in the A-fraction are derived from the tips of growing neurites as these proteins are growth-associated and are localized predominately in growth cones or grow- ing neurites [9,28].
While the combination of ultrastructural, biochemical, and other evidence reported here and earlier [32] indicates that the 0.75-A-fraction consists primarily of nerve growth cones, it does not exclude the possibility that other ele- ments may be contaminating the preparation. The major source of foreign elements to be considered is glial cells, especially radial glia processes. Present data show that the GCP fraction contains very low levels of two glial cell markers, GFAP and vimentin. The weak band seen in the A-fractions probed with anti-GFAP is not authentic GFAP. This immunoreactivity has been observed by other investi- gators and may be a different protein [10]. GFAP may be a suboptimal marker for glial elements in F18 rat brains because astrocyte differentiation has only just begun, and astrocytes may not be representative of other glia. How- ever, GFAP is readily detectable in H as well as LSS in our studies, and it is seen to partition away from GCPs. Vimentin, an intermediate filament protein expressed in all glial cells and earlier in development than GFAP [7,8] was also used as a marker. Like GFAP, expression of this protein was very low (0.2%) in the 0.75-A-fraction com- pared to the LSS, B- and C-fractions. This confirms the virtual absence of glial elements from the GCP prepara- tion, a result consistent with the present and earlier ultra- structural findings [32]. The 0.75-A-fraction appears, then, to consist primarily of resealed nerve growth cone frag- ments with few if any foreign elements present.
4.2. GCP yield
A recurring problem of the original GCP preparation was its low yield. By raising the sucrose concentration of the uppermost layer of the density gradient from 0.75 to 0.83 M, it is possible to increase the recovery of GCP protein approximately 2-fold. Ultrastructural and marker analyses demonstrate that up to 0.83 M, this increases the
K. Lohse et al. / Developmental Brain Research 96 (1996) 83-96 95
recovery of elements identical to those seen in the 0.75-A- fraction and of the most critical positive marker, GAP-43, without compromising the purity of the fraction. Further raising the sucrose concentration results in greater protein recovery, but vimentin lew..ls increase sharply, indicating glial contamination. Taken together the data indicate that 0.83 M is the optimal sucrose concentration at which to collect GCPs (see also Table 1).
4.3. Axonal origin of GCPs
The present marker analysis provides additional evi- dence pertaining to the origiin of the growth cones isolated in the 0.75-0.83-A-fractions. In addition to being a growth-associated protein, GAP-43 becomes segregated in axonal growth cones [13,14]. Therefore, GAP-43 enrich- ment in the GCP fraction suggests that they are axonally derived. Critical additional evidence for this conclusion comes from the study of file microtubule-associated pro- teins, tau and MAP-2B. These two proteins have been found to segregate into different cellular compartments, with non-phosphorylated tau being restricted to axonal compartments and MAP-2B localized primarily in den- dritic structures [2,20,27]. Analysis of these markers in the LSS subfractions shows thai: tau is enriched several-fold in the A-fraction. In contrast, MAP-2B is purified away form the A-fractions (below 0.89 M sucrose) into the B- and C-fractions. The MAP-2B levels observed in the 0.75- 0.86-A-fractions could be from contaminating dendritic growth cones, or perhaps more likely, from growth cones that have not yet reached axonal or dendritic identity. In contrast to MAP-2B, the juvenile, developmentally regu- lated MAP-2C (lacking the dendritic localization signal [30]) is abundantly present in LSS and all of its subfrac- tions. MAP-2C immunoreactivity was heterogeneous as observed by others [30], and the presumed isoforms were present uniformly in all fractions.
Overall, the data from studies on the three markers, GAP-43, tau, and MAP-2B, are internally consistent and indicate that growth cones partitioning into the 0.83-A- fraction are primarily or exclusively of axonal origin (cf. Table 1). Based on this conclusion, and on GAP-43 recov- ery we estimate that perhaps as much as 50% of growth cones in fetal brain are recovered in our GCP fraction. In any case our data suggests strongly that the GCP fraction is representative of most or :all axonal growth cones in F18 brains.
In summary, the results presented here indicate (i) that the yield of GCPs isolated from fetal rat brain can be doubled relative to the previously published method [32] without sacrificing purity (by collecting them at 0.83 M sucrose), (ii) that this GCP preparation is virtually free of glial contaminants and (iii) that the GCPs are primarily, if not exclusively, of axonal origin. These results are impor- tant for the interpretation of current and past results ob- tained with the GCP fractiort, as well as for the planning of
future experiments requiring the use of bulk quantities of growth cone material from the CNS.
Acknowledgements
This research was supported by NSF grant BNS 9109775 and NIH grant NS 24672 awarded to K.H. Pfenninger. The authors would like to thank Dr. MaryBeth Robinson for help with the graphics and Carmel McGuire for expert assistance with the completion of the manuscript.
References
[1] Bergmann, M., Lahr, G., Mayerhofer, A. and Gratzl, M., Expression of synaptophysin during the prenatal development of the rat spinal cord: correlation with basic differentiation processes of neurons, Neuroscience, 42 (1991) 569-582.
[2] Binder, L.I., Frankfurter, A. and Rebhun, L.I., The distribution of tau in the mammalian central nervous system, Z Cell Biol., 101 (1985) 1371-1378.
[3] Cartwright, C.A., Simantov, R., Cowan, W.M., Hunter, T. and Eckhart, W., pp60 c-src expression in the developing rat brain, Proc. Natl. Acad. Sci. USA, 85 (1988) 3348-3352.
[4] Chuong, C.-M. and Edelman, G.M., Alterations in neural cell adhe- sion molecules during development of different regions of the nervous system, J. Neurosci., 4 (1984) 2354-2368.
[5] Cochard, P. and Paulin, D., Initial expression of neurofilaments and vimentin in the central and peripheral nervous system of the mouse embryo in vivo, J. Neurosci., 4 (1984) 2080-2094.
[6] Cohen, R.S., Blomberg, F., Berzins, K. and Siekevitz, P., The structure of postsynaptic densities isolated from dog cerebral cortex. I. Overall morphology and protein composition, J. Cell Biol., 74 (1977) 181-203.
[7] Dahl, D., The vimentin-GFA protein transition in rat neuroglia cytoskeleton occurs at the time of myelination, J. Neurosci. Res., 6 (1981) 741-748.
[8] Dahl, D., Rueger, D.C., Bignami, A., Weber, K. and Osborn, M., Vimentin, the 57,000 molecular weight protein of fibroblast fila- ments, is the major cytoskeletal component in immature glia, Eur. J. Cell Biol., 24 (1981) 191-196.
[9] Ellis, L., Wallis, I., Abreu, E. and Pfenninger, K.H., Nerve growth cones isolated from fetal rat brain. IV. Preparation of a membrane subfraction and identification of a membrane glycoprotein expressed on sprouting neurons, J. Cell Biol., 101 (1985) 1977-1989.
[10] Fukuyama, R., Fushiki, S. and Fujita, S., Purification of glial fibrillary acidic protein (GFAP) from normal bovine brain, J. Neu- rosci. Methods, 40 (1991) 133-137.
[11] Fults, D.W., Towle, A.C., Lauder, J.M. and Maness, P.F., pp60 c-~rc in the developing cerebellum, Mol. Cell. Biol., 5 (1985) 27-32.
[12] Gordon-Weeks, P.R. and Lockerbie, R.O., Isolation and partial characterization of neuronal growth cones from neonatal rat fore- brain, Neuroscience, 13 (1984) 119-136.
[13] Goslin, K., Schreyer, D.J., Skene, J.H.P. and Banker, G., Develop- ment of neuronal polarity: GAP-43 distinguishes axonal from den- dritic growth cones, Nature, 336 (1988) 672-674.
[14] Goslin, K., Schreyer, D.J., Skene, J.H.P. and Banker, G., Changes in the distribution of GAP-43 during the development of neuronal polarity, J. Neurosci., 10 (1990) 588-602.
[15] Gray, E.G. and Whittaker, V.P., The isolation of nerve endings from brain: an electron microscopic study of cell fragments derived by homogenization and centrifugation, J. Anat., 96 (1962) 79-88.
[16] Helmke, S. and Pfenninger, K.H., Growth cone enrichment and
96 K. Lohse et al. / Developmental Brain Research 96 (1996) 83-96
cytoskeletal association of non-receptor tyrosine kinases, Cell Motil. Cytoskel. 30 (1995) 194-207.
[17] Hyman, C. and Pfenninger, K.H., Intracellular regulators of neuronal sprouting: II. Phosphorylation reactions in isolated growth cones, J. Neurosci., 7 (1987) 4076-4083.
[18] Jahn, R., Schiebler, W., Ouimet, C. and Greengard, P., A 38,000- dalton membrane protein (p38) present in synaptic vesicles, Proc. Natl. Acad. Sci. USA, 82 (1985) 4137-4141.
[19] Katz, F., Ellis, L. and Pfenninger, K.H., Nerve growth cones isolated from fetal rat brain. III. Calcium-dependent protein phosphorylation, J. Neurosci., 5 (1985) 1402-1411.
[20] Kosik, K.S. and Finch, E.A., MAP2 and tan segregate into dendritic and axonal domains after the elaboration of morphologically distinct neurites: an immunocytochemical study of cultured rat cerebrum, J. Neurosci., 7 (1987) 3142-3153.
[21] Kosik, K.S., Orecchio, L.D., Bakalis, S. and Neve, R.L., Develop- mentally regulated expression of specific tau sequences, Neuron, 2 (1989) 1389-1397.
[22] LaemmlL U.K., Cleavage of structural proteins during the assembly of the head of bacteriophage T4, Nature, 227 (1970) 680-685.
[23] Larcher, J.C., Boucher, D., Ginzburg, I., Gros, F. and Denoulet, P., Heterogeneity of Tau proteins during mouse brain development and differentiation of cultured neurons, Dev. Biol., 154 (1992)195-204.
[24] Leclerc, N., Beesley, P.W., Brown, I., Colonnier, M., Gurd, J.W., Paladino, T. and Hawkes, R., Synaptophysin expression during synaptogenesis in the rat cerebellar cortex, J. Comp. Neurol., 280 (1989) 197-212.
[25] Lowry, O.H., Rosebrough, N.J., Farr, A.L. and Randall, R.J., Protein measurement with the folin phenol reagent, J. Biol. Chem., 193 (1951) 265-275.
[26] Maness, P.F., Aubry, M., Shores, C.G., Frame, L. and Pfenninger, K.H., c-src gene product in developing rat brain is enriched in nerve growth cone membranes, Proc. Natl. Acad. Sci. USA, 85 (1988) 5001-5005.
[27] Matus, A., Microtubule-associated proteins: their potential role in determining neuronal morphology, Annu. Rev. Neurosci., 11 (1988) 29-44.
[28] Meiri, K.F., Pfenninger, K.H. and Willard, M.B., Growth-associated protein, GAP-43, a polypeptide that is induced when neurons extend axons, is a component of growth cones and corresponds to pp46, a major polypeptide of a subcellular fraction enriched in growth cones, Proc. Natl. Acad. Sci. USA, 83 (1986) 3537-3541.
[29] Murphy, K.M., Gould, R.J., Oster-Granite, M.L., Gearhart, J.D. and Snyder, S.H., Phorbol ester receptors: autoradiographic identification in the developing rat, Science, 222 (1983) 1036-1038.
[30] Papandrikopoulou, A., Doll, T., Tucker, R.P., Garner, C.C. and Matus, A., Embryonic MAP2 lacks the cross-linking sidearm se- quences and dendritic targeting signal of adult MAP2, Nature, 340, (1989) 650-652.
[31] Papasozomenos, S.C. and Binder, L.I., Phosphorylation determines two distinct species of Tau in the central nervous system, Cell Motil. Cytoskel., 8 (1987) 210-226.
[32] Pfenninger, K.H., Ellis, L., Johnson, M.P., Friedman, L.B. and Somlo, S., Nerve growth cones isolated from fetal rat brain: subcel- lular fractionation and characterization, Cell, 35 (1983) 573-584.
[33] Phelan, P. and Gordon-Weeks, P.R., Widespread distribution of synaptophysin, a synaptic vesicle glycoprotein, in growing neurites and growth cones, Eur. J. Neurosci., 4, (1992) 1180-1190.
[34] Pollerberg, E.G., Sadoul, R., Goridis, C. and Schachner, M., Selec- tive expression of the 180-kDa component of the neural cell adhe- sion molecule N-CAM during development, J. Cell Biol., 101 (1985) 1921-1929.
[35] Ramos, P., Safaei, R., Kayalar, C. and Ellis, L., Isolation and sequence of h g t l l cDNA clones encoding the 5B4 antigen ex- pressed on sprouting neurons, MoL Brain Res., 5 (1989) 297-303.
[36] Saito, S., Fujita, T., Komiya, Y. and Igarashi, M., Biochemical characterization of nerve growth cones isolated from both fetal and neonatal rat forebrains: the growth cone particle fraction mainly consists of axonal growth cones in both stages, Dev. Brain Res., 65 (1992) 179-184.
[37] Simkowitz, P., Ellis, L. and Pfenninger, K.H., Membrane proteins of the nerve growth cone and their developmental regulation, J. Neu- rosci., 9 (1989) 1004-1017.
[38] Skene, J.H.P., Axonal growth-associated proteins, Annu. Rev. Neu- rosci., 12 (1989) 127-156.
[39] Sorge, L.K., Levy, B.T. and Maness, P.F., pp60 c-src is developmen- tally regulated in the neural retina, Cell, 36 (1984) 249-257.
[40] Towbin, H., Staehelin, T. and Gordon, J., Electrophoretic transfer of proteins from polyacrylamide gels to nitrocellulose sheets: procedure and some applications, Proc. Natl. Acad. Sci. USA, 76 (1979) 4350-4354.
[41] Wiestler, O.D. and Walter, G., Developmental expression of two forms of pp60 ..... in mouse brain, Mol. Cell Biol., 8 (1988) 502-504.