Embed Size (px)
Citation preview
INSTITUTE OF PHYSICS PUBLISHING PHYSICS IN MEDICINE AND BIOLOGY
Phys. Med. Biol. 46 (2001) 609–619 www.iop.org/Journals/pb PII: S0031-9155(01)14254-5
B1 field homogeneity and SAR calculations for thebirdcage coil
T S Ibrahim1,2, R Lee1, B A Baertlein1 and P-M L Robitaille2,3
1 Department of Electrical Engineering, The Ohio State University, 1320 Kinnear Road,Columbus, OH 43212, USA2 MRI Facility, The Ohio State University, 1630 Upham Drive, Columbus, OH 43210, USA
E-mail: [email protected]
Received 26 May 2000, in final form 30 October 2000
AbstractThe finite-difference time-domain (FDTD) method is used to model a birdcageresonator. All the coil components, including the wires, lumped capacitorsand the source, are geometrically modelled together. As such, the couplingeffects within the birdcage, including the interactions of coil, source andhuman head, are accurately computed. A study of the transverse magnetic(B1) field homogeneity and the specific absorption rate (SAR) is presented onan anatomically detailed human head model at 64 and 200 MHz representing1.5 and 4.7 T MRI systems respectively. Unlike that at 64 MHz, the B1 fielddistribution is found to be inhomogeneous at 200 MHz. Also, high local SARvalues are observed in the tissue near the source due to the coupling betweenthe source and the head at 200 MHz.
1. Introduction
The radiofrequency (RF) coil is an essential element in magnetic resonance imaging (MRI)systems and therefore its correct design is important. Significant effort has been devoted tomodelling the electrical characteristics of RF coils. For instance, both the birdcage coil (Hayeset al 1985) and the TEM resonator (Vaughan et al 1994) have been theoretically analysed. Thefinite element method (FEM) has been used to model the TEM resonator loaded with a phantomand human head model (Vaughan et al 1994). A 2D FEM model has also been used to studythe B1 field and the SAR in a birdcage coil loaded with a human head model (Jin and Chen1997). The FEM has also been utilized to calculate the SAR inside a human head model ina saddle shaped MRI head coil (Simunic et al 1996). Since the wavelength was electricallylarge compared with the largest dimension of the saddle coil at 64 MHz, Simunic et al (1996)assumed quasistatic conditions in calculating the fields outside the human head. Jin et al(1996) employed the method of conjugate gradients with fast Fourier transform to evaluate theelectromagnetic fields inside a human head model placed within a birdcage coil. Recently, the
3 Author to whom correspondence should be addressed.
0031-9155/01/020609+11$30.00 © 2001 IOP Publishing Ltd Printed in the UK 609
610 T S Ibrahim et al
finite-difference time-domain (FDTD) method has been used to model a birdcage coil loadedwith a human head model (Collins et al 1998, Chen et al 1998).
The aforementioned studies shared the common assumption that the RF coil functionsas an azimuthal transmission line at all the frequencies of interest. This was achieved bydetermining the current distribution in the coil without the head being present using the methodof moments (Chen et al 1998), or by replacing the lumped capacitors with voltage sourceswhose magnitudes varied sinusoidally (Collins et al 1998). Such assumptions, however, arenot valid when the human head is positioned within the coil, due to electromagnetic couplingbetween the coil and the head (Ibrahim et al 2000b). Although the resulting inaccuracies maynot be too significant at 64 MHz, the field distribution calculations at higher frequencies aremuch more prone to being invalid. Even when the coil is empty, there are many cases wherethe ideal current distribution is not present (Ibrahim et al 1999, 2000b). Chen et al (1998)stated that neglecting the effect of the head on the coil current distribution can be a majorsource of error and the most accurate simulation involves modelling the coil and the object tobe imaged as a single system. This, however, was considered to be a difficult problem (Chenet al 1998).
The proper modelling of the RF coil has become of critical importance because of thedevelopment of ultra high-field MRI systems (Robitaille et al 1998), and it is anticipated thatthe optimization of RF coils for such a system will rely heavily upon numerical modelling(Ibrahim et al 2000a, Vaughan et al 2000, Collins et al 2000). Assumptions about the coilcurrents can produce misleading results. The importance of RF homogeneity in a birdcageresonator at 4.0 T has been brought into question (Robitaille 1999). Since RF homogeneity isinherently linked to RF power requirements, this issue has also gained increased attention inthe light of recent reports of lower than expected RF power requirements at 8.0 T (Robitailleet al 1998, Robitaille 1999, Abduljalil et al 1999). As such, in order to further expand uponthis subject (Leroy-Willig 1999, Robitaille 1999), the electrical characteristics of the birdcagehead coil are now examined.
In this work, in accordance with the suggestion of Chen et al (1998), both the RF coiland the human head are modelled as a single system using the FDTD method. Also, theRF coil is excited at one point for linear excitation and two points for quadrature excitationin exactly the same manner as the real system. The currents on the coil are then calculatedusing Maxwell’s equations. Unlike previous studies (Vaughan et al 1994, Jin and Chen 1997,Simunic et al 1996, Jin et al 1996, Collins et al 1998, Chen et al 1998), these currents areobtained while considering the interaction between the human head and the resonator. Theimplementation of the current source as well as the inclusion of the interactions between thecoil and the head makes the simulation accurate in modelling the performance of the RF coil.Results for the distribution of the magnetic field and the specific absorption rate (SAR) arepresented.
2. Theory
For the electrically large geometries that are usually encountered in high-field MRI, one canargue that it is better to use FDTD than FEM. This is due to the fact that the computation timeof the FDTD method is proportional to N1.33 where N is the number of unknowns, while thecomputation time of the FEM method is proportional to N>1.5. In addition, there is also a widedisparity in terms of memory requirements. The memory needed to solve an FEM problemwith 2 000 000 unknowns can be used to solve an FDTD problem with 40 000 000 unknowns.The one disadvantage of FDTD relative to FEM is that it is less flexible for modelling arbitrarygeometries, because FEM can be applied to an unstructured grid.
B1 field homogeneity and SAR calculations 611
The FDTD method is based on a finite difference approximation of Maxwell’s time domainequations:
∇ × �E = −∂ �B∂t
− σm�H (1)
∇ × �H = ∂ �D∂t
+ σe�E (2)
where �E (V m−1) and �H (A m−1) are the electric and the magnetic field intensities and�D (C m−2) and �B (Wb m−2) are the electric and the magnetic flux densities respectively.σm (� m−1) and σe (�−1 m−1) are the magnetic and the electric conductivities respectively.The above two vector equations actually represent six scalar equations, one for each of thex, y and z components of the equation. In the finite difference method, time and space arediscretized. Time is divided into small increments �t (time step). Space is discretized along allthree Cartesian coordinates, where the coordinates x, y, z are divided into increments �x, �y
and �z respectively. For this work, we choose �x = �y = �z = 3 mm. The electric field E
can be broken up into its three Cartesian components: Ex , Ey and Ez. Similarly, the magneticfield H is given by its three components, Hx , Hy and Hz. The notation used to represent anyfield component, say for example Ex , is En
x (i, j, k) = Ex(i�x, j�y, k�z, n�t), where i, j ,k are integer indices. All six components of the electric and magnetic fields can be solved interms of the neighbouring field values. A central difference approximation is applied to all sixof the scalar equations which represent Maxwell’s equations. The resulting equations showthat the field at a given time step is evaluated in terms of its value at a previous time step andof the fields from neighbouring cells at an earlier half time step (Ibrahim 1998).
An automatic FDTD mesh generator was developed to produce the grid for the birdcagecoil. In order to operate, the mesh generator requires cell size, diameter and length of the coil,size of the transverse domain and the number of coil legs. To minimize the errors caused bystair stepping, the Yee cells were chosen to be small enough (3 mm) to fully characterize thestructure of the coil including the lumped capacitors and the excitation source. Based on thestability criterion (Ibrahim 1998), the time step was chosen to be 5.5 ps. A 16-leg high-passbirdcage resonator was used for the calculations in this work. The diameter and the length ofthe coil were set to be 28.8 cm and 40 cm respectively, representing the size of the actual 1.5 TGE Signa birdcage coil. The coil structure in this model was composed of perfect electricconductors and the size of each conductor was assumed to be negligible.
The next step was the choice of the transverse domain size. With the given coil size, thedomain was chosen to have 148 cells in the x and y directions and 186 cells in the z direction(the number of cells in the grid is approximately 4 000 000 cells). The perfectly matched layer(PML) (Berenger 1994) was used for the outer boundary truncation of the grid. The grid sizeallows for 16 PML cells and a separation of at least 10 cells between the PML surface andclosest point on the coil geometry.
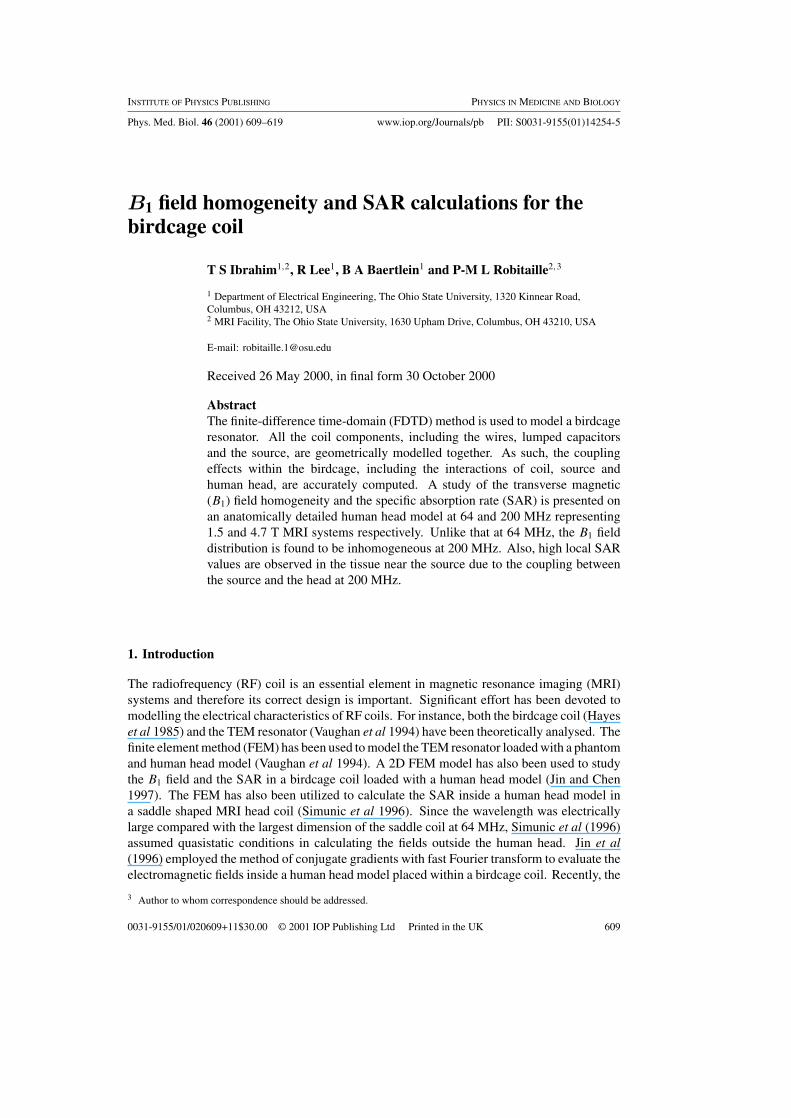
A differentiated Gaussian pulse that has a suitable frequency spectrum between 50 and400 MHz was used to excite the coil. At the lumped capacitor locations, a lumped elementFDTD algorithm is used to model the tuning capacitors (Tsuei et al 1993). Figure 1(a) showsa top view of the FDTD grid of an unloaded high-pass birdcage coil where the location ofthe lumped capacitors is observed on the upper coil ring. The exact definition of lumpedcapacitors is of great importance. The capacitance values (pF) give a realistic prediction of thelimitation of this specific coil design. For instance, the model had predicted that the resonancefrequency of mode 1 of this specific high-pass birdcage coil cannot surpass 270 MHz (0 pFcapacitance value). Also, as the frequency of operation rises, the modal field distribution ofthe coil becomes more dependent on the values and the position of the lumped capacitors.
612 T S Ibrahim et al
Figure 1. Schematic representation of a high pass birdcage coil within the FDTD grid. A top viewof an unloaded coil (a) and axial (b), sagittal (c) and coronal (d) slices of a coil loaded with thehuman head model are displayed. The B1 field and the SAR arrows (figure 1(c)) correspond tothe locations of the axial slices in which the FDTD results are presented in figures 3(a), 3(c), 3(e)and 3(g).
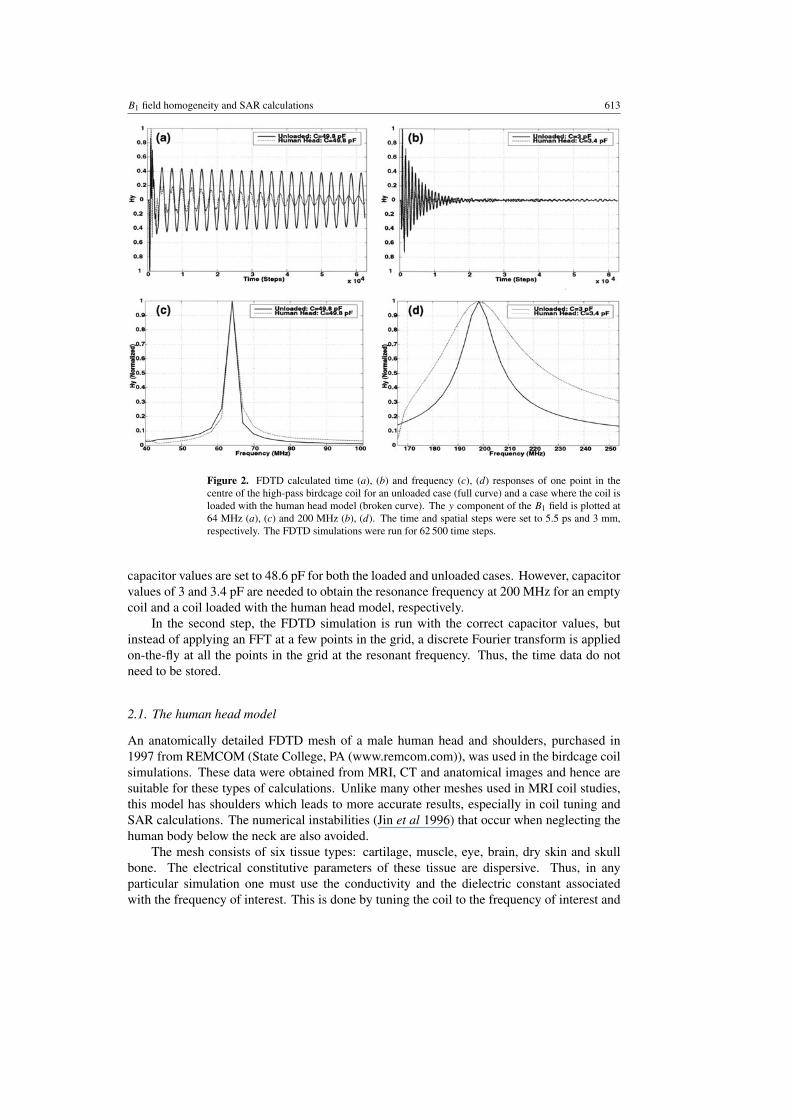
The simulation was run for 62 500 steps. The time domain data were collected at arbitrarypoints inside the coil for different capacitor values. Figures 2(a) and 2(b) show the timedomain response at one point for the Hy field component of a linearly excited coil. The fieldsare calculated with different capacitor values inside an empty coil and a coil loaded with thehuman head model. Because of loss, the signal decays much faster for the loaded cases. It isapparent that with this number of time steps the signal has significantly decayed (200 MHz:figure 2(b)) or reached steady state (64 MHz: figure 2(a)). Thus, it is clear that the frequencydomain data will not be significantly contaminated by the late time signal.
In reality, the goal was to obtain the field distribution within the coil at the resonancefrequency where the lumped capacitors must be tuned to set the resonance at the Larmorfrequency. Finding the field distribution is a two-step process. In the first step, an initial guessis made for the capacitor values. A fast Fourier transform (FFT) is then applied to the FDTDsolution at a few points within the grid to obtain the frequency response of the coil. The actuallocation where the data are collected is not that important since the frequency response atany point within the coil should not differ significantly. The only difference should be due tovariations in the field distribution of the coil. If the resonance frequency of the solution is not atthe desired location, then the capacitor values are changed and the FDTD program is rerun. Thisstep is repeated until the desired resonance frequency is obtained. Figures 2(c) and 2(d), showtwo frequency responses of the birdcage coil, loaded and unloaded. The resonance frequencyof the mode of interest is obtained at 64 and 200 MHz which are the Larmor frequencies for1.5 and 4.7 T MRI systems respectively. To obtain the resonance frequency at 64 MHz, the
B1 field homogeneity and SAR calculations 613
Figure 2. FDTD calculated time (a), (b) and frequency (c), (d) responses of one point in thecentre of the high-pass birdcage coil for an unloaded case (full curve) and a case where the coil isloaded with the human head model (broken curve). The y component of the B1 field is plotted at64 MHz (a), (c) and 200 MHz (b), (d). The time and spatial steps were set to 5.5 ps and 3 mm,respectively. The FDTD simulations were run for 62 500 time steps.
capacitor values are set to 48.6 pF for both the loaded and unloaded cases. However, capacitorvalues of 3 and 3.4 pF are needed to obtain the resonance frequency at 200 MHz for an emptycoil and a coil loaded with the human head model, respectively.
In the second step, the FDTD simulation is run with the correct capacitor values, butinstead of applying an FFT at a few points in the grid, a discrete Fourier transform is appliedon-the-fly at all the points in the grid at the resonant frequency. Thus, the time data do notneed to be stored.
2.1. The human head model
An anatomically detailed FDTD mesh of a male human head and shoulders, purchased in1997 from REMCOM (State College, PA (www.remcom.com)), was used in the birdcage coilsimulations. These data were obtained from MRI, CT and anatomical images and hence aresuitable for these types of calculations. Unlike many other meshes used in MRI coil studies,this model has shoulders which leads to more accurate results, especially in coil tuning andSAR calculations. The numerical instabilities (Jin et al 1996) that occur when neglecting thehuman body below the neck are also avoided.
The mesh consists of six tissue types: cartilage, muscle, eye, brain, dry skin and skullbone. The electrical constitutive parameters of these tissue are dispersive. Thus, in anyparticular simulation one must use the conductivity and the dielectric constant associatedwith the frequency of interest. This is done by tuning the coil to the frequency of interest and
614 T S Ibrahim et al
Table 1. Tissue properties of the human head/shoulder mesh.
64 MHz 200 MHz
Tissue type ρ (kg m−3) εr σ (�−1 m−1) εr σ (�−1 m−1)
Cartilage 1100 69.95 0.45 49.35 0.55Muscle 1040 88.0 0.76 71.08 0.85Eye 1050 76.30 0.88 60 0.95Brain 1030 105.82 0.60 66.66 0.76Dry skin 1100 75.31 0.43 47.91 0.50Skull bone 1850 35.92 0.13 24.72 0.18
simultaneously using the constitutive parameters associated with this particular frequency. Theconductivity, dielectric constant and density for these tissue types are given for two differentfrequencies (64 and 200 MHz) in table 1 (Gabriel 1996). The variables ρ, εr = ε/ε0 and σ
are the density, relative permittivity and conductivity respectively. At the interface betweentissues, each cell can have up to three different conductivities (σx , σy , σz) to account forconductivity discontinuities at the cell interfaces. This is critical for the SAR calculations dueto the local hot spots that usually occur at these areas. However, for the dielectric constantan interpolation scheme is used to account for a permittivity discontinuity at these interfaces.Figure 1 displays FDTD grids of a top view of an unloaded coil (a) and axial (b), sagittal (c)and coronal (d) slices of a coil loaded with the human head model. The shoulders extendover eight cells (approximately 2.5 cm) in the −y direction beyond the bottom ring of the coil(figure 1(d)). The excitation source can be applied on either of the excitation locations shownin figure 1(a). To get quadrature excitation, the same input is applied to the x (Ex) and y (Ey)components of the electric field positioned at Ex and Ey locations as shown (figure 1(a)), withthe only difference being a 90◦ phaseshift between the two inputs.
3. Numerical results
In this section, numerical results are presented to show the magnetic field homogeneity andSAR in the human head model inside the birdcage coil under quadrature excitation at 64 MHzand 200 MHz. The computer code used to generate these results was validated (Ibrahim et al2000b) against measurements taken from a GE Signa 1.5 T MRI system.
3.1. Magnetic field homogeneity
Ideally, excellent magnetic field homogeneity is necessary when imaging the human head.By extension, this problem must therefore be studied when the head is placed within theRF coil because the presence of the head within the resonator can significantly change themagnetic field homogeneity. This is due to two major factors. First, the wavelength in thehead is approximately eight times smaller than in the empty coil. Second, the head can induceadditional non-uniform currents on the coil elements.
A study of the B1 field homogeneity was therefore conducted on a birdcage coil loadedwith the human head model (figures 1(b)–(d)). The human head model was positioned such asthe excitation source located at Ex (figure 1(a)) is spatially behind the centre of the back of thehead. Note that with linear excitation, no significant difference in B1 field homogeneity wasobserved when the excitation was placed at the Ey versus the Ex locations (figure 1(a)). Thiswas also the case when the position of the human head model was reversed around its inferior–
B1 field homogeneity and SAR calculations 615
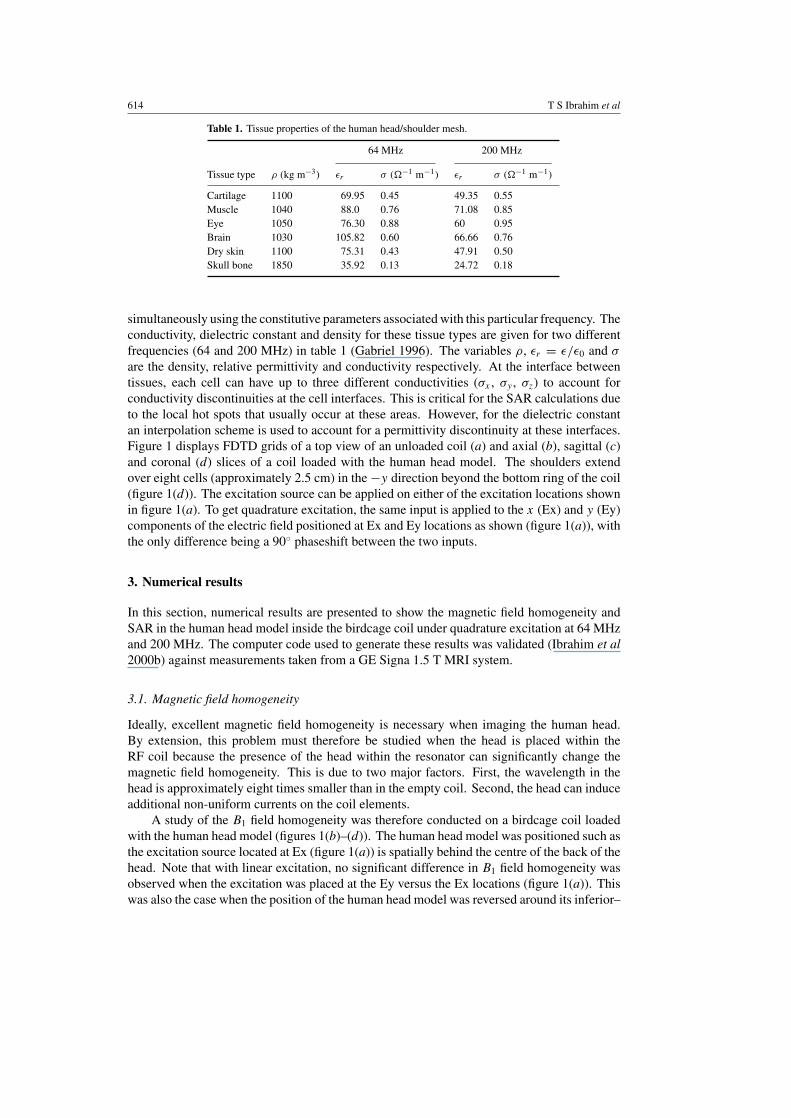
Figure 3. FDTD calculated B1 field (a)–(d) and the SAR (e)–(l) inside the human head modelusing quadrature excitation. The results are presented at 64 MHz (a), (b), (e), (f ), (i), (j) and at200 MHz (c), (d), (g), (h), (k), (l). Figures 3(i) and 3(k) correspond to axial slices through the neckand shoulders (1.5 cm in the −y direction beyond the bottom ring of the birdcage coil (figure 1(d)).�� and �� are the medial–lateral and the posterior–anterior directions respectively. The backand left side of the head are shown in figures 3(f ) and 3(h), while the front and right side of the headare shown in figures 3(j) and 3(l). Quadrature drive was performed where the excitation locationsare positioned at the back and the left side of the head. The location of the excitation sources isdisplayed in figure 1(a). The SAR results are presented for a total of 1 W CW absorption by thehuman head and shoulders.
superior axis while fixing the locations of the excitation source(s). The results presented inthis section are for quadrature excitation.
Figures 3(a) and 3(b) show axial (slice location is shown in figure 1(c)), coronal andsagittal slices of the B1 field in the human head at 64 MHz for quadrature excitation. The B1
field is very homogeneous except near the neck region where there is a significant decrease inthe field strength. In the region of the brain (region of most interest) where the axial slice istaken, the homogeneity of the B1 field is near 90% (the difference between the maximum andthe minimum values of the B1 field in the specified slice is 10% of the maximum value).
Examples of non-uniform B1 fields have been observed in experiments with 4 T magnets(170 MHz) (Barfuss et al 1990, Ugurbil et al 1993). To examine the homogeneity for thebirdcage coil at high frequency, the capacitor values are set to 3.4 pF so that the resonancefrequency rises approximately to 200 MHz (figure 2(d)). At 200 MHz, axial, coronal andsagittal slices of the B1 field are shown in figures 3(c) and 3(d) for quadrature excitation.The field distribution is more inhomogeneous (approximately 50% homogeneity across the
616 T S Ibrahim et al
specified axial slice) compared with the 64 MHz case. Based on such simulations and utilizingthe current conventional imaging techniques (two-port fixed phase and fixed magnitudequadrature excitation), one can conclude that the birdcage coil cannot produce a homogeneousB1 field around 200 MHz without significant modifications in the coil design.
3.2. Specific absorption rate
An important aspect of RF coil design at high frequencies is the absorption of RF power by thepatient. For both safety and operational reasons, a highly efficient coil is desirable. Electricfields, which can cause increased RF power deposition and dielectric losses, a source of furtherdegradation in Q, must also be minimized.
Fields within the body are difficult to estimate accurately because of their dependence onthe body’s complicated internal structure. Classically, the SAR is given by
SAR = σ |E|22ρ
(3)
where σ (�−1 m−1) and ρ (kg m−3) are the conductivity and the mass density of the tissuerespectively. |E| (V m−1) is the magnitude of the electric field in the tissue. By evaluating theSAR within specific tissues, one can obtain the power deposition for specific organs. Also, bysumming the SAR from all tissues, an indication of the total power deposition can be obtained.The SAR in the above equation is normalized to the power transmitted from the coil. Whilethere has been an extensive use of full-wave methods to predict SAR for humans (Gandhi1990), the FDTD method is considered to be a good choice because the fields are computedeverywhere within the RF coil.
The following calculations are presented for a 1 W CW total absorption by the humanhead/shoulder model given that the percentages of the FDTD calculated power radiated fromthe specified birdcage coil are 5.5% and 34% of total power going into the coil at 64 MHz and200 MHz respectively. As such, we are not concerned with the absolute amount of RF powerrequired to produce a given spin excitation at either 64 or 200 MHz. The human head modelwas positioned so that the excitation source located at Ex (figure 1(a)) is spatially behind thecentre of the back of the head. Figures 3(e)–(h) and 3(i)–(l) show two axial slices, one in themiddle of the head and one at the shoulder and the neck region, and 3D surface views of theSAR inside the human head model for quadrature excitation at 64 and 200 MHz respectively.At 64 MHz, compared with the linear excitation results, the SAR peak values in generalhave dropped when the excitation is done in quadrature. The decrease in peak SAR values,however, was less than that obtained with a coil loaded with a cylindrical muscle phantom. Thisis because the human head model is heterogeneous and asymmetric; hence, its internal fieldsare less circularly polarized than when a homogeneous and symmetrical cylindrical phantomis considered.
In general, the heating in the head is higher near the surface, especially at low frequency.Also, there are local high SARs in the shoulder where the end loops of the coil are closest tothe patient. From the electromagnetic theory one expects these hot spots, because the electricfield is very high at the ends of the coil. At 200 MHz, one observation is that the SAR valuesdecrease in the shoulder region compared with that at 64 MHz. This is the case when bothresonators are driven by an equal 1 W absorption.
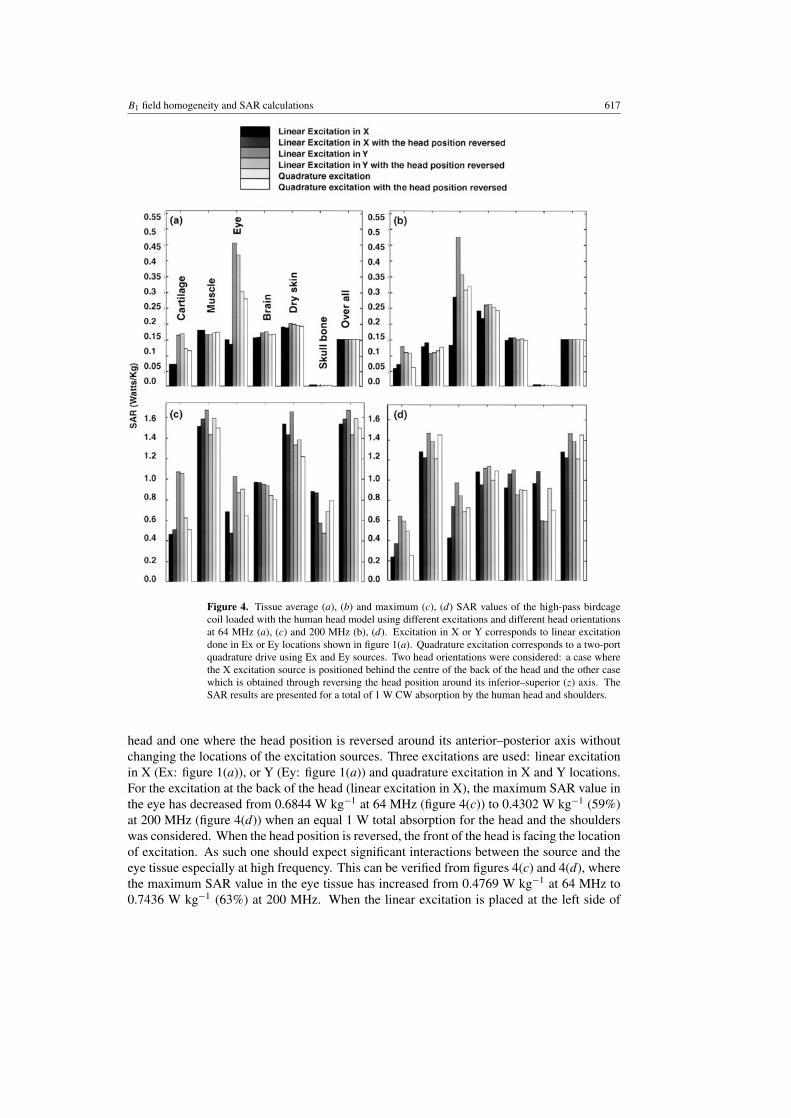
The average (64 MHz, figure 4(a) and 200 MHz, figure 4(b)) and the maximum (64 MHz,figure 4(c) and 200 MHz, figure 4(d)) SAR values in each tissue are given in figure 4. Twohead positions are considered: one where the human head model was positioned such that theexcitation source located at Ex (figure 1(a)) is spatially behind the centre of the back of the
B1 field homogeneity and SAR calculations 617
Figure 4. Tissue average (a), (b) and maximum (c), (d) SAR values of the high-pass birdcagecoil loaded with the human head model using different excitations and different head orientationsat 64 MHz (a), (c) and 200 MHz (b), (d). Excitation in X or Y corresponds to linear excitationdone in Ex or Ey locations shown in figure 1(a). Quadrature excitation corresponds to a two-portquadrature drive using Ex and Ey sources. Two head orientations were considered: a case wherethe X excitation source is positioned behind the centre of the back of the head and the other casewhich is obtained through reversing the head position around its inferior–superior (z) axis. TheSAR results are presented for a total of 1 W CW absorption by the human head and shoulders.
head and one where the head position is reversed around its anterior–posterior axis withoutchanging the locations of the excitation sources. Three excitations are used: linear excitationin X (Ex: figure 1(a)), or Y (Ey: figure 1(a)) and quadrature excitation in X and Y locations.For the excitation at the back of the head (linear excitation in X), the maximum SAR value inthe eye has decreased from 0.6844 W kg−1 at 64 MHz (figure 4(c)) to 0.4302 W kg−1 (59%)at 200 MHz (figure 4(d)) when an equal 1 W total absorption for the head and the shoulderswas considered. When the head position is reversed, the front of the head is facing the locationof excitation. As such one should expect significant interactions between the source and theeye tissue especially at high frequency. This can be verified from figures 4(c) and 4(d), wherethe maximum SAR value in the eye tissue has increased from 0.4769 W kg−1 at 64 MHz to0.7436 W kg−1 (63%) at 200 MHz. When the linear excitation is placed at the left side of
618 T S Ibrahim et al
the head, the maximum values of the SAR in the eye tissue are higher than that when theexcitation is at the back of the head. The maximum SAR values in the eye tissue are 1.0277and 0.9785 W kg−1 at 64 and 200 MHz respectively (figures 4(c) and 4(d)). When the headposition is reversed, the peak values do not significantly change: 0.8689 and 0.8474 W kg−1
at 64 and 200 MHz respectively (figures 4(c) and 4(d)). This is valid because the sourcelocation is relatively indifferent to the human head whether the head position is reversed ornot. This is a further indication of how much the interactions between the source and the headaffect the SAR values at 200 MHz. Similar to what we obtained with linear excitation, themaximum and average SAR values increase in the eye tissue when the head position is reversedat 200 MHz with quadrature excitation. Although the SAR distributions are different betweenthe two frequencies, the maximum SAR value does not change very much (with an equal 1 Wtotal absorption at 64 and 200 MHz). In fact, the SAR peak values have decreased in sometissues such as cartilage and dry skin at 200 MHz compared with that at 64 MHz (figures 4(c)and 4(d)). Of course in the traditional NMR theory, one would expect that more power wouldbe needed to obtain an image at 200 MHz relative to 64 MHz (Bottomley et al 1985, Hoult et al1986); therefore, the SAR values would go up proportionally. This traditional expectation hasrecently been the source of significant controversy (Robitaille et al 1998, Leroy-Willig 1999).
4. Conclusions
In this paper, analysis of the performance of a birdcage coil at low and high frequencywas presented using the FDTD method. A study of the B1 field homogeneity was doneon an anatomically detailed human head model. At 64 MHz, the B1 field was found to behomogeneous. At 200 MHz, the B1 field is much more inhomogeneous.
SAR calculations were presented at low and high frequency for different kinds ofexcitation, and different orientations of the human head model. Using equal excitation powermagnitude, the SAR values at 64 MHz have generally decreased from linear to quadratureexcitation. At 200 MHz, when quadrature excitation is compared with linear excitation,the SAR peak values do not necessarily decrease. The SAR peak values observed withquadrature excitation relative to linear excitation at 200 MHz are higher than those observedat 64 MHz. Because linear excitation does not give a sinusoidal current distribution on thecoil (high-pass birdcage) elements at 200 MHz (Ibrahim et al 1999, 2000b) (the fields are notlinearly polarized), it is impossible to obtain circularly polarized fields using the conventionalquadrature drive. Therefore, the fields induced by each of the two sources can add up randomly(constructively and destructively). As a result, and contrary to Collins et al (1998), peak SARvalues have increased for some tissues, which give inhomogeneous fields at 200 MHz whenswitching from linear to quadrature excitation. Another observation which cannot be predictedusing idealized current distribution (Collins et al 1998) on the birdcage coil struts is that highlocal SAR values were observed in the tissue near the source location due to electromagneticinteractions between the source and the human head at 200 MHz.
Acknowledgment
The Cray C-90 located at the Aeronautical Systems Command Major Shared Resource Centerof the Wright Patterson Air Force Base was used to generate the numerical results for thispaper.
B1 field homogeneity and SAR calculations 619
References
Abduljalil A M, Kangarlu A, Zhang X, Burgess R E and Robitaille P M L 1999 Acquisition of human multi-slice MRimages at 8 Tesla J. Comput. Assist. Tomogr. 23 335–40
Barfuss H, Fischer H, Hentschel D, Ladebeck K R, Oppelt A, Wittig R, Duerr W and Oppelt R 1990 In vivo magneticresonance imaging and spectroscopy of humans with a 4T whole-body magnet NMR Biomed. 3 31–45
Berenger J A 1994 perfectly matched layer for the absorption of electromagnetic waves Comput. Phys. 114 185–200Bottomley P A, Redington R W, Edelstein W A and Schenck J F 1985 Estimating radiofrequency power deposition
in body NMR imaging Magn. Reson. Med. 2 336–49Chen J, Feng Z and Jin J M 1998 Numerical simulation of SAR and B1-field inhomogeneity of shielded RF coils
loaded with the human head IEEE Trans. Biomed. Eng. 45 650–9Collins C M, Shizhe L and Smith M B 1998 SAR and B1 field distributions in a heterogeneous human head model
within a birdcage coil Magn. Reson. Med. 40 846–56Collins C M, Smith M B, Vaughan J T, Garwood M and Ugurbil K 2000 B1 field homogeneity comparison at 300 MHz:
calculation vs. experiment Proc. ISMRM, 8th Ann. Meeting (Denver, CO) (Berkeley, CA: International Societyof Magnetic Resonance in Medicine) p 148
Gabriel C 1996 Compilation of dielectric properties of body tissues at RF and microwave frequencies AL/OE-TR-1996-0037
Gandhi O P 1990 Biological Effects and Medical Applications of Electromagnetic Energy (Englewood Cliffs, NJ:Prentice-Hall)
Hayes E C, Wdelstein W A, Schenck D F, Mueller O M and Eash M 1985 An efficient highly homogeneousradiofrequency coil for whole-body NMR imaging at 1.5 T J. Magn. Reson. 63 622–8
Hoult D I, Chen C-N and Sank V J 1986 The field dependence of NMR imaging II. Arguments concerning an optimalfield strength Magn. Reson. Med. 3 730–46
Ibrahim T S 1998 Finite difference time domain simulations of ultra high-field magnetic resonance imaging in medicineMaster’s Thesis The Ohio State University, Columbus, OH
Ibrahim T S, Lee R, Baertlein B A, Kangarlu A and Robitaille P M L 1999 On the physical feasibility of achievinglinear polarization at high-field: a study of the birdcage coil Proc. ISMRM, 7th Ann. Meeting (Philadelphia, PA)(Berkeley, CA: International Society of Magnetic Resonance in Medicine) p 2058
Ibrahim T S, Lee R, Baertlein B A and Robitaille P M L 2000a FDTD numerical comparison of multi-strut TEMresonators Proc. ISMRM, 8th Ann. Meeting (Denver, CO) (Berkeley, CA: International Society of MagneticResonance in Medicine) p 149
Ibrahim T S, Lee R, Baertlein B A, Yu Y and Robitaille P M L 2000b Computational analysis of the high pass birdcageresonator: finite difference time domain simulations for high-field MRI Magn. Reson. Imaging 18 835–43
Jin J M and Chen J 1997 On the SAR and field inhomogeneity of birdcage coils loaded with human head Magn. Reson.Med. 31 953–63
Jin J M, Chen J, Chew W C, Gan H, Magin R L and Dimbylow P J 1996 Computation of electromagnetic fields forhigh-frequency magnetic resonance imaging applications Phys. Med. Biol. 41 2719–38
Leroy-Willig A 1999 Does RF heating decrease at 8 Tesla? NMR Biomed. 12 255Robitaille P M L 1999 Response to: does RF heating decrease at 8 Tesla? NMR Biomed. 12 256Robitaille P M L et al 1998 Human magnetic resonance imaging at 8T NMR Biomed. 11 263–5Simunic D, Watch P, Renhart W and Stollberger R 1996 Spatial distribution of high-frequency electromagnetic energy
in human head during MRI: numerical results and measurements IEEE Trans. Biomed. Eng. 43 88–94Tsuei Y, Cangellaris A C and Prince J L 1993 Rigorous electromagnetic modelling of chip-to-package (first-level)
interconnections IEEE Trans. Com., Hybrids., Manuf. 16 876–82Ugurbil K et al 1993 Imaging at high magnetic fields: initial experiences at 4 T Magn. Reson. Q. 9 259–77Vaughan J T, Garwood M, Collins C M, Delabarre L, Adriany G, Anderson P, Merkle H, Smith M B and Ugurbil K
2000 7T vs. 4T: Preliminary B1, SNR, SAR comparison in the human head Proc. ISMRM, 8th Ann. Meeting(Denver, CO) (Berkeley, CA: International Society of Magnetic Resonance in Medicine) p 147
Vaughan J T, Hetherington H P, Otu J O, Pan J W and Pohost J M 1994 High frequency volume coils for clinical NMRimaging and spectroscopy Magn. Reson. Med. 32 206–18


