Embed Size (px)
Citation preview
THE HONG KONG POLYTECHNIC UNIVERSITY
DEPARTMENT OF CIVIL AND STRUCTURAL ENGINEERING
EXPERIMENTAL AND THEORETICAL STUDY ON
PULLOUT RESISTANCE OF GROUTED SOIL NAILS
By
Wan-Huan ZHOU
A Thesis Submitted in Partial Fulfillment of the Requirements
for the Degree of Doctor of Philosophy
July 2008

II
III
Abstract of thesis entitled
EXPERIMENTAL AND THEORETICAL STUDY
ON PULLOUT RESISTANCE OF GROUTED SOIL NAILS
Soil nails have been widely used for stabilization of slopes and earth retaining structures
in many countries and regions. In Hong Kong, grouted soil nails have been used in most
slope stabilization works since the late 1980s. Soil nail pullout resistance is a key
parameter in the design of soil nailing. The design of a soil nailed system for slope
stabilization will be improved, if the pullout resistance can be more accurately estimated.
Nowadays, researchers and engineers have acknowledged that many factors influence
the pullout resistance of soil nails, such factors include installation method, overburden
pressure, grouting pressure (for grouted nails), roughness of nail surface, degree of
saturation of the soil, soil dilation, bending of the soil nail.
This research has therefore commenced to study the pullout resistance of grouted soil
nails. Firstly a simple mathematical model for the interaction analysis of a soil nail and
the surrounding soil has been developed. This model takes into account some key
factors, which are constrained soil dilation, soil nail bending, vertical pressure, and
non-linear subgrade reaction stiffness. The lateral subgrade reaction between the soil
and the soil nail is assumed to obey a hyperbolic relation. Reported test data in the
literature are used to verify the present model. Good agreement is found from the
comparisons in two case studies. The analyses show that the contribution of the soil nail
bending to the pullout resistance is of secondary importance as the tension failure is
dominant in a soil-nailed slope. Parametric study indicates that the soil nail pullout
IV
resistance increases to a limit value as the soil nail bending stiffness approaches to
infinity.
Secondly, a series of laboratory soil nail pullout tests have been carried out to study the
influences of both grouting pressure and overburden pressure on the soil nail pullout
interface shear resistance. The pullout tests were conduced in a completely decomposed
granite (CDG) soil in a saturated condition. The test procedures simulated the real
construction process of a soil nail, including the establishment of initial soil stress,
drilling a hole with stress release, pressure grouting, soil saturation, and soil nail pullout.
The pullout box was well instrumented. Typical test results are presented and discussed.
From the data analysis, the effects of both grouting pressure and overburden pressure on
the soil nail pullout resistance are investigated. It is found that both overburden
pressure and grouting pressure have influences on soil nail pullout resistance, and their
influences are interactional. The soil nail pullout resistance is hardly or slightly
dependent on the overburden pressure when the grouting pressure is low, but increases
with the overburden pressure when the grouting pressure is higher. Based on the test
results, a new empirical liner equation is proposed for the determination of soil nail
pullout resistance considering both grouting pressure and overburden pressure.
Finally, a three-dimensional (3D) finite element model has been established for
modelling the laboratory soil nail pullout tests carried out in The Hong Kong
Polytechnic University. The model simulates all the procedures of the pullout tests for
the cases of both unsaturated soil without pressure grouting and saturated soil with
pressure grouting. The model is verified by the comparisons between the results from
the numerical modelling and the pullout test data. It is found that the present 3D FE
model is capable of capturing the main features of the soil stress variations and pullout
V
behaviour during the soil nail pullout tests in both unsaturated and saturated soils. The
FE modelling shows that the stress distribution in the soil nail axial direction is
non-uniform at large pullout displacement in the unsaturated soil condition, but
basically uniform in the saturated condition.
VI
ACKNOWLEDGEMENTS
I would like to express my deepest gratitude to my supervisor, Professor Jian-Hua Yin,
for his encouragement and guidance throughout the study and giving me the
responsibility over such a project. It was his supports and experienced guidance that
made this work possible. The privilege of working with Professor Yin has appreciably
influenced my professional development and perspectives.
Financial supports from The Hong Kong Polytechnic University and a grant from
Research Grants Committee (grant number: PolyU 5174/04E) of the Hong Kong
Special Administrative Region Government of China are gratefully acknowledged.
I would like to express my thanks to Mr. Hong Cheng-Yu, Miss Lai Li, Mr. Zhu
Hong-Hu, Dr. Su Li-Jun, and the technicians in the Soil Mechanics Laboratory of
Department of Civil and Structural Engineering in The Hong Kong Polytechnic
University for their suggestions in the test setup and assistance in the soil nail pullout
tests.
Finally, I would like to express my sincere thanks to my dear parents, teachers, and
friends whose encouragement, friendship and love over the last three years have enabled
me to reach a new level in my life.
VII
TABLE OF CONTENTS
CERTIFICATE OF ORIGINALITY..................................................................................I
ABSTRACT ....................................................................................................................III
ACKNOWLEDGEMENTS ............................................................................................VI
TABLE OF CONTENTS .............................................................................................. VII
LIST OF TABLES........................................................................................................XIII
LIST OF FIGURES....................................................................................................... XV
Chapter 1: INTRODUCTION
1.1 BACKGROUND.................................................................................................................- 1 -
1.2 OBJECTIVES OF THE RESEARCH...............................................................................- 2 -
1.3 ORGANIZATION OF THE THESIS................................................................................- 3 -
Chapter 2: LITERATURE REVIEW
2.1 INTRODUCTION...............................................................................................................- 7 -
2.1.1 The soil nailing technique...........................................................................................- 7 -
2.1.2 Development of soil nailing........................................................................................- 9 -
2.1.3 Advantages and limitations of soil nailing...............................................................- 17 -
2.1.4 Behaviour of a soil nailed system.............................................................................- 19 -
2.1.5 Design of a soil nailed system ..................................................................................- 22 -
2.2 SOIL NAIL PULLOUT RESISTANCE .........................................................................- 23 -
2.2.1 Effect of overburden pressure...................................................................................- 24 -
2.2.2 Effect of soil dilation.................................................................................................- 25 -
VIII
2.2.3 Effect of grouting.......................................................................................................- 26 -
2.2.4 Effect of soil saturation condition.............................................................................- 28 -
2.3 FIELD AND LABORATORY TESTING......................................................................- 28 -
2.3.1 Field monitoring........................................................................................................- 29 -
2.3.2 Centrifuge modelling ................................................................................................- 31 -
2.3.3 Direct and interface shear tests .................................................................................- 32 -
2.3.4 Laboratory pullout tests.............................................................................................- 32 -
2.4 NUMERICAL MODELLING .........................................................................................- 33 -
2.4.1 Analytical method .....................................................................................................- 34 -
2.4.2 Finite element method...............................................................................................- 35 -
Chapter 3: A SIMPLE MATHEMATICAL MODEL FOR THE DETERMINATION
OF SOIL NAIL PULLOUT RESISTANCE
3.1 INTRODUCTION.............................................................................................................- 49 -
3.2 DEVELOPMENT OF A MATHEMATICAL MODEL...............................................- 52 -
3.2.1 Normal stress on the soil nail....................................................................................- 52 -
3.2.2 Shear stress at the interface.......................................................................................- 55 -
3.2.3 Equilibrium equations...............................................................................................- 56 -
3.3 VERIFICATION WITH EXPERIMENTAL DATA.....................................................- 58 -
3.3.1 Case Study 1- Comparisons with field test data by Gässler (1987).......................- 59 -
3.3.2 Case Study 2 - Comparisons with large-scale direct shear test data by Pedley (1990)
...........................................................................................................- 61 -
3.4 PARAMETRIC STUDY ..................................................................................................- 63 -
3.5 SUMMARY AND CONCLUSIONS..............................................................................- 65 -
IX
Chapter 4: TEST SETUP, MATERIALS AND PROCEDURES
4.1 INTRODUCTION.............................................................................................................- 77 -
4.2 TEST SETUP AND INSTRUMENTATION.................................................................- 79 -
4.2.1 Description of the pullout box..................................................................................- 79 -
4.2.2 Calibration of transducers.........................................................................................- 80 -
4.3 MATERIAL PROPERTIES.............................................................................................- 81 -
4.3.1 Basic properties of the CDG soil..............................................................................- 81 -
4.3.2 Shear strength of the saturated CDG soil.................................................................- 82 -
4.3.3 Properties of the cement grout..................................................................................- 84 -
4.4 TEST PROCEDURES ......................................................................................................- 84 -
4.4.1 Test preparation.........................................................................................................- 85 -
4.4.2 Soil compaction.........................................................................................................- 85 -
4.4.3 Application of the overburden pressure...................................................................- 86 -
4.4.4 Hole drilling and preparation of the steel rebar .......................................................- 86 -
4.4.5 Pressure grouting.......................................................................................................- 88 -
4.4.6 Saturation ...................................................................................................................- 89 -
4.4.7 Pullout of the soil nail ...............................................................................................- 90 -
4.4.8 Post-test examination ................................................................................................- 91 -
4.5 SUMMARY ...................................................................................................................- 91 -
Chapter 5: LABORATORY SOIL NAIL PULLOUT
EXPERIMENTS AND RESULTS
5.1 INTRODUCTION...........................................................................................................- 111 -
5.2 TEST PROGRAMME ....................................................................................................- 112 -
5.3 RESULTS AND OBSERVATIONS BEFORE PULLOUT.......................................- 112 -
5.3.1 Stress variations during overburden pressure application and hole drilling........- 112 -
X
5.3.2 Stress variations during pressure grouting.............................................................- 114 -
5.3.3 Results during saturation.........................................................................................- 117 -
5.4 RESULTS AND OBSERVATIONS DURING PULLOUT.......................................- 119 -
5.4.1 Strain data comparison............................................................................................- 119 -
5.4.2 Typical results during pullout.................................................................................- 120 -
5.5 OBSERVATIONS AFTER PULLOUT........................................................................- 122 -
5.5.1 Degree of saturation in the box...............................................................................- 122 -
5.5.2 Soil nail failure surface after pullout ......................................................................- 124 -
5.5.3 Soil nail diameter after pullout ...............................................................................- 124 -
5.5.4 Location changes of earth pressure cells................................................................- 125 -
5.6 SUMMARY .................................................................................................................- 125 -
Chapter 6: EFFECTS OF BOTH OVERBURDEN PRESSURE
AND GROUTING PRESSURE
6.1 INTRODUCTION...........................................................................................................- 147 -
6.2 SOIL NAIL PULLOUT BEHAVIOUR DURING PULLOUT..................................- 148 -
6.2.1 Average effective normal stress and interface shear stress...................................- 148 -
6.2.2 Soil nail pullout behaviour under different overburden pressures .......................- 150 -
6.2.3 Soil nail pullout behaviour under different grouting pressures ............................- 152 -
6.3 EFFECTS ON SOIL NAIL PULLOUT RESISTANCE .............................................- 154 -
6.3.1 Effect of overburden pressure.................................................................................- 155 -
6.3.2 Effect of grouting pressure......................................................................................- 156 -
6.4 AN EMPIRICAL EQUATION FOR SOIL NAIL PULLOUT RESISTANCE........- 157 -
6.5 SUMMARY AND FINDINGS......................................................................................- 161 -
XI
Chapter 7: A 3D FINITE ELEMENT MODEL
FOR SOIL NAIL PULLOUT TESTS
7.1 INTRODUCTION...........................................................................................................- 179 -
7.2 MESH AND BOUNDARY CONDITIONS.................................................................- 181 -
7.3 SIMULATION OF TEST PROCEDURES ..................................................................- 182 -
7.3.1 Establishment of the stress condition after drilling ...............................................- 183 -
7.3.2 Simulation of pressure grouting (for saturated case).............................................- 184 -
7.3.3 Simulation of saturation (for saturated case) .........................................................- 186 -
7.3.4 Soil nail pullout simulation.....................................................................................- 186 -
7.4 MATERIALS AND INTERFACE MODELS..............................................................- 187 -
7.4.1 A constitutive model for the unsaturated CDG soil ..............................................- 187 -
7.4.2 Constitutive model for the saturated CDG soil .....................................................- 189 -
7.4.3 Constitutive model for the soil nail and the soil-nail interaction..........................- 191 -
7.5 MATERIAL PARAMETERS IN ANALYSIS ............................................................- 193 -
7.5.1 Parameters for unsaturated CDG soil.....................................................................- 193 -
7.5.2 Parameters for saturated CDG soil.........................................................................- 194 -
7.5.3 Parameters for soil nail and soil-nail interface ......................................................- 195 -
7.6 SUMMARY AND FINDINGS......................................................................................- 195 -
Chapter 8: MODEL VERIFICATION AND DISCUSSION
8.1 INTRODUCTION...........................................................................................................- 209 -
8.2 PULLOUT TEST IN UNSATURATED SOIL ............................................................- 209 -
8.2.1 Stress variations.......................................................................................................- 210 -
8.2.2 Pullout behaviour ....................................................................................................- 212 -
8.2.3 Soil stress contour....................................................................................................- 213 -
8.2.4 Effects of dilation angle and overburden pressure ................................................- 214 -
XII
8.3 PULLOUT TEST IN SATURATED SOIL ..................................................................- 215 -
8.3.1 Stress variations.......................................................................................................- 215 -
8.3.2 Pullout behaviour ....................................................................................................- 218 -
8.3.3 Soil stress contour....................................................................................................- 219 -
8.4 SUMMARY AND FINDINGS......................................................................................- 219 -
Chapter 9: SUMMARY, CONCLUSIONS AND SUGGESTIONS
9.1 SUMMARY AND CONCLUSIONS............................................................................- 243 -
9.2 RECOMMENDATIONS AND SUGGESTIONS .......................................................- 247 -
REFERENCES ..................................................................................................................- 249-
XIII
LIST OF TABLES
TTable 2.1 Comparison of different soil nailing design approaches ............................ - 37 -
Table 2.2 Merits and limitations of the methods for determining ultimate pull-out
resistance (after Pun and Shiu 2007)........................................................ - 37 -
Table 3.1 Material parameters adopted in the verification study (Case Study 2) ...... - 67 -
Table 3.2 Material parameters adopted in parametric studies.................................... - 67 -
Table 4.1 Properties of the completely decomposed granite soil............................... - 93 -
Table 4.2 Properties of the Cement Grout in the pullout tests (after Su 2006) .......... - 93 -
Table 5.1 Test programme for the laboratory soil nail pullout tests under four
overburden pressures (OP) and four grouting pressures (GP) in nearly
saturated soil condition .......................................................................... - 127 -
Table 5.2 Summary of measured perimeter and average diameter of the soil nails after
pullout for the pullout tests under different overburden pressure (OP) and
grouting pressure (GP) conditions ......................................................... - 127 -
Table 6.1 Summary of soil nail peak pullout resistance under different overburden
pressures (OP) and grouting pressures (GP) .......................................... - 163 -
Table 6.2 Summary of soil nail pullout resistance at 50 mm pullout displacement under
different overburden pressures (OP) and grouting pressures (GP) ........ - 163 -
Table 6.3 Summary of soil nail pullout resistance at 100 mm pullout displacement under
different overburden pressures (OP) and grouting pressures (GP) ........ - 163 -
XIV
Table 7.1 Mohr-Coulomb model parameters for unsaturated CDG soil (Sr = 75%)- 197 -
Table 7.2 Drucker-Prager/Cap model parameters for saturated CDG soil............... - 197 -
T
XV
T
LIST OF FIGURES
Figure 1.1 Two major slope failures in Hong Kong, 1972 - (a) Sau Mau Ping, Kowloon
(b) Po Shan Road, Mid-levels……………………………………………- 6 -
Figure 2.1 Schematic diagram of a soil-nailed cut slope in Hong Kong practice (after
GEO 2008) ............................................................................................... - 38 -
Figure 2.2 The first soil-nailed wall in the world, built at Versailles, France in 1972/73
(after Clouterre 1991)............................................................................... - 39 -
Figure 2.3 Post-failure observations of the first large-scale experimental soil nailed wall
(after Clouterre 1991)............................................................................... - 39 -
Figure 2.4 Two-zone model of a soil nailed system (after GEO 2008) ..................... - 40 -
Figure 2.5 Potential external failure modes of a soil nailed system (after GEO 2008)
................................................................................................................ - 40 -
Figure 2.6 Potential internal failure modes of a soil nailed system (after GEO 2008)
................................................................................................................ - 41 -
Figure 2.7 Schematic distribution of tensile forces along soil nails (after GEO 2008)
.................................................................................................................. - 41 -
Figure 2.8 Effect of the inclination of the soil nails on the maximum tensile force for
inclination of the soil nails at (a) 10°and (b) 20°downward to horizontal
(Clouterre 1991) ....................................................................................... - 42 -
Figure 2.9 Effect of the bending stiffness on the locus of maximum tensile force in the
soil nails (after Juran et al. 1985) ............................................................. - 43 -
XVI
Figure 2.10 Effect of hole drilling process and overburden pressure on the soil nail
pullout resistance in a unsaturated CDG soil (after Su et al. 2008) ......... - 43 -
Figure 2.11 Increase of normal stress due to restrained dilatancy around an inclusion
which is in tension. (after Clouterre 1991) .............................................. - 44 -
Figure 2.12 Field monitoring of soil nailed walls in the “Bodenvernagelung” project
(after Gässler 1992).................................................................................. - 44 -
Figure 2.13 Strain gauge locations in the critical section of a soil nailed slope in Hong
Kong (after Shiu et al. 1997).................................................................... - 45 -
Figure 2.14 Monitored lateral displacements in the critical section of a soil nailed slope
in Hong Kong (after Shiu et al. 1997)...................................................... - 45 -
Figure 2.15 Axial force development in the soil nails at different construction stages in a
soil nailed slope in Hong Kong (after Shiu et al. 1997)........................... - 46 -
Figure 2.16 Axial force distributions along the soil nails at the end of construction in a
soil nailed slope in Hong Kong (after Shiu et al. 1997)........................... - 46 -
Figure 2.17 Pullout box used by Tei (After Tei 1993) ............................................... - 47 -
Figure 2.18 – Pullout test apparatus in Junaideen et al. (2004) ................................. - 47 -
Figure 2.19 – Pullout box used by Chu (After Chu 2003)......................................... - 48 -
Figure 3.1 Failure principle of a soil-nailed slope (a) a slope reinforced with soil nails
and (b) local mechanism of one soil nail in a slope ................................. - 68 -
Figure 3.2 Three normal stresses around the soil nail in the passive zone ................ - 68 -
Figure 3.3 Development of the mean normal pressure due to bending of the soil nail ......
.................................................................................................................. - 68 -
Figure 3.4 A soil nail element with all forces ............................................................ - 69 -
XVII
Figure 3.5 Bending moment distribution at collapse of soil nailed wall (after Gässler
1987) ........................................................................................................ - 69 -
Figure 3.6 Bending moment along the soil nail (Case Study 1) ................................ - 70 -
Figure 3.7 Shear stress along the soil nail (Case Study 1) ......................................... - 70 -
Figure 3.8 Three components (due to post-installation stress, soil dilation, and soil nail
bending) of the pullout force and their variations with pullout displacement
(Case Study 1) .......................................................................................... - 70 -
Figure 3.9 Contributions of three normal stresses (due to post-installation stress, soil
dilation, and soil nail bending) to the pullout resistance (Case Study 1) . - 71 -
Figure 3.10 Comparison between calculated results with LDST data in Case Study 2 (a)
bending moment (b) shear force .............................................................. - 71 -
Figure 3.11 Three components (due to post-installation stress, soil dilation, and soil nail
bending) of the pullout force and their variations with pullout displacement
(Case Study 2) .......................................................................................... - 72 -
Figure 3.12 Contributions of three normal stresses (due to post-installation stress, soil
dilation, and soil nail bending) to the pullout resistance (Case Study 2) . - 72 -
Figure 3.13 Influence of soil modulus of subgrade reaction on - (a) bending moment
along the soil nail; (b) shear force along the soil nail; (c) shear stress along
the soil nail; and (d) pullout forces vs. pullout displacement .................. - 74 -
Figure 3.14 Influence of the soil nail stiffness on - (a) bending moment along the soil
nail; (b) shear force along the soil nail; (c) shear stress along the soil nail;
and (d) pullout forces vs. pullout displacement ....................................... - 75 -
Figure 3.15 The variation of soil nail pullout resistance with the soil nail stiffness.. - 76 -
Figure 4.1 Dimensions of a new pullout box and test set up with full instrumentation
XVIII
and pressure grouting devices – (a) longitudinal section along soil nail, (b)
cross-section of the soil nail, (c) a photo of the box and a pullout test in
progress, and (d) pressure gauge at the end of the box to measure the
grouting pressure during grouting............................................................ - 95 -
Figure 4.2 Transducers in the pullout tests (a) earth pressure cell, (b) pore water pressure
transducer, (c) tensiometer, (d) automatic volumemeter, (e) LVDTs, (f) strain
gauge, and (f) load cell connected to a hydraulic jack............................. - 97 -
Figure 4.3 Setup for the calibration of earth pressure cells and pore water pressure
transducers ............................................................................................... - 97 -
Figure 4.4 Setup for the calibration of LVDTs........................................................... - 97 -
Figure 4.5 Calibration results of the earth pressure cells........................................... - 98 -
Figure 4.6 Calibration results of the pore water pressure transducers and tensiometers ....
.................................................................................................................. - 99 -
Figure 4.7 Calibration results of the load cell............................................................ - 99 -
Figure 4.8 Calibration results of the LVDTs............................................................ - 100 -
Figure 4.9 Calibration results of the volumemeter .................................................. - 100 -
Figure 4.10 Particle size distribution of the CDG soil............................................. - 101 -
Figure 4.11 Relationship between dry density and moisture content ...................... - 101 -
Figure 4.12 Triaxial tests (CD) results of saturated CDG soil (a) deviatoric stress vs.
axial strain, (b) volumetric strain vs. axial strain, and (c) effective stress
paths: q vs. p’ ......................................................................................... - 102 -
Figure 4.13 Shear strength of saturated CDG soil (a) at 15% axial strain and (b) at 20%
axial strain .............................................................................................. - 103 -
Figure 4.14 Test preparation - (a) covering the inside surface of the box with a flexible
plastic film with the lubricating oil in between, (b) placing the drilling
machine, (c) connection of the drilling rod, and (d) adjusting the position and
XIX
direction of the drillhole......................................................................... - 104 -
Figure 4.15 Embedded locations of the six earth pressure cells (side view, unit: mm) ....
................................................................................................................ - 105 -
Figure 4.16 With the use of the wooden plate, the soil surface settled uniformly after a
test (a) whole view of the soil surface and (b) view at a corner............. - 105 -
Figure 4.17 The procedure of hole drilling - (a) drilling machine, (b) during the drilling,
(c) the drilled hole throughout the box, and (d) the drilled hole in the
additional cylinder.................................................................................. - 106 -
Figure 4.18 Preparation of the steel bar (a) attaching the strain gauge and fiber optical
sensors to the bar surface (b) protection of the strain gauge (c) preparing the
grouting pipes and the front cover for pressure grouting (d) sealing the
outlets at the front cover, and (e) a prepared the steel bar before grouting.......
................................................................................................................ - 107 -
Figure 4.19 Locations of strain gauges and fiber optical sensors along the soil nail- 107 -
Figure 4.20 Procedure of grouting (a) placing the rebar in the centre the hole, (b) fixing
the front cover and the rebar, (c) fixing the extension chamber and the
pressure gauge at the back of the box, (d) connecting the barrel for pressure
grouting, (e) mixing the cement with water, (f) applying pressure to the
cement slurry, and (g) connecting the pressure gauge to the outgoing
grouting pipe when the hole was filled with cement slurry ................... - 108 -
Figure 4.21 Locations of four pore water pressure transducers (PPT) in the soil (top
view, unit: mm) ...................................................................................... - 109 -
Figure 4.22 Procedure of saturation - apply back water pressure through (a) the back
extension chamber and (b) waterproof triaxial cell at front................... - 109 -
XX
Figure 5.1 Relationships between earth pressures and time during overburden pressure
(OP) application: (a) OP= 120 kPa, (b) OP= 240 kPa, and (c) OP= 350 kPa...
................................................................................................................ - 129 -
Figure 5.2 Relationships between earth pressures and time during drilling under
different overburden pressure (OP): (a) OP= 120 kPa, (b) OP= 240 kPa, and
(c) OP= 350 kPa..................................................................................... - 130 -
Figure 5.3 Relationships between earth pressures and time during pressure grouting for
the tests under (a) OP = 350 kPa, GP = 300 kPa and (b) OP = 350 kPa, GP =
250 kPa................................................................................................... - 131 -
Figure 5.4 Relationships between earth pressures and time during pressure grouting for
the tests under GP = 130 kPa (a) OP = 350 kPa and (b) OP = 240 kPa . - 132 -
Figure 5.5 Relationships between earth pressures and time during pressure grouting for
the tests under GP = 80 kPa (a) OP = 350 kPa, (b) OP = 120 kPa, and (c) OP
= 80 kPa ................................................................................................. - 134 -
Figure 5.6 Variations of effective stresses and pore water pressure with time during the
soil saturation for the test under OP = 350 kPa and GP = 300kPa......... - 134 -
Figure 5.7 Variations of effective vertical stresses and pore water pressure with time
during the soil saturation for the tests under OP = 350 kPa and (a) GP = 250
kPa, (b) GP = 130kPa, and (c) GP = 80 kPa .......................................... - 136 -
Figure 5.8 Comparisons of strain data measured by strain gauges and FBG sensors
during pullout for the test under OP = 240 kPa and GP = 130 kPa (a)
comparison of SG 2 and FBG 2, (b) comparison of SG 3 and FBG 3, (c)
comparison of SG 4 and FBG 4 ............................................................. - 137 -
Figure 5.9 Monitored data during the pullout testing under OP = 350kPa and GP =
250kPa (a) pullout force vs. time, (b) strains at four locations in the soil nail
vs. time, (c) effective earth pressures at six locations vs. time, (d) pullout
XXI
force vs. pullout displacement................................................................ - 139 -
Figure 5.10 Monitored data from the pullout testing under OP = 240 kPa and GP = 130
kPa (a) pullout force vs. time, (b) effective earth pressures at six locations in
the soil vs. time, (c) strains in the soil nail vs. time, (d) pullout force vs.
pullout displacement .............................................................................. - 141 -
Figure 5.11 Water content and degree of saturation in the box measured after pullout for
the tests under (a) OP = 130 kPa, GP = 80 kPa and (b) OP = 200 kPa, GP =
80 kPa..................................................................................................... - 142 -
Figure 5.12 Soil nail surface after pullout for the tests under (a) OP = 350 kPa, GP = 300
kPa, (b) OP = 240 kPa, GP = 250 kPa, (c) OP = 350 kPa, GP = 130 kPa, and
(d) OP = 120 kPa, GP = 80 kPa.............................................................. - 143 -
Figure 5.13 Soil nail surface near the nail head after pullout for the tests under (a) OP =
350 kPa, GP = 300 kPa, (b) OP = 240 kPa, GP = 250 kPa, and (c) OP = 80
kPa, GP = 80 kPa ................................................................................... - 144 -
Figure 5.14 Soil nail surface in the middle nail after pullout for the tests under (a) OP =
350 kPa, GP = 300 kPa, (b) OP = 120 kPa, GP = 80 kPa, and (c) OP = 80
kPa, GP = 80 kPa ................................................................................... - 145 -
Figure 6.1 Variations of average interface shear stress and average effective normal
stress around the soil nail during the pullout testing under OP = 350 kPa and
GP = 250 kPa (a) stress vs. time (b) stress vs. pullout displacement ..... - 164 -
Figure 6.2 Variations of average interface shear stress and average effective normal
stress around the soil nail during the pullout testing under OP = 240 kPa and
GP = 130 kPa (a) stress vs. time (b) stress vs. pullout displacement ..... - 165 -
Figure 6.3 Development of average interface shear stress with pullout displacement at
XXII
nail head for the tests under different overburden pressures (a) GP = 0 kPa
after Su (2006), (b) GP = 80 kPa, (c) GP = 130 kPa, and (d) GP = 250 kPa ....
................................................................................................................ - 167 -
Figure 6.4 Development of average interface shear stress with average effective normal
stress for the tests under different overburden pressures (a) GP = 0 kPa after
Su (2006), (b) GP = 80 kPa, (c) GP = 130 kPa, and (d) GP = 250 kPa.. - 169 -
Figure 6.5 Development of average interface shear stress with pullout displacement at
nail head for the tests under different grouting pressures and (a) OP = 80 kPa,
(b) OP = 120 kPa, (c) OP = 240 kPa or 200 kPa, and (d) OP = 350 kPa or
300 kPa................................................................................................... - 171 -
Figure 6.6 Development of average interface shear stress with average effective normal
stress for the tests under different grouting pressures and (a) OP = 80 kPa, (b)
OP = 120 kPa, (c) OP = 240 kPa or 200 kPa, and (d) OP = 350 kPa or 300
kPa.......................................................................................................... - 173 -
Figure 6.7 Effect of overburden pressure on soil nail pullout resistance at different
grouting pressure levels (a) peak pullout resistance, (b) pullout resistance at
50mm pullout displacement, and (c) pullout resistance at 100mm pullout
displacement .......................................................................................... - 175 -
Figure 6.8 Effect of grouting pressure on soil nail pullout resistance at different
overburden pressure levels (a) peak pullout resistance, (b) pullout resistance
at 50mm pullout displacement, and (c) pullout resistance at 100mm pullout
displacement (results of GP=0 are after Su 2006) ................................. - 176 -
Figure 6.9 Summary of all interface shear stresses under different grouting pressures: (a)
peak pullout resistance versus initial overburden pressureand (b) pullout
resistance at pullout displacement of 50mm versus overburden pressure ........
................................................................................................................ - 177 -
XXIII
Figure 6.10 Effect of grouting pressure on the two parameters: (a) the interception
and (b) the slope ................................................................................. - 178 -
Figure 7.1 A 3D finite element model for soil nail pullout tests (a) three-dimensional
view (b) top view, (c) side view (longitudinal section), and (d) front view......
................................................................................................................ - 199 -
Figure 7.2 Modelling of soil nail and interface soil (a) soil nail and surface and (b) mesh
of the surface and interface soil surrounding the soil nail ..................... - 200 -
Figure 7.3 Master and slave surfaces in a contact pair (after ABAQUS 2005) ....... - 200 -
Figure 7.4 Interference fit with contact surfaces (after ABAQUS 2005) ................ - 201 -
Figure 7.5 Mohr-Coulomb failure criterion (after ABAQUS 2005) ........................ - 201 -
Figure 7.6 Mohr-Coulomb yield surface in meridional and deviatoric planes (after
ABAQUS 2005) ..................................................................................... - 202 -
Figure 7.7 Mohr-Coulomb flow potential (a) in the meridional plane and (b) in the
deviatoric plane (after ABAQUS 2005)................................................. - 202 -
Figure 7.8 Yield surfaces of the Modified Drucker-Prager/Cap model in the p -t plane
(after ABAQUS 2005) ........................................................................... - 203 -
Figure 7.9 Projection of the yield/flow surfaces of the Modified Drucker-Prager/Cap
model on the deviatoric plane (after ABAQUS 2005) ........................... - 203 -
Figure 7.10 Typical cap hardening behaviour in the Modified Drucker-Prager/Cap
model (after ABAQUS 2005) ................................................................ - 203 -
Figure 7.11 Flow potential of the Modified Drucker-Prager/Cap model in the p -t plane
(after ABAQUS 2005) ........................................................................... - 204 -
Figure 7.12 Coulomb friction model in ABAQUS for interface modelling (a) slip
regions for the basic Coulomb friction model and (b) sticking and slipping
XXIV
friction behaviour (after ABAQUS 2005).............................................. - 204 -
Figure 7.13 Axisymmetric finite element model (one element) for triaxial tests .... - 205 -
Figure 7.14 Double cell triaxial (CD) tests on unsaturated CDG soil (data from Su 2006)
and fitting curves of Mohr-Coulomb model (a) deviatoric stress vs. axial
strain and (b) volume strain vs. axial strain ........................................... - 206 -
Figure 7.15 Fitting curves of hardening rule and flow rule in Mohr-Coulomb model
under different confining pressures - (a) apparent cohesion vs. plastic strain,
(b) friction angle vs. plastic strain, and (c) dilation angle vs. plastic strain......
................................................................................................................ - 207 -
Figure 7.16 Triaxial (CD) tests on saturated CDG soil and fitting curves of
Drucker-Prager/Cap model (a) deviatoric stress vs. axial strain and (b)
volume strain vs. axial strain.................................................................. - 208 -
Figure 7.17 Hardening curves of Drucker-Prager/Cap model under different confining
pressures................................................................................................. - 209 -
Figure 8.1 Path A selected in the FE model for demonstration of vertical stress
distribution in the soil ............................................................................ - 224 -
Figure 8.2 Calculated results of vertical stress distributions in the soil along Path A and
measured earth pressures from laboratory tests during the pullout for the test
under (a) OP = 80 kPa, (b) OP = 120 kPa, (c) OP = 200 kPa, and (d) OP =
300 kPa................................................................................................... - 226 -
Figure 8.3 Comparison of numerical and experimental results of average interface shear
stress development with pullout displacement for the test under (a) OP = 80
kPa, (b) OP = 120 kPa, (c) OP = 200 kPa, and (d) OP = 300 kPa ......... - 228 -
Figure 8.4 Vertical stress contour for the pullout test under OP = 120 kPa - (a) before
XXV
pullout, (b) at 5mm pullout displacement, and (c) at 100mm pullout
displacement........................................................................................... - 229 -
Figure 8.5 Vertical stress contour for the pullout test under OP = 120 kPa - (a) before
pullout, (b) at 5mm pullout displacement, and (c) at 100mm pullout
displacement........................................................................................... - 231 -
Figure 8.6 Effect of interface soil dilation angle on the peak average pullout shear stress
under different overburden pressures..................................................... - 231 -
Figure 8.7 Relationship of the peak average pullout shear stress and overburden
pressure under different interface soil dilation angles from numerical
modelling and the laboratory pullout test data from Su (2006) ........................
................................................................................................................ - 232 -
Figure 8.8 Simulated and measured vertical stress in the soil at different distances to the
soil nail surface and the stress variations at different simulation/test steps for
the pullout tests under OP = 350 kPa and (a) GP = 80 kPa, (b) GP = 130 kPa,
(c) GP = 250 kPa and (d) GP = 300 kPa ................................................ - 234 -
Figure 8.9 Simulated vertical stress distributions in the soil along Path A and measured
earth pressures in laboratory pullout tests at different pullout displacements
for the test under OP = 240 kPa and (a) GP = 80 kPa, (b) GP = 130 kPa, and
(c) GP = 250 kPa .................................................................................... - 237 -
Figure 8.10 Simulated vertical stress distributions in the soil along Path A and measured
earth pressures in laboratory pullout tests at different pullout displacements
for the test under OP = 350 kPa and (a) GP = 80 kPa, (b) GP = 130 kPa, (c)
GP = 250 kPa, and (d) GP = 300 kPa..................................................... - 238 -
Figure 8.11 Adopted hardening curves of the interface soil under different grouting
pressure conditions................................................................................. - 238 -
Figure 8.12 Numerical and experimental results of average interface shear stress
XXVI
development with pullout displacement for the tests under OP = 240 kPa and
different grouting pressures ................................................................... - 238 -
Figure 8.13 Numerical and experimental results of average interface shear stress
development with pullout displacement for the tests under OP = 350 kPa and
different grouting pressures ................................................................... - 239 -
Figure 8.14 Vertical stress contour for the pullout test under OP = 350 kPa and GP
=250kPa - (a) before pullout, (b) at 5mm pullout displacement, and (c) at
100mm pullout displacement ................................................................. - 241 -
Experimental and Theoretical Study on Pullout Resistance of Grouted Soil Nails Wan-Huan Zhou
Chapter 1:
INTRODUCTION
1.1 BACKGROUND
Hong Kong is one of the most densely populated cities in the world. The total area is
approximately 1100 km2, about 70% of which is hilly terrain, accommodating a
population of about 7 million. Hong Kong has a substantial portion of urban
developments located on or near steep hillsides, resulting in the creation of 57,000
sizable man-made slopes. Coupled with an annual rainfall of 2300mm on average, the
slope safety problem is serious in Hong Kong. Before 1977, slopes were traditionally
formed and designed by cutting into the deeply weathered residual soils at the angle of
60°or 30m (Powell and Watkins 1990). These slopes are liable to failure in periods
of intense tropical rainfall, resulting in severe loss of life and property damage. In
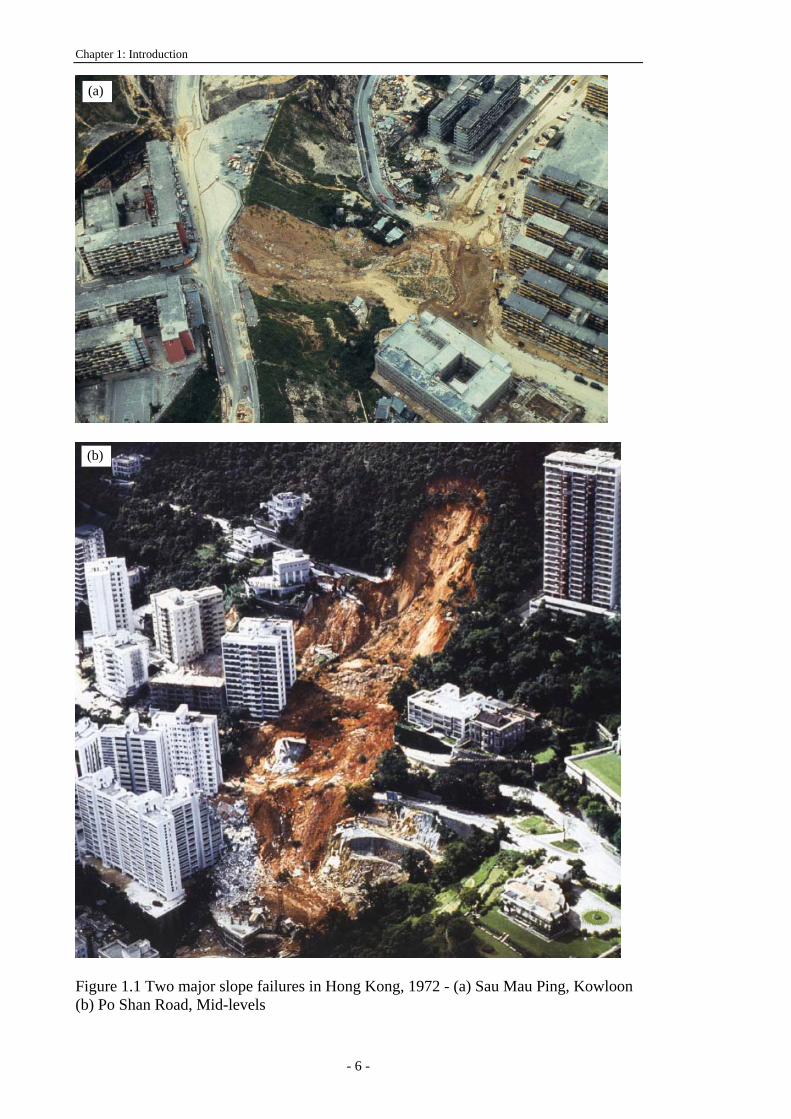
1972, two major landslides occurred in Sau Mau Ping, Kowloon, and Po Shan Road,
Mid-levels, respectively, as shown in Figure 1.1, in which a total of 138 people died.
Since 1976, the Hong Kong Government has spent about HK$11.5 billion (as of 1 June
2008) on upgrading works and stability studies in the pre-1977 substandard slopes
under a long-term Landslip Preventive Measures (LPM) programme. In 2000, the
10-year Extended LPM Project commenced to upgrade 250 substandard government
man-made slopes and undertake safety screening studies for 300 private man-made
slopes each year up to 2010.
The soil nailing technique was introduced to Hong Kong in the 1980s. Due to the
- 1 -
Chapter 1: Introduction
advantages of simplicity, speed construction, and economical efficiency, soil nailing has
been increasingly used and become the most common slope stabilization method in
Hong Kong. More than 200 slopes and retaining walls are upgraded using grouted soil
nails each year (GEO 2008). Although the design guidelines are available in many
countries, some design issues remain ambiguous among some engineers and researchers.
Many of the issues under debate are related to the determination of soil nail pullout
resistance, which is a key parameter in the soil nail design. Better design can be
achieved, if the pullout resistance is more accurately predicted. Many researchers and
engineers have found this parameter is influenced by many factors. Such factors
include installation method, overburden pressure, grouting pressure, roughness of nail
surface, water content of the soil, soil dilation, and soil nail bending. The research
project named ‘Experimental and Theoretical Study on Pullout Resistance of Grouted
Soil Nails’ has commenced to investigate the mechanism and influencing factors of soil
nail pullout resistance.
1.2 OBJECTIVES OF THE RESEARCH
The objectives of this research project are to (a) develop an analytical model to study
the interaction between soil nail and the surrounding soil, (b) carry out laboratory
pullout tests to study the soil nail pullout resistance, and (c) establish 3D finite element
model to simulate the soil nail pullout tests under different conditions. The following
specific issues are to be studied:
(a) To develop a mathematical model to study the soil-nail interaction when
considering the factors of constrained soil dilation, soil nail bending, overburden
pressure and soil subgrade reaction stiffness.
- 2 -
Experimental and Theoretical Study on Pullout Resistance of Grouted Soil Nails Wan-Huan Zhou
(b) To study the pullout resistance of grouted soil nails in a completely decomposed
granite (CDG) soil at the saturated condition under different combinations of
overburden pressure and grouting pressure by laboratory pullout tests.
(c) To investigate the stress changes surrounding the drillhole (or soil nail to be
constructed) at different construction stages during laboratory pullout tests.
(d) To simulate the soil nail pullout behaviour in unsaturated CDG soil without
pressure grouting by finite element modelling.
(e) To simulate the soil nail pullout behaviour in saturated CDG soil with pressure
grouting by finite element modelling.
(f) To study the effect of soil dilation and overburden pressure on the soil nail
pullout resistance in an unsaturated CDG soil by finite element modelling.
1.3 ORGANIZATION OF THE THESIS
This thesis consists of nine chapters as follows.
Chapter 1: Introduction. This chapter presents briefly the background, the objectives
and specific issues to be investigated, and the organization of the thesis.
Chapter 2: Literature review. The review finds out the development and application
history of soil nailing and research findings on the soil nail pullout resistance. The
- 3 -
Chapter 1: Introduction
current design methods of grouted soil nails are presented and discussed. The
influencing factors of soil nail pullout resistance are summarized. Research work on the
behaviour and mechanisms of soil nails by means of field monitoring, laboratory testing
and numerical modeling are reviewed.
Chapter 3: A simple mathematical model for the determination of soil nail pullout
resistance. A simple mathematical model for the interaction analysis of a soil nail and
the surrounding soil has been developed. The model takes into account a few key
parameters, which are soil dilation, soil nail bending, vertical pressure, and non-linear
subgrade reaction stiffness of the soil. Reported test data in the literature were used for
model verification. The relative contribution of the soil nail bending on the soil nail
pullout resistance in a large-scale soil nailed wall and in direct shear tests are discussed.
Chapter 4: Test setup, materials and procedures. Laboratory tests have been carried out
to study the influences of overburden pressure and grouting pressure on the soil nail
pullout resistance in a saturated CDG soil. The test setup, materials properties, and test
procedures of the laboratory pullout tests are presented in this chapter.
Chapter 5: Laboratory soil nail pullout experiments and results. The test programme is
introduced and the data obtained throughout the tests are presented in this chapter. The
stresses and pore water pressures developed in the soil, the pullout force and
displacement of the soil nail, and the strains developed along the soil nail are plotted for
each phase of the experiment.
Chapter 6: Effects of both overburden pressure and grouting pressure. The pullout test
data are further analyzed, compared and interpreted in this chapter. The soil nail
- 4 -
Experimental and Theoretical Study on Pullout Resistance of Grouted Soil Nails Wan-Huan Zhou
pullout behaviour is assessed by comparing the soil nail performance under different
overburden pressures and grouting pressures, respectively. The effects of both
overburden pressure and grouting pressure on the soil nail pullout resistance are
evaluated and discussed. A new empirical linear equation for determination of soil nail
pullout resistance is proposed.
Chapter 7: A 3D finite element model for simulating soil nail pullout tests. A
three-dimensional (3D) finite element (FE) model has been established for simulation of
the soil nail pullout tests in this chapter. The model simulates all the procedures of the
pullout tests for the conditions of both unsaturated soil, without pressure grouting and
saturated, with pressure grouting. The factors of soil dilation, overburden pressure and
grouting pressure are considered in the FE model. The model mesh, simulation
procedures, material constitutive models and parameters are presented and discussed.
Chapter 8: Model verification and discussion. The verification of the 3D finite element
model with the laboratory pullout test data is presented in this chapter. The effects of
soil dilation, overburden pressure, and grouting pressure are considered in simulation.
The stress variations in the soil and the soil nail pullout behaviour at different test steps
and conditions are compared with the experimental data and discussed.
Chapter 9: Summary, conclusions and suggestions. A summary and main conclusions
made from this research project are presented. Suggestions are given for further
research in the topic area.
- 5 -
Chapter 1: Introduction
(a)
- 6 -
(b)
Figure 1.1 Two major slope failures in Hong Kong, 1972 - (a) Sau Mau Ping, Kowloon (b) Po Shan Road, Mid-levels
Experimental and Theoretical Study on Pullout Resistance of Grouted Soil Nails Wan-Huan Zhou
Chapter 2:
LITERATURE REVIEW
2.1 INTRODUCTION
Soil nailing is a technique used to reinforce and strengthen existing ground conditions.
This is accomplished by installing closely spaced, passive, structural inclusions, known
as nails, into the soils to increase their overall shear strength. During the 1970s, the
soil nailing technique was developed in France, Germany and the United States.
Thereafter, the technique has been increasingly used in soil reinforcement projects all
over the world. In Hong Kong, soil nails are extensively used for slope improvement
works. Tens of thousands of soil nails have been installed for stabilizing existing
substandard existing soil slopes or new man-made slopes each year.
The aim of this chapter is to review of the application and development of the soil
nailing technique, and research findings regarding soil nail pullout resistance. The soil
nailing technique is first introduced. This includes application and development history,
behaviour and mechanisms, and design methods. The influencing factors of the soil nail
pullout resistance are then discussed. Finally, previous research on the behaviour and
mechanisms of soil nail systems, by means of field monitoring, laboratory experiments
and numerical modelling, are reviewed.
2.1.1 The soil nailing technique
Soil nailing is a construction technique for reinforcing existing ground conditions. Soil
- 7 -
Chapter 2: Literature Review
is a poor structural material because it is weak in tension. In contrast, steel is strong in
tension. The fundamental concept of soil nailing is the reinforcement of soil by the
installation of closely spaced, passive, grouted steel bars, called ‘nails’, into a slope, to
increase the overall shear strength of the in-situ soil and hence, restrain displacement.
The term ‘passive’ is applied. “Passive” means that the nails are not pre-tensioned
when installed and are forced to develop tension as the ground deforms laterally. Soil
nails are used to stabilize either existing slopes or future slopes/cuts created by
excavation activities at a site.
Soil nails are divided into several types, based on the installation methods used. They
include such as driven nails, grouted nails, and jet-grouted nails. A brief description of
the three types of soil nails is given below.
Driven nails are composed of ordinary steel bars or angle bars, driven into the ground at
the designed inclination by the ballistic method using a compressed air launcher, by the
percussive method using hammering equipment, or by the vibratory method using a
vibrator. The nail diameter is normally 15-46 mm. The steel properties should be
perfectly ductile rather than brittle (Myles, 1994), to avoid a brittle failure. This
installation technique is rapid (4 to 6 per hour) and causes little ground disruption.
However, it is limited by the length of the bars (maximum length about 20m) and by the
heterogeneity of the ground (e.g., presence of boulders).
Grouted nails typically consist of a steel bar with a diameter 15 - 46mm, with 30-80mm
thick grout cover. The steel bar is placed in pre-drilled hole (100-150mm in diameter)
with a vertical and horizontal spacing, typically varying from 1 to 3m, depending on the
type of in-situ soil. The nails are usually cement-grouted under gravity or low pressure.
- 8 -
Experimental and Theoretical Study on Pullout Resistance of Grouted Soil Nails Wan-Huan Zhou
Various drilling techniques, e.g. rotary, rotary percussive and down-the-hole hammer,
are available to suit different ground conditions. The action of grouting leads to greatly
enhanced pullout resistance because of the increased surface area and roughness. The
presence of grout also provides the steel bar with increased corrosion protection.
Jet-grouted nails are composite inclusions made of a grouted soil with a central steel
rod, which can be as thick as 30 to 40cm. The main difference between the grouted nails
and jet-grouted nails is the grouting pressure and the installation technique. Instead of
pre-drilling the hole and then grouting, the jet-grouting technique uses percussion
driving with simultaneous high pressure grouting (Louis 1986). The grouting pressure
can be greater than 20MPa, which will cause hydraulic fracturing and re-compaction of
the surrounding soil and hence increase the pullout resistance of the soil nail.
The focus of this study is on the grouted soil nails, as they are most commonly used
both in Hong Kong and overseas. Figure 2.1 shows the cross-section of a typical
soil-nailed cut slope in Hong Kong. According to GEOGUIDE 7 (GEO 2008), a
soil-nailed system with grouted soil nails comprises 6 basic elements: (a) Soil-nail
reinforcement (typically a steel bar); (b) Reinforcement connector (Coupler); (c)
Cement grout sleeve (typically cement grout, made of Portland cement and water at the
ratio of 0.42); (4) Corrosion protection measures; (5) Soil-nail head; (6) Slope facing.
2.1.2 Development of soil nailing
Soil nailing has now become an internationally recognized technique of ground
improvement. It partly originated from techniques developed for rock-bolting and
multi-anchorage system, and partly from reinforced soil technique (CIRIA 2005). In the
following section, the development of the soil nailing practice is reviewed.
- 9 -
Chapter 2: Literature Review
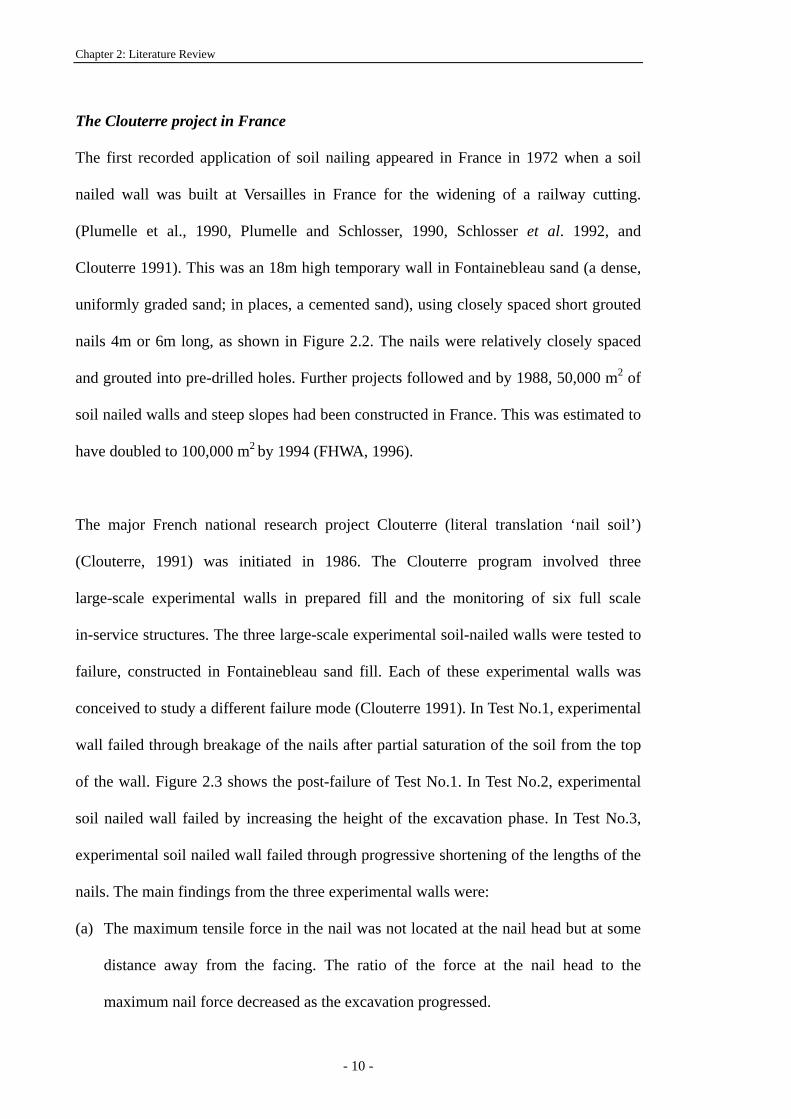
The Clouterre project in France
The first recorded application of soil nailing appeared in France in 1972 when a soil
nailed wall was built at Versailles in France for the widening of a railway cutting.
(Plumelle et al., 1990, Plumelle and Schlosser, 1990, Schlosser et al. 1992, and
Clouterre 1991). This was an 18m high temporary wall in Fontainebleau sand (a dense,
uniformly graded sand; in places, a cemented sand), using closely spaced short grouted
nails 4m or 6m long, as shown in Figure 2.2. The nails were relatively closely spaced
and grouted into pre-drilled holes. Further projects followed and by 1988, 50,000 m2 of
soil nailed walls and steep slopes had been constructed in France. This was estimated to
have doubled to 100,000 m2 by 1994 (FHWA, 1996).
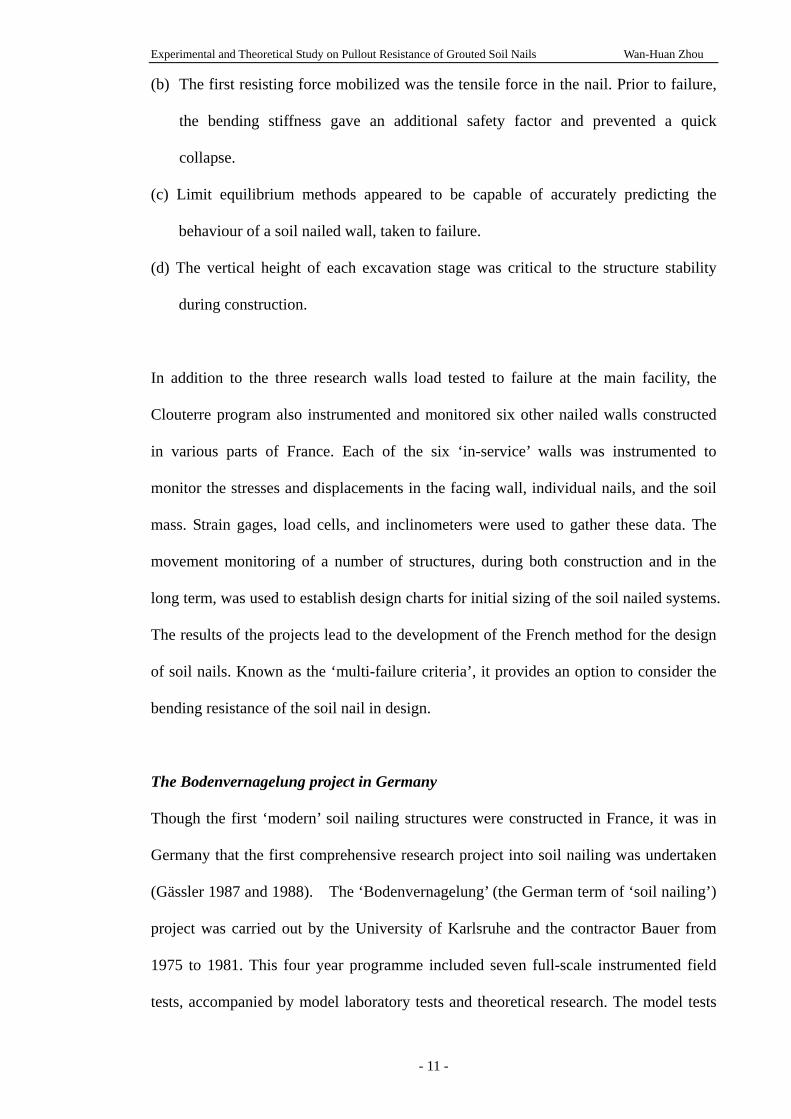
The major French national research project Clouterre (literal translation ‘nail soil’)
(Clouterre, 1991) was initiated in 1986. The Clouterre program involved three
large-scale experimental walls in prepared fill and the monitoring of six full scale
in-service structures. The three large-scale experimental soil-nailed walls were tested to
failure, constructed in Fontainebleau sand fill. Each of these experimental walls was
conceived to study a different failure mode (Clouterre 1991). In Test No.1, experimental
wall failed through breakage of the nails after partial saturation of the soil from the top
of the wall. Figure 2.3 shows the post-failure of Test No.1. In Test No.2, experimental
soil nailed wall failed by increasing the height of the excavation phase. In Test No.3,
experimental soil nailed wall failed through progressive shortening of the lengths of the
nails. The main findings from the three experimental walls were:
(a) The maximum tensile force in the nail was not located at the nail head but at some
distance away from the facing. The ratio of the force at the nail head to the
maximum nail force decreased as the excavation progressed.
- 10 -
Experimental and Theoretical Study on Pullout Resistance of Grouted Soil Nails Wan-Huan Zhou
(b) The first resisting force mobilized was the tensile force in the nail. Prior to failure,
the bending stiffness gave an additional safety factor and prevented a quick
collapse.
(c) Limit equilibrium methods appeared to be capable of accurately predicting the
behaviour of a soil nailed wall, taken to failure.
(d) The vertical height of each excavation stage was critical to the structure stability
during construction.
In addition to the three research walls load tested to failure at the main facility, the
Clouterre program also instrumented and monitored six other nailed walls constructed
in various parts of France. Each of the six ‘in-service’ walls was instrumented to
monitor the stresses and displacements in the facing wall, individual nails, and the soil
mass. Strain gages, load cells, and inclinometers were used to gather these data. The
movement monitoring of a number of structures, during both construction and in the
long term, was used to establish design charts for initial sizing of the soil nailed systems.
The results of the projects lead to the development of the French method for the design
of soil nails. Known as the ‘multi-failure criteria’, it provides an option to consider the
bending resistance of the soil nail in design.
The Bodenvernagelung project in Germany
Though the first ‘modern’ soil nailing structures were constructed in France, it was in
Germany that the first comprehensive research project into soil nailing was undertaken
(Gässler 1987 and 1988). The ‘Bodenvernagelung’ (the German term of ‘soil nailing’)
project was carried out by the University of Karlsruhe and the contractor Bauer from
1975 to 1981. This four year programme included seven full-scale instrumented field
tests, accompanied by model laboratory tests and theoretical research. The model tests
- 11 -
Chapter 2: Literature Review
were conducted in a large box to observe failure mechanisms under a variety of loading
conditions. Approximately 100 pullout tests were also performed on nails under various
overburden pressures. The seven large scale test walls were of varying heights and soil
types. The most important conclusions from the Bodenvernagelung program were:
(a) The nailed soil structure behaves like a gravity wall.
(b) The required nail length for a vertical wall and a horizontal ground surface lies in
the range of 0.5 to 0.8 times the height of the wall.
(c) The spacing of the nails should be less than 1.5 m.
(d) The wall face pressure may be assumed uniform with a magnitude on the order of
0.4 to 0.7 times the active Coulomb earth pressure.
The observations and results from Bodenvernagelung project lead to a limit equilibrium
method for the design of soil nailed walls using a bilinear failure surface. This is known
as the ‘German’ method. It considers only the contribution of axial resistance of the
nails to the stability of the structure.
The FHWA projects in North America
Research in the USA initially developed independent of that in Europe, under a
technique described as the lateral earth support system. This research was conducted
primarily at the University of Davis by Bang et al. (1980). The project incorporated
centrifuge model studies, a full scale instrumented construction, and field measurements.
In addition, finite element studies were conducted to simulate the centrifuge models.
The Davis method of design was formulated from this research, (Bang et al. 1980),
using a limit equilibrium method, where by the failure plane is described by a parabola.
The method of analysis considered only the axial contribution of the nails to maintain
- 12 -
Experimental and Theoretical Study on Pullout Resistance of Grouted Soil Nails Wan-Huan Zhou
the stability of the structure.
Following this research at the University of Davis, a number of projects included
instrumentation of the soil nails and monitoring of movements (Thompson and Miller
1990). Juran et al. (1990) proposed a limit equilibrium method, using the kinematically
admissible log spiral, incorporating an option to include nail bending resistance in the
design similar to that used in the French method.
In 1996, FHWA published ‘Manual for design and construction monitoring of soil nail
walls’. The manual details over 50 projects undertaken in the USA between 1987 and
1995. It gives guidance for a design method considering only the contribution of tensile
resistance of the nail to the stability of the structure, but leaves selection of failure
planes up to the experience of the engineer. By the end of 2001, more than 500
soil-nailed walls had been completed for highway works in the USA, with sizeable
savings on costs compared to other more conventional techniques. In California, the
leading state in the use of soil nailing in high construction, more than 200,000m2 of soil
nailed walls have been built there to date. Soil nailing has been found to be the most
cost-effective method for larger projects that require considerable excavation using
conventional methods (FHWA 2002).
Development in other countries
Soil nailing is also widely used elsewhere in the world. Many research projects have
been undertaken. Adoption of the technique has proceeded more slowly in the UK and
in France, Germany and North America (Bruce and Jewell 1986, Bruce and Jewell 1987,
Barley 1992). One of the reasons for the relatively slow acceptance of soil nailing is the
concern over the long-term durability of the nails and the contribution of shear and
- 13 -
Chapter 2: Literature Review
bending as compared with tension. The soil nailing market has grown rapidly since late
1990s. In 2002, more than 60,000 m2 face area of soil nailing were installed in the UK.
The use of soil nails has become widespread, from stabilization of existing retaining
walls and slopes, to construction of new steep slopes and retaining walls.
Much UK research on soil nailing has taken place at universities. The research topics
include: the importance of bending and shear, relative to tensile resistance in soil nails
(Jewell and Pedley 1990 and1992); the influencing factors on pullout resistance of soil
nails in sand and clay (Milligan et al. 1997, Milligan and Tei 1998); centrifuge
modelling of slopes stabilized using soil nailing (Gammage 1997, Aminfar 1998);
ground/soil nail interaction from large shear box tests (Barr, et al. 1991, Davies and Le
Masurier 1997); Finite element Modelling of soil nailing construction (Ho and Smith
1993, Smith and Su 1997).
Soil nailing was extensively used in Japan in the late 1990s, an average annual length
(along the road) of 40,000m of steep soil-nailed cut slopes were built for expressway
projects (Hirano 2001). Sano et al. (1988) proposed design methods for reinforced cut
slopes. They concluded, firstly that pullout tests should form the basis of design and
secondly, analysis should be conducted using circular slips, wedges or study of earth
pressures. This was similar to the European conclusions drawn from the French and
German projects, even though pullout tests should be conducted to substantiate the
theoretical calculation. Chai and Hayashi (2005) introduced a combined technology of
chemical grouting and soil nailing called the ‘earth sewing technique’. The contribution
of constrained dilatancy to the nail pullout resistance in an unsaturated sandy clay was
studied.
- 14 -
Experimental and Theoretical Study on Pullout Resistance of Grouted Soil Nails Wan-Huan Zhou
In Australia, the first application of soil nailing was reported in 1992 where the
procedure was used to stabilize a road embankment, constructed of silty sands, north of
Sydney (Seto et al. 1992). A limit equilibrium design method using a circular slip
analysis was used and verified by pullout tests. Three nails were strain gauged and
monitored for 1.7 years to assess the performance of the nails. Results showed a small
but gradual increase in force developed in the nail with no more movement of the
embankment.
Ortigao et al. (1995) summarized twenty projects undertaken in Brazil between 1983
and 1993. Some over 20m high soil nailed structures were constructed. The study also
reports the use of semi-rigid inclusions by tunneling contactors in 1970, to stabilize the
slope around the tunnel portal.
Soil nailing in Hong Kong
The soil nailing technique was introduced to Hong Kong in the 1980s. It was first
used as a prescriptive method to provide support to limited areas of deeply weathered
material in otherwise good rock (Powell and Watkins 1990). This was followed by a few
cases where passive anchors or tie-back systems were used. Due to the advantages of
simplicity, speed construction, and economical efficiency, soil nailing has been
increasingly used in Hong Kong. In the early 1990s, the experience of design and
construction of soil nails was summarized by Watkins and Powell (1992), which soon
became the standard practice in Hong Kong. Along with the increasing number of
existing slopes and retaining walls, upgraded by the Government and private owners,
the soil nailing technique has gained popularity since the mid-1990s. Nowadays, soil
nailing is the most common slope stabilization method in Hong Kong. Each year more
than 200 slopes and retaining walls have been upgraded using soil nails (GEO 2008).
- 15 -
Chapter 2: Literature Review
Most soil nailing works in Hong Kong are associated with the stabilization of existing
soil cut slopes and retaining walls. They are also used for reinforcing new soil cut slopes,
existing fill slopes, disturbed terrain and natural hillsides. The use of soil nails in new
retaining walls and new fill slopes is rare in Hong Kong. Apart from permanent works,
soil nails may be used in temporary excavations.
The soil nailing design method in Hong Kong is based on limit equilibrium approach
(Powell and Watkins 1990), where only the contribution of tensile (pullout) resistance of
the nail reinforcement in the passive zone is considered. The requirements for the
analytical design for soil nailing are given in GEO Technical Guidance Note No. 23
(GEO 2006). Prescriptive design (Wong and Pang 1996) for soil nailing has also been
promoted in Hong Kong. The technical guidance on the design of soil nail heads for
soil cut slopes are given in GEO (2007). The new published Geoguide 7 (GEO 2008)
provides a recommended standard of good practice for the design, construction,
monitoring and maintenance of soil-nailed systems for Hong Kong. The guide
summarizes the experience gained from the use of the soil nailing technique and the
findings of related technical development work.
Many research studies on soil nailing have also been carried out by Hong Kong
Government and universities. In 2002, The GEO reported non-destructive tests for
determining soil nail lengths (Cheung, 2002) and long-term durability of steel soil nails
(Shiu and Cheung 2002). Shiu and Chang (2005) studied the effects of inclination,
length pattern and bending stiffness of soil nails on the behaviour of nailed structures by
numerical simulations. The Hong Kong Polytechnic University carried out large-scale
laboratory pullout tests, and interface shear tests to study the pullout resistance of soil
nails in Hong Kong (Yin et al. 2008, Su et al. 2008, Su et al. 2007, Yin and Su 2006, and
- 16 -
Experimental and Theoretical Study on Pullout Resistance of Grouted Soil Nails Wan-Huan Zhou
Su 2006, Chu and Yin 2005a, Chu and Yin 2005b, Chu 2003). The University of Hong
Kong investigated soil nail pullout resistance in loose fills (Pradhan 2003, Junaideen et
al. 2004, Pradhan et al. 2006). Hong Kong University of Science and Technology
carried out numerical and centrifuge study on Hong Kong slopes with and without soil
nails (Zhang 2005, Zhang 2006, Zhou et al. 2006).
2.1.3 Advantages and limitations of soil nailing
The soil nailing technique has undergone a rapid development in the last 36 years. The
method offers an alternative design solution to the conventional techniques of cutting
back and retaining wall construction. The main advantages and limitations are
summarized in this section.
The advantage of grouted soil nails is that it can overcome underground obstructions,
e.g., corestones, and the drilling spoils can provide information about the ground. In
addition, long soil nails can be installed using the drilled and grouted method. The size
and alignment of the drillholes can be checked before the insertion of reinforcement..
The action of grouting leads to the advantage of greatly enhanced pullout resistance
because of the increased surface area and roughness. The presence of grout may also
provide increased corrosion protection. However, the construction process may also
cause disturbance to the ground, and casing is required in some soil conditions to
prevent hole collapse during drilling.
The advantages of the application of soil nailing in respect of construction, cost and
performance mainly include:
- 17 -
Chapter 2: Literature Review
(a) Flexible construction, that is, site constraints and variations in ground conditions
encountered during construction can easily be catered by adjusting the location and
length of the soil nails to suit the site conditions.
(b) The drilling spoils can provide information about the ground. The size and
alignment of the drillholes can be checked before the insertion of reinforcement, if
needed.
(c) Less working space is needed for construction as the construction equipment is
relatively small scale and easily moved.
(d) Less environmental impact is caused during construction than cutting back and
retaining wall construction procedures, as no major earthworks are needed. The
construction is quiet with fewer disturbances to the surrounding existing buildings.
(e) The construction time can be less than that required by the conventional techniques
of cutting back and retaining wall construction as this usually involves substantial
earth works and temporary works, hence saving the cost.
(f) The failure mode of a soil-nailed system is likely to be ductile, thus providing
warning signs before failure.
Like every other stabilization technique, soil nailing has its limitations:
(a) Restrictions may occur in the area with the utilities, underground structures, and
other buried obstructions.
(b) Construction is difficult in the area with high groundwater levels or presence of
permeable ground.
(c) Long soil nails are difficult to install, and thus the soil nailing technique may not be
appropriate for deep-seated landslides and large slopes.
(d) Extra care should be taken when using soil nailing in soft clay.
- 18 -
Experimental and Theoretical Study on Pullout Resistance of Grouted Soil Nails Wan-Huan Zhou
(e) The construction process may also cause disturbance to the ground, and casing is
required in some soil conditions to prevent hole collapse during drilling.
(f) The zone occupied by soil nails may constrain future development of the area.
(g) Special corrosion protection measures are needed in aggressive ground.
2.1.4 Behaviour of a soil nailed system
A soil nailed system is considered as a geotechnical structure, stabilized by soil nailing
techniques, principally through the development of tensile force in the soil nails. It can
be a soil nailed retaining wall, a soil nailed slope, or a soil nailed excavation. The tensile
forces are mobilized in the soil nails primarily through the frictional interaction between
the soil nails and the ground, and the reactions provided by soil-nail heads/facing.
Two-zone model of a soil nailed system
Schlosser (1982) suggested a two-zone model to access the internal stability of a
soil-nailed system. This model has been widely used in limit equilibrium analysis in soil
nailing design, as shown in Figure 2.4. The model separates the soil nailed system into
two zones by a potential failure surface, namely the active zone and the passive zone (or
resistant zone). The active zone is the region in front of the potential failure surface,
where it has a tendency to detach from the soil-nailed system and pull out the
reinforcements. The passive zone is the region behind the potential failure surface,
where the area remains more or less stable and prevents the sliding of the system. The
soil nails act to tie (or fasten) the active zone to the passive zone.
As shown in Figure 2.4, during the slope failure, the soil nail is not only subjected to
tensile forces, but also shear forces and bending moments. All these loads originate as
reactions to the slope movement before and during the slope failure. To date, the
- 19 -
Chapter 2: Literature Review
prevailing opinion is that soil nails work predominantly in tension, but stresses are also
mobilized due to shear and bending at the intersection of the slip surface with the soil
nails (Juran 1985, Jewell and Pedley 1990 and 1992, Bridle and Davies 1997). Under
service load conditions, the contribution of shear/bending is considered negligible
(Jewell and Pedley, 1992, FHWA 2003).
It should be noted that the two-zone model is only a simplification of the soil-nailed
system for limit equilibrium analysis where the system deformation is not accounted for.
In reality, instead of a slip surface, an irregular shearing failure zone is generally
observed, as shown in Figure 2.3. The interaction between the soil nail and
surrounding soil is complex, and the forces developed in the soil nails are influenced by
many factors, such as the soil nail properties (i.e., tensile strength, shear strength and
stiffness), the inclination of the soil nails, the soil properties (i.e., shear strength,
saturation condition and gravel size), the friction between the soil nails and the soil, the
size of soil-nail heads and the nature of the slope facing.
Failure modes of a soil nailed system
The failure surface of a soil nailed system may or may not intersect the nails. The
potential failure modes of a soil nailed system are generally classified by the location of
the potential failure surfaces. The potential failure modes can be broadly classified into
external failure modes and internal failure modes (GEO 2008).
For external failure modes, the failure surface is essentially outside the soil nail
reinforced soil mass, as shown in Figure 2.5. In this case, the soil nailed mass is
generally treated as a block. The system stability is then assessed by establishing the
equilibrium of this block.
- 20 -
Experimental and Theoretical Study on Pullout Resistance of Grouted Soil Nails Wan-Huan Zhou
For the internal failure modes, the failure surface is within the soil nailed ground. Figure
2.6 illustrated 8 potential internal failure modes, including the failure occur at the nail
heads or slope facing, in the nail strength, and along the grout-soil interface. Pullout
failure (Figure 2.4e) is the primary internal failure mode in a soil nailed system. This
failure mode may occur along the grout-soil interface when the pullout resistance per
unit length of the soil nail is inadequate and/or the nail length in the passive zone is
insufficient.
Tensile force distribution in the soil nails
The small displacements in a soil nailed system result in forces being mobilized in the
soil nails. The major forces are axial tension, with bending moments and shear forces
being of secondary importance. The tensile forces in the soil nail vary from the passive
zone to the facing (or nail head): starting as zero at the end of the nail, increasing to a
maximum value in the intermediate length, and decreasing to a value at the facing (or
nail head). A schematic distribution of tensile forces in the soil nails are shown in Figure
2.7. The locus of maximum tensile forces of soil nails and the potential failure surface
of a slope are also shown in the figure.
As indicated above, the interaction between the soil nail and surrounding soil is
complex. Hence the axial forces are mobilized progressively along the entire soil nail
with a certain distribution affected by numerous factors. Clouterre (1991) reported the
effect of soil nail inclination on the tensile force distribution, as shown in Figure 2.8.
Juran et al. (1985) analyzed the effect of the soil nail bending stiffness on the locus of
maximum tensile force, as shown in Figure 2.9. FHWA (2003) concluded that the
point of maximum tension in a soil nail is close to, but does not necessary occur at the
- 21 -
Chapter 2: Literature Review
point of maximum soil shear strain, i.e., the failure surface of a slope.
2.1.5 Design of a soil nailed system
There are several different methods currently used for soil nail system design. Most
methods are derived from classical slope stability analysis methods with the
consideration of additional resisting forces provided by soil nails. Both of the external
and internal failures are checked in the design.
The most common used design methods include German Method (Gässler 1987,
Stocker et al. 1979), French Method (Clouterre 1991), Modified Davis Method (Bang et
al. 1980), FHWA Design Method (FHWA 1996 and 2003), UK Method (HA68/94 1994),
as well as design methods used in Hong Kong (GEO 2006 and 2008). The main
differences of these methods are the assumed failure surface, as shown in Table 2.1, and
the determination of ultimate soil nail pullout resistance, discussed in the paragraph
below. For the internal stability checks, the French method considers the tensile
resistance as well as the shear resistance of the soil nail in the analysis, while the other
methods used only the tensile force of the inclusion for design. Yeo and Leung (2001)
compared and evaluated these design methods. They found that all the design methods
yielded reasonable results, and in general, the USA, UK and HK methods gave similar
soil nail length per meter width slope. However the Davis method and the German
method gave a lower value of 10% and 50%, respectively.
At present, the design methods of the determination of pullout resistance include
effective stress method (Hong Kong, UK), empirical correlation with SPT-N values
(Japan), correlation with pressuremeter tests (France), and correlation with soil types
(US). Pun and Shiu (2007) summarized the merits and limitations of these methods in
- 22 -
Experimental and Theoretical Study on Pullout Resistance of Grouted Soil Nails Wan-Huan Zhou
Table 2. Although the design guidelines are available in many countries, some design
issues remain ambiguous among some engineers and researchers. The soil nail ultimate
pullout resistance is a key parameter for the design of soil nails. Many of the issues
under debate, are related to the determination of this key parameter. Some influencing
factors are not well qualified in the current design methods. For example, the effective
stress method, adopted in Hong Kong, does not account for factors including soil
arching, soil dilatancy, soil saturation condition, roughness of drillhole surface, and
grouting pressure. Pun and Shiu (2007) compared hundreds of pullout test results with
the estimated pullout resistance. They found that the actual pullout resistance is
generally several times higher than that estimated using the Hong Kong design method,
i.e., effective stress method.
2.2 SOIL NAIL PULLOUT RESISTANCE
Nowadays, researchers and engineers have acknowledged that many factors influence
the soil nail pullout resistance, such factors include stress release during drilling,
overburden pressure, grouting pressure, soil dilation, the arching effect at the nail
surface, roughness of nail surface, water content of the soil, and soil properties. Since
the 1980s, a number of different equations have been suggested to analytically estimate
the soil nail pullout resistance (Schlosser and Guilloux 1981, Cartier and Gigan 1983,
Jewell 1990, HA 68/94 1994, and Luo 2000). In these studies the normal stress acting
on the nail surface, the friction coefficient between the soil nail and the surrounding soil,
the adhesion between the nail and soil, the nail perimeter, and the soil dilation are
concerned. Hence, a general equation for the soil nail pullout resistance can be written
( )LPDcT eqnault'σμπ ∗+= (2.1)
- 23 -
Chapter 2: Literature Review
where Tult is the soil nail pullout resistance; is the adhesion between the soil nail
and soil, D is the nail diameter, is the effective normal stress at the soil nail surface,
is so called the apparent friction coefficient between the soil nail and the
surrounding soil, P
ac
'nσ
∗μ
eq is the equivalent soil nail perimeter; for the effective stress method,
Peq is two times of the nail diameter (2D), while for other methods, Peq is the nail
perimeter, and L is the soil nail length in the passive zone. In the following section,
the research and current knowledge of how different factors influence the pullout
resistance are reviewed.
2.2.1 Effect of overburden pressure
Many analytical methods relate the normal pressure on the soil nail surface, in
Eq.(2.1) to the overburden pressure. In the effective stress method in Hong Kong, the
is considered equivalent to the effective overburden pressure at mid-depth of the
soil nail in the passive zone, with a maximum value of 300 kPa (GEO 2008). In HA
68/94 (1994), the average normal effective stress acting on the soil nail circumference
is calculated from the effective overburden pressure with the lateral earth pressure
coefficient taken into account. Jewell (1990) proposed that the average normal effective
stress is in the range of in steep slopes and with lightly over consolidated
soils. However, Schlosser (1982) pointed out the actual normal pressure on the soil
nail surface is highly dependent on the soil nail type, i.e. the installation method. For
driven nails, the normal pressure is close to the overburden pressure, while for grouted
nails, the pressure can be very low, because of the stress release during hole drilling. Su
(2006) and Su et al. (2008) conducted a study on the influence of the hole drilling
process and overburden pressure on soil nail pullout resistance in a compacted
completely decomposed granite (CDG) fill. They observed that the hole drilling process
'nσ
'nσ
'nσ
')17.0( vσ−
- 24 -
Experimental and Theoretical Study on Pullout Resistance of Grouted Soil Nails Wan-Huan Zhou
caused significant stress reduction in the soil around the drillhole and the pullout
resistances of the nails were not dependent on the overburden pressure if the grouting
was conducted without pressure, as shown in Figure 2.10.
2.2.2 Effect of soil dilation
Extensive experimental tests have demonstrated that in dilative soils, soil dilation has
significant influence on the pullout resistance of soil inclusions (Schlosser 1982,
Schlosser et al. 1992, Clouterre 1991). Schlosser (1982) suggested the soil nail pullout
resistance in a granular soil is significantly governed by soil dilation behaviour. In dense
granular soil, the soil tends to dilate when it is under shearing. During pullout, the
shearing occurs in a finite zone surrounding the soil nail, and the tendency of the soil
zone to increase its volume is restrained by the neighboring soil, hence resulting in an
increase in the normal stress acting on the soil nail. The increased normal stress, due to
the constrained soil dilation, can reach four times the initial stress (Clouterre 1991), as
shown in Figure 2.11.
The magnitude of the normal stress increase, due to the effect of soil dilation, is
dependent on a number of factors, such as the confining pressure, the soil relative
density, the soil particle size and particle shape, the soil saturation condition. An
increased overburden pressure increases the confining effect and reduces the dilatancy.
Laboratory model tests and full-scale field tests indicated that the soil unit skin friction
is practically independent of the depth; the decrease of the effect of constrained soil
dilation was compensated by the increase of the overburden pressure (Clouterre 1991).
Normally, the dilation behaviour is considered to be higher in a dense sand than in a
loose sand. However, Juran (1985) reported on pullout test results in a loose sand and
found normal stress increase during pullout shearing. Junaideen et al. (2004) performed
- 25 -
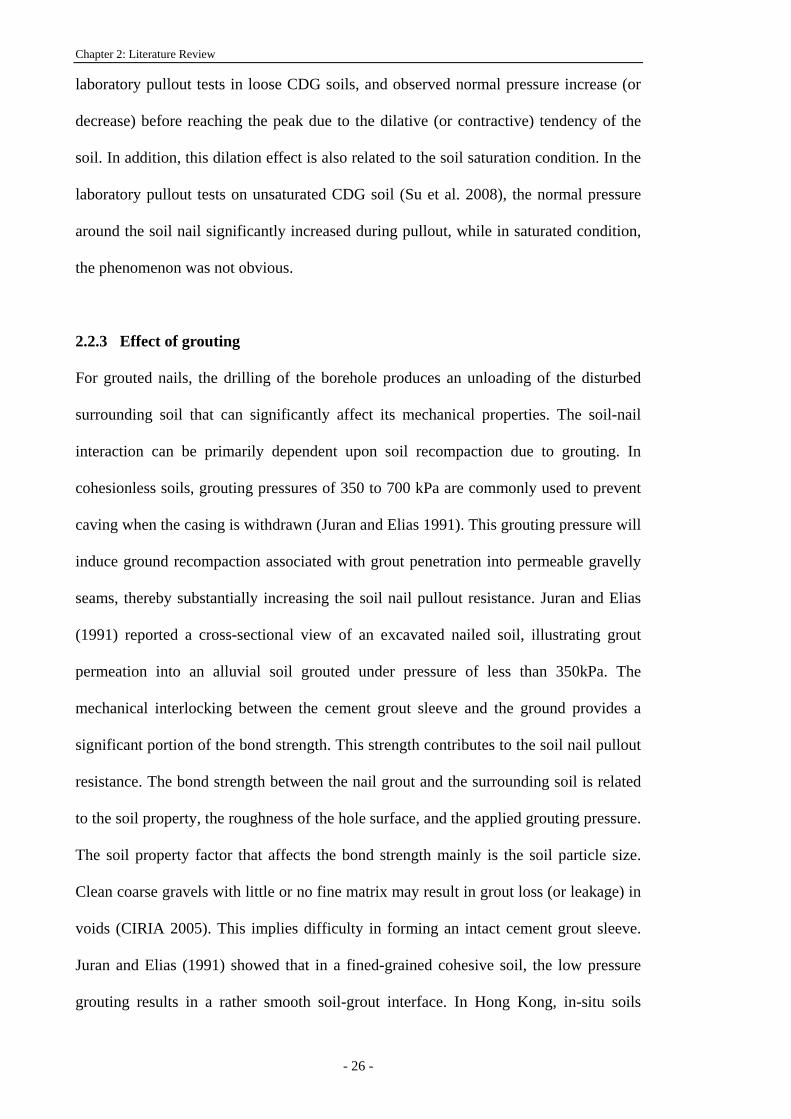
Chapter 2: Literature Review
laboratory pullout tests in loose CDG soils, and observed normal pressure increase (or
decrease) before reaching the peak due to the dilative (or contractive) tendency of the
soil. In addition, this dilation effect is also related to the soil saturation condition. In the
laboratory pullout tests on unsaturated CDG soil (Su et al. 2008), the normal pressure
around the soil nail significantly increased during pullout, while in saturated condition,
the phenomenon was not obvious.
2.2.3 Effect of grouting
For grouted nails, the drilling of the borehole produces an unloading of the disturbed
surrounding soil that can significantly affect its mechanical properties. The soil-nail
interaction can be primarily dependent upon soil recompaction due to grouting. In
cohesionless soils, grouting pressures of 350 to 700 kPa are commonly used to prevent
caving when the casing is withdrawn (Juran and Elias 1991). This grouting pressure will
induce ground recompaction associated with grout penetration into permeable gravelly
seams, thereby substantially increasing the soil nail pullout resistance. Juran and Elias
(1991) reported a cross-sectional view of an excavated nailed soil, illustrating grout
permeation into an alluvial soil grouted under pressure of less than 350kPa. The
mechanical interlocking between the cement grout sleeve and the ground provides a
significant portion of the bond strength. This strength contributes to the soil nail pullout
resistance. The bond strength between the nail grout and the surrounding soil is related
to the soil property, the roughness of the hole surface, and the applied grouting pressure.
The soil property factor that affects the bond strength mainly is the soil particle size.
Clean coarse gravels with little or no fine matrix may result in grout loss (or leakage) in
voids (CIRIA 2005). This implies difficulty in forming an intact cement grout sleeve.
Juran and Elias (1991) showed that in a fined-grained cohesive soil, the low pressure
grouting results in a rather smooth soil-grout interface. In Hong Kong, in-situ soils
- 26 -
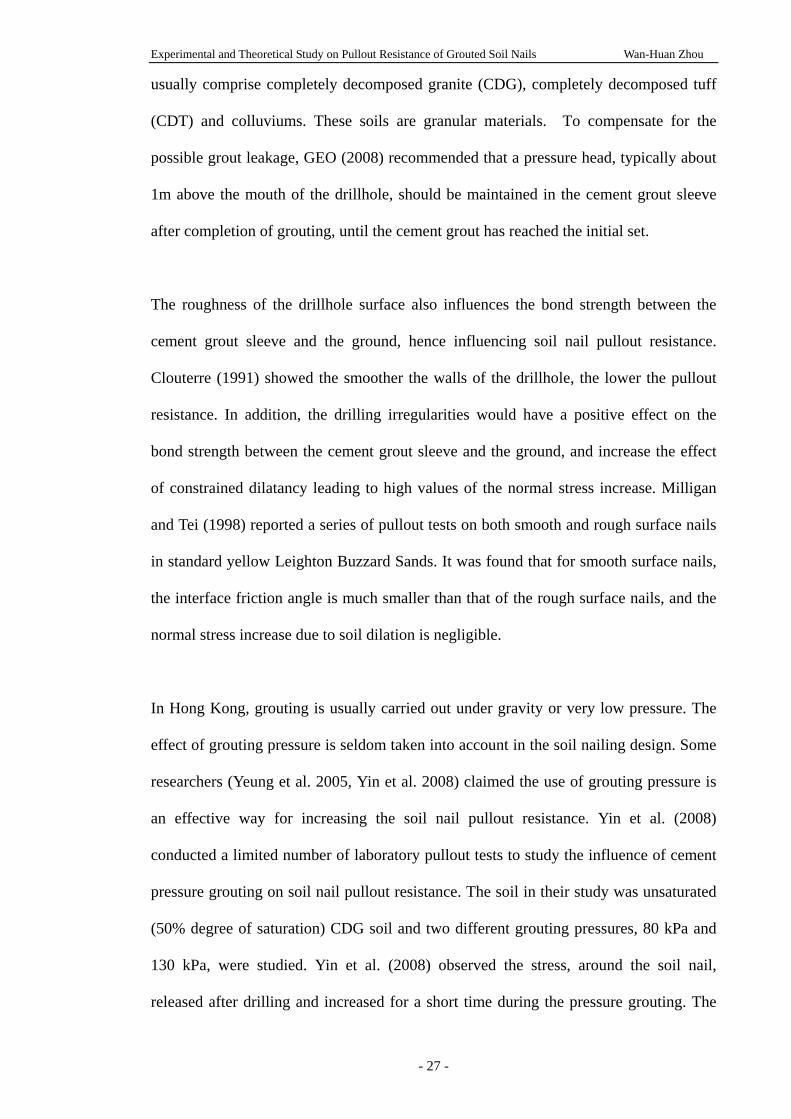
Experimental and Theoretical Study on Pullout Resistance of Grouted Soil Nails Wan-Huan Zhou
usually comprise completely decomposed granite (CDG), completely decomposed tuff
(CDT) and colluviums. These soils are granular materials. To compensate for the
possible grout leakage, GEO (2008) recommended that a pressure head, typically about
1m above the mouth of the drillhole, should be maintained in the cement grout sleeve
after completion of grouting, until the cement grout has reached the initial set.
The roughness of the drillhole surface also influences the bond strength between the
cement grout sleeve and the ground, hence influencing soil nail pullout resistance.
Clouterre (1991) showed the smoother the walls of the drillhole, the lower the pullout
resistance. In addition, the drilling irregularities would have a positive effect on the
bond strength between the cement grout sleeve and the ground, and increase the effect
of constrained dilatancy leading to high values of the normal stress increase. Milligan
and Tei (1998) reported a series of pullout tests on both smooth and rough surface nails
in standard yellow Leighton Buzzard Sands. It was found that for smooth surface nails,
the interface friction angle is much smaller than that of the rough surface nails, and the
normal stress increase due to soil dilation is negligible.
In Hong Kong, grouting is usually carried out under gravity or very low pressure. The
effect of grouting pressure is seldom taken into account in the soil nailing design. Some
researchers (Yeung et al. 2005, Yin et al. 2008) claimed the use of grouting pressure is
an effective way for increasing the soil nail pullout resistance. Yin et al. (2008)
conducted a limited number of laboratory pullout tests to study the influence of cement
pressure grouting on soil nail pullout resistance. The soil in their study was unsaturated
(50% degree of saturation) CDG soil and two different grouting pressures, 80 kPa and
130 kPa, were studied. Yin et al. (2008) observed the stress, around the soil nail,
released after drilling and increased for a short time during the pressure grouting. The
- 27 -
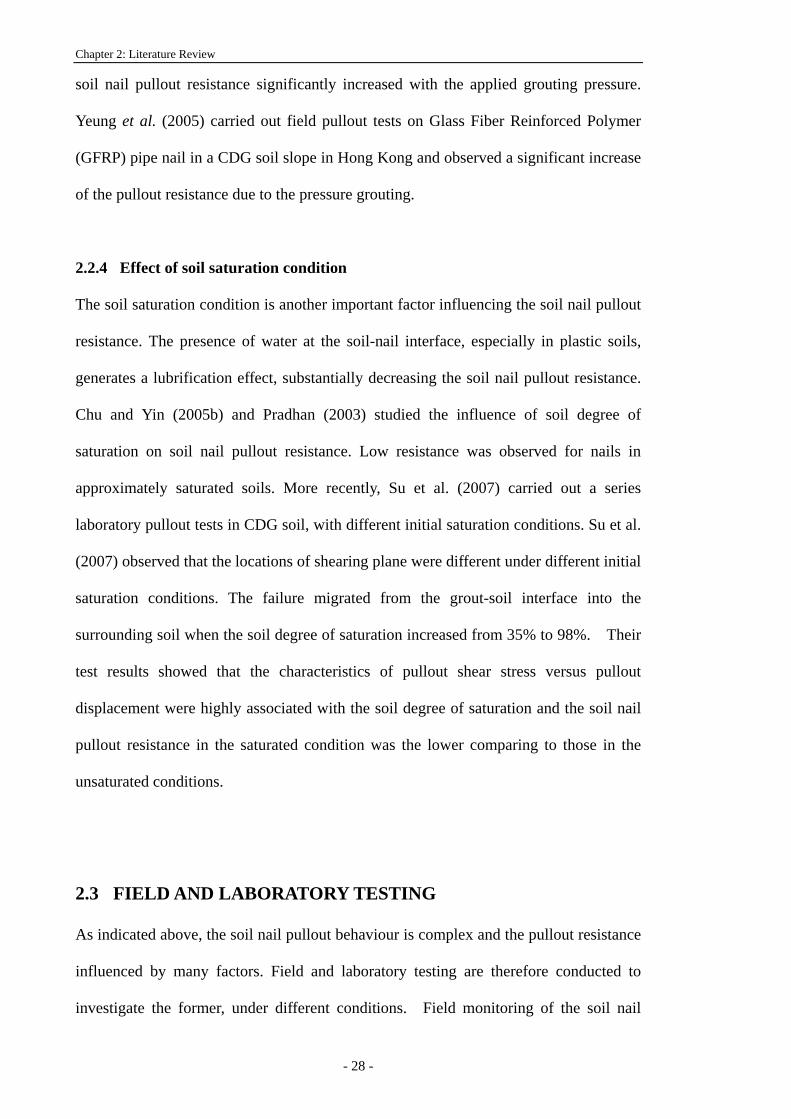
Chapter 2: Literature Review
soil nail pullout resistance significantly increased with the applied grouting pressure.
Yeung et al. (2005) carried out field pullout tests on Glass Fiber Reinforced Polymer
(GFRP) pipe nail in a CDG soil slope in Hong Kong and observed a significant increase
of the pullout resistance due to the pressure grouting.
2.2.4 Effect of soil saturation condition
The soil saturation condition is another important factor influencing the soil nail pullout
resistance. The presence of water at the soil-nail interface, especially in plastic soils,
generates a lubrification effect, substantially decreasing the soil nail pullout resistance.
Chu and Yin (2005b) and Pradhan (2003) studied the influence of soil degree of
saturation on soil nail pullout resistance. Low resistance was observed for nails in
approximately saturated soils. More recently, Su et al. (2007) carried out a series
laboratory pullout tests in CDG soil, with different initial saturation conditions. Su et al.
(2007) observed that the locations of shearing plane were different under different initial
saturation conditions. The failure migrated from the grout-soil interface into the
surrounding soil when the soil degree of saturation increased from 35% to 98%. Their
test results showed that the characteristics of pullout shear stress versus pullout
displacement were highly associated with the soil degree of saturation and the soil nail
pullout resistance in the saturated condition was the lower comparing to those in the
unsaturated conditions.
2.3 FIELD AND LABORATORY TESTING
As indicated above, the soil nail pullout behaviour is complex and the pullout resistance
influenced by many factors. Field and laboratory testing are therefore conducted to
investigate the former, under different conditions. Field monitoring of the soil nail
- 28 -
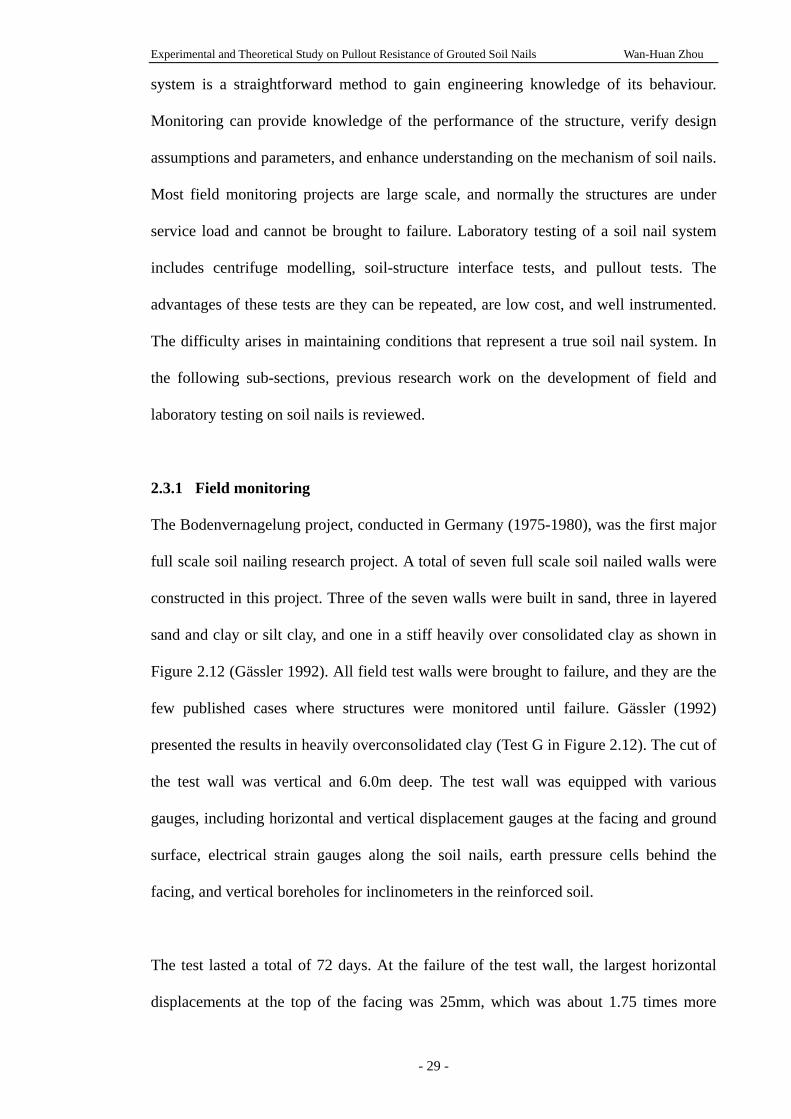
Experimental and Theoretical Study on Pullout Resistance of Grouted Soil Nails Wan-Huan Zhou
system is a straightforward method to gain engineering knowledge of its behaviour.
Monitoring can provide knowledge of the performance of the structure, verify design
assumptions and parameters, and enhance understanding on the mechanism of soil nails.
Most field monitoring projects are large scale, and normally the structures are under
service load and cannot be brought to failure. Laboratory testing of a soil nail system
includes centrifuge modelling, soil-structure interface tests, and pullout tests. The
advantages of these tests are they can be repeated, are low cost, and well instrumented.
The difficulty arises in maintaining conditions that represent a true soil nail system. In
the following sub-sections, previous research work on the development of field and
laboratory testing on soil nails is reviewed.
2.3.1 Field monitoring
The Bodenvernagelung project, conducted in Germany (1975-1980), was the first major
full scale soil nailing research project. A total of seven full scale soil nailed walls were
constructed in this project. Three of the seven walls were built in sand, three in layered
sand and clay or silt clay, and one in a stiff heavily over consolidated clay as shown in
Figure 2.12 (Gässler 1992). All field test walls were brought to failure, and they are the
few published cases where structures were monitored until failure. Gässler (1992)
presented the results in heavily overconsolidated clay (Test G in Figure 2.12). The cut of
the test wall was vertical and 6.0m deep. The test wall was equipped with various
gauges, including horizontal and vertical displacement gauges at the facing and ground
surface, electrical strain gauges along the soil nails, earth pressure cells behind the
facing, and vertical boreholes for inclinometers in the reinforced soil.
The test lasted a total of 72 days. At the failure of the test wall, the largest horizontal
displacements at the top of the facing was 25mm, which was about 1.75 times more
- 29 -
Chapter 2: Literature Review
than the displacements measured in the filed tests A or B (in Figure 2.12) in sand. Creep
displacements and the force distribution changes in the nails caused by creep effects
were observed. The field monitoring data reported by Gässler (1992) demonstrated that
the creep property of cohesive soils can play a major role in the behaviour of a soil
nailed structure.
In the French research project (Plumelle et al., 1990, Plumelle and Schlosser, 1990,
Schlosser et al. 1992, Clouterre, 1991), in addition to the field monitoring tests
reviewed in Section 2.1.2, the Clouterre program also carried out a number of field
pullout tests, the results of which were used to empirically correlate with the pressure
limit measured by the pressuremeter.
Wong et al., (1997) reported an instrumented soil nailed wall in residual soil in
Singapore. Eight rows of nails were installed at 1 m centers. The nails were grouted into
100mm diameter boreholes and 7m long. Five inclinometers were installed in 16m deep
boreholes and 0.3m behind the facing. The nails were installed with vibrating wire
strain gauges to monitor the axial forces in the nails. Earth pressure cells were installed
at a depth of 1.5m below the ground surface to monitor the earth pressure acting on the
facing. However, the earth pressure readings were considered unreliable (Wong et al.
1997). The monitoring data were taken during the excavation stages and also after the
wall construction to evaluate the long term performance. More than 3 years after the
wall construction, measurements showed that lateral deflection at the top wall reached
37mm. Wong et al. (1997) suggested that the wall displacements during the
post-construction period could result from the seepage of rain water which destroyed the
suction in the soil.
- 30 -
Experimental and Theoretical Study on Pullout Resistance of Grouted Soil Nails Wan-Huan Zhou
Barley et al. (1998) reported an eighteen-month monitoring of a soil nail slope by
installing strain gauged soil nails. During the monitoring period only 3-6kN of nail
loads were found to have developed. No visually detectable movement of the slope
occurred which indicated that the soil nails fulfilled the purpose of stabilizing the slope.
Turner and Jensen (2005) reported the application of soil nailing in the stabilization of
active landslides. Strain gauges and inclinometers were stalled to monitor the nail forces
and ground movements. The monitored results demonstrated that the soil nailing has
successfully been used for stabilization of active slides in Elbow, USA.
Shiu et al., (1997) reported a field monitoring case of soil nailed slope in Hong Kong.
This project excavated the toe of a natural hillside to form a steep cut slope up to 13.5 m
high at angles of 80°. Vibrating wire strain gauges were installed in the soil nails in the
most critical section of the slope, to measure the nail force distributions during the
excavation, as shown in Figure 2.13. An inclinometer casing was installed to monitor
the lateral deformation of the nailed slope during and after construction. Figure 2.14
shows the lateral displacements recorded during different stages of excavation. It was
observed that the lateral displacement increased in line with the increase in excavation
depth. The axial force distributions along the nails on rows 3 and 7 at different
excavation stages are shown in Figure 2.15. This distribution illustrates that the effect of
advancing excavation is significant on row 7 but much less noticeable on row 3. Figure
2.16 shows the axial force distribution along each soil nail at the end of construction.
This demonstrates that the soil nails contributes significantly to the stability of the cut
slope.
2.3.2 Centrifuge modelling
Centrifuge modelling is a method using large reduced scale models under high gravity
- 31 -
Chapter 2: Literature Review
accelerations to simulate the prototype structures under normal gravity. It has been used
to study the behaviour of soil structures, such as foundations, tunnels and reinforced
slopes. Many researchers have reported centrifuge modelling on the behaviour of soil
nailed system under static and dynamic loading conditions (Davies et al. 1997, Aminfar
1998, Choukeir 1996, Zhang et al. 2001, Zhang 2005, and Zhang 2006). The research
studies focused on the soil nailing performance in different soil conditions, loading
conditions, ground water conditions, and nail arrangement conditions.
2.3.3 Direct and interface shear tests
Direct shear tests with inclusions were carried out to study the influence of the
inclination, shear and bending resistance of the inclusions on the overall strength of the
reinforced soil. Many authors such as Jewell and Wroth (1987), Pedley (1990), Barr et
al. (1991), Davies and Masurier (1997) and Briddle and Davies (1997), have carried out
these types of tests.
Interface shear tests can be used to investigate the behaviour of soil-structure interfaces.
Ramsey et al. (1998) reviewed the soil-steel interface testing with the ring shear apparatus.
Chu (2003) performed a series of interface shear tests between a CDG soil and cement
grout to investigate the shearing behaviour at the soil-grout interface.
2.3.4 Laboratory pullout tests
Laboratory pullout testing is an effective way to study the soil nail pullout behaviour
under different controlled conditions. Tei (1993) carried out series of soil nail pullout
tests in three types of sands using a 254mm long, 153mm wide and 202mm high pullout
box, as shown in Figure 2.17. Franzén (1998) studied soil nail pullout resistance using a
2m×4m×1.5m pullout box for four types of jacked or driven nails under four different
- 32 -
Experimental and Theoretical Study on Pullout Resistance of Grouted Soil Nails Wan-Huan Zhou
stress levels.
In Hong Kong, a number of laboratory soil nail pullout tests have been performed at
The University of Hong Kong and The Hong Kong Polytechnic University. Pradhan
(2003) and Junaideen et al. (2004) reported pullout tests in loose CDG fill using a sand
tank of size 2m in length ×1.6m in width ×1.4m in height, as shown in Figure 2.18. Chu
(2003) carried out a series of pullout tests using a 0.6m×0.6m×0.7m steel box in dense
CDG soil (Figure 2.19). More recently, an innovative pullout box was developed by Yin
and Su (2006). The features of the pullout box are further described below in Chapter 4.
Su (2006), Su et al. (2007 and 2008), and Yin et al. (2008) utilized this pullout box to
carry out a series of pullout tests on CDG soil and investigated the soil nail pullout
behaviour under different overburden pressures, saturation conditions, and grouting
pressures.
2.4 NUMERICAL MODELLING
Numerical modelling is an effective way to predict the performance of a soil nailed
system and widely used both in design and research. Most methods for analyzing a soil
nailed system are derived from slope stability analysis methods with the consideration
of additional resisting forces provided by soil nails. The limit equilibrium and shear
strength reduction methods are two well established methods for slope stability analysis.
They have been successfully adopted in the analysis of a soil nailed system to determine
the factor of safety and locations of critical failure planes. Most current design methods
are based on two-dimensional (2D) limit equilibrium method, while shear strength
reduction method is widely used in three-dimensional (3D) finite element analysis. In
- 33 -
Chapter 2: Literature Review
the analysis of a soil nailed system, no matter which method is used, the simulation of
the interaction between the soil nail and the ground is an important factor that influences
the result of soil nail pullout resistance, and hence the factor of safety of the whole soil
nailed system.
As indicated in Section 3.2, the interaction between the soil nail and ground is complex,
the soil nail pullout resistance being influenced by a number of factors. These factors
are considered in the numerical modelling in two ways: analytical method and finite
element method. Some researchers intend to derive analytical solutions (with empirical
correlations sometimes) to describe the soil nail pullout behaviour. Alternatively, others
simulate the soil nail behaviour by using finite element models based on continuum
mechanics with proper constitutive models for the soil and the soil-nail interface. In the
following section, the previous research work on the numerical modelling of the
interaction between the soil nail and ground is reviewed.
2.4.1 Analytical method
For the determination of soil nail pullout resistance, the analytical method is widely
used in design, as the analytical equations are simple and easy to be used by engineers.
But these equations generally failed to consider some important factors, such as soil
dilation, stress release after drilling, water content, and grouting pressure, etc, as stated
in Section 2.2. In addition, rational analysis of the nail-ground interactions requires
appropriate interface properties that are difficult to estimate.
Many analytical equations have been proposed for the determination of soil nail pullout
resistance, such as the representative work proposed by Schlosser and Guilloux (1981),
Cartier and Gigan (1983), Jewell (1990), HA 68/94 (1994) and others. These equations
- 34 -
Experimental and Theoretical Study on Pullout Resistance of Grouted Soil Nails Wan-Huan Zhou
can be generally written in the form of Eq. (2.1). These equations mainly vary in the
determination of the parameters of and , or additional parameters, to consider
the effects of soil properties, soil nail spacing, and soil dilation.
∗μ 'nσ
Luo et al. (2000) developed an analytical model for the calculation of soil nail pullout
resistance in dilative soils. In their model, the soil relative density, dilation angle, soil
shear modulus, and confining pressure are considered.
2.4.2 Finite element method
The finite element method (FEM) is well recognized as a powerful tool, which can be
used to model a soil nailed system. The two primary advantages of finite element
analysis are (a) to provide information about deformations and strains development in a
soil nailed system, and (b) to easily perform a three-dimensional (3D) analysis. It can
be used as validation of simplified analytical analysis or a complemental analysis for the
problems where anticipated conditions may be such that the validity of simplified
analysis is questionable, for example, when 3D effect is dominant for the specific
problem. There are two principal approaches to FEM modelling of a soil nailed
system, the discrete and composite representations. In the discrete representation, the
soil and the soil nail are modeled distinctly. In the composite representation, the
reinforced soil structure is considered to be built from an orthotropic, locally
homogeneous material with enhanced strength and stiffness properties. The choice of
representation is governed by the level of information required and the computing
resources available. The discrete approach is capable of providing more information
about how the soil nail and the ground interact. Aspects such as bond stresses and
relative slip at the interface cannot be studied in the composite approach.
- 35 -
Chapter 2: Literature Review
Numerical modelling using finite element methods for analyzing overall and local
behaviour of soil nailed system has been reported by many authors, such as Frydman et
al. (1994), Benhamida et al. (1997), Smith and Su (1997), Ng and Lee (2002), and
Cheuk et al. (2005). Some numerical modelling has been performed to study soil-nail
interaction behaviour, such as the work published by Ochiai et al. (1997) and Tsai et al.
(2005).
The simulation of the interaction between soil nail and soil is important in modelling the
soil nailed system. Some researchers simulated the nail-soil interface using zero
thickness interface elements (Kim 1998; Zhang et al. 1999; Yang and Drumm 2000).
Zhang et al. (1999) used two perpendicular fictitious springs to simulate the normal and
tangential behaviour at the soil-nail interface. Yang and Drumm (2000) adopted a
surface based frictional interaction model to simulate the soil-nail interface, so that large
relative displacement between soil and inclusion is allowed. But the actual behaviour
of the soil-nail interface is neither purely elastic nor frictional. Appropriate constitutive
model for the soil-nail interaction needs to be defined. Lim (1996) and Briaud and Lim
(1997) chose one-dimensional structural elements, such as beam and cable elements, to
simulate the inclusions. In their analysis, the structural elements were embedded in the
soil mass, and the interaction between the nail and the surrounding soil can not be
defined.
- 36 -
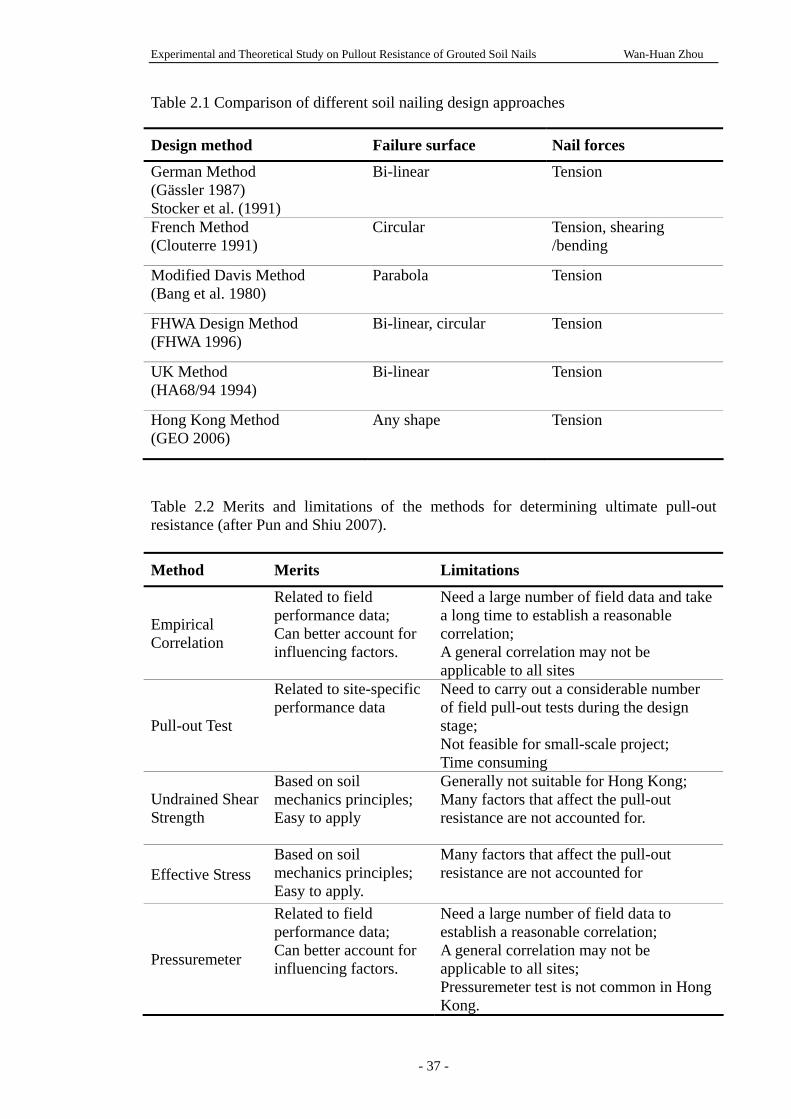
Experimental and Theoretical Study on Pullout Resistance of Grouted Soil Nails Wan-Huan Zhou
Table 2.1 Comparison of different soil nailing design approaches
Design method Failure surface Nail forces
German Method (Gässler 1987) Stocker et al. (1991)
Bi-linear Tension
French Method (Clouterre 1991)
Circular Tension, shearing /bending
Modified Davis Method (Bang et al. 1980)
Parabola Tension
FHWA Design Method (FHWA 1996)
Bi-linear, circular Tension
UK Method (HA68/94 1994)
Bi-linear Tension
Hong Kong Method (GEO 2006)
Any shape Tension
Table 2.2 Merits and limitations of the methods for determining ultimate pull-out resistance (after Pun and Shiu 2007).
Method Merits Limitations
Empirical Correlation
Related to field performance data; Can better account for influencing factors.
Need a large number of field data and take a long time to establish a reasonable correlation; A general correlation may not be applicable to all sites
Pull-out Test
Related to site-specific performance data
Need to carry out a considerable number of field pull-out tests during the design stage; Not feasible for small-scale project; Time consuming
Undrained Shear Strength
Based on soil mechanics principles; Easy to apply
Generally not suitable for Hong Kong; Many factors that affect the pull-out resistance are not accounted for.
Effective Stress Based on soil mechanics principles; Easy to apply.
Many factors that affect the pull-out resistance are not accounted for
Pressuremeter
Related to field performance data; Can better account for influencing factors.
Need a large number of field data to establish a reasonable correlation; A general correlation may not be applicable to all sites; Pressuremeter test is not common in Hong Kong.
- 37 -
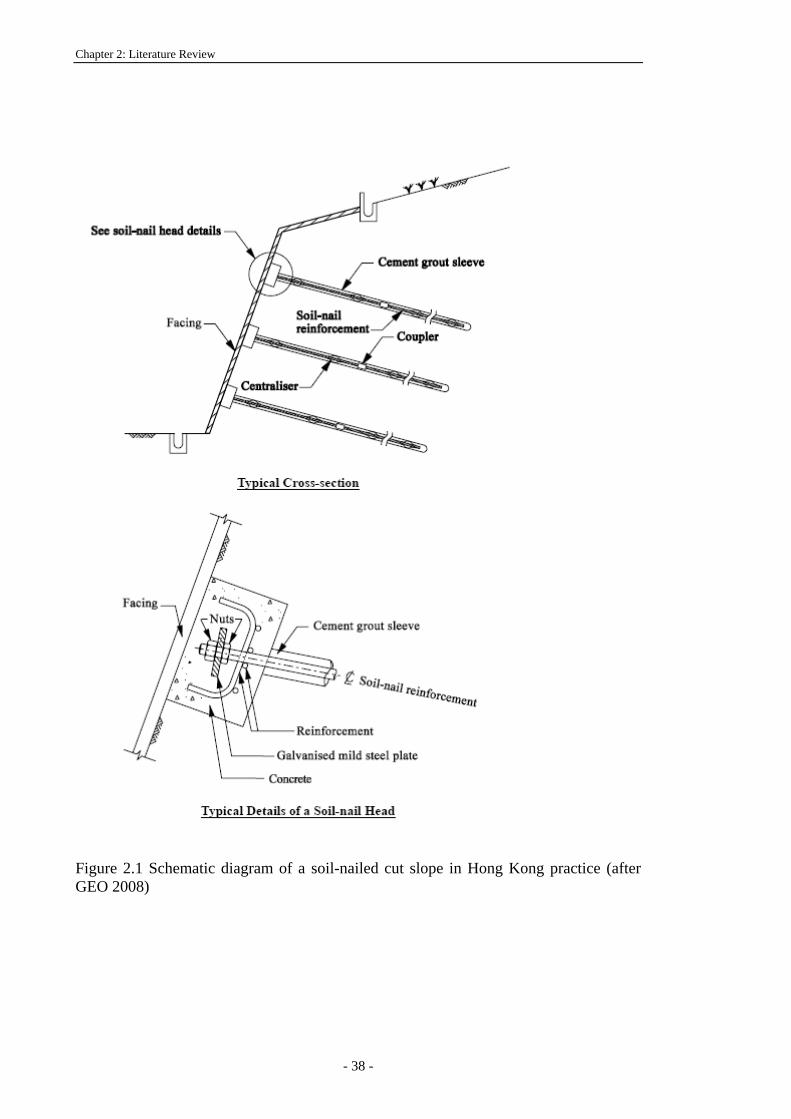
Chapter 2: Literature Review
Figure 2.1 Schematic diagram of a soil-nailed cut slope in Hong Kong practice (after GEO 2008)
- 38 -
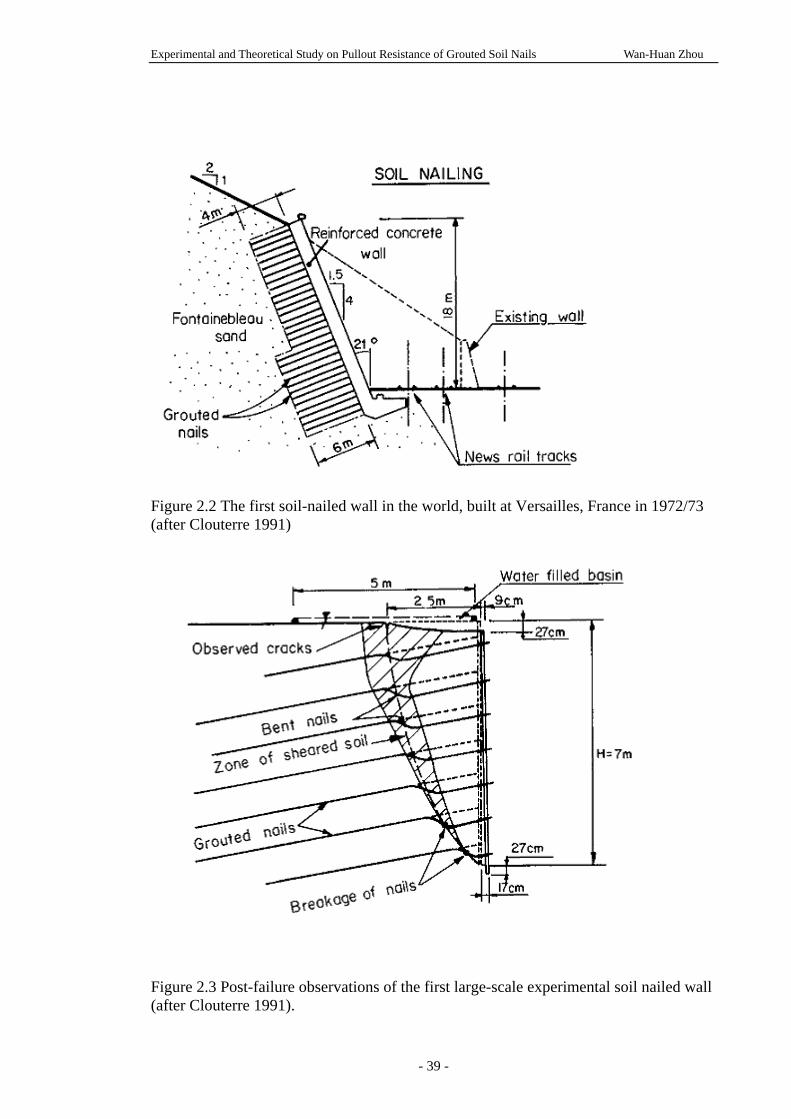
Experimental and Theoretical Study on Pullout Resistance of Grouted Soil Nails Wan-Huan Zhou
Figure 2.2 The first soil-nailed wall in the world, built at Versailles, France in 1972/73 (after Clouterre 1991)
Figure 2.3 Post-failure observations of the first large-scale experimental soil nailed wall (after Clouterre 1991).
- 39 -
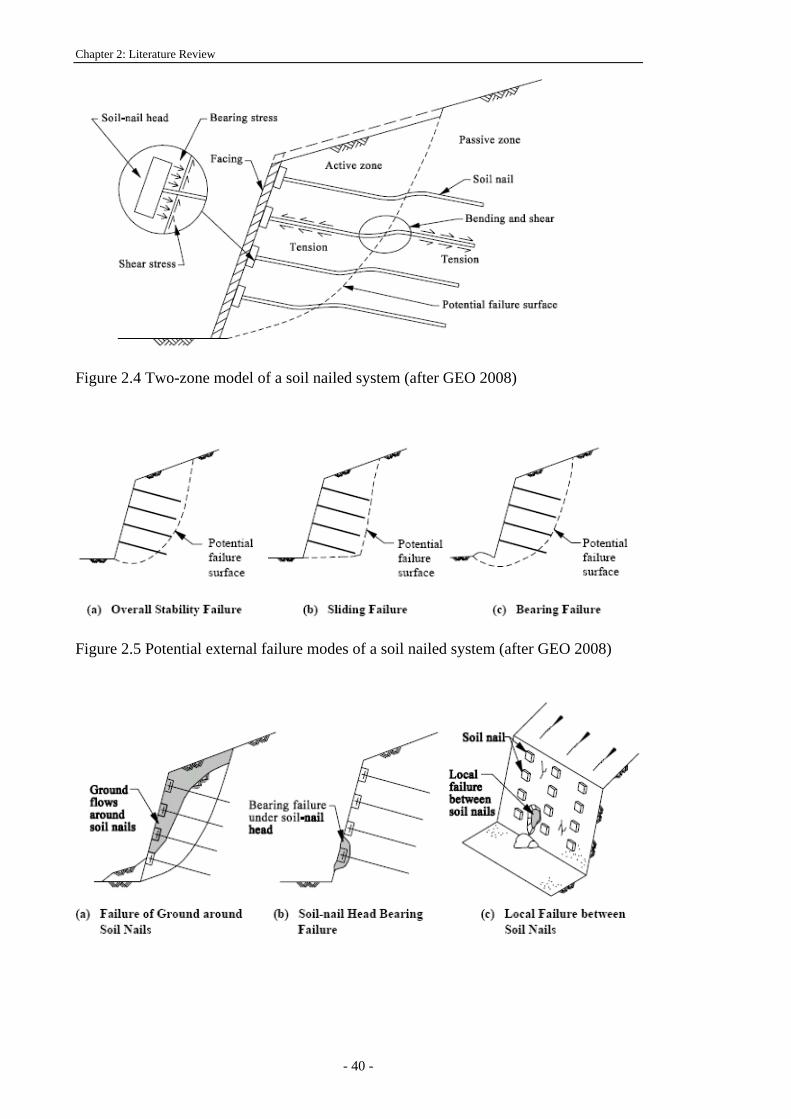
Chapter 2: Literature Review
Figure 2.4 Two-zone model of a soil nailed system (after GEO 2008)
Figure 2.5 Potential external failure modes of a soil nailed system (after GEO 2008)
- 40 -
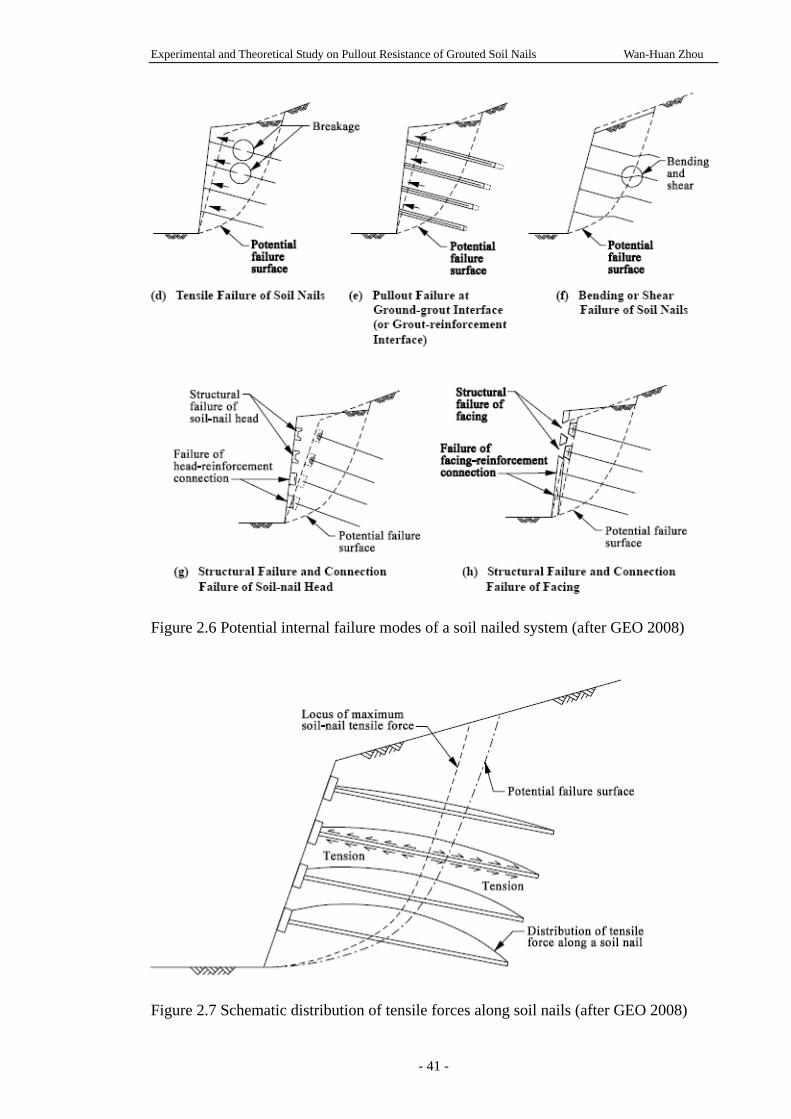
Experimental and Theoretical Study on Pullout Resistance of Grouted Soil Nails Wan-Huan Zhou
Figure 2.6 Potential internal failure modes of a soil nailed system (after GEO 2008)
Figure 2.7 Schematic distribution of tensile forces along soil nails (after GEO 2008)
- 41 -
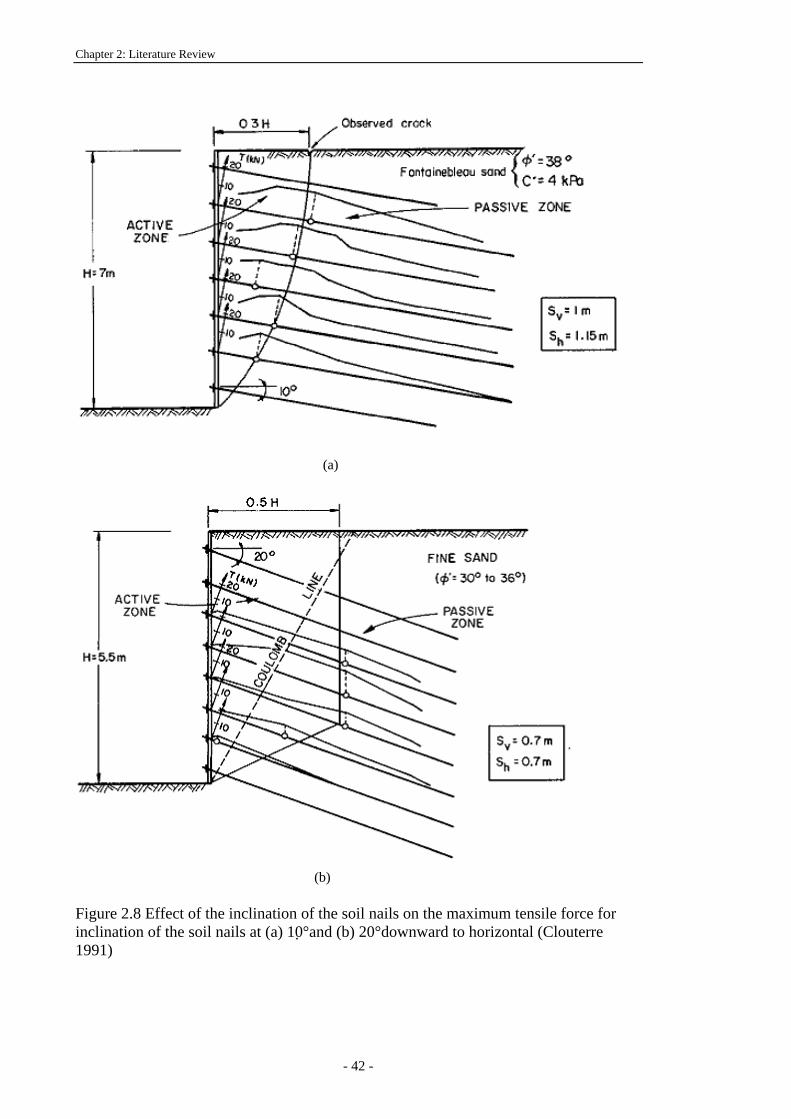
Chapter 2: Literature Review
(a)
(b)
Figure 2.8 Effect of the inclination of the soil nails on the maximum tensile force for inclination of the soil nails at (a) 10°and (b) 20°downward to horizontal (Clouterre 1991)
- 42 -
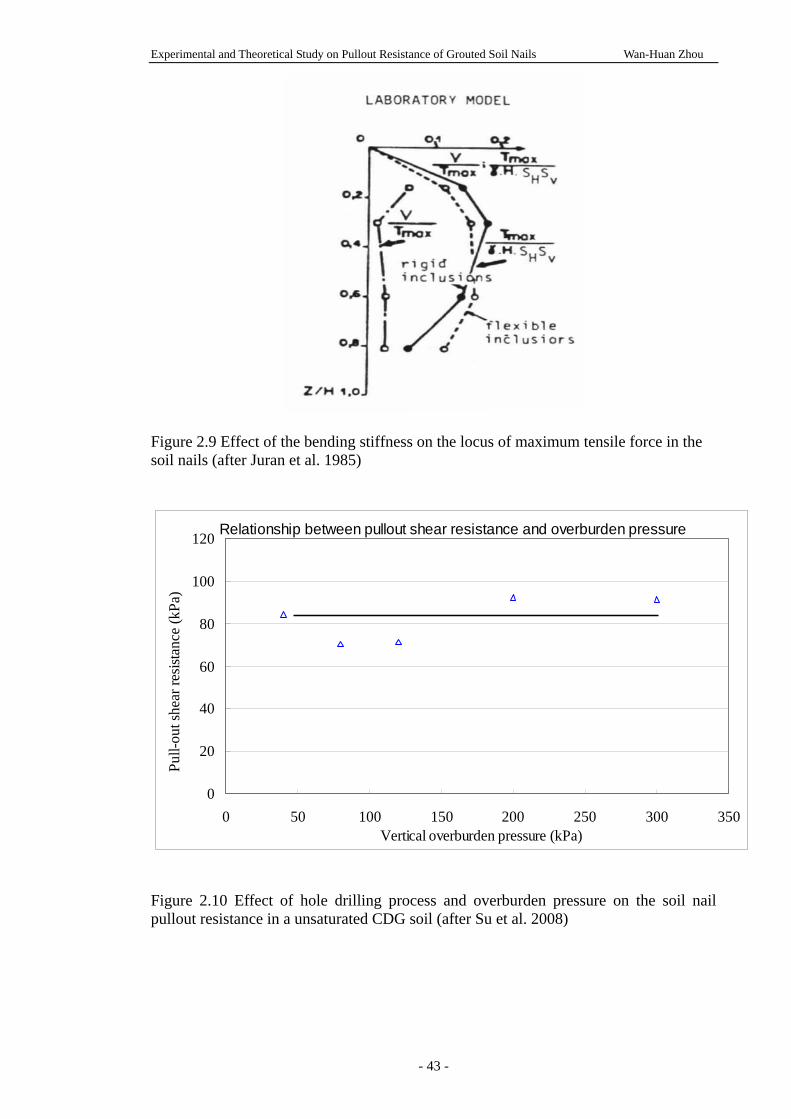
Experimental and Theoretical Study on Pullout Resistance of Grouted Soil Nails Wan-Huan Zhou
Figure 2.9 Effect of the bending stiffness on the locus of maximum tensile force in the soil nails (after Juran et al. 1985)
Relationship between pullout shear resistance and overburden pressure
0
20
40
60
80
100
120
0 50 100 150 200 250 300 350Vertical overburden pressure (kPa)
Pull-
out s
hear
resis
tanc
e (k
Pa) _
Figure 2.10 Effect of hole drilling process and overburden pressure on the soil nail pullout resistance in a unsaturated CDG soil (after Su et al. 2008)
- 43 -
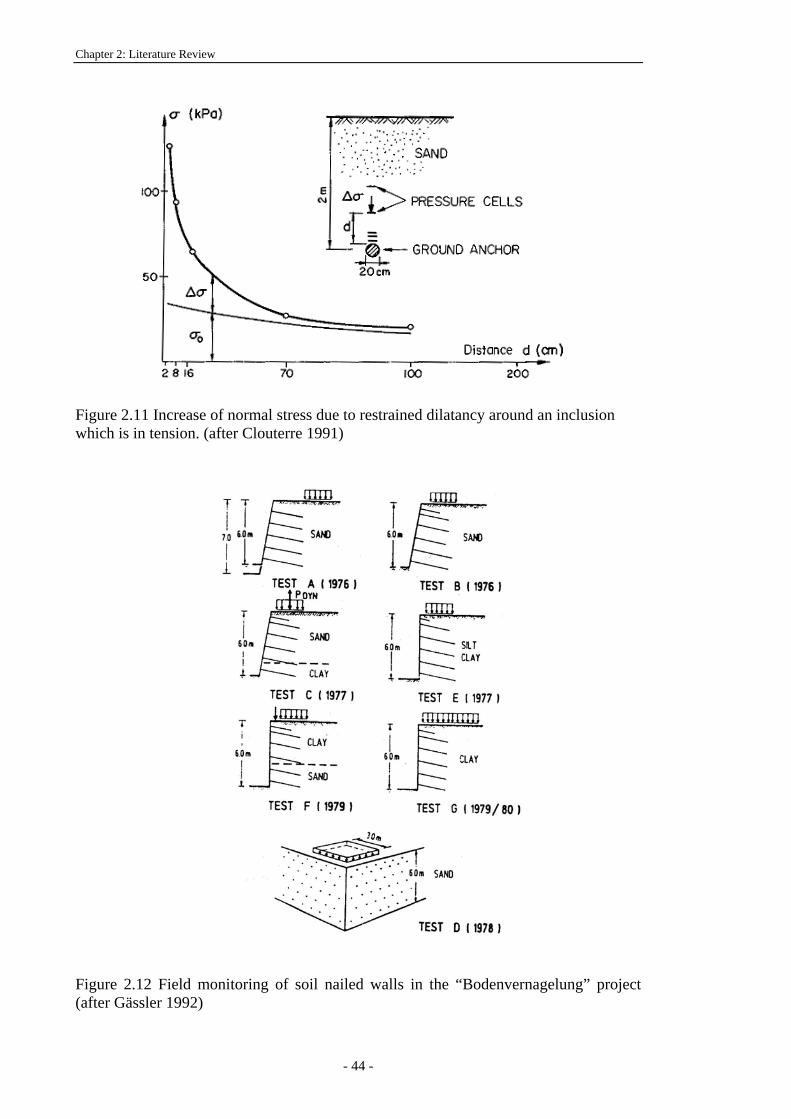
Chapter 2: Literature Review
Figure 2.11 Increase of normal stress due to restrained dilatancy around an inclusion which is in tension. (after Clouterre 1991)
Figure 2.12 Field monitoring of soil nailed walls in the “Bodenvernagelung” project (after Gässler 1992)
- 44 -
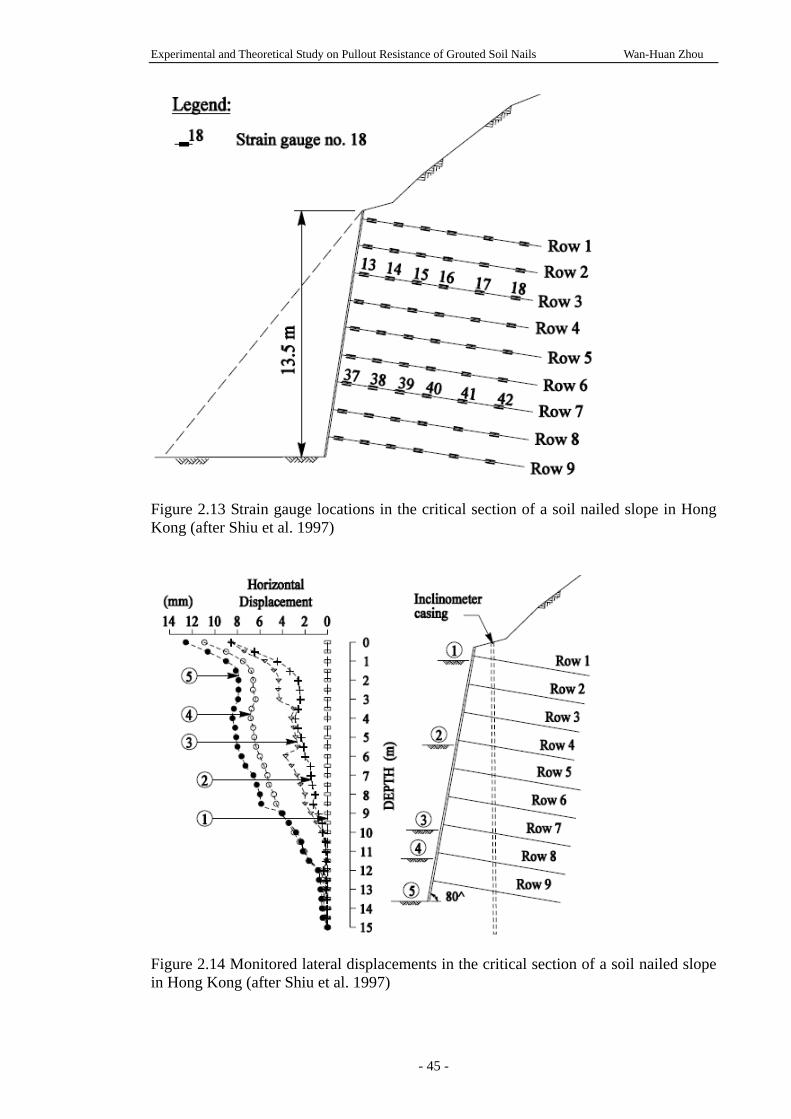
Experimental and Theoretical Study on Pullout Resistance of Grouted Soil Nails Wan-Huan Zhou
Figure 2.13 Strain gauge locations in the critical section of a soil nailed slope in Hong Kong (after Shiu et al. 1997)
Figure 2.14 Monitored lateral displacements in the critical section of a soil nailed slope in Hong Kong (after Shiu et al. 1997)
- 45 -
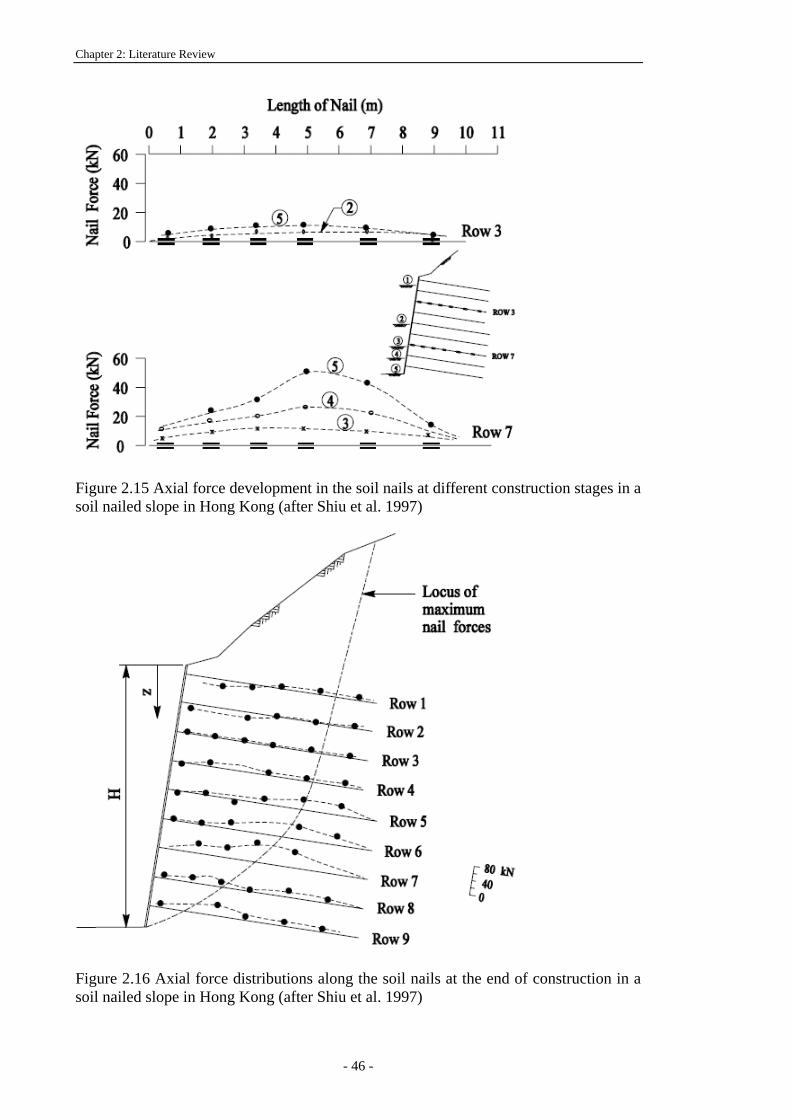
Chapter 2: Literature Review
Figure 2.15 Axial force development in the soil nails at different construction stages in a soil nailed slope in Hong Kong (after Shiu et al. 1997)
Figure 2.16 Axial force distributions along the soil nails at the end of construction in a soil nailed slope in Hong Kong (after Shiu et al. 1997)
- 46 -
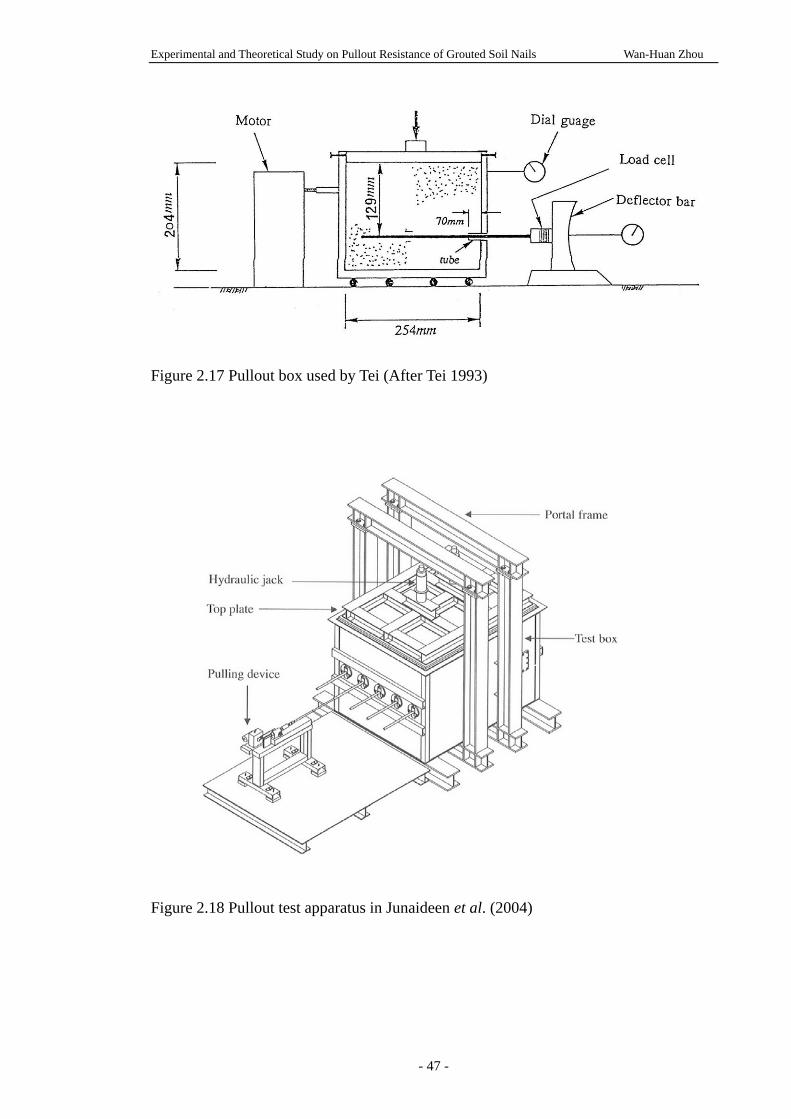
Experimental and Theoretical Study on Pullout Resistance of Grouted Soil Nails Wan-Huan Zhou
Figure 2.17 Pullout box used by Tei (After Tei 1993) Figure 2.18 Pullout test apparatus in Junaideen et al. (2004)
- 47 -
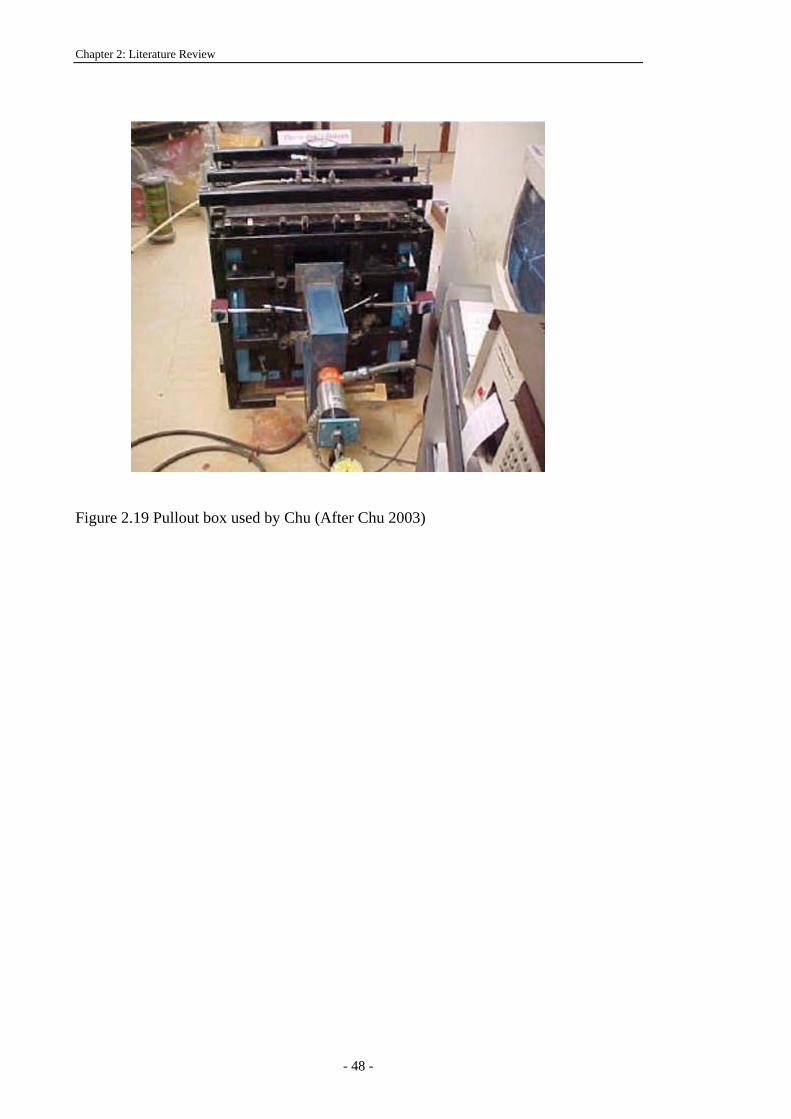
Chapter 2: Literature Review
Figure 2.19 Pullout box used by Chu (After Chu 2003)
- 48 -
Experimental and Theoretical Study on Pullout Resistance of Grouted Soil Nails Wan-Huan Zhou
Chapter 3:
A SIMPLE MATHEMATICAL MODEL FOR THE
DETERMINATION OF SOIL NAIL PULLOUT
RESISTANCE
3.1 INTRODUCTION
Soil nailing has been proved to be a versatile and cost-effective technique in the
stabilization of slopes and earth retaining structures. Conventional limit equilibrium
analysis and design methods depend on the concept of the nails being ‘anchored’ in the
passive zone (i.e. stable zone) and developing tensile forces, in a passive way, which
resist the slope failure when/if the slope moves (Figure 3.1a). The required soil nail
length in the passive zone depends on the ‘soil nail pullout resistance’ (Figure
3.1b) which is an important parameter in the soil nailing design. The local analysis of
each soil nail (Figure 3.1b) is useful in determining the individual pullout strength,
hence enabling the stability of the reinforced slope/wall to be evaluated in a
global analysis.
pL aF
Extensive tests (Schlosser 1982, Gray and Ohashi 1983, Schlosser et al. 1992 and Su
2006) have demonstrated that soil dilation has significant influence on the pullout
resistance of soil inclusions in dilative soils. As suggested by Schlosser (1982), the
shear resistance on the interface between the inclusion and soil is essentially governed
- 49 -
Chapter 3: A Simple Mathematical Model for the Determination of Soil Nail Pullout Resistance
by the dilation behavior of the soil. The laboratory pullout tests (Su 2006) showed that
the development of pullout shear resistance of soil nails in the completely decomposed
granite was mainly mobilized by the constrained dilatancy of the soil. Theoretically,
Luo et al. (2000) developed an analytical model for calculating the pullout resistance of
soil nail reinforcement in dilative soils.
The soil nail is not only subjected to tensile forces, but also shear forces and bending
moments. All these loads originate as reactions to the slope movement before and
during the slope failure. Many researchers have investigated the effects of the nail
bending on the soil nailed structures (Juran et al. 1990, Jewell and Pedley 1990 and
1992). In recent years, Fiber glass Reinforced Plastic (FRP), a type of material with
high tensile strength, is increasingly used to replace steel bars in cement grouted soil
nails because of its high corrosion resistance and advantages in environmental
protection (Ortigao and Palmeira 1997). Yeung et al. (2005) reported pullout tests on
Fibre Reinforced Polymer (FRP) pipe soil nails in the field. An FRP nail is a pipe with
an outer diameter of 55 mm and an inner diameter of 37 mm. During installation of a
FRP pipe nail in a drill hole normally of 100 mm in Hong Kong, both the inside and
outside of the FRP pipe are grouted with cement grout. According to the study by Yeung
et al. (2005), one of the advantages of the FRP pipe nails is the significant increase of
the bending stiffness and shear force for this type of pipe nails. This increase leads to a
large increase in slope stability. Hence, bending and shear force must be considered in
the slope stability analysis when using this nail type (Yeung et al. 2005).
To date, the prevailing opinion is that soil nails work predominantly in tension, but
stresses are also mobilized due to shear and bending at the intersection of the slip
surface with the soil nails (Bridle and Davies 1997). Under service load conditions, the
- 50 -
Experimental and Theoretical Study on Pullout Resistance of Grouted Soil Nails Wan-Huan Zhou
contribution of shear/bending is considered negligible. As failure conditions approach,
the contribution of shear/bending action is more significant but still small. However,
the bending of the soil nail is likely to have influences on the normal pressure along the
soil nail length, and hence influence the shear resistance of the soil-nail interface. As
shown in Figure 3.1(b), the post-installation stress, the constrained soil dilation, and the
nail bending co-exist and contribute to the development of normal and shear stresses
around the soil nail. However, the contribution of soil nail bending to the shear
resistance of the soil-nail interface has never been considered in previous research
studies. Furthermore, the evaluation of soil nail resistance at the ultimate state other
than in a progressive way is the focus of most studies, even though the loads on the soil
nails are mobilized gradually, in accordance with the soil deformation.
In this chapter, the development of a rational simple mathematical model for the
complex load transfer mechanism at the interface between soil nail and the surrounding
soil is presented. The model aims to describe the evolution of shear stresses along the
nail when the effects of soil dilation and the nail bending are considered together. The
effects of nail bending are estimated during the soil nail failure process in a slope. The
soil nail pullout resistance is studied in a progressive way. Numerical results of the
mathematical model are obtained and compared with the reported data in the literature
for verification. The contributions of the soil dilation and soil nail bending to the pullout
resistance are evaluated in the case studies. Finally, parametric study based on the new
simple model is presented. The influences of modulus of soil subgrade reaction and soil
nail bending stiffness on the soil nail pullout behaviour are investigated.
- 51 -
Chapter 3: A Simple Mathematical Model for the Determination of Soil Nail Pullout Resistance
3.2 DEVELOPMENT OF A MATHEMATICAL MODEL
3.2.1 Normal stress on the soil nail
The soil nail in the passive zone is subjected to multiple forces. The normal stress nσ ′
is composed of the post-installation normal stress rσ ′ , the normal stress diσ ′ , induced
by soil dilation, and the normal stress bmσ ′ , due to bending of the soil nail, as shown in
Figure 3.2. The normal stress due to dilation is evenly distributed around the soil nail,
while the normal stress, due to bending, is only imposed on half of the nail. The
post-installation stress may be uneven depending on the installation methods. In this
study, it is assumed that the three normal stresses are induced independently, i.e. they
have no influence on each other, but may co-exist. In the following, the three types of
normal stresses are normalized around the nail perimeter, hence giving the relation nσ ′
= rσ ′+ diσ ′ + bmσ ′ in the analysis.
For the circular soil nail, the average post-installation stress rσ ′ , can be calculated by
the following
pr
rK
σσ ′+=′
21 (3.1)
where pσ ′ is the post-installation vertical effective normal stress on the soil-nail
interface. The coefficient is the ratio of horizontal normal pressure to vertical
normal pressure around the soil nail, as shown in Figure 3. For grouted soil nails,
because the stress has been released by the drilling of the borehole, the coefficient
can be assumed as 1 based on the axisymmetry of the hole. If the effect of the drilling
process is not considered, can be determined as the coefficient of earth pressure at
rest, . For normally consolidated soil, the widely accepted form of the
rK
rK
rK
0KK r =
- 52 -
Experimental and Theoretical Study on Pullout Resistance of Grouted Soil Nails Wan-Huan Zhou
coefficient is proposed by Jaky (1944), φ′−= sin10K , where φ′ is the internal
friction angle of the soil. Therefore, the rσ ′ value is highly dependent on the
installation method. For grouted soil nails, rσ ′ can be very small and is approximately
constant with depth. For driven soil nails, rσ ′ is related to the overburden pressure or
earth pressure.
The analysis of the soil mass around the soil nail can be simplified as an axisymmetric
problem. The soil mass can be considered to be a hollow cylinder with infinite thickness.
The relationship between radial displacement and normal pressure at the circumference
of the hole can be calculated using a linear elastic solution for a hollow cylinder with
internal pressure at 1p 0rr = and 02 =p at infinite distance according to the
following equation given by Jaeger and Cook (1979),
01
02
rGu
p r= (3.2)
where is the soil shear modulus. and are the radial displacement and
radius of the soil nail respectively. As suggested by Luo et al. (2000), the critical shear
displacement (u
G0r
u 0r
c), i.e. the relative displacement in the interface shear zone to mobilize
the peak interface shear resistance, and the maximum dilation angle maxψ can be used
to calculate the radial displacement at the critical shear displacement as
follows
cro
u cu
∫=c
o
u
oa
cr duu ψtan (3.3)
where ua is the shear displacement, ψ is the corresponding dilation angle. The ψtan
is assumed to be linear with the shear displacement as abu=ψtan , where b is a
constant. Thus
- 53 -
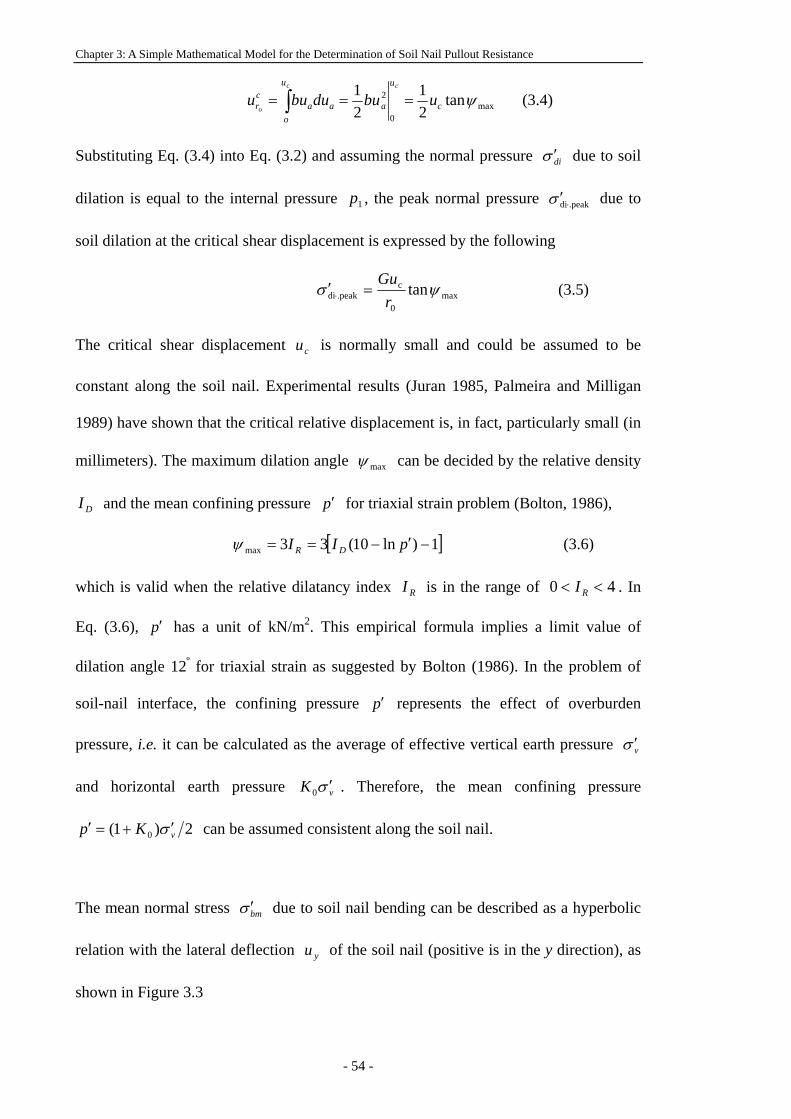
Chapter 3: A Simple Mathematical Model for the Determination of Soil Nail Pullout Resistance
max0
2 tan21
21 ψc
u
a
u
oaa
cr ubudubuu
cc
o=== ∫ (3.4)
Substituting Eq. (3.4) into Eq. (3.2) and assuming the normal pressure diσ ′ due to soil
dilation is equal to the internal pressure , the peak normal pressure 1p .peakdi⋅′σ due to
soil dilation at the critical shear displacement is expressed by the following
max0
c.peakdi tanψσ
rGu
=′ ⋅ (3.5)
The critical shear displacement is normally small and could be assumed to be
constant along the soil nail. Experimental results (Juran 1985, Palmeira and Milligan
1989) have shown that the critical relative displacement is, in fact, particularly small (in
millimeters). The maximum dilation angle
cu
maxψ can be decided by the relative density
and the mean confining pressure DI p′ for triaxial strain problem (Bolton, 1986),
[ ]1)ln10(33max −′−== pII DRψ (3.6)
which is valid when the relative dilatancy index is in the range of . In
Eq. (3.6), has a unit of kN/m
RI 40 << RI
p′ 2. This empirical formula implies a limit value of
dilation angle 12º for triaxial strain as suggested by Bolton (1986). In the problem of
soil-nail interface, the confining pressure p′ represents the effect of overburden
pressure, i.e. it can be calculated as the average of effective vertical earth pressure vσ ′
and horizontal earth pressure vK σ ′0 . Therefore, the mean confining pressure
2)1( 0 vKp σ ′+=′ can be assumed consistent along the soil nail.
The mean normal stress bmσ ′ due to soil nail bending can be described as a hyperbolic
relation with the lateral deflection of the soil nail (positive is in the y direction), as
shown in Figure 3.3
yu
- 54 -
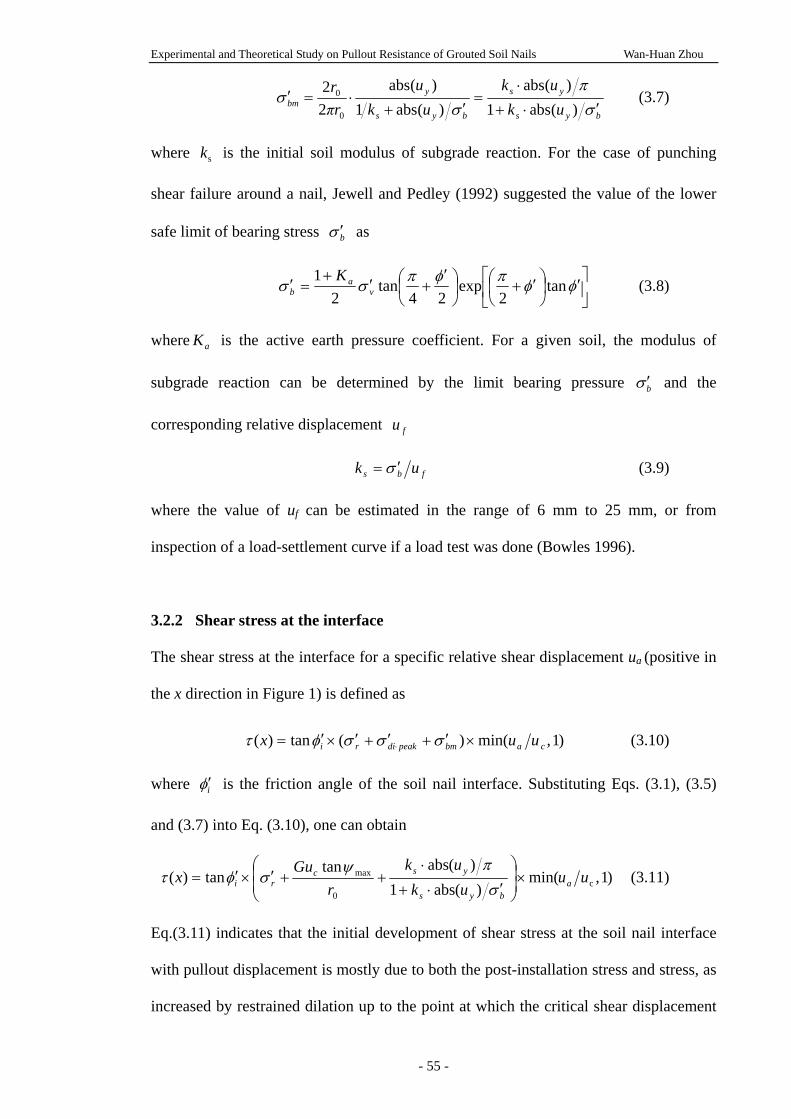
Experimental and Theoretical Study on Pullout Resistance of Grouted Soil Nails Wan-Huan Zhou
bys
ys
bys
ybm uk
ukuk
uπrr
σπ
σσ
′⋅+
⋅=
′+⋅=′
)(abs1)(abs
)(abs1)(abs
22
0
0 (3.7)
where is the initial soil modulus of subgrade reaction. For the case of punching
shear failure around a nail, Jewell and Pedley (1992) suggested the value of the lower
safe limit of bearing stress
sk
bσ ′ as
⎥⎦
⎤⎢⎣
⎡ ′⎟⎠⎞
⎜⎝⎛ ′+⎟
⎠⎞
⎜⎝⎛ ′
+′+=′ φφπφπσσ tan
2exp
24tan
21
va
bK
(3.8)
where is the active earth pressure coefficient. For a given soil, the modulus of
subgrade reaction can be determined by the limit bearing pressure
aK
bσ ′ and the
corresponding relative displacement fu
fbs uk σ ′= (3.9)
where the value of uf can be estimated in the range of 6 mm to 25 mm, or from
inspection of a load-settlement curve if a load test was done (Bowles 1996).
3.2.2 Shear stress at the interface
The shear stress at the interface for a specific relative shear displacement ua (positive in
the x direction in Figure 1) is defined as
)1 ,min()(tan)( cabmpeakdiri uux ×′+′+′×′= ⋅ σσσφτ (3.10)
where iφ′ is the friction angle of the soil nail interface. Substituting Eqs. (3.1), (3.5)
and (3.7) into Eq. (3.10), one can obtain
)1 ,min()(abs1
)(abstantan)( c
0
max uuuk
ukr
Gux a
bys
yscri ×⎟
⎟⎠
⎞⎜⎜⎝
⎛
′⋅+
⋅++′×′=
σπψ
σφτ (3.11)
Eq.(3.11) indicates that the initial development of shear stress at the soil nail interface
with pullout displacement is mostly due to both the post-installation stress and stress, as
increased by restrained dilation up to the point at which the critical shear displacement
- 55 -
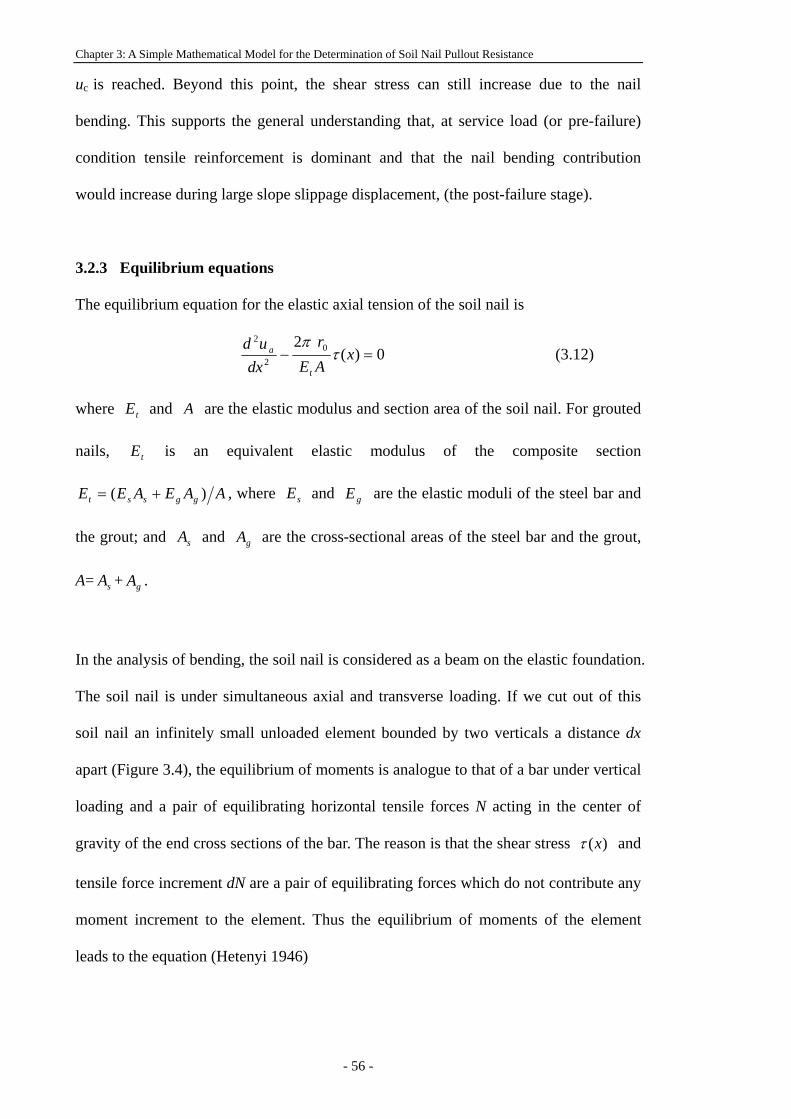
Chapter 3: A Simple Mathematical Model for the Determination of Soil Nail Pullout Resistance
uc is reached. Beyond this point, the shear stress can still increase due to the nail
bending. This supports the general understanding that, at service load (or pre-failure)
condition tensile reinforcement is dominant and that the nail bending contribution
would increase during large slope slippage displacement, (the post-failure stage).
3.2.3 Equilibrium equations
The equilibrium equation for the elastic axial tension of the soil nail is
0)(2 0
2
2
=− xAEr
dxud
t
a τπ
(3.12)
where and tE A are the elastic modulus and section area of the soil nail. For grouted
nails, is an equivalent elastic modulus of the composite section tE
AAEAEE ggsst )( += , where and are the elastic moduli of the steel bar and
the grout; and and are the cross-sectional areas of the steel bar and the grout,
A= + .
sE gE
sA gA
sA gA
In the analysis of bending, the soil nail is considered as a beam on the elastic foundation.
The soil nail is under simultaneous axial and transverse loading. If we cut out of this
soil nail an infinitely small unloaded element bounded by two verticals a distance dx
apart (Figure 3.4), the equilibrium of moments is analogue to that of a bar under vertical
loading and a pair of equilibrating horizontal tensile forces N acting in the center of
gravity of the end cross sections of the bar. The reason is that the shear stress )(xτ and
tensile force increment dN are a pair of equilibrating forces which do not contribute any
moment increment to the element. Thus the equilibrium of moments of the element
leads to the equation (Hetenyi 1946)
- 56 -
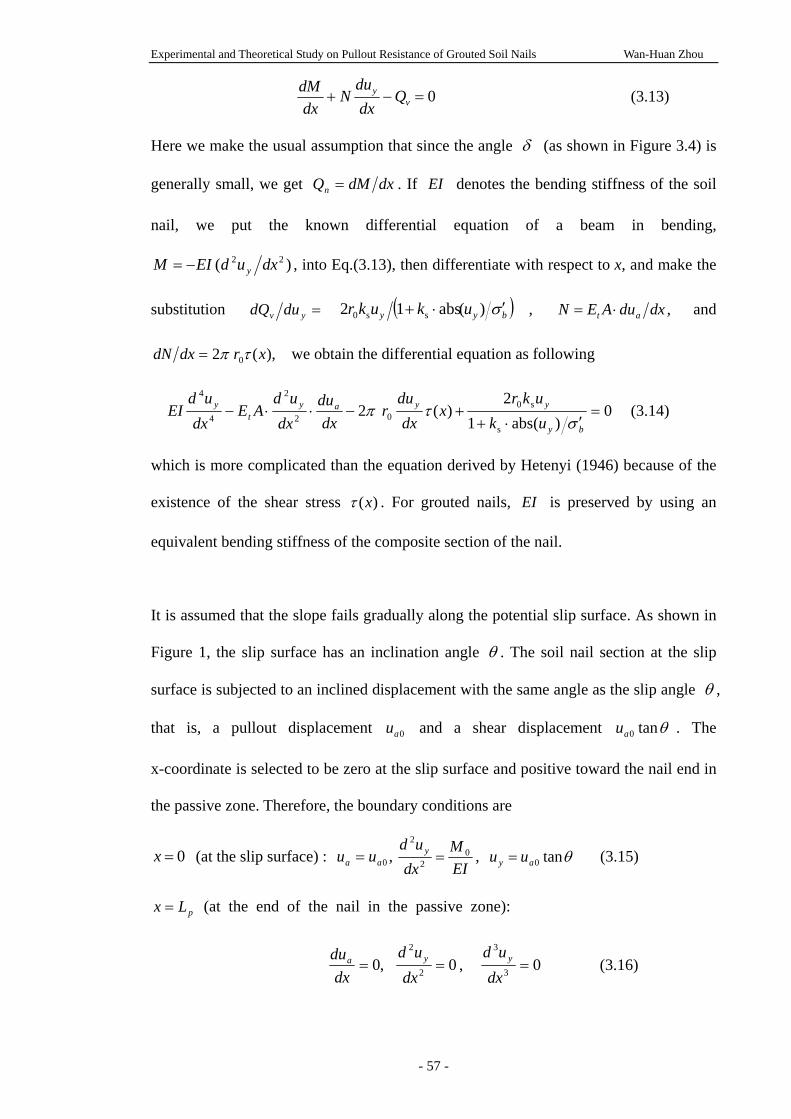
Experimental and Theoretical Study on Pullout Resistance of Grouted Soil Nails Wan-Huan Zhou
0=−+ vy Q
dxdu
Ndx
dM (3.13)
Here we make the usual assumption that since the angle δ (as shown in Figure 3.4) is
generally small, we get dxdMQn = . If EI denotes the bending stiffness of the soil
nail, we put the known differential equation of a beam in bending,
)( 22 dxudEIM y−= , into Eq.(3.13), then differentiate with respect to x, and make the
substitution =yv dudQ ( )byy ukukr σ′⋅+ )(abs12 ss0 , ,dxduAEN at ⋅= and
),( 2 0 xrdxdN τπ= we obtain the differential equation as following
0)(abs1
2)(2
s
s002
2
4
4
=′⋅+
+−⋅⋅−by
yyayt
y
ukukr
xdx
dur
dxdu
dxud
AEdx
udEI
στπ (3.14)
which is more complicated than the equation derived by Hetenyi (1946) because of the
existence of the shear stress )(xτ . For grouted nails, EI is preserved by using an
equivalent bending stiffness of the composite section of the nail.
It is assumed that the slope fails gradually along the potential slip surface. As shown in
Figure 1, the slip surface has an inclination angle θ . The soil nail section at the slip
surface is subjected to an inclined displacement with the same angle as the slip angle θ ,
that is, a pullout displacement and a shear displacement 0au θtan0au . The
x-coordinate is selected to be zero at the slip surface and positive toward the nail end in
the passive zone. Therefore, the boundary conditions are
0=x (at the slip surface) : ,0aa uu =EIM
dxud y 0
2
2
= , θtan0ay uu = (3.15)
pLx = (at the end of the nail in the passive zone):
,0=dx
dua 02
2
=dx
ud y , 03
3
=dx
ud y (3.16)
- 57 -
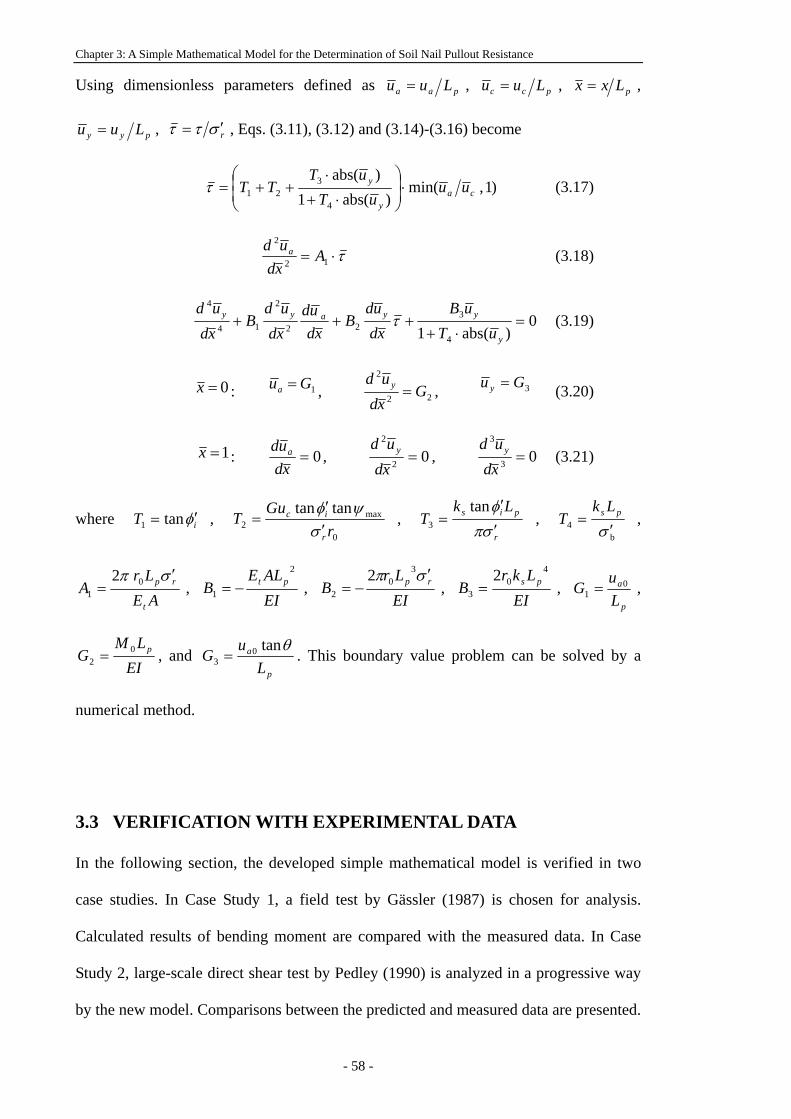
Chapter 3: A Simple Mathematical Model for the Determination of Soil Nail Pullout Resistance
Using dimensionless parameters defined as paa Luu = , pcc Luu = , pLxx = ,
pyy Luu = , rσττ ′= , Eqs. (3.11), (3.12) and (3.14)-(3.16) become
)1 , min()abs(1
)abs(
4
321 ca
y
y uuuT
uTTT ⋅⎟
⎟⎠
⎞⎜⎜⎝
⎛
⋅+
⋅++=τ (3.17)
τ⋅= 12
2
Axdud a (3.18)
0)(abs1 4
322
2
14
4
=⋅+
+++y
yyayy
uTuB
xdud
Bxd
udxdud
Bxdud
τ (3.19)
0=x : 1Gua = , 22
2
Gxdud y = , 3Gu y = (3.20)
1=x : 0=xdud a , 02
2
=xdud y , 03
3
=xdud y (3.21)
where iT φ′= tan1 , 0
max2
tantanr
GuT
r
ic
σψφ
′′
= , r
pis LkT
σπφ′
′=
tan3 ,
b4 σ ′= ps Lk
T ,
AELr
At
rpσπ ′= 0
1
2,
EIALE
B pt2
1 −= , EILr
B rp σπ ′−=
30
2
2,
EILkr
B ps4
03
2= ,
p
a
Lu
G 01 = ,
EILM
G p02 = , and
p
a
Lu
Gθtan0
3 = . This boundary value problem can be solved by a
numerical method.
3.3 VERIFICATION WITH EXPERIMENTAL DATA
In the following section, the developed simple mathematical model is verified in two
case studies. In Case Study 1, a field test by Gässler (1987) is chosen for analysis.
Calculated results of bending moment are compared with the measured data. In Case
Study 2, large-scale direct shear test by Pedley (1990) is analyzed in a progressive way
by the new model. Comparisons between the predicted and measured data are presented.
- 58 -
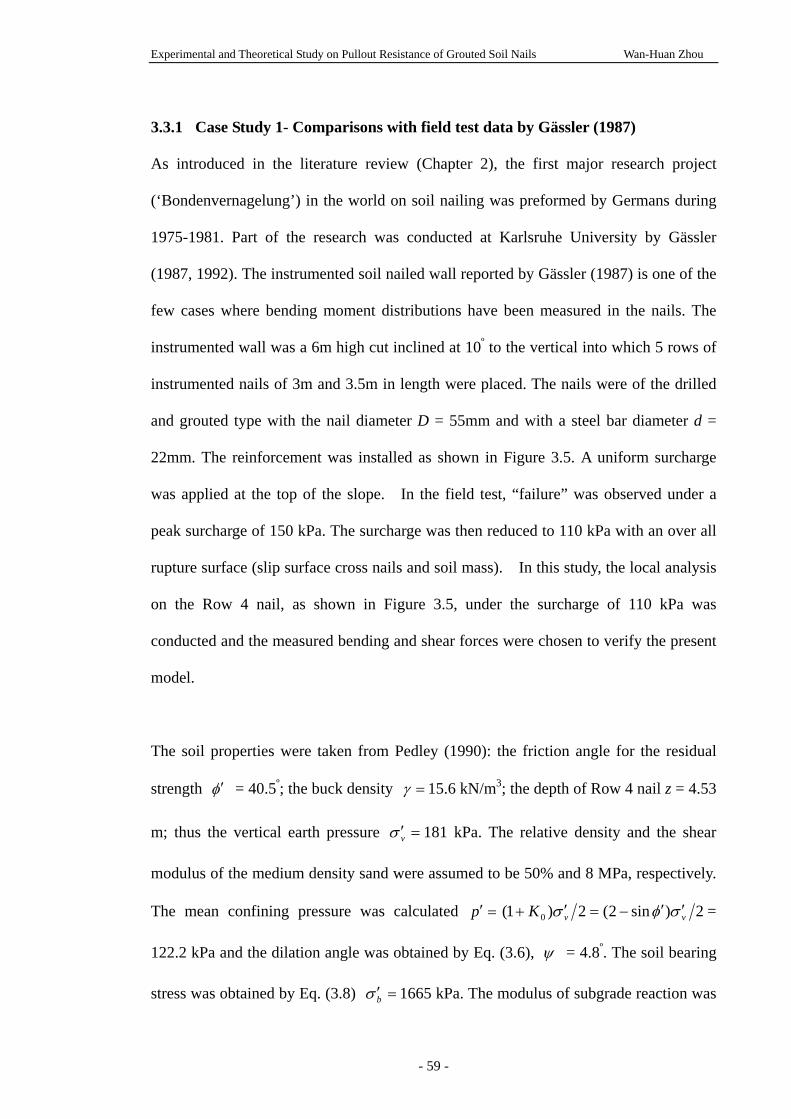
Experimental and Theoretical Study on Pullout Resistance of Grouted Soil Nails Wan-Huan Zhou
3.3.1 Case Study 1- Comparisons with field test data by Gässler (1987)
As introduced in the literature review (Chapter 2), the first major research project
(‘Bondenvernagelung’) in the world on soil nailing was preformed by Germans during
1975-1981. Part of the research was conducted at Karlsruhe University by Gässler
(1987, 1992). The instrumented soil nailed wall reported by Gässler (1987) is one of the
few cases where bending moment distributions have been measured in the nails. The
instrumented wall was a 6m high cut inclined at 10º to the vertical into which 5 rows of
instrumented nails of 3m and 3.5m in length were placed. The nails were of the drilled
and grouted type with the nail diameter D = 55mm and with a steel bar diameter d =
22mm. The reinforcement was installed as shown in Figure 3.5. A uniform surcharge
was applied at the top of the slope. In the field test, “failure” was observed under a
peak surcharge of 150 kPa. The surcharge was then reduced to 110 kPa with an over all
rupture surface (slip surface cross nails and soil mass). In this study, the local analysis
on the Row 4 nail, as shown in Figure 3.5, under the surcharge of 110 kPa was
conducted and the measured bending and shear forces were chosen to verify the present
model.
The soil properties were taken from Pedley (1990): the friction angle for the residual
strength φ′ = 40.5º; the buck density =γ 15.6 kN/m3; the depth of Row 4 nail z = 4.53
m; thus the vertical earth pressure =′vσ 181 kPa. The relative density and the shear
modulus of the medium density sand were assumed to be 50% and 8 MPa, respectively.
The mean confining pressure was calculated =′p 2)sin2(2)1( 0 vvK σφσ ′′−=′+ =
122.2 kPa and the dilation angle was obtained by Eq. (3.6), ψ = 4.8º. The soil bearing
stress was obtained by Eq. (3.8) =′bσ 1665 kPa. The modulus of subgrade reaction was
- 59 -
Chapter 3: A Simple Mathematical Model for the Determination of Soil Nail Pullout Resistance
determined by Eq.(3.9) with uf of 25 mm, ks = 66.7 MN/m3, and the value was within
the reasonable range for the medium dense sand according to the guide table listed in
Bowles (1996). The friction angle of the soil nail interface iφ′ was assumed equal to
the soil friction angle φ′ . Luo et al. (2000) claimed the critical shear displacement
did not depend on the soil relative density. The was assumed to be 2mm in this
study. For the grouted soil nail it was assumed the post-installation pressure at the
soil-nail interface was relatively small,
cu
cu
=′rσ 5 kPa.
The length of the soil nail in the passive zone is observed from experimental results
(Figure 3.5) as 1.2 m. The elastic moduli of the steel bar and cement grout were
assumed to be 200 GPa and 25 GPa, respectively. Thus the equivalent elastic modulus
Et and the equivalent bending stiffness EI of the grouted soil nail were estimated to be
53.0 GPa and 13.2 kN·m2, respectively. The boundary conditions at 0=x were taken
from experimental data (Pedley 1990): 0 kNm for bending moment and the slippage
happened along the direction of 37º from the vertical, i.e. θ = 53º. The experiment data
(Figure 3.5) showed that the bending moments in the soil nails were quite small (less
than 0.2 kNm), while the slippage displacement of the soil was reported around 40mm
(Jewell 1990). This implied that at the post-failure stage the soil nails had moved
vertically with the surrounding soil. Therefore, the relative punching displacement uy in
Eq.(3.7) should be re-examined by back analysis. It was finally assigned as 0.71mm in
calculation to match the experimental data.
The calculated results of bending moment using the present model are shown together
with the observed data from Pedley (1990) in Figure 3.6. The predicted curves agree
well with the reported data. Figure 3.7 shows the shear stress distribution along the soil
- 60 -
Experimental and Theoretical Study on Pullout Resistance of Grouted Soil Nails Wan-Huan Zhou
nail. It can be seen that the calculated shear stresses on the nail surface are distributed
unevenly along the soil nail. Since this present model divides the normal stresses around
the soil nail into three parts: post-installation stress, stress due to soil dilation and stress
due to soil nail bending, the contributions of the three normal stresses to the soil nail
pullout resistance can be evaluated. Figures 3.8 and 3.9 indicate that the constrained soil
dilation contributes most to the soil nail pullout resistance, while the bending of the soil
nail is of secondary importance in the mechanism of soil nail pullout force. Although
the bending behaviour of the soil nail increases the pullout force at the large pullout
displacement, its contribution is still as low as around 10% of the total pullout force.
3.3.2 Case Study 2 - Comparisons with large-scale direct shear test data by Pedley
(1990)
Pedley (1990) carried out a study of the soil-reinforcement interaction with a series of
large scale shear box tests. The direct shear test apparatus consisted of a rigid steel cubic
box of internal size 1m×1m×1m, split at mid-height. The boundary conditions
maintained symmetry about the central plane so that shearing took place along the
horizontal central plane.
The soil used was quartz Leighton Buzzard sands. The dilation angle was observed in
the un-reinforced direct shear tests (Pedley 1990) maxψ = 12.8º. The steel bars used were
920 mm long with two diameters, d = 15.9 mm and d = 25.4 mm. Each bar was placed
in the soil in the shear box at inclination angles of 0º, 15º or 25º from the vertical
direction, respectively. Only half length of the steel bar was analyzed because the newly
designed model is for use in describing the nail in the passive zone. The ultimate shear
displacement was 60 mm, half of which was the displacement in the direction of slip
surface, and according to the inclination angle, the steel bar was axially pulled 7.8 mm
- 61 -
Chapter 3: A Simple Mathematical Model for the Determination of Soil Nail Pullout Resistance
at the end of the test. The shear modulus of the soil was assumed as 4 MPa by back
analysis, considering the dimension effect of the reinforced steel bar. The critical shear
displacement uc was assumed to be 1mm. The modulus of subgrade reaction value was
determined by back analysis from Eq.(3.9), ks = 220 MN/m3, with bσ ′ of 2200 kPa and
uf of 10mm. Other parameters used in the calculation were those of Pedley (1990) and
are summarized in Table 3.1.
As introduced in Section 3.2 the new model is capable of analyzing the soil-nail
interaction in a progressive manner. The results of bending moment and shear force
along the steel bar (d =25.4 mm and θ =15º ) at the shear displacement of 20mm and
60mm are shown in Figures 3.10(a & b), together with the experimental data from
Pedley (1990). It should be noted that the shear force profiles in the experiments were
obtained by differentiating the bending moment profiles by Pedley (1990).
Correspondingly, the new model shows better predictions in bending moments than for
those in shear forces. It can be seen that this simple model can be used to obtain
results at different shearing stages and the calculated results are in good agreements
with the experimental data.
It should be noted that some researchers argue that the direct shear tests could not
represent the behaviour of the reinforcement in the slope (Sawicki 2000). One of the
reasons is that the reinforcement in shear box fails in bending and shearing rather than
tension. However, since the present model considers the bending and tension behaviour
altogether, it is suitable for analyzing both the local failure of a soil-nailed wall and the
direct shear tests with reinforcement. Figures 3.11 and 3.12 show the contributions of
the three normal stresses on the pullout resistance of the steel bar. It can be seen that
the contributions of bending are significant in this case, about 20% to 80% of the total
- 62 -
Experimental and Theoretical Study on Pullout Resistance of Grouted Soil Nails Wan-Huan Zhou
pullout resistance, during the shear tests.
It can be clearly seen that the contribution of bending moments in the shear box
apparatus (Case Study 2) is larger than that in the large-scale field test (Case Study 1).
This is due to the different failure mechanisms between the reinforced wall and the
direct shear tests with reinforcement. In the soil-nailed wall, the soil nail fails in tension
with small bending moments motivated, while in the direct shear tests, the steel bar fails
in large shearing forces and bending moments. On the other hand, from the distribution
of the bending moment, it can be observed that the effect of bending on the normal
pressure along the soil nail length is within a limit range. After a certain distance away
from the failure point, the bending would have minimal contribution to the shear
resistance of the soil/nail interface. In the shear box apparatus, as the nail length is
relatively too small to generate a large axial force, the nail bending makes a larger
contribution to the shear resistance of the soil-nail interface. Therefore, comparing the
results of the two case studies, it can be seen that the relative contributions of the three
normal stresses depend on the geometry characteristics, the bending stiffness of the
reinforcement, the soil properties and the failure mechanism of the reinforced structure.
3.4 PARAMETRIC STUDY
As described in the above section the contribution of the bending moment to the soil
nail pull out resistance can be calculated by the newly developed simple model. A
parametric study was carried out to study the effects of the soil nail bending stiffness
and the soil modulus of the subgrade reaction on the soil nail pullout behaviour.
A typical case, namely a grouted soil nail, 100mm in diameter and 2m in passive length
- 63 -
Chapter 3: A Simple Mathematical Model for the Determination of Soil Nail Pullout Resistance
was chosen. Material parameters used for the parametric studies are shown in Table 3.2.
For convenience, it was assumed that the soil nail interface parameters were the same as
those of the surrounding soil.
Figures 3.13 shows the influences of soil modulus of subgrade reaction on the soil nail
pullout behaviour. Three values of soil subgrade reaction modulus (1MPa/m, 10 MPa/m
and 100 MPa/m) were chosen in the calculations in Figure 3.13. The distributions of the
bending moments, shear forces, shear stresses along the soil nail, and pullout force vs.
pullout displacement are plotted in Figure 3.13(a, b, c & d), respectively. The influence
of soil nail bending stiffness is shown in Figure 3.14.
It can be seen in Figure 3.13 and Figure 3.14 that the stronger the soil or the higher the
soil nail bending stiffness, the larger the bending moment, shear force, and the pullout
resistance. After the shear displacement exceeds the limit value, the pull out resistance
keeps on increasing with the increase of the sliding displacement, due, mostly, to the
soil nail lateral interaction effect with the surrounding soil.
Figure 3.15 shows the variation of soil nail pullout resistance with the soil nail bending
stiffness. It can be seen that the soil nail pullout resistance increases with the soil nail
bending stiffness and it has a limit value when soil nail bending stiffness approaches to
infinity in the soil nail reinforcement working system. In this study case, when the soil
nail bending stiffness is larger than 350 kNm, the pullout resistance hardly increases
with the soil nail bending stiffness.
- 64 -
Experimental and Theoretical Study on Pullout Resistance of Grouted Soil Nails Wan-Huan Zhou
3.5 SUMMARY AND CONCLUSIONS
A simple mathematical model for analyzing the interaction between a soil nail and the
surrounding soil has been developed and is presented in this chapter. This model
considers the nail-soil interface dilation, non-linear soil subgrade reaction, and the soil
nail bending. The soil nail pullout failure can be simulated in a progressive failure way
using the present model. The main summary and conclusions are outlined below:
Two case studies have been carried out for model verification. In Case Study 1,
the field test by Gässler (1987) has been chosen for analysis. In Case Study 2, the
large direct shear test conducted by Pedley (1990) has been analyzed, using the
newly developed model. The calculated results of these tests are compared with
the reported experimental data in the two tests. Good agreements are found in the
comparisons. The model is found to be suitable for modelling both the local
failure of soil-nailed walls and direct shear tests with reinforcement.
The analyses of the two tests in case studies show that the contribution of bending
moments to the pullout resistance in the shear box apparatus (Case Study 2) is
larger than that in the large-scale field test (Case Study 1). In the reinforced
slope/wall, the contribution of the soil nail bending to the pullout resistance is of
secondary importance as the tension failure is dominant in the soil-nailed
structures.
Parametric study has been carried out based on the new simple model. The
influences of modulus of soil subgrade reaction and soil nail bending stiffness on
the magnitude and distribution of the bending moments, shear forces, shear
stresses along the soil nail, and the pullout resistances have been investigated.
The study indicates that the soil nail pullout resistance increases to a limit value
as the soil nail bending stiffness approaches to infinity.
- 65 -
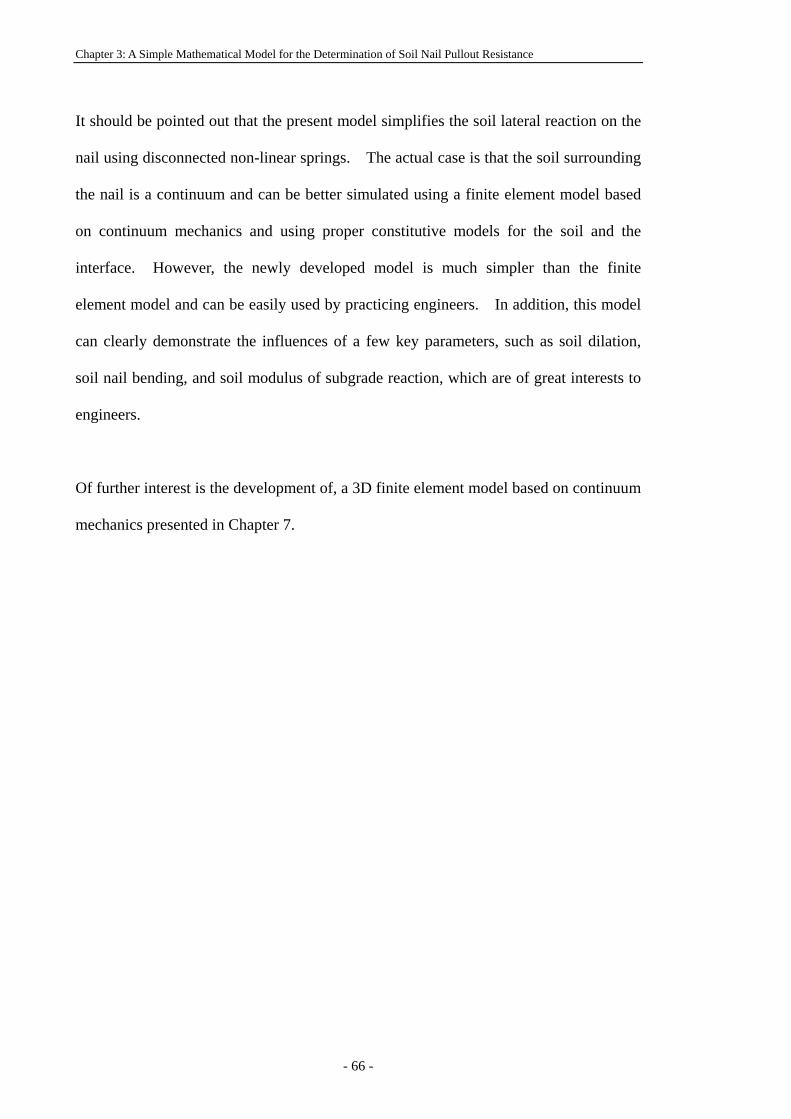
Chapter 3: A Simple Mathematical Model for the Determination of Soil Nail Pullout Resistance
It should be pointed out that the present model simplifies the soil lateral reaction on the
nail using disconnected non-linear springs. The actual case is that the soil surrounding
the nail is a continuum and can be better simulated using a finite element model based
on continuum mechanics and using proper constitutive models for the soil and the
interface. However, the newly developed model is much simpler than the finite
element model and can be easily used by practicing engineers. In addition, this model
can clearly demonstrate the influences of a few key parameters, such as soil dilation,
soil nail bending, and soil modulus of subgrade reaction, which are of great interests to
engineers.
Of further interest is the development of, a 3D finite element model based on continuum
mechanics presented in Chapter 7.
- 66 -
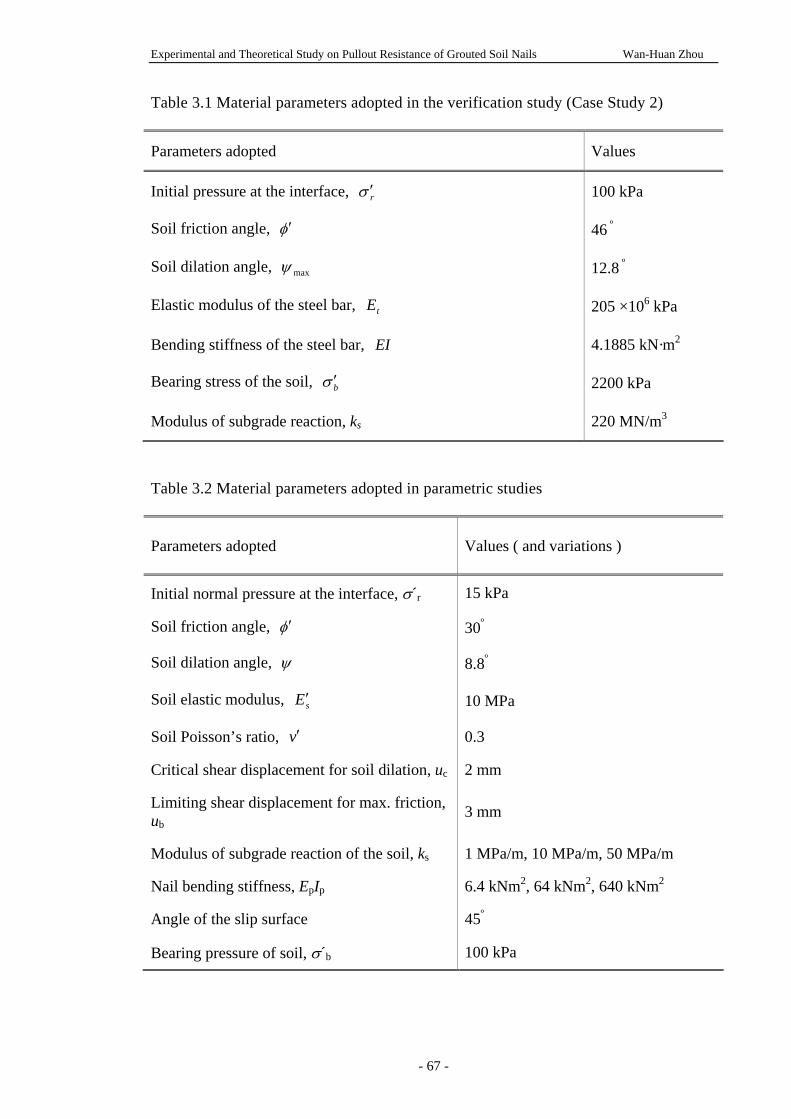
Experimental and Theoretical Study on Pullout Resistance of Grouted Soil Nails Wan-Huan Zhou
Table 3.1 Material parameters adopted in the verification study (Case Study 2)
Parameters adopted Values
Initial pressure at the interface, rσ ′ 100 kPa
Soil friction angle, φ′ 46 º
Soil dilation angle, maxψ 12.8 º
Elastic modulus of the steel bar, tE 205 ×106 kPa
Bending stiffness of the steel bar, EI 4.1885 kN·m2
Bearing stress of the soil, bσ ′ 2200 kPa
Modulus of subgrade reaction, ks 220 MN/m3
Table 3.2 Material parameters adopted in parametric studies
Parameters adopted Values ( and variations )
Initial normal pressure at the interface, σ´r 15 kPa
Soil friction angle, φ′ 30º
Soil dilation angle, ψ 8.8º
Soil elastic modulus, sE ′ 10 MPa
Soil Poisson’s ratio, v′ 0.3
Critical shear displacement for soil dilation, uc 2 mm
Limiting shear displacement for max. friction, ub 3 mm
Modulus of subgrade reaction of the soil, ks 1 MPa/m, 10 MPa/m, 50 MPa/m
Nail bending stiffness, EpIp 6.4 kNm2, 64 kNm2, 640 kNm2
Angle of the slip surface 45º
Bearing pressure of soil, σ´b 100 kPa
- 67 -
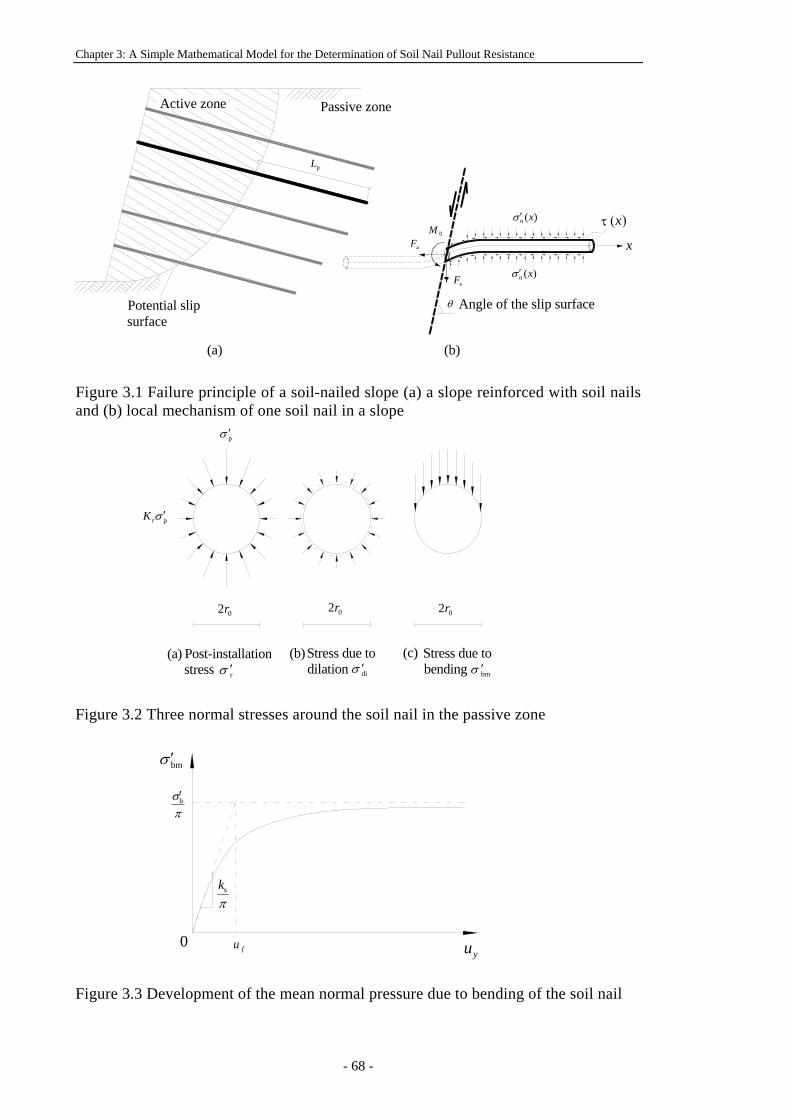
Chapter 3: A Simple Mathematical Model for the Determination of Soil Nail Pullout Resistance
x
τ (x)
Potential slip surface
Passive zoneActive zone
Angle of the slip surfacesF
aF0M
)(n xσ ′
)(n xσ ′
θ
(a) (b)
pL
Figure 3.1 Failure principle of a soil-nailed slope (a) a slope reinforced with soil nails and (b) local mechanism of one soil nail in a slope
(c)(b)(a) Post-installation stress
Stress due to dilation
Stress due to bending
pσ ′
02r 02r 02r
pσ ′rK
rσ ′ diσ ′ bmσ ′
Figure 3.2 Three normal stresses around the soil nail in the passive zone
bmσ ′
πσb′
yu
πsk
0fu
Figure 3.3 Development of the mean normal pressure due to bending of the soil nail
- 68 -
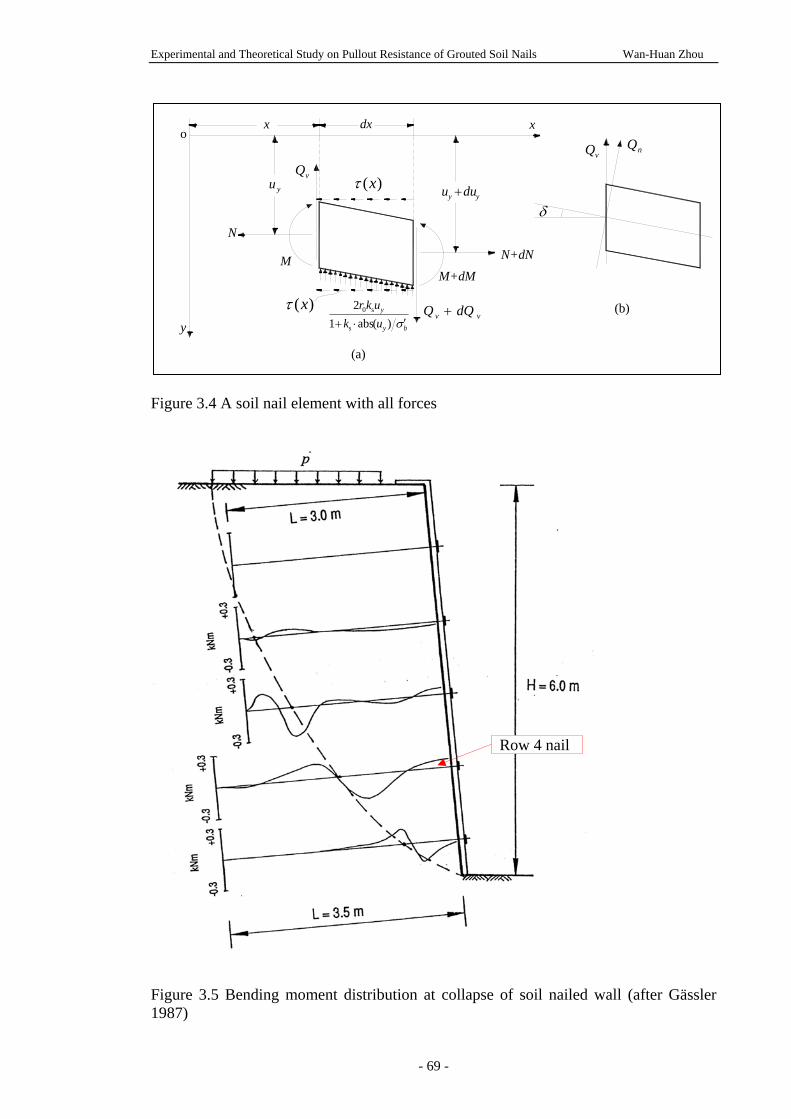
Experimental and Theoretical Study on Pullout Resistance of Grouted Soil Nails Wan-Huan Zhou
N+dN
M+dMM
N
y
oxdxx
by
y
ukukr
σ′⋅+ )(abs12
s
s0)(xτ
)(xτyuyy duu +
vv dQQ +
vQvQ nQ
(a)
(b)
δ
Figure 3.4 A soil nail element with all forces
Row 4 nail
Figure 3.5 Bending moment distribution at collapse of soil nailed wall (after Gässler 1987)
- 69 -
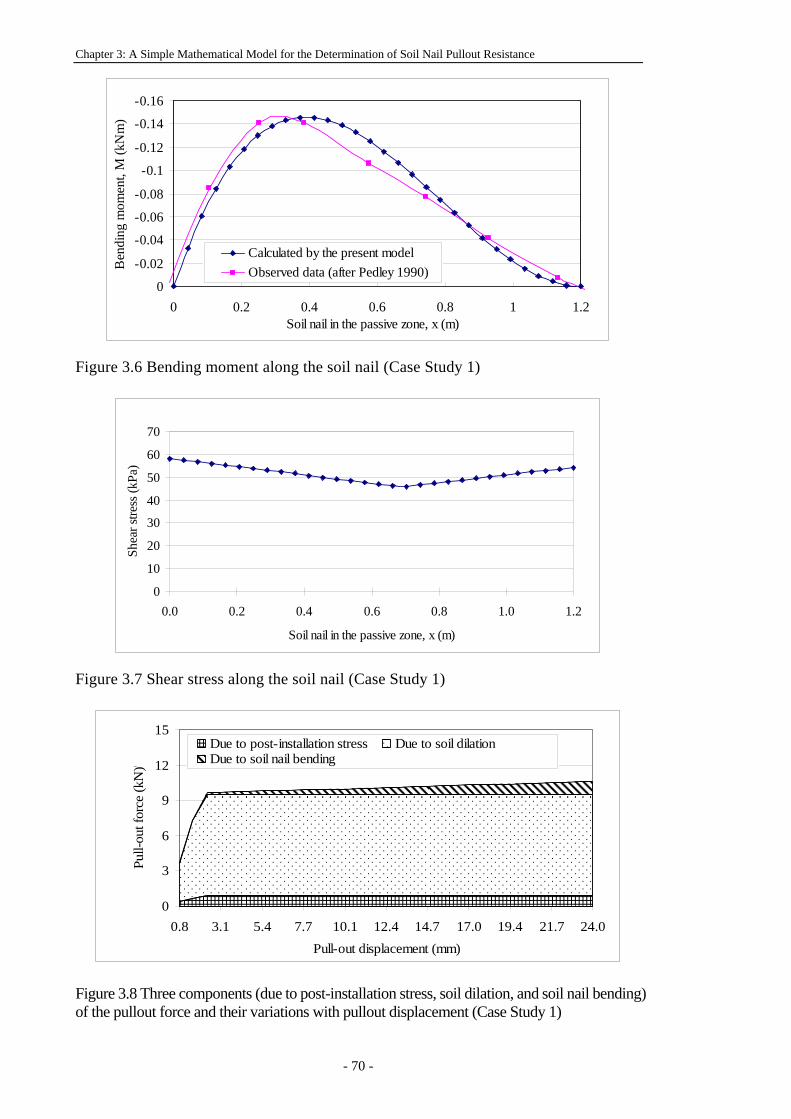
Chapter 3: A Simple Mathematical Model for the Determination of Soil Nail Pullout Resistance
-0.16
-0.14
-0.12
-0.1
-0.08
-0.06
-0.04
-0.02
00 0.2 0.4 0.6 0.8 1 1.2
Soil nail in the passive zone, x (m)
Ben
ding
mom
ent,
M (k
Nm
)
Calculated by the present modelObserved data (after Pedley 1990)
Figure 3.6 Bending moment along the soil nail (Case Study 1)
0
10
20
30
40
50
60
70
0.0 0.2 0.4 0.6 0.8 1.0 1.2
Soil nail in the passive zone, x (m)
Shea
r stre
ss (k
Pa)
Figure 3.7 Shear stress along the soil nail (Case Study 1)
0
3
6
9
12
15
0.8 3.1 5.4 7.7 10.1 12.4 14.7 17.0 19.4 21.7 24.0Pull-out displacement (mm)
Pull-
out f
orce
(kN
)'
Due to post-installation stress Due to soil dilationDue to soil nail bending
Figure 3.8 Three components (due to post-installation stress, soil dilation, and soil nail bending) of the pullout force and their variations with pullout displacement (Case Study 1)
- 70 -
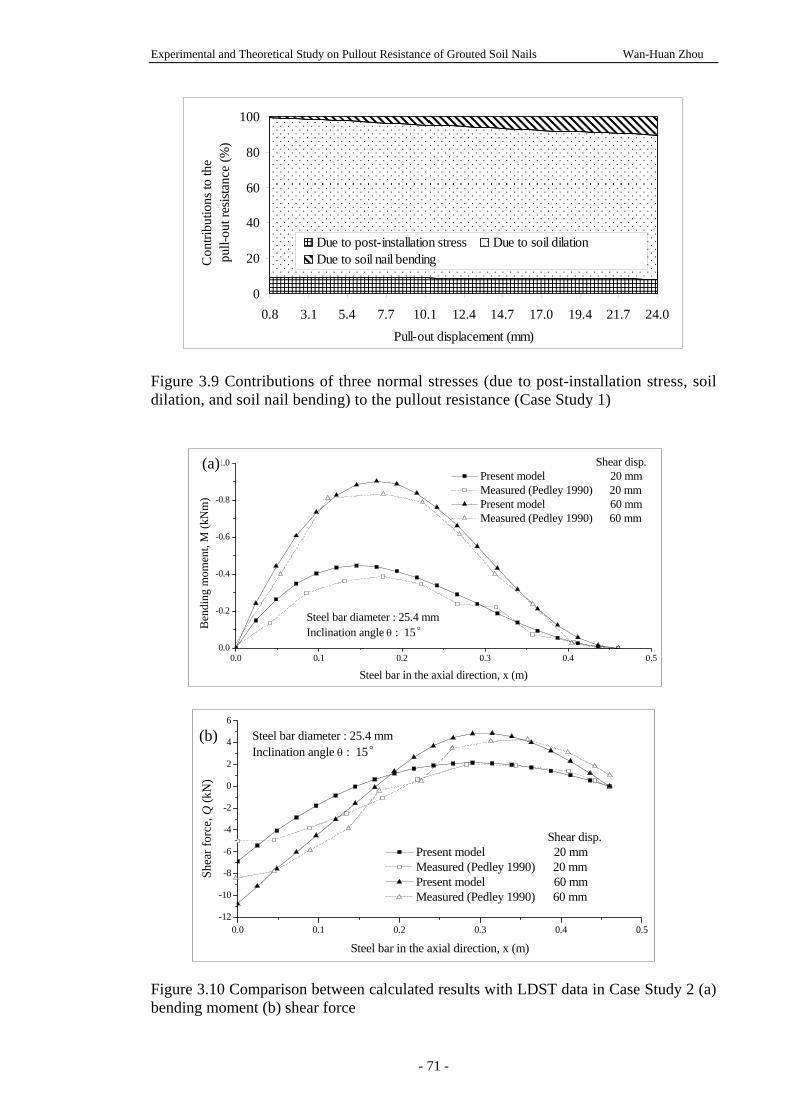
Experimental and Theoretical Study on Pullout Resistance of Grouted Soil Nails Wan-Huan Zhou
0
20
40
60
80
100
0.8 3.1 5.4 7.7 10.1 12.4 14.7 17.0 19.4 21.7 24.0Pull-out displacement (mm)
Con
tribu
tions
to th
e
pu
ll-ou
t res
istan
ce (%
) Due to post-installation stress Due to soil dilationDue to soil nail bending
Figure 3.9 Contributions of three normal stresses (due to post-installation stress, soil dilation, and soil nail bending) to the pullout resistance (Case Study 1)
Figure 3.10 Comparison between calculated results with LDST data in Case Study 2 (a) bending moment (b) shear force
0.0 0.1 0.2 0.3 0.4 0.50.0
-0.2
-0.4
-0.6
-0.8
-1.0 Shear disp. Present model 20 mm Measured (Pedley 1990) 20 mm Present model 60 mm Measured (Pedley 1990) 60 mm
Ben
ding
mom
ent,
M (k
Nm
)
Steel bar in the axial direction, x (m)
Steel bar diameter : 25.4 mmInclination angle θ : 15°
(a)
0.0 0.1 0.2 0.3 0.4 0.5-12
-10
-8
-6
-4
-2
0
2
4
6
Steel bar diameter : 25.4 mmInclination angle θ : 15°
Shea
r for
ce, Q
(kN
)
Steel bar in the axial direction, x (m)
Shear disp. Present model 20 mm Measured (Pedley 1990) 20 mm Present model 60 mm Measured (Pedley 1990) 60 mm
(b)
- 71 -
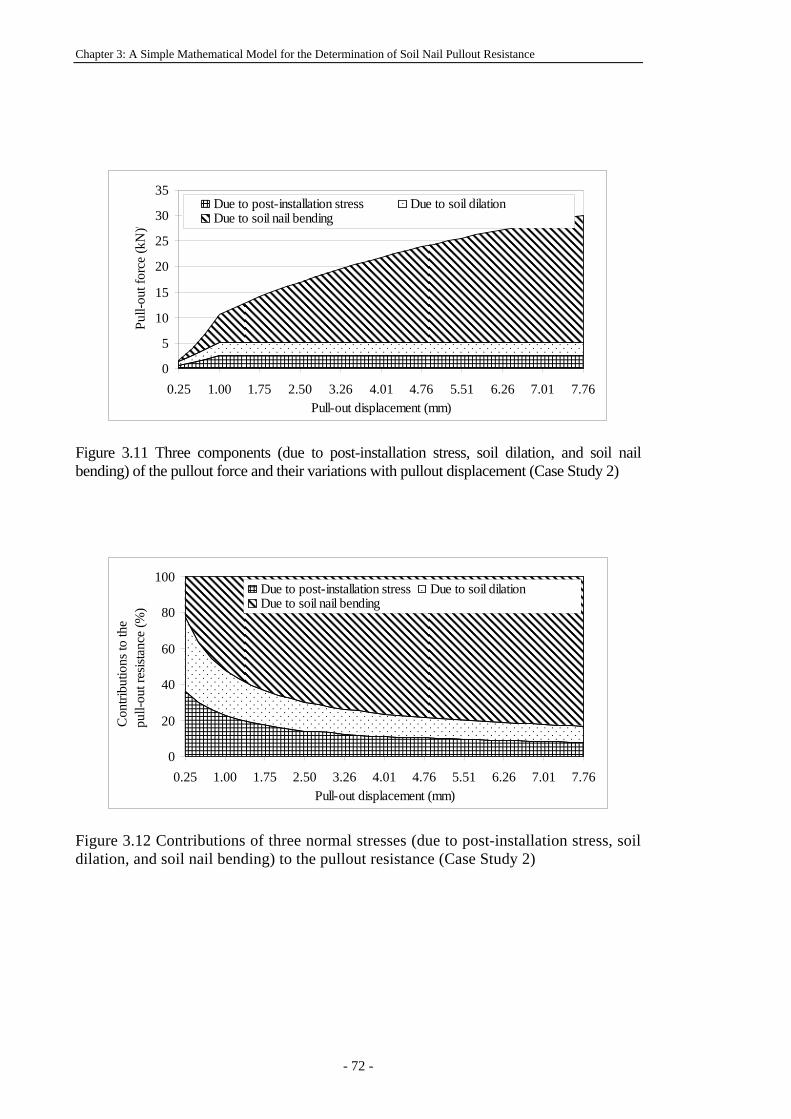
Chapter 3: A Simple Mathematical Model for the Determination of Soil Nail Pullout Resistance
0
5
10
15
20
25
30
35
0.25 1.00 1.75 2.50 3.26 4.01 4.76 5.51 6.26 7.01 7.76Pull-out displacement (mm)
Pull-
out f
orce
(kN
)'
Due to post-installation stress Due to soil dilationDue to soil nail bending
Figure 3.11 Three components (due to post-installation stress, soil dilation, and soil nail bending) of the pullout force and their variations with pullout displacement (Case Study 2)
0
20
40
60
80
100
0.25 1.00 1.75 2.50 3.26 4.01 4.76 5.51 6.26 7.01 7.76Pull-out displacement (mm)
Con
tribu
tions
to th
e
pu
ll-ou
t res
istan
ce (%
) ,
Due to post-installation stress Due to soil dilationDue to soil nail bending
Figure 3.12 Contributions of three normal stresses (due to post-installation stress, soil dilation, and soil nail bending) to the pullout resistance (Case Study 2)
- 72 -
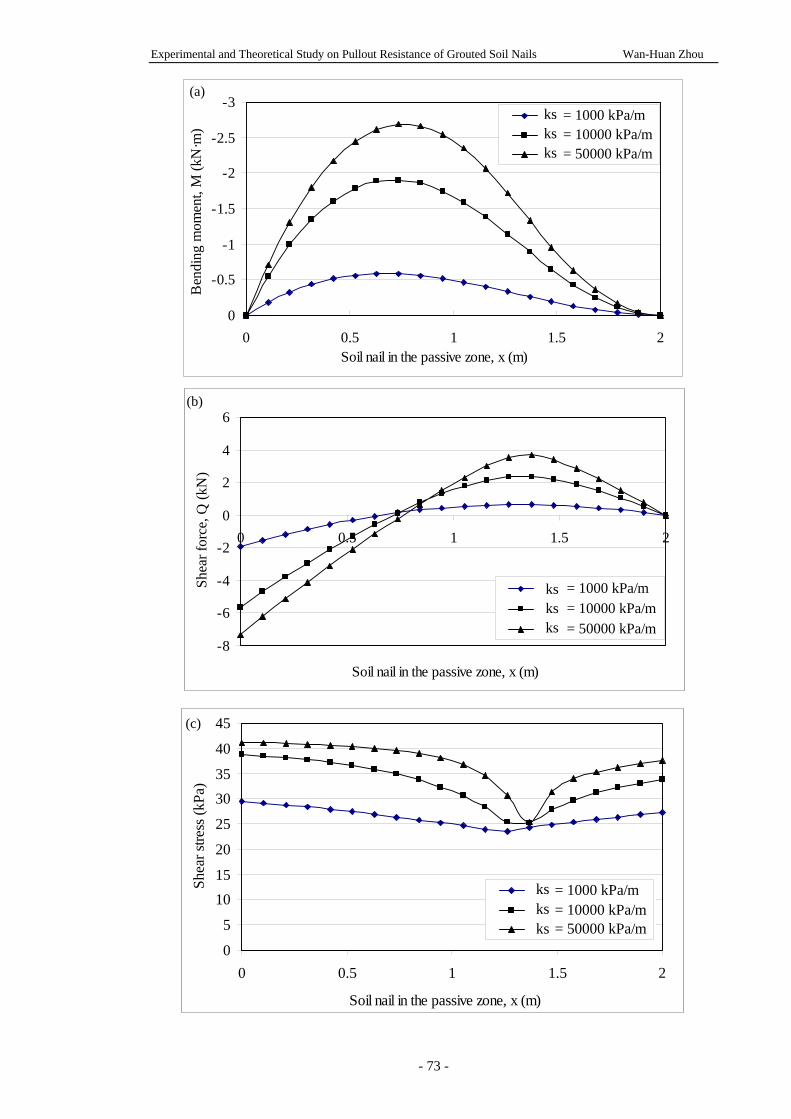
Experimental and Theoretical Study on Pullout Resistance of Grouted Soil Nails Wan-Huan Zhou
-3
-2.5
-2
-1.5
-1
-0.5
00 0.5 1 1.5 2
Soil nail in the passive zone, x (m)
Ben
ding
mom
ent,
M (k
N·m
) = 1000 kPa/m
= 10000 kPa/m = 50000 kPa/m
ksksks
(a)
-8
-6
-4
-2
0
2
4
6
0 0.5 1 1.5 2
Soil nail in the passive zone, x (m)
Shea
r for
ce, Q
(kN
)
= 1000 kPa/m = 10000 kPa/m = 50000 kPa/m
ksksks
(b)
0
5
1015
20
25
3035
40
45
0 0.5 1 1.5
Soil nail in the passive zone, x (m)
Shea
r stre
ss (k
Pa)
2
= 1000 kPa/m = 10000 kPa/m = 50000 kPa/m
ksksks
(c)
- 73 -
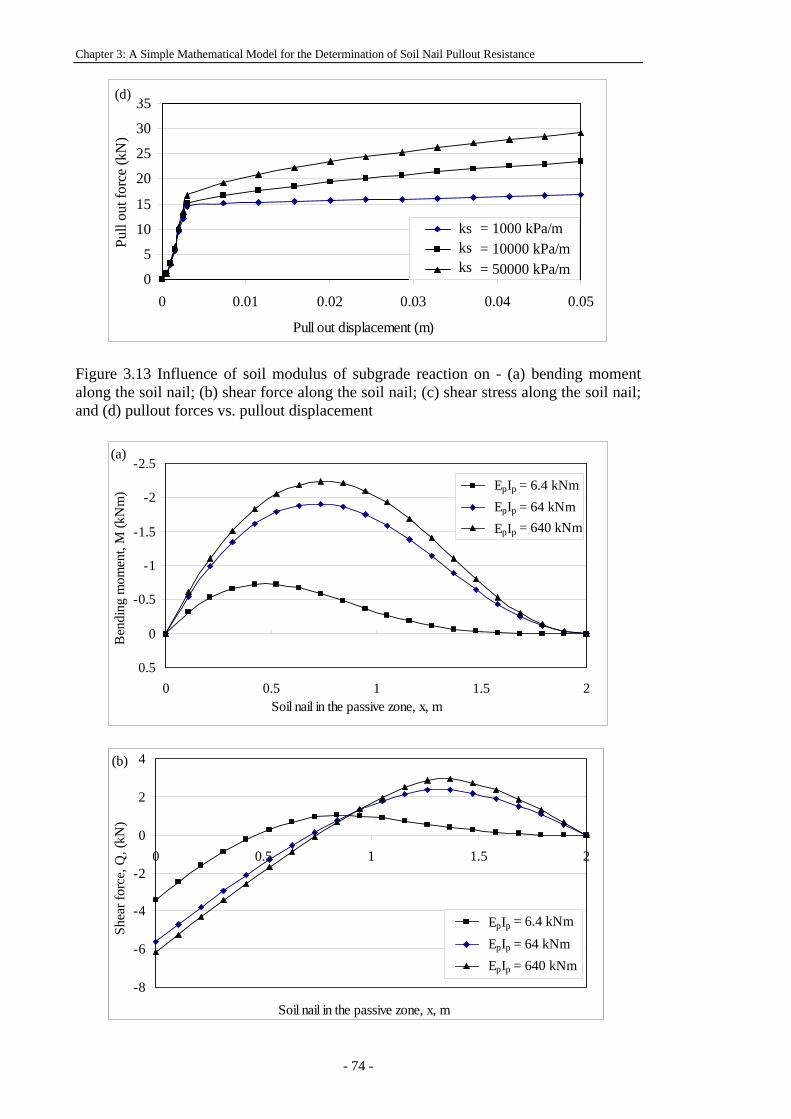
Chapter 3: A Simple Mathematical Model for the Determination of Soil Nail Pullout Resistance
0
5
10
15
20
25
30
35
0 0.01 0.02 0.03 0.04 0.05
Pull out displacement (m)
Pull
out f
orce
(kN
) ,
= 1000 kPa/m = 10000 kPa/m = 50000 kPa/m
(d)
ksksks
Figure 3.13 Influence of soil modulus of subgrade reaction on - (a) bending moment along the soil nail; (b) shear force along the soil nail; (c) shear stress along the soil nail; and (d) pullout forces vs. pullout displacement
-2.5
-2
-1.5
-1
-0.5
0
0.50 0.5 1 1.5
Soil nail in the passive zone, x, m
Ben
ding
mom
ent,
M (k
Nm
)
2
= 6.4 kNm = 64 kNm = 640 kNm
EpIp
EpIp
EpIp
(a)
(b)
-8
-6
-4
-2
0
2
4
0 0.5 1 1.5 2
Soil nail in the passive zone, x, m
Shea
r for
ce, Q
, (kN
) ,
= 6.4 kNm = 64 kNm = 640 kNm
EpIp
EpIp
EpIp
(b)
- 74 -
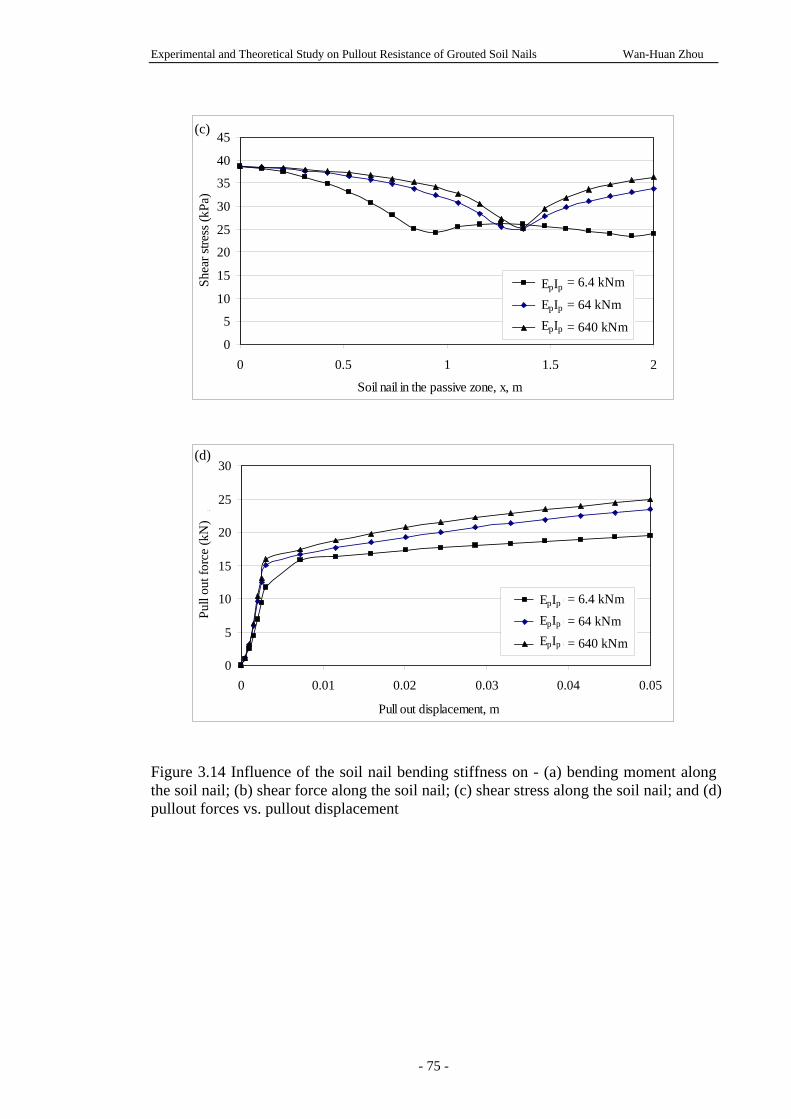
Experimental and Theoretical Study on Pullout Resistance of Grouted Soil Nails Wan-Huan Zhou
0
5
10
15
20
25
30
35
40
45
0 0.5 1 1.5
Soil nail in the passive zone, x, m
Shea
r stre
ss (k
Pa)
2
EpIp = 6.4 kNm
EpIp = 64 kNm
EpIp = 640 kNm
EpIp
EpIp
EpIp
(c)
0
5
10
15
20
25
30
0 0.01 0.02 0.03 0.04 0.05
Pull out displacement, m
Pull
out f
orce
(kN
) ,
EpIp = 6.4 kNm
EpIp = 64 kNm
EpIp = 640 kNm
EpIp
EpIp
EpIp
(d)
Figure 3.14 Influence of the soil nail bending stiffness on - (a) bending moment along the soil nail; (b) shear force along the soil nail; (c) shear stress along the soil nail; and (d) pullout forces vs. pullout displacement
- 75 -
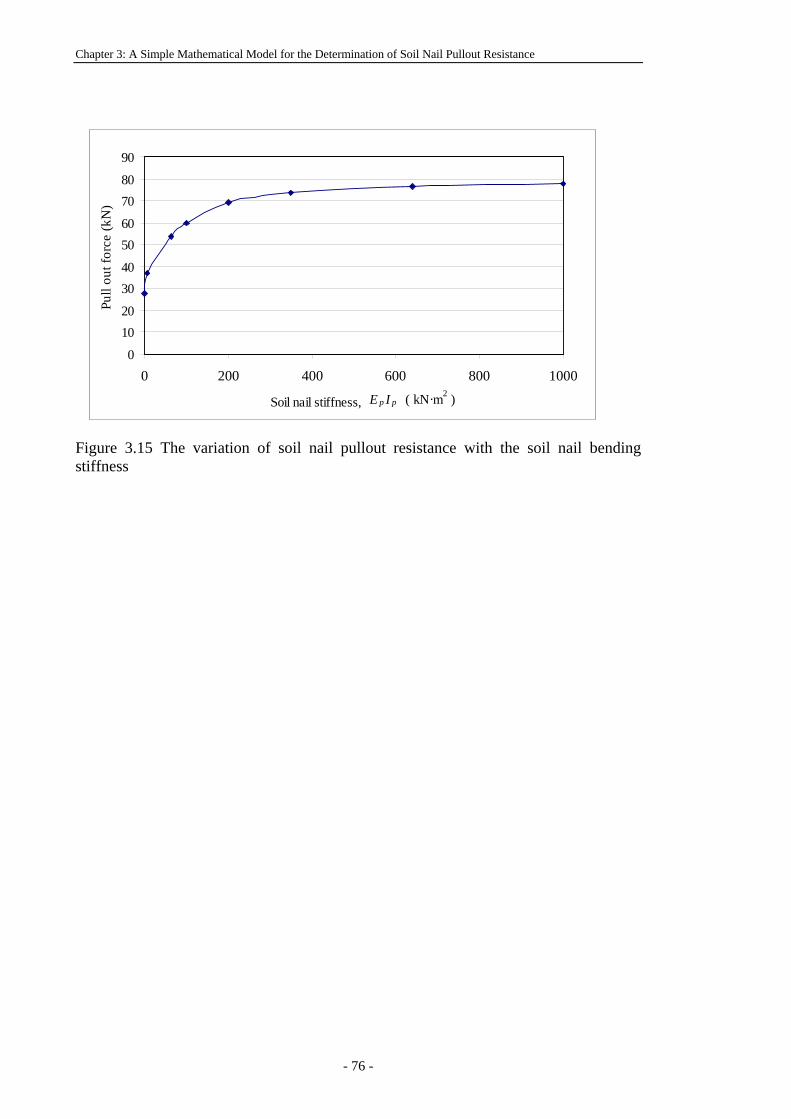
Chapter 3: A Simple Mathematical Model for the Determination of Soil Nail Pullout Resistance
0
1020
3040
5060
7080
90
0 200 400 600 800 1000
Soil nail stiffness,
Pull
out f
orce
(kN
)
E p I p ( kN·m2 )
Figure 3.15 The variation of soil nail pullout resistance with the soil nail bending stiffness
- 76 -
Experimental and Theoretical Study on Pullout Resistance of Grouted Soil Nails Wan-Huan Zhou
- 77 -
Chapter 4:
TEST SETUP, MATERIALS AND PROCEDURES
4.1 INTRODUCTION
Soil nail pullout resistance is an important parameter in the design of soil nails for slope
stabilization. The possibility of achieving an optimal design would be improved, if the
pullout resistance could be more accurately predicted. Nowadays, researchers and
engineers have acknowledged that many factors influence the pullout resistance of soil
nails, such factors include installation method, overburden pressure, grouting pressure
(for grouted nails), soil dilation, roughness of nail surface, degree of saturation of the
soil, and shear strength of the soil.
The present study focuses on the grouted nails which are commonly used in Hong Kong.
The soil nail pullout resistance can be estimated by the field pullout tests. The
behaviour of grouted nails in the field is influenced by a number of uncertain factors,
such as variations in the water content and soil properties, quality of cement grout, and
uncontrolled test parameters including vertical overburden pressure, grouting pressure,
and roughness of a drilled hole. Consequently, due to these uncertainties the reported
field test results are generally quite scattered. Laboratory tests were therefore chosen
since they offer a better possibility to control the factors mentioned above, hence
eliminating any uncertainties associated with field test results. In addition, the field
pullout tests are normally carried out in a no-rain weather condition, when the soil is
unsaturated. Such testing conditions are not the worst state and the measured pullout
Chapter 4: Test Setup, Materials and Procedures
- 78 -
resistance is, therefore, on the unsafe side. In a laboratory soil nail pullout test, key
influencing factors on the fundamental interaction mechanism of the pullout resistance
are able to be studied (Chang and Milligan 1996, Junaideen et al. 2004, Yin and Su
2006, Su 2006, Su et al. 2007 and 2008, Yin et al. 2008). Su et al. (2007) have
reported the degree of saturation influence on soil nail pullout resistance. Su et al. (2008)
have studied the influence of overburden pressure on the soil nail pullout resistance in a
compacted CDG soil, under an unsaturated condition. The soil nails in their tests were
grouted without pressure. They have found that the soil nail pullout resistance is hardly
dependent on the overburden pressures. In Hong Kong, grouting is usually carried out
under gravity or low pressure. The effect of grouting pressure is seldom taken into
account in the soil nailing design. The research on the influence of grouting pressure on
soil nail pullout resistance is still limited (Yeung et al. 2005, Yin et al. 2008). Yin et al.
(2008) conducted a limited number of laboratory pullout tests to study the influence of
cement pressure grouting on soil nail pullout resistance. However, the soil in their
study was unsaturated (Sr≈50%) and only two different grouting pressures were
studied (80 kPa and 130 kPa).
The main objective of the present laboratory tests is to study the influence on soil nail
pullout resistance of the overburden pressure and grouting pressure, when the soil is
saturated, i.e. at the most critical condition. In this chapter, the setup and
instrumentation of the laboratory tests are first introduced. The material properties of
the sample soil and cement grout are then presented, followed by the description of the
test procedures. The test program and test observations are presented in Chapter 5.
Experimental and Theoretical Study on Pullout Resistance of Grouted Soil Nails Wan-Huan Zhou
- 79 -
4.2 TEST SETUP AND INSTRUMENTATION
4.2.1 Description of the pullout box
The pullout box designed by Yin and Su (2006) is used in the present study. The design
concept of the soil nail pullout box is to enable the study in the laboratory of a short
length of soil nail in the passive zone of a soil nailed slope, as shown in Figure 4.1. Soil
nail pullout tests can be carried out under controlled condition using the pullout box,
and thus the influences of some important parameters of soil nail pullout resistance can
be studied. The controlled parameters include: overburden pressure, saturation condition,
grouting pressure, roughness of the drilled hole, and pullout rate. The pullout box is
fully instrumented to monitor earth pressure variations in the soil, and strains, pullout
displacement and force in the soil nail during the testing. The main features of the
pullout box are briefly described below.
The internal dimensions of the box are 1000 mm long, 600 mm wide and 830 mm high
as shown in Figure 4.1. This pullout box has a few special components for special
purposes:
(a) an overburden pressure application device is in the top cover of the box, while a
rubber bag underneath the top cover is filled with de-aired water. The application of
water pressure to the top surface of the soil can be controlled in the box. This
pressure (up to 400 kPa) is to simulate the overburden pressure in a soil slope.
(b) an extension chamber on the left side (Figure 4.1a) of the box covers the end of the
soil nail, so that no cavity is formed inside the box during the soil nail pullout and
the soil stresses on the soil nail inside the box are kept uniform in the longitudinal
direction.
(c) a special pressure chamber (like a triaxial cell) covers the nail head, which works as
a waterproof front cover for application of back water pressure for soil saturation.
Chapter 4: Test Setup, Materials and Procedures
- 80 -
(d) a pressure grouting device is used to conduct grouting under a controlled pressure
when constructing a soil nail in a drill hole in the box.
(e) a pullout device with a special reaction frame is used to apply a pullout force at the
nail head at a controlled pullout rate.
In addition, the pullout box is instrumented with six earth pressure cells, four pore water
pressure transducers, one automatic volumemeter, two LVDTs (Linear Variation
Displacement Transducer), one load cell, one water pressure gauge, and two grouting
pressure gauges (one at the nail head and one at the nail end) as shown in Figure 4.1.
Both strain gauges and fiber optical sensors are employed to measure the strains in the
soil nail during the testing, as shown in Figure 4.2. More details on the box design and
setup can be found in the work of Yin and Su (2006) and Yin et al. (2008).
4.2.2 Calibration of transducers
A CR10X data logger was used to collect data during the testing. Before conducting the
test, all the transducers were calibrated over the entire operational ranges.
The earth pressure cells were calibrated by water with the use of a Geotechnical digital
system (GDS) pressure controller and a sealed Perspex cylinder (Figure 4.3). Water
pressure was applied step by step from 0kPa to 500kPa in the cylinder, while the
response of the earth pressure cell corresponding to each pressure increment was
recorded from the data logger. Figure 4.5 shows the calibration results of the earth
pressure cells. It was noted that the sensitivity of the earth pressure cells in the soil can
be lower than that in the fluid calibration due to an arching effect or non-uniform
contact condition in the soil. Therefore, a reduction factor of 0.8-0.9 is used in the
calculation of soil stress in the pullout box.
Experimental and Theoretical Study on Pullout Resistance of Grouted Soil Nails Wan-Huan Zhou
- 81 -
Two different transducers as shown in Figure 4.2 were used to measured pore water
pressure in the soil, (b) pore water pressure transducer and (c) tensiometer. They were
calibrated in the same way as the earth pressure cells. The pore water pressure
transducers were calibrated within the range from 0kPa to 500kPa, while the
tensiometers were calibrated up to its limit, 100kPa. The load cell was calibrated using a
dead weight. Due to the limitation of the equipment, calibrating was only in the range
from 0kN to 5kN. The LVDTs were calibrated using a micrometer as shown in Figure
4.4. The volumemeter was calibrated using a scaled water tube. The calibration results
of pore water pressure transducers, load cell, LVDTs, and volumemeter were shown in
Figure 4.6-Figure 4.9. The Fibre Bragg Grading (FBG) based monitoring system
developed by Zhu et al. (2007) was employed together with the strain gauges to
measure the strain changes in the soil nail during the pullout.
4.3 MATERIAL PROPERTIES
4.3.1 Basic properties of the CDG soil
The soil used in this study was a Completely Decomposed Granite (CDG) soil which is
a typical in-situ soil in Hong Kong. It was taken from a highway construction site at
Tai Wai, Hong Kong. This soil is the same soil used in previous studies by Su (2006),
Su et al. (2007 and 2008), and Yin et al. (2008). Thus, previous pullout test results can
be used for comparisons with those of the present study. It should be noted that as the
soil was re-used for all the tests, the properties of the soil will probably have slightly
changed. A series of basic property tests were carried out to exam the changes. All the
tests followed the procedures as described in BS 1377: 1990. The tests included particle
size distribution, compaction test, specific gravity, liquid and plastic limit tests.
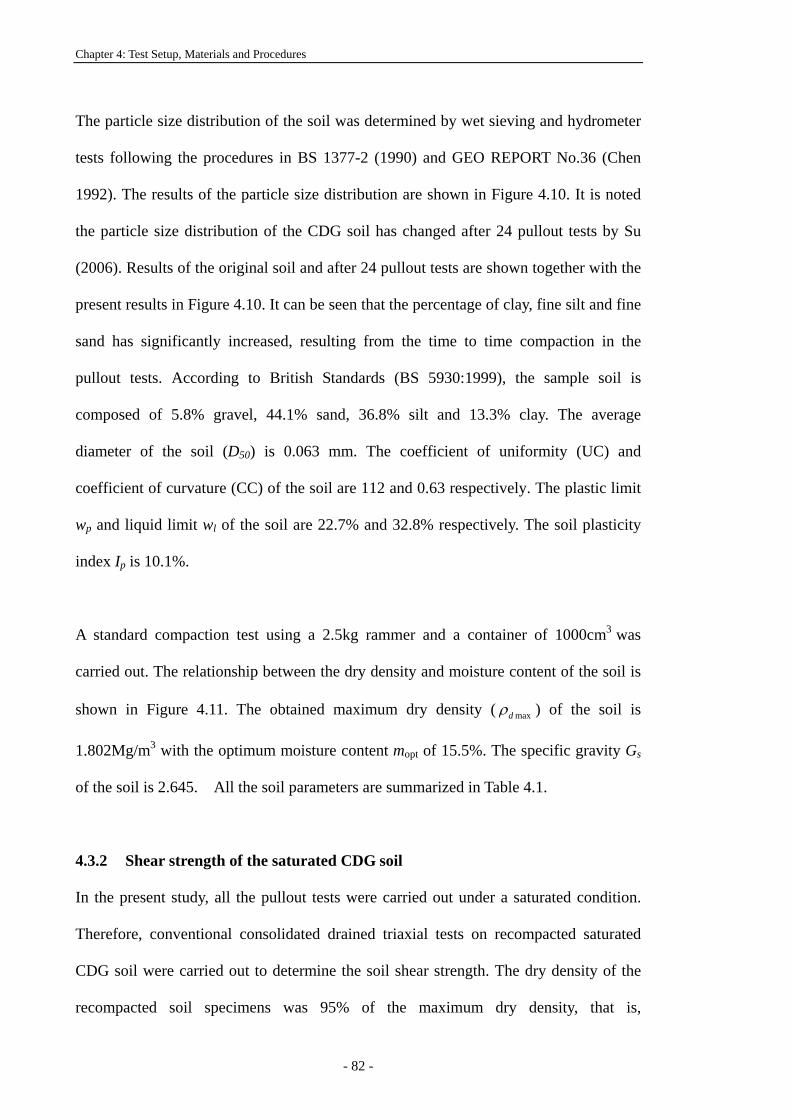
Chapter 4: Test Setup, Materials and Procedures
- 82 -
The particle size distribution of the soil was determined by wet sieving and hydrometer
tests following the procedures in BS 1377-2 (1990) and GEO REPORT No.36 (Chen
1992). The results of the particle size distribution are shown in Figure 4.10. It is noted
the particle size distribution of the CDG soil has changed after 24 pullout tests by Su
(2006). Results of the original soil and after 24 pullout tests are shown together with the
present results in Figure 4.10. It can be seen that the percentage of clay, fine silt and fine
sand has significantly increased, resulting from the time to time compaction in the
pullout tests. According to British Standards (BS 5930:1999), the sample soil is
composed of 5.8% gravel, 44.1% sand, 36.8% silt and 13.3% clay. The average
diameter of the soil (D50) is 0.063 mm. The coefficient of uniformity (UC) and
coefficient of curvature (CC) of the soil are 112 and 0.63 respectively. The plastic limit
wp and liquid limit wl of the soil are 22.7% and 32.8% respectively. The soil plasticity
index Ip is 10.1%.
A standard compaction test using a 2.5kg rammer and a container of 1000cm3 was
carried out. The relationship between the dry density and moisture content of the soil is
shown in Figure 4.11. The obtained maximum dry density ( maxdρ ) of the soil is
1.802Mg/m3 with the optimum moisture content mopt of 15.5%. The specific gravity Gs
of the soil is 2.645. All the soil parameters are summarized in Table 4.1.
4.3.2 Shear strength of the saturated CDG soil
In the present study, all the pullout tests were carried out under a saturated condition.
Therefore, conventional consolidated drained triaxial tests on recompacted saturated
CDG soil were carried out to determine the soil shear strength. The dry density of the
recompacted soil specimens was 95% of the maximum dry density, that is,
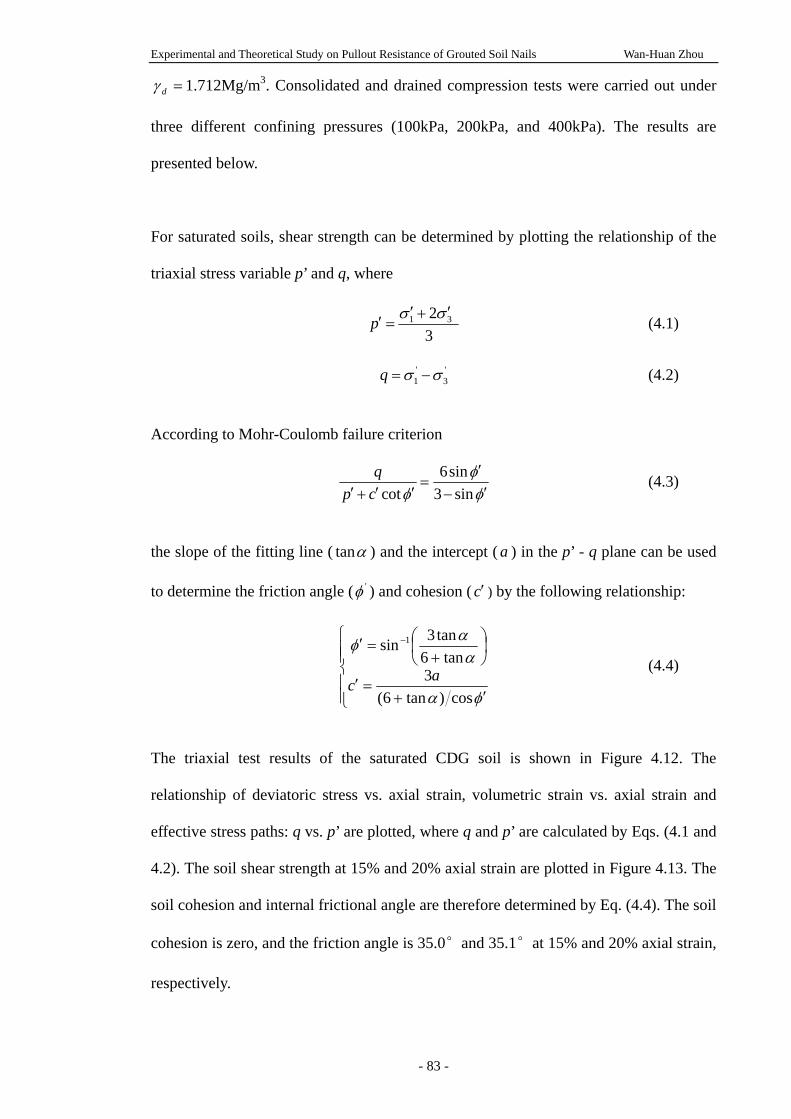
Experimental and Theoretical Study on Pullout Resistance of Grouted Soil Nails Wan-Huan Zhou
- 83 -
=dγ 1.712Mg/m3. Consolidated and drained compression tests were carried out under
three different confining pressures (100kPa, 200kPa, and 400kPa). The results are
presented below.
For saturated soils, shear strength can be determined by plotting the relationship of the
triaxial stress variable p’ and q, where
1 323
p σ σ′ ′+′ = (4.1)
' '
1 3q σ σ= − (4.2)
According to Mohr-Coulomb failure criterion
6sincot 3 sin
qp c
φφ φ
′=
′ ′ ′ ′+ − (4.3)
the slope of the fitting line ( αtan ) and the intercept ( a ) in the p’ - q plane can be used
to determine the friction angle ( 'φ ) and cohesion ( c′ ) by the following relationship:
⎪⎪⎩
⎪⎪⎨
⎧
′+=′
⎟⎠⎞
⎜⎝⎛
+=′ −
φα
ααφ
cos)tan6(3
tan6tan3sin 1
ac (4.4)
The triaxial test results of the saturated CDG soil is shown in Figure 4.12. The
relationship of deviatoric stress vs. axial strain, volumetric strain vs. axial strain and
effective stress paths: q vs. p’ are plotted, where q and p’ are calculated by Eqs. (4.1 and
4.2). The soil shear strength at 15% and 20% axial strain are plotted in Figure 4.13. The
soil cohesion and internal frictional angle are therefore determined by Eq. (4.4). The soil
cohesion is zero, and the friction angle is 35.0°and 35.1°at 15% and 20% axial strain,
respectively.
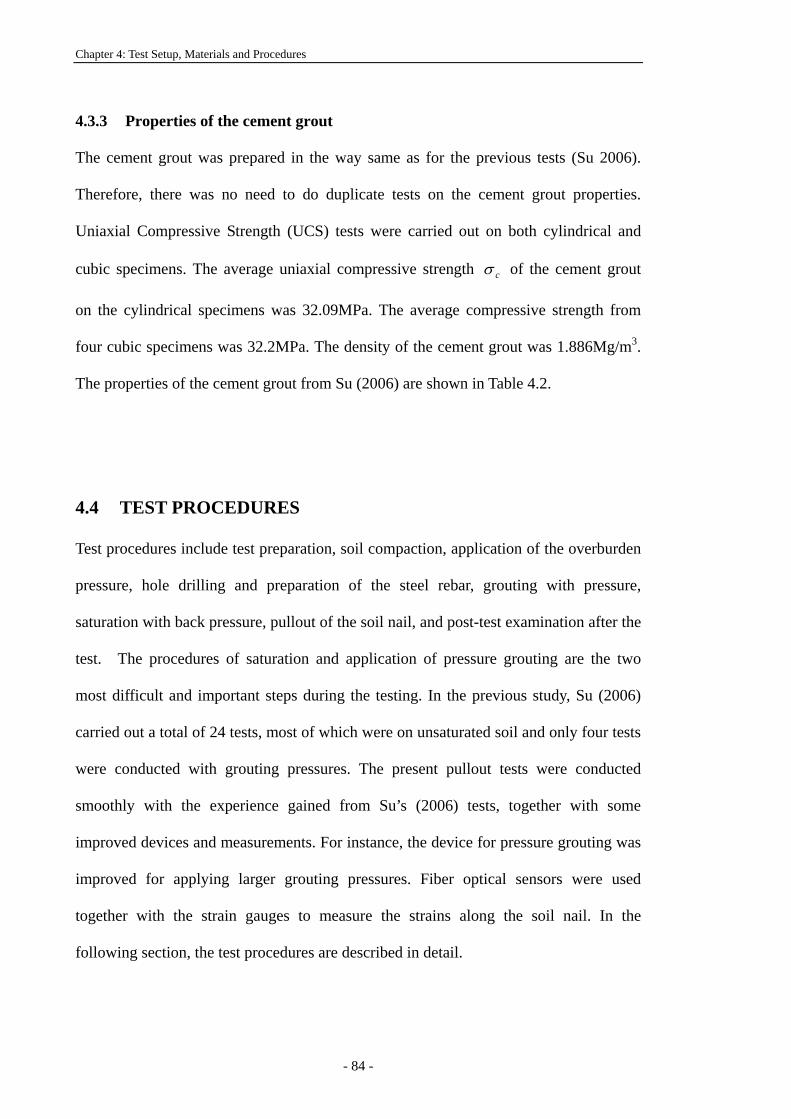
Chapter 4: Test Setup, Materials and Procedures
- 84 -
4.3.3 Properties of the cement grout
The cement grout was prepared in the way same as for the previous tests (Su 2006).
Therefore, there was no need to do duplicate tests on the cement grout properties.
Uniaxial Compressive Strength (UCS) tests were carried out on both cylindrical and
cubic specimens. The average uniaxial compressive strength cσ of the cement grout
on the cylindrical specimens was 32.09MPa. The average compressive strength from
four cubic specimens was 32.2MPa. The density of the cement grout was 1.886Mg/m3.
The properties of the cement grout from Su (2006) are shown in Table 4.2.
4.4 TEST PROCEDURES
Test procedures include test preparation, soil compaction, application of the overburden
pressure, hole drilling and preparation of the steel rebar, grouting with pressure,
saturation with back pressure, pullout of the soil nail, and post-test examination after the
test. The procedures of saturation and application of pressure grouting are the two
most difficult and important steps during the testing. In the previous study, Su (2006)
carried out a total of 24 tests, most of which were on unsaturated soil and only four tests
were conducted with grouting pressures. The present pullout tests were conducted
smoothly with the experience gained from Su’s (2006) tests, together with some
improved devices and measurements. For instance, the device for pressure grouting was
improved for applying larger grouting pressures. Fiber optical sensors were used
together with the strain gauges to measure the strains along the soil nail. In the
following section, the test procedures are described in detail.
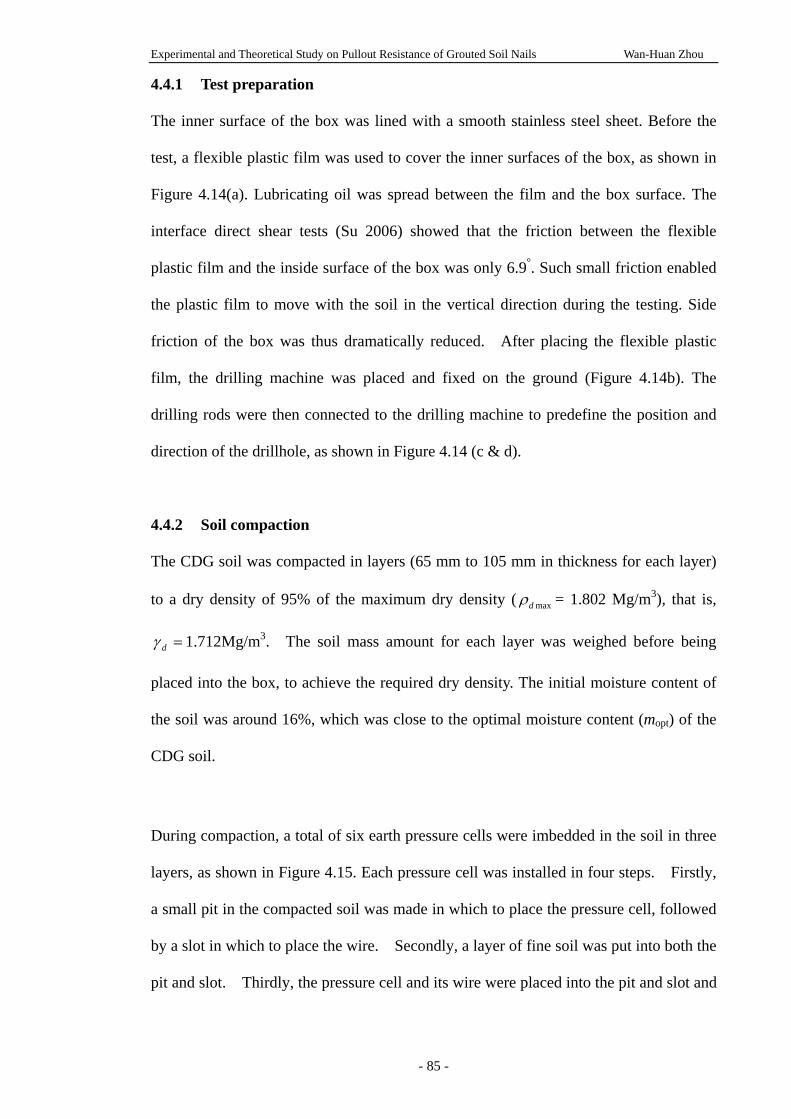
Experimental and Theoretical Study on Pullout Resistance of Grouted Soil Nails Wan-Huan Zhou
- 85 -
4.4.1 Test preparation
The inner surface of the box was lined with a smooth stainless steel sheet. Before the
test, a flexible plastic film was used to cover the inner surfaces of the box, as shown in
Figure 4.14(a). Lubricating oil was spread between the film and the box surface. The
interface direct shear tests (Su 2006) showed that the friction between the flexible
plastic film and the inside surface of the box was only 6.9°. Such small friction enabled
the plastic film to move with the soil in the vertical direction during the testing. Side
friction of the box was thus dramatically reduced. After placing the flexible plastic
film, the drilling machine was placed and fixed on the ground (Figure 4.14b). The
drilling rods were then connected to the drilling machine to predefine the position and
direction of the drillhole, as shown in Figure 4.14 (c & d).
4.4.2 Soil compaction
The CDG soil was compacted in layers (65 mm to 105 mm in thickness for each layer)
to a dry density of 95% of the maximum dry density ( maxdρ = 1.802 Mg/m3), that is,
=dγ 1.712Mg/m3. The soil mass amount for each layer was weighed before being
placed into the box, to achieve the required dry density. The initial moisture content of
the soil was around 16%, which was close to the optimal moisture content (mopt) of the
CDG soil.
During compaction, a total of six earth pressure cells were imbedded in the soil in three
layers, as shown in Figure 4.15. Each pressure cell was installed in four steps. Firstly,
a small pit in the compacted soil was made in which to place the pressure cell, followed
by a slot in which to place the wire. Secondly, a layer of fine soil was put into both the
pit and slot. Thirdly, the pressure cell and its wire were placed into the pit and slot and
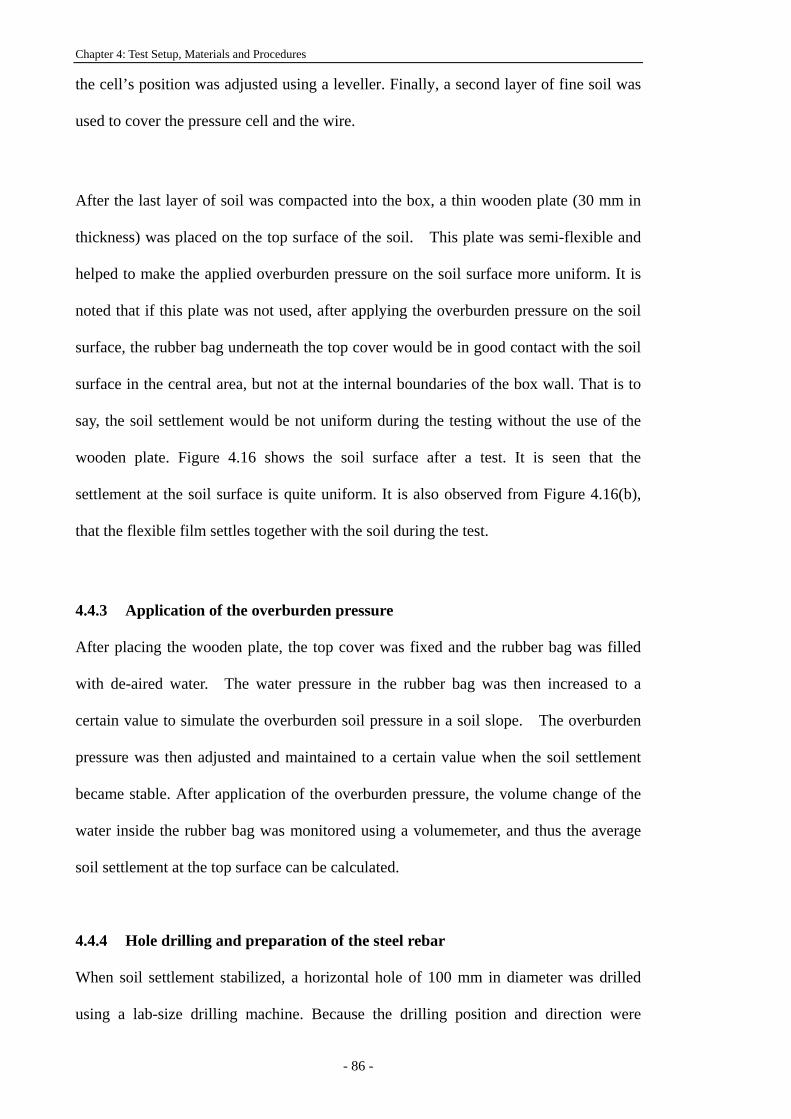
Chapter 4: Test Setup, Materials and Procedures
- 86 -
the cell’s position was adjusted using a leveller. Finally, a second layer of fine soil was
used to cover the pressure cell and the wire.
After the last layer of soil was compacted into the box, a thin wooden plate (30 mm in
thickness) was placed on the top surface of the soil. This plate was semi-flexible and
helped to make the applied overburden pressure on the soil surface more uniform. It is
noted that if this plate was not used, after applying the overburden pressure on the soil
surface, the rubber bag underneath the top cover would be in good contact with the soil
surface in the central area, but not at the internal boundaries of the box wall. That is to
say, the soil settlement would be not uniform during the testing without the use of the
wooden plate. Figure 4.16 shows the soil surface after a test. It is seen that the
settlement at the soil surface is quite uniform. It is also observed from Figure 4.16(b),
that the flexible film settles together with the soil during the test.
4.4.3 Application of the overburden pressure
After placing the wooden plate, the top cover was fixed and the rubber bag was filled
with de-aired water. The water pressure in the rubber bag was then increased to a
certain value to simulate the overburden soil pressure in a soil slope. The overburden
pressure was then adjusted and maintained to a certain value when the soil settlement
became stable. After application of the overburden pressure, the volume change of the
water inside the rubber bag was monitored using a volumemeter, and thus the average
soil settlement at the top surface can be calculated.
4.4.4 Hole drilling and preparation of the steel rebar
When soil settlement stabilized, a horizontal hole of 100 mm in diameter was drilled
using a lab-size drilling machine. Because the drilling position and direction were
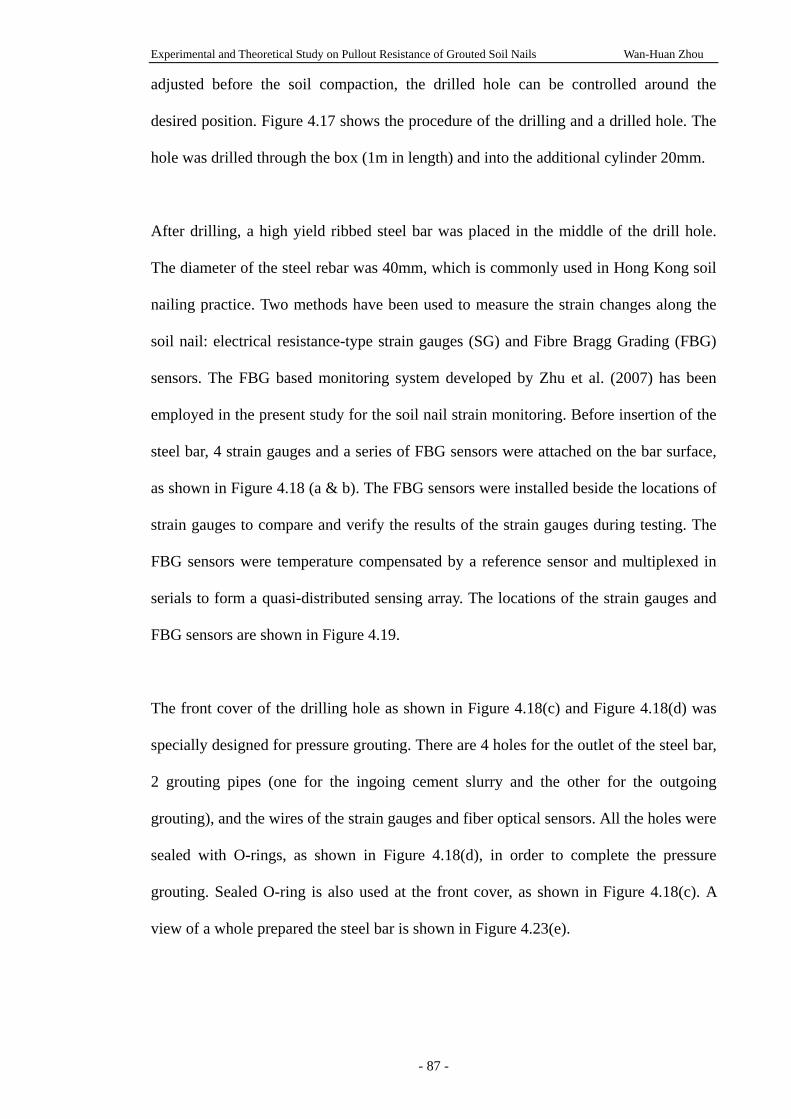
Experimental and Theoretical Study on Pullout Resistance of Grouted Soil Nails Wan-Huan Zhou
- 87 -
adjusted before the soil compaction, the drilled hole can be controlled around the
desired position. Figure 4.17 shows the procedure of the drilling and a drilled hole. The
hole was drilled through the box (1m in length) and into the additional cylinder 20mm.
After drilling, a high yield ribbed steel bar was placed in the middle of the drill hole.
The diameter of the steel rebar was 40mm, which is commonly used in Hong Kong soil
nailing practice. Two methods have been used to measure the strain changes along the
soil nail: electrical resistance-type strain gauges (SG) and Fibre Bragg Grading (FBG)
sensors. The FBG based monitoring system developed by Zhu et al. (2007) has been
employed in the present study for the soil nail strain monitoring. Before insertion of the
steel bar, 4 strain gauges and a series of FBG sensors were attached on the bar surface,
as shown in Figure 4.18 (a & b). The FBG sensors were installed beside the locations of
strain gauges to compare and verify the results of the strain gauges during testing. The
FBG sensors were temperature compensated by a reference sensor and multiplexed in
serials to form a quasi-distributed sensing array. The locations of the strain gauges and
FBG sensors are shown in Figure 4.19.
The front cover of the drilling hole as shown in Figure 4.18(c) and Figure 4.18(d) was
specially designed for pressure grouting. There are 4 holes for the outlet of the steel bar,
2 grouting pipes (one for the ingoing cement slurry and the other for the outgoing
grouting), and the wires of the strain gauges and fiber optical sensors. All the holes were
sealed with O-rings, as shown in Figure 4.18(d), in order to complete the pressure
grouting. Sealed O-ring is also used at the front cover, as shown in Figure 4.18(c). A
view of a whole prepared the steel bar is shown in Figure 4.23(e).
Chapter 4: Test Setup, Materials and Procedures
- 88 -
4.4.5 Pressure grouting
Cement slurry grouting was carried out after the hole was open for about 13 hours.
For pressure grouting, it is important to make sure the drill hole is sufficiently sealed.
This was completed as follows:
(a) Carefully inserted the prepared steel bar into the hole (Figure 4.20 a) and adjusted
the position of the steel bar to the center of the hole
(b) Fixed the front cover to the pullout box (Figure 4.20 b) and connected an extension
bar to the rebar head to sustain the rebar at the center of the hole
(c) Fixed the extension chamber to the back of the box (Figure 4.20 c) and connected
the pressure gauge, used to monitor the grouting pressure during the grouting, to the
extension chamber
(d) Connected the grouting barrel to the ingoing grouting pipe (Figure 4.20 d)
(e) Prepared the cement slurry with a water-cement ratio of 0.42 (Figure 4.20 e).
Stirred the slurry for 15mins to get a good mixture and then transferred into the
grouting barrel.
(f) Filled the hole with cement slurry in a few minutes. It was done by applying a low
pressure of about 20kPa to the sealed grouting barrel, as shown in Figure 4.20 (f).
The air in the hole was exhausted from the outgoing grouting pipe while filling the
hole with cement slurry from the ingoing grouting pipe.
(g) Connected the outgoing pipe to another pressure gauge at the front of the box at the
moment cement slurry was exhaled out (Figure 4.20 g). Then the grouting pressure
was increased to a required value and kept for about 30mins until the initial setting
of the cement slurry had almost finished. It was observed that the grouting
pressure measured by the two pressure gauges (one at the nail head and the other at
the nail end) were almost the same during the grouting, and the pressure dropped
quickly within about 8-15 minutes after the grouting pressure had applied. After
Experimental and Theoretical Study on Pullout Resistance of Grouted Soil Nails Wan-Huan Zhou
- 89 -
about 2 hours, the pressure gauges were removed when the cement slurry had been
hardened and lost its fluidity. More observations and results will be further
discussed in Chapter 5.
4.4.6 Saturation
Two days after the pressure grouting when the cement grout had gained a certain value
of strength, the soil in the box was saturated by back pressure method. The procedures
are described in more details below.
(a) A total of four pore water pressure transducers (PPT) were installed in the soil near
to the soil nail. The locations of the PPTs are shown in Figure 4.21. All the outlets
of the wires of earth pressure cells and pore water pressure cells were sealed before
the saturation.
(b) Removed the soil in the extension chamber and then fixed it back to the box. Later
on, the extension chamber would be filled with water for the soil saturation (Figure
4.22a).
(c) Removed the front cover, which was used to block the hole during the pressure
grouting, and set up the waterproof triaxial cell (shown in Figure 4.22b) for the soil
saturation. The waterproof triaxial cell has two functions: to apply water (back)
pressure from the soil nail head for the soil saturation; to allow the steel guide bar
move smoothly along the center of the cell with the applied water (back) pressure
so that the pullout can be conducted without any leakage.
(d) Plastic tubes were connected to the six holes in the side plates and near the bottom
of the box, the extension chamber at the back, and the waterproof cell at the front,
so that water could flow into the soil through these tubes.
(e) A vacuum air pump was used to pump out the air from the soil through the four
holes in the side plates and near the top of the box. Under the suction pressure (less
Chapter 4: Test Setup, Materials and Procedures
- 90 -
than 100kPa), water filled the extension chamber and the waterproof front cell, and
also flowed into the soil.
(f) When the extension chamber and the waterproof front cell were almost filled with
water, a back water pressure of about 30kPa was applied and maintained. The
increase in the pore water pressure in the soil was monitored and recorded by the
four pore water pressure cells. The overburden pressure was then increased by
30kPa to maintain the effective overburden pressure consistent in the soil.
4.4.7 Pullout of the soil nail
Five days after grouting when the cement grout strength was about 32 MPa, the cement
grouted soil nail was pulled out from the nail head using a hydraulic jack against a steel
reaction frame as shown in Figure 4.1c. The load was applied step by step and was held
for 1 hour for each loading step. The increment for each loading step was about 5kN.
After reaching the peak pullout resistance, the nail was continuously pulled out to
100mm at a rate of about 1.2 mm/min.
The total length of the soil nail was 1.2 m with 0.2 m inside the extension chamber at
the back of the pullout box. As mentioned in Section 4.46, the soil in the extension
chamber was removed two days after the grouting. During the pullout testing, when
the nail head was pulled out for 100 mm, the additional length (200 mm) in the
extension chamber moved into the box for 100 mm, so that the soil nail length inside the
box was retained as 1.0 m in full contact with the soil in the box.
During the soil nail pullout, the variations of the pullout force, pullout displacement,
vertical earth pressures at six locations, pore water pressures at four locations and the
strains in the soil nail, were automatically monitored and recorded.
Experimental and Theoretical Study on Pullout Resistance of Grouted Soil Nails Wan-Huan Zhou
- 91 -
4.4.8 Post-test examination
After the soil nail was pulled out of 100mm displacement, the overburden pressure and
the water back pressure were released and the computer stopped monitoring and
recording data from transducers. The entire soil nail was then fully extracted from the
drillhole for visual inspection. The diameter of the front, middle and end parts of the
grout column and the attached soil were measured. The soil near the nail surface was
collected to measure the water content immediately after the test. The soil in the box
was then removed. During the removal of the soil, the water content of the soil in each
layer was measured to check the soil saturation degree. The locations of the earth
pressure cells in the soil were also measured after the test, as these locations may
change due to the soil settlement during the test.
4.5 SUMMARY
A series of laboratory experiments have been carried out to investigate the influence of
the overburden pressure and grouting pressure on soil nail pullout resistance. In this
chapter, the test setup and instrumentation, material properties, and test procedures have
been presented.
The pullout box designed by Yin and Su (2006) has been used in the present study. The
test setup has been briefly introduced. The soil used in this study was a Completely
Decomposed Granite (CDG) soil as used in previous studies (Su et al. 2007 and 2008,
Yin et al. 2008, Su 2006). It is noted that the soil properties have changed during the
previous tests, hence basic property tests and triaxial tests for saturated soil has been
carried out to determine the soil properties and shear strength. The material properties
Chapter 4: Test Setup, Materials and Procedures
- 92 -
have been summarized and presented.
The pullout test procedures have been described in detail in this chapter. The procedures
include test preparation, soil compaction, application of the overburden pressure, hole
drilling and preparation of the steel rebar, grouting with pressure, saturation with back
pressure, pullout of the soil nail, and post-test examination after the test.
The test results are presented and discussed in Chapter 5 and further interpreted in
Chapter 6.
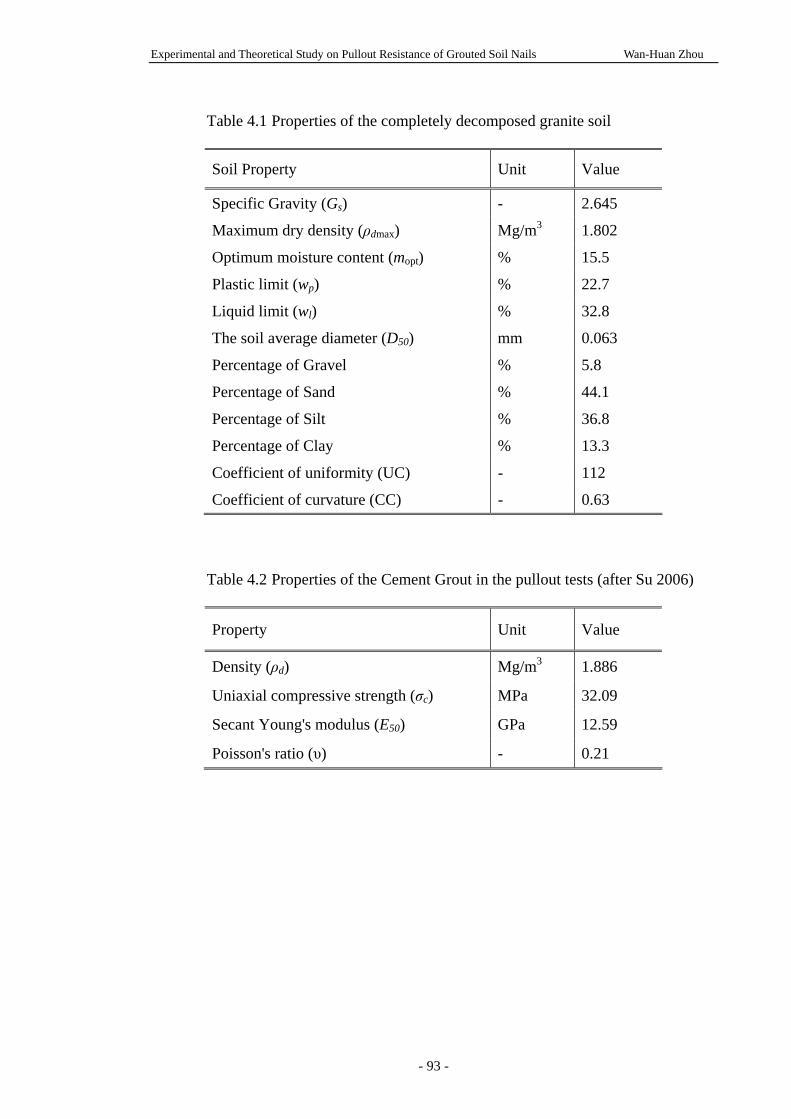
Experimental and Theoretical Study on Pullout Resistance of Grouted Soil Nails Wan-Huan Zhou
- 93 -
Table 4.1 Properties of the completely decomposed granite soil
Soil Property Unit Value
Specific Gravity (Gs) - 2.645
Maximum dry density (ρdmax) Mg/m3 1.802
Optimum moisture content (mopt) % 15.5
Plastic limit (wp) % 22.7
Liquid limit (wl) % 32.8
The soil average diameter (D50) mm 0.063
Percentage of Gravel % 5.8
Percentage of Sand % 44.1
Percentage of Silt % 36.8
Percentage of Clay % 13.3
Coefficient of uniformity (UC) - 112
Coefficient of curvature (CC) - 0.63
Table 4.2 Properties of the Cement Grout in the pullout tests (after Su 2006)
Property Unit Value
Density (ρd) Mg/m3 1.886
Uniaxial compressive strength (σc) MPa 32.09
Secant Young's modulus (E50) GPa 12.59
Poisson's ratio (υ) - 0.21
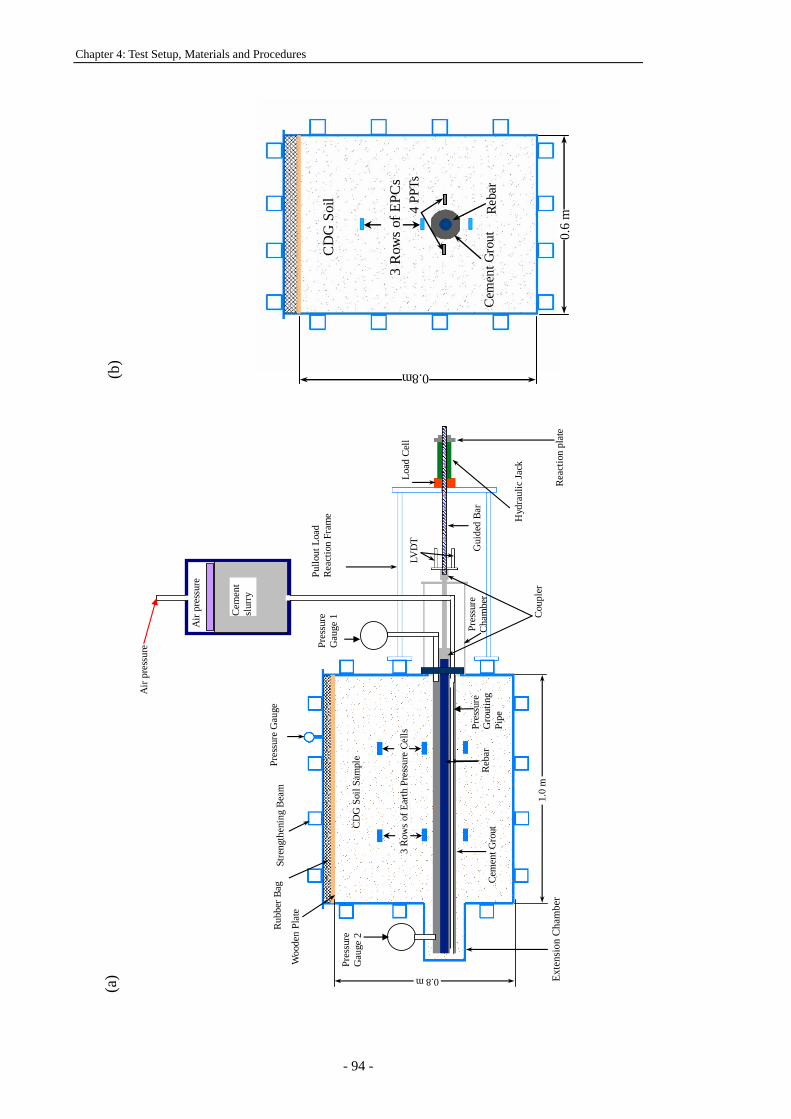
Chapter 4: Test Setup, Materials and Procedures
- 94 -
CD
G S
oil
3 R
ows o
f EPC
s
Cem
ent G
rout
Reba
r
0.6
m
0.8m
4 PP
Ts
(b)
(a)
1.0
m
0.8 m
Woo
den
Plat
e
Rub
ber B
ag
Stre
ngth
enin
g B
eam
Pr
essu
re G
auge
CD
G S
oil S
ampl
e
3
Row
s of
Ear
th P
ress
ure
Cells
Cem
ent G
rout
R
ebar
Add
ition
al C
ham
ber
Cem
ent
slur
ry
Air
pres
sure
Air
pres
sure
Pres
sure
C
ham
ber
Gui
ded
Bar
Coup
ler
LVD
T
Pullo
ut L
oad
R
eact
ion
Fram
e
Load
Cel
l
Hyd
raul
ic J
ack
Reac
tion
plat
e
Pres
sure
G
auge
2
Pres
sure
G
auge
1
Pres
sure
G
rout
ing
Pipe
Exte
nsio
n C
ham
ber
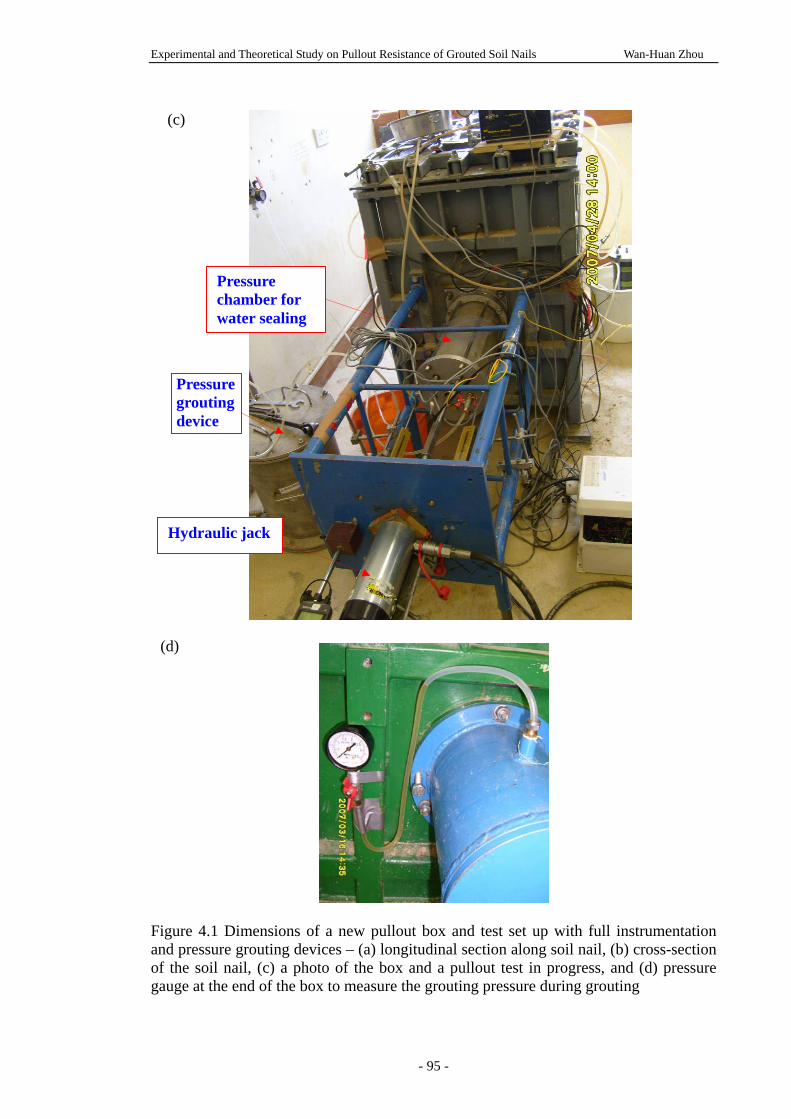
Experimental and Theoretical Study on Pullout Resistance of Grouted Soil Nails Wan-Huan Zhou
- 95 -
Figure 4.1 Dimensions of a new pullout box and test set up with full instrumentation and pressure grouting devices – (a) longitudinal section along soil nail, (b) cross-section of the soil nail, (c) a photo of the box and a pullout test in progress, and (d) pressure gauge at the end of the box to measure the grouting pressure during grouting
(c)
(d)
Pressure chamber for water sealing
Pressure grouting device
Hydraulic jack
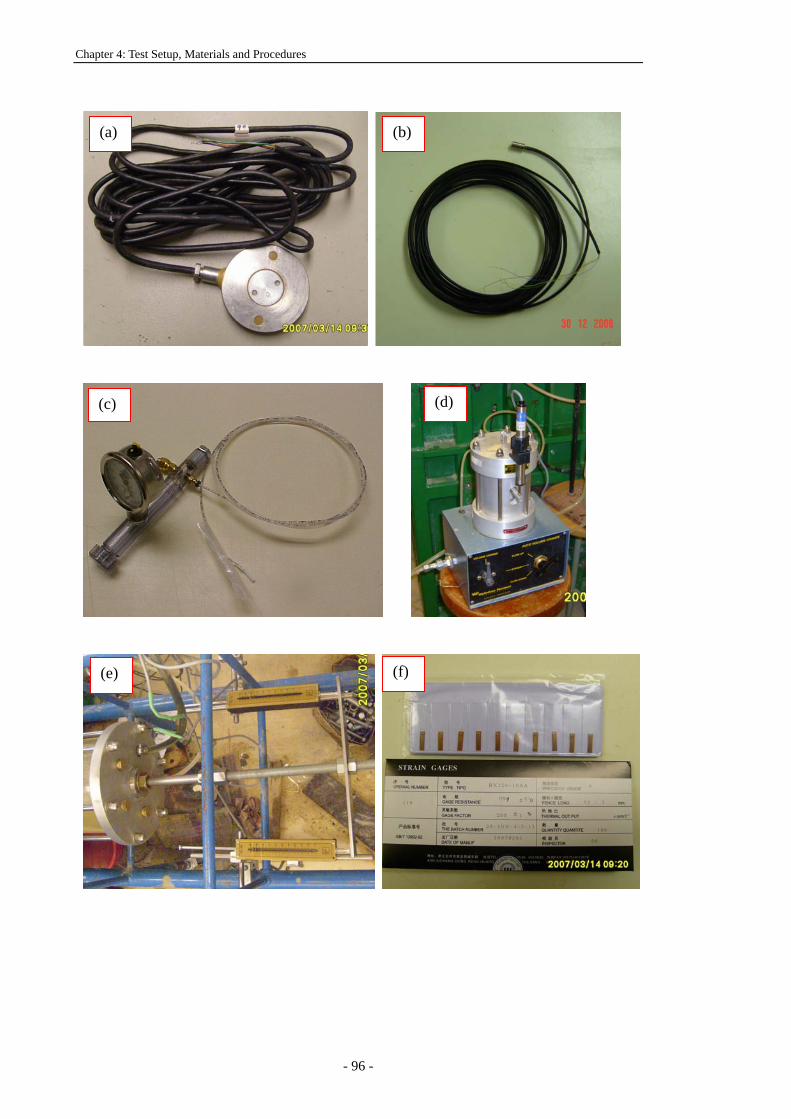
Chapter 4: Test Setup, Materials and Procedures
- 96 -
(a) (b)
(c) (d)
(e) (f)
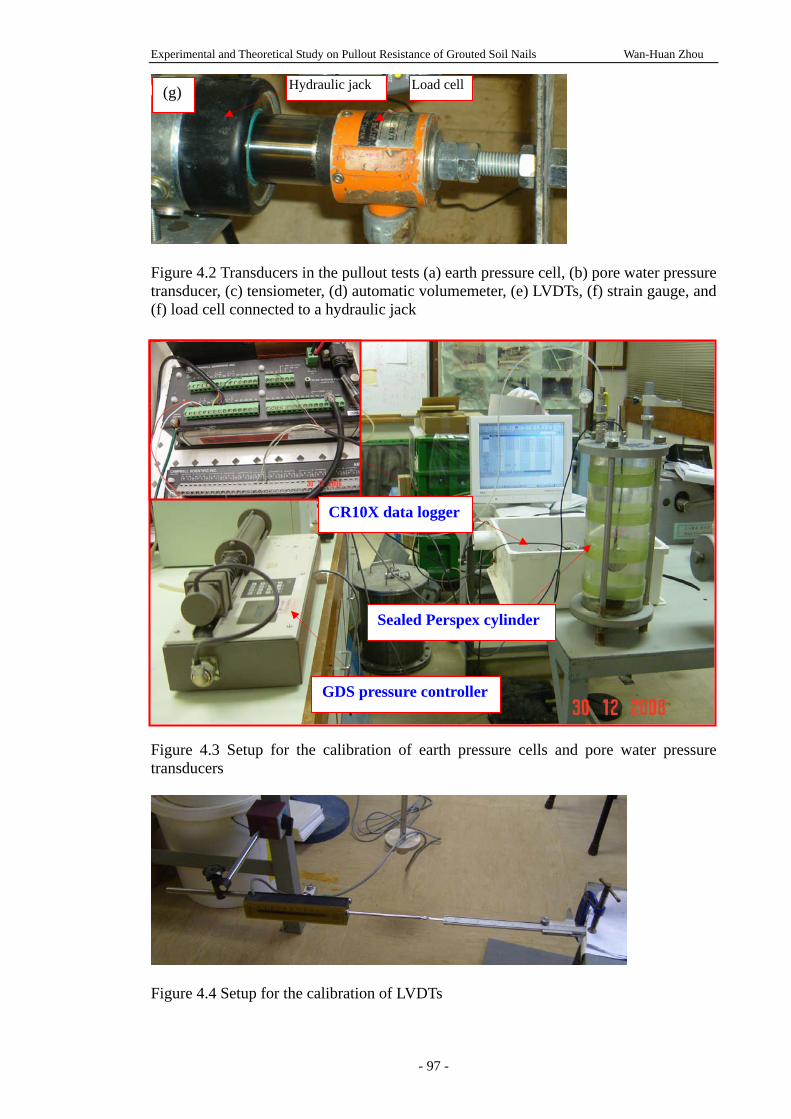
Experimental and Theoretical Study on Pullout Resistance of Grouted Soil Nails Wan-Huan Zhou
- 97 -
Figure 4.2 Transducers in the pullout tests (a) earth pressure cell, (b) pore water pressure transducer, (c) tensiometer, (d) automatic volumemeter, (e) LVDTs, (f) strain gauge, and (f) load cell connected to a hydraulic jack Figure 4.3 Setup for the calibration of earth pressure cells and pore water pressure transducers
Figure 4.4 Setup for the calibration of LVDTs
(g) Hydraulic jack Load cell
CR10X data logger
GDS pressure controller
Sealed Perspex cylinder
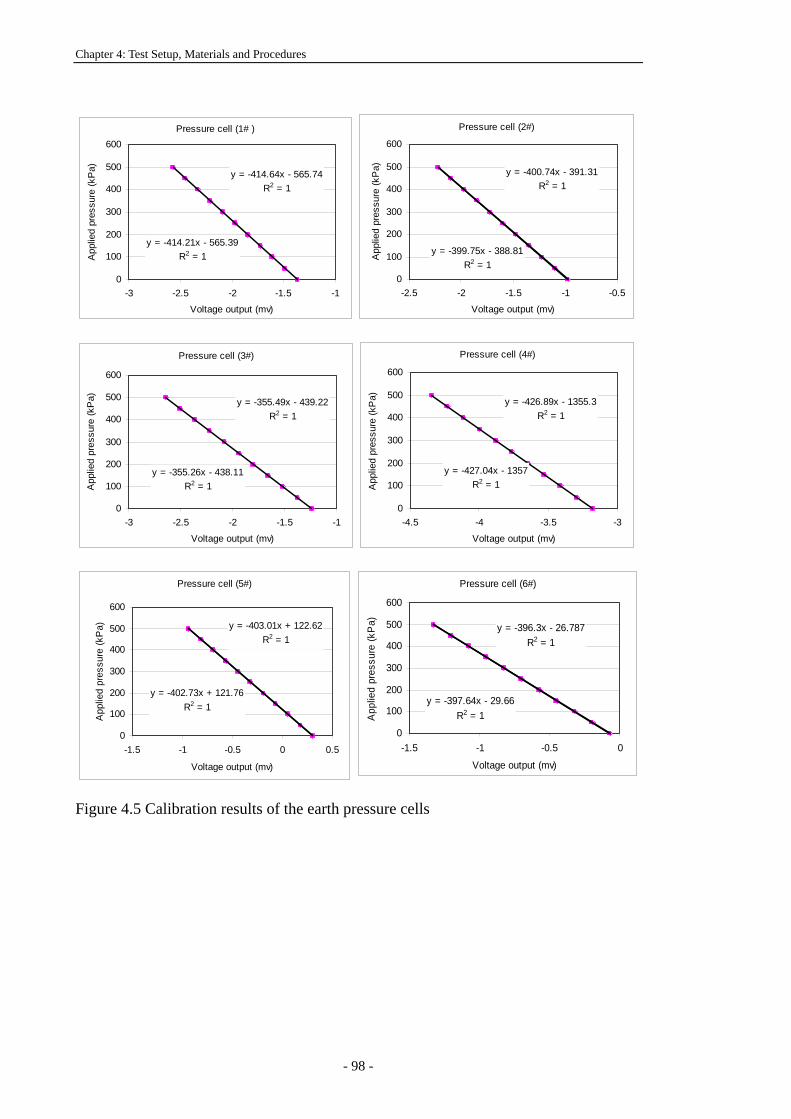
Chapter 4: Test Setup, Materials and Procedures
- 98 -
Pressure cell (1# )
y = -414.64x - 565.74R2 = 1
y = -414.21x - 565.39R2 = 1
0
100
200
300
400
500
600
-3 -2.5 -2 -1.5 -1
Voltage output (mv)
App
lied
pres
sure
(kP
a)
Pressure cell (2#)
y = -399.75x - 388.81R2 = 1
y = -400.74x - 391.31R2 = 1
0
100
200
300
400
500
600
-2.5 -2 -1.5 -1 -0.5
Voltage output (mv)
App
lied
pres
sure
(kP
a)
Pressure cell (3#)
y = -355.26x - 438.11R2 = 1
y = -355.49x - 439.22R2 = 1
0
100
200
300
400
500
600
-3 -2.5 -2 -1.5 -1
Voltage output (mv)
App
lied
pres
sure
(kP
a)
Pressure cell (4#)
y = -426.89x - 1355.3R2 = 1
y = -427.04x - 1357R2 = 1
0
100
200
300
400
500
600
-4.5 -4 -3.5 -3
Voltage output (mv)
App
lied
pres
sure
(kP
a)
Pressure cell (5#)
y = -403.01x + 122.62R2 = 1
y = -402.73x + 121.76R2 = 1
0
100
200
300
400
500
600
-1.5 -1 -0.5 0 0.5
Voltage output (mv)
App
lied
pres
sure
(kP
a)
Figure 4.5 Calibration results of the earth pressure cells
Pressure cell (6#)
y = -396.3x - 26.787R2 = 1
y = -397.64x - 29.66R2 = 1
0
100
200
300
400
500
600
-1.5 -1 -0.5 0
Voltage output (mv)
App
lied
pres
sure
(kP
a)
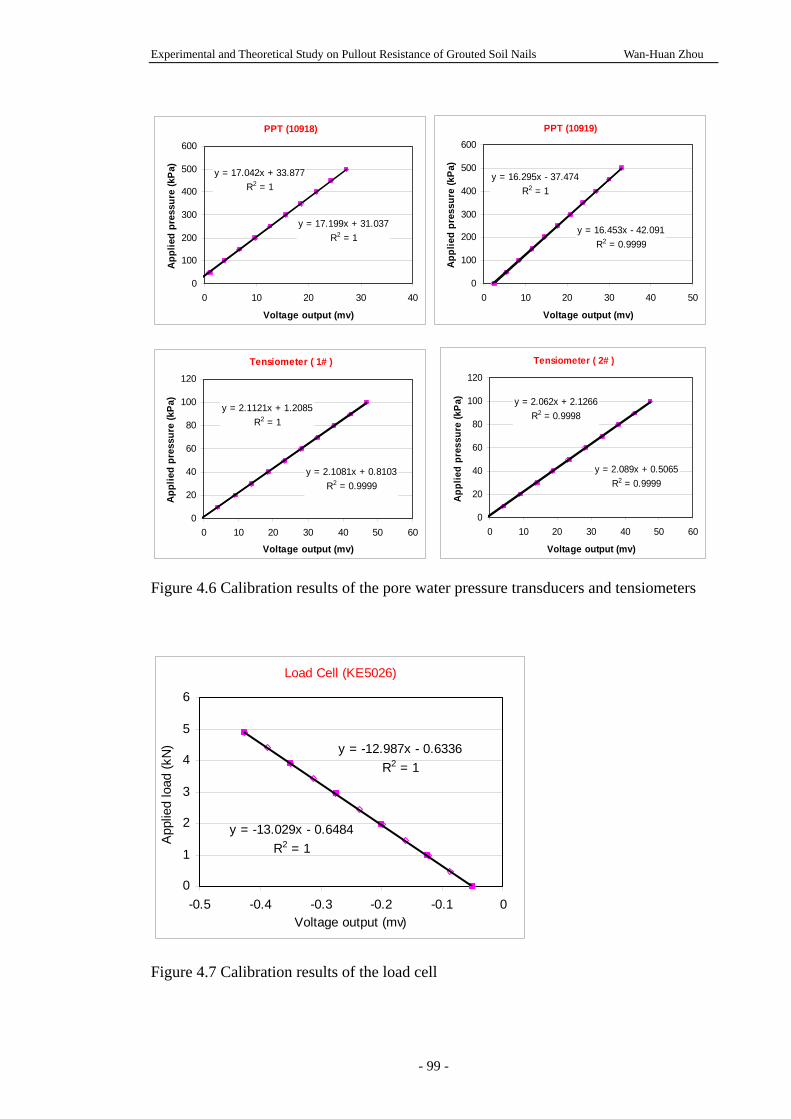
Experimental and Theoretical Study on Pullout Resistance of Grouted Soil Nails Wan-Huan Zhou
- 99 -
PPT (10918)
y = 17.042x + 33.877R2 = 1
y = 17.199x + 31.037R2 = 1
0
100
200
300
400
500
600
0 10 20 30 40
Voltage output (mv)
App
lied
pres
sure
(kP
a)
PPT (10919)
y = 16.295x - 37.474R2 = 1
y = 16.453x - 42.091R2 = 0.9999
0
100
200
300
400
500
600
0 10 20 30 40 50
Voltage output (mv)
Appl
ied
pres
sure
(kPa
)
Tensiometer ( 1# )
y = 2.1121x + 1.2085R2 = 1
y = 2.1081x + 0.8103R2 = 0.9999
0
20
40
60
80
100
120
0 10 20 30 40 50 60
Voltage output (mv)
App
lied
pres
sure
(kPa
)
Tensiometer ( 2# )
y = 2.062x + 2.1266R2 = 0.9998
y = 2.089x + 0.5065R2 = 0.9999
0
20
40
60
80
100
120
0 10 20 30 40 50 60
Voltage output (mv)
App
lied
pres
sure
(kP
a)
Figure 4.6 Calibration results of the pore water pressure transducers and tensiometers
Load Cell (KE5026)
y = -12.987x - 0.6336R2 = 1
y = -13.029x - 0.6484R2 = 1
0
1
2
3
4
5
6
-0.5 -0.4 -0.3 -0.2 -0.1 0Voltage output (mv)
App
lied
load
(kN
)
Figure 4.7 Calibration results of the load cell
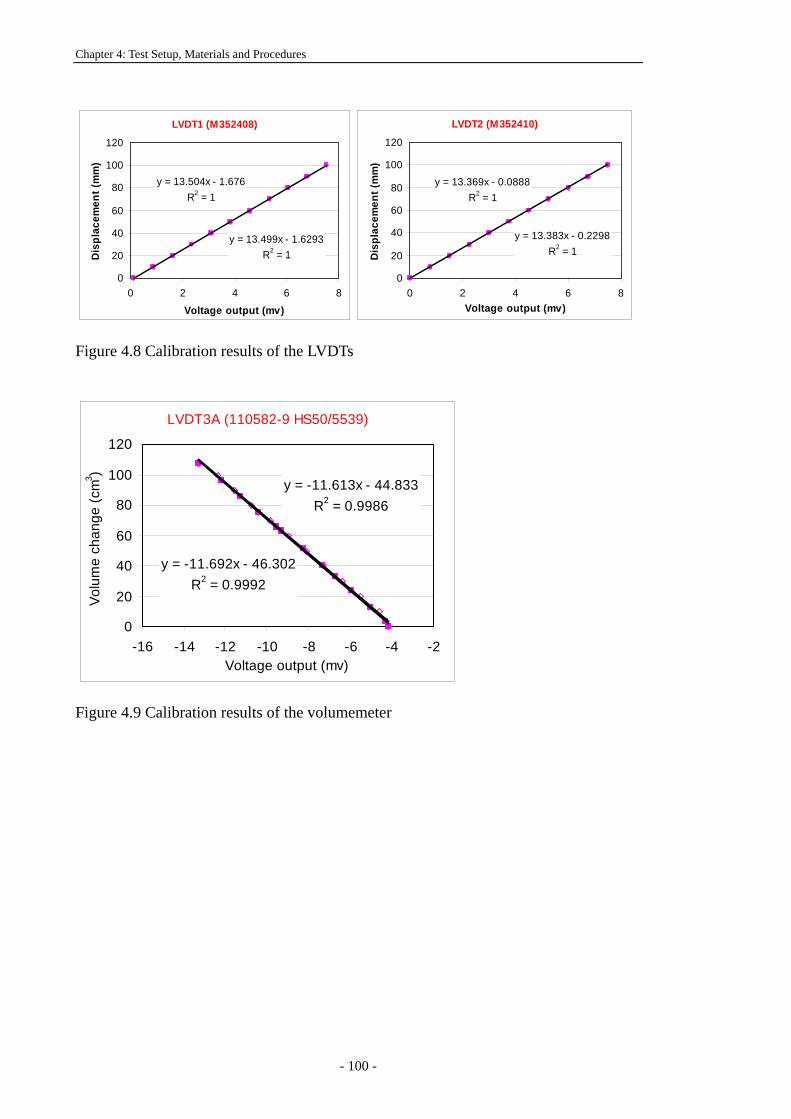
Chapter 4: Test Setup, Materials and Procedures
- 100 -
LVDT1 (M352408)
y = 13.504x - 1.676R2 = 1
y = 13.499x - 1.6293R2 = 1
0
20
40
60
80
100
120
0 2 4 6 8
Voltage output (mv)
Dis
plac
emen
t (m
m)
LVDT2 (M352410)
y = 13.369x - 0.0888R2 = 1
y = 13.383x - 0.2298R2 = 1
0
20
40
60
80
100
120
0 2 4 6 8Voltage output (mv)
Dis
plac
emen
t (m
m)
Figure 4.8 Calibration results of the LVDTs
LVDT3A (110582-9 HS50/5539)
y = -11.613x - 44.833R2 = 0.9986
y = -11.692x - 46.302R2 = 0.9992
0
20
40
60
80
100
120
-16 -14 -12 -10 -8 -6 -4 -2Voltage output (mv)
Volu
me
chan
ge (c
m3 )
Figure 4.9 Calibration results of the volumemeter
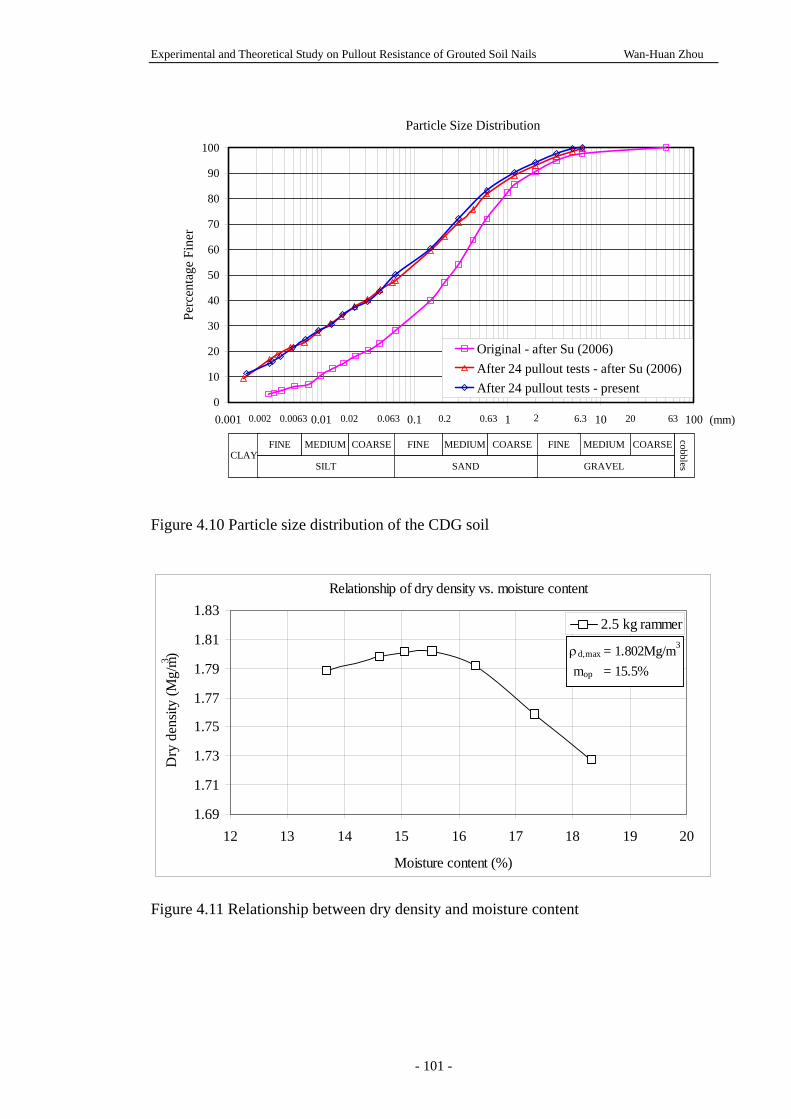
Experimental and Theoretical Study on Pullout Resistance of Grouted Soil Nails Wan-Huan Zhou
- 101 -
Figure 4.10 Particle size distribution of the CDG soil
Relationship of dry density vs. moisture content
1.69
1.71
1.73
1.75
1.77
1.79
1.81
1.83
12 13 14 15 16 17 18 19 20
Moisture content (%)
Dry
den
sity
(Mg/
m3 )
2.5 kg rammer
ρd,max = 1.802Mg/m3
mop = 15.5%
Figure 4.11 Relationship between dry density and moisture content
Particle Size Distribution
0
10
20
30
40
50
60
70
80
90
100
0.001 0.01 0.1 1 10 100
Perc
enta
ge F
iner
Original - after Su (2006)After 24 pullout tests - after Su (2006)After 24 pullout tests - present
CLAYFINE MEDIUMCOARSE
SILT
FINEMEDIUM COARSE
GRAVEL
FINE MEDIUM COARSE
SAND
cobbles
(mm)0.002 0.630.02 0.063 0.2 2 6.3 63200.0063
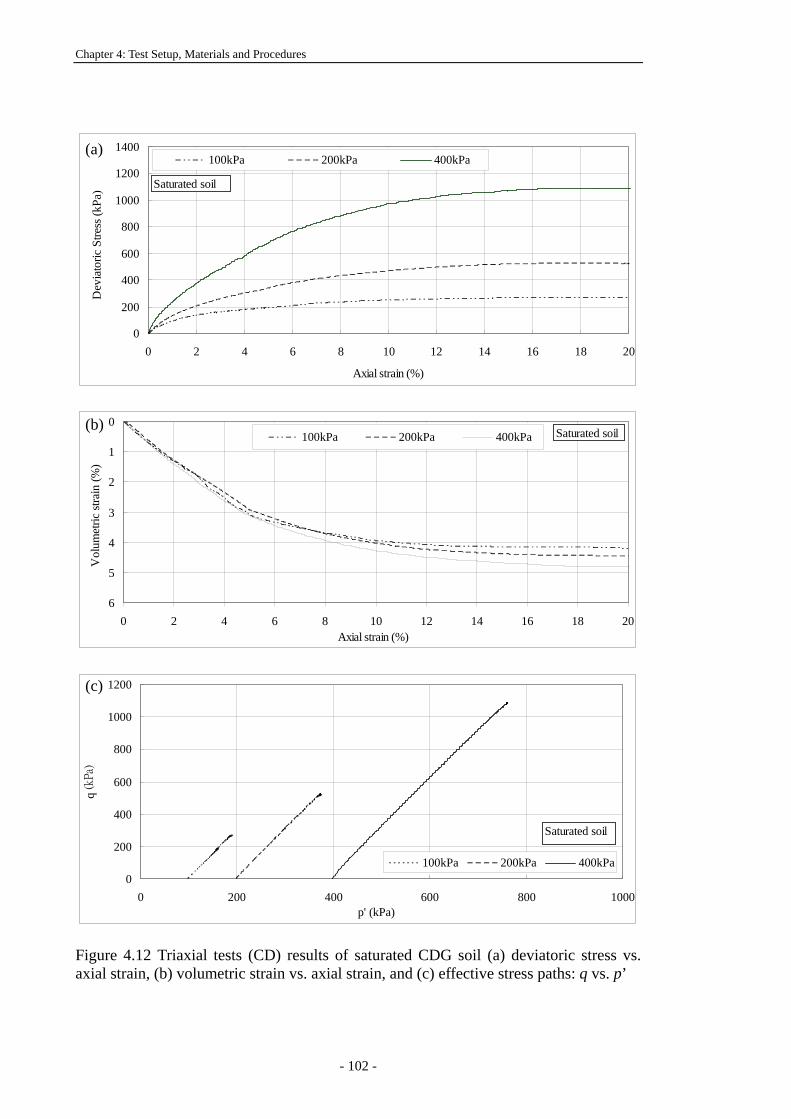
Chapter 4: Test Setup, Materials and Procedures
- 102 -
0
200
400
600
800
1000
1200
1400
0 2 4 6 8 10 12 14 16 18 20
Axial strain (%)
Dev
iato
ric S
tress
(kPa
)__
100kPa 200kPa 400kPa
Saturated soil
0
1
2
3
4
5
60 2 4 6 8 10 12 14 16 18 20
Axial strain (%)
Vol
umet
ric st
rain
(%)
100kPa 200kPa 400kPa Saturated soil
0
200
400
600
800
1000
1200
0 200 400 600 800 1000p' (kPa)
q (k
Pa)
100kPa 200kPa 400kPa
Saturated soil
Figure 4.12 Triaxial tests (CD) results of saturated CDG soil (a) deviatoric stress vs. axial strain, (b) volumetric strain vs. axial strain, and (c) effective stress paths: q vs. p’
(a)
(b)
(c)
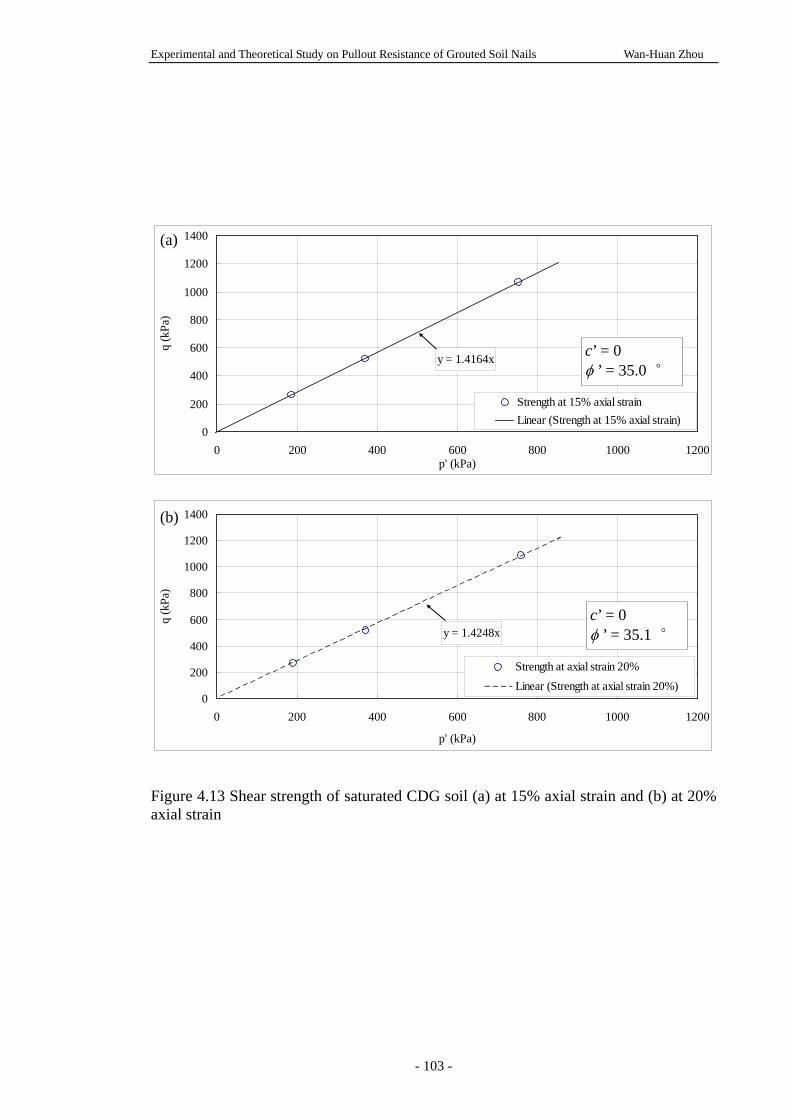
Experimental and Theoretical Study on Pullout Resistance of Grouted Soil Nails Wan-Huan Zhou
- 103 -
y = 1.4164x
0
200
400
600
800
1000
1200
1400
0 200 400 600 800 1000 1200p' (kPa)
q (k
Pa)
Strength at 15% axial strainLinear (Strength at 15% axial strain)
y = 1.4248x
0
200
400
600
800
1000
1200
1400
0 200 400 600 800 1000 1200
p' (kPa)
q (k
Pa)
Strength at axial strain 20%Linear (Strength at axial strain 20%)
Figure 4.13 Shear strength of saturated CDG soil (a) at 15% axial strain and (b) at 20% axial strain
(a)
(b)
c’ = 0 φ ’ = 35.0 °
c’ = 0 φ ’ = 35.1 °
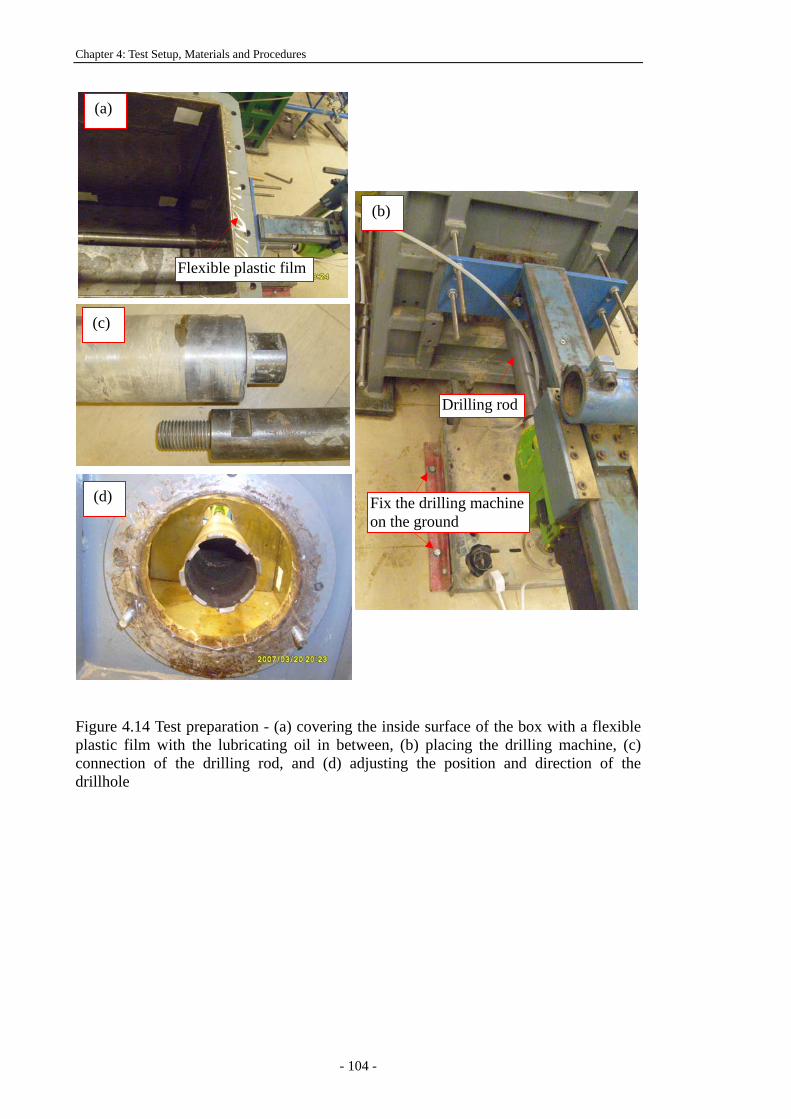
Chapter 4: Test Setup, Materials and Procedures
- 104 -
Figure 4.14 Test preparation - (a) covering the inside surface of the box with a flexible plastic film with the lubricating oil in between, (b) placing the drilling machine, (c) connection of the drilling rod, and (d) adjusting the position and direction of the drillhole
(b)
(a)
(c)
Flexible plastic film
Fix the drilling machineon the ground
Drilling rod
(d)
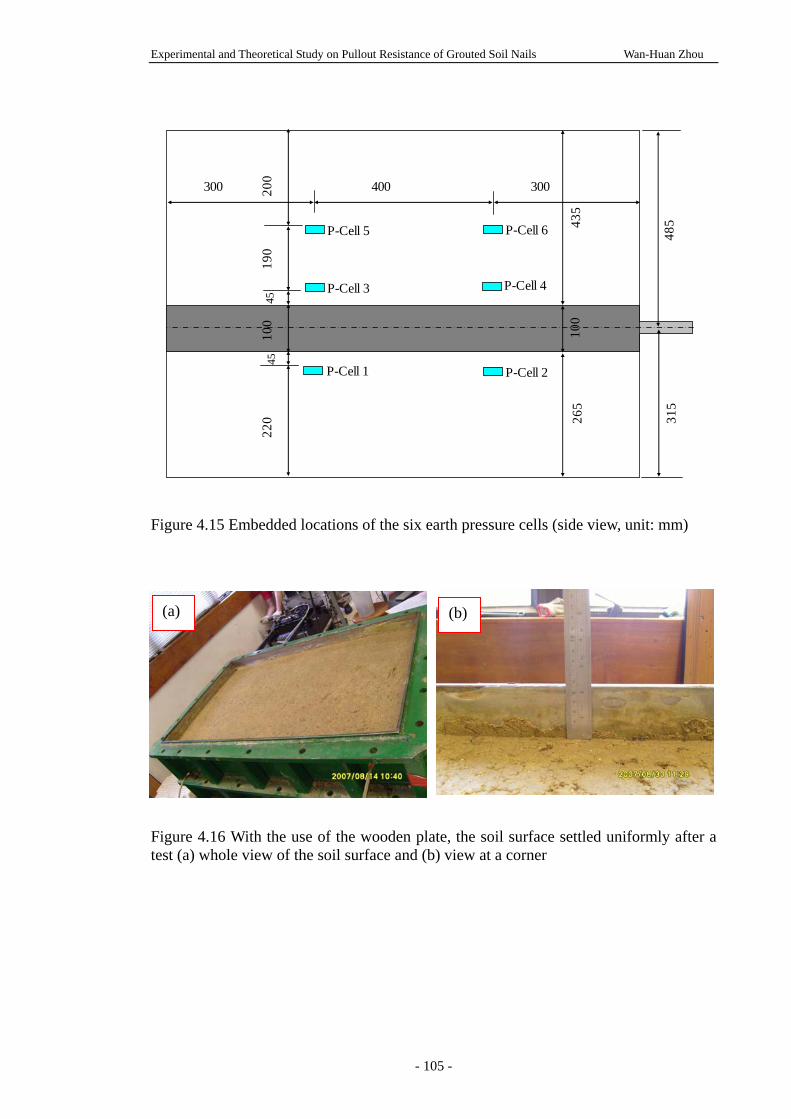
Experimental and Theoretical Study on Pullout Resistance of Grouted Soil Nails Wan-Huan Zhou
- 105 -
Figure 4.15 Embedded locations of the six earth pressure cells (side view, unit: mm) Figure 4.16 With the use of the wooden plate, the soil surface settled uniformly after a test (a) whole view of the soil surface and (b) view at a corner
P-Cell 1 P-Cell 2
P-Cell 4P-Cell 3
P-Cell 5 P-Cell 6
400 300300 200
190
100
220
485
315
435
265
100
4545
(a) (b)
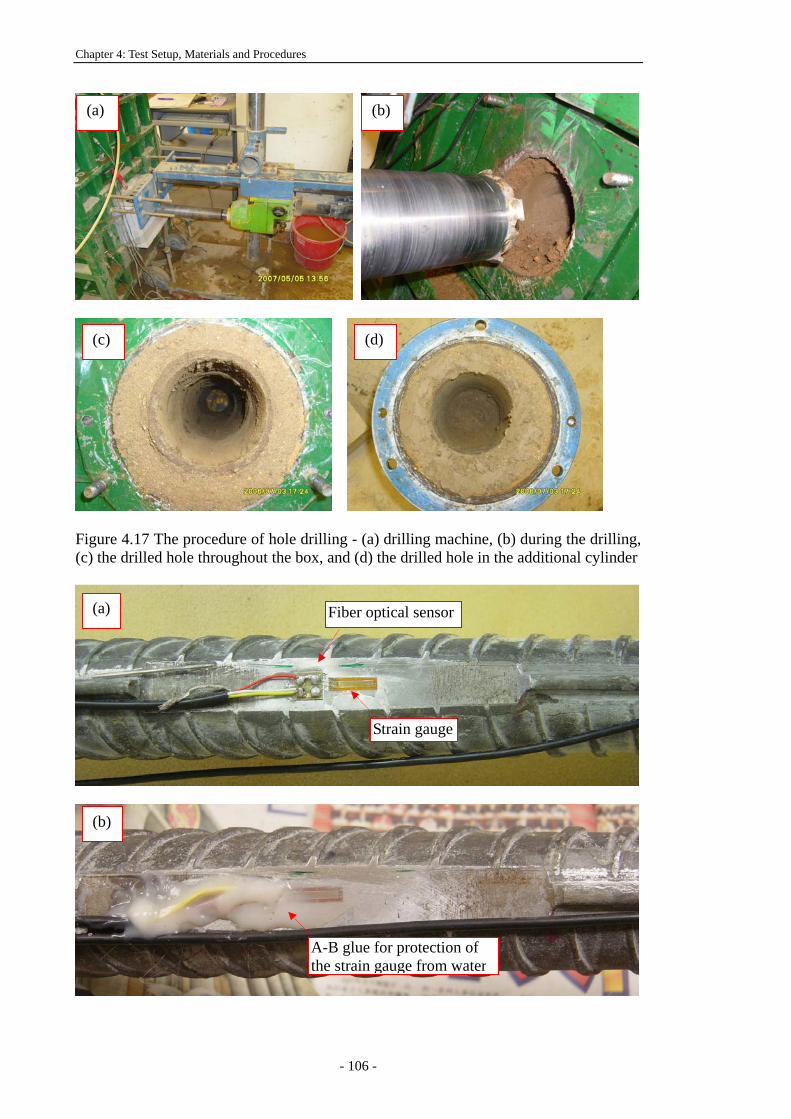
Chapter 4: Test Setup, Materials and Procedures
- 106 -
Figure 4.17 The procedure of hole drilling - (a) drilling machine, (b) during the drilling, (c) the drilled hole throughout the box, and (d) the drilled hole in the additional cylinder
(a) (b)
(c) (d)
(b)
(a)
Strain gauge
Fiber optical sensor
A-B glue for protection of the strain gauge from water
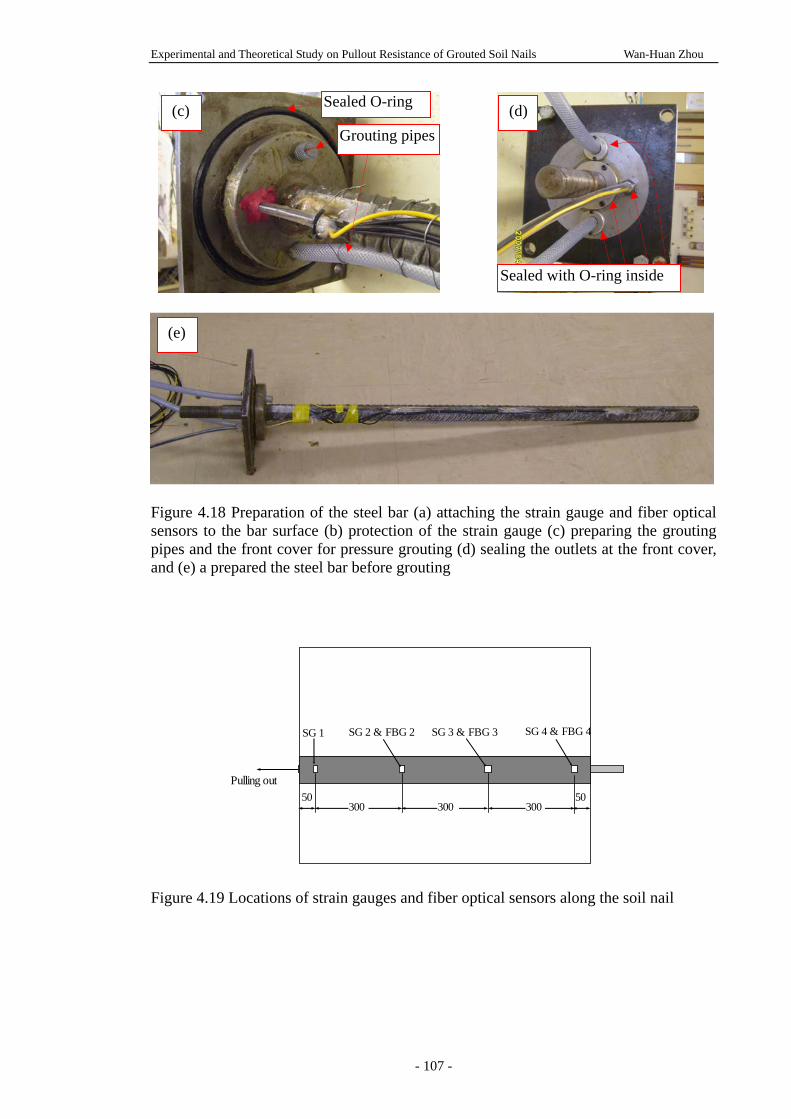
Experimental and Theoretical Study on Pullout Resistance of Grouted Soil Nails Wan-Huan Zhou
- 107 -
Figure 4.18 Preparation of the steel bar (a) attaching the strain gauge and fiber optical sensors to the bar surface (b) protection of the strain gauge (c) preparing the grouting pipes and the front cover for pressure grouting (d) sealing the outlets at the front cover, and (e) a prepared the steel bar before grouting Figure 4.19 Locations of strain gauges and fiber optical sensors along the soil nail
(e)
(c) Grouting pipes
Sealed O-ring
Sealed with O-ring inside
(d)
SG 1 SG 2 & FBG 2
300 30030050 50
SG 3 & FBG 3 SG 4 & FBG 4
Pulling out
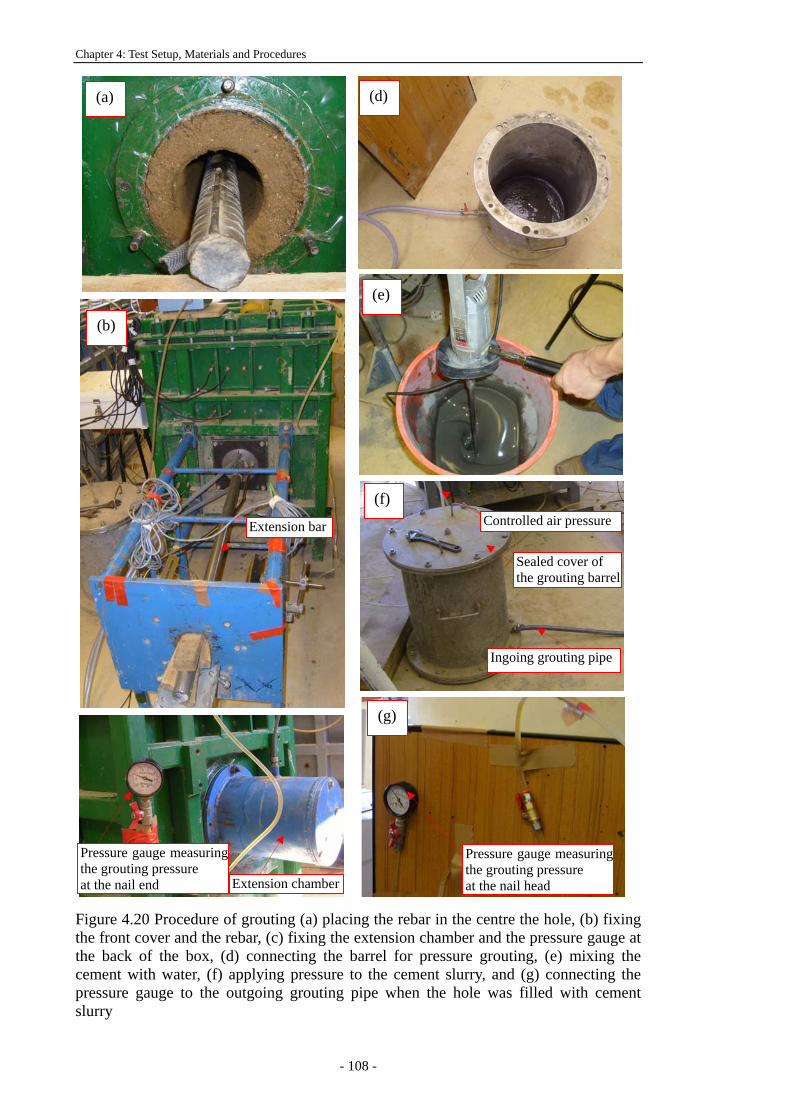
Chapter 4: Test Setup, Materials and Procedures
- 108 -
Figure 4.20 Procedure of grouting (a) placing the rebar in the centre the hole, (b) fixing the front cover and the rebar, (c) fixing the extension chamber and the pressure gauge at the back of the box, (d) connecting the barrel for pressure grouting, (e) mixing the cement with water, (f) applying pressure to the cement slurry, and (g) connecting the pressure gauge to the outgoing grouting pipe when the hole was filled with cement slurry
Ingoing grouting pipe
Sealed cover of the grouting barrel
Controlled air pressure Extension bar
(a)
(b)
(d)
(f)
(e)
(c) (g)
Pressure gauge measuring the grouting pressure at the nail head Extension chamber
Pressure gauge measuring the grouting pressure at the nail end
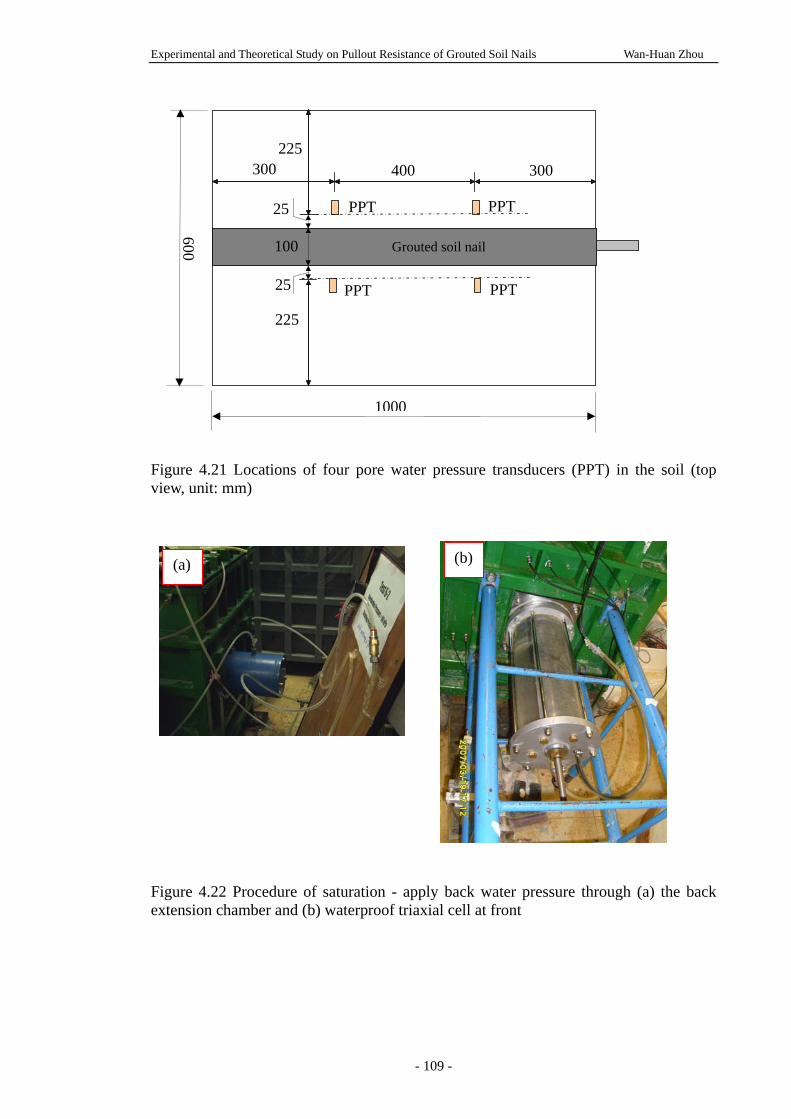
Experimental and Theoretical Study on Pullout Resistance of Grouted Soil Nails Wan-Huan Zhou
- 109 -
Figure 4.21 Locations of four pore water pressure transducers (PPT) in the soil (top view, unit: mm) Figure 4.22 Procedure of saturation - apply back water pressure through (a) the back extension chamber and (b) waterproof triaxial cell at front
400300
300
PPT
PPT
PPT
PPT
225
100
225
600
1000
25
25
Grouted soil nail
(b)(a)
Chapter 4: Test Setup, Materials and Procedures
- 110 -
Experimental and Theoretical Study on Pullout Resistance of Grouted Soil Nails Wan-Huan Zhou
- 111 -
Chapter 5:
LABORATORY SOIL NAIL PULLOUT
EXPERIMENTS AND RESULTS
5.1 INTRODUCTION
Grouted soil nails are widely used in slope stabilization. The influence of both grouting
pressure and overburden pressure on the soil nail pullout interface shear resistance is
still not well understood owing to the complexity of soil-grout interactions. A series of
laboratory soil nail pullout tests have been carried out on a soil nail in a completely
decomposed granite (CDG) soil in a nearly saturated condition under a combination of
different grouting pressures and overburden pressures. The soil nail pullout tests
simulate the real construction process of a soil nail, including establishment of initial
earth pressure in a soil slope, drilling a hole with stress release, grouting, and soil nail
pullout when the slope is sliding. The pullout box is well instrumented. The test setup,
material properties and test procedures are described in detail in Chapter 4.
The data obtained from the data logger throughout the tests have been analyzed and are
presented in this chapter. The stresses and pore water pressures developed in the soil,
the pullout force and displacement of the soil nail, and the strains developed along the
soil nail are plotted for each phase of the experiment. Firstly the test programme is
introduced. The typical results and observations during and after the overburden
pressure application, hole drilling, pressure grouting, soil saturation, and soil nail
pullout are then presented and discussed. Finally, the photos and data, obtained in the
Chapter 5: Laboratory Soil Nail Pullout Experiments and Results
- 112 -
post-test examination, are summarized and presented. The pullout test data are further
analyzed, compared and interpreted in Chapter 6.
5.2 TEST PROGRAMME
A series of laboratory pullout tests have been carried out to study the effect of both
overburden pressure and grouting pressure on the soil nail pullout resistance. All the
pullout tests were conduced in a saturated condition. The applied overburden pressure
varied from 80 kPa to 350 kPa and the applied grouting pressure ranged from 80 kPa to
300 kPa. A total of 12 pullout tests were carried out. The test programme is shown in
Table 5.1.
5.3 RESULTS AND OBSERVATIONS BEFORE PULLOUT
5.3.1 Stress variations during overburden pressure application and hole drilling
After application of overburden pressure (OP), the earth pressures in the box were
observed to reach a stable value after some time, indicating that the stress equilibrium
was successfully established in the box. As described in Chapter 4, 6 earth pressure cells
were embedded to monitor the total vertical pressure changes during testing. As shown
in Figure 4.20, two earth pressure cells (P-Cells 1 and 2) were placed about 45 mm
below the soil nail surface (to be constructed) and another two cells (P-Cells 3 and 4)
about 45 mm above the soil nail surface. The other two earth pressure cells (P-Cells 5
and 6) were placed approximately in the middle between the soil nail top surface and
the top soil surface in the box. Figure 5.1 (a, b and c) shows the variations of earth
pressures at the 6 locations during the OP application of 120kPa, 240kPa and 350kPa,
respectively. It can be seen that the time needed for the establishment of stress
Experimental and Theoretical Study on Pullout Resistance of Grouted Soil Nails Wan-Huan Zhou
- 113 -
equilibrium, under different overburden pressures, is different. The initial density of
the soil was controlled approximately at 95% of maximum dry density of the soil for
each test. It was found that the stronger the applied overburden pressure, the greater the
soil settlement, and the longer the time needed to obtain stress equilibrium.
The overburden pressure was applied, adjusted and maintained to a certain value until
the soil settlement gradually became stable. It should be noted that, some fluctuations
and sudden changes of the earth pressures, seen in Figure 5.1 (b and c), were due to the
sudden adjustment of the overburden pressure during the testing. It can be seen from
Figure 5.1 that: for the test under OP of 120kPa, the time needed for stress
establishment is about 2 hours; for the test under OP of 240 kPa, the time needed is as
long as 20 hours; while the test under OP of 350 kPa, the time needed is more than 40
hours.
After the stress equilibrium had been established in the soil under an overburden
pressure, a horizontal hole was then drilled through the box and into the extension
chamber 20mm. Consequently, the initial stresses established under the given
overburden pressure were reduced to zero at the perimeter of the drillhole (e.g. stress
release). Figure 5.2 (a, b and c) shows the changes of earth pressures, during drilling,
for the tests under OP of 120kPa, 240kPa and 350kPa, respectively. The vertical earth
pressures measured by P-Cells 1 and 3 are the first to drop, as they are located near the
front of the box. The pressures measured by P-Cells 2 and 4 drop later, as shown in
Figure 5.2. The changes of the vertical pressures at the other two earth pressure cells
(P-Cells 5 and 6) are not significant, as they are relatively far away from the drillhole.
After drilling, the earth pressures near the drillhole (measured by P-Cells 1, 2, 3, and 4)
reduce to small, but slightly larger than zero, values, since the cells are placed inside the
Chapter 5: Laboratory Soil Nail Pullout Experiments and Results
- 114 -
soil at a distance of about 45 mm above or below the hole perimeter. It was noted that
the earth pressure responses were similar to the previous test results reported by Su
(2006).
5.3.2 Stress variations during pressure grouting
After drilling, cement slurry pressure grouting was conducted and the earth pressure
responses, during the grouting, were monitored. Figure 5.3 shows the changes in the
earth pressures at P-Cells 1, 2 ,3, 4, 5, and 6 with time monitored during the pressure
grouting under GP = 300 kPa and OP = 350 kPa. It is seen in Figure 5.3 that the initial
earth pressures at P-Cell 1, 2, 3, and 4 before grouting are not the same. This is because
the distances between the earth pressure cells and the soil nail surfaces changed with the
soil settlement and soil particle re-arrangement during and after the test phases of soil
compaction, overburden pressure application, and hole drilling. It is well known that
the stresses, close to the perimeter of the drillhole, have dramatic variations. Therefore,
any small difference in the locations of the earth pressure cell above (or below) the
drillhole surface will result in a big variation in the measured earth pressure. The
different initial earth pressures at P-Cells 1, 2, 3, and 4 before grouting are also
observed in other test data shown in Figure 5.4, Figure 5.5 and Figure 5.6.
As described in Chapter 4, the grouting pressure was applied initially at 20 kPa for a
few minutes until the hole was fully filled with cement slurry, and then gradually
increased to a certain grouting pressure, i.e. 300 kPa in Figure 5.3. It is clearly observed
in Figure 5.3 that earth pressures at P-Cells 1, 2, 3, and 4 increase rapidly to peak values,
while pressures at P-Cells 5 and 6 (about 235 mm distance away from the drillhole) are
almost unchanged. The increased pressures at P-Cell 1, 2, 3, and 4 were maintained for
about 15 mins, though the applied grouting pressure of 300 kPa was kept for 30 mins. It
Experimental and Theoretical Study on Pullout Resistance of Grouted Soil Nails Wan-Huan Zhou
- 115 -
was also observed from the two pressure gauges (one at the nail head and the other at
the nail end) that the measured grouting pressure dropped at about 15 mins after the
grouting pressure had been applied. In Figure 5.3, the pressures in the soil around the
soil nail can be seen to have gradually decreased to the values slightly larger than those
before the grouting. This is because the resistance to the grouting pressure transfer,
increased with the hardening of the cement slurry in the pipe and the drillhole. Since the
applied grouting pressure could not be transferred to the cement slurry through the
grouting pipe into the drillhole, the grouting pressures in the drillhole could not be
maintained for 30 mins, as the applied grouting pressure had been.
Shown in Figure 5.4 are the changes of earth pressures with time during pressure
grouting for the tests under the same GP = 250 kPa, but different overburden pressures
(a) OP = 350 kPa and (b) OP = 240 kPa. It can be seen that, although the applied
grouting pressure of 250 kPa in the grouting barrel was kept for 30 mins, the increased
pressure at P-Cells 1, 2, 3 and 4 is only maintained for about 10 mins and then decrease,
with time, to stable values.
The relationships between earth pressures and time during pressure grouting for the tests
under the same GP = 130 kPa, but different overburden pressures (a) OP = 350 kPa and
(b) OP = 240 kPa are shown in Figure 5.5 The measured earth pressures around the soil
nail increased significantly at the time when the applied grouting pressure increased
from 20 kPa to 130 kPa. It is seen that the increased pressures are maintained for about
8 mins and then decrease gradually to stable values.
Figure 5.6 shows relationships between earth pressures and time during pressure
grouting for the tests under GP = 80 kPa and (a) OP = 350 kPa, (b) OP = 120 kPa, and (c)
Chapter 5: Laboratory Soil Nail Pullout Experiments and Results
- 116 -
OP = 80 kPa. It is seen the earth pressure at P-Cells 1, 2, 3, 4 increase significantly
when the 80 kPa grouting pressure is applied, and then drop to stable values with time.
It is noted in Figures 5.3, 5.4, and 5.5 that irregular changes in earth pressures, that is,
intermittent increases and decreases, are observed at P-Cells 1, 2, 3, and 4 during
grouting. The two grouting pressure gauges also detected simultaneous changes of the
grouting pressure during testing. These irregular changes more likely happened in the
tests under higher grouting pressures (i.e. GP = 300 kPa, 250 kPa and 130 kPa), but
were not distinct in the tests under lower grouting pressures, for example, as the data
shows in Figure 5.6 with GP = 80 kPa. This irregular pressure change phenomenon can
be explained by understanding the process of pressure grouting in a porous soil.
Immediately after the grouting pressure is applied, the pressure is first transmitted to the
soil surface at the perimeter of the drillhole. The total earth pressure of the soil near the
drillhole perimeter is increased by the grouting pressure of the cement slurry and
detected by the earth pressure cells (P-Cells 1, 2, 3, and 4). The excess pore water
pressure in the soil, near the drillhole, increases quickly with the grouting pressure. If
the grouting pressure is high enough, some cracks within the soil might suddenly be
generated to allow for the dissipation of the pore pressure in the soil, caused by a
sudden decrease of the grouting pressure in the drillhole. As a result, more cement slurry
under the applied pressure in the grouting barrel is injected into the drillhole, and the
grouting pressure in the drillhole increases once more, until the cement grout in the
plastic grout tube could not move at all due to the viscosity increase (or hardening) of
the grout. Soil crack generation may occur more than once, resulting in several sudden
decrease-increase changes as shown in Figures 5.3(a) and Figure 5.4(a, b). When the
grouting pressure is low, few cracks generate. This explains why no irregular changes
are shown in Figure 5.5.
Experimental and Theoretical Study on Pullout Resistance of Grouted Soil Nails Wan-Huan Zhou
- 117 -
It is also noted that the decrease in the earth pressures in the tests under GP = 80 kPa
and shown in Figure 5.5, is much faster than the tests under higher grouting pressures
(GP = 300 kPa in Figure 5.3a, GP = 250 kPa in Figure 5.3b and GP = 130 kPa in Figure
5.4). That is to say, the higher the applied grouting pressure, the longer the
maintenance of that pressure. The reason relates to the phenomenon of crack generation
during grouting. When the grouting pressure is high, cracks are generated, more cement
slurry is injected into the drillhole to maintain the grouting pressure, and consequently
the cement slurry in the grouting pipe and the drillhole is thus partly renewed during
this process. As a result the hardening of the cement slurry is delayed in the grouting
pipe and drillhole.
5.3.3 Results during saturation
Two days after grouting, de-aired water was supplied to the soil in the box through
plastic tubes connected to the box and a back water pressure of 30 kPa was applied to
saturate the soil. The overburden pressure was increased correspondingly, to maintain a
consistent and effective overburden pressure. Descriptions of the setup and saturation
procedures are given in Chapter 4.
As shown in the top view in Figure 4.25, four pore water pressure transducers (PPT) are
installed at 25 mm away from the soil nail side surface. The use of a vacuum air pump
might produce some suction in the soil at the beginning of the saturation. However, with
the relatively high permeability of the CDG soil (about 10-6 m/s), water flowed into the
soil, rapidly filling the pores. Hence suction was not immediately observed after the
back pressure was applied. It was noted that the pore water pressure inside the box
may not be uniform in the vertical direction, as the back pressure was applied from the
Chapter 5: Laboratory Soil Nail Pullout Experiments and Results
- 118 -
lower part of the box. The use of the vacuum air pump and the increase of the applied
overburden pressure may cause some soil settlement, especially for the soil in the upper
box. The effective overburden pressure should therefore be adjusted slowly until the
stress equilibrium was re-established inside the box and the water pressure became
uniform throughout the box.
The effective stress in the box can be calculated by subtracting the average pore
pressure from the total stress measured by earth pressure cells. Since P-Cell 5 and
P-Cell 6 were placed far away from the soil nail, the variations of average effective
stress at P-Cell 5 and P-Cell 6 could represent the changes of the effective overburden
pressure. Figure 5.6 shows the changes of effective vertical stresses in the box with time,
during saturation, for the test under OP of 350 kPa and GP of 250 kPa. As indicated
above, the soil suction, observed at the beginning of saturation in the figure, is due to
the use of a vacuum air pump. It was observed that the suction rapidly disappears as
the water flows into the soil under the back pressure. From Figure 5.6, it can be seen
that after saturation, the increase in the vertical effective stress around the soil nail (data
from P-Cells 1, 2, 3 and 4) is larger than the increase in the effective overburden
pressure (data from P-Cells 5 and 6). This phenomenon actually reflects the collapse
of the arching effect in the soil around the soil nail during saturation. When water flows
into the voids in the soil, the soil particles surrounding the soil nail move and re-arrange,
and the arching around the soil nail is relaxed. Thus, soils adjacent to the soil nail take a
larger share of the overburden pressure, so that the total earth pressures at P-Cells 1, 2, 3,
and 4, to certain extent, increase.
When the grouting pressure is lower, the above mentioned phenomenon is less distinct,
as shown in Figure 5.7 (b) for the test under OP = 350 kPa and GP = 130 kPa and Figure
Experimental and Theoretical Study on Pullout Resistance of Grouted Soil Nails Wan-Huan Zhou
- 119 -
5.7 (c) for the test under OP = 350 kPa and GP = 80 kPa. This is because the stress
increase in the soil adjacent to the soil nail is related to the soil densification during the
pressure grouting. Kleyner and Krizek (1995) studied the effect of grouting pressure
and duration on the densification of the soil near a borehole. They found that the loose
soil around a hole after drilling was re-compacted by the grouting pressure and that the
average void ratio in the adjacent zone decreased considerably after the grout pressure
was applied. Anecdotically, although the grouting pressure decreases after a short
duration, the effect of soil densification by the pressure grouting is irreversible. The
higher the applied grouting pressure, the denser the soil around the soil nail. It is
believed that during the saturation process, the stress increase in the denser soil is more
significant. But this stress increase in the soil far away from the soil nail has a less
distinct interface, such as at the locations of P-Cells 5 and 6.
5.4 RESULTS AND OBSERVATIONS DURING PULLOUT
5.4.1 Strain data comparison
For each pullout test, 4 electrical resistance-type strain gauges (SG) were installed along
the steel rebar to measure the axial strains along the soil nail. The steel rebar was 40mm
in diameter and 1.2 m in length. The strain responses were therefore relatively small,
with a maximum strain of about 100 micro strains during pullout. To insure the
reliability of the strain results, a series of Fibre Bragg Grading (FBG) strain sensors
were employed and adhered to the locations near the strain gauges. A typical array of
the strain gauges and FBG sensors are shown in Figure 4.19, where 3 FBG sensors are
located beside SG2, SG3, and SG4. The data measured by FBG sensors are used to
compare and verify the strain gauge data.
Chapter 5: Laboratory Soil Nail Pullout Experiments and Results
- 120 -
Figure 5.8 shows the comparisons of strain data measured by strain gauges and FBG
sensors for the test under OP=240kPa and GP=130kPa. From the figure, it can be seen
that both strain gauges and FBG sensors give similar strain results. In Figure 5.8 (b & c),
when the strains are small, the FBG strain curve is more smooth than the SG stain curve.
The FBG sensors appear to provide higher reliability than the strain gauges for the small
strain monitoring. In Figure 5.8 (a & b), the difference between FBG data and SG data
becomes bigger at the end of the pullout. The possible reason is that the FBG and SG
sensor locations, along the soil nail, are not exactly the same. After the soil nail pullout
resistance was reached, the interface shear stresses along the soil nail were unevenly
distributed, resulting in the bigger axial strain variations at different locations along the
soil nail.
5.4.2 Typical results during pullout
The soil nail was pulled out from the nail head on the fifth day after grouting. The load
was applied step by step and held for 1 hour for each loading step. During the pullout of
the soil nail, the variations of pullout force, pullout displacement, vertical earth
pressures at six locations, pore water pressures at four locations and the strains in the
soil nail, were automatically monitored and recorded. The initial results from the pullout
test under OP = 350 kPa and GP = 250 kPa and the pullout test under OP = 240 kPa and
GP = 130 kPa were selected as typical results and presented in this section.
For each pullout testing, the relationship of pullout force, effective earth pressure at six
locations (Figure 4.20) in the soil and strains at four locations in the soil nail, versus
time or pullout displacement was obtained. The monitored data during the pullout
testing for the test under OP = 350kPa and GP = 250kPa is shown in Figure 5.9 The
pore water pressure was considered stable and uniform in the soil during the pullout,
Experimental and Theoretical Study on Pullout Resistance of Grouted Soil Nails Wan-Huan Zhou
- 121 -
when the soil had been saturated for about three days. The effective earth pressures were
therefore calculated by subtracting the average pore water pressure from the (total) earth
pressures measured by the 6 earth pressure cells (P-Cells 1-6). The locations of the
measured strains are shown in Figure 4.24. The observations, revealed in Figures 5.8,
are presented below:
(a) the pullout load increases step by step with time, and decreases gradually after
reaching the peak;
(b) the effective earth pressures at P-Cells 1, 2, 3, and 4 respond simultaneously with
the pullout force, while the effective earth pressures at P-Cells 5 and 6 change little
during the pullout as they are far from the nail, suggesting that the effect of soil nail
pullout, on the surrounding soil, is localized in a limited area around that soil nail;
(c) the axial strains along the soil nail show a corresponding response at the time when
the pullout force is applied step by step; the nearer to the nail head, the bigger the
observed strain responses; the strains near to the end of the soil nail change little
with the values below 15 micro-strains during the pullout;
(d) the pullout force increases linearly with the pullout displacement in the first few
millimeters, and then increases nonlinearly until the peak is reached. This is
followed by softening behaviour.
The monitored data during pullout for the test under OP = 240 kPa and GP = 130kPa is
shown in Figure 5.10. In Figure 5.9b and Figure 5.10b, it is seen that both the effective
earth pressures at P-Cells 5 and 6 drop slightly at the end of the pullout. This may be
due to the failure at the soil-nail interface after the peak pullout resistance has been
reached. This interface failure may cause soil settlement, and even decrease in the earth
pressure around the soil nail. Examples are: the locations at P-Cells 5 and 6.
Chapter 5: Laboratory Soil Nail Pullout Experiments and Results
- 122 -
For the effective earth pressures around the soil nail (i.e. data measured by P-Cells 1, 2,
3, and 4), the variations are generally different for each test. Sometimes for the same
test, the measured earth pressures vary, even though the earth pressure cells were
originally placed at the same distance away from the soil nail surface. The possible
reasons are:
(a) The earth pressure near to the soil nail is highly dependent on OP and GP conditions.
Hence the earth pressure is likely to be different from test to test.
(b) As the pressure variations are relatively large in the soil near the soil nail, any small
difference in the locations of the earth pressure cells may result in a big difference in
the measured earth pressures.
(c) The direction of the pullout might not be controlled perfectly horizontally in such
large scale tests. The nail might tilt slightly when being pulled out, hence resulting
in different earth pressures above and below.
Therefore, the difference in the earth pressures around the soil nail is reasonable and
acceptable.
5.5 OBSERVATIONS AFTER PULLOUT
After the soil nail was pulled out of 100mm displacement, the entire soil nail was then
fully extracted from the drillhole and the soil in the box removed for visual inspection.
The soil nail surface, the soil nail diameter, the degree of saturation of the soil, and the
locations of the earth pressure cells were measured and are summarized below.
5.5.1 Degree of saturation in the box
The water content of the soil adhering to or near the nail surface was measured
immediately after each pullout test. Because the back water pressure was applied
Experimental and Theoretical Study on Pullout Resistance of Grouted Soil Nails Wan-Huan Zhou
- 123 -
directly at the front and back of the soil nail, the measured water content around the soil
nail was generally higher than 20%, indicating that the soil nail pullout failure occurred
in a submerged condition.
During the soil removal after pullout, the water content of the soil in the upper, middle,
and bottom layer of the box was measured to check the degree of uniformity in the box.
Figure 5.13 shows the water content and degree of saturation, measured after pullout for
the tests under (a) OP = 130 kPa, GP = 80 kPa and (b) OP = 200 kPa, GP = 80 kPa. The
degree of saturation was calculated by assuming the soil was at 95% maximum dry
density (1.802 Mg/m3). It should be noted that the back water pressure was released
immediately after pullout. As a result, the soil water content dropped simultaneously,
and decreased more when exposed to the air during the soil removal.
Although the degree of saturation in the box, measured during the soil removal, is not
the real degree of saturation in the box during pullout, these results can still be used as a
reference to reflect the soil saturation condition during testing. It can be seen in Figure
5.11 that the water content (or degree of saturation) in the box is fairly uniform after the
test. It was found the water content (or degree of saturation) in the lower box was
comparatively higher than that in the upper box. This is because the back water pressure
was applied from the lower part of the box. The water content distribution in Figure
5.11(a) shows the results, typical of most tests. But Figure 5.11(b) shows a relatively
low water content in the box for Test 6-4 with OP = 200 kPa and GP = 80 kPa, which
indicates the saturation condition might not have been sufficient during the pullout
testing.
Chapter 5: Laboratory Soil Nail Pullout Experiments and Results
- 124 -
5.5.2 Soil nail failure surface after pullout
Figure 5.14 gives photographs of the soil nail surface for the tests under (a) OP = 350
kPa, GP = 300 kPa, (b) OP = 240 kPa, GP = 250 kPa, (c) OP = 350 kPa, GP = 130 kPa,
and (d) OP = 120 kPa, GP = 80 kPa. It is clearly seen that a layer of soil adheres to the
cement column of the soil nail during and after the soil nail pullout, indicating that the
soil nail pullout failure occurred mostly in the soil surrounding the soil nail in the
saturated condition. This is consistent with the observation reported by Su et al. (2008).
They found a noticeable increase in the thickness of soil adhesion on the nail surface as
the soil saturation degree increased from 50% to 98%.
Figure 5.15 and Figure 5.16 show the close-up view of the failure surfaces in the front
and middle part of the soil nail, respectively. It is seen that the thickness of the adhered
soil is not uniform around the soil nail. This is probably related to the grouting condition.
During grouting, pressurized cement slurry would unevenly penetrate the surrounding
soil, resulting in the uneven soil strength around the soil nail.
5.5.3 Soil nail diameter after pullout
The perimeter at the front, middle and end parts of the grout column and the adhered
soil were measured immediately after pullout. As suggested above, the failure surface is
likely to happen in the surrounding soil and not uniform around the nail. The thickness
of the adhered soil on the grout column is related to soil saturation and grouting
conditions. Table 5.2 summarizes the measured nail perimeters at the three locations and
the calculated average diameter of the soil nail for each pullout test. The soil nail
average diameters range from 103.8mm to 115.7mm.
Experimental and Theoretical Study on Pullout Resistance of Grouted Soil Nails Wan-Huan Zhou
- 125 -
5.5.4 Location changes of earth pressure cells
The depths of the earth pressure cells in the soil were measured during the soil removal,
as the embedded locations (as shown in Figure 4.20) may have changed with soil
deformations during testing. The volumemeter, connected to the top rubber bag for
overburden pressure application, monitored the water volume change in the rubber bag
during testing. This volume change approximately represented the average soil
settlement at the soil top surface during testing. It was observed that soil settlement
mainly happened during overburden pressure application, and occurred less during
drilling, grouting, saturation and pullout. It should be noted that the compaction
procedure also influences the earth pressure cell locations. The location change of earth
pressure cells was normally bigger when the overburden pressure was higher. It was
found that the average depth changes of the three layers of earth pressure cells from the
top down were 14 mm, 8 mm, and 7 mm, respectively. The maximum depth change was
25 mm, and occurred in the P-Cell 6 in the test under OP=350 kPa and GP=300 kPa.
5.6 SUMMARY
To study the influence of both grouting pressure and overburden pressure on the soil
nail pullout interface shear resistance, a series of laboratory soil-nail pullout tests have
been carried out on a soil nail in a completely decomposed granite (CDG) soil. A total
of 12 tests were conducted in a nearly saturated condition in this thesis project. In this
chapter, typical test results and observations have been presented and discussed for each
phase of the experiment. The initial presentation of the results in this chapter illustrates
the variations of soil stress, pore water pressure, and soil nail behaviour under different
test conditions and phases. With the object of accessing the influence of both
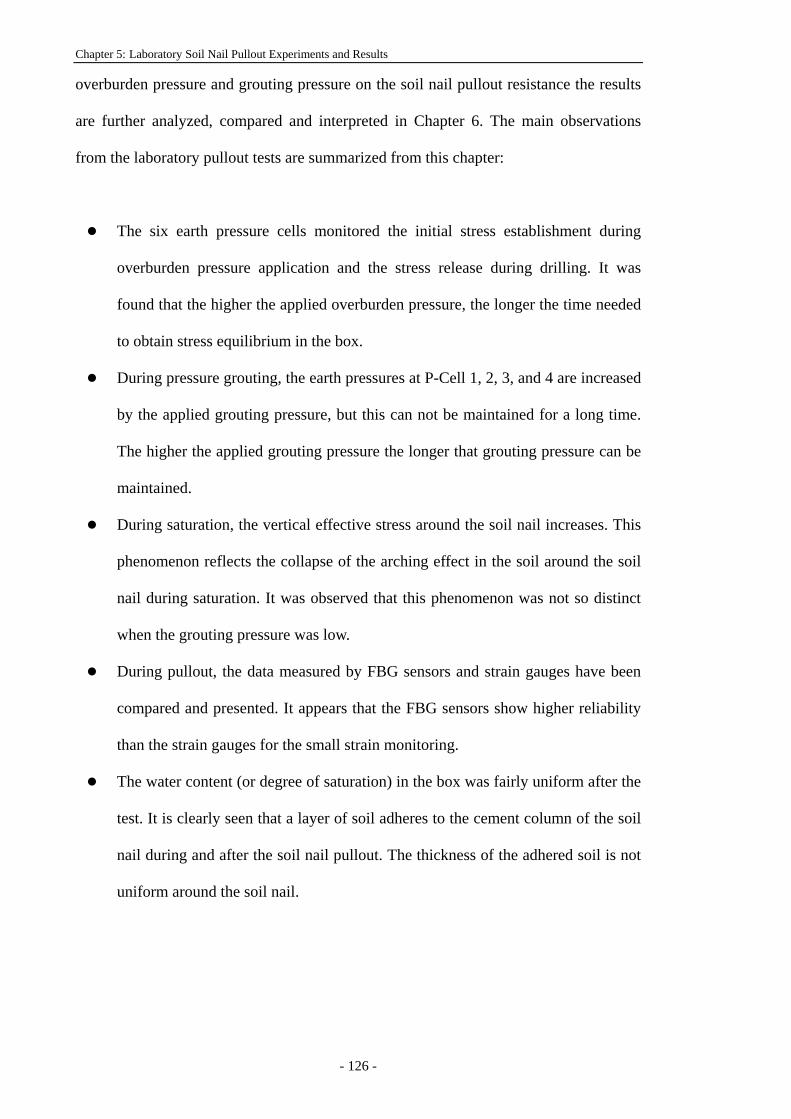
Chapter 5: Laboratory Soil Nail Pullout Experiments and Results
- 126 -
overburden pressure and grouting pressure on the soil nail pullout resistance the results
are further analyzed, compared and interpreted in Chapter 6. The main observations
from the laboratory pullout tests are summarized from this chapter:
The six earth pressure cells monitored the initial stress establishment during
overburden pressure application and the stress release during drilling. It was
found that the higher the applied overburden pressure, the longer the time needed
to obtain stress equilibrium in the box.
During pressure grouting, the earth pressures at P-Cell 1, 2, 3, and 4 are increased
by the applied grouting pressure, but this can not be maintained for a long time.
The higher the applied grouting pressure the longer that grouting pressure can be
maintained.
During saturation, the vertical effective stress around the soil nail increases. This
phenomenon reflects the collapse of the arching effect in the soil around the soil
nail during saturation. It was observed that this phenomenon was not so distinct
when the grouting pressure was low.
During pullout, the data measured by FBG sensors and strain gauges have been
compared and presented. It appears that the FBG sensors show higher reliability
than the strain gauges for the small strain monitoring.
The water content (or degree of saturation) in the box was fairly uniform after the
test. It is clearly seen that a layer of soil adheres to the cement column of the soil
nail during and after the soil nail pullout. The thickness of the adhered soil is not
uniform around the soil nail.
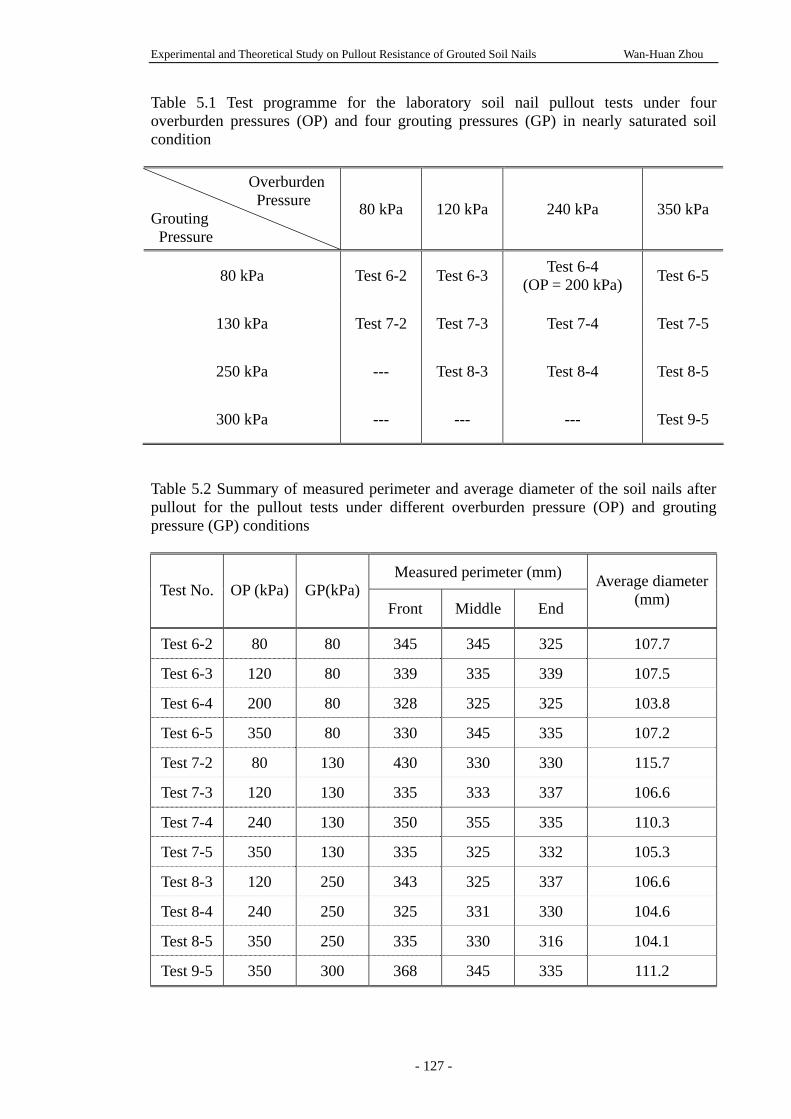
Experimental and Theoretical Study on Pullout Resistance of Grouted Soil Nails Wan-Huan Zhou
- 127 -
Table 5.1 Test programme for the laboratory soil nail pullout tests under four overburden pressures (OP) and four grouting pressures (GP) in nearly saturated soil condition
Overburden Pressure
Grouting Pressure
80 kPa 120 kPa 240 kPa 350 kPa
80 kPa Test 6-2 Test 6-3 Test 6-4 (OP = 200 kPa) Test 6-5
130 kPa Test 7-2 Test 7-3 Test 7-4 Test 7-5
250 kPa --- Test 8-3 Test 8-4 Test 8-5
300 kPa --- --- --- Test 9-5
Table 5.2 Summary of measured perimeter and average diameter of the soil nails after pullout for the pullout tests under different overburden pressure (OP) and grouting pressure (GP) conditions
Measured perimeter (mm) Test No. OP (kPa) GP(kPa)
Front Middle End
Average diameter(mm)
Test 6-2 80 80 345 345 325 107.7
Test 6-3 120 80 339 335 339 107.5
Test 6-4 200 80 328 325 325 103.8
Test 6-5 350 80 330 345 335 107.2
Test 7-2 80 130 430 330 330 115.7
Test 7-3 120 130 335 333 337 106.6
Test 7-4 240 130 350 355 335 110.3
Test 7-5 350 130 335 325 332 105.3
Test 8-3 120 250 343 325 337 106.6
Test 8-4 240 250 325 331 330 104.6
Test 8-5 350 250 335 330 316 104.1
Test 9-5 350 300 368 345 335 111.2
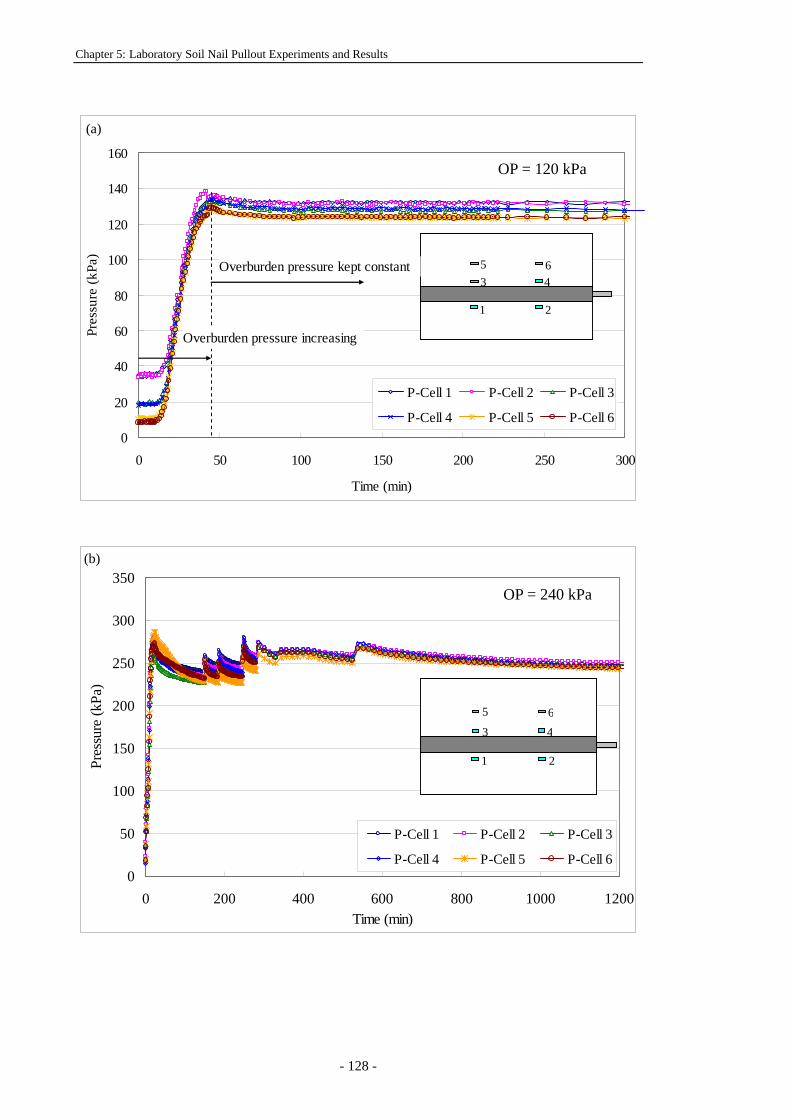
Chapter 5: Laboratory Soil Nail Pullout Experiments and Results
- 128 -
0
20
40
60
80
100
120
140
160
0 50 100 150 200 250 300
Time (min)
Pres
sure
(kPa
)
P-Cell 1 P-Cell 2 P-Cell 3
P-Cell 4 P-Cell 5 P-Cell 6
1 2
435 6
Overburden pressure increasing
Overburden pressure kept constant
0
50
100
150
200
250
300
350
0 200 400 600 800 1000 1200Time (min)
Pres
sure
(kPa
)
P-Cell 1 P-Cell 2 P-Cell 3
P-Cell 4 P-Cell 5 P-Cell 6
1 2
43
5 6
(a)
(b)
OP = 120 kPa
OP = 240 kPa
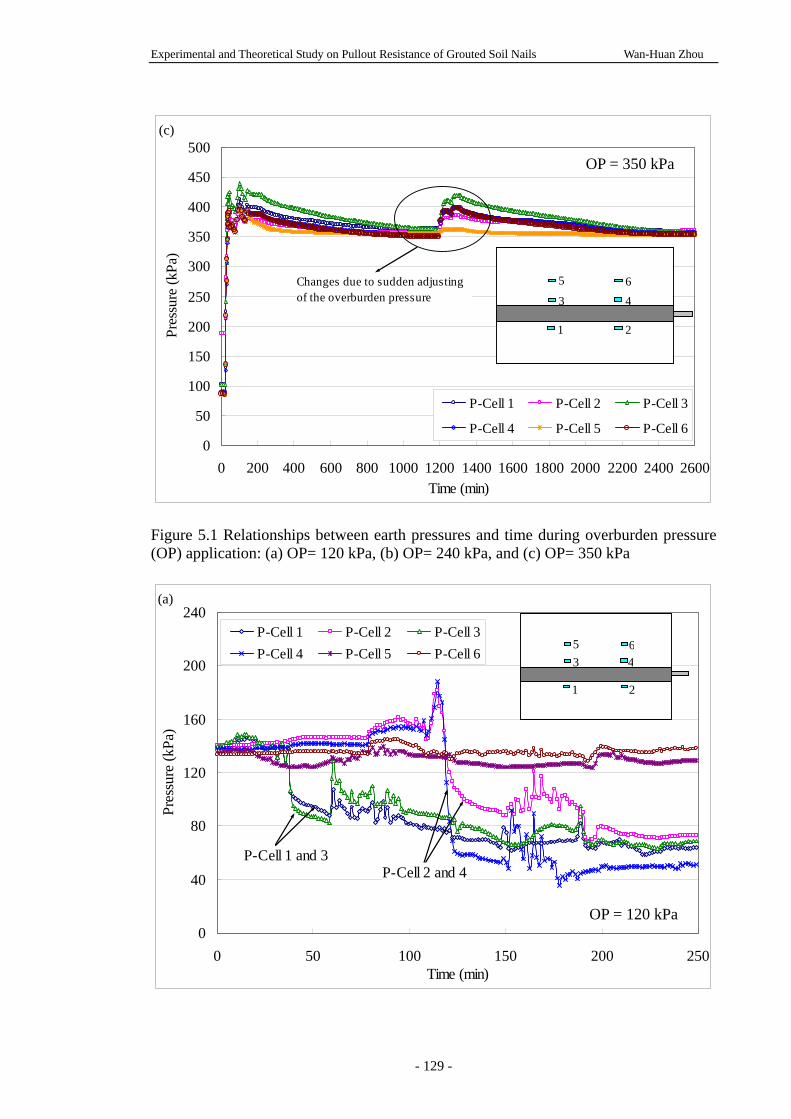
Experimental and Theoretical Study on Pullout Resistance of Grouted Soil Nails Wan-Huan Zhou
- 129 -
0
50
100
150
200
250
300
350
400
450
500
0 200 400 600 800 1000 1200 1400 1600 1800 2000 2200 2400 2600Time (min)
Pres
sure
(kPa
)
P-Cell 1 P-Cell 2 P-Cell 3
P-Cell 4 P-Cell 5 P-Cell 6
1 2
43
5 6Changes due to sudden adjustingof the overburden pressure
Figure 5.1 Relationships between earth pressures and time during overburden pressure (OP) application: (a) OP= 120 kPa, (b) OP= 240 kPa, and (c) OP= 350 kPa
0
40
80
120
160
200
240
0 50 100 150 200 250Time (min)
Pres
sure
(kPa
)
P-Cell 1 P-Cell 2 P-Cell 3P-Cell 4 P-Cell 5 P-Cell 6
1 2
435 6
P-Cell 1 and 3P-Cell 2 and 4
(c)
(a)
OP = 350 kPa
OP = 120 kPa
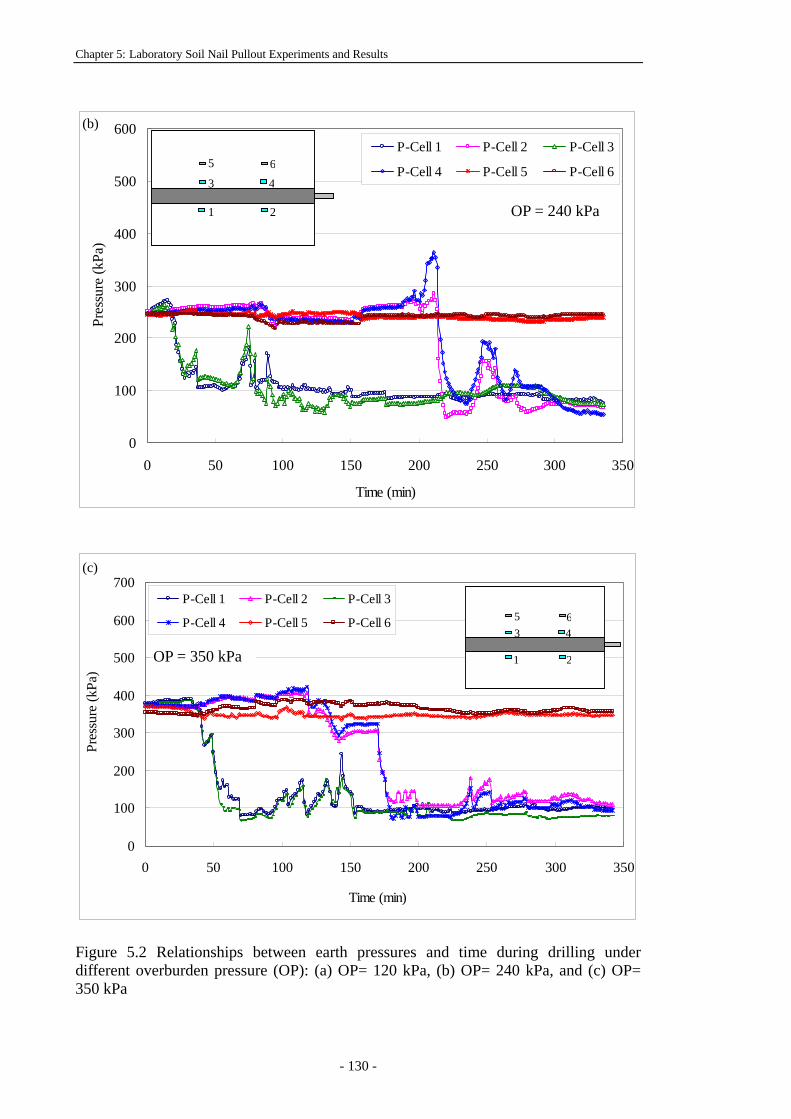
Chapter 5: Laboratory Soil Nail Pullout Experiments and Results
- 130 -
0
100
200
300
400
500
600
0 50 100 150 200 250 300 350
Time (min)
Pres
sure
(kPa
)
P-Cell 1 P-Cell 2 P-Cell 3
P-Cell 4 P-Cell 5 P-Cell 6
1 2
43
5 6
0
100
200
300
400
500
600
700
0 50 100 150 200 250 300 350
Time (min)
Pres
sure
(kPa
)
P-Cell 1 P-Cell 2 P-Cell 3
P-Cell 4 P-Cell 5 P-Cell 6
1 2
435 6
Figure 5.2 Relationships between earth pressures and time during drilling under different overburden pressure (OP): (a) OP= 120 kPa, (b) OP= 240 kPa, and (c) OP= 350 kPa
(c)
(b)
OP = 240 kPa
OP = 350 kPa
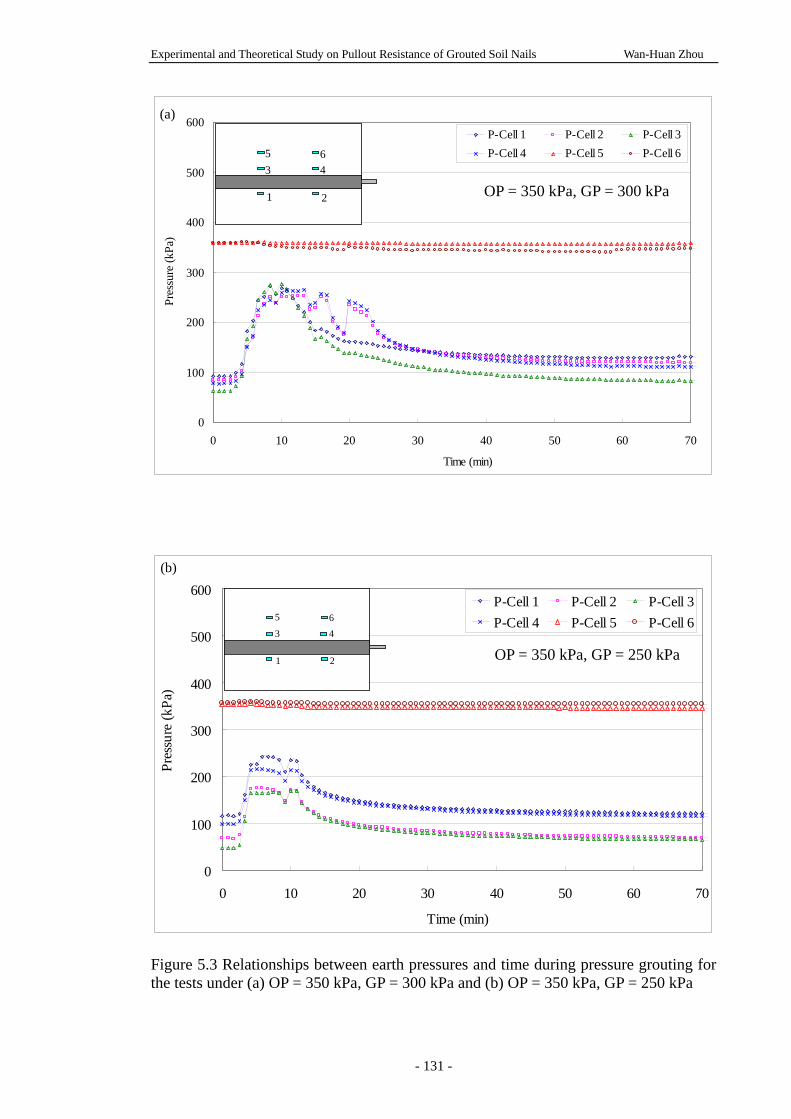
Experimental and Theoretical Study on Pullout Resistance of Grouted Soil Nails Wan-Huan Zhou
- 131 -
0
100
200
300
400
500
600
0 10 20 30 40 50 60 70
Time (min)
Pres
sure
(kPa
)
P-Cell 1 P-Cell 2 P-Cell 3P-Cell 4 P-Cell 5 P-Cell 6
1 2
435 6
0
100
200
300
400
500
600
0 10 20 30 40 50 60 70
Time (min)
Pres
sure
(kPa
)
P-Cell 1 P-Cell 2 P-Cell 3P-Cell 4 P-Cell 5 P-Cell 6
1 2
43
5 6
Figure 5.3 Relationships between earth pressures and time during pressure grouting for the tests under (a) OP = 350 kPa, GP = 300 kPa and (b) OP = 350 kPa, GP = 250 kPa
(b)
OP = 350 kPa, GP = 300 kPa
OP = 350 kPa, GP = 250 kPa
(a)
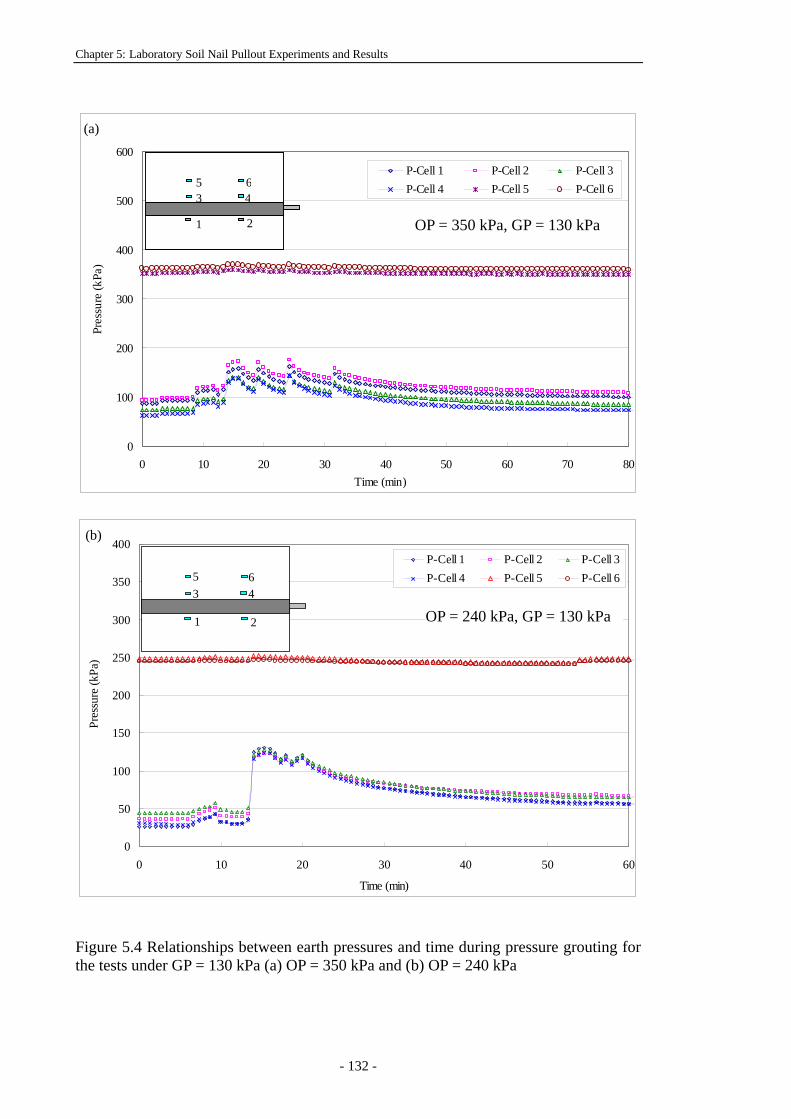
Chapter 5: Laboratory Soil Nail Pullout Experiments and Results
- 132 -
0
100
200
300
400
500
600
0 10 20 30 40 50 60 70 80Time (min)
Pres
sure
(kPa
)
P-Cell 1 P-Cell 2 P-Cell 3P-Cell 4 P-Cell 5 P-Cell 6
1 2
435 6
0
50
100
150
200
250
300
350
400
0 10 20 30 40 50 60
Time (min)
Pres
sure
(kPa
)
P-Cell 1 P-Cell 2 P-Cell 3P-Cell 4 P-Cell 5 P-Cell 6
1 2
435 6
Figure 5.4 Relationships between earth pressures and time during pressure grouting for the tests under GP = 130 kPa (a) OP = 350 kPa and (b) OP = 240 kPa
(a)
(b)
OP = 240 kPa, GP = 130 kPa
OP = 350 kPa, GP = 130 kPa
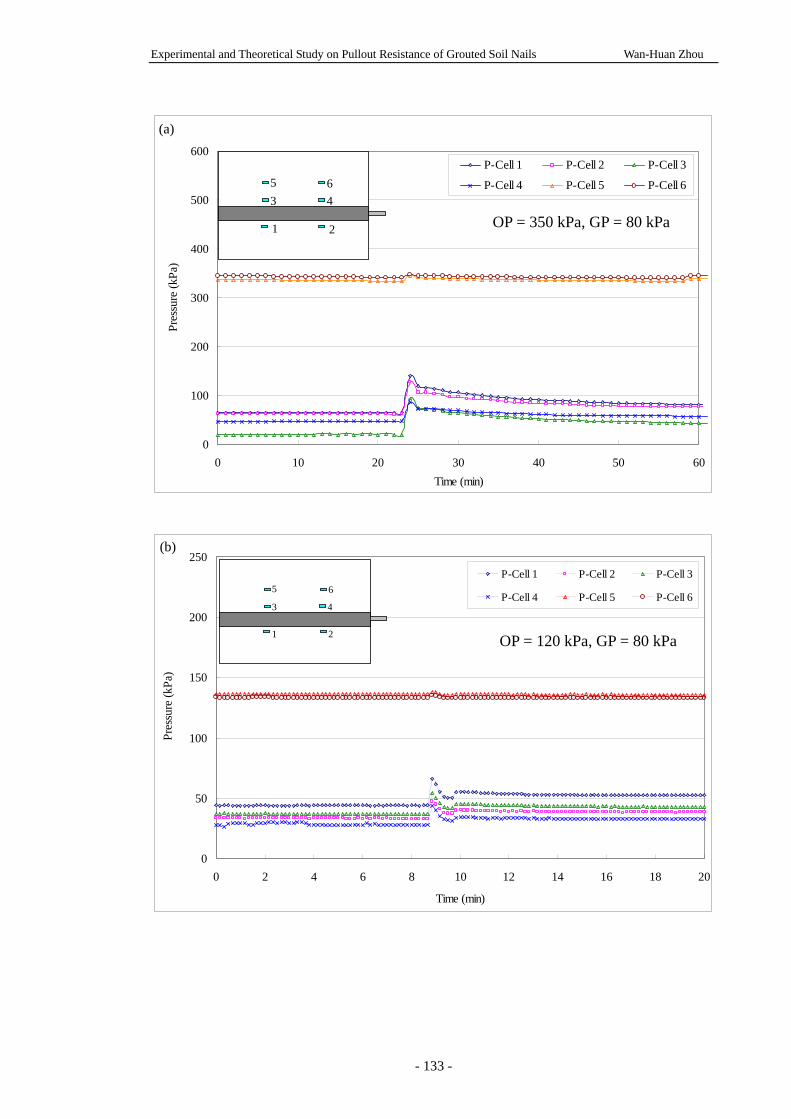
Experimental and Theoretical Study on Pullout Resistance of Grouted Soil Nails Wan-Huan Zhou
- 133 -
0
100
200
300
400
500
600
0 10 20 30 40 50 60Time (min)
Pres
sure
(kPa
)P-Cell 1 P-Cell 2 P-Cell 3
P-Cell 4 P-Cell 5 P-Cell 6
1 2
435 6
0
50
100
150
200
250
0 2 4 6 8 10 12 14 16 18 20
Time (min)
Pres
sure
(kPa
)
P-Cell 1 P-Cell 2 P-Cell 3
P-Cell 4 P-Cell 5 P-Cell 6
1 2
43
5 6
(a)
(b)
OP = 350 kPa, GP = 80 kPa
OP = 120 kPa, GP = 80 kPa
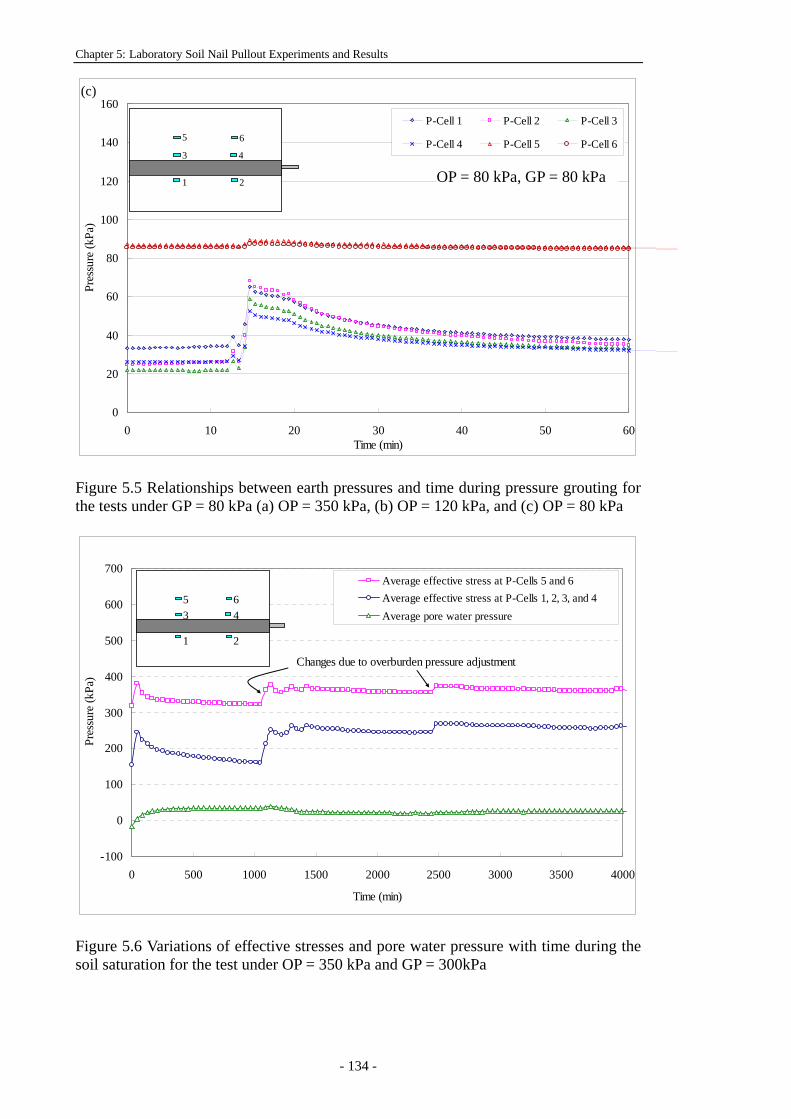
Chapter 5: Laboratory Soil Nail Pullout Experiments and Results
- 134 -
0
20
40
60
80
100
120
140
160
0 10 20 30 40 50 60Time (min)
Pres
sure
(kPa
)
P-Cell 1 P-Cell 2 P-Cell 3
P-Cell 4 P-Cell 5 P-Cell 6
1 2
43
5 6
Figure 5.5 Relationships between earth pressures and time during pressure grouting for the tests under GP = 80 kPa (a) OP = 350 kPa, (b) OP = 120 kPa, and (c) OP = 80 kPa
-100
0
100
200
300
400
500
600
700
0 500 1000 1500 2000 2500 3000 3500 4000
Time (min)
Pres
sure
(kPa
)
Average effective stress at P-Cells 5 and 6Average effective stress at P-Cells 1, 2, 3, and 4Average pore water pressure
1 2
435 6
Changes due to overburden pressure adjustment
Figure 5.6 Variations of effective stresses and pore water pressure with time during the soil saturation for the test under OP = 350 kPa and GP = 300kPa
(c)
OP = 80 kPa, GP = 80 kPa
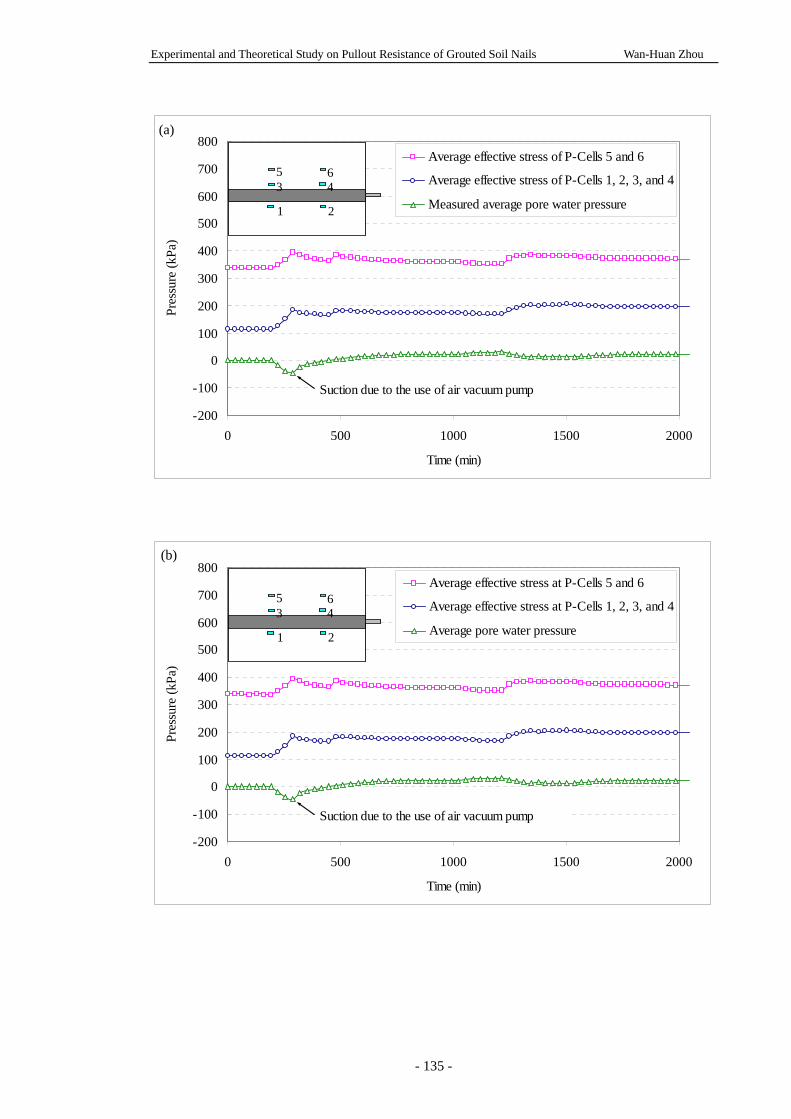
Experimental and Theoretical Study on Pullout Resistance of Grouted Soil Nails Wan-Huan Zhou
- 135 -
-200
-100
0
100
200
300
400
500
600
700
800
0 500 1000 1500 2000
Time (min)
Pres
sure
(kPa
)Average effective stress of P-Cells 5 and 6
Average effective stress of P-Cells 1, 2, 3, and 4
Measured average pore water pressure1 2
435 6
Suction due to the use of air vacuum pump
-200
-100
0
100
200
300
400
500
600
700
800
0 500 1000 1500 2000
Time (min)
Pres
sure
(kPa
)
Average effective stress at P-Cells 5 and 6
Average effective stress at P-Cells 1, 2, 3, and 4
Average pore water pressure1 2
435 6
Suction due to the use of air vacuum pump
(a)
(b)
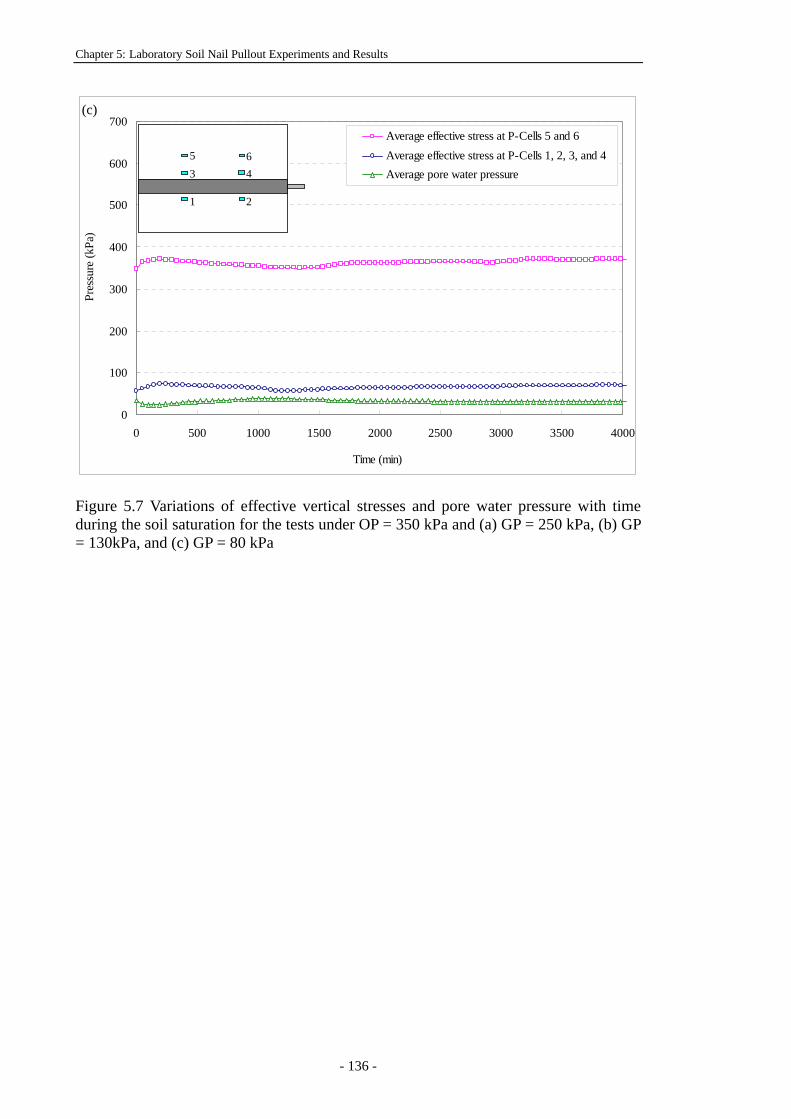
Chapter 5: Laboratory Soil Nail Pullout Experiments and Results
- 136 -
0
100
200
300
400
500
600
700
0 500 1000 1500 2000 2500 3000 3500 4000
Time (min)
Pres
sure
(kPa
)
Average effective stress at P-Cells 5 and 6Average effective stress at P-Cells 1, 2, 3, and 4Average pore water pressure
1 2
435 6
Figure 5.7 Variations of effective vertical stresses and pore water pressure with time during the soil saturation for the tests under OP = 350 kPa and (a) GP = 250 kPa, (b) GP = 130kPa, and (c) GP = 80 kPa
(c)
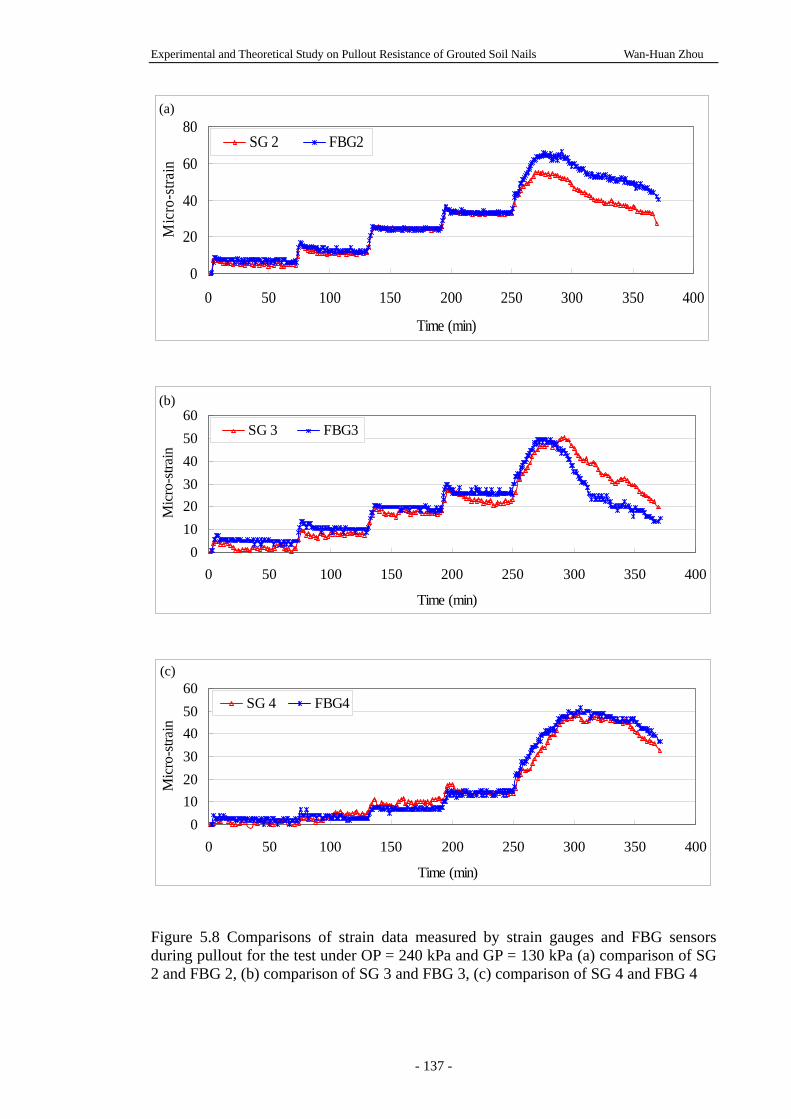
Experimental and Theoretical Study on Pullout Resistance of Grouted Soil Nails Wan-Huan Zhou
- 137 -
0
20
40
60
80
0 50 100 150 200 250 300 350 400
Time (min)
Mic
ro-s
train
SG 2 FBG2
0102030405060
0 50 100 150 200 250 300 350 400
Time (min)
Mic
ro-s
train
SG 3 FBG3
0102030405060
0 50 100 150 200 250 300 350 400
Time (min)
Mic
ro-s
train
SG 4 FBG4
Figure 5.8 Comparisons of strain data measured by strain gauges and FBG sensors during pullout for the test under OP = 240 kPa and GP = 130 kPa (a) comparison of SG 2 and FBG 2, (b) comparison of SG 3 and FBG 3, (c) comparison of SG 4 and FBG 4
(a)
(c)
(b)
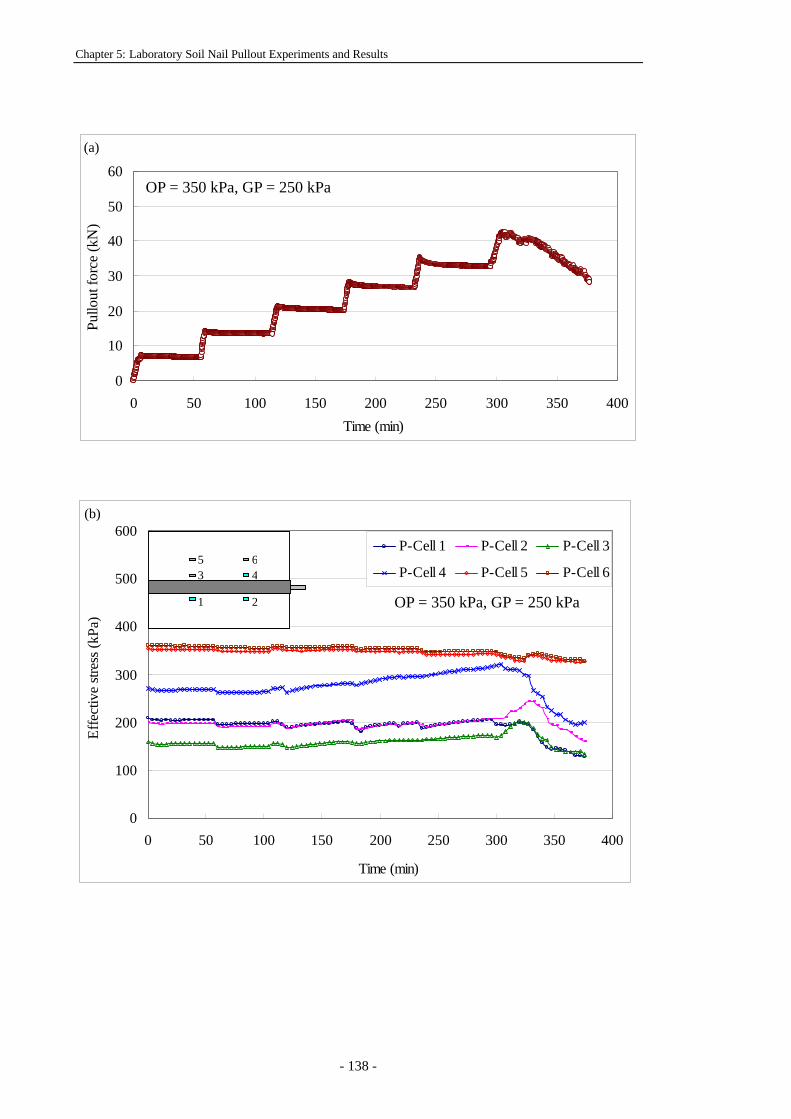
Chapter 5: Laboratory Soil Nail Pullout Experiments and Results
- 138 -
0
10
20
30
40
50
60
0 50 100 150 200 250 300 350 400Time (min)
Pullo
ut fo
rce
(kN
)
0
100
200
300
400
500
600
0 50 100 150 200 250 300 350 400
Time (min)
Effe
ctiv
e str
ess (
kPa)
P-Cell 1 P-Cell 2 P-Cell 3
P-Cell 4 P-Cell 5 P-Cell 6
1 2
435 6
(a)
(b)
OP = 350 kPa, GP = 250 kPa
OP = 350 kPa, GP = 250 kPa
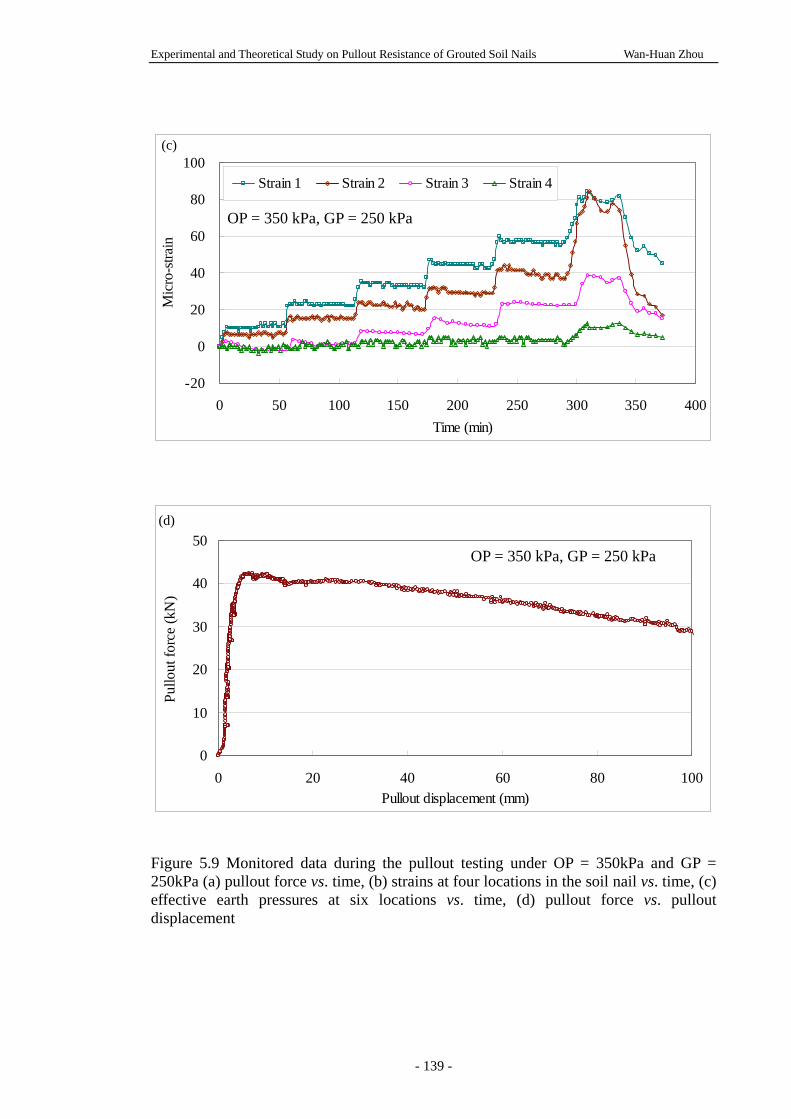
Experimental and Theoretical Study on Pullout Resistance of Grouted Soil Nails Wan-Huan Zhou
- 139 -
-20
0
20
40
60
80
100
0 50 100 150 200 250 300 350 400Time (min)
Mic
ro-s
train
Strain 1 Strain 2 Strain 3 Strain 4
0
10
20
30
40
50
0 20 40 60 80 100Pullout displacement (mm)
Pullo
ut fo
rce
(kN
)
Figure 5.9 Monitored data during the pullout testing under OP = 350kPa and GP = 250kPa (a) pullout force vs. time, (b) strains at four locations in the soil nail vs. time, (c) effective earth pressures at six locations vs. time, (d) pullout force vs. pullout displacement
(c)
(d)
OP = 350 kPa, GP = 250 kPa
OP = 350 kPa, GP = 250 kPa
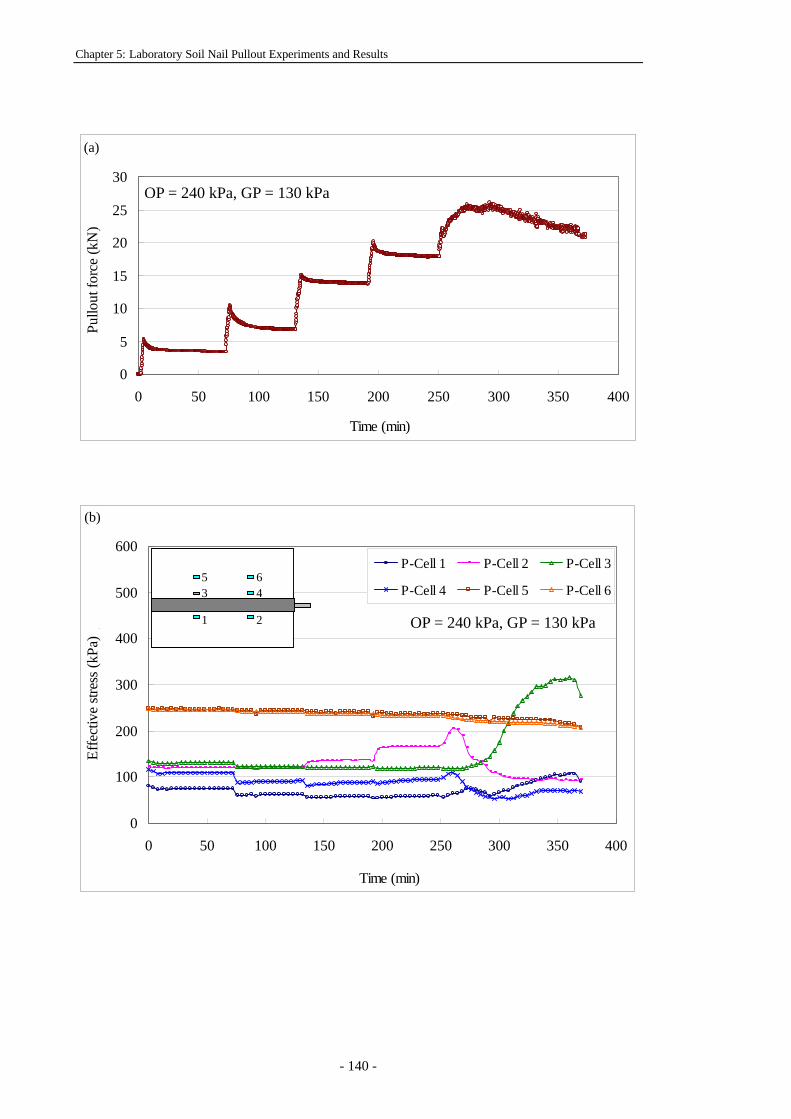
Chapter 5: Laboratory Soil Nail Pullout Experiments and Results
- 140 -
0
5
10
15
20
25
30
0 50 100 150 200 250 300 350 400
Time (min)
Pullo
ut fo
rce
(kN
)__
0
100
200
300
400
500
600
0 50 100 150 200 250 300 350 400
Time (min)
Effe
ctiv
e str
ess (
kPa)
,
P-Cell 1 P-Cell 2 P-Cell 3
P-Cell 4 P-Cell 5 P-Cell 6
1 2
435 6
(a)
(b) (b)
OP = 240 kPa, GP = 130 kPa
OP = 240 kPa, GP = 130 kPa
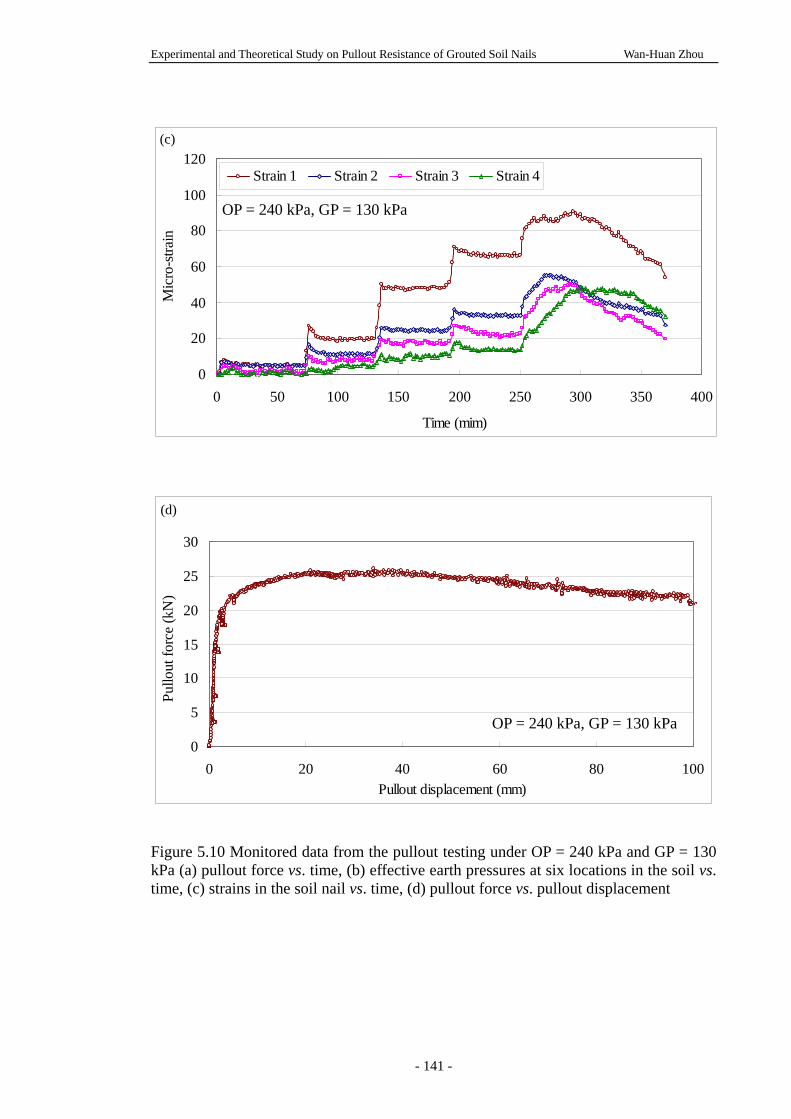
Experimental and Theoretical Study on Pullout Resistance of Grouted Soil Nails Wan-Huan Zhou
- 141 -
0
20
40
60
80
100
120
0 50 100 150 200 250 300 350 400
Time (mim)
Mic
ro-s
train
Strain 1 Strain 2 Strain 3 Strain 4
0
5
10
15
20
25
30
0 20 40 60 80 100Pullout displacement (mm)
Pullo
ut fo
rce
(kN
) a
Figure 5.10 Monitored data from the pullout testing under OP = 240 kPa and GP = 130 kPa (a) pullout force vs. time, (b) effective earth pressures at six locations in the soil vs. time, (c) strains in the soil nail vs. time, (d) pullout force vs. pullout displacement
(c)
(d)
OP = 240 kPa, GP = 130 kPa
OP = 240 kPa, GP = 130 kPa
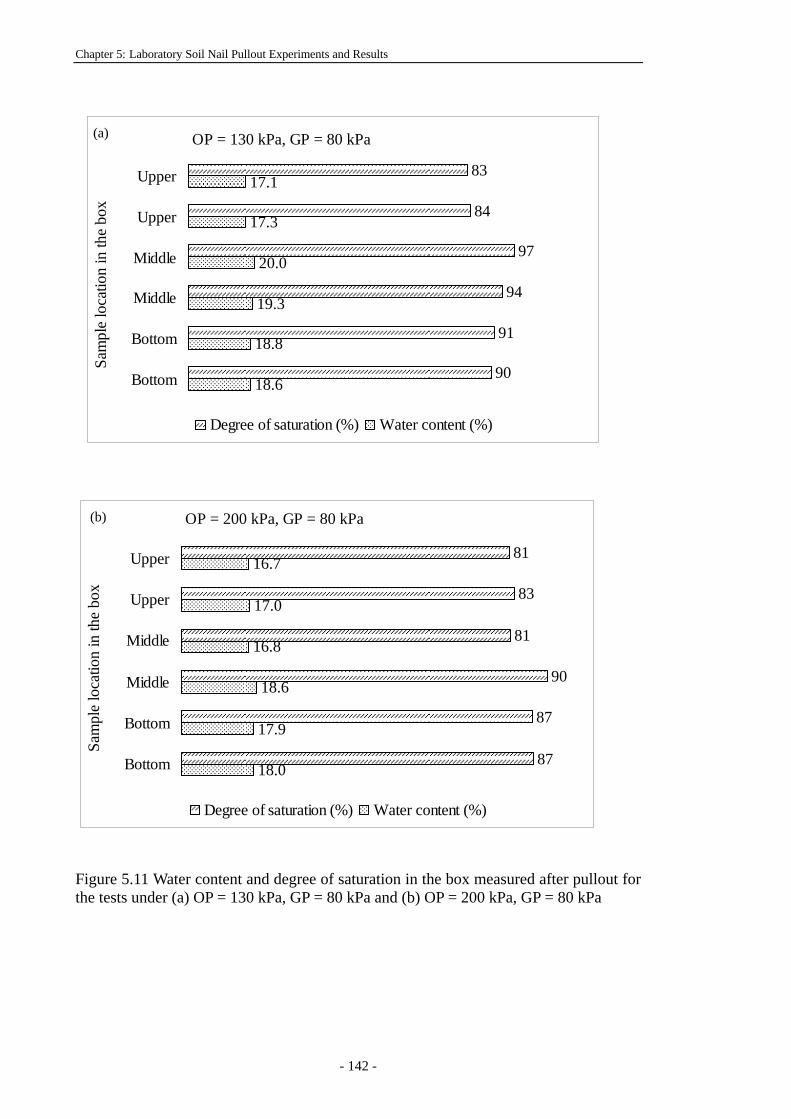
Chapter 5: Laboratory Soil Nail Pullout Experiments and Results
- 142 -
83
84
97
94
91
90
17.1
17.3
20.0
19.3
18.8
18.6
Upper
Upper
Middle
Middle
Bottom
Bottom
Sam
ple
loca
tion
in th
e bo
x
Degree of saturation (%) Water content (%)
OP = 130 kPa, GP = 80 kPa
81
83
81
90
87
87
16.7
17.0
16.8
18.6
17.9
18.0
Upper
Upper
Middle
Middle
Bottom
Bottom
Sam
ple
loca
tion
in th
e bo
x
Degree of saturation (%) Water content (%)
OP = 200 kPa, GP = 80 kPa
Figure 5.11 Water content and degree of saturation in the box measured after pullout for the tests under (a) OP = 130 kPa, GP = 80 kPa and (b) OP = 200 kPa, GP = 80 kPa
(a)
(b)
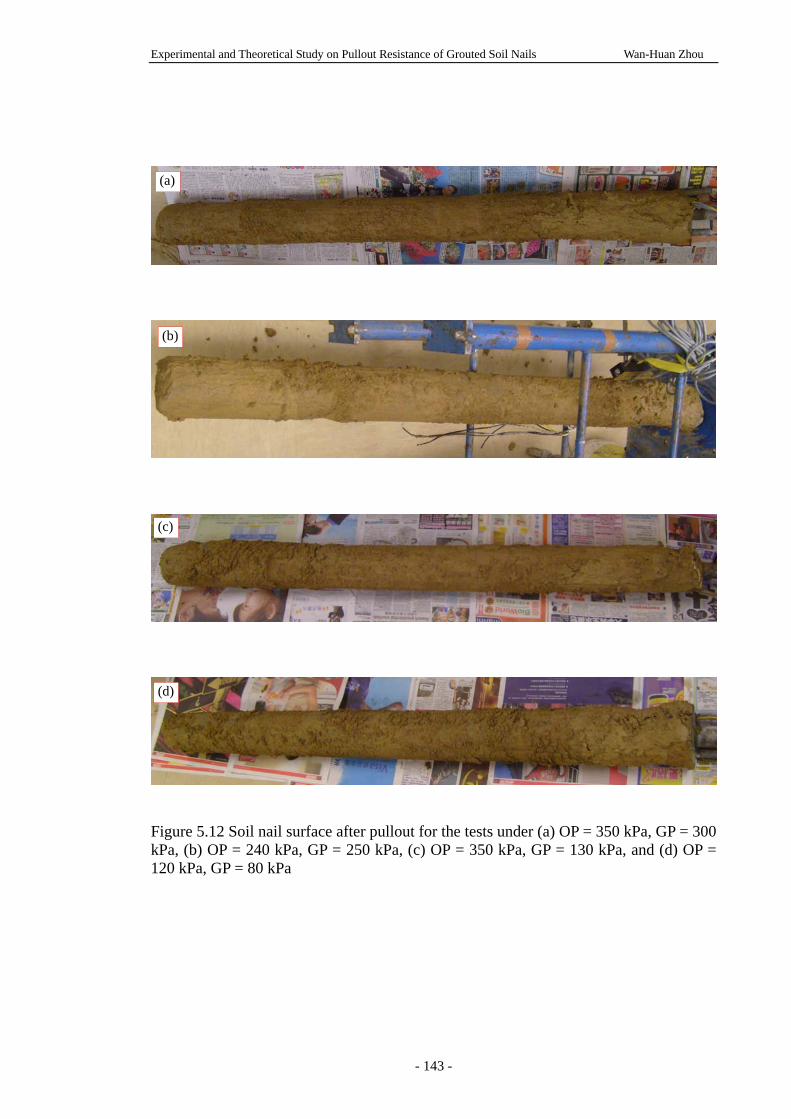
Experimental and Theoretical Study on Pullout Resistance of Grouted Soil Nails Wan-Huan Zhou
- 143 -
Figure 5.12 Soil nail surface after pullout for the tests under (a) OP = 350 kPa, GP = 300 kPa, (b) OP = 240 kPa, GP = 250 kPa, (c) OP = 350 kPa, GP = 130 kPa, and (d) OP = 120 kPa, GP = 80 kPa
(b)
(c)
(d)
(a)
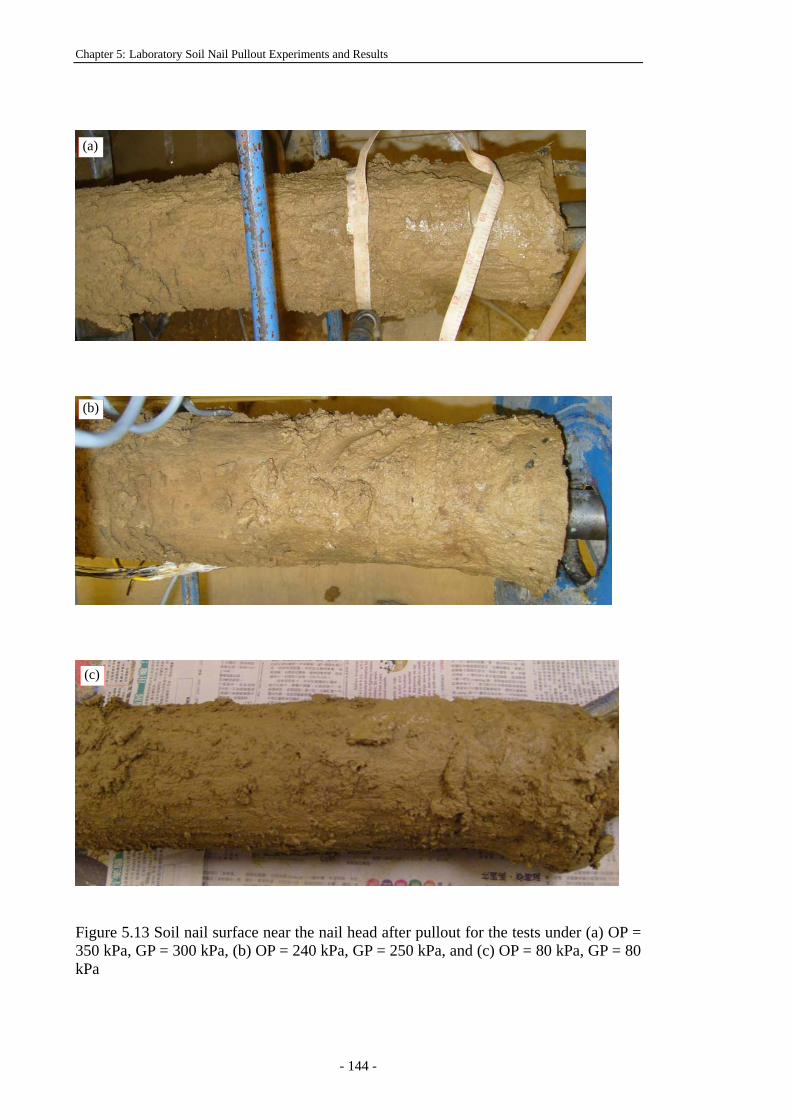
Chapter 5: Laboratory Soil Nail Pullout Experiments and Results
- 144 -
Figure 5.13 Soil nail surface near the nail head after pullout for the tests under (a) OP = 350 kPa, GP = 300 kPa, (b) OP = 240 kPa, GP = 250 kPa, and (c) OP = 80 kPa, GP = 80 kPa
(a)
(b)
(c)
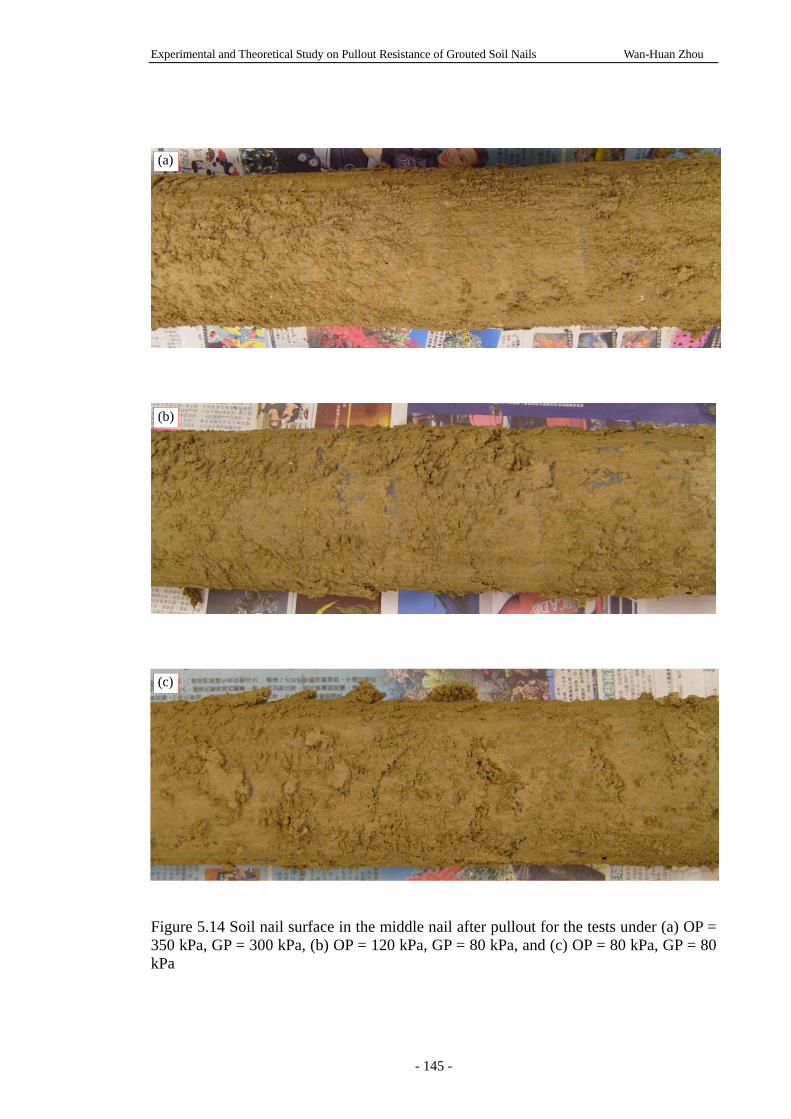
Experimental and Theoretical Study on Pullout Resistance of Grouted Soil Nails Wan-Huan Zhou
- 145 -
Figure 5.14 Soil nail surface in the middle nail after pullout for the tests under (a) OP = 350 kPa, GP = 300 kPa, (b) OP = 120 kPa, GP = 80 kPa, and (c) OP = 80 kPa, GP = 80 kPa
(b)
(c)
(a)
Chapter 5: Laboratory Soil Nail Pullout Experiments and Results
- 146 -
Experimental and Theoretical Study on Pullout Resistance of Grouted Soil Nails Wan-Huan Zhou
- 147 -
Chapter 6:
EFFECTS OF BOTH OVERBURDEN PRESSURE
AND GROUTING PRESSURE
6.1 INTRODUCTION
The test programme described in Chapter 5 was designed to study the effects of
overburden pressure and grouting pressure on soil nail pullout resistance, in a saturated
CDG soil. Typical test results and observations have been presented in Chapter 5. The
focus of this chapter is to further analyze the results during soil nail pullout testing. Su
(2006), Su et al. (2007 and 2008), and Yin et al. (2008) have reported the pullout tests
under different overburden pressures without grouting pressure, i.e. GP = 0 kPa, for the
same soil under saturated condition. The new test results from the present test program
are interpreted together with the results of Su (2006) to examine the effects of both
grouting pressure and overburden pressure on soil nail pullout behaviour in a saturated
CDG soil.
Firstly the average effective normal stress and the interface shear stress around the soil
nail are defined and their variations during pullout are presented. The soil nail pullout
behaviour is assessed by comparing the soil nail performance under different
overburden pressures and grouting pressures, respectively. Secondly the effects of
both overburden pressure and grouting pressure on the soil nail pullout resistance are
evaluated and discussed. Finally, a new empirical linear equation for determination of
soil nail pullout resistance is proposed. Both grouting pressure and overburden pressure
Chapter 6: Effects of Both Overburden Pressure and Grouting Pressure
- 148 -
are considered.
6.2 SOIL NAIL PULLOUT BEHAVIOUR DURING PULLOUT
6.2.1 Average effective normal stress and interface shear stress
The average shear stress at soil nail interface is more straightforward for the
interpretation of soil nail pullout resistance. The average interface shear stress (τ ) is
calculated from the measured pullout force at nail head divided by the active surface
area of the nail,
DLP
πτ =
(6.1)
where P is the pullout force measured from the load cell, D is the average diameter of
the soil nail measured after pullout of the soil nail, and L is the length of the soil nail in
contact with the soil inside the box, that is as mentioned in Chapter 4, the soil nail
length inside the box was retained as L = 1.0 m in full contact with the soil in the box.
It is noted that the vertical stress changes at the soil-nail interface could be higher than
the values measured by P-Cells 1, 2, 3, and 4 which were approximately 37 mm (after
application of overburden pressure, hole drilling, grouting and saturation) to 45 mm
(embedded position) away from the soil nail surface, while the normal pressure changes
in other directions around the perimeter of the nail would be smaller than that in the
vertical direction. Therefore, the average effective vertical stresses ( 'nσ ) at the soil-nail
interface is approximately determined by:
≈'nσ average (P-Cells 1-4) – average (PPTs 1-4) (6.2)
Figure 6.1 shows the variations of average interface shear stress and average effective
Experimental and Theoretical Study on Pullout Resistance of Grouted Soil Nails Wan-Huan Zhou
- 149 -
normal stress at (or near) the soil nail interface (a) versus time and (b) versus pullout
displacement for the test under OP = 350 kPa and GP = 250 kPa. It is seen from Figure
6.1 that the average normal effective stress increases from an initial value of 205 kPa to
a peak value of 235 kPa, and reduces gradually to 150 kPa at the displacement of 100
mm. Correspondingly, the average interface shear stress increases from zero to 131 kPa
and then decreases to 85 kPa at the displacement of 100 mm. The pullout displacement
at the peak interface shear stress ( pτ ) is 7 mm, while the displacement at the peak
normal effective stress is 21 mm. It seems that the displacements at the two peak values
are different. This phenomenon was also found in previous pullout tests (Su 2006).
Because of the progressive failure nature at the soil-nail interface, the peak (or the
maximum) normal effective stress may not correspond to the peak pullout resistance.
Figure 6.2 shows the variations of average interface shear stress and average effective
normal stress at (or near) the soil nail interface (a) versus time and (b) versus pullout
displacement for the pullout test under OP = 240 kPa and GP = 130 kPa. It is seen that
the interface shear stress initially increases linearly with pullout displacement until
reaches 54 kPa at 2.8mm pullout displacement, then nonlinearly increases to the peak
value of 73.7 kPa at 28.9mm pullout displacement, and gradually decreases to 60 kPa at
100mm pullout displacement. On the other hand, the average effective normal stress
shows inconsistent variations during the pullout. The normal stress starts from 114 kPa,
slightly drops to 98 kPa at 1.5mm pullout displacement, then increases to 124.5 kPa at
8.8mm displacement, and then decreases again to 93kPa at 34mm displacement,
gradually increases afterwards to the peak value of 145.5kPa at 83mm displacement,
and finishes at 132kPa in the end.
Chapter 6: Effects of Both Overburden Pressure and Grouting Pressure
- 150 -
The normal stress changes occurred during the pullout testing is related to the
constrained dilation (the expansion tendency of the soil volume during shearing) at and
around the soil nail interface. Su et al. (2008) reported that the soil dilation had a big
contribution on the soil nail pullout resistance for the grouted nail under an unsaturated
condition. However, for the same CDG soil in a saturated condition, the dilation effect
at the soil nail interface was less notable, as shown in Figure 6.1 and Figure 6.2,
compared to the previous results reported by Su et al. (2008). There are probably two
reasons. The first one is that the soil suction can influence the soil dilation. Ng and
Zhou (2005) have found that the suction can cause an increase in the soil dilation. The
present pullout tests were conduced in the CDG soil under a nearly saturated condition
so that there was neither suction nor the dilation due to suction. Thus the effect of
dilation in the saturated soil should be much smaller than that in the tests carried out in
an unsaturated condition. The second reason is that the stress level will influence the
constrained dilation of the soil. Schlosser (1982) claimed that the tendency of the soil
to dilate would decrease with increasing normal stress. Since the stresses around the soil
nail were increased to a higher level during the saturation, the effect of soil dilation in a
saturated condition would be smaller than that at a lower stress level in an unsaturated
condition.
6.2.2 Soil nail pullout behaviour under different overburden pressures
Soil nail pullout behaviour under different overburden pressures are presented and
discussed in this section. The results of Su (2006) for the tests without grouting pressure,
i.e. GP = 0 kPa are presented for comparison. The pullout behaviour of Test 6-4 under
OP = 200 kPa and GP = 80 kPa was abnormal compared to the other tests. The pullout
resistance was as high as 103 kPa, and the water content measured after pullout, was
relatively low, as shown in Figure 5.11b. Therefore, it is believed Test 6-4 was not
Experimental and Theoretical Study on Pullout Resistance of Grouted Soil Nails Wan-Huan Zhou
- 151 -
conducted in a sufficiently saturation condition, and hence the results are not included in
the analysis.
Figure 6.3 shows the development of average interface shear stress with the nail head
pullout displacement for the tests under different overburden pressures and (a) GP = 0
kPa, (b) GP = 80 kPa, (c) GP = 130 kPa, and (d) GP = 250 kPa. It is seen from this
figure that for the tests under the low grouting pressures, such as tests under GP = 0 kPa
(Figure 6.3a), GP = 80 kPa (Figure 6.3b), and GP = 130 kPa (Figure 6.3c), the soil nail
pullout behaviour is hardly or slightly dependent on the overburden pressures. For the
tests under GP = 250 kPa (Figure 6.3d), the influence of overburden pressures is more
significant. It can be seen in Figure 6.3 that the average interface shear stress shows
linear increase behaviour at the first few millimeters pullout displacement. The shear
stress then nonlinearly increases to the peak (or maximum) interface shear stress, which
can be defined as the soil nail pullout resistance. It is seen in Figure 6.3 (a) that the
pullout resistance occurs at 8.3mm, 3.9 mm, 4.2mm and 5.6mm pullout displacement
for tests under GP=0 kPa and OP = 40 kPa, 80kPa 200 kPa and 300 kPa, respectively.
In Figure 6.3 (b), the pullout resistance occurs at 17.6mm, 15.9mm and 15.6mm pullout
displacement for the tests under GP = 80 kPa and OP = 80 kPa, 120 kPa and 350 kPa,
respectively. In Figure 6.3 (c), the pullout resistance occurs at 13.5mm, 8.9mm, and
34.0mm pullout displacement for the tests under GP = 130 kPa and OP = 80 kPa, 120
kPa, and 240 kPa, respectively. For Test 7-5 with GP = 130 kPa and OP = 350 kPa, a
peak shear stress occurs at 9.9mm pullout displacement, and the stress then slightly
decreases and increases again to the maximum shear stress at 93.4mm pullout
displacement. This abnormal hardening behaviour may result from the grouting
procedure. As shown in Figure 5.4(a), several pressure changes are observed during
grouting, and the changes are relatively large, indicating more cement grout has been
Chapter 6: Effects of Both Overburden Pressure and Grouting Pressure
- 152 -
injected during grouting. Therefore, it is believed that a better bond is formed due to the
abnormal grouting injection. However, it can be seen in Figure 6.3 that the peak
interface shear stress is followed by a gradual decrease to a residual value in most tests.
In Figure 6.3(d), the peak pullout resistance occurs at 5.7mm, 8.7mm, and 6.4mm
pullout displacement for the tests under GP = 250 kPa and OP = 120 kPa, 240 kPa, and
350 kPa, respectively.
Figure 6.4 shows the development of average interface shear stress with average
effective normal stress for the tests shown in Figure 6.3. As discussed in Chapter 5, the
normal stresses around the soil nail were observed to increase, to an extent, during
saturation. The higher the grouting pressure applied, the greater the increase in the
normal stresses. It is seen in Figure 6.3 that when the grouting pressure is higher, the
average normal stress before pullout is more closely related to the overburden pressure.
The normal stress does not vary significantly before the peak shear stress has been
reached. However, the changes of the calculated normal stress seem to be diverging at
large pullout displacement. This is because the normal stress is calculated from the
measured earth pressure around the soil nail. The divergence of the earth pressures is
greater when the pullout displacement is large and failure happens in the soil around the
soil nail.
6.2.3 Soil nail pullout behaviour under different grouting pressures
Figure 6.5 shows the development of average interface shear stress with pullout nail
head displacement under different grouting pressures and the same overburden pressure
(OP). Figure 6.5(a) shows the curves for GP of 0 kPa, 80 kPa and 130 kPa under the
same OP = 80 kPa; Figure 6.5 (b) shows the curves for GP = 80 kPa, 130 kPa and 250
kPa under the same OP = 120 kPa; Figure 6.5 (c) compares the curves for GP = 130 kPa
Experimental and Theoretical Study on Pullout Resistance of Grouted Soil Nails Wan-Huan Zhou
- 153 -
and 250 kPa under the same OP=240 kPa (plus GP=0 kPa and OP=200 kPa from Su
2006); Figure 6.5 (d) presents the curves for GP of 80 kPa, 130 kPa, 250 kPa, and 300
kPa under the same OP = 350 kPa (plus GP = 0 and OP=300 kPa from Su 2006). It is
seen that under the same overburden pressure, the grouting pressure clearly results in an
increase in the soil nail pullout interface shear resistance compared to that of the soil
nail grouted without pressure. In Figure 6.5(a & b), it is seen that when the overburden
pressure is low (excluding the test under GP = 0 kPa), the pullout behaviour shows no
relationship with the different grouting pressures. In Figure 6.5(c), the test curve for
GP=0kPa shows significant strain softening behaviour, that is, a sharp reduction in the
interface shear stress with pullout displacement, while the test curves for GP of 130 kPa
and 250 kPa are more ductile with minor softening behaviour. In Figure 6.5(d), except
for the test under GP=130kPa, the other four curves exhibit obvious strain softening
behaviour. As discussed in Section 6.2.2, the hardening behaviour observed in Test 7-5
is related to the abnormal grouting injection in the particular test. It can be seen in
Figure 6.5(c & d) that the grouting pressure has significant influence on the soil nail
pullout behaviour, especially when the grouting pressure is high.
Figure 6.6 shows the development of average interface shear stress with average
effective normal stress for the tests shown in Figure 6.5. It is seen that the influence of
grouting pressure becomes significant when the overburden pressure level is high, as
shown in Figure 6.6 (c & d). That is to say, both overburden pressure and grouting
pressure have influences on the soil nail pullout behaviour and the influences are
interactional to each other.
Chapter 6: Effects of Both Overburden Pressure and Grouting Pressure
- 154 -
6.3 EFFECTS ON SOIL NAIL PULLOUT RESISTANCE
Many researchers have found that the overburden pressure has little influence on the
pullout resistance of soil nails installed without grouting pressure or at a low grouting
pressure. Su et al. (2008) reported a laboratory soil nail pullout study on soil nails
grouted without pressure and in an unsaturated CDG soil. They found that the soil nail
pullout resistance was independent of the overburden pressure. The reason for this is
that the drilling procedure has released all stresses in the drill hole and the normal stress
on the soil nail is no longer related to the overburden pressure.
In Hong Kong, soil nails are generally grouted under gravity. During the injection,
cement slurry (normal prepared at some distance away from the drillholes) is normally
transferred through pipes into the drillholes by an applied pumping pressure. The
applied pumping pressure depends on the field conditions, such as the distance and
height between cement slurry and the drillholes. The grouting pressure in the drillholes
is not controlled during grouting, as long as the cement slurry flows into the holes
smoothly. After the hole is full, the pumping pressure is released and the hole sealed.
The soil nails are normally installed with a downward inclination of 20°. Therefore,
grouting pressure may exist during grouting owing to the pumping pressure, and be
further maintained at certain level by gravity effect.
Regarding the effect of grouting pressure, Yeung et al. (2005) carried out field pullout
tests on Glass Fiber Reinforced Polymer (GFRP) pipe nail in a CDG soil slope in Hong
Kong and observed a significant increase of the pullout resistance due to the pressure
grouting. Yin et al. (2008) reported data from a limited number of laboratory pullout
tests and discussed the influence of cement pressure grouting on the soil nail pullout
resistances. However, the soil in their study was unsaturated soil with a degree of
Experimental and Theoretical Study on Pullout Resistance of Grouted Soil Nails Wan-Huan Zhou
- 155 -
saturation of 50% and the grouting pressure was small, only 130 kPa or less (Yin et al.
2008). In Hong Kong, as indicated above, although the grouting pressure is not
controlled during grouting, a certain level of grouting pressure may exist due to
pumping and gravity. Juran and Elias (1991) reported that for cohesionless soils,
grouting pressures of 350 to 700 kPa were commonly used to prevent caving as the
casing would be withdrawn. The degree to which the grouting pressure influences the
soil nail pullout resistance is of interests to engineers and researchers. In the following
section, the effects of overburden pressure and grouting pressure on soil nail pullout
resistance are discussed.
Soil nail pullout resistance includes peak and residual pullout resistance. The peak
resistance is defined as the peak average shear stress at the soil-nail interface during
pullout. As discussed in Section 6.2.2, the peak resistance occurs within 10mm pullout
displacement in some tests, and within 13.5mm - 34.0mm pullout displacement in
others; softening behaviour is observed after the peak resistance in most tests except for
Test 7-5 with two peak resistances and hardening behaviour during pullout. Therefore,
the results from Test 7-5 are excluded in the analysis. For the same saturated CDG soil,
Su (2006) and Su et al., (2008) reported soil nail pullout test data under different
overburden pressures and without grouting pressure, i.e. GP = 0 kPa. The present new
test data are analyzed together with those of Su (2006) in the following analysis. The
peak pullout resistance and the residual pullout resistances (defined as the interface
shear stress at 50mm and 100mm pullout displacement) for all tests are summarized in
Table 6.1-6.3.
6.3.1 Effect of overburden pressure
Figure 6.7 shows the effect of overburden pressure on soil nail pullout resistance at
Chapter 6: Effects of Both Overburden Pressure and Grouting Pressure
- 156 -
different grouting pressure levels. It can be seen in Figure 6.7(a) that for GP = 0kPa, and
80kPa, the peak pullout resistance is hardly dependent on the overburden pressure; for
GP=130kPa, the peak resistance increases a little when overburden pressure increases
from 120kPa to 240kPa; but at GP=250kPa, the peak pullout resistance dramatically
increases with the overburden pressure. In Figure 6.17 ( b & c ), it is seen that the
residual pullout resistances at 50mm and 100mm pullout displacement are still hardly
dependent on the overburden pressure for GP=0 and 80kPa. For GP=130kPa, the
influence of overburden pressure seems emerging. The residual pullout resistance
increases significantly when OP increases from 120kPa to 240kPa. For GP=240kPa, the
residual pullout resistance increases significantly when OP increases from 120kPa to
240kPa, but the increasing rate slows down when OP increases from 240kPa to 350kPa.
It can be concluded that the effect of overburden pressure on the soil nail pullout
resistance is small when the grouting pressure level is low (less than 80kPa), the effect
emerges when the grouting pressure increases to 130kPa, and the effect on the increase
of soil nail pullout resistance becomes significant when GP = 250 kPa.
6.3.2 Effect of grouting pressure
Figure 6.8 shows the effect of grouting pressure on soil nail pullout resistance at
different overburden pressure levels. No distinct influence of the grouting pressure is
found on the peak and residual pullout resistances for OP=80kPa and 240kPa. However,
when the overburden pressure is higher, i.e. OP=240kPa and 350kPa, a significant
increase of peak resistance is observed with the grouting pressure; the residual
resistances in Figure 6.8 (b & c) show a similar trend as that of the peak resistance,
except that for OP=350kPa and GP=300kPa, where the reduction on the residual
resistance seems larger than other cases.
Experimental and Theoretical Study on Pullout Resistance of Grouted Soil Nails Wan-Huan Zhou
- 157 -
It can be concluded that soil nail pullout resistance significantly increases with the
grouting pressure when the overburden pressure level is high, such as OP = 240 kPa and
350 kPa.
6.4 AN EMPIRICAL EQUATION FOR SOIL NAIL PULLOUT
RESISTANCE
As indicated above in Chapter 5, the normal stresses around the soil nail were observed
to be remobilized, to a certain extent, during saturation. The higher the grouting
pressure applied, the greater the increase in the normal stresses found. The greater
normal stress is considered to be balanced by the overburden pressure. Hence the
magnitude of the normal pressure induced by the higher grouting pressure is related to
the overburden pressure. The analysis in Section 6.3 shows that both overburden and
grouting pressures influence the soil nail pullout resistance, and their influences are
interactional. Therefore, in the determination of soil nail pullout resistance, both factors
should be considered.
If the initial overburden pressure 'vσ at the soil nail level before its installation is
assumed to be the same as before and is still acting on the soil nail, the pullout
resistance of the soil nail can be estimated using the formula given by Schlosser and
Guilloux (1981)
''' 2 μσπ vault DDcT += (6.3)
where Tult is the soil nail pullout resistance, 'ac is the effective adhesion of the soil nail
interface (assume '' cca = , the internal effective cohesion of the soil), D is the nail
Chapter 6: Effects of Both Overburden Pressure and Grouting Pressure
- 158 -
diameter, 'vσ is the vertical stress at the mid-depth of the soil nail, and 'μ is so
called the coefficient of apparent friction of the soil-nail interface (normally taking as
'' tanφμ = , where 'φ is the internal effective friction angle of the soil). The formula in
Eq. (6.3) was originally proposed for driven nails and has been adopted by practicing
engineers owing to its simplicity for grouted nails.
However, the vertical stress acting on the soil nail is not equal to the initial overburden
pressure after drilling and soil nail installation. Based on this understanding, the formula
in Eq.(6.3) is not suitable to calculate the pullout resistance of grouted soil nails. In
the present study, the pullout test results have shown that the pullout resistance is
dependent on both overburden pressure and grouting pressure. For interpretation of
the present test data, a new empirical equation for fitting test results is proposed:
)()( '''GGviGG ppc μστ += (6.4)
where τ is the average soil nail interface shear resistance; 'Gc is a fitting parameter,
that is, the interception value for the initial vertical effective stress (overburden pressure)
'viσ equal to zero; '
Gμ is the slope of the fitting line in Eq.(6.4); Gp is the grouting
pressure. It is noted that the two parameters 'Gc and '
Gμ are dependent on the
grouting pressure ( Gp ), or as a function of Gp .
The parameter 'Gc may be interpreted as the interface shear strength when the initial
overburden pressure is zero. But 'Gc may include the contributions of both bonding
and frictional resistance at the interface between soil and grout. Even though the
initial overburden pressure is zero, the pulling out of the soil nail may introduce
shear-dilation, hence generating a certain normal stress. This normal stress would then
Experimental and Theoretical Study on Pullout Resistance of Grouted Soil Nails Wan-Huan Zhou
- 159 -
result in frictional resistance. The 'Gμ is not the frictional coefficient of the soil, but a
pure fitting parameter as well. The parameter 'Gμ reflects the increase of interface
shear resistance due to the effects of both grouting pressure and overburden pressure.
Eq.(6.4) is a simple and practical equation for estimating the soil nail pullout resistance
due to the effects of both grouting pressure and overburden pressure.
Figure 6.9 shows the measured values and relationships of soil nail pullout resistanceτ
versus overburden pressure (initial vertical effective stress) 'viσ under grouting
pressures of 0, 80 kPa, 130 kPa, and 250 kPa: (a) τ at peak and (b) τ at pullout
displacement of 50 mm. Why is the pullout resistance at pullout displacement of
50mm presented and analyzed here as well? It is well known that the peak strength is
important for stability analysis of geotechnical structures experiencing the initial failure
(failure at peak). However, the post-peak (or residual) shear strength should be used
for stability analysis for geotechnical structures experiencing the post-peak failure.
For example, a new cut slope with soil nails may experience a progressive slope failure
due to rain fall or loading. At the slip surface in soil mass and/or the slip surface at the
soil-nail interface, the failure develops progressively, from a peak failure to a post-peak
failure. Therefore, the post-peak (residual) strength is also necessary for stability
analysis of slopes in progressive failure. In Figure 6.9(b), the residual pullout
resistance at pullout displacement of 50 mm is selected.
It can be seen from Figure 6.9 that the grouting pressure has a significant effect on soil
nail pullout resistance both at peak and at 50mm pullout displacement. When the
grouting pressure is zero, the soil nail pullout resistance is independent of the
overburden pressure. But, as the grouting pressure increases, the soil nail pullout
Chapter 6: Effects of Both Overburden Pressure and Grouting Pressure
- 160 -
resistance increases with the overburden pressure. Eq.(6.4) has been used to fit the test
data in Figure 6.9 for the average interface shear stress τ (a) at peak and at (b) at
pullout displacement of 50 mm. Values of the two parameters 'Gc and '
Gμ are
obtained and shown in Figure 6.9. It is clear seen that both 'Gc and '
Gμ are
dependent on the grouting pressure ( Gp ). Using the values obtained in Figure 6.9, the
relationships between the two parameters ( 'Gc and '
Gμ ) and the grouting pressure ( Gp )
are plotted in Figure 6.10 for the pullout resistance (a) at peak and (b) at pullout
displacement of 50 mm.
Figure 6.10(a) shows that the curve of 'Gc and Gp for the peak pullout resistance is
above the curve for the residual resistance at 50mm displacement. It is also seen in the
figure that 'Gc for the peak pullout resistance increases with the grouting pressure as
Gp increases from zero to 80 kPa, and then approaches a constant as Gp is higher
than 80 kPa. The 'Gc data for the residual pullout resistance seems to increase to a
peak and then decrease to a smaller value. The overall average of 'Gc for residual
pullout resistance is 32.4 kPa. As discussed above, both the bonding and frictional
resistance at the soil-nail interface would contribute to the value of 'Gc . In other
words, 'Gc is not a pure adhesion or bonding strength at soil-nail interface. The
grouting pressure influences both bonding and frictional resistance at the soil-nail
interface, and hence has effects on the soil nail pullout resistance. It is seen that the
relationships between the parameter 'Gc and the grouting pressure ( Gp ) are nonlinear.
Experimental and Theoretical Study on Pullout Resistance of Grouted Soil Nails Wan-Huan Zhou
- 161 -
Figure 6.10(b) shows that the curve of the parameter 'Gμ and the grouting pressure
( Gp ) for the peak pullout resistance is below the curve for the residual resistance at
50mm pullout resistance. It should be pointed out that this phenomenon is similar to that
for shear strength of over-consolidated clay. For over-consolidated clay, the cohesion
of the shear strength at peak is larger than that at the critical state (normally zero for
non-cemented soil); while the friction angle of the peak strength is smaller than that at
the critical state. It is also seem from Figure 6.10(b) that 'Gμ is almost zero at Gp
equals to zero, and then 'Gμ increases slowly as Gp up to 80 kPa. After this, '
Gμ
for both peak and residual resistances increase quickly as Gp up to 250 kPa. The
increasing rate of 'Gμ seems to be approaching constant with the increase of grouting
pressure. The relationships between the parameter 'Gμ and the grouting pressure Gp
are nonlinear as well. This indicates that the influence of the grouting pressure on the
soil nail pullout resistance is complicated.
6.5 SUMMARY AND FINDINGS
The results during soil nail pullout testing have been further analyzed in this chapter.
The new test results are interpreted together with those of Su (2006) to evaluate the
effects of both grouting pressure and overburden pressure on the soil nail pullout
behaviour in a saturated CDG soil. The soil nail pullout resistance have been
summarized and analyzed. A new empirical linear equation is proposed to fit the soil
nail pullout resistance data at peak and at residual (at pullout displacement of 50 mm).
Based on the facts presented and discussed in the above chapter, the following
observations and findings are made:
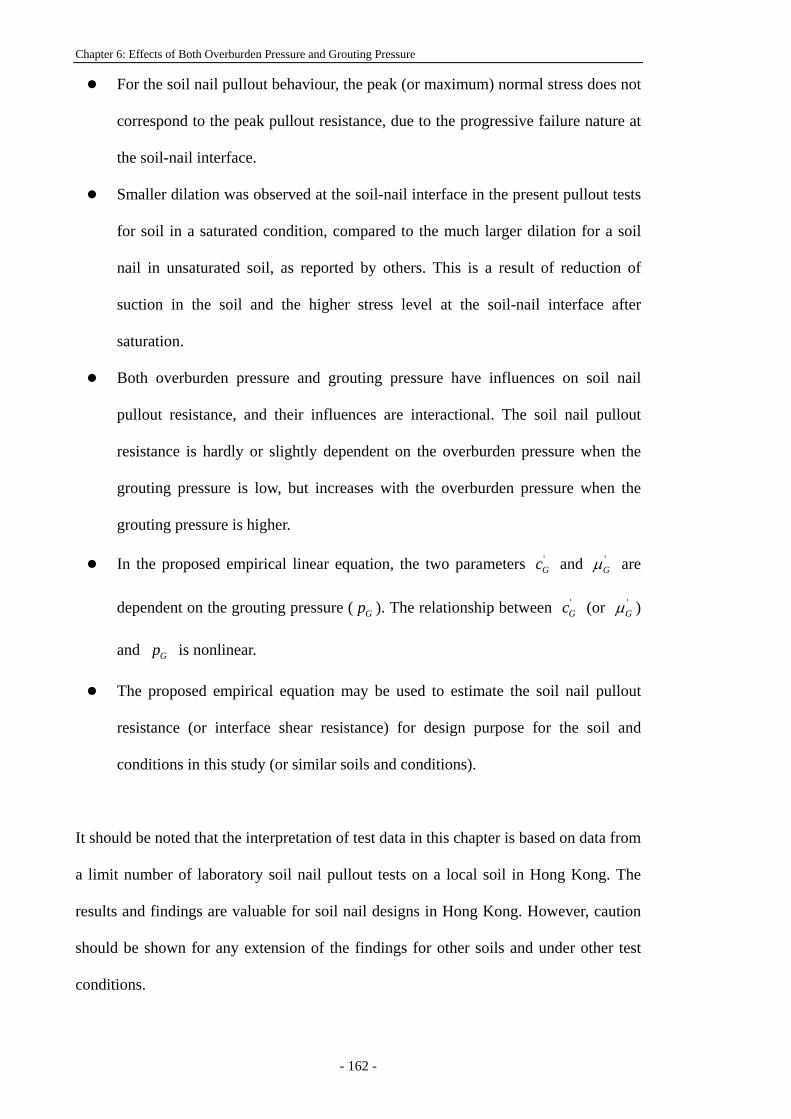
Chapter 6: Effects of Both Overburden Pressure and Grouting Pressure
- 162 -
For the soil nail pullout behaviour, the peak (or maximum) normal stress does not
correspond to the peak pullout resistance, due to the progressive failure nature at
the soil-nail interface.
Smaller dilation was observed at the soil-nail interface in the present pullout tests
for soil in a saturated condition, compared to the much larger dilation for a soil
nail in unsaturated soil, as reported by others. This is a result of reduction of
suction in the soil and the higher stress level at the soil-nail interface after
saturation.
Both overburden pressure and grouting pressure have influences on soil nail
pullout resistance, and their influences are interactional. The soil nail pullout
resistance is hardly or slightly dependent on the overburden pressure when the
grouting pressure is low, but increases with the overburden pressure when the
grouting pressure is higher.
In the proposed empirical linear equation, the two parameters 'Gc and '
Gμ are
dependent on the grouting pressure ( Gp ). The relationship between 'Gc (or '
Gμ )
and Gp is nonlinear.
The proposed empirical equation may be used to estimate the soil nail pullout
resistance (or interface shear resistance) for design purpose for the soil and
conditions in this study (or similar soils and conditions).
It should be noted that the interpretation of test data in this chapter is based on data from
a limit number of laboratory soil nail pullout tests on a local soil in Hong Kong. The
results and findings are valuable for soil nail designs in Hong Kong. However, caution
should be shown for any extension of the findings for other soils and under other test
conditions.
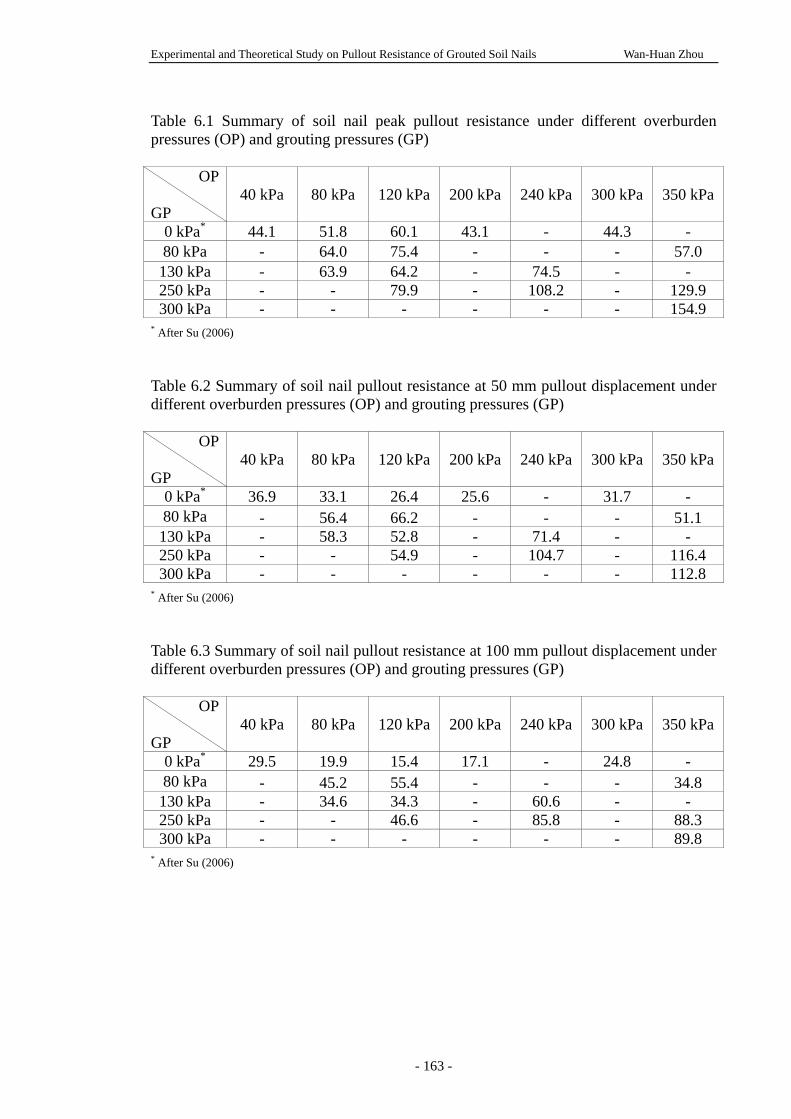
Experimental and Theoretical Study on Pullout Resistance of Grouted Soil Nails Wan-Huan Zhou
- 163 -
Table 6.1 Summary of soil nail peak pullout resistance under different overburden pressures (OP) and grouting pressures (GP)
OP GP
40 kPa 80 kPa 120 kPa 200 kPa 240 kPa 300 kPa 350 kPa
0 kPa* 44.1 51.8 60.1 43.1 - 44.3 - 80 kPa - 64.0 75.4 - - - 57.0 130 kPa - 63.9 64.2 - 74.5 - - 250 kPa - - 79.9 - 108.2 - 129.9 300 kPa - - - - - - 154.9
* After Su (2006) Table 6.2 Summary of soil nail pullout resistance at 50 mm pullout displacement under different overburden pressures (OP) and grouting pressures (GP) OP GP
40 kPa 80 kPa 120 kPa 200 kPa 240 kPa 300 kPa 350 kPa
0 kPa* 36.9 33.1 26.4 25.6 - 31.7 - 80 kPa - 56.4 66.2 - - - 51.1 130 kPa - 58.3 52.8 - 71.4 - - 250 kPa - - 54.9 - 104.7 - 116.4 300 kPa - - - - - - 112.8
* After Su (2006) Table 6.3 Summary of soil nail pullout resistance at 100 mm pullout displacement under different overburden pressures (OP) and grouting pressures (GP) OP GP
40 kPa 80 kPa 120 kPa 200 kPa 240 kPa 300 kPa 350 kPa
0 kPa* 29.5 19.9 15.4 17.1 - 24.8 - 80 kPa - 45.2 55.4 - - - 34.8 130 kPa - 34.6 34.3 - 60.6 - - 250 kPa - - 46.6 - 85.8 - 88.3 300 kPa - - - - - - 89.8
* After Su (2006)
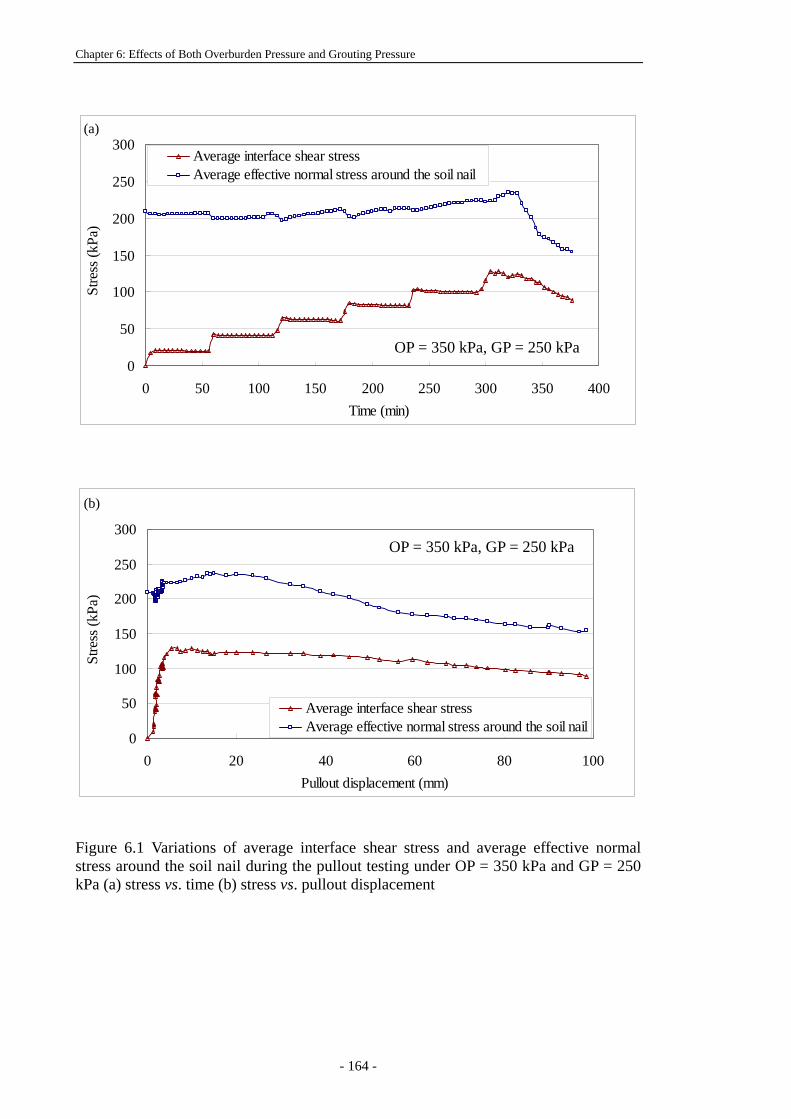
Chapter 6: Effects of Both Overburden Pressure and Grouting Pressure
- 164 -
0
50
100
150
200
250
300
0 50 100 150 200 250 300 350 400Time (min)
Stre
ss (k
Pa)
Average interface shear stressAverage effective normal stress around the soil nail
0
50
100
150
200
250
300
0 20 40 60 80 100Pullout displacement (mm)
Stre
ss (k
Pa)
Average interface shear stressAverage effective normal stress around the soil nail
Figure 6.1 Variations of average interface shear stress and average effective normal stress around the soil nail during the pullout testing under OP = 350 kPa and GP = 250 kPa (a) stress vs. time (b) stress vs. pullout displacement
(a)
(b)
OP = 350 kPa, GP = 250 kPa
OP = 350 kPa, GP = 250 kPa
Experimental and Theoretical Study on Pullout Resistance of Grouted Soil Nails Wan-Huan Zhou
- 165 -
0
50
100
150
200
250
0 50 100 150 200 250 300 350 400Time (min)
Stre
ss (k
Pa)
Average interface shear stressAverage effective normal stress around the soil nail
0
50
100
150
200
250
0 20 40 60 80 100Pullout displacement (min)
Stre
ss (k
Pa)
Average interface shear stressAverage effective normal stress around the soil nail
Figure 6.2 Variations of average interface shear stress and average effective normal stress around the soil nail during the pullout testing under OP = 240 kPa and GP = 130 kPa (a) stress vs. time (b) stress vs. pullout displacement
(a)
(b)
OP = 240 kPa, GP = 130 kPa
OP = 240 kPa, GP = 130 kPa
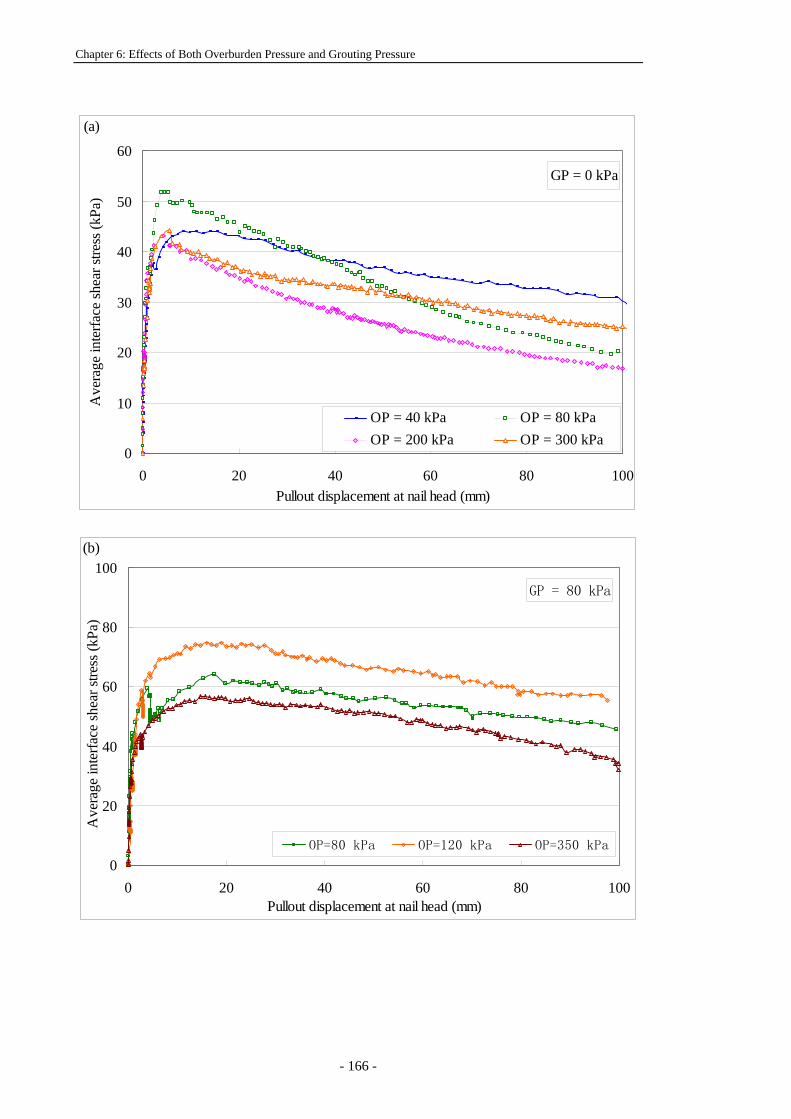
Chapter 6: Effects of Both Overburden Pressure and Grouting Pressure
- 166 -
GP = 0 kPa
0
10
20
30
40
50
60
0 20 40 60 80 100Pullout displacement at nail head (mm)
Ave
rage
inte
rface
shea
r stre
ss (k
Pa)
OP = 40 kPa OP = 80 kPaOP = 200 kPa OP = 300 kPa
(a)
GP = 80 kPa
0
20
40
60
80
100
0 20 40 60 80 100Pullout displacement at nail head (mm)
Ave
rage
inte
rface
shea
r stre
ss (k
Pa) _
_
OP=80 kPa OP=120 kPa OP=350 kPa
(b)
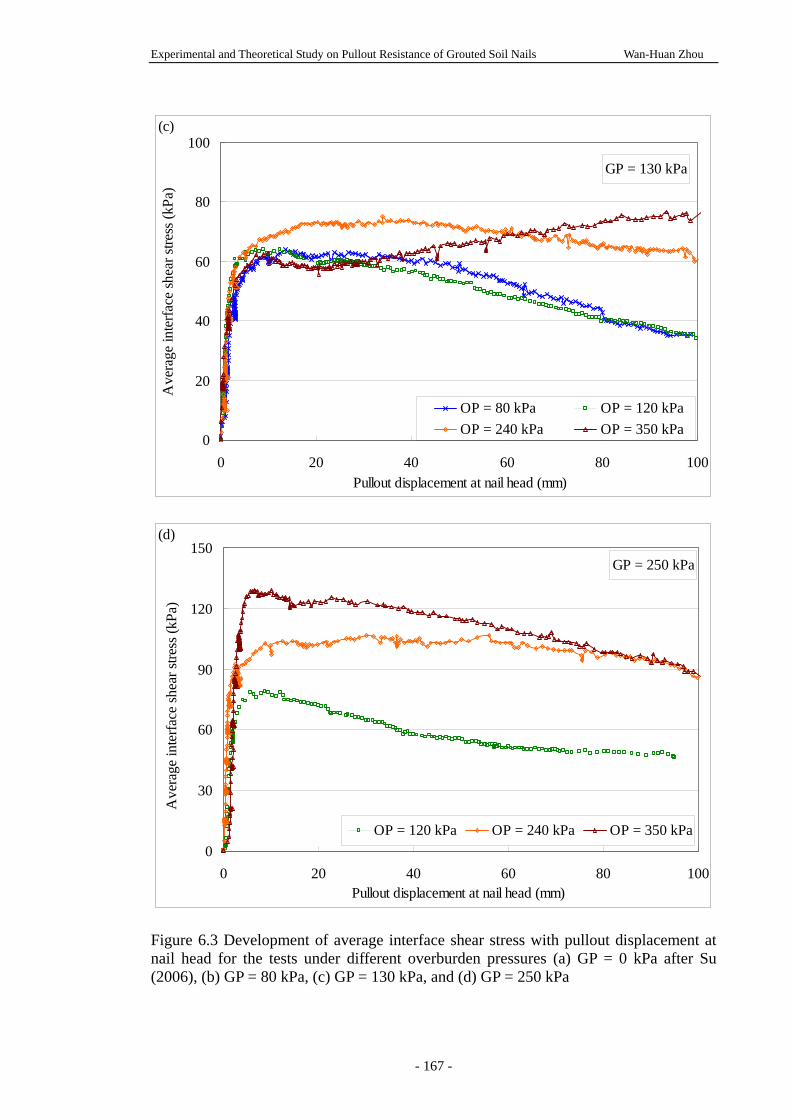
Experimental and Theoretical Study on Pullout Resistance of Grouted Soil Nails Wan-Huan Zhou
- 167 -
GP = 130 kPa
0
20
40
60
80
100
0 20 40 60 80 100Pullout displacement at nail head (mm)
Ave
rage
inte
rface
shea
r stre
ss (k
Pa)
OP = 80 kPa OP = 120 kPaOP = 240 kPa OP = 350 kPa
(c)
GP = 250 kPa
0
30
60
90
120
150
0 20 40 60 80 100Pullout displacement at nail head (mm)
Ave
rage
inte
rface
shea
r stre
ss (k
Pa)
OP = 120 kPa OP = 240 kPa OP = 350 kPa
(d)
Figure 6.3 Development of average interface shear stress with pullout displacement at nail head for the tests under different overburden pressures (a) GP = 0 kPa after Su (2006), (b) GP = 80 kPa, (c) GP = 130 kPa, and (d) GP = 250 kPa
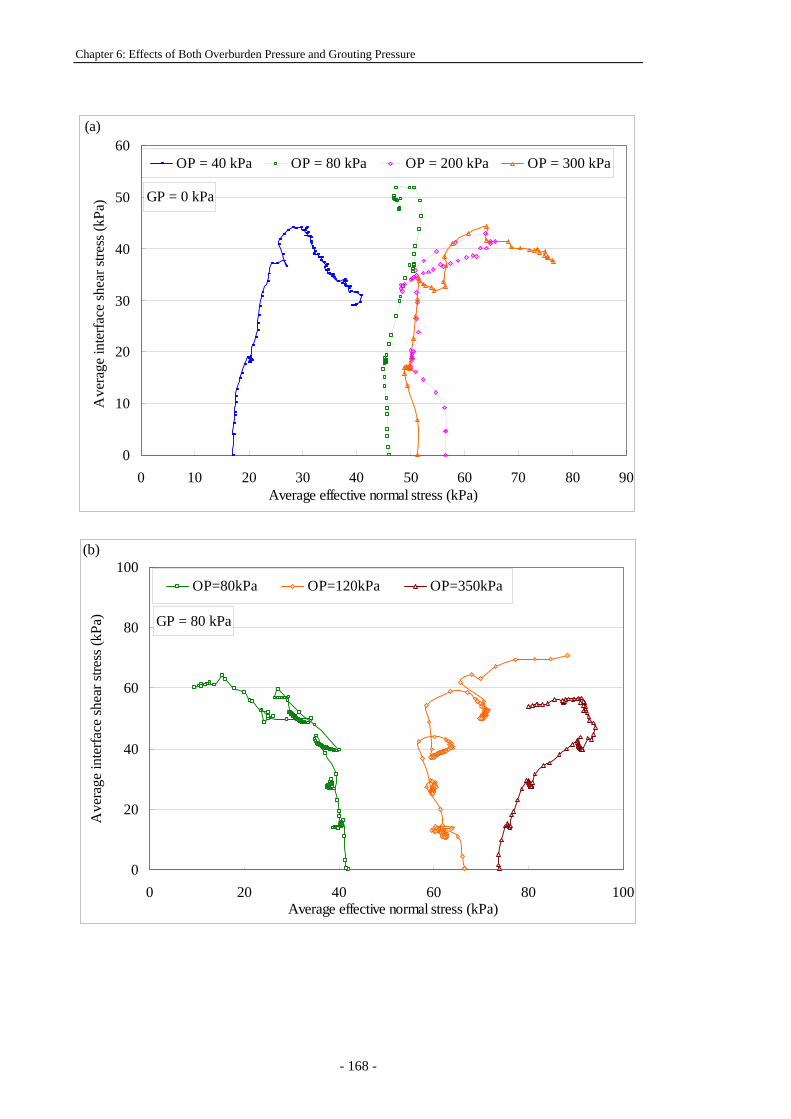
Chapter 6: Effects of Both Overburden Pressure and Grouting Pressure
- 168 -
GP = 0 kPa
0
10
20
30
40
50
60
0 10 20 30 40 50 60 70 80 90Average effective normal stress (kPa)
Ave
rage
inte
rface
shea
r stre
ss (k
Pa) a
OP = 40 kPa OP = 80 kPa OP = 200 kPa OP = 300 kPa
(a)
GP = 80 kPa
0
20
40
60
80
100
0 20 40 60 80 100Average effective normal stress (kPa)
Ave
rage
inte
rface
shea
r stre
ss (k
Pa)
OP=80kPa OP=120kPa OP=350kPa
(b)
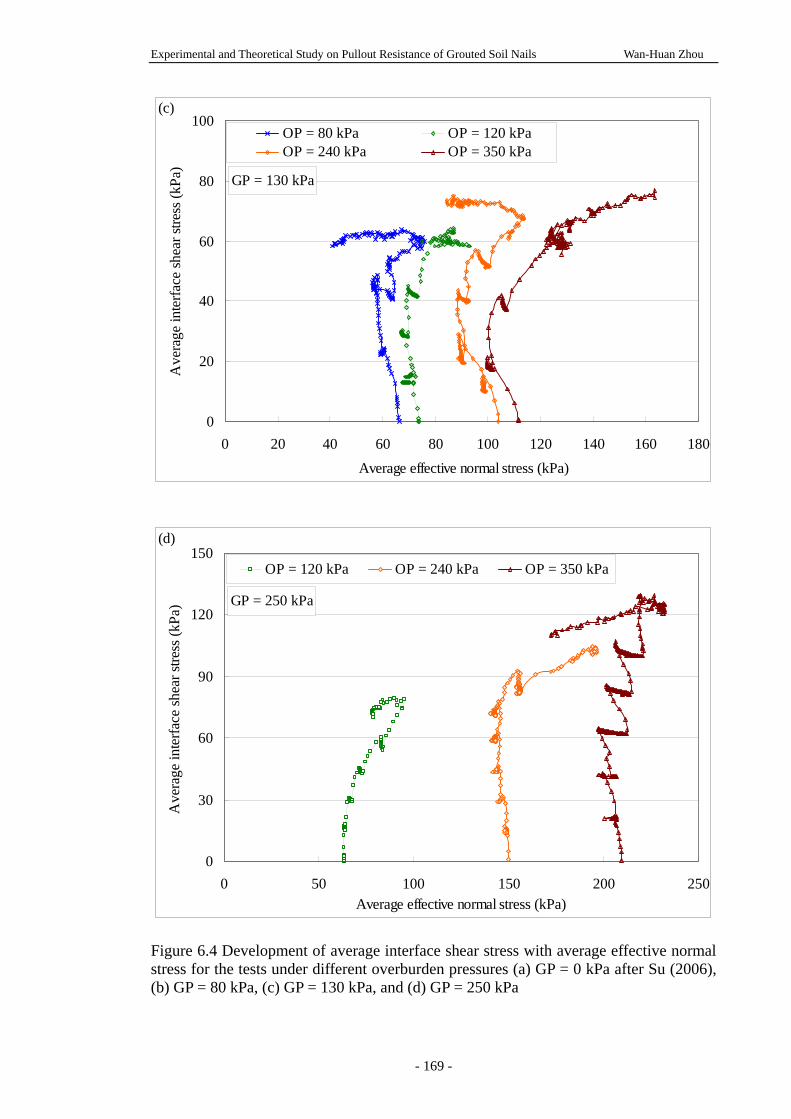
Experimental and Theoretical Study on Pullout Resistance of Grouted Soil Nails Wan-Huan Zhou
- 169 -
GP = 130 kPa
0
20
40
60
80
100
0 20 40 60 80 100 120 140 160 180Average effective normal stress (kPa)
Ave
rage
inte
rface
shea
r stre
ss (k
Pa)
OP = 80 kPa OP = 120 kPaOP = 240 kPa OP = 350 kPa
(c)
GP = 250 kPa
0
30
60
90
120
150
0 50 100 150 200 250Average effective normal stress (kPa)
Ave
rage
inte
rface
shea
r stre
ss (k
Pa)
OP = 120 kPa OP = 240 kPa OP = 350 kPa
(d)
Figure 6.4 Development of average interface shear stress with average effective normal stress for the tests under different overburden pressures (a) GP = 0 kPa after Su (2006), (b) GP = 80 kPa, (c) GP = 130 kPa, and (d) GP = 250 kPa
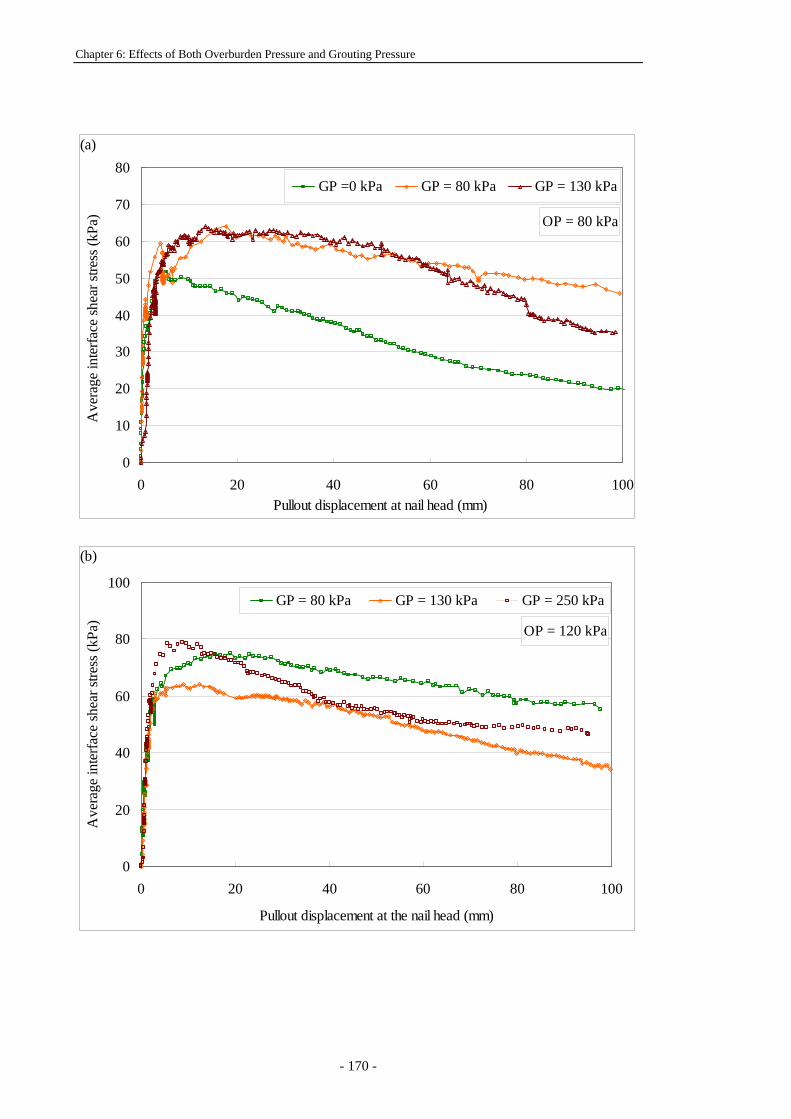
Chapter 6: Effects of Both Overburden Pressure and Grouting Pressure
- 170 -
OP = 80 kPa
0
10
20
30
40
50
60
70
80
0 20 40 60 80 100Pullout displacement at nail head (mm)
Ave
rage
inte
rface
shea
r stre
ss (k
Pa) a
GP =0 kPa GP = 80 kPa GP = 130 kPa
(a)
OP = 120 kPa
0
20
40
60
80
100
0 20 40 60 80 100
Pullout displacement at the nail head (mm)
Ave
rage
inte
rface
shea
r stre
ss (k
Pa)
GP = 80 kPa GP = 130 kPa GP = 250 kPa
(b)
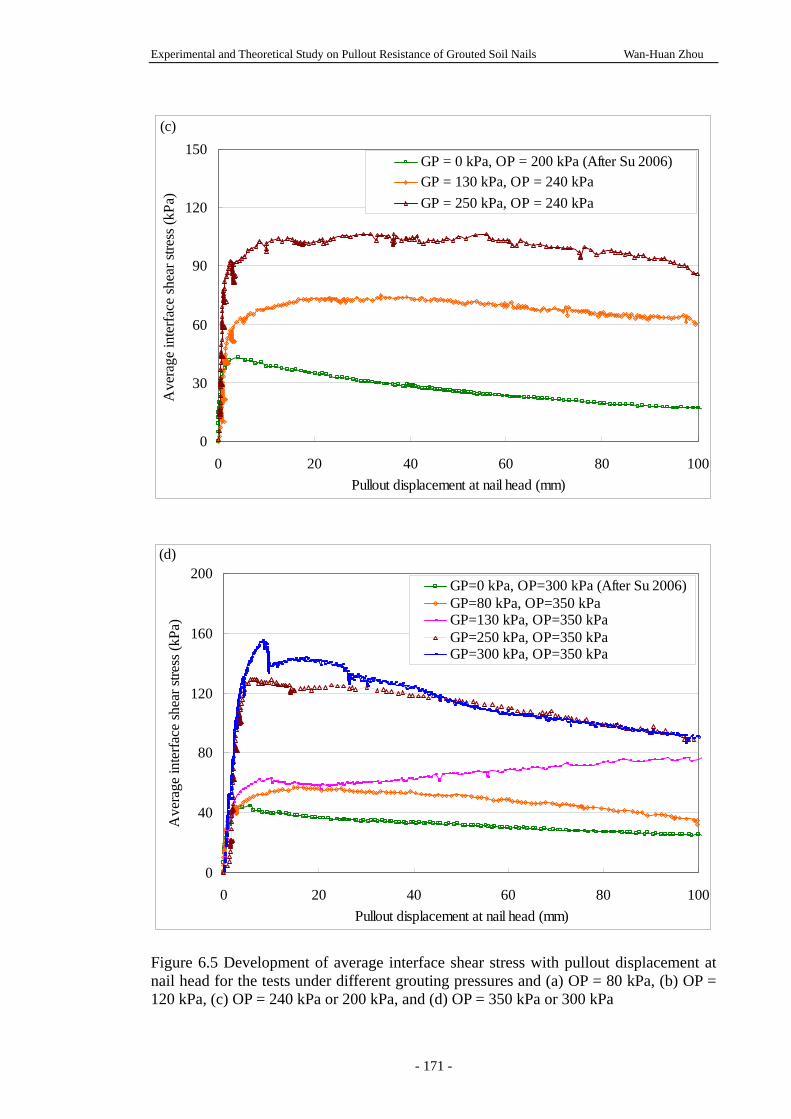
Experimental and Theoretical Study on Pullout Resistance of Grouted Soil Nails Wan-Huan Zhou
- 171 -
0
30
60
90
120
150
0 20 40 60 80 100Pullout displacement at nail head (mm)
Ave
rage
inte
rface
shea
r stre
ss (k
Pa)
GP = 0 kPa, OP = 200 kPa (After Su 2006)GP = 130 kPa, OP = 240 kPaGP = 250 kPa, OP = 240 kPa
(c)
0
40
80
120
160
200
0 20 40 60 80 100Pullout displacement at nail head (mm)
Ave
rage
inte
rface
shea
r stre
ss (k
Pa)
GP=0 kPa, OP=300 kPa (After Su 2006)GP=80 kPa, OP=350 kPaGP=130 kPa, OP=350 kPaGP=250 kPa, OP=350 kPaGP=300 kPa, OP=350 kPa
(d)
Figure 6.5 Development of average interface shear stress with pullout displacement at nail head for the tests under different grouting pressures and (a) OP = 80 kPa, (b) OP = 120 kPa, (c) OP = 240 kPa or 200 kPa, and (d) OP = 350 kPa or 300 kPa
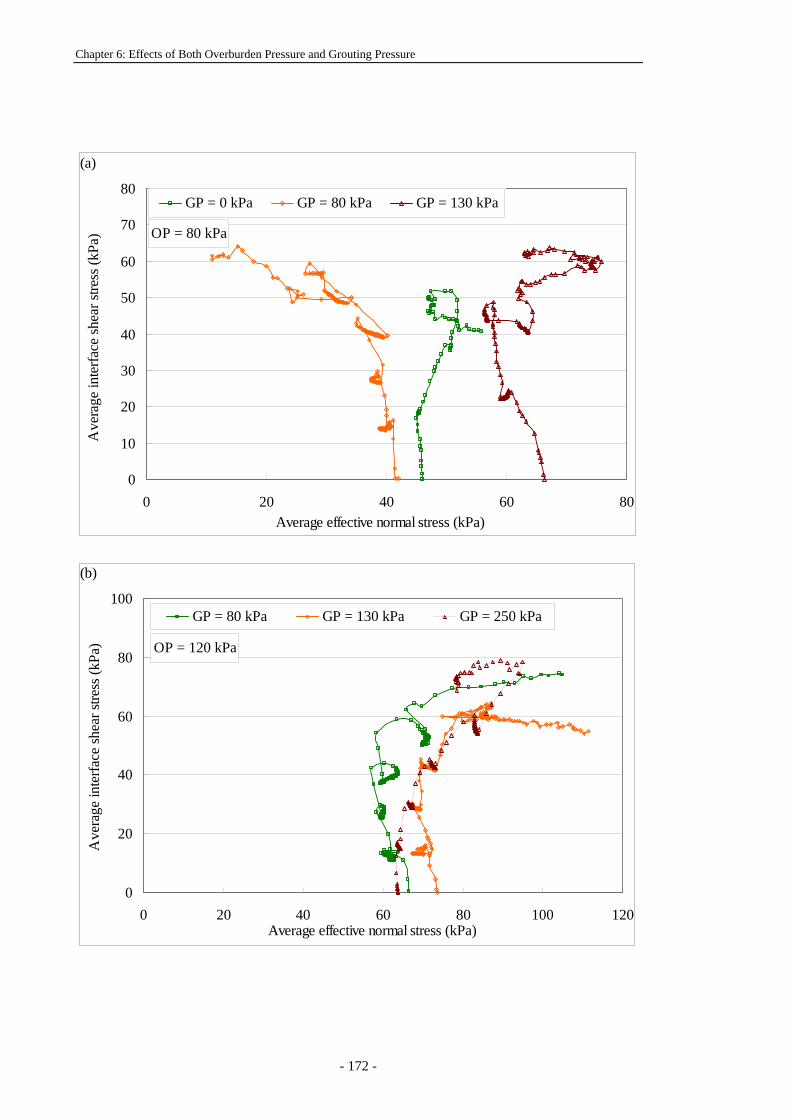
Chapter 6: Effects of Both Overburden Pressure and Grouting Pressure
- 172 -
OP = 80 kPa
0
10
20
30
40
50
60
70
80
0 20 40 60 80Average effective normal stress (kPa)
Ave
rage
inte
rface
shea
r stre
ss (k
Pa) a
GP = 0 kPa GP = 80 kPa GP = 130 kPa
(a)
OP = 120 kPa
0
20
40
60
80
100
0 20 40 60 80 100 120Average effective normal stress (kPa)
Ave
rage
inte
rface
shea
r stre
ss (k
Pa)
GP = 80 kPa GP = 130 kPa GP = 250 kPa
(b)
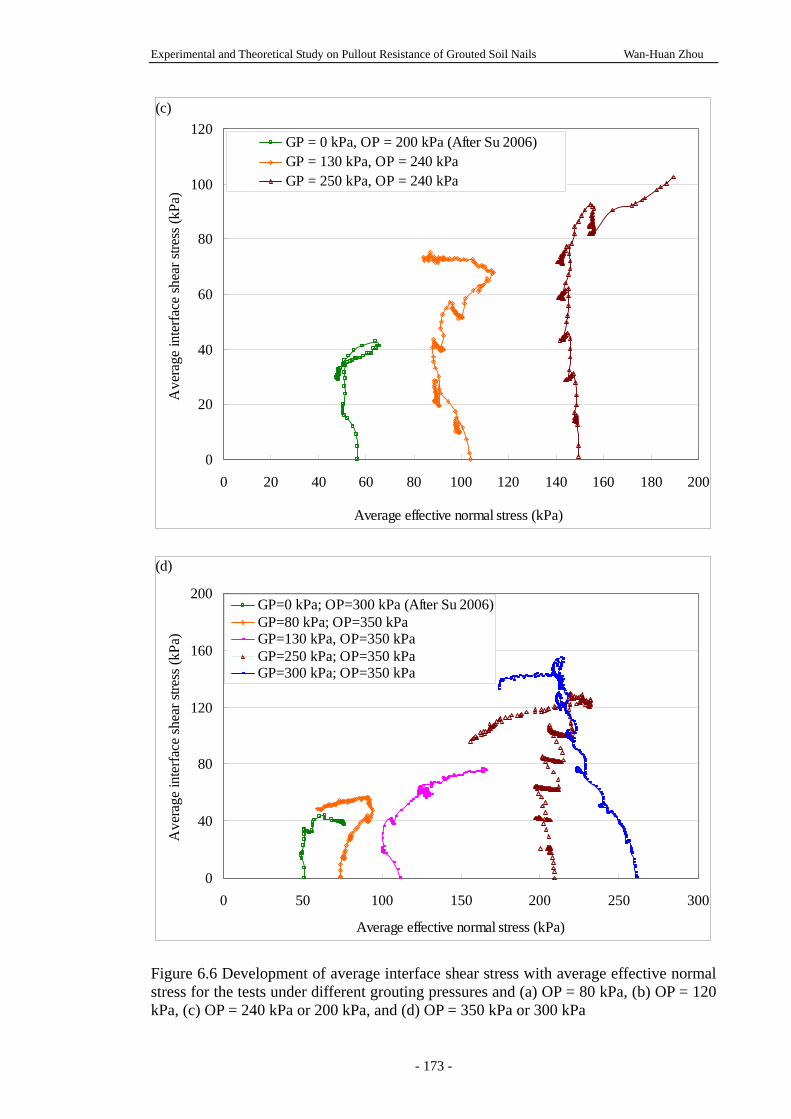
Experimental and Theoretical Study on Pullout Resistance of Grouted Soil Nails Wan-Huan Zhou
- 173 -
0
20
40
60
80
100
120
0 20 40 60 80 100 120 140 160 180 200
Average effective normal stress (kPa)
Ave
rage
inte
rface
shea
r stre
ss (k
Pa)
GP = 0 kPa, OP = 200 kPa (After Su 2006)GP = 130 kPa, OP = 240 kPaGP = 250 kPa, OP = 240 kPa
(c)
0
40
80
120
160
200
0 50 100 150 200 250 300
Average effective normal stress (kPa)
Ave
rage
inte
rface
shea
r stre
ss (k
Pa)
GP=0 kPa; OP=300 kPa (After Su 2006)GP=80 kPa; OP=350 kPaGP=130 kPa, OP=350 kPaGP=250 kPa; OP=350 kPaGP=300 kPa; OP=350 kPa
(d)
Figure 6.6 Development of average interface shear stress with average effective normal stress for the tests under different grouting pressures and (a) OP = 80 kPa, (b) OP = 120 kPa, (c) OP = 240 kPa or 200 kPa, and (d) OP = 350 kPa or 300 kPa
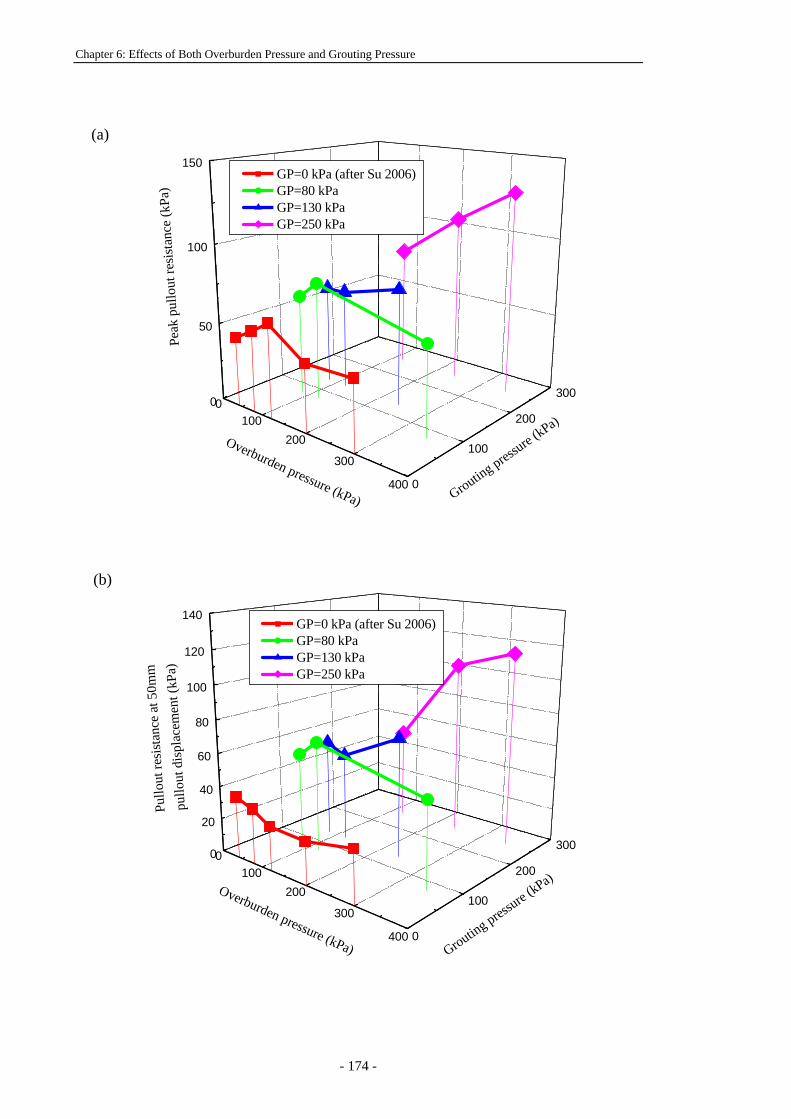
Chapter 6: Effects of Both Overburden Pressure and Grouting Pressure
- 174 -
0100
200
300
400 0
100
200
3000
50
100
150 GP=0 kPa (after Su 2006) GP=80 kPa GP=130 kPa GP=250 kPa
Peak
pul
lout
resi
stan
ce (k
Pa)
Grouting pressure (
kPa)Overburden pressure (kPa)
0100
200
300
400 0
100
200
3000
20
40
60
80
100
120
140 GP=0 kPa (after Su 2006) GP=80 kPa GP=130 kPa GP=250 kPa
Pullo
ut re
sist
ance
at 5
0mm
pullo
ut d
ispl
acem
ent (
kPa)
Grouting pressure (
kPa)Overburden pressure (kPa)
(a)
(b)
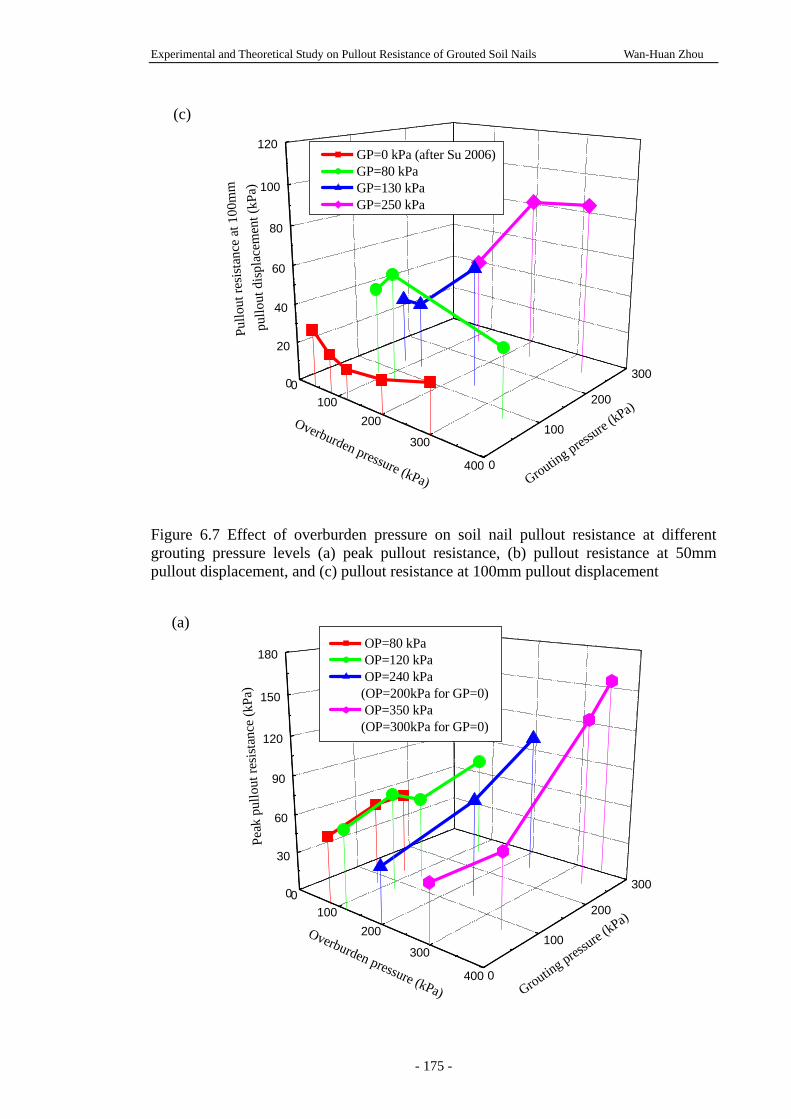
Experimental and Theoretical Study on Pullout Resistance of Grouted Soil Nails Wan-Huan Zhou
- 175 -
0100
200
300
400 0
100
200
3000
20
40
60
80
100
120 GP=0 kPa (after Su 2006) GP=80 kPa GP=130 kPa GP=250 kPa
Pullo
ut re
sist
ance
at 1
00m
m
pullo
ut d
ispl
acem
ent (
kPa)
Grouting pressure (
kPa)Overburden pressure (kPa)
Figure 6.7 Effect of overburden pressure on soil nail pullout resistance at different grouting pressure levels (a) peak pullout resistance, (b) pullout resistance at 50mm pullout displacement, and (c) pullout resistance at 100mm pullout displacement
0100
200
300
400 0
100
200
3000
30
60
90
120
150
180 OP=80 kPa OP=120 kPa OP=240 kPa
(OP=200kPa for GP=0) OP=350 kPa
(OP=300kPa for GP=0)
Peak
pul
lout
resi
stan
ce (k
Pa)
Grouting pressure (
kPa)Overburden pressure (kPa)
(c)
(a)
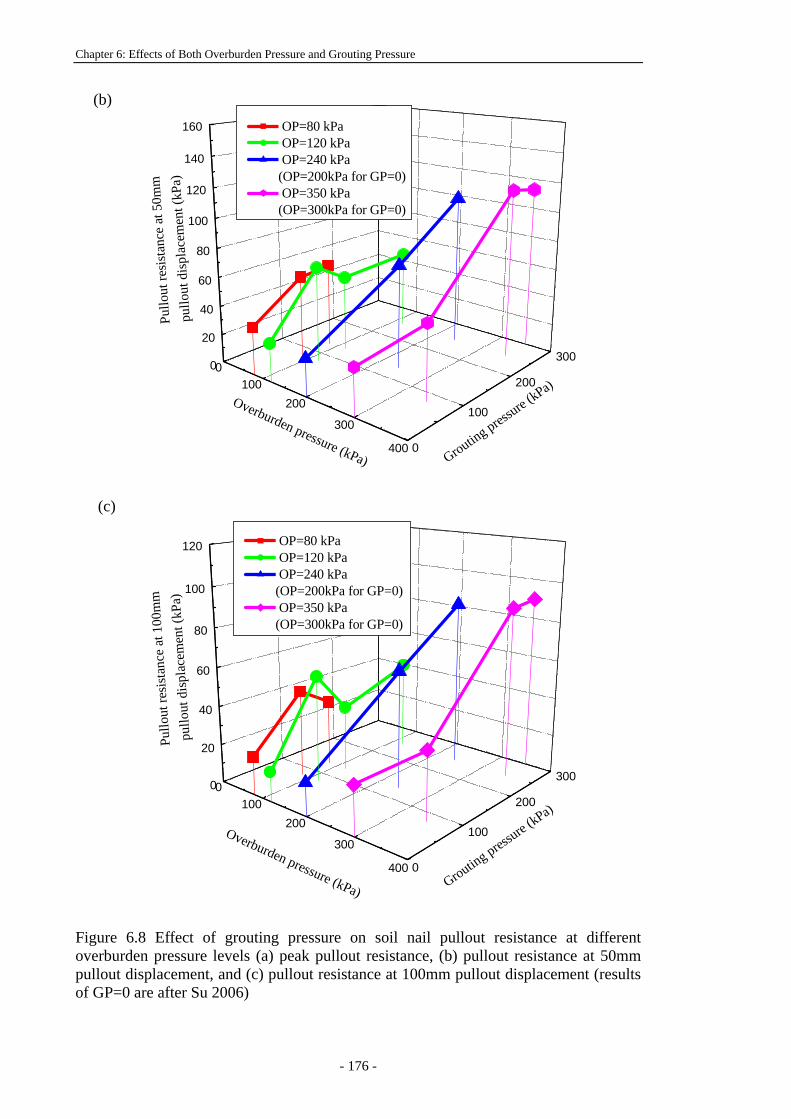
Chapter 6: Effects of Both Overburden Pressure and Grouting Pressure
- 176 -
0100
200
300
400 0
100
200
3000
20
40
60
80
100
120
140
160 OP=80 kPa OP=120 kPa OP=240 kPa
(OP=200kPa for GP=0) OP=350 kPa
(OP=300kPa for GP=0)
Pullo
ut re
sist
ance
at 5
0mm
pullo
ut d
ispl
acem
ent (
kPa)
Grouting pressure (
kPa)Overburden pressure (kPa)
0100
200
300
400 0
100
200
3000
20
40
60
80
100
120 OP=80 kPa OP=120 kPa OP=240 kPa
(OP=200kPa for GP=0) OP=350 kPa
(OP=300kPa for GP=0)
Pullo
ut re
sist
ance
at 1
00m
m
pullo
ut d
ispl
acem
ent (
kPa)
Grouting pressure (
kPa)
Overburden pressure (kPa)
Figure 6.8 Effect of grouting pressure on soil nail pullout resistance at different overburden pressure levels (a) peak pullout resistance, (b) pullout resistance at 50mm pullout displacement, and (c) pullout resistance at 100mm pullout displacement (results of GP=0 are after Su 2006)
(c)
(b)
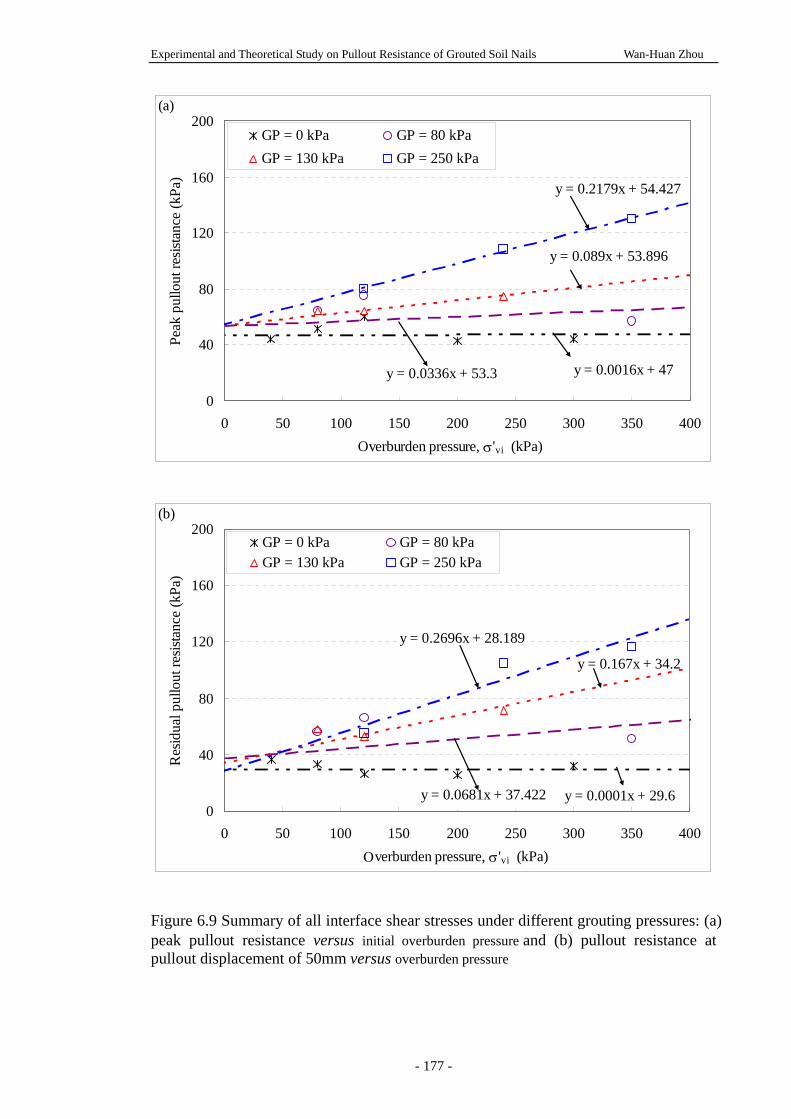
Experimental and Theoretical Study on Pullout Resistance of Grouted Soil Nails Wan-Huan Zhou
- 177 -
y = 0.0016x + 47y = 0.0336x + 53.3
y = 0.089x + 53.896
y = 0.2179x + 54.427
0
40
80
120
160
200
0 50 100 150 200 250 300 350 400Overburden pressure, σ'vi (kPa)
Peak
pul
lout
resis
tanc
e (k
Pa)
GP = 0 kPa GP = 80 kPaGP = 130 kPa GP = 250 kPa
(a)
y = 0.0001x + 29.6y = 0.0681x + 37.422
y = 0.167x + 34.2
y = 0.2696x + 28.189
0
40
80
120
160
200
0 50 100 150 200 250 300 350 400Οverburden pressure, σ'vi (kPa)
Res
idua
l pul
lout
resis
tanc
e (k
Pa)
GP = 0 kPa GP = 80 kPaGP = 130 kPa GP = 250 kPa
(b)
Figure 6.9 Summary of all interface shear stresses under different grouting pressures: (a) peak pullout resistance versus initial overburden pressure and (b) pullout resistance at pullout displacement of 50mm versus overburden pressure
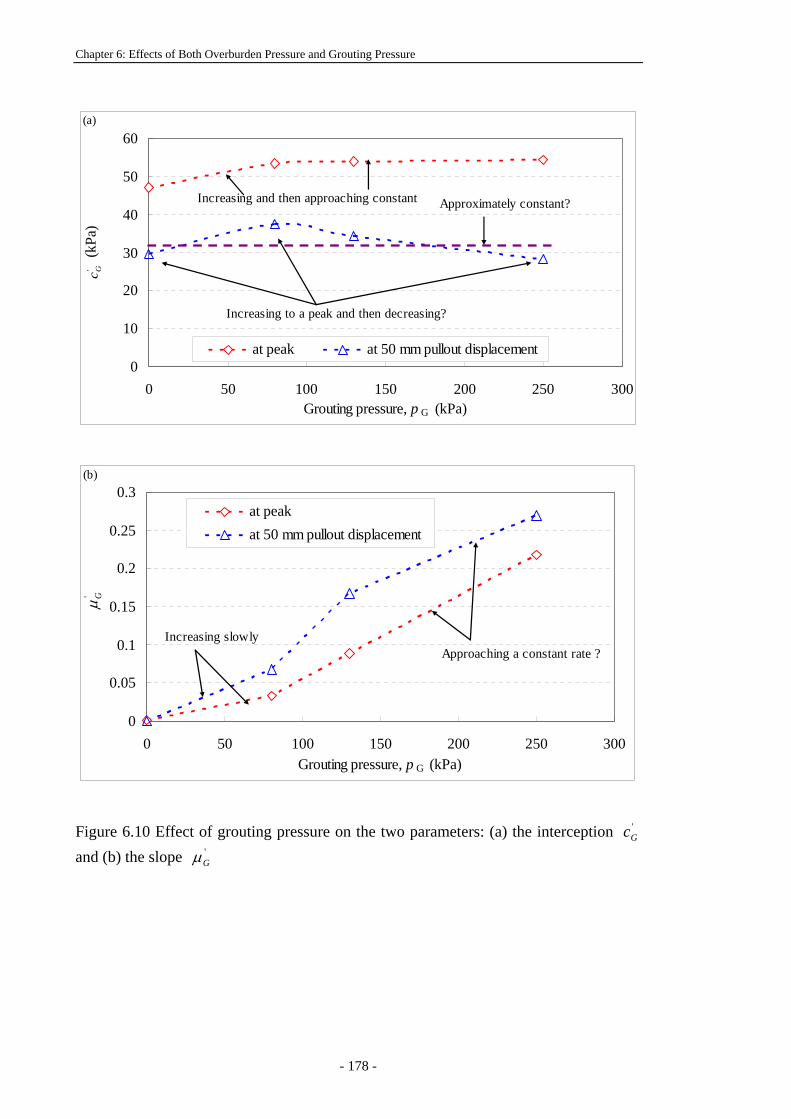
Chapter 6: Effects of Both Overburden Pressure and Grouting Pressure
- 178 -
0
10
20
30
40
50
60
0 50 100 150 200 250 300Grouting pressure, p G (kPa)
at peak at 50 mm pullout displacement
(kPa
)' Gc
(a)
Approximately constant?Increasing and then approaching constant
Increasing to a peak and then decreasing?
0
0.05
0.1
0.15
0.2
0.25
0.3
0 50 100 150 200 250 300Grouting pressure, p G (kPa)
at peakat 50 mm pullout displacement
' Gμ
(b)
Approaching a constant rate ?Increasing slowly
Figure 6.10 Effect of grouting pressure on the two parameters: (a) the interception '
Gc and (b) the slope '
Gμ
Experimental and Theoretical Study on Pullout Resistance of Grouted Soil Nails Wan-Huan Zhou
- 179 -
Chapter 7:
A 3D FINITE ELEMENT MODEL FOR SOIL NAIL
PULLOUT TESTS
7.1 INTRODUCTION
A total of thirty six laboratory soil nail pullout tests have been carried out in Soil
Mechanics Laboratory of the Department of Civil and Structural Engineering of The
Hong Kong Polytechnic University. Among these tests, twenty four tests were
reported by Su (2006), Su et al. (2007 and 2008) and Yin et al. (2008) and the other
twelve tests were done by the writer and are presented above in Chapters 4, 5, and 6.
These physical modelling tests are specially designed to study the pullout resistance of
grouted soil nails in a typical Hong Kong soil, completely decomposed granite (CDG)
soil. The tests were conducted with strictly controlled test conditions to study the
influences of several important factors on soil nail pullout resistance. These factors
include stress release during hole drilling, saturation condition, overburden pressure,
and grouting pressure. The results and observations from these laboratory pullout tests
provide valuable data to enable better understanding of the mechanism of soil nail
pullout behaviour. Based on the findings and results from physical modelling, numerical
models can be established with proper simplification and assumptions. After the
numerical model is calibrated and verified by the experimental results, it can be used to
theoretically further demonstrate the soil nail pullout behaviour.
A simple mathematical model for the determination of soil nail pullout resistance has
Chapter 7: A 3D Finite Element Model for Soil Nail Pullout Tests
- 180 -
been developed and is presented in Chapter 3. The simple model describes the evolution
of pullout shear stresses along the nail when considering the effects of both soil dilation
and nail bending. However, this model simplifies the soil lateral reaction on the nail by
using disconnected non-linear springs. Considering the fact that the soil surrounding the
soil nail is a continuum material, the soil-nail interaction can be better simulated by a
finite element model based on continuum mechanics. The finite element method has the
advantage of simulating the deformation, stress (strain) distribution, and failure in the
continuum materials with interface problems. Finite element models for soil nailed
structures have been established by different authors (Benhamida et al. 1997, Kim et al.
1997, Smith and Su 1997, Ochiai et al. 1997, and Cheuk et al. 2005). In their analysis,
the interface between soil nail and soil was normally assumed dependent on the
overburden pressure. Some important factors, including drilling process with stress
release, soil dilation, overburden pressure, and grouting pressure, were seldom
considered in previous models, though many researchers had acknowledged these
factors had significant influences on the pullout resistance of grouted soil nails.
In this project, a three-dimensional (3D) finite element (FE) model has been established
for simulating the pullout tests carried out at The Hong Kong Polytechnic University. A
general purpose 3D FE program, (ABAQUS 2005) is used in this study. The model
simulates all the procedures of the pullout tests for the conditions of both unsaturated
soil without pressure grouting and saturated soil with pressure grouting. The factors of
soil dilation, overburden pressure and grouting pressure are considered in the present
3D FE model. The model mesh, simulation procedures, material constitutive models and
parameters are presented and discussed in this chapter. The model verification results
and parametric study are presented in Chapter 8.
Experimental and Theoretical Study on Pullout Resistance of Grouted Soil Nails Wan-Huan Zhou
- 181 -
7.2 MESH AND BOUNDARY CONDITIONS
A 3D finite element (FE) model was established to simulate the laboratory soil nail
pullout tests. The model is illustrated in Figure 7.1, in different views. Using the same
dimensions as in the physical model in Chapter 4, the dimensions of the FE model were
1.0m in length, 0.6m in width and 0.81m in height, where the soil sample was 0.8m
high and the wooden plate placed on the soil sample was 0.01m thick. Overburden
pressure was applied on the top surface of the model, as shown in Figure 7.1a. As
shown in the top view (Figure 7.1 b & c), the soil nail is 1.2m long with an extension
length of 0.2m outside the pullout box. According to the pullout tests, a circular hole
was excavated through the soil sample, centered at the level 0.315m in height and 0.1m
in diameter (Figure 7.1d). A soil nail was constructed in the drillhole for the analysis.
The mesh around the hole was fine, becoming coarser towards the edge of the box. The
soil and wooden plate were represented by 7440 linear hexahedral elements with
reduced integration.
During the pullout tests, the soil nail was composed of a steel rebar and cement grout.
The strength of the soil nail was much stronger than the surrounding soil. The bond
between the steel bar and the grout was considered to be strong enough to keep the same
strain in both materials and no crack occurred in the grout during the pullout. In the
finite element modelling, the soil nail can be simulated by beam elements or solid
elements. In the soil nail pullout simulation, it is essential to calculate the axial forces of
the nails. The use of beam elements rather than solid elements reduces the mesh size
and directly provides the results of soil nail axial forces. Therefore, the cross-section
stress and strain distribution in the soil nail was considered uniform during pullout. 3D
2-node beam elements with circular section were chosen to simulate the behaviour of
Chapter 7: A 3D Finite Element Model for Soil Nail Pullout Tests
- 182 -
the nail in the present FE model, as shown in Figure 7.2. A length of 1.2m and a
homogeneous circular section of 0.1m in diameter were specified for the soil nail. A
uniform mesh with 36 line elements was used to represent the soil nail.
A cylindrical surface with a diameter of 0.1m and length of 1.2m was created and
constrained (tied) to the soil nail (represented by a beam). The surface was represented
by 864 quadrilateral elements, as shown in Figure 7.2(a). In ABAQUS/Standard
(ABAQUS 2005), contact can be defined between two bodies in terms of two surfaces
that may interact. These surfaces are called a “contact pair”. In the present model, a
contact pair was built between the cylindrical surface and the drillhole surface of the
soil, so that interaction between the soil nail and the surrounding soil was established
through the cylindrical surface.
It is noted that pullout failure may occur at the soil-nail interface and in the surrounding
soil. A thin layer of soil surrounding the nail surface would experience strong
disturbance during drilling, grouting, and pullout procedures, and pullout failure may
occur in this thin layer and the soil-nail interface. Therefore, an 8mm thickness soil
layer surrounding the nail (or drillhole) surface, as shown in Figure 7.2(b), is considered
as the interface soil layer, and the material parameters should be specified with due
consideration given to the disturbance effect during the test procedures.
7.3 SIMULATION OF TEST PROCEDURES
Simulation of real case procedures of pullout tests is necessary, as the stress in the soil
significantly changes during the test. The simulation includes three steps for the
pullout tests without pressure grouting in the unsaturated soil, they are: initial stress
Experimental and Theoretical Study on Pullout Resistance of Grouted Soil Nails Wan-Huan Zhou
- 183 -
establishment, hole drilling, and pullout. The simulation for the saturated case with
pressure grouting includes five steps: initial stress establishment, hole drilling, pressure
grouting, soil saturation, and pullout. The simulation procedures for these steps are
presented in the following section.
7.3.1 Establishment of the stress condition after drilling
The establishment of the stress condition in the pullout box after drilling was
accomplished by a computation in two steps. In this computation, the soil nail and
surface elements were firstly removed. The analysis contained the following two
steps:
Step 1 - the initial geostatic stress was constructed, with the applied body forces and
overburden pressure and constrained radial displacement of the drillhole
surface; and
Step 2- a stress-deformation calculation was carried out. In this step, the displacement
constraint at the drillhole surface was removed to simulate the drilling
procedure. All the elements were assigned with the soil properties to simulate
the test soil compacted in the pullout box.
From the above two steps, the stress condition in the pullout box after drilling was
obtained.
In the pullout analysis, the strains (or deformations) generated in the soil elements
surrounding the drillhole in the above two steps of drilling analysis will result in contact
difficulties between the surface elements and the soil elements. For the simulation of
pullout tests under unsaturated condition without pressure grouting, the soil stresses
obtained in the above two steps of calculations were then collected and input into the
Chapter 7: A 3D Finite Element Model for Soil Nail Pullout Tests
- 184 -
pullout analysis as the initial soil stress condition. Contact difficulties were thus
eliminated by ignoring the generated strains in the drilling analysis.
Simulations of pressure grouting and saturation for the pullout tests with pressure
grouting and saturation procedures were conducted following the drilling analysis.
7.3.2 Simulation of pressure grouting (for saturated case)
As stated above in Chapter 4, the maximum applied grouting pressure in the soil nail
pullout tests was 300kPa. As discussed in Chapter 5, some grouting injection effect
occurs when the grouting pressure is at a high level. During the grouting, the stress
surrounding the drillhole increases, but the increase lasts only a short time. Although the
surrounding stress decreases after the pressure grouting, it is believed that densification
effect influences the normal pressure on the soil-nail interface and the soil nail pullout
resistance. Examples of numerical modelling of low pressure grouting are limited in the
literature. Some researchers (Wisser et al., 2005, Soga et al., 2000, Addenbrooke et al.
2002) use a ‘prescribed pressure’ approach to model the grouting procedure for
compensation grouting, which is a technique for controlling the ground movements
caused by the construction of shallow tunnels. In a ‘prescribed pressure’ approach,
grout injection is generally modelled by a two-stage procedure. Firstly, an appropriate
numerical scheme is used to represent the effect of the pressure of the liquid grout on
the neighbouring soil. Secondly, to simulate the increase in stiffness of the grout as it
sets, the properties of the grout change when the injection is completed. This approach
has the potential for more detailed modelling of the grout flow, but special ‘grout
elements’ are likely to be required, hence increasing the complexity of the modelling.
In the present modelling, pressure grouting procedure was simulated by applying
Experimental and Theoretical Study on Pullout Resistance of Grouted Soil Nails Wan-Huan Zhou
- 185 -
pressure on the drillhole surface. The soil nail (simulated as beam elements and surface
elements) was then re-activated in the model. Nail gravity load was applied and contact
between the drillhole and the nail surface was established. Contact properties were
specified to simulate the setting of the soil nail. The grouting pressure was then
removed and some contact pressure was generated between the soil nail surface and
drillhole surface. The magnitude of the contact pressure is dependent on the specified
normal contact properties, which can be determined by back analysis.
Because the dimension of the drillhole has changed during the drilling and application
of pressure grouting, the two contact surfaces do not match when the soil nail is
re-activated in the model. The nodes in the drillhole surface penetrated into the soil nail
surface. This over-closure may result in convergence problems and some unreasonable
contact pressure between the contact surfaces may occur.
ABAQUS (ABAQUS 2005) uses a pure master-slave contact algorithm: nodes on the
slave surface cannot penetrate the segments that make up the master surface, as shown
in Figure 7.3. In this analysis, the soil nail surface is specified as the slave surface, and
the drillhole surface is the master surface. To overcome the contact problem mentioned
above, allowable interferences are specified to the node sets of the slave surface (soil
nail surface). The contact constraint imposed at each slave node is that the current
penetration of the node h(t) is 0≤ . When h(t) is positive, the slave node penetrates its
master surface. The specified allowable interference v modifies the contact constraint as
0)()( ≤− tvth . Thus, specifying a positive value for )(tv causes ABAQUS/Standard to
ignore penetrations of the slave node to that magnitude. Figure 7.4 illustrates a typical
interference fit problem. The magnitude of the allowable interference can be determined
by a pre-trial analysis. Through this approach, the generated contact pressure during the
Chapter 7: A 3D Finite Element Model for Soil Nail Pullout Tests
- 186 -
step of re-activating soil nail is small.
7.3.3 Simulation of saturation (for saturated case)
The soil saturation was conducted two days after the pressure grouting was completed.
As discussed in Chapter 4, the stress around the soil nail was increased to a certain
extent during saturation. It is believed the stress increase is related to the soil
densification effect of the pressure grouting and the soil properties reduction during the
saturation. Therefore, the simulation of soil saturation was conducted following the
pressure grouting step, so that the densification effect of the pressure grouting was taken
into account. The soil saturation was simulated by reducing the soil elastic modulus
over the saturation step.
It should be noted that for the drilling, pressure grouting and saturation simulation, only
the soil nail in the pullout box was considered. Because the soil in the extension
chamber was removed during the saturation, the soil nail in the extension chamber did
not influence the stress distribution in the pullout box. After the simulation of drilling,
pressure grouting, and saturation, the stress in the soil was used as the input initial soil
stress for the pullout analysis.
7.3.4 Soil nail pullout simulation
The initial stress state in the pullout analysis was obtained from drilling analysis (for
unsaturated case) or after saturation analysis (for saturated case). Stress equilibrium
was established in the first running step in this analysis. The soil nail of 1.2 m length
was activated in the model so that contact was established during the stress equilibrium
analysis. The soil strain generated in the previous procedures was eliminated to
overcome the problem of contact difficulties. In the following pullout step, a pullout
Experimental and Theoretical Study on Pullout Resistance of Grouted Soil Nails Wan-Huan Zhou
- 187 -
displacement was specified on the nail head to simulate the pullout of the soil nail.
Frictional contact properties were specified in this step.
Because of the high nonlinearity of the problem, the un-symmetric matrix
Quasi-Newton technique was chosen in the pullout analysis. The Quasi-Newton
technique can save substantial computational cost in some cases. Generally it is most
successful when the system is large and the stiffness matrix is not changing much from
iteration to iteration (ABAQUS 2005).
7.4 MATERIALS AND INTERFACE MODELS
7.4.1 A constitutive model for the unsaturated CDG soil
For the CDG soil, the elastic behaviour was modeled as linear isotropic elastic using the
generalized Hooke’s law. For the unsaturated CDG soil, the Mohr-Coulomb plasticity
model (ABAQUS 2005) with a non-associate flow rule was adopted, as the effect of soil
dilation was an important feature to be considered in the pullout modelling. The
Mohr-Coulomb failure criterion assumes that failure occurs when the shear stress on
any plane in a soil mass reaches a value that exceeds the normal stress on the same
plane multiplied by tan(φ ). The Mohr-Coulomb model can be expressed by plotting
Mohr’s circle for states of stress at failure in the plane of the maximum and minimum
principle stresses. The failure line is the straight line that touches these Mohr’s circles as
shown in Figure 7.5. The Mohr-Coulomb failure criterion is defined as
φστ tan+= c (7.1)
where, τ = shear stress, σ = normal stress, c= cohesion intercept, and φ = internal
friction angle of soil.
Chapter 7: A 3D Finite Element Model for Soil Nail Pullout Tests
- 188 -
The model is expressed in terms of three stress invariants in ABAQUS (ABAQUS
2005):
Mean total stress,
3321 σσσ ++
=p (7.2)
Mises equivalent stress,
)(23 S:S=q (7.3)
The third invariant of deviatoric stress
31
)( 29 S:SS ⋅=r (7.4)
where S is the deviatoric stress tensor and defined as IσS p−= ; σ is stress tensor; pI
is hydrostatic stress tensor; and I is unit tensor.
The Mohr-Coulomb failure surface is defined by
0tan =−+= cpqRF mc φ (7.5)
and
φπθπθφ
φθ tan3
cos31
3sin
cos31),( ⎟
⎠⎞
⎜⎝⎛ ++⎟
⎠⎞
⎜⎝⎛ +=mcR (7.6)
where c is the soil cohesion; the soil friction angle φ is the slope of the
Mohr-Coulomb yield surface in the p-Rmcq stress plane as shown in Figure 7.6, and it
can range from 0 to 90 ° ; and θ is the deviatoric polar angle defined as
3)/()3cos( qr=θ .
Experimental and Theoretical Study on Pullout Resistance of Grouted Soil Nails Wan-Huan Zhou
- 189 -
The flow potential G is defined as a hyperbolic function in meridional stress plane and
as a smooth elliptic function in deviatoric plane proposed by Menetrey and William
(1995), as shown in Figure 7.7
( ) ( ) ψψ tantan 220 pqRacG mw ++= (7.7)
and
( )φθθ
θθ π ,45cos)1(4)12(cos)1(2
)12(cos)1(4),( 32222
222
mcmw Reeeee
eeeR−+−−+−
−+−= (7.8)
where ψ is the dilation angle; 0c is the initial cohesion yield stress; a is the
meridional eccentricity with a default value of 0.1; and e is the deviatoric eccentricity
which is calculated as )sin3()sin3( φφ +−=e by default.
7.4.2 Constitutive model for the saturated CDG soil
It was observed from triaxial tests and soil nail pullout tests that the dilation behaviour
of the saturated CDG soil was not significant. Hence, the plastic behaviour of the
saturated CDG soil was modeled by the Modified Drucker-Prager/Cap plasticity model
(ABAQUS2005) in the finite element modelling. The yield surface of the modified
Drucker-Prager/Cap plasticity model consists of three parts: a Drucker-Prager shear
failure surface, an elliptical cap, which intersects the mean effective stress axis at a right
angle, and a smooth transition region between the shear failure surface and the cap, as
shown in Figure 7.8.
The onset of plastic behaviour is determined by the Drucker-Prager failure surface and
the cap yield surface. The Drucker-Prager failure surface is given by
0tan =−−= dptFs β (7.9)
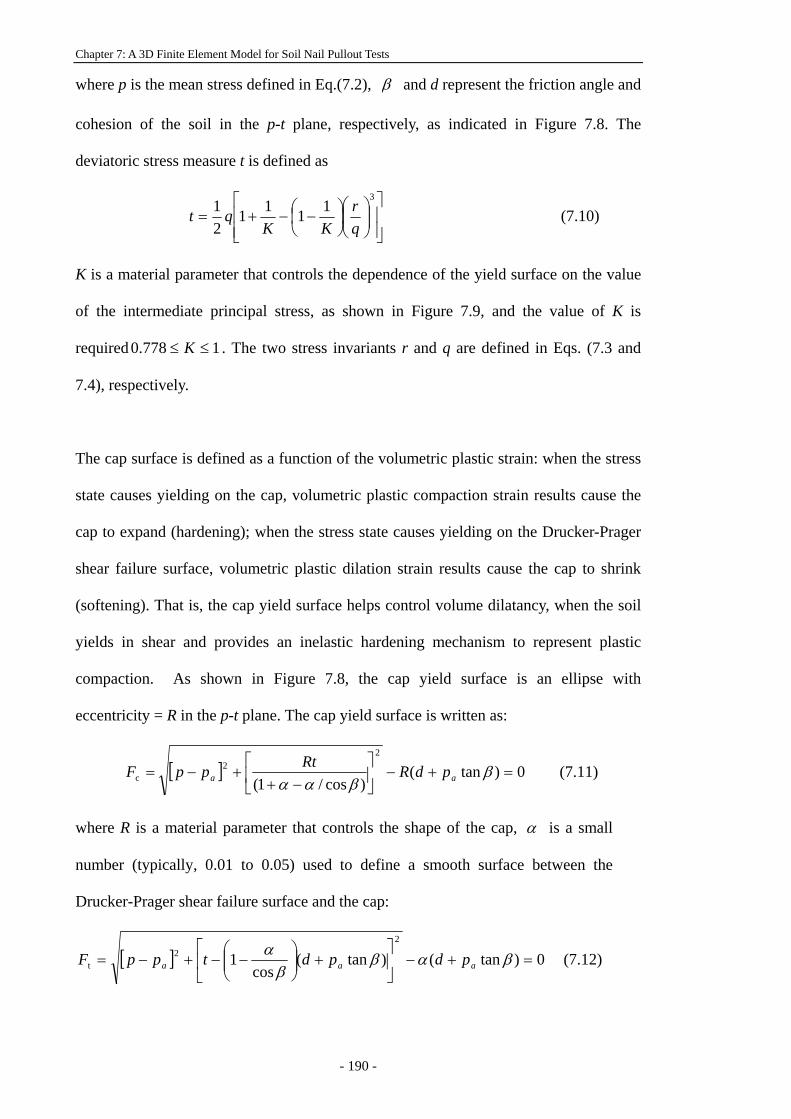
Chapter 7: A 3D Finite Element Model for Soil Nail Pullout Tests
- 190 -
where p is the mean stress defined in Eq.(7.2), β and d represent the friction angle and
cohesion of the soil in the p-t plane, respectively, as indicated in Figure 7.8. The
deviatoric stress measure t is defined as
⎥⎥⎦
⎤
⎢⎢⎣
⎡⎟⎟⎠
⎞⎜⎜⎝
⎛⎟⎠⎞
⎜⎝⎛ −−+=
31111
21
qr
KKqt (7.10)
K is a material parameter that controls the dependence of the yield surface on the value
of the intermediate principal stress, as shown in Figure 7.9, and the value of K is
required 1778.0 ≤≤ K . The two stress invariants r and q are defined in Eqs. (7.3 and
7.4), respectively.
The cap surface is defined as a function of the volumetric plastic strain: when the stress
state causes yielding on the cap, volumetric plastic compaction strain results cause the
cap to expand (hardening); when the stress state causes yielding on the Drucker-Prager
shear failure surface, volumetric plastic dilation strain results cause the cap to shrink
(softening). That is, the cap yield surface helps control volume dilatancy, when the soil
yields in shear and provides an inelastic hardening mechanism to represent plastic
compaction. As shown in Figure 7.8, the cap yield surface is an ellipse with
eccentricity = R in the p-t plane. The cap yield surface is written as:
[ ] 0)tan()cos/1(
22
c =+−⎥⎦
⎤⎢⎣
⎡−+
+−= ββαα aa pdRRtppF (7.11)
where R is a material parameter that controls the shape of the cap, α is a small
number (typically, 0.01 to 0.05) used to define a smooth surface between the
Drucker-Prager shear failure surface and the cap:
[ ] 0)tan()tan(cos
12
2t =+−⎥
⎦
⎤⎢⎣
⎡+⎟⎟
⎠
⎞⎜⎜⎝
⎛−−+−= βαβ
βα
aaa pdpdtppF (7.12)
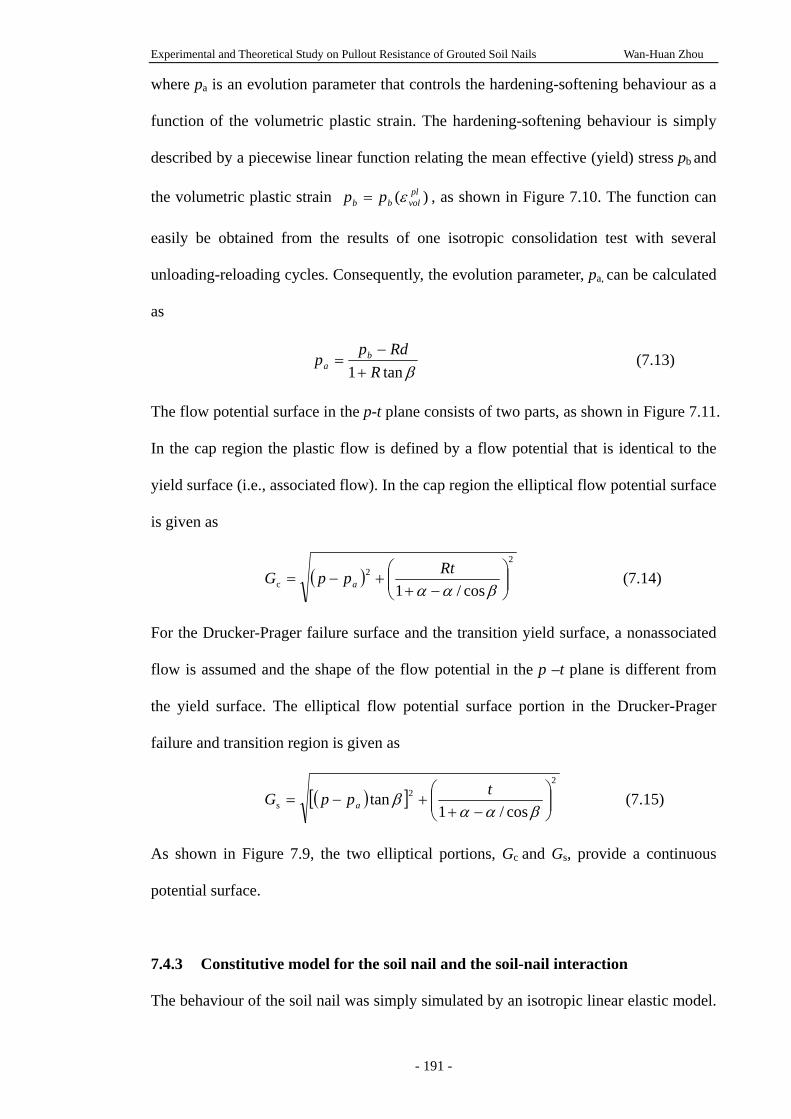
Experimental and Theoretical Study on Pullout Resistance of Grouted Soil Nails Wan-Huan Zhou
- 191 -
where pa is an evolution parameter that controls the hardening-softening behaviour as a
function of the volumetric plastic strain. The hardening-softening behaviour is simply
described by a piecewise linear function relating the mean effective (yield) stress pb and
the volumetric plastic strain )( plvolbb pp ε= , as shown in Figure 7.10. The function can
easily be obtained from the results of one isotropic consolidation test with several
unloading-reloading cycles. Consequently, the evolution parameter, pa, can be calculated
as
βtan1 RRdp
p ba +
−= (7.13)
The flow potential surface in the p-t plane consists of two parts, as shown in Figure 7.11.
In the cap region the plastic flow is defined by a flow potential that is identical to the
yield surface (i.e., associated flow). In the cap region the elliptical flow potential surface
is given as
( )2
2c cos/1 ⎟⎟
⎠
⎞⎜⎜⎝
⎛−+
+−=βαα
RtppG a (7.14)
For the Drucker-Prager failure surface and the transition yield surface, a nonassociated
flow is assumed and the shape of the flow potential in the p –t plane is different from
the yield surface. The elliptical flow potential surface portion in the Drucker-Prager
failure and transition region is given as
( )[ ]2
2s cos/1
tan ⎟⎟⎠
⎞⎜⎜⎝
⎛−+
+−=βαα
β tppG a (7.15)
As shown in Figure 7.9, the two elliptical portions, Gc and Gs, provide a continuous
potential surface.
7.4.3 Constitutive model for the soil nail and the soil-nail interaction
The behaviour of the soil nail was simply simulated by an isotropic linear elastic model.
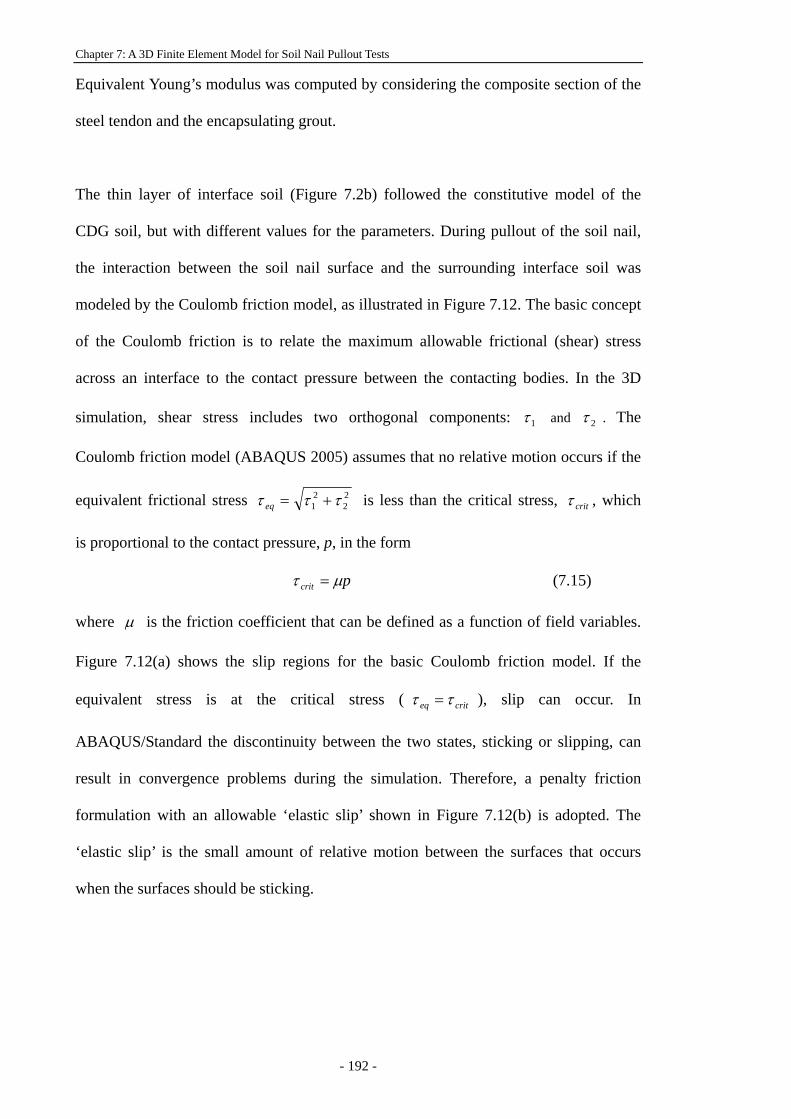
Chapter 7: A 3D Finite Element Model for Soil Nail Pullout Tests
- 192 -
Equivalent Young’s modulus was computed by considering the composite section of the
steel tendon and the encapsulating grout.
The thin layer of interface soil (Figure 7.2b) followed the constitutive model of the
CDG soil, but with different values for the parameters. During pullout of the soil nail,
the interaction between the soil nail surface and the surrounding interface soil was
modeled by the Coulomb friction model, as illustrated in Figure 7.12. The basic concept
of the Coulomb friction is to relate the maximum allowable frictional (shear) stress
across an interface to the contact pressure between the contacting bodies. In the 3D
simulation, shear stress includes two orthogonal components: 1τ and 2τ . The
Coulomb friction model (ABAQUS 2005) assumes that no relative motion occurs if the
equivalent frictional stress 22
21 τττ +=eq is less than the critical stress, critτ , which
is proportional to the contact pressure, p, in the form
pcrit μτ = (7.15)
where μ is the friction coefficient that can be defined as a function of field variables.
Figure 7.12(a) shows the slip regions for the basic Coulomb friction model. If the
equivalent stress is at the critical stress ( criteq ττ = ), slip can occur. In
ABAQUS/Standard the discontinuity between the two states, sticking or slipping, can
result in convergence problems during the simulation. Therefore, a penalty friction
formulation with an allowable ‘elastic slip’ shown in Figure 7.12(b) is adopted. The
‘elastic slip’ is the small amount of relative motion between the surfaces that occurs
when the surfaces should be sticking.
Experimental and Theoretical Study on Pullout Resistance of Grouted Soil Nails Wan-Huan Zhou
- 193 -
7.5 MATERIAL PARAMETERS IN ANALYSIS
7.5.1 Parameters for unsaturated CDG soil
Su (2006) has carried out double cell triaxial tests on unsaturated specimens of the
recompacted CDG soil with different values of initial degree of saturations and different
confining pressures. The double cell triaxial apparatus (Yin 2003) has the advantage
of accurately measuring the volume change of partially saturated soil specimens in
triaxial testing. All the soil specimens were compacted to 95% of the maximum dry
density in certain initial degree of saturation (35%, 50% or 75%). The specimen was
100mm in height and 50mm in diameter. In the present study, data under 75% degree
of saturation were selected. Su (2006) reported consolidated drained test data for the
CDG soil with an initial saturation degree of 75% under different confining pressures
(80 kPa, 120 kPa, 200 kPa, and 300 kPa). After the drained compression testing, the
value of the degree of saturation of the soil specimens was found almost unchanged.
As stated above in Section 7.4.1, the unsaturated CDG soil is modeled by elastic-plastic
Mohr-Coulomb model, which contains four parameters, Young’s Modulus (E),
Poisson’s ratio (ν), soil cohesion (c), friction angle (φ ) and dilation angle (ψ ). It is
well known that these parameters are not constant during soil shearing. These
parameters are therefore selected by back analysis using an axisymmetric finite element
model for triaxial tests, as shown in Figure 7.13, where a cylindrical soil specimen with
D=50mm, and H=100mm is considered.
Figure 7.14 shows the data from double cell triaxial tests on unsaturated CDG soil (Su
2006) and the fitting curves from elastic - plastic Mohr-Coulomb model. It can be seen
that the modelling curves represent the main features of the stress-strain behaviour of
the unsaturated CDG soil during shearing, under different confining pressures. In
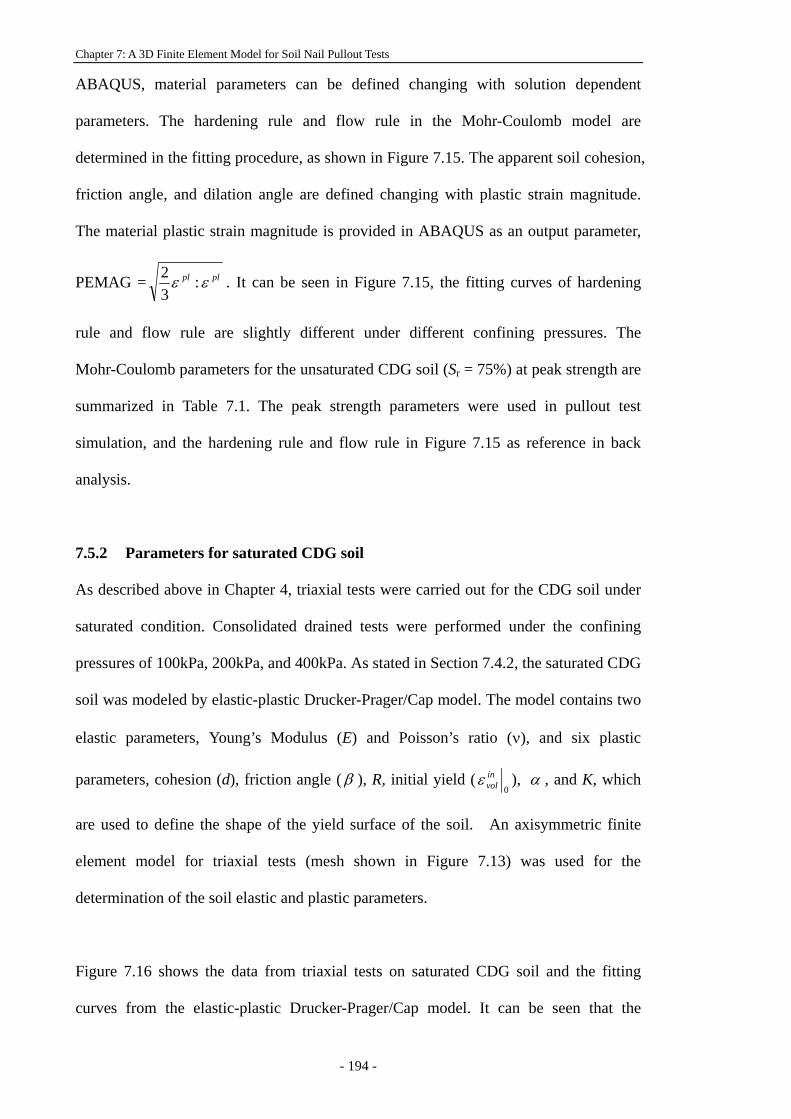
Chapter 7: A 3D Finite Element Model for Soil Nail Pullout Tests
- 194 -
ABAQUS, material parameters can be defined changing with solution dependent
parameters. The hardening rule and flow rule in the Mohr-Coulomb model are
determined in the fitting procedure, as shown in Figure 7.15. The apparent soil cohesion,
friction angle, and dilation angle are defined changing with plastic strain magnitude.
The material plastic strain magnitude is provided in ABAQUS as an output parameter,
PEMAG = plpl εε :32 . It can be seen in Figure 7.15, the fitting curves of hardening
rule and flow rule are slightly different under different confining pressures. The
Mohr-Coulomb parameters for the unsaturated CDG soil (Sr = 75%) at peak strength are
summarized in Table 7.1. The peak strength parameters were used in pullout test
simulation, and the hardening rule and flow rule in Figure 7.15 as reference in back
analysis.
7.5.2 Parameters for saturated CDG soil
As described above in Chapter 4, triaxial tests were carried out for the CDG soil under
saturated condition. Consolidated drained tests were performed under the confining
pressures of 100kPa, 200kPa, and 400kPa. As stated in Section 7.4.2, the saturated CDG
soil was modeled by elastic-plastic Drucker-Prager/Cap model. The model contains two
elastic parameters, Young’s Modulus (E) and Poisson’s ratio (ν), and six plastic
parameters, cohesion (d), friction angle (β ), R, initial yield (0
involε ), α , and K, which
are used to define the shape of the yield surface of the soil. An axisymmetric finite
element model for triaxial tests (mesh shown in Figure 7.13) was used for the
determination of the soil elastic and plastic parameters.
Figure 7.16 shows the data from triaxial tests on saturated CDG soil and the fitting
curves from the elastic-plastic Drucker-Prager/Cap model. It can be seen that the
Experimental and Theoretical Study on Pullout Resistance of Grouted Soil Nails Wan-Huan Zhou
- 195 -
modelling curves show good agreement with the experiment data under different
confining pressures. The soil parameters were therefore determined from the fitting
procedure. Table 7.2 summarizes the Drucker-Prager/Cap model parameters for
saturated CDG soil, where the soil cohesion and friction angle are equivalent to zero
and 35.1° , respectively. The cap hardening curves under different confining
pressures are shown in Figure 7.17, which represents the evolution of the plastic
volumetric strain with the mean effective stress.
7.5.3 Parameters for soil nail and soil-nail interface
As discussed in Section 7.4.3, the nail was simulated by an isotropic linear elastic model.
The density, Young’s Modulus and Poisson’s ratio for the nail were selected as 2000
kg/m3, 32GPa and 0.28, respectively.
The parameters of the interface soil and interaction friction coefficient (μ) were
determined by back analysis. The goal of the matching procedure is to reproduce the
soil nail pullout behaviour, as closely as possible, by the finite element model, using
appropriate values for the interface soil parameters as well as parameters for the
Coulomb interaction model. Numerous prediction attempts by the finite element method
were required to achieve this goal. The back-calculated values are discussed in the
model verification in Chapter 8.
7.6 SUMMARY AND FINDINGS
A three-dimensional (3D) finite element (FE) model based on ABAQUS/standard has
been established for simulation of the soil nail pullout tests carried out at The Hong
Kong Polytechnic University. The model can be used to simulate the pullout tests for
Chapter 7: A 3D Finite Element Model for Soil Nail Pullout Tests
- 196 -
the conditions of both unsaturated without pressure grouting and saturated with pressure
grouting.
The soil nail was simulated by a beam with a tied cylindrical surface. The interaction
between the soil nail and the surrounding soil was thus established through the surface.
The simulation procedures included the initial stress establishment, hole drilling,
pressure grouting, soil saturation, and pullout. Some measures for solving the contact
problems during the modelling have been discussed.
The constitutive models for the soil and interface have been discussed and presented.
For the unsaturated CDG soil, the elastic-plastic Mohr-Coulomb model was adopted as
the dilation behaviour was dominant in the modelling. For the saturated CDG soil, the
elastic-plastic Drucker-Prager/Cap model was found suitable to represent the soil
stress-strain behaviour in a saturated condition. The interaction between the soil nail
surface and the surrounding soil was modelled by a Coulomb Model. The soil models
were calibrated by triaxial tests results. Elastic and plastic parameters of the CDG soil
were determined by fitting procedure. It was found that the selected model can represent
the soil stress-strain behaviour under different confining pressures. The verification of
the 3D finite element model is presented in the following chapter.
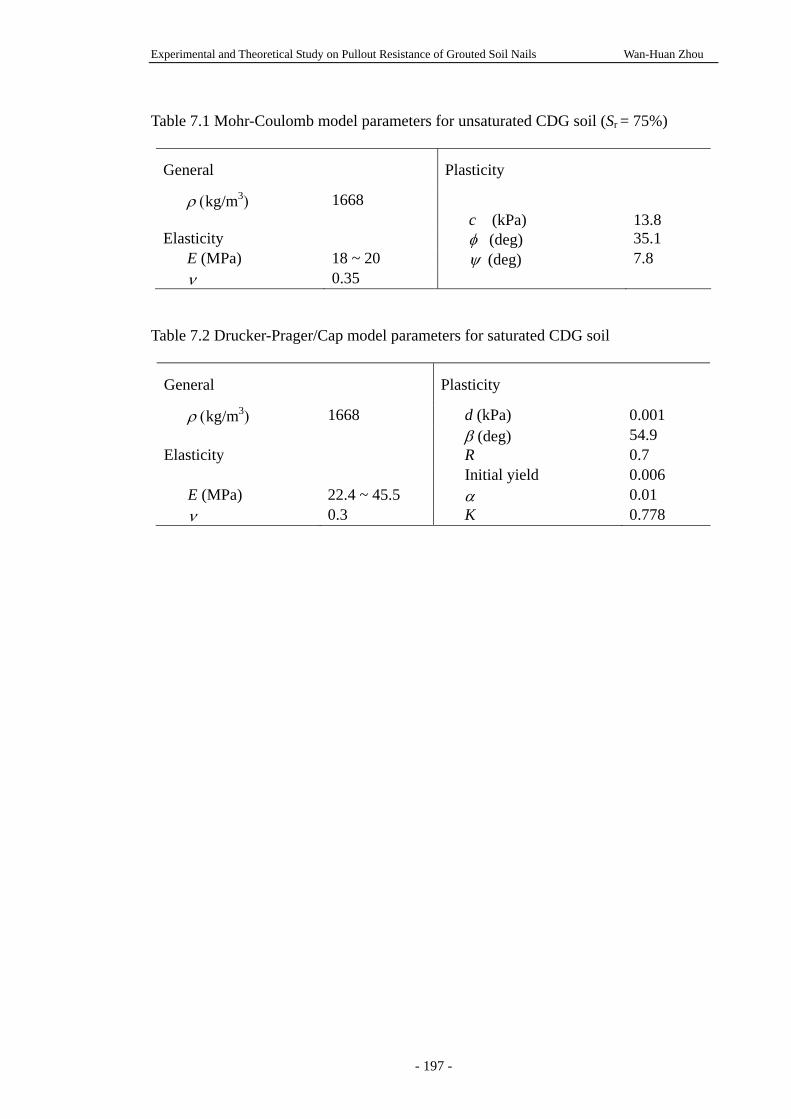
Experimental and Theoretical Study on Pullout Resistance of Grouted Soil Nails Wan-Huan Zhou
- 197 -
Table 7.1 Mohr-Coulomb model parameters for unsaturated CDG soil (Sr = 75%)
General Plasticity
ρ (kg/m3) 1668 c (kPa) 13.8 Elasticity φ (deg) 35.1
E (MPa) 18 ~ 20 ψ (deg) 7.8 ν 0.35
Table 7.2 Drucker-Prager/Cap model parameters for saturated CDG soil
General Plasticity
ρ (kg/m3) 1668 d (kPa) 0.001 β (deg) 54.9 Elasticity R 0.7
Initial yield 0.006 E (MPa) 22.4 ~ 45.5 α 0.01 ν 0.3 K 0.778
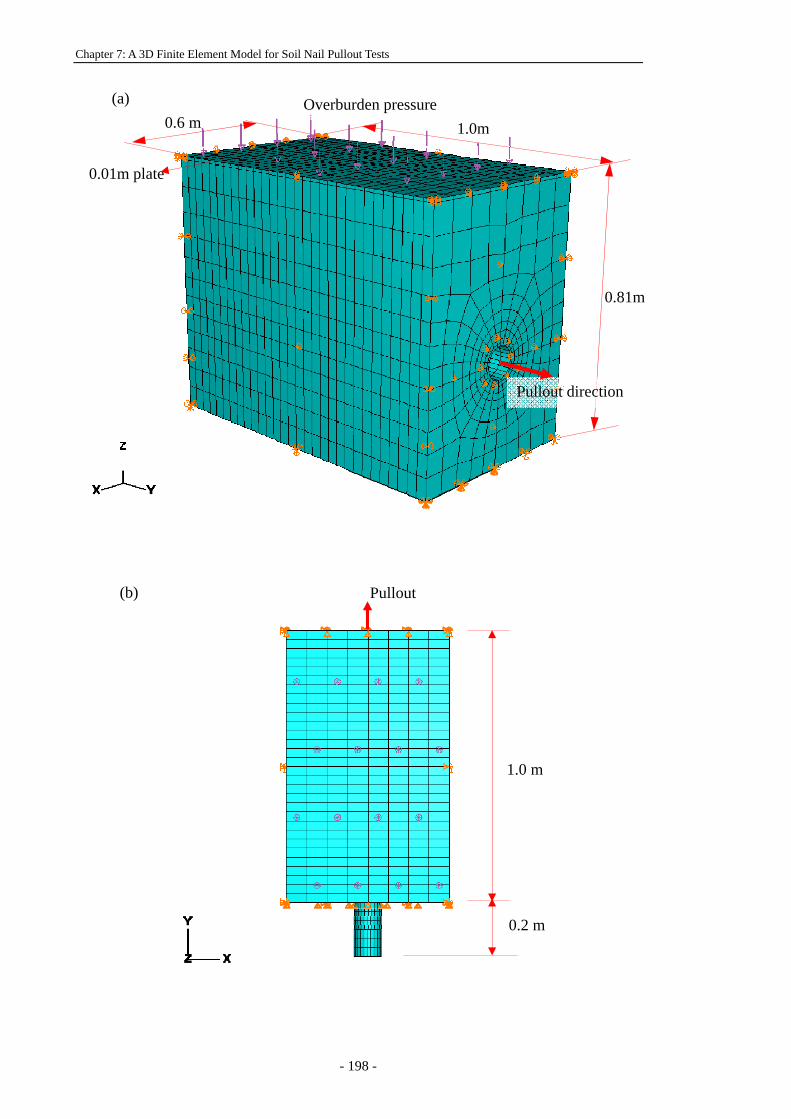
Chapter 7: A 3D Finite Element Model for Soil Nail Pullout Tests
- 198 -
1.0 m
0.2 m
Pullout
(a)
(b)
1.0m
0.81m
0.6 m
0.01m plate
Overburden pressure
Pullout direction
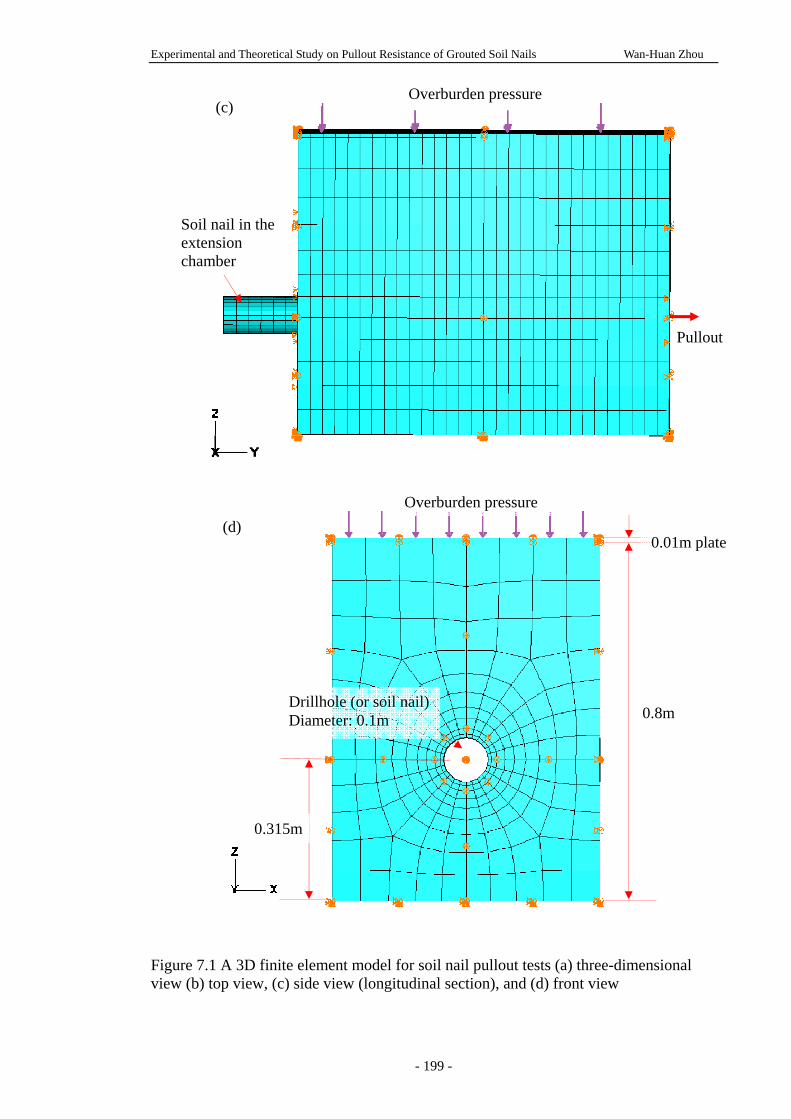
Experimental and Theoretical Study on Pullout Resistance of Grouted Soil Nails Wan-Huan Zhou
- 199 -
Figure 7.1 A 3D finite element model for soil nail pullout tests (a) three-dimensional view (b) top view, (c) side view (longitudinal section), and (d) front view
Overburden pressure
Pullout
Soil nail in the extension chamber
Drillhole (or soil nail)Diameter: 0.1m
0.315m
0.8m
0.01m plate
Overburden pressure
(c)
(d)
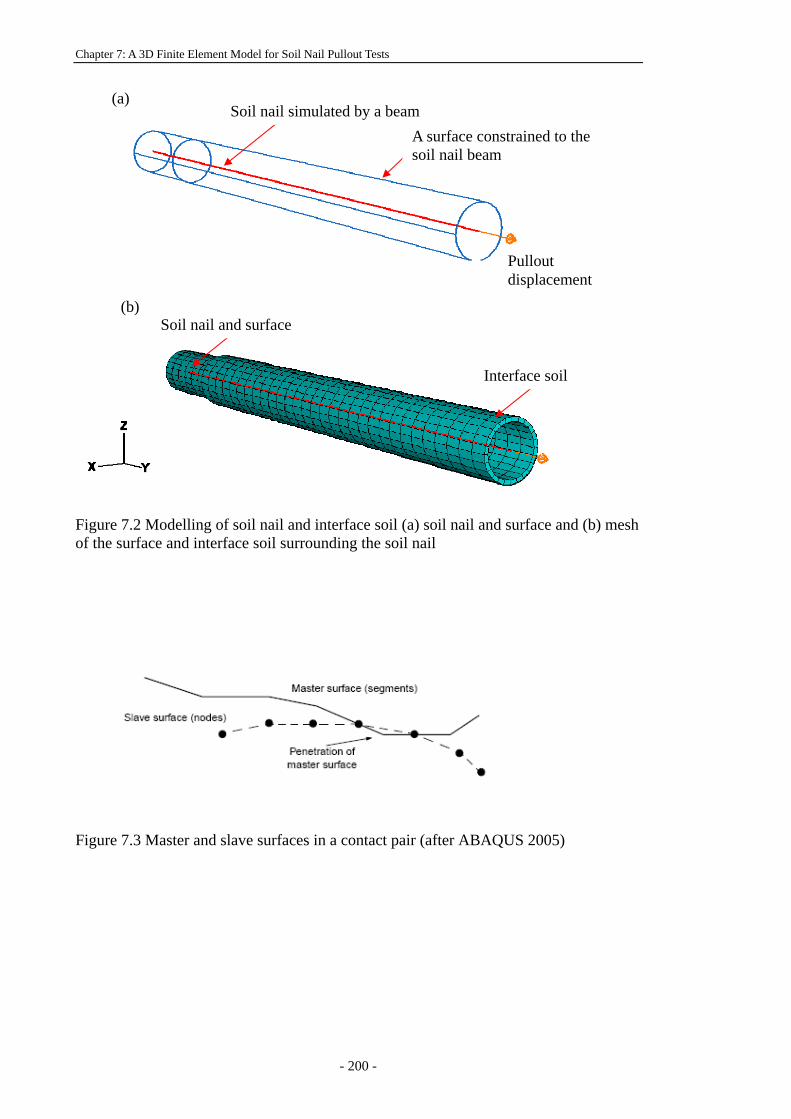
Chapter 7: A 3D Finite Element Model for Soil Nail Pullout Tests
- 200 -
Figure 7.2 Modelling of soil nail and interface soil (a) soil nail and surface and (b) mesh of the surface and interface soil surrounding the soil nail
Figure 7.3 Master and slave surfaces in a contact pair (after ABAQUS 2005)
(b) Soil nail and surface
Interface soil
(a) Soil nail simulated by a beam
A surface constrained to the soil nail beam
Pullout displacement
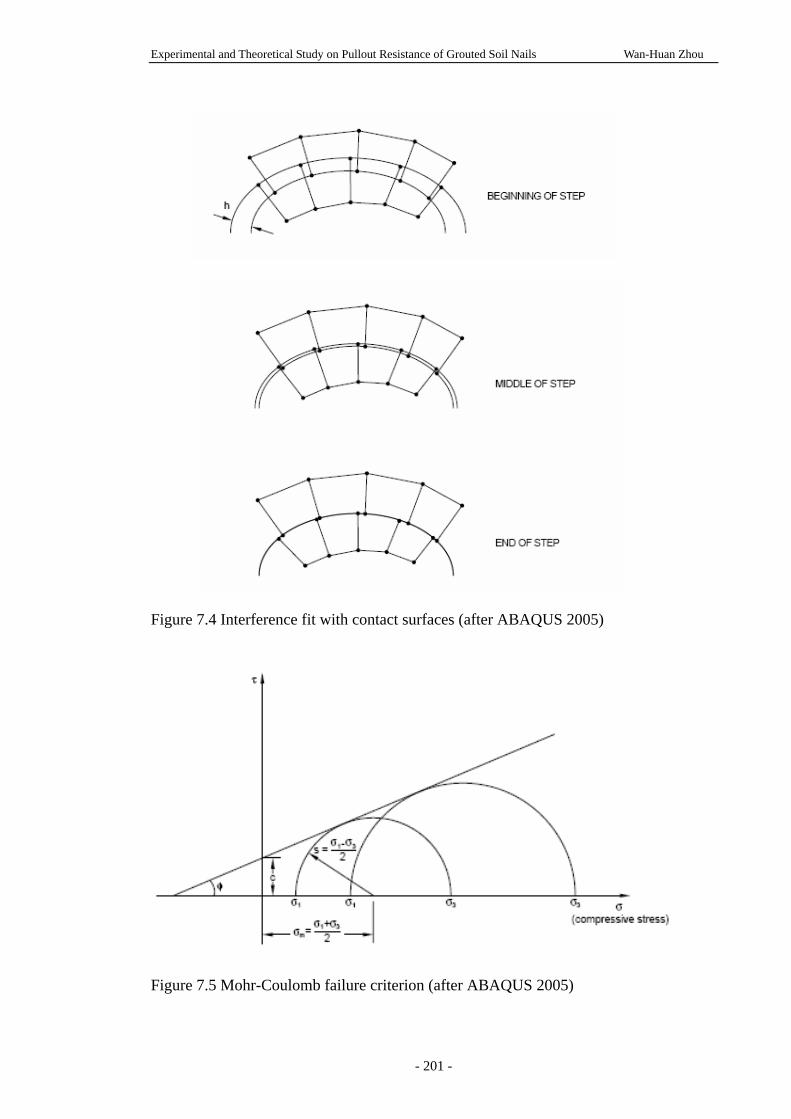
Experimental and Theoretical Study on Pullout Resistance of Grouted Soil Nails Wan-Huan Zhou
- 201 -
Figure 7.4 Interference fit with contact surfaces (after ABAQUS 2005)
Figure 7.5 Mohr-Coulomb failure criterion (after ABAQUS 2005)
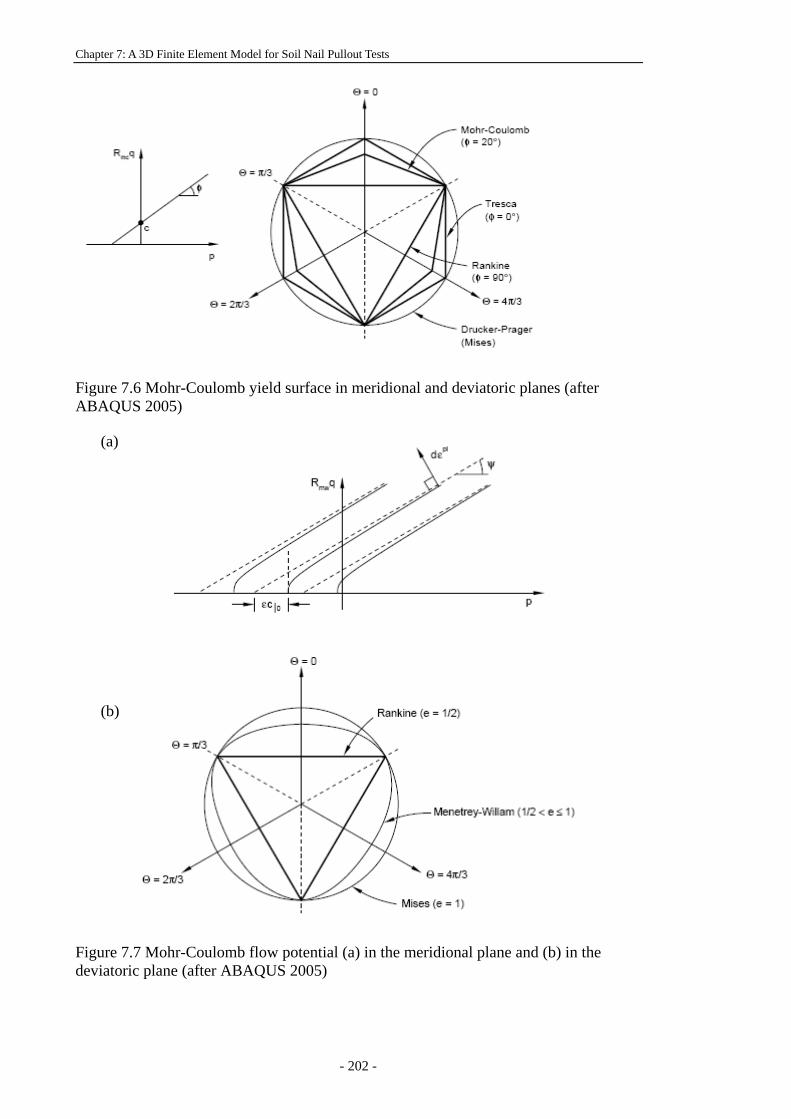
Chapter 7: A 3D Finite Element Model for Soil Nail Pullout Tests
- 202 -
Figure 7.6 Mohr-Coulomb yield surface in meridional and deviatoric planes (after ABAQUS 2005)
Figure 7.7 Mohr-Coulomb flow potential (a) in the meridional plane and (b) in the deviatoric plane (after ABAQUS 2005)
(b)
(a)
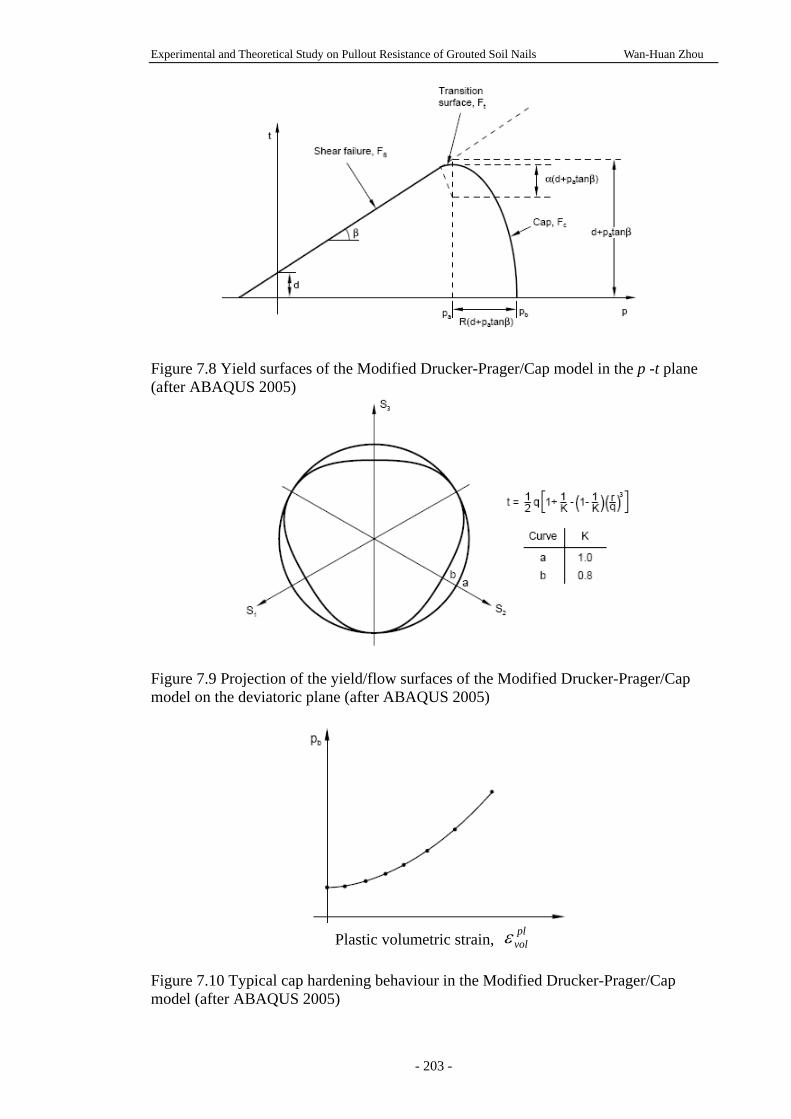
Experimental and Theoretical Study on Pullout Resistance of Grouted Soil Nails Wan-Huan Zhou
- 203 -
Figure 7.8 Yield surfaces of the Modified Drucker-Prager/Cap model in the p -t plane (after ABAQUS 2005)
Figure 7.9 Projection of the yield/flow surfaces of the Modified Drucker-Prager/Cap model on the deviatoric plane (after ABAQUS 2005)
Plastic volumetric strain, pl
volε Figure 7.10 Typical cap hardening behaviour in the Modified Drucker-Prager/Cap model (after ABAQUS 2005)
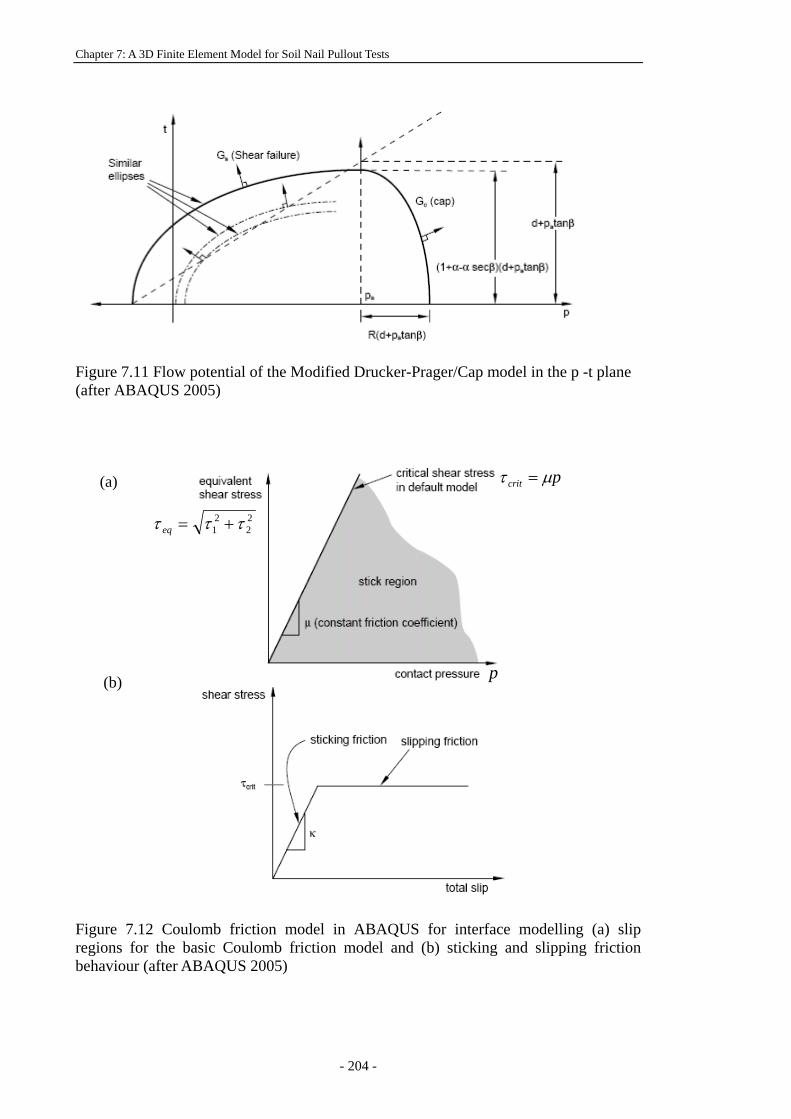
Chapter 7: A 3D Finite Element Model for Soil Nail Pullout Tests
- 204 -
Figure 7.11 Flow potential of the Modified Drucker-Prager/Cap model in the p -t plane (after ABAQUS 2005)
Figure 7.12 Coulomb friction model in ABAQUS for interface modelling (a) slip regions for the basic Coulomb friction model and (b) sticking and slipping friction behaviour (after ABAQUS 2005)
(a)
(b)
pcrit μτ =
22
21 τττ +=eq
p
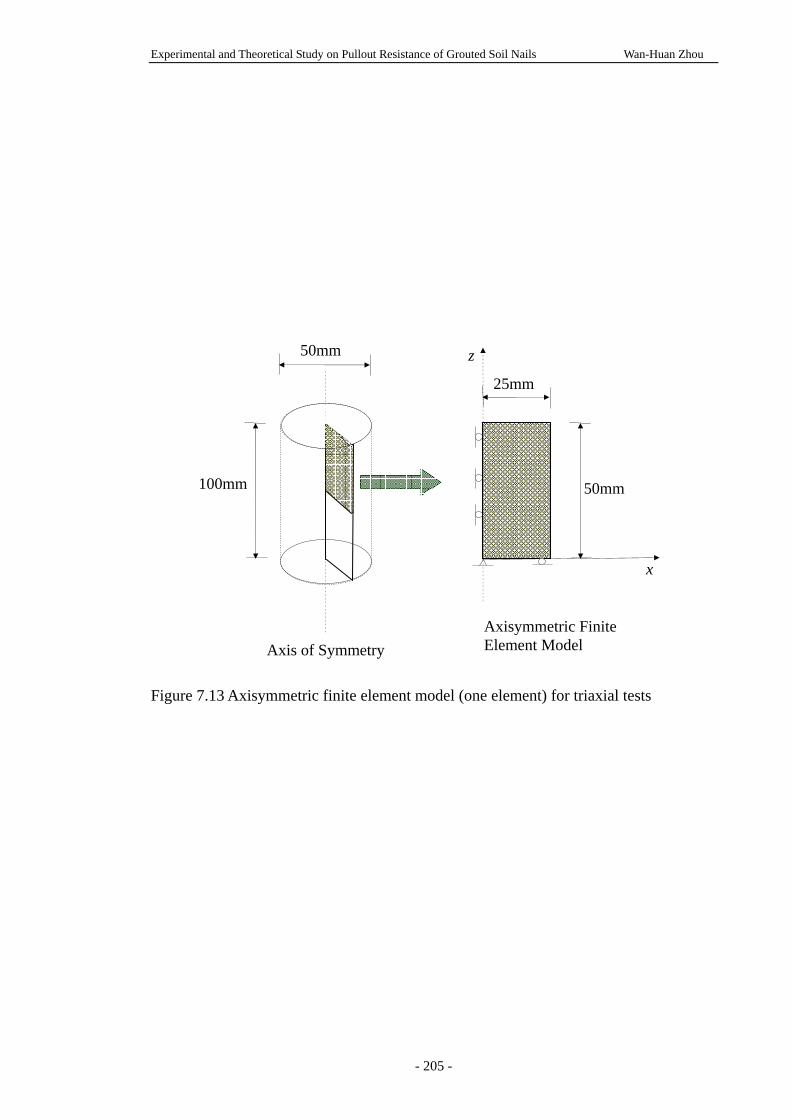
Experimental and Theoretical Study on Pullout Resistance of Grouted Soil Nails Wan-Huan Zhou
- 205 -
Figure 7.13 Axisymmetric finite element model (one element) for triaxial tests
50mm
100mm
Axis of Symmetry Axisymmetric Finite Element Model
25mm
50mm
x
z
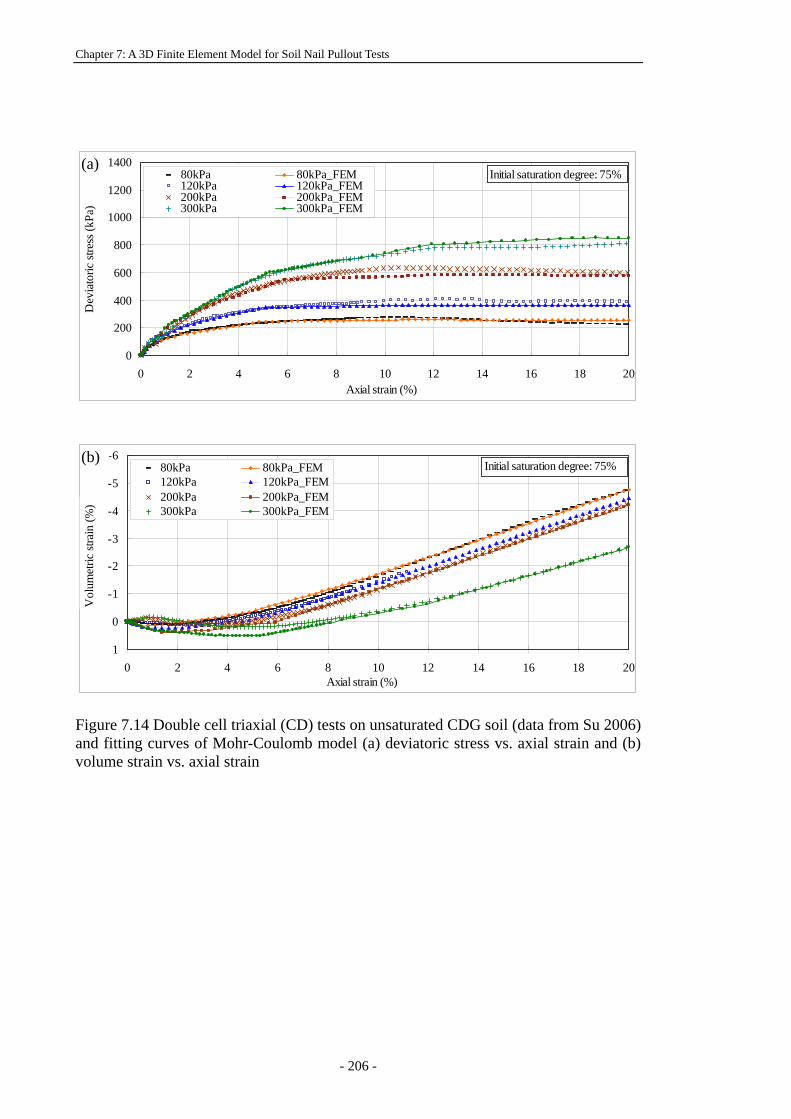
Chapter 7: A 3D Finite Element Model for Soil Nail Pullout Tests
- 206 -
0
200
400
600
800
1000
1200
1400
0 2 4 6 8 10 12 14 16 18 20Axial strain (%)
Dev
iato
ric st
ress
(kPa
) __
80kPa 80kPa_FEM120kPa 120kPa_FEM200kPa 200kPa_FEM300kPa 300kPa_FEM
Initial saturation degree: 75%
-6
-5
-4
-3
-2
-1
0
10 2 4 6 8 10 12 14 16 18 20
Axial strain (%)
Vol
umet
ric st
rain
(%)
80kPa 80kPa_FEM120kPa 120kPa_FEM200kPa 200kPa_FEM300kPa 300kPa_FEM
Initial saturation degree: 75%
Figure 7.14 Double cell triaxial (CD) tests on unsaturated CDG soil (data from Su 2006) and fitting curves of Mohr-Coulomb model (a) deviatoric stress vs. axial strain and (b) volume strain vs. axial strain
(a)
(b)
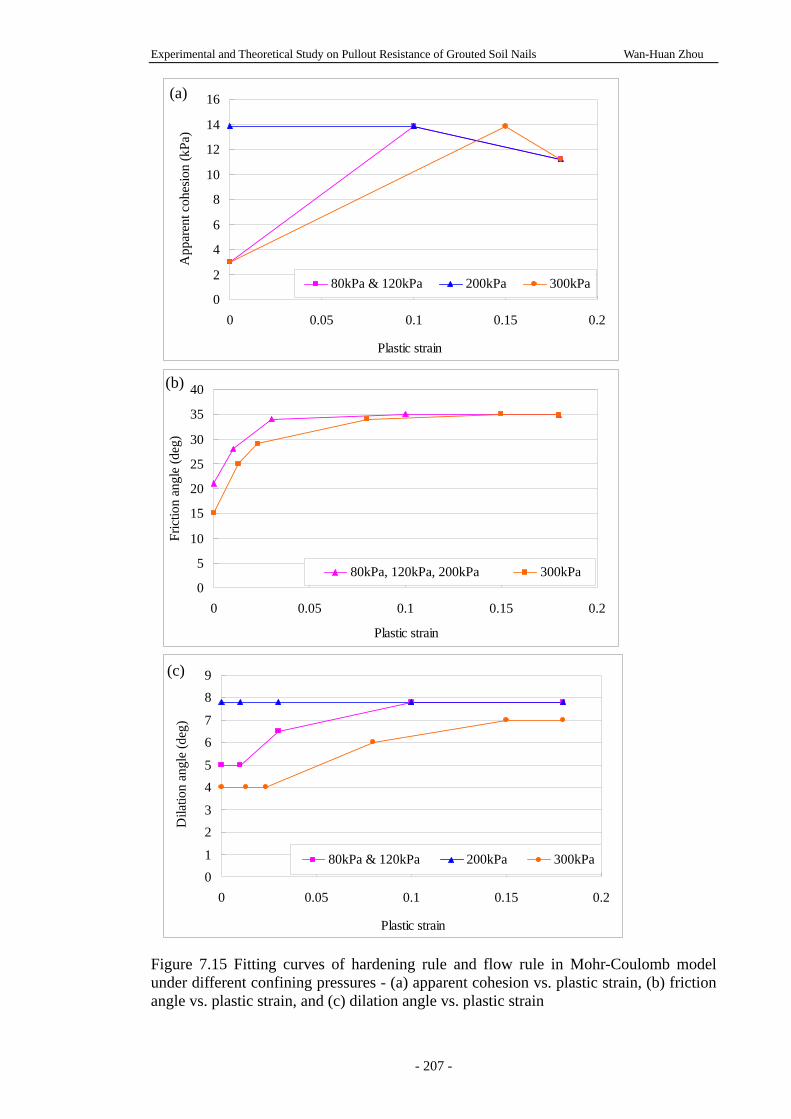
Experimental and Theoretical Study on Pullout Resistance of Grouted Soil Nails Wan-Huan Zhou
- 207 -
0
2
4
6
8
10
12
14
16
0 0.05 0.1 0.15 0.2
Plastic strain
App
aren
t coh
esio
n (k
Pa)
80kPa & 120kPa 200kPa 300kPa
0
5
10
15
20
25
30
35
40
0 0.05 0.1 0.15 0.2
Plastic strain
Fric
tion
angl
e (d
eg)
80kPa, 120kPa, 200kPa 300kPa
01
23
45
67
89
0 0.05 0.1 0.15 0.2
Plastic strain
Dila
tion
angl
e (d
eg)
80kPa & 120kPa 200kPa 300kPa
Figure 7.15 Fitting curves of hardening rule and flow rule in Mohr-Coulomb model under different confining pressures - (a) apparent cohesion vs. plastic strain, (b) friction angle vs. plastic strain, and (c) dilation angle vs. plastic strain
(a)
(b)
(c)
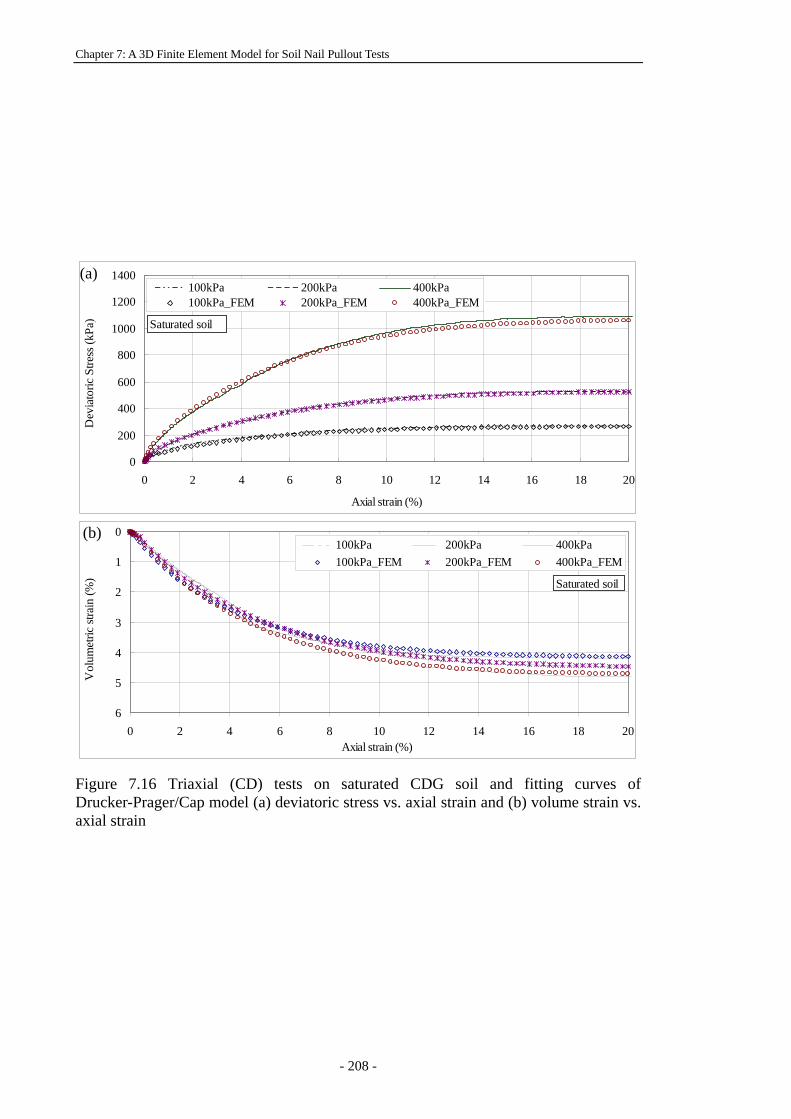
Chapter 7: A 3D Finite Element Model for Soil Nail Pullout Tests
- 208 -
0
200
400
600
800
1000
1200
1400
0 2 4 6 8 10 12 14 16 18 20
Axial strain (%)
Dev
iato
ric S
tress
(kPa
)__
100kPa 200kPa 400kPa100kPa_FEM 200kPa_FEM 400kPa_FEM
Saturated soil
0
1
2
3
4
5
60 2 4 6 8 10 12 14 16 18 20
Axial strain (%)
Vol
umet
ric st
rain
(%)
100kPa 200kPa 400kPa100kPa_FEM 200kPa_FEM 400kPa_FEM
Saturated soil
Figure 7.16 Triaxial (CD) tests on saturated CDG soil and fitting curves of Drucker-Prager/Cap model (a) deviatoric stress vs. axial strain and (b) volume strain vs. axial strain
(a)
(b)
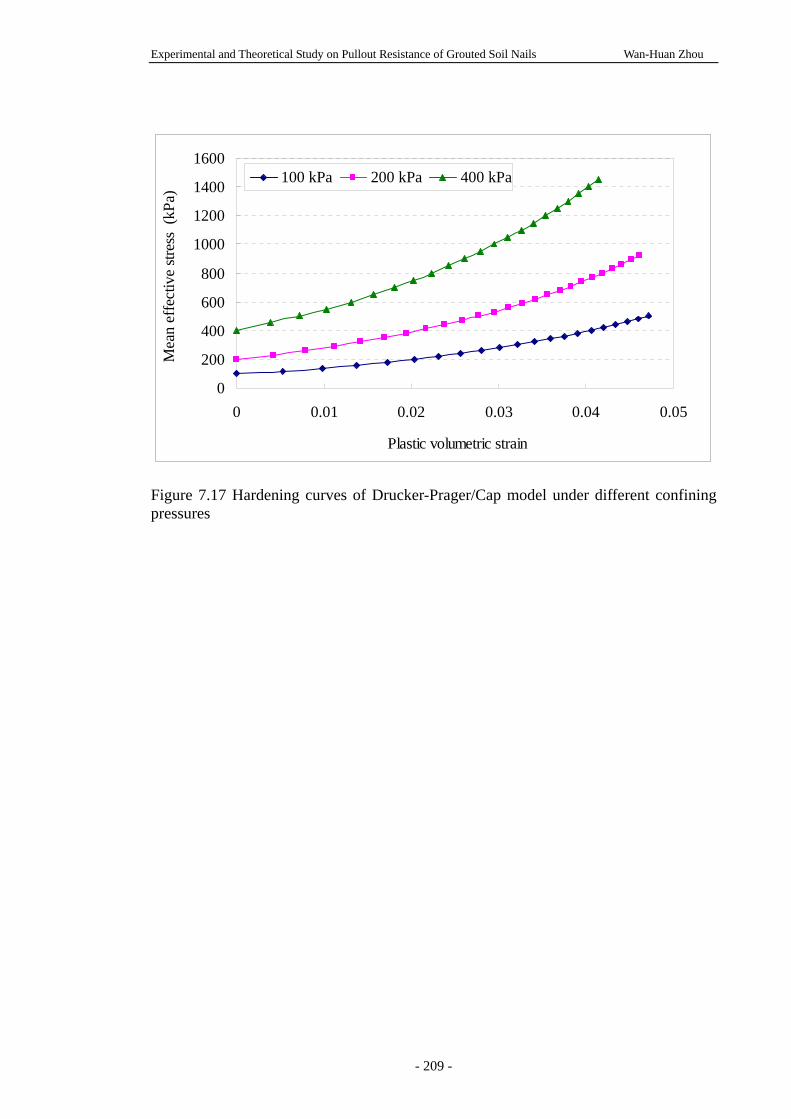
Experimental and Theoretical Study on Pullout Resistance of Grouted Soil Nails Wan-Huan Zhou
- 209 -
0
200
400
600
800
1000
1200
1400
1600
0 0.01 0.02 0.03 0.04 0.05
Plastic volumetric strain
Mea
n ef
fect
ive
stres
s (k
Pa)
100 kPa 200 kPa 400 kPa
Figure 7.17 Hardening curves of Drucker-Prager/Cap model under different confining pressures
Chapter 7: A 3D Finite Element Model for Soil Nail Pullout Tests
- 210 -
Experimental and Theoretical Study on Pullout Resistance of Grouted Soil Nails Wan-Huan Zhou
- 211 -
Chapter 8:
MODEL VERIFICATION AND DISCUSSION
8.1 INTRODUCTION
A three-dimensional (3D) finite element (FE) model has been established for simulating
the laboratory soil nail pullout tests conducted in this project and by others. The FE
model simulates the pullout tests for the conditions of both unsaturated soil without
pressure grouting and saturated with pressure grouting. The factors of soil dilation,
overburden pressure and grouting pressure are taken into account in this FE model. In
this chapter, the FE model is verified by laboratory pullout test data. Comparisons
between the modelling and experimental data are presented and the results discussed.
The soil stress distributions during pullout tests are presented. The stress uniformity in
the soil during pullout is interpreted by the soil stress contours at different pullout
displacements. Using the FE modeling results, the effects of soil dilation, overburden
pressure, and grouting pressure are investigated.
8.2 PULLOUT TEST IN UNSATURATED SOIL
The pullout tests under 75% degree of saturation (Su 2006) were selected for model
verification. The soil stress surrounding the soil nail and average pullout shear stress
obtained from the present FE model were compared with the experiment data of Su
(2006) and are presented in this section. The stress contour in the soil during the
Chapter 8: Model Verification and Discussion
- 212 -
pullout is presented and discussed and the effects of soil dilation and overburden
pressure investigated.
8.2.1 Stress variations
In the laboratory tests, Su (2006) reported that the soil stresses near the drillhole were
released after hole drilling and increased during the pullout as a result of constrained
soil dilation. However, it is difficult to accurately measure the contact (normal)
pressure at the soil nail surface, as the earth pressure cells have to be placed at a
distance of about 40mm from the nail surface. In this study, the experiment data were
compared with the numerical results and used to verify the present FE model. The
contact stress at the soil nail interface was then predicted by the FE model.
The soil vertical stress distributions along Path A, obtained from the FE model and as
shown in Figure 8.1 are now presented in Figure 8.2, for the tests under different
overburden pressures. As reported by Su (2006), four earth pressure cells were placed
at locations about 40mm above and below the soil nail surface, similar to the locations
as shown in Figure 4.15. The average of the measured earth pressures at P-Cell 1, 2, 3,
and 4 during the pullout are shown in Figure 8.2, together with the numerical results. It
can be seen from the comparisons that the numerical results of the soil stress before
pullout are close to those of the experiment data. The difference between calculated and
measured vertical stress for the test under overburden pressure (OP) of 120 kPa (Figure
8.2b), is larger than that in the other tests (Figure 8.2a, c, d). Two possible reasons are
(a) the earth pressure cells were placed closer to the soil nail surface in the laboratory
test, and (b) the earth pressure cells were not in full contact with the surrounding soil
before pullout, resulting in lower measured earth pressures. As stated in Chapter 4, the
earth pressure cells were installed during the soil compaction, the contact between the
Experimental and Theoretical Study on Pullout Resistance of Grouted Soil Nails Wan-Huan Zhou
- 213 -
earth pressure cells and surrounding soils can be disturbed during the test procedures.
The soil surrounding the drillhole is loosened during the drilling, and can be compacted
by the effect of constrained dilation, during pullout. The earth pressure cells were placed
close to the nail surface, where the soil disturbance was large during the test. The
accuracy of the measured earth pressures can be affected, as a result.
Su (2006) reported that the maximum measured earth pressures surrounding the soil nail
do not correspond to the peak pullout resistance. The same finding was observed in the
pullout tests in saturated conditions, as reported in Chapter 6. In Figure 8.2, both the
earth pressure at the peak pullout force and the maximum (peak) earth pressure during
pullout are plotted and shown. The numerical results of the vertical stress distributions
along Path A at 5mm and 100mm pullout displacements are also presented in the figure,
for comparison. From the diagram, it is seen that the numerical results of the vertical
stress at 40mm above the nail surface are close to the measured values at peak pullout
force, for the tests under OP=80kPa, 200kPa and 300kPa. For the test under OP=120kPa,
the numerical results are larger than the measured vertical stress at peak pullout force,
but close to the peak measured vertical stress during pullout.
According to the FE modelling results, the stress variation is significant during pullout
within the range of 200mm above the soil nail surface. The vertical stress distributions
at 5mm and 100mm pullout displacement are similar, but significantly different from
that before pullout. The stress increases in the surrounding soil, demonstrate the effect
of constrained soil dilation during the pullout. It is also seen that along Path A the
stresses start from the soil nail surface, decrease and increase again to the overburden
pressure value. This may be owing to the discontinuity of the soil properties along Path
A, i.e. the interface soil properties were different from the surrounding soil in the FE
Chapter 8: Model Verification and Discussion
- 214 -
model.
8.2.2 Pullout behaviour
The numerical and experiment results of average interface shear stress versus pullout
displacement for the tests under different overburden pressures are compared and shown
in Figure 8.3. The numerical results show good agreement with the experiment data. In
the analysis, the friction coefficient was defined as decreasing with the pullout
displacement. The average interface (pullout) shear stress reaches the peak when the
shear strength of the contact pair is smaller than that of the interface soil element. Slip
failure occurs at the contact pair afterwards. With the development of pullout
displacement, slip failure occurs along the whole of the contact surfaces (i.e. soil nail
surface and soil drillhole surface) and the pullout force gradually decreases with the
increase of pullout displacement. From back analysis, the interface soil properties was
determined to be 'c =3 kPa, 'φ =29o, and 'ψ =10o. In Figure 8.3, it can be seen that the
calculated interface shear stress linearly increases with the pullout displacement, then
nonlinearly reaches the peak, and gradually decreases to the residual value.
It is noted that in Figure 8.3(d), the experimental interface shear stress reaches the peak
value of 92kPa at about 31mm pullout displacement, while the calculated data reaches
the peak of 99.7kPa at 18mm pullout displacement. A possible reason is that the pullout
shearing may occur in larger soil areas, around the soil nail under a larger overburden
pressure, so that the pullout shearing failure can be more non-uniform and occur
progressively along the soil nail. As a result, the peak pullout resistance may occur at a
large pullout displacement, but will not be a high value. In the numerical modelling, the
above situations were not considered, and the thickness of the interface soil was defined
as constant for the conditions of different overburden pressures. Nevertheless, the
Experimental and Theoretical Study on Pullout Resistance of Grouted Soil Nails Wan-Huan Zhou
- 215 -
simulated curves capture the basic characters of the soil nail pullout behaviour under
different overburden pressures in the laboratory tests.
8.2.3 Soil stress contour
The vertical stress contours in the soil at different pullout displacements for the pullout
tests under OP = 120 kPa and 300kPa are plotted in Figure 8.4 and Figure 8.5,
respectively. Middle cut views are shown in the figures. Observations are given below.
(a) The vertical stress distributions before pullout, shown in Figure 8.4 (a) and Figure
8.5 (a), show that the stress at the drill hole is small, about 2.5kPa for OP = 120kPa
and 5kPa for OP = 300kPa, and the stress variations near the drill hole are large.
(b) The stress surrounding the drillhole at 5mm pullout displacement, shown in Figure
8.4 (b) and Figure 8.5 (b), increases owing to constrained soil dilation during pullout.
The stress distribution becomes more vertically uniform than that evident before the
pullout. The stress distribution is on the whole uniform in the soil nail axial
direction, i.e. Y direction in the figure. Slight stress concentration is observed in a
small part of the soil near the soil nail head and end.
(c) The stress contours at 100mmm pullout displacement for the test OP = 120kPa and
OP = 300kPa, respectively is shown in Figure 8.4 (c) and Figure 8.5 (c). In the two
figures, stress concentration in the soil is significant near the front nail, vertical
stress is about 209kPa in Figure 8.4(c), and 350kPa in Figure 8.5(c). This implies
the stress distribution in the soil nail axial direction becomes non-uniform at large
pullout displacement. The pullout shear stress and strain near the front nail is larger
than that near the end nail. It is also seen that the normal stress around the soil nail
increased by the constrained soil dilation, can be larger than the overburden pressure,
as shown in Figure 8.4 (c).
Chapter 8: Model Verification and Discussion
- 216 -
8.2.4 Effects of dilation angle and overburden pressure
The laboratory pullout tests by Su (2006), described in Section 8.2.2, have been
simulated by the present FE model with the interface soil properties of 'c =3 kPa,
'φ =29o, and 'ψ =10o. The effect of the interface soil dilation angle on the peak average
pullout shear stress at different overburden pressures was investigated using the FE
model. The relationship of peak average pullout shear stress and dilation angle under
different overburden pressures is shown in Figure 8.6. It can be seen that the effect of
interface soil dilation under small overburden pressures is less significant than that
under OP = 200 kPa and 300 kPa. For OP = 200kPa, the peak average pullout shear
stress increases from 74kPa to 88kPa when the interface soil dilation angle increases
from 5.5o to 10o . For OP = 300kPa, the pullout shear stress increases from 88kPa to
115kPa when the interface dilation angle increases from 5.5 o to 8.5 o , but decreases to
100kPa when dilation angle is 10 o . The reason for the decrease is the usage of the
interface contact pair in the FE model. The interaction friction angle was defined as
decreasing with the pullout displacement. When the interface dilation angle is large, the
normal stress increases more within a certain pullout displacement. It should be noted
that the frictional interaction of the contact pair is a pure Coulomb friction criterion
without cohesion (or adhesion), while the interface soil has a small cohesion of 3kPa.
During the soil nail pullout, the soil stress increases by the constrained dilation and the
interaction frictional coefficient decreases. When the interface soil dilation is larger, slip
failure occurs in a smaller pullout displacement and results in a smaller pullout
resistance.
Figure 8.7 shows the relationship of the peak average pullout shear stress and
overburden pressure under different interface soil dilation angles from numerical
Experimental and Theoretical Study on Pullout Resistance of Grouted Soil Nails Wan-Huan Zhou
- 217 -
modelling and the laboratory pullout test data (Su 2006). It can be seen from the
numerical modelling results that at the same interface soil dilation angle, the soil nail
pullout resistance tends to increase with the overburden pressure. It should be noted
that the soil dilation angle is, by nature, a complicated parameter. It varies with
overburden pressure condition and is not a constant during shearing. The interface soil,
is more complicated, as the soil is disturbed by the drilling and grouting. It can be
seen that the simulated pullout behaviour does not entirely correspond to the laboratory
pullout data. The observations from the numerical modelling were obtained under
certain assumptions, such as a constant thickness of the interface soil and a constant soil
dilation angle. Hence careful consideration is necessary when applying the above
modelling findings to the actual soil nail pullout behaviour.
8.3 PULLOUT TEST IN SATURATED SOIL
Pressure grouting is considered in the FE model for the simulation of the pullout tests
conducted in this project on saturated CDG soil and described in this thesis. The pullout
tests under OP = 240 kPa and 350 kPa and GP= 80kPa, 130kPa, 250kPa, and 300kPa
were selected for model verification and discussion. The soil stress and average
interface pullout shear stress obtained from the present FE model was compared with
the experiment data by Su (2006) and are presented in this section. The soil nail
pullout behaviour and the soil stress contours during the pullout are then presented and
discussed.
8.3.1 Stress variations
As indicated in Chapter 7, the present FE model simulates all the test steps (procedures).
Figure 8.8 shows the simulated vertical stresses at 4mm, 14mm, 30mm, and 55mm
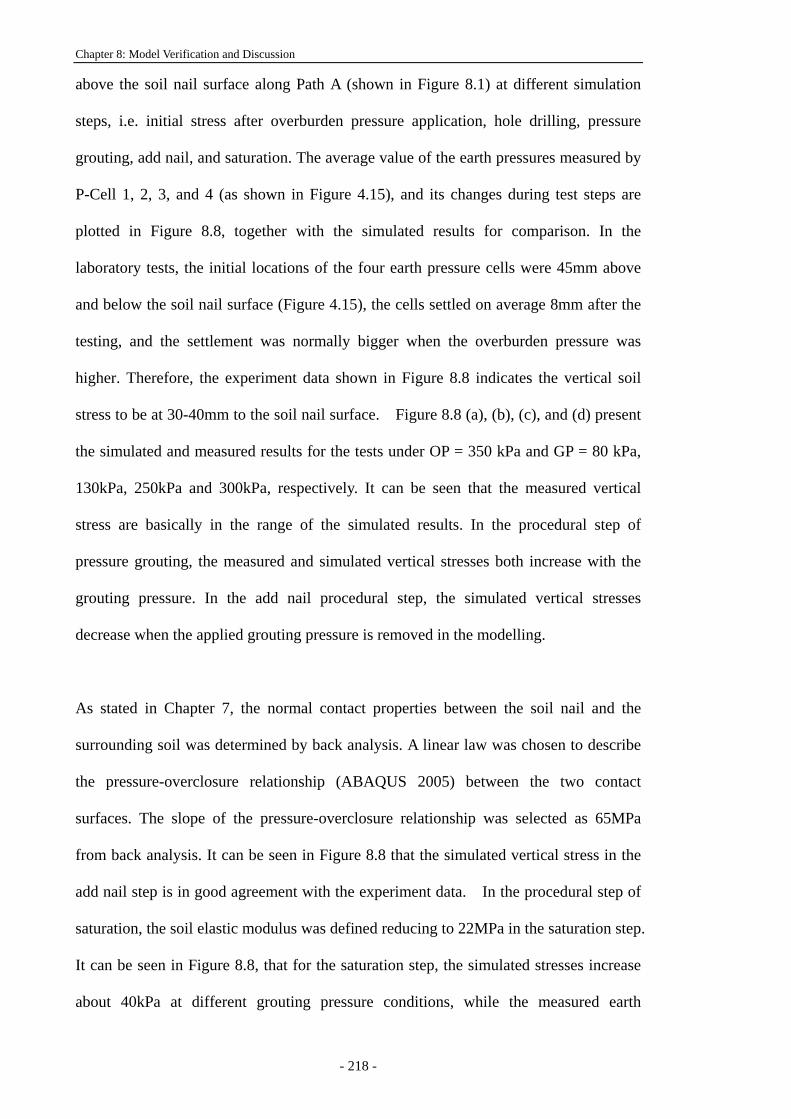
Chapter 8: Model Verification and Discussion
- 218 -
above the soil nail surface along Path A (shown in Figure 8.1) at different simulation
steps, i.e. initial stress after overburden pressure application, hole drilling, pressure
grouting, add nail, and saturation. The average value of the earth pressures measured by
P-Cell 1, 2, 3, and 4 (as shown in Figure 4.15), and its changes during test steps are
plotted in Figure 8.8, together with the simulated results for comparison. In the
laboratory tests, the initial locations of the four earth pressure cells were 45mm above
and below the soil nail surface (Figure 4.15), the cells settled on average 8mm after the
testing, and the settlement was normally bigger when the overburden pressure was
higher. Therefore, the experiment data shown in Figure 8.8 indicates the vertical soil
stress to be at 30-40mm to the soil nail surface. Figure 8.8 (a), (b), (c), and (d) present
the simulated and measured results for the tests under OP = 350 kPa and GP = 80 kPa,
130kPa, 250kPa and 300kPa, respectively. It can be seen that the measured vertical
stress are basically in the range of the simulated results. In the procedural step of
pressure grouting, the measured and simulated vertical stresses both increase with the
grouting pressure. In the add nail procedural step, the simulated vertical stresses
decrease when the applied grouting pressure is removed in the modelling.
As stated in Chapter 7, the normal contact properties between the soil nail and the
surrounding soil was determined by back analysis. A linear law was chosen to describe
the pressure-overclosure relationship (ABAQUS 2005) between the two contact
surfaces. The slope of the pressure-overclosure relationship was selected as 65MPa
from back analysis. It can be seen in Figure 8.8 that the simulated vertical stress in the
add nail step is in good agreement with the experiment data. In the procedural step of
saturation, the soil elastic modulus was defined reducing to 22MPa in the saturation step.
It can be seen in Figure 8.8, that for the saturation step, the simulated stresses increase
about 40kPa at different grouting pressure conditions, while the measured earth
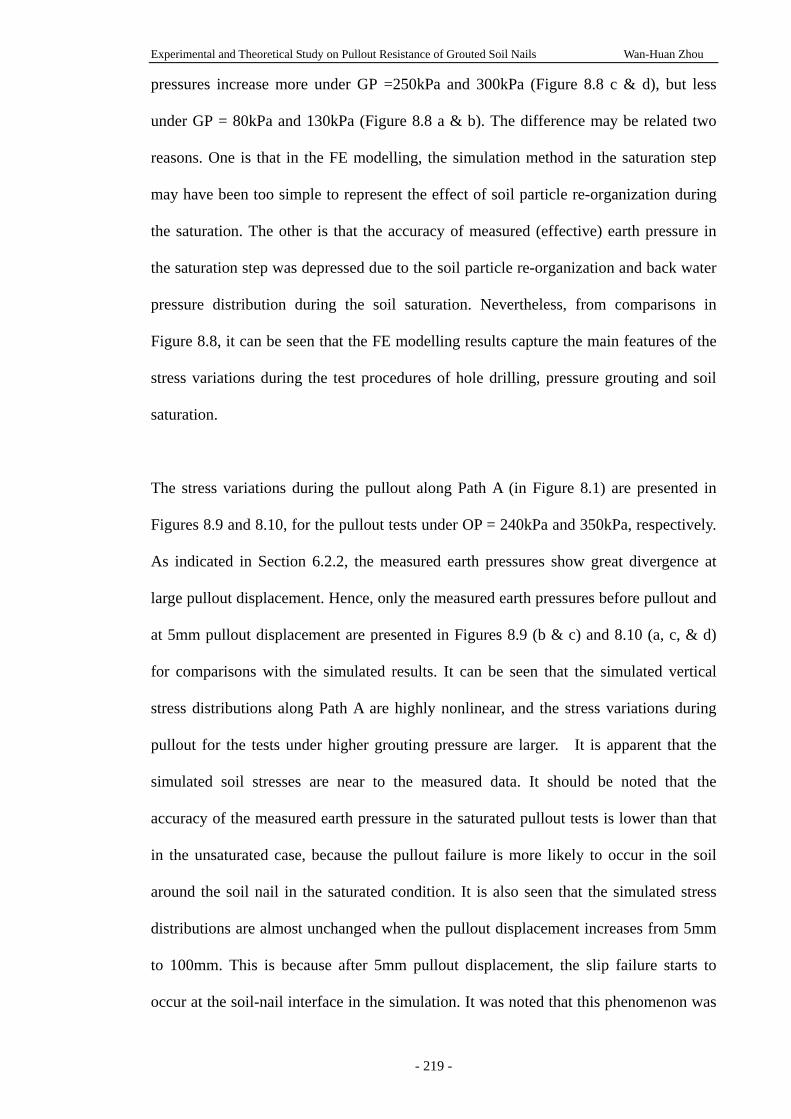
Experimental and Theoretical Study on Pullout Resistance of Grouted Soil Nails Wan-Huan Zhou
- 219 -
pressures increase more under GP =250kPa and 300kPa (Figure 8.8 c & d), but less
under GP = 80kPa and 130kPa (Figure 8.8 a & b). The difference may be related two
reasons. One is that in the FE modelling, the simulation method in the saturation step
may have been too simple to represent the effect of soil particle re-organization during
the saturation. The other is that the accuracy of measured (effective) earth pressure in
the saturation step was depressed due to the soil particle re-organization and back water
pressure distribution during the soil saturation. Nevertheless, from comparisons in
Figure 8.8, it can be seen that the FE modelling results capture the main features of the
stress variations during the test procedures of hole drilling, pressure grouting and soil
saturation.
The stress variations during the pullout along Path A (in Figure 8.1) are presented in
Figures 8.9 and 8.10, for the pullout tests under OP = 240kPa and 350kPa, respectively.
As indicated in Section 6.2.2, the measured earth pressures show great divergence at
large pullout displacement. Hence, only the measured earth pressures before pullout and
at 5mm pullout displacement are presented in Figures 8.9 (b & c) and 8.10 (a, c, & d)
for comparisons with the simulated results. It can be seen that the simulated vertical
stress distributions along Path A are highly nonlinear, and the stress variations during
pullout for the tests under higher grouting pressure are larger. It is apparent that the
simulated soil stresses are near to the measured data. It should be noted that the
accuracy of the measured earth pressure in the saturated pullout tests is lower than that
in the unsaturated case, because the pullout failure is more likely to occur in the soil
around the soil nail in the saturated condition. It is also seen that the simulated stress
distributions are almost unchanged when the pullout displacement increases from 5mm
to 100mm. This is because after 5mm pullout displacement, the slip failure starts to
occur at the soil-nail interface in the simulation. It was noted that this phenomenon was
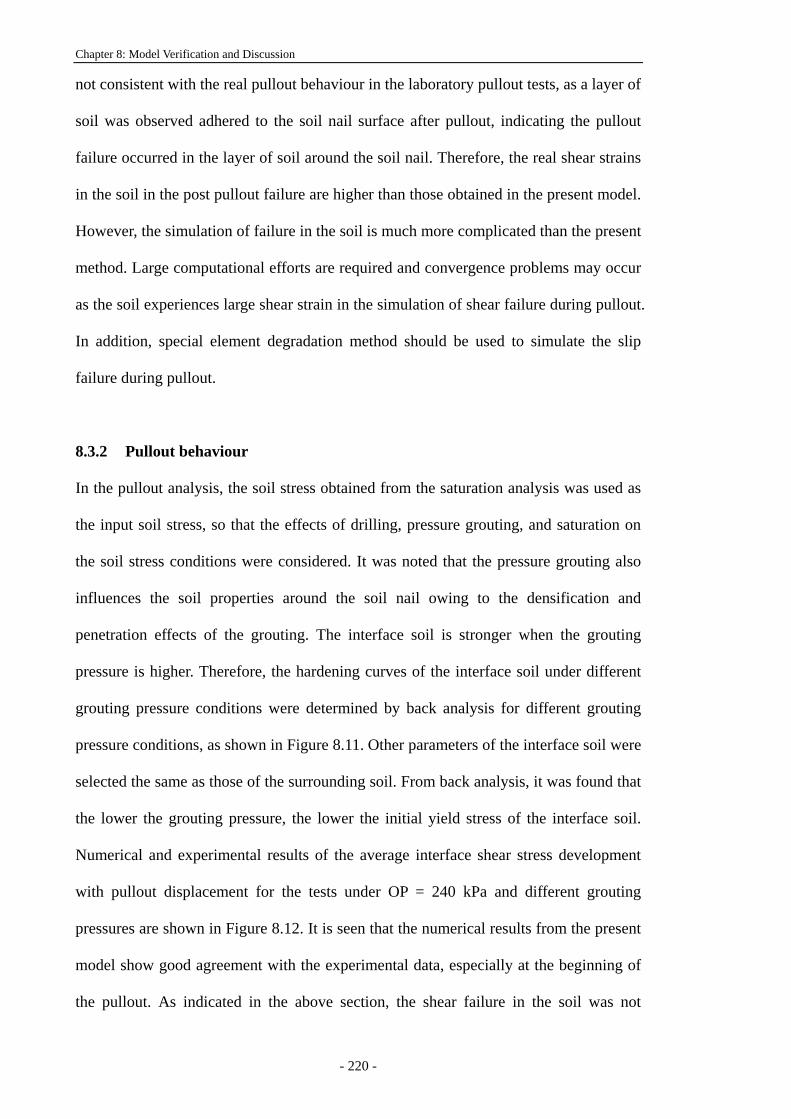
Chapter 8: Model Verification and Discussion
- 220 -
not consistent with the real pullout behaviour in the laboratory pullout tests, as a layer of
soil was observed adhered to the soil nail surface after pullout, indicating the pullout
failure occurred in the layer of soil around the soil nail. Therefore, the real shear strains
in the soil in the post pullout failure are higher than those obtained in the present model.
However, the simulation of failure in the soil is much more complicated than the present
method. Large computational efforts are required and convergence problems may occur
as the soil experiences large shear strain in the simulation of shear failure during pullout.
In addition, special element degradation method should be used to simulate the slip
failure during pullout.
8.3.2 Pullout behaviour
In the pullout analysis, the soil stress obtained from the saturation analysis was used as
the input soil stress, so that the effects of drilling, pressure grouting, and saturation on
the soil stress conditions were considered. It was noted that the pressure grouting also
influences the soil properties around the soil nail owing to the densification and
penetration effects of the grouting. The interface soil is stronger when the grouting
pressure is higher. Therefore, the hardening curves of the interface soil under different
grouting pressure conditions were determined by back analysis for different grouting
pressure conditions, as shown in Figure 8.11. Other parameters of the interface soil were
selected the same as those of the surrounding soil. From back analysis, it was found that
the lower the grouting pressure, the lower the initial yield stress of the interface soil.
Numerical and experimental results of the average interface shear stress development
with pullout displacement for the tests under OP = 240 kPa and different grouting
pressures are shown in Figure 8.12. It is seen that the numerical results from the present
model show good agreement with the experimental data, especially at the beginning of
the pullout. As indicated in the above section, the shear failure in the soil was not
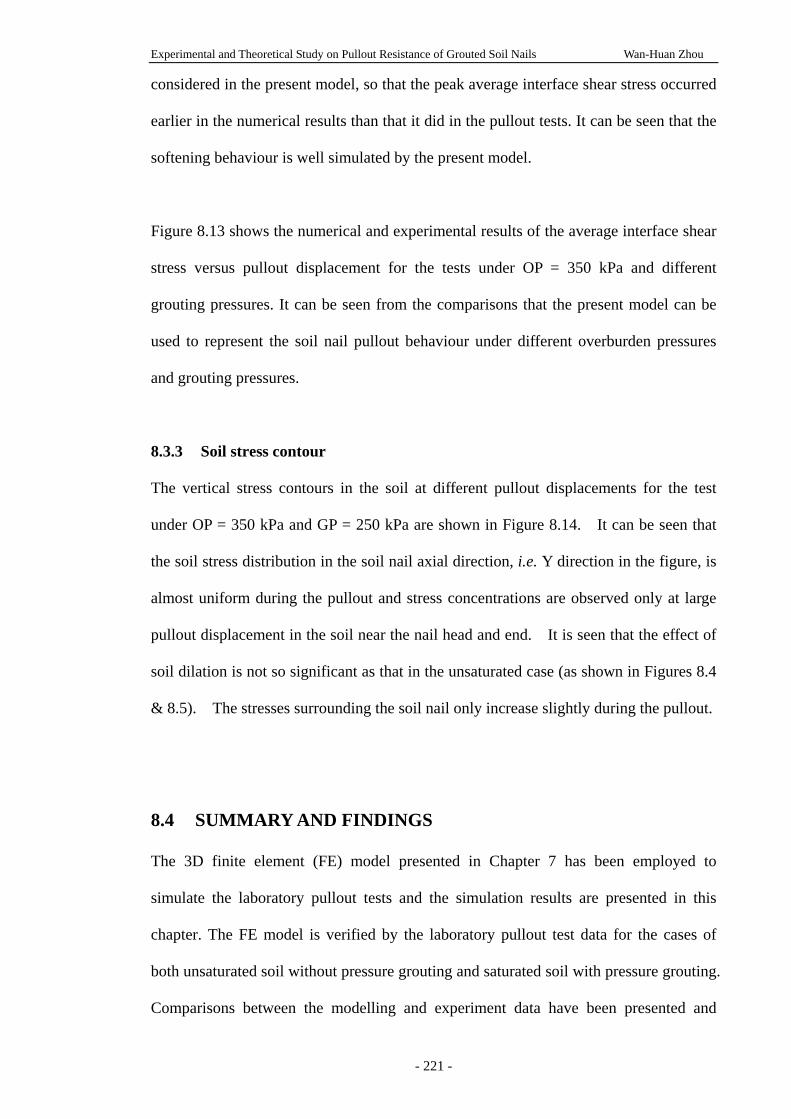
Experimental and Theoretical Study on Pullout Resistance of Grouted Soil Nails Wan-Huan Zhou
- 221 -
considered in the present model, so that the peak average interface shear stress occurred
earlier in the numerical results than that it did in the pullout tests. It can be seen that the
softening behaviour is well simulated by the present model.
Figure 8.13 shows the numerical and experimental results of the average interface shear
stress versus pullout displacement for the tests under OP = 350 kPa and different
grouting pressures. It can be seen from the comparisons that the present model can be
used to represent the soil nail pullout behaviour under different overburden pressures
and grouting pressures.
8.3.3 Soil stress contour
The vertical stress contours in the soil at different pullout displacements for the test
under OP = 350 kPa and GP = 250 kPa are shown in Figure 8.14. It can be seen that
the soil stress distribution in the soil nail axial direction, i.e. Y direction in the figure, is
almost uniform during the pullout and stress concentrations are observed only at large
pullout displacement in the soil near the nail head and end. It is seen that the effect of
soil dilation is not so significant as that in the unsaturated case (as shown in Figures 8.4
& 8.5). The stresses surrounding the soil nail only increase slightly during the pullout.
8.4 SUMMARY AND FINDINGS
The 3D finite element (FE) model presented in Chapter 7 has been employed to
simulate the laboratory pullout tests and the simulation results are presented in this
chapter. The FE model is verified by the laboratory pullout test data for the cases of
both unsaturated soil without pressure grouting and saturated soil with pressure grouting.
Comparisons between the modelling and experiment data have been presented and
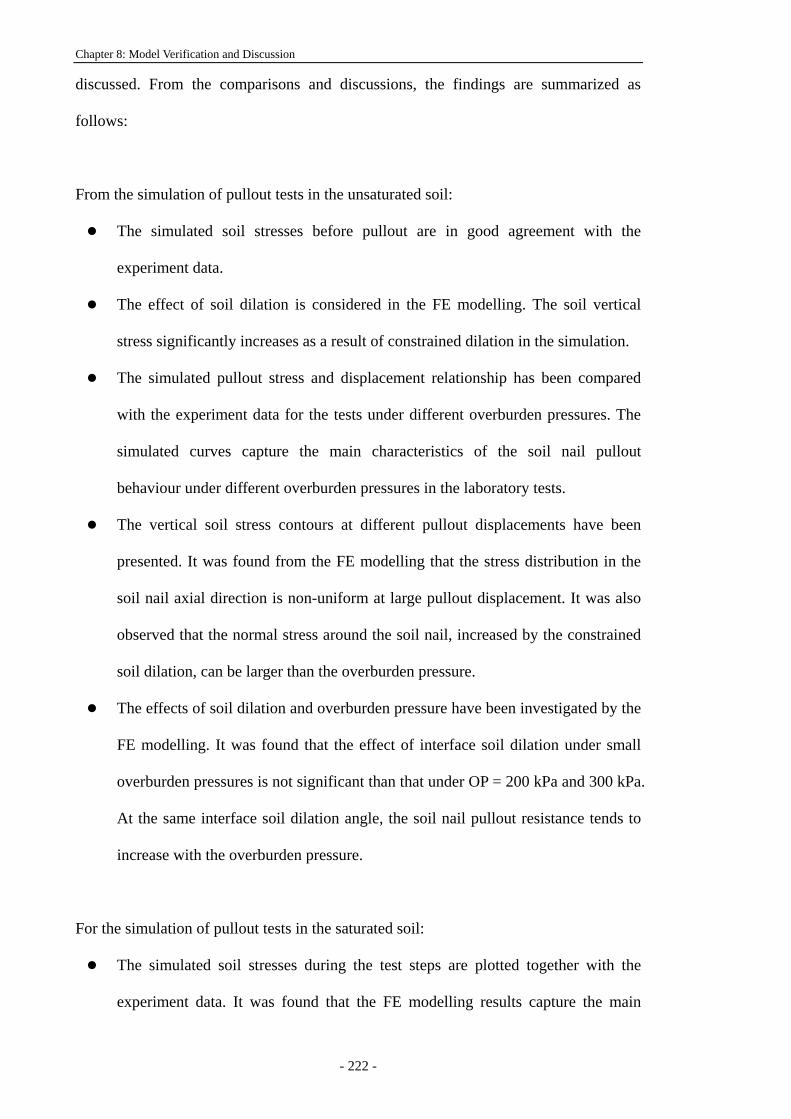
Chapter 8: Model Verification and Discussion
- 222 -
discussed. From the comparisons and discussions, the findings are summarized as
follows:
From the simulation of pullout tests in the unsaturated soil:
The simulated soil stresses before pullout are in good agreement with the
experiment data.
The effect of soil dilation is considered in the FE modelling. The soil vertical
stress significantly increases as a result of constrained dilation in the simulation.
The simulated pullout stress and displacement relationship has been compared
with the experiment data for the tests under different overburden pressures. The
simulated curves capture the main characteristics of the soil nail pullout
behaviour under different overburden pressures in the laboratory tests.
The vertical soil stress contours at different pullout displacements have been
presented. It was found from the FE modelling that the stress distribution in the
soil nail axial direction is non-uniform at large pullout displacement. It was also
observed that the normal stress around the soil nail, increased by the constrained
soil dilation, can be larger than the overburden pressure.
The effects of soil dilation and overburden pressure have been investigated by the
FE modelling. It was found that the effect of interface soil dilation under small
overburden pressures is not significant than that under OP = 200 kPa and 300 kPa.
At the same interface soil dilation angle, the soil nail pullout resistance tends to
increase with the overburden pressure.
For the simulation of pullout tests in the saturated soil:
The simulated soil stresses during the test steps are plotted together with the
experiment data. It was found that the FE modelling results capture the main
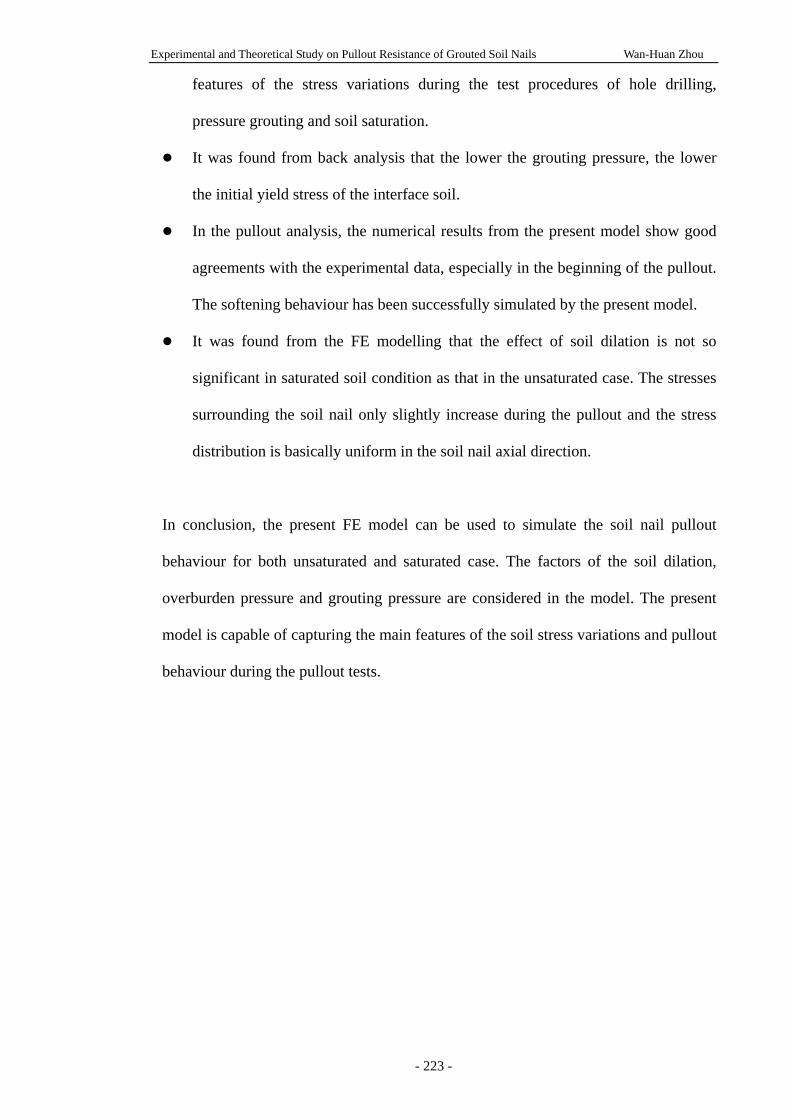
Experimental and Theoretical Study on Pullout Resistance of Grouted Soil Nails Wan-Huan Zhou
- 223 -
features of the stress variations during the test procedures of hole drilling,
pressure grouting and soil saturation.
It was found from back analysis that the lower the grouting pressure, the lower
the initial yield stress of the interface soil.
In the pullout analysis, the numerical results from the present model show good
agreements with the experimental data, especially in the beginning of the pullout.
The softening behaviour has been successfully simulated by the present model.
It was found from the FE modelling that the effect of soil dilation is not so
significant in saturated soil condition as that in the unsaturated case. The stresses
surrounding the soil nail only slightly increase during the pullout and the stress
distribution is basically uniform in the soil nail axial direction.
In conclusion, the present FE model can be used to simulate the soil nail pullout
behaviour for both unsaturated and saturated case. The factors of the soil dilation,
overburden pressure and grouting pressure are considered in the model. The present
model is capable of capturing the main features of the soil stress variations and pullout
behaviour during the pullout tests.
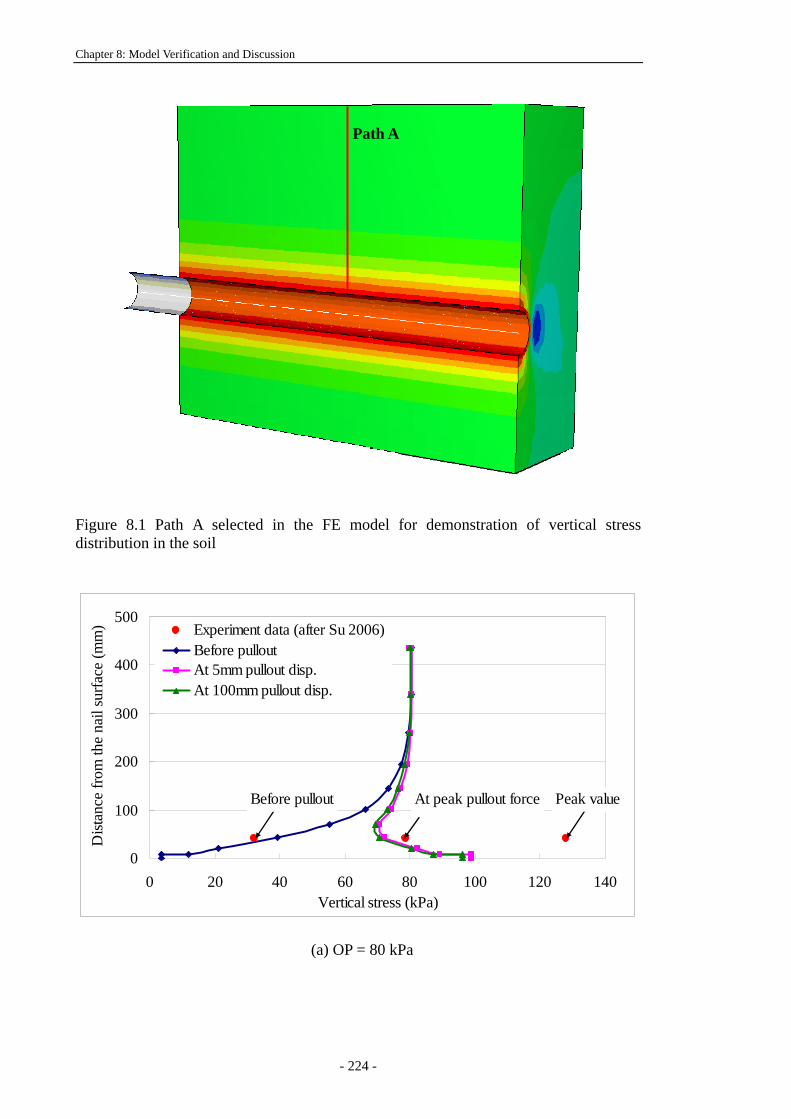
Chapter 8: Model Verification and Discussion
- 224 -
Figure 8.1 Path A selected in the FE model for demonstration of vertical stress distribution in the soil
0
100
200
300
400
500
0 20 40 60 80 100 120 140Vertical stress (kPa)
Dist
ance
from
the
nail
surfa
ce (m
m) Experiment data (after Su 2006)
Before pulloutAt 5mm pullout disp.At 100mm pullout disp.
At peak pullout force Peak valueBefore pullout
(a) OP = 80 kPa
Path A
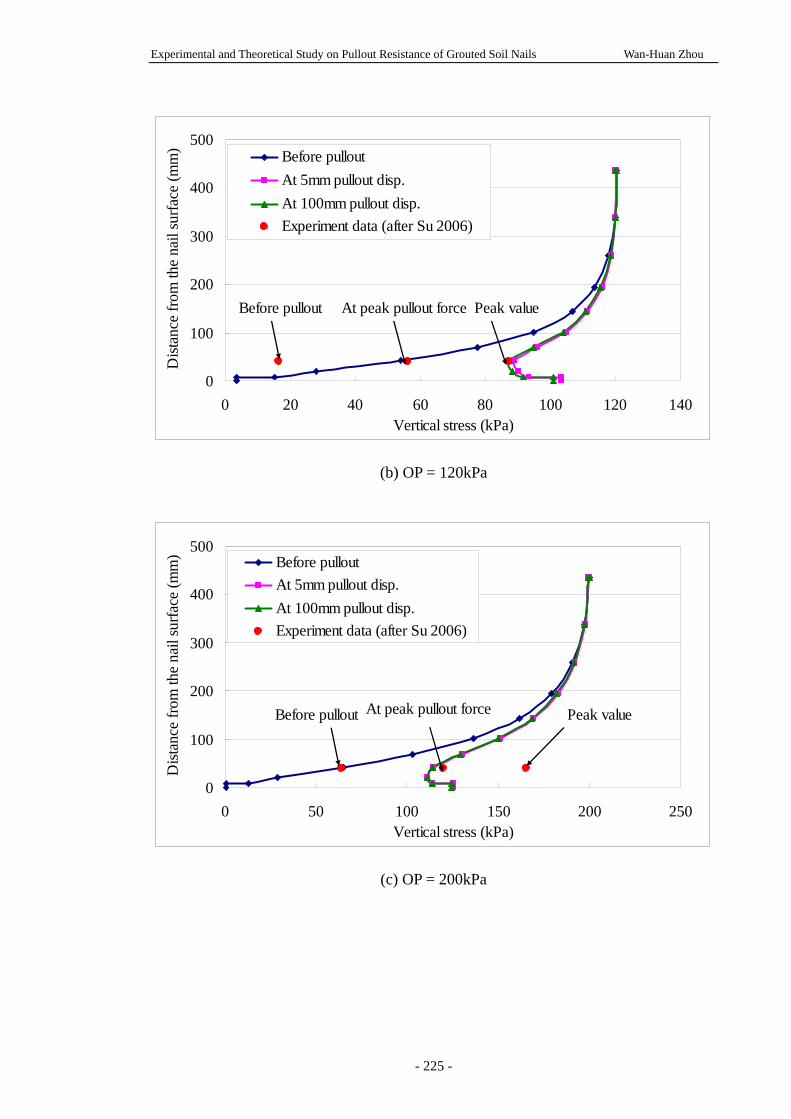
Experimental and Theoretical Study on Pullout Resistance of Grouted Soil Nails Wan-Huan Zhou
- 225 -
0
100
200
300
400
500
0 20 40 60 80 100 120 140Vertical stress (kPa)
Dist
ance
from
the
nail
surfa
ce (m
m) Before pullout
At 5mm pullout disp.At 100mm pullout disp.Experiment data (after Su 2006)
At peak pullout force Peak valueBefore pullout
(b) OP = 120kPa
0
100
200
300
400
500
0 50 100 150 200 250Vertical stress (kPa)
Dist
ance
from
the
nail
surfa
ce (m
m) Before pullout
At 5mm pullout disp.At 100mm pullout disp.Experiment data (after Su 2006)
At peak pullout force Peak valueBefore pullout
(c) OP = 200kPa
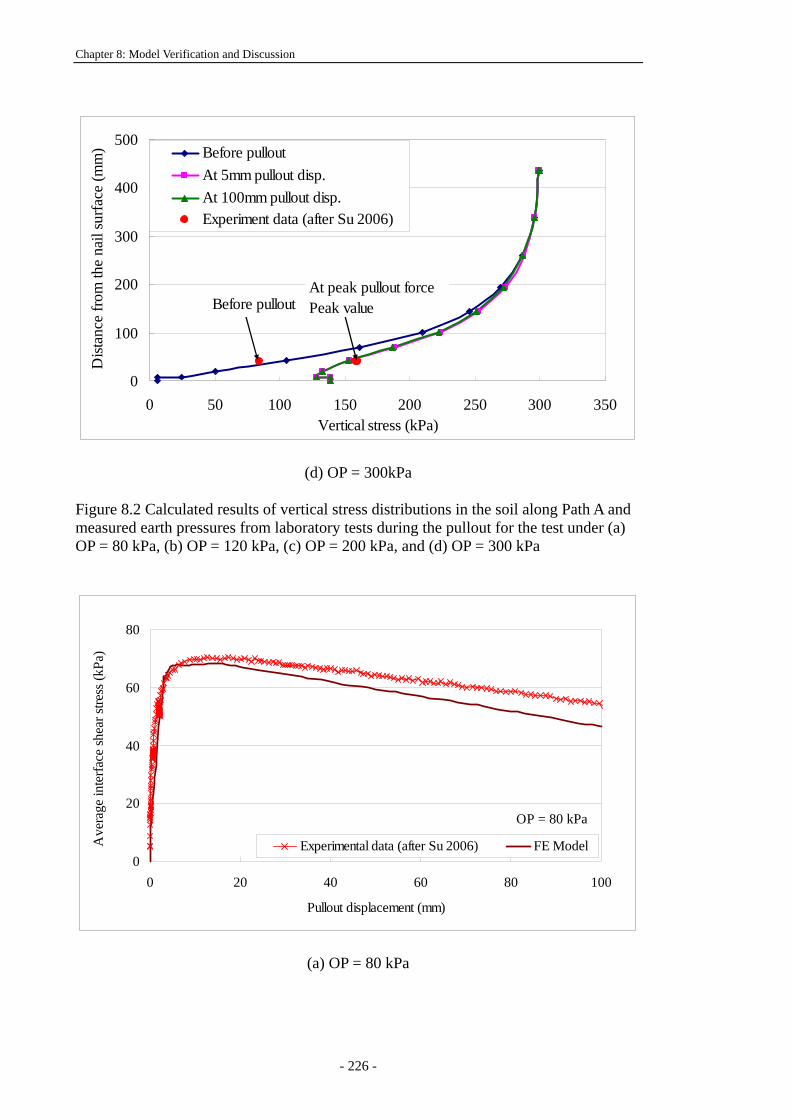
Chapter 8: Model Verification and Discussion
- 226 -
0
100
200
300
400
500
0 50 100 150 200 250 300 350Vertical stress (kPa)
Dist
ance
from
the
nail
surfa
ce (m
m) Before pullout
At 5mm pullout disp.At 100mm pullout disp.Experiment data (after Su 2006)
At peak pullout forcePeak valueBefore pullout
(d) OP = 300kPa Figure 8.2 Calculated results of vertical stress distributions in the soil along Path A and measured earth pressures from laboratory tests during the pullout for the test under (a) OP = 80 kPa, (b) OP = 120 kPa, (c) OP = 200 kPa, and (d) OP = 300 kPa
0
20
40
60
80
0 20 40 60 80 100
Pullout displacement (mm)
Ave
rage
inte
rface
shea
r stre
ss (k
Pa)
Experimental data (after Su 2006) FE Model
OP = 80 kPa
(a) OP = 80 kPa
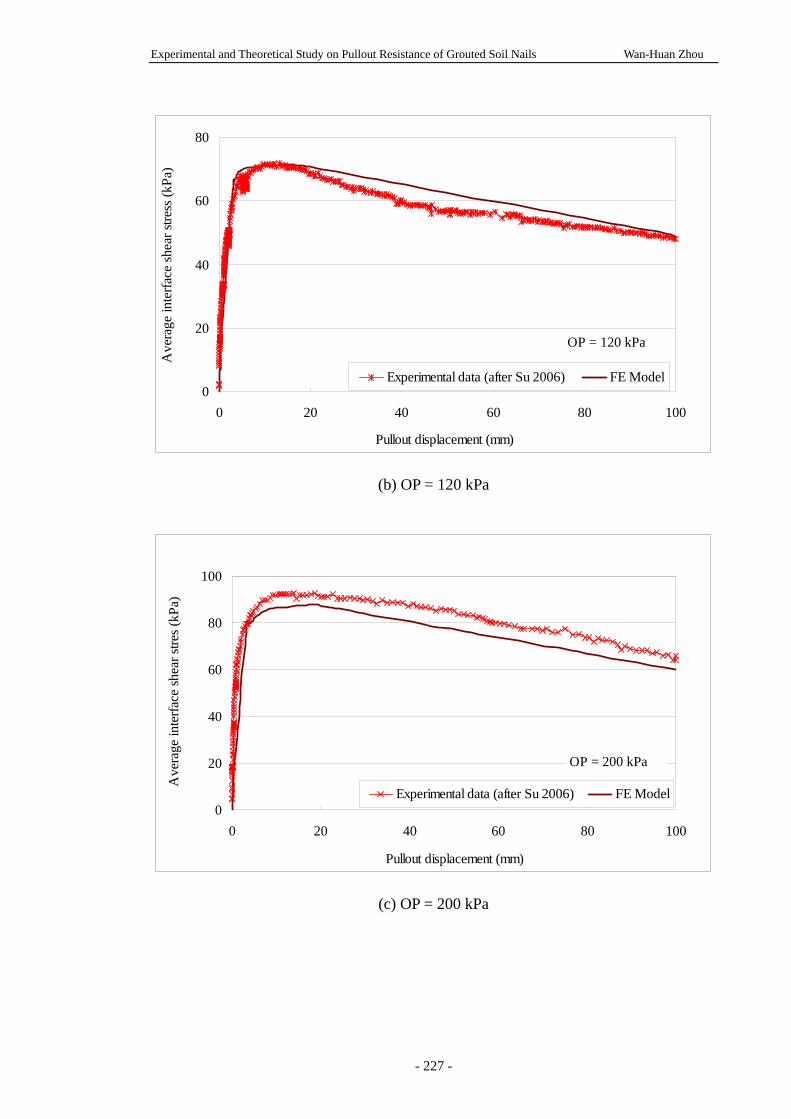
Experimental and Theoretical Study on Pullout Resistance of Grouted Soil Nails Wan-Huan Zhou
- 227 -
0
20
40
60
80
0 20 40 60 80 100
Pullout displacement (mm)
Ave
rage
inte
rface
shea
r stre
ss (k
Pa)
Experimental data (after Su 2006) FE Model
OP = 120 kPa
(b) OP = 120 kPa
0
20
40
60
80
100
0 20 40 60 80 100
Pullout displacement (mm)
Ave
rage
inte
rface
shea
r stre
s (kP
a)
Experimental data (after Su 2006) FE Model
OP = 200 kPa
(c) OP = 200 kPa
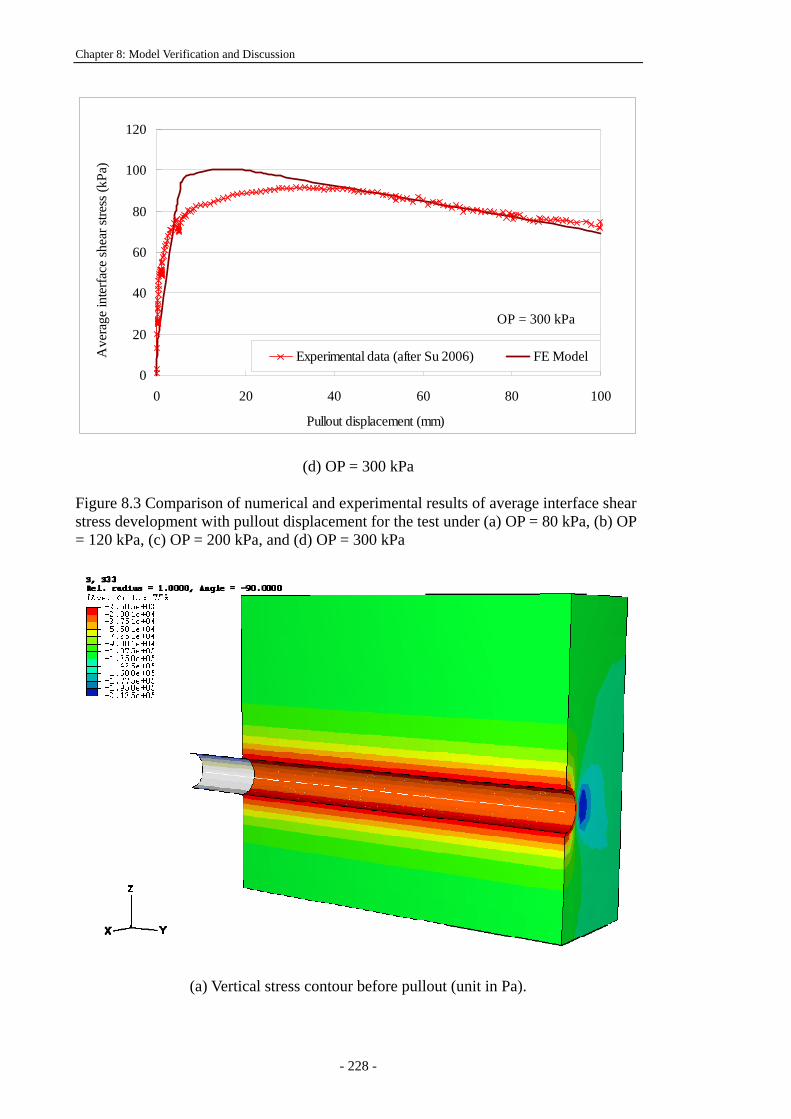
Chapter 8: Model Verification and Discussion
- 228 -
0
20
40
60
80
100
120
0 20 40 60 80 100
Pullout displacement (mm)
Ave
rage
inte
rface
shea
r stre
ss (k
Pa)
Experimental data (after Su 2006) FE Model
OP = 300 kPa
(d) OP = 300 kPa Figure 8.3 Comparison of numerical and experimental results of average interface shear stress development with pullout displacement for the test under (a) OP = 80 kPa, (b) OP = 120 kPa, (c) OP = 200 kPa, and (d) OP = 300 kPa
(a) Vertical stress contour before pullout (unit in Pa).
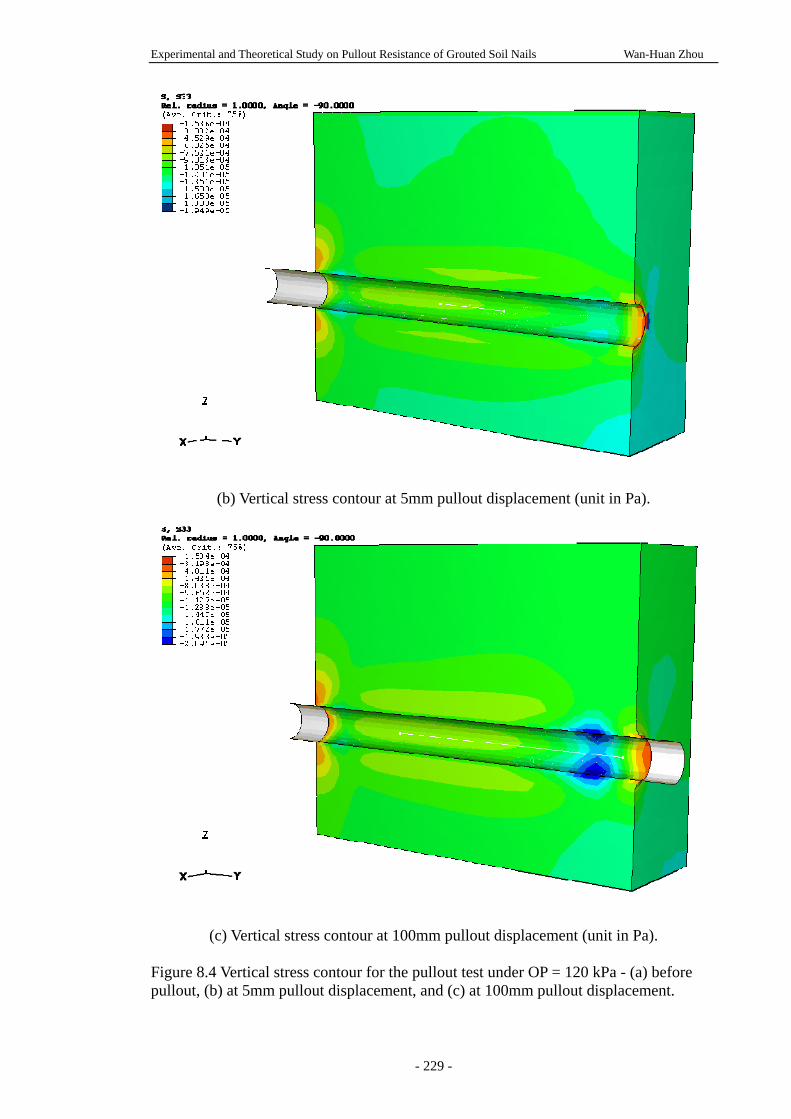
Experimental and Theoretical Study on Pullout Resistance of Grouted Soil Nails Wan-Huan Zhou
- 229 -
(b) Vertical stress contour at 5mm pullout displacement (unit in Pa).
(c) Vertical stress contour at 100mm pullout displacement (unit in Pa). Figure 8.4 Vertical stress contour for the pullout test under OP = 120 kPa - (a) before pullout, (b) at 5mm pullout displacement, and (c) at 100mm pullout displacement.
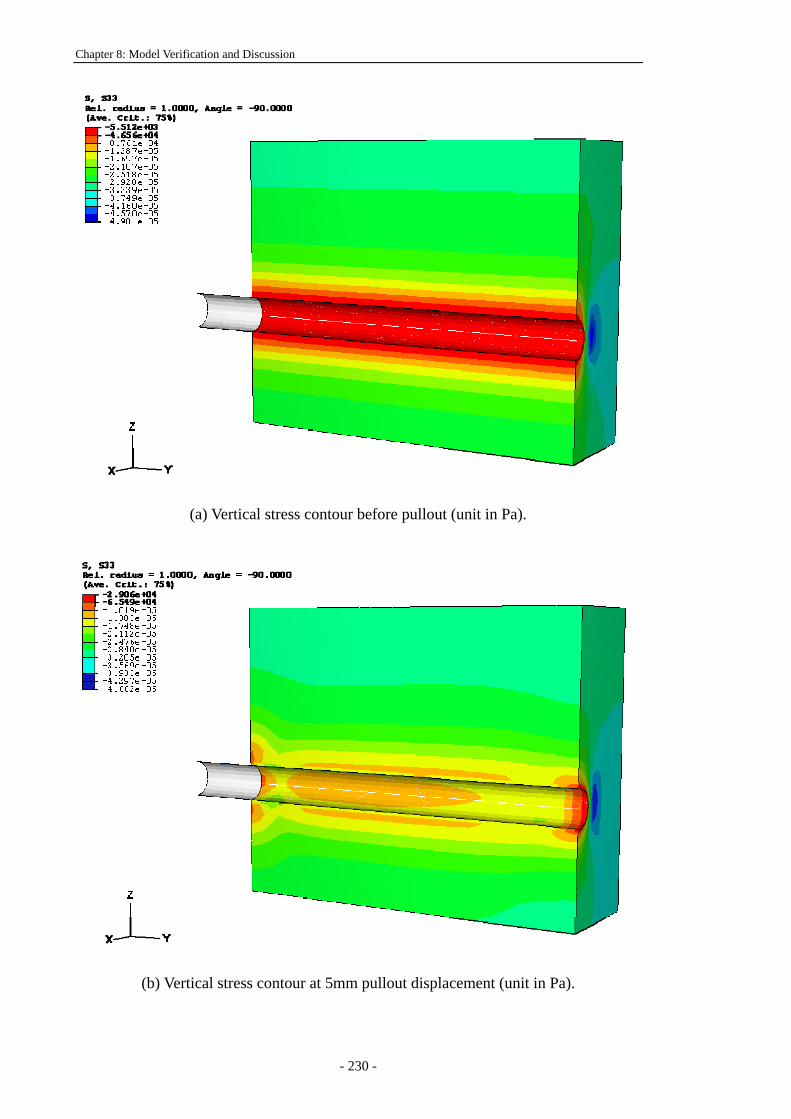
Chapter 8: Model Verification and Discussion
- 230 -
(a) Vertical stress contour before pullout (unit in Pa).
(b) Vertical stress contour at 5mm pullout displacement (unit in Pa).
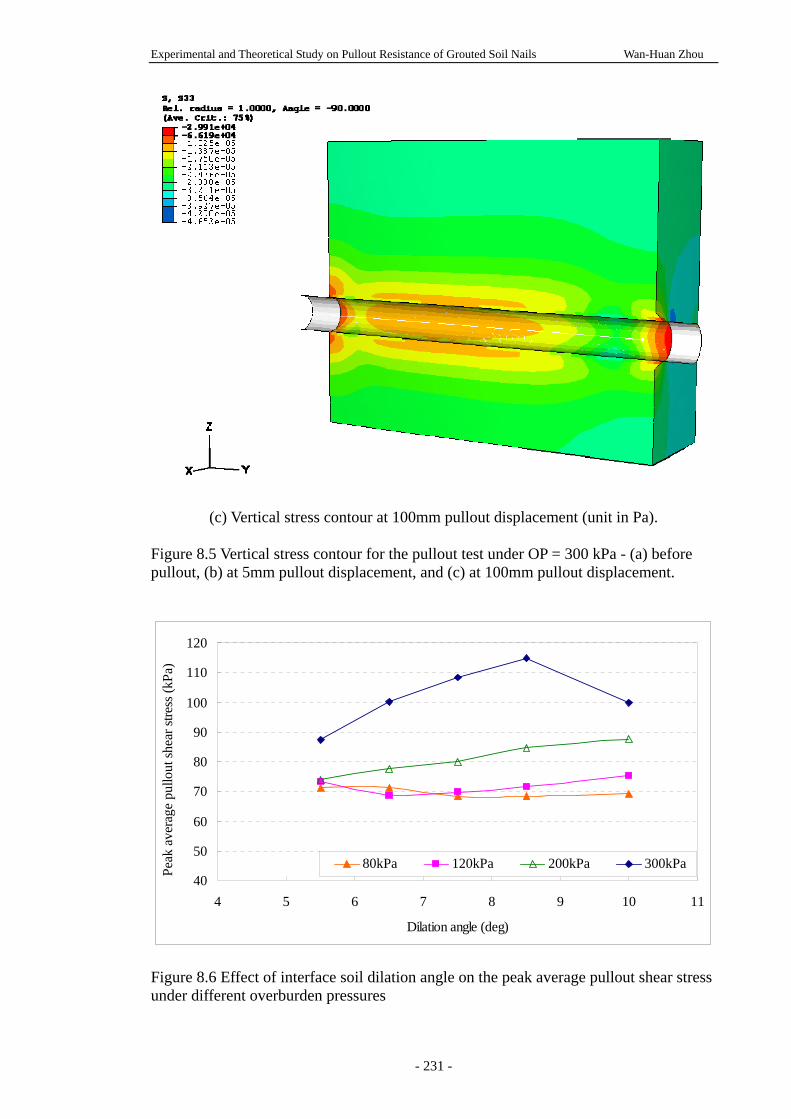
Experimental and Theoretical Study on Pullout Resistance of Grouted Soil Nails Wan-Huan Zhou
- 231 -
(c) Vertical stress contour at 100mm pullout displacement (unit in Pa). Figure 8.5 Vertical stress contour for the pullout test under OP = 300 kPa - (a) before pullout, (b) at 5mm pullout displacement, and (c) at 100mm pullout displacement.
40
50
60
70
80
90
100
110
120
4 5 6 7 8 9 10 11
Dilation angle (deg)
Peak
ave
rage
pul
lout
shea
r stre
ss (k
Pa)
80kPa 120kPa 200kPa 300kPa
Figure 8.6 Effect of interface soil dilation angle on the peak average pullout shear stress under different overburden pressures
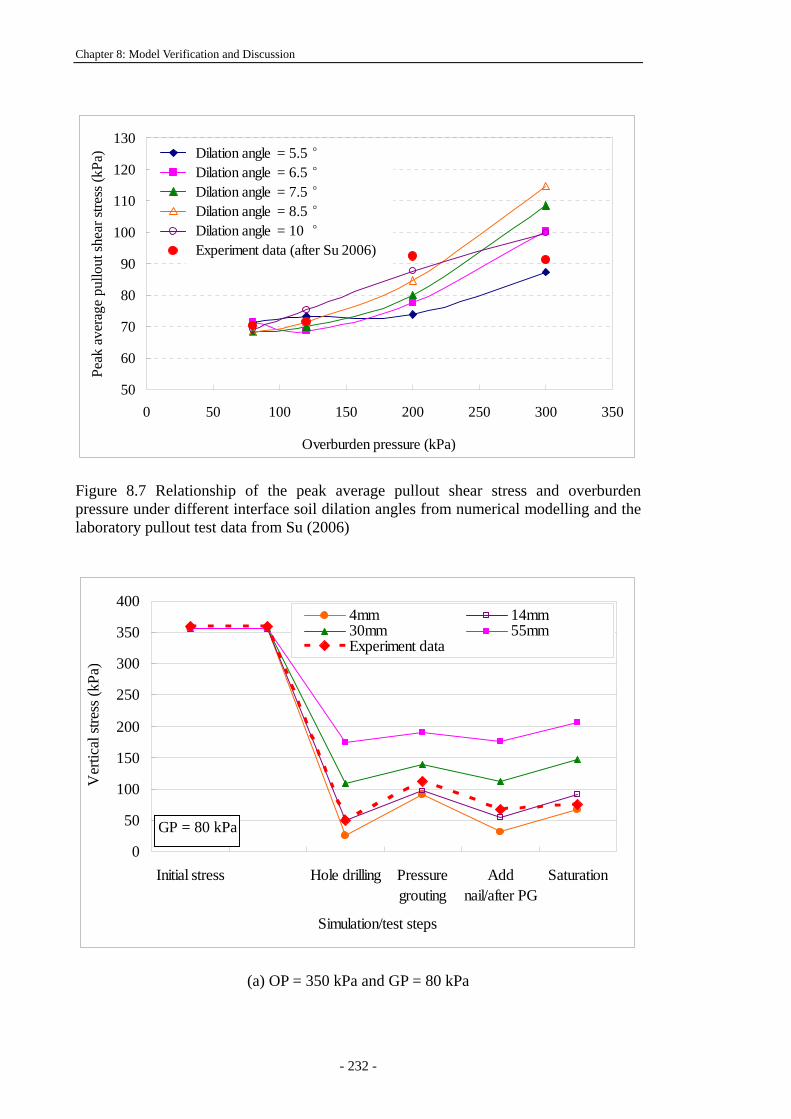
Chapter 8: Model Verification and Discussion
- 232 -
50
60
70
80
90
100
110
120
130
0 50 100 150 200 250 300 350
Overburden pressure (kPa)
Peak
ave
rage
pul
lout
shea
r stre
ss (k
Pa) Dilation angle = 5.5 °
Dilation angle = 6.5 °Dilation angle = 7.5 °Dilation angle = 8.5 °Dilation angle = 10 °Experiment data (after Su 2006)
Figure 8.7 Relationship of the peak average pullout shear stress and overburden pressure under different interface soil dilation angles from numerical modelling and the laboratory pullout test data from Su (2006)
0
50
100
150
200
250
300
350
400
Initial stress Hole drilling Pressuregrouting
Addnail/after PG
Saturation
Simulation/test steps
Ver
tical
stre
ss (k
Pa)
4mm 14mm30mm 55mmExperiment data
GP = 80 kPa
(a) OP = 350 kPa and GP = 80 kPa
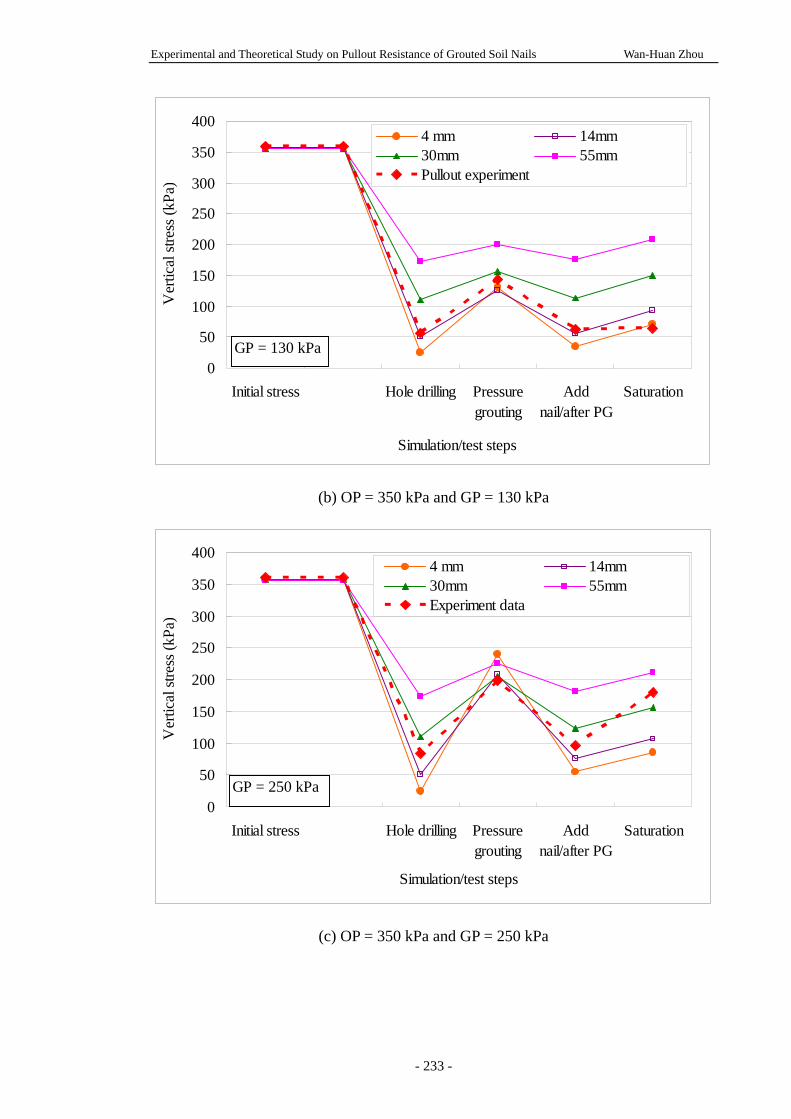
Experimental and Theoretical Study on Pullout Resistance of Grouted Soil Nails Wan-Huan Zhou
- 233 -
0
50
100
150
200
250
300
350
400
Initial stress Hole drilling Pressuregrouting
Addnail/after PG
Saturation
Simulation/test steps
Ver
tical
stre
ss (k
Pa)
4 mm 14mm30mm 55mmPullout experiment
GP = 130 kPa
(b) OP = 350 kPa and GP = 130 kPa
0
50
100
150
200
250
300
350
400
Initial stress Hole drilling Pressuregrouting
Addnail/after PG
Saturation
Simulation/test steps
Ver
tical
stre
ss (k
Pa)
4 mm 14mm30mm 55mmExperiment data
GP = 250 kPa
(c) OP = 350 kPa and GP = 250 kPa
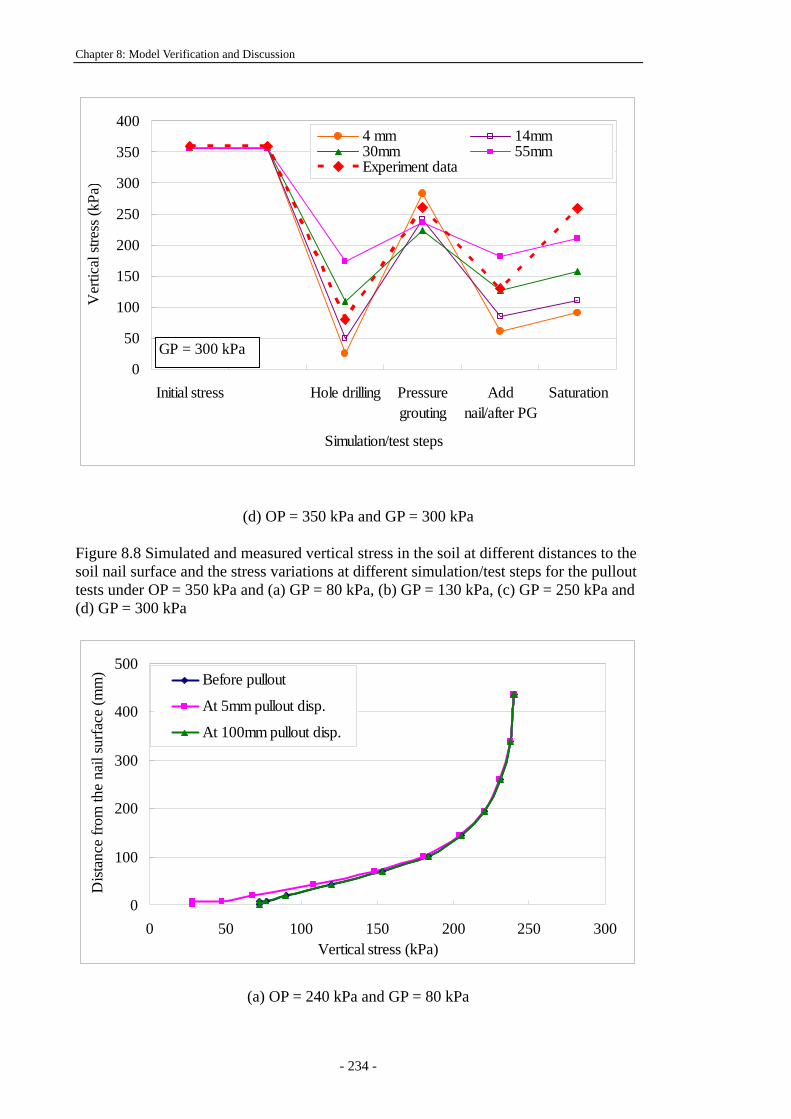
Chapter 8: Model Verification and Discussion
- 234 -
0
50
100
150
200
250
300
350
400
Initial stress Hole drilling Pressuregrouting
Addnail/after PG
Saturation
Simulation/test steps
Ver
tical
stre
ss (k
Pa)
4 mm 14mm30mm 55mmExperiment data
GP = 300 kPa
(d) OP = 350 kPa and GP = 300 kPa
Figure 8.8 Simulated and measured vertical stress in the soil at different distances to the soil nail surface and the stress variations at different simulation/test steps for the pullout tests under OP = 350 kPa and (a) GP = 80 kPa, (b) GP = 130 kPa, (c) GP = 250 kPa and (d) GP = 300 kPa
0
100
200
300
400
500
0 50 100 150 200 250 300Vertical stress (kPa)
Dist
ance
from
the
nail
surfa
ce (m
m) Before pullout
At 5mm pullout disp.
At 100mm pullout disp.
(a) OP = 240 kPa and GP = 80 kPa
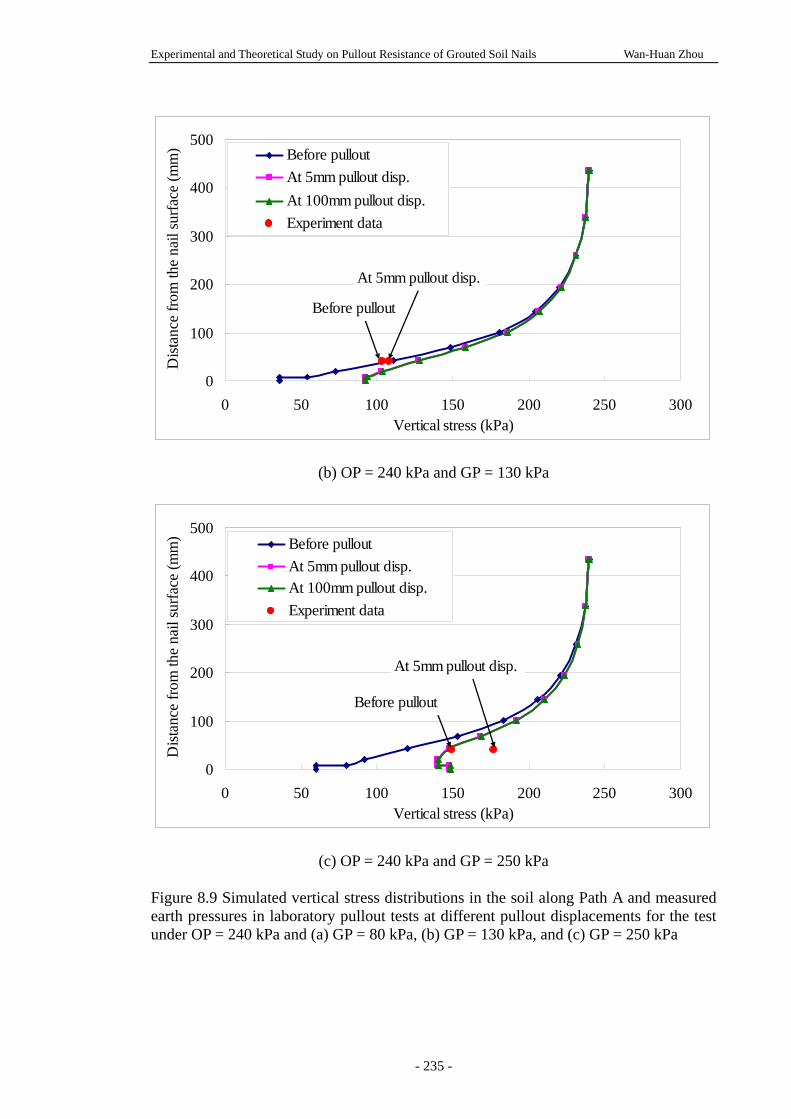
Experimental and Theoretical Study on Pullout Resistance of Grouted Soil Nails Wan-Huan Zhou
- 235 -
0
100
200
300
400
500
0 50 100 150 200 250 300Vertical stress (kPa)
Dist
ance
from
the
nail
surfa
ce (m
m) Before pullout
At 5mm pullout disp.At 100mm pullout disp.Experiment data
At 5mm pullout disp.
Before pullout
(b) OP = 240 kPa and GP = 130 kPa
0
100
200
300
400
500
0 50 100 150 200 250 300Vertical stress (kPa)
Dist
ance
from
the
nail
surfa
ce (m
m) Before pullout
At 5mm pullout disp.At 100mm pullout disp.Experiment data
At 5mm pullout disp.
Before pullout
(c) OP = 240 kPa and GP = 250 kPa Figure 8.9 Simulated vertical stress distributions in the soil along Path A and measured earth pressures in laboratory pullout tests at different pullout displacements for the test under OP = 240 kPa and (a) GP = 80 kPa, (b) GP = 130 kPa, and (c) GP = 250 kPa
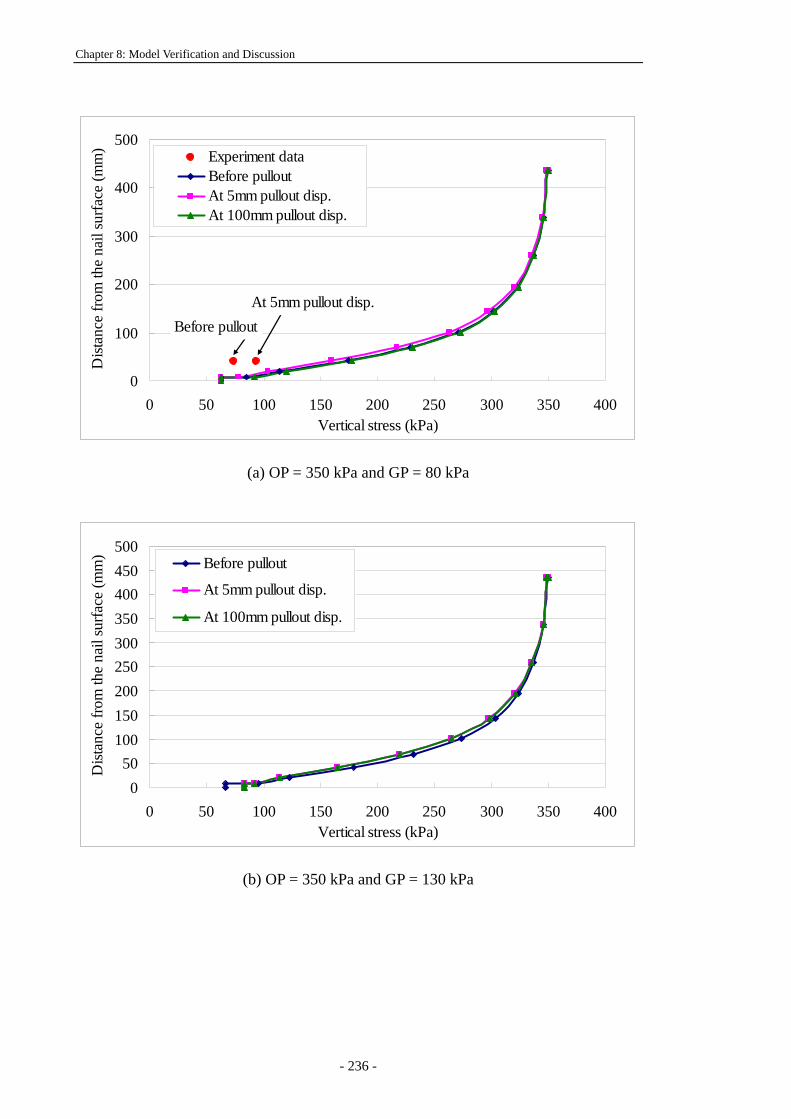
Chapter 8: Model Verification and Discussion
- 236 -
0
100
200
300
400
500
0 50 100 150 200 250 300 350 400Vertical stress (kPa)
Dist
ance
from
the
nail
surfa
ce (m
m) Experiment data
Before pulloutAt 5mm pullout disp.At 100mm pullout disp.
At 5mm pullout disp.Before pullout
(a) OP = 350 kPa and GP = 80 kPa
050
100150200250300350400450500
0 50 100 150 200 250 300 350 400Vertical stress (kPa)
Dist
ance
from
the
nail
surfa
ce (m
m) Before pullout
At 5mm pullout disp.
At 100mm pullout disp.
(b) OP = 350 kPa and GP = 130 kPa
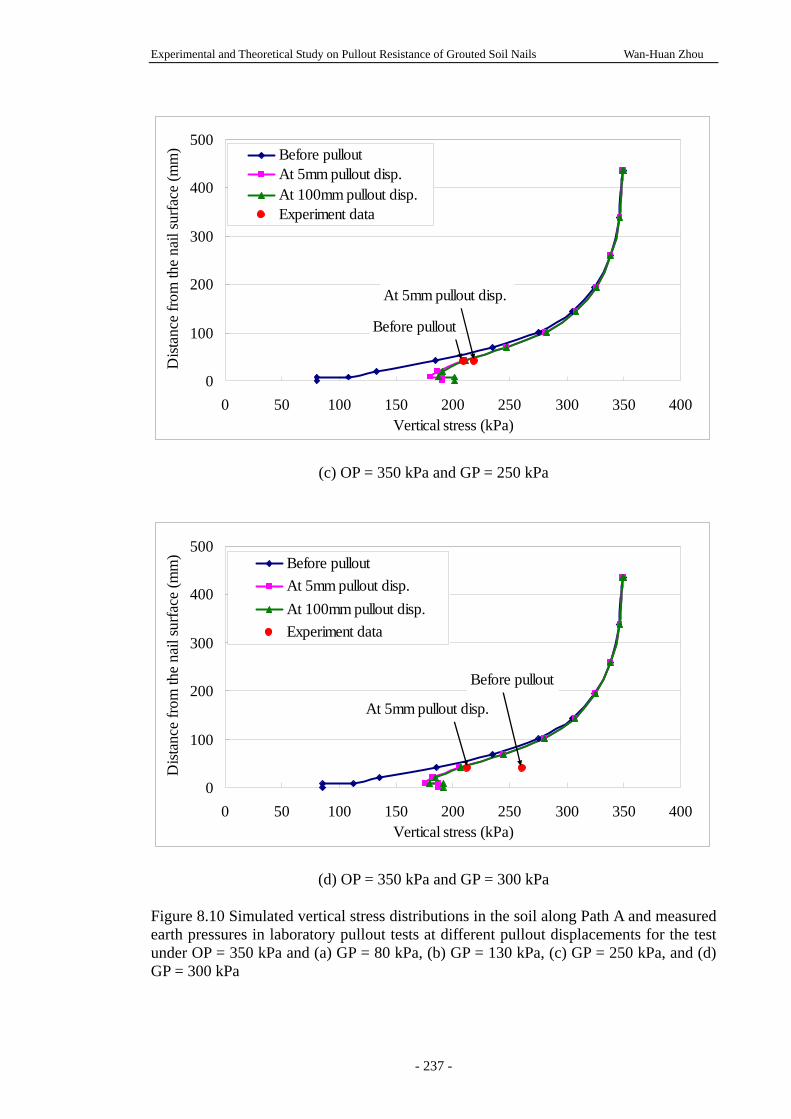
Experimental and Theoretical Study on Pullout Resistance of Grouted Soil Nails Wan-Huan Zhou
- 237 -
0
100
200
300
400
500
0 50 100 150 200 250 300 350 400Vertical stress (kPa)
Dist
ance
from
the
nail
surfa
ce (m
m) Before pullout
At 5mm pullout disp.At 100mm pullout disp.Experiment data
At 5mm pullout disp.
Before pullout
(c) OP = 350 kPa and GP = 250 kPa
0
100
200
300
400
500
0 50 100 150 200 250 300 350 400Vertical stress (kPa)
Dist
ance
from
the
nail
surfa
ce (m
m) Before pullout
At 5mm pullout disp.At 100mm pullout disp.Experiment data
At 5mm pullout disp.
Before pullout
(d) OP = 350 kPa and GP = 300 kPa Figure 8.10 Simulated vertical stress distributions in the soil along Path A and measured earth pressures in laboratory pullout tests at different pullout displacements for the test under OP = 350 kPa and (a) GP = 80 kPa, (b) GP = 130 kPa, (c) GP = 250 kPa, and (d) GP = 300 kPa
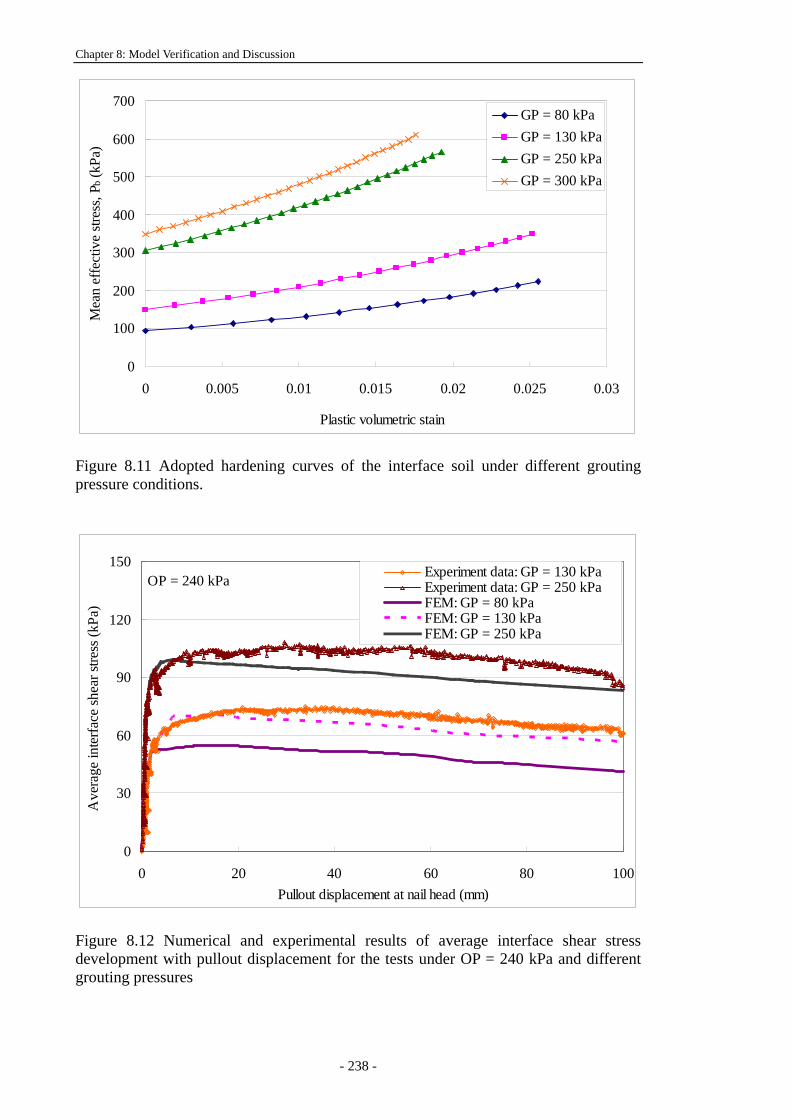
Chapter 8: Model Verification and Discussion
- 238 -
0
100
200
300
400
500
600
700
0 0.005 0.01 0.015 0.02 0.025 0.03
Plastic volumetric stain
Mea
n ef
fect
ive
stres
s, P b
(kPa
)GP = 80 kPaGP = 130 kPaGP = 250 kPaGP = 300 kPa
Figure 8.11 Adopted hardening curves of the interface soil under different grouting pressure conditions.
0
30
60
90
120
150
0 20 40 60 80 100Pullout displacement at nail head (mm)
Ave
rage
inte
rface
shea
r stre
ss (k
Pa)
Experiment data: GP = 130 kPaExperiment data: GP = 250 kPaFEM: GP = 80 kPaFEM: GP = 130 kPaFEM: GP = 250 kPa
OP = 240 kPa
Figure 8.12 Numerical and experimental results of average interface shear stress development with pullout displacement for the tests under OP = 240 kPa and different grouting pressures
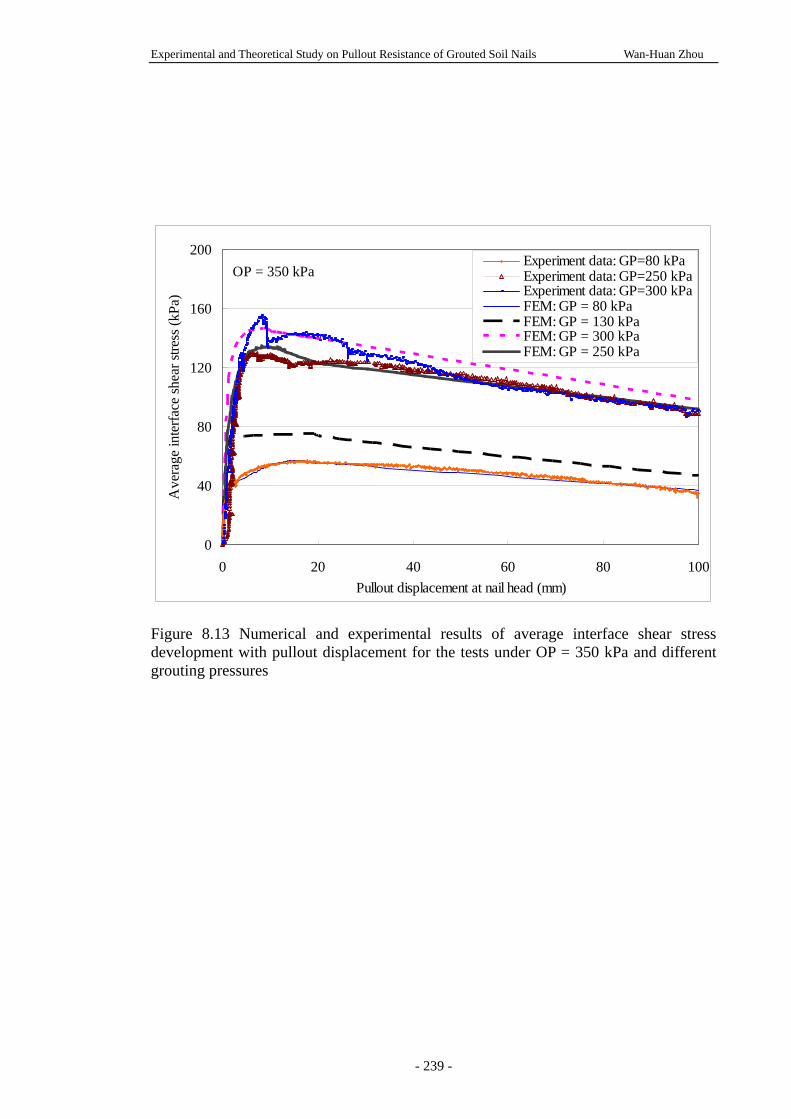
Experimental and Theoretical Study on Pullout Resistance of Grouted Soil Nails Wan-Huan Zhou
- 239 -
0
40
80
120
160
200
0 20 40 60 80 100Pullout displacement at nail head (mm)
Ave
rage
inte
rface
shea
r stre
ss (k
Pa)
Experiment data: GP=80 kPaExperiment data: GP=250 kPaExperiment data: GP=300 kPaFEM: GP = 80 kPaFEM: GP = 130 kPaFEM: GP = 300 kPaFEM: GP = 250 kPa
OP = 350 kPa
Figure 8.13 Numerical and experimental results of average interface shear stress development with pullout displacement for the tests under OP = 350 kPa and different grouting pressures
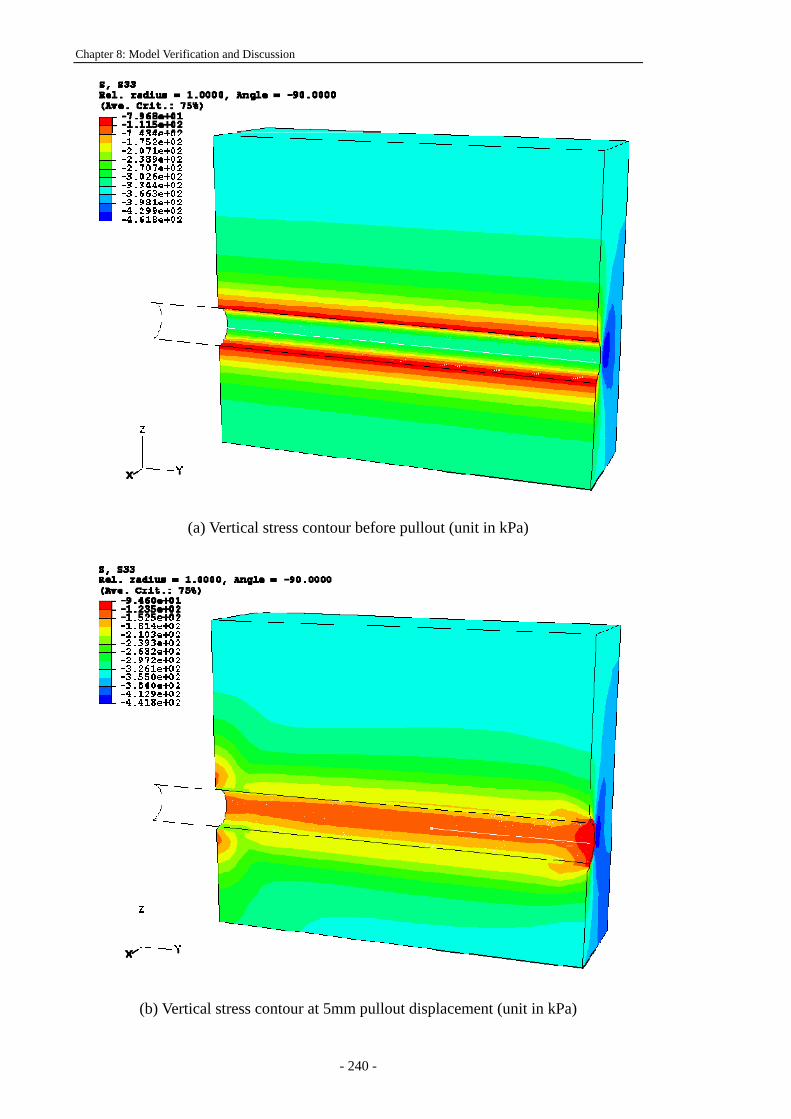
Chapter 8: Model Verification and Discussion
- 240 -
(a) Vertical stress contour before pullout (unit in kPa)
(b) Vertical stress contour at 5mm pullout displacement (unit in kPa)
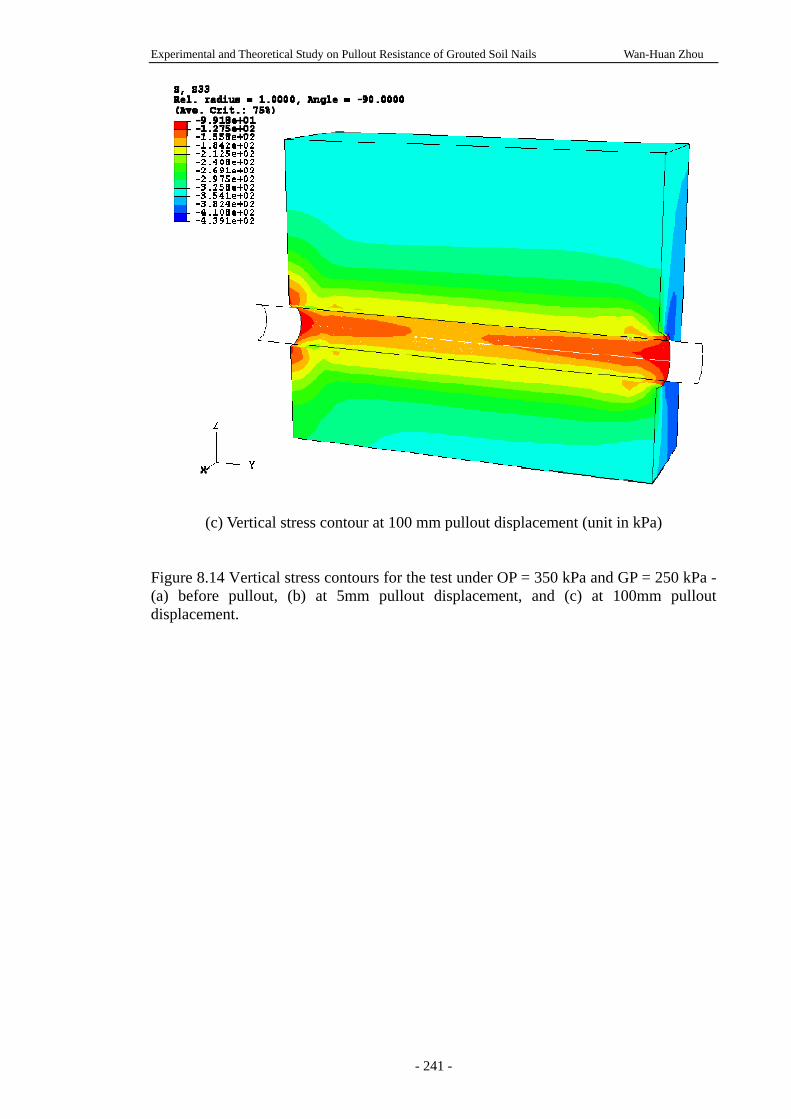
Experimental and Theoretical Study on Pullout Resistance of Grouted Soil Nails Wan-Huan Zhou
- 241 -
(c) Vertical stress contour at 100 mm pullout displacement (unit in kPa) Figure 8.14 Vertical stress contours for the test under OP = 350 kPa and GP = 250 kPa - (a) before pullout, (b) at 5mm pullout displacement, and (c) at 100mm pullout displacement.
Chapter 8: Model Verification and Discussion
- 242 -
Experimental and Theoretical Study on Pullout Resistance of Grouted Soil Nails Wan-Huan Zhou
- 243 -
Chapter 9:
SUMMARY, CONCLUSIONS AND SUGGESTIONS
The pullout resistance of grouted soil nails has been investigated by using experimental
and theoretical methods in this research project. A summary of and main conclusions
from this research project are presented in this final chapter. Suggestions are then given
for further research in the topic area.
9.1 SUMMARY AND CONCLUSIONS
A simple mathematical model for the interaction analysis of a soil nail and the
surrounding soil has been developed. The model takes into account some key
parameters, which are soil dilation, soil nail bending, vertical pressure, and non-linear
subgrade reaction stiffness of the soil. Two case studies have been carried out for model
verification. Good agreement has been found. The following conclusions are drawn
from the analyses:
The simple mathematical model is suitable for modelling both the performance of
a single soil nail installed in a soil-nailed wall/slope and direct shear tests with
reinforcement.
The analyses of a soil nail installed in a slope/wall show that the contribution of
the soil nail bending to the pullout resistance is of secondary importance as the
tension failure is dominant in the soil-nailed structure.
Parametric study indicates that the lateral soil reaction has a positive effect on the
Chapter 9: Summary, Conclusions and Suggestions
- 244 -
soil nail pullout resistance, especially at large sliding displacement and the soil
nail pullout resistance increases to a limit as the soil nail bending stiffness
approaches to infinity.
A series of laboratory soil nail pullout tests have been carried out on a soil nail in a
completely decomposed granite (CDG) soil in a nearly saturated condition under a
combination of different grouting pressures and overburden pressures. The soil nail
pullout tests simulated the real construction process of a soil nail, including the
establishment of initial earth pressure in a soil slope, drilling a hole with stress release,
grouting, and soil nail pullout when the slope is sliding. The pullout box is well
instrumented. The test setup, material properties and test procedures are detailed in
Chapter 4. The test programme is introduced and the typical test results and
observations throughout the tests are presented in Chapter 5. The main observations
from the laboratory tests are:
The higher the applied overburden pressure, the longer the time needed to obtain
stress equilibrium in the box.
The earth pressures at P-Cell 1, 2, 3, and 4 increase with the application of
grouting pressure, but this can not be maintained for a long time. The higher the
applied grouting pressure the longer that grouting pressure can be maintained.
During saturation, the vertical effective stress around the soil nail increased. This
stress increasing phenomenon during saturation was not so distinct when the
grouting pressure was low.
It appears that the FBG sensors show higher reliability than the strain gauges for
the small strain monitoring.
The water content (or degree of saturation) in the box was fairly uniform after the
test. A layer of soil adhered to the cement column of the soil nail during and
Experimental and Theoretical Study on Pullout Resistance of Grouted Soil Nails Wan-Huan Zhou
- 245 -
after the soil nail pullout. The thickness of the adhered soil was not uniform
around the soil nail.
The pullout test data are further analyzed, compared and interpreted in Chapter 6. The
effects of both overburden pressure and grouting pressure on the soil nail pullout
resistance have been evaluated and discussed. A new empirical linear equation with two
parameters 'Gc and '
Gμ has been proposed to fit the pullout resistance data at peak and
pullout displacement of 50 mm. The following conclusions are made from the
laboratory study:
The peak (or maximum) normal stress does not correspond to the peak pullout
resistance, due to the progressive failure nature at the soil-nail interface.
The effect of soil dilation is much smaller in the soil nail pullout tests under a
saturated condition, compared to the significant effect of dilation observed during
the pullout in an unsaturated soil condition, as reported by other researchers.
Both overburden pressure and grouting pressure have influences on soil nail
pullout resistance, and their influences are interactional. The soil nail pullout
resistance is independent of the overburden pressure when the grouting pressure
is low, but increases with the overburden pressure when the grouting pressure is
higher.
In the proposed empirical linear equation, two parameters 'Gc and '
Gμ are
dependent on the grouting pressure ( Gp ). The relationship between 'Gc (or '
Gμ )
and Gp is nonlinear.
A three-dimensional (3D) finite element (FE) model has been established for simulation
of the soil nail pullout tests. The model simulates all the procedures of the pullout tests
Chapter 9: Summary, Conclusions and Suggestions
- 246 -
for the conditions of both unsaturated soil, without pressure grouting and saturated, with
pressure grouting. The factors of soil dilation, overburden pressure and grouting
pressure are considered in the FE model. The model mesh, simulation procedures,
material constitutive models and parameters are presented in Chapter 7. The modelling
results have been compared with the laboratory pullout test data and are presented in
Chapter 8. The stress variations in the soil and the soil nail pullout behaviour at
different test steps and conditions are presented and discussed. The conclusions
obtained from the FE modelling are as follows.
The present FE model can be used to simulate the soil nail pullout behaviour for
both unsaturated and saturated cases. The present model is capable of capturing
the main features of the soil stress variations and pullout behaviour during the
soil nail pullout tests.
The effect of soil dilation on the pullout resistance, in the simulation of
unsaturated case, is significant during the pullout. The FE modelling has shown
that the stress distribution in the soil nail axial direction is non-uniform at large
pullout displacements.
The effect of interface soil dilation under small overburden pressures is not so
significant as that under OP = 200 kPa and 300 kPa. At the same interface soil
dilation angle, the soil nail pullout resistance tends to increase with the
overburden pressure.
In the simulation of saturated cases, the procedural steps of pressure grouting and
soil saturation have been considered. It was found that the FE modelling results
captured the main features of the stress variations during the test procedures of
hole drilling, pressure grouting and soil saturation.
In the pullout analysis, the numerical results from the present model agree well
with the experimental data. The softening behaviour of soil nail pullout resistance
Experimental and Theoretical Study on Pullout Resistance of Grouted Soil Nails Wan-Huan Zhou
- 247 -
is successfully simulated by the present model. It was found from back analysis
that the lower the grouting pressure, the lower the initial yield stress of the
interface soil.
It is seen from the FE modelling that the effect of soil dilation is not so significant
as that in the unsaturated case. The stresses surrounding the soil nail slightly
increased during the pullout and the stress distribution in the axial direction is
basically uniform in the saturated condition.
9.2 RECOMMENDATIONS AND SUGGESTIONS
The simple mathematical model presented in Chapter 3 has been verified by two
case studies. Further study is recommended to extend the application of the
simple model in the soil nailing design in Hong Kong.
It has been found that when the magnitude of overburden pressure and grouting
pressure is low, the effects of both overburden pressure and grouting pressure are
not significant in terms of soil nail pullout resistance. More pullout tests under
larger overburden pressure and grouting pressures are recommended to further
investigate the effects of the overburden pressure and grouting pressure on the
soil nail pullout behaviour.
It has been found that the softening behaviour of the soil nail pullout resistance is
significant in the pullout tests. The research on the durability and long term
performance of soil nails in CDG soil or other soils is recommended to be carried
out in future studies.
Chapter 9: Summary, Conclusions and Suggestions
- 248 -
The 3D FE model simulates the main features of the soil nail pullout behaviour.
The modelling method can be applied to the simulation of a soil nailed slope, to
study the effect of soil dilation, overburden pressure and grouting pressure on the
stability of a soil nailed slope.
A more complicated FE model is recommended to investigate the mechanism of
the soil-grout interaction during the pressure grouting and saturation. For the
pullout analysis, the simulation of the pullout failure in the surrounding soil may
be useful to investigate the progressive failure during the pullout.
Experimental and Theoretical Study on Pullout Resistance of Grouted Soil Nails Wan-Huan Zhou
- 249 -
REFERENCES
ABAQUS. (2005). Hibbitt D., Karlsson B., and Sorensen P., ABAQUS v6.5 User's
Manuals, Providence (RI), ABAQUS, Inc.
Addenbrooke T.I., Ong J.C.W., and Potts D.M. (2002). Finite-element Analysis of A
Compensation Grouting Field Trial in Soft Clay. Proceedings of the Institution of
Civil Engineers, Geotechnical Engineering, 115(1), 47- 58.
Aminfar M.H. (1998). Centrifuge Modelling of Soil Nailed Slopes. PhD thesis,
University of Wales, Cardiff, United Kingdom.
Bang S., Shen C.K., and Romstad K.M. (1980). Analysis of an Earth-reinforcing
System for Deep Excavations. US Transport Research Record 749, 21-26.
Barley A.D. (1992). Soil Nailing Case Histories and Developments. Proceedings of ICE
Conference on Retaining Structures, Cambridge, 559- 573.
Barley A.D., Davies M.C.R., and Jones A.M. (1998). Instrumentation and Long Term
Monitoring of a Soil Nailed Slope at Madeira Walk, Exmouth, UK. Symposium of
Field Instrumentation for Soil and Rock, Atlanta, USA, 51-65.
Barr B.I.G., Davies M.C.R. and Jacobs C.D. (1991). A Large Direct Shear Box - Some
Initial Results of Tests on Nails. Ground Engineering, 24 (3), 44- 50.
Benhamida B., Schlosser F., and Unterreiner P. (1997). Finite Element Modeling of A
Soil Nailed Wall: Earth Pressures and Arching Effects. Numerical models in
References
- 250 -
Geomechanics, Pietruszczak & Pande (eds), Balkema, Rotterdam, 245-250.
Bolton M.D. (1986). The Strength and Dilatancy of Sands. Geotechnique, 36(1), 65-78.
Bowles J.E. (1996). Foundation Analysis and Design, (5th edition), McGraw-Hill, Int.
Editions.
Briaud, J.L. and Lim Y.J. (1997). Soil-Nailed Wall Under Piled Bridge Abutment:
Simulation and Guidelines. Journal of Geotechnical and Geoenvironmental
Engineering, 123(11), 1043-1050
Bridle R.J. and Davies M.C.R. (1997). Analysis of Soil Nailing Using Tension and
Shear: Experiment Observations and Assessment. Proc. Inst. Civ. Eng., Geotech.
Eng., 125(3), 155-167.
Bruce D.A. and Jewell R.A. (1986). Soil Nailing: Application and Practice-Part 1.
Ground Engineering, 19(8), 10-15.
Bruce D.A. and Jewell R.A. (1987). Soil Nailing: Application and Practice - Part 2.
Ground Engineering, 20(1), 21-23.
BS 1377-2. (1990). Methods of Test for Soils for Civil Engineering Purpose-Part 2:
Classification Tests. British Standards Institution.
BS 5930. (1981). Code of Practice for Site Investigations. British Standards Institution.
Cartier G. and Gigan J.P. (1983). Experiments and Observations on Soil Nailing
Structures. Proc. Enropean Conf. Soil Mechanics and Foundation Engineering,
Helsinki, 473-476.
Experimental and Theoretical Study on Pullout Resistance of Grouted Soil Nails Wan-Huan Zhou
- 251 -
Chai X.J. and Hayashi S. (2005). Effect of Constrained Dilatancy on Pull-out Resistance
of Nails in Sandy Clay. Ground Improvement. 9(3), 127-135.
Chang K.T. and Milligan G.W.E. (1996). Effects of the Transition Zone in A Nailed Wall
Model Test. Proc. of Earth Reinforcement, Ochiai, Yasufuku & Omie (eds.), Balkema,
333-338.
Chen P.Y.M. (1992). Methods of Test for Soils in Hong Kong for Civil Engineering
Purposes (Phase 1 Tests). Geotechnical Engineering office, Civil Engineering
Department, The Government of HKSAR, GEO Report No.36
Cheuk C.Y., Ng C.W.W., and Sun H.W. (2005). Numerical Experiments of Soil Nails in
Loose Fill Slopes Subjected to Rainfall Infiltration Effects Computers and
Geotechnics, 32(4), 290-303
Cheung W.M. (2002). Non-Destructive Tests for Determining The Lengths of Installed
Steel Soil Nails. Geotechnical Engineering Office, CEDD, GEO Special Project
Report No. SPR 5/2002
Choukeir M.H. (1996). Seismic Analysis of Reinforced Earth and Soil-Nailed Structures.
Ph.D Thesis, New York Polytechnic University
Chu L.M. (2003). Study on the Interface Shear Strength of Soil Nailing in Completely
Decomposed Granite (CDG) Soil. M.Phil thesis, September 2003, The Hong Kong
Polytechnic University.
Chu L.M. and Yin J.H. (2005a). Comparison of Interface Shear Strength of Soil Nails
Measured by Both Direct Shear Box Tests and Pullout Tests. Journal of Geotechnical
References
- 252 -
and Geoenvironmental Engineering, 131(9), 1097-1107.
Chu L.M. and Yin J.H. (2005b). A Laboratory Device to Test the Pull-out Behavior of
Soil Nails. ASTM Geotechnical Testing Journal, 28 (5), September, 1-15.
CIRIA (2005). Soil Nailing - Best Practice Guidance (CIRIA C637). CIRIA, UK. ISBN:
0-86017-637-1.
CLOUTERRE (1991). French National Research Project Clouterre - Recommentations
1991. English Translation, Federal Highway Administration, FHWA-SA-93-026,
Washington D.D., USA.
Davies M.C.R. and Le Masurier J.W. (1997). Soil Nail Interaction Mechanisms From
Large Direct Shear Tests. Ground Improvement Geosystems Densification and
Reinforcement, London, United Kingdom, 3-5, June, 1997, 493-499.
FHWA (1996). Manual for Design and Construction of Soil Nail Walls. Soil nail
walls-demonstration project 103. Federal Highway Administration, Washington D.C.,
USA. November 1996. FHWA-SA-96-096.
FHWA (2002). International Technology Scanning Program - Bringing Global
Innovations to Us Highways. Federal Highway Administration, Washington D.C.,
USA
FHWA (2003). Soil Nail Walls, Geotechnical Engineering Circular No. 7, Federal
Highway Administration, USA. Publication No. FHWA0-IF-03-017.
Franzén G. (1998). Soil Nailing – A Laboratory and Field Study of Pullout Capacity.
Doctoral thesis, Department of Geotechnical Engineering, Chalmers University of
Experimental and Theoretical Study on Pullout Resistance of Grouted Soil Nails Wan-Huan Zhou
- 253 -
Technology, Sweden.
Frydman S., Baker R. and Levy A. (1994). Modeling The Soil Nailing Excavation
Process. Proc. of the Int. Centrifuge Conference 94, Singapore, 669-674.
Gammage P.J. (1997). Centrifuge Modelling of Soil Nailed Walls. PhD thesis,
University of Wales, Cardiff, United Kingdom.
Gässler G. (1987). Vernagelte Gelandesprunge - Tragverhalten Und Standsicherheit.
PhD thesis, University of Karlsruhe.
Gässler G. (1988). Soil Nailing - Theoretical Basis and Practical Design. International
Geotechnical Symposium on Theory and Practice of Earth Reinforcment, Fukuoka,
Japan, 5-7 Oct. 1988, 283-288.
Gässler G. (1992). Full Scale Test on A Nailed Wall in Consolidated Clay. Proc. Int.
Symp. on Earth Reinforcement Practice, Fukuoka, Kyushu, Japan, Vol.1, 475-480
GEO (2006). Good Practice in Design of Steel Soil Nails for Soil Cut Slopes. GEO
Technical Guidance Note No. 23 (TGN 23), Geotechnical Engineering Office, Hong
Kong.
GEO (2007). Design of Soil Nail Heads. Geotechnical Engineering Office, CEDD,
GEO Technical Guidance Note No. 21 (TGN 21)
GEO (2008). Geoguide 7 - Guide to Soil Nail Design and Construction, Published by
Geotechnical Engineering Office, Civil Engineering and Development Department,
The Government of the Hong Kong Special Administrative Region. ISBN:
978-962-02-0375-6, GEO REPORT No. 197
References
- 254 -
Gray D.H.and Ohashi H. (1983). Mechanics of Fiber Reinforcement in Sand. J. Geotech.
Eng. Div. ASCE, 109 (GT3), 335-353.
HA68/94 (1994). Design Manual for The Reinforcement of Highways Slopes by
Reinforced Soil and Soil Nailing Techniques. Design Manual for Roads and Bridges.
Vol. 4.1, HMSO, London.
Hetenyi M. (1946). Beams on Elastic Foundation : Theory With Applications in The
Fields of Civil and Mechanical Engineering, Michigan U.P., Ann Arbor.
Hirano M. (2001). Actual Status of The Application of Soil Nailing to Expressway Cut
Slope Construction in Japan. Landmarks in earth reinforcement. Proceedings of
international earth reinforcement, Kyushu, Japan, Nov. Swets and Zeitlinger,
919-934.
Ho D.K.H. and Smith I.M. (1993). Modelling of soil nailing construction by three
dimensional finite element analysis. Retaining structures, Thomas Telford, London,
515-528.
Jaeger JC and Cook NGW. (1976). Fundamentals of Rock Mechanics, (2rd Edition),
Campman and Hall Ltd., London.
Jaky J. (1944). The coefficient of earth pressure at rest. J. Soc. Hungarian Architects
Eng., 7, 355-358.
Japan Highway Public Corporation (JH). (1998). Design & Works Outlines on the
Soil-Cutting Reinforcement Soil Works (English Translation). Japan Highway Public
Corporation.
Experimental and Theoretical Study on Pullout Resistance of Grouted Soil Nails Wan-Huan Zhou
- 255 -
Jewell RA. (1990). Review of theoretical models for soil nailing. Proceedings of an
International Reinforced Soil Conference, 10-12, Sept. Glasgow, Scotland, 265-275.
Jewell R.A. and Pedley M.J. (1990). Soil Nailing Design: The Role of Bending Stiffness.
Ground Engineering, 23(2), March, 30-36.
Jewell R.A. and Pedley M.J. (1992). Analysis for Soil Reinforcement with Bending
Stiffness. ASCE Journal of Geotechnical Engineering Division, 118(10), 1505-1528.
Jewell R.A. and Wroth C.P. (1987). Direct Shear Tests on Reinforced Sand.
Geotechnique, 37(1), 53-68
Junaideen S.M., Tham L.G., Law K.T., Lee C.F., and Yue Z.Q. (2004). Laboratory Study
of Soil-Nail Interaction in Loose, Completely Decomposed Granite. Canadian
Geotechnical Journal, 41, 274-286.
Juran I and Elias V. (1991). Ground Anchors and Soil Nails in Retaining Structures,
Foundation Engineering Handbook, 2nd Edition, edited by Hsai-Yang Fang.
Chapman & Hall, New York. 868-905.
Juran I. (1985). Reinforced Soil Systems - Application in Retaining Structures.
Geotechnical Engineering, 16, 39-82.
Juran I., Baudrand G., Farrag K., and Elias V. (1990). Kinematical Limit Analysis for
Design of Soil-Nailed Structures. ASCE Journal of Geotechnical Engineering, 116(1),
54-72.
Kim W.C. (1998). The Effect of Nail Stiffness and Inclination in Soil Nailing by Finite
Element Method. Ph.D thesis, Utah State University, United States.
References
- 256 -
Kleyner I. and Krizek R.J. (1995). Mathematical model for bore-injected cement grout
installations. Journal of Geotechnical Engineering. ASCE. 121(11), 782-788.
Lim, Y.J. (1996). Three-Dimensional Nonlinear Finite Element Analysis of Tieback
Walls and of Soil Nailed Walls Under Piled Bridge Abutments. Ph.D thesis, Texas
A&M University, United States.
Louis C. (1986). Theory and Practice in Soil Nailing Temporary Or Permanent Works,
ASCE Annual Conference, Boston.
Luo S.Q., Tan S.A., and Yong K.Y. (2000). Pull-out Resistance Mechanism of A Soil
Nail Reinforcement in Dilative Soils. Soils and Foundations, 40(1), 47-56.
Milligan G.W.E., Chang K.T. and Morris J.D. (1997). Pull-out Resistance of Soil Nails
in Sand and Clay. Ground Improvement Geosystems Densification and
Reinforcement, London, United Kingdom, 415-422.
Milligan G.W.E. and Tei K. (1998). The Pull-out Resistance of Model Soil Nails. Soils
and Foundations, 38(2), 179-190.
Myles B. (1994). New techniques for soil nailing slopes. Proceedings of International
Conference on Landslides, Slope Stability and the Safety of Infra-structures,
Malaysia, 265-271.
Ng C.W.W. and Lee G.T.K. (2002). A Three-Dimensional Parametric Study of The Use
of Soil Nails for Stabilizing Tunnel Faces. Computers and Geotechnics, Vol. 29, Iss.
8, 673-697
Ng C.W.W. and Zhou R.Z.B. (2005). Effects of Soil Suction on Dilatancy of An
Experimental and Theoretical Study on Pullout Resistance of Grouted Soil Nails Wan-Huan Zhou
- 257 -
Unsaturated Soil. Proceedings of the 16th International Conf. on Soil Mech. and
Geot. Engineering, September 12-16, 2005, Osaka, Japan, 559-562.
Ortigao J.A.R., Palmeira E.M. and Zirlis A.C. (1995). Experience With Soil Nailing in
Brazil: 1970-1994. Proc. Int. Civil Engineer, Geotechnical Engineering, Vol.113,
April 1995, 93-106
Ochiai T., Hattori K., and Pokharel G. (1997). Numerical Modeling of An in-Situ
Pull-Out Test on Soil Reinforcing Bars. Numerical Models in Geomechanics,
Pietruszczak & Pande (eds), Balkema, Rotterdam, 263-268.
Pedley M.J. (1990). The Performance of Soil Reinforcement in Bending and Shear.
Ph.D. Thesis, University of Oxford.
Plumelle C. and Schlosser F. (1990). A French National Research Project on Soil
Nailing: Clouterre. Proc. Int. Reinforced Soil Conf., Glasgow, Scotland, 219-223.
Plumelle B.C., Schlosser F., Delage P. and Knochenmus G. (1990). French National
Research Project on Soil Nailing Clouterre. Proc. of a Conf. on Design and
Performance of Earth Retaining Structures, Geotechnical Special Publication No.25,
Ithaca, USA, 660-675.
Powell G.E. and Watkins A.T. (1990). Improvement of Marginally Stable Existing
Slopes by Soil Nailing in Hong Kong. State of The Art Report, Proceedings of the
International Reinforced Soil Conference, September, 1990. Performance of
Reinforced Soil Structures, British Geotechnical Society, edited by A. McGown, K.
C. Yeo and K. Z. Andrawes. London, .241-247.
References
- 258 -
Pradhan B. (2003). Study of Pullout Behaviour of Soil Nails in Completely
Decomposed Granite Fill, M.Phil Thesis, The University of Hong Kong.
Pradhan B., Tham L.G., Yue Z.Q., Junaideen S.M., and Lee C.F. (2006). Soil-Nail
Pullout Interaction in Loose Fill Materials. International Journal of Geomechanics,
ASCE. 6(4), 238-247.
Pun W.K. and Shiu Y.K. (2007). Design Practice and Technical Developments of Soil
Nailing in Hong Kong. Proceedings of the HKIE Geotechnical Division 27th Annual
Seminar: Geotechnical Advancements in Hong Kong since 1970s. The Hong Kong
Institution of Engineers, Hong Kong, 197-212.
Ramsey N., Jardine R.J., Lehane B.M. and Ridley A. (1998). A Review of soil-steel
interface testing with the ring shear apparatus. Int. Conf. on Offshore Site
Investigations and Foundation Behaviour, SUT, London, 237-258.
Sano N., Kitamura T., and Matsuoka K. (1988). Proposal for Design and Construction
of Reinforced Cut Slope With Steel Bars. International Geotechnical Symposium on
Theory and Practice of Earth Reinforcement, Fukuoka, Japan, 5-7 October 1988,
347-353.
Sawicki A. (2000). Mechanics of Reinforced Soil, Balkema, Rotterdam, Brookfield, Vt.
Schlosser F. (1982). Behaviour and Design of Soil Nailing. Proc. on Recent
Developments in Ground Improvement Techniques, Bangkok, Thailand, 399-413.
Schlosser F. and Guilloux A. (1981). Le Frottement Dens Les Sols. Revue Francaise de
Geotechnique, (16), 65-77.
Experimental and Theoretical Study on Pullout Resistance of Grouted Soil Nails Wan-Huan Zhou
- 259 -
Schlosser F., Plumelle C., Unterreiner P., and Benoit J. (1992). Failure of Full Scale
Experimental Soil Nailed Wall by Reducing The Nails Lengths (French Research
Project CLOUTEERE). Proc. of Int. Conf. on Earth Reinforcement Practice, 11-13
Nov. 1992, Fukuoka, Kyushu, Japan, 531-535.
Seto P., Won G.W., Choi K.Y. (1992). Use of Soil Nailing in Stabilization of A Freeway
Embankment. Proceedings of International Symposium on Earth Reinforcement,
Kyushu, Japan, Vol. 1, 11-13 November 1992, 537-543.
Shiu Y.K. and Chang G.W.K. (2005). Effects of Inclination, Length Pattern and Bending
Stiffness of Soil Nails on Behaviour of Nailed Structures. Geotechnical Engineering
Office, CEDD, GEO Special Project Report No. SPR 6/2005
Shiu Y.K. and Cheung W.M. (2002). Long-Term Durability of Steel Soil Nails.
Geotechnical Engineering Office, CEDD, GEO Special Project Report No. SPR
3/2002.
Shiu Y.K., Yung P.C.Y. and Wong C.K. (1997). Design, Construction and Performance
of Soil Nailed Excavation in Hong Kong. Proceedings of the XIVth International
Conference Soil Mechanics and Foundation Engineering, 6-12 September, Hamburg,
Germany, 1339-1342.
Smith I.M. and Su N. (1997). Three-Dimensional FE Analysis of A Nailed Soil Wall
Curved in Plan. Int. Journal for Numerical and Analytical Method in Geomechanics,
Vol.21, 583-597
Soga K., Bolton M.D., Au S.K.A., Komiya K., Hamelin J.P., Van Cotthem A., Buchet G.,
Michel J.P. (2000). Development of Compensation Grouting Modelling and Control
References
- 260 -
System. in Proceedings of the International Symposium on Geotechnical Aspects of
Underground Construction in Soft Ground, Kusakabe O, Fujita K, Miyazaki Y (eds),
Tokyo, Japan, 19–21 July, 1999. Balkema, Rotterdam, 2000; 425–436.
Stocker M.F., Korber G.W., Gassler G. and Gudehus G. (1979). Soil Nailing. Int. Conf.
on Soil, Reinforcement, Paris, 469-474.
Su L.J. (2006). Laboratory Pull-Out Testing Study on Soil Nails in Compacted
Completely Decomposed Granite Fill. Ph.D. Thesis, The Hong Kong Polytechnic
University.
Su L.J., Chan T.C.F., Shiu Y.K., Cheung T., and Yin J.H. (2007). Influence of Degree of
Saturation on Soil Nail Pull-Out Resistance in Compacted Completely Decomposed
Granite Fill. Canadian Geotechnical Journal, 44(11), 1314-1428.
Su L.J., Chan C.F., Shiu Y.K., Chiu S.L., and Yin J.H. (2008). Study on The Influence of
Overburden Pressure on Soil Nail Pull-Out Resistance in A Compacted Fill. Journal
of Geotechnical and Geoenvironmental Engineering, ASCE. (in press).
Tei K. (1993). A Study of Soil Nailing in Sand. Ph.D thesis, University of Oxford
Thompson S.R. and Miller I.R. (1990). Design, Construction and Performance of A Soil
Nailed Wall in Seattle, Washington. Proceedings of Conference on Design and
Performance of Earth Retaining Structures. Geotechnical Special Publication No. 25,
Ithaca, USA, 18-21 June 1990, 629-643.
Tsai J.H., Patra A. and Wetherhold R. (2005). Finite Element Simulation of Shaped
Ductile Fiber Pullout Using A Mixed Cohesive Zone-Friction Interface Model.
Experimental and Theoretical Study on Pullout Resistance of Grouted Soil Nails Wan-Huan Zhou
- 261 -
Composites: Part A, 36, 827–838.
Turner J.P. and Jensen W.G. (2005). Landslide Stabilization Using Soil Nail and
Mechanically Stabilized Earth Walls: Case Study. Journal of Geotechnical and
Geoenvironmental Engineering, ASCE, 131(2), 141-150.
Watkins A.T. and Powell G.E. (1992). Soil Nailing to Existing Slopes As Landslide
Preventive Works. Hong Kong Engineer, March 1992, 463-474.
Wisser C., Augarde C.E., and Burd H.J., (2005). Numerical Modelling of Compensation
Grouting Above Shallow Tunnels, Int. J. Numer. Anal. Meth. Geomech., 29,
443–471.
Wong H.N. and Pang L.S. (1996). Application of Prescriptive Measures to Soil Cut
Slopes, GEO Report No. 56, GEO, CEDD, The Government of HKSAR.
Wong I.H., Low B.K., Pang P.Y. and Raju G.V.R. (1997). Field performance of nailed
soil wall in residual soil. Journal of performance of constructed facilities,11(3),
105-112.
Yang M.Z. and Drumm E.C. (2000). Numerical Analysis of The Load Transfer and
Deformation in A Soil Nailed Slope. Numerical Methods in Geotechnical
Engineering: Recent Developments, Proc. of Sessions of Geo-Denver 2000, 102-116.
Yeo K.C. and Leung S.K. (2001). Soil Nail Design With Respect to Hong Kong
Conditions. Landmarks in Earth Reinforcement, Proceedings of the International
Symposium on Earth Reinforcement. Fukuoka, Kyushu, Japan, 14-16 November,
2001, Edited by Hidetoshi Ochiai, Jun Otani, Noriyuki Yasufuku, and Kiyoshi Omine.
References
- 262 -
Published by A.A. Balkema, 759-764.
Yeung A.T., Cheng Y.M., Lau C.K., Mak L.M., Yu R.S.M., Choi Y.K., and Kim J.H.
(2005). An Innovative Korean System of Pressure-Grouted Soil Nailing as A Slope
Stabilization Measure. The Proceedings of The HKIE Geotechnical Division 25th
Annual Seminar, 4 May 2005, Hong Kong, published by HKIE-GDC and HKGES,
43-49.
Yin J.H. and Su L.J. (2006). An Innovative Laboratory Box for Testing Nail Pull-Out
Resistance in Soil. ASTM Geotechnical Testing Journal, 29(6), 451-461.
Yin J.H., Su L.J., Cheung R.W.M., Shiu Y.K., and Tang C. (2008). The Influence of
Grouting Pressure on The Pullout Resistance of Soil Nail in Compacted Completely
Decomposed Granite Fill. Geotechnique. (in press).
Zhang Lulu. (2005). Probabilistic Study of Slope Stability Under Rainfall Condition.
PhD thesis, Hong Kong University of Science and Technology.
Zhang Min (2006). Centrifuge Modelling of Potentially Liquefiable Loose Fill Slopes
With and Without Soil Nails. PhD thesis, Hong Kong University of Science and
Technology
Zhang, M.J., Song, E.X. and Chen, Z.Y. (1999). Ground Movement Analysis of Soil
Nailing Construction by Three-Dimensional (3-D). Finite Element Modeling (FEM).
Computers and Geotechnics, 25(4), 191-204.
Zhang J., Pu J., Zhang M., and Qiu T. (2001). Model Tests by Centrifuge of Soil Nail
Reinforcements. Journal of Testing and Evaluation, JTEVA, 29(4), 315-328.
Experimental and Theoretical Study on Pullout Resistance of Grouted Soil Nails Wan-Huan Zhou
- 263 -
Zhou R.Z.B., Ng C.W.W., Zhang M., Pun W.K., Shiu Y.K. and Chang G.W.K. (2006).
The Effect of Soil Nails in A Dense Steep Slope Subjected to Rising Groundwater.
Proceedings of the Sixth International Conference on Physical Modelling in
Geotechnics - 6th ICPMG’06, 4-6 August, Hong Kong, 397-402.
Zhu Hong-Hu, Yin Jian-Hua, Jin Wei, and Zhou Wan-Huan. (2007). Soil Nail
Monitoring Using Fiber Bragg Grating Sensors During Pullout Tests. The
Proceedings of 60th Canadian Geotechnical Conference & 8th joint CGS/IAH-CNC
Groundwater Conference Ottawa, Ontario, Canada. October 21-24, 2007, 821- 828.


