Embed Size (px)
Citation preview
www.elsevier.com/locate/ifset
Innovative Food Science and Emergin
Bacterial resistance after pulsed electric fields depending
on the treatment medium pH
D. Garcıa, N. Gomez, J. Raso, R. Pagan*
Departamento de Produccion Animal y Ciencia de los Alimentos, Facultad de Veterinaria, Universidad de Zaragoza, C/ Miguel Servet,
177, 50013, Zaragoza, Spain
Received 16 February 2005; accepted 30 April 2005
Abstract
The objective was to evaluate and compare the pulsed electric field (PEF) resistance of four Gram-positive (Bacillus subtilis, Listeria
monocytogenes, Lactobacillus plantarum, Staphylococcus aureus) and four Gram-negative (Escherichia coli, E. coli O157:H7, Salmonella
serotype Senftenberg 775W, Yersinia enterocolitica) bacterial strains under the same treatment conditions. Microbial characteristics such as
cell size, shape or type of the cell envelopes did not exert the expected influence on microbial PEF resistance. The most PEF resistant bacteria
depended on the treatment medium pH. For instance, L. monocytogenes, which showed the highest PEF resistance at pH 7.0, was one of the
most sensitive at pH 4.0. The most PEF resistant strains at pH 4.0 were the Gram-negatives E. coli O157:H7 and S. Senftenberg. A
subsequent holding of PEF-treated cells in pH 4.0 for 2 h increased the degree of inactivation up to 4 extra Log10 cycles depending on the
bacterial strain investigated. Under these treatment conditions, the most PEF resistant bacterial strains were still the pathogens S. Senftenberg
and E. coli O157:H7.
D 2005 Elsevier Ltd. All rights reserved.
Keywords: Pulsed electric fields; pH; Bacillus subtilis; Escherichia coli O157:H7; Lactobacillus plantarum; Listeria monocytogenes; Salmonella Senftenberg;
Staphylococcus aureus; Yersinia enterocolitica
Industrial relevance: The design of appropriate food preservation processes by PEF requires the selection of an adequate target bacterial strain, which should
correspond to the most PEF resistant microorganism contaminating food. This study indicates that the pH of the treatment medium plays an important role in
determining this target bacterial strain. On the other hand, the combination of PEF and subsequent holding under acidic conditions has been proven to be an
effective method in order to achieve a higher level of microbial inactivation.
1. Introduction
Pulsed electric field (PEF) treatments have been found to
inactivate spoiling and pathogenic microorganisms without
altering nutritional and sensorial properties of foods
(Barbosa-Canovas, Gongora, Pothakamury & Swanson,
1999), so it has been pointed out the possibility of using
PEF treatments to replace or partially substitute traditional
heat pasteurization treatments.
The design of effective PEF treatments that assure the
safety and stability of foods requires identifying the most
1466-8564/$ - see front matter D 2005 Elsevier Ltd. All rights reserved.
doi:10.1016/j.ifset.2005.04.003
* Corresponding author. Tel.: +34 976 761581; fax: +34 976 761590.
E-mail address: [email protected] (R. Pagan).
PEF resistant strains among pathogenic and spoiling
contaminating microorganisms. However, limited informa-
tion on variation in microbial resistance to PEF is
available in published literature. Scarce systematic studies
have been carried out under the same experimental
conditions, and an effective comparison of the data
reported in the literature is hampered by the different
environmental conditions and methodologies employed by
its authors, or the contribution to the lethal effect of
temperature increase during continuous operation where
high repetition rates were applied.
In general, microbial inactivation by PEF seems to be
highly dependent on the type of microorganism, species,
strain and even serovar (Alvarez, Manas, Condon &
g Technologies 6 (2005) 388 – 395
D. Garcıa et al. / Innovative Food Science and Emerging Technologies 6 (2005) 388–395 389
Raso, 2003; Aronsson, Lindgren, Johansson & Ronner,
2001; Hulsheger, Potel, & Niemann, 1981, 1983; Lado &
Yousef, 2003; MacGregor, Farish, Fouracre, Rowan &
Anderson, 2000; Pagan, Condon & Raso, 2004; Qin,
Barbosa-Canovas, Swanson, Pedrow & Olsen, 1998; Sale
& Hamilton, 1967; Wouters, Alvarez & Raso, 2002;
Wouters & Smelt, 1997). It is assumed that yeast are
more sensitive than the vegetative bacteria when intense
PEF treatments are applied (Qin et al., 1998; Sale &
Hamilton, 1967), and Gram-positive bacteria more resist-
ant than the Gram-negatives (Aronsson et al., 2001;
Hulsheger et al., 1983; Mazurek, Lubicki & Staroniewicz,
1995; Pothakamury, Monsalve-Gonzalez, Barbosa-Cano-
vas & Swanson, 1995; Sale & Hamilton 1967; Vega-
Mercado, Martın-Belloso, Chang, Barbosa-Canovas &
Swanson, 1996). Since the mechanism of inactivation
by PEF seems to be related to the effects on the
cytoplasmic cell membrane, the thicker and more rigid
cell envelopes of Gram-positive bacteria have been
pointed out to be responsible for their higher PEF
resistance.
The intrinsic resistance of microorganisms also seems to
be related to their cell size and shape (Heinz, Alvarez,
Angersbach & Knorr, 2002; Kehez, Savic & Johnson,
1996; Qin et al., 1998). In fact, the major sensitivity of
yeast to PEF treatments is believed to be due to their
higher cell size. The influence of the cell size on the
inactivating effect of PEF treatments is related to the
transmembrane potential created by an external electric
field. The smaller the cell size, the lower the membrane
potential induced by the action of the electrical field and
therefore a higher microbial resistance to PEF treatments is
achieved (Hulsheger et al., 1983; Zimmermann, Pilwat &
Riemann, 1974). Regarding to the influence of the cell
shape, Heinz et al. (2002) reported that rod-shaped cells
would require a more than 5 times higher electrical field to
be inactivated than spherical cells with the same character-
istic dimension.
Nevertheless, numerous published data are not in
agreement with these general and accepted assumptions.
For example, MacGregor et al. (2000) found that Bacillus
cereus which is a Gram-positive bacterium, was more PEF
sensitive than Pseudomonas aeruginosa which is Gram-
negative. Also, Pagan et al. (2004) reported that Salmo-
nella enterica serovar Senftenberg might be more PEF
resistant than Listeria monocytogenes depending on the
treatment conditions. With regard to the cell size, Heinz et
al. (2002) observed that Yersinia enterocolitica, being one
of the smallest cells tested, was more PEF susceptible than
other larger bacterial strains such as Escherichia coli or
Lactobacillus plantarum. In this sense, Wouters, Bos and
Ueckert (2001) demonstrated that cells of L. plantarum,
sorted by flow cytometry on the basis of different sizes
and shapes, showed a similar degree of permeabilization
when increasing time or energy input of the PEF
treatment.
The influence of unknown or uncontrolled environmental
factors may explain these contradictory results. In fact,
microbial inactivation by PEF has also been found to be
substantially influenced by process parameters such as the
electrical field strength, treatment time, pulse number,
repetition rate of pulses or treatment temperature, and
product parameters such as conductivity, water activity or
pH (Alvarez, Pagan, Condon & Raso 2002; Alvarez, Raso,
Palop & Sala, 2000; Wouters, Alvarez, & Raso, 2002;
Wouters & Smelt, 1997). Besides, pH of the treatment
medium is one of the most investigated parameters (Pagan
et al., 2004; Wouters et al., 2002), its influence on microbial
PEF inactivation is a matter of controversy. In fact, it has
been pointed out that a variation of the pH can increase,
reduce or not modify the microbial PEF sensitivity.
The aim of this work was to evaluate and compare under
the same experimental conditions the PEF resistance of four
Gram-positive (Bacillus subtilis, L. monocytogenes, L.
plantarum, Staphylococcus aureus) and four Gram-neg-
ative (E. coli, E. coli O157:H7; Salmonella serotype
Senftenberg 775W, Y. enterocolitica) bacterial strains
depending on the pH of the treatment medium. The
bacterial strains chosen, which differ in size, shape and
cell wall composition, include food spoiling and pathogens.
The work pretends to determine the role of different
microbial characteristics on microbial PEF resistance
depending on the treatment conditions in order to obtain
a more general picture and help in the design and
optimization of PEF processes.
2. Materials and methods
2.1. Microorganisms and growth conditions
The strains of B. subtilis subsp. niger (NCTC 10073), L.
monocytogenes (ATCC 15313), L. plantarum (ATCC
14917), S. aureus (ATCC 13565), E. coli (NCTC 5934),
S. serotype Senftenberg 775W (ATCC 43485) and Y.
enterocolitica (ATCC 9610) used in this investigation were
supplied by the Spanish Type Culture Collection. The strain
of E. coli O157:H7 used in this investigation is a VTEC–
(Phage type 34) isolated by Dr Chapman (Chapman et al.
1993) and was kindly provided by Dr. B. Mackey
(University of Reading, United Kingdom). During this
investigation the strains were maintained on slants of
Tryptic Soy Agar (Biolife, Milan, Italy) with 0.6% of Yeast
Extract added (Biolife) (TSAYE) (E. coli, E. coli O157:H7
L. monocytogenes, S. aureus, Y. enterocolitica), nutrient
agar (NA) (Biolife) (B. subtilis subsp. niger, S. Senftenberg
775W) or MRS agar broth with Tween 80 (Biolife) (L.
plantarum).
Broth subcultures were prepared by inoculating, with one
single colony from a plate, a test tube containing 5 ml of
sterile Tryptic Soy Broth (Biolife, Milan, Italy) with 0.6% of
Yeast Extract added (Biolife) (TSBYE) (E. coli, E. coli
0 5 10 15 200
5
10
15
20
25
30
Time (µs)
Ele
ctri
c fi
eld
str
eng
th (
kV/c
m)
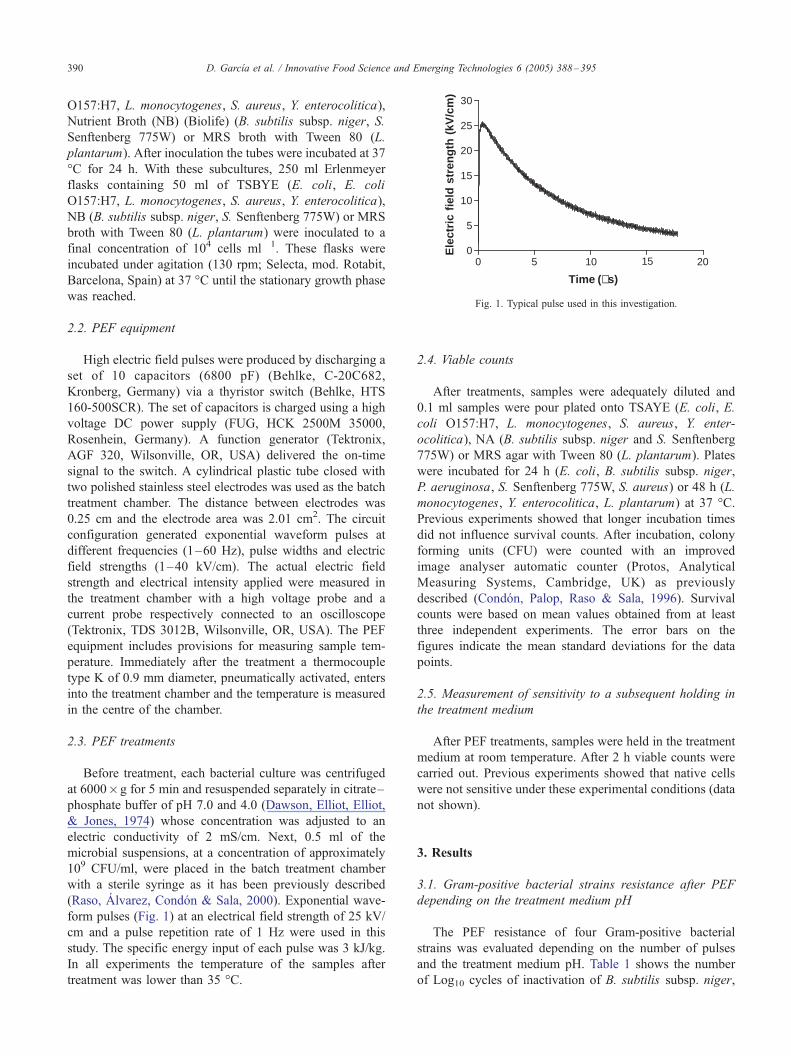
Fig. 1. Typical pulse used in this investigation.
D. Garcıa et al. / Innovative Food Science and Emerging Technologies 6 (2005) 388–395390
O157:H7, L. monocytogenes, S. aureus, Y. enterocolitica),
Nutrient Broth (NB) (Biolife) (B. subtilis subsp. niger, S.
Senftenberg 775W) or MRS broth with Tween 80 (L.
plantarum). After inoculation the tubes were incubated at 37
-C for 24 h. With these subcultures, 250 ml Erlenmeyer
flasks containing 50 ml of TSBYE (E. coli, E. coli
O157:H7, L. monocytogenes, S. aureus, Y. enterocolitica),
NB (B. subtilis subsp. niger, S. Senftenberg 775W) or MRS
broth with Tween 80 (L. plantarum) were inoculated to a
final concentration of 104 cells ml�1. These flasks were
incubated under agitation (130 rpm; Selecta, mod. Rotabit,
Barcelona, Spain) at 37 -C until the stationary growth phase
was reached.
2.2. PEF equipment
High electric field pulses were produced by discharging a
set of 10 capacitors (6800 pF) (Behlke, C-20C682,
Kronberg, Germany) via a thyristor switch (Behlke, HTS
160-500SCR). The set of capacitors is charged using a high
voltage DC power supply (FUG, HCK 2500M 35000,
Rosenhein, Germany). A function generator (Tektronix,
AGF 320, Wilsonville, OR, USA) delivered the on-time
signal to the switch. A cylindrical plastic tube closed with
two polished stainless steel electrodes was used as the batch
treatment chamber. The distance between electrodes was
0.25 cm and the electrode area was 2.01 cm2. The circuit
configuration generated exponential waveform pulses at
different frequencies (1–60 Hz), pulse widths and electric
field strengths (1–40 kV/cm). The actual electric field
strength and electrical intensity applied were measured in
the treatment chamber with a high voltage probe and a
current probe respectively connected to an oscilloscope
(Tektronix, TDS 3012B, Wilsonville, OR, USA). The PEF
equipment includes provisions for measuring sample tem-
perature. Immediately after the treatment a thermocouple
type K of 0.9 mm diameter, pneumatically activated, enters
into the treatment chamber and the temperature is measured
in the centre of the chamber.
2.3. PEF treatments
Before treatment, each bacterial culture was centrifuged
at 6000�g for 5 min and resuspended separately in citrate–
phosphate buffer of pH 7.0 and 4.0 (Dawson, Elliot, Elliot,
& Jones, 1974) whose concentration was adjusted to an
electric conductivity of 2 mS/cm. Next, 0.5 ml of the
microbial suspensions, at a concentration of approximately
109 CFU/ml, were placed in the batch treatment chamber
with a sterile syringe as it has been previously described
(Raso, Alvarez, Condon & Sala, 2000). Exponential wave-
form pulses (Fig. 1) at an electrical field strength of 25 kV/
cm and a pulse repetition rate of 1 Hz were used in this
study. The specific energy input of each pulse was 3 kJ/kg.
In all experiments the temperature of the samples after
treatment was lower than 35 -C.
2.4. Viable counts
After treatments, samples were adequately diluted and
0.1 ml samples were pour plated onto TSAYE (E. coli, E.
coli O157:H7, L. monocytogenes, S. aureus, Y. enter-
ocolitica), NA (B. subtilis subsp. niger and S. Senftenberg
775W) or MRS agar with Tween 80 (L. plantarum). Plates
were incubated for 24 h (E. coli, B. subtilis subsp. niger,
P. aeruginosa, S. Senftenberg 775W, S. aureus) or 48 h (L.
monocytogenes, Y. enterocolitica, L. plantarum) at 37 -C.Previous experiments showed that longer incubation times
did not influence survival counts. After incubation, colony
forming units (CFU) were counted with an improved
image analyser automatic counter (Protos, Analytical
Measuring Systems, Cambridge, UK) as previously
described (Condon, Palop, Raso & Sala, 1996). Survival
counts were based on mean values obtained from at least
three independent experiments. The error bars on the
figures indicate the mean standard deviations for the data
points.
2.5. Measurement of sensitivity to a subsequent holding in
the treatment medium
After PEF treatments, samples were held in the treatment
medium at room temperature. After 2 h viable counts were
carried out. Previous experiments showed that native cells
were not sensitive under these experimental conditions (data
not shown).
3. Results
3.1. Gram-positive bacterial strains resistance after PEF
depending on the treatment medium pH
The PEF resistance of four Gram-positive bacterial
strains was evaluated depending on the number of pulses
and the treatment medium pH. Table 1 shows the number
of Log10 cycles of inactivation of B. subtilis subsp. niger,
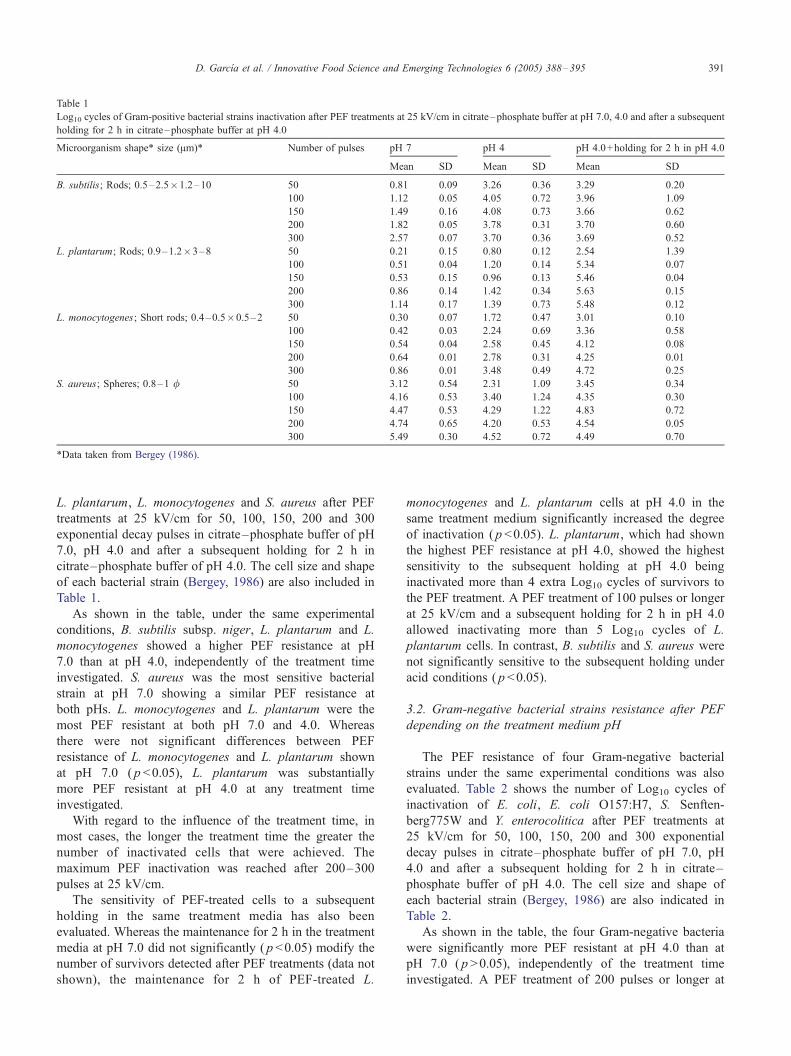
Table 1
Log10 cycles of Gram-positive bacterial strains inactivation after PEF treatments at 25 kV/cm in citrate–phosphate buffer at pH 7.0, 4.0 and after a subsequent
holding for 2 h in citrate–phosphate buffer at pH 4.0
Microorganism shape* size (Am)* Number of pulses pH 7 pH 4 pH 4.0+holding for 2 h in pH 4.0
Mean SD Mean SD Mean SD
B. subtilis; Rods; 0.5–2.5�1.2–10 50 0.81 0.09 3.26 0.36 3.29 0.20
100 1.12 0.05 4.05 0.72 3.96 1.09
150 1.49 0.16 4.08 0.73 3.66 0.62
200 1.82 0.05 3.78 0.31 3.70 0.60
300 2.57 0.07 3.70 0.36 3.69 0.52
L. plantarum; Rods; 0.9–1.2�3–8 50 0.21 0.15 0.80 0.12 2.54 1.39
100 0.51 0.04 1.20 0.14 5.34 0.07
150 0.53 0.15 0.96 0.13 5.46 0.04
200 0.86 0.14 1.42 0.34 5.63 0.15
300 1.14 0.17 1.39 0.73 5.48 0.12
L. monocytogenes; Short rods; 0.4–0.5�0.5–2 50 0.30 0.07 1.72 0.47 3.01 0.10
100 0.42 0.03 2.24 0.69 3.36 0.58
150 0.54 0.04 2.58 0.45 4.12 0.08
200 0.64 0.01 2.78 0.31 4.25 0.01
300 0.86 0.01 3.48 0.49 4.72 0.25
S. aureus; Spheres; 0.8–1 / 50 3.12 0.54 2.31 1.09 3.45 0.34
100 4.16 0.53 3.40 1.24 4.35 0.30
150 4.47 0.53 4.29 1.22 4.83 0.72
200 4.74 0.65 4.20 0.53 4.54 0.05
300 5.49 0.30 4.52 0.72 4.49 0.70
*Data taken from Bergey (1986).
D. Garcıa et al. / Innovative Food Science and Emerging Technologies 6 (2005) 388–395 391
L. plantarum, L. monocytogenes and S. aureus after PEF
treatments at 25 kV/cm for 50, 100, 150, 200 and 300
exponential decay pulses in citrate–phosphate buffer of pH
7.0, pH 4.0 and after a subsequent holding for 2 h in
citrate–phosphate buffer of pH 4.0. The cell size and shape
of each bacterial strain (Bergey, 1986) are also included in
Table 1.
As shown in the table, under the same experimental
conditions, B. subtilis subsp. niger, L. plantarum and L.
monocytogenes showed a higher PEF resistance at pH
7.0 than at pH 4.0, independently of the treatment time
investigated. S. aureus was the most sensitive bacterial
strain at pH 7.0 showing a similar PEF resistance at
both pHs. L. monocytogenes and L. plantarum were the
most PEF resistant at both pH 7.0 and 4.0. Whereas
there were not significant differences between PEF
resistance of L. monocytogenes and L. plantarum shown
at pH 7.0 ( p <0.05), L. plantarum was substantially
more PEF resistant at pH 4.0 at any treatment time
investigated.
With regard to the influence of the treatment time, in
most cases, the longer the treatment time the greater the
number of inactivated cells that were achieved. The
maximum PEF inactivation was reached after 200–300
pulses at 25 kV/cm.
The sensitivity of PEF-treated cells to a subsequent
holding in the same treatment media has also been
evaluated. Whereas the maintenance for 2 h in the treatment
media at pH 7.0 did not significantly ( p<0.05) modify the
number of survivors detected after PEF treatments (data not
shown), the maintenance for 2 h of PEF-treated L.
monocytogenes and L. plantarum cells at pH 4.0 in the
same treatment medium significantly increased the degree
of inactivation ( p <0.05). L. plantarum, which had shown
the highest PEF resistance at pH 4.0, showed the highest
sensitivity to the subsequent holding at pH 4.0 being
inactivated more than 4 extra Log10 cycles of survivors to
the PEF treatment. A PEF treatment of 100 pulses or longer
at 25 kV/cm and a subsequent holding for 2 h in pH 4.0
allowed inactivating more than 5 Log10 cycles of L.
plantarum cells. In contrast, B. subtilis and S. aureus were
not significantly sensitive to the subsequent holding under
acid conditions ( p<0.05).
3.2. Gram-negative bacterial strains resistance after PEF
depending on the treatment medium pH
The PEF resistance of four Gram-negative bacterial
strains under the same experimental conditions was also
evaluated. Table 2 shows the number of Log10 cycles of
inactivation of E. coli, E. coli O157:H7, S. Senften-
berg775W and Y. enterocolitica after PEF treatments at
25 kV/cm for 50, 100, 150, 200 and 300 exponential
decay pulses in citrate–phosphate buffer of pH 7.0, pH
4.0 and after a subsequent holding for 2 h in citrate–
phosphate buffer of pH 4.0. The cell size and shape of
each bacterial strain (Bergey, 1986) are also indicated in
Table 2.
As shown in the table, the four Gram-negative bacteria
were significantly more PEF resistant at pH 4.0 than at
pH 7.0 ( p >0.05), independently of the treatment time
investigated. A PEF treatment of 200 pulses or longer at
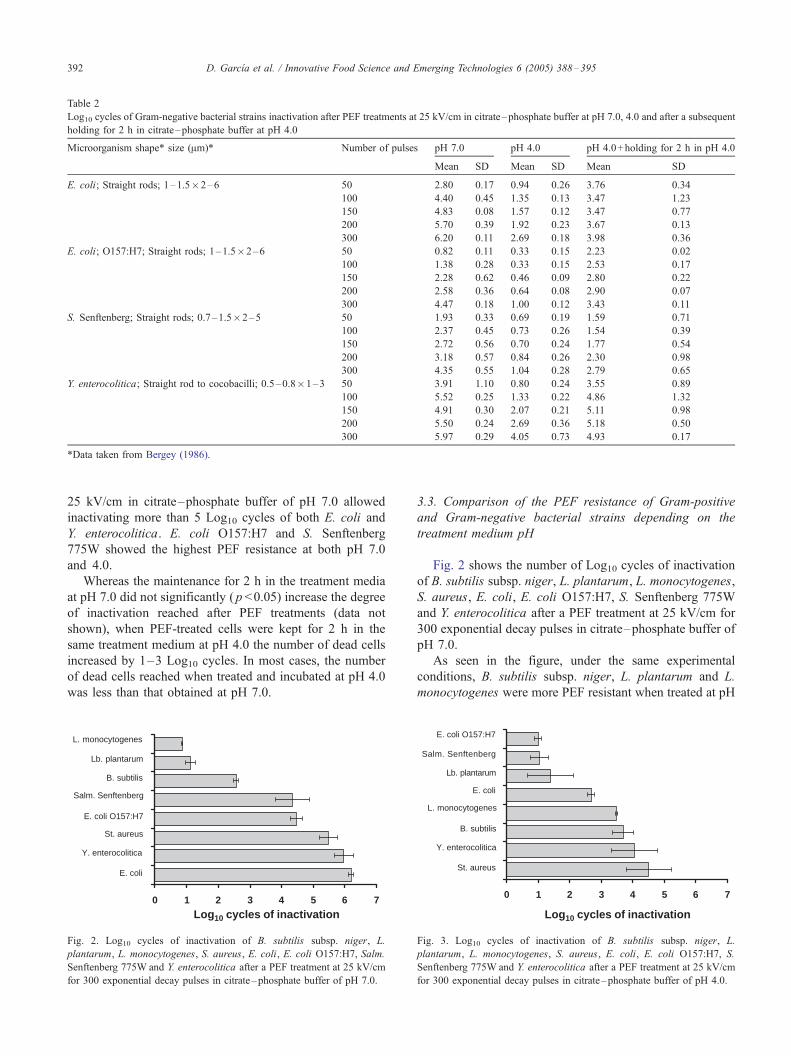
Table 2
Log10 cycles of Gram-negative bacterial strains inactivation after PEF treatments at 25 kV/cm in citrate–phosphate buffer at pH 7.0, 4.0 and after a subsequent
holding for 2 h in citrate–phosphate buffer at pH 4.0
Microorganism shape* size (Am)* Number of pulses pH 7.0 pH 4.0 pH 4.0+holding for 2 h in pH 4.0
Mean SD Mean SD Mean SD
E. coli; Straight rods; 1–1.5�2–6 50 2.80 0.17 0.94 0.26 3.76 0.34
100 4.40 0.45 1.35 0.13 3.47 1.23
150 4.83 0.08 1.57 0.12 3.47 0.77
200 5.70 0.39 1.92 0.23 3.67 0.13
300 6.20 0.11 2.69 0.18 3.98 0.36
E. coli; O157:H7; Straight rods; 1–1.5�2–6 50 0.82 0.11 0.33 0.15 2.23 0.02
100 1.38 0.28 0.33 0.15 2.53 0.17
150 2.28 0.62 0.46 0.09 2.80 0.22
200 2.58 0.36 0.64 0.08 2.90 0.07
300 4.47 0.18 1.00 0.12 3.43 0.11
S. Senftenberg; Straight rods; 0.7–1.5�2–5 50 1.93 0.33 0.69 0.19 1.59 0.71
100 2.37 0.45 0.73 0.26 1.54 0.39
150 2.72 0.56 0.70 0.24 1.77 0.54
200 3.18 0.57 0.84 0.26 2.30 0.98
300 4.35 0.55 1.04 0.28 2.79 0.65
Y. enterocolitica; Straight rod to cocobacilli; 0.5–0.8�1–3 50 3.91 1.10 0.80 0.24 3.55 0.89
100 5.52 0.25 1.33 0.22 4.86 1.32
150 4.91 0.30 2.07 0.21 5.11 0.98
200 5.50 0.24 2.69 0.36 5.18 0.50
300 5.97 0.29 4.05 0.73 4.93 0.17
*Data taken from Bergey (1986).
D. Garcıa et al. / Innovative Food Science and Emerging Technologies 6 (2005) 388–395392
25 kV/cm in citrate–phosphate buffer of pH 7.0 allowed
inactivating more than 5 Log10 cycles of both E. coli and
Y. enterocolitica. E. coli O157:H7 and S. Senftenberg
775W showed the highest PEF resistance at both pH 7.0
and 4.0.
Whereas the maintenance for 2 h in the treatment media
at pH 7.0 did not significantly ( p <0.05) increase the degree
of inactivation reached after PEF treatments (data not
shown), when PEF-treated cells were kept for 2 h in the
same treatment medium at pH 4.0 the number of dead cells
increased by 1–3 Log10 cycles. In most cases, the number
of dead cells reached when treated and incubated at pH 4.0
was less than that obtained at pH 7.0.
0 1 2 3 4 5 6 7
Log10 cycles of inactivation
E. coli
Y. enterocolitica
St. aureus
E. coli O157:H7
Salm. Senftenberg
B. subtilis
Lb. plantarum
L. monocytogenes
Fig. 2. Log10 cycles of inactivation of B. subtilis subsp. niger, L.
plantarum, L. monocytogenes, S. aureus, E. coli, E. coli O157:H7, Salm.
Senftenberg 775W and Y. enterocolitica after a PEF treatment at 25 kV/cm
for 300 exponential decay pulses in citrate–phosphate buffer of pH 7.0.
3.3. Comparison of the PEF resistance of Gram-positive
and Gram-negative bacterial strains depending on the
treatment medium pH
Fig. 2 shows the number of Log10 cycles of inactivation
of B. subtilis subsp. niger, L. plantarum, L. monocytogenes,
S. aureus, E. coli, E. coli O157:H7, S. Senftenberg 775W
and Y. enterocolitica after a PEF treatment at 25 kV/cm for
300 exponential decay pulses in citrate–phosphate buffer of
pH 7.0.
As seen in the figure, under the same experimental
conditions, B. subtilis subsp. niger, L. plantarum and L.
monocytogenes were more PEF resistant when treated at pH
0 1 2 3 4 5 6 7
St. aureus
Y. enterocolitica
B. subtilis
L. monocytogenes
E. coli
Lb. plantarum
Salm. Senftenberg
E. coli O157:H7
Log10 cycles of inactivation
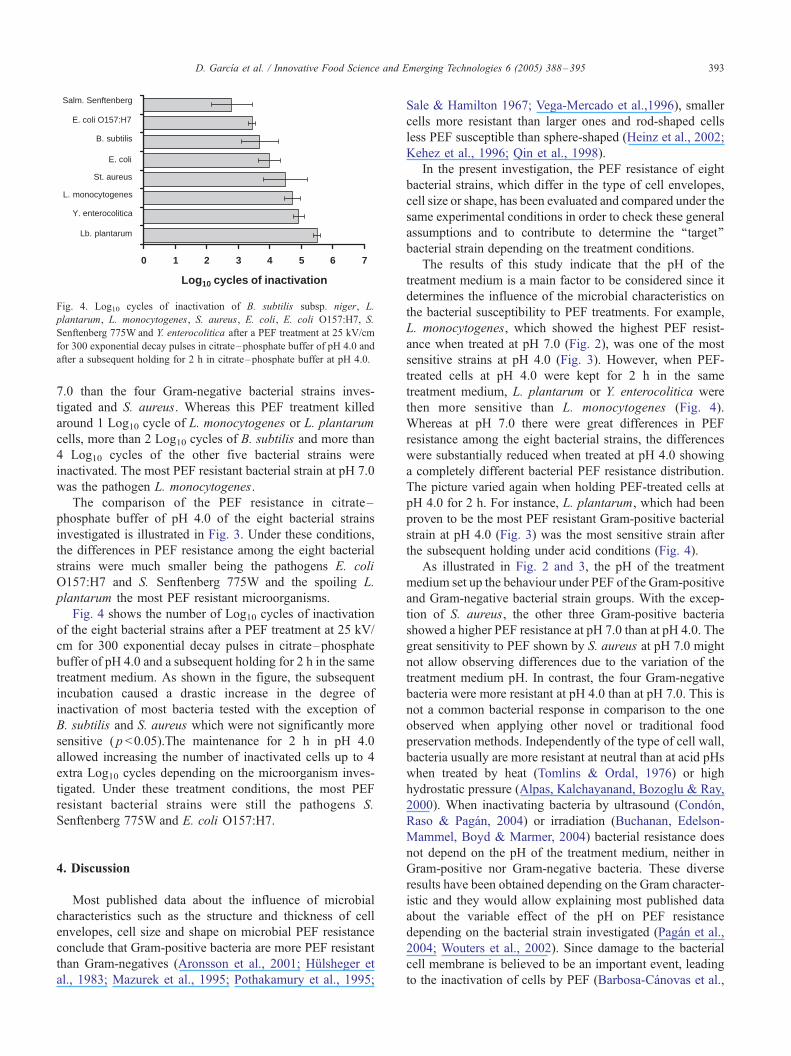
Fig. 3. Log10 cycles of inactivation of B. subtilis subsp. niger, L.
plantarum, L. monocytogenes, S. aureus, E. coli, E. coli O157:H7, S.
Senftenberg 775W and Y. enterocolitica after a PEF treatment at 25 kV/cm
for 300 exponential decay pulses in citrate–phosphate buffer of pH 4.0.
0 1 2 3 4 5 6 7
Lb. plantarum
Y. enterocolitica
St. aureus
E. coli
B. subtilis
E. coli O157:H7
Salm. Senftenberg
Log10 cycles of inactivation
L. monocytogenes
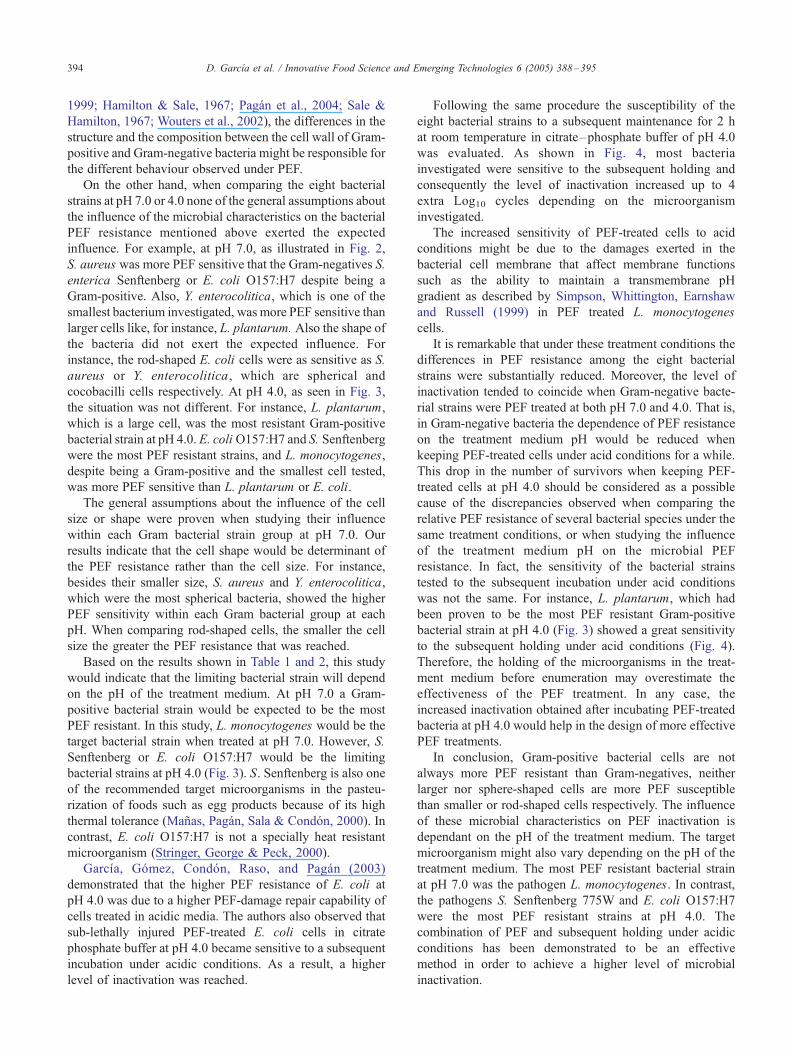
Fig. 4. Log10 cycles of inactivation of B. subtilis subsp. niger, L.
plantarum, L. monocytogenes, S. aureus, E. coli, E. coli O157:H7, S.
Senftenberg 775W and Y. enterocolitica after a PEF treatment at 25 kV/cm
for 300 exponential decay pulses in citrate–phosphate buffer of pH 4.0 and
after a subsequent holding for 2 h in citrate–phosphate buffer at pH 4.0.
D. Garcıa et al. / Innovative Food Science and Emerging Technologies 6 (2005) 388–395 393
7.0 than the four Gram-negative bacterial strains inves-
tigated and S. aureus. Whereas this PEF treatment killed
around 1 Log10 cycle of L. monocytogenes or L. plantarum
cells, more than 2 Log10 cycles of B. subtilis and more than
4 Log10 cycles of the other five bacterial strains were
inactivated. The most PEF resistant bacterial strain at pH 7.0
was the pathogen L. monocytogenes.
The comparison of the PEF resistance in citrate–
phosphate buffer of pH 4.0 of the eight bacterial strains
investigated is illustrated in Fig. 3. Under these conditions,
the differences in PEF resistance among the eight bacterial
strains were much smaller being the pathogens E. coli
O157:H7 and S. Senftenberg 775W and the spoiling L.
plantarum the most PEF resistant microorganisms.
Fig. 4 shows the number of Log10 cycles of inactivation
of the eight bacterial strains after a PEF treatment at 25 kV/
cm for 300 exponential decay pulses in citrate–phosphate
buffer of pH 4.0 and a subsequent holding for 2 h in the same
treatment medium. As shown in the figure, the subsequent
incubation caused a drastic increase in the degree of
inactivation of most bacteria tested with the exception of
B. subtilis and S. aureus which were not significantly more
sensitive ( p <0.05).The maintenance for 2 h in pH 4.0
allowed increasing the number of inactivated cells up to 4
extra Log10 cycles depending on the microorganism inves-
tigated. Under these treatment conditions, the most PEF
resistant bacterial strains were still the pathogens S.
Senftenberg 775W and E. coli O157:H7.
4. Discussion
Most published data about the influence of microbial
characteristics such as the structure and thickness of cell
envelopes, cell size and shape on microbial PEF resistance
conclude that Gram-positive bacteria are more PEF resistant
than Gram-negatives (Aronsson et al., 2001; Hulsheger et
al., 1983; Mazurek et al., 1995; Pothakamury et al., 1995;
Sale & Hamilton 1967; Vega-Mercado et al.,1996), smaller
cells more resistant than larger ones and rod-shaped cells
less PEF susceptible than sphere-shaped (Heinz et al., 2002;
Kehez et al., 1996; Qin et al., 1998).
In the present investigation, the PEF resistance of eight
bacterial strains, which differ in the type of cell envelopes,
cell size or shape, has been evaluated and compared under the
same experimental conditions in order to check these general
assumptions and to contribute to determine the ‘‘target’’
bacterial strain depending on the treatment conditions.
The results of this study indicate that the pH of the
treatment medium is a main factor to be considered since it
determines the influence of the microbial characteristics on
the bacterial susceptibility to PEF treatments. For example,
L. monocytogenes, which showed the highest PEF resist-
ance when treated at pH 7.0 (Fig. 2), was one of the most
sensitive strains at pH 4.0 (Fig. 3). However, when PEF-
treated cells at pH 4.0 were kept for 2 h in the same
treatment medium, L. plantarum or Y. enterocolitica were
then more sensitive than L. monocytogenes (Fig. 4).
Whereas at pH 7.0 there were great differences in PEF
resistance among the eight bacterial strains, the differences
were substantially reduced when treated at pH 4.0 showing
a completely different bacterial PEF resistance distribution.
The picture varied again when holding PEF-treated cells at
pH 4.0 for 2 h. For instance, L. plantarum, which had been
proven to be the most PEF resistant Gram-positive bacterial
strain at pH 4.0 (Fig. 3) was the most sensitive strain after
the subsequent holding under acid conditions (Fig. 4).
As illustrated in Fig. 2 and 3, the pH of the treatment
medium set up the behaviour under PEF of the Gram-positive
and Gram-negative bacterial strain groups. With the excep-
tion of S. aureus, the other three Gram-positive bacteria
showed a higher PEF resistance at pH 7.0 than at pH 4.0. The
great sensitivity to PEF shown by S. aureus at pH 7.0 might
not allow observing differences due to the variation of the
treatment medium pH. In contrast, the four Gram-negative
bacteria were more resistant at pH 4.0 than at pH 7.0. This is
not a common bacterial response in comparison to the one
observed when applying other novel or traditional food
preservation methods. Independently of the type of cell wall,
bacteria usually are more resistant at neutral than at acid pHs
when treated by heat (Tomlins & Ordal, 1976) or high
hydrostatic pressure (Alpas, Kalchayanand, Bozoglu & Ray,
2000). When inactivating bacteria by ultrasound (Condon,
Raso & Pagan, 2004) or irradiation (Buchanan, Edelson-
Mammel, Boyd & Marmer, 2004) bacterial resistance does
not depend on the pH of the treatment medium, neither in
Gram-positive nor Gram-negative bacteria. These diverse
results have been obtained depending on the Gram character-
istic and they would allow explaining most published data
about the variable effect of the pH on PEF resistance
depending on the bacterial strain investigated (Pagan et al.,
2004; Wouters et al., 2002). Since damage to the bacterial
cell membrane is believed to be an important event, leading
to the inactivation of cells by PEF (Barbosa-Canovas et al.,
D. Garcıa et al. / Innovative Food Science and Emerging Technologies 6 (2005) 388–395394
1999; Hamilton & Sale, 1967; Pagan et al., 2004; Sale &
Hamilton, 1967; Wouters et al., 2002), the differences in the
structure and the composition between the cell wall of Gram-
positive and Gram-negative bacteria might be responsible for
the different behaviour observed under PEF.
On the other hand, when comparing the eight bacterial
strains at pH 7.0 or 4.0 none of the general assumptions about
the influence of the microbial characteristics on the bacterial
PEF resistance mentioned above exerted the expected
influence. For example, at pH 7.0, as illustrated in Fig. 2,
S. aureus was more PEF sensitive that the Gram-negatives S.
enterica Senftenberg or E. coli O157:H7 despite being a
Gram-positive. Also, Y. enterocolitica, which is one of the
smallest bacterium investigated, was more PEF sensitive than
larger cells like, for instance, L. plantarum. Also the shape of
the bacteria did not exert the expected influence. For
instance, the rod-shaped E. coli cells were as sensitive as S.
aureus or Y. enterocolitica, which are spherical and
cocobacilli cells respectively. At pH 4.0, as seen in Fig. 3,
the situation was not different. For instance, L. plantarum,
which is a large cell, was the most resistant Gram-positive
bacterial strain at pH 4.0. E. coli O157:H7 and S. Senftenberg
were the most PEF resistant strains, and L. monocytogenes,
despite being a Gram-positive and the smallest cell tested,
was more PEF sensitive than L. plantarum or E. coli.
The general assumptions about the influence of the cell
size or shape were proven when studying their influence
within each Gram bacterial strain group at pH 7.0. Our
results indicate that the cell shape would be determinant of
the PEF resistance rather than the cell size. For instance,
besides their smaller size, S. aureus and Y. enterocolitica,
which were the most spherical bacteria, showed the higher
PEF sensitivity within each Gram bacterial group at each
pH. When comparing rod-shaped cells, the smaller the cell
size the greater the PEF resistance that was reached.
Based on the results shown in Table 1 and 2, this study
would indicate that the limiting bacterial strain will depend
on the pH of the treatment medium. At pH 7.0 a Gram-
positive bacterial strain would be expected to be the most
PEF resistant. In this study, L. monocytogenes would be the
target bacterial strain when treated at pH 7.0. However, S.
Senftenberg or E. coli O157:H7 would be the limiting
bacterial strains at pH 4.0 (Fig. 3). S. Senftenberg is also one
of the recommended target microorganisms in the pasteu-
rization of foods such as egg products because of its high
thermal tolerance (Manas, Pagan, Sala & Condon, 2000). In
contrast, E. coli O157:H7 is not a specially heat resistant
microorganism (Stringer, George & Peck, 2000).
Garcıa, Gomez, Condon, Raso, and Pagan (2003)
demonstrated that the higher PEF resistance of E. coli at
pH 4.0 was due to a higher PEF-damage repair capability of
cells treated in acidic media. The authors also observed that
sub-lethally injured PEF-treated E. coli cells in citrate
phosphate buffer at pH 4.0 became sensitive to a subsequent
incubation under acidic conditions. As a result, a higher
level of inactivation was reached.
Following the same procedure the susceptibility of the
eight bacterial strains to a subsequent maintenance for 2 h
at room temperature in citrate–phosphate buffer of pH 4.0
was evaluated. As shown in Fig. 4, most bacteria
investigated were sensitive to the subsequent holding and
consequently the level of inactivation increased up to 4
extra Log10 cycles depending on the microorganism
investigated.
The increased sensitivity of PEF-treated cells to acid
conditions might be due to the damages exerted in the
bacterial cell membrane that affect membrane functions
such as the ability to maintain a transmembrane pH
gradient as described by Simpson, Whittington, Earnshaw
and Russell (1999) in PEF treated L. monocytogenes
cells.
It is remarkable that under these treatment conditions the
differences in PEF resistance among the eight bacterial
strains were substantially reduced. Moreover, the level of
inactivation tended to coincide when Gram-negative bacte-
rial strains were PEF treated at both pH 7.0 and 4.0. That is,
in Gram-negative bacteria the dependence of PEF resistance
on the treatment medium pH would be reduced when
keeping PEF-treated cells under acid conditions for a while.
This drop in the number of survivors when keeping PEF-
treated cells at pH 4.0 should be considered as a possible
cause of the discrepancies observed when comparing the
relative PEF resistance of several bacterial species under the
same treatment conditions, or when studying the influence
of the treatment medium pH on the microbial PEF
resistance. In fact, the sensitivity of the bacterial strains
tested to the subsequent incubation under acid conditions
was not the same. For instance, L. plantarum, which had
been proven to be the most PEF resistant Gram-positive
bacterial strain at pH 4.0 (Fig. 3) showed a great sensitivity
to the subsequent holding under acid conditions (Fig. 4).
Therefore, the holding of the microorganisms in the treat-
ment medium before enumeration may overestimate the
effectiveness of the PEF treatment. In any case, the
increased inactivation obtained after incubating PEF-treated
bacteria at pH 4.0 would help in the design of more effective
PEF treatments.
In conclusion, Gram-positive bacterial cells are not
always more PEF resistant than Gram-negatives, neither
larger nor sphere-shaped cells are more PEF susceptible
than smaller or rod-shaped cells respectively. The influence
of these microbial characteristics on PEF inactivation is
dependant on the pH of the treatment medium. The target
microorganism might also vary depending on the pH of the
treatment medium. The most PEF resistant bacterial strain
at pH 7.0 was the pathogen L. monocytogenes. In contrast,
the pathogens S. Senftenberg 775W and E. coli O157:H7
were the most PEF resistant strains at pH 4.0. The
combination of PEF and subsequent holding under acidic
conditions has been demonstrated to be an effective
method in order to achieve a higher level of microbial
inactivation.
D. Garcıa et al. / Innovative Food Science and Emerging Technologies 6 (2005) 388–395 395
Acknowledgements
This work was supported by CICYT (Project AGL
2000-1222) and Ministerio Espanol de Educacion y
Ciencia, which provided D. Garcıa and N. Gomez with
a grant to carry out this investigation. Our thanks to Mrs.
I. Dumall for her collaboration in the English correction
of this work.
References
Alpas, H., Kalchayanand, N., Bozoglu, F., & Ray, B. (2000). Interactions of
high hydrostatic pressure, pressurization temperature and pH on death
and injury of pressure-resistant and pressure-sensitive strains of
foodborne pathogens. International Journal of Food Microbiology, 60,
33–42.
Alvarez, I., Manas, P., Condon, S., & Raso, J. (2003). Resistance variation
of Salmonella enterica serovars to pulsed electric fields treatment.
Journal of Food Science, 68, 2316–2320.
Alvarez, I., Pagan, R., Condon, S., & Raso. (2002). Environmental factors
influencing the inactivation of Listeria monocytogenes by pulsed
electric fields. Letters in Applied Microbiology, 35, 489–493.
Alvarez, I., Raso, J., Palop, A., & Sala, F. J. (2000). Influence of
different factors on the inactivation of Salmonella Senftenberg by
pulsed electric fields. International Journal of Food Microbiology,
55, 143–146.
Aronsson, K., Lindgren, M., Johansson, B. R., & Ronner, U. (2001).
Inactivation of microorganisms using pulsed electric fields: The
influence of process parameters on Escherichia coli, Listeria
innocua, Leuconostoc mesenteroides and Saccharomyces cerevi-
siae. Innovative Food Science and Emerging Technologies, 2,
41–54.
Barbosa-Canovas, G. V., Gongora, M. M., Pothakamury, U. R., &
Swanson, B. G. (1999). Preservation of foods with pulsed electric
fields. San Diego’ Academic Press.
Bergey. (1986). Manual of systematic bacteriology. Baltimore’ Williams
and Wilkins.
Buchanan, R. L., Edelson-Mammel, S. G., Boyd, G., & Marmer, B. S.
(2004). Influence of acidulant identity on the effects of pH and acid
resistance on the radiation resistance of Escherichia coli O157:H7.
Food Microbiology, 21, 51–57.
Chapman, P. A., Siddons, C. A., Wright, D. J., Norman, P., Fox, J., & Crick,
E. (1993). Cattle as a possible source of verocytotoxin-producing
Escherichia coli O157 infections in man. Epidemiology and Infection,
111, 439–447.
Condon, S., Palop, A., Raso, J., & Sala, F. J. (1996). Influence of the
incubation temperature after heat treatment upon the estimated heat
resistance values of spores of Bacillus subtilis. Letters in Applied
Microbiology, 22, 149–152.
Condon, S., Raso, J., & Pagan, R. (2004). Microbial inactivation by
ultrasound. In V. Barbosa-Canovas, S. Tapia, & P. Cano (Eds.), Novel
food processing technology (pp. 423–442). New York’ Marcel Dekker.
Dawson, R. M. C., Elliot, D. C., Elliot, W. H., & Jones, K. M. (1974). Data
for biochemical research. Oxford’ Oxford at Clarendon Press.
Garcıa, D., Gomez, N., Condon, S., Raso, J., & Pagan, R. (2003). Pulsed
electric fields cause sublethal injury in Escherichia coli. Letters in
Applied Microbiology, 36, 140–144.
Hamilton, W. A., & Sale, A. J. H. (1967). Effects of high electric fields on
microorganisms: II. Killing of bacteria and yeasts. Biochimica and
Biophysica Acta, 148, 789–800.
Heinz, V., Alvarez, I., Angersbach, A., & Knorr, D. (2002). Preservation of
liquid foods by high intensity pulsed electric fields-basic concepts for
process design. Trends in Food Science and Technology, 12, 103–111.
Hulsheger, H., Potel, J., & Niemann, E. G. (1981). Killing of bacteria with
electric pulses of high field strength. Radiation and Environmental
Biophysics, 20, 53–65.
Hulsheger, H., Potel, J., & Niemann, E. G. (1983). Electric field effects on
bacteria and yeast cells. Radiation and Environmental Biophysics, 22,
149–162.
Kehez, M. M., Savic, P., & Johnson, B. F. (1996). Contribution to the
biophysics of the lethal effects of electric field on microorganisms.
Biochimica and Biophysica Acta, 1278, 79–88.
Lado, B. H., &Yousef, A. E. (2003). Selection and identification of a Listeria
monocytogenes target strain for pulsed electric field process optimiza-
tion. Applied and Environmental Microbiology, 69, 2223–2229.
MacGregor, S. J., Farish, O., Fouracre, R., Rowan, N. J., & Anderson, J. G.
(2000). Inactivation of pathogenic and spoilage microorganisms in a test
liquid using pulsed electric fields. IEEE Transactions on Plasma
Science, 28, 144–149.
Manas, P., Pagan, R., Sala, F. J., & Condon, S. (2000). Inactivation of S.
Typhimurium, S. Enteritidis and S. Senftenberg by ultrasonic waves
under pressure. Journal of Food Protection, 63, 451–456.
Mazurek, B., Lubicki, P., & Staroniewicz, Z. (1995). Effect of short HV
pulses on bacteria and fungi. IEEE Transactions on Dielectrics and
Electrical Insulation, 2, 418–425.
Pagan, R., Condon, S., & Raso, J. (2004). Microbial inactivation by pulsed
electric fields. In V. Barbosa-Canovas, S. Tapia, & P. Cano (Eds.), Novel
food processing technology (pp. 45–68). New York’ Marcel Dekker.
Pothakamury, U. R., Monsalve-Gonzalez, A., Barbosa-Canovas, G. V., &
Swanson, B. G. (1995). Inactivation of Escherichia coli and Staph-
ylococcus aureus in model foods by pulsed electric fields. Food
Research International, 28, 167–171.
Qin, B. -L., Barbosa-Canovas, G. V., Swanson, B. G., Pedrow, P. D., &
Olsen, R. G. (1998). Inactivating microorganisms using a pulsed electric
field continuous treatment system. IEEE Transactions on Industrial
Applications, 34, 43–50.
Raso, J., Alvarez, I., Condon, S., & Sala, F. J. (2000). Predicting
inactivation of Salmonella Senftenberg by pulsed electric fields.
Innovative Food Science and Emerging Technologies, 1, 21–29.
Sale, A. J. H., & Hamilton, W. A. (1967). Effects of high electric fields on
microorganisms: I. Killing of bacteria and yeast. Biochimica and
Biophysica Acta, 148, 781–788.
Simpson, R. K., Whittington, R., Earnshaw, R. G., & Russell, N. J. (1999).
Pulsed high electric field causes all or nothing membrane damage in
Listeria monocytogenes and Salmonella typhimurium, but membrane
H+-ATPase is not a primary target. International Journal of Food
Microbiology, 48, 1–10.
Stringer, S. C., George, S. M., & Peck, M. W. (2000). Thermal inactivation
of Escherichia coli O157:H7. Journal of Applied Microbiology
Symposium Supplement, 88, 79S–89S.
Tomlins, R. I., & Ordal, Z. J. (1976). Thermal injury and inactivation in
vegetative bacteria. In F. A. Skinner, & W. B. Hugo (Eds.), Inhibition
and inactivation of vegetative microbes (pp. 153–191). London’
Academic Press.
Vega-Mercado, H., Martın-Belloso, O., Chang, F. -J., Barbosa-Canovas, G.
V., & Swanson, B. G. (1996). Inactivation of Escherichia coli and
Bacillus subtilis suspended in pea soup using pulsed electric field.
Journal of Food Processing and Preservation, 20, 511–514.
Wouters, P. C., Alvarez, I., & Raso, J. (2002). Critical factors determining
inactivation kinetics by pulsed electric field food processing. Trends in
Food Science and Technology, 12, 112–121.
Wouters, P. C., Bos, A. P., & Ueckert, J. (2001). Membrane permeabiliza-
tion in relation to inactivation kinetics of Lactobacillus species due to
pulsed electric fields. Applied and Environmental Microbiology, 67,
3092–3101.
Wouters, P. C., & Smelt, J. P. P. M. (1997). Inactivation of microorganisms
with pulsed electric fields: Potencial for food preservation. Food
Biotechnology, 11, 193–229.
Zimmermann, U., Pilwat, G., & Riemann, F. (1974). Dielectric breakdown
of cell membranes. Biophysical Journal, 14, 881–899.


