Embed Size (px)
Citation preview
Hotel, Tourism and Leisure
TM
Bali Hotel & BrandedResidences UpdateNovember 2013
HOTEL & BRANDED RESIDENCES UPDATE
Interesting times ahead forBali hoteliers: remain strongon rates and tailor newproduct development formarket gaps.
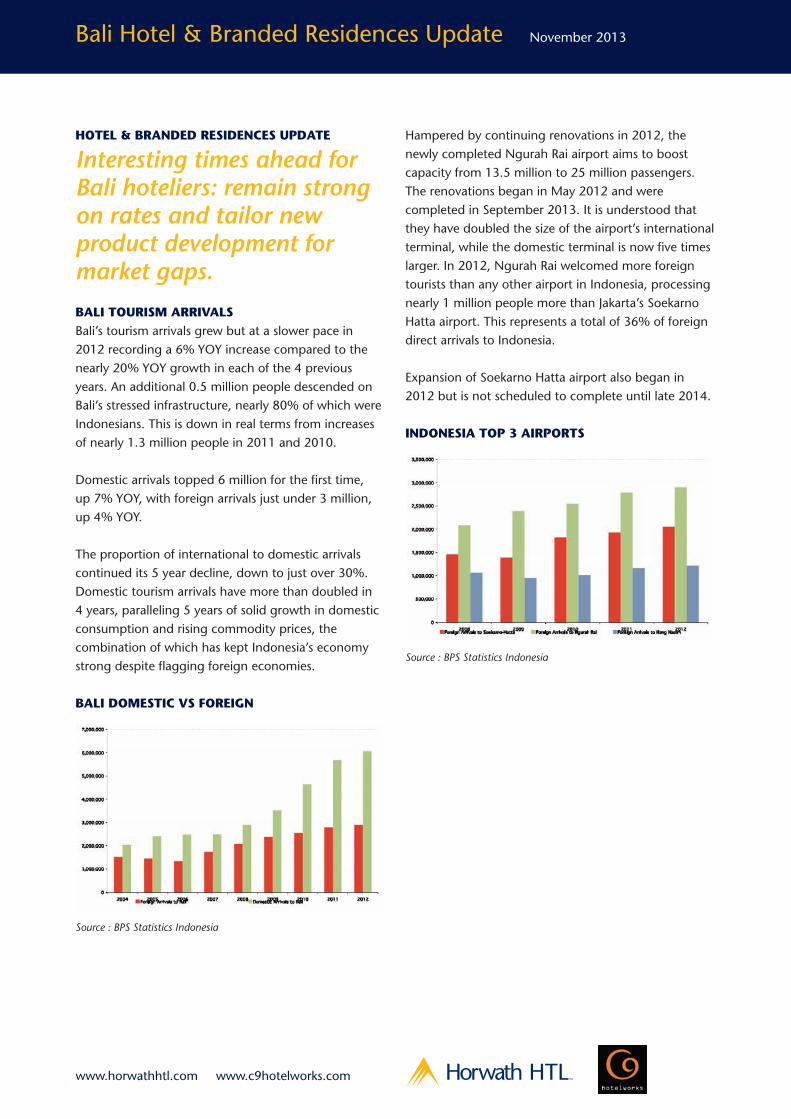
BALI TOURISM ARRIVALSBali’s tourism arrivals grew but at a slower pace in2012 recording a 6% YOY increase compared to thenearly 20% YOY growth in each of the 4 previousyears. An additional 0.5 million people descended onBali’s stressed infrastructure, nearly 80% of which wereIndonesians. This is down in real terms from increasesof nearly 1.3 million people in 2011 and 2010.
Domestic arrivals topped 6 million for the first time,up 7% YOY, with foreign arrivals just under 3 million,up 4% YOY.
The proportion of international to domestic arrivalscontinued its 5 year decline, down to just over 30%.Domestic tourism arrivals have more than doubled in4 years, paralleling 5 years of solid growth in domesticconsumption and rising commodity prices, thecombination of which has kept Indonesia’s economystrong despite flagging foreign economies.
BALI DOMESTIC VS FOREIGN
Source : BPS Statistics Indonesia
Bali Hotel & Branded Residences Update November 2013
TMwww.horwathhtl.com www.c9hotelworks.com
Hampered by continuing renovations in 2012, thenewly completed Ngurah Rai airport aims to boostcapacity from 13.5 million to 25 million passengers.The renovations began in May 2012 and werecompleted in September 2013. It is understood thatthey have doubled the size of the airport’s internationalterminal, while the domestic terminal is now five timeslarger. In 2012, Ngurah Rai welcomed more foreigntourists than any other airport in Indonesia, processingnearly 1 million people more than Jakarta’s SoekarnoHatta airport. This represents a total of 36% of foreigndirect arrivals to Indonesia.
Expansion of Soekarno Hatta airport also began in2012 but is not scheduled to complete until late 2014.
INDONESIA TOP 3 AIRPORTS
Source : BPS Statistics Indonesia

PHUKET VS BALI: THE BATTLE FOR REGIONALRESORT SUPREMACY!The battle has taken an interesting turn YTD June 2013:the foreign arrivals’ gap between Phuket and Balinarrowed further in 2012 and was reversed for the firsttime YTD June 2013, with Phuket’s remarkable 5 yeargrowth (ignoring the 2009 hiccup caused by airportclosures and demonstrations) continuing.
As seen below, YTD June 2013, Phuket foreign arrivalsnumbers inched ahead of Bali by around 80,000passengers, up another 30% YOY. The encouragingnews is, however, that total tourism numbers to bothdestinations has increased an impressive 0.5 millionpeople in 12 months.
FOREIGN BALI VS PHUKET
Source : BPS Statistics Indonesia
It is believed that Bali’s tourism growth is impacted bythe government’s slow response to infrastructurefailures: traffic jams, garbage disposal, water, electricityand safety matters are a major concern for visitors,especially long haul Europeans.
In addition, as domestic incomes increase and theLCC routes proliferate, there is a possibility thatdomestic tourists will go further afield than Bali toSingapore, Bangkok and even Phuket. Data fromthe Transportation Ministry shows the number of airpassengers flying with LCCs reached almost 35 millionin 2012, representing 47% market share which ispredicted to reach 55% over the next few years.
NATIONALITY MIX
Source : BPS Statistics Indonesia
Bali Hotel & Branded Residences Update November 2013
TMwww.horwathhtl.com www.c9hotelworks.com
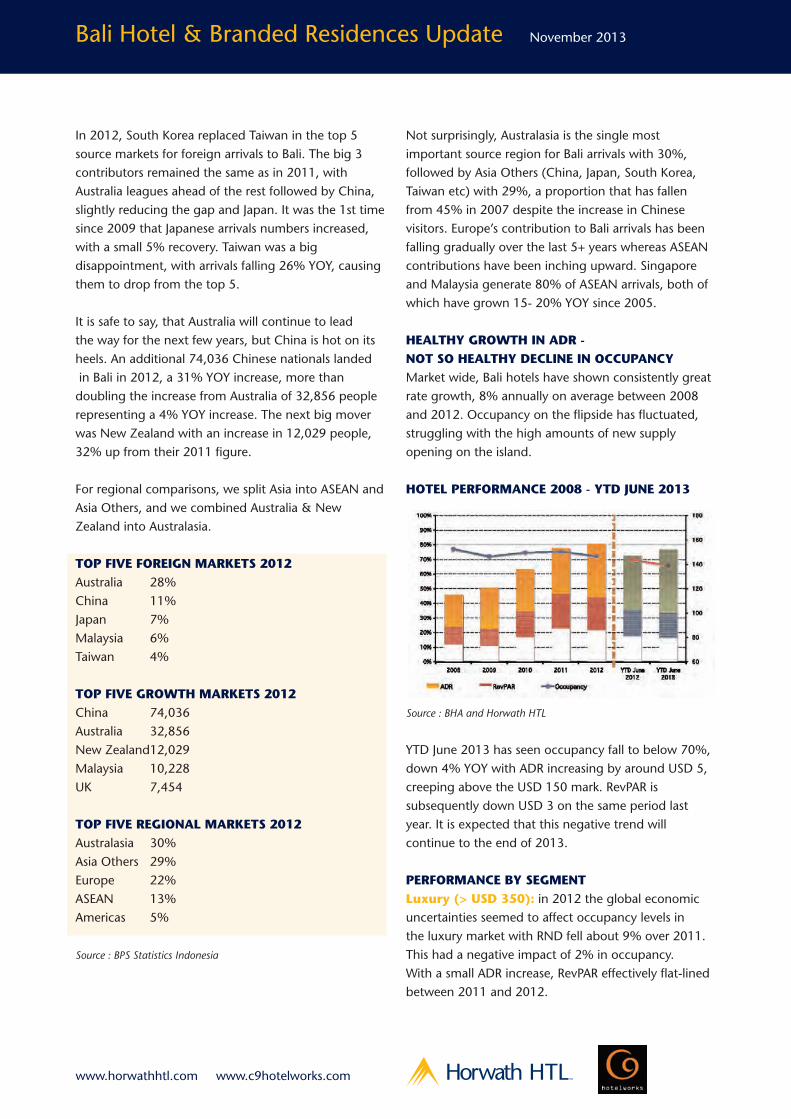
In 2012, South Korea replaced Taiwan in the top 5source markets for foreign arrivals to Bali. The big 3contributors remained the same as in 2011, withAustralia leagues ahead of the rest followed by China,slightly reducing the gap and Japan. It was the 1st timesince 2009 that Japanese arrivals numbers increased,with a small 5% recovery. Taiwan was a bigdisappointment, with arrivals falling 26% YOY, causingthem to drop from the top 5.
It is safe to say, that Australia will continue to leadthe way for the next few years, but China is hot on itsheels. An additional 74,036 Chinese nationals landedin Bali in 2012, a 31% YOY increase, more thandoubling the increase from Australia of 32,856 peoplerepresenting a 4% YOY increase. The next big moverwas New Zealand with an increase in 12,029 people,32% up from their 2011 figure.
For regional comparisons, we split Asia into ASEAN andAsia Others, and we combined Australia & NewZealand into Australasia.
TOP FIVE FOREIGN MARKETS 2012Australia 28%China 11%Japan 7%Malaysia 6%Taiwan 4%
TOP FIVE GROWTH MARKETS 2012China 74,036Australia 32,856New Zealand12,029Malaysia 10,228UK 7,454
TOP FIVE REGIONAL MARKETS 2012Australasia 30%Asia Others 29%Europe 22%ASEAN 13%Americas 5%
Source : BPS Statistics Indonesia
Not surprisingly, Australasia is the single mostimportant source region for Bali arrivals with 30%,followed by Asia Others (China, Japan, South Korea,Taiwan etc) with 29%, a proportion that has fallenfrom 45% in 2007 despite the increase in Chinesevisitors. Europe’s contribution to Bali arrivals has beenfalling gradually over the last 5+ years whereas ASEANcontributions have been inching upward. Singaporeand Malaysia generate 80% of ASEAN arrivals, both ofwhich have grown 15- 20% YOY since 2005.
HEALTHY GROWTH IN ADR -NOT SO HEALTHY DECLINE IN OCCUPANCYMarket wide, Bali hotels have shown consistently greatrate growth, 8% annually on average between 2008and 2012. Occupancy on the flipside has fluctuated,struggling with the high amounts of new supplyopening on the island.
HOTEL PERFORMANCE 2008 - YTD JUNE 2013
Source : BHA and Horwath HTL
YTD June 2013 has seen occupancy fall to below 70%,down 4% YOY with ADR increasing by around USD 5,creeping above the USD 150 mark. RevPAR issubsequently down USD 3 on the same period lastyear. It is expected that this negative trend willcontinue to the end of 2013.
PERFORMANCE BY SEGMENTLuxury (> USD 350): in 2012 the global economicuncertainties seemed to affect occupancy levels inthe luxury market with RND fell about 9% over 2011.This had a negative impact of 2% in occupancy.With a small ADR increase, RevPAR effectively flat-linedbetween 2011 and 2012.
Bali Hotel & Branded Residences Update November 2013
TMwww.horwathhtl.com www.c9hotelworks.com
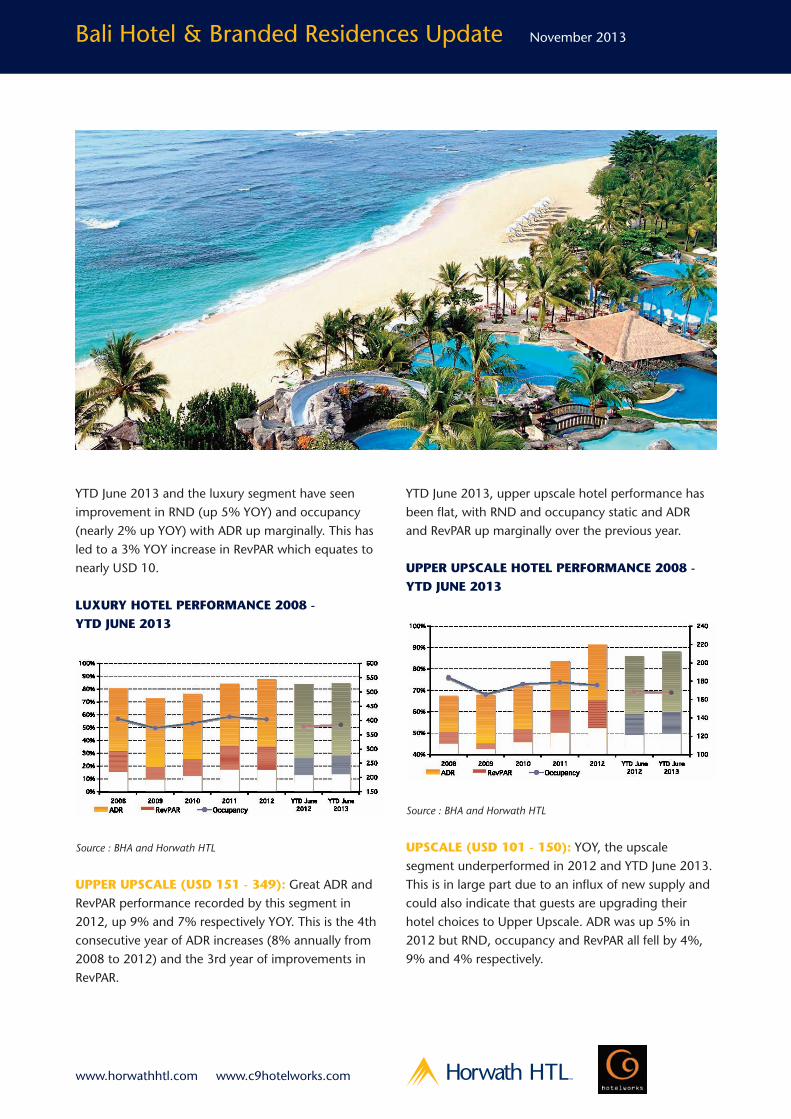
YTD June 2013 and the luxury segment have seenimprovement in RND (up 5% YOY) and occupancy(nearly 2% up YOY) with ADR up marginally. This hasled to a 3% YOY increase in RevPAR which equates tonearly USD 10.
LUXURY HOTEL PERFORMANCE 2008 -YTD JUNE 2013
Source : BHA and Horwath HTL
UPPER UPSCALE (USD 151 - 349): Great ADR andRevPAR performance recorded by this segment in2012, up 9% and 7% respectively YOY. This is the 4thconsecutive year of ADR increases (8% annually from2008 to 2012) and the 3rd year of improvements inRevPAR.
YTD June 2013, upper upscale hotel performance hasbeen flat, with RND and occupancy static and ADRand RevPAR up marginally over the previous year.
UPPER UPSCALE HOTEL PERFORMANCE 2008 -YTD JUNE 2013
Source : BHA and Horwath HTL
UPSCALE (USD 101 - 150): YOY, the upscalesegment underperformed in 2012 and YTD June 2013.This is in large part due to an influx of new supply andcould also indicate that guests are upgrading theirhotel choices to Upper Upscale. ADR was up 5% in2012 but RND, occupancy and RevPAR all fell by 4%,9% and 4% respectively.
Bali Hotel & Branded Residences Update November 2013
TMwww.horwathhtl.com www.c9hotelworks.com
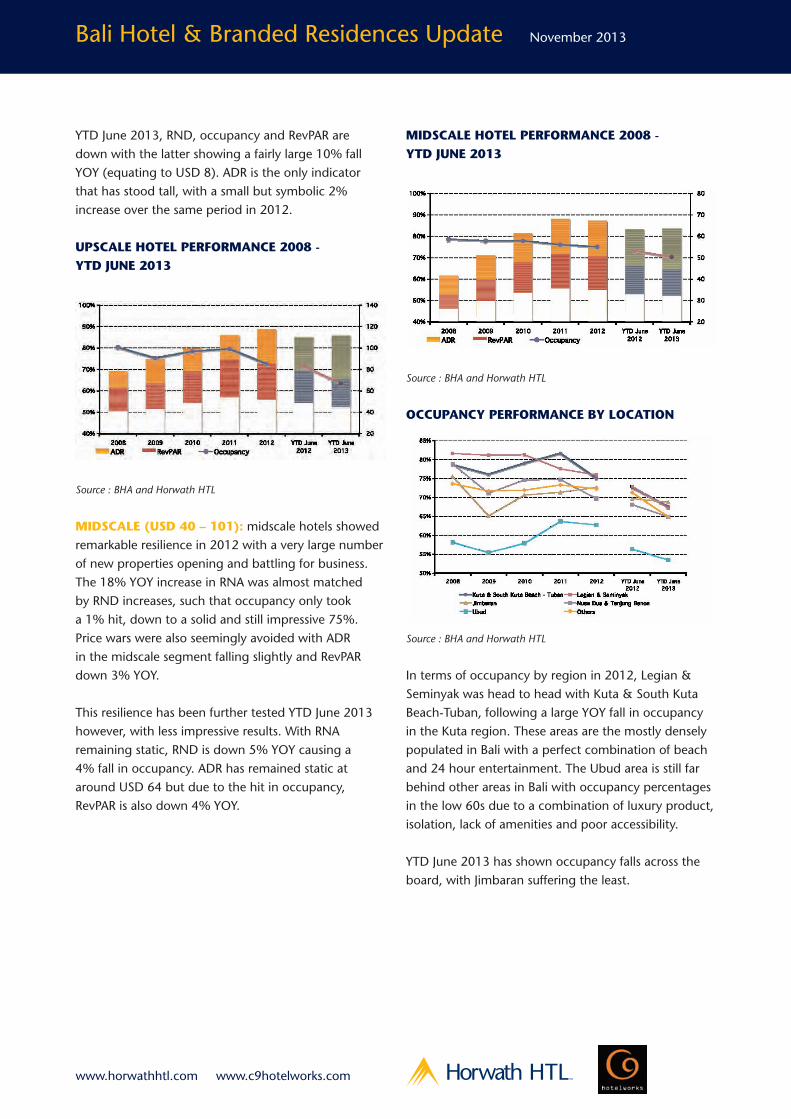
YTD June 2013, RND, occupancy and RevPAR aredown with the latter showing a fairly large 10% fallYOY (equating to USD 8). ADR is the only indicatorthat has stood tall, with a small but symbolic 2%increase over the same period in 2012.
UPSCALE HOTEL PERFORMANCE 2008 -YTD JUNE 2013
Source : BHA and Horwath HTL
MIDSCALE (USD 40 – 101): midscale hotels showedremarkable resilience in 2012 with a very large numberof new properties opening and battling for business.The 18% YOY increase in RNA was almost matchedby RND increases, such that occupancy only tooka 1% hit, down to a solid and still impressive 75%.Price wars were also seemingly avoided with ADRin the midscale segment falling slightly and RevPARdown 3% YOY.
This resilience has been further tested YTD June 2013however, with less impressive results. With RNAremaining static, RND is down 5% YOY causing a4% fall in occupancy. ADR has remained static ataround USD 64 but due to the hit in occupancy,RevPAR is also down 4% YOY.
MIDSCALE HOTEL PERFORMANCE 2008 -YTD JUNE 2013
Source : BHA and Horwath HTL
OCCUPANCY PERFORMANCE BY LOCATION
Source : BHA and Horwath HTL
In terms of occupancy by region in 2012, Legian &Seminyak was head to head with Kuta & South KutaBeach-Tuban, following a large YOY fall in occupancyin the Kuta region. These areas are the mostly denselypopulated in Bali with a perfect combination of beachand 24 hour entertainment. The Ubud area is still farbehind other areas in Bali with occupancy percentagesin the low 60s due to a combination of luxury product,isolation, lack of amenities and poor accessibility.
YTD June 2013 has shown occupancy falls across theboard, with Jimbaran suffering the least.
Bali Hotel & Branded Residences Update November 2013
TMwww.horwathhtl.com www.c9hotelworks.com
ADR PERFORMANCE BY LOCATION
Source : BHA and Horwath HTL
Not surprisingly with their high proportion of luxuryproduct, Jimbaran and Ubud are leading the pack forADR performance by region with average ADR ofaround USD 300, YTD June 2013. Rates have beenconsistently growing in these markets since 2009.Legian/Seminyak and Nusa Dua/Tanjung Benoa arearound USD 100 lower and the remaining Kuta/Othersa further USD 50 lower. YTD June 2013,Legian/Seminyak is up, recovering ground from adecline in ADR in 2012 over 2011. Otherwise, ADRgrowth has been quite flat YTD June 2013 across theboard. Rates increase as the mass market orientation ofthe region reduces. Candi Dasa, Sanur, and Tabanan allfall under Others and are in a developing stage with alack of international brand options.
OUTLOOK FOR 2013/14In 2012 Indonesia’s central bureau of statistics (BPS)recorded more than 24,000 hotel rooms were availablein Bali, up 2,000 in just 12 month. A further, and muchmore significant, 6,000 new rooms are expected toenter the market in 2013 (around 4,000 of which havealready opened this year). If this eventuates Baliinventory will top 30,000 rooms.
The following table shows projected inventoryincreases to 2016 based on rumoured developments.
SUPPLY GROWTH 2012-2016
Source : BHA and Horwath HTL
Clearly investors still believe that Bali has growthpotential and the government is coming to the party
Bali Hotel & Branded Residences Update November 2013
TMwww.horwathhtl.com www.c9hotelworks.com
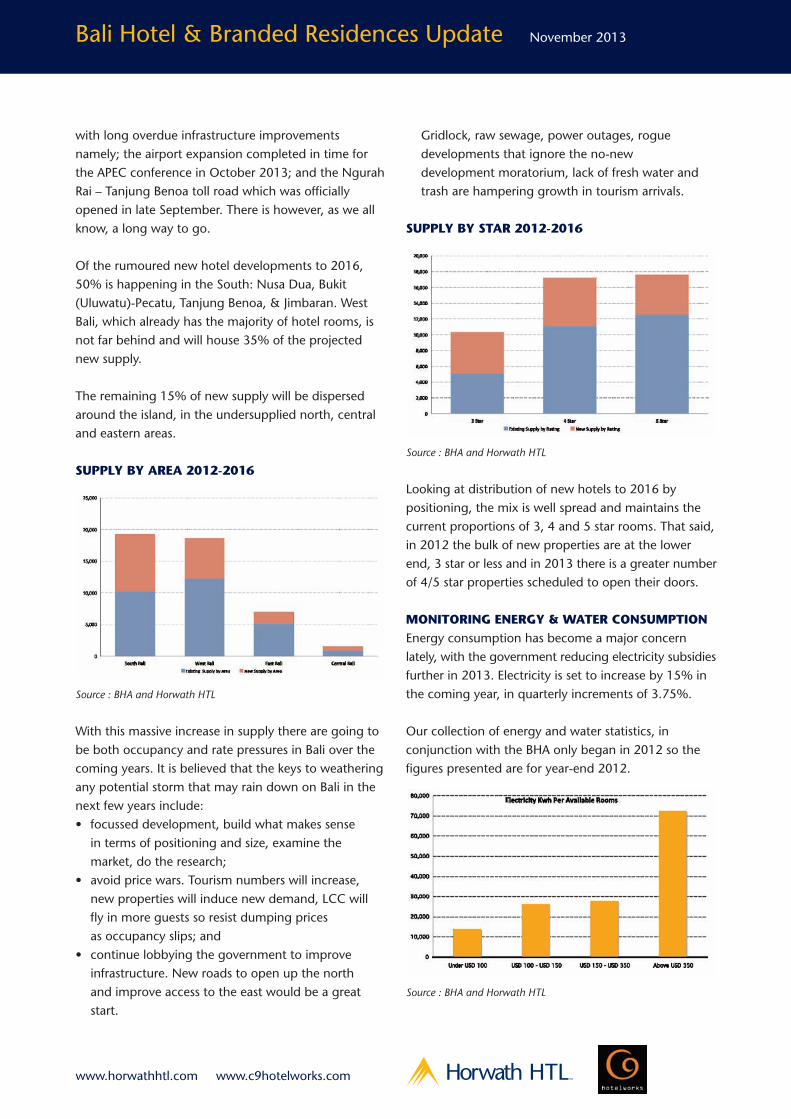
with long overdue infrastructure improvementsnamely; the airport expansion completed in time forthe APEC conference in October 2013; and the NgurahRai – Tanjung Benoa toll road which was officiallyopened in late September. There is however, as we allknow, a long way to go.
Of the rumoured new hotel developments to 2016,50% is happening in the South: Nusa Dua, Bukit(Uluwatu)-Pecatu, Tanjung Benoa, & Jimbaran. WestBali, which already has the majority of hotel rooms, isnot far behind and will house 35% of the projectednew supply.
The remaining 15% of new supply will be dispersedaround the island, in the undersupplied north, centraland eastern areas.
SUPPLY BY AREA 2012-2016
Source : BHA and Horwath HTL
With this massive increase in supply there are going tobe both occupancy and rate pressures in Bali over thecoming years. It is believed that the keys to weatheringany potential storm that may rain down on Bali in thenext few years include:• focussed development, build what makes sensein terms of positioning and size, examine themarket, do the research;
• avoid price wars. Tourism numbers will increase,new properties will induce new demand, LCC willfly in more guests so resist dumping pricesas occupancy slips; and
• continue lobbying the government to improveinfrastructure. New roads to open up the northand improve access to the east would be a greatstart.
Gridlock, raw sewage, power outages, roguedevelopments that ignore the no-newdevelopment moratorium, lack of fresh water andtrash are hampering growth in tourism arrivals.
SUPPLY BY STAR 2012-2016
Source : BHA and Horwath HTL
Looking at distribution of new hotels to 2016 bypositioning, the mix is well spread and maintains thecurrent proportions of 3, 4 and 5 star rooms. That said,in 2012 the bulk of new properties are at the lowerend, 3 star or less and in 2013 there is a greater numberof 4/5 star properties scheduled to open their doors.
MONITORING ENERGY & WATER CONSUMPTIONEnergy consumption has become a major concernlately, with the government reducing electricity subsidiesfurther in 2013. Electricity is set to increase by 15% inthe coming year, in quarterly increments of 3.75%.
Our collection of energy and water statistics, inconjunction with the BHA only began in 2012 so thefigures presented are for year-end 2012.
Source : BHA and Horwath HTL
Bali Hotel & Branded Residences Update November 2013
TMwww.horwathhtl.com www.c9hotelworks.com
Not surprisingly, Luxury properties use significantlymore electricity PAR than other hotel categories. This isdue to a combination of factors including the highproportion of standalone villas to block rooms, fewerkeys to spread BOH and FOH power usage, generalproperty size and plunge pools.
From electricity consumption to cost, luxury propertiesare spending almost triple the upper upscale propertiesin electricity PAR.
Source : BHA and Horwath HTL
Mass resort development on the island has alsoaffected fresh water supplies which is causing concernin the general community. Hotels & resorts stillsupplement mains water with deep well water whichputs the local community at risk as they compete forthis limited resource.
Source : BHA and Horwath HTL
For similar reasons as for power consumption, Luxuryproperties consume significantly more water than othersegments. Their water consumption is double that ofthe upper upscale properties.
Water cost is quite difficult to track in Bali as deep wellsupply is free and as mentioned above hotels’supplement mains water with the free water. Figurescan therefore be misleading. That said, the figures wehave are shown below.
Source : BHA and Horwath HTL
HOTEL BRANDED RESIDENCES MARKET
Brand concentration sets thestage for the Bali market’snext step forward
Over the past few years, the Bali property market haswitnessed a dramatic shift in demand towards hotelbranded/managed projects across all segments. Thehospitality led residential property sector has beenstrengthened by domestic buyers which created strongunderlying demand and favorable market conditions.With increasing access from Jakarta, Surabaya andother domestic cities, Bali continues to be a popularplayground for Indonesians.
Looking forward a series of upcoming internationalbranded products with real estate offerings such asRosewood, Raffles, Jumeirah and Shangri-La will inducemore demand to the island. It is anticipated that theIsland of Gods will attract a wider base of internationalvisitors which will create sustained tourism and in turnspur real estate demand. Though there continues to bea post GFC disconnect over low transactional levels ofhotel branded pool villas over the one million dollarmark.
Bali Hotel & Branded Residences Update November 2013
TMwww.horwathhtl.com www.c9hotelworks.com
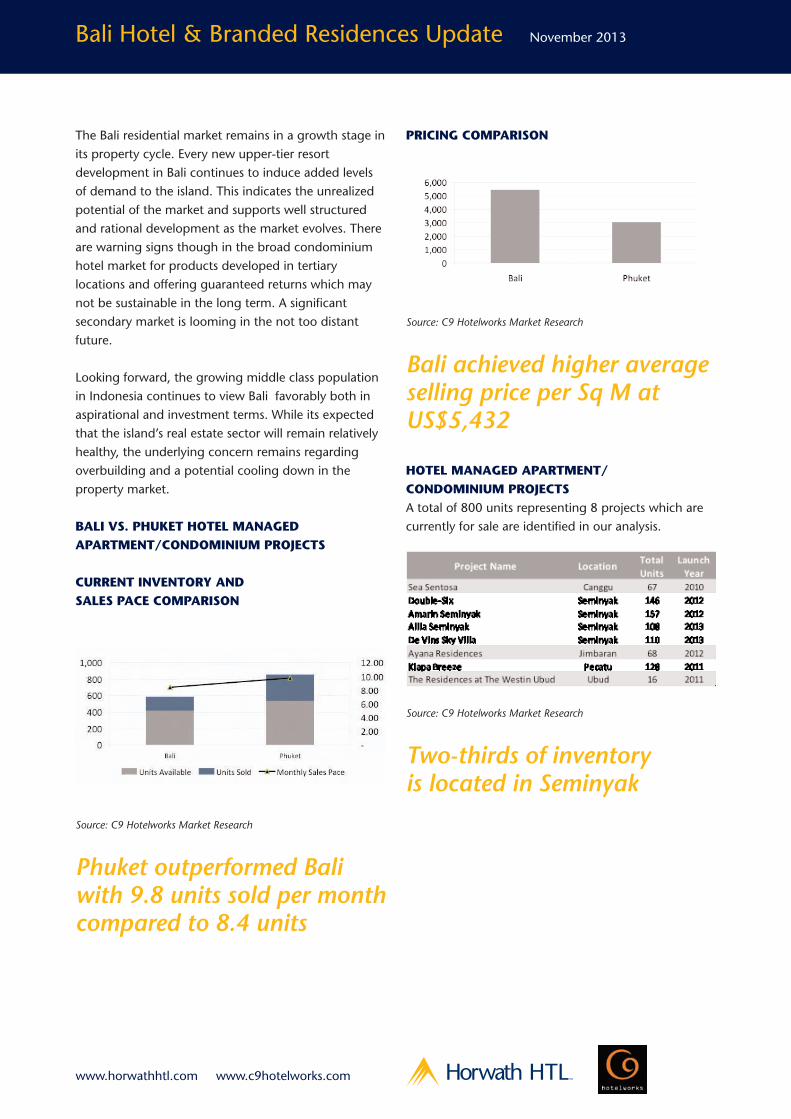
The Bali residential market remains in a growth stage inits property cycle. Every new upper-tier resortdevelopment in Bali continues to induce added levelsof demand to the island. This indicates the unrealizedpotential of the market and supports well structuredand rational development as the market evolves. Thereare warning signs though in the broad condominiumhotel market for products developed in tertiarylocations and offering guaranteed returns which maynot be sustainable in the long term. A significantsecondary market is looming in the not too distantfuture.
Looking forward, the growing middle class populationin Indonesia continues to view Bali favorably both inaspirational and investment terms. While its expectedthat the island’s real estate sector will remain relativelyhealthy, the underlying concern remains regardingoverbuilding and a potential cooling down in theproperty market.
BALI VS. PHUKET HOTEL MANAGEDAPARTMENT/CONDOMINIUM PROJECTS
CURRENT INVENTORY ANDSALES PACE COMPARISON
Source: C9 Hotelworks Market Research
Phuket outperformed Baliwith 9.8 units sold per monthcompared to 8.4 units
PRICING COMPARISON
Source: C9 Hotelworks Market Research
Bali achieved higher averageselling price per Sq M atUS$5,432
HOTEL MANAGED APARTMENT/CONDOMINIUM PROJECTSA total of 800 units representing 8 projects which arecurrently for sale are identified in our analysis.
Source: C9 Hotelworks Market Research
Two-thirds of inventoryis located in Seminyak
Bali Hotel & Branded Residences Update November 2013
TMwww.horwathhtl.com www.c9hotelworks.com
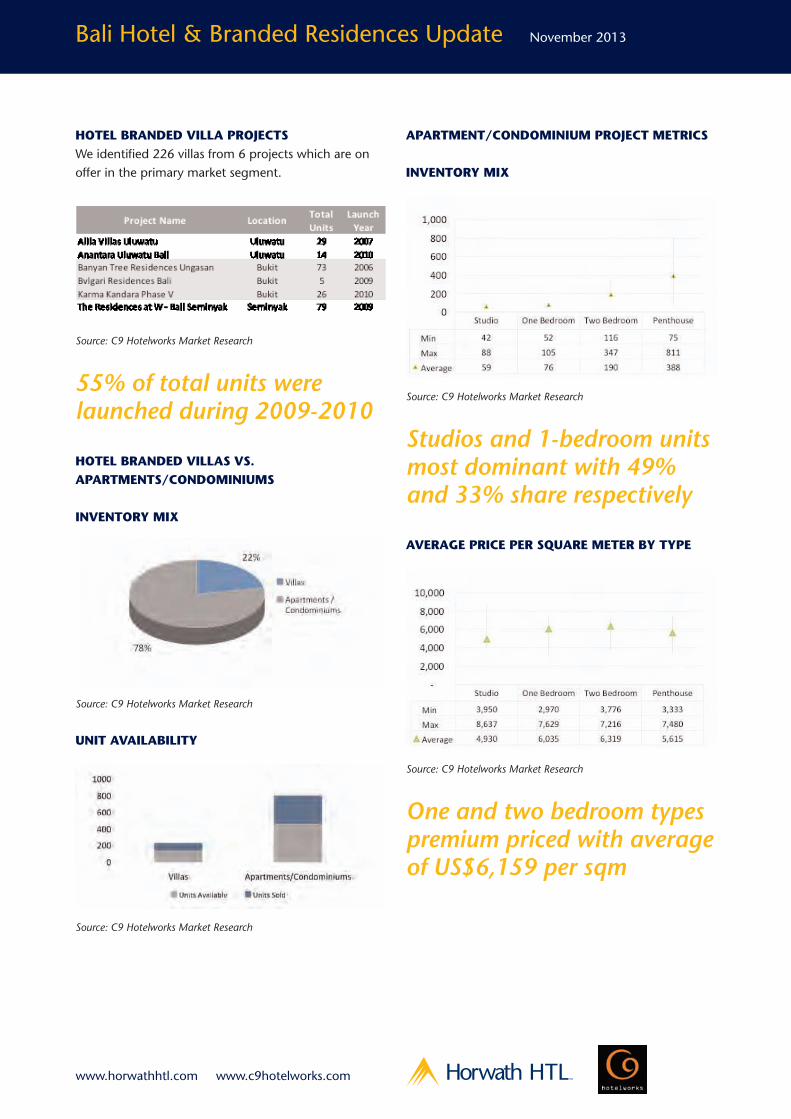
HOTEL BRANDED VILLA PROJECTSWe identified 226 villas from 6 projects which are onoffer in the primary market segment.
Source: C9 Hotelworks Market Research
55% of total units werelaunched during 2009-2010
HOTEL BRANDED VILLAS VS.APARTMENTS/CONDOMINIUMS
INVENTORY MIX
Source: C9 Hotelworks Market Research
UNIT AVAILABILITY
Source: C9 Hotelworks Market Research
APARTMENT/CONDOMINIUM PROJECT METRICS
INVENTORY MIX
Source: C9 Hotelworks Market Research
Studios and 1-bedroom unitsmost dominant with 49%and 33% share respectively
AVERAGE PRICE PER SQUARE METER BY TYPE
Source: C9 Hotelworks Market Research
One and two bedroom typespremium priced with averageof US$6,159 per sqm
Bali Hotel & Branded Residences Update November 2013
TMwww.horwathhtl.com www.c9hotelworks.com
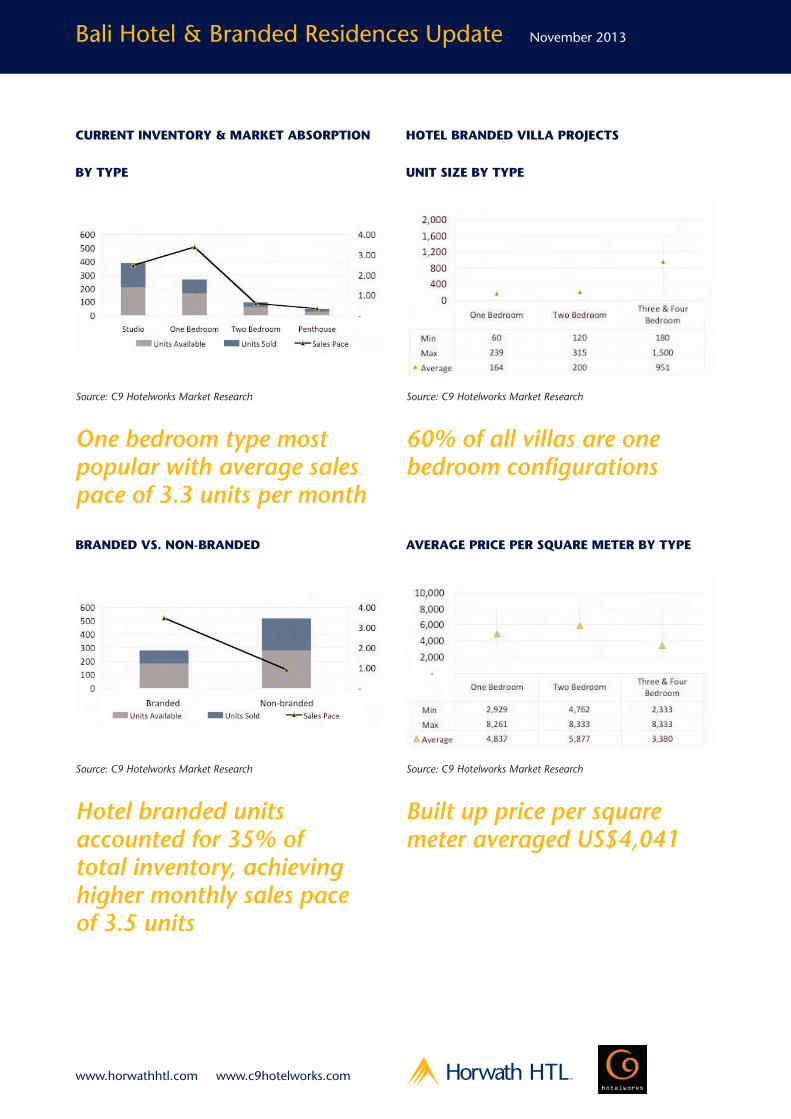
CURRENT INVENTORY & MARKET ABSORPTION
BY TYPE
Source: C9 Hotelworks Market Research
One bedroom type mostpopular with average salespace of 3.3 units per month
BRANDED VS. NON-BRANDED
Source: C9 Hotelworks Market Research
Hotel branded unitsaccounted for 35% oftotal inventory, achievinghigher monthly sales paceof 3.5 units
HOTEL BRANDED VILLA PROJECTS
UNIT SIZE BY TYPE
Source: C9 Hotelworks Market Research
60% of all villas are onebedroom configurations
AVERAGE PRICE PER SQUARE METER BY TYPE
Source: C9 Hotelworks Market Research
Built up price per squaremeter averaged US$4,041
Bali Hotel & Branded Residences Update November 2013
TMwww.horwathhtl.com www.c9hotelworks.com
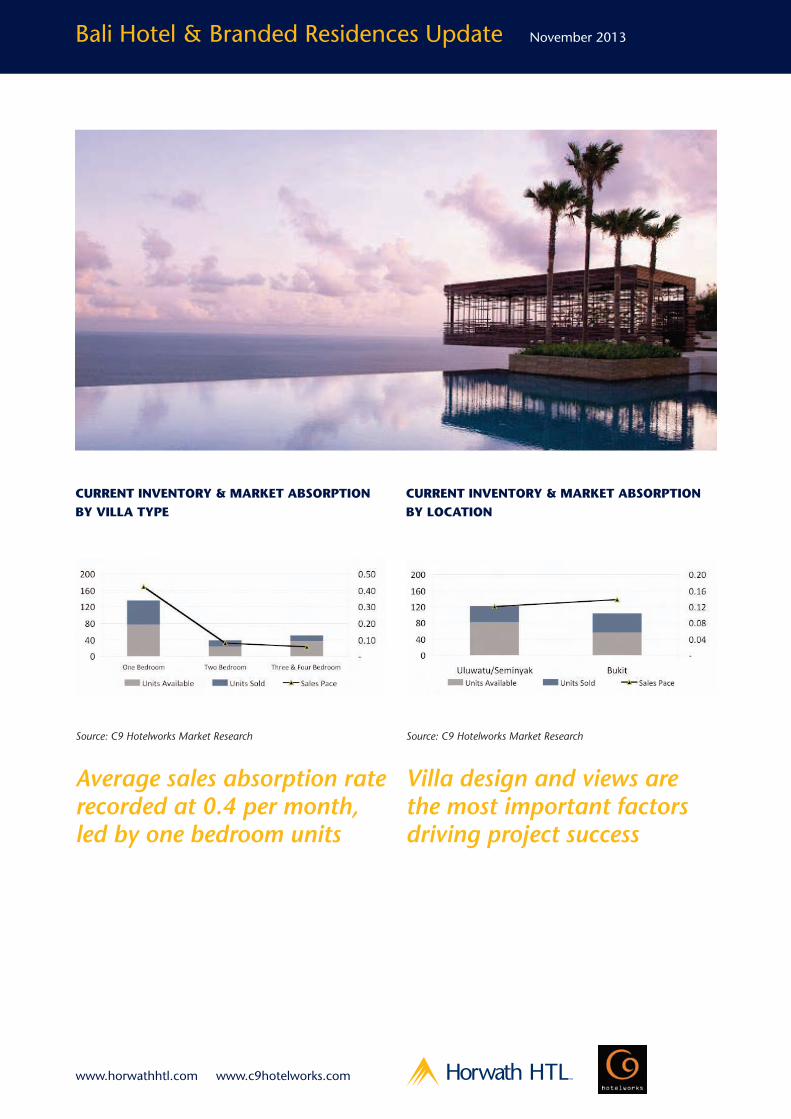
CURRENT INVENTORY & MARKET ABSORPTIONBY VILLA TYPE
Source: C9 Hotelworks Market Research
Average sales absorption raterecorded at 0.4 per month,led by one bedroom units
CURRENT INVENTORY & MARKET ABSORPTIONBY LOCATION
Source: C9 Hotelworks Market Research
Villa design and views arethe most important factorsdriving project success
Bali Hotel & Branded Residences Update November 2013
TMwww.horwathhtl.com www.c9hotelworks.com

ASIA PACIFICAUCKLAND, NEW [email protected]
BANGKOK, [email protected]
BEIJING, [email protected]
HONG KONG, [email protected]
JAKARTA, [email protected]
KUALA LUMPUR, [email protected]
MUMBAI, [email protected]
SHANGHAI, [email protected]
SINGAPORE, [email protected]
SYDNEY, [email protected]
TOKYO, [email protected]
AFRICACAPE TOWN, SOUTH [email protected]
MIDDLE EASTBEIRUT, [email protected]
EUROPEAMSTERDAM, [email protected]
ANDORRA LA VELLA, [email protected]
BARCELONA, [email protected]
BUDAPEST, [email protected]
DUBLIN, [email protected]
FRANKFURT, [email protected]
ISTANBUL, [email protected]
LISBON, [email protected]
LONDON, [email protected]
MADRID, [email protected]
MOSCOW, [email protected]
OSLO, [email protected]
PARIS, [email protected]
ROME, [email protected]
SALZBURG, [email protected]
WARSAW, [email protected]
ZAGREB, [email protected]
ZUG, [email protected]
NORTH/CENTRAL AMERICAATLANTA, [email protected]
ATLANTA, [email protected]
ATLANTA, USApgrayboff@ horwathhtl.com
DALLAS, [email protected]
CHICAGO, [email protected]
DENVER, [email protected]
LOS ANGELES, [email protected]
LAS VEGAS, [email protected]
MONTREAL, [email protected]
MEXICO CITY, [email protected]
NEW YORK, [email protected]
PHOENIX, [email protected]
SAN FRANCISCO, [email protected]
DOMINICAN [email protected]
TORONTO, [email protected]
SOUTH AMERICABUENOS AIRES, [email protected]
SÃO PAULO, [email protected]
SANTIAGO, [email protected]
BOGOTA, [email protected]
TM
www.horwathhtl.com
C9 Hotelworks Company Ltd9 Lagoon Road, Cherngtalay,Thalang, Phuket 83110, ThailandT: +66 (0)81 956 1802E: [email protected]


