Embed Size (px)
Citation preview

Coastal Engineering 63 (2012) 3–12
Contents lists available at SciVerse ScienceDirect
Coastal Engineering
j ourna l homepage: www.e lsev ie r .com/ locate /coasta leng
Barrier dynamics experiment (BARDEX): Aims, design and procedures
J.J. Williams a,⁎, D. Buscombe b, G. Masselink b, I.L. Turner c, C. Swinkels d
a ABPmer, Suite B, Town Quay, Southampton SO14 2AQ, UKb School of Marine Science and Engineering, University of Plymouth, Plymouth, PL4 8AA, UKc Water Research Laboratory, School of Civil and Environmental Engineering, University of New South Wales Sydney, NSW 2052, Australiad Deltares, Rotterdamseweg 185, 2629 HD Delft, Postbus 177, 2600 MH Delft, The Netherlands
⁎ Corresponding author. Tel.: +44 23 80711840; fax:E-mail addresses: [email protected] (J.J. Willia
[email protected] (G. Masselink), [email protected]@deltares.nl (C. Swinkels).
0378-3839/$ – see front matter © 2011 Elsevier B.V. Alldoi:10.1016/j.coastaleng.2011.12.009
a b s t r a c t
a r t i c l e i n f oArticle history:Received 21 November 2011Accepted 9 December 2011Available online 23 January 2012
Keywords:Gravel barrierDelta flumeWavesTidesPrototype scale experiment
Although relatively common features in nature, only a handful of laboratory studies have examined the dy-namic response of gravel beaches and barriers to combined tidal and wave forcing and to storm simulations.This paper reports experiments undertaken in the Delta flume during the BARDEX project using a prototypegravel barrier (55 m-long, 5 m-wide and 4 m-high with seaward and lagoon facing slopes of 1 V/8H and 1 V/4H, respectively) composed of sub-rounded gravel (D50=11 mm). Hydrodynamic conditions and beachmorphology were measured using buried PTs, ECMs and closely spaced bed location sensors on a scaffoldframe spanning the entire barrier. Additional measurements were also obtained from video and from instru-ments on an offshore frame. A series of systematic tests were undertaken using pumps to change water levelson the seaward (hS) and lagoon (hL) sides of the barrier. These included: 1) hydraulic conductivity testswhere hS and hL levels were varied; 2) tests to assess the impact of waves (hS=2.5 m, variable hL in therange 1 m to 2.5 m, significant wave height, Hs=0.8 m, and peak wave period, Tp=3.0 s, 4.5 s and 6 s); 3)tests examining the effect of tides (varying hS from 1.75 m to 3.25 m, variable hL at high (hL=hS+1m), me-dium (hL=hS) and low (hL=hS−1 m) levels, Hs=0.8 m and Tp=4.5 s); and 4) overwash tests (tidal simu-lation, variable hL, Hs=1m and Tp=4.5 s, 6 s, 7 s and 8 s). The principal objective of the paper is to provideessential information on the design and execution of the BARDEX experiments referred to in the series of pa-pers that follow in this special edition. It also describes the instrumentation used to measure hydrodynamic,morphodynamic and sediment processes.
© 2011 Elsevier B.V. All rights reserved.
1. Introduction
The BARDEX experiments were motivated by two main consider-ations. (1) Gravel beaches provide effective natural sea defences fromflooding at many worldwide locations (e.g. Bradbury and Powell,1992; Mason and Coates, 2001; Obhrai et al., 2008; Pedrozo-Acunaet al., 2007) and many are currently actively eroding (e.g. Chadwicket al., 2005; Pye and Blott, 2009). This process increases the threatto coastal infrastructure, exacerbates coastal flooding problems andmay possibly lead to further loss of important natural habitats. Theprocesses responsible for the formation, maintenance and erosion ofgravel beaches and barriers are not fully-understood and require fur-ther work (e.g. Masselink and Buscombe, 2008). (2) Coarse sedimentis increasingly used for beach nourishment and recharge in coastalprotection schemes (e.g. Lawrence et al., 2002; Moses and Williams,2008; Riddell and Young, 1992; Van Wellen et al., 2000) and attractsan annual expenditure of c. 60 million Euros in the UK alone
+44 23 8071 1841.ms),unsw.edu.au (I.L. Turner),
rights reserved.
(Bradbury and McCabe, 2003). The further development, testing andvalidation of numerical models to assist with scheme design and toassess the response of gravel coastlines to a range of storm and sealevel scenarios is thus desirable from a coastal engineering and man-agement perspective (e.g. Bradbury, 2000).
Most of the world's gravel beaches are found in meso- to macro-tidal settings, and thus tidal effects on beach morphodynamics cannotbe ignored (Masselink and Short, 1993). Furthermore, owing to thecoarse nature of the sediments, beach porosity can also exert a signif-icant influence on morphodynamic behaviour. However, most previ-ous laboratory flume experiments have used a fixed mean waterlevel to study the response of gravel beaches to waves (e.g. Roelvinkand Reniers, 1995). Although a few studies have attempted to exam-ine the response of gravel beaches to waves and tides (e.g. Trim et al.,2002), the experiments are subject to scaling problems and the bea-ches used are normally emplaced on impermeable ramps at the endof the test facilities. Such experiments fail, therefore, to replicatesome important aspects of natural gravel beach hydrology. Moreover,many gravel beaches (with a hydraulic conductivity greatly exceed-ing that of sand beaches) are barrier beaches which front and protectlow-lying coastal areas (lagoons, estuaries, and coastal plains) fromcoastal flooding. Examples in the UK include Westward Ho!, Porlock,

4 J.J. Williams et al. / Coastal Engineering 63 (2012) 3–12
Slapton Sands, Chesil and Blakeney. Being subjected to relativechanges in water level on both their seaward and landward sides, hy-draulic gradients are likely to be an important element governingtheir dynamics and stability.
In order to replicate as many of the natural processes as possible inthe BARDEX experiments, a prototype scale open-coast tidal beachcomposed entirely of medium gravel was emplaced in the Deltaflume in the Netherlands and subjected to simulated tidal modula-tions and to waves. The primary objective was to obtain data requiredto understand, parameterise, model and predict gravel beach mor-phodynamics. For that purpose experiments were undertaken usinga range of water levels on either side of the barrier, with time-varying water level on the seaward side of the beach being used tosimulate tides. Detailed measurements were taken of: 1) the near-shore flow field and sub-tidal bedforms; 2) swash hydrodynamics;3) beach/bed-levels and 4) the beach water table. In order to addressthe problem of parameterising andmodelling the incipient conditionsfor natural overwashing and barrier failure during storms, another setof experiments simulated tidal modulation and wave conditions typ-ical of storms. In such conditions, gravel barrier overwashing cansometimes lead to breaching and contribute, over time, to large-scale roll-back (Forbes et al., 1991). This process has implicationsfor long-term coastal managements and is therefore one requiringinvestigation.
Owing to an abundance of sediments with a median diameter, D50,>2 mm, gravel beaches and barriers are common along formerly(peri-) glaciated coasts. In some cases these sediments may be de-rived from erosion of terrestrial glacial deposits (e.g. Orford et al.,1996) or from the continental shelf during the Holocene transgres-sion (e.g. Long et al., 2006; Plater et al., 2009). At other locationscoarse beach material may be supplied from fluvial sources (e.g.Shulmeister and Kirk, 1997) or through cliff erosion (e.g. Pye andBlott, 2009). As a general rule, gravel beaches are mostly frequentlyencountered in wave-dominated coastlines at mid- and high latitudeswith meso- or macro-tidal regimes.
Studies examining the long-term evolution of gravel barriers in re-sponse to changes in relative sea level, and to variations in the sedi-ment supply (cf. Orford et al., 2002), have highlighted theimportance of overwashing (Orford et al., 1988), or even breaching,during extreme storm conditions (Orford et al., 2003). On shortertime-scales studies of the dynamics of the beach step and the evolu-tion of the berm over consecutive tides (e.g. Austin and Buscombe,2008) have identified the importance of swash processes and the im-portant role of swash-groundwater interactions in the developmentof gravel beach morphology (e.g. Austin and Masselink, 2006a). Spe-cifically, because gravels are significantly more porous than beachsands, they exert important control on a number of key beach pro-cesses. For example, studies of interactions between swash flowsand the beach groundwater have demonstrated a significant effecton beach morphology and stability attributable to swash infiltrationinto the (upper) unsaturated beach; and infiltration and exfiltrationacross the (lower) saturated beach (e.g. Butt et al., 2001; Horn,2006; Puleo, 2009; Turner and Masselink, 1998; Masselink and Turn-er (this volume)). Although some aspects of gravel beach hydrody-namics can be inferred from measurements of the beach profile andfrom the sediment grain size distribution and changes in sorting(e.g. Austin and Masselink, 2006b), the measurement in the field ofhydrodynamic parameters required in existing models (e.g.Bradbury and Powell, 1992; Pedrozo-Acuna et al., 2006; 2007), or inpredictive statistical approaches (e.g. Kroon et al., 2008) is extremelydifficult owing to the very energetic nature of the breaker zone. Thusproviding some scaling issues can be resolved, there is therefore agreat deal that can be learned about processes and about hydrody-namic processes and the morphodynamic responses from a series ofcontrolled large-scale experiments in which a gravel barrier is sub-jected both to simulated tidal motion and a range of wave conditions.
The BARDEX project has four objectives and all experiments weredesigned to provide high-quality data sets for process studies and fornumerical model calibration and testing: 1) to investigate the role ofback-barrier lagoon levels on the dynamic groundwater profilethrough the barrier and to assess whether varying groundwater levelsmay induce different morphological response at the beach face; 2) toimprove the understanding of sediment transport processes on thebeach face under conditions of accretion and erosion; 3) to examinehydrodynamics and sediment transport at locations from the swashregion to locations offshore from the barrier; and 4) to improve theunderstanding of overwash sediment transport and the thresholdconditions for overwash occurrence. The data acquired have beenused to examine the prognostic capabilities of the XBeach numericalmodel (Williams et al., this volume).
2. Methods
2.1. Construction of the gravel barrier and water level control
The scale of the Delta flume (240 m-long, 5 m-wide, 7 m-deep)enabled the experiments to be conducted with natural gravel,which avoids the adverse scale effects. Using locally sourced fluvialgravel with a median grain size, D50, ~11 mm, a 55 m-long, 4 m-high and 5 m-wide gravel barrier crest was constructed in the centralregion of the Delta flume. The barrier was carefully profiled to give agradient of 1 V/8H for the slope facing the wave paddle and a 1 V/4Hgradient for the opposite slope (Fig. 1). Fig. 2 shows the physical char-acteristic of the barrier sediments. The mid-barrier crest was locatedat an along flume distance, X, from the wave paddle of approximately95 m (Fig. 1) and the flume volume between the barrier and the wavepaddle (hereafter called ‘sea’) was filled with water to a requireddepth. In addition, owing to a unique feature of the Delta flume, itwas possible to create a ‘lagoon’ between the back slope of the barrierand a watertight gate emplaced at X~130 m (Fig. 1). As complete bar-rier overwash tests were planned, a series of effective wave absorp-tion baffles were constructed behind the barrier at the end of thelagoon to reduce wave reflection (Fig. 1). The water levels in the seaand lagoon were maintained at set levels by 4×180 l/s pumps withconnecting pipe work and a flow control system (Fig. 1). The flumechannel behind the gate was filled with water and acted as a reservoirto supply water to, and to store water from, the sea and lagoon. Thepumping system was able to maintain the water levels either side ofthe barrier to a tolerance of ±10 mm, permitting the simulation ofdiffering sea-level, tidal and beach groundwater conditions. Pumpdischarges in and out of the lagoon were measured using a SiemensMagflow 5100 and enabled direct determination of flow rates throughthe barrier when a hydraulic gradient was applied. The effects onbeach profile development attributable to a range of wave andwater level conditions (tides) were investigated by raising and lower-ing the water level on the seaward side of the barrier and in thelagoon.
2.2. Water levels and wave generation
In most BARDEX tests the sea and lagoon water depths weremaintained at the required levels by the pumping system. Testwaves were then generated using a JONSWAP wave steering signalspecified by significant wave height, Hs, and peak wave period, Tpusing default settings for gamma (3.3) and sigma (0.07 and 0.09 forsigma low and sigma high respectively). This latter parameter repre-sents the narrowness of the spectrum. Wave groupiness, caused byconstructive or destructive interference is a function of the spectralform and was not user defined (cf. Battjes and van Vledder, 1984).In most tests, reflected waves, as well as low-frequency resonantwaves were damped at the paddle using an Automated ReflectionCompensator (ARC). In Fig. 3a the power spectral density (PSD)

Fig. 1. Diagram of the BARDEX experiment showing the location of the gravel barrier in the Delta flume in relation to the wave paddle and the reservoir section. The pumping sys-tem is shown schematically and photographs are used to illustrate key features of the Delta flume and associated instrumentation.
5J.J. Williams et al. / Coastal Engineering 63 (2012) 3–12
functions are shown for waves measured by a pressure sensor in testsC5-4, C1-4 and B2-4 and in Fig. 3b water surface elevation measuredby the WG at X=41 m during test E8-6. This wave sequence was re-peated throughout all series E tests and included a single largeoverwash initiation wave at approximately 135 s from the start ofthe sequence. This was intended to overtop the barrier to removeany residual berm from the proceeding test and to promote subse-quent overwashing by smaller waves in the sequence. In the eventthis was successful. Hs and Tp values were obtained by spectral analy-sis of PT data (cf. Bishop and Donelan, 1987). In all cases there wasclose agreement between design and test conditions in the BARDEXtest. Further details of wave generation and properties are given byBuscombe et al. (2008).
2.3. Sediment properties
Five 25 cm long cores of sediment were collected at locationsacross the top of the barrier profile by pushing 5 cm-diameter Per-spex tubes into the gravel and sealing the ends in situ. This wasdesigned to yield some information on the potential sorting of thegravel near the surface of the barrier. The tests were carried out be-fore any overwash experiments took place and sorting was minimal.The grain size distribution was obtained by sieving for the gravel ma-terial as it was delivered to the flume (Fig. 2a). The material is a mod-erately well sorted, unimodal medium gravel (Fig. 2b) with a mediangrain size (D50) of 11.0 mm (D10=5.4 mm, D90=16.9 mm). The dis-tribution is fine skewed and leptokurtic as defined by the Folk andWard (1957). The particle shape distribution for a random sampleof barrier sediments is shown in Fig. 2c. Routine measurements ofmean grain size for surficial sediments were obtained at variousstream-wise locations across the barrier between each experimentusing the photograph techniques based on Rubin (2004) describedby Buscombe and Masselink (2009). The grain size distributions
were also determined using the same images following the methodof Buscombe (2008). Larger samples obtained using similar tech-niques were used to determine the sediment porosity,n, defined vol-ume of voids / volume of voids plus gravel. The average value for nwas found to be 0.32 with a standard deviation of 0.04. The sedimentdensity was also determined from a bulk sample and found to be2630 kg/m3.
2.4. Hydrodynamic measurements
The incident wave field, and associated wave induced flows weremeasured offshore using three wave gauges (WGs) and five 40 mm-diameter Marsh-McBirney 511 electromagnetic current meters(ECMs) mounted on the side wall of the flume (Fig. 1). TheWGs com-prised a vertical aluminium gauge with a conductivity sensor at thebottom tip. A servo motor moved the gauge vertically so that the tipremained just in contact with the water surface. These wave heightdata, in combination with measurements of the horizontal and verti-cal flow components from a single ECM, were sufficient to describethe incoming and outgoing wave characteristics (spectra) accurately.The distances between the wave followers were periodically adjust-ed, depending on the steepness of the waves, as prescribed byMansard and Funk (1980) in their method for derivation the incidentspectrum from the measured water surface elevation. In order tomeasure the pressure profile, and to thereby infer the phreatic sur-face, the barrier was instrumented with Druck PTX 1830 pressuretransducers, PTs, (1 bar range; absolute accuracy of 0.4%, Fig. 1).These were deployed 0.035 m above the floor of the flume atX=38 m and from 76 mbXb106 m with a normally at a spacing of2 m to 3 m. Table 1 summarises the streamwise (X), spanwise (Y)and vertical (Z) locations of these instruments where X, Y, Z=0 is lo-cated at the wave paddle on the floor of the flume next to the leftwall. It also gives the measurement units of each sensor.

Fig. 2. (a) Close-up of barrier sediments. (b) Barrier sediments grain size distributionobtained by sieving of BARDEX sediments. (c) Particle shape distribution for a randomsample of barrier sediments.
6 J.J. Williams et al. / Coastal Engineering 63 (2012) 3–12
A scaffold support frame (30 m-long and 2 m-wide) spanning thebarrier from 76 mbXb110 m was used to support four mini (Valeportwith disc-shaped head) at X=82.5 m, (Fig. 1). Although these weredeployed at various elevations from the bed to record swash veloci-ties, there was always one ECM deployed at c. 0.03 m from the bedto record the near-bed flow velocity. The same ECM elevations rela-tive to the evolving barrier profile were maintained throughout thetests by manual adjustment during periods of no waves. AdditionalECM pairs were also deployed from the frame at locations furtherup the beach determined by wave conditions during any given test.Following adjustments, all instrument positions were surveyedusing a Trimble 5605 Robotic Total Station to a local coordinate sys-tem. A similar frame construction has been used successfully to de-ploy instruments in field experiment at Truc Vert, France, and atSlapton Sands, UK (e.g. Masselink et al., 2009).
A vertical array of three absolute PTs (Druck PDCR1830) were co-located with the ECMs on the frame and buried in the bed at 0.1 m,0.25 m and 0.4 m depth to record vertical pressure gradients at
X=82.5 m. Additional absolute PTs (Druck PDCR1830) were installedat c. 0.03 m from the bed surface to record the swash depth at each ofthe ECM stations to help identify the times when the ECM closest tothe bed was submerged. The location of these instruments was ad-justed between each test as required to maintain the required burialdepth. An absolute PT (Druck PDCR1830) was also deployed to recordthe atmospheric pressure, required to convert the absolute pressuresrecorded by the PTs to hydrostatic pressure and water depth. Datafrom these instruments, related to swash flow velocities and depths,were recorded at 4 Hz. To record wave run-up, a Sony SSC-DC50APvideo camera positioned on the profiling gantry high above the centreof the flume, and facing the waves, was used. Images were referencedto ground control point positions and recorded at 4 Hz into Matlabdata files following image orthorectification. These images were sub-sequently digitally filtered to remove strong gradients in sunlightacross the flume.
A frame was used to deploy instruments at locations seaward ofthe barrier to measure wave-induced turbulence and bed morpholo-gy (Fig. 4). These comprised a Sontek 10 MHz autonomous HydraADV Ocean Probe with strain-gauge pressure and water temperaturesensors and compass and inclinometers recording at 25 Hz and twocabled Nortek 10 MHz Vectrino ADVs recording at 25 Hz. These instru-ments were used to measure wave-induced turbulence at nominalheights z above the bed of 0.06 m, 0.25 m and 0.5 m. In addition,two autonomous Marine Electronics acoustic bed profilers (ABP)were deployed on the frame to measure the bed morphology. TheABPs operated at 2 MHz with a 1.1o conical beam and were mountedhorizontally on the frame to scan a cross-section of the bed over anangular range of 120o. The frame was deployed at locations seawardof the wave breaking zone using the Delta flume gantry crane(Fig. 4) and was carefully aligned with the side wall of the flumeusing projecting guides fixed to the frame.
2.5. Morphodynamic measurements
Barrier profiles were measured at the end of each wave sequenceusing a roller and actuator which followed the bed profile from anoverhead carriage, thereby allowing supra-tidal and sub-tidal pro-files to be measured with identical accuracy (Fig. 1). An array of45 temperature compensated Massa M300/95 ultrasonic proximitysensors operating at 95KHz, and recording data at 4 Hz weredeployed at c. 1 m from the bed at 0.5 m intervals on the scaffoldframe (Figs. 1 and 5). Each had a beam angle of 8o giving a mea-surement footprint c. 28 cm in diameter and a vertical accuracy ofc. ±1mm. Data for temperature corrections were supplied from alocally installed meteorological station mounted above the flume.In addition to providing direct measurements of bed level betweenswash events, these data were also used to derive flow depths andvelocities associated with individual swash and backwash events(Turner et al., 2008).
2.6. Sediment tracers
Sediment tracers were used in Test Series E6 to assess obliquity ofoverwash sediment transport across the back-barrier. Using a fluores-cent paint three 30 kg samples of barrier gravel were dyed usingthree colours (orange, green and blue). The application of the dye tothe surface had no measureable effect on the physical or hydrody-namic properties of the sediment. Before overwash tests, sedimenttracers were placed flush with the barrier surface at three locationsalong the crest. Samples of surficial sediments were obtained after pe-riods of overwash and analysed using a UV light source to determinethe transport pathways. No significant transverse gradients in trans-port were detected.

Fig. 3. (a) Power spectral density (PSD) functions for waves measured by a PT at X=76 m in tests C5-4, C1-4 and B2-4. (b) Water surface elevation measured by a WG at X=41 mduring test E8-6 showing the single large overwash initiation wave.
7J.J. Williams et al. / Coastal Engineering 63 (2012) 3–12
3. Data logging, processing and storage
With the exception of the autonomous instruments on the off-shore frame, all other instruments were linked to a number of
Table 1Summary of wave gauge, pressure sensor and electromagnetic current meter locationsduring the BARDEX experiments.
Sensor X Y Z units
WG01 36.7 0.5 3.500 mWG02 41.0 0.5 3.500 mWG03 43.9 0.5 3.500 mDruck PTX 1830 76.0 0.25 0.035 kN/m2
Druck PTX 1830 79.0 0.25 0.025 kN/m2
Druck PTX 1830 82.0 0.25 0.035 kN/m2
Druck PTX 1830 84.0 0.25 0.035 kN/m2
Druck PTX 1830 86.0 0.25 0.035 kN/m2
Druck PTX 1830 88.0 0.25 0.035 kN/m2
Druck PTX 1830 90.0 0.25 0.035 kN/m2
Druck PTX 1830 92.0 0.25 0.035 kN/m2
Druck PTX 1830 94.0 0.25 0.035 kN/m2
Druck PTX 1830 96.0 0.25 0.035 kN/m2
Druck PTX 1830 99.0 0.25 0.035 kN/m2
Druck PTX 1830 102.0 0.25 0.035 kN/m2
Druck PTX 1830 105.0 0.25 0.035 kN/m2
Druck PTX 1830 38.3 0.25 0.035 kN/m2
Druck PTX 1830 129.0 0.25 0.035 kN/m2
Druck PTX 1830 140.0 0.25 0.035 kN/m2
Marsh-McBirney 511 ECM 57.0 0.59 1.350 m/sMarsh-McBirney 511 ECM 57.0 0.59 1.350 m/sMarsh-McBirney 511 ECM 57.0 0.59 1.750 m/sMarsh-McBirney 511 ECM 57.0 0.59 1.750 m/sMarsh-McBirney 511 ECM 57.0 0.59 2.150 m/sMarsh-McBirney 511 ECM 57.0 0.59 2.150 m/sMarsh-McBirney 511 ECM 76.0 0.59 2.100 m/sMarsh-McBirney 511 ECM 76.0 0.59 2.100 m/sMarsh-McBirney 511 ECM 38.4 0.59 1.000 m/sMarsh-McBirney 511 ECM 38.4 0.59 1.000 m/s Fig. 4. The offshore frame with ABPs and ADVs and associated power supplies and data
logging units. The photograph shows deployment before test B3.

Fig. 5. Photograph looking toward the wave paddle showing part of the array of ultra-sonic bed level sensors on the scaffold frame and the swash ECMs and PT.
8 J.J. Williams et al. / Coastal Engineering 63 (2012) 3–12
networked laptop and desktop PCs to record data. All logging com-puters were synchronised from a GARMIN GPS using TAC32 software.Similarly, the autonomous logging systems were also synchronised tothis common time-base. Further details are given by Buscombe et al.(2008). Depending on the test run, the number of logged data chan-nels varied from 87 to 119. To provide a convenient way to group re-lated data of different types all raw data were organised into 28 datastructures for each experiment. Data fields were ascribed for each re-lated group of measurements (e.g. PT and ECM data) and sub-fieldswere used to hold individual data sets. 1.5 GB of quality-controlleddata were stored on a single DVD which also included some Matlabscripts to load data and perform some elementary analysis. Thesedata can be read by Matlab or Octave. This proved to be an effectiveway for the BARDEX scientists to access the data and to make thedata available to other interested groups.
4. BARDEX experiments
4.1. Test series
The initial Test Series A was performed in the absence of waves forthe purpose of assessing barrier stability when subjected to a range ofhydraulic gradients induced by varying sea/lagoon water levels, andto test and fine-tune the pump the controller system used for all sub-sequent tests to maintain the required sea and lagoon water levels.The four tests series followed were then undertaken to examine bar-rier profile response to: 1) waves only (Test Series B); 2) waves with afixed offshore water level and varying lagoon levels (Test Series C); 3)waves and simulated tidal cycles (Test Series D); and 5) storm condi-tions using tidal simulation and large waves (Test Series E). Fig. 6ashows sea, hS, and lagoon, hL, water levels set during all the BARDEXtests. It shows tests with fixed hS levels and tests involving tidal sim-ulations. The corresponding Hs and Tp values for all BARDEX tests areshown in Fig. 6b.
4.2. Design of the test sequence
Since Test Series C and D aimed to examine if the beach groundwa-ter profile affected barrier morphodynamics in different wave condi-tions, it was necessary to simulate the same sea level, tidalmodulation, wave forcing and antecedent morphology in every testand only vary the barrier water table. Although accurate replicationof sea level, tidal signal and wave forcing was possible, the largesize of the barrier made re-profiling between tests impracticableand thus a test chronology was designed to reduce the dependencyon initial conditions of subsequent barrier profile developments.The resulting chronological sequence of tests undertaken in BARDEXare summarised in Table 2. This table gives hS, hL, Hs and Tp values,the duration of a test and status of the ARC, and comments relatingto the nature of the waves and tide during a given test. This test se-quence in Table 2 was intended to ensure that the initial barrier pro-files of a given test pair with different lagoon levels (e.g. C1/C2, C3/C4,C5/C6 and D2/D3) were similar. Masselink and Turner (this volume)demonstrate that this was achieved reasonably well, indicatingstrongly that the main difference between the tests using differing la-goon levels was related to changes in the beach water table and not tothe starting morphology of the barrier.
4.3. Test Series B and C
The following illustrates the main features of the test procedureundertaken during Test Series B and C. It is subdivided into 5 stepslasting c. 8 hours in total. 1) The water level on either side of the bar-rier was adjusted to the required level and the zero offsets of the bur-ied PTs were adjusted to the ambient atmospheric pressure. 2) Toensure that starting profiles for tests with the same wave conditions,but different lagoon levels, were comparable, the hS was raised to2.5 m for a given test, and the barrier was exposed to monochromaticwaves (Table 2) with design height, H, and period, T, for 60 min. Al-though in most tests H and T were set to the Hs and Tp values of thefollowing test, early trials used H=1m and T=10s for a period of3 min (Table 2). This approach was abandoned in favour of the formerowing to undesirable erosion of the barrier. The heights of the instru-ments on the scaffold frame were then adjusted and the starting bar-rier profile was surveyed. 3) The level of the lagoon was then adjustedto the required level for the test and pumps were run continuously tomaintain the water levels on each side of the barrier, allowing timefor the water table to equilibrate. 4) The test series was then initiatedusing a 90-min long wave signal divided into nine segments of un-equal length (4×5 min; 2×10 min; 2×15 min; and 1×20 min) toenable interruption of the wave action for beach surveys and equip-ment maintenance. Importantly, for tests with the same wave forcing(Hs and Tp), the identical segmented wave steering signal was used.To enable ensemble averages of the swash/hydrodynamic parametersto be calculated, monochromatic ‘reset’ waves were again used at theend of the final ‘run’ for a period of 5 min. 5) After completion of thetest, the pumps were stopped and the water levels were allowed toequilibrate, normally overnight.
It was found to be difficult to maintain a constant hS value usingthe automated pump system, whilst at the same time suppressing re-flection at the paddle using the ARC. Further, without the ARC on, itwas difficult to keep the hS steady. It was found that the best solutionwas to leave the ARC on and to control the pumpsmanually. Althoughrequiring some skill, accurate hS and hL levels could be maintainedusing this approach.
4.4. Test Series D and E
It was required in Test Series D and E to simulate a tidal cycle char-acterised by a range of sea water levels, hS, of 1.5 m. Typically, a tidalcycle comprised 14 segments, each lasting 15 min: the first segment

Fig. 6. (a) Schematic summarising planned sea, hS, and lagoon, hL, water levels set during all the BARDEX tests. It shows tests with fixed hS levels and tests involving tidal simula-tions. (b) Hs and Tp values used for all BARDEX tests.
9J.J. Williams et al. / Coastal Engineering 63 (2012) 3–12
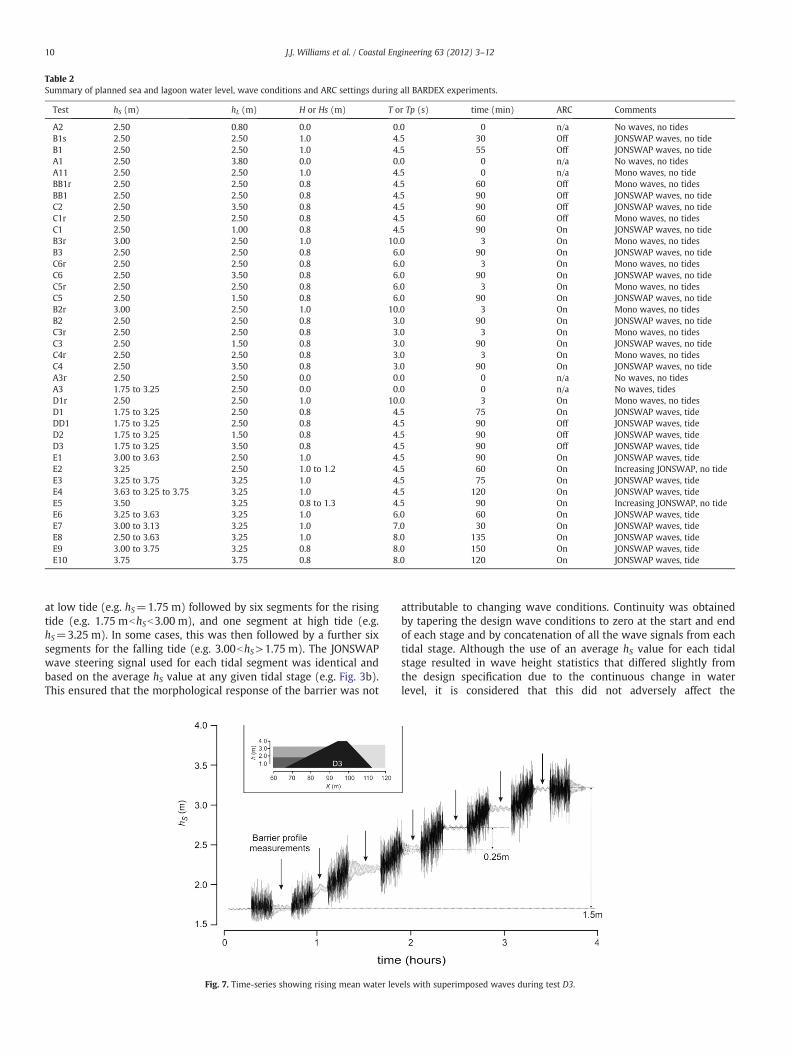
Table 2Summary of planned sea and lagoon water level, wave conditions and ARC settings during all BARDEX experiments.
Test hS (m) hL (m) H or Hs (m) T or Tp (s) time (min) ARC Comments
A2 2.50 0.80 0.0 0.0 0 n/a No waves, no tidesB1s 2.50 2.50 1.0 4.5 30 Off JONSWAP waves, no tideB1 2.50 2.50 1.0 4.5 55 Off JONSWAP waves, no tideA1 2.50 3.80 0.0 0.0 0 n/a No waves, no tidesA11 2.50 2.50 1.0 4.5 0 n/a Mono waves, no tideBB1r 2.50 2.50 0.8 4.5 60 Off Mono waves, no tidesBB1 2.50 2.50 0.8 4.5 90 Off JONSWAP waves, no tideC2 2.50 3.50 0.8 4.5 90 Off JONSWAP waves, no tideC1r 2.50 2.50 0.8 4.5 60 Off Mono waves, no tidesC1 2.50 1.00 0.8 4.5 90 On JONSWAP waves, no tideB3r 3.00 2.50 1.0 10.0 3 On Mono waves, no tidesB3 2.50 2.50 0.8 6.0 90 On JONSWAP waves, no tideC6r 2.50 2.50 0.8 6.0 3 On Mono waves, no tidesC6 2.50 3.50 0.8 6.0 90 On JONSWAP waves, no tideC5r 2.50 2.50 0.8 6.0 3 On Mono waves, no tidesC5 2.50 1.50 0.8 6.0 90 On JONSWAP waves, no tideB2r 3.00 2.50 1.0 10.0 3 On Mono waves, no tidesB2 2.50 2.50 0.8 3.0 90 On JONSWAP waves, no tideC3r 2.50 2.50 0.8 3.0 3 On Mono waves, no tidesC3 2.50 1.50 0.8 3.0 90 On JONSWAP waves, no tideC4r 2.50 2.50 0.8 3.0 3 On Mono waves, no tidesC4 2.50 3.50 0.8 3.0 90 On JONSWAP waves, no tideA3r 2.50 2.50 0.0 0.0 0 n/a No waves, no tidesA3 1.75 to 3.25 2.50 0.0 0.0 0 n/a No waves, tidesD1r 2.50 2.50 1.0 10.0 3 On Mono waves, no tidesD1 1.75 to 3.25 2.50 0.8 4.5 75 On JONSWAP waves, tideDD1 1.75 to 3.25 2.50 0.8 4.5 90 Off JONSWAP waves, tideD2 1.75 to 3.25 1.50 0.8 4.5 90 Off JONSWAP waves, tideD3 1.75 to 3.25 3.50 0.8 4.5 90 Off JONSWAP waves, tideE1 3.00 to 3.63 2.50 1.0 4.5 90 On JONSWAP waves, tideE2 3.25 2.50 1.0 to 1.2 4.5 60 On Increasing JONSWAP, no tideE3 3.25 to 3.75 3.25 1.0 4.5 75 On JONSWAP waves, tideE4 3.63 to 3.25 to 3.75 3.25 1.0 4.5 120 On JONSWAP waves, tideE5 3.50 3.25 0.8 to 1.3 4.5 90 On Increasing JONSWAP, no tideE6 3.25 to 3.63 3.25 1.0 6.0 60 On JONSWAP waves, tideE7 3.00 to 3.13 3.25 1.0 7.0 30 On JONSWAP waves, tideE8 2.50 to 3.63 3.25 1.0 8.0 135 On JONSWAP waves, tideE9 3.00 to 3.75 3.25 0.8 8.0 150 On JONSWAP waves, tideE10 3.75 3.75 0.8 8.0 120 On JONSWAP waves, tide
10 J.J. Williams et al. / Coastal Engineering 63 (2012) 3–12
at low tide (e.g. hS=1.75 m) followed by six segments for the risingtide (e.g. 1.75 mbhSb3.00 m), and one segment at high tide (e.g.hS=3.25 m). In some cases, this was then followed by a further sixsegments for the falling tide (e.g. 3.00bhS>1.75 m). The JONSWAPwave steering signal used for each tidal segment was identical andbased on the average hS value at any given tidal stage (e.g. Fig. 3b).This ensured that the morphological response of the barrier was not
Fig. 7. Time-series showing rising mean water lev
attributable to changing wave conditions. Continuity was obtainedby tapering the design wave conditions to zero at the start and endof each stage and by concatenation of all the wave signals from eachtidal stage. Although the use of an average hS value for each tidalstage resulted in wave height statistics that differed slightly fromthe design specification due to the continuous change in waterlevel, it is considered that this did not adversely affect the
els with superimposed waves during test D3.

Fig. 8. Typical barrier overwash sequence during simulations of storm conditions and high tidal levels.
11J.J. Williams et al. / Coastal Engineering 63 (2012) 3–12
experiments. The tidal sequence used in test D2 in Fig. 7 shows risingmean water levels with superimposed waves and indicates the timeswhen barrier profiles were measured. The inset in Fig. 7 shows anoverview of water levels during the test.
With the exception of one ‘reset’ before test D1 (Table 2) Test Se-ries D and E proceeded in an orderly sequence and involved raisingor lowering hS in steps to simulate a tide whilst at the same timemaintaining a constant hL value. Additionally, tests E2 and E5 main-tained constant hS and hL values and examined barrier responses tochanging wave conditions. These tests were designed to determinethe thresholds required for incipient overwash. Other tests in SeriesE were undertaken to study the morphological response of the bar-rier under full overwash conditions. Particle tracing experimentsoutlined above were undertaken during this Test Series. An illustra-tion of a barrier overwash sequence is shown in Fig. 8. Even inthese high energy conditions, instruments on the barrier framefunctioned well and data related to overwash flow speed and depthswere obtained.
5. Summary
A number of aspects of the BARDEX project are novel: (1) gravelbeach research in the laboratory is relatively rare, especially on thisscale (the notable exception being the GWK experiments reportedby Blanco (2002); (2) the experiments are believed to be the firstcombining waves with variations of offshore and lagoon water levels;and (3) the state-of-the-art measurements, including turbulence,run-up, sub-tidal, intertidal and supra-tidal bed morphologies, sedi-ment size, and groundwater table are some of the most detailedever undertaken in a laboratory study of a gravel beach. The experi-ments have, for the first time, examined the response of a gravel bar-rier beach to different water levels either side of the barrier in thepresence of waves and to overwash events. The use of metered highcapacity pumps has allowed water levels to be held at different rela-tive levels either side of the barrier and have enabled direct measure-ments of hydraulic conductivity. It is considered that the data setcollected will therefore be of interest to the wider academic commu-nity in the fields of coastal hydrodynamics and hydraulics, coastal de-fence and geotechnics, and nearshore morphodynamics and sedimenttransport. Further, the outcomes from the various detailed studiesreported in this special issue will be of interest to engineers taskedwith designing a range of gravel beach schemes and to coastal man-agers with responsibility for safety, conservation and preservationof existing gravel beaches.
Acknowledgements
The data reported here were collected in the Delta flume (Nether-lands) as part of the EU-funded BARDEX project (HYDRALAB III Con-tract no. 022441 (RII3), Barrier Dynamics Experiments).
References
Austin, M.J., Buscombe, D., 2008. Morphological change and sediment dynamics of thebeach step on a macrotidal gravel beach. Marine Geology 249, 167–183.
Austin, M.J., Masselink, G., 2006a. Swash-groundwater interaction on a steep gravelbeach. Continental Shelf Research 26 (20), 2503–2519.
Austin, M.J., Masselink, G., 2006b. Observations of morphological change and sedimenttransport on a steep gravel beach. Marine Geology 229 (1–2), 59–77.
Battjes, J.A., Van Vledder, G.P., 1984. Verification of Kimura's theory for wave group sta-tistics. Proceedings ICCE'84 43, 642–648.
Bishop, C.T., Donelan, M.A., 1987. Measuring waves with pressure transducers. CoastalEngineering 11, 309–328.
Blanco, B., 2002. Large wave channel (GWK) experiments on gravel and mixed bea-ches. Experimental Procedure and Data Documentation. Rept. TR-130, HRWallingford.
Bradbury, A.P., 2000. Predicting breaching of shingle barrier beaches— recent advancesto aid beach management. Proc. 35th MAFF (Defra) Conf. on River and Coastal Eng,pp. 05.3.1–05.3.13.
Bradbury, A.P., McCabe, M., 2003. Morphodynamic response of shingle and mixedsand/shingle beaches in large scale tests—preliminary observations. Proc. HydralabII, Budapest, pp. 9-1–9-11.
Bradbury, A., Powell, K., 1992. The short term profile response of shingle spits to stormwave action. Proceedings of the International Conference Coastal Engineering,ASCE 2694–2707.
Buscombe, D., 2008. Estimation of grain size distributions and associated parametersfrom digital images of sediment. Sedimentary Geology 210, 1–10.
Buscombe, D., Masselink, G., 2009. Grain size information from the statistical proper-ties of digital images of sediment. Sedimentology 56, 421–438.
Buscombe, D., Williams, J.J., Masselink, G., 2008. BARDEX: Experimental procedures,technical information and data report. School of Geography, Univ. Plymouth, UK,164pp. unpublished manuscript.Now available from University of Plymouth, sub-ject to a handling fee.
Butt, T., Russell, P., Turner, I., 2001. The influence of swash infiltration-exfiltration onbeach face sediment transport: onshore or offshore? Coastal Engineering 42 (1),35–52.
Chadwick, A.J., Karunarathna, H., Gehrels, W.R., O'Brien, D., Dales, D., 2005. A new anal-ysis of the Slapton Barrier beach system. UK. Proceedings of the Institution of CivilEngineers: Maritime Engineering 158 (4), 147–161.
Folk, R.L., Ward, W.C., 1957. Brazos river bar: a study of significance of grain size pa-rameters. Journal of Sedimentary Petrology 27, 3–26.
Forbes, D.L., Taylor, R.B., Orford, J.D., Carter, R.W.G., Shaw, J., 1991. Gravel-barrier mi-gration and overstepping. Marine Geology 97 (3–4), 305–313.
Horn, D.P., 2006. Measurements and modelling of beach ground-water flow in theswash-zone: a review. Continental Shelf Research 26, 622–652.
Kroon, A., Larson, M., Möller, I., Yokoki, H., Rozynski, G., Cox, J., Larroude, P., 2008. Sta-tistical analysis of coastal morphological data sets over seasonal to decadal timescales. Coastal Engineering 55 (7–8), 581–600.
Lawrence, J., Karunarathna, H., Chadwick, A.J., Flemming, C., 2002. Cross-shore sedi-ment transport on mixed coarse grain sized beaches: modelling and measure-ments. Proc. 28th Int. Conf. Coastal Eng., ASCE, pp. 2565–2577.
Long, A.J., Waller, M.P., Plater, A.J., 2006. Coastal resilience and late Holocene tidal inlethistory: the evolution of Dungeness foreland and the Romney Marsh depositionalcomplex (UK). Geomorphologie 82 (3–4), 309–330.
Mansard, E.P.D., Funk, E.R., 1980. The measurement of incident and reflected spectrausing a least squares method. Proc. Coastal Eng., ASCE, pp. 154–172.
Mason, T., Coates, T.T., 2001. Sediment transport processes on mixed beaches: areview for shoreline management. Journal of Coastal Research 17 (3),645–657.
Masselink, G., Buscombe, D., 2008. Shifting gravel: a case study of Slapton Sands. Geo-graphical Review 22 (1), 27–31.
Masselink, G., Short, A., 1993. The influence of tide range on beach morphodynamics: aconceptual model. Journal of Coastal Research 9, 785–800.
Masselink, G., Austin, M., Tinker, J., O'Hare, T., Russell, P.E., 2009. Cross-shore sedimenttransport and morphological response on a macro-tidal beach with intertidal barmorphology, Truc Vert, France. Marine Geology 251, 141–155. doi:10.1016/j.margeo.2008.01.010.
Moses, C.A., Williams, R.B.G., 2008. Artificial beach recharge: the South East Englandexperience. Zeitschrift fur Geomorphologie N.E. 52 (3), 107–124.

12 J.J. Williams et al. / Coastal Engineering 63 (2012) 3–12
Obhrai, C., Powell, K., Bradbury, A., 2008. A laboratory study of overtopping and breach-ing of shingle barrier beaches. Proc. Coastal Engineering, Hannover, Germany, pp.1497–1508.
Orford, J.D., Carter, R.W.G., Forbes, D.L., Taylor, R.B., 1988. Overwash occurrence conse-quent on morphodynamic changes following lagoon outlet closure on a coarseclastic barrier. Earth Surface Processes and Landforms 13 (1), 27–35.
Orford, J.D., Carter, R., Jennings, S., 1996. Control domains and morphological phases ingravel-dominated coastal barriers of Nova Scotia. Journal of Coastal Research 12(3), 589–604.
Orford, J.D., Forbes, D.L., Jennings, S.C., 2002. Organisational controls, typologies andtime scales of paraglacial gravel-dominated coastal systems. Geomorphology 48(1–3), 51–85.
Orford, J.D., Jennings, S., Pethick, J., 2003. Extreme storm effect on gravel dominatedbarriers. Proceedings of the International Conference on Coastal Sediments 2003.CD-ROM published by World Scientific Publishing Corp. and East Meets West Pro-ductions, Corpus Christi, Texas, USA. ISBN 981-238-422-7, 12pp.
Pedrozo-Acuna, A., Simmonds, D.J., Otta, A.K., Chadwick, A.J., 2006. On the cross-shoreprofile change of gravel beaches. Coastal Engineering 53 (4), 335–347.
Pedrozo-Acuna, A., Simmonds, D.J., Chadwick, A.J., Silva, R., 2007. A numerical-empirical approach for evaluating morphodynamic processes on gravel andmixed sand-gravel beaches. Marine Geology 241 (1–4), 1–18.
Plater, A.J., Stupples, P., Roberts, H.M., 2009. Evidence of episodic coastal change duringthe late Holocene: the Dungeness barrier complex, SE England. Geomorphologie104 (1–2), 47–58.
Puleo, J.A., 2009. Tidal variability of swash-zone sediment suspension and transport.Journal of Coastal Research 25 (4), 937–948. doi:10.2112/08-1031.1.
Pye, K., Blott, S.J., 2009. Progressive breakdown of a gravel-dominated coastal barrier,Dunwich-Walberswick, Suffolk, UK: processes and implications. Journal of CoastalResearch 25 (3), 589–602.
Riddell, K.J., Young, S.W., 1992. The management and creation of beaches for coastaldefence. Water Environment Journal 6 (6), 588–597.
Roelvink, J.A., Reniers, A.J.H.M., 1995. LIP11 D Deltaflume experiment: dataset for pro-file validation. Rept. H2130 Delft Hydraulics, Delft, Netherlands.
Rubin, D.M., 2004. A simple autocorrelation algorithm for determining grain size fromdigital images of sediment. Journal of Sedimentary Research 74, 160–165.
Shulmeister, J., Kirk, R.M., 1997. Holocene fluvial-coastal interactions on a mixed sandand sand and gravel beach system, North Canterbury, New Zealand. Catena 30 (4),337–355.
Trim, L.K., She, K., Pope, D.J., 2002. Tidal effects on cross-shore sediment transport on ashingle beach. Journal of Coastal Research SI36, 708–715.
Turner, I.L., Masselink, G., 1998. Swash infiltration-exfiltration and sediment transport.Journal of Geophysical Research 103/C13, 30813–30824.
Turner, I.L., Russell, P.E., Butt, T., 2008. Measurement of wave-by-wave bed-levels inthe swash zone. Coastal Engineering. doi:10.1016/j.coastaleng.2008.09.009.
Van Wellen, E., Chadwick, A.J., Mason, T., 2000. A review and assessment of longshoresediment transport equations for coarse grained beaches. Coastal Engineering 40(3), 243–275.


