Embed Size (px)
Citation preview

Strength Prediction of Basalt Filaments
Jiří Militký, Vladimír Kovačič
Textile Faculty, Technical University of Liberec 461 17 Liberec, Czech Republic

Outline
Basalt rocks
Fibers formation
Basic properties
Bundle strength prediction
Mechanism of fracture

Basaltic rocks
Basalt is generic name for solidified lava which poured out the volcanoes
Basaltic rocks are melted approximately in the range 1500 – 1700 C.
When this melt is quickly quenched, it solidificated to glass like nearly amorphous solid.
Slow cooling leads to more or less complete crystallization, to an assembly of minerals.
Augite Plagioclase
Olivine

Basalt composition
Chemical composition:
silicon oxide SiO2 (optimal range 43.3 – 47 %)
Al2 O3 (optimal range 11 – 13 %)
CaO (optimal range 10 – 12 %)
MgO (optimal range 8 – 11 %)
Other oxides are almost always below 5 % level
Essential minerals plagiocene and pyroxene (augite) make up perhaps 80% of basalts

Filaments formation
Classical procedure
Heat transfer from walls to center
High power (4 kWh/kg)
Long pre heating 8 hours
Spinneret materials (Platinum, rhodium)
Microwave heating
Heat transfer from center to walls
Low power (1 kWh/kg)
Short pre heating 3 hours
Spinneret materials (ceramics)
Melt after 5 min at 1300oC

Properties of Basalts
Basalts are more stable in strong alkalis that glasses.
Stability in strong acids is low
Basalt products can be used from very low temperatures (about –200 C) up to the comparative high temperatures 700 – 800 C.
At higher temperatures the
structural changes occur.
Model: Rz=a1+(100-a1)*exp(-a2*t)
y=(54,883416)+(100-(54,883416))*exp(-(0,0628529)*x)
t [hod]
Rz [
%]
C:1
C:2
C:3
C:4
C:5 C:6
60
65
70
75
80
85
90
95
100
105
0 5 10 15 20

Materials
Commercial basalt filament roving 320 tex from
company Kaneniy Vek (abbreviation KV) and basalt
filament roving 330 tex from company Basaltex
(abbreviation BAS) were used.
The diameters of individual fibers extracted from these
roving were measured from longitudinal views by using
of image analysis. From mean values the mean numbers
of fibers in roving were computed.
KV = 952 BAS = 975
Property Basalt
Density[kgm-3] 2733
Softening temp. [C] 960

Experiments
The strength of individual fibers and roving was measured on Instron TM4200 automatic testing device in standard conditions.
The fibers were mounted into paper frame before testing.
The 65 measurements of fiber breaking stress f [GPa] and corresponding fiber strain f [-] were realized.
The basalt roving strength was measured under the same conditions.

Fibrous Bundle Strength I
Assumptions:
The fiber strength obeys two parameter Weibull distribution.
Fibrous bundle is composed from parallel straight fibers clamped at both ends.
When a fiber breaks, the load is carryings by survived fibers (distributed equally among the rest of fibers).
The changes of bundle geometry and dimensions during extension are neglected.
Computation:
Estimation of fiber Weibull parameters from experimental mean strength and standard deviation.
Estimation of parallel fibrous bundle of fibers strength.

Fibrous Bundle Strength II
Let the fiber distribution is Weibull two-parameter type
The mean fiber strength and corresponding standard
deviation are
Γ(.) is gamma function. For known and computed from
experimental data is parameter C evaluated by iterative
solving of equation
1 exp C
f fF A
f
fs
1 1
1Cf A
C
1
2
2
21
11
1f f
Cs
C
f fs
1
2
2
21
1 01
1f f
Cs
C
1;9C

Fibrous Bundle Strength III
Fibrous bundles distribution - Daniel's result, that for large
bundles (number of fibers in cross section N is more that 100) is
bundle strength approaching to normal distribution
Mean strength of fibrous bundle is equal to
Standard deviation of fibrous bundle is
2
2
1exp
22 .
b b
b
bb
Hss
1 1
.exp 1Cf AC
C
2
11 1exp 1 expC
b fs AC NC C
Fiber utilization
factor
b
f
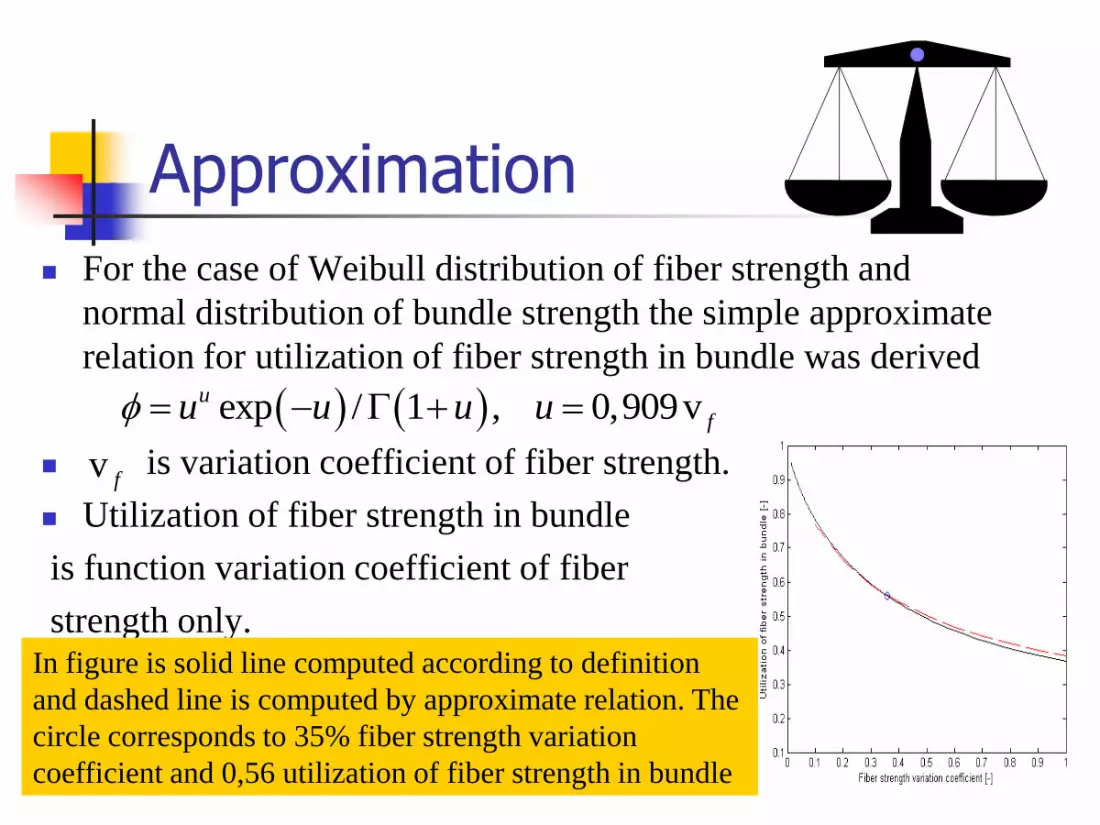
Approximation
For the case of Weibull distribution of fiber strength and
normal distribution of bundle strength the simple approximate
relation for utilization of fiber strength in bundle was derived
is variation coefficient of fiber strength.
Utilization of fiber strength in bundle
is function variation coefficient of fiber
strength only.
exp / 1 , 0,909vu
fu u u u
v f
In figure is solid line computed according to definition
and dashed line is computed by approximate relation. The
circle corresponds to 35% fiber strength variation
coefficient and 0,56 utilization of fiber strength in bundle

Results
Material KV BAS
Fiber diameter [m] 12.96 13.74
Fiber fineness [tex] 0.336 0.377
Mean fiber strength [GPa] 3.58 2.79
SD fiber strength [GPa] 1.06 0.45
CV fiber strength [%] 29.61 16.29
Mean bundle strength exp. [GPa] 1.35 0.92
SD bundle strength exp. [GPa] 0.13 0.06
Mean bundle strength pred. [GPa] 2.13 1.97
SD fiber strength pred. [GPa] 2.81 0.98
Fiber strength utilization factor 0.377 0.330

Mechanism of fracture
Surface of fibers is very smooth without flaws or crazes
Fracture occurs due to nonhomogenities in fiber volume (probably near the small crystallites of minerals)