Embed Size (px)
Citation preview
Behavioral Acoustic EmanationsAttack and Verification of PIN Entry Using Keypress SoundsPanda, Sourav; Liu, Yuanzhen; Hancke, Gerhard Petrus; Qureshi, Umair Mujtaba
Published in:Sensors (Switzerland)
Published: 01/06/2020
Document Version:Final Published version, also known as Publisher’s PDF, Publisher’s Final version or Version of Record
License:CC BY
Publication record in CityU Scholars:Go to record
Published version (DOI):10.3390/s20113015
Publication details:Panda, S., Liu, Y., Hancke, G. P., & Qureshi, U. M. (2020). Behavioral Acoustic Emanations: Attack andVerification of PIN Entry Using Keypress Sounds. Sensors (Switzerland), 20(11), [3015].https://doi.org/10.3390/s20113015
Citing this paperPlease note that where the full-text provided on CityU Scholars is the Post-print version (also known as Accepted AuthorManuscript, Peer-reviewed or Author Final version), it may differ from the Final Published version. When citing, ensure thatyou check and use the publisher's definitive version for pagination and other details.
General rightsCopyright for the publications made accessible via the CityU Scholars portal is retained by the author(s) and/or othercopyright owners and it is a condition of accessing these publications that users recognise and abide by the legalrequirements associated with these rights. Users may not further distribute the material or use it for any profit-making activityor commercial gain.Publisher permissionPermission for previously published items are in accordance with publisher's copyright policies sourced from the SHERPARoMEO database. Links to full text versions (either Published or Post-print) are only available if corresponding publishersallow open access.
Take down policyContact [email protected] if you believe that this document breaches copyright and provide us with details. We willremove access to the work immediately and investigate your claim.
Download date: 31/03/2022
sensors
Article
Behavioral Acoustic Emanations: Attack andVerification of PIN Entry Using Keypress Sounds
Sourav Panda 1, Yuanzhen Liu 2 , Gerhard Petrus Hancke 2,* and Umair Mujtaba Qureshi 2,3
1 Department of Computer Science and Engineering, University of California, Riverside, CA 92521, USA;[email protected]
2 Department of Computer Science, City University of Hong Kong, Hong Kong, China;[email protected] (Y.L.); [email protected] (U.M.Q.)
3 Department of Telecommunication Engineering, Mehran University of Engineering and Technology,Jamshoro 76062, Sindh, Pakistan
* Correspondence: [email protected]; Tel.: +852-3442-9341
Received: 29 April 2020; Accepted: 22 May 2020; Published: 26 May 2020�����������������
Abstract: This paper explores the security vulnerability of Personal Identification Number (PIN) ornumeric passwords. Entry Device (PEDs) that use small strings of data (PINs, keys or passwords) asmeans of verifying the legitimacy of a user. Today, PEDs are commonly used by personnel in differentindustrial and consumer electronic applications, such as entry at security checkpoints, ATMs andcustomer kiosks, etc. In this paper, we propose a side-channel attack on a 4–6 digit random PIN key,and a PIN key user verification method. The intervals between two keystrokes are extracted from theacoustic emanation and used as features to train machine-learning models. The attack model has a60% chance to recover the PIN key. The verification model has an 88% accuracy on identifying theuser. Our attack methods can perform key recovery by using the acoustic side-channel at low cost.As a countermeasure, our verification method can improve the security of PIN entry devices.
Keywords: side-channel attack; personal identification number; biometric verification; PINentry device
1. Introduction
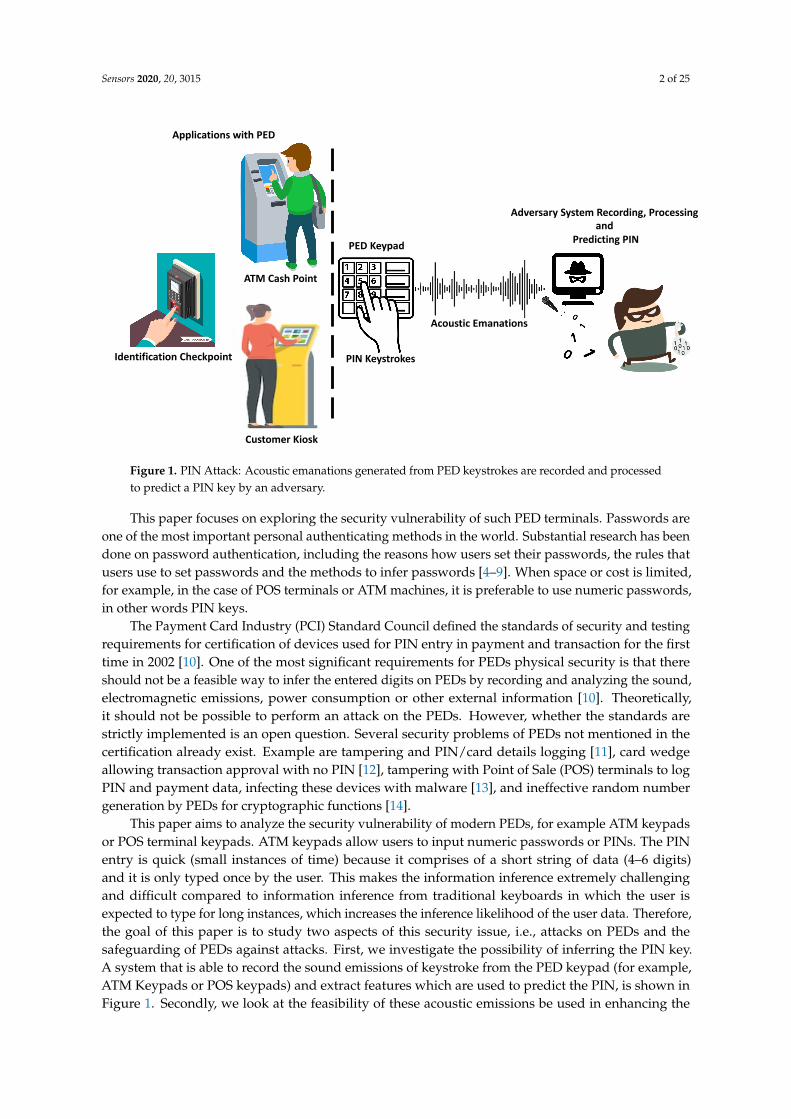
The Internet of Things (IoT) refers to a network of tiny small wireless sensors that communicatewith each other via the Internet [1]. Today, IoT provides a wide range of consumer applications [2]. IoTdevices are resource constrained devices which makes them an attractive target for attacks [3]. To accessdifferent applications and services, user authentication and verification is the first layer of security.Failing to authentication and verification process leads to denial of service. For example, authenticationand verification processes are commonly used in Automated Teller Machines (ATMs) and Point ofSale (POS) terminals which are resource constrained systems. The process of authentication andverification is important as it allows legitimate personnel to enter and perform various operations intheir respective environments. Personal Identification Number (PIN) keys or numeric passwords arewidely used in such resource constrained environments. PIN key is basically small and unique stringof data that is ubiquitously used for user authentication and verification. Usually, PIN key is typedinto PIN entry device (PED) or terminal as shown in Figure 1.
Sensors 2020, 20, 3015; doi:10.3390/s20113015 www.mdpi.com/journal/sensors
Sensors 2020, 20, 3015 2 of 25
ATM Cash Point
Customer Kiosk
Identification Checkpoint
Applications with PED
PIN Keystrokes
PED Keypad
Acoustic Emanations
Adversary System Recording, Processingand
Predicting PIN
Figure 1. PIN Attack: Acoustic emanations generated from PED keystrokes are recorded and processedto predict a PIN key by an adversary.
This paper focuses on exploring the security vulnerability of such PED terminals. Passwords areone of the most important personal authenticating methods in the world. Substantial research has beendone on password authentication, including the reasons how users set their passwords, the rules thatusers use to set passwords and the methods to infer passwords [4–9]. When space or cost is limited,for example, in the case of POS terminals or ATM machines, it is preferable to use numeric passwords,in other words PIN keys.
The Payment Card Industry (PCI) Standard Council defined the standards of security and testingrequirements for certification of devices used for PIN entry in payment and transaction for the firsttime in 2002 [10]. One of the most significant requirements for PEDs physical security is that thereshould not be a feasible way to infer the entered digits on PEDs by recording and analyzing the sound,electromagnetic emissions, power consumption or other external information [10]. Theoretically,it should not be possible to perform an attack on the PEDs. However, whether the standards arestrictly implemented is an open question. Several security problems of PEDs not mentioned in thecertification already exist. Example are tampering and PIN/card details logging [11], card wedgeallowing transaction approval with no PIN [12], tampering with Point of Sale (POS) terminals to logPIN and payment data, infecting these devices with malware [13], and ineffective random numbergeneration by PEDs for cryptographic functions [14].
This paper aims to analyze the security vulnerability of modern PEDs, for example ATM keypadsor POS terminal keypads. ATM keypads allow users to input numeric passwords or PINs. The PINentry is quick (small instances of time) because it comprises of a short string of data (4–6 digits)and it is only typed once by the user. This makes the information inference extremely challengingand difficult compared to information inference from traditional keyboards in which the user isexpected to type for long instances, which increases the inference likelihood of the user data. Therefore,the goal of this paper is to study two aspects of this security issue, i.e., attacks on PEDs and thesafeguarding of PEDs against attacks. First, we investigate the possibility of inferring the PIN key.A system that is able to record the sound emissions of keystroke from the PED keypad (for example,ATM Keypads or POS keypads) and extract features which are used to predict the PIN, is shown inFigure 1. Secondly, we look at the feasibility of these acoustic emissions be used in enhancing the
Sensors 2020, 20, 3015 3 of 25
security level of PEDs. The assumption is that each user exhibits a unique behavior while entering thePIN keys. This behavior can be seen as a fingerprint and as a way to verify the key holder’s identity,thus acting as an authentication layer that is able to prevent the attack or key theft, and at the sametime preserving the public’s confidence in these systems. Thus, the contribution of this paper is asfollows:
• An investigation into the security vulnerability of PEDs by performing a PIN key recover attack onthe random six-digit PIN number by using the acoustic emanation generated by the PED keypads.
• Proposing the behavioral acoustic emanations as a countermeasure and verification method for aPIN key user’s identity.
The remainder of the paper is organized as follows: Section 2 presents our review of workpresented in the literature on PIN attacks and preventative measures. Section 3 presents the key PINrecovery attack, along with the methodology through acoustic emanations.
Section 4 explains the idea of user verification by using behavioral acoustics generated from thePEDs to authenticate user identity and prevent key PIN attacks. Section 5 concludes the paper.
2. Literature Review
In this section, we review the most relevant work in the context of information inference of userdata (Password, Key or PIN). Generally, users lock their information by typing a password or PINinto the system via a keyboard or keypad. The password or PIN entry into the system generatesdifferent kinds of emissions, which are exploited by adversaries to breach the system’s security forinformation theft purposes. In this section, we first present a review of the literature on emissionsecurity, side-channel analysis and key recovery methods from different sensors to have an insightinto different attack models and approaches used to recover a key from the system. In the next sectionwe shall review countermeasures and approaches present in the literature to prevent key theft.
2.1. Emission Security and Side-Channel Analysis
Early in the 1960s researchers noticed that systems could leak information unintentionallyby electromagnetic, optical or acoustic emissions [15,16]. This type of work, including obtaininginformation from unintentional emission analysis and preventing emission from leaking, is known asTEMPEST [17] in the intelligence and military communities. One feasible method to infer datawas intercepting electromagnetic emissions from cables, such as RS-232 or PS/2 [18,19]. Otherattacks also exist, for example, recovering printed documents by the sound of the printer [20], orreconstructing the sent data from communication equipment by the LED status indicators [21]. Whenthe display technology was improved, some researchers also aimed at monitoring video displays byboth electromagnetic and optical emanations [22–24]. The latest research can even eavesdrop froma cell phone screen or from tablet screen [25–28]. The work presented in [25], the authors presentsa side-channel attack to retrieve PIN from a cell phone screen. The attack was devised by usingtwo microphone or mics embedded in a cell phone to listen the digit taps when the PIN is entered.The authors used Time Difference of Arrival (TDOA) technique to infer the location of each soundsource and then it maps with Keypad layout to identify the character/digit with accuracy greater than50%. The limitation of the work is that authors attempted to identify single character/digit each timeinstead of the combine PIN. The emanations generated during a PIN entry (quick taps) can resultin similar sounds which can lead to false positioning of the digits. The work presented in [26], theauthors presents a mathematical model used to devise character and digit recovery attack from victim’scell phone screen. The attack derives prior information such as location of the victim cell phone inrelative the location of the adversary and studies. The authors report that to successfully infer thecharacter or digit tap information, the distance between the victim and adversary needs to be less than60 cm. However, in [27], the authors present acoustic side-channel attack to retrieve the lock pattersby using the mic embedded in an android cell phones. The authors use a cellphone application to
Sensors 2020, 20, 3015 4 of 25
record the emanations of lock pattern and used to noise rejection filter, signal segmentation, relativemovement measurement to infer the pattern of the fingertips. The author reports an accuracy of72% for successfully recovering screen lock patterns and propose dynamic instead of linear patters tostrengthen the security. From these successive attacks on the display, we can draw a conclusion thatdata reconstruction from emissions is highly correlated with the hardware design of the destinationdevices. The same applies to keypads. The physical design of keypads may lead to various emissions,such as sound and vibration. Side-channel analysis aims at reconstructing the plaintext, passwords orother information by gaining information from the hardware. In general, the side-channel attack is notaggressive. Instead of a direct attack on the information, it is targeted at gaining data from timing [29],power consumption [30] or electronic emissions [31] while the device is working. Acoustic side-channelattacks are proved to be possible [32]. The side-channel attack is so useful that it even changed thethreat model, design and certification testing of secure hardware since the late 1990s [33,34]. From theabove cases we can draw the conclusion that when designing a security component, it is necessary toconsider side-channel information leakage.
2.2. Key Recovery from Sensors
In recent years, smart devices are widely used in the industrial environment. The sensitiveinformation may be unintentionally captured by the devices. If malicious applications were installed inthe devices, this may lead to information leakage [35]. In fact, the side-channel attacks on the recoveryof passwords by analyzing the data from different sensors, such as images, sound and acceleration,have already been proved to be possible [36–40].
Simon et al. (2013) suggested a new side-channel attack on PINs by gathering data from a mobilephone’s front camera and microphone [41]. They used a gaming approach (game application) toperform the attack, including data collection, feature extraction, training a model, recording dataand analyzing results. They used a Support Vector Machine to train the data from two users and got35–50% prediction accuracy. Next, they tried to recover a PIN key with video and audio streams, butfound that this method required 5 or more attempts to achieve an accuracy of more than 50%
Owusu et al. (2012) suggested that accelerometers can be used to infer passwords [39]. Theycollected data in two ways. The first was the area mode, dividing the screen into a 10 by 6 buttonarray. This mode was used to test how the sampling rate can affect the accuracy of key inferenceand the information leakages of different screen regions. 1300 key presses were collected in thismode. The result showed that a sample rate equal to or above 100 Hz can present the best results.The other method was character mode. This mode was used to test the keystroke reconstruction attack.Acceleration data affiliated with key pressing was recorded with pre-processing for feature extractionand used this data for classification. The authors found that a Random Forest classification algorithmdelivered the best results. It successfully cracked 59 of 99 passwords. Liu et al. (2015) suggested aside-channel attack on keystrokes by using accelerometer data of a user’s smartwatch [40]. To attackthe POS terminal, they recorded the POS terminal keypad motion and used K-Nearest Neighbor toselect the best option. The authors recorded 4920 movements, including 3720 motions between twonumbers and 1200 “Enter” button movements. The highest accuracy for one-time recovery could reach65%. Since most POS machines allowed a user to input 3 times, the accuracy could be improved toaround 85%.
Asonov et al. (2004) used acoustic emanations and performed the attack to recognize the keypressing by applying a neural network [36]. They extracted features from raw acoustic signals byapplying a Fourier Transform with 2–3 ms or 8–10 ms window to the signals to find push peaks andtrained the system with user keystrokes on a standard QWERTY keyboard.
The result showed that a network trained for one person can be applied to attack another person’skey pressing on the same keyboard. However, when the keyboard changed, the success rate droppedto 28%. This means that the neural network is only applicable on the keyboard that is used to generatethe training set. The main reason for sound differences between keys is the different positions on
Sensors 2020, 20, 3015 5 of 25
the keyboard plate. We make a conclusion in this paper that the sound tune was actually used todifferentiate between the key pressings.
Zhuang et al. (2005) tried to improve the method. They used cepstrum to extract features.In addition, they used unsupervised key recognition (K-Means) to classify the keystrokes with a largernumber of keys of the keyboard [37]. Then they applied a Hidden Markov Model to determine the keysequence to improve the accuracy along with spelling and grammar checking to yield the accuracy rateand trained their classifiers. Their experimental results showed that linear classification and Gaussianmixtures had a better performance than a neural network.
Zhu et al. (2014) presented a method to recover keystrokes (push and release) without contextanalysis [38]. Their analysis indicated that the minimal distinguishable distance between two soundsources was (343 m/s)/(44.1 kHz) 0.77 cm, which is less than the distance between two adjacent keyson the keyboard. They used two or more mobile phones in different places to record the sound fromthe keyboard, which were pre-processed to find the sound peak in each 100 ms. The experimentsshowed that 3 or more phone microphones lead to more accurate results. Time sync was a sensitiveproblem in this method. To address this problem, they used a fixed distance between keyboard andphones to synchronize the time. The accuracy of this method was quite acceptable, as more than 72.2%keys were recovered.
Cardaioli et al. suggested a PIN inference method by analyzing user’s typing behavior [42].The behavior features are extracted from audio signal; They used thermal camera to retrieve moreinformation to raise the accuracy. Faria et al. performed a new side-channel attack on PIN pads [43].They used two inner mics to record audio and differential analysis of the vibration signal differencesbetween the keystrokes to infer the PIN.
2.3. Preventative Measures against Key Recovery Approaches
Researchers supposed various methods of attack on PEDs. These attacks focused on the keystroke to recover the PIN. Many countermeasures against side-channel attacks were suggested,including changing the physical architecture of devices [44,45] and adding noise to the side-channelemanation [46,47]. Another possible method is adding an additional verification layer combined withPINs. There are three main streams of verification methods, i.e., biometrics, keystroke dynamics andactive authentication.
2.3.1. Biometrics
Biometrics are unique physical traits and behavioral characteristics that work as excellentcandidates for automated recognition and authentication [48]. Conventionally, biometrics aresub-classified into Physiological and Behavioral characteristics [49]. Instances of physiologicalauthentication systems include fingerprint scanning, face recognition, and DNA recognition. These arestatic features and are unique across a large domain of users. On the contrary, behavioral traits includethe amplitude and pitch of a user’s voice, the way people sign their names, and their keyboardtyping patterns. Unlike the former, behavioral characters are dynamic and are revealing of the user’spsychological composition (cognitive fingerprint) instead of stable physical features [50]. Therefore,resilience is a concern as a sudden and gradual deviation from expected user behavior is inevitableand requires a robust system capable of adapting to change over a prolonged period. In comparison tophysiological traits, behavior authentication is inexpensive and passive.
Researchers have also asserted that for the foreseeable future, biometric services will noteliminate issued ID cards and password PINs, but rather complement the identification processand accountability of the authentication workflow [51]. Furthermore, behavioral biometrics neveryield an absolute match between the expected and the input during the verification step. As aresult, the False Acceptance Rate (FAR) and the False Rejection Rate (FRR) are not as low as theones provided by physiological verification. Therefore, behavioral factors alone cannot constitute areliable authentication system for the various extrinsic factors involved, such as mood and fatigue.
Sensors 2020, 20, 3015 6 of 25
Ogihara et al. (2006) proposed a verification method using biometric features [52]. By both calculatingthe similarities of key press timing between current operators and users and comparing extractedhand shape features, they can improve the security of ATM authentication. One method was key presstiming. To process a 4-digit PIN, they calculated the press and release time for each key, and the timebetween two adjacent PIN key number. Another method was extraction of hand shape features. If thetwo methods were used separately, the error rates were between 10% to 25%. If the two methods werecombined, the error rate was reduced to 1.1%.
2.3.2. Active Authentication
Presently, active authentication is the norm when it comes to validating the identity of a user foraccess applications [53,54]. It requires explicit user interaction (a passphrase or inputting a fingerprint,etc.) which authorizes the user based on the legitimacy of the input. If successfully authorized,the user is provisioned system resources until session timeout, or until the user voluntarily logsout. Any activity during this session period is accounted to the authenticated user and an impostorphysically present at the system cannot be detected. Furthermore, after a session timeout, users mustdigress from their intended objective in mind to perform the cumbersome authorization step, yetagain. Active authentication alleviates these complications by continuously authenticating users onthe way they interact with the environment. These interactions construct the cognitive fingerprint ofthe user and reveal how the brain processes the technology in hand. Active authentication has thepotential to detect intruders after successful authentication, and cases where the user’s password havebeen compromised. Additionally, since the interaction depends on the technology in hand, softwarecould also be devised to help employers distinguish between employees working from home andoffice. This research work argues that the latencies between the successive keystrokes, key duration,finger placement and applied pressure can be used to construct a unique cognitive signature for auser in a non-intrusive manner [51]. This work studied Euclidean distance, non-weighted probability,and weighted probability algorithms to determine the authenticity of a user typing a username andpassword. The authors report an authentication accuracy of 83.22% with Euclidean distance, 85.63%accuracy with non-weighted probability and 87.18% accuracy with weighted probability.
The works reviewed above explains different PIN recovery attack models used along withcountermeasure approaches present in the literature. For PIN recovery attack, our focus is to devisea simple yet effective methodology. The works [13,38] provide us with an interesting insight thatmotivates the consideration of a PIN key recovery attack on modern PEDs. We derive our methodologyfrom these two works that focus on using time intervals of keystrokes generated from acousticemanations of the PEDs. The methodology is composed of simple common-off-the-shelf (COTS)devices which consider features that can be easily be extracted from acoustic emanations. PIN Keyrecovery through acoustic emanations is unique and the methodology is devised such that it act as ageneral framework that can be readily formed and applied to any modern PED that uses small stringsof data. It covers groups of PINs no matter that they are random or not, which is different. This makesour methodology simple yet effective compared to attack models reviewed above. Also, our approachovercomes the shortcomings and limitations of [13,37,43] and the feasibility of application in real life isimproved compared to the method of [25,38].
To defend PIN attack and verify the identity of the person when entering a PIN, we used theacoustic emanations to extract the timing feature, which saves save many time, space and powercompared to Ogihara’s method [52], which used camera to record the motion of hand. Moreover,microphones are cheaper than cameras. In comparison, our method’s cost is lower, both in the requireddevices and computational power. Compared to current active authentication [53], the lower cost isalso an advantage of our method. Active authentication requires a fingerprint, this means we need afingerprint sensor, which is more expensive than a microphone, to do the recording. If we use a mobilephone to perform active authentication, we need to send messages to the user. The vendor will chargefor the message fee when authentication is performed, whereas our preventative measure eradicates
Sensors 2020, 20, 3015 7 of 25
these issues. The proposed behavioral acoustic detection for user verification is simple and novel thatcan successfully prevent a KEY PIN recovery attack and acts as an authentication security layer formodern PEDs. In the subsequent sections both the PIN recovery attack based on acoustic emanationsand verification based on behavioral acoustics of PIN key users are explained.
3. Acoustic Side-Channel PIN Recovery
The advent of Artificial Intelligence (AI) and automation is slowly obviating the need for cashiersin supermarkets and grocery stores, making self-checkout lines increasingly popular. Although theseservices are convenient from the consumer’s outlook, they do pose serious security implications forthem. For instance, the checkout kiosk can collect data pertinent to the user’s behavioral characteristicsand exploit them to recover data entered over third party trusted interfaces using side-channel analysis.To better understand this, consider the following application-threat model.
3.1. Application-Threat Model: PIN Key Recovery by Using Acoustic Emanations at Customer Kiosks
In this application-threat model, we consider an automated self-check-out machine in an industrycanteen that does the job of calculating the total bill and collecting the payment using a debit cardtransaction. The kiosk is assumed to be fitted with a microphone device that is equipped to connect tothe customer service for assistance. Now, when the customer completes the item checkout process, heis prompted to enter some information (e.g., a telephone number) or key that allows the microphoneto collect data regarding the user characteristics using keystroke acoustic emanations. Once thissystem is trained with the user’s habitual typing patterns, it prompts the user to enter his debit cardand PIN number, which is obfuscated by the trusted banking interface. The idea is to exploit theseacoustic emanations carefully such that the system can predict the PIN. To perform such an attack, themethodology followed is explain below.
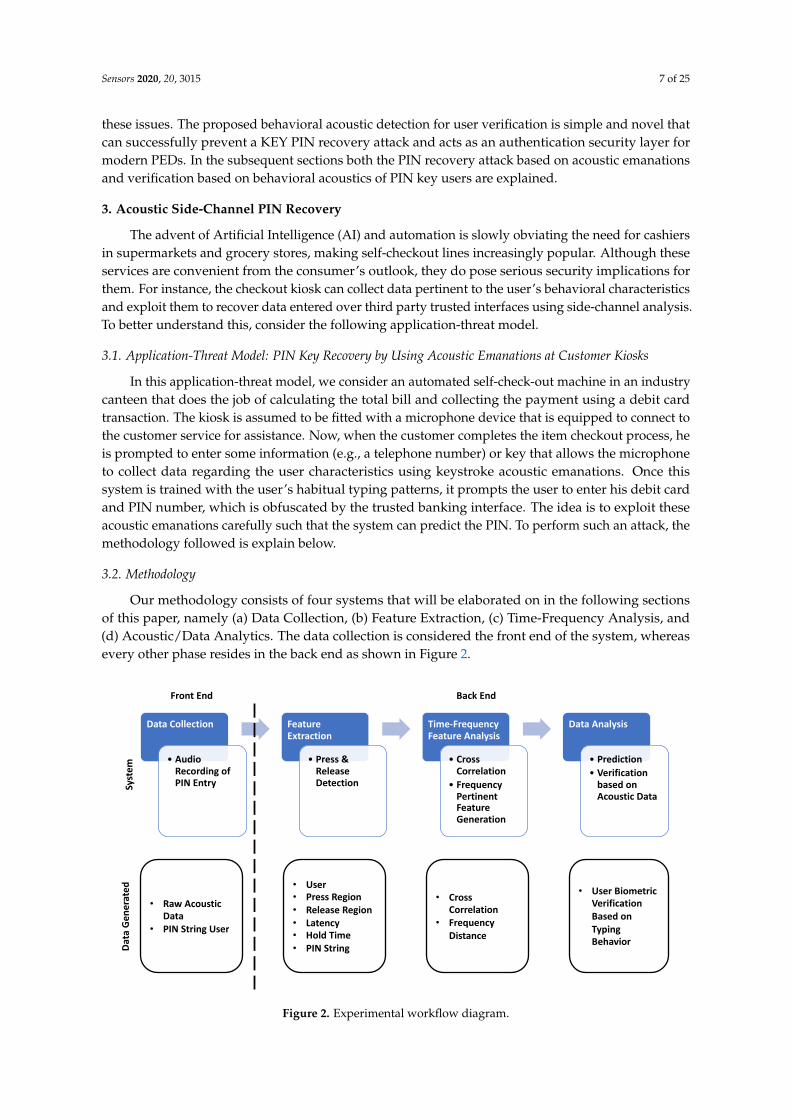
3.2. Methodology
Our methodology consists of four systems that will be elaborated on in the following sectionsof this paper, namely (a) Data Collection, (b) Feature Extraction, (c) Time-Frequency Analysis, and(d) Acoustic/Data Analytics. The data collection is considered the front end of the system, whereasevery other phase resides in the back end as shown in Figure 2.
Data Collection
• Audio Recording of PIN Entry
Feature Extraction
• Press & Release Detection
Time-Frequency Feature Analysis
• Cross Correlation
• Frequency Pertinent Feature Generation
Data Analysis
• Prediction• Verification
based on Acoustic Data
• Raw Acoustic Data
• PIN String User
• User• Press Region• Release Region• Latency• Hold Time• PIN String
• Cross Correlation
• FrequencyDistance
• User Biometric Verification Based on Typing BehaviorDa
ta G
ener
ated
Front End
Syst
em
Back End
Figure 2. Experimental workflow diagram.
Sensors 2020, 20, 3015 8 of 25
3.2.1. Data Collection
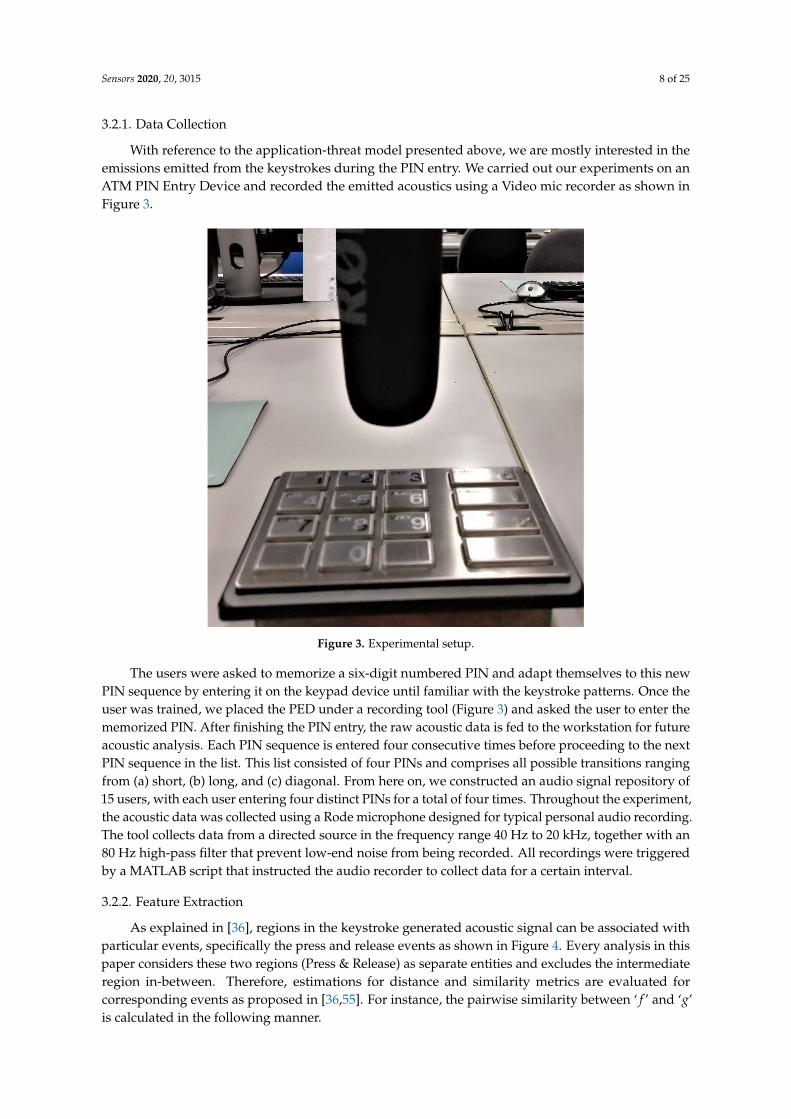
With reference to the application-threat model presented above, we are mostly interested in theemissions emitted from the keystrokes during the PIN entry. We carried out our experiments on anATM PIN Entry Device and recorded the emitted acoustics using a Video mic recorder as shown inFigure 3.
Figure 3. Experimental setup.
The users were asked to memorize a six-digit numbered PIN and adapt themselves to this newPIN sequence by entering it on the keypad device until familiar with the keystroke patterns. Once theuser was trained, we placed the PED under a recording tool (Figure 3) and asked the user to enter thememorized PIN. After finishing the PIN entry, the raw acoustic data is fed to the workstation for futureacoustic analysis. Each PIN sequence is entered four consecutive times before proceeding to the nextPIN sequence in the list. This list consisted of four PINs and comprises all possible transitions rangingfrom (a) short, (b) long, and (c) diagonal. From here on, we constructed an audio signal repository of15 users, with each user entering four distinct PINs for a total of four times. Throughout the experiment,the acoustic data was collected using a Rode microphone designed for typical personal audio recording.The tool collects data from a directed source in the frequency range 40 Hz to 20 kHz, together with an80 Hz high-pass filter that prevent low-end noise from being recorded. All recordings were triggeredby a MATLAB script that instructed the audio recorder to collect data for a certain interval.
3.2.2. Feature Extraction
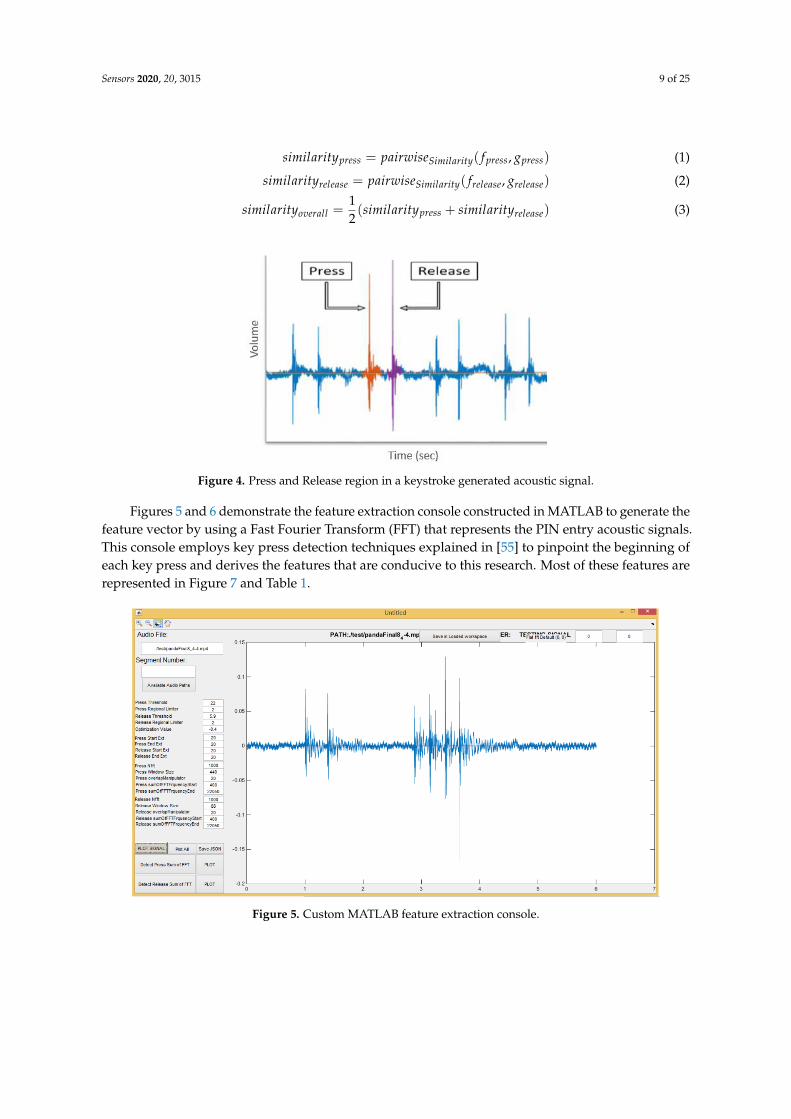
As explained in [36], regions in the keystroke generated acoustic signal can be associated withparticular events, specifically the press and release events as shown in Figure 4. Every analysis in thispaper considers these two regions (Press & Release) as separate entities and excludes the intermediateregion in-between. Therefore, estimations for distance and similarity metrics are evaluated forcorresponding events as proposed in [36,55]. For instance, the pairwise similarity between ‘ f ’ and ‘g’is calculated in the following manner.
Sensors 2020, 20, 3015 9 of 25
similaritypress = pairwiseSimilarity( fpress, gpress) (1)
similarityrelease = pairwiseSimilarity( frelease, grelease) (2)
similarityoverall =12(similaritypress + similarityrelease) (3)
Figure 4. Press and Release region in a keystroke generated acoustic signal.
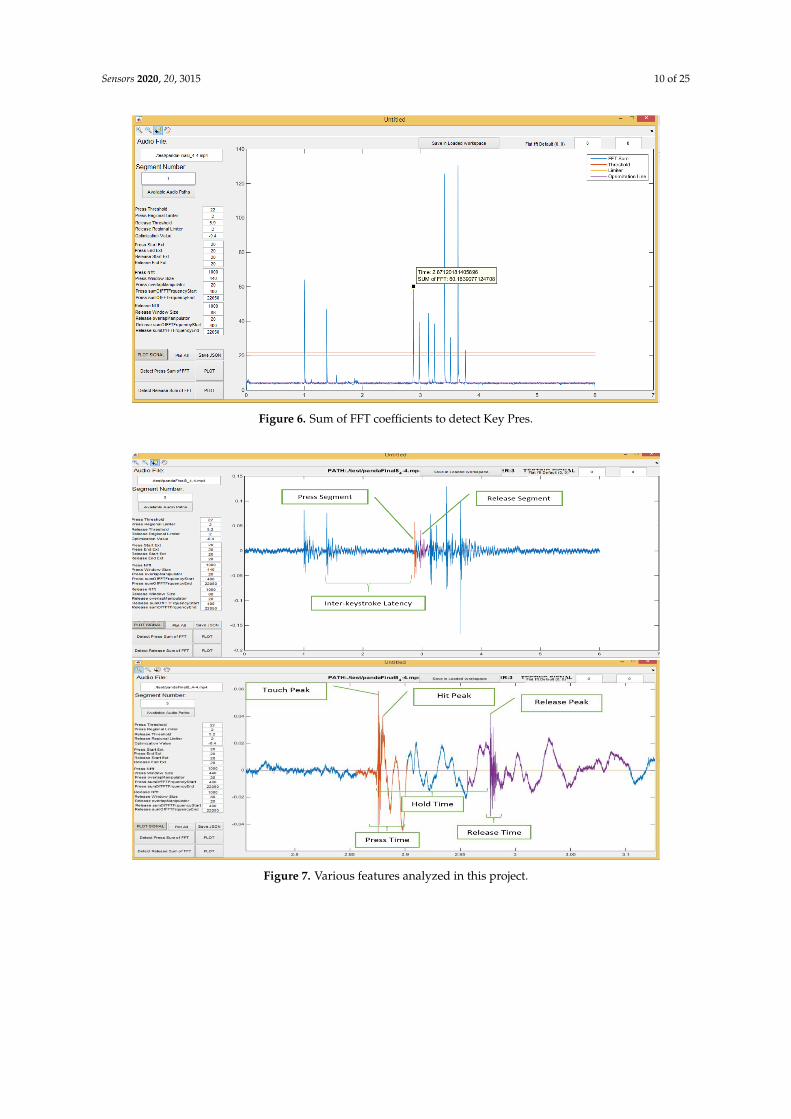
Figures 5 and 6 demonstrate the feature extraction console constructed in MATLAB to generate thefeature vector by using a Fast Fourier Transform (FFT) that represents the PIN entry acoustic signals.This console employs key press detection techniques explained in [55] to pinpoint the beginning ofeach key press and derives the features that are conducive to this research. Most of these features arerepresented in Figure 7 and Table 1.
Figure 5. Custom MATLAB feature extraction console.
Sensors 2020, 20, 3015 10 of 25
Figure 6. Sum of FFT coefficients to detect Key Pres.
Figure 7. Various features analyzed in this project.
Sensors 2020, 20, 3015 11 of 25
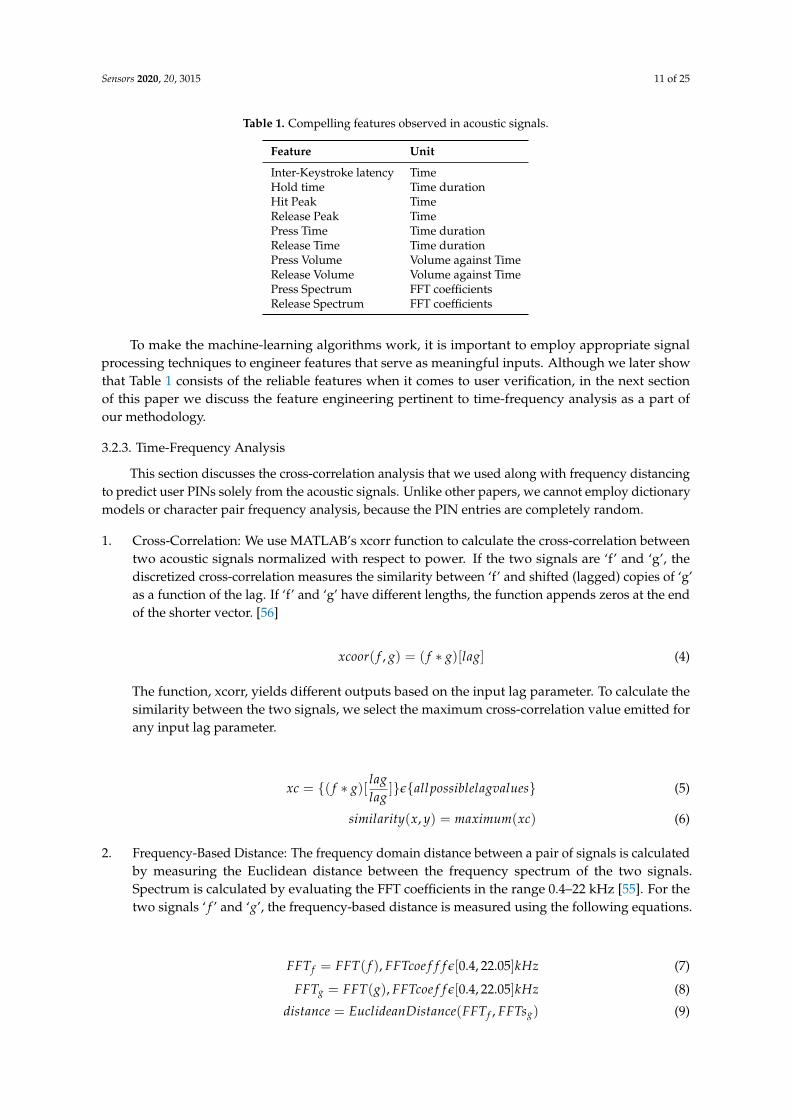
Table 1. Compelling features observed in acoustic signals.
Feature Unit
Inter-Keystroke latency TimeHold time Time durationHit Peak TimeRelease Peak TimePress Time Time durationRelease Time Time durationPress Volume Volume against TimeRelease Volume Volume against TimePress Spectrum FFT coefficientsRelease Spectrum FFT coefficients
To make the machine-learning algorithms work, it is important to employ appropriate signalprocessing techniques to engineer features that serve as meaningful inputs. Although we later showthat Table 1 consists of the reliable features when it comes to user verification, in the next sectionof this paper we discuss the feature engineering pertinent to time-frequency analysis as a part ofour methodology.
3.2.3. Time-Frequency Analysis
This section discusses the cross-correlation analysis that we used along with frequency distancingto predict user PINs solely from the acoustic signals. Unlike other papers, we cannot employ dictionarymodels or character pair frequency analysis, because the PIN entries are completely random.
1. Cross-Correlation: We use MATLAB’s xcorr function to calculate the cross-correlation betweentwo acoustic signals normalized with respect to power. If the two signals are ‘f’ and ‘g’, thediscretized cross-correlation measures the similarity between ‘f’ and shifted (lagged) copies of ‘g’as a function of the lag. If ‘f’ and ‘g’ have different lengths, the function appends zeros at the endof the shorter vector. [56]
xcoor( f , g) = ( f ∗ g)[lag] (4)
The function, xcorr, yields different outputs based on the input lag parameter. To calculate thesimilarity between the two signals, we select the maximum cross-correlation value emitted forany input lag parameter.
xc = {( f ∗ g)[laglag
]}ε{allpossiblelagvalues} (5)
similarity(x, y) = maximum(xc) (6)
2. Frequency-Based Distance: The frequency domain distance between a pair of signals is calculatedby measuring the Euclidean distance between the frequency spectrum of the two signals.Spectrum is calculated by evaluating the FFT coefficients in the range 0.4–22 kHz [55]. For thetwo signals ‘ f ’ and ‘g’, the frequency-based distance is measured using the following equations.
FFTf = FFT( f ), FFTcoe f f f ε[0.4, 22.05]kHz (7)
FFTg = FFT(g), FFTcoe f f ε[0.4, 22.05]kHz (8)
distance = EuclideanDistance(FFTf , FFTsg) (9)
Sensors 2020, 20, 3015 12 of 25
Time-Frequency analysis is classical approach commonly used in feature extraction in differentbehavioral authentication mechanisms [42]. In our case, Time-frequency analysis helps in extractionof useful features such as hold time and release time etc. (rest are mentioned in Table 1)) fromthe acoustic emanations generated from the keystrokes during PIN entry. Based on the featuresextracted from time-frequency analysis, the system is trained with different machine-learning models.The machine-learning models used are discussed in the next section.
3.2.4. Machine-Learning Models and Assessments
We use the extracted features to train the machine learning models and make predictions.We analyze the robustness against certain criteria by indicating the FAR FRR and TAR of the models.
1. Machine Learning: This work evaluates three machine-learning models, specifically:
(a) Gaussian Naïve Bayes (Gaussian NB)(b) Logistic Regression (LR), and(c) Support Vector Machines (SVM)
In our task, we know the input and we know what the output should be; however, we do nothave an algorithm to transform the input to the output. When we meet this situation, we cantry machine-learning. Our dataset can be labeled as positive and negative examples, e.g., if thePIN is entered by User 1, we mark it positive, otherwise we mark negative. Supervised learningis suitable for the labeled data [57]. We extract 10 kinds of features from the raw acoustic data,including inter-keystroke latency, hold time, hit peak, release peak, press time, release time,press volume, release volume, press spectrum, release spectrum. We want to find which featurecontribute most to help us to make decision. Gaussian Naïve Bayes classifier distributes thesame representational power to each feature [58]. Thus, we applied the Gaussian Naïve Bayesclassifier to the dataset and found when we use latency and hold time as features, we can getthe best result. The latency and hold time are categorical features, the expected outcomes, e.g.,User 1 entered the PIN, are categorical as well. In this situation, logistic regression is suited todescribe the relationship between features and outcomes [59]. The SVM can add exponents tothe feature and raise the accuracy of the model [60], this can neutralize the negative effect ofthe small number of features in our case. In Section 3.3, our goal is to prove the threat that useacoustic emanation to recover a PIN is possible. Thus, we only trained a logistic regression model.In Section 4, the essential part of this paper, we tried 3 models to reach the best accuracy in userverification.
2. False Acceptance Rate (FAR), False Rejection Rate (FRR) and True Acceptance Rate (TAR): Thissection provides a description of metrics for the evaluation of Biometric performance. FAR andFRR are used in assessing authentication or verification system, e.g., [61,62]. True acceptancerate means the accuracy of the prediction model. Typically, setting a global acceptance thresholdrequires considering the tradeoff between the false acceptance rate and false rejection rate.
(a) FAR: This is the measure of the likelihood that the security system will incorrectly acceptan access attempt by an unauthorized user.
FAR =Number of false acceptance
Number of identification attempts(10)
(b) FRR: This is the measure of the likelihood that the security system will incorrectly rejectan access attempt by an authorized user.
FRR =Number of false rejections
Number of identification attempts(11)
Sensors 2020, 20, 3015 13 of 25
(c) TAR: This is the measure of the likelihood that the security system will correctly accept anaccess attempt by an authorized user.
TAR =Number of true acceptance
Number of identification attempts(12)
This methodology is devised such that it can be applied and integrated to any POS terminal ormachine. The system records the acoustic emanations, then extracts press and release time intervalfeatures that are conducive to identify the user for future access attempts. The methodology isnon-invasive, meaning that the features are not derived from a data feed generated by the ATMmachine, but rather collected externally using a microphone, with background noise cancellationand omission of certain known frequencies like the ATM’s feedback sound. This modular approachsignificantly reduces the cost of integrating the reinforcement and compares inexpensive to othercandidates such as iris detection and fingerprint scanning, as it only requires an additional audiorecording module. The methodology presented acts as general framework that is simple to implementand execute on any keyboard or PED keypads. In the following section we shall present our experimentand results in the light of the application-threat model presented above to recover a key PIN.
3.3. Experiment and Results
During the PIN entry the microphone collects the acoustic data and performs time frequencydecoding [55] to recover the PIN entered by the user. The objective is to analyze the risk of such anattack that can be implemented by shopkeepers on a point of sales terminal (POS) or a self-checkoutkiosk. The experiment was performed in the following steps:
• An audio signal repository was established for the key presses 1, 5, 6, 8, 9, and 7 for a targeted user.• The repository was divided into testing and training sets.• Then a similarity function was implemented using pairwise cross-correlation.• Each testing and training keystroke ‘f’, was transformed into a feature vector that consisted of
six elements. Each element describes the average similarity of ‘f’ against the acoustic emanationsgenerated from a specific key source. (i.e., feature(f) = similarity to key 1, similarity to key 5,similarity to key 6 and so on)
• The features are then plotted for the press and release regions followed by min-max scaling.
The data analysis considers different inputs and yields outputs that discern the ATM PINs enteredby the user.
3.3.1. Time-Frequency Analysis
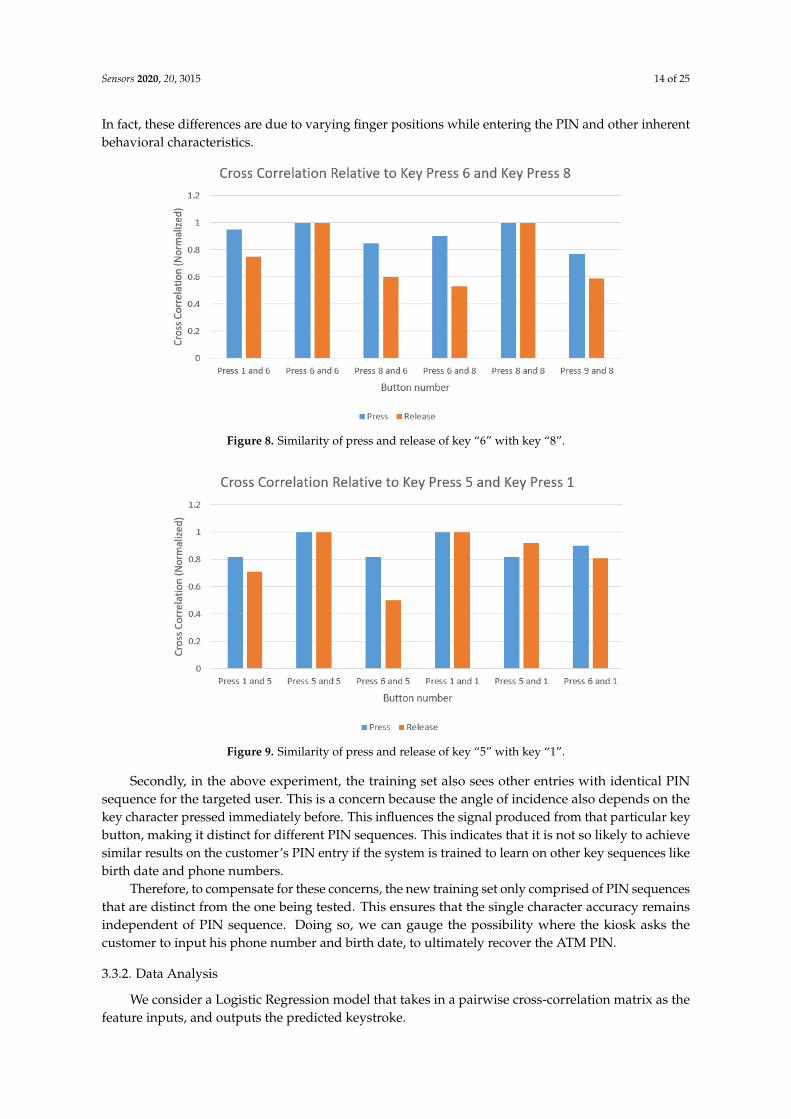
Our initial experimental results show that simple cross-correlation analysis of keystroke acousticemissions could indicate the correct keystroke if trained on a device for a targeted user. The empiricaldata suggests that emanations produced from a specific key exhibit higher similarity to presses of thesame key than that of other keys as shown in Figures 8 and 9.
As the correlation plot itself provided perceptible evidence to discern the source of the keystroke,the implementation of a Logistic Regression model to train and test the data yielded correct predictionsfor most keystrokes if trained on a targeted user. However, there are a few shortcomings inthis approach.
First, we observed a drop in prediction accuracy when the model was trained on multiple usersand then tested for a specific user. This indicates that it is not as likely to successfully executean attack by using dummy users to train the system and then recovering the customer’s PIN bycross-correlating the corresponding key presses. This is because different users employ dissimilartyping styles, which influences the acoustic signal due to varying incident angles and applied pressure.
Sensors 2020, 20, 3015 14 of 25
In fact, these differences are due to varying finger positions while entering the PIN and other inherentbehavioral characteristics.
Figure 8. Similarity of press and release of key “6” with key “8”.
Figure 9. Similarity of press and release of key “5” with key “1”.
Secondly, in the above experiment, the training set also sees other entries with identical PINsequence for the targeted user. This is a concern because the angle of incidence also depends on thekey character pressed immediately before. This influences the signal produced from that particular keybutton, making it distinct for different PIN sequences. This indicates that it is not so likely to achievesimilar results on the customer’s PIN entry if the system is trained to learn on other key sequences likebirth date and phone numbers.
Therefore, to compensate for these concerns, the new training set only comprised of PIN sequencesthat are distinct from the one being tested. This ensures that the single character accuracy remainsindependent of PIN sequence. Doing so, we can gauge the possibility where the kiosk asks thecustomer to input his phone number and birth date, to ultimately recover the ATM PIN.
3.3.2. Data Analysis
We consider a Logistic Regression model that takes in a pairwise cross-correlation matrix as thefeature inputs, and outputs the predicted keystroke.
Sensors 2020, 20, 3015 15 of 25
s f ,k := (Σn
i=1similarity( f , t[i])n
, t = {Acoustic signals generated from key k}) (13)
fu,i = (S f ,0, S f ,1, S f ,2, S f ,3, S f ,4, S f ,5, S f ,6, S f ,7, S f ,8, S f ,9) (14)
Input : Similaritiesacquiredthroughtime f requencydecoding (15)
Output : Key (16)
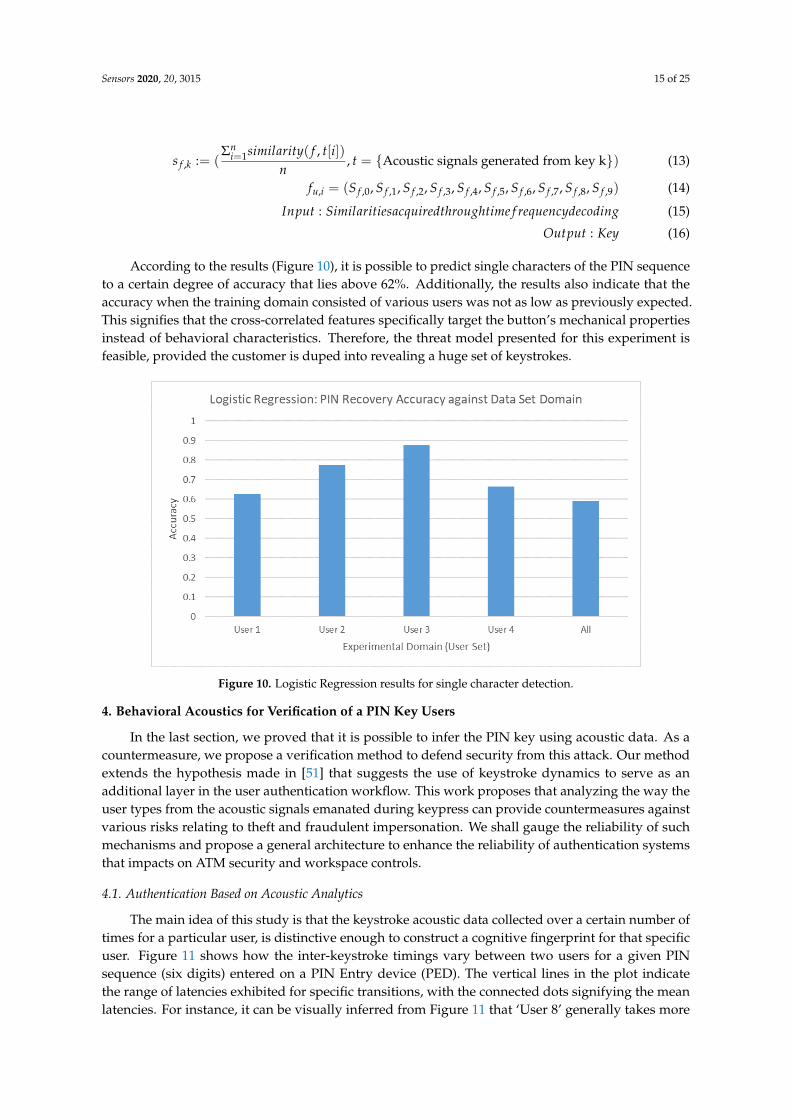
According to the results (Figure 10), it is possible to predict single characters of the PIN sequenceto a certain degree of accuracy that lies above 62%. Additionally, the results also indicate that theaccuracy when the training domain consisted of various users was not as low as previously expected.This signifies that the cross-correlated features specifically target the button’s mechanical propertiesinstead of behavioral characteristics. Therefore, the threat model presented for this experiment isfeasible, provided the customer is duped into revealing a huge set of keystrokes.
Figure 10. Logistic Regression results for single character detection.
4. Behavioral Acoustics for Verification of a PIN Key Users
In the last section, we proved that it is possible to infer the PIN key using acoustic data. As acountermeasure, we propose a verification method to defend security from this attack. Our methodextends the hypothesis made in [51] that suggests the use of keystroke dynamics to serve as anadditional layer in the user authentication workflow. This work proposes that analyzing the way theuser types from the acoustic signals emanated during keypress can provide countermeasures againstvarious risks relating to theft and fraudulent impersonation. We shall gauge the reliability of suchmechanisms and propose a general architecture to enhance the reliability of authentication systemsthat impacts on ATM security and workspace controls.
4.1. Authentication Based on Acoustic Analytics
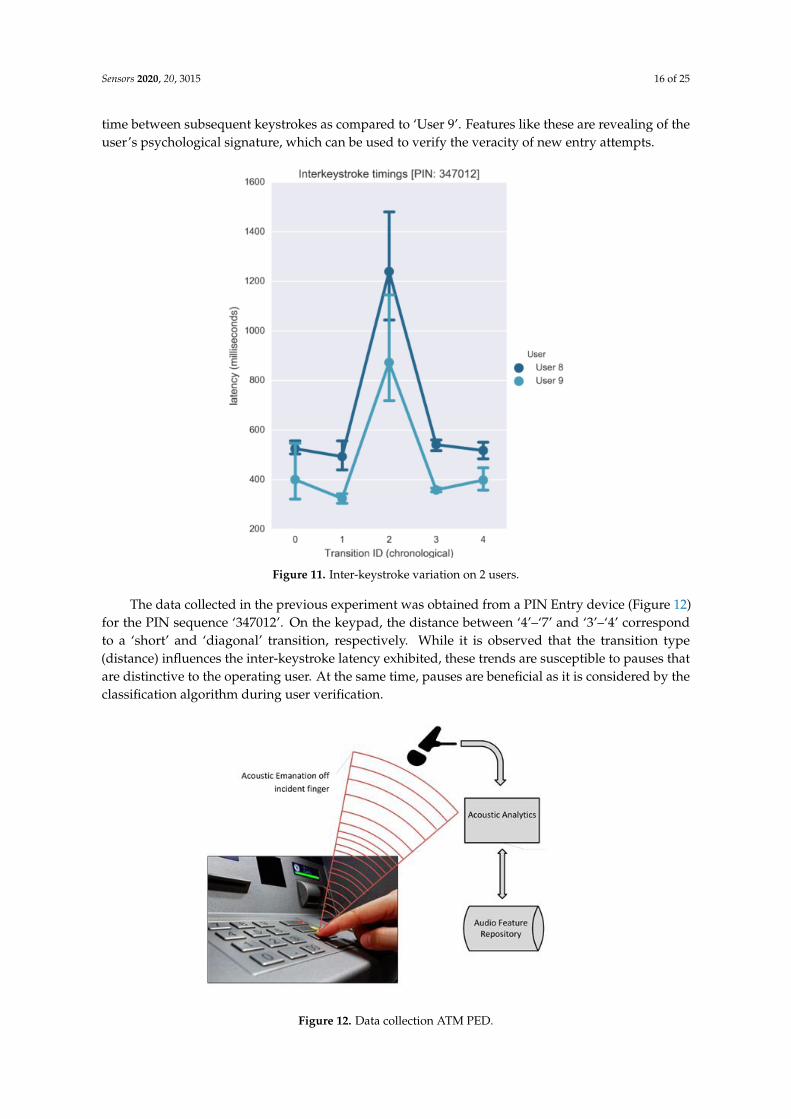
The main idea of this study is that the keystroke acoustic data collected over a certain number oftimes for a particular user, is distinctive enough to construct a cognitive fingerprint for that specificuser. Figure 11 shows how the inter-keystroke timings vary between two users for a given PINsequence (six digits) entered on a PIN Entry device (PED). The vertical lines in the plot indicatethe range of latencies exhibited for specific transitions, with the connected dots signifying the meanlatencies. For instance, it can be visually inferred from Figure 11 that ‘User 8’ generally takes more
Sensors 2020, 20, 3015 16 of 25
time between subsequent keystrokes as compared to ‘User 9’. Features like these are revealing of theuser’s psychological signature, which can be used to verify the veracity of new entry attempts.
Figure 11. Inter-keystroke variation on 2 users.
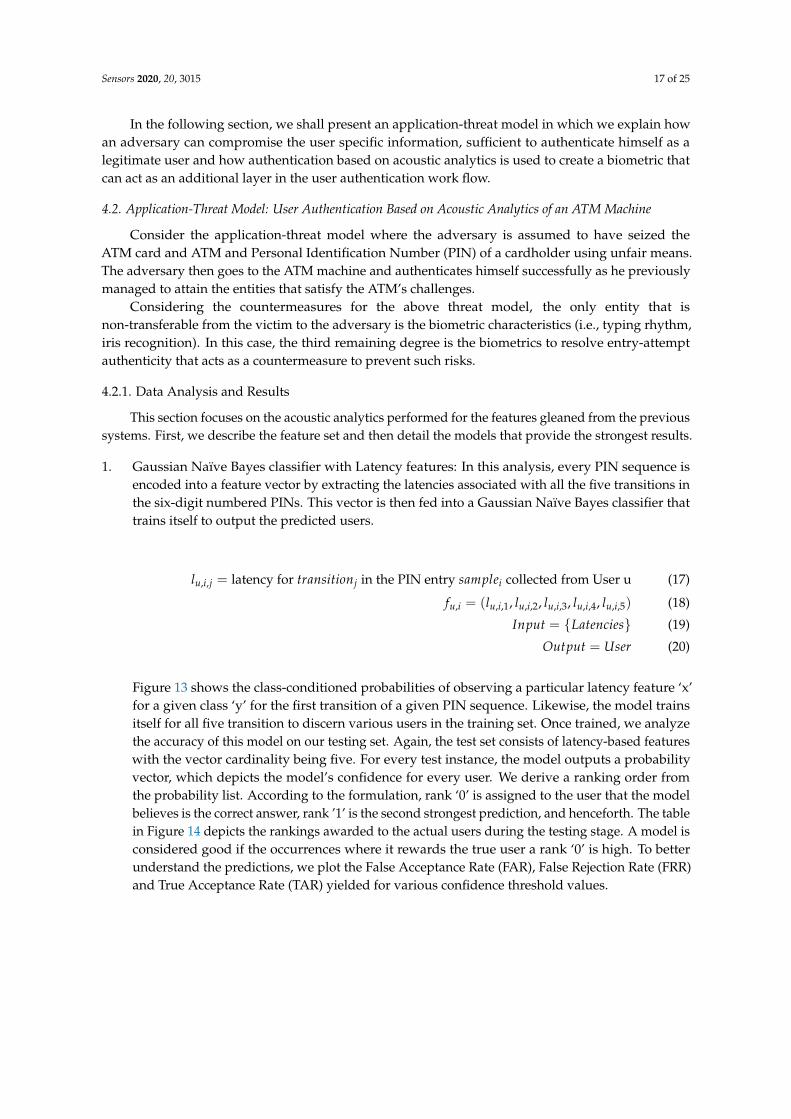
The data collected in the previous experiment was obtained from a PIN Entry device (Figure 12)for the PIN sequence ‘347012’. On the keypad, the distance between ‘4’–‘7’ and ‘3’–‘4’ correspondto a ‘short’ and ‘diagonal’ transition, respectively. While it is observed that the transition type(distance) influences the inter-keystroke latency exhibited, these trends are susceptible to pauses thatare distinctive to the operating user. At the same time, pauses are beneficial as it is considered by theclassification algorithm during user verification.
Figure 12. Data collection ATM PED.
Sensors 2020, 20, 3015 17 of 25
In the following section, we shall present an application-threat model in which we explain howan adversary can compromise the user specific information, sufficient to authenticate himself as alegitimate user and how authentication based on acoustic analytics is used to create a biometric thatcan act as an additional layer in the user authentication work flow.
4.2. Application-Threat Model: User Authentication Based on Acoustic Analytics of an ATM Machine
Consider the application-threat model where the adversary is assumed to have seized theATM card and ATM and Personal Identification Number (PIN) of a cardholder using unfair means.The adversary then goes to the ATM machine and authenticates himself successfully as he previouslymanaged to attain the entities that satisfy the ATM’s challenges.
Considering the countermeasures for the above threat model, the only entity that isnon-transferable from the victim to the adversary is the biometric characteristics (i.e., typing rhythm,iris recognition). In this case, the third remaining degree is the biometrics to resolve entry-attemptauthenticity that acts as a countermeasure to prevent such risks.
4.2.1. Data Analysis and Results
This section focuses on the acoustic analytics performed for the features gleaned from the previoussystems. First, we describe the feature set and then detail the models that provide the strongest results.
1. Gaussian Naïve Bayes classifier with Latency features: In this analysis, every PIN sequence isencoded into a feature vector by extracting the latencies associated with all the five transitions inthe six-digit numbered PINs. This vector is then fed into a Gaussian Naïve Bayes classifier thattrains itself to output the predicted users.
lu,i,j = latency for transitionj in the PIN entry samplei collected from User u (17)
fu,i = (lu,i,1, lu,i,2, lu,i,3, lu,i,4, lu,i,5) (18)
Input = {Latencies} (19)
Output = User (20)
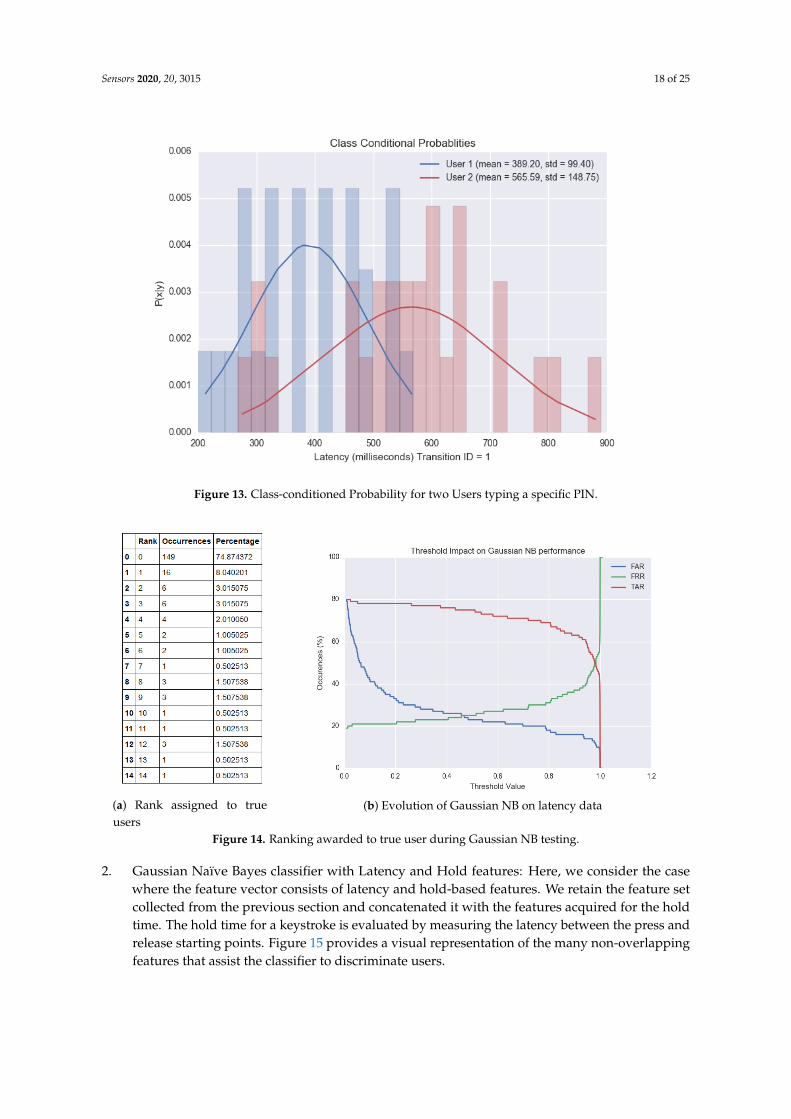
Figure 13 shows the class-conditioned probabilities of observing a particular latency feature ‘x’for a given class ‘y’ for the first transition of a given PIN sequence. Likewise, the model trainsitself for all five transition to discern various users in the training set. Once trained, we analyzethe accuracy of this model on our testing set. Again, the test set consists of latency-based featureswith the vector cardinality being five. For every test instance, the model outputs a probabilityvector, which depicts the model’s confidence for every user. We derive a ranking order fromthe probability list. According to the formulation, rank ‘0’ is assigned to the user that the modelbelieves is the correct answer, rank ’1’ is the second strongest prediction, and henceforth. The tablein Figure 14 depicts the rankings awarded to the actual users during the testing stage. A model isconsidered good if the occurrences where it rewards the true user a rank ‘0’ is high. To betterunderstand the predictions, we plot the False Acceptance Rate (FAR), False Rejection Rate (FRR)and True Acceptance Rate (TAR) yielded for various confidence threshold values.
Sensors 2020, 20, 3015 18 of 25
Figure 13. Class-conditioned Probability for two Users typing a specific PIN.
(a) Rank assigned to trueusers
(b) Evolution of Gaussian NB on latency data
Figure 14. Ranking awarded to true user during Gaussian NB testing.
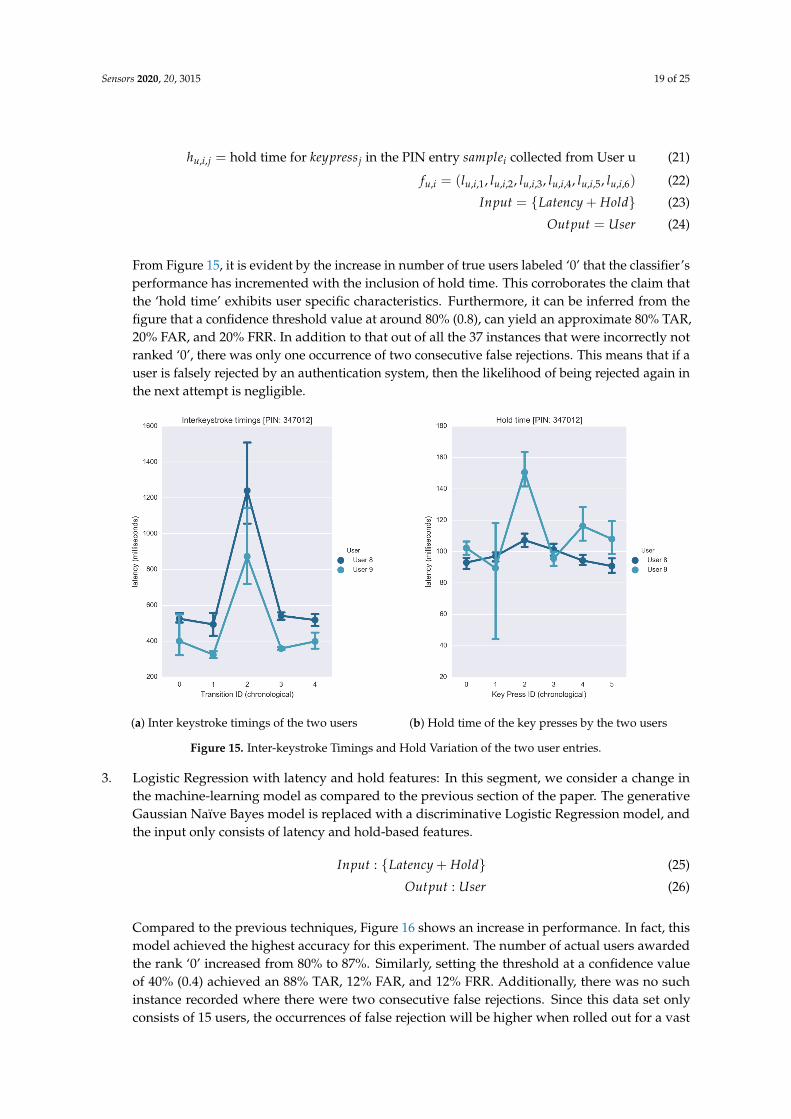
2. Gaussian Naïve Bayes classifier with Latency and Hold features: Here, we consider the casewhere the feature vector consists of latency and hold-based features. We retain the feature setcollected from the previous section and concatenated it with the features acquired for the holdtime. The hold time for a keystroke is evaluated by measuring the latency between the press andrelease starting points. Figure 15 provides a visual representation of the many non-overlappingfeatures that assist the classifier to discriminate users.
Sensors 2020, 20, 3015 19 of 25
hu,i,j = hold time for keypressj in the PIN entry samplei collected from User u (21)
fu,i = (lu,i,1, lu,i,2, lu,i,3, lu,i,4, lu,i,5, lu,i,6) (22)
Input = {Latency + Hold} (23)
Output = User (24)
From Figure 15, it is evident by the increase in number of true users labeled ‘0’ that the classifier’sperformance has incremented with the inclusion of hold time. This corroborates the claim thatthe ‘hold time’ exhibits user specific characteristics. Furthermore, it can be inferred from thefigure that a confidence threshold value at around 80% (0.8), can yield an approximate 80% TAR,20% FAR, and 20% FRR. In addition to that out of all the 37 instances that were incorrectly notranked ‘0’, there was only one occurrence of two consecutive false rejections. This means that if auser is falsely rejected by an authentication system, then the likelihood of being rejected again inthe next attempt is negligible.
(a) Inter keystroke timings of the two users (b) Hold time of the key presses by the two users
Figure 15. Inter-keystroke Timings and Hold Variation of the two user entries.
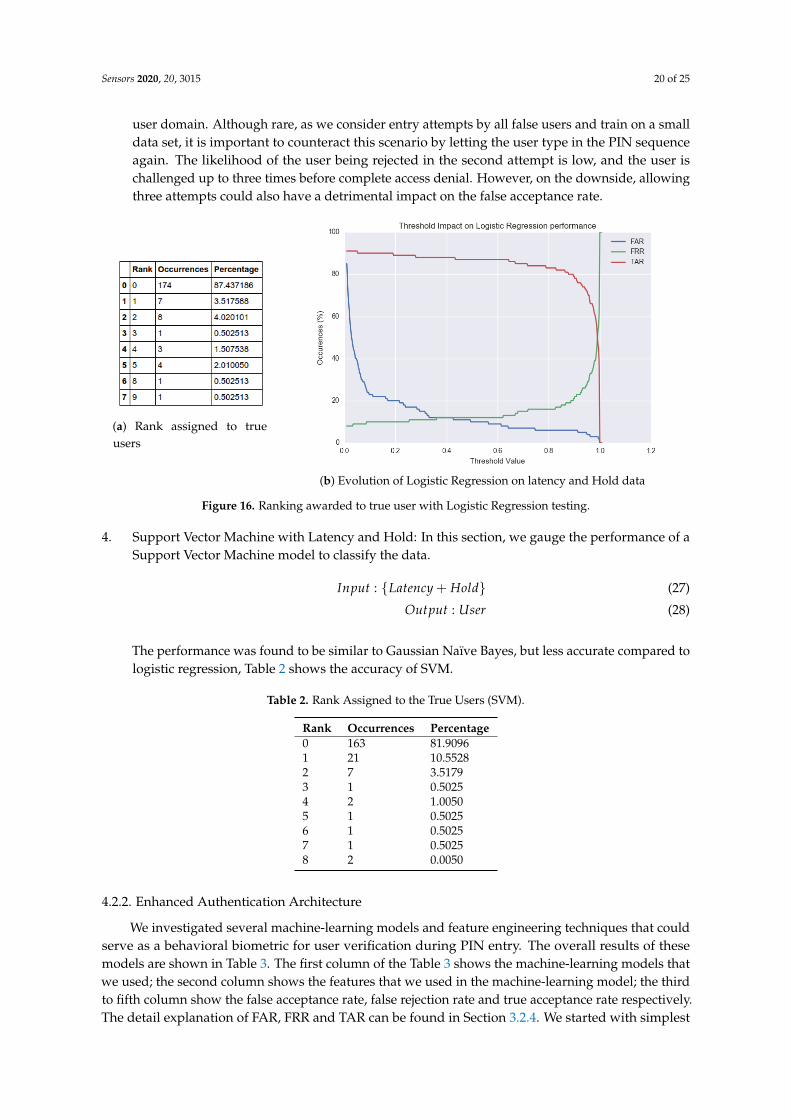
3. Logistic Regression with latency and hold features: In this segment, we consider a change inthe machine-learning model as compared to the previous section of the paper. The generativeGaussian Naïve Bayes model is replaced with a discriminative Logistic Regression model, andthe input only consists of latency and hold-based features.
Input : {Latency + Hold} (25)
Output : User (26)
Compared to the previous techniques, Figure 16 shows an increase in performance. In fact, thismodel achieved the highest accuracy for this experiment. The number of actual users awardedthe rank ‘0’ increased from 80% to 87%. Similarly, setting the threshold at a confidence valueof 40% (0.4) achieved an 88% TAR, 12% FAR, and 12% FRR. Additionally, there was no suchinstance recorded where there were two consecutive false rejections. Since this data set onlyconsists of 15 users, the occurrences of false rejection will be higher when rolled out for a vast
Sensors 2020, 20, 3015 20 of 25
user domain. Although rare, as we consider entry attempts by all false users and train on a smalldata set, it is important to counteract this scenario by letting the user type in the PIN sequenceagain. The likelihood of the user being rejected in the second attempt is low, and the user ischallenged up to three times before complete access denial. However, on the downside, allowingthree attempts could also have a detrimental impact on the false acceptance rate.
(a) Rank assigned to trueusers
(b) Evolution of Logistic Regression on latency and Hold data
Figure 16. Ranking awarded to true user with Logistic Regression testing.
4. Support Vector Machine with Latency and Hold: In this section, we gauge the performance of aSupport Vector Machine model to classify the data.
Input : {Latency + Hold} (27)
Output : User (28)
The performance was found to be similar to Gaussian Naïve Bayes, but less accurate compared tologistic regression, Table 2 shows the accuracy of SVM.
Table 2. Rank Assigned to the True Users (SVM).
Rank Occurrences Percentage0 163 81.90961 21 10.55282 7 3.51793 1 0.50254 2 1.00505 1 0.50256 1 0.50257 1 0.50258 2 0.0050
4.2.2. Enhanced Authentication Architecture
We investigated several machine-learning models and feature engineering techniques that couldserve as a behavioral biometric for user verification during PIN entry. The overall results of thesemodels are shown in Table 3. The first column of the Table 3 shows the machine-learning models thatwe used; the second column shows the features that we used in the machine-learning model; the thirdto fifth column show the false acceptance rate, false rejection rate and true acceptance rate respectively.The detail explanation of FAR, FRR and TAR can be found in Section 3.2.4. We started with simplest
Sensors 2020, 20, 3015 21 of 25
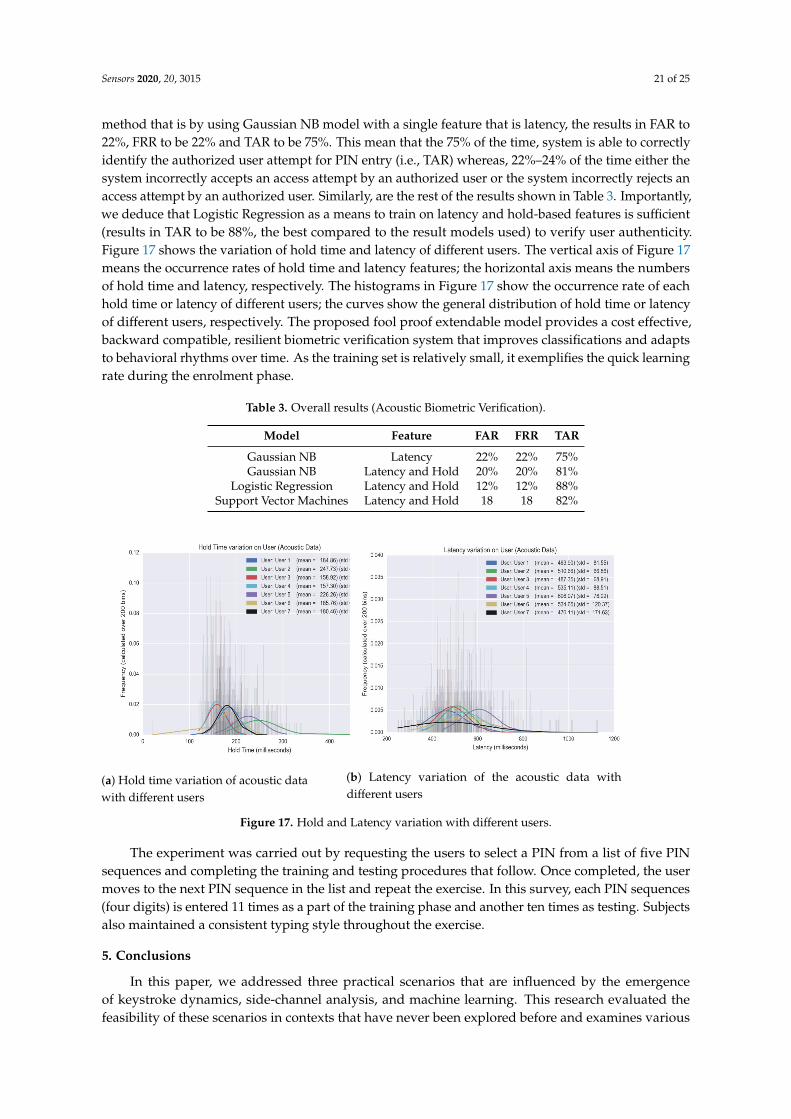
method that is by using Gaussian NB model with a single feature that is latency, the results in FAR to22%, FRR to be 22% and TAR to be 75%. This mean that the 75% of the time, system is able to correctlyidentify the authorized user attempt for PIN entry (i.e., TAR) whereas, 22%–24% of the time either thesystem incorrectly accepts an access attempt by an authorized user or the system incorrectly rejects anaccess attempt by an authorized user. Similarly, are the rest of the results shown in Table 3. Importantly,we deduce that Logistic Regression as a means to train on latency and hold-based features is sufficient(results in TAR to be 88%, the best compared to the result models used) to verify user authenticity.Figure 17 shows the variation of hold time and latency of different users. The vertical axis of Figure 17means the occurrence rates of hold time and latency features; the horizontal axis means the numbersof hold time and latency, respectively. The histograms in Figure 17 show the occurrence rate of eachhold time or latency of different users; the curves show the general distribution of hold time or latencyof different users, respectively. The proposed fool proof extendable model provides a cost effective,backward compatible, resilient biometric verification system that improves classifications and adaptsto behavioral rhythms over time. As the training set is relatively small, it exemplifies the quick learningrate during the enrolment phase.
Table 3. Overall results (Acoustic Biometric Verification).
Model Feature FAR FRR TAR
Gaussian NB Latency 22% 22% 75%Gaussian NB Latency and Hold 20% 20% 81%
Logistic Regression Latency and Hold 12% 12% 88%Support Vector Machines Latency and Hold 18 18 82%
(a) Hold time variation of acoustic datawith different users
(b) Latency variation of the acoustic data withdifferent users
Figure 17. Hold and Latency variation with different users.
The experiment was carried out by requesting the users to select a PIN from a list of five PINsequences and completing the training and testing procedures that follow. Once completed, the usermoves to the next PIN sequence in the list and repeat the exercise. In this survey, each PIN sequences(four digits) is entered 11 times as a part of the training phase and another ten times as testing. Subjectsalso maintained a consistent typing style throughout the exercise.
5. Conclusions
In this paper, we addressed three practical scenarios that are influenced by the emergenceof keystroke dynamics, side-channel analysis, and machine learning. This research evaluated thefeasibility of these scenarios in contexts that have never been explored before and examines various
Sensors 2020, 20, 3015 22 of 25
frameworks. First, we devised a PIN key recovery attack and used the acoustic signal to successfullyrecover 4–6-digit random PINs from the emanations generated from the keystrokes. Secondly, weproved that it is possible to verify user identity from acoustic emanations. Based on the results, weproposed a defense mechanism to thwart user impersonation attempts and several other risks, thuselevating the security of the PEDs. We plan to improve our experiment in the future. A limitation ofour work is the size of training set. For a PIN, a user only enters 4 times in our experiment. We considerincrease the number to 8 or 10 times per PIN. Extension of this work is in the plan as well. As wealready proved that time interval between keystrokes can be used to verify user, we suggest thistechnique can be applied in other area. Also, different (supervised) machine-learning models arealso be tested. One possible application is remote authentication. When user enters password on thewebsite, the time intervals between keystrokes are recorded and used to verify the user’s identity.Another potential application is mobile phone unlocking. Due to the impact of Covoid-19, iPhoneusers must wear masks and cannot use face ID (a technique that can detect user’s face to verify theuser) to unlock their phone. Instead they must use PIN, which is possible to be record by others.We plan to record the time intervals between two presses on screen and use these to verify user.
Author Contributions: Y.L. and G.P.H. conceived the idea of this research; S.P. and Y.L. performed the experiments,S.P., Y.L., U.M.Q. analyzed the data; Y.L., U.M.Q. and G.P.H. wrote and reviewed the paper. All authors have readand agreed to the published version of the manuscript.
Funding: This work was supported by City University of Hong Kong Projects CityU 11200017 (7004892) andCityU 11202618 (7005053).
Conflicts of Interest: The authors declare no conflict of interest.
References
1. Xu, L.D.; He, W.; Li, S. Internet of Things in Industries: A Survey. IEEE Trans. Ind. Informatics 2014,10, 2233–2243. [CrossRef]
2. Atzori, L.; Iera, A.; Morabito, G. The internet of things: A survey. Comput. Netw. 2010, 54, 2787–2805.3. Zhou, L.; Yeh, K.H.; Hancke, G.; Liu, Z.; Su, C. Security and privacy for the industrial internet of things: An
overview of approaches to safeguarding endpoints. IEEE Signal Process. Mag. 2018, 35, 76–87.4. Golla, M.; Beuscher, B.; Dürmuth, M. On the security of cracking-resistant password vaults. In Proceedings
of the 2016 ACM SIGSAC Conference on Computer and Communications Security, Vienna, Austria, 24–28October 2016; pp. 1230–1241.
5. Wang, D.; Zhang, Z.; Wang, P.; Yan, J.; Huang, X. Targeted online password guessing: An underestimatedthreat. In Proceedings of the 2016 ACM SIGSAC Conference on Computer and Communications Security,Vienna, Austria, 24–28 October 2016; pp. 1242–1254.
6. Yang, W.; Li, N.; Chowdhury, O.; Xiong, A.; Proctor, R.W. An empirical study of mnemonic sentence-basedpassword generation strategies. In Proceedings of the 2016 ACM SIGSAC Conference on Computer andCommunications Security, Vienna, Austria, 24–28 October 2016; pp. 1216–1229.
7. Chatterjee, R.; Athayle, A.; Akhawe, D.; Juels, A.; Ristenpart, T. pASSWORD tYPOS and how to correctthem securely. In Proceedings of the 2016 IEEE Symposium on Security and Privacy (SP), San Jose, CA, USA,22–26 May 2016; pp. 799–818.
8. Silver, D.; Jana, S.; Boneh, D.; Chen, E.; Jackson, C. Password managers: Attacks and defenses. In Proceedingsof the 23rd USENIX Security Symposium (USENIX Security 14), San Diego, CA, USA, 20–22 August 2014;pp. 449–464.
9. Yan, J.; Blackwell, A.; Anderson, R.; Grant, A. Password memorability and security: Empirical results. IEEESecur. Priv. 2004, 2, 25–31. [CrossRef]
10. Payment Card Industry (PCI). PIN Transaction Security (PTS) Point of Interaction (POI); Security StandardsCouncil: Wakefield, MA, USA, 2011. Available online: https://www.pci-dss.gr/media/1955/pci_pts_poi_vq_v4_final.pdf (accessed on June 2013).
11. Drimer, S.; Murdoch, S.J.; Anderson, R. Thinking inside the box: System-level failures of tamper proofing.In Proceedigns of the 2008 IEEE Symposium on Security and Privacy (sp 2008), Oakland, CA, USA, 18–22May 2008; pp. 281–295.
Sensors 2020, 20, 3015 23 of 25
12. Murdoch, S.J.; Drimer, S.; Anderson, R.; Bond, M. Chip and PIN is Broken. In Proceedings of the 2010 IEEESymposium on Security and Privacy, Oakland, CA, USA, 16–19 May 2010; pp. 433–446.
13. Anderson, R.; Murdoch, S.J. EMV: Why payment systems fail. Commun. ACM 2014, 57, 24–28.14. Bond, M.; Choudary, O.; Murdoch, S.J.; Skorobogatov, S.; Anderson, R. Chip and Skim: Cloning EMV cards
with the pre-play attack. In Proceedings of the 2014 IEEE Symposium on Security and Privacy, San Jose, CA,USA, 18–21 May 2014; pp. 49–64.
15. Kuhn, M.G.; Anderson, R.J. Soft tempest: Hidden data transmission using electromagnetic emanations. InProceedings of the International Workshop on Information Hiding, Portland, OR, USA, 14–17 April 1998;pp. 124–142.
16. Qiao, H.; Liu, Y.; Yang, A.; Hancke, G. Preventing overshadowing attacks in self-jamming audio channels.IEEE Trans. Dependable Secur. Comput. 2018. [CrossRef]
17. Friedman, J. Tempest: A signal problem. NSA Cryptologic Spectr. 1972, 35, 76.18. Smulders, P. The threat of information theft by reception of electromagnetic radiation from RS-232 cables.
Comput. Secur. 1990, 9, 53–58.19. Vuagnoux, M.; Pasini, S. Compromising Electromagnetic Emanations of Wired and Wireless Keyboards.
In Proceedings of the 18th USENIX Security Symposium, Montreal, QC, Canada, 10–14 August 2009;pp. 1–16.
20. Backes, M.; Dürmuth, M.; Gerling, S.; Pinkal, M.; Sporleder, C. Acoustic Side-Channel Attacks on Printers.In Proceedings of the 19th USENIX Security symposium, Washington, DC, USA, 11–13 August 2010;pp. 307–322.
21. Loughry, J.; Umphress, D.A. Information leakage from optical emanations. ACM Trans. Inf. Syst. Secur.(TISSEC) 2002, 5, 262–289. [CrossRef]
22. Van Eck, W. Electromagnetic radiation from video display units: An eavesdropping risk? Comput. Secur.1985, 4, 269–286. [CrossRef]
23. Kuhn, M.G. Optical time-domain eavesdropping risks of CRT displays. In Proceedings of the 2002 IEEESymposium on Security and Privacy, Berkeley, CA, USA, 12–15 May 2002; pp. 3–18.
24. Kuhn, M.G. Compromising emanations of LCD TV sets. IEEE Trans. Electromagn. Compat. 2013, 55, 564–570.[CrossRef]
25. Shumailov, I.; Simon, L.; Yan, J.; Anderson, R. Hearing your touch: A new acoustic side channel onsmartphones. arXiv 2019, arXiv:1903.11137.
26. Yu, J.; Lu, L.; Chen, Y.; Zhu, Y.; Kong, L. An indirect eavesdropping attack of keystrokes on touch screenthrough acoustic sensing. IEEE Trans. Mob. Comput. 2019. [CrossRef]
27. Zhou, M.; Wang, Q.; Yang, J.; Li, Q.; Jiang, P.; Chen, Y.; Wang, Z. Stealing Your Android Patterns via AcousticSignals. IEEE Trans. Mob. Comput. 2019. [CrossRef]
28. Hayashi, Y.; Homma, N.; Miura, M.; Aoki, T.; Sone, H. A threat for tablet pcs in public space: Remotevisualization of screen images using em emanation. In Proceedings of the 2014 ACM SIGSAC Conference onComputer and Communications Security, Scottsdale, AZ, USA, 3–7 November 2014; pp. 954–965.
29. Kocher, P.C. Timing attacks on implementations of Diffie-Hellman, RSA, DSS, and other systems. InProceedings of the Annual International Cryptology Conference, Santa Barbara, CA, USA, 18–22 August1996; pp. 104–113.
30. Kocher, P.; Jaffe, J.; Jun, B. Differential power analysis. In Proceedings of the Annual International CryptologyConference, Santa Barbara, CA, USA, 15–19 August 1999; pp. 388–397.
31. Gandolfi, K.; Mourtel, C.; Olivier, F. Electromagnetic analysis: Concrete results. In Proceedings of theInternational Workshop on Cryptographic Hardware and Embedded Systems, Paris, France, 14–16 May2001; pp. 251–261.
32. Genkin, D.; Shamir, A.; Tromer, E. RSA key extraction via low-bandwidth acoustic cryptanalysis. InProceedings of the Annual Cryptology Conference, Santa Barbara, CA, USA, 17–21 August 2014; pp. 444–461.
33. Mangard, S.; Oswald, E.; Popp, T. Power Analysis Attacks: Revealing the Secrets of Smart Cards; Springer Science& Business Media: Berlin, Germany, 2008; Voulme 31.
34. Ledwaba, L.P.; Hancke, G.P.; Venter, H.S.; Isaac, S.J. Performance costs of software cryptography in securingnew-generation Internet of energy endpoint devices. IEEE Access 2018, 6, 9303–9323. [CrossRef]
35. Hu, Q.; Zhang, J.; Mitrokotsa, A.; Hancke, G. Tangible security: Survey of methods supporting secure ad-hocconnects of edge devices with physical context. Comput. Secur. 2018, 78, 281–300. [CrossRef]
Sensors 2020, 20, 3015 24 of 25
36. Asonov, D.; Agrawal, R. Keyboard acoustic emanations. In Proceedings of the IEEE Symposium on Securityand Privacy, Berkeley, CA, USA, 12 May 2004; pp. 3–11.
37. Zhuang, L.; Zhou, F.; Tygar, J.D. Keyboard acoustic emanations revisited. ACM Trans. Inf. Syst. Secur.(TISSEC) 2009, 13, 1–26. [CrossRef]
38. Zhu, T.; Ma, Q.; Zhang, S.; Liu, Y. Context-free attacks using keyboard acoustic emanations. In Proceedingsof the 2014 ACM SIGSAC Conference on Computer and Communications Security, Scottsdale, AZ, USA, 3–7November 2014; pp. 453–464.
39. Owusu, E.; Han, J.; Das, S.; Perrig, A.; Zhang, J. Accessory: Password inference using accelerometers onsmartphones. In Proceedings of the Twelfth Workshop on Mobile Computing Systems & Applications,San Diego, CA, USA, 28–29 February 2012; pp. 1–6.
40. Liu, X.; Zhou, Z.; Diao, W.; Li, Z.; Zhang, K. When good becomes evil: Keystroke inference with smartwatch.In Proceedings of the 22nd ACM SIGSAC Conference on Computer and Communications Security, Denver,CO, USA, 12–16 October 2015; pp. 1273–1285.
41. Simon, L.; Anderson, R. Pin skimmer: Inferring pins through the camera and microphone. In Proceedingsof the Third ACM Workshop on Security and Privacy in Smartphones & Mobile Devices, Berlin, Germany,8 November 2013; pp. 67–78.
42. Cardaioli, M.; Conti, M.; Balagani, K.; Gasti, P. Your PIN Sounds Good! On The Feasibility of PIN InferenceThrough Audio Leakage. arXiv 2019, arXiv:1905.08742.
43. de Souza Faria, G.; Kim, H.Y. Differential audio analysis: A new side-channel attack on PIN pads. Int. J. Inf.Secur. 2019, 18, 73–84. [CrossRef]
44. Kong, J.; Aciiçmez, O.; Seifert, J.P.; Zhou, H. Hardware-software integrated approaches to defend againstsoftware cache-based side channel attacks. In Proceedings of the 2009 IEEE 15th International Symposiumon High Performance Computer Architecture, Raleigh, NC, USA, 14–18 February 2009; pp. 393–404.
45. Ambrose, J.A.; Ragel, R.G.; Parameswaran, S.; Ignjatovic, A. Multiprocessor information concealmentarchitecture to prevent power analysis-based side channel attacks. IET Comput. Digit. Tech. 2011, 5, 1–15.[CrossRef]
46. Ambrose, J.A.; Parameswaran, S.; Ignjatovic, A. MUTE-AES: A multiprocessor architecture to prevent poweranalysis based side channel attack of the AES algorithm. In Proceedings of the 2008 IEEE/ACM InternationalConference on Computer-Aided Design, San Jose, CA, USA, 10–13 November 2008; pp. 678–684.
47. Okeya, K.; Sakurai, K. On insecurity of the side channel attack countermeasure using addition-subtractionchains under distinguishability between addition and doubling. In Proceedings of the AustralasianConference on Information Security and Privacy, Melbourne, Australia, 3–5 July 2002; pp. 420–435.
48. Dinca, L.M.; Hancke, G.P. The fall of one, the rise of many: A survey on multi-biometric fusion methods.IEEE Access 2017, 5, 6247–6289. [CrossRef]
49. Qureshi, U.M.; Hancke, G.P.; Gebremichael, T.; Jennehag, U.; Forsström, S.; Gidlund, M. Survey of proximitybased authentication mechanisms for the Industrial Internet of Things. In Proceedings of the IECON2018-44th Annual Conference of the IEEE Industrial Electronics Society, Washington, DC, USA, 21–23October 2018; pp. 5246–5251.
50. Miller, B. Vital signs of identity [biometrics]. IEEE Spectr. 1994, 31, 22–30. [CrossRef]51. Monrose, F.; Rubin, A.D. Keystroke dynamics as a biometric for authentication. Future Gener. Comput. Syst.
2000, 16, 351–359. [CrossRef]52. Ogihara, A.; Matsumura, H.; Shiozaki, A. Biometric verification using keystroke motion and key press
timing for atm user authentication. In Proceedings of the 2006 International Symposium on IntelligentSignal Processing and Communications, Tottori, Japan, 12–15 December 2006; pp. 223–226.
53. Guidorizzi, R.P. Security: Active authentication. IT Prof. 2013, 15, 4–7. [CrossRef]54. Fridman, L.; Weber, S.; Greenstadt, R.; Kam, M. Active authentication on mobile devices via stylometry,
application usage, web browsing, and GPS location. IEEE Syst. J. 2016, 11, 513–521. [CrossRef]55. Halevi, T.; Saxena, N. Keyboard acoustic side channel attacks: Exploring realistic and security-sensitive
scenarios. Int. J. Inf. Secur. 2015, 14, 443–456. [CrossRef]56. Rabiner, L.; Schafer, R. Digital Processing of Speech Signals; Prentice-Hall: Upper Saddle River, NJ, USA, 1978.57. Alpaydin, E. Introduction to Machine Learning; MIT Press: Cambridge, MA, USA, 2020.58. Langley, P.; Iba, W.; Thompson, K. An analysis of Bayesian classifiers. In Proceedings of the Tenth National
Conference on Artificial Intelligence (AAAI-92), San Jose, CA, USA, 12–16 July 1992; Volume 90, pp. 223–228.
Sensors 2020, 20, 3015 25 of 25
59. Peng, C.Y.J.; Lee, K.L.; Ingersoll, G.M. An introduction to logistic regression analysis and reporting. J. Educ.Res. 2002, 96, 3–14.
60. Schölkopf, B.; Simard, P.; Smola, A.J.; Vapnik, V. Prior knowledge in support vector kernels. In Proceedingsof the Advances in Neural Information Processing Systems, Denver, CO, USA, 30 November–5 December1998; pp. 640–646.
61. Vatsa, M.; Singh, R.; Noore, A. Reducing the false rejection rate of iris recognition using textural andtopological features. Int. J. Signal Process. 2005, 2, 2.
62. Le Saint, E.F.; Wen, W.; Hamid, L. Method for Improving False Acceptance Rate Discriminating for BiometricAuthentication Systems. U.S. Patent 8,014,570, 6 September 2011.
c© 2020 by the authors. Licensee MDPI, Basel, Switzerland. This article is an open accessarticle distributed under the terms and conditions of the Creative Commons Attribution(CC BY) license (http://creativecommons.org/licenses/by/4.0/).