Embed Size (px)
Citation preview

Belowground carbon allocation by trees drives seasonalpatterns of extracellular enzyme activities by alteringmicrobial community composition in a beech forest soil
Christina Kaiser1, Marianne Koranda1, Barbara Kitzler2, Lucia Fuchslueger1, Jorg Schnecker1, Peter Schweiger5,
Frank Rasche3,4, Sophie Zechmeister-Boltenstern2, Angela Sessitsch3 and Andreas Richter1
1University of Vienna, Department of Chemical Ecology and Ecosystem Research, Althanstr. 14, A-1090 Vienna, Austria; 2Department of Forest Ecology
and Soils, Federal Research and Training Centre for Forests, Natural Hazards and Landscape (BFW), A-1131 Vienna, Austria; 3AIT Austrian Institute of
Technology GmbH, Bioresources Unit, A-2444 Seibersdorf, Austria; 4University of Hohenheim, Institute for Plant Production and Agroecology in the
Tropics and Subtropics, D-70593 Stuttgart, Germany; 5Institute of Soil Science, University of Natural Resources and Life Sciences, Peter Jordan Straße 82,
1190 Vienna, Austria
Author for correspondence:Christina Kaiser
Tel: +43 1 427754263
Email: [email protected]
Received: 22 February 2010
Accepted: 23 April 2010
New Phytologist (2010) 187: 843–858doi: 10.1111/j.1469-8137.2010.03321.x
Key words: ectomycorrhizal fungi,extracellular enzyme activities, girdling,microbial community dynamics, plant–soilinteractions, rhizosphere priming, seasonaldynamics, soil organic matter decomposition.
Summary
• Plant seasonal cycles alter carbon (C) and nitrogen (N) availability for soil
microbes, which may affect microbial community composition and thus feed back
on microbial decomposition of soil organic material and plant N availability. The
temporal dynamics of these plant–soil interactions are, however, unclear.
• Here, we experimentally manipulated the C and N availability in a beech forest
through N fertilization or tree girdling and conducted a detailed analysis of the sea-
sonal pattern of microbial community composition and decomposition processes
over 2 yr.
• We found a strong relationship between microbial community composition and
enzyme activities over the seasonal course. Phenoloxidase and peroxidase activities
were highest during late summer, whereas cellulase and protease peaked in late
autumn. Girdling, and thus loss of mycorrhiza, resulted in an increase in soil organic
matter-degrading enzymes and a decrease in cellulase and protease activity.
• Temporal changes in enzyme activities suggest a switch of the main substrate
for decomposition between summer (soil organic matter) and autumn (plant litter).
Our results indicate that ectomycorrhizal fungi are possibly involved in autumn
cellulase and protease activity. Our study shows that, through belowground C
allocation, trees significantly alter soil microbial communities, which may affect
seasonal patterns of decomposition processes.
Introduction
The seasonal cycles of plants and soil microbes in temperateforests are closely linked by the availability of nutrients andlabile carbon (C). Plants affect C and nitrogen (N) avail-ability for soil microbes as a result of competition for nutrientsduring active growth, exudation of labile C via roots andsubstrate input by litterfall (Wardle et al., 2004; Bardgettet al., 2005; Harrison et al., 2008). Microbes, in turn,
control nutrient availability for plants by carrying out awide spectrum of decomposition processes (Schimel et al.,2007; Schmidt et al., 2007). Thus, seasonal variations inplant growth phases as well as in microbial communitycomposition and physiology may strongly affect C and Navailability, which in turn feed back on plant and microbialprocesses over the course of a year.
Microbial decomposition processes in soil have beenshown to be highly sensitive to the availability of labile Cand N (Schimel & Weintraub, 2003). For example, the deg-radation of humified soil organic matter (SOM) is thoughtto be energy limited, leading to very slow SOM decomposi-tion rates in soils (Kuzyakov et al., 2009). The input of labile
Re-use of this article is permitted in accordance with the Termsand Conditions set out at http://www3.interscience.wiley.com/
authorresources/onlineopen.html.
NewPhytologist Research
� The Authors (2010)
Journal compilation � New Phytologist Trust (2010)
New Phytologist (2010) 187: 843–858 843www.newphytologist.com

C by plant root exudation, however, may provide energy andenable microbes to degrade SOM to gain limiting nutrients(Paterson, 2009). Plant exudates may also fuel decomposi-tion of other complex substrates, such as soil proteins (DeNobili et al., 2001; Weintraub et al., 2007) or litter (Subkeet al., 2004). Complementarily, many studies have shownthat changes in N availability for soil microbes lead to altera-tions in decomposition rates of SOM and litter (Waldrop &Zak, 2006; Allison et al., 2008; Keeler et al., 2009).Together, these findings indicate that the availability oflabile C and N controls the decomposition of complexsubstrates and thus the availability of nutrients for plants.
The mechanism by which C and N availability may con-trol decomposition rates remains unclear. One possibleexplanation for this phenomenon may be the tight couplingbetween microbial community structure and function thathas been proposed recently (Prosser et al., 2007; Stricklandet al., 2009). As a result of the different nutrient demandsand growth characteristics of specific microbial groups,altered C and N availability may favour the growth ofcertain microbial groups over others, thereby leading tomicrobial community shifts (Brant et al., 2006). This may,in turn, strongly influence decomposition processes, asdifferent microbial groups may exhibit different capacitiesto degrade high molecular weight substances, such as lignin,cellulose or humified SOM.
In temperate ecosystems, a strong effect of seasons onplant–soil interactions leads to seasonally variable C and Navailabilities for both plants and microbes. As describedabove, C and N availability may be – together with abioticfactors – major drivers of microbial decomposition pro-cesses in soils. Microbial decomposition of SOM, however,represents a key driver of the forest’s C and N cycle, whichhighlights the need for a better understanding of how thisprocess is influenced by plant-mediated C and N availability.Unraveling the effects of aboveground–belowgroundrelationships on ecosystem processes and function onseasonal time-scales still remains one of the major challengesin ecosystem ecology (Bardgett et al., 2005). To improveour understanding of those relationships, it is, however,necessary to gain a deeper insight into the link among Cand N availability, microbial community dynamics andmicrobial decomposition processes in a seasonal context.
The aim of this study was to explore this link over thecourse of 2 yr in a temperate forest. We hypothesized thatthe seasonal changes in microbial community compositionand physiology are driven by C and N availability in additionto abiotic factors; and that microbial community composi-tion affects specific decomposition processes mainly throughthe production of distinct sets of extracellular enzymes. Wetested these hypotheses by analysing the seasonal patterns ofnutrient availability, microbial community structure anddecomposition processes in monthly to bimonthly measure-ments over a period of 2 yr. Additionally, we experimentally
altered the C and N availability and C:N stoichiometrythrough N fertilization and tree girdling. Tree girdling hasbeen shown to effectively cut off the translocation of photo-assimilates from the canopy to the roots, thereby preventingthe exudation of labile C from plant roots into the soil(Hogberg et al., 2001; Subke et al., 2004; Scott-Dentonet al., 2006). To link microbial community composition todecomposition processes, we investigated whether seasonalor treatment-specific microbial community changes wererelated to changes in specific enzyme activities.
Materials and Methods
Study site
Our study site was located in a mature beech forest (Fagussylvatica L.) c. 40 km south-west of Vienna, Austria (510 masl). The age of the trees was on average 65 yr. The soilwas a dystric cambisol (over flysh) with a pH of between4.5 and 5.1 (CaCl2). Organic C and total N contentcomprised 7.45% and 0.48% of dry soil, respectively.Despite the proximity to the city of Vienna, the site receivedan N input through atmospheric deposition of only12.6 kg N ha)1 yr)1 (Kitzler et al., 2006).
Experimental set-up
The selection of control and treatment plots followed arandomized block design. First, three blocks within an areaof c. 5400 m2 were selected based on a geobotanic charac-terization, such that each block had more or less homogenousvegetation and similar soil properties. Within each block,two control plots, two fertilization plots (5 · 5 m each)and one girdling area (20 · 20m) were chosen randomly.Two girdling plots were installed in the central 10 · 10 mof each girdling area. Each block thus contained tworeplicate plots of each treatment.
The fertilization treatment plots were fertilized once amonth (after the soil sampling) with 29.7 g NH4NO3
dissolved in 2 l of water to give a final N fertilization rate of50 kg ha)1 yr)1. The fertilizer was evenly distributed oneach plot by spraying. The first fertilizer application was on9 May 2006, 1 month before the first sampling. On thesame day, all trees within each girdling area were girdled byripping off a 20-cm strip of bark around the stem at a heightof c. 1.50 m. Understory plants, which consisted mainly ofbeech seedlings, a few herbs and sedges, were removed fromall plots (girdling, control and fertilization). Understoryplants were again removed in the following spring.
Soil sampling
Soil samples were taken from the upper 5 cm of mineral soil(A horizon). Soils from control plots were sampled every
844 Research
NewPhytologist
� The Authors (2010)
Journal compilation � New Phytologist Trust (2010)
New Phytologist (2010) 187: 843–858
www.newphytologist.com

month between June 2006 and June 2008 (24 samplings).Soils from fertilized and girdled plots were sampled every2 months, except for June and July 2007 (which were bothsampled; 13 samplings in total). Four subsamples were takenfrom each of the six replicate plots for treatments andcontrols and pooled to give one replicate. Sampling wasbased on a predetermined sampling scheme in order to avoidsampling of already disturbed soil. Soil samples were care-fully sieved (2 mm), freed from visible roots by hand-picking and kept at 4�C until further processing. All extractionswere carried out on fresh soils within 4 d after sampling.
Fine-root biomass
Fine-root biomass was determined 4, 14 and 28 monthsafter girdling. The determination of root biomass 4 monthsafter girdling was conducted in a parallel girdling experimentat the same study site, which started in May 2008 (three newgirdling areas, with the same outline and experimental set-upas the girdling experiment described above). Thus, rootbiomass was determined in July 2007 (14.5 months aftergirdling) and September 2008 (4 and 28 months aftergirdling). Five soil cores (7 cm in diameter and 14.5 cm inheight) were taken from the upper mineral soil (A horizon)of each of the six replicate control and girdled plots. For eachsoil core, fine roots (diameter < 1 mm) were carefully sepa-rated from coarse and visibly dead roots, thoroughly washedand weighed to determine fine-root biomass. Fine roots werepooled for each replicate plot. Mycorrhizal colonization wasdetermined from aliquots of pooled samples.
Determination of mycorrhizal root colonization
Entire root subsamples were evenly dispersed in a 9-cm-diameter Petri dish, and root length was measured using aline intersect method at ·30 magnification (Newman,1966). The degree of mycorrhizal root colonization wasdetermined by counting all ectomycorrhizal root tips infour randomly selected squares making up 11% of the totalarea of the Petri dish.
Soil moisture and temperature
Soil moisture was detected gravimetrically in soil samples.Soil temperature was measured using Pt100 sensors (KuceraCompany, Brno, Slovakia) at 5 cm depth and data werecollected every 0.5 h. The soil temperature data presentedare means of soil temperature measurements collectedduring the 6 d time period preceding the sampling date.
Dissolved organic carbon (DOC) and total N
DOC and total dissolved N (dN) were measured in soilwater extracts (2 g of fresh soil was extracted with 20 ml of
analytical grade water; extracts were stored at · 20�C) usinga TOC ⁄ TN analyzer (TOC-V CPH E200V ⁄ TNM-1220V; Shimadzu, Vienna, Austria).
Phospholipid fatty acids (PLFAs)
PLFAs were analyzed using a modified procedure describedin Frostegard et al. (1991). Samples were processed within1 d after sampling. Total lipids were extracted with chloro-form ⁄ methanol ⁄ citric acid buffer (0.15 M), pH 4.0(1 : 2 : 0.8, v ⁄ v ⁄ v). Neutral lipids were separated fromphospholipids on silica columns (Supelco, LC-Si SPE,Vienna, Austria) by elution with chloroform, acetone andmethanol. After adding methyl-nonadecanoate (19:0) as aninternal standard, phospholipids were converted to fattyacid methyl esters (FAME) by alkaline methanolysis. DriedFAMEs were redissolved in isooctane and analyzed by gaschromatography (HP G1530A, Agilent, Vienna, Austria)on a DB23 column (Agilent, Vienna, Austria). A bacterialFAME mix (Supelco) was used as qualitative standard.Concentrations of FAMEs were calculated using the internalstandard (19:0) peak as a reference.
We used i15:0, a15:0, i16:0, i17:0 and a17:0 as indica-tors for Gram-positive bacteria, 18:1x7, cy17:0, 16:1x7,16:1x9, cy18:0, cy19:0 and 16:1x5 as indicators for Gram-negative bacteria, and the sum of Gram-positive and Gram-negative biomarkers together with 18:1x5, 17:0, 15:0,17:1x6 and 17:1x7 as a measure for total bacteria. The bio-markers 18:2x6,9, 18:1x9 and 18:3x3,6,9 are frequentlyused as fungal markers (Hill et al., 2000; Leckie, 2005;Hogberg, 2006; Joergensen & Wichern, 2008). However,as they have also been found to occur in plants (Zelles,1997; Laczko et al., 2004) we measured the concentrationsof these biomarkers in beech roots and calculated that thepossible contribution of root-borne PLFAs (based on fine-root biomass measurements and the assumption that 95%of roots were removed by sieving) to our soil samples was£ 0.61% for 18:2x6 and 18:1x9 (or £ 0.31% in girdledplots) and up to 4.1% for 18:3x3,6,9 (or 1.2% in girdledplots). Thus, the observed fine-root loss in girdled plotswould account for 1.25, 0.79 and 6% of the observeddecrease in 18:1x9, 18:2x6 and 18:3x3,6,9, respectively(Kaiser et al., 2010).
We used the sum of all PLFAs described above togetherwith the PLFAs 20:2x6,9 (protozoa), 10Me16:0 (actino-myceta) and 14:0, i14:0, 16:0, 19:1x8, i17:1x8, 18:0,16:1x11, 16:1x6, 19:1x7, 20:0, 14Me15:0 and 20:1x9,which are not specific for any microbial group, as a measureof total microbial biomass.
Extracellular enzymes
Potential extracellular enzyme activities were measuredusing microplate fluorometric and photometric assays. All
NewPhytologist Research 845
� The Authors (2010)
Journal compilation � New Phytologist Trust (2010)
New Phytologist (2010) 187: 843–858
www.newphytologist.com

activities were measured within 48 h after sampling of soils.One gram of sieved soil was suspended in 100 ml of sodiumacetate buffer (100 mM, pH 5.5) and ultrasonicated at lowenergy (Stemmer et al., 1998; Marx et al., 2001). b-1,4-Cellobiosidase (‘cellobiosidase’), b-1,4-N-acetylglucosa-minidase, chitinase ⁄ lysozyme (‘chitinase’) and leucine amino-peptidase (‘peptidase’) were measured fluorimetrically (Marxet al., 2001; Saiya-Cork et al., 2002). Two hundred micro-liters of soil suspension and 50 ll of substrate (4-methyl-umbelliferyl-b-d-cellobioside, 4-methylumbelliferyl-N-acetyl-b-d-glucosaminide, 4-methylumbelliferyl-b-d-N,N¢,N¢¢-tri-acetylchitotrioside and l-leucine-7-amido-4-methyl coumarin,respectively) were pipetted into black microtiter plates in threeanalytical replicates. Methylumbelliferyl (MUF) was usedfor calibration of cellobiosidase, N-acetylglucosaminidaseand chitinase, whereas aminomethylcoumarin (AMC) wasused for calibration of leucine amino-peptidase. Plates wereincubated for 140 min in the dark and fluorescence wasmeasured at 450 nm emission at an excitation at 365 nm(using a Tecan Infinite M200 fluorimeter, Werfen, Austria).
Different enzymes with different abilities to cope withsteric hindrance may be involved in the degradation ofpolymers, such as chitin. We therefore assayed chitinaseswith two types of substrate: 4-methylumbelliferyl-b-d-N,N¢,N¢¢-triacetylchitotrioside, consisting of three units ofN-acetyl-b-d-glucosaminide (component of chitin), and4-methylumbelliferyl-N-acetyl-b-d-glucosaminide, consist-ing of only one unit.
Phenoloxidase and peroxidase activities were measuredphotometrically according to standard methods (Sinsabaughet al., 1999), with small modifications. Subsamples weretaken from the soil suspension (see above) and mixed with a20 mM l-3,4-dihydroxyphenylalanin (L-DOPA, Sigma-Aldrich, Vienna, Austria) solution (1 : 1). Samples wereshaken for 10 min and centrifuged, and aliquots werepipetted into microtiter plates (six analytical replicates persample). Half of the wells additionally received 10 ll of a0.3% H2O2 solution for measurement of peroxidase.Absorption was measured at 450 nm at the starting time-point and after 20 h. Enzyme activity was calculated fromthe difference in absorption between the two time-pointsdivided by the molar extinction coefficient, which had beendetermined in a preliminary experiment.
Actual extracellular enzyme activities
‘Actual’ enzyme activities were measured without substrateand buffer additions, but with the addition of toluene toinhibit microbial uptake of enzymatic products, leading totheir accumulation in the soil suspension (Boschker et al.,1995; Watanabe & Hayano, 1995; Lipson et al., 1999;Weintraub & Schimel, 2005). This method has been usedbefore to determine actual protease activities (accumulationof amino acids; Lipson et al., 1999; Weintraub & Schimel,
2005) and to determine polysaccharide degradation (accu-mulation of glucose and xylose; Boschker et al., 1995). Wemeasured both activities in the same assay: 8 g of fresh soilwas mixed with 80 ml of distilled water and 0.8 ml oftoluene in a glass jar and shaken for 4 h. Subsamples for thedetection of amino acids and glucose were sampled after 0.5and 4 h. For measurement of amino acid production, subs-amples were centrifuged and supernatants were mixed withthe same volume of a solution containing 0.11 M trichloro-acetic acid, 0.22 M sodium acetate and 0.33 M acetic acid,to stop further enzyme activity (Weintraub & Schimel,2005). Samples were analyzed for amino acids using aphotometric assay with ninhydrin (Moore, 1968). Formeasurement of glucose production, subsamples werecentrifuged twice at 15 000 g to remove soil particles andmicrobes and were incubated at 100�C for 15 min to stopenzyme activities. Samples were then analyzed for glucoseby HPLC (ICS-3000; CarboPac PA20 column; 10 mMNaOH, with pulsed amperiometric detection, DIONEX,Vienna, Austria). In a preliminary experiment, the accumu-lation of both amino acids and glucose was shown to belinear up to 6 h. Glucose accumulation in the soil solutionwas probably caused by cellulase and ⁄ or amylase activity(Boschker et al., 1995). We detected some accumulation ofcellobiose and maltose in the soil solution, but concen-trations were much lower than that of glucose, indicatingthat these intermediate products were rapidly furtherdegraded. Thus, we used glucose production as a proxy forthe combined action of cellulose and amylase. We ascribedaccumulation of amino acids in the soil solution to proteaseactivity (Weintraub & Schimel, 2005).
Statistics
We carried out a canonical correspondence analysis (CCA;Anderson & Willis, 2003; Gonzalez et al., 2008) on a dataset of 11 samplings (bimonthly from August 2006 to May2008; August 2007 had to be excluded because of missingdata for phenoloxidase and peroxidase activity (n = 195)).A total of 37 individual PLFA biomarkers were used as thecommunity matrix (nmol PLFAs g)1 dry soil), whereas dif-ferent sets of constraining variables (abiotic conditions, Cand N pools and microbial processes) were used to comparethe influence of different groups of environmental para-meters on microbial community composition. The contri-bution of constrained variability to total communityvariability (= fraction of variability explained by theparameter) in each analysis was used as a measure of theinfluence of the respective parameter set on community vari-ation (used in Table 2). Results from a CCA conductedwith all parameters (except glucose production, which wasnot available for the first two samplings) as the constrainingmatrix are presented graphically in more detail (see Fig. 6below). We conducted a linear regression analysis (ordinary
846 Research
NewPhytologist
� The Authors (2010)
Journal compilation � New Phytologist Trust (2010)
New Phytologist (2010) 187: 843–858
www.newphytologist.com
least square regression) between all individual PLFAbiomarkers and all measured soil parameters for the 2-yrsampling period. All statistical analyses were performed inR 2.8.1 (http://www.r-project.org/, R-package vegan).
Results
Climate and abiotic conditions
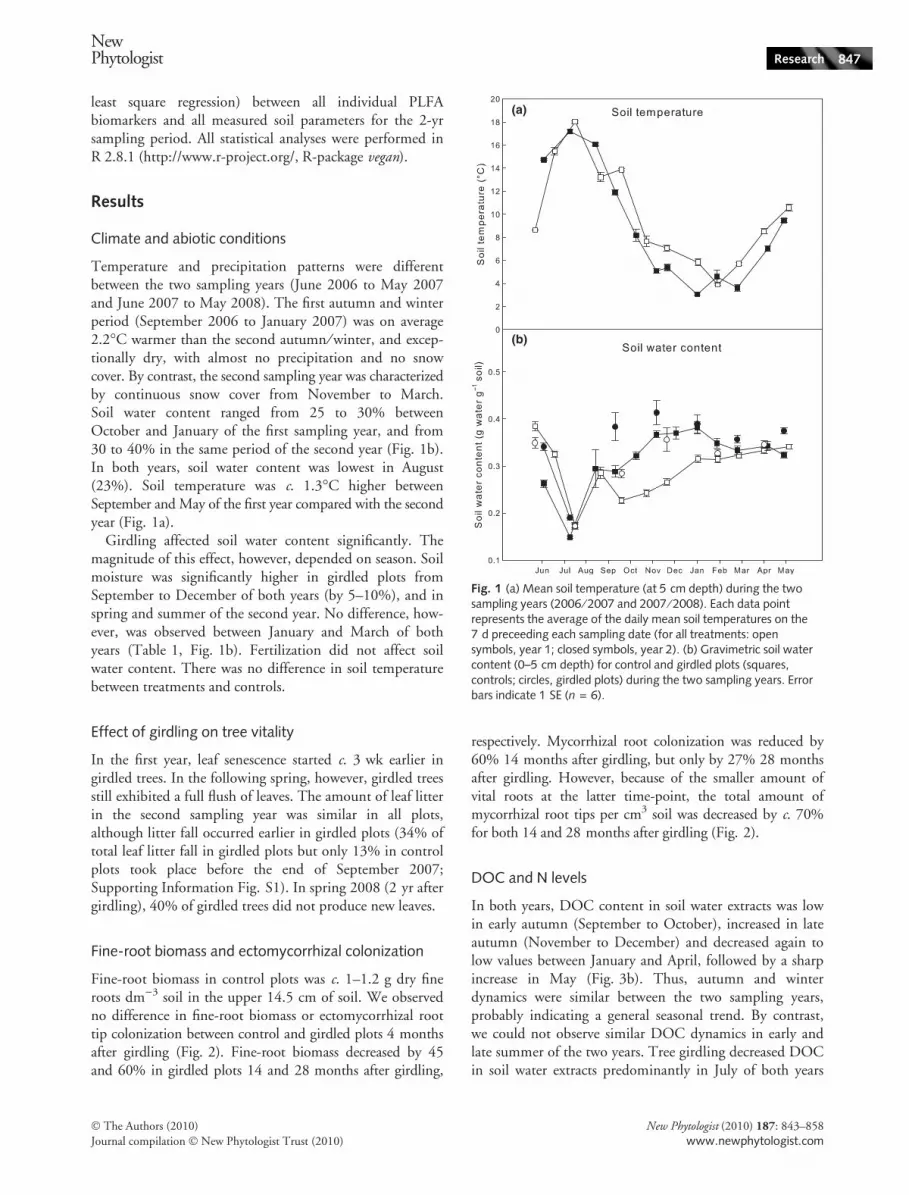
Temperature and precipitation patterns were differentbetween the two sampling years (June 2006 to May 2007and June 2007 to May 2008). The first autumn and winterperiod (September 2006 to January 2007) was on average2.2�C warmer than the second autumn ⁄ winter, and excep-tionally dry, with almost no precipitation and no snowcover. By contrast, the second sampling year was characterizedby continuous snow cover from November to March.Soil water content ranged from 25 to 30% betweenOctober and January of the first sampling year, and from30 to 40% in the same period of the second year (Fig. 1b).In both years, soil water content was lowest in August(23%). Soil temperature was c. 1.3�C higher betweenSeptember and May of the first year compared with the secondyear (Fig. 1a).
Girdling affected soil water content significantly. Themagnitude of this effect, however, depended on season. Soilmoisture was significantly higher in girdled plots fromSeptember to December of both years (by 5–10%), and inspring and summer of the second year. No difference, how-ever, was observed between January and March of bothyears (Table 1, Fig. 1b). Fertilization did not affect soilwater content. There was no difference in soil temperaturebetween treatments and controls.
Effect of girdling on tree vitality
In the first year, leaf senescence started c. 3 wk earlier ingirdled trees. In the following spring, however, girdled treesstill exhibited a full flush of leaves. The amount of leaf litterin the second sampling year was similar in all plots,although litter fall occurred earlier in girdled plots (34% oftotal leaf litter fall in girdled plots but only 13% in controlplots took place before the end of September 2007;Supporting Information Fig. S1). In spring 2008 (2 yr aftergirdling), 40% of girdled trees did not produce new leaves.
Fine-root biomass and ectomycorrhizal colonization
Fine-root biomass in control plots was c. 1–1.2 g dry fineroots dm)3 soil in the upper 14.5 cm of soil. We observedno difference in fine-root biomass or ectomycorrhizal roottip colonization between control and girdled plots 4 monthsafter girdling (Fig. 2). Fine-root biomass decreased by 45and 60% in girdled plots 14 and 28 months after girdling,
respectively. Mycorrhizal root colonization was reduced by60% 14 months after girdling, but only by 27% 28 monthsafter girdling. However, because of the smaller amount ofvital roots at the latter time-point, the total amount ofmycorrhizal root tips per cm3 soil was decreased by c. 70%for both 14 and 28 months after girdling (Fig. 2).
DOC and N levels
In both years, DOC content in soil water extracts was lowin early autumn (September to October), increased in lateautumn (November to December) and decreased again tolow values between January and April, followed by a sharpincrease in May (Fig. 3b). Thus, autumn and winterdynamics were similar between the two sampling years,probably indicating a general seasonal trend. By contrast,we could not observe similar DOC dynamics in early andlate summer of the two years. Tree girdling decreased DOCin soil water extracts predominantly in July of both years
(a)
(b)
Fig. 1 (a) Mean soil temperature (at 5 cm depth) during the twosampling years (2006 ⁄ 2007 and 2007 ⁄ 2008). Each data pointrepresents the average of the daily mean soil temperatures on the7 d preceeding each sampling date (for all treatments: opensymbols, year 1; closed symbols, year 2). (b) Gravimetric soil watercontent (0–5 cm depth) for control and girdled plots (squares,controls; circles, girdled plots) during the two sampling years. Errorbars indicate 1 SE (n = 6).
NewPhytologist Research 847
� The Authors (2010)
Journal compilation � New Phytologist Trust (2010)
New Phytologist (2010) 187: 843–858
www.newphytologist.com

()21.7% (P = 0.058) and )20% (P = 0.044), respectively),but did not affect DOC during autumn and winter(Fig. 3b). Total (= organic and inorganic) dissolved N insoil water extracts peaked around mid-summer (August) inboth years, followed by a sharp decrease in autumn to lowlevels in winter (Fig. 3a). Levels of dissolved N were signifi-cantly enhanced by fertilization and girdling, on average(over the whole sampling period) by 28 and 170%, respec-tively (P < 0.001 and P < 0.05, respectively; Fig. 3,Table 1).
Soil enzyme activities
Soil enzyme activities were high in spring, late summer andautumn, and low in mid-summer and winter (Fig. 4). Thespring peak was highly synchronous for all measuredenzymes (in 2007), starting with fairly low levels in Marchand increasing to maximum levels in June, followed againby a summer decline. The second (‘autumn’) peak occurredat different times for different enzymes: (potential) pheno-loxidase and peroxidase showed maximum activities alreadyin late summer (around September), whereas glucose pro-duction (by actual cellulase ⁄ amylase activity; Fig. 4g) andactual protease activity (Fig. 4h) had their autumn
maximum around November. At this time, phenoloxidaseand peroxidase activities had already dropped to very lowlevels (Fig. 4e,f).
We found no significant effect of girdling or fertilizationon enzymes measured using fluorescent substrates (chitin-ase, cellobiosidase, N-acetylglucosaminidase and peptidase)during the first year (Table 1, Fig. 4a–d). In the secondyear, chitinase was found to be significantly decreased ingirdled plots (Table 1, Fig. 4a).
‘Actual’ protease and cellulase activities were markedlyreduced in girdled plots, whereas phenoloxidase and peroxi-dase activities were significantly enhanced (Fig. 4e–h,Table 1). These shifts in activities occurred already in thefirst summer after girdling. Fertilization affected phenoloxi-dase and peroxidase activity only in the second year(Table 1, Fig. 4e,f).
Microbial biomass
The annual course of the amount of total PLFAs, as a mea-sure of microbial biomass, was similar in the two samplingyears in control plots, apart from a small time shift(Fig. 5a). Microbial biomass showed two phases of lowervalues during the course of a year: the first in June (July in
Table 1 Significance of the effects of girdling, fertilization and sampling month on various soil parameters derived from an analysis of variance(ANOVA)
Soil parameter
Year 1 Year 2
Girdling Fertilization Girdling Fertilization
m(df = 5)
g(df = 1)
g · m(df = 5)
m(df = 5)
f(df = 1)
f · m(df = 5)
m(df = 6)
g(df = 1)
g · m(df = 6)
m(df = 6)
f(df = 1)
f · m(df = 6)
Soil water content *** *** *** *** ns ns *** *** * *** ns nsCellobiosidase *** ns ns *** ns ns *** ns � *** ns nsChitinase *** � ns *** ns ns *** ** ns ** ns nsN-Acetylglucosaminidase *** ns ns *** ns ns *** ns ** *** ns nsLeu-peptidase *** ns ns *** ns ns *** ns *** *** ns nsPhenoloxidasea *** � *** *** ns ns *** ns *** *** * ***Peroxidasea *** *** ** *** ns ns *** ns *** *** *** ***Actual proteaseb *** *** ns ** ns ns *** *** � *** ns *Glucose productionc *** *** ** *** ns ns *** ** *** *** � nsDOC ** ns ns ** ns ns *** ns ns *** ns *Total dissolved N (dN) *** *** *** *** * ns *** *** *** *** ** nsDOC: dN *** *** *** *** *** ** *** *** *** *** ** **CCA1 *** ns ns *** * *** *** ns ns *** ns �CCA2 * *** ** ns ns ns ** *** ns * * ns
Presented are levels of significance resulting from factorial ANOVAs (with month and treatment as factors) conducted separately for thegirdling and fertilization treatments, and for each year of the experiment. DOC, dissolved organic carbon; m, month of sampling; g, girdling;f, fertilization; g · m and f · m, interactions of month and treatment. The number of replicates for the first and second years was n = 72(six samplings) and n = 84 (seven samplings), respectively. Degrees of freedom (df) for each factor are indicated in the table headings, withthe following exceptions. an = 72 and df (m and m · treatment) = 5 for year 2; bn = 60 and df (m and m · treatment) = 4 for year 1; cn = 48and df (m and m · treatment) = 3 for year 1. CCA1, CCA2, sampling scores of the first two axes of the canonical correspondence analysis(Fig. 6, Supporting Information Fig. S2).Significance levels: ***, P < 0.001; **, P < 0.01; *, P < 0.05; �, P < 0.1.ns, not significant.
848 Research
NewPhytologist
� The Authors (2010)
Journal compilation � New Phytologist Trust (2010)
New Phytologist (2010) 187: 843–858
www.newphytologist.com

the second year) and the second in February (March in thesecond year). In both years we observed a sharp increase ofbiomass in spring and a period of high values in autumn(Fig. 5a, Table S1).
Girdling decreased the total amount of PLFAs by 15%on average between July 2006 and January 2008 (2–20 months after girdling). In the same time period, the sumof bacterial biomarkers was decreased by c. 14%, theamount of the fungal biomarker 18:1x9 by 16% and thefungal biomarker 18:2x6,9 by as much as 51% (Fig. 5).
Fungi are thought to contain smaller amounts of PLFAsper g biomass compared with bacteria because of a higherratio of cell volume to cell surface, which makes it difficultto estimate the real fungi to bacteria ratio from PLFA data(Joergensen & Wichern, 2008). Thus, the reduction of51% of the 18:2x6,9 biomarker may translate into a muchgreater reduction of the total microbial biomass than the15% loss of total PLFAs suggests. It is worth noting that ingirdled plots the seasonal trend was maintained for bacteriaand the fungal biomarker 18:1x9, but not for the fungal bi-omarker 18:2x6,9, which had already started to decreasestrongly 2 months after girdling (Fig. 5). Fertilization had
no significant effect on the total amount of bacterial orfungal PLFA biomarkers.
Microbial community composition
We conducted a canonical correspondence analysis (CCA)in order to assess how far the variation observed in themicrobial community composition was related to specificenvironmental parameters. By contrast to unconstrainedmultivariate analysis, CCA displays only the part of thevariation in the community data that can be explained by theused constraints. Our analysis revealed that soil temperatureand soil water content were related to 20% of the PLFAvariability, whereas labile C and N (DOC and dissolved N)could only explain 4.3% of the total community variability(Table 2). Enzyme activities, however, were linked to 24%of the variability in the community matrix. Of all enzymes,phenoloxidase, peroxidase and peptidase were most stronglyrelated to community structure (19.9%), whereas otherenzymes explained much smaller parts of the variance (e.g.N-actyl-glucosaminidase, chitinase and cellobiase only5.4%; Table 2).
Altogether, c. 36% of the variability of the microbialcommunity matrix throughout seasons and treatmentscould be related to a combination of enzymatic activitiesand environmental parameters (Fig. 6, Table 2). Of theconstrained variability, CCA axis 1 (CCA1) accounted for72.2%, and CCA axis 2 (CCA2) for 12.4%. Both CCA1and CCA2 were significant (P < 0.001; permutation test).We found significant effects of seasons and girdling onmicrobial community composition along these two axes(Fig. 6, Table 1). Different sampling months were mainlyseparated on CCA1 whereas control and girdled plots couldbe separated on CCA2 (Fig. 6b). No general trend forspecific microbial groups (Gram-negative bacteria, Gram-positive bacteria, all bacteria, fungi) was observed alongCCA1, indicating that seasonal microbial community shiftswere caused by changes within all groups. The communityshift along CCA2 (reflecting the effect of girdling) wasdominated by the influence of two fungal biomarkers(18:2x6,9 and 18:3x3,6,9) and one bacterial biomarker(18:1x5), which were negatively correlated to that axis(indicating reduced abundance of these markers in samplesfrom the girdling treatment). The influence of the thirdfungal biomarker (18:1x9) was comparably low (Fig. 6).
Of all sampling months, February of the first year andNovember of the second year had the highest scores onCCA1 (Supporting information Fig. S2). Both were the firstmonths in which winter conditions (high soil moisture andlow soil temperature) occurred in the respective year. Springand summer months were characterized by lower scores(Fig. S2). Soil temperature and soil water content as well asperoxidase and peptidase activities exhibited a strong effecton CCA1, indicating that they were closely related to
(a)
(b)
Fig. 2 Dry fine-root biomass (a) and ectomycorrhizal root tips(b) per dm)3 of soil in control and girdled plots at 4, 14.5 and28 months after girdling. Black bars, controls; gray bars, girdledplots. Error bars indicate 1 SE (n = 6). Asterisks indicate statisticalsignificant differences between control and girdled plots for eachtime-point (ns, not significant; *, P < 0.05; **, P < 0.01;***, P < 0.001).
NewPhytologist Research 849
� The Authors (2010)
Journal compilation � New Phytologist Trust (2010)
New Phytologist (2010) 187: 843–858
www.newphytologist.com

seasonal variation of microbial community composition(Fig. 6).
A regression analysis of each individual biomarker witheach microbial process revealed interesting links betweenmicrobial processes and community structure (Table 3).The results of this regression analysis showed that enzymaticactivities can be separated into three groups, each of themrelating to a specific set of individual PLFA biomarkers.First, phenoloxidase and peptidase activities were correlatedwith peroxidase activity and all three enzymes were corre-lated to the same same set of individual PLFAs, includingthe majority of Gram-positive biomarkers (i15:0, a15:0,i16:0), certain Gram-negative biomarkers (16:1x7,16:1x9) and a few general bacterial biomarkers (14:0,16:1x11) (Table 3). Secondly, cellobiosidase, N-acetylglu-cosaminidase and chitinase were correlated with each other.Overall, these enzymes did not correlate with any specificPLFA biomarker, with the exeption of N-acetylglucosa-minidase and chitinase which were correlated to the microbialbiomass (sum of all PLFAs). The third group of enzymeactivities, comprising ‘actual’ protease and cellulase ⁄amylase activities, were not correlated to any bacterial
biomarker, but – together with chitinase activity – to thefungal biomarkers 18:2x6,9 and 18:3x3,6,9 (Table 3).There was no correlation of one of the fungal biomarkerswith peroxidase or phenoloxidase activity. However, whenthe regression analysis only for girdled plots was examined,a strong correlation (r2 = 0.54, P < 0.005) between18:2x6,9 and phenoloxidase activity was found (Table S2).
Discussion
Tree roots provide an important source of easily assimilableC for soil microbes and allow the establishment of a specificmicrobial community (Brant et al., 2006). In temperateforests, an important part of this community comprisesectomycorrhizal fungi (Read & Perez-Moreno, 2003; Joneset al., 2004), but other microbial groups also benefit fromthis source of C (Butler et al., 2003). Eliminating below-ground C allocation by tree girdling in our study had a two-fold effect on C and N availability for microbes. First, it ledto decreased DOC contents in the soil during the summer.This effect was similar to that of other girdling studieswhich also found small season-dependent effects of girdling
(a)
(b)
Fig. 3 Total dissolved nitrogen (a) anddissolved organic carbon (b) in soil waterextracts over the course of the two samplingyears (squares, controls; circles, girdled plots;triangles, fertilized plots; dotted lines connectcontrol values to show the seasonal trend).All data are plotted on the actual samplingdate; ticks are for the 15th day of eachmonth. Error bars indicate 1 SE (n = 6).
850 Research
NewPhytologist
� The Authors (2010)
Journal compilation � New Phytologist Trust (2010)
New Phytologist (2010) 187: 843–858
www.newphytologist.com

on DOC contents in soil water extracts (Weintraub et al.,2007; Zeller et al., 2008). As DOC is a labile pool with fastturnover times, its absolute amount may provide little infor-mation about substrate supply to microbes. However, wealso observed a reduced microbial biomass and a strong
decline of soil CO2 efflux (B. Kitzler et al., unpublished),confirming that the availability of easily assimilable C wassubstantially depleted in the girdling treatments. By con-trast, N concentrations were strongly enhanced in the soilwater of girdled plots, presumably as a result of reduced
Glucose production Amino acid production
(a) (b)
(c) (d)
(e) (f)
(g) (h)
b
b
Fig. 4 Soil extracellular enzyme activities in control, fertilized and girdled plots throughout the 2-yr sampling period (squares, controls; circles,girdled plots; triangles, fertilized plots; dotted lines connect control values to show the seasonal trend). (a–f) Potential activities (activities mea-sured using fluorometric and photometric methods after addition of a specific substrate). (g, h) Actual enzyme activities (no substrate added).All data are plotted on the actual sampling date; ticks are for the 15th day of each month. MUF, Methylumbelliferyl; AMC,Aminomethylcoumarin; DOPA, L-3,4-dihydroxyphenylalanin; AS-N, Amino acid-nitrogen. Error bars indicate 1 SE (n = 6).
NewPhytologist Research 851
� The Authors (2010)
Journal compilation � New Phytologist Trust (2010)
New Phytologist (2010) 187: 843–858
www.newphytologist.com

plant N uptake caused by reductions in mycorrhizal hyphaeand fine roots in the soil (Jordan et al., 1998). Increased dis-solved inorganic N concentrations in response to girdlinghave also been found in other studies (Weintraub et al.,2007; Zeller et al., 2008; Dannenmann et al., 2009) andmay affect microbial community composition in additionto the loss of root C input.
The effect of girdling on soil C and N availability led tosubstantial changes in microbial biomass and community
composition. Although only a small proportion of thebacterial community (15%) was affected, the fungal bio-marker 18:2x6,9 was reduced by 51%. This is consistentwith other girdling studies, which showed a strong declineof the fungal biomarker 18:2x6,9, but almost no responseof 18:1x9. Compared with other types of fungi, mycorrhi-zal fungi depend to a much higher degree on belowgroundC allocation by trees. It is therefore safe to assume that thereduction of fungal biomarkers after girdling was relatedmainly to the reduction of mycorrhizal fungi, as has alsobeen suggested by others (Hogberg, 2006; Hogberg et al.,2007; Yarwood et al., 2009). Surprisingly, we found astrong decrease of 18:2x6,9 just 2 months after girdling(Fig. 5), although we did not observe any decrease ofmycorrhizal root colonization 4 months after girdling(Fig. 2). The latter is consistent with the results of anotherbeech girdling experiment (Dannenmann et al., 2009), inwhich girdling had no effect on mycorrhizal root coloniza-tion in the first year. In our study, however, mycorrhizalroot colonization decreased by as much as 60% 14 monthsafter girdling (Fig. 2). Our results suggest that reducing theinput of labile root C initially resulted in a strong decreaseof the mycorrhizal extramatrical hyphal network in the soilwithin the first 2 months, followed only later by a decreasein ectomycorrizal root tips and a loss of fine-root biomass.
Potential activities of cellobiosidase, N-acetylglucosa-minidase and peptidase were not significantly affected bygirdling, demonstrating that they were not linked to rootexudations. These enzymes (measured using relatively
(a)
(b)
(c)
(d)
Fig. 5 Total phospholipid fatty acid (PLFA; a), bacterial (b) andfungal (c, d) biomarkers in control, girdled and fertilized plots over aperiod of 2 yr (squares, controls; circles, girdled plots; triangles,fertilized plots; dotted lines connect control values to show theseasonal trend). All data are plotted on the actual sampling date;ticks are for the 15th day of each month. Error bars indicate 1 SE(n = 6).
Table 2 Relationship between different soil parameters and soilmicrobial community composition
Set of constraints
Explainedfraction ofvariability (%)
Soil temperature and soil water content 20.3DOC and dN 4.3N-acetyl-b-D-glucosaminidase, chitinaseand cellobiosidase
5.4
Peptidase 12.1Phenoloxidase and peroxidase 15.9Phenoloxidase, peroxidase and peptidase 19.9Actual protease and cellulase ⁄ amylase* 6.3All enzymes 24.2All parameters 36.0
Presented are the contributions of constrained variability to totalcommunity variability by canonical correspondence analysis (CCA)conducted with different sets of constraining variables. CCA wasbased on data from bimonthly samplings of control, fertilized andgirdled plots between August 2006 and May 2008 (with theexclusion of August 2007 because of missing peroxidase andphenoloxidase data; 11 samplings; n = 195). Additionally, datafor July 2006 are missing for cellulose ⁄ amylase actitivity(*; 10 samplings; n = 177). DOC, dissolved organic carbon; dN,total dissolved nitrogen.
852 Research
NewPhytologist
� The Authors (2010)
Journal compilation � New Phytologist Trust (2010)
New Phytologist (2010) 187: 843–858
www.newphytologist.com

simple low-molecular-weight substrates) possibly representa general trait of microbial groups other than mycorrhizalfungi and rhizosphere bacteria, which were not affected bygirdling. In contrast to the above-mentioned enzyme activi-ties, our results showed a clear decrease of actual cellulaseand protease activities in girdled plots already in the firstyear, especially at times when these rates were at peak valuesin control plots; that is, in spring and autumn (Fig. 4). Thediminishing of the spring peak in girdled plots indicatesthat this peak is linked to root exudates. Spring exudatesmay have accelerated the turnover of microbes, leading to aflush of proteins and carbohydrates (De Nobili et al., 2001;Kuzyakov, 2002; Phillips et al., 2008). The autumn peak inenzyme activity, in contrast, may be explained by the inputof fresh litter at that time. Approximately 70% of N-richlow-order roots are thought to have turnover times of< 1 yr (Kielland et al., 2006; Guo et al., 2008; Pritchard &Strand, 2008) and a large proportion of fine-root mortalityis usually found at the end of the growing season (Ruess
et al., 2003). Together with leachates from leaf litter, thispeak of fine-root mortality in autumn may therefore haveled to a large input of cellulose and protein into the soil andsubsequently to increased glucose and amino acid production.
As there was no reduction in overall fine-root biomass inthe first year of girdling, we assume that this input of freshsubstrates did occur in control as well as in girdled plots.Nevertheless, girdling strongly reduced this autumn peak ofglucose and amino acid production (by > 50%) inNovember of both years (Fig. 4) This reduction was corre-lated to a strong reduction of the autumn and winter peakof fungal biomarkers in girdled plots (Fig. 5b, Table 3),suggesting that mycorrhizal fungi may be closely involvedin protease and cellulase ⁄ amylase activity in autumn. At thetime when amino acid and glucose production rates exhibitedtheir autumn peak (in November), (potential) phenol-oxidase and peroxidase activities strongly decreased to verylow values (Fig. 4). Thus, we observed a temporal shiftin enzyme activities from an early autumn maximum of
(a)
(b)
Fig. 6 Relationship between microbial community composition and various soil parameters analyzed by canonical correspondence analysis(CCA). Phospholipid fatty acid (PLFA) data were used as the community matrix; environmental and microbial process data as a constrainingmatrix. The analysis was based on data from all samplings between 6 August and 8 May, except for 7 July. (a) The distribution of individualPLFA biomarkers (weighted scores) is shown on the first two axes. Additionally, the biplot scores of constraining variables depicting theinfluence of soil parameters are shown on these axes. Biomarkers are colored according to their allocation to specific microbial groups.a*, 18:1x7 and cy17:0; N_ac, N-acetyl-b-D-glucosaminidase; cell, cellobiosidase; stemp, soil temperature; act_prot, actual protease; pept,leucine-peptidase. (b) The distribution of the bimonthly samplings for the two sampling years is shown along the first two axes. Circles, girdledplots; squares, control plots; triangles, fertilized plots. The contribution of constrained variability to total variability was 36%, of which CCA1accounts for 74.8% and CCA2 for 12.5%. CCA1 and CCA2 were both significant (P < 0.001; permutation test). The distribution of bimonthlysamplings in the course of time is shown in Supporting Information Fig. S2.
NewPhytologist Research 853
� The Authors (2010)
Journal compilation � New Phytologist Trust (2010)
New Phytologist (2010) 187: 843–858
www.newphytologist.com

oxidative enzymes to a late autumn maximum of hydrolyticenzymes. While the maxima of cellulase and protease activi-ties can be readily explained by increased substrate inputs inlate autumn (see the Discussion section), the reasons for thedrop in oxidative enzymes by c. 70% from September toDecember are less clear. Our data suggest that it is not likelythat this drop was driven by abiotic factors. For example,October 2006 exhibited warmer soil temperatures thanSeptember, although there was already a strong decrease (by
45%) in oxidative enzymes in this period (Fig. 4). Potentialmeasurements of oxidative enzyme activities may, however,reflect the abundance of the microbes producing them,rather than the actual rates of these enzyme activities.Phenoloxidase and peroxidase catalyze the key reactions inthe degradation of lignin and humified SOM and have tobe carried out by specialist microbes (Hatakka, 2001;Baldrian, 2009). However, specialists for SOM degradationwill only have an advantage over others when other sources
Table 3 Linear regressions of phospholipid fatty acid biomarkers and various soil parameters
PLFAbiomarkers
Soil parameterWatercontent
Soiltemp Cellob. Chitin. N-acet. L-pept. Ph.ox. Perox.
Act.prot. Gluc. p. dN DOC: dN
Gram-positive i15:0 0.36 0.52 0.37 0.56a15:0 0.30 0.50 0.33 0.47i16:0 0.38 0.36 0.38 0.45i17:0 0.36 0.27 0.29a17:0 0.27
Actinomycetes 10me16Gram-negative 18:1x7
cy17:016:1x7 0.27 0.40 0.30 0.5416:1x9 0.36 0.49 0.27 0.36cy18:0 0.32 0.34cy19:016:1x5 0.28 0.36 0.35 0.31 0.29 0.28
Bacteria 18:1x5 0.2717:0015:00 0.36 0.41 0.35 0.5517:1x6
Fungi 18:2x6 0.29 0.36 0.27 0.3518:1x9
F&P 18:3x3 0.26 0.27 0.57 0.38General 14:00 0.36 0.55 0.38 0.58
16:00 0.33 0.32 0.30 0.3616:1x11 0.28 0.32 0.41 0.31 0.3316:1x6 0.37 0.27 0.35 0.3517:1x6 0.2518:00 0.26 0.28 0.28
Groups Gram+ 0.36 0.47 0.36 0.50Gram)Bacteria 0.27 0.41 0.34 0.38FungiAll 0.26 0.35 0.30 0.37 0.34
Processes Cellob. 1.00 0.42 0.32Chitin. 0.42 1.00 0.62 0.35N-acet. 0.32 0.62 1.00 0.37L-pept. 1.00 0.30Ph.ox. 0.34 1.00 0.52Perox. 0.47 0.30 0.52 1.00Act. prot. 0.37 1.00 0.32Gluc. p. 0.35 1.00
Presented are goodness of fit (R2) of statistical significant (P < 0.01) relationships between parameters; empty fields indicate that the regres-sion was not significant. Bold values show R2 > 0.5. Regressions are based on data from control and girdling plots from all samplings over the2-yr sampling period (mean values of each sampling). Cellob., cellobiosidase; Chitin., chitinase; N-acet., N-acetyl-glucosaminidase; L-pept.,leucine-peptidase; Ph.ox., phenoloxidase; Perox., peroxidase; Act. prot., actual protease; Gluc. p., glucose production; dN, total dissolvednitrogen; F&P, fungi and plants; DOC, dissolved organic carbon; PFLA, phospholipid fatty acid.
854 Research
NewPhytologist
� The Authors (2010)
Journal compilation � New Phytologist Trust (2010)
New Phytologist (2010) 187: 843–858
www.newphytologist.com

of nutrients (such as fresh organic matter (FOM)) are scarce(Fontaine et al., 2003; Kuzyakov et al., 2009; Paterson,2009), which is possibly the case during summer. Plant rootexudates may provide a constant energy supply at low Nlevels during summer, thereby creating optimal conditionsfor SOM degraders (Fontaine et al., 2003). This situationmay change fundamentally when N-rich substrates, such asdying fine roots and leaf litter leachates, appear in autumn.SOM-degrading microbes may then lose their competitiveadvantage over microbes decomposing FOM, explainingthe rapid autumn and winter decrease of phenoloxidase ⁄peroxidase.
Competition between microbial groups could also havebeen responsible for the shift of enzyme activities fromhydrolytic enzymes to oxidative enzymes in girdled plots.Mycorrhizal fungi are known to dominate the rooted soillayers as a result of a competitive advantage gained throughaccess to root C, whereas saprotrophic fungi are thought tobe more competitive in the litter layer (Hobbie & Horton,2007; Lindahl et al., 2007). Although ectomycorrhizalfungi have been found to be able to produce cellulases, pro-teases and phenoloxidases (Luis et al., 2005; Cullings &Courty, 2009), saprotrophic fungi are thought to possess amuch greater capacity to produce peroxidases (Luis et al.,2005; Baldrian, 2009; Cullings & Courty, 2009). Girdlinggreatly decreased the abundance of mycorrhizal fungi,thereby possibly also giving saprotrophic fungi a competi-tive advantage in the rooting zone. At the same time,girdling reduced easily assimilable C in soils, which mayhave led to starvation of microbes, while N availabilityincreased to very high levels (Fig. 3). According to the cur-rent understanding of rhizosphere priming, this would notfavour SOM degradation, because under such conditionsthere is no need to mineralize N and SOM degradation togain C would be too energy demanding (Kuzyakov et al.,2009; Paterson, 2009). Nevertheless, potential oxidativeenzyme activities rose in girdling plots in our experiment,suggesting that, at least in the longer term, the reducedabundance of mycorrhizal fungi may have relieved thecompetitive disadvantage of slow-growing specialist decom-posers (e.g. saprotrophic fungi) which possess the ability todegrade SOM by releasing peroxidases and phenoloxidases(Hobbie & Horton, 2007; Baldrian, 2009).
Alternatively, reducing C input from the host tree couldhave led to a shift within the ectomycorrhizal communitytowards species with a greater ability to produce SOM-degrading enzymes or to a physiological switch ofectomycorrhizal fungi towards increased saprotrophic activ-ity (Buee et al., 2007; Talbot et al., 2008; Cullings &Courty, 2009). Different mechanisms have recently beensuggested which may lead to the decomposition of SOM bymycorrhizal fungi; for example, the need for an alternativeC source when supplies of photosynthetates from plants arelow, or, by contrast, ‘priming’ with high amounts of
photosynthetates, which may accelerate the growth andactivity of ectomycorrhizal fungi (Courty et al., 2007;Cullings et al., 2008; Talbot et al., 2008). Our resultssuggest that, if mycorrhizal fungi were able to switch tosaprotrophy at low C supply (as indicated by increasedphenoloxidase and peroxidase activities in girdled plots), itwas apparently not very effective, as fungal biomass stronglydecreased in girdled plots. Instead, it seems plausible thatfungi were primed by tree C in control plots, in which theygrew to high abundances from summer to autumn and werelinked to high activities of cellulase and protease, both ofwhich diminished in girdled plots. An increase of pheno-loxidase and peroxidase activities after girdling was alsofound by Weintraub et al. (2007), who suggested that thismay have been caused by increasing availability of deadfine-root biomass as a result of girdling. However, becauseof the rapid increase of oxidative enzymes in girdled plotsjust 2 months after treatment and the lack of a decrease infine-root biomass in the first 4 months (Fig. 2), we rule outthis explanation for our experiment.
Regression analysis of PLFAs and enzyme activities overall seasons revealed three ‘groups’ of enzymes, each relatedto a specific set of individual PLFA biomarkers (Table 3).Of all measured enzyme activities, the activities of pheno-loxidase, peroxidase and leucine-peptidase were those linkedto the largest part of the variation (20%) in the microbialcommunity composition, whereas cellobiosidase, N-acetyl-glucosaminidase and chitinase showed the weakest relationto community composition (Tables 2, 3). The high numberof significant correlations between PLFA biomarkers andenzymes suggests that the observed enzyme pattern wasdetermined to a large extent by microbial communitydynamics, rather than by individual physiological responseof microbes to varying nutrient and energy availability.Correlations between phenoloxidase, peroxidase and indi-vidual PLFAs were stronger and also involved the fungalbiomarker 18:2x6,9 (R2 = 0.54, P = 0.007; Table S2)when girdled plots were analyzed alone, indicating thatmore microbial groups were connected to these enzymeactivities after girdling (Table S2).
Tree C allocation to the belowground microbial communityhas been shown to enhance the decomposition of recal-citrant C compounds (Ekberg et al., 2007) and to result ina long-term net C loss from soil (Carney et al., 2007;Dijkstra & Cheng, 2007). Carney et al. (2007) showed thatelevated root C input altered the microbial communitystructure towards a higher proportion of fungi, which inturn led to greater priming of SOM decomposition by leaflitter. This indicates that SOM decomposition may bedetermined by microbial community composition and anappropriate source of energy. In the present study, we com-pared a system with a specialized root-C-based microbialcommunity to a system inhabited by a community not sup-ported by tree root C. In the ‘intact’ system, we see clear
NewPhytologist Research 855
� The Authors (2010)
Journal compilation � New Phytologist Trust (2010)
New Phytologist (2010) 187: 843–858
www.newphytologist.com

seasonal trends, suggesting that FOM degradation, as indi-cated by actual cellulase ⁄ amylase and protease activities,seems to be enhanced in autumn, whereas SOM degrada-tion, as indicated by a higher potential activity of oxidativeenzymes, may be enhanced during the summer months. Inthe girdled system, however, this trend disappeared andlower rates for cellulase and protein degradation, especiallyin autumn, were found. The possible conclusion thatmycorrhizal fungi may be involved in autumn litter degra-dation, however, still needs to be confirmed by directmeasurements.
Overall, our study demonstrated the importance ofplant–decomposer interactions for C and N cycling in tem-perate forests on a seasonal time-scale. Our results showedthat extracellular enzymes mediating the decomposition ofSOM and litter in a beech forest soil are linked to microbialcommunity composition and exhibit a strong seasonal pat-tern. Our findings indicate that, through belowground Callocation, trees alter microbial community structure andthus may affect the seasonal pattern of microbial decompo-sition processes.
Acknowledgements
This work was supported by the Austrian Science Fund(FWF; project number P18495-B03) and in part by theFWF National Research Network MICDIF (S1001-B07).We are grateful to Ieda Nunes-Cornelio Hammerle andBirgit Wild for valuable help in the field and to four anony-mous reviewers for helpful comments on the manuscript.
References
Allison SD, Czimczik CI, Treseder KK. 2008. Microbial activity and soil
respiration under nitrogen addition in Alaskan boreal forest. GlobalChange Biology 14: 1156–1168.
Anderson MJ, Willis TJ. 2003. Canonical analysis of principal
coordinates: a useful method of constrained ordination for ecology.
Ecology 84: 511–525.
Baldrian P. 2009. Ectomycorrhizal fungi and their enzymes in soils: is
there enough evidence for their role as facultative soil saprotrophs?
Oecologia 161: 657–660.
Bardgett RD, Bowman WD, Kaufmann R, Schmidt SK. 2005. A
temporal approach to linking aboveground and belowground ecology.
Trends in Ecology & Evolution 20: 634–641.
Boschker HTS, Bertilsson SA, Dekkers EMJ, Cappenberg TE. 1995. An
inhibitor-based method to measure initial decomposition of naturally-
occurring polysaccharides in sediments. Applied and EnvironmentalMicrobiology 61: 2186–2192.
Brant JB, Myrold DD, Sulzman EW. 2006. Root controls on soil
microbial community structure in forest soils. Oecologia 148: 650–
659.
Buee M, Courty PE, Mignot D, Garbaye J. 2007. Soil niche effect on
species diversity and catabolic activities in an ectomycorrhizal fungal
community. Soil Biology & Biochemistry 39: 1947–1955.
Butler JL, Williams MA, Bottomley PJ, Myrold DD. 2003. Microbial
community dynamics associated with rhizosphere carbon flow. Appliedand Environmental Microbiology 69: 6793–6800.
Carney KM, Hungate BA, Drake BG, Megonigal JP. 2007. Altered soil
microbial community at elevated CO2 leads to loss of soil carbon.
Proceedings of the National Academy of Sciences, USA 104: 4990–4995.
Courty PE, Breda N, Garbaye J. 2007. Relation between oak tree
phenology and the secretion of organic matter degrading enzymes by
Lactarius quietus ectomycorrhizas before and during bud break. SoilBiology & Biochemistry 39: 1655–1663.
Cullings K, Courty PE. 2009. Saprotrophic capabilities as functional traits
to study functional diversity and resilience of ectomycorrhizal
community. Oecologia 161: 661–664.
Cullings K, Ishkhanova G, Henson J. 2008. Defoliation effects on enzyme
activities of the ectomycorrhizal fungus Suillus granulatus in a Pinuscontorta (lodgepole pine) stand in Yellowstone National Park. Oecologia158: 77–83.
Dannenmann M, Simon J, Gasche R, Holst J, Naumann PS, Koegel-
Knabner I, Knicker H, Mayer H, Schloter M, Pena R et al. 2009. Tree
girdling provides insight on the role of labile carbon in nitrogen
partitioning between soil microorganisms and adult European beech.
Soil Biology & Biochemistry 41: 1622–1631.
De Nobili M, Contin M, Mondini C, Brookes PC. 2001. Soil microbial
biomass is triggered into activity by trace amounts of substrate. SoilBiology & Biochemistry 33: 1163–1170.
Dijkstra FA, Cheng WX. 2007. Interactions between soil and tree roots
accelerate long-term soil carbon decomposition. Ecology Letters 10:
1046–1053.
Ekberg A, Buchmann N, Gleixner G. 2007. Rhizospheric influence on soil
respiration and decomposition in a temperate Norway spruce stand. SoilBiology & Biochemistry 39: 2103–2110.
Fontaine S, Mariotti A, Abbadie L. 2003. The priming effect of organic
matter: a question of microbial competition? Soil Biology & Biochemistry35: 837–843.
Frostegard A, Tunlid A, Baath E. 1991. Microbial biomass measured as
total lipid phosphate in soils of different organic content. Journal ofMicrobiological Methods 14: 151–163.
Gonzalez I, Dejean S, Martin PGP, Baccini A. 2008. CCA: an R package
to extend canonical correlation analysis. Journal of Statistical Software23: 1–14.
Guo DL, Li H, Mitchell RJ, Han WX, Hendricks JJ, Fahey TJ, Hendrick
RL. 2008. Fine root heterogeneity by branch order: exploring the
discrepancy in root turnover estimates between minirhizotron and
carbon isotopic methods. New Phytologist 177: 443–456.
Harrison KA, Bol R, Bardgett RD. 2008. Do plant species with different
growth strategies vary in their ability to compete with soil microbes for
chemical forms of nitrogen? Soil Biology & Biochemistry 40: 228–237.
Hatakka A 2001. Biodegradation of lignin. In: Hofrichter M, Steinbuchel
A, eds. Biopolymers Vol. 1: Lignin, humic substances and coal.Weinheim, Germany: Wiley-VCH: 130–167.
Hill GT, Mitkowski NA, Aldrich-Wolfe L, Emele LR, Jurkonie DD,
Ficke A, Maldonado-Ramirez S, Lynch ST, Nelson EB. 2000. Methods
for assessing the composition and diversity of soil microbial
communities. Applied Soil Ecology 15: 25–36.
Hobbie EA, Horton TR. 2007. Evidence that saprotrophic fungi mobilise
carbon and mycorrhizal fungi mobilise nitrogen during litter
decomposition. New Phytologist 173: 447–449.
Hogberg MN. 2006. Discrepancies between ergosterol and the
phospholipid fatty acid 18: 2 omega 6,9 as biomarkers for fungi in
boreal forest soils. Soil Biology & Biochemistry 38: 3431–3435.
Hogberg MN, Hogberg P, Myrold DD. 2007. Is microbial community
composition in boreal forest soils determined by pH, C-to-N ratio, the
trees, or all three? Oecologia 150: 590–601.
Hogberg P, Nordgren A, Buchmann N, Taylor AFS, Ekblad A, Hogberg
MN, Nyberg G, Ottosson-Lofvenius M, Read DJ. 2001. Large-scale
forest girdling shows that current photosynthesis drives soil respiration.
Nature 411: 789–792.
856 Research
NewPhytologist
� The Authors (2010)
Journal compilation � New Phytologist Trust (2010)
New Phytologist (2010) 187: 843–858
www.newphytologist.com

Joergensen RG, Wichern F. 2008. Quantitative assessment of the fungal
contribution to microbial tissue in soil. Soil Biology & Biochemistry 40:
2977–2991.
Jones DL, Hodge A, Kuzyakov Y. 2004. Plant and mycorrhizal regulation
of rhizodeposition. New Phytologist 163: 459–480.
Jordan MO, Habib R, Bonafous M. 1998. Uptake and allocation of
nitrogen in young peach trees as affected by the amount of
photosynthates available in roots. Journal of Plant Nutrition 21: 2441–
2454.
Kaiser C, Frank A, Wild B, Koranda M, Richter A. 2010. Negligible
contribution from roots to soil-borne phospholipid fatty acid fungal
biomarkers 18:2x6,9 and 18:1x9. Soil Biology and Biochemistry,doi:10.1016/j.soilbio.2010.05.019.
Keeler BL, Hobbie SE, Kellogg LE. 2009. Effects of long-term nitrogen
addition on microbial enzyme activity in eight forested and grassland
sites: implications for litter and soil organic matter decomposition.
Ecosystems 12: 1–15.
Kielland K, Olson K, Ruess RW, Boone RD. 2006. Contribution of
winter processes to soil nitrogen flux in taiga forest ecosystems.
Biogeochemistry 81: 349–360.
Kitzler B, Zechmeister-Boltenstern S, Holtermann C, Skiba U,
Butterbach-Bahl K. 2006. Nitrogen oxides emission from two beech
forests subjected to different nitrogen loads. Biogeosciences 3: 293–310.
Kuzyakov Y. 2002. Review: factors affecting rhizosphere priming effects.
Journal of Plant Nutrition and Soil Science-Zeitschrift FurPflanzenernahrung Und Bodenkunde 165: 382–396.
Kuzyakov Y, Blagodatskaya E, Blagodatsky S. 2009. Comments on the
paper by Kemmitt et al. (2008) ‘Mineralization of native soil organic
matter is not regulated by the size, activity or composition of the soil
microbial biomass – A new perspective’ [Soil Biology & Biochemistry
40, 61–73]: The biology of the Regulatory Gate. Soil Biology &Biochemistry 41: 435–439.
Laczko E, Boller T, Wiemken V. 2004. Lipids in roots of Pinus sylvestrisseedlings and in mycelia of Pisolithus tinctorius during ectomycorrhiza
formation: changes in fatty acid and sterol composition. Plant, Cell &Environment 27: 27–40.
Leckie SE. 2005. Methods of microbial community profiling and their
application to forest soils. Forest Ecology and Management 220: 88–
106.
Lindahl BD, Ihrmark K, Boberg J, Trumbore SE, Hogberg P, Stenlid J,
Finlay RD. 2007. Spatial separation of litter decomposition and
mycorrhizal nitrogen uptake in a boreal forest. New Phytologist 173:
611–620.
Lipson DA, Schmidt SK, Monson RK. 1999. Links between microbial
population dynamics and nitrogen availability in an alpine ecosystem.
Ecology 80: 1623–1631.
Luis P, Kellner H, Zimdars B, Langer U, Martin F, Buscot F. 2005.
Patchiness and spatial distribution of laccase genes of ectomycorrhizal,
saprotrophic, and unknown basidiomycetes in the upper horizons of a
mixed forest cambisol. Microbial Ecology 50: 570–579.
Marx MC, Wood M, Jarvis SC. 2001. A microplate fluorimetric assay for
the study of enzyme diversity in soils. Soil Biology & Biochemistry 33:
1633–1640.
Moore S. 1968. Amino acid analysis – aqueous dimethyl sulfoxide as
solvent for ninhydrin reaction. Journal of Biological Chemistry 243:
6281.
Newman EI. 1966. A method of estimating total length of root in a
sample. Journal of Applied Ecology 3: 139.
Paterson E. 2009. Comments on the regulatory gate hypothesis and
implications for C-cycling in soil. Soil Biology & Biochemistry 41: 1352–
1354.
Phillips RP, Erlitz Y, Bier R, Bernhardt ES. 2008. New approach for
capturing soluble root exudates in forest soils. Functional Ecology 22:
990–999.
Pritchard SG, Strand AE. 2008. Can you believe what you see?
Reconciling minirhizotron and isotopically derived estimates of fine root
longevity New Phytologist 177: 287–291.
Prosser JI, Bohannan BJM, Curtis TP, Ellis RJ, Firestone MK,
Freckleton RP, Green JL, Green LE, Killham K, Lennon JJ et al. 2007.
Essay – the role of ecological theory in microbial ecology. NatureReviews Microbiology 5: 384–392.
Read DJ, Perez-Moreno J. 2003. Mycorrhizas and nutrient cycling in
ecosystems – a journey towards relevance? New Phytologist 157: 475–
492.
Ruess RW, Hendrick RL, Burton AJ, Pregitzer KS, Sveinbjornsson B,
Allen ME, Maurer GE. 2003. Coupling fine root dynamics with
ecosystem carbon cycling in black spruce forests of interior Alaska.
Ecological Monographs 73: 643–662.
Saiya-Cork KR, Sinsabaugh RL, Zak DR. 2002. The effects of long
term nitrogen deposition on extracellular enzyme activity in an Acersaccharum forest soil. Soil Biology & Biochemistry 34: 1309–
1315.
Schimel J, Balser TC, Wallenstein M. 2007. Microbial stress-response
physiology and its implications for ecosystem function. Ecology 88:
1386–1394.
Schimel JP, Weintraub MN. 2003. The implications of exoenzyme
activity on microbial carbon and nitrogen limitation in soil: a theoretical
model. Soil Biology & Biochemistry 35: 549–563.
Schmidt SK, Costello EK, Nemergut DR, Cleveland CC, Reed SC,
Weintraub MN, Meyer AF, Martin AM. 2007. Biogeochemical
consequences of rapid microbial turnover and seasonal succession in soil.
Ecology 88: 1379–1385.
Scott-Denton LE, Rosenstiel TN, Monson RK. 2006. Differential
controls by climate and substrate over the heterotrophic and
rhizospheric components of soil respiration. Global Change Biology 12:
205–216.
Sinsabaugh RL, Klug MJ, Collins HP, Yeager PE, Petersen SO. 1999.
Characterizing soil microbial communities. In: Robertson GP, Coleman
DC, Bledsoe CS, Sollins P, eds. Standard soil methods for long-termecological research. New York, NY, USA: Oxford University Press: 318–
348.
Stemmer M, Gerzabek MH, Kandeler E. 1998. Organic matter and
enzyme activity in particle-size fractions of soils obtained after low-
energy sonication. Soil Biology & Biochemistry 30: 9–17.
Strickland MS, Lauber C, Fierer N, Bradford MA. 2009. Testing the
functional significance of microbial community composition. Ecology90: 441–451.
Subke JA, Hahn V, Battipaglia G, Linder S, Buchmann N, Cotrufo MF.
2004. Feedback interactions between needle litter decomposition and
rhizosphere activity. Oecologia 139: 551–559.
Talbot JM, Allison SD, Treseder KK. 2008. Decomposers in disguise:
mycorrhizal fungi as regulators of soil C dynamics in ecosystems under
global change. Functional Ecology 22: 955–963.
Waldrop MP, Zak DR. 2006. Response of oxidative enzyme activities to
nitrogen deposition affects soil concentrations of dissolved organic
carbon. Ecosystems 9: 921–933.
Wardle DA, Bardgett RD, Klironomos JN, Setala H, van der Putten
WH, Wall DH. 2004. Ecological linkages between aboveground and
belowground biota. Science 304: 1629–1633.
Watanabe K, Hayano K. 1995. Seasonal-variation of soil protease
activities and their relation to proteolytic bacteria and Bacillus spp. in
paddy field soil. Soil Biology & Biochemistry 27: 197–203.
Weintraub MN, Schimel JP. 2005. Seasonal protein dynamics in Alaskan
arctic tundra soils. Soil Biology & Biochemistry 37: 1469–1475.
Weintraub MN, Scott-Denton LE, Schmidt SK, Monson RK. 2007. The
effects of tree rhizodeposition on soil exoenzyme activity, dissolved
organic carbon, and nutrient availability in a subalpine forest ecosystem.
Oecologia 154: 327–338.
NewPhytologist Research 857
� The Authors (2010)
Journal compilation � New Phytologist Trust (2010)
New Phytologist (2010) 187: 843–858
www.newphytologist.com

Yarwood SA, Myrold DD, Hogberg MN. 2009. Termination of
belowground C allocation by trees alters soil fungal and bacterial
communities in a boreal forest. FEMS Microbiology Ecology 70: 151–
162.
Zeller B, Liu JX, Buchmann N, Richter A. 2008. Tree girdling increases
soil N mineralisation in two spruce stands. Soil Biology & Biochemistry40: 1155–1166.
Zelles L. 1997. Phospholipid fatty acid profiles in selected members of soil
microbial communities. Chemosphere 35: 275–294.
Supporting Information
Additional supporting information may be found in theonline version of this article.
Fig. S1 Leaf litter fall collected by litter traps in the secondsampling year (August–December 2007) in control and gir-dled plots.
Fig. S2 Microbial community composition of bimonthlysamplings on the first two axes of the canonical correspon-dence analysis.
Table S1 Phospholipid fatty acids of different microbialgroups in control, girdled and fertilized soils over a timeperiod of 2 yr.
Table S2 Linear regressions of phospholipid fatty acidbiomarkers and soil parameters for control plots only,girdled plots only, and both control and girdled plotstogether.
Please note: Wiley-Blackwell are not responsible for thecontent or functionality of any supporting informationsupplied by the authors. Any queries (other than missingmaterial) should be directed to the New Phytologist CentralOffice.
858 Research
NewPhytologist
� The Authors (2010)
Journal compilation � New Phytologist Trust (2010)
New Phytologist (2010) 187: 843–858
www.newphytologist.com


