Embed Size (px)
Citation preview
3584 | Phys. Chem. Chem. Phys., 2015, 17, 3584--3598 This journal is© the Owner Societies 2015
Cite this:Phys.Chem.Chem.Phys.,
2015, 17, 3584
Benchmark thermochemistry of chloramines,bromamines, and bromochloramines: halogenoxidants stabilized by electron correlation†
Daniela Trogolo and J. Samuel Arey*‡
Chloramines, bromamines, and bromochloramines are halogen-containing oxidants that arise from
the reaction of hypohalous acids with ammonia in water. Although relevant to both water disinfection
chemistry and biochemistry, these molecules are difficult to study in the laboratory, and their
thermochemical properties remain poorly established. We developed a benchmark level ab initio
calculation protocol, termed TA14, adapted from the Weizmann theory and Feller–Peterson–Dixon
approaches to determine the molecular structures and thermochemical properties of these compounds.
We find that the halamine molecules are bound largely, and in some cases entirely, by electron correla-
tion forces. This presumably explains their high reactivity as electrophilic oxidants. We provide computed
heats of formation at 0 K (DfH00 K) and at 298 K (DfH
0298 K) and Gibbs free energies of formation at
298 K (DfG0298 K) for the 9 inorganic chloramines, bromamines, bromochloramines in gas phase. Based on
comparisons to previous theoretical and experimental data for a set of 11 small molecules containing N,
O, H, Cl, and Br, we propose uncertainties ranging from 1 to 3 kJ mol�1 for computed thermodynamic
properties of the halamines. Reported thermochemical data enable the determination of equilibrium
constants for reactions involving halamines, opening possibilities for more quantitative studies of the
chemistry of these poorly understood compounds.
1 Introduction
Halogen-containing oxidants have long received attention, dueto their role in processes affecting human health and environ-mental hygiene.1,2 Chlorination and chloramination are thepredominant methods of drinking water disinfection in theUnited States.3–5 Chlorine is commonly applied either as gas-eous Cl2, which dissolves in water at room temperature, or as asalt of hypochlorite, OCl�:
Cl2 + H2O - HOCl + HCl (1)
OCl� þHþ !pKaHOCl (2)
Cl2 and hypochlorite both lead to the formation of hypo-chlorous acid, HOCl (pKa = 7.56). In ammonia-containingwater, HOCl undergoes substitution reactions with ammonia,
following a well-known process that leads to the formation ofchloramines:7–11
NH3 + HOCl " NH2Cl + H2O (3)
NH2Cl + HOCl " NHCl2 + H2O (4)
NHCl2 + HOCl " NCl3 + H2O (5)
Monochloramine can be directly added to water during drink-ing water disinfection treatment.3–5,12 Operationally, thesereactions are largely controlled by the ratio of chlorine toammonia nitrogen, pH, temperature, and the presence ofnatural acid catalysts as phosphate, sulfate, and carbonate.11,13
Bromamines and bromochloramines may arise as well, inbromine-containing waters.14–22 During disinfection treatment,bromide can become oxidized to hypobromous acid/hypobromite,contributing to the formation of bromamines and bromochlor-amines in water.23 The role of bromide in monochloramine decaywas considered in the kinetic model provided by Vikesland et al.13
Lei et al. reported on the formation kinetics of bromamines,24 andLuh and Marinas recently investigated the formation kinetics ofbromochloramines, providing more information on their aqueouschemistry.25
Chloramines and bromamines are implicated in the forma-tion of potentially toxic disinfection byproducts (DBPs) during
Environmental Chemistry Modeling Laboratory, Ecole Polytechnique Federale de
Lausanne (EPFL), Station 2, 1015 Lausanne, Switzerland.
E-mail: [email protected]; Fax: +41 (0)21 693 8070; Tel: +41 (0)21 693 8031
† Electronic supplementary information (ESI) available. See DOI: 10.1039/c4cp03987d‡ EAWAG, Swiss Federal Institute of Aquatic Science and Technology, Dubendorf,Switzerland.
Received 5th September 2014,Accepted 9th December 2014
DOI: 10.1039/c4cp03987d
www.rsc.org/pccp
PCCP
PAPER
Ope
n A
cces
s A
rtic
le. P
ublis
hed
on 0
2 Ja
nuar
y 20
15. D
ownl
oade
d on
1/1
8/20
22 4
:55:
20 A
M.
Thi
s ar
ticle
is li
cens
ed u
nder
a C
reat
ive
Com
mon
s A
ttrib
utio
n-N
onC
omm
erci
al 3
.0 U
npor
ted
Lic
ence
.
View Article OnlineView Journal | View Issue
This journal is© the Owner Societies 2015 Phys. Chem. Chem. Phys., 2015, 17, 3584--3598 | 3585
water treatment.3,4,26–28 Chloramines can undergo substitutionand oxidation reactions involving natural organic matter.29
Snyder and Margerum30 and then Isaac and Morris31,32 showedthat monochloramine could transfer chlorine to organic nitrogencompounds by general acid catalysis. During water disinfection,monochloramine can play a direct role in the formation ofhalonitriles, halonitroalkanes and nitrosamines.33 Monochloraminereactions with dissolved organic matter can also lead to productionof haloacetic acids.34 The reaction between dichloramines andorganic nitrogen precursors such as dimethylamine can explainthe observed production of N-nitrosodimethylamine (NDMA) andother nitrosamines,35,36 which are probable human carcinogensaccording to the US Environmental Protection Agency. Fewer dataare available concerning the role of bromamines and bromo-chloramines in reactions that lead to DBP formation. Le Rouxet al. reported an enhancement of the formation of NDMA fromreactions between bromine-containing oxidant species andtertiary amines or dimethylamine, suggesting a direct role ofbromamines.27 Monobromamine and dibromamine were alsofound to react with cyanide ion (CN�) leading to the formation ofCNBr, a volatile DBP.28 According to Valentine,37 the bromineatom of bromochloramine is highly reactive. Despite their con-siderable roles in disinfection byproduct formation, the specia-tion of chloramines, bromamines, and bromochloramines is notfully known, and this impedes mechanistic studies of DBPformation, which can involve many potential reaction pathways.
Due to the volatility of chloramines,38,39 these molecules alsohave implications in the poor air quality in indoor swimmingpools. According to Richardson et al.,40 NH2Cl, NHCl2, NCl3 canescape into the atmosphere of swimming pool environments.They contribute to the typical smell and irritant properties of theair of these facilities.41
Chloramines and bromamines are also released extracellularlyby activated mammalian eosinophils and neutrophils (white bloodcells).42,43 The haem enzymes eosinophil peroxidase and myelo-peroxidase catalyse the production of HOBr and HOCl that canreact with extracellular matrix, including proteins, proteoglycans,and other nitrogen organic compounds, generating substitutedbromamines and chloramines.43–47 The N-bromination reactionspromoted by HOBr, which exhibits higher rate constants than thecorresponding reactions by HOCl, may damage tissue, affectingcellular and tissue function, in inflammatory diseases such asasthma.45 Moreover, the so-generated halamines can undergo one-electron reduction processes that cleave the N–X (where X = Clor Br) bond.48,49 Indeed, redox-active metal ions and superoxideradicals can reduce N-halogenated species, leading to the forma-tion of N-centered radicals and radical bromine atoms.49
Despite these concerns, halamine speciation is not fullyunderstood and thus the reactivities of halamines with compo-nents of natural waters and biological fluids are difficult tostudy. Halamines are unstable at neutral pH and autodecomposeby a complex set of reactions only partially known.11,13,29 As aconsequence, kinetic experiments on chloramine formation can-not be always successfully conducted under realistic water condi-tions found in water treatment facilities.11 Additionally, samplingand analysis of the chloramines in the atmosphere is difficult,
requiring specific sampling devices and analytical methods.41 Dueto these challenges, fundamental thermochemical properties ofhalamines have not been extensively determined with experi-ments either in gas phase or in aqueous phase.
Quantum computational methods could offer more tractableestimates of the thermochemistry of chloramines, bromamines,and bromochloramines. However existing work is limited. In 1997,Milburn et al.50 reported theoretical enthalpy of formation valuesfor inorganic chloramines at MP451–54 and QCISD(T)55 levels oftheory. More recently, Rayne and Forest56 estimated gas phasestandard state enthalpies of formation at 298 K (DfH
0298 K) for 398
species that contained the elements hydrogen through bromine atthe G457 level, including NH2Cl, NHCl2, NCl3, NH2Br, and NHBr2.This approach produced a MAD (mean absolute deviation) of2.68 kcal mol�1 with respect to experimental DfH
0298 K values for
144 compounds. More recently, Rayne and Forest58 assessed newDfH
0298 K values for NH2Cl, NHCl2, and NCl3 using G4MP2.59 These
estimates likely have about 2–3 kcal mol�1 uncertainties. In 2011,monochloramine was included in the W4-11 dataset:60 this is theonly halamine whose total atomization energy was determinedwith benchmark accuracy. Finally, thermochemistry estimatesremain absent for NBr3 and for the bromochloramines.
Calculations of energies for compounds containing halogensare not without their difficulties. Therefore chloramines, brom-amines, and bromochloramines require a carefully constructedab initio computational recipe, with attention to several finequantum mechanical effects, in order to obtain accurate thermo-chemistry data. Since these inorganic molecules contain theheavy elements chlorine and bromine, fine quantum mecha-nical effects must be evaluated properly if sub-kcal mol�1 orsub-kJ mol�1 energies are sought. Indeed, the ‘‘gold standard ofquantum chemistry’’, or CCSD(T) with complete basis-set limitextrapolation, has to be combined with core valence correlationenergy calculations and relativistic effects in order to predictaccurate thermochemistry for chlorine- and bromine-containingmolecules.61–64 For molecules with elements from the first andsecond rows, relativistic and core-correlation contributions tobond energies are relatively small,61,63,65 but these componentsincrease with the size of the atoms involved. For example,Feller et al. reported scalar relativistic contributions of�0.14 kcal mol�1 and �0.54 kcal mol�1 to the total atomizationenergies (TAE) of Cl2 and Br2, respectively.63 Core-valencecorrelation components of the TAEs of these molecules were�0.13 kcal mol�1 and 0.29 kcal mol�1, respectively.63 Post-CCSD(T) energy contributions may also be important. Themagnitude of post-CCSD(T) effects is small for systems thatare reasonably described by a single reference configuration.61
However, for species affected by severe nondynamical correlation,post-CCSD(T) contributions to the TAE may exceed 1 kcal mol�1.63,66
Halogen-containing molecules often exhibit severe nondynamicalcorrelation effects; examples include F2, FO2, F2O2, FO, F2O,OClO, and ClOO.65 Hence, for chloramines and bromamines,we suspected that an extension of the correlation treatmentbeyond CCSD(T) may be needed.
Specialized methods, such as the HEAT (high-accurate extra-polated ab initio thermochemistry),67–69 Weizmann-n,61,70,71
Paper PCCP
Ope
n A
cces
s A
rtic
le. P
ublis
hed
on 0
2 Ja
nuar
y 20
15. D
ownl
oade
d on
1/1
8/20
22 4
:55:
20 A
M.
Thi
s ar
ticle
is li
cens
ed u
nder
a C
reat
ive
Com
mon
s A
ttrib
utio
n-N
onC
omm
erci
al 3
.0 U
npor
ted
Lic
ence
.View Article Online
3586 | Phys. Chem. Chem. Phys., 2015, 17, 3584--3598 This journal is© the Owner Societies 2015
and Feller–Peterson–Dixon (FPD)63,64,72 protocols have beendesigned to estimate accurate thermochemistry even for difficultcases as those described above. W4 provided thermochemicaldata up to chlorine-containing molecules with a ‘benchmarkaccuracy’ of 1 kJ mol�1 (0.24 kcal mol�1).61 The HEAT targetaccuracy was sub-kJ mol�1 for first-row systems, whereas theFPD approach suggested an accuracy of 0.2 to 0.4 kcal mol�1 forsmall molecules up to the third row. The FPD protocol is moreflexible, being developed molecule-by-molecule, and has beenapplied up to bromine-containing species, including BrO, Br2, HBr,BrF, and BrCl.63 These computational methods (Weizmann-n, FPD)are commonly recognized as benchmarks for small molecules.Although we were inspired by these established methods, wedid not apply any of these protocols in their prescribed formu-lation. The W3 method does not include second order spin–orbit corrections, and W3 treats core–valence correlation energywith only the MTSmall basis set. These choices would not beappropriate for benchmark thermochemistry of molecules con-taining bromine. On the other hand, the more rigorous W4 andFPD procedures were intractably expensive for the not-so-smallhalamine species, with available algorithms and hardware.Hence the halamines warranted the development of a tailoredcomputational recipe for the determination of high-accuracythermochemistry.
In the present study, we calculated high-quality benchmarkgas-phase thermochemical data, including total atomizationenergies, heats of formation at 0 K and at 298 K, and Gibbs freeenergies of formation at 298 K for chloramines, bromamines,bromochloramines, and other related small halogenated mole-cules. For this purpose, we developed a computational protocol,termed as TA14 in the remainder of the manuscript, which isadapted from the high-quality Weizmann-n, and Feller–Peterson–Dixon (FDP) procedures. TA14 combines a systematic sequenceof coupled cluster methods up to CCSDTQ with large correlationconsistent basis sets and includes relativistic effects, core–valenceelectron correlation, and diagonal Born–Oppenheimer correc-tion, aiming for kJ mol�1 accuracy with affordable computingtime. A test set of small compounds containing chlorine andbromine was chosen to briefly evaluate the performance of theprotocol, and comparisons with high-quality experimentalvalues and previously published computational benchmarksare made. This leads to the first published set of high accuracythermochemistry data for chloramines, bromamines, andbromochloramines.
2 Methods2.1 Selected molecules of study and reference data
Our chemical set comprised 20 neutral inorganic molecules,divided by chemical composition into non-halamines (set A)and halamines (set B). Set A includes H2, N2, O2, Cl2, Br2, HCl,HBr, HOCl, HOBr, H2O, and NH3. Set B contains NH2Cl, NHCl2,NCl3, NH2Br, NHBr2, NBr3, NHBrCl, NBrCl2, and NBr2Cl.
Experimental enthalpies of formation and experimentaltotal atomization energies were available in the literature for
the entire set A. Experimental total atomization energies at 0 K,TAEExpt
0 K , heats of formation at 0 K, DfH0,Expt0 K , and at 298 K,
DfH0,Expt298 K , and Gibbs free energies of formation, DfG0,Expt
298 K , aretaken from several sources: CODATA,73 the Active ThermoChemicalTables,74,75 JANAF thermochemical database,76 and NISTComputational Chemistry Comparison and Benchmark Data-Base (CCCBDB).77 In cases where several experimental valueswere available for the same molecule, the value with the lowestlisted uncertainty was selected.
2.2 Model chemistries and basis sets
Hartree–Fock, CCSD,78 and CCSD(T)78–80 calculations were carriedout using the program CFOUR.81 CCSDT,82–84 CCSDT(Q),85 andCCSDTQ86–88 calculations were conducted with the MRCC pack-age89 interfaced to the CFOUR program suite. Scalar relativisticcalculations and B2PLYPD90,91 frequency analysis were conductedusing Gaussian09.92 Second-order molecular spin–orbit compo-nents were computed with NWchem.93
The basis sets employed in all calculations belong to thecorrelation consistent family of Dunning and co-workers94–98
and are abbreviated PVXZ, AVXZ, and AWCVXZ for cc-pVXZ,aug-cc-pVXZ, and aug-cc-pWCVXZ basis set types, respectively,throughout the remainder of the article. The aug-cc-pV(X+d)Zbasis sets employed by Wn methods were not available forbromine. Complete basis-set limit results were achieved usingdifferent extrapolation formulae, as explained below.
2.3 Geometries and frequencies
With three exceptions, all reference geometries were obtainedat the all-electron (AE)-CCSD(T)/AVQZ level. For NBrCl2, NBr2Cl,and NBr3, geometries were optimized at the all-electron (AE)-CCSD(T)/AVTZ level. For open-shell species, single-point energycalculations were based on UHF reference wave functions, whereasthe default restricted Hartree–Fock reference was employed for theclosed-shell molecules. Due to high spin contamination using anunrestricted reference, O2 was treated as a restricted open-shellspecies. The Watts–Gauss–Bartlett99 (e.g., CFOUR/ACESII) defini-tion of restricted open-shell CCSD(T) was applied. These referencegeometries were used for electronic energy calculations, and theyare given in the ESI† for all molecules.
Harmonic and anharmonic zero-point vibrational energies werecomputed at 298 K using analytic second derivatives for theB2PLYPD/AVQZ model chemistry. The VPT2100,101 approach wasapplied to compute the anharmonic corrections as implemented inGaussian09. Anharmonic frequencies are reported in the ESI† forall the halamines and the hypohalous acids. Since Gaussian09 doesnot allow the calculations of anharmonic frequency contributionsfor linear molecules, we employed B2PLYPD/AVQZ for harmonicfrequency calculations and combined these with experimentalanharmonic contributions for diatomic molecules.102–104 Molecularrotations were determined assuming rigid geometries, thus rota-tions were assumed uncoupled to vibrations. Based on thesefrequency data and corresponding B2PLYPD/AVQZ geometries,zero-point vibrational energies and thermal contributions to thegas phase enthalpy and gas phase Gibbs free energy were computedat 298 K in the NVT ensemble for all studied molecules.105
PCCP Paper
Ope
n A
cces
s A
rtic
le. P
ublis
hed
on 0
2 Ja
nuar
y 20
15. D
ownl
oade
d on
1/1
8/20
22 4
:55:
20 A
M.
Thi
s ar
ticle
is li
cens
ed u
nder
a C
reat
ive
Com
mon
s A
ttrib
utio
n-N
onC
omm
erci
al 3
.0 U
npor
ted
Lic
ence
.View Article Online
This journal is© the Owner Societies 2015 Phys. Chem. Chem. Phys., 2015, 17, 3584--3598 | 3587
2.4 Electronic energies
Our methodology for computing the electronic energy was adaptedfrom the recently developed W3, W4, and FPD protocols,61,63,71 andit is aimed to being an appropriate compromise between comput-ing cost and basis set convergence. By including all terms that cancontribute to the energy at the sub-kJ mol�1 level, the TA14 protocolallows the determination of high quality electronic energies andthermodynamic properties of halogenated compounds. The proto-col applied to compute the electronic energy is purely ab initio: nofitted parameters or empirical terms are included.
An overview of the TA14 protocol, together with other highlyaccurate thermochemistry composite methods, is shown inTable 1. Within the Born–Oppenheimer approximation, the totalenergy of a compound may be separated into electronic andvibrational contributions. The ground state electronic energy isexpressed by the following additivity scheme:
ETA14e ¼ EHF;Extrap þ DECCSD;Extrap
þ DEðTÞ;Extrap þ DET�ðTÞ;Extrap
þ DEðQÞ þ DEQ�ðQÞ þ DECORE
þ DEREL þ DE1stSO þ DE2ndSO
þ DEDBOC
(6)
In eqn (6), the term EHF,Extrap is the Hartree–Fock energy, andDECCSD,Extrap, DE(T),Extrap and DET–(T),Extrap are valence correlationenergies, where the label ‘‘Extrap’’ indicates extrapolation to thecomplete basis-set limit, explained further below. DECCSD,Extrap isgiven by the CCSD energy contribution, and DE(T),Extrap describesthe energy contribution from the perturbative treatment of tripleexcitations. DET–(T),Extrap describes the energy difference betweenfull triples and the perturbative triples approximation. DE(Q)
and DEQ–(Q) are the perturbative quadruples contribution and
the full quadruples contribution, respectively. The resultingfrozen core FC-CCSDTQ energy is very close to the frozen-corenon-relativistic FullCI limit.106 DECORE is the last nonrelativisticcomponent of the total energy and describes core–valencecorrelation effects. The term DEREL represents scalar relativisticeffects. First-order and second-order spin–orbit correctionsare given as DE1st SO and DE2nd SO, and DEDBOC is the diagonalBorn–Oppenheimer correction. Each of these terms is explainedin detail below.
To obtain high accuracy estimates of HF and electroniccorrelation energies, extrapolation techniques can be applied,requiring large correlation-consistent basis sets.107 We appliedthe extrapolation formulae proposed in W4 theory for theHartree–Fock energies and the extrapolation formulae given inW3 theory for the correlation energies to obtain accurate ab initiothermochemistry properties. Theoretical results obtained usingthis approach are labeled ‘‘Best’’ in the remainder of the article.The Hartree–Fock energy extrapolation is based on the Karton–Martin modification108 of Jensen’s formula:109
EHF;‘‘Best’’ ¼ EX þ
EX � EX�1
X exp 9ffiffiffiffiXp�
ffiffiffiffiffiffiffiffiffiffiffiffiffiX � 1p� �
X þ 1� 1
(7)
where the consecutive cardinal numbers X � 1 and X are themaximum angular momentum quantum number X representedin correlation-consistent basis set (e.g., 3 for AVTZ, 4 for AVQZ,and 5 for AV5Z).107 EHF,‘‘Best’’ represents the EHF,Extrap term ineqn (6). Eqn (7) was previously found to give an RMS error of0.00628 kcal mol�1 with respect to the Hartree–Fock complete-basis set energy for a set of atoms and diatomic systems withthe AV{Q,5}Z basis set pair.110
The correlation energy results are extrapolated separatelyfrom the Hartree–Fock components. The CCSD energy typicallyconverges more slowly than the Hartree–Fock energy.111–113
Table 1 Comparison of the TA14 computational protocol with other benchmark thermochemistry protocols
Component FPD63 d W371 W461 TA14
Reference geometry FC-CCSD(T)/AV6Z FC-CCSD(T)/pV(Q+d)Z FC-CCSD(T)/pV(Q+d)Z AE-CCSD(T)/AVQZAnharmonic ZPVE Expt data CCSD(T)/VTZ+1a CCSD(T)/VTZ+1a B2PLYPD/AVQZb
Electronic energyHF extrapolation AV6Z AV(Q,5)+dZ AV(5,6)+dZ AV(Q,5)ZValence CCSD extrapolation AV6Z AV(Q,5)+dZ AV(5,6)+dZ AV(Q,5)ZValence (T) extrapolation AV6Z AV(T,Q)+dZ AV(Q,5)+dZ AV(T,Q)ZValence T–(T) extrapolation PVQZ PV(D,T)Z PV(D,T)Z PV(T,Q)ZValence (Q) 1.25 PVDZ 1.10 PVTZ PVTZValence Q–(Q) 1.25 PVDZ 1.10 PVDZ PVDZValence Q PVTZValence 5 PVDZ PVDZValence 6 PVDZCCSD(T) core shell PWCV5Z MTSmall AWCV(T,Q)Z AWCV(T,Q)ZT–(T) core shell PWCVTZc
CCSDTQ core shell PWCVDZScalar relativistic CCSD(T) DK-PVTZ MTSmall DK-AV(Q+d)Z DK-AVQZFirst-order atomic spin–orbit correction Expt data Expt data Expt data Expt dataSecond-order molecular spin–orbit correction CAS-CI/AVTZ-PP SO-B3LYP/ECPDBOC HF/AVTZ HF/AVTZ HF/AVQZ, CCSD/AVDZ
a See W2,70 W371 and W461 protocols. b The VPT2 approach was used. c W4.2 also includes this higher core shell contribution. d This Feller–Peterson–Dixon procedure was defined for Br2.63
Paper PCCP
Ope
n A
cces
s A
rtic
le. P
ublis
hed
on 0
2 Ja
nuar
y 20
15. D
ownl
oade
d on
1/1
8/20
22 4
:55:
20 A
M.
Thi
s ar
ticle
is li
cens
ed u
nder
a C
reat
ive
Com
mon
s A
ttrib
utio
n-N
onC
omm
erci
al 3
.0 U
npor
ted
Lic
ence
.View Article Online
3588 | Phys. Chem. Chem. Phys., 2015, 17, 3584--3598 This journal is© the Owner Societies 2015
The extrapolations to the infinite basis-set limit for severalcorrelation energy contributions were carried out with the two-term A + B/La expression used extensively in Wn theories61,65,70,71
and expressed in this form:
ECC;‘‘Best’’ ¼ EX þ
EX � EX�1ðX=X � 1Þa � 1
(8)
Eqn (8) derives from the truncation of the partial-wave expansionof pair correlation energies to just the leading terms, as describedby Klopper.107 The a factor was set equal to 3, as given in the W3protocol;71 this contrasts with the W4 approach61 where a = 5 isused for triplet-coupled pair CCSD energies. Hence, the TA14protocol uses eqn (7) to extrapolate the Hartree–Fock energy(EHF,Extrap in eqn (6)) and applies eqn (8) for some correlationenergies (DECCSD,Extrap, DE(T),Extrap, DET–(T),Extrap) and for DECORE
in eqn (6) with a = 3 throughout.As recommended by Klopper and co-workers,111 the (T) valence
correlation energy contribution was evaluated separately from theCCSD contributions, with smaller basis sets. The more expensive(T) contribution converges to the basis set limit more quickly thanthe CCSD correlation energy.111,112 Our best estimate DE(T),Extrap
energy contributions were calculated with the AV{T,Q}Z basis setpair and were extrapolated using eqn (8).
Post-CCSD(T) contributions to the electronic energy weredetermined with smaller basis sets. Higher-order correlatedenergies converge to the complete basis set limit more efficientlythan the energies computed at CCSD(T) level.64,114 In the presentwork, the DET–(T),Extrap term was extrapolated from CCSDT-CCSD(T)energy differences with the PVTZ and PVQZ basis sets. However forNBrCl2, NBr2Cl, NHBr2, NHBrCl and NBr3, we instead used thePV{D,T}Z basis set pair, due to computational limitations.
Separately, we also applied the widely used extrapolationmethod of Halkier for the Hartree–Fock and CCSD, (T), andT–(T) correlation energies, leading to a second estimate of com-puted thermodynamic properties. Halkier et al.113,115 proposedapplying two-term extrapolation procedures based on calculationswith hierarchical correlation-consistent basis sets:
EHF=CC;‘‘Halkier’’ ¼
EXX3 � EX�1ðX � 1Þ3
X3 � ðX � 1Þ3(9)
Eqn (9) was applied to approximate both Hartree–Fock energiesand the above-listed correlation energies at the complete basis-set limit.113,116 We used the label ‘‘Halkier’’ for thermochemicalquantities obtained by use of eqn (9) to extrapolate Hartree–Fock and correlation energies.
As explained by Peterson et al.,64 CCSDT(Q) correctionsshould always be included in order to counterbalance theCCSDT energy contributions, which are typically less close tothe FullCI limit than CCSD(T) values. The DE(Q) contributionswere calculated as the CCSDT(Q)-CCSDT energy difference withthe PVTZ basis set. For NBr3 and NBr2Cl, the DE(Q) contributionwas computed with the PVDZ basis set. DEQ–(Q) was computedas the energy difference CCSDTQ-CCSDT(Q) with the PVDZbasis set. We chose to apply the UHF reference wave functionon the ROHF oxygen molecule in the calculation of quadrupleexcitation correlation energy contributions. Due to its high
computational cost, the CCSDTQ correlation energy was notcomputed for NBr3.
For most molecules, DECORE was assessed as the energydifference between all-electron CCSD(T)/AWCV{T,Q}Z and frozen-core CCSD(T)/AWCV{T,Q}Z calculations, applying eqn (8) toextrapolate each energy to the complete basis-set limit. ForNHBrCl the DECORE was computed at the AWCVQZ level, whereasfor NBr3 and NBr2Cl, this contribution was obtained at theAWCVTZ level, due to computational cost, and no extrapolationformula was applied.
Relativistic contributions were computed as follows. Scalarrelativistic effects (DEREL) are quantitatively recovered within thesecond-order Douglas–Kroll–Hess approximation,117–122 and thesewere obtained from the energy difference between relativisticCCSD(T)/AVQZ-DK and non-relativistic CCSD(T)/AVQZ calcula-tions. Atomic first-order spin–orbit coupling terms, DE1st SO,were taken from the experimental fine structure.123 For heavyelements such as bromine, second-order molecular spin–orbitcontributions have non-negligible contributions.63,124 Theseenergy contributions, DE2nd SO, were carried out with SO-DFTcalculations at the B3LYP125,126 level. The CRENBL basis setsand AREPs (averaged relativistic effective potentials) with spin–orbit operators were employed for the non-hydrogen atoms.127–132
Although implemented with HF/AVTZ in the W4 scheme, post-HFcontributions to the diagonal Born–Oppenheimer correctionhave been better reproduced when including the CCSD energycontribution.133 DEDBOC calculations thus were conducted atCCSD/AVDZ level, where the HF electronic energy contributionwas calculated with the AVQZ basis set:
DEDBOC = DEHF/AVQZDBOC + DDECCSD/AVDZ
DBOC (10)
2.5 Thermochemical properties
To construct standard enthalpies of formation at 0 K and 298 Kat 1 atm pressure, we determined the electronic energies andthe total atomization energies of all species. Total atomizationenergies at the bottom of the theoretical potential energy well(TAEe(M)) and at 0 K (TAE0 K(M)) were calculated ab initio as:
TAETA14e ðMÞ ¼
XN
i
ETA14e Aið Þ � ETA14
e ðMÞ (11)
TAETA140 K (M) = TAETA14
e (M) � ZPVETA14(M) (12)
where ETA14e (M) and ETA14
e (Ai) are the electronic energies of themolecule M and of the constituent atoms Ai, computed followingthe TA14 protocol, and ZPVETA14(M) is the computed anharmoniczero-point vibrational energy of the molecule.
The method to calculate standard enthalpies of formationhas been described previously by Curtiss et al.134 Briefly theprocedure was as follows. A theoretical enthalpy of formation ofa molecule M at 0 K can be calculated as the difference betweenthe summed experimental enthalpies of formation of the atoms
contained in the molecule at 0 K,PN
i
DfH00 K Aið Þ, and the
theoretical atomization energy TAE0 K(M) of the molecule.
PCCP Paper
Ope
n A
cces
s A
rtic
le. P
ublis
hed
on 0
2 Ja
nuar
y 20
15. D
ownl
oade
d on
1/1
8/20
22 4
:55:
20 A
M.
Thi
s ar
ticle
is li
cens
ed u
nder
a C
reat
ive
Com
mon
s A
ttrib
utio
n-N
onC
omm
erci
al 3
.0 U
npor
ted
Lic
ence
.View Article Online
This journal is© the Owner Societies 2015 Phys. Chem. Chem. Phys., 2015, 17, 3584--3598 | 3589
The superscript ‘‘0’’ refers to 1 atm standard state. For eachmolecule:
DfH0;TA140 K ðMÞ ¼
XN
i
DfH0;Expt0 K Aið Þ � TAETA14
0 K ðMÞ (13)
A theoretical enthalpy of formation at 298 K was obtained byapplying the following formula:
DfH0;TA14298 K ðMÞ ¼ DfH
0;TA140 K ðMÞ þ DDHTA14
thermalðMÞ
�XN
i
H298 K Aið Þ �H0 K Aið Þ½ �0;Expt
� ZPVETA14ðMÞ
(14)
where DDHTA14thermal(M) is the computed thermal correction to the
enthalpy for the molecule M obtained from computed vibrationalfrequencies, and [H298 K(Ai) � H0 K(Ai)]
0,Expt is the experimentalintegrated heat capacity for each atom Ai at its standard state. Theexperimental atomic enthalpy corrections and the integrated heatcapacity values for each element are taken from the CODATAthermochemical database (Table 2).73 In eqn (14), computed zero-point vibrational energy contributions (already included in thetotal atomization energies) were subtracted from enthalpies offormation of the molecule at 0 K to avoid their double-counting.
We computed the Gibbs free energy of formation of eachmolecule as follows. We combined the computed entropy offormation, DfS0,TA14
298 K (M), to the gas phase enthalpy of formation:
DfG0,TA14298 K (M) = DfH0,TA14
298 K (M) � TDfS0,TA14298 K (M) (15)
where DfS0,TA14298 K (M) was calculated as follows:
DfS0;TA14298 K ðMÞ ¼ STA14
298 KðMÞ �XN
i
niS0;Expt298 K Dið Þ (16)
For all polyatomic molecules, STA14298 K(M) comprises computed
anharmonic vibrational, rotational, and translational contri-butions to the molecular entropy at 298 K. For the diatomicmolecules, the anharmonic contribution to vibrations was takenfrom experimental data, as discussed above. S0,Expt
298 K (Di) is theexperimental entropy for each diatomic element at its standardstate, as taken from the CODATA thermochemical database(Table 2),73 and ni is the appropriate stoichiometric coefficient.For example, the DfS0,TA14
298 K value of HOBr is:
DfS0;TA14298 K ðHOBrÞ ¼ STA14
298 KðHOBrÞ � S0;Expt298 K H2ð Þ
2
� S0;Expt298 K O2ð Þ
2� S
0;Expt298 K Br2ð Þ
2
(17)
The resulting DfH0,TA14298 K (M) and DfG0,TA14
298 K (M) values are thusbased on a combination of experimental data (e.g., DfH
0,Expt0 K (Ai),
[H298 K(Ai) � H0 K(Ai)]0,Expt, and S0,Expt
298 K (Ai)) and computationalresults (TAETA14
0 K (M), DDHTA14thermal(M), and S0,TA14
298 K (M)), but they areconsidered as theoretical values.
2.6 Diagnostics for nondynamical correlation effects
Diagnostics for nondynamical correlation (NDC) effects providean indication of the importance of post-CCSD(T) electroniccontributions for thermochemical applications. Among severalproposed diagnostics, the %TAE[HF] is the most affordablea priori energy-based diagnostic, and %TAE[(T)] is a more reliableindicator that also requires no post-CCSD(T) calculations.61
%TAE[post-CCSD(T)] is an a posteriori diagnostic to evaluatethe post-CCSD(T) contributions to total atomization energy.61
These diagnostics are calculated as follows:
%TAE½HF� ¼ 100� TAEeðHFÞTAEeðCCSDðTÞÞ
(18)
%TAE½ðTÞ� ¼ 100� TAEeðCCSDðTÞÞ � TAEeðCCSDÞTAEeðCCSDðTÞÞ
(19)
%TAE½post-CCSDðTÞ�
¼ 100� TAEeðpost-CCSDðTÞÞ � TAEeðCCSDðTÞÞTAEeðpost-CCSDðTÞÞ
(20)
where TAEe(HF), TAEe(CCSD) and TAEe(CCSD(T)) represent thenon-relativistic HF, CCSD, and CCSD(T) atomization energycomponents at the bottom of the well. TAEe(post-CCSD(T))contains the non-relativistic higher excitation energy contri-butions T–(T), (Q), and Q–(Q), but excludes core–valence andrelativistic contributions.
3 Results and discussion
We computed total atomization energies at 0 K, standard heats offormation at 0 K and at 298 K, and Gibbs free energies of forma-tion at 298 K for bromamines, chloramines, bromochloramines,and other related molecules. First, we report total atomizationenergy data and discuss the electronic energy contributions tobond formation in these molecules. This is followed by a discus-sion of diagnostics for nondynamical correlation. Then, to assessthe performance of the TA14 approach, we compare our com-puted property data to experimental data and other publishedbenchmarks, where available. Finally we briefly discuss theimplications of thermochemistry data for halamines.
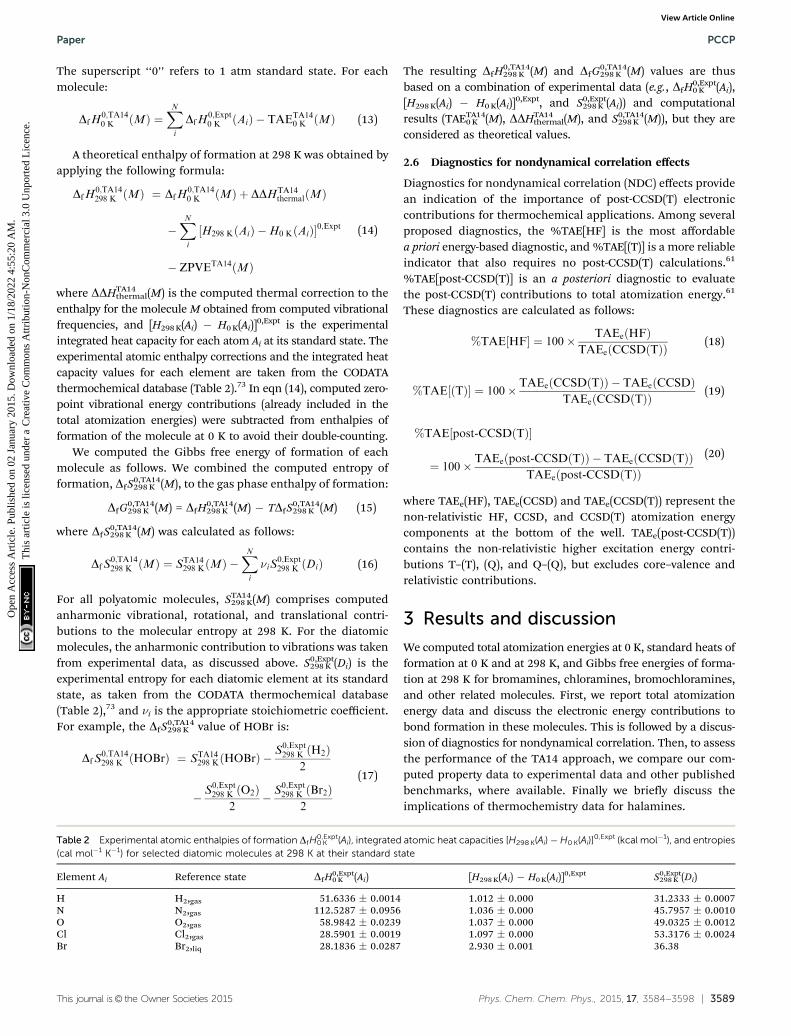
Table 2 Experimental atomic enthalpies of formation DfH0,Expt0 K (Ai), integrated atomic heat capacities [H298 K(Ai)�H0 K(Ai)]
0,Expt (kcal mol�1), and entropies(cal mol�1 K�1) for selected diatomic molecules at 298 K at their standard state
Element Ai Reference state DfH0,Expt0 K (Ai) [H298 K(Ai) � H0 K(Ai)]
0,Expt S0,Expt298 K (Di)
H H2,gas 51.6336 � 0.0014 1.012 � 0.000 31.2333 � 0.0007N N2,gas 112.5287 � 0.0956 1.036 � 0.000 45.7957 � 0.0010O O2,gas 58.9842 � 0.0239 1.037 � 0.000 49.0325 � 0.0012Cl Cl2,gas 28.5901 � 0.0019 1.097 � 0.000 53.3176 � 0.0024Br Br2,liq 28.1836 � 0.0287 2.930 � 0.001 36.38
Paper PCCP
Ope
n A
cces
s A
rtic
le. P
ublis
hed
on 0
2 Ja
nuar
y 20
15. D
ownl
oade
d on
1/1
8/20
22 4
:55:
20 A
M.
Thi
s ar
ticle
is li
cens
ed u
nder
a C
reat
ive
Com
mon
s A
ttrib
utio
n-N
onC
omm
erci
al 3
.0 U
npor
ted
Lic
ence
.View Article Online
3590 | Phys. Chem. Chem. Phys., 2015, 17, 3584--3598 This journal is© the Owner Societies 2015
3.1 Total atomization energies
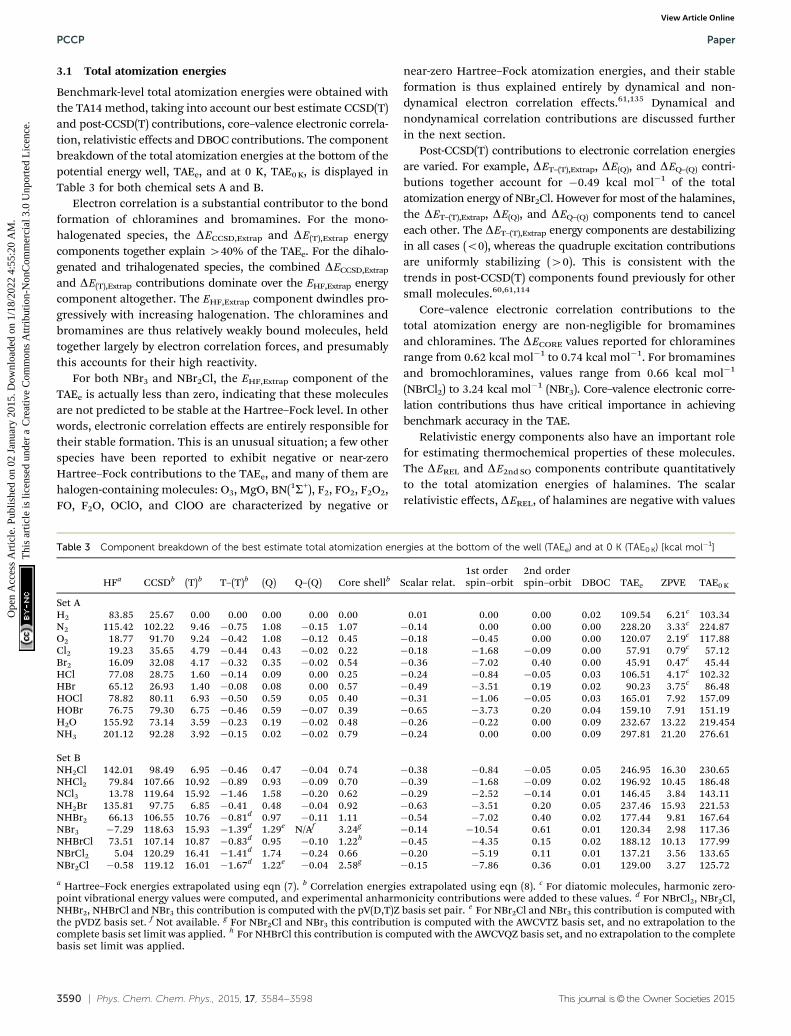
Benchmark-level total atomization energies were obtained withthe TA14 method, taking into account our best estimate CCSD(T)and post-CCSD(T) contributions, core–valence electronic correla-tion, relativistic effects and DBOC contributions. The componentbreakdown of the total atomization energies at the bottom of thepotential energy well, TAEe, and at 0 K, TAE0 K, is displayed inTable 3 for both chemical sets A and B.
Electron correlation is a substantial contributor to the bondformation of chloramines and bromamines. For the mono-halogenated species, the DECCSD,Extrap and DE(T),Extrap energycomponents together explain 440% of the TAEe. For the dihalo-genated and trihalogenated species, the combined DECCSD,Extrap
and DE(T),Extrap contributions dominate over the EHF,Extrap energycomponent altogether. The EHF,Extrap component dwindles pro-gressively with increasing halogenation. The chloramines andbromamines are thus relatively weakly bound molecules, heldtogether largely by electron correlation forces, and presumablythis accounts for their high reactivity.
For both NBr3 and NBr2Cl, the EHF,Extrap component of theTAEe is actually less than zero, indicating that these moleculesare not predicted to be stable at the Hartree–Fock level. In otherwords, electronic correlation effects are entirely responsible fortheir stable formation. This is an unusual situation; a few otherspecies have been reported to exhibit negative or near-zeroHartree–Fock contributions to the TAEe, and many of them arehalogen-containing molecules: O3, MgO, BN(1S+), F2, FO2, F2O2,FO, F2O, OClO, and ClOO are characterized by negative or
near-zero Hartree–Fock atomization energies, and their stableformation is thus explained entirely by dynamical and non-dynamical electron correlation effects.61,135 Dynamical andnondynamical correlation contributions are discussed furtherin the next section.
Post-CCSD(T) contributions to electronic correlation energiesare varied. For example, DET–(T),Extrap, DE(Q), and DEQ–(Q) contri-butions together account for �0.49 kcal mol�1 of the totalatomization energy of NBr2Cl. However for most of the halamines,the DET–(T),Extrap, DE(Q), and DEQ–(Q) components tend to canceleach other. The DET–(T),Extrap energy components are destabilizingin all cases (o0), whereas the quadruple excitation contributionsare uniformly stabilizing (40). This is consistent with thetrends in post-CCSD(T) components found previously for othersmall molecules.60,61,114
Core–valence electronic correlation contributions to thetotal atomization energy are non-negligible for bromaminesand chloramines. The DECORE values reported for chloraminesrange from 0.62 kcal mol�1 to 0.74 kcal mol�1. For bromaminesand bromochloramines, values range from 0.66 kcal mol�1
(NBrCl2) to 3.24 kcal mol�1 (NBr3). Core–valence electronic corre-lation contributions thus have critical importance in achievingbenchmark accuracy in the TAE.
Relativistic energy components also have an important rolefor estimating thermochemical properties of these molecules.The DEREL and DE2nd SO components contribute quantitativelyto the total atomization energies of halamines. The scalarrelativistic effects, DEREL, of halamines are negative with values
Table 3 Component breakdown of the best estimate total atomization energies at the bottom of the well (TAEe) and at 0 K (TAE0 K) [kcal mol�1]
HFa CCSDb (T)b T–(T)b (Q) Q–(Q) Core shellb Scalar relat.1st orderspin–orbit
2nd orderspin–orbit DBOC TAEe ZPVE TAE0 K
Set AH2 83.85 25.67 0.00 0.00 0.00 0.00 0.00 0.01 0.00 0.00 0.02 109.54 6.21c 103.34N2 115.42 102.22 9.46 �0.75 1.08 �0.15 1.07 �0.14 0.00 0.00 0.00 228.20 3.33c 224.87O2 18.77 91.70 9.24 �0.42 1.08 �0.12 0.45 �0.18 �0.45 0.00 0.00 120.07 2.19c 117.88Cl2 19.23 35.65 4.79 �0.44 0.43 �0.02 0.22 �0.18 �1.68 �0.09 0.00 57.91 0.79c 57.12Br2 16.09 32.08 4.17 �0.32 0.35 �0.02 0.54 �0.36 �7.02 0.40 0.00 45.91 0.47c 45.44HCl 77.08 28.75 1.60 �0.14 0.09 0.00 0.25 �0.24 �0.84 �0.05 0.03 106.51 4.17c 102.32HBr 65.12 26.93 1.40 �0.08 0.08 0.00 0.57 �0.49 �3.51 0.19 0.02 90.23 3.75c 86.48HOCl 78.82 80.11 6.93 �0.50 0.59 0.05 0.40 �0.31 �1.06 �0.05 0.03 165.01 7.92 157.09HOBr 76.75 79.30 6.75 �0.46 0.59 �0.07 0.39 �0.65 �3.73 0.20 0.04 159.10 7.91 151.19H2O 155.92 73.14 3.59 �0.23 0.19 �0.02 0.48 �0.26 �0.22 0.00 0.09 232.67 13.22 219.454NH3 201.12 92.28 3.92 �0.15 0.02 �0.02 0.79 �0.24 0.00 0.00 0.09 297.81 21.20 276.61
Set BNH2Cl 142.01 98.49 6.95 �0.46 0.47 �0.04 0.74 �0.38 �0.84 �0.05 0.05 246.95 16.30 230.65NHCl2 79.84 107.66 10.92 �0.89 0.93 �0.09 0.70 �0.39 �1.68 �0.09 0.02 196.92 10.45 186.48NCl3 13.78 119.64 15.92 �1.46 1.58 �0.20 0.62 �0.29 �2.52 �0.14 0.01 146.45 3.84 143.11NH2Br 135.81 97.75 6.85 �0.41 0.48 �0.04 0.92 �0.63 �3.51 0.20 0.05 237.46 15.93 221.53NHBr2 66.13 106.55 10.76 �0.81d 0.97 �0.11 1.11 �0.54 �7.02 0.40 0.02 177.44 9.81 167.64NBr3 �7.29 118.63 15.93 �1.39d 1.29e N/Af 3.24g �0.14 �10.54 0.61 0.01 120.34 2.98 117.36NHBrCl 73.51 107.14 10.87 �0.83d 0.95 �0.10 1.22h �0.45 �4.35 0.15 0.02 188.12 10.13 177.99NBrCl2 5.04 120.29 16.41 �1.41d 1.74 �0.24 0.66 �0.20 �5.19 0.11 0.01 137.21 3.56 133.65NBr2Cl �0.58 119.12 16.01 �1.67d 1.22e �0.04 2.58g �0.15 �7.86 0.36 0.01 129.00 3.27 125.72
a Hartree–Fock energies extrapolated using eqn (7). b Correlation energies extrapolated using eqn (8). c For diatomic molecules, harmonic zero-point vibrational energy values were computed, and experimental anharmonicity contributions were added to these values. d For NBrCl2, NBr2Cl,NHBr2, NHBrCl and NBr3 this contribution is computed with the pV(D,T)Z basis set pair. e For NBr2Cl and NBr3 this contribution is computed withthe pVDZ basis set. f Not available. g For NBr2Cl and NBr3 this contribution is computed with the AWCVTZ basis set, and no extrapolation to thecomplete basis set limit was applied. h For NHBrCl this contribution is computed with the AWCVQZ basis set, and no extrapolation to the completebasis set limit was applied.
PCCP Paper
Ope
n A
cces
s A
rtic
le. P
ublis
hed
on 0
2 Ja
nuar
y 20
15. D
ownl
oade
d on
1/1
8/20
22 4
:55:
20 A
M.
Thi
s ar
ticle
is li
cens
ed u
nder
a C
reat
ive
Com
mon
s A
ttrib
utio
n-N
onC
omm
erci
al 3
.0 U
npor
ted
Lic
ence
.View Article Online
This journal is© the Owner Societies 2015 Phys. Chem. Chem. Phys., 2015, 17, 3584--3598 | 3591
that range from �0.14 kcal mol�1 (NBr3) to �0.63 kcal mol�1
(NH2Br). DE2nd SO values range from �0.14 kcal mol�1 (NCl3) to0.61 kcal mol�1 (NBr3). These energy contributions, althoughsmall, have to be considered to achieve the desired accuracy inTAE calculations. The DE1st SO contribution is simply an addi-tive function of the elemental composition of the molecule andtherefore it is not discussed.
Finally, DEDBOC components are the smallest energy contri-butions considered. Among the halamines, the largest valuesare 0.05 kcal mol�1 found for NH2Cl and NH2Br.
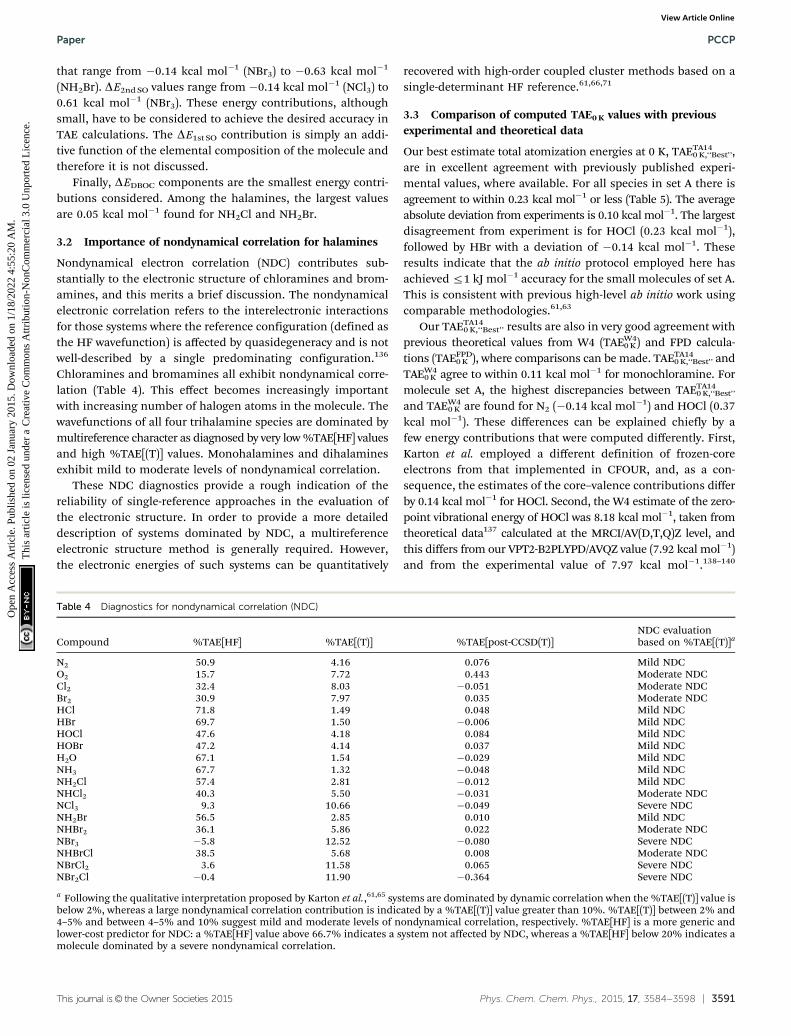
3.2 Importance of nondynamical correlation for halamines
Nondynamical electron correlation (NDC) contributes sub-stantially to the electronic structure of chloramines and brom-amines, and this merits a brief discussion. The nondynamicalelectronic correlation refers to the interelectronic interactionsfor those systems where the reference configuration (defined asthe HF wavefunction) is affected by quasidegeneracy and is notwell-described by a single predominating configuration.136
Chloramines and bromamines all exhibit nondynamical corre-lation (Table 4). This effect becomes increasingly importantwith increasing number of halogen atoms in the molecule. Thewavefunctions of all four trihalamine species are dominated bymultireference character as diagnosed by very low %TAE[HF] valuesand high %TAE[(T)] values. Monohalamines and dihalaminesexhibit mild to moderate levels of nondynamical correlation.
These NDC diagnostics provide a rough indication of thereliability of single-reference approaches in the evaluation ofthe electronic structure. In order to provide a more detaileddescription of systems dominated by NDC, a multireferenceelectronic structure method is generally required. However,the electronic energies of such systems can be quantitatively
recovered with high-order coupled cluster methods based on asingle-determinant HF reference.61,66,71
3.3 Comparison of computed TAE0 K values with previousexperimental and theoretical data
Our best estimate total atomization energies at 0 K, TAETA140 K,‘‘Best’’,
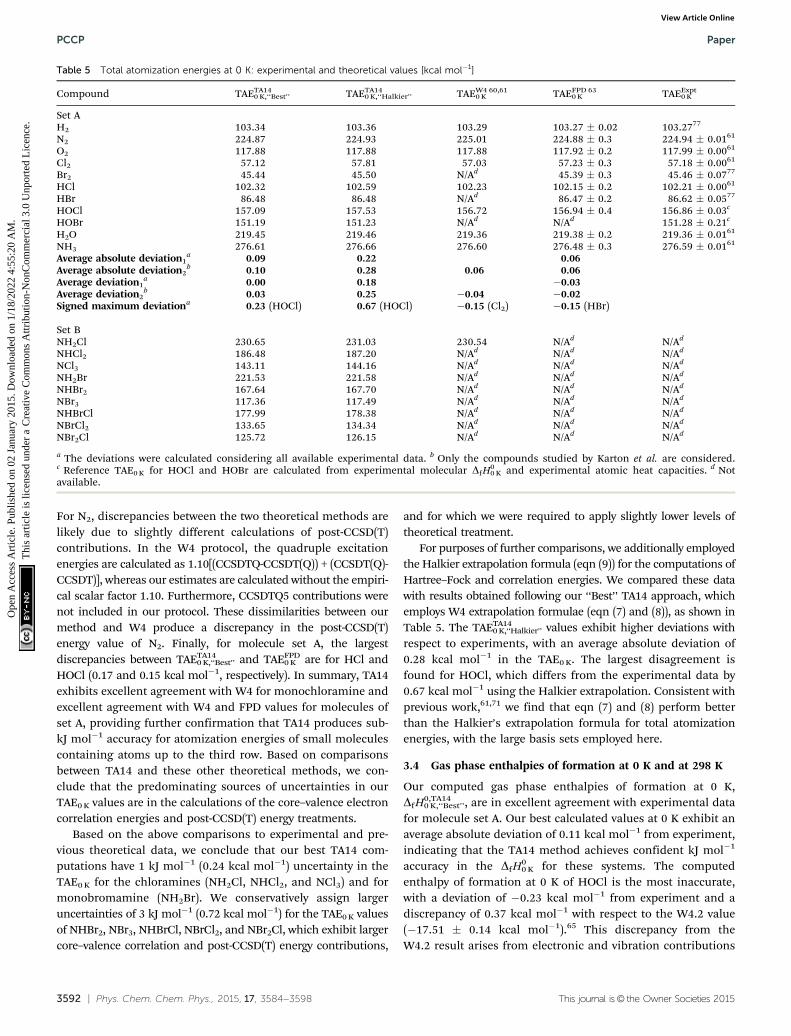
are in excellent agreement with previously published experi-mental values, where available. For all species in set A there isagreement to within 0.23 kcal mol�1 or less (Table 5). The averageabsolute deviation from experiments is 0.10 kcal mol�1. The largestdisagreement from experiment is for HOCl (0.23 kcal mol�1),followed by HBr with a deviation of �0.14 kcal mol�1. Theseresults indicate that the ab initio protocol employed here hasachieved r1 kJ mol�1 accuracy for the small molecules of set A.This is consistent with previous high-level ab initio work usingcomparable methodologies.61,63
Our TAETA140 K,‘‘Best’’ results are also in very good agreement with
previous theoretical values from W4 (TAEW40 K) and FPD calcula-
tions (TAEFPD0 K ), where comparisons can be made. TAETA14
0 K,‘‘Best’’ andTAEW4
0 K agree to within 0.11 kcal mol�1 for monochloramine. Formolecule set A, the highest discrepancies between TAETA14
0 K,‘‘Best’’
and TAEW40 K are found for N2 (�0.14 kcal mol�1) and HOCl (0.37
kcal mol�1). These differences can be explained chiefly by afew energy contributions that were computed differently. First,Karton et al. employed a different definition of frozen-coreelectrons from that implemented in CFOUR, and, as a con-sequence, the estimates of the core–valence contributions differby 0.14 kcal mol�1 for HOCl. Second, the W4 estimate of the zero-point vibrational energy of HOCl was 8.18 kcal mol�1, taken fromtheoretical data137 calculated at the MRCI/AV(D,T,Q)Z level, andthis differs from our VPT2-B2PLYPD/AVQZ value (7.92 kcal mol�1)and from the experimental value of 7.97 kcal mol�1.138–140
Table 4 Diagnostics for nondynamical correlation (NDC)
Compound %TAE[HF] %TAE[(T)] %TAE[post-CCSD(T)]NDC evaluationbased on %TAE[(T)]a
N2 50.9 4.16 0.076 Mild NDCO2 15.7 7.72 0.443 Moderate NDCCl2 32.4 8.03 �0.051 Moderate NDCBr2 30.9 7.97 0.035 Moderate NDCHCl 71.8 1.49 0.048 Mild NDCHBr 69.7 1.50 �0.006 Mild NDCHOCl 47.6 4.18 0.084 Mild NDCHOBr 47.2 4.14 0.037 Mild NDCH2O 67.1 1.54 �0.029 Mild NDCNH3 67.7 1.32 �0.048 Mild NDCNH2Cl 57.4 2.81 �0.012 Mild NDCNHCl2 40.3 5.50 �0.031 Moderate NDCNCl3 9.3 10.66 �0.049 Severe NDCNH2Br 56.5 2.85 0.010 Mild NDCNHBr2 36.1 5.86 0.022 Moderate NDCNBr3 �5.8 12.52 �0.080 Severe NDCNHBrCl 38.5 5.68 0.008 Moderate NDCNBrCl2 3.6 11.58 0.065 Severe NDCNBr2Cl �0.4 11.90 �0.364 Severe NDC
a Following the qualitative interpretation proposed by Karton et al.,61,65 systems are dominated by dynamic correlation when the %TAE[(T)] value isbelow 2%, whereas a large nondynamical correlation contribution is indicated by a %TAE[(T)] value greater than 10%. %TAE[(T)] between 2% and4–5% and between 4–5% and 10% suggest mild and moderate levels of nondynamical correlation, respectively. %TAE[HF] is a more generic andlower-cost predictor for NDC: a %TAE[HF] value above 66.7% indicates a system not affected by NDC, whereas a %TAE[HF] below 20% indicates amolecule dominated by a severe nondynamical correlation.
Paper PCCP
Ope
n A
cces
s A
rtic
le. P
ublis
hed
on 0
2 Ja
nuar
y 20
15. D
ownl
oade
d on
1/1
8/20
22 4
:55:
20 A
M.
Thi
s ar
ticle
is li
cens
ed u
nder
a C
reat
ive
Com
mon
s A
ttrib
utio
n-N
onC
omm
erci
al 3
.0 U
npor
ted
Lic
ence
.View Article Online
3592 | Phys. Chem. Chem. Phys., 2015, 17, 3584--3598 This journal is© the Owner Societies 2015
For N2, discrepancies between the two theoretical methods arelikely due to slightly different calculations of post-CCSD(T)contributions. In the W4 protocol, the quadruple excitationenergies are calculated as 1.10[(CCSDTQ-CCSDT(Q)) + (CCSDT(Q)-CCSDT)], whereas our estimates are calculated without the empiri-cal scalar factor 1.10. Furthermore, CCSDTQ5 contributions werenot included in our protocol. These dissimilarities between ourmethod and W4 produce a discrepancy in the post-CCSD(T)energy value of N2. Finally, for molecule set A, the largestdiscrepancies between TAETA14
0 K,‘‘Best’’ and TAEFPD0 K are for HCl and
HOCl (0.17 and 0.15 kcal mol�1, respectively). In summary, TA14exhibits excellent agreement with W4 for monochloramine andexcellent agreement with W4 and FPD values for molecules ofset A, providing further confirmation that TA14 produces sub-kJ mol�1 accuracy for atomization energies of small moleculescontaining atoms up to the third row. Based on comparisonsbetween TA14 and these other theoretical methods, we con-clude that the predominating sources of uncertainties in ourTAE0 K values are in the calculations of the core–valence electroncorrelation energies and post-CCSD(T) energy treatments.
Based on the above comparisons to experimental and pre-vious theoretical data, we conclude that our best TA14 com-putations have 1 kJ mol�1 (0.24 kcal mol�1) uncertainty in theTAE0 K for the chloramines (NH2Cl, NHCl2, and NCl3) and formonobromamine (NH2Br). We conservatively assign largeruncertainties of 3 kJ mol�1 (0.72 kcal mol�1) for the TAE0 K valuesof NHBr2, NBr3, NHBrCl, NBrCl2, and NBr2Cl, which exhibit largercore–valence correlation and post-CCSD(T) energy contributions,
and for which we were required to apply slightly lower levels oftheoretical treatment.
For purposes of further comparisons, we additionally employedthe Halkier extrapolation formula (eqn (9)) for the computations ofHartree–Fock and correlation energies. We compared these datawith results obtained following our ‘‘Best’’ TA14 approach, whichemploys W4 extrapolation formulae (eqn (7) and (8)), as shown inTable 5. The TAETA14
0 K,‘‘Halkier’’ values exhibit higher deviations withrespect to experiments, with an average absolute deviation of0.28 kcal mol�1 in the TAE0 K. The largest disagreement isfound for HOCl, which differs from the experimental data by0.67 kcal mol�1 using the Halkier extrapolation. Consistent withprevious work,61,71 we find that eqn (7) and (8) perform betterthan the Halkier’s extrapolation formula for total atomizationenergies, with the large basis sets employed here.
3.4 Gas phase enthalpies of formation at 0 K and at 298 K
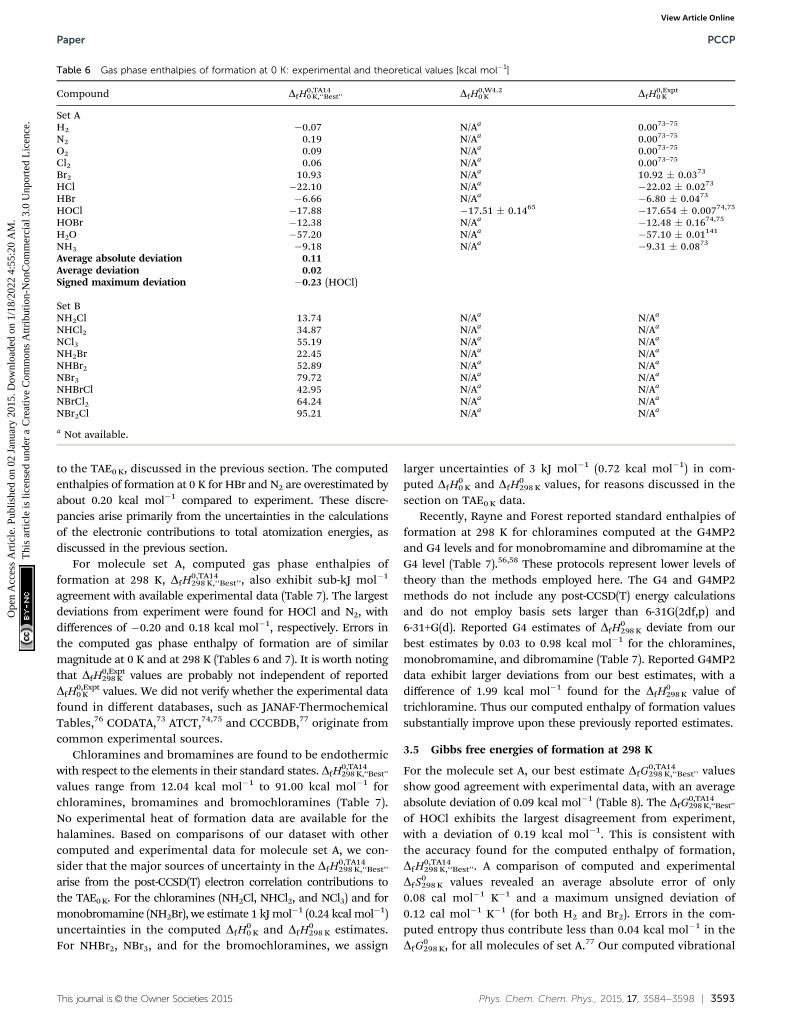
Our computed gas phase enthalpies of formation at 0 K,DfH0,TA14
0 K,‘‘Best’’, are in excellent agreement with experimental datafor molecule set A. Our best calculated values at 0 K exhibit anaverage absolute deviation of 0.11 kcal mol�1 from experiment,indicating that the TA14 method achieves confident kJ mol�1
accuracy in the DfH00 K for these systems. The computed
enthalpy of formation at 0 K of HOCl is the most inaccurate,with a deviation of �0.23 kcal mol�1 from experiment and adiscrepancy of 0.37 kcal mol�1 with respect to the W4.2 value(�17.51 � 0.14 kcal mol�1).65 This discrepancy from theW4.2 result arises from electronic and vibration contributions
Table 5 Total atomization energies at 0 K: experimental and theoretical values [kcal mol�1]
Compound TAETA140 K,‘‘Best’’ TAETA14
0 K,‘‘Halkier’’ TAEW40 K
60,61 TAEFPD0 K
63 TAEExpt0 K
Set AH2 103.34 103.36 103.29 103.27 � 0.02 103.2777
N2 224.87 224.93 225.01 224.88 � 0.3 224.94 � 0.0161
O2 117.88 117.88 117.88 117.92 � 0.2 117.99 � 0.0061
Cl2 57.12 57.81 57.03 57.23 � 0.3 57.18 � 0.0061
Br2 45.44 45.50 N/Ad 45.39 � 0.3 45.46 � 0.0777
HCl 102.32 102.59 102.23 102.15 � 0.2 102.21 � 0.0061
HBr 86.48 86.48 N/Ad 86.47 � 0.2 86.62 � 0.0577
HOCl 157.09 157.53 156.72 156.94 � 0.4 156.86 � 0.03c
HOBr 151.19 151.23 N/Ad N/Ad 151.28 � 0.21c
H2O 219.45 219.46 219.36 219.38 � 0.2 219.36 � 0.0161
NH3 276.61 276.66 276.60 276.48 � 0.3 276.59 � 0.0161
Average absolute deviation1a 0.09 0.22 0.06
Average absolute deviation2b 0.10 0.28 0.06 0.06
Average deviation1a 0.00 0.18 �0.03
Average deviation2b 0.03 0.25 �0.04 �0.02
Signed maximum deviationa 0.23 (HOCl) 0.67 (HOCl) �0.15 (Cl2) �0.15 (HBr)
Set BNH2Cl 230.65 231.03 230.54 N/Ad N/Ad
NHCl2 186.48 187.20 N/Ad N/Ad N/Ad
NCl3 143.11 144.16 N/Ad N/Ad N/Ad
NH2Br 221.53 221.58 N/Ad N/Ad N/Ad
NHBr2 167.64 167.70 N/Ad N/Ad N/Ad
NBr3 117.36 117.49 N/Ad N/Ad N/Ad
NHBrCl 177.99 178.38 N/Ad N/Ad N/Ad
NBrCl2 133.65 134.34 N/Ad N/Ad N/Ad
NBr2Cl 125.72 126.15 N/Ad N/Ad N/Ad
a The deviations were calculated considering all available experimental data. b Only the compounds studied by Karton et al. are considered.c Reference TAE0 K for HOCl and HOBr are calculated from experimental molecular DfH0
0 K and experimental atomic heat capacities. d Notavailable.
PCCP Paper
Ope
n A
cces
s A
rtic
le. P
ublis
hed
on 0
2 Ja
nuar
y 20
15. D
ownl
oade
d on
1/1
8/20
22 4
:55:
20 A
M.
Thi
s ar
ticle
is li
cens
ed u
nder
a C
reat
ive
Com
mon
s A
ttrib
utio
n-N
onC
omm
erci
al 3
.0 U
npor
ted
Lic
ence
.View Article Online
This journal is© the Owner Societies 2015 Phys. Chem. Chem. Phys., 2015, 17, 3584--3598 | 3593
to the TAE0 K, discussed in the previous section. The computedenthalpies of formation at 0 K for HBr and N2 are overestimated byabout 0.20 kcal mol�1 compared to experiment. These discre-pancies arise primarily from the uncertainties in the calculationsof the electronic contributions to total atomization energies, asdiscussed in the previous section.
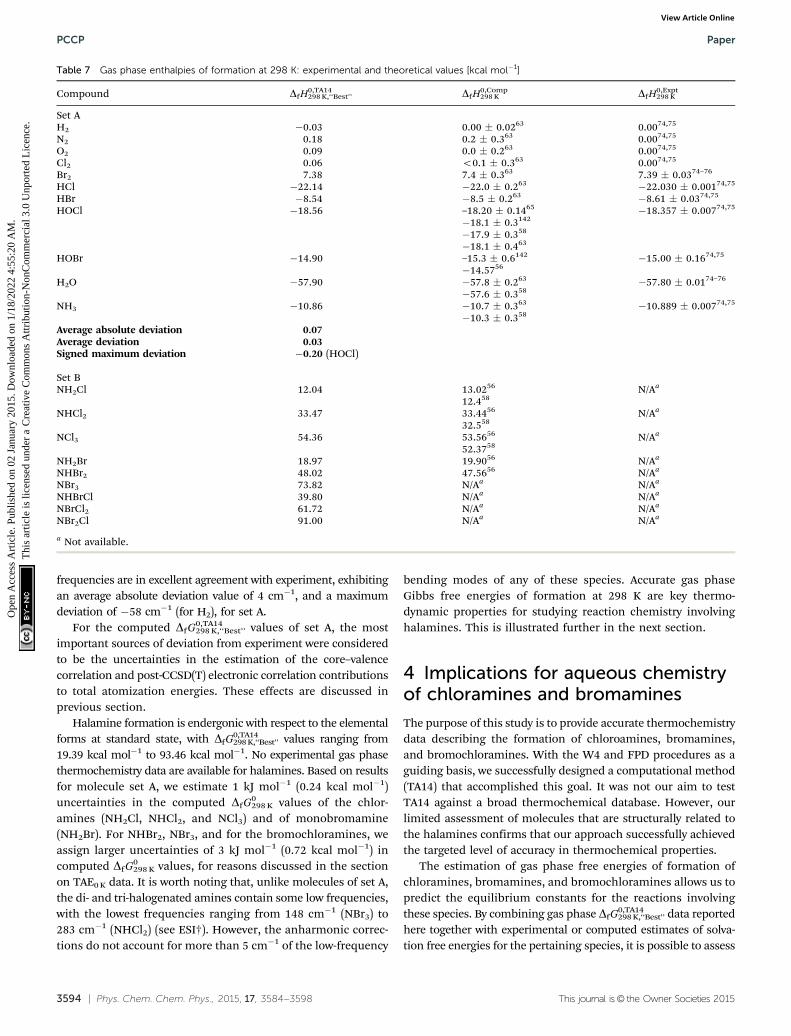
For molecule set A, computed gas phase enthalpies offormation at 298 K, DfH0,TA14
298 K,‘‘Best’’, also exhibit sub-kJ mol�1
agreement with available experimental data (Table 7). The largestdeviations from experiment were found for HOCl and N2, withdifferences of �0.20 and 0.18 kcal mol�1, respectively. Errors inthe computed gas phase enthalpy of formation are of similarmagnitude at 0 K and at 298 K (Tables 6 and 7). It is worth notingthat DfH
0,Expt298 K values are probably not independent of reported
DfH0,Expt0 K values. We did not verify whether the experimental data
found in different databases, such as JANAF-ThermochemicalTables,76 CODATA,73 ATCT,74,75 and CCCBDB,77 originate fromcommon experimental sources.
Chloramines and bromamines are found to be endothermicwith respect to the elements in their standard states. DfH
0,TA14298 K,‘‘Best’’
values range from 12.04 kcal mol�1 to 91.00 kcal mol�1 forchloramines, bromamines and bromochloramines (Table 7).No experimental heat of formation data are available for thehalamines. Based on comparisons of our dataset with othercomputed and experimental data for molecule set A, we con-sider that the major sources of uncertainty in the DfH0,TA14
298 K,‘‘Best’’
arise from the post-CCSD(T) electron correlation contributions tothe TAE0 K. For the chloramines (NH2Cl, NHCl2, and NCl3) and formonobromamine (NH2Br), we estimate 1 kJ mol�1 (0.24 kcal mol�1)uncertainties in the computed DfH0
0 K and DfH0298 K estimates.
For NHBr2, NBr3, and for the bromochloramines, we assign
larger uncertainties of 3 kJ mol�1 (0.72 kcal mol�1) in com-puted DfH0
0 K and DfH0298 K values, for reasons discussed in the
section on TAE0 K data.Recently, Rayne and Forest reported standard enthalpies of
formation at 298 K for chloramines computed at the G4MP2and G4 levels and for monobromamine and dibromamine at theG4 level (Table 7).56,58 These protocols represent lower levels oftheory than the methods employed here. The G4 and G4MP2methods do not include any post-CCSD(T) energy calculationsand do not employ basis sets larger than 6-31G(2df,p) and6-31+G(d). Reported G4 estimates of DfH
0298 K deviate from our
best estimates by 0.03 to 0.98 kcal mol�1 for the chloramines,monobromamine, and dibromamine (Table 7). Reported G4MP2data exhibit larger deviations from our best estimates, with adifference of 1.99 kcal mol�1 found for the DfH
0298 K value of
trichloramine. Thus our computed enthalpy of formation valuessubstantially improve upon these previously reported estimates.
3.5 Gibbs free energies of formation at 298 K
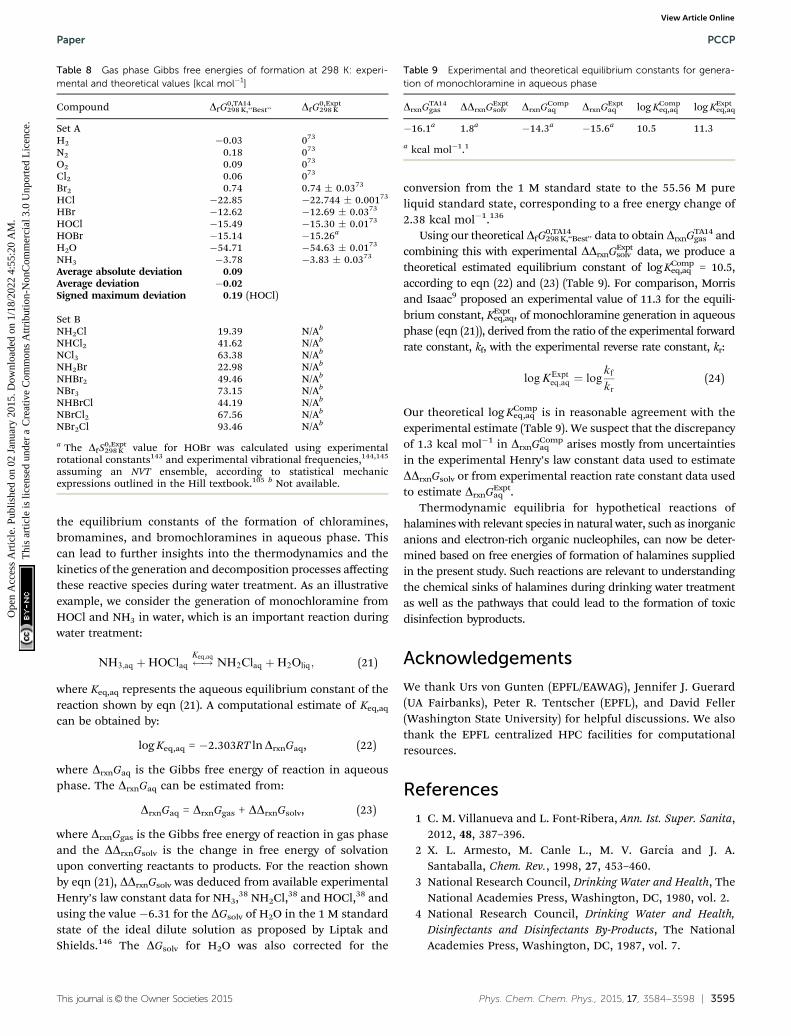
For the molecule set A, our best estimate DfG0,TA14298 K,‘‘Best’’ values
show good agreement with experimental data, with an averageabsolute deviation of 0.09 kcal mol�1 (Table 8). The DfG
0,TA14298 K,‘‘Best’’
of HOCl exhibits the largest disagreement from experiment,with a deviation of 0.19 kcal mol�1. This is consistent withthe accuracy found for the computed enthalpy of formation,DfH0,TA14
298 K,‘‘Best’’. A comparison of computed and experimentalDfS0
298 K values revealed an average absolute error of only0.08 cal mol�1 K�1 and a maximum unsigned deviation of0.12 cal mol�1 K�1 (for both H2 and Br2). Errors in the com-puted entropy thus contribute less than 0.04 kcal mol�1 in theDfG0
298 K, for all molecules of set A.77 Our computed vibrational
Table 6 Gas phase enthalpies of formation at 0 K: experimental and theoretical values [kcal mol�1]
Compound DfH0,TA140 K,‘‘Best’’ DfH0,W4.2
0 K DfH0,Expt0 K
Set AH2 �0.07 N/Aa 0.0073–75
N2 0.19 N/Aa 0.0073–75
O2 0.09 N/Aa 0.0073–75
Cl2 0.06 N/Aa 0.0073–75
Br2 10.93 N/Aa 10.92 � 0.0373
HCl �22.10 N/Aa �22.02 � 0.0273
HBr �6.66 N/Aa �6.80 � 0.0473
HOCl �17.88 �17.51 � 0.1465 �17.654 � 0.00774,75
HOBr �12.38 N/Aa �12.48 � 0.1674,75
H2O �57.20 N/Aa �57.10 � 0.01141
NH3 �9.18 N/Aa �9.31 � 0.0873
Average absolute deviation 0.11Average deviation 0.02Signed maximum deviation �0.23 (HOCl)
Set BNH2Cl 13.74 N/Aa N/Aa
NHCl2 34.87 N/Aa N/Aa
NCl3 55.19 N/Aa N/Aa
NH2Br 22.45 N/Aa N/Aa
NHBr2 52.89 N/Aa N/Aa
NBr3 79.72 N/Aa N/Aa
NHBrCl 42.95 N/Aa N/Aa
NBrCl2 64.24 N/Aa N/Aa
NBr2Cl 95.21 N/Aa N/Aa
a Not available.
Paper PCCP
Ope
n A
cces
s A
rtic
le. P
ublis
hed
on 0
2 Ja
nuar
y 20
15. D
ownl
oade
d on
1/1
8/20
22 4
:55:
20 A
M.
Thi
s ar
ticle
is li
cens
ed u
nder
a C
reat
ive
Com
mon
s A
ttrib
utio
n-N
onC
omm
erci
al 3
.0 U
npor
ted
Lic
ence
.View Article Online
3594 | Phys. Chem. Chem. Phys., 2015, 17, 3584--3598 This journal is© the Owner Societies 2015
frequencies are in excellent agreement with experiment, exhibitingan average absolute deviation value of 4 cm�1, and a maximumdeviation of �58 cm�1 (for H2), for set A.
For the computed DfG0,TA14298 K,‘‘Best’’ values of set A, the most
important sources of deviation from experiment were consideredto be the uncertainties in the estimation of the core–valencecorrelation and post-CCSD(T) electronic correlation contributionsto total atomization energies. These effects are discussed inprevious section.
Halamine formation is endergonic with respect to the elementalforms at standard state, with DfG
0,TA14298 K,‘‘Best’’ values ranging from
19.39 kcal mol�1 to 93.46 kcal mol�1. No experimental gas phasethermochemistry data are available for halamines. Based on resultsfor molecule set A, we estimate 1 kJ mol�1 (0.24 kcal mol�1)uncertainties in the computed DfG0
298 K values of the chlor-amines (NH2Cl, NHCl2, and NCl3) and of monobromamine(NH2Br). For NHBr2, NBr3, and for the bromochloramines, weassign larger uncertainties of 3 kJ mol�1 (0.72 kcal mol�1) incomputed DfG0
298 K values, for reasons discussed in the sectionon TAE0 K data. It is worth noting that, unlike molecules of set A,the di- and tri-halogenated amines contain some low frequencies,with the lowest frequencies ranging from 148 cm�1 (NBr3) to283 cm�1 (NHCl2) (see ESI†). However, the anharmonic correc-tions do not account for more than 5 cm�1 of the low-frequency
bending modes of any of these species. Accurate gas phaseGibbs free energies of formation at 298 K are key thermo-dynamic properties for studying reaction chemistry involvinghalamines. This is illustrated further in the next section.
4 Implications for aqueous chemistryof chloramines and bromamines
The purpose of this study is to provide accurate thermochemistrydata describing the formation of chloroamines, bromamines,and bromochloramines. With the W4 and FPD procedures as aguiding basis, we successfully designed a computational method(TA14) that accomplished this goal. It was not our aim to testTA14 against a broad thermochemical database. However, ourlimited assessment of molecules that are structurally related tothe halamines confirms that our approach successfully achievedthe targeted level of accuracy in thermochemical properties.
The estimation of gas phase free energies of formation ofchloramines, bromamines, and bromochloramines allows us topredict the equilibrium constants for the reactions involvingthese species. By combining gas phase DfG
0,TA14298 K,‘‘Best’’ data reported
here together with experimental or computed estimates of solva-tion free energies for the pertaining species, it is possible to assess
Table 7 Gas phase enthalpies of formation at 298 K: experimental and theoretical values [kcal mol�1]
Compound DfH0,TA14298 K,‘‘Best’’ DfH0,Comp
298 K DfH0,Expt298 K
Set AH2 �0.03 0.00 � 0.0263 0.0074,75
N2 0.18 0.2 � 0.363 0.0074,75
O2 0.09 0.0 � 0.263 0.0074,75
Cl2 0.06 o0.1 � 0.363 0.0074,75
Br2 7.38 7.4 � 0.363 7.39 � 0.0374–76
HCl �22.14 �22.0 � 0.263 �22.030 � 0.00174,75
HBr �8.54 �8.5 � 0.263 �8.61 � 0.0374,75
HOCl �18.56 –18.20 � 0.1465 �18.357 � 0.00774,75
�18.1 � 0.3142
�17.9 � 0.358
�18.1 � 0.463
HOBr �14.90 –15.3 � 0.6142 �15.00 � 0.1674,75
�14.5756
H2O �57.90 �57.8 � 0.263 �57.80 � 0.0174–76
�57.6 � 0.358
NH3 �10.86 �10.7 � 0.363 �10.889 � 0.00774,75
�10.3 � 0.358
Average absolute deviation 0.07Average deviation 0.03Signed maximum deviation �0.20 (HOCl)
Set BNH2Cl 12.04 13.0256 N/Aa
12.458
NHCl2 33.47 33.4456 N/Aa
32.558
NCl3 54.36 53.5656 N/Aa
52.3758
NH2Br 18.97 19.9056 N/Aa
NHBr2 48.02 47.5656 N/Aa
NBr3 73.82 N/Aa N/Aa
NHBrCl 39.80 N/Aa N/Aa
NBrCl2 61.72 N/Aa N/Aa
NBr2Cl 91.00 N/Aa N/Aa
a Not available.
PCCP Paper
Ope
n A
cces
s A
rtic
le. P
ublis
hed
on 0
2 Ja
nuar
y 20
15. D
ownl
oade
d on
1/1
8/20
22 4
:55:
20 A
M.
Thi
s ar
ticle
is li
cens
ed u
nder
a C
reat
ive
Com
mon
s A
ttrib
utio
n-N
onC
omm
erci
al 3
.0 U
npor
ted
Lic
ence
.View Article Online
This journal is© the Owner Societies 2015 Phys. Chem. Chem. Phys., 2015, 17, 3584--3598 | 3595
the equilibrium constants of the formation of chloramines,bromamines, and bromochloramines in aqueous phase. Thiscan lead to further insights into the thermodynamics and thekinetics of the generation and decomposition processes affectingthese reactive species during water treatment. As an illustrativeexample, we consider the generation of monochloramine fromHOCl and NH3 in water, which is an important reaction duringwater treatment:
NH3;aq þHOClaq !Keq;aq
NH2Claq þH2Oliq; (21)
where Keq,aq represents the aqueous equilibrium constant of thereaction shown by eqn (21). A computational estimate of Keq,aq
can be obtained by:
log Keq,aq = �2.303RT lnDrxnGaq, (22)
where DrxnGaq is the Gibbs free energy of reaction in aqueousphase. The DrxnGaq can be estimated from:
DrxnGaq = DrxnGgas + DDrxnGsolv, (23)
where DrxnGgas is the Gibbs free energy of reaction in gas phaseand the DDrxnGsolv is the change in free energy of solvationupon converting reactants to products. For the reaction shownby eqn (21), DDrxnGsolv was deduced from available experimentalHenry’s law constant data for NH3,38 NH2Cl,38 and HOCl,38 andusing the value �6.31 for the DGsolv of H2O in the 1 M standardstate of the ideal dilute solution as proposed by Liptak andShields.146 The DGsolv for H2O was also corrected for the
conversion from the 1 M standard state to the 55.56 M pureliquid standard state, corresponding to a free energy change of2.38 kcal mol�1.136
Using our theoretical DfG0,TA14298 K,‘‘Best’’ data to obtain DrxnGTA14
gas andcombining this with experimental DDrxnGExpt
solv data, we produce atheoretical estimated equilibrium constant of log KComp
eq,aq = 10.5,according to eqn (22) and (23) (Table 9). For comparison, Morrisand Isaac9 proposed an experimental value of 11.3 for the equili-brium constant, KExpt
eq,aq, of monochloramine generation in aqueousphase (eqn (21)), derived from the ratio of the experimental forwardrate constant, kf, with the experimental reverse rate constant, kr:
logKExpteq;aq ¼ log
kf
kr(24)
Our theoretical log KCompeq,aq is in reasonable agreement with the
experimental estimate (Table 9). We suspect that the discrepancyof 1.3 kcal mol�1 in DrxnGComp
aq arises mostly from uncertaintiesin the experimental Henry’s law constant data used to estimateDDrxnGsolv or from experimental reaction rate constant data usedto estimate DrxnGExpt
aq .Thermodynamic equilibria for hypothetical reactions of
halamines with relevant species in natural water, such as inorganicanions and electron-rich organic nucleophiles, can now be deter-mined based on free energies of formation of halamines suppliedin the present study. Such reactions are relevant to understandingthe chemical sinks of halamines during drinking water treatmentas well as the pathways that could lead to the formation of toxicdisinfection byproducts.
Acknowledgements
We thank Urs von Gunten (EPFL/EAWAG), Jennifer J. Guerard(UA Fairbanks), Peter R. Tentscher (EPFL), and David Feller(Washington State University) for helpful discussions. We alsothank the EPFL centralized HPC facilities for computationalresources.
References
1 C. M. Villanueva and L. Font-Ribera, Ann. Ist. Super. Sanita,2012, 48, 387–396.
2 X. L. Armesto, M. Canle L., M. V. Garcıa and J. A.Santaballa, Chem. Rev., 1998, 27, 453–460.
3 National Research Council, Drinking Water and Health, TheNational Academies Press, Washington, DC, 1980, vol. 2.
4 National Research Council, Drinking Water and Health,Disinfectants and Disinfectants By-Products, The NationalAcademies Press, Washington, DC, 1987, vol. 7.
Table 8 Gas phase Gibbs free energies of formation at 298 K: experi-mental and theoretical values [kcal mol�1]
Compound DfG0,TA14298 K,‘‘Best’’ DfG0,Expt
298 K
Set AH2 �0.03 073
N2 0.18 073
O2 0.09 073
Cl2 0.06 073
Br2 0.74 0.74 � 0.0373
HCl �22.85 �22.744 � 0.00173
HBr �12.62 �12.69 � 0.0373
HOCl �15.49 �15.30 � 0.0173
HOBr �15.14 �15.26a
H2O �54.71 �54.63 � 0.0173
NH3 �3.78 �3.83 � 0.0373
Average absolute deviation 0.09Average deviation �0.02Signed maximum deviation 0.19 (HOCl)
Set BNH2Cl 19.39 N/Ab
NHCl2 41.62 N/Ab
NCl3 63.38 N/Ab
NH2Br 22.98 N/Ab
NHBr2 49.46 N/Ab
NBr3 73.15 N/Ab
NHBrCl 44.19 N/Ab
NBrCl2 67.56 N/Ab
NBr2Cl 93.46 N/Ab
a The DfS0,Expt298 K value for HOBr was calculated using experimental
rotational constants143 and experimental vibrational frequencies,144,145
assuming an NVT ensemble, according to statistical mechanicexpressions outlined in the Hill textbook.105 b Not available.
Table 9 Experimental and theoretical equilibrium constants for genera-tion of monochloramine in aqueous phase
DrxnGTA14gas DDrxnGExpt
solv DrxnGCompaq DrxnGExpt
aq log KCompeq,aq log KExpt
eq,aq
�16.1a 1.8a �14.3a �15.6a 10.5 11.3
a kcal mol�1.1
Paper PCCP
Ope
n A
cces
s A
rtic
le. P
ublis
hed
on 0
2 Ja
nuar
y 20
15. D
ownl
oade
d on
1/1
8/20
22 4
:55:
20 A
M.
Thi
s ar
ticle
is li
cens
ed u
nder
a C
reat
ive
Com
mon
s A
ttrib
utio
n-N
onC
omm
erci
al 3
.0 U
npor
ted
Lic
ence
.View Article Online
3596 | Phys. Chem. Chem. Phys., 2015, 17, 3584--3598 This journal is© the Owner Societies 2015
5 U.S. Environmental Protection Agency, Information aboutChloramine in Drinking Water, 2012.
6 J. C. Morris, J. Phys. Chem., 1966, 70, 3798–3805.7 I. Weil and J. C. Morris, J. Am. Chem. Soc., 1949, 71, 1664–1671.8 J. C. Morris, Princ. Appl. Water Chem., 1967, pp. 23–53.9 J. C. Morris and R. A. Isaac, Water Chlorination Environ.
Impact Heal. Eff., Ann Arbor Science, Ann Arbor, MI, 1981,ch. 2, vol. 4, pp. 50–62.
10 D. W. Margerum and E. T. Gray, Organometals Organo-metalloids, Occur. Fate Environ., 1978, ch. 17, pp. 278–291.
11 C. T. Jafvert and R. L. Valentine, Environ. Sci. Technol.,1992, 26, 577–586.
12 R. L. Wolfe, N. R. Ward and B. H. Olson, J. - Am. WaterWorks Assoc., 1984, 76, 74–88.
13 P. J. Vikesland, K. Ozekin and R. L. Valentine, Water Res.,2001, 35, 1766–1776.
14 J. E. Wajon and J. C. Morris, Water Chlorination Environ.Impact Heal. Eff., Ann Arbor Science, Ann Arbor, MI, 1980,ch. 16, vol. 3, pp. 171–181.
15 J. D. Jonhson and R. Overby, J. Sanit. Eng. Div., Am. Soc. Civ.Eng., 1971, 97, 617–628.
16 M. Gazda, L. E. Dejarme, T. K. Choudhury, R. G. Cooks andW. Lafayette, Environ. Sci. Technol., 1993, 27, 557–561.
17 M. Gazda and D. W. Margerum, Inorg. Chem., 1994, 33,118–123.
18 G. W. Inman, T. F. LaPointe and J. D. Jonhson, Inorg.Chem., 1976, 15, 3037–3042.
19 G. W. Inman and J. D. Johnson, Environ. Sci. Technol., 1984,4, 219–224.
20 H. Galal-Gorchev and J. C. Morris, Inorg. Chem., 1965, 4,899–905.
21 B. M. Soulard, F. Bloc and A. Hatterer, J. Chem. Soc., DaltonTrans., 1981, 2300–2310.
22 A. Bousher, P. Brimblecombe and D. Midgley, Water Res.,1989, 23, 1049–1058.
23 M. B. Heeb, J. Criquet, S. G. Zimmermann-Steffens andU. von Gunten, Water Res., 2014, 48, 15–42.
24 H. Lei, B. J. Marinas and R. A. Minear, Environ. Sci.Technol., 2004, 38, 2111–2119.
25 J. Luh and B. J. Marinas, Environ. Sci. Technol., 2014, 48,2843–2852.
26 A. C. Diehl, G. E. Speitel Jr., J. M. Symons, S. W. Krasner,C. J. Hwang and S. E. Barrett, J. - Am. Water Works Assoc.,2000, 92, 76–90.
27 J. Le Roux, H. Gallard and J.-P. Croue, Environ. Sci. Technol.,2012, 46, 1581–1589.
28 H. Lei, R. A. Minear and B. J. Marinas, Environ. Sci.Technol., 2006, 40, 2559–2564.
29 P. J. Vikesland and R. L. Valentine, Environ. Sci. Technol.,1998, 32, 1409–1416.
30 M. P. Snyder and D. W. Margerum, Inorg. Chem., 1982, 21,2545–2550.
31 R. A. Isaac and J. C. Morris, Environ. Sci. Technol., 1983, 17,738–742.
32 R. A. Isaac and J. C. Morris, Environ. Sci. Technol., 1985, 19,810–814.
33 A. D. Shah and W. A. Mitch, Environ. Sci. Technol., 2012, 46,119–131.
34 S. E. Duirk and R. L. Valentine, Water Res., 2006, 40,2667–2674.
35 I. M. Schreiber and W. A. Mitch, Environ. Sci. Technol.,2005, 39, 3811–3818.
36 I. M. Schreiber and W. A. Mitch, Environ. Sci. Technol.,2006, 40, 6007–6014.
37 R. L. Valentine, Environ. Sci. Technol., 1986, 20, 166–170.38 G. Holzwarth, R. G. Balmer and L. Soni, Water Res., 1984,
18, 1421–1427.39 N. Cimetiere and J. De Laat, Chemosphere, 2009, 77,
465–470.40 S. D. Richardson, D. M. DeMarini, M. Kogevinas, P. Fernandez,
E. Marco, C. Lourencetti, C. Balleste, D. Heederik, K. Meliefste,A. B. McKague, R. Marcos, L. Font-Ribera, J. O. Grimalt andC. M. Villanueva, Environ. Health Perspect., 2010, 118,1523–1530.
41 M. Hery, G. Hecht, J. Gerber, J. Gendre, G. Hubert andJ. Rebuffaud, Ann. Occup. Hyg., 1995, 39, 427–439.
42 D. I. Pattison and M. J. Davies, Biochemistry, 2004, 43,4799–4809.
43 E. L. Thomas, P. M. Bozeman, M. M. Jefferson and C. C.King, J. Biol. Chem., 1995, 270, 2906–2913.
44 S. J. Weiss, S. T. Test, C. M. Eckmann, D. Roos andS. Regiani, Science, 1986, 234, 200–203.
45 M. D. Rees, T. N. McNiven and M. J. Davies, Biochem. J.,2007, 401, 587–596.
46 A. L. P. Chapman, O. Skaff, R. Senthilmohan, A. J. Kettleand M. J. Davies, Biochem. J., 2009, 417, 773.
47 Z. Xue, W. H. Lee, K. M. Coburn and Y. Seo, Environ. Sci.Technol., 2014, 48, 3832–3839.
48 D. I. Pattison, R. J. O’Reilly, O. Ska, L. Radom, R. F. Andersonand M. J. Davies, Chem. Res. Toxicol., 2011, 24, 371–382.
49 R. J. O’Reilly, A. Karton and L. Radom, J. Phys. Chem. A,2013, 117, 460–472.
50 R. K. Milburn, C. F. Rodriquez and A. C. Hopkinson,J. Phys. Chem. B, 1997, 5647, 1837–1844.
51 C. Moller and M. Plesset, Phys. Rev., 1934, 46, 618–622.52 R. Krishnan and J. A. Pople, Int. J. Chem. Kinet., 1978, XIV,
91–100.53 R. Krishnan, M. J. Frisch and J. A. Pople, J. Chem. Phys.,
1980, 72, 4244.54 H. B. Schlegel, J. Phys. Chem., 1988, 92, 3075–3078.55 J. A. Pople, M. Head-Gordon and K. Raghavachari, J. Chem.
Phys., 1987, 87, 5968.56 S. Rayne and K. Forest, Comput. Theor. Chem., 2011, 974,
163–179.57 L. A. Curtiss, P. C. Redfern and K. Raghavachari, J. Chem.
Phys., 2007, 126, 084108.58 S. Rayne and K. Forest, J. Environ. Sci. Health, Part A: Toxic/
Hazard. Subst. Environ. Eng., 2014, 49, 753–762.59 L. A. Curtiss, P. C. Redfern and K. Raghavachari, J. Chem.
Phys., 2007, 127, 124105.60 A. Karton, S. Daon and J. M. L. Martin, Chem. Phys. Lett.,
2011, 510, 165–178.
PCCP Paper
Ope
n A
cces
s A
rtic
le. P
ublis
hed
on 0
2 Ja
nuar
y 20
15. D
ownl
oade
d on
1/1
8/20
22 4
:55:
20 A
M.
Thi
s ar
ticle
is li
cens
ed u
nder
a C
reat
ive
Com
mon
s A
ttrib
utio
n-N
onC
omm
erci
al 3
.0 U
npor
ted
Lic
ence
.View Article Online
This journal is© the Owner Societies 2015 Phys. Chem. Chem. Phys., 2015, 17, 3584--3598 | 3597
61 A. Karton, E. Rabinovich, J. M. L. Martin and B. Ruscic,J. Chem. Phys., 2006, 125, 144108.
62 A. Karton, P. R. Taylor and J. M. L. Martin, J. Chem. Phys.,2007, 127, 064104.
63 D. Feller, K. A. Peterson and D. A. Dixon, J. Chem. Phys.,2008, 129, 204105.
64 K. A. Peterson, D. Feller and D. A. Dixon, Theor. Chem. Acc.,2012, 131, 1079.
65 A. Karton, S. Parthiban and J. M. L. Martin, J. Phys. Chem.A, 2009, 113, 4802–4816.
66 A. Karton and J. M. L. Martin, J. Chem. Phys., 2011,135, 144119.
67 A. Tajti, P. G. Szalay, A. G. Csaszar, M. Kallay, J. Gauss,E. F. Valeev, B. A. Flowers, J. Vazquez and J. F. Stanton,J. Chem. Phys., 2004, 121, 11599–11613.
68 Y. J. Bomble, J. Vazquez, M. Kallay, C. Michauk, P. G.Szalay, A. G. Csaszar, J. Gauss and J. F. Stanton, J. Chem.Phys., 2006, 125, 64108.
69 M. E. Harding, J. Vazquez, B. Ruscic, A. K. Wilson, J. Gaussand J. F. Stanton, J. Chem. Phys., 2008, 128, 114111.
70 J. M. L. Martin and G. de Oliveira, J. Chem. Phys., 1999,111, 1843.
71 A. D. Boese, M. Oren, O. Atasoylu, J. M. L. Martin, M. Kallayand J. Gauss, J. Chem. Phys., 2004, 120, 4129–4141.
72 D. Feller, K. A. Peterson and B. Ruscic, Theor. Chem. Acc.,2013, 133, 1407.
73 J. D. Cox, D. D. Wagman and V. A. Medvedev, CODATA KeyValues for Thermodynamics, Hemisphere Publishing Corp.,New York, 1989.
74 B. Ruscic, R. E. Pinzon, M. L. Morton, G. von Laszevski,S. J. Bittner, S. G. Nijsure, K. A. Amin, M. Minkoff andA. F. Wagner, J. Phys. Chem. A, 2004, 108, 9979–9997.
75 B. Ruscic, R. E. Pinzon, G. V. Laszewski, D. Kodeboyina,A. Burcat, D. Leahy, D. Montoy and A. F. Wagner, J. Phys.:Conf. Ser., 2005, 16, 561–570.
76 M. W. Chase, J. Phys. Chem. Ref. Data, Monogr., 1998, 9,1–1951.
77 NIST Computational Chemistry Comparison and BenchmarkDatabase, NIST Standard Reference Database Number 101Release 16a, ed. R. D. Johnson III, 2013.
78 G. D. Purvis, J. Chem. Phys., 1982, 76, 1910.79 K. Raghavachari, G. W. Trucks, J. A. Pople and M. Head-
Gordon, Chem. Phys. Lett., 1989, 157, 479–483.80 J. F. Stanton, Chem. Phys. Lett., 1997, 281, 130–134.81 CFOUR, a quantum chemical program package written by
J. F. Stanton, J. Gauss, M. E. Harding, P. G. Szalay withcontributions from A. A. Auer, R. J. Bartlett, U. Benedikt,C. Berger, D. E. Bernholdt, Y. J. Bomble, L. Cheng,O. Christiansen, M. Heckert, O. Heun, C. Huber, T.-C.Jagau, D. Jonsson, J. Juselius, K. Klein, W. J. Lauderdale,D. A. Matthews, T. Metzroth, L. A. Muck, D. P. O’Neill, D. R.Price, E. Prochnow, C. Puzzarini, K. Ruud, F. Schiffmann,W. Schwalbach, C. Simmons, S. Stopkowicz, A. Tajti, J. Vazquez,F. Wang, J. D. Watts and the integral packages MOLECULE(J. Almlof and P. R. Taylor), PROPS (P. R. Taylor), ABACUS(T. Helgaker, H. J. Aa. Jensen, P. Jørgensen, and J. Olsen),
and ECP routines by A. V. Mitin and C. van Wullen. For thecurrent version, see http://www.cfour.de.
82 J. Noga and R. J. Bartlett, J. Chem. Phys., 1987, 86, 7041.83 G. E. Scuseria and H. F. Schaefer III, Chem. Phys. Lett.,
1988, 152, 1–5.84 J. D. Watts and R. J. Bartlett, J. Chem. Phys., 1990, 93, 6104.85 Y. J. Bomble, J. F. Stanton, M. Kallay and J. Gauss, J. Chem.
Phys., 2005, 123, 054101.86 S. A. Kucharski and R. J. Bartlett, Theor. Chim. Acta, 1991,
80, 387–405.87 N. Oliphant and L. Adamowicz, J. Chem. Phys., 1991, 95, 6645.88 S. A. Kucharski and R. J. Bartlett, J. Chem. Phys., 1992,
97, 4282.89 M. Kallay and P. R. Surjan, J. Chem. Phys., 2001, 115, 2945.90 S. Grimme, J. Chem. Phys., 2006, 124, 034108.91 T. Schwabe and S. Grimme, Phys. Chem. Chem. Phys., 2007,
9, 3397–3406.92 M. J. Frisch, G. W. Trucks, H. B. Schlegel, G. E. Scuseria,
M. A. Robb, J. R. Cheeseman, G. Scalmani, V. Barone,B. Mennucci, G. A. Petersson, H. Nakatsuji, M. Caricato,X. Li, H. P. Hratchian, A. F. Izmaylov, J. Bloino, G. Zheng,J. L. Sonnenberg, M. Hada, M. Ehara, K. Toyota, R. Fukuda,J. Hasegawa, M. Ishida, T. Nakajima, Y. Honda, O. Kitao,H. Nakai, T. Vreven, J. A. Montgomery Jr, J. E. Peralta,F. Ogliaro, M. Bearpark, J. J. Heyd, E. Brothers, K. N.Kudin, V. N. Staroverov, R. Kobayashi, J. Normand,K. Raghavachari, A. Rendell, J. C. Burant, S. S. Iyengar,J. Tomasi, M. Cossi, N. Rega, M. J. Millam, M. Klene,J. E. Knox, J. B. Cross, V. Bakken, C. Adamo, J. Jaramillo,R. Gomperts, R. E. Stratmann, O. Yazyev, A. J. Austin,R. Cammi, C. Pomelli, J. W. Ochterski, R. L. Martin,K. Morokuma, V. G. Zakrzewski, G. A. Voth, P. Salvadorand E. Al., Gaussian 09 Revision D.01, 2009.
93 M. Valiev, E. J. Bylaska, N. Govind, K. Kowalski, T. P.Straatsma, H. Van Dam, D. Wang, J. Nieplocha, E. Apra,T. L. Windus and W. A. de Jong, Comput. Phys. Commun.,2010, 181, 1477–1489.
94 T. Dunning Jr., J. Chem. Phys., 1989, 90, 1007–1023.95 R. A. Kendall, T. H. Dunning Jr. and R. J. Harrison, J. Chem.
Phys., 1992, 96, 6796–6806.96 T. H. Dunning Jr, K. A. Peterson and A. K. Wilson,
J. Chem. Phys., 2001, 114, 9244.97 W. A. de Jong, R. J. Harrison and D. A. Dixon, J. Chem.
Phys., 2001, 114, 48.98 K. A. Peterson and T. H. Dunning Jr, J. Chem. Phys., 2002,
117, 10548.99 J. D. Watts, J. Gauss and R. J. Bartlett, J. Chem. Phys., 1993,
98, 8718.100 V. Barone, J. Chem. Phys., 2005, 122, 14108.101 M. Biczysko, P. Panek, G. Scalmani, J. Bloino and
V. Barone, J. Chem. Theory Comput., 2010, 6, 2115–2125.102 K. K. Irikura, J. Phys. Chem. Ref. Data, 2007, 36, 389.103 NIST Chemistry WebBook, NIST Standard Reference Database
Number 69, ed. P. J. Linstrom and W. G. Mallard, NationalInstitute of Standards and Technology, Gaithersburg MD,20899, http://webbook.nist.gov, (accessed September, 2012).
Paper PCCP
Ope
n A
cces
s A
rtic
le. P
ublis
hed
on 0
2 Ja
nuar
y 20
15. D
ownl
oade
d on
1/1
8/20
22 4
:55:
20 A
M.
Thi
s ar
ticle
is li
cens
ed u
nder
a C
reat
ive
Com
mon
s A
ttrib
utio
n-N
onC
omm
erci
al 3
.0 U
npor
ted
Lic
ence
.View Article Online
3598 | Phys. Chem. Chem. Phys., 2015, 17, 3584--3598 This journal is© the Owner Societies 2015
104 G. Herzberg, Molecular Spectra and Molecular Structure. –Spectra of Diatomic Molecules, Krieger Publishing Company,Malabar, Florida, 2nd edn, 1989, vol. 1, p. 660.
105 T. L. Hill, An Introduction to Statistical Thermodynamics,Dover Publications, Inc., New York, 1986, p. 508.
106 S. A. Kucharski and R. J. Bartlett, Chem. Phys. Lett., 1989,158, 550–555.
107 W. Klopper, Mol. Phys., 2001, 99, 481–507.108 A. Karton and J. M. L. Martin, Theor. Chem. Acc., 2005, 115,
330–333.109 F. Jensen, Theor. Chem. Acc., 2005, 113, 267–273.110 F. Jensen, Theor. Chem. Acc., 2005, 113, 187–190.111 W. Klopper, J. Noga, H. Koch and T. Helgaker, Theor.
Chem. Acc., 1997, 97, 164–176.112 J. M. L. Martin and P. R. Taylor, J. Chem. Phys., 1997,
106, 8620.113 A. Halkier, T. Helgaker, P. Jørgensen, W. Klopper, H. Koch,
J. Olsen and A. K. Wilson, Chem. Phys. Lett., 1998, 286,243–252.
114 D. Feller, K. A. Peterson and T. D. Crawford, J. Chem. Phys.,2006, 124, 054107.
115 A. Halkier, W. Klopper, T. Helgaker, P. Jørgensen andP. R. Taylor, J. Chem. Phys., 1999, 111, 9157.
116 K. L. Bak, P. Jørgensen, J. Olsen, T. Helgaker and W. Klopper,J. Chem. Phys., 2000, 112, 9229–9242.
117 M. Reiher, Theor. Chem. Acc., 2006, 116, 241–252.118 M. Douglas and N. M. Kroll, Ann. Phys., 1974, 82, 88–155.119 B. Hess, Phys. Rev. A: At., Mol., Opt. Phys., 1985, 32,
756–763.120 B. Hess, Phys. Rev. A: At., Mol., Opt. Phys., 1986, 33,
3742–3748.121 G. Jansen and B. Hess, Phys. Rev. A: At., Mol., Opt. Phys.,
1989, 39, 6016–6017.122 L. Visscher and K. Dyall, At. Data Nucl. Data Tables, 1997,
67, 207–224.123 C. E. Moore, Atomic Energy Levels, National Bureau of
Standards, Washington, D.C., 1971, vol. I and II.124 D. Feller, K. A. Peterson, W. A. de Jong and D. A. Dixon,
J. Chem. Phys., 2003, 118, 3510.
125 C. Lee, W. Yang and R. G. Parr, Phys. Rev. B: Condens.Matter Mater. Phys., 1988, 37, 785.
126 A. D. Becke, J. Chem. Phys., 1993, 98, 1372–1377.127 T. H. Dunning Jr. and P. J. Hay, Methods Electron. Struct.
Theory, 1977, vol. 3, p. 462.128 L. R. Kahn, P. Baybutt and D. G. Truhlar, J. Chem. Phys.,
1976, 65, 3826.129 Y. S. Lee, W. C. Ermler and K. S. Pitzer, J. Chem. Phys., 1977,
67, 5861.130 P. A. Christiansen, Y. S. Lee and K. S. Pitzer, J. Chem. Phys.,
1979, 71, 4445.131 L. F. Pacios and P. A. Christiansen, J. Chem. Phys., 1985,
82, 2664.132 M. M. Hurley, L. F. Pacios, P. A. Christiansen, R. B. Ross
and W. C. Ermler, J. Chem. Phys., 1986, 84, 6840.133 J. Gauss, A. Tajti, M. Kallay, J. F. Stanton and P. G. Szalay,
J. Chem. Phys., 2006, 125, 144111.134 L. A. Curtiss, K. Raghavachari, P. C. Redfern and J. A.
Pople, J. Chem. Phys., 1997, 106, 1063.135 A. Karton, A. Tarnopolsky, J.-F. Lamere, G. C. Schatz and
J. M. L. Martin, J. Phys. Chem. A, 2008, 112, 12868–12886.136 C. J. Cramer, Essentials of Computational Chemistry Theories
and Models, John Wiley & Sons Inc., 2nd edn, 2004, p. 618.137 K. A. Peterson, S. Skokov and J. M. Bowman, J. Chem. Phys.,
1999, 111, 7446.138 R. Ashby, J. Mol. Spectrosc., 1967, 23, 439–447.139 R. A. Ashby, J. Mol. Spectrosc., 1971, 40, 639–640.140 K. Hedberg and R. M. Badger, J. Chem. Phys., 1951, 19, 508.141 B. Ruscic, R. E. Pinzon, M. L. Morton, N. K. Srinivasan,
M.-C. Su, J. W. Sutherland and J. V. Michael, J. Phys.Chem. A, 2006, 110, 6592–6601.
142 P. A. Denis, J. Phys. Chem. A, 2006, 110, 5887–5892.143 Y. Koga, H. Takeo, S. Kondo, M. Sugie, C. Matsumura,
G. McRae and E. Cohen, J. Mol. Spectrosc., 1989, 138, 467–481.144 G. McRae and E. Cohen, J. Mol. Spectrosc., 1990, 139, 369.145 I. Barnes, V. Bastian, K. Becker, R. Overath and T. Zhu,
Int. J. Chem. Kinet., 1989, 21, 499.146 M. D. Liptak and G. C. Shields, Int. J. Quantum Chem.,
2001, 85, 727–741.
PCCP Paper
Ope
n A
cces
s A
rtic
le. P
ublis
hed
on 0
2 Ja
nuar
y 20
15. D
ownl
oade
d on
1/1
8/20
22 4
:55:
20 A
M.
Thi
s ar
ticle
is li
cens
ed u
nder
a C
reat
ive
Com
mon
s A
ttrib
utio
n-N
onC
omm
erci
al 3
.0 U
npor
ted
Lic
ence
.View Article Online


