Embed Size (px)
Citation preview
Institute for Futures Studies and Technology Assessment
School of the Environment – University of Leeds
Beyond Environmental Cost Accounting
Principles and Empirical Demonstration of Accounting for Sustainable Value
7th annual conference of the Environmental Management Accounting Network Europe (EMAN-EU) “Sustainability Accounting and Reporting” 4-5 March 2004, Lüneburg
Frank Figge and Tobias Hahn
School of the Environment – University of LeedsInstitute for Futures Studies and Technology Assessment, Berlin

© Figge & Hahn 2004
- 2 -
What is he concerned about?
Jürgen E. Schrempp, CEO of DaimlerChrysler AG
http
://w
ww
.mits
ubis
hi-m
otor
s.co
.jp/d
ocs1
/032
7pho
to/jp
g/Sc
hrem
pp.jp
g

© Figge & Hahn 2004
- 3 -
Accounting for Environmental and Social Costs
§ What‘s an economic activity’s overall damage to society?
§ Weigh up different „environmental bads“– How bad is more CO2 in comparison to all the other
impacts?
– What‘s e.g. the trade-off between work accidents and CO2?
§ It‘s– Focused on how bad emissions are.
– Ethically doubtful.
– Impossible in practice for many impacts.
– Unimportant to managers.

© Figge & Hahn 2004
- 4 -
Accounting for Sustainable Value
§ How much value is created by an economic activity?
– How much € value is created per ton of CO2?
– How much € value is created per ton of VOC?
§ Compare the value of alternative uses (opportunity costs)
– When used in another place – how much more value is created?
§ It‘s
– Focused on how much value is created.
– Easy to do.
– Using the logic of the financial markets.
– Compatible with managerial thinking.

© Figge & Hahn 2004
- 5 -
I want to pollute more! How much do I have to pay you to accept the additional
damage?
How to deal with environmental damage?
I want to pollute more! How much do I have to pay you to
pollute instead of you?

© Figge & Hahn 2004
- 6 -
The Four Steps of Calculating Sustainable Value Added
(1) Calculate change of resource use
between period t0 and t1.
(2) Calculate the opportunity costs of the changes in resource use.
Repeat for every environmental & social resource.
(4) Balance with economic growth.
Result: Sustainable Value Added
(3) Calculate the average of the opportunity costs.

© Figge & Hahn 2004
- 7 -
Principles of Sustainable Value Added
§ Additional use of environmental and social resources of a company is only justified if this creates more value than an alternative use.
§ The overall consumption of environmental and social resources within the national economy must not increase.
§ If companies want to use more resources they have to compensate other users for giving up these resources.
§ Environmental and social resources are valued and weighted at their opportunity cost.

© Figge & Hahn 2004
- 8 -
Sustainable Value Added of three German companies in 2001.
§ Henkel KGaADetergents, cosmetics and adhesives industry
§ Wacker Chemie GmbHChemical industry
§ BMW AGAutomobile industry
© Figge & Hahn 2004
- 9 -
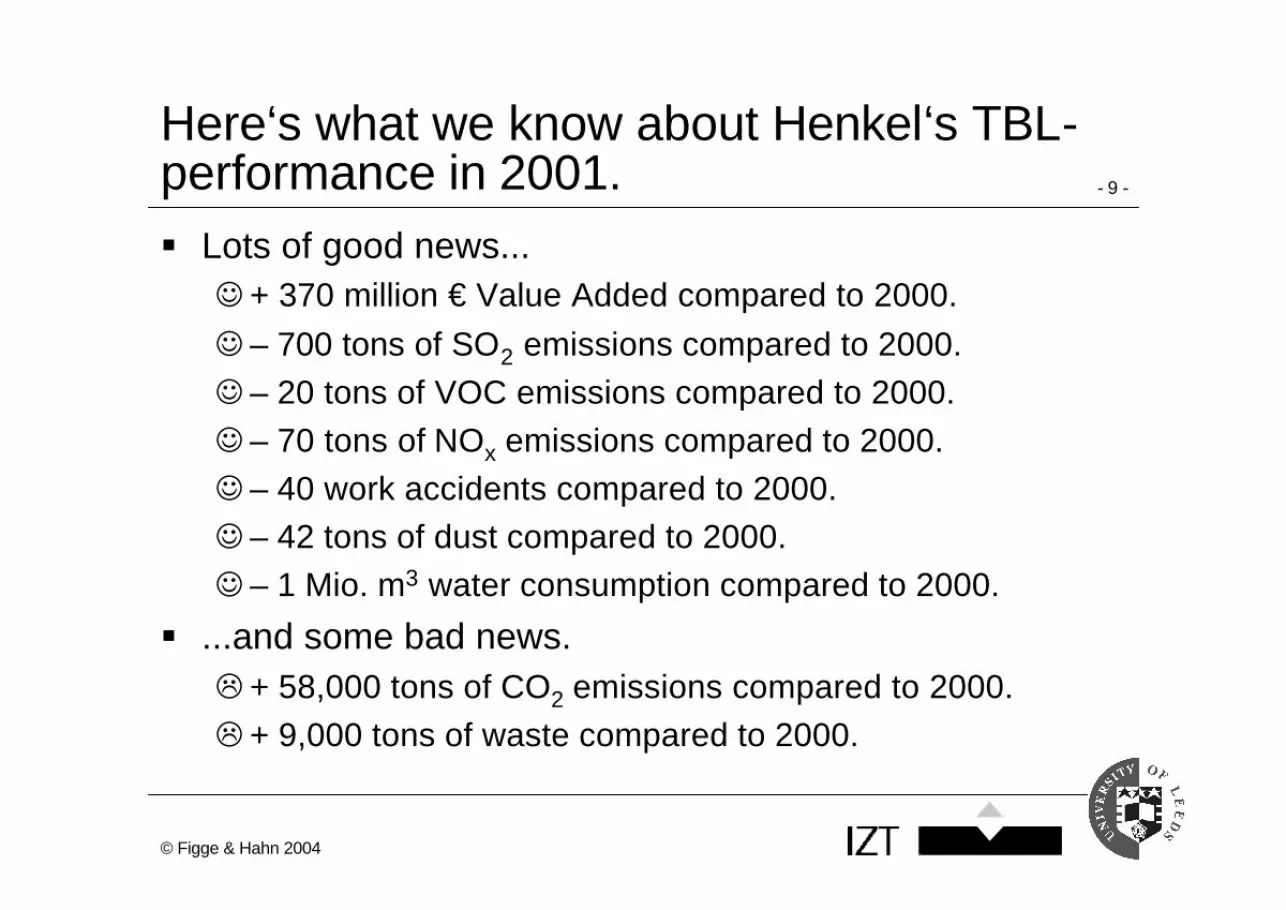
Here‘s what we know about Henkel‘s TBL-performance in 2001.§ Lots of good news...☺ + 370 million € Value Added compared to 2000.
☺ – 700 tons of SO2 emissions compared to 2000.
☺ – 20 tons of VOC emissions compared to 2000.
☺ – 70 tons of NOx emissions compared to 2000.
☺ – 40 work accidents compared to 2000.
☺ – 42 tons of dust compared to 2000.
☺ – 1 Mio. m3 water consumption compared to 2000.
§ ...and some bad news.L + 58,000 tons of CO2 emissions compared to 2000.
L + 9,000 tons of waste compared to 2000.

© Figge & Hahn 2004
- 10 -
What about eco- and social efficiency of Henkel?
Henkel in 2001
[€ per impact] Germany in 2001
[€ per impact]
CO2 equivalents - efficiency 1,720 2,380 SO2 -efficiency 856,091 3,190,307 VOC - efficiency 6,025,899 1,291,220 NOx - efficiency 1,976,403 1,302,575 Dust emissions - efficiency 7,334,500 8,395,546 Water consumption - efficiency 180,626,240 47,245,511 Waste - efficiency 13,960 55,369 Work accidents - efficiency 8,725,000 1,485,892

© Figge & Hahn 2004
- 11 -
Sustainable Value Added of Henkel in 2001
Contribution of environmental and social performance
CO2 equivalents - performance - 138 Mio. € SO2 - performance 2.233 Mio. € VOC - performance 26 Mio. € NOx - performance 91 Mio. € Dust emissions - performance 353 Mio. € Water consumption - performance 39 Mio. € Waste - performance - 498 Mio. € Work accidents - performance 59 Mio. €
Overall environmental and social performance
271 Mio. €
Contribution of economic performance Economic growth 370 Mio. €
Sustainable Value Added of Henkel in 2001
641 Mio. €

© Figge & Hahn 2004
- 12 -
Here‘s what we know about Wacker‘s TBL-performance in 2001.§ Some good news...☺ – 60 tons of VOC emissions compared to 2000.
☺ – 22 work accidents compared to 2000.
☺ – 48 tons of dust compared to 2000.
☺ – 21 Mio. m3 water consumption compared to 2000.
☺ – 7,599 tons of waste compared to 2000.
§ ... but also some bad news.L + 262,846 tons of CO2 emissions compared to 2000.
L + 16 tons of SO2 emissions compared to 2000.
L + 269 tons of NOx emissions compared to 2000.
L – 379.4 Mio. € Value Added compared to 2000

© Figge & Hahn 2004
- 13 -
Wacker‘s eco- and social-efficiencies...
Wacker in 2001
[€ per impact] Germany in 2001
[€ per impact]
CO2 - efficiency 1,597 2,380 SO2 -efficiency 2,786,105 3,190,307 VOC - efficiency 2,899,592 1,291,220 NOx - efficiency 1,725,696 1,302,575 Dust emissions - efficiency 5,834,836 8,395,546 Water consumption - efficiency 6,110,300 47,245,511 Waste - efficiency 12,859 55,369 Work accidents - efficiency 15,145,744 1,485,892
© Figge & Hahn 2004
- 14 -
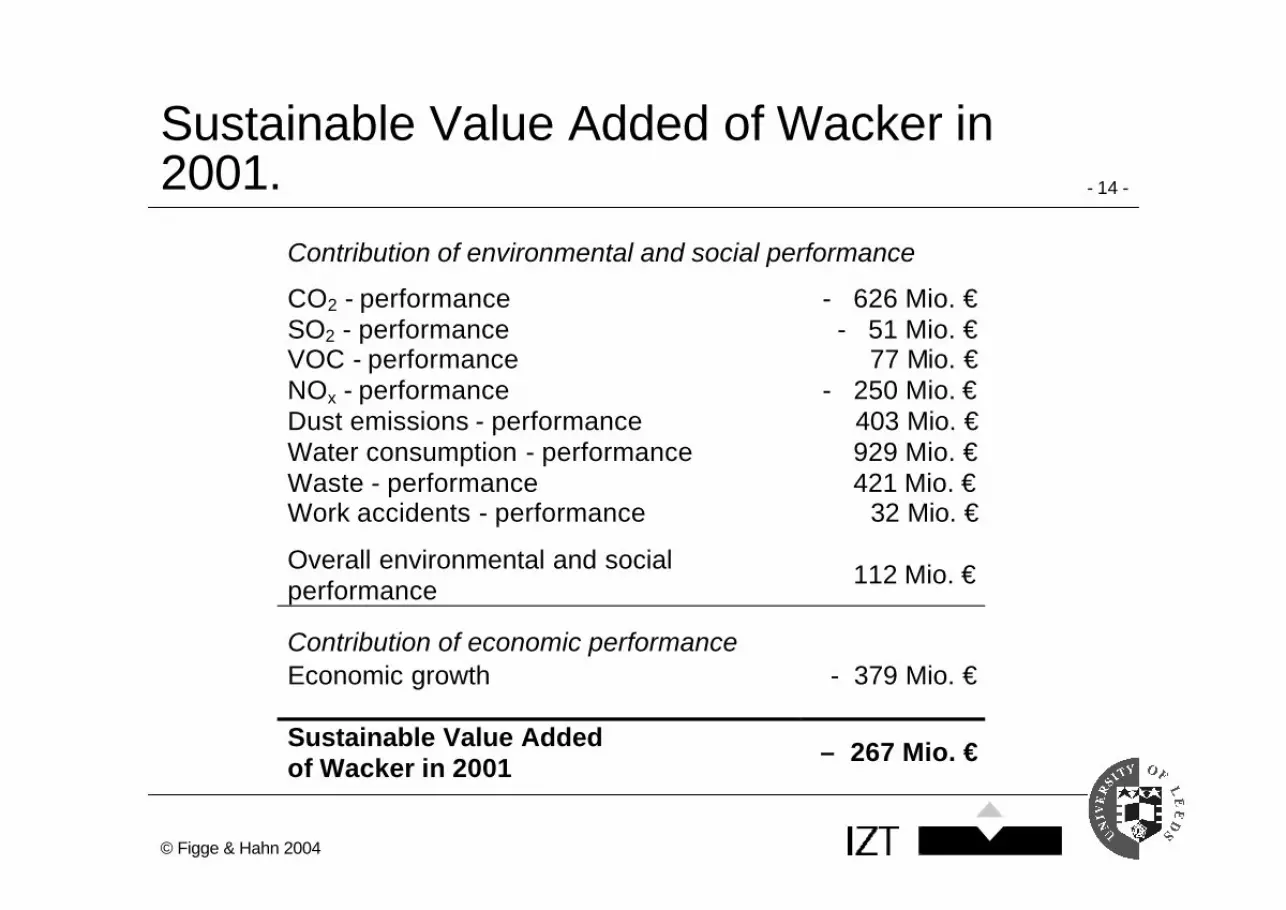
Sustainable Value Added of Wacker in 2001.
Contribution of environmental and social performance
CO2 - performance - 626 Mio. € SO2 - performance - 51 Mio. € VOC - performance 77 Mio. € NOx - performance - 250 Mio. € Dust emissions - performance 403 Mio. € Water consumption - performance 929 Mio. € Waste - performance 421 Mio. € Work accidents - performance 32 Mio. €
Overall environmental and social performance
112 Mio. €
Contribution of economic performance Economic growth - 379 Mio. €
Sustainable Value Added of Wacker in 2001
– 267 Mio. €
© Figge & Hahn 2004
- 15 -
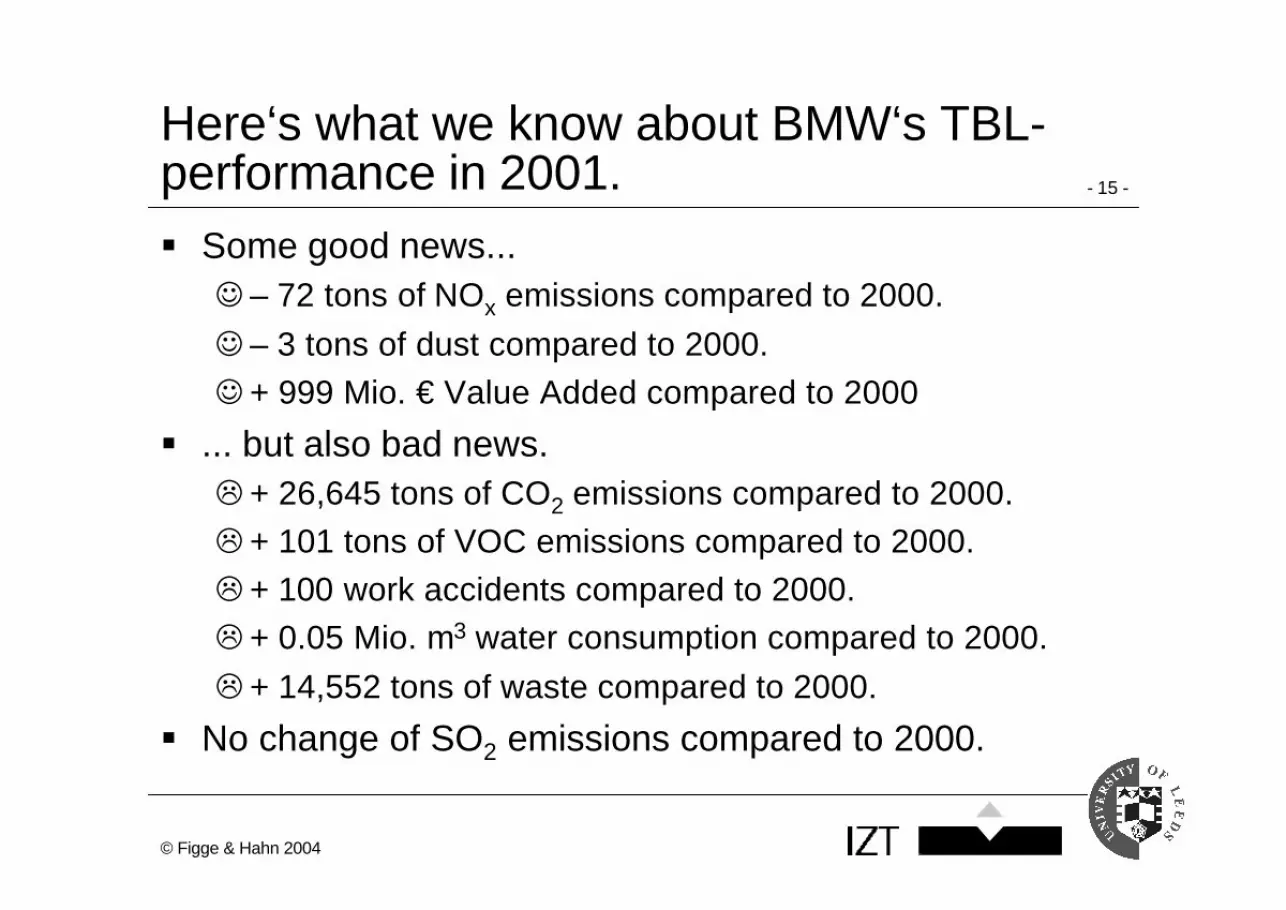
Here‘s what we know about BMW‘s TBL-performance in 2001.§ Some good news...☺ – 72 tons of NOx emissions compared to 2000.
☺ – 3 tons of dust compared to 2000.
☺ + 999 Mio. € Value Added compared to 2000
§ ... but also bad news.L + 26,645 tons of CO2 emissions compared to 2000.
L + 101 tons of VOC emissions compared to 2000.
L + 100 work accidents compared to 2000.
L + 0.05 Mio. m3 water consumption compared to 2000.
L + 14,552 tons of waste compared to 2000.
§ No change of SO2 emissions compared to 2000.

© Figge & Hahn 2004
- 16 -
BMW‘s eco- and social efficiencies...
BMW in 2001 [€ per impact]
Germany in 2001 [€ per impact]
CO2 - efficiency 12,918 2,380 SO2 - efficiency 1,932,333,333 3,190,307 VOC - efficiency 4,170,503 1,291,220 NOx - efficiency 28,698,019 1,302,575 Dust emissions - efficiency 341,000,000 8,395,546 Water consumption - efficiency 3,418,417,350 47,245,511 Waste - efficiency 37,934 55,369 Work accidents - efficiency 9,661,666 1,485,892

© Figge & Hahn 2004
- 17 -
Sustainable Value Added of BMW in 2001.
Contribution of environmental and social performance
CO2 - performance - 63 Mio. € SO2 - performance 0 Mio. € VOC - performance - 130 Mio. € NOx - performance 94 Mio. € Dust emissions - performance 25 Mio. € Water consumption - performance - 2 Mio. € Waste - performance - 806 Mio. € Work accidents - performance - 149 Mio. €
Overall environmental and social performance
- 129 Mio. €
Contribution of economic performance Economic growth 999 Mio. €
Sustainable Value Added of BMW in 2001
870 Mio. €

© Figge & Hahn 2004
- 18 -
But there is Kyoto!
§ Constant resource consumption may not be sufficient to move towards more sustainability.
§ Germany: CO2-reduction by 21% compared to 1990 until 2008 (Burden sharing within the EU)
§ Target from 2001 on: Yearly reduction of CO2-emissions by 1.2%
§ Sustainable Value Added in 2001 of the three companies including this reduction target:– Henkel: 632 Mio. €
– Wacker: – 269 Mio. €
– BMW: 867 Mio. €

© Figge & Hahn 2004
- 19 -
Conclusions
§ Sustainable Value Added– expresses a company’s Triple Bottom Line performance in
€ terms.
– shows a company’s contribution to making Germany more sustainable.
– leaves overall environmental and social burden constant.
– is based on data which is publicly available.
– does not require external cost figures.
– is able to include reduction targets.
– represents a paradigmatic shift toward an accounting for sustainable value.

© Figge & Hahn 2004
- 20 -
More information
Dr. Frank Figge
School of the Environment
University of Leeds
Leeds LS2 9JT
United Kingdom
Tel: +44-113-343 72 47
Fax: +44-113-343 67 16
E-Mail: [email protected]
Tobias HahnInstitute for Futures Studies and
Technology Assessment (IZT)
Schopenhauerstr. 26
D-14129 Berlin
Tel: +49-30-803088-24
Fax: +49-30-803088-88
E-Mail: [email protected]
Suggested Reading:Figge, F. & Hahn, T. (2004): "Sustainable Value Added. Measuring Corporate Contributionsto Sustainability Beyond Eco-Efficiency", Ecological Economics, 48(2), 173-187.


