Embed Size (px)
Citation preview
Supported by:
The�Bharat�Microfinance�Report�2017The�Bharat�Microfinance�Report�2017
Data Acquisition Analytics& Report Generation by
Ardhendu Nandi
Shyamasree Nandan
Sunny Koshy
A 1- 248, 3rd Floor, Safdarjung Enclave New Delhi – 110029, India
Tel: + 91- 11-47174400, Fax: + 91-11-47174405E-mail: [email protected], [email protected]
The Bharat Microfinance Report 2017
© Copyright reserved Sa-Dhan2017
Developed & Published by:Sa-Dhan
A 1- 248, 3rd Floor, Safdarjung Enclave New Delhi – 110029, India
Tel: + 91- 11-47174400, Fax: + 91-11-47174405E-mail: [email protected], [email protected]
Cover Design & Printed by:Elegant Enterprises
8860127811, [email protected]
Disclaimer:The views expressed in this publication do not necessarily reflect the opinions/views of any of the
insitutions referred to and they are not to be held responsible for the opinions/views in this report.
Preface
The Indian Microfinance Sector has witnessed a phenomenal growth over the past 18 years. The number of institutions providing microfinance services has gone up from a few to several hundreds. The quantum of credit
made available to the poor and financially excluded clients has reached ̀ 46,842 crore and number of clients benefitted crossed 29 million as of March 2017 without the data of 6 large sized MFIs who converted to Small Finance Banks before April 2017. The SHG bank linkage programme has equally grown to touch the lives of individuals through SHGs with an outstanding loan portfolio of `61,581 crores.
The Government of India and the Reserve Bank of India have created conducive policy and regulatory framework for Microfinance Institutions (MFIs) to operate in the country. This has provided necessary legitimacy and impetus to the sector. MFIs in general comply with the regulations, take care of client protection issues, adhere to the Industry Code of Conduct. These factors go a long way in infusing confidence among all the stakeholders. This year the sector had to face certain issues when two denominations of currency notes were demonetized. This was coupled with efforts in certain regions to put spokes in the recovery efforts of the institutions. Though in the short term these developments have indeed affected the sector, we have displayed enough resilience to carry on with our activities to achieve the goal of financial inclusion.
In this context, I think there are three areas within our domain deserving our special attention. One is the need for articulating the fact that microfinance is a strategic part of the financial inclusion agenda of the government and that of the central bank. The second is the criticality of re-demonstrating our collective intention to help the poor and the unbanked populace by way of having the right mission, social performance measures and client protection processes. The third area is in projecting the fact that microfinance institutions are sustainable financial institutions and they continue to be the investible destination for the bankers and the investors.
In order to articulate these positions, we need empirical data. This Bharat Microfinance Report has been designed to provide comprehensive information and newer perspectives on the above three areas. Primary data received from 168 MFIs and 4 Small Finance Banks who represent around 96 percent of the microfinance sector in India and analysis thereon forms the basis for this report.
Sa-Dhan, as the leading association of community development finance institutions in India, has been publishing The Bharat Microfinance Report for the past fourteen years. This year 172 MFIs/SFBs reported data, including 62 non-members of Sa-Dhan. We thank them for reposing confidence in us and valuing transparency through data reporting.
This year the substantial part of the work relating to the report has been shouldered by Mr. Ardhendu Nandi, right from data collection, consolidation, analysis to report writing in which he was ably supported by Ms. Shyamasree Nandan and Mr. Sunny Koshy.
Mr. Somesh Dayal and Mr. Saibal Paul provided a broad support to the report, especially in sourcing useful inputs. Ms. Sangeeta Naik and Mr. Chandan Thakur also supported by giving write-ups for box items.
Special thanks are due to CRIF High Mark, Prime M2i Consulting Pvt. Ltd, Smart Campaign, Gram Vaani, National Payment Corporation of India, Bajaj Allianz Life Insurance Company Ltd, Satya MicroCapital Ltd for inputs in bringing out this report.
We are grateful to overall patronage from NABARD for generously sponsoring the publication of The Bharat Microfinance Report, 2017 with financial assistance from Research and Development Fund of National Bank for Agriculture and Rural Development (NABARD) and dissemination of the report widely among all stakeholders. We are also thankful to SIDBI, World Bank Group (IFC), DFID, RBI and Government agencies for their support to the activities and initiatives of Sa-Dhan.
We hope this report would be extremely useful to you as a reference and data source. We welcome suggestions for further enhancing its coverage and utility.
P. SatishExecutive Director14 September, 2017
iii
The Bharat Microfinance Report 2017iv
Contents
Preface iii
List of Boxes vi
List of Figures vii
List of Tables ix
List of Abbreviations x
Glossary xiii
Executive Summary xv
Chapter 1: Inclusive Financial Sector: Progress with Continuity 1
1.1 Introduction 1
1.2 Demonetization and its aftermath 1
1.3 Microfinance: The Continuing Relevance 3
1.4 Quarter Century of SBLP 4
1.5 Furthering Financial Inclusion 4
1.6 DBT and Social Security 5
Chapter 2: Outreach and Loan Portfolio 7
2.1 Geographical Spread of Microfinance 6
2.2 Branch Network 8
2.3 Client Outreach 11
2.3.1 Regional Outreach of MFIs 11
2.3.2 State-wise Client Outreach 12
2.3.3 Rural – Urban Share of MFIs Borrowers 13
2.3.4 Outreach to Special Segment of Borrowers (Women, SC/ST, and Minorities) 13
2.3.5 Leading MFIs in Client Outreach 14
2.3.6 Client outreach distribution across Players 15
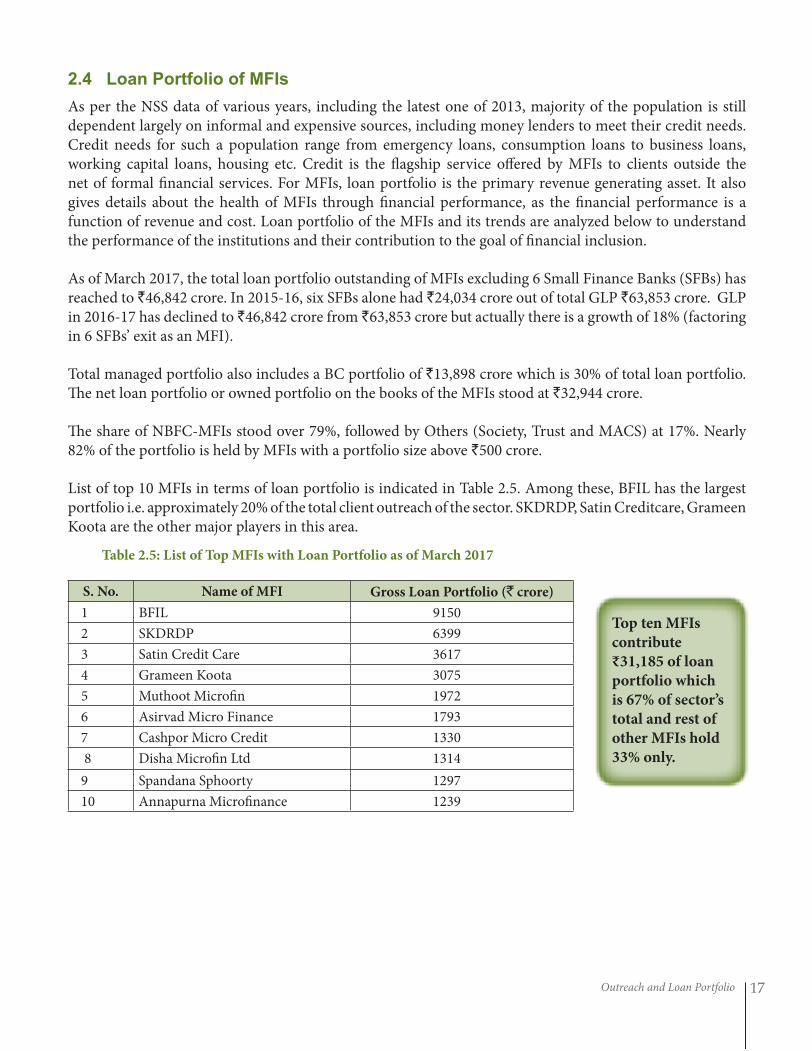
2.4 Loan Portfolio of MFIs 17
2.4.1 Rural – Urban Share of Gross Loan Portfolio 18
2.4.2 Regional Spread of Loan Portfolio 18
2.4.3 Loan Portfolio Across States / UTs 19
2.4.4 Managed Portfolio 21
2.4.5 Business Correspondent (BC) Portfolio 21
2.4.6 Gross Loan Portfolio distribution across players 22
2.4.7 Loan Outstanding per Borrower 22
2.4.8 Trends in Outreach and Outstanding Portfolio 23
2.5 Loan Disbursement 23
2.5.1 Loan Disbursement - States/UTs and Regional Pattern 24
2.5.2 Rural – Urban Share of No. of Loans Disbursed 26
2.5.3 Loan Amount Disbursed 27
2.5.4 Purpose of Loan 27
2.5.4.1 Income Generation Loans 28
2.5.4.2 Non- Income Generation Loans 28
Chapter 3: Operational and Financial Aspects 31
Section I: Workforce, Productivity and Portfolio Quality 31 3.1.1 Workforce in MFIs 31 3.1.2 Staff Productivity 32 3.1.3 Portfolio Quality 34
v
Section II: Cost & Revenue 35 3.2.1 Expenditure Analysis 35 3.2.2 Income Analysis 38 3.2.3 Margin 40 3.2.4 Yield, Cost and Margin: Performance Across MFI size 40
Section III: Surplus, Sufficiency and Profitability 41 3.3.1 Surplus 41 3.3.2 Operational Self-Sufficiency (OSS) 41 3.3.3 Profitability Ratios 42 Section IV: Balance Sheet Distribution and Capital Structure 44 3.4.1 MFI Assets 44 3.4.2 Pattern of Portfolio Financing 45 3.4.2.i Net Owned Fund (NOF) 45 3.4.2.ii Debt Financing 46 3.4.3 Capital (Net Owned Fund) to Total Asset Ratio 58 3.4.4 Leverage / Debt – Equity Ratio 58
Chapter 4: Credit Plus Activities 59 4.1 Micro Insurance 60 4.2 Micro Pension 63 4.2.1 NPS: Swavalamban 63 4.2.2 Atal Pension Yojana 64 4.2.3 Composition of NPS Subscribers 65 4.3 Pradhan Mantri Jan Dhan Yojana 66 4.4 Other Development Services 67
Chapter 5: SHG Movement and its Role in Financial Inclusion 735.1 Self Help Group Bank Linkage Programme (SBLP) 73
5.1.1 Savings Performance of SBLP 74
5.1.2 No of SHGs Availing Bank Loan during 2016-17 75
5.1.3 Loan Outstanding with SHGs 78
5.2 Aajeevika – National Rural Livelihoods Mission (NRLM) 81
Chapter 6: BC Model and Technology 856.1 Strengthening the BC Model 856.2 Progress and Challenges 866.3 MFIs as Business Correspondents 87
Annexures 90
State wise Presence of Different MFIs 90
Distrct wise Presence of Different MFIs 95
Distribution of Data Contributing MFIs for this Report 111
Profile of MFIs Which Contributed Data for this Report 113
The Bharat Microfinance Report 2017
List of Boxes
Chapter1 Inclusive Financial Sector: Progress with Continuity
Box 1.1 Digitization of Microfinance Payments 2
Chapter 2 Outreach and Loan Portfolio
Box 2.1 The year it was for Microfinance 10
Box 2.2 Limited Liability Group (LLG) - A New Way of Doing Microfinance 16
Box 2.3 Self Assessment and Monitoring Tool 30
Chapter 4 Credit Plus Activities
Box 4.1 Microfinance and Affordable Insurance Access - A path to achieve Sustainable 61 Development Goals
Box 4.2 Client Engagement and Grievance Redressal Mechanism using IVR Technology 64
Box 4.3 Handholding and Capacity Building support for Small MFIs 83
Chapter 5 SHG Movement And Its Role In Financial Inclusion
Box 5.1 Self Help Promoting Institutions (SHPIs): Efficiency, Cost Structure & Challenges 83
Chapter 6 BC Model And Technology
Box 6.1 National Strategy for Financial Inclusion 87
vi
List of Figures
Chapter 2 Outreach and Loan Portfolio
Figure 2.1 Top 10 MFIs Operating in Number of Indian States/Union Territories 7
Figure 2.2 Top 10 MFIs Operating in Number of Indian Districts 7
Figure 2.3 MFI Branch Network – Yearly Trend and Category –wise Breakup 9
Figure 2.4 Top 10 MFIs in Terms of Branch Network 9
Figure 2.5 Outreach to Borrowers: Yearly Trend and Category – wise Breakup for 2016-17 11
Figure 2.6 Regional break up of Client Outreach 11
Figure 2.7 Trends in Rural - Urban Share of MFI Borrowers 13
Figure 2.8 List of Top 10 MFIs with Client Outreach as of March 2017 14
Figure 2.9 Player wise break up of Client Outreach as of March 2017 16
Figure 2.10 Gross Loan Portfolio – Yearly Trend and Category–wise Breakup for 2016-17 18
Figure 2.11 Percentage of Rural - Urban Share of Gross Loan Portfolio 18
Figure 2.12 Region wise Loan Portfolio 19
Figure 2.13 Managed Loan Portfolio – Yearly Trend and Category–wise Breakup for 2016-17 21
Figure 2.14 BC Loan Portfolio and Category–wise Breakup for 2016-17 22
Figure 2.15 Player wise break up of Loan Portfolio as of March 2017 22
Figure 2.16 Loan Outstanding per Borrower yearly trend and across regions for the FY 2016-17 23
Figure 2.17 Growth Fluctuations in Outreach and Loan Outstanding over the Years 23
Figure 2.18 Loan Disbursement over the years 24
Figure 2.19 Top 10 MFIs in Loan Disbursement during 2016-17 24
Figure 2.20 Regional Pattern of Loan Disbursement 26
Figure 2.21 Percentage of Rural - Urban Share of No. of Loans Disbursed 26
Figure 2.22 Share of income generation loans and non income generation loans 27
Figure 2.23 Share of MFIs Income Generation Loans under Different Sub-sectors as of March 2017 28
Figure 2.24 Share of MFIs Non-Income Generation Loans under Different Sub-sectors as of March 2017 28
Chapter 3.1 Workforce, Productivity And Portfolio Quality
Figure 3.1.1 No. of MFI Staff - Yearly Trend and MFI-Category-wise Break-up 31
Figure 3.1.2 MFI Field Staff vs Other Staff Distribution – 2017 & 2016 31
Figure 3.1.3 New Staff Recruited by the MFIs over the years 32
Figure 3.1.4 Distribution of MFIs based on clients served per Staff & per Credit Officer 33
Figure 3.1.5 ABCO Across MFIs 33
Figure 3.1.6 Distribution of MFIs Based on Loan Portfolio per Credit Officer 34
Figure 3.1.7 MFI Loan Portfolio at Risk (PAR) 34
Figure 3.1.8 Distribution of MFIs Based on PAR 34
Chapter 3.2 Cost and Revenue
Figure 3.2.1 Break up of expenses by Indian MFIs 35
Figure 3.2.2 Break up of expenses by Indian MFIs based on portfolio size and legal form 36
Figure 3.2.3 Operating Expenditure Ratio across MFIs 36
Figure 3.2.4 Finance Cost Ratio across MFI Categories 37
Figure 3.2.5 Trends of OER and FCR 38
Figure 3.2.6 Break-up of Income 38
Figure 3.2.7 Yield Trend of MFIs 39
Figure 3.2.8 Yield on Portfolio across MFIs 39
Figure 3.2.9 Yield, Cost and Margin of MFIs –size wise 40
vii
The Bharat Microfinance Report 2017
Chapter 3.3 Surplus, Sufficiency and Profitability
Figure 3.3.1 OSS Across MFIs 41
Figure 3.3.2 OSS based on average loan size 42
Figure 3.3.3 OSS based on yield category 42
Figure 3.3.4 OSS based on OER of MFIs 42
Figure 3.3.5 Return on Asset (ROA) and Return on Equity (ROE) across MFI types 43
Figure 3.3.6 Return on Asset (ROA) and Return on Equity (ROE) of MFI-Size wise 43
Figure 3.4.1 MFI Total Assets- Yearly Trend 44
Figure 3.4.2 Composition of Total Assets of MFIs 44
Figure 3.4.3 MFI Equity Outstanding - Yearly Trend and MFI- Category- wise Break-up of 2017 Figure 45
Figure 3.4.4 Fresh Equity Raised by MFIs and MFI-Category-wise Break-up 46
Figure 3.4.5 Top 10 MFIs in terms of Equity Raised 46
Figure 3.4.6 Sources of funding based on types of instruments 47
Figure 3.4.7 Sources of funding based on Institution types 47
Figure 3.4.8 Outstanding Borrowing – Yearly Trend and MFI-Category wise Break-up of 2017 Figure 48
Figure 3.4.9 Fund Received during the year – Yearly Trend and MFI-Category wise Break-up of 2017 Figure 48
Figure 3.4.10 Source wise Share of Loans lent among Different Legal Forms of MFIs during 2016-17 49
Figure 3.4.11 Capital to Total Asset Ratio 58
Figure 3.4.12 Debt - Equity Ratio Trend and Break–up of 2017 Figure across MFI –Categories 58
Chapter 3.4 Balance Sheet Distribution and Capital Structure
Figure 4.1 Composition of NPS Subscribers 65
Chapter 5 SHG Movement and its Role in Financial Inclusion
Figure 5.1 Historical Trend in Credit Linkage and Bank Loan Disbursed 73
Figure 5.2 All India Trend in SHG Savings Amount Held in the Indian Banking System 74
Figure 5.3 All India Trend in Average per SHG Savings Held in the Banking System 74
Figure 5.4 Savings of SHGs with Banks as on 31 March 2017 75
Figure 5.5 No. of SHGs availed Bank Loan during 2016-17 from the Banking System 75
Figure 5.6 Top 10 Banks in terms of Savings 76
Figure 5.7 All India Trend in Bank Loan Amount Disbursed to SHGs 76
Figure 5.8 Agency-wise loan disbursement – No. of SHGs and Loan Amount disbursed 77
Figure 5.9 Top 10 Banks in terms of Disbursement 77
Figure 5.10 All India Trend in Average Bank Loan Amount Disbursed per SHG 78
Figure 5.11 All India Trend in SHG Loan Outstanding in the Books of Banking System 78
Figure 5.12 All India Trend in Average per SHG Loan Outstanding in the Banking System 79
Figure 5.13 Agency-wise Bank Loan outstanding against SHGs as on 31 March 2017 79
Figure 5.14 Non Performing Asset Per Cent of SHG Loans with Banks 80
Figure 5.15 NPAs of Banks against SHGs Loan Outstanding 80
Figure 5.16 SHGs with Savings-Linked to Banks under NRLM 82
Figure 5.17 SHGs having Credit-Linked to Banks under NRLM 82
Figure 5.18 SHGs having Credit Outstanding to Banks under NRLM 82
viii
List of Tables
Chapter 2 Outreach and Loan Portfolio
Table 2.1 No. of MFIs in Indian States/UTs 6
Table 2.2 No. of MFIs in Indian States/UTs and No. of Districts with MFI Operation 8
Table 2.3 Outreach (in lakh) of MFIs across States/UTs – 2016 & 2017 (Decreasing Order) 12
Table 2.4 Composition of Borrowers – Category wise 14
Table 2.5 List of Top MFIs with Loan Portfolio as of March 2017 17
Table 2.6 Loan Portfolio Outstanding across States/UTs – 2016 & 2017 (Decreasing Order) 19
Table 2.7 Loan Disbursement across States/UTs – 2017 & 2016 (Decreasing Order) 25
Table 2.8 Amount disbursed during the year 2017 and 2016 27
Chapter 3.1 Workforce, Productivity And Portfolio Quality
Table 3.1.1 Yearly trend of Total Staff vs Women Staff 32
Table 3.1.2 Staff Turn-over among MFIs during 2016-17 32
Chapter 3.4 Balance Sheet Distribution and Capital Structure
Table 3.4.1 List of lenders reported among Top 10 Lenders of the individual reporting MFIs 49
(in terms of Outstanding as of March 2017)
Table 3.4.2 MFI wise Loan Outstanding (based on top 10 Lenders data) to Lenders 52
Table 3.4.3 Lender wise Loan Outstanding (based on top 10 Lenders data) to MFIs 55
Chapter 4 Credit Plus Activities
Table 4.1 MFIs involved in Micro Insurance- Health 62
Table 4.2 MFIs involved in Micro Insurance - Non-health 62
Table 4.3 MFIs involved in Micro Pension 66
Table 4.4 Development Services of Reporting MFIs 67
Table 4.5 MFIs and Livelihoods Intervention 67
Table 4.6 MFIs and General Education Intervention 69
Table 4.7 MFIs and Preventive Healthcare Initiatives 70
Chapter 6 BC Model And Technology
Table 6.1 Financial Inclusion Plan-Summary Progress of all Banks including RRBs 86
Table 6.2 MFIs as Banking Correspondents – No. of saving clients and amount saved 87
Table 6.3 MFIs as Banking Correspondents – No. of Loan clients, amount disbursed and amount outstanding 88
ix
The Bharat Microfinance Report 2017
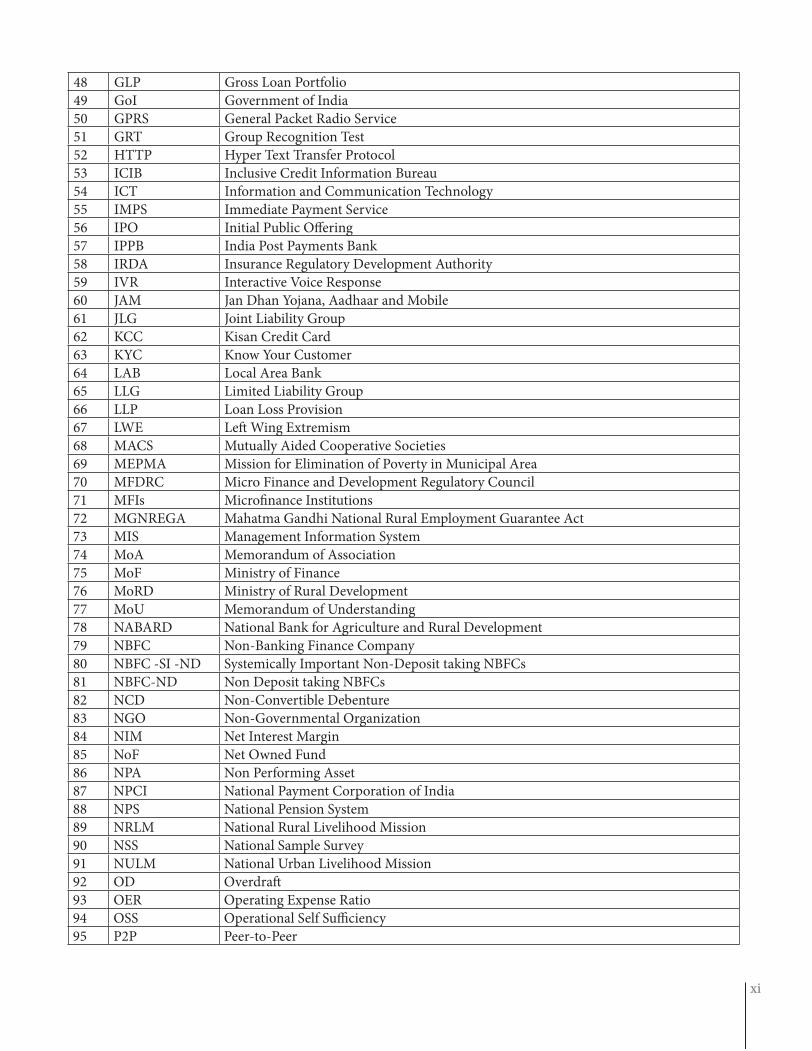
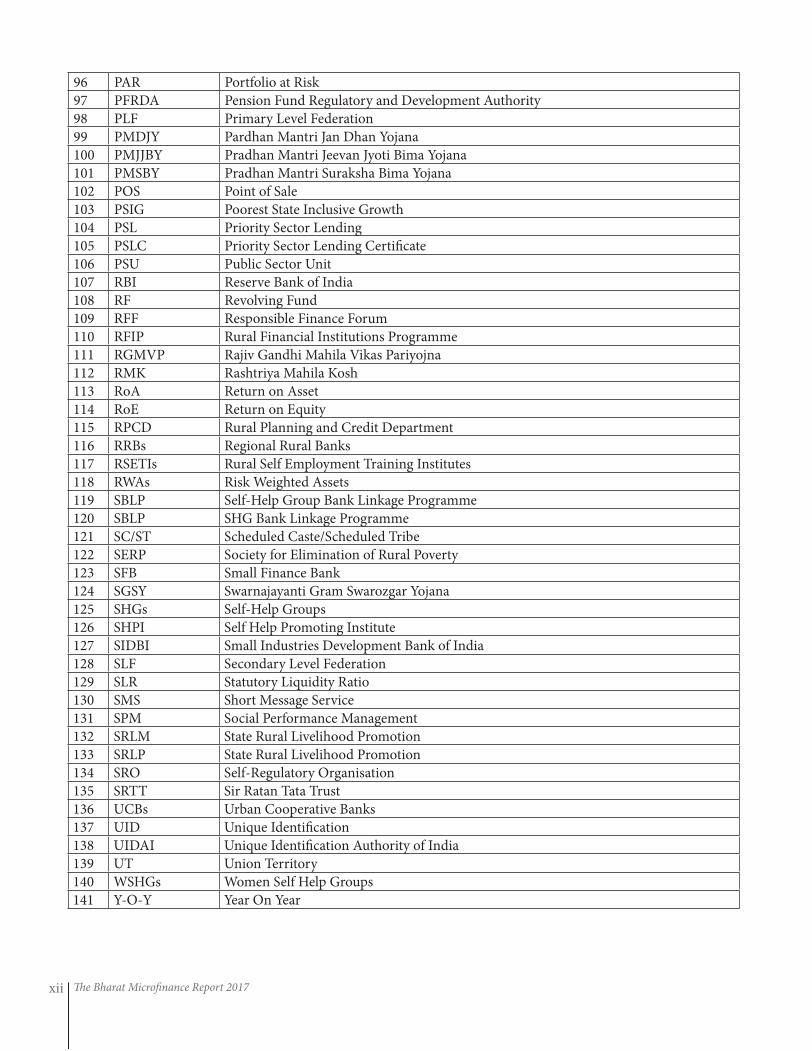
List of Abbreviations
x
1 ABCO Active Borrower per Credit Officer
2 AEPS Aadhaar enabled payment systems
3 ANBC Adjusted Net Bank Credit
4 AP Andhra Pradesh
5 APBS Aadhaar Payment Bridge System
6 APY Atal Pension Yojana
7 ATM Automatic Teller Machines
8 AUM Assets Under Management
9 BC Business Correspondent
10 BCFI Business Correspondent Federation of India
11 BCNM Business Correspondent Network Manager
12 BF Business Facilitator
13 BPL Below Poverty Line
14 BSBDA Basic Savings Bank Deposit Account
15 CAR Capital Adequacy Ratio
16 CBEO Community Based Economic Organization
17 CDR Corporate Debt Restructuring
18 CEO Chief Executive Officer
19 CGT Compulsory Group Training
20 CIB Credit Information Bureau
21 CIF Community Investment Fund
22 CmF Centre for Micro Finance
23 CO Credit Officer
24 CoC Code of Conduct
25 COCA Code of Conduct Assessment
26 CPPs Client Protection Principles
27 CRR Cash Reserve Ratio
28 CSO Customer Service Officer
29 CSP Customer Service Point
30 DBT Days Beyond Terms
31 DBT direct benefit transfers
32 DNBS Department of Non-Banking Supervision
33 DOTs Directly Observed Treatment, Short Course
34 DPD Days Past Due
35 DRDA District Rural Development Agency
36 DWCD Department of Women and Child Development
37 ECB External Commercial Borrowing
38 FCR Finance Cost Ratio
39 FDI Foreign Direct Investment
40 FER Finance Expense Ratio
41 FI Financial Institution
42 FIIs Foreign Institutional Investors
43 FLCs Financial Literacy Centers
44 FPIs Foreign Portfolio Investors
45 GBA Gramin Bank of Aryavart
46 GCC General Credit Card
47 GIC General Insurance Corporation of India
xi
48 GLP Gross Loan Portfolio
49 GoI Government of India
50 GPRS General Packet Radio Service
51 GRT Group Recognition Test
52 HTTP Hyper Text Transfer Protocol
53 ICIB Inclusive Credit Information Bureau
54 ICT Information and Communication Technology
55 IMPS Immediate Payment Service
56 IPO Initial Public Offering
57 IPPB India Post Payments Bank
58 IRDA Insurance Regulatory Development Authority
59 IVR Interactive Voice Response
60 JAM Jan Dhan Yojana, Aadhaar and Mobile
61 JLG Joint Liability Group
62 KCC Kisan Credit Card
63 KYC Know Your Customer
64 LAB Local Area Bank
65 LLG Limited Liability Group
66 LLP Loan Loss Provision
67 LWE Left Wing Extremism
68 MACS Mutually Aided Cooperative Societies
69 MEPMA Mission for Elimination of Poverty in Municipal Area
70 MFDRC Micro Finance and Development Regulatory Council
71 MFIs Microfinance Institutions
72 MGNREGA Mahatma Gandhi National Rural Employment Guarantee Act
73 MIS Management Information System
74 MoA Memorandum of Association
75 MoF Ministry of Finance
76 MoRD Ministry of Rural Development
77 MoU Memorandum of Understanding
78 NABARD National Bank for Agriculture and Rural Development
79 NBFC Non-Banking Finance Company
80 NBFC -SI -ND Systemically Important Non-Deposit taking NBFCs
81 NBFC-ND Non Deposit taking NBFCs
82 NCD Non-Convertible Debenture
83 NGO Non-Governmental Organization
84 NIM Net Interest Margin
85 NoF Net Owned Fund
86 NPA Non Performing Asset
87 NPCI National Payment Corporation of India
88 NPS National Pension System
89 NRLM National Rural Livelihood Mission
90 NSS National Sample Survey
91 NULM National Urban Livelihood Mission
92 OD Overdraft
93 OER Operating Expense Ratio
94 OSS Operational Self Sufficiency
95 P2P Peer-to-Peer
The Bharat Microfinance Report 2017
96 PAR Portfolio at Risk
97 PFRDA Pension Fund Regulatory and Development Authority
98 PLF Primary Level Federation
99 PMDJY Pardhan Mantri Jan Dhan Yojana
100 PMJJBY Pradhan Mantri Jeevan Jyoti Bima Yojana
101 PMSBY Pradhan Mantri Suraksha Bima Yojana
102 POS Point of Sale
103 PSIG Poorest State Inclusive Growth
104 PSL Priority Sector Lending
105 PSLC Priority Sector Lending Certificate
106 PSU Public Sector Unit
107 RBI Reserve Bank of India
108 RF Revolving Fund
109 RFF Responsible Finance Forum
110 RFIP Rural Financial Institutions Programme
111 RGMVP Rajiv Gandhi Mahila Vikas Pariyojna
112 RMK Rashtriya Mahila Kosh
113 RoA Return on Asset
114 RoE Return on Equity
115 RPCD Rural Planning and Credit Department
116 RRBs Regional Rural Banks
117 RSETIs Rural Self Employment Training Institutes
118 RWAs Risk Weighted Assets
119 SBLP Self-Help Group Bank Linkage Programme
120 SBLP SHG Bank Linkage Programme
121 SC/ST Scheduled Caste/Scheduled Tribe
122 SERP Society for Elimination of Rural Poverty
123 SFB Small Finance Bank
124 SGSY Swarnajayanti Gram Swarozgar Yojana
125 SHGs Self-Help Groups
126 SHPI Self Help Promoting Institute
127 SIDBI Small Industries Development Bank of India
128 SLF Secondary Level Federation
129 SLR Statutory Liquidity Ratio
130 SMS Short Message Service
131 SPM Social Performance Management
132 SRLM State Rural Livelihood Promotion
133 SRLP State Rural Livelihood Promotion
134 SRO Self-Regulatory Organisation
135 SRTT Sir Ratan Tata Trust
136 UCBs Urban Cooperative Banks
137 UID Unique Identification
138 UIDAI Unique Identification Authority of India
139 UT Union Territory
140 WSHGs Women Self Help Groups
141 Y-O-Y Year On Year
xii
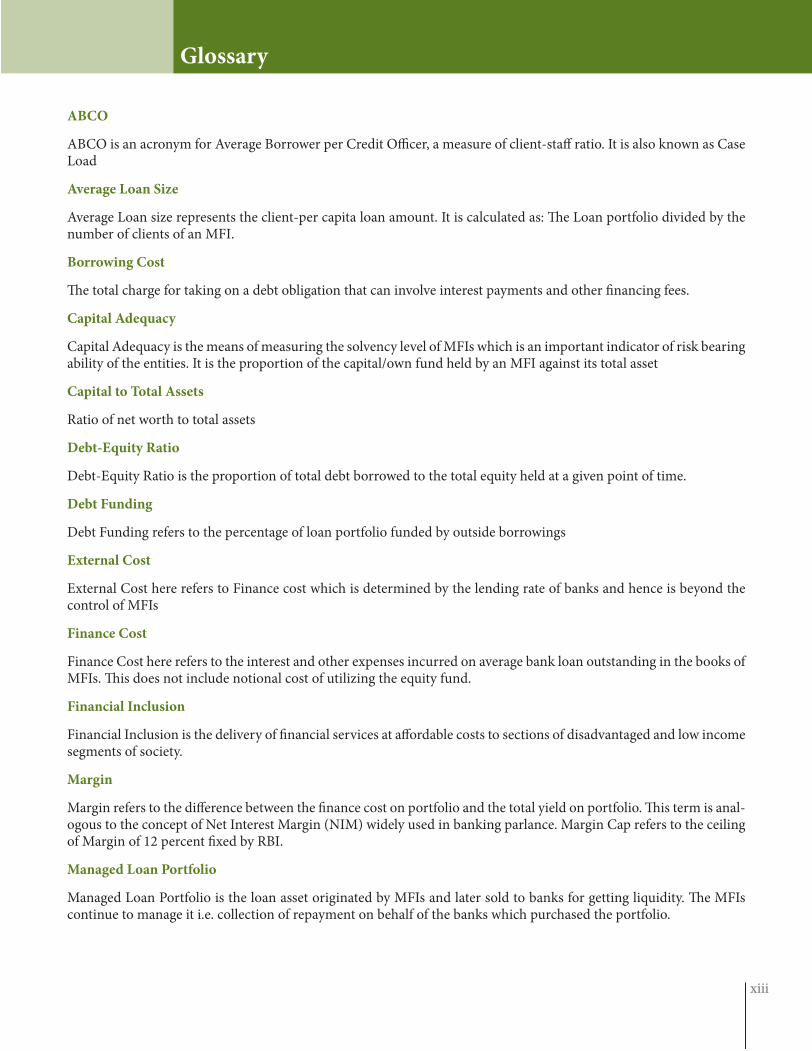
Glossary
ABCO
ABCO is an acronym for Average Borrower per Credit Officer, a measure of client-staff ratio. It is also known as Case Load
Average Loan Size
Average Loan size represents the client-per capita loan amount. It is calculated as: The Loan portfolio divided by the number of clients of an MFI.
Borrowing Cost
The total charge for taking on a debt obligation that can involve interest payments and other financing fees.
Capital Adequacy
Capital Adequacy is the means of measuring the solvency level of MFIs which is an important indicator of risk bearing ability of the entities. It is the proportion of the capital/own fund held by an MFI against its total asset
Capital to Total Assets
Ratio of net worth to total assets
Debt-Equity Ratio
Debt-Equity Ratio is the proportion of total debt borrowed to the total equity held at a given point of time.
Debt Funding
Debt Funding refers to the percentage of loan portfolio funded by outside borrowings
External Cost
External Cost here refers to Finance cost which is determined by the lending rate of banks and hence is beyond the control of MFIs
Finance Cost
Finance Cost here refers to the interest and other expenses incurred on average bank loan outstanding in the books of MFIs. This does not include notional cost of utilizing the equity fund.
Financial Inclusion
Financial Inclusion is the delivery of financial services at affordable costs to sections of disadvantaged and low income segments of society.
Margin
Margin refers to the difference between the finance cost on portfolio and the total yield on portfolio. This term is anal-ogous to the concept of Net Interest Margin (NIM) widely used in banking parlance. Margin Cap refers to the ceiling of Margin of 12 percent fixed by RBI.
Managed Loan Portfolio
Managed Loan Portfolio is the loan asset originated by MFIs and later sold to banks for getting liquidity. The MFIs continue to manage it i.e. collection of repayment on behalf of the banks which purchased the portfolio.
xiii
The Bharat Microfinance Report 2017
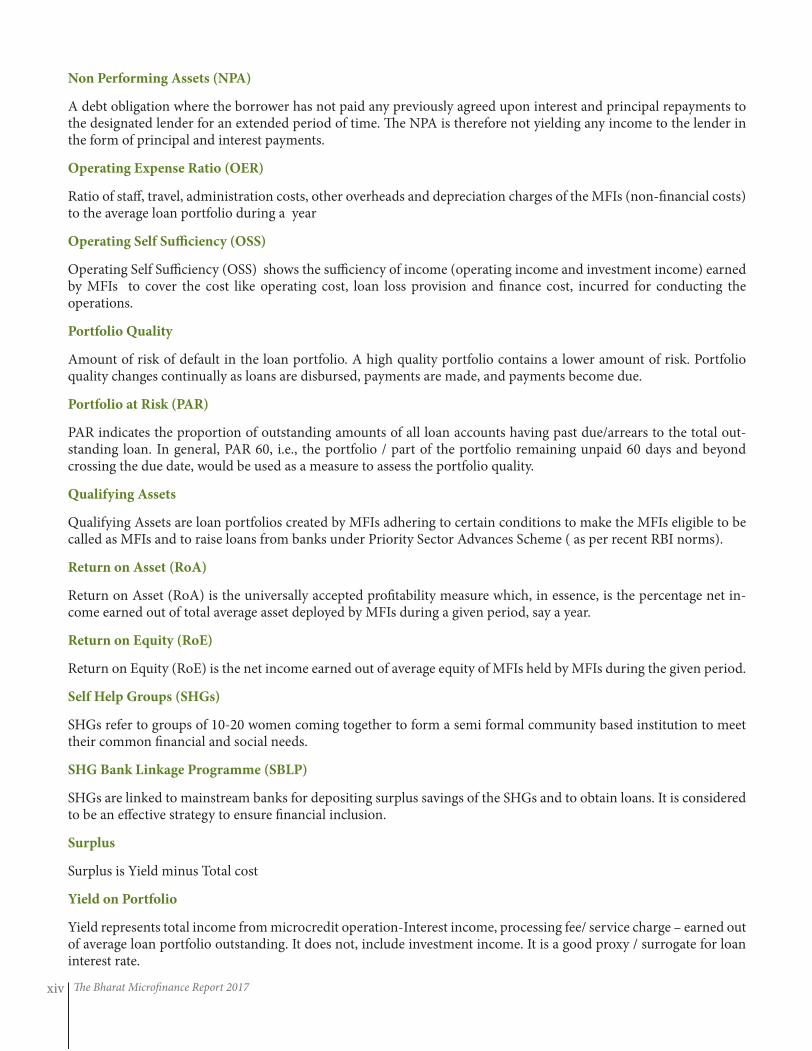
Non Performing Assets (NPA)
A debt obligation where the borrower has not paid any previously agreed upon interest and principal repayments to the designated lender for an extended period of time. The NPA is therefore not yielding any income to the lender in the form of principal and interest payments.
Operating Expense Ratio (OER)
Ratio of staff, travel, administration costs, other overheads and depreciation charges of the MFIs (non-financial costs) to the average loan portfolio during a year
Operating Self Sufficiency (OSS)
Operating Self Sufficiency (OSS) shows the sufficiency of income (operating income and investment income) earned by MFIs to cover the cost like operating cost, loan loss provision and finance cost, incurred for conducting the operations.
Portfolio Quality
Amount of risk of default in the loan portfolio. A high quality portfolio contains a lower amount of risk. Portfolio quality changes continually as loans are disbursed, payments are made, and payments become due.
Portfolio at Risk (PAR)
PAR indicates the proportion of outstanding amounts of all loan accounts having past due/arrears to the total out-standing loan. In general, PAR 60, i.e., the portfolio / part of the portfolio remaining unpaid 60 days and beyond crossing the due date, would be used as a measure to assess the portfolio quality.
Qualifying Assets
Qualifying Assets are loan portfolios created by MFIs adhering to certain conditions to make the MFIs eligible to be called as MFIs and to raise loans from banks under Priority Sector Advances Scheme ( as per recent RBI norms).
Return on Asset (RoA)
Return on Asset (RoA) is the universally accepted profitability measure which, in essence, is the percentage net in-come earned out of total average asset deployed by MFIs during a given period, say a year.
Return on Equity (RoE)
Return on Equity (RoE) is the net income earned out of average equity of MFIs held by MFIs during the given period.
Self Help Groups (SHGs)
SHGs refer to groups of 10-20 women coming together to form a semi formal community based institution to meet their common financial and social needs.
SHG Bank Linkage Programme (SBLP)
SHGs are linked to mainstream banks for depositing surplus savings of the SHGs and to obtain loans. It is considered to be an effective strategy to ensure financial inclusion.
Surplus
Surplus is Yield minus Total cost
Yield on Portfolio
Yield represents total income from microcredit operation-Interest income, processing fee/ service charge – earned out of average loan portfolio outstanding. It does not, include investment income. It is a good proxy / surrogate for loan interest rate.
xiv
Executive Summary
Context
For the microfinance sector in India the year 2016 -17 was one of growth with a few hiccups. External
environment had some non-conducive elements for the sector. RBI’s continuing interest in the sector
is reflected in its engagement with both the SROs of the Microfinance sector-Sa-Dhan and MFIN, coming
out with modifications and improvements in guidelines whenever required, and support to the sector in the
aftermath of demonetization.
MFIs continue to be major contributors for the progress of MUDRA. The Pradhan Mantri Bima Yojana
(PMBY) and the Atal Pension Yojana provide additional financial instruments for MFIs to offer to their
clientele. Bandhan Bank which rose from the microfinance sector completed two years of its service, five
MFIs started off as Small Finance Banks during the year along with four Payment Banks. Further, RBI is
coming up with guidelines for Peer To Peer lending. These are game changers for the banking and financial
sector landscape of the country in general and for financial inclusion scenario in particular.
Objective
This report is an attempt to collect primary data on MFI client outreach, their loan portfolio and other
financials of MFIs in India that includes both members as well as non-members of Sa-Dhan.
The report purports to provide primary data based analytical information to a wide range of stakeholders
such as the Government, policymakers, regulators, banks, investors, researchers, media, MFIs and others,
helping them to understand the current status and the underlying trends in the sector in order to take
appropriate decisions/actions that are critical for the development of the industry.
Methodology
The contributing MFIs have voluntarily provided their data and detailed information as sought through a data
acquisition sheet consisting of their financial, outreach, geographic spread, credit plus and developmental
activities etc. For this report we have compiled data from MFIs representing all legal forms (Societies, Trusts,
Sec-8 Companies, NBFC-MFIs, Cooperatives). The data has been collated, validated, and analysed for peer
groups.
The project team rigorously scrutinized the self reported data, validated it from the MFIs’ financial statements,
and reconciled from other secondary sources. The validity of the findings however, is subject to the accuracy
of the self-reported data, though reconciliation techniques used would have minimized such errors.
The analysis of the report was undertaken on the basis of a predesigned framework and the findings have
been improved to the extent possible though advisory inputs from microfinance experts and practitioners.
The chapters pertaining to SHGs and the BC model, while culled out from secondary sources, have been
further enhanced by inputs from the experts in the field.
The Report Coverage
The report is divided into two parts. Part one covers the MFI sector and is based on primary data, whereas
Part two covers the SHG sector and the BC model and is mainly culled out from secondary sources of
information.
xv
The Bharat Microfinance Report 2017
Part 1 is further divided into four chapters. Chapter 1 represents an overview of the microfinance sector
within the larger ambit of financial inclusion, Chapter 2 deals with growth and outreach of MFIs, Chapter
3 deals with operational and financial aspects of credit services, while Chapter 4 deals with credit plus
activities. Chapter 3 is further subdivided into 4 sections. Section 1 dwells upon the workforce, productivity
and portfolio quality. Section 2 represents the cost and revenue aspects of the MFIs. Section-3 represents
surplus, sufficiency and profitability of the MFIs, while Section 4 deals with capital structure and balance
sheet distribution.
In the Part 2 of the report, Chapter 5 deals with the SHG section of microfinance and Chapter 6 presents an
overview of the BC model and other technology led approaches of financial inclusion.
Highlights of the Report
Growth and Outreach
MFIs currently operate in 29 States, 4 Union Territories and 563 districts in India. The reported 168 MFIs
with a branch network of 10,233 and 89,785 employees have reached out to 29 million clients with an
outstanding loan portfolio of `46,842 crore. This includes a managed portfolio of `13,898 crore. Out of
managed portfolio, BC portfolio accounts for `10,131crore. The average loan outstanding per borrower
stood at `12,751 and 85% of loans were used for income generation purposes
Outreach fell by 26% and loan outstanding grew by 27% over the previous year. The Southern region
continues to have the highest share of both outreach and loans outstanding, followed by East. However
growth rates are higher in the Northeastern and East regions. Outreach proportion of urban clientele has
decreased significantly as against the rural population. The proportion of urban clientele which was 62% in
2015-16 decreased to 39% in 2016-17. Women borrowers constitute 96% of the total clientele of MFIs, SC/
ST borrowers constitute 20% and minorities 10%.
Of the total, For Profit MFIs (NBFC/NBFC-MFIs) contribute to 79% of clients outreach and 79% of
outstanding portfolio, while NGO MFIs contribute to the remaining. MFIs with portfolio size of more than
`500 crore contribute significantly to the total outreach (80%) and loan outstanding (82%) of the sector.
Operational and Financial Aspects
MFI sector employs 89785 personnel, out of which 12% are women, and 60% are field staff. The number of
active borrowers per credit officer (ABCO) is 426, which is lower than the previous year indicating higher
focus on client services without much of staff growth.
Financial expense is the major expense (48%) incurred by MFIs. Personnel expense and other administrative
expenses contribute 24% and 28% respectively. Median OER (Operating Expense Ratio) and FCR (Finance
Cost Ratio) remained at 10.5% and 14.8% respectively. It is seen that the OER comes down with scale of
operation. MFIs, with portfolio of more than `500 crore have a median OER of 8.5% and FCR of 17.7%.
The Yield of the sector for the year was 22%, which is the highest for Others MFIs (Society/Trust/MACS)
(23%) and lowest for the Section 8 Companies (21%). The Margin for different types of institutions was in
the range of 6-9%. For-profit MFI (NBFC/NBFC-MFIs) maintained a median margin of 8.1%. Median OSS
(Operational Self Sufficiency) is 114%. Approximately 8% of MFIs have OSS less than 100%. This includes
3% of the NBFC-MFIs on account of AP portfolio and 5% not for profit MFIs. Generally, the OSS improves
with the average loan size and yield of the institution.
xvi
Median ROA and ROE for the sector remained at 2.4% and 13.31% respectively. The returns are generally
higher for not for profit MFIs and very large sized MFIs.
The CAR (Capital Adequacy Ratio) for all types of MFIs remained above the desirable level of 15%. NBFC-
MFIs have CAR of 21%. Leveraging of the sector was 2.9 The sector received a sum of `26236 crore, which
includes a portfolio sale of `3768 crore. Total outstanding borrowing of MFIs stood at `33923 crore, with a
substantial share of this derived by NBFC-MFIs (94%) especially from the very large MFIs (87%).
Self-Help Groups and the BC model
The SHG-Bank Linkage Programme has completed its quarter century this year, which is an important
milestone in the financial inclusion history of the nation. Number of SHGs linked to credit and bank loan
amount to SHGs has witnessed an increasing trend after 2010-11. The number of saving linked SHGs has
also increased during the year.; till date, 112 million families have been covered under the SBL Programme
with a total number of 85.77 lakh SHGs with a saving amount of `16,114 crores. A total of 48.48 lakh SHGs
have a gross loan outstanding of `61,581 crores.
The amount of savings and the average per SHG savings (`18,788) held in the banking system are both
increasing since 2011-12. Average loan disbursed per SHG for 2016-17 is reported at `204,314, whereas
average loan outstanding per SHG stood at `127017
The aggregate NPA of SHG loans remain a concern though it has declined marginally to 6.45% in 2015-16,
it again rose in 2016-17 to 6.5 %. Quality of SHGs, their performance has emerged as one of the major issues
affecting the movement.
Also the fact that NRLM will push for improvement in the SHG bank linkage with better monitoring, lower
rates of interest and a sharper focus on livelihood generation, would give a greater fillip to the growth of
SHG programme.
MFIs are finding the BC model increasingly attractive to carry out their activities on the credit side and to
spread it to deposit taking activities 44 MFIs had an exposure to a BC loan portfolio of `6712 crores through
linkage to 29 banks. Apart from this 6 MFIs were undertaking deposit related activities for 9 banks. The
deposit portfolio of BCs amounted to `588.11crores.
xvii
The Bharat Microfinance Report 2017
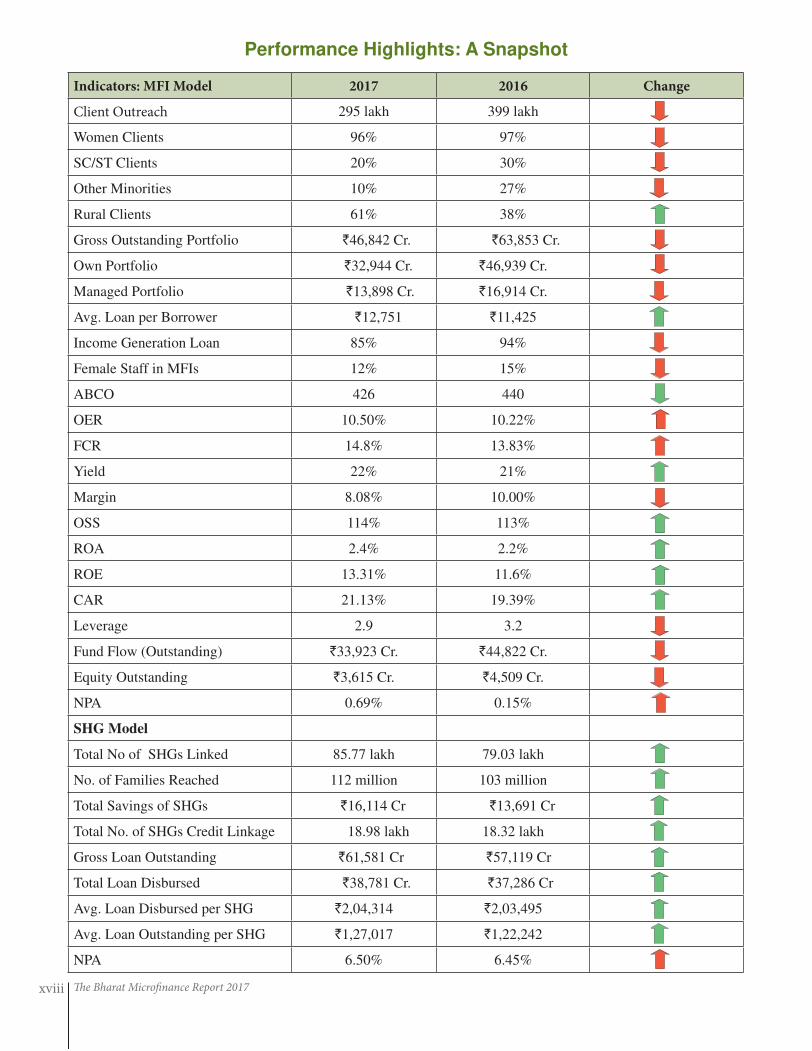
Indicators: MFI Model 2017 2016 Change
Client Outreach 295 lakh 399 lakh
Women Clients 96% 97%
SC/ST Clients 20% 30%
Other Minorities 10% 27%
Rural Clients 61% 38%
Gross Outstanding Portfolio `46,842 Cr. `63,853 Cr.
Own Portfolio `32,944 Cr. `46,939 Cr.
Managed Portfolio `13,898 Cr. `16,914 Cr.
Avg. Loan per Borrower `12,751 `11,425
Income Generation Loan 85% 94%
Female Staff in MFIs 12% 15%
ABCO 426 440
OER 10.50% 10.22%
FCR 14.8% 13.83%
Yield 22% 21%
Margin 8.08% 10.00%
OSS 114% 113%
ROA 2.4% 2.2%
ROE 13.31% 11.6%
CAR 21.13% 19.39%
Leverage 2.9 3.2
Fund Flow (Outstanding) `33,923 Cr. `44,822 Cr.
Equity Outstanding `3,615 Cr. `4,509 Cr.
NPA 0.69% 0.15%
SHG Model
Total No of SHGs Linked 85.77 lakh 79.03 lakh
No. of Families Reached 112 million 103 million
Total Savings of SHGs `16,114 Cr `13,691 Cr
Total No. of SHGs Credit Linkage 18.98 lakh 18.32 lakh
Gross Loan Outstanding `61,581 Cr `57,119 Cr
Total Loan Disbursed `38,781 Cr. `37,286 Cr
Avg. Loan Disbursed per SHG `2,04,314 `2,03,495
Avg. Loan Outstanding per SHG `1,27,017 `1,22,242
NPA 6.50% 6.45%
Performance Highlights: A Snapshot
xviii
Inclusive Financial Sector: Progress with Continuity 1
Inclusive Financial Sector: Progress with ContinuityChapter 1
1.1 Introduction
During the last financial year 2016-17, the Indian economy has continued to consolidate the gains achieved in restoring macro-economic stability. Despite the continuing global sluggishness and recent pick-up
in petroleum prices, the economic growth has continued to be robust and inflation has remained more or less stable, while fiscal deficit and current account deficit as percentage of GDP have improved. The growth rate of the economy during the first half of the year is estimated at 7.2 per cent, which makes India one of the fastest growing major economies in the world. At the sectoral level, the growth rates for agriculture and allied sectors, industry and services sectors for the first half of the year were estimated at 2.5 per cent, 5.6 per cent, and 9.2 per cent respectively. The stress given to fiscal consolidation through expenditure rationalization and revenue raising efforts and the focus on administrative measures for cooperative financial governance and also steps towards containing inflation have contributed significantly to macro-economic stability
1.2 Demonetization and its Aftermath
The year gone by has been a challenging one for the microfinance sector. It was a year in which, old currency notes of `500 and `1000 were withdrawn – an event that has been commonly referred to as demonetization. The restrictions imposed during demonetization provided a reality check to MFIs on their capacity to manage organizational stress. The businesses of clients of MFIs witnessed disruption in the immediate aftermath of demonetization, as they primarily were in the habit of using cash for their transactions. In addition, rumors regarding loan waivers made several MFI clients not pay their installments back. Also, vested interests created doubt among MFI clients regarding their legitimacy as MFIs could not accept repayments in old currency notes. MFIs witnessed a decline in their repayment rates, with several leading MFIs reporting Portfolio at Risk (PAR) in excess of 10%. MFIs, which have significant exposure in states of Maharashtra, Madhya Pradesh, Uttar Pradesh, Uttarakhand and Karnataka, continue to experience problems in their loan portfolios.
Demonetization was an unanticipated event for the microfinance sector. However, it also had a few silver linings. Firstly, MFIs have increased the rate at which they have been adopting technological solutions so that they can promote cashless transactions among their clients. This will have a positive impact on the operating efficiency as well as the operational risk profile of MFIs as losses due to theft and frauds, two of the major operational risks of MFIs, will reduce.
Secondly, although MFIs faced severe disruption in their cash flows after demonetization, this has not had a catastrophic impact on them. This was due in large part due to better risk management practices that MFIs have adopted. Some of the important aspects of the risk management practices that have helped several MFIs include the following:
• Maintaining adequate level of capital adequacy and liquidity buffer based on short term cash flow forecasts
• Prioritizing cash-outflow to manage liquidity stress
• Diversifying sources of funds and keeping channels of communications with lenders open
• Tracking early signals of risks, and taking steps to control them
• Ensuring sound relationship management with clients
• Strengthening loan origination, appraisal and monitoring
• Limiting concentration of portfolio in geographical pockets
The Bharat Microfinance Report 20172
The above strategies have stood MFIs in good stead during the period after demonetization. However, the challenge has not been overcome in its entirety and MFIs will need to ensure a high level of risk-oversight to return to a sustainable state, characterized by low portfolio risks and high customer satisfaction. Hence, Sa-Dhan continues to encourage its members to adopt a sound risk management framework. This is also necessary for continued provision of financial services to MFI clients.
Box: 1.1: Digitization of Microfinance Payments
The Microfinance Industry comprises of 233 MFIs catering to over 40 million low income customers with an outstanding portfolio of `535 billion and repayment rate of over 99%. While digitisation has been implemented in backend processes, the products are still delivered in operational models which are high on human touch and use of cash based disbursal and repayment processes. Digitising cash based operations has the potential to bring a host of benefits to MFIs. It mitigates cash carrying risks and improves operational efficiency by saving time for frontline staff. It can aid in the diversification of products offered to consumers and enable the innovation of customer centric offerings based on critical insights sourced from digital data collected over time on customer behaviour.
It was under this context that NPCI, in its endeavour to bring payments to the last mile, started a pilot to digitise MFI transactions with Svatantra as the MFI, RBL Bank for disbursement and HDFC bank to receive the repayments.
A simple innovative use of the Aadhaar Payment Bridge System (APBS) and *99# infrastructure has made this possible. The customer’s Aadhaar numbers are collected and sent to disbursing bank for onward direct credit to account using APBS system. For repayments a string of numbers *99*1*4*1# is being saved as a contact number in the MFI customers feature phone during MFI group meetings. The customer has to dial the contact, input amount and UPI PIN on the feature phone and the repayment is successfully done. With this it is expected that the 80 million annual disbursements and the over 900 million repayment transactions will be digitised. NPCI hopes to popularise this process with the MFI industry across the country and has released a guide booklet titled “UPI & APBS Digitizing Microfinance – An NPCI Initiative” in February 2017.
To ride along with current digital payments revolution, MFI’s have to take a step ahead and digitise the industry as it will take the digital revolution to the last mile customer of the country as MFI’s have a good rural outreach and working closely with more than 40 million rural women. It will also help MFI’s in reducing operational cost, transit risk and also to connect Indian rural women to the digital banking channel.
About NPCI:
NPCI, during its journey for last over eight years, has made a significant impact on the retail payment systems in the country. Dedicated to the nation by the then Hon’ble President, Shri Pranab Mukherjee, endorsed by the Hon’ble Prime Minister, Shri Narendra Modi, RuPay is now an established brand with complete portfolio of debit, credit, contactless and prepaid. Needless to mention, National Financial Switch, Cheque Truncation System and Aadhaar Enabled Payment System continues to be the flagship products of NPCI. With Immediate Payment Service, India became the leading country in the world in real time payments in retail sector while Bharat Interface for Money/Unified Payments Interface has been termed as the revolutionary product in payment system. The other recently launched products Bharat Bill Pay, National Common Mobility Card and National Electronic Toll Collection are geared to bring revolution in small value electronic payments.
Source: National Payment Corporation of India
Inclusive Financial Sector: Progress with Continuity 3
1.3Microfinance: The Continuing Relevance
The importance of microfinance can be assessed by the fact that the Reserve Bank of India classifies microfinance loans as priority sector loans. The successful utilization of microfinance loans for income generation as proven by high repayment rates of microfinance clients is one of the reasons that there is now a proven business case for such loans. The total gross loan portfolio of MFIs, excluding Small Finance Banks (SFBs), was over `46,000 crore on 31 March 2017. This is a growth of around 18% over the previous year.
Over the previous year, several SFBs have commenced operations. This is an exciting development for microfinance clients, as SFBs will offer a full range of financial services to them. RBI’s guidelines for SFBs, issued in July 2017, require them to extend 75% of their Adjusted Net Bank Credit (ANBC) for priority sector lending.
According to RBI, “the scope of activities of a small finance bank would primarily be to undertake basic banking activities of acceptance of deposits and lending to unserved and underserved sections including small business units, small and marginal farmers, micro and small industries and unorganized sector entities.” SFBs are required to open 25% of their branches in unbanked areas. While 40% of the lending has to be allocated according to the norms for commercial banks, the remaining 35% can go towards any priority sector where the small finance bank has competitive advantage. Domestic commercial banks and foreign banks with more than 20 branches have to lend at least 40% towards priority sectors within which 18% has to be towards agriculture, 7.5% towards micro enterprises, 10% towards weaker sections and remaining 4.5% towards any priority sector. The lending to agriculture sector will be categorized as (i) Farm Credit (which will include short-term crop loans and medium/long-term credit to farmers) (ii) Agriculture Infrastructure and (iii) Ancillary Activities. Farm Credit includes loans to individual farmers, (including SHGs or JLGs, i.e. groups of individual farmers, provided banks maintain disaggregated data of such loans), directly engaged in Agriculture and Allied Activities – dairy, fishery, animal husbandry, poultry, bee-keeping and sericulture.
Early evidence suggests that MFIs that have become SFBs will easily exceed these targets. There will be an opportunity for them to sell Priority Sector Lending Certificate (PSLC), to other banks which need to cover their shortfalls in priority sector loans. In the near term, SFBs face the challenge to evolve their business model in a manner that makes it possible for them to serve their clientele, which to a large extent will include low income households as well as micro and small enterprises. They will need to evolve a mix of financial products and services that are tailored to the needs of this market segment. At the same time, they will need to establish sound risk management systems so that they can successfully cope with any uncertainty that their operating environment throws at them.
This year has provided evidence that the microfinance sector has matured and is in a better position to manage risks that may arise from time to time. However, the need to remain vigilant at the organizational level as well as the sector level remains as important today as ever. In the past year we have seen high profile cases of fraudulent organizations mimicking MFIs as well as SHPIs (in Odisha and Bihar). Such instances create confusion among the general population and harm the reputation of microfinance. It is therefore important for responsible organizations involved in microfinance to make efforts to safeguard their clients from becoming victims of such frauds. There is now an imperative from a risk management perspective for responsible organizations to make efforts to raise the financial literacy levels of their clients. They should ensure that their clients are able to distinguish between legitimate and fake financial institutions, genuine and fake financial products and genuine and fake banking agents.
The Bharat Microfinance Report 20174
1.4 Quarter Century of SBLP
SHG-bank linkages have been a primary driving force of financial inclusion in the country. It is expected that SFBs will provide further impetus to SHG bank linkages. The RBI has advised SFBs to consider lending to SHGs as part of their mainstream credit operations. Further the RBI has advised them to include SHG linkage in their corporate strategy/plan, training curriculum of their officers and staff and implement SHG linkage as a regular business activity and monitor and review it periodically. According to RBI’s July 2017 guidelines, “Lending to SHGs should be included in branch credit plan, block credit plan, district credit plan and state credit plan of each SFB. While no target is being prescribed under SHG bank linkage programme, utmost priority should be accorded to the sector in preparation of these plans. It should also form an integral part of the bank’s corporate credit plan”.
It is worth mentioning that the SHG bank linkage movement has entered its 26th year. According to NABARD’s “Status of Microfinance in India (2016-17)” report, as on 31 March 2017, the SHG bank linkage program covered “10 crore families through 85 lakh SHGs with savings deposits of `16,114 crore and 48.4 lakh groups with collateral-free loan outstanding of over `61,500 crore, of which, 88% for rural women”. An important factor that has helped this program achieve this scale has been the wide participation of banks, NGOs, as well as State Rural Livelihood Missions in the recent years. The organizations involved in the SHG bank linkage project are now making efforts to link credit data of SHG members to credit information bureaus. Once this is achieved, there will be greater integration of the low-income population living in the rural areas of the country with the formal credit markets.
1.5 Furthering Financial Inclusion
Business Correspondents (BCs) have emerged as important links in providing last mile outreach to the economically underprivileged clients. BCs have now started playing an important role in providing a variety of services to these clients, including providing access to Pradhan Mantri Jan Dhan Yojana (PMJDY) accounts, direct benefit transfers (DBT) as well as a variety of credit products. Use of mobile and internet technology to provide safe and secure financial services to these clients is an important aspect of the BC model. At the same time, it is important to remember, that the clients being served by the BCs do not possess a high level of financial literacy and are very vulnerable to mis-selling and financial frauds. It is therefore very important that a code of conduct is devised and implemented to ensure that clients get access to ethical financial services, transparent pricing and a mechanism to have their grievances redressed. Progress is being made in this direction by the Business Correspondent Federation of India (BCFI), and it is expected that a code of conduct for BCs will soon be established.
With the passing of Aadhaar Bill, the project of the Unique Identification Authority of India (UIDAI), got a legal framework, strengthening its use for enhancing digital financial inclusion. The ultimate objective is to provide direct and multiple access to the customer; to develop the ecosystem with the help of geographical information system mapping banking points; these are steps towards greater acceptance of digitization that has potential to open up possibilities for the hitherto excluded. A study on financial inclusion by Intermedia indicates that financial inclusion is on the rise (currently 65%), mobile money awareness is 10% and use of mobile money is 0.5%. Usage of basic banking services has increased which implies increase in number of new account holders who are adults and belong to BPL and rural population.
A MicroSave study on PMJDY suggests that the percentage of zero-balance or static accounts can be reduced by aggressively linking the DBT schemes that can drive transactions. Bank Mitras are the last mile architecture (BC), who are preferred to ATM and bank branch for transactions, so training and certification of BC has been proposed to be carried out by Indian Banks Association (IBA). Besides, RBI has proposed two initiatives for BCs, a) growth path and b)Incentives for continuation. Adoption of JAM strategy (Jan
Inclusive Financial Sector: Progress with Continuity 5
Dhan Yojana, Aadhaar and Mobile) also is one policy initiative to increase the throughput of transactions. These also have Aadhaar enabled payment systems (AEPS) authentication of beneficiaries so that in-kind subsidies may be converted to cash subsidies in future.
Indian postal network has an extensive outreach and is undergoing renovation under the e-governance project. About 28,000 Departmental post offices have been established across the country and the administrative offices have been connected under single wide area network. Core banking solution is available in more than 22,000 centers and ATM have been installed. 4000 hand held devices have been provided to rural postmen to go for 3rd party products and make e-commerce deliveries. This can also dovetail with the expansion of the India Post Payments Bank (IPPB), and derive synergies from its outreach programme.
1.6 DBT and Social Security
The PAHAL scheme (direct cash transfer of subsidy to LPG subscribers) is now focused on relatively poorer segments of the society, and has provided a basis for voluntary classification of beneficiaries rather than universal coverage. All accounts are now termed as PMJDY accounts which are receiving direct benefit transfers and are eligible for insurance cover, OD facility and RuPay Card. The scope of DBT has been extended to MGNREGA wages, old age pension, scholarships, people working for the schemes (Anganwadi workers, teachers in aided school) etc. The number of beneficiaries stood at more than 300 million amounting to subsidies to the tune of `47 billion. Three social security schemes pertain to the insurance and pension: Pradhan Mantri Jeevan Jyoti Bima Yojana (PMJJBY), Pradhan Mantri Suraksha Bima Yojana (PMSBY) and Atal Pension Yojana (APY); out of which PMSBY is more popular while APY has been subscribed by more urban customers, as people receiving old age pension do not want to pay for another pension scheme.
The Bharat Microfinance Report 20176
Outreach and Loan PortfolioChapter 2
Client outreach and loan portfolio are two key indicators of an MFI’s contribution to financial inclusion as well as the depth and breadth of financial deepening achieved by it. This chapter aims to provide an
overview of MFIs’ outreach in terms of client coverage and loan portfolio, based on the data received from 168 MFIs and 4 SFBs. This chapter is divided into two parts; the first part explains geographic distribution of microfinance institutions and their client outreach. The second discusses the issues of portfolio outstanding, loan disbursement, and purpose of loan.
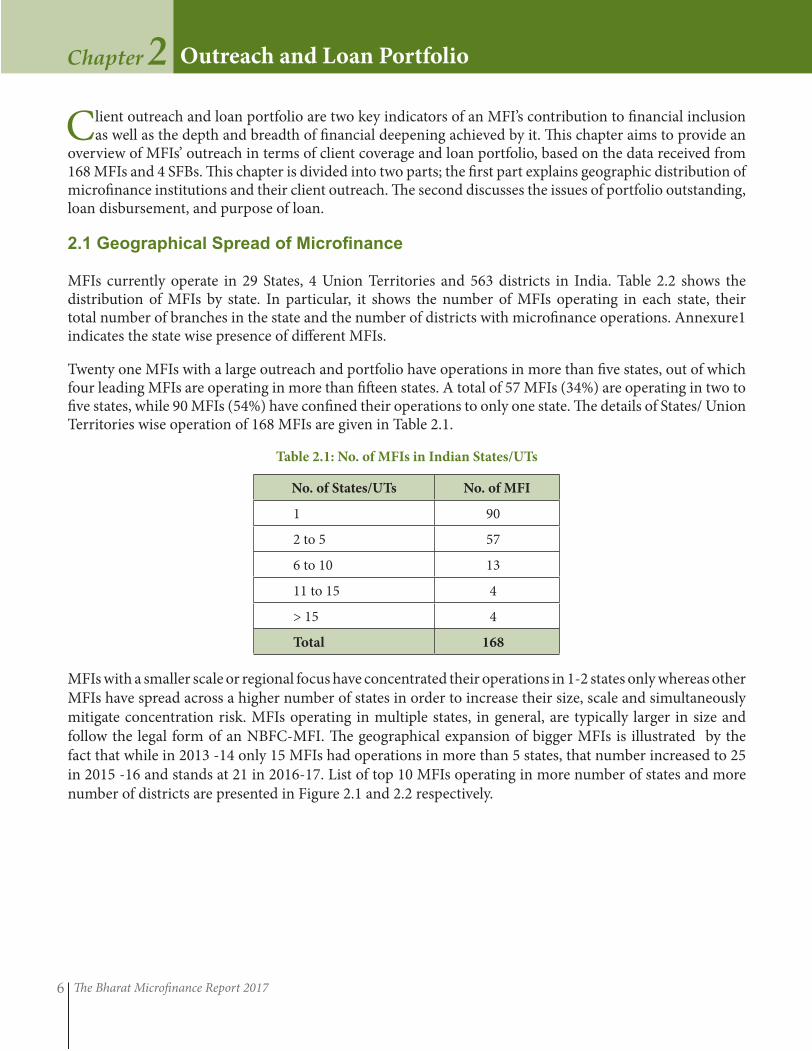
2.1GeographicalSpreadofMicrofinance
MFIs currently operate in 29 States, 4 Union Territories and 563 districts in India. Table 2.2 shows the distribution of MFIs by state. In particular, it shows the number of MFIs operating in each state, their total number of branches in the state and the number of districts with microfinance operations. Annexure1 indicates the state wise presence of different MFIs.
Twenty one MFIs with a large outreach and portfolio have operations in more than five states, out of which four leading MFIs are operating in more than fifteen states. A total of 57 MFIs (34%) are operating in two to five states, while 90 MFIs (54%) have confined their operations to only one state. The details of States/ Union Territories wise operation of 168 MFIs are given in Table 2.1.
Table 2.1: No. of MFIs in Indian States/UTs
No. of States/UTs No. of MFI
1 90
2 to 5 57
6 to 10 13
11 to 15 4
> 15 4
Total 168
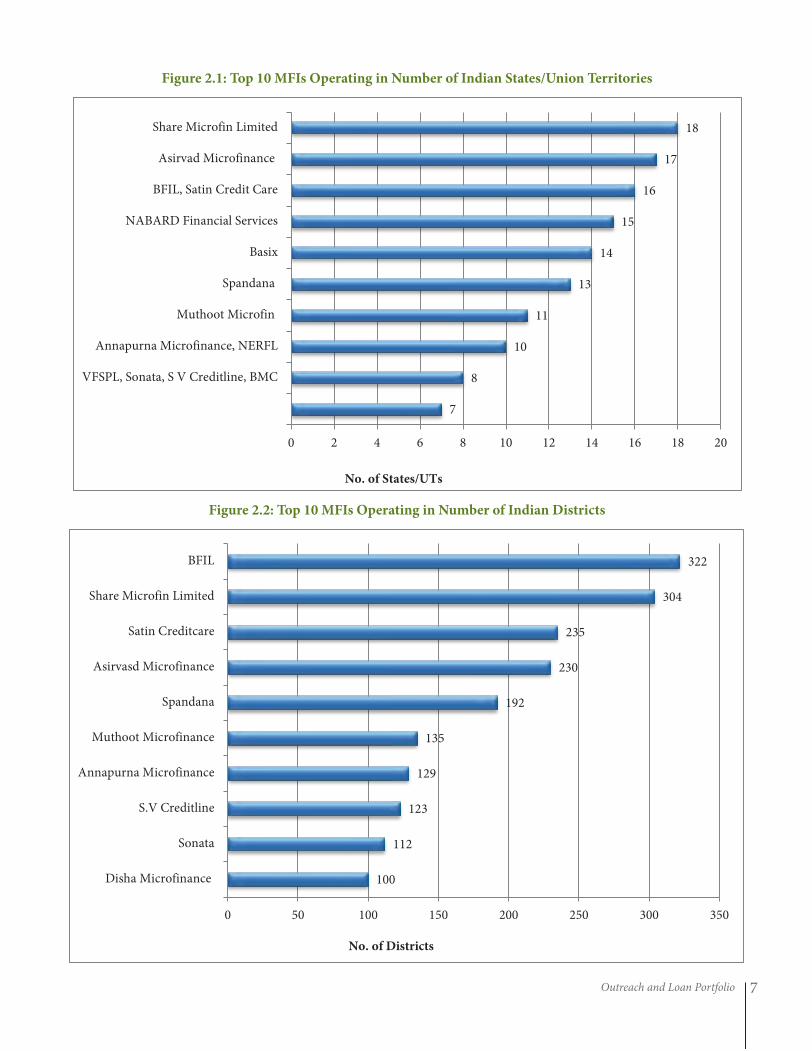
MFIs with a smaller scale or regional focus have concentrated their operations in 1-2 states only whereas other MFIs have spread across a higher number of states in order to increase their size, scale and simultaneously mitigate concentration risk. MFIs operating in multiple states, in general, are typically larger in size and follow the legal form of an NBFC-MFI. The geographical expansion of bigger MFIs is illustrated by the fact that while in 2013 -14 only 15 MFIs had operations in more than 5 states, that number increased to 25 in 2015 -16 and stands at 21 in 2016-17. List of top 10 MFIs operating in more number of states and more number of districts are presented in Figure 2.1 and 2.2 respectively.
Outreach and Loan Portfolio 7
Figure 2.1: Top 10 MFIs Operating in Number of Indian States/Union Territories
Figure 2.2: Top 10 MFIs Operating in Number of Indian Districts
7
8
10
11
13
14
15
16
17
18
0 2 4 6 8 10 12 14 16 18 20
VFSPL, Sonata, S V Creditline, BMC
Annapurna Microfinance, NERFL
Muthoot Microfin
Spandana
Basix
NABARD Financial Services
BFIL, Satin Credit Care
Asirvad Microfinance
Share Microfin Limited
No. of States/UTs
100
112
123
129
135
192
230
235
304
322
0 50 100 150 200 250 300 350
Disha Microfinance
Sonata
S.V Creditline
Annapurna Microfinance
Muthoot Microfinance
Spandana
Asirvasd Microfinance
Satin Creditcare
Share Microfin Limited
BFIL
No. of Districts
The Bharat Microfinance Report 20178
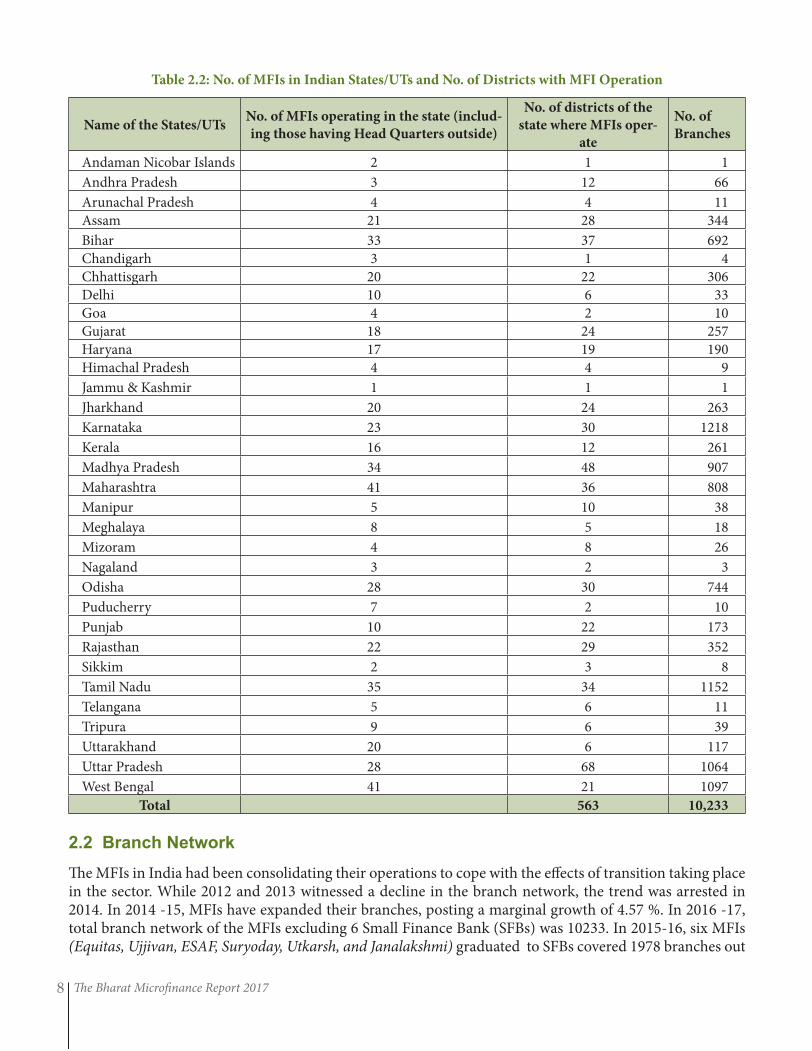
Table 2.2: No. of MFIs in Indian States/UTs and No. of Districts with MFI Operation
Name of the States/UTsNo. of MFIs operating in the state (includ-
ing those having Head Quarters outside)
No. of districts of the
state where MFIs oper-
ate
No. of
Branches
Andaman Nicobar Islands 2 1 1
Andhra Pradesh 3 12 66
Arunachal Pradesh 4 4 11
Assam 21 28 344
Bihar 33 37 692
Chandigarh 3 1 4
Chhattisgarh 20 22 306
Delhi 10 6 33
Goa 4 2 10
Gujarat 18 24 257
Haryana 17 19 190
Himachal Pradesh 4 4 9
Jammu & Kashmir 1 1 1
Jharkhand 20 24 263
Karnataka 23 30 1218
Kerala 16 12 261
Madhya Pradesh 34 48 907
Maharashtra 41 36 808
Manipur 5 10 38
Meghalaya 8 5 18
Mizoram 4 8 26
Nagaland 3 2 3
Odisha 28 30 744
Puducherry 7 2 10
Punjab 10 22 173
Rajasthan 22 29 352
Sikkim 2 3 8
Tamil Nadu 35 34 1152
Telangana 5 6 11
Tripura 9 6 39
Uttarakhand 20 6 117
Uttar Pradesh 28 68 1064
West Bengal 41 21 1097
Total 563 10,233
2.2BranchNetworkThe MFIs in India had been consolidating their operations to cope with the effects of transition taking place in the sector. While 2012 and 2013 witnessed a decline in the branch network, the trend was arrested in 2014. In 2014 -15, MFIs have expanded their branches, posting a marginal growth of 4.57 %. In 2016 -17, total branch network of the MFIs excluding 6 Small Finance Bank (SFBs) was 10233. In 2015-16, six MFIs (Equitas, Ujjivan, ESAF, Suryoday, Utkarsh, and Janalakshmi) graduated to SFBs covered 1978 branches out
Outreach and Loan Portfolio 9
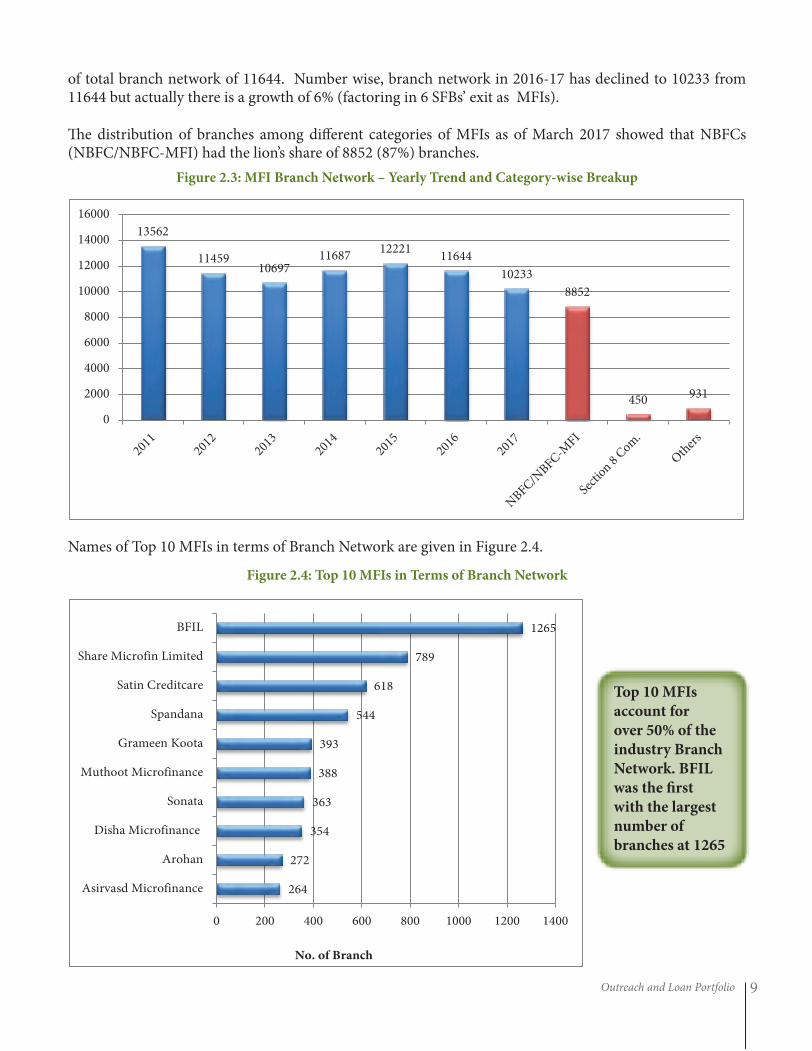
of total branch network of 11644. Number wise, branch network in 2016-17 has declined to 10233 from 11644 but actually there is a growth of 6% (factoring in 6 SFBs’ exit as MFIs).
The distribution of branches among different categories of MFIs as of March 2017 showed that NBFCs (NBFC/NBFC-MFI) had the lion’s share of 8852 (87%) branches.
Figure 2.3: MFI Branch Network – Yearly Trend and Category-wise Breakup
Names of Top 10 MFIs in terms of Branch Network are given in Figure 2.4.
Figure 2.4: Top 10 MFIs in Terms of Branch Network
264
272
354
363
388
393
544
618
789
1265
0 200 400 600 800 1000 1200 1400
Asirvasd Microfinance
Arohan
Disha Microfinance
Sonata
Muthoot Microfinance
Grameen Koota
Spandana
Satin Creditcare
Share Microfin Limited
BFIL
No. of Branch
Top 10 MFIs
account for
over 50% of the
industry Branch
Network. BFIL
was the first
with the largest
number of
branches at 1265
13562
11459 10697
11687 12221
11644
10233
8852
450 931
0
2000
4000
6000
8000
10000
12000
14000
16000
The Bharat Microfinance Report 201710
Box 2.1: The year it was for Microfinance
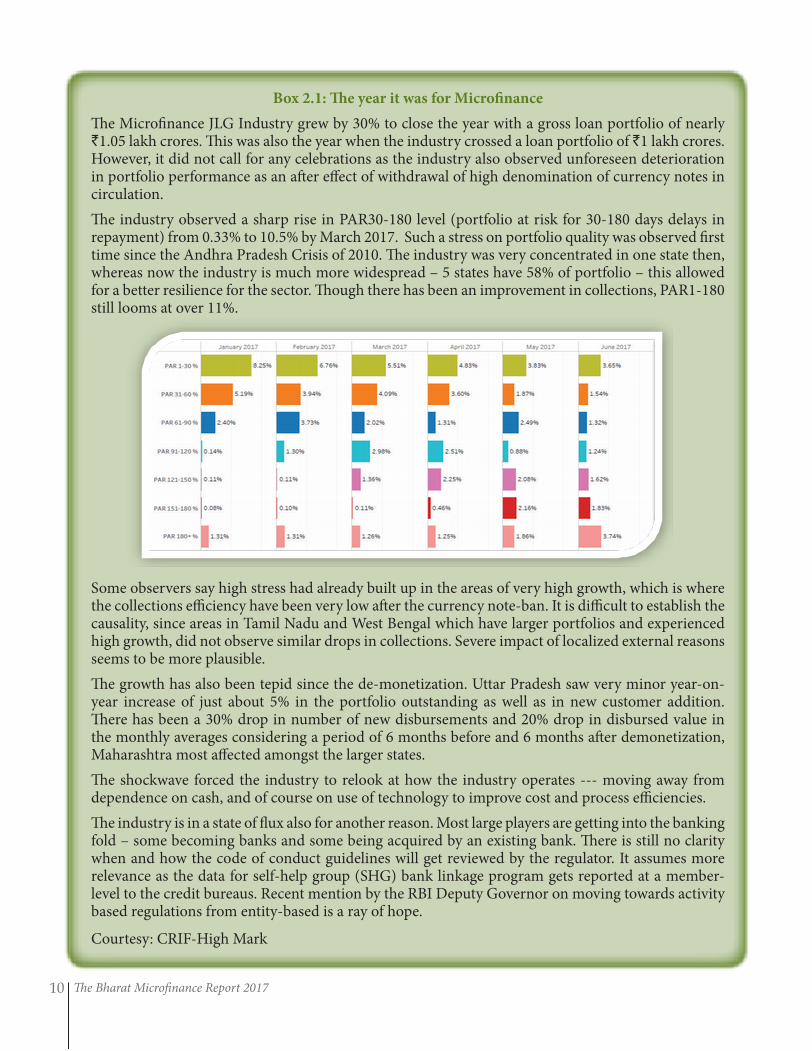
The Microfinance JLG Industry grew by 30% to close the year with a gross loan portfolio of nearly `1.05 lakh crores. This was also the year when the industry crossed a loan portfolio of `1 lakh crores. However, it did not call for any celebrations as the industry also observed unforeseen deterioration in portfolio performance as an after effect of withdrawal of high denomination of currency notes in circulation.
The industry observed a sharp rise in PAR30-180 level (portfolio at risk for 30-180 days delays in repayment) from 0.33% to 10.5% by March 2017. Such a stress on portfolio quality was observed first time since the Andhra Pradesh Crisis of 2010. The industry was very concentrated in one state then, whereas now the industry is much more widespread – 5 states have 58% of portfolio – this allowed for a better resilience for the sector. Though there has been an improvement in collections, PAR1-180 still looms at over 11%.
Some observers say high stress had already built up in the areas of very high growth, which is where the collections efficiency have been very low after the currency note-ban. It is difficult to establish the causality, since areas in Tamil Nadu and West Bengal which have larger portfolios and experienced high growth, did not observe similar drops in collections. Severe impact of localized external reasons seems to be more plausible.
The growth has also been tepid since the de-monetization. Uttar Pradesh saw very minor year-on-year increase of just about 5% in the portfolio outstanding as well as in new customer addition. There has been a 30% drop in number of new disbursements and 20% drop in disbursed value in the monthly averages considering a period of 6 months before and 6 months after demonetization, Maharashtra most affected amongst the larger states.
The shockwave forced the industry to relook at how the industry operates --- moving away from dependence on cash, and of course on use of technology to improve cost and process efficiencies.
The industry is in a state of flux also for another reason. Most large players are getting into the banking fold – some becoming banks and some being acquired by an existing bank. There is still no clarity when and how the code of conduct guidelines will get reviewed by the regulator. It assumes more relevance as the data for self-help group (SHG) bank linkage program gets reported at a member-level to the credit bureaus. Recent mention by the RBI Deputy Governor on moving towards activity based regulations from entity-based is a ray of hope.
Courtesy: CRIF-High Mark
Outreach and Loan Portfolio 11
Client Outreach grew by 10% 2017 relative to 2016 without six SFBs which indicate a sound growth of MFIs in 2016-17. This rise in the number of borrowers is positively correlated with an increase in fund flow from banks, MUDRA and financial institutions to MFIs.
2.3.1 Regional Outreach of MFIs
1 Clients of MFIs are essentially Loan Borrowers. ‘Clients’ and ‘Borrowers’ have been interchangeably used in this report.
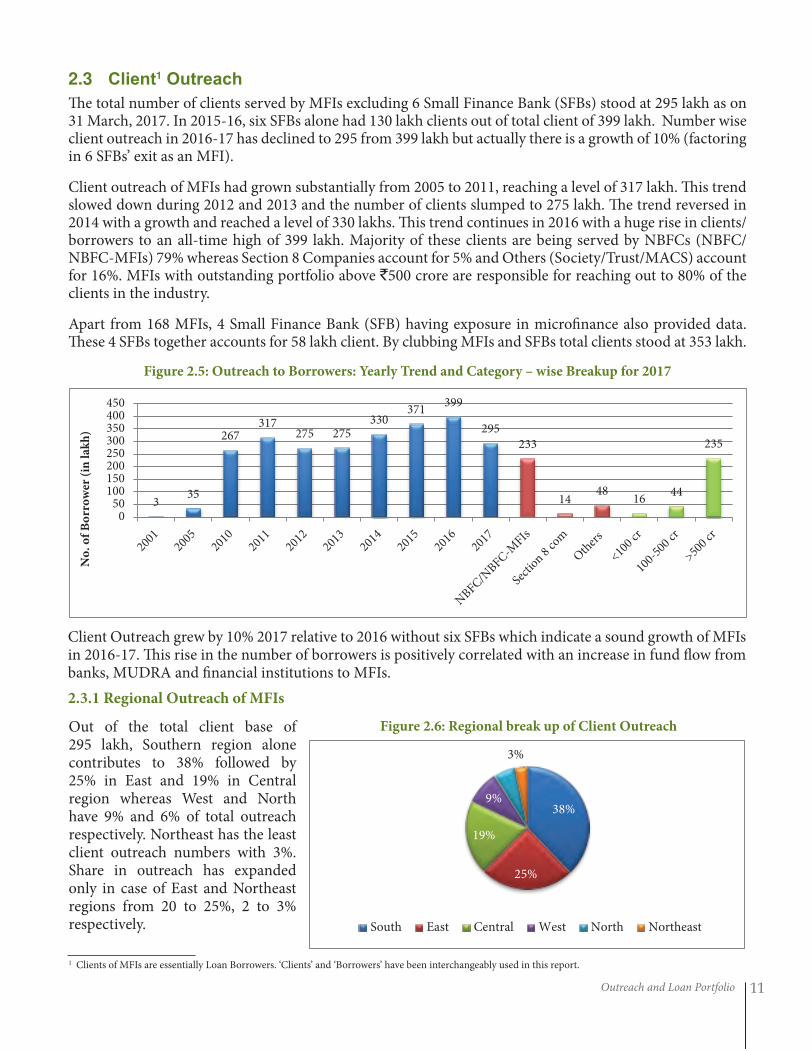
2.3 Client1 OutreachThe total number of clients served by MFIs excluding 6 Small Finance Bank (SFBs) stood at 295 lakh as on 31 March, 2017. In 2015-16, six SFBs alone had 130 lakh clients out of total client of 399 lakh. Number wise client outreach in 2016-17 has declined to 295 from 399 lakh but actually there is a growth of 10% (factoring in 6 SFBs’ exit as an MFI).
Client outreach of MFIs had grown substantially from 2005 to 2011, reaching a level of 317 lakh. This trend slowed down during 2012 and 2013 and the number of clients slumped to 275 lakh. The trend reversed in 2014 with a growth and reached a level of 330 lakhs. This trend continues in 2016 with a huge rise in clients/borrowers to an all-time high of 399 lakh. Majority of these clients are being served by NBFCs (NBFC/NBFC-MFIs) 79% whereas Section 8 Companies account for 5% and Others (Society/Trust/MACS) account for 16%. MFIs with outstanding portfolio above `500 crore are responsible for reaching out to 80% of the clients in the industry.
Apart from 168 MFIs, 4 Small Finance Bank (SFB) having exposure in microfinance also provided data. These 4 SFBs together accounts for 58 lakh client. By clubbing MFIs and SFBs total clients stood at 353 lakh.
Figure 2.5: Outreach to Borrowers: Yearly Trend and Category – wise Breakup for 2017
Out of the total client base of 295 lakh, Southern region alone contributes to 38% followed by 25% in East and 19% in Central region whereas West and North have 9% and 6% of total outreach respectively. Northeast has the least client outreach numbers with 3%. Share in outreach has expanded only in case of East and Northeast regions from 20 to 25%, 2 to 3% respectively.
Figure 2.6: Regional break up of Client Outreach
38%
25%
19%
9%
6% 3%
South East Central West North Northeast
3 35
267 317
275 275 330
371 399
295
233
14 48
16 44
235
050
100150200250300350400450
No
. o
f B
orr
ow
er (
in l
akh
)
The Bharat Microfinance Report 201712
This year, a positive growth trend in client outreach is observed across East and Northeast only. Northeast region has grown at 50%, followed by East at 25% respectively. The Southern region is still leading although there is a negative growth rate of 3% whereas Central and Western regions have declined by 5% and 44% respectively.
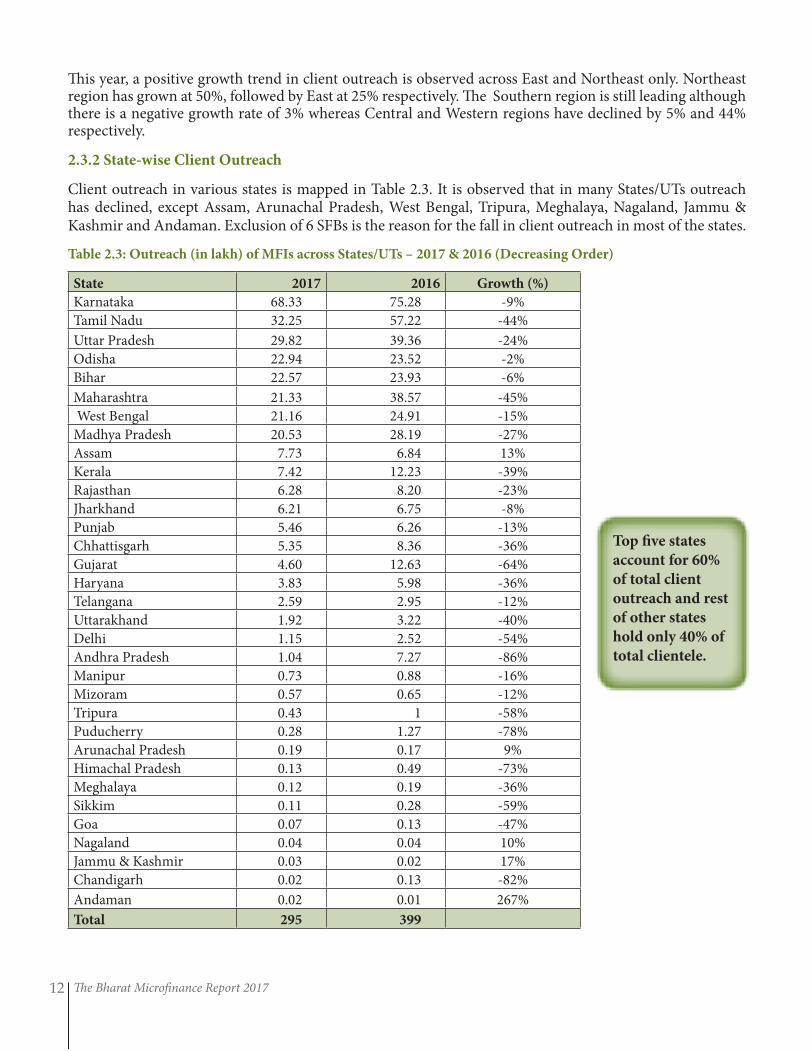
2.3.2 State-wise Client Outreach
Client outreach in various states is mapped in Table 2.3. It is observed that in many States/UTs outreach has declined, except Assam, Arunachal Pradesh, West Bengal, Tripura, Meghalaya, Nagaland, Jammu & Kashmir and Andaman. Exclusion of 6 SFBs is the reason for the fall in client outreach in most of the states.
Table 2.3: Outreach (in lakh) of MFIs across States/UTs – 2017 & 2016 (Decreasing Order)
State 2017 2016 Growth (%)
Karnataka 68.33 75.28 -9%
Tamil Nadu 32.25 57.22 -44%
Uttar Pradesh 29.82 39.36 -24%
Odisha 22.94 23.52 -2%
Bihar 22.57 23.93 -6%
Maharashtra 21.33 38.57 -45%
West Bengal 21.16 24.91 -15%
Madhya Pradesh 20.53 28.19 -27%
Assam 7.73 6.84 13%
Kerala 7.42 12.23 -39%
Rajasthan 6.28 8.20 -23%
Jharkhand 6.21 6.75 -8%
Punjab 5.46 6.26 -13%
Chhattisgarh 5.35 8.36 -36%
Gujarat 4.60 12.63 -64%
Haryana 3.83 5.98 -36%
Telangana 2.59 2.95 -12%
Uttarakhand 1.92 3.22 -40%
Delhi 1.15 2.52 -54%
Andhra Pradesh 1.04 7.27 -86%
Manipur 0.73 0.88 -16%
Mizoram 0.57 0.65 -12%
Tripura 0.43 1 -58%
Puducherry 0.28 1.27 -78%
Arunachal Pradesh 0.19 0.17 9%
Himachal Pradesh 0.13 0.49 -73%
Meghalaya 0.12 0.19 -36%
Sikkim 0.11 0.28 -59%
Goa 0.07 0.13 -47%
Nagaland 0.04 0.04 10%
Jammu & Kashmir 0.03 0.02 17%
Chandigarh 0.02 0.13 -82%
Andaman 0.02 0.01 267%
Total 295 399
Top five states
account for 60%
of total client
outreach and rest
of other states
hold only 40% of
total clientele.
Outreach and Loan Portfolio 13
2.3.3 Rural – Urban Share of MFIs Borrowers
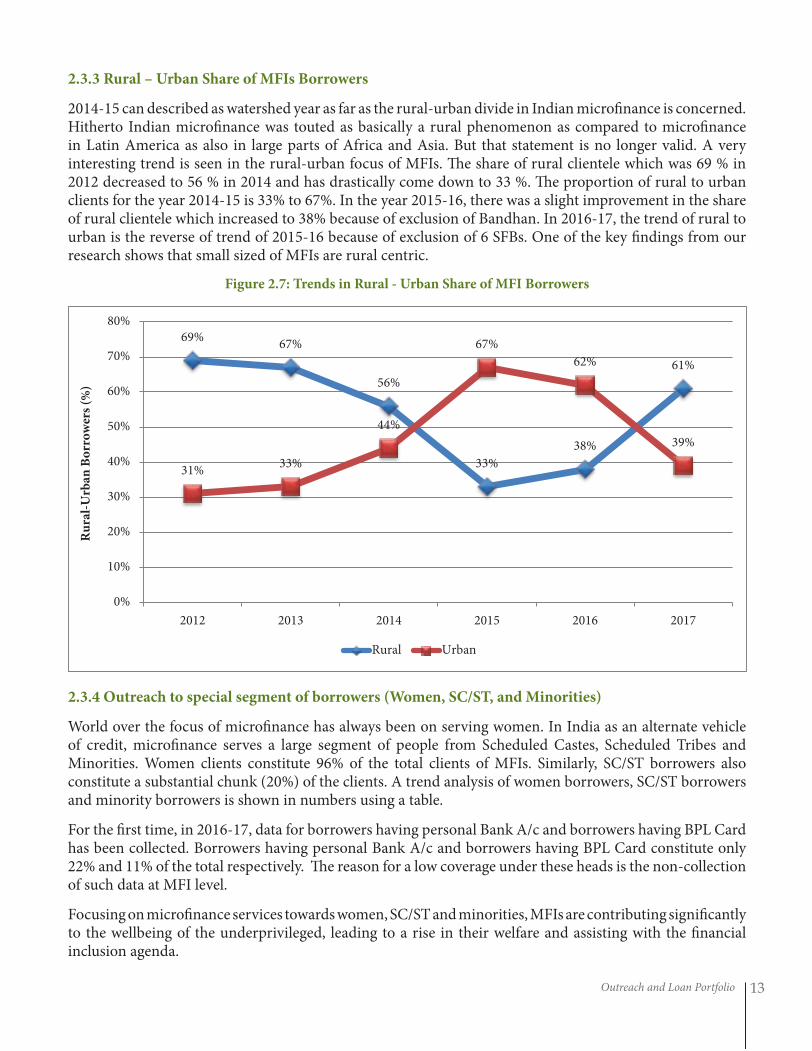
2014-15 can described as watershed year as far as the rural-urban divide in Indian microfinance is concerned. Hitherto Indian microfinance was touted as basically a rural phenomenon as compared to microfinance in Latin America as also in large parts of Africa and Asia. But that statement is no longer valid. A very interesting trend is seen in the rural-urban focus of MFIs. The share of rural clientele which was 69 % in 2012 decreased to 56 % in 2014 and has drastically come down to 33 %. The proportion of rural to urban clients for the year 2014-15 is 33% to 67%. In the year 2015-16, there was a slight improvement in the share of rural clientele which increased to 38% because of exclusion of Bandhan. In 2016-17, the trend of rural to urban is the reverse of trend of 2015-16 because of exclusion of 6 SFBs. One of the key findings from our research shows that small sized of MFIs are rural centric.
Figure 2.7: Trends in Rural - Urban Share of MFI Borrowers
2.3.4 Outreach to special segment of borrowers (Women, SC/ST, and Minorities)
World over the focus of microfinance has always been on serving women. In India as an alternate vehicle of credit, microfinance serves a large segment of people from Scheduled Castes, Scheduled Tribes and Minorities. Women clients constitute 96% of the total clients of MFIs. Similarly, SC/ST borrowers also constitute a substantial chunk (20%) of the clients. A trend analysis of women borrowers, SC/ST borrowers and minority borrowers is shown in numbers using a table.
For the first time, in 2016-17, data for borrowers having personal Bank A/c and borrowers having BPL Card has been collected. Borrowers having personal Bank A/c and borrowers having BPL Card constitute only 22% and 11% of the total respectively. The reason for a low coverage under these heads is the non-collection of such data at MFI level.
Focusing on microfinance services towards women, SC/ST and minorities, MFIs are contributing significantly to the wellbeing of the underprivileged, leading to a rise in their welfare and assisting with the financial inclusion agenda.
69% 67%
56%
33%
38%
61%
31% 33%
44%
67%
62%
39%
0%
10%
20%
30%
40%
50%
60%
70%
80%
2012 2013 2014 2015 2016 2017
Ru
ral-
Urb
an B
orr
ow
ers
(%)
Rural Urban
The Bharat Microfinance Report 201714
Table 2.4: Composition of Borrowers – Category wise
% to Total Borrowers
YearWomen
Borrowers
SC/ST Borrow-
ers
Minority Borrow-
ers
Differently abled Bor-
rowers
Borrowers having
Aadhaar Card
BC Bor-rowers
Indi-vidual
Borrow-ers
Borrow-ers having personal Bank A/c
Bor-rowers having
BPL Card
2011 94%
2012 95% 20% 23%
2013 96% 21% 23%
2014 97% 19% 14%
2015 97% 28% 18% 0.05% 10%
2016 97% 30% 27% 4% 18% 15% 3%
2017 96% 20% 10% 0.12% 52% 23% 3% 22% 11%
Note: Data for SC/ST and Minorities is being collected from 2012; data for Differently abled borrowers and Borrowers having Aadhaar Card is being collected from 2015, data for BC Borrowers and Individual Borrowers is being collected from 2016 whereas data for borrowers having personal Bank A/c and borrowers having BPL Car started from 2017.
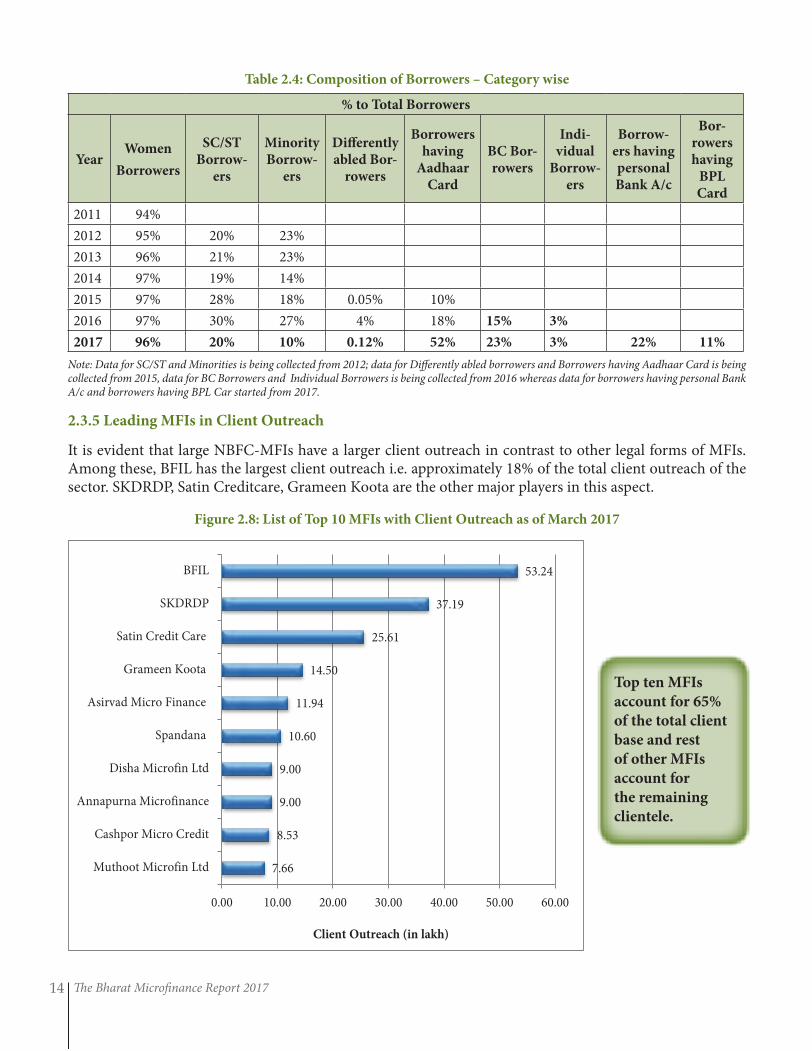
2.3.5 Leading MFIs in Client Outreach
It is evident that large NBFC-MFIs have a larger client outreach in contrast to other legal forms of MFIs. Among these, BFIL has the largest client outreach i.e. approximately 18% of the total client outreach of the sector. SKDRDP, Satin Creditcare, Grameen Koota are the other major players in this aspect.
Figure 2.8: List of Top 10 MFIs with Client Outreach as of March 2017
Top ten MFIs
account for 65%
of the total client
base and rest
of other MFIs
account for
the remaining
clientele.
7.66
8.53
9.00
9.00
10.60
11.94
14.50
25.61
37.19
53.24
0.00 10.00 20.00 30.00 40.00 50.00 60.00
Muthoot Microfin Ltd
Cashpor Micro Credit
Annapurna Microfinance
Disha Microfin Ltd
Spandana
Asirvad Micro Finance
Grameen Koota
Satin Credit Care
SKDRDP
BFIL
Client Outreach (in lakh)
Outreach and Loan Portfolio 15
Interestingly, SKDRDP and Cashpor remain the only non-NBFC MFIs with a large client outreach. Other than legal form, factors like availability of funds, business plan, regulatory environment etc. also determine the scale of operation and client outreach.
2 Source: CRIF Highmark
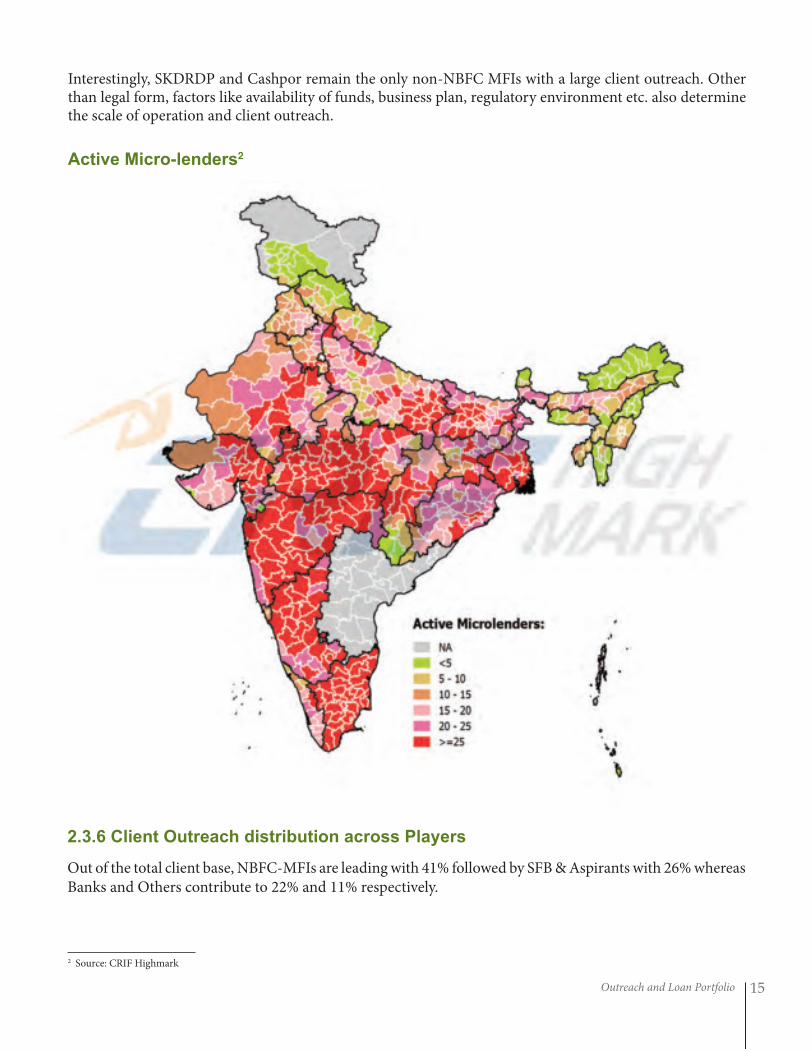
ActiveMicro-lenders2
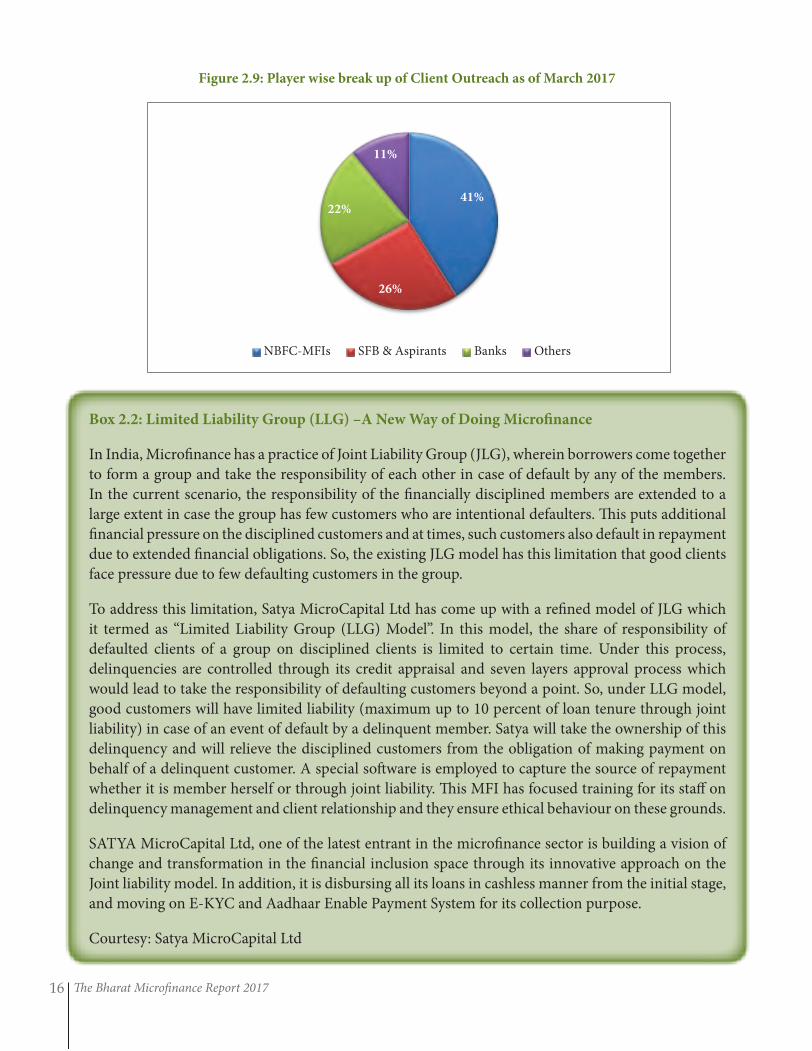
2.3.6ClientOutreachdistributionacrossPlayers
Out of the total client base, NBFC-MFIs are leading with 41% followed by SFB & Aspirants with 26% whereas Banks and Others contribute to 22% and 11% respectively.
The Bharat Microfinance Report 201716
Figure 2.9: Player wise break up of Client Outreach as of March 2017
Box 2.2: Limited Liability Group (LLG) –A New Way of Doing Microfinance
In India, Microfinance has a practice of Joint Liability Group (JLG), wherein borrowers come together
to form a group and take the responsibility of each other in case of default by any of the members.
In the current scenario, the responsibility of the financially disciplined members are extended to a
large extent in case the group has few customers who are intentional defaulters. This puts additional
financial pressure on the disciplined customers and at times, such customers also default in repayment
due to extended financial obligations. So, the existing JLG model has this limitation that good clients
face pressure due to few defaulting customers in the group.
To address this limitation, Satya MicroCapital Ltd has come up with a refined model of JLG which
it termed as “Limited Liability Group (LLG) Model”. In this model, the share of responsibility of
defaulted clients of a group on disciplined clients is limited to certain time. Under this process,
delinquencies are controlled through its credit appraisal and seven layers approval process which
would lead to take the responsibility of defaulting customers beyond a point. So, under LLG model,
good customers will have limited liability (maximum up to 10 percent of loan tenure through joint
liability) in case of an event of default by a delinquent member. Satya will take the ownership of this
delinquency and will relieve the disciplined customers from the obligation of making payment on
behalf of a delinquent customer. A special software is employed to capture the source of repayment
whether it is member herself or through joint liability. This MFI has focused training for its staff on
delinquency management and client relationship and they ensure ethical behaviour on these grounds.
SATYA MicroCapital Ltd, one of the latest entrant in the microfinance sector is building a vision of
change and transformation in the financial inclusion space through its innovative approach on the
Joint liability model. In addition, it is disbursing all its loans in cashless manner from the initial stage,
and moving on E-KYC and Aadhaar Enable Payment System for its collection purpose.
Courtesy: Satya MicroCapital Ltd
41%
26%
22%
11%
NBFC-MFIs SFB & Aspirants Banks Others
Outreach and Loan Portfolio 17
2.4LoanPortfolioofMFIsAs per the NSS data of various years, including the latest one of 2013, majority of the population is still dependent largely on informal and expensive sources, including money lenders to meet their credit needs. Credit needs for such a population range from emergency loans, consumption loans to business loans, working capital loans, housing etc. Credit is the flagship service offered by MFIs to clients outside the net of formal financial services. For MFIs, loan portfolio is the primary revenue generating asset. It also gives details about the health of MFIs through financial performance, as the financial performance is a function of revenue and cost. Loan portfolio of the MFIs and its trends are analyzed below to understand the performance of the institutions and their contribution to the goal of financial inclusion.
As of March 2017, the total loan portfolio outstanding of MFIs excluding 6 Small Finance Banks (SFBs) has reached to `46,842 crore. In 2015-16, six SFBs alone had `24,034 crore out of total GLP `63,853 crore. GLP in 2016-17 has declined to `46,842 crore from `63,853 crore but actually there is a growth of 18% (factoring in 6 SFBs’ exit as an MFI).
Total managed portfolio also includes a BC portfolio of `13,898 crore which is 30% of total loan portfolio. The net loan portfolio or owned portfolio on the books of the MFIs stood at `32,944 crore.
The share of NBFC-MFIs stood over 79%, followed by Others (Society, Trust and MACS) at 17%. Nearly 82% of the portfolio is held by MFIs with a portfolio size above `500 crore.
List of top 10 MFIs in terms of loan portfolio is indicated in Table 2.5. Among these, BFIL has the largest portfolio i.e. approximately 20% of the total client outreach of the sector. SKDRDP, Satin Creditcare, Grameen Koota are the other major players in this area.
Table 2.5: List of Top MFIs with Loan Portfolio as of March 2017
S. No. Name of MFI Gross Loan Portfolio (` crore)
1 BFIL 9150
2 SKDRDP 6399
3 Satin Credit Care 3617
4 Grameen Koota 3075
5 Muthoot Microfin 1972
6 Asirvad Micro Finance 1793
7 Cashpor Micro Credit 1330
8 Disha Microfin Ltd 1314
9 Spandana Sphoorty 1297
10 Annapurna Microfinance 1239
Top ten MFIs
contribute
₹31,185 of loan
portfolio which
is 67% of sector’s
total and rest of
other MFIs hold
33% only.
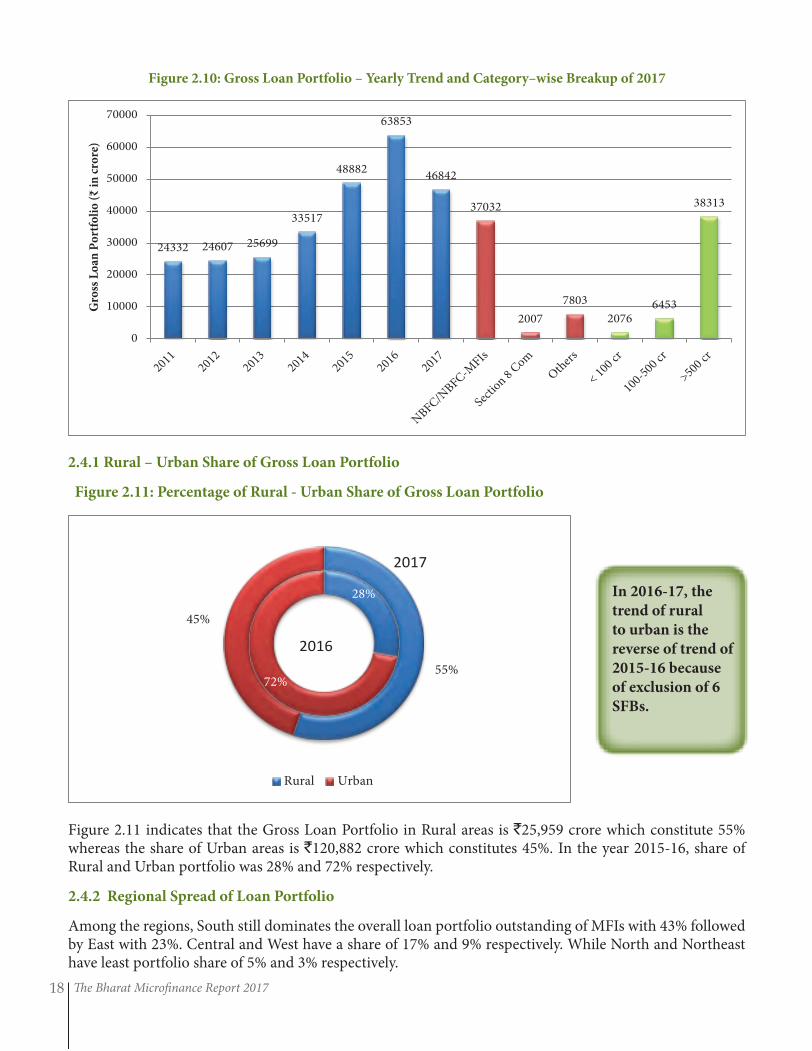
The Bharat Microfinance Report 201718
Figure 2.10: Gross Loan Portfolio – Yearly Trend and Category–wise Breakup of 2017
2.4.1 Rural – Urban Share of Gross Loan Portfolio
Figure 2.11: Percentage of Rural - Urban Share of Gross Loan Portfolio
In 2016-17, the
trend of rural
to urban is the
reverse of trend of
2015-16 because
of exclusion of 6
SFBs.
28%
72% 55%
45%
Rural Urban
2016
2017
Figure 2.11 indicates that the Gross Loan Portfolio in Rural areas is `25,959 crore which constitute 55% whereas the share of Urban areas is `120,882 crore which constitutes 45%. In the year 2015-16, share of Rural and Urban portfolio was 28% and 72% respectively.
2.4.2 Regional Spread of Loan Portfolio
Among the regions, South still dominates the overall loan portfolio outstanding of MFIs with 43% followed by East with 23%. Central and West have a share of 17% and 9% respectively. While North and Northeast have least portfolio share of 5% and 3% respectively.
24332 24607 25699
33517
48882
63853
46842
37032
2007
7803
2076 6453
38313
0
10000
20000
30000
40000
50000
60000
70000
Gro
ss L
oan
Po
rtfo
lio
(₹
in
cro
re)
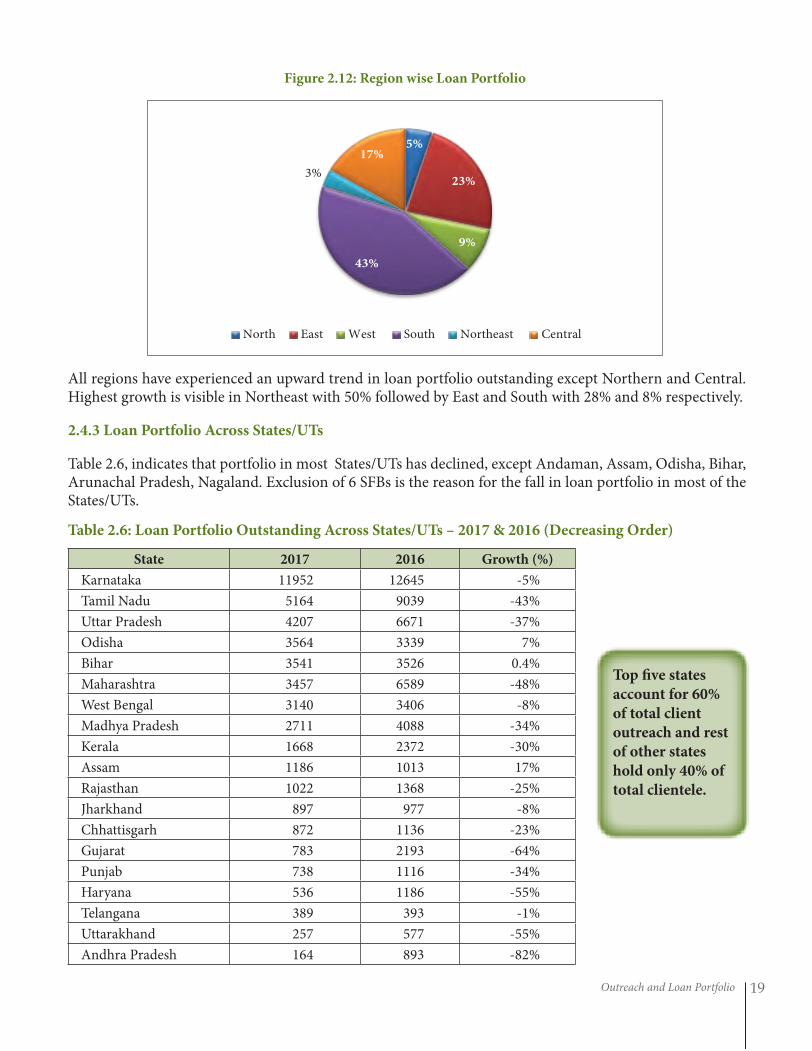
Outreach and Loan Portfolio 19
Figure 2.12: Region wise Loan Portfolio
5%
23%
9%
43%
3%
17%
North East West South Northeast Central
All regions have experienced an upward trend in loan portfolio outstanding except Northern and Central. Highest growth is visible in Northeast with 50% followed by East and South with 28% and 8% respectively.
2.4.3 Loan Portfolio Across States/UTs
Table 2.6, indicates that portfolio in most States/UTs has declined, except Andaman, Assam, Odisha, Bihar, Arunachal Pradesh, Nagaland. Exclusion of 6 SFBs is the reason for the fall in loan portfolio in most of the States/UTs.
Table 2.6: Loan Portfolio Outstanding Across States/UTs – 2017 & 2016 (Decreasing Order)
State 2017 2016 Growth (%)
Karnataka 11952 12645 -5%
Tamil Nadu 5164 9039 -43%
Uttar Pradesh 4207 6671 -37%
Odisha 3564 3339 7%
Bihar 3541 3526 0.4%
Maharashtra 3457 6589 -48%
West Bengal 3140 3406 -8%
Madhya Pradesh 2711 4088 -34%
Kerala 1668 2372 -30%
Assam 1186 1013 17%
Rajasthan 1022 1368 -25%
Jharkhand 897 977 -8%
Chhattisgarh 872 1136 -23%
Gujarat 783 2193 -64%
Punjab 738 1116 -34%
Haryana 536 1186 -55%
Telangana 389 393 -1%
Uttarakhand 257 577 -55%
Andhra Pradesh 164 893 -82%
Top five states
account for 60%
of total client
outreach and rest
of other states
hold only 40% of
total clientele.
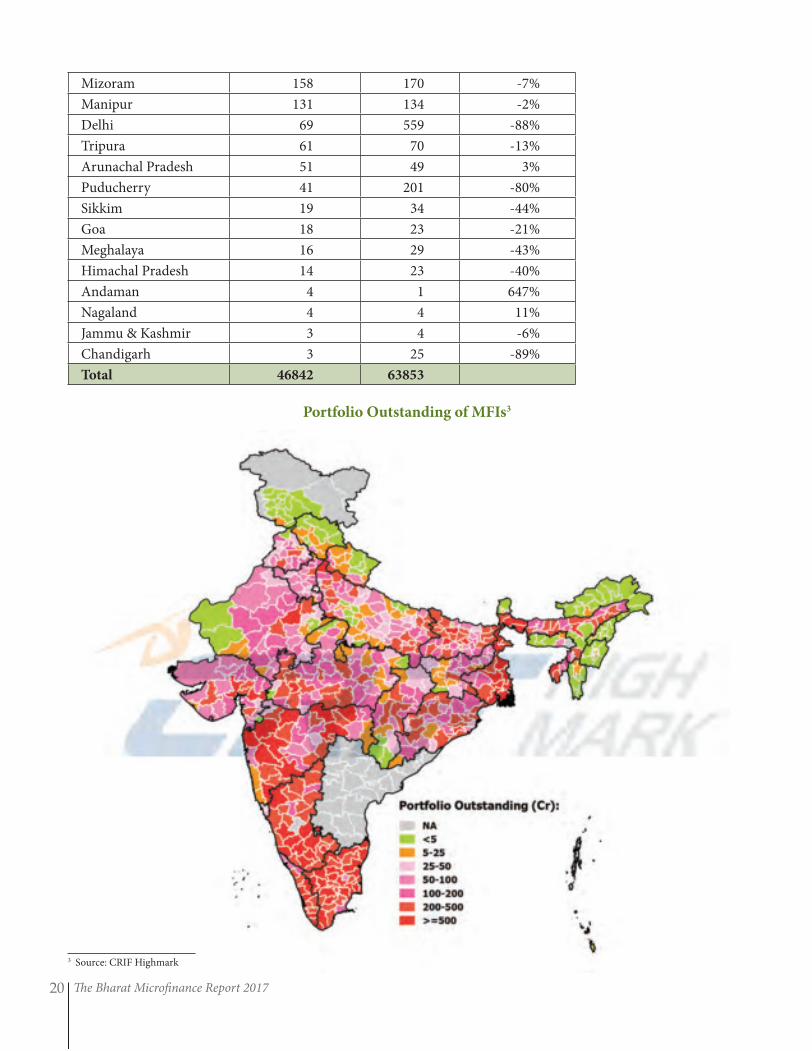
The Bharat Microfinance Report 201720
3 Source: CRIF Highmark
Mizoram 158 170 -7%
Manipur 131 134 -2%
Delhi 69 559 -88%
Tripura 61 70 -13%
Arunachal Pradesh 51 49 3%
Puducherry 41 201 -80%
Sikkim 19 34 -44%
Goa 18 23 -21%
Meghalaya 16 29 -43%
Himachal Pradesh 14 23 -40%
Andaman 4 1 647%
Nagaland 4 4 11%
Jammu & Kashmir 3 4 -6%
Chandigarh 3 25 -89%
Total 46842 63853
Portfolio Outstanding of MFIs3
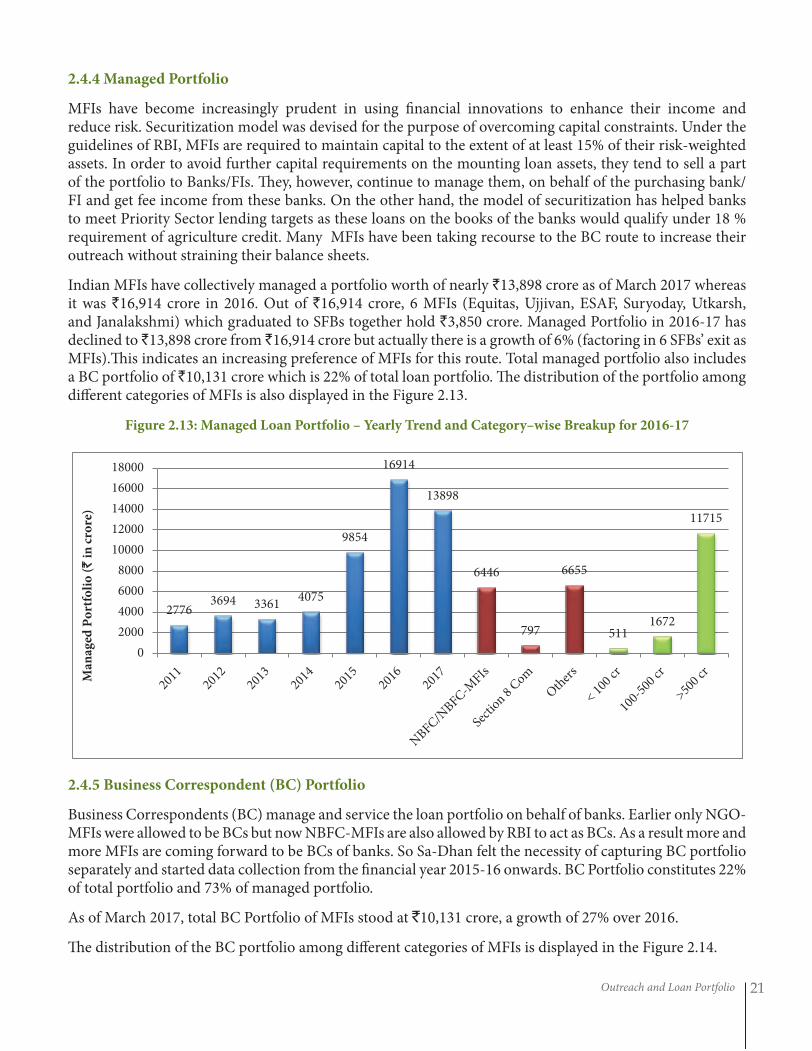
Outreach and Loan Portfolio 21
2.4.4 Managed Portfolio
MFIs have become increasingly prudent in using financial innovations to enhance their income and reduce risk. Securitization model was devised for the purpose of overcoming capital constraints. Under the guidelines of RBI, MFIs are required to maintain capital to the extent of at least 15% of their risk-weighted assets. In order to avoid further capital requirements on the mounting loan assets, they tend to sell a part of the portfolio to Banks/FIs. They, however, continue to manage them, on behalf of the purchasing bank/FI and get fee income from these banks. On the other hand, the model of securitization has helped banks to meet Priority Sector lending targets as these loans on the books of the banks would qualify under 18 % requirement of agriculture credit. Many MFIs have been taking recourse to the BC route to increase their outreach without straining their balance sheets.
Indian MFIs have collectively managed a portfolio worth of nearly `13,898 crore as of March 2017 whereas it was `16,914 crore in 2016. Out of `16,914 crore, 6 MFIs (Equitas, Ujjivan, ESAF, Suryoday, Utkarsh, and Janalakshmi) which graduated to SFBs together hold `3,850 crore. Managed Portfolio in 2016-17 has declined to `13,898 crore from `16,914 crore but actually there is a growth of 6% (factoring in 6 SFBs’ exit as MFIs).This indicates an increasing preference of MFIs for this route. Total managed portfolio also includes a BC portfolio of `10,131 crore which is 22% of total loan portfolio. The distribution of the portfolio among different categories of MFIs is also displayed in the Figure 2.13.
Figure 2.13: Managed Loan Portfolio – Yearly Trend and Category–wise Breakup for 2016-17
2.4.5 Business Correspondent (BC) Portfolio
Business Correspondents (BC) manage and service the loan portfolio on behalf of banks. Earlier only NGO-MFIs were allowed to be BCs but now NBFC-MFIs are also allowed by RBI to act as BCs. As a result more and more MFIs are coming forward to be BCs of banks. So Sa-Dhan felt the necessity of capturing BC portfolio separately and started data collection from the financial year 2015-16 onwards. BC Portfolio constitutes 22% of total portfolio and 73% of managed portfolio.
As of March 2017, total BC Portfolio of MFIs stood at `10,131 crore, a growth of 27% over 2016.
The distribution of the BC portfolio among different categories of MFIs is displayed in the Figure 2.14.
2776 3694 3361
4075
9854
16914
13898
6446
797
6655
511 1672
11715
0
2000
4000
6000
8000
10000
12000
14000
16000
18000
Man
aged
Po
rtfo
lio
(`
in
cro
re)
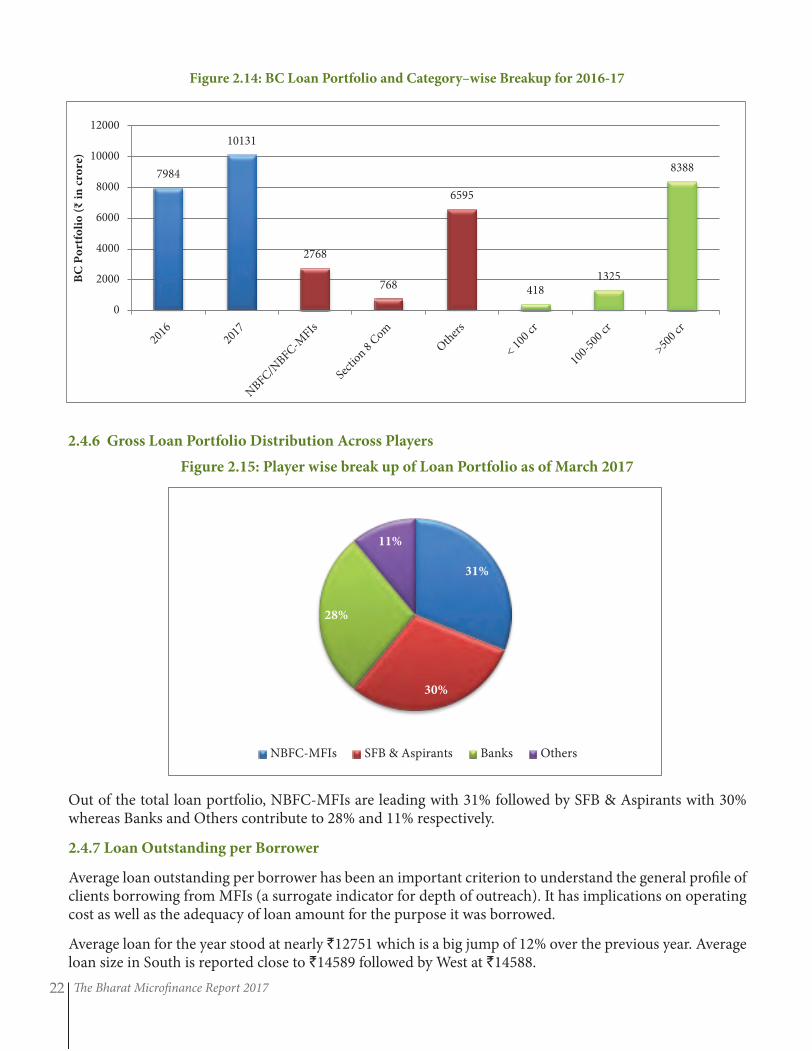
The Bharat Microfinance Report 201722
Figure 2.14: BC Loan Portfolio and Category–wise Breakup for 2016-17
2.4.6 Gross Loan Portfolio Distribution Across Players
Figure 2.15: Player wise break up of Loan Portfolio as of March 2017
Out of the total loan portfolio, NBFC-MFIs are leading with 31% followed by SFB & Aspirants with 30% whereas Banks and Others contribute to 28% and 11% respectively.
2.4.7 Loan Outstanding per Borrower
Average loan outstanding per borrower has been an important criterion to understand the general profile of clients borrowing from MFIs (a surrogate indicator for depth of outreach). It has implications on operating cost as well as the adequacy of loan amount for the purpose it was borrowed.
Average loan for the year stood at nearly `12751 which is a big jump of 12% over the previous year. Average loan size in South is reported close to `14589 followed by West at `14588.
31%
30%
28%
11%
NBFC-MFIs SFB & Aspirants Banks Others
7984
10131
2768
768
6595
418 1325
8388
0
2000
4000
6000
8000
10000
12000
BC
Po
rtfo
lio
(₹
in
cro
re)
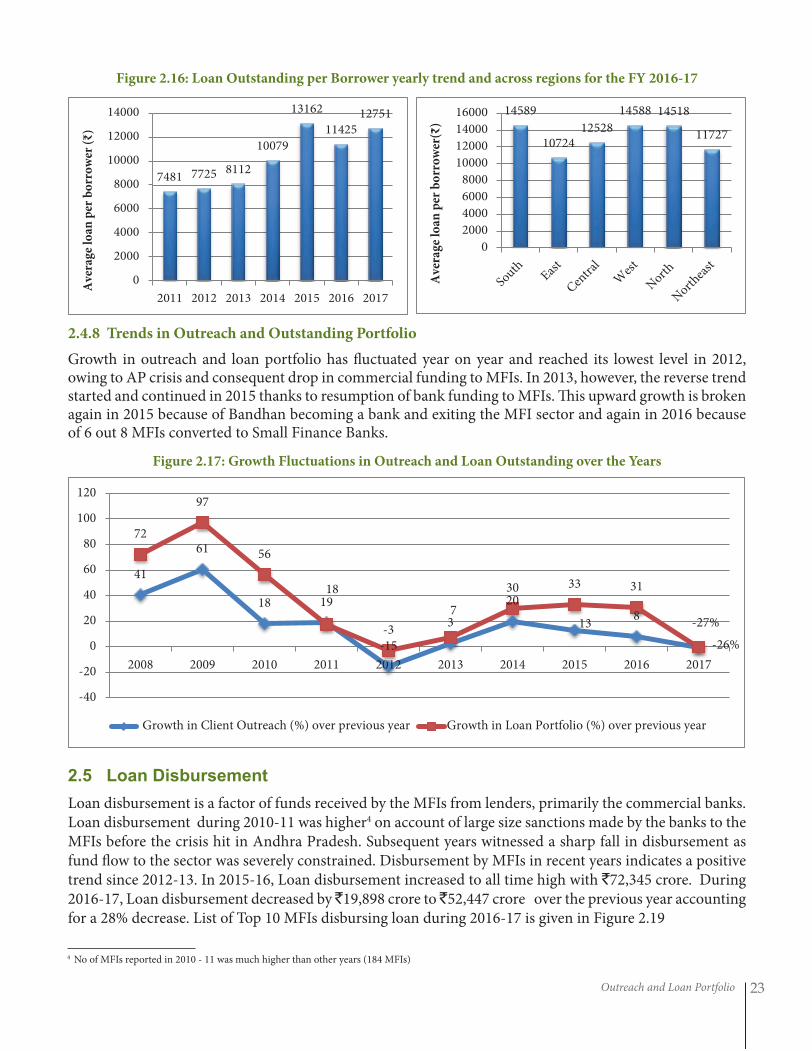
Outreach and Loan Portfolio 23
Figure 2.16: Loan Outstanding per Borrower yearly trend and across regions for the FY 2016-17
4 No of MFIs reported in 2010 - 11 was much higher than other years (184 MFIs)
14589
10724 12528
14588 14518
11727
0
2000
4000
6000
8000
10000
12000
14000
16000
Ave
rage
loan
per
bo
rro
wer
(₹)
7481 7725 8112
10079
13162
11425
12751
0
2000
4000
6000
8000
10000
12000
14000
2011 2012 2013 2014 2015 2016 2017
Ave
rage
loan
per
bo
rro
wer
(₹
)
2.4.8 Trends in Outreach and Outstanding Portfolio
Growth in outreach and loan portfolio has fluctuated year on year and reached its lowest level in 2012, owing to AP crisis and consequent drop in commercial funding to MFIs. In 2013, however, the reverse trend started and continued in 2015 thanks to resumption of bank funding to MFIs. This upward growth is broken again in 2015 because of Bandhan becoming a bank and exiting the MFI sector and again in 2016 because of 6 out 8 MFIs converted to Small Finance Banks.
Figure 2.17: Growth Fluctuations in Outreach and Loan Outstanding over the Years
2.5 LoanDisbursementLoan disbursement is a factor of funds received by the MFIs from lenders, primarily the commercial banks. Loan disbursement during 2010-11 was higher4 on account of large size sanctions made by the banks to the MFIs before the crisis hit in Andhra Pradesh. Subsequent years witnessed a sharp fall in disbursement as fund flow to the sector was severely constrained. Disbursement by MFIs in recent years indicates a positive trend since 2012-13. In 2015-16, Loan disbursement increased to all time high with `72,345 crore. During 2016-17, Loan disbursement decreased by ̀ 19,898 crore to ̀ 52,447 crore over the previous year accounting for a 28% decrease. List of Top 10 MFIs disbursing loan during 2016-17 is given in Figure 2.19
41
61
18 19
-15
3
20
13 8
-26%
72
97
56
18
-3
7
30 33 31
-27%
-40
-20
0
20
40
60
80
100
120
2008 2009 2010 2011 2012 2013 2014 2015 2016 2017
Growth in Client Outreach (%) over previous year Growth in Loan Portfolio (%) over previous year
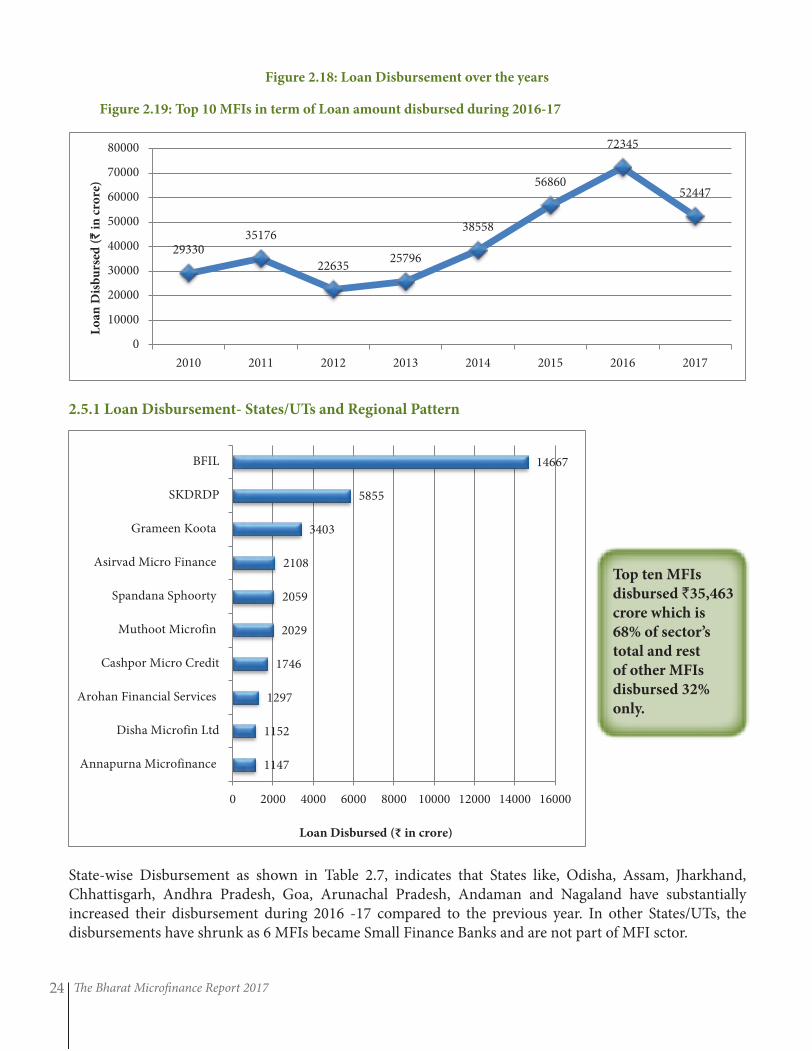
The Bharat Microfinance Report 201724
Figure 2.18: Loan Disbursement over the years
Figure 2.19: Top 10 MFIs in term of Loan amount disbursed during 2016-17
2.5.1 Loan Disbursement- States/UTs and Regional Pattern
29330 35176
22635 25796
38558
56860
72345
52447
0
10000
20000
30000
40000
50000
60000
70000
80000
2010 2011 2012 2013 2014 2015 2016 2017
Lo
an D
isb
urs
ed (`
in
cro
re)
Top ten MFIs
disbursed `35,463
crore which is
68% of sector’s
total and rest
of other MFIs
disbursed 32%
only.
State-wise Disbursement as shown in Table 2.7, indicates that States like, Odisha, Assam, Jharkhand, Chhattisgarh, Andhra Pradesh, Goa, Arunachal Pradesh, Andaman and Nagaland have substantially increased their disbursement during 2016 -17 compared to the previous year. In other States/UTs, the disbursements have shrunk as 6 MFIs became Small Finance Banks and are not part of MFI sctor.
1147
1152
1297
1746
2029
2059
2108
3403
5855
14667
0 2000 4000 6000 8000 10000 12000 14000 16000
Annapurna Microfinance
Disha Microfin Ltd
Arohan Financial Services
Cashpor Micro Credit
Muthoot Microfin
Spandana Sphoorty
Asirvad Micro Finance
Grameen Koota
SKDRDP
BFIL
Loan Disbursed (₹ in crore)
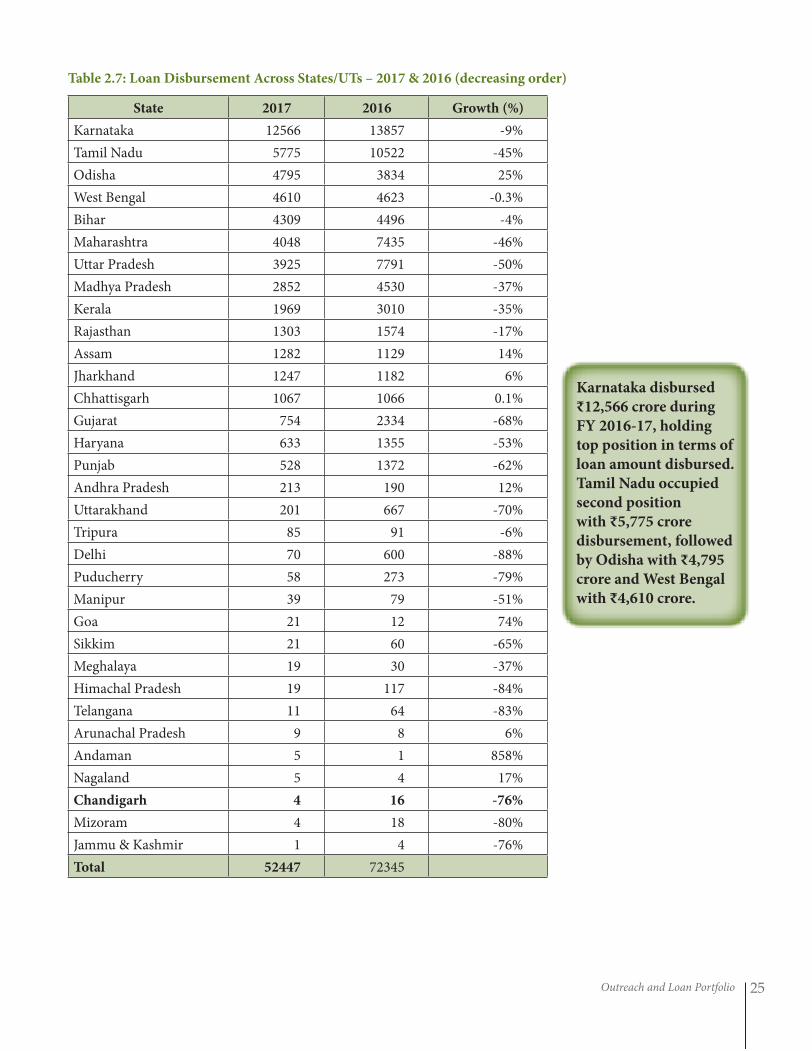
Outreach and Loan Portfolio 25
Table 2.7: Loan Disbursement Across States/UTs – 2017 & 2016 (decreasing order)
State 2017 2016 Growth (%)
Karnataka 12566 13857 -9%
Tamil Nadu 5775 10522 -45%
Odisha 4795 3834 25%
West Bengal 4610 4623 -0.3%
Bihar 4309 4496 -4%
Maharashtra 4048 7435 -46%
Uttar Pradesh 3925 7791 -50%
Madhya Pradesh 2852 4530 -37%
Kerala 1969 3010 -35%
Rajasthan 1303 1574 -17%
Assam 1282 1129 14%
Jharkhand 1247 1182 6%
Chhattisgarh 1067 1066 0.1%
Gujarat 754 2334 -68%
Haryana 633 1355 -53%
Punjab 528 1372 -62%
Andhra Pradesh 213 190 12%
Uttarakhand 201 667 -70%
Tripura 85 91 -6%
Delhi 70 600 -88%
Puducherry 58 273 -79%
Manipur 39 79 -51%
Goa 21 12 74%
Sikkim 21 60 -65%
Meghalaya 19 30 -37%
Himachal Pradesh 19 117 -84%
Telangana 11 64 -83%
Arunachal Pradesh 9 8 6%
Andaman 5 1 858%
Nagaland 5 4 17%
Chandigarh 4 16 -76%
Mizoram 4 18 -80%
Jammu & Kashmir 1 4 -76%
Total 52447 72345
Karnataka disbursed
₹12,566 crore during
FY 2016-17, holding
top position in terms of
loan amount disbursed.
Tamil Nadu occupied
second position
with ₹5,775 crore
disbursement, followed
by Odisha with ₹4,795
crore and West Bengal
with ₹4,610 crore.
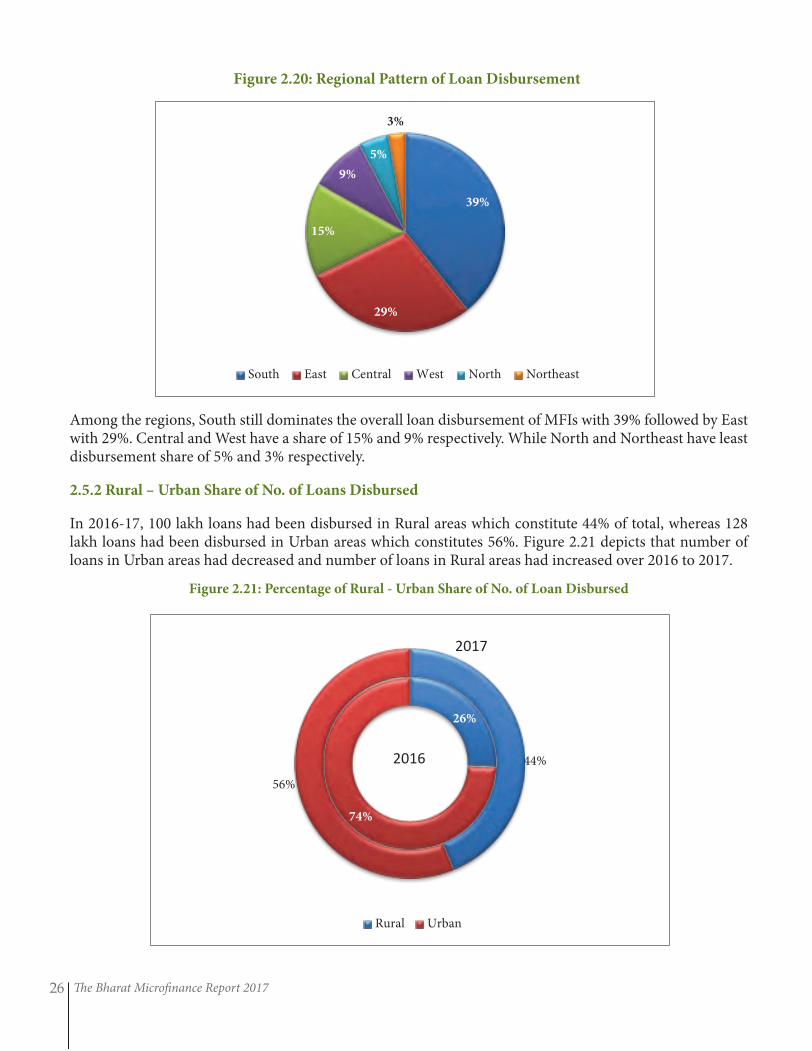
The Bharat Microfinance Report 201726
Figure 2.20: Regional Pattern of Loan Disbursement
Among the regions, South still dominates the overall loan disbursement of MFIs with 39% followed by East with 29%. Central and West have a share of 15% and 9% respectively. While North and Northeast have least disbursement share of 5% and 3% respectively.
2.5.2 Rural – Urban Share of No. of Loans Disbursed
In 2016-17, 100 lakh loans had been disbursed in Rural areas which constitute 44% of total, whereas 128 lakh loans had been disbursed in Urban areas which constitutes 56%. Figure 2.21 depicts that number of loans in Urban areas had decreased and number of loans in Rural areas had increased over 2016 to 2017.
Figure 2.21: Percentage of Rural - Urban Share of No. of Loan Disbursed
39%
29%
15%
9%
5%
3%
South East Central West North Northeast
26%
74%
44%
56%
Rural Urban
2016
2017
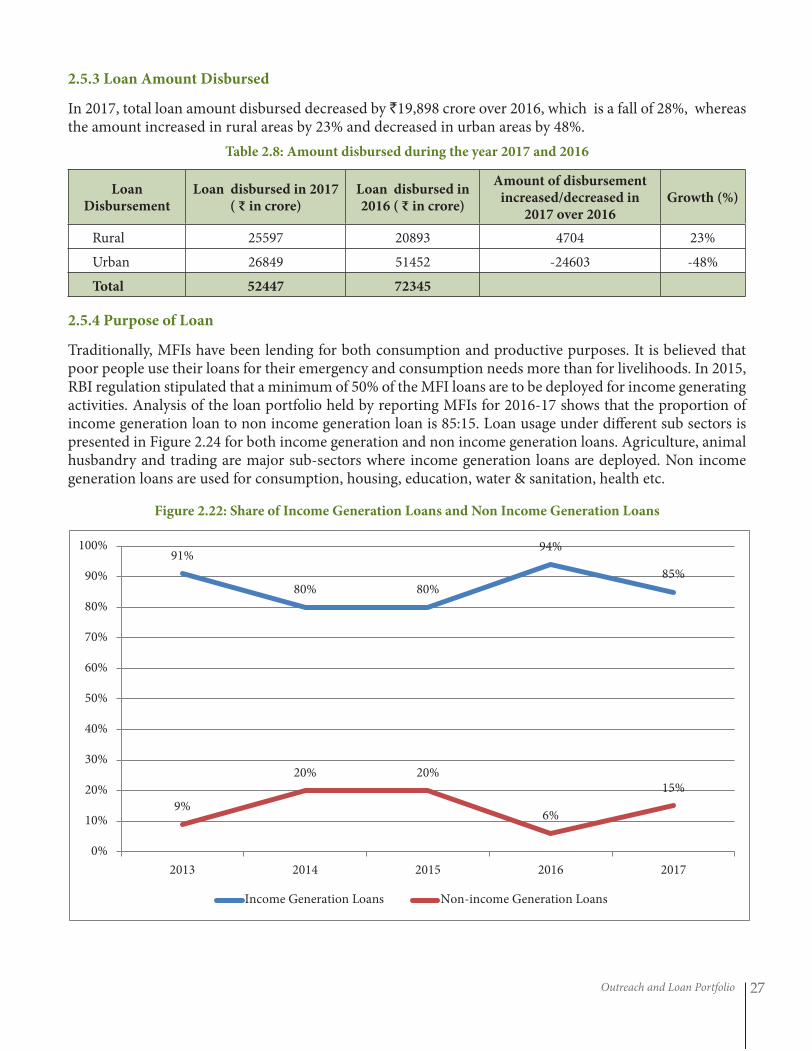
Outreach and Loan Portfolio 27
2.5.3 Loan Amount Disbursed
In 2017, total loan amount disbursed decreased by `19,898 crore over 2016, which is a fall of 28%, whereas the amount increased in rural areas by 23% and decreased in urban areas by 48%.
Table 2.8: Amount disbursed during the year 2017 and 2016
Loan Disbursement
Loan disbursed in 2017 ( ₹ in crore)
Loan disbursed in 2016 ( ₹ in crore)
Amount of disbursement increased/decreased in
2017 over 2016Growth (%)
Rural 25597 20893 4704 23%
Urban 26849 51452 -24603 -48%
Total 52447 72345
2.5.4 Purpose of Loan
Traditionally, MFIs have been lending for both consumption and productive purposes. It is believed that poor people use their loans for their emergency and consumption needs more than for livelihoods. In 2015, RBI regulation stipulated that a minimum of 50% of the MFI loans are to be deployed for income generating activities. Analysis of the loan portfolio held by reporting MFIs for 2016-17 shows that the proportion of income generation loan to non income generation loan is 85:15. Loan usage under different sub sectors is presented in Figure 2.24 for both income generation and non income generation loans. Agriculture, animal husbandry and trading are major sub-sectors where income generation loans are deployed. Non income generation loans are used for consumption, housing, education, water & sanitation, health etc.
Figure 2.22: Share of Income Generation Loans and Non Income Generation Loans
91%
80% 80%
94%
85%
9%
20% 20%
6%
15%
0%
10%
20%
30%
40%
50%
60%
70%
80%
90%
100%
2013 2014 2015 2016 2017
Income Generation Loans Non-income Generation Loans
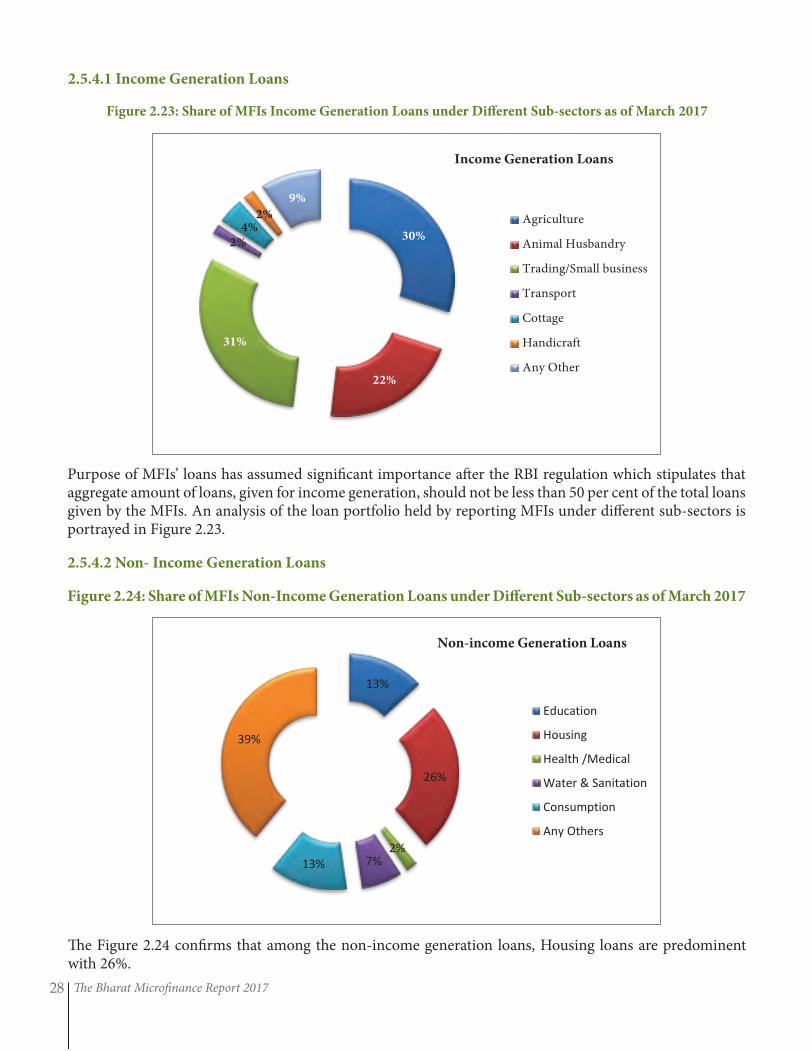
The Bharat Microfinance Report 201728
2.5.4.1 Income Generation Loans
Figure 2.23: Share of MFIs Income Generation Loans under Different Sub-sectors as of March 2017
Purpose of MFIs’ loans has assumed significant importance after the RBI regulation which stipulates that aggregate amount of loans, given for income generation, should not be less than 50 per cent of the total loans given by the MFIs. An analysis of the loan portfolio held by reporting MFIs under different sub-sectors is portrayed in Figure 2.23.
2.5.4.2 Non- Income Generation Loans
Figure 2.24: Share of MFIs Non-Income Generation Loans under Different Sub-sectors as of March 2017
30%
22%
31%
2% 4%
2%
9%
Agriculture
Animal Husbandry
Trading/Small business
Transport
Cottage
Handicraft
Any Other
Income Generation Loans
13%
26%
2% 7% 13%
39%
Education
Housing
Health /Medical
Water & Sanitation
Consumption
Any Others
Non-income Generation Loans
The Figure 2.24 confirms that among the non-income generation loans, Housing loans are predominent with 26%.
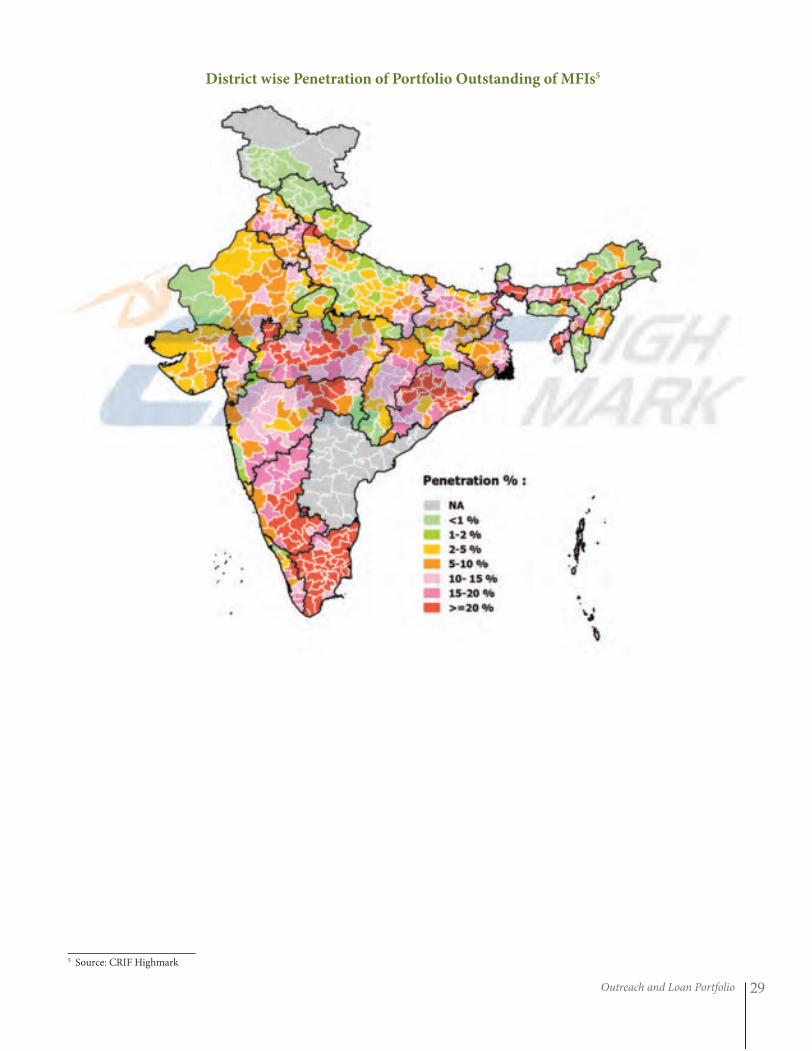
Outreach and Loan Portfolio 29
5 Source: CRIF Highmark
District wise Penetration of Portfolio Outstanding of MFIs5
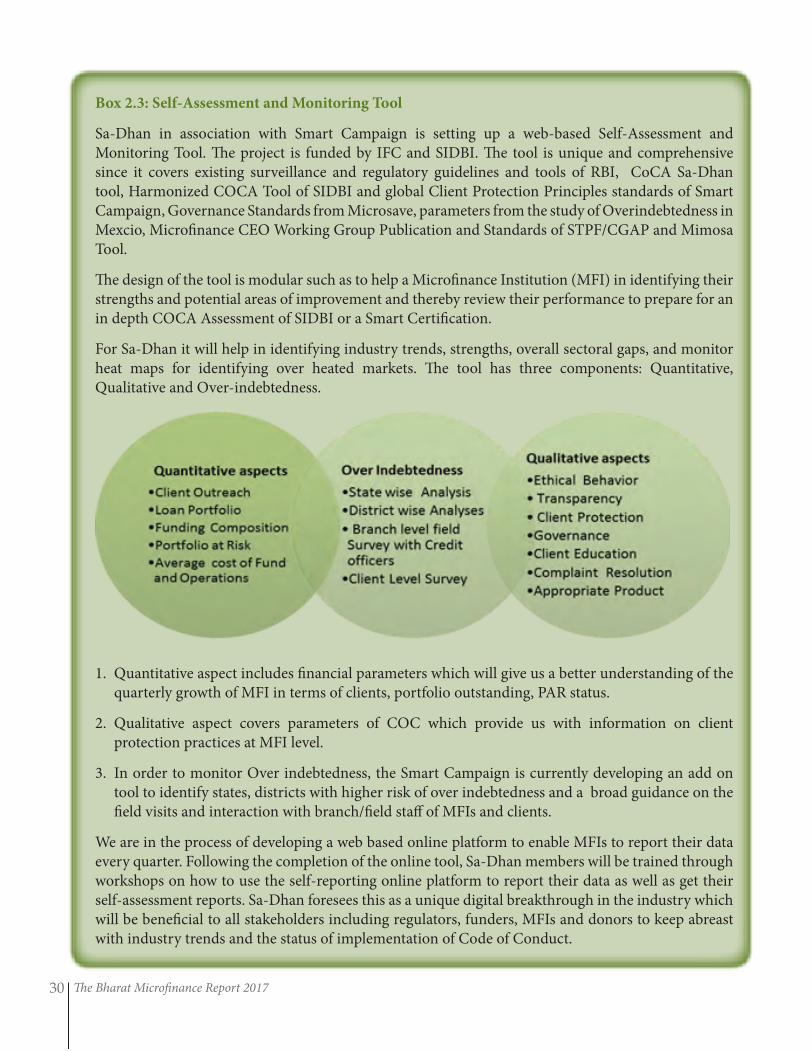
The Bharat Microfinance Report 201730
Box 2.3: Self-Assessment and Monitoring Tool
Sa-Dhan in association with Smart Campaign is setting up a web-based Self-Assessment and Monitoring Tool. The project is funded by IFC and SIDBI. The tool is unique and comprehensive since it covers existing surveillance and regulatory guidelines and tools of RBI, CoCA Sa-Dhan tool, Harmonized COCA Tool of SIDBI and global Client Protection Principles standards of Smart Campaign, Governance Standards from Microsave, parameters from the study of Overindebtedness in Mexcio, Microfinance CEO Working Group Publication and Standards of STPF/CGAP and Mimosa Tool.
The design of the tool is modular such as to help a Microfinance Institution (MFI) in identifying their strengths and potential areas of improvement and thereby review their performance to prepare for an in depth COCA Assessment of SIDBI or a Smart Certification.
For Sa-Dhan it will help in identifying industry trends, strengths, overall sectoral gaps, and monitor heat maps for identifying over heated markets. The tool has three components: Quantitative, Qualitative and Over-indebtedness.
1. Quantitative aspect includes financial parameters which will give us a better understanding of the quarterly growth of MFI in terms of clients, portfolio outstanding, PAR status.
2. Qualitative aspect covers parameters of COC which provide us with information on client protection practices at MFI level.
3. In order to monitor Over indebtedness, the Smart Campaign is currently developing an add on tool to identify states, districts with higher risk of over indebtedness and a broad guidance on the field visits and interaction with branch/field staff of MFIs and clients.
We are in the process of developing a web based online platform to enable MFIs to report their data every quarter. Following the completion of the online tool, Sa-Dhan members will be trained through workshops on how to use the self-reporting online platform to report their data as well as get their self-assessment reports. Sa-Dhan foresees this as a unique digital breakthrough in the industry which will be beneficial to all stakeholders including regulators, funders, MFIs and donors to keep abreast with industry trends and the status of implementation of Code of Conduct.
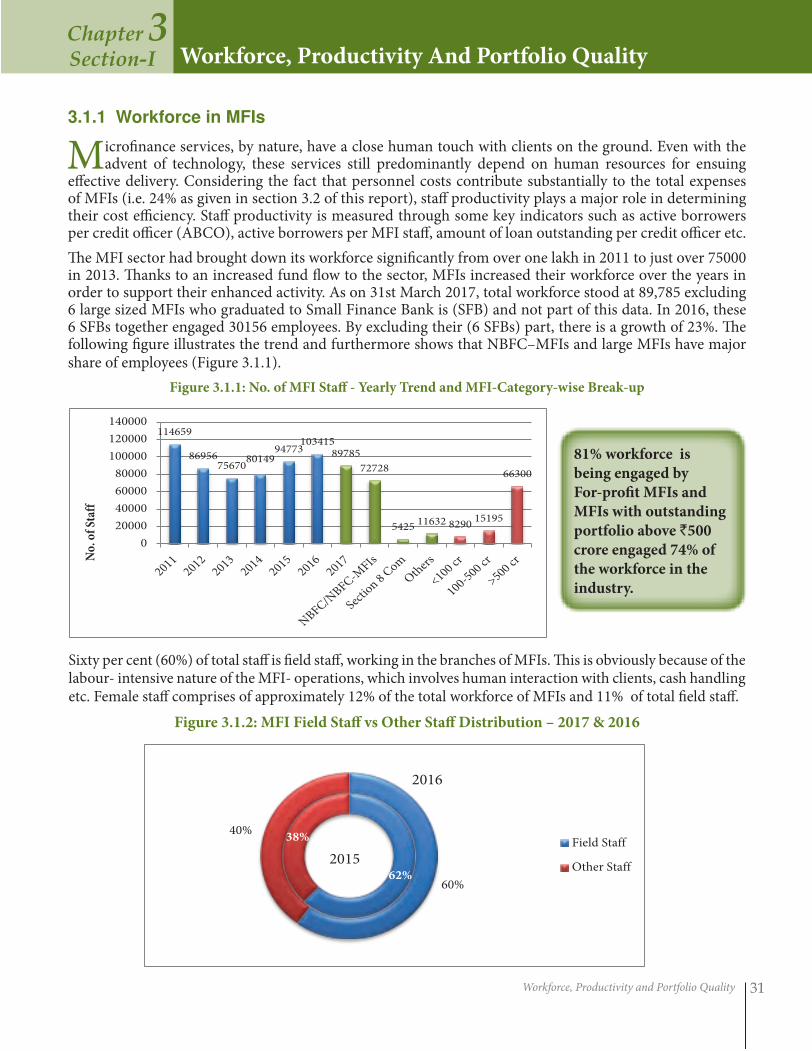
Workforce, Productivity and Portfolio Quality 31
3.1.1 Workforce in MFIs
Microfinance services, by nature, have a close human touch with clients on the ground. Even with the advent of technology, these services still predominantly depend on human resources for ensuing
effective delivery. Considering the fact that personnel costs contribute substantially to the total expenses of MFIs (i.e. 24% as given in section 3.2 of this report), staff productivity plays a major role in determining their cost efficiency. Staff productivity is measured through some key indicators such as active borrowers per credit officer (ABCO), active borrowers per MFI staff, amount of loan outstanding per credit officer etc.
The MFI sector had brought down its workforce significantly from over one lakh in 2011 to just over 75000 in 2013. Thanks to an increased fund flow to the sector, MFIs increased their workforce over the years in order to support their enhanced activity. As on 31st March 2017, total workforce stood at 89,785 excluding 6 large sized MFIs who graduated to Small Finance Bank is (SFB) and not part of this data. In 2016, these 6 SFBs together engaged 30156 employees. By excluding their (6 SFBs) part, there is a growth of 23%. The following figure illustrates the trend and furthermore shows that NBFC–MFIs and large MFIs have major share of employees (Figure 3.1.1).
Figure 3.1.1: No. of MFI Staff - Yearly Trend and MFI-Category-wise Break-up
Workforce, Productivity And Portfolio QualityChapter 3Section-I
Sixty per cent (60%) of total staff is field staff, working in the branches of MFIs. This is obviously because of the labour- intensive nature of the MFI- operations, which involves human interaction with clients, cash handling etc. Female staff comprises of approximately 12% of the total workforce of MFIs and 11% of total field staff.
Figure 3.1.2: MFI Field Staff vs Other Staff Distribution – 2017 & 2016
81% workforce is
being engaged by
For-profit MFIs and
MFIs with outstanding
portfolio above `500
crore engaged 74% of
the workforce in the
industry.
114659
86956 75670
80149 94773
103415 89785
72728
5425 11632 8290
15195
66300
0
20000
40000
60000
80000
100000
120000
140000
No.
of
Staf
f
62%
38%
60%
40% Field Staff
Other Staff2015
2016
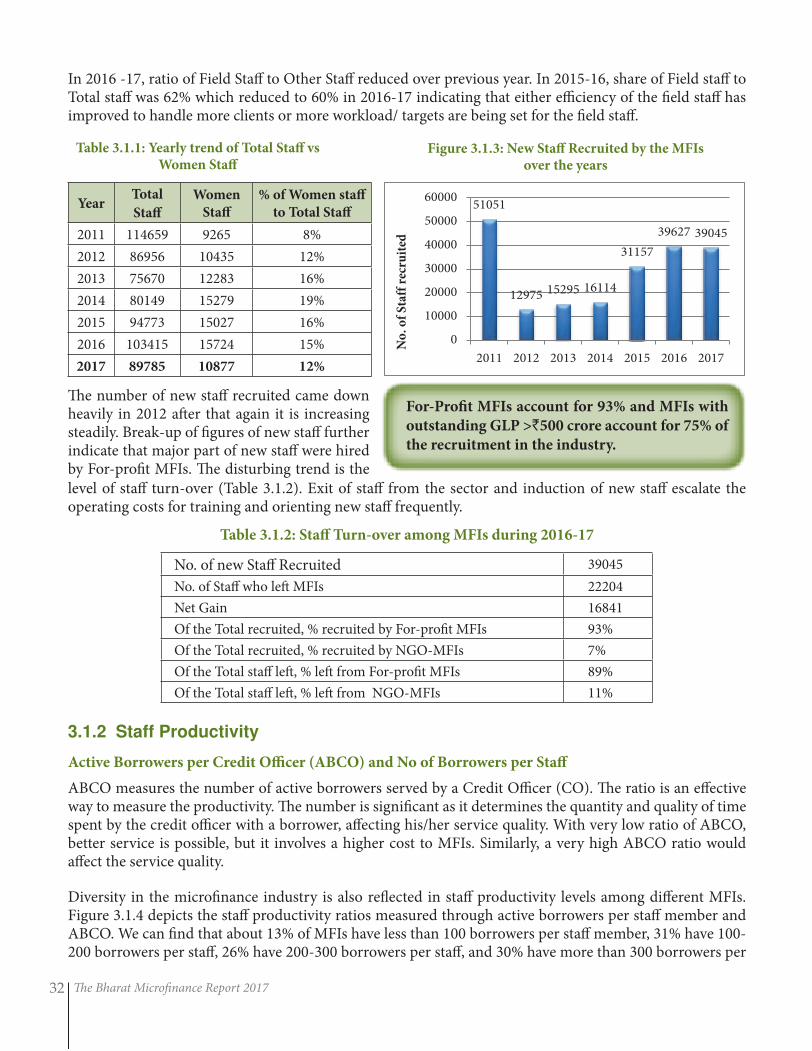
The Bharat Microfinance Report 201732
In 2016 -17, ratio of Field Staff to Other Staff reduced over previous year. In 2015-16, share of Field staff to Total staff was 62% which reduced to 60% in 2016-17 indicating that either efficiency of the field staff has improved to handle more clients or more workload/ targets are being set for the field staff.
Table 3.1.1: Yearly trend of Total Staff vs Women Staff
YearTotal
Staff
Women
Staff
% of Women staff
to Total Staff
2011 114659 9265 8%
2012 86956 10435 12%
2013 75670 12283 16%
2014 80149 15279 19%
2015 94773 15027 16%
2016 103415 15724 15%
2017 89785 10877 12%
Figure 3.1.3: New Staff Recruited by the MFIs over the years
The number of new staff recruited came down heavily in 2012 after that again it is increasing steadily. Break-up of figures of new staff further indicate that major part of new staff were hired by For-profit MFIs. The disturbing trend is the
For-Profit MFIs account for 93% and MFIs with
outstanding GLP >`500 crore account for 75% of
the recruitment in the industry.
Table 3.1.2: Staff Turn-over among MFIs during 2016-17
No. of new Staff Recruited 39045
No. of Staff who left MFIs 22204
Net Gain 16841
Of the Total recruited, % recruited by For-profit MFIs 93%
Of the Total recruited, % recruited by NGO-MFIs 7%
Of the Total staff left, % left from For-profit MFIs 89%
Of the Total staff left, % left from NGO-MFIs 11%
3.1.2 Staff Productivity
Active Borrowers per Credit Officer (ABCO) and No of Borrowers per Staff
ABCO measures the number of active borrowers served by a Credit Officer (CO). The ratio is an effective way to measure the productivity. The number is significant as it determines the quantity and quality of time spent by the credit officer with a borrower, affecting his/her service quality. With very low ratio of ABCO, better service is possible, but it involves a higher cost to MFIs. Similarly, a very high ABCO ratio would affect the service quality.
Diversity in the microfinance industry is also reflected in staff productivity levels among different MFIs. Figure 3.1.4 depicts the staff productivity ratios measured through active borrowers per staff member and ABCO. We can find that about 13% of MFIs have less than 100 borrowers per staff member, 31% have 100-200 borrowers per staff, 26% have 200-300 borrowers per staff, and 30% have more than 300 borrowers per
level of staff turn-over (Table 3.1.2). Exit of staff from the sector and induction of new staff escalate the operating costs for training and orienting new staff frequently.
51051
12975 15295 16114
31157
39627 39045
0
10000
20000
30000
40000
50000
60000
2011 2012 2013 2014 2015 2016 2017
No
. of
Sta
ff r
ecru
ited
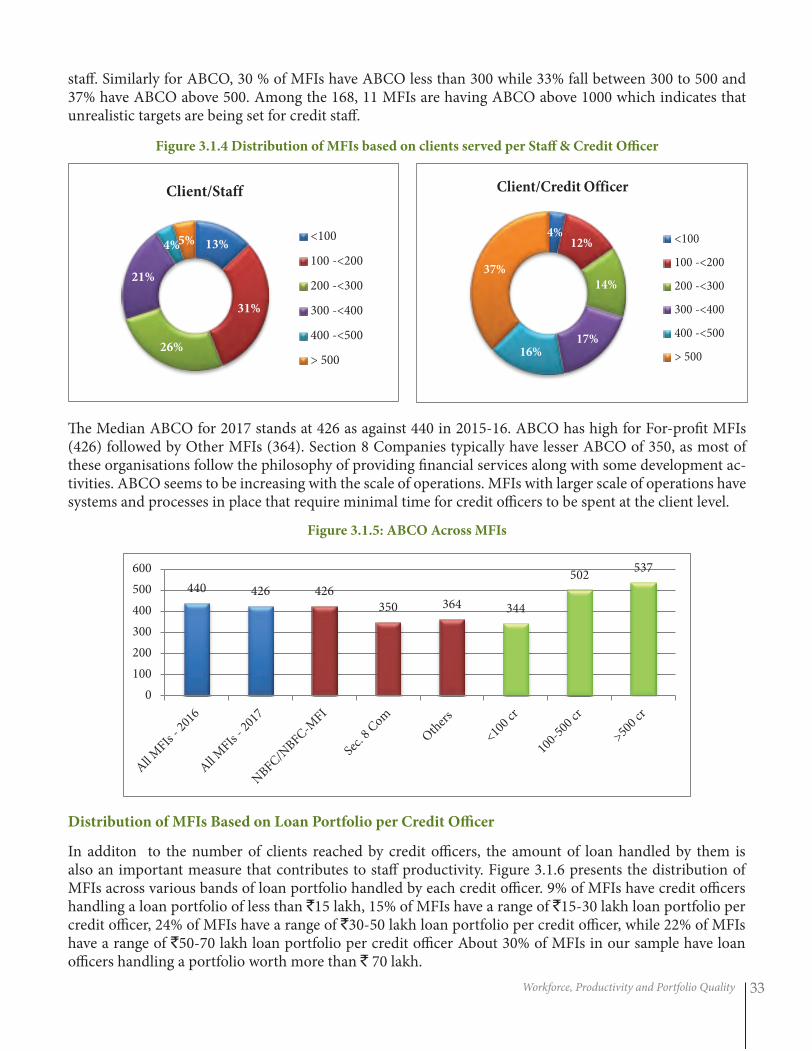
Workforce, Productivity and Portfolio Quality 33
staff. Similarly for ABCO, 30 % of MFIs have ABCO less than 300 while 33% fall between 300 to 500 and 37% have ABCO above 500. Among the 168, 11 MFIs are having ABCO above 1000 which indicates that unrealistic targets are being set for credit staff.
Figure 3.1.4 Distribution of MFIs based on clients served per Staff & Credit Officer
The Median ABCO for 2017 stands at 426 as against 440 in 2015-16. ABCO has high for For-profit MFIs (426) followed by Other MFIs (364). Section 8 Companies typically have lesser ABCO of 350, as most of these organisations follow the philosophy of providing financial services along with some development ac-tivities. ABCO seems to be increasing with the scale of operations. MFIs with larger scale of operations have systems and processes in place that require minimal time for credit officers to be spent at the client level.
Figure 3.1.5: ABCO Across MFIs
Distribution of MFIs Based on Loan Portfolio per Credit Officer
In additon to the number of clients reached by credit officers, the amount of loan handled by them is also an important measure that contributes to staff productivity. Figure 3.1.6 presents the distribution of MFIs across various bands of loan portfolio handled by each credit officer. 9% of MFIs have credit officers handling a loan portfolio of less than `15 lakh, 15% of MFIs have a range of `15-30 lakh loan portfolio per credit officer, 24% of MFIs have a range of `30-50 lakh loan portfolio per credit officer, while 22% of MFIs have a range of `50-70 lakh loan portfolio per credit officer About 30% of MFIs in our sample have loan officers handling a portfolio worth more than ` 70 lakh.
440 426 426 350 364 344
502 537
0
100
200
300
400
500
600
13%
31%
26%
21%
4% 5%
Client/Staff
<100
100 -<200
200 -<300
300 -<400
400 -<500
> 500
4% 12%
14%
17% 16%
37%
Client/Credit Officer
<100
100 -<200
200 -<300
300 -<400
400 -<500
> 500
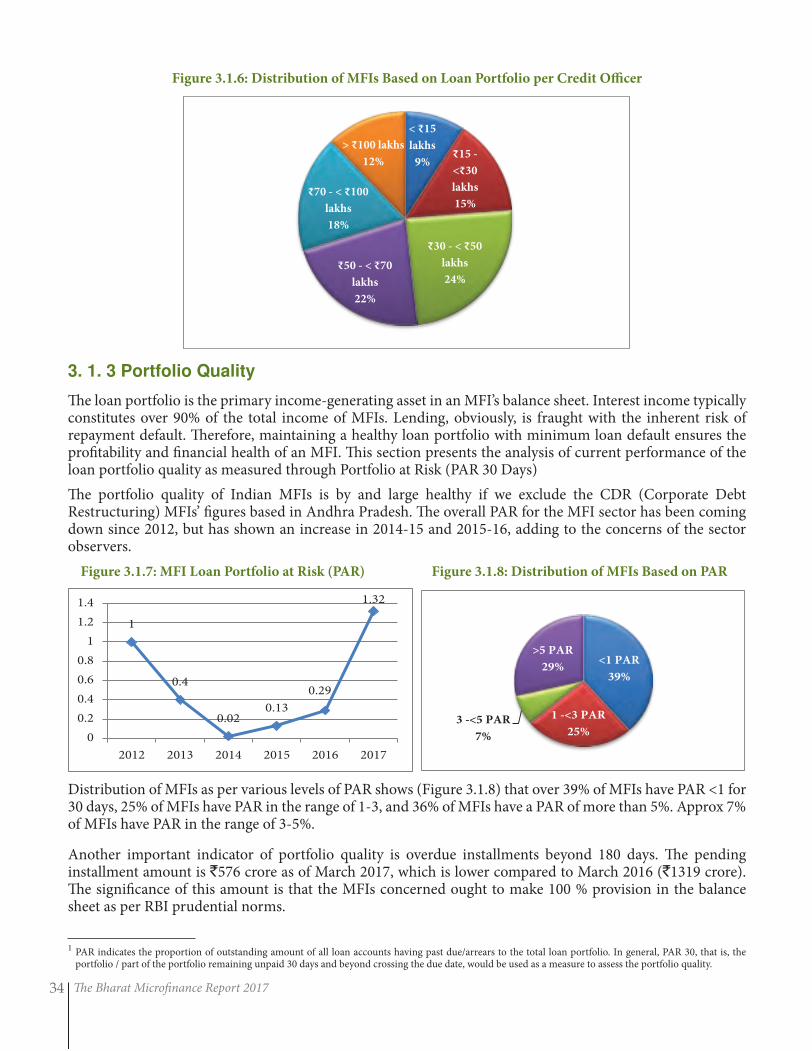
The Bharat Microfinance Report 201734
1 PAR indicates the proportion of outstanding amount of all loan accounts having past due/arrears to the total loan portfolio. In general, PAR 30, that is, the portfolio / part of the portfolio remaining unpaid 30 days and beyond crossing the due date, would be used as a measure to assess the portfolio quality.
3. 1. 3 Portfolio Quality
The loan portfolio is the primary income-generating asset in an MFI’s balance sheet. Interest income typically constitutes over 90% of the total income of MFIs. Lending, obviously, is fraught with the inherent risk of repayment default. Therefore, maintaining a healthy loan portfolio with minimum loan default ensures the profitability and financial health of an MFI. This section presents the analysis of current performance of the loan portfolio quality as measured through Portfolio at Risk (PAR 30 Days)
The portfolio quality of Indian MFIs is by and large healthy if we exclude the CDR (Corporate Debt Restructuring) MFIs’ figures based in Andhra Pradesh. The overall PAR for the MFI sector has been coming down since 2012, but has shown an increase in 2014-15 and 2015-16, adding to the concerns of the sector observers.
Figure 3.1.7: MFI Loan Portfolio at Risk (PAR) Figure 3.1.8: Distribution of MFIs Based on PAR
Figure 3.1.6: Distribution of MFIs Based on Loan Portfolio per Credit Officer
Distribution of MFIs as per various levels of PAR shows (Figure 3.1.8) that over 39% of MFIs have PAR <1 for 30 days, 25% of MFIs have PAR in the range of 1-3, and 36% of MFIs have a PAR of more than 5%. Approx 7% of MFIs have PAR in the range of 3-5%.
Another important indicator of portfolio quality is overdue installments beyond 180 days. The pending installment amount is `576 crore as of March 2017, which is lower compared to March 2016 (`1319 crore). The significance of this amount is that the MFIs concerned ought to make 100 % provision in the balance sheet as per RBI prudential norms.
1
0.4
0.02 0.13
0.29
1.32
0
0.2
0.4
0.6
0.8
1
1.2
1.4
2012 2013 2014 2015 2016 2017
<1 PAR
39%
1 -<3 PAR
25% 3 -<5 PAR
7%
>5 PAR
29%
< ₹15
lakhs
9% ₹15 -
<₹30
lakhs
15%
₹30 - < ₹50
lakhs
24% ₹50 - < ₹70
lakhs
22%
₹70 - < ₹100
lakhs
18%
> ₹100 lakhs
12%
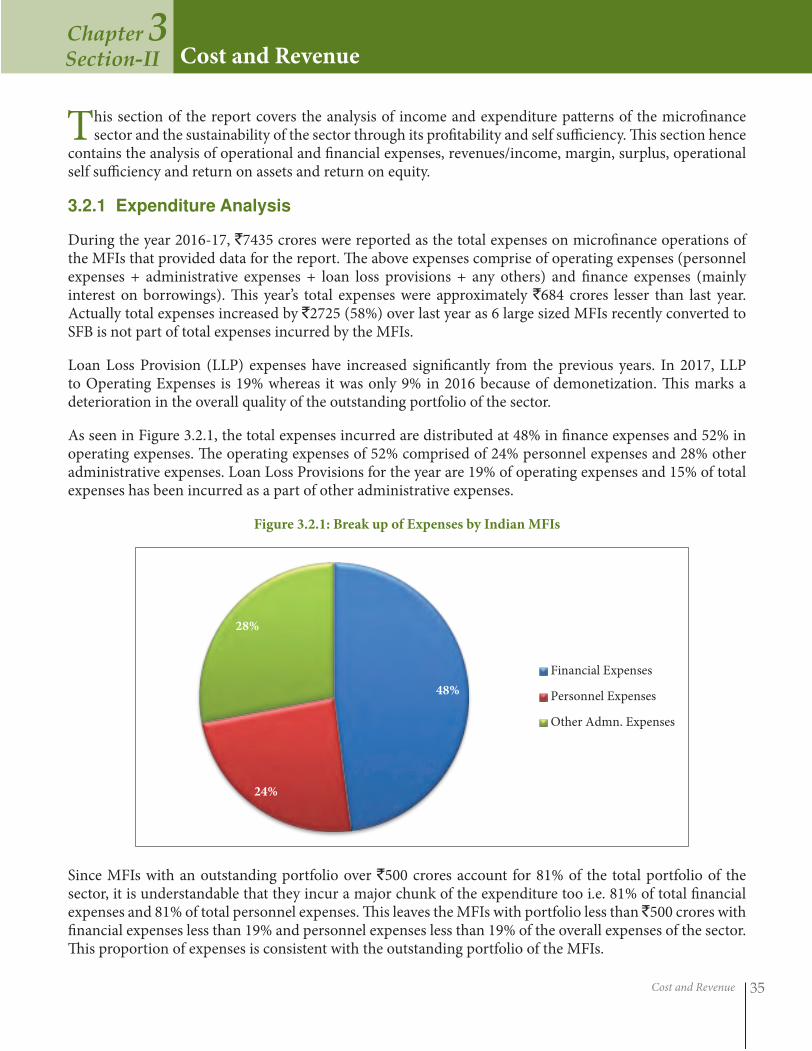
Cost and Revenue 35
Cost and RevenueChapter 3Section-II
This section of the report covers the analysis of income and expenditure patterns of the microfinance sector and the sustainability of the sector through its profitability and self sufficiency. This section hence
contains the analysis of operational and financial expenses, revenues/income, margin, surplus, operational self sufficiency and return on assets and return on equity.
3.2.1 Expenditure Analysis
During the year 2016-17, `7435 crores were reported as the total expenses on microfinance operations of the MFIs that provided data for the report. The above expenses comprise of operating expenses (personnel expenses + administrative expenses + loan loss provisions + any others) and finance expenses (mainly interest on borrowings). This year’s total expenses were approximately `684 crores lesser than last year. Actually total expenses increased by `2725 (58%) over last year as 6 large sized MFIs recently converted to SFB is not part of total expenses incurred by the MFIs.
Loan Loss Provision (LLP) expenses have increased significantly from the previous years. In 2017, LLP to Operating Expenses is 19% whereas it was only 9% in 2016 because of demonetization. This marks a deterioration in the overall quality of the outstanding portfolio of the sector.
As seen in Figure 3.2.1, the total expenses incurred are distributed at 48% in finance expenses and 52% in operating expenses. The operating expenses of 52% comprised of 24% personnel expenses and 28% other administrative expenses. Loan Loss Provisions for the year are 19% of operating expenses and 15% of total expenses has been incurred as a part of other administrative expenses.
Figure 3.2.1: Break up of Expenses by Indian MFIs
Since MFIs with an outstanding portfolio over `500 crores account for 81% of the total portfolio of the sector, it is understandable that they incur a major chunk of the expenditure too i.e. 81% of total financial expenses and 81% of total personnel expenses. This leaves the MFIs with portfolio less than ̀ 500 crores with financial expenses less than 19% and personnel expenses less than 19% of the overall expenses of the sector. This proportion of expenses is consistent with the outstanding portfolio of the MFIs.
48%
24%
28%
Financial Expenses
Personnel Expenses
Other Admn. Expenses
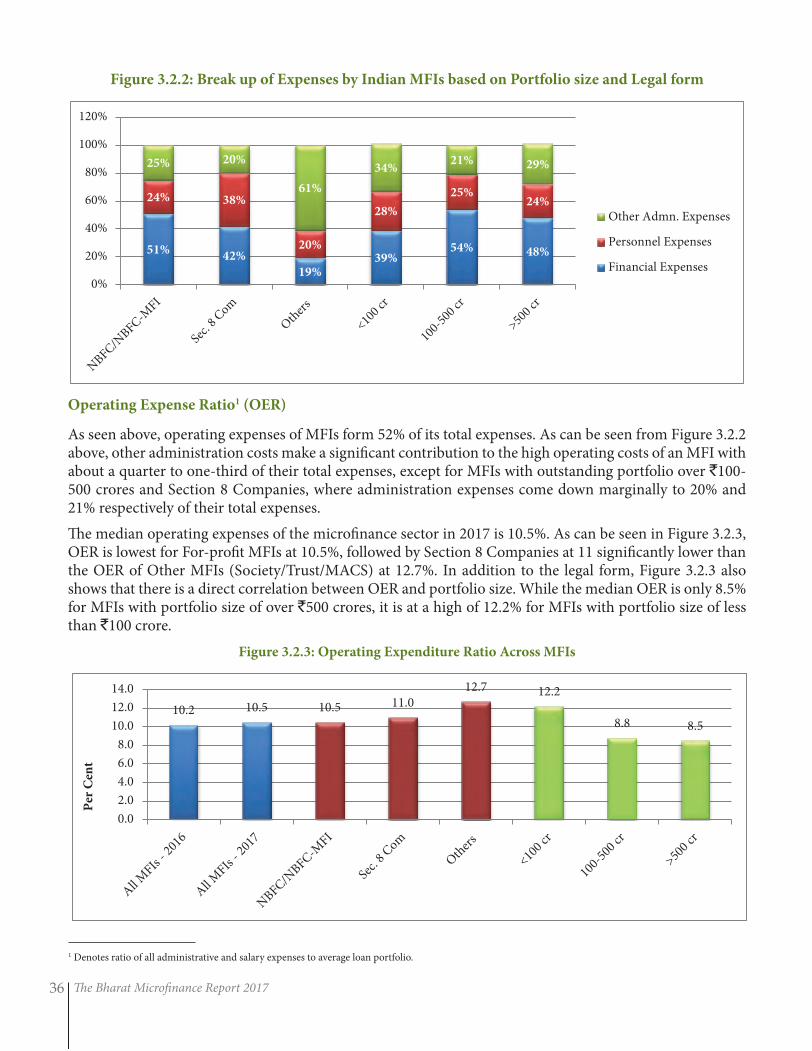
The Bharat Microfinance Report 201736
Figure 3.2.2: Break up of Expenses by Indian MFIs based on Portfolio size and Legal form
Operating Expense Ratio1 (OER)
As seen above, operating expenses of MFIs form 52% of its total expenses. As can be seen from Figure 3.2.2 above, other administration costs make a significant contribution to the high operating costs of an MFI with about a quarter to one-third of their total expenses, except for MFIs with outstanding portfolio over `100-500 crores and Section 8 Companies, where administration expenses come down marginally to 20% and 21% respectively of their total expenses.
The median operating expenses of the microfinance sector in 2017 is 10.5%. As can be seen in Figure 3.2.3, OER is lowest for For-profit MFIs at 10.5%, followed by Section 8 Companies at 11 significantly lower than the OER of Other MFIs (Society/Trust/MACS) at 12.7%. In addition to the legal form, Figure 3.2.3 also shows that there is a direct correlation between OER and portfolio size. While the median OER is only 8.5% for MFIs with portfolio size of over `500 crores, it is at a high of 12.2% for MFIs with portfolio size of less than `100 crore.
Figure 3.2.3: Operating Expenditure Ratio Across MFIs
1 Denotes ratio of all administrative and salary expenses to average loan portfolio.
51% 42%
19% 39%
54% 48%
24% 38%
20%
28%
25% 24%
25% 20%
61%
34% 21% 29%
0%
20%
40%
60%
80%
100%
120%
Other Admn. Expenses
Personnel Expenses
Financial Expenses
10.2 10.5 10.5 11.0 12.7 12.2
8.8 8.5
0.0
2.0
4.0
6.0
8.0
10.0
12.0
14.0
Per
Cen
t
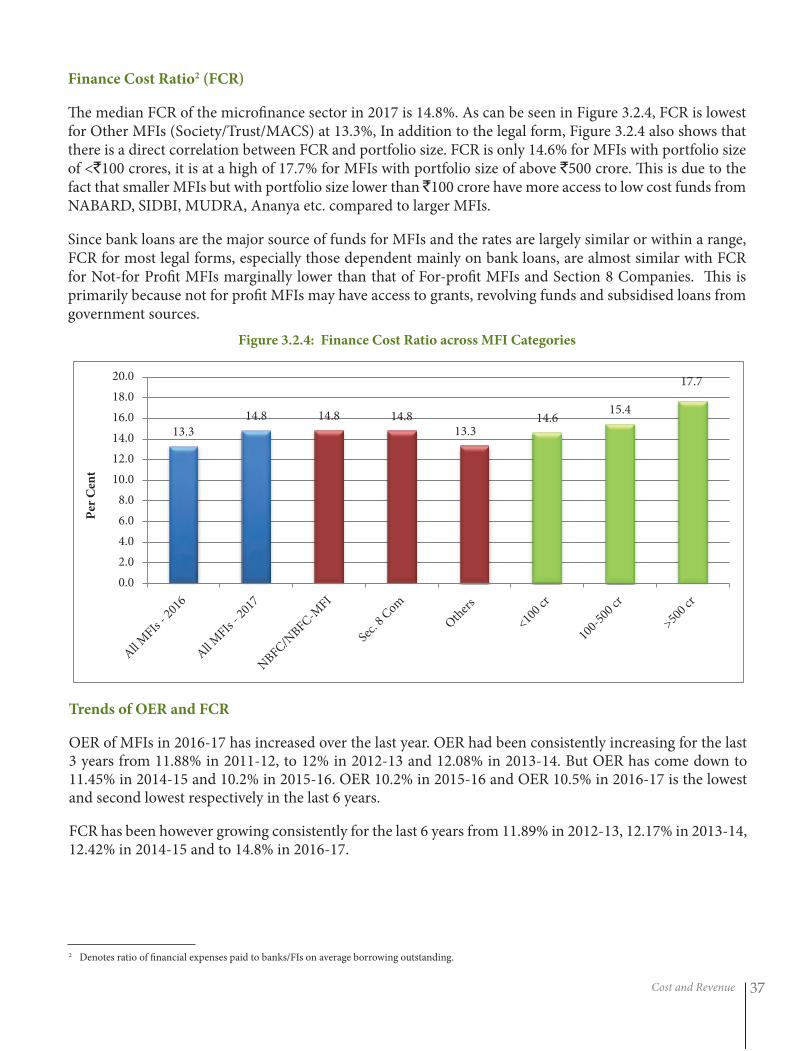
Cost and Revenue 37
Finance Cost Ratio2 (FCR)
The median FCR of the microfinance sector in 2017 is 14.8%. As can be seen in Figure 3.2.4, FCR is lowest for Other MFIs (Society/Trust/MACS) at 13.3%, In addition to the legal form, Figure 3.2.4 also shows that there is a direct correlation between FCR and portfolio size. FCR is only 14.6% for MFIs with portfolio size of <`100 crores, it is at a high of 17.7% for MFIs with portfolio size of above `500 crore. This is due to the fact that smaller MFIs but with portfolio size lower than `100 crore have more access to low cost funds from NABARD, SIDBI, MUDRA, Ananya etc. compared to larger MFIs.
Since bank loans are the major source of funds for MFIs and the rates are largely similar or within a range, FCR for most legal forms, especially those dependent mainly on bank loans, are almost similar with FCR for Not-for Profit MFIs marginally lower than that of For-profit MFIs and Section 8 Companies. This is primarily because not for profit MFIs may have access to grants, revolving funds and subsidised loans from government sources.
Figure 3.2.4: Finance Cost Ratio across MFI Categories
Trends of OER and FCR
OER of MFIs in 2016-17 has increased over the last year. OER had been consistently increasing for the last 3 years from 11.88% in 2011-12, to 12% in 2012-13 and 12.08% in 2013-14. But OER has come down to 11.45% in 2014-15 and 10.2% in 2015-16. OER 10.2% in 2015-16 and OER 10.5% in 2016-17 is the lowest and second lowest respectively in the last 6 years.
FCR has been however growing consistently for the last 6 years from 11.89% in 2012-13, 12.17% in 2013-14, 12.42% in 2014-15 and to 14.8% in 2016-17.
2 Denotes ratio of financial expenses paid to banks/FIs on average borrowing outstanding.
13.3
14.8 14.8 14.8 13.3
14.6 15.4
17.7
0.0
2.0
4.0
6.0
8.0
10.0
12.0
14.0
16.0
18.0
20.0
Per
Cen
t
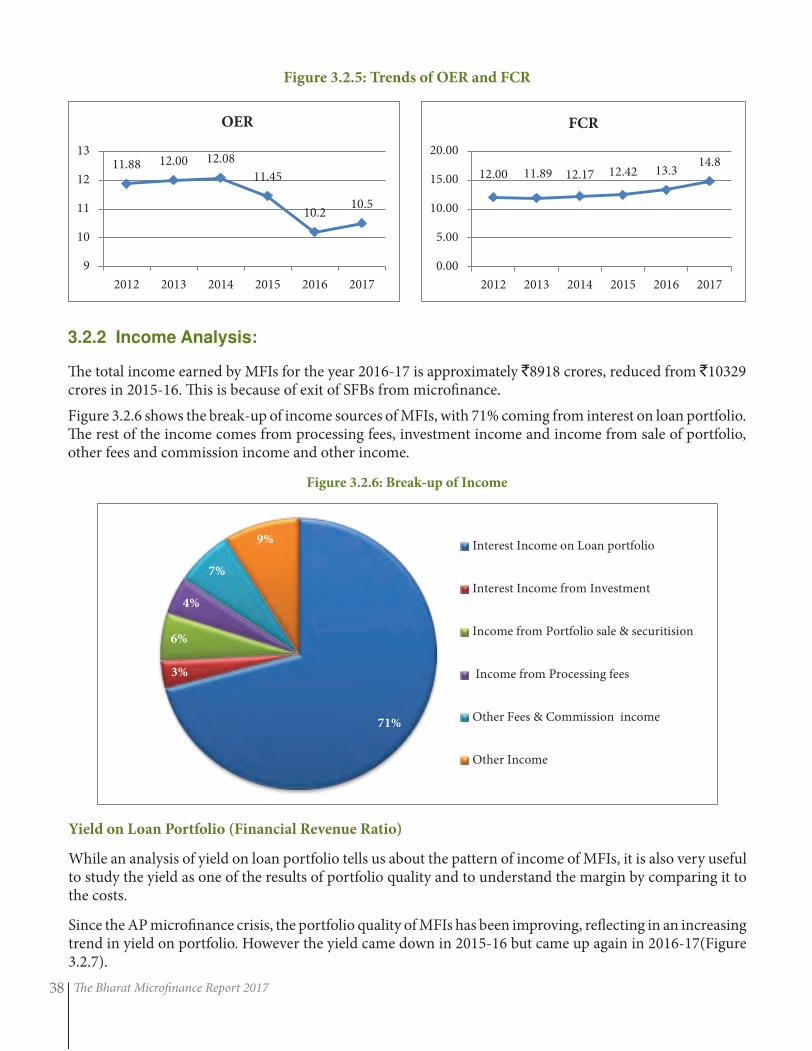
The Bharat Microfinance Report 201738
Figure 3.2.5: Trends of OER and FCR
3.2.2 Income Analysis:
The total income earned by MFIs for the year 2016-17 is approximately `8918 crores, reduced from `10329 crores in 2015-16. This is because of exit of SFBs from microfinance.
Figure 3.2.6 shows the break-up of income sources of MFIs, with 71% coming from interest on loan portfolio. The rest of the income comes from processing fees, investment income and income from sale of portfolio, other fees and commission income and other income.
Figure 3.2.6: Break-up of Income
Yield on Loan Portfolio (Financial Revenue Ratio)
While an analysis of yield on loan portfolio tells us about the pattern of income of MFIs, it is also very useful to study the yield as one of the results of portfolio quality and to understand the margin by comparing it to the costs.
Since the AP microfinance crisis, the portfolio quality of MFIs has been improving, reflecting in an increasing trend in yield on portfolio. However the yield came down in 2015-16 but came up again in 2016-17(Figure 3.2.7).
11.88 12.00 12.08
11.45
10.2 10.5
9
10
11
12
13
2012 2013 2014 2015 2016 2017
OER
12.00 11.89 12.17 12.42 13.3 14.8
0.00
5.00
10.00
15.00
20.00
2012 2013 2014 2015 2016 2017
FCR
71%
3%
6%
4%
7%
9% Interest Income on Loan portfolio
Interest Income from Investment
Income from Portfolio sale & securitision
Income from Processing fees
Other Fees & Commission income
Other Income
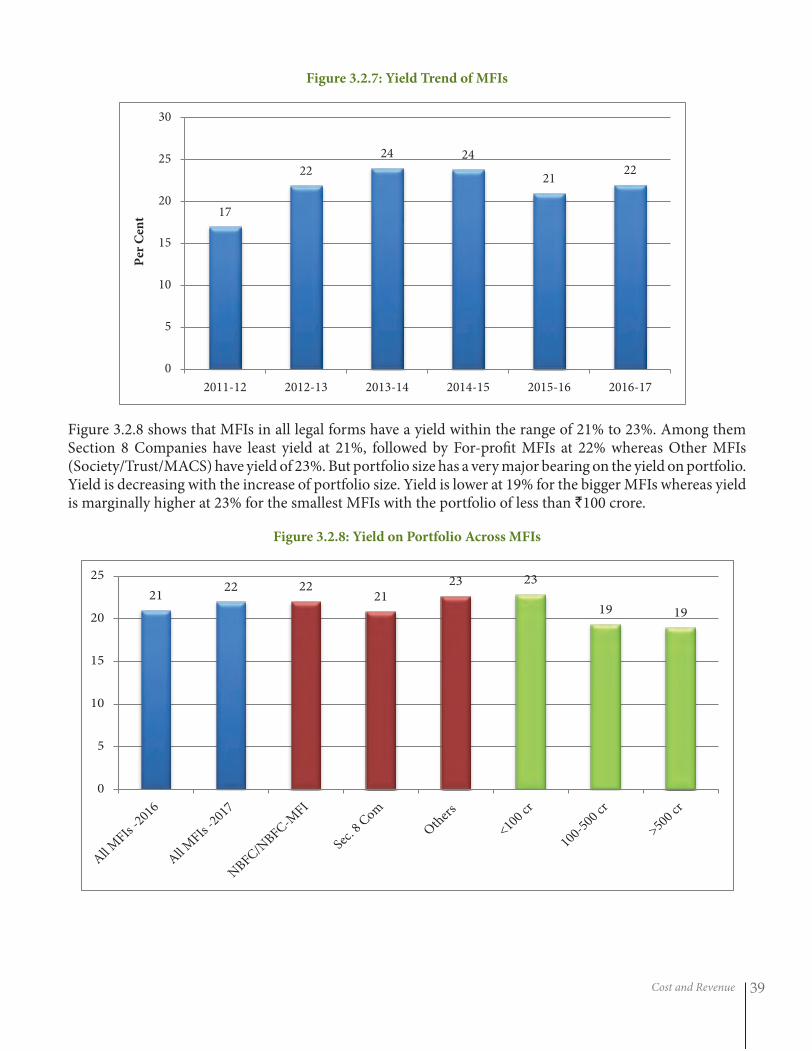
Cost and Revenue 39
Figure 3.2.7: Yield Trend of MFIs
Figure 3.2.8 shows that MFIs in all legal forms have a yield within the range of 21% to 23%. Among them Section 8 Companies have least yield at 21%, followed by For-profit MFIs at 22% whereas Other MFIs (Society/Trust/MACS) have yield of 23%. But portfolio size has a very major bearing on the yield on portfolio. Yield is decreasing with the increase of portfolio size. Yield is lower at 19% for the bigger MFIs whereas yield is marginally higher at 23% for the smallest MFIs with the portfolio of less than `100 crore.
Figure 3.2.8: Yield on Portfolio Across MFIs
17
22
24 24
21 22
0
5
10
15
20
25
30
2011-12 2012-13 2013-14 2014-15 2015-16 2016-17
Per
Cen
t
21 22 22
21 23 23
19 19
0
5
10
15
20
25
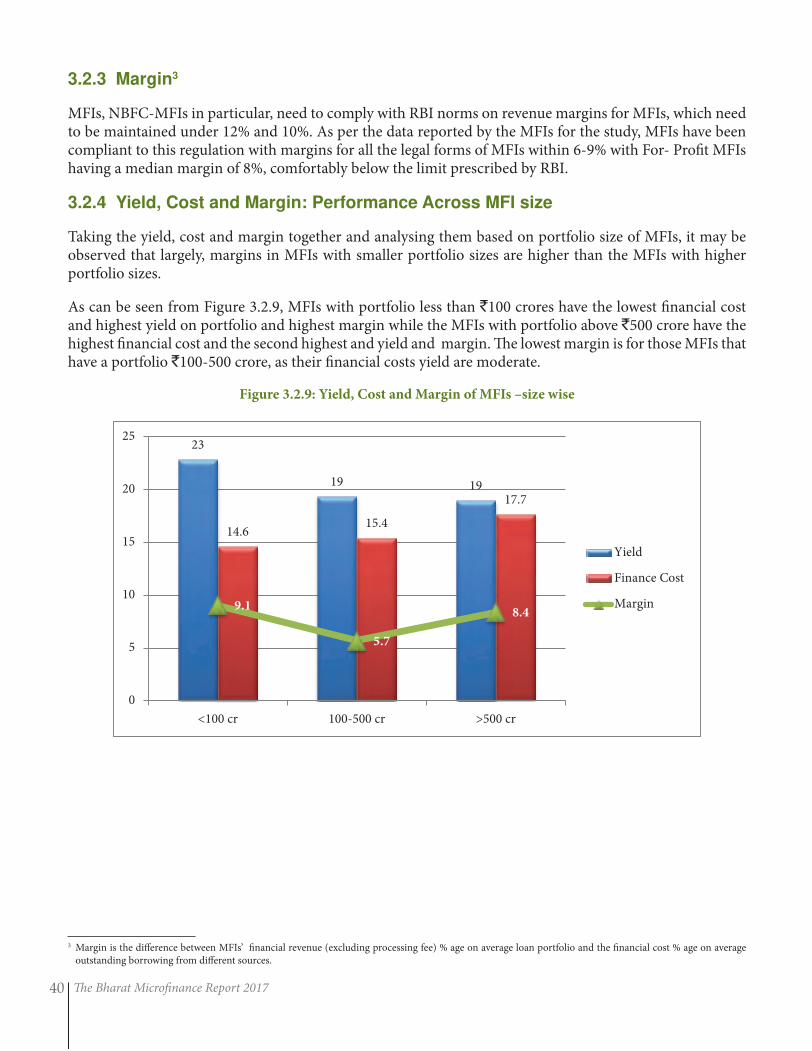
The Bharat Microfinance Report 201740
3.2.3 Margin3
MFIs, NBFC-MFIs in particular, need to comply with RBI norms on revenue margins for MFIs, which need to be maintained under 12% and 10%. As per the data reported by the MFIs for the study, MFIs have been compliant to this regulation with margins for all the legal forms of MFIs within 6-9% with For- Profit MFIs having a median margin of 8%, comfortably below the limit prescribed by RBI.
3.2.4 Yield, Cost and Margin: Performance Across MFI size
Taking the yield, cost and margin together and analysing them based on portfolio size of MFIs, it may be observed that largely, margins in MFIs with smaller portfolio sizes are higher than the MFIs with higher portfolio sizes.
As can be seen from Figure 3.2.9, MFIs with portfolio less than `100 crores have the lowest financial cost and highest yield on portfolio and highest margin while the MFIs with portfolio above `500 crore have the highest financial cost and the second highest and yield and margin. The lowest margin is for those MFIs that have a portfolio `100-500 crore, as their financial costs yield are moderate.
Figure 3.2.9: Yield, Cost and Margin of MFIs –size wise
3 Margin is the difference between MFIs’ financial revenue (excluding processing fee) % age on average loan portfolio and the financial cost % age on average outstanding borrowing from different sources.
23
19 19
14.6 15.4
17.7
9.1
5.7
8.4
0
5
10
15
20
25
<100 cr 100-500 cr >500 cr
Yield
Finance Cost
Margin
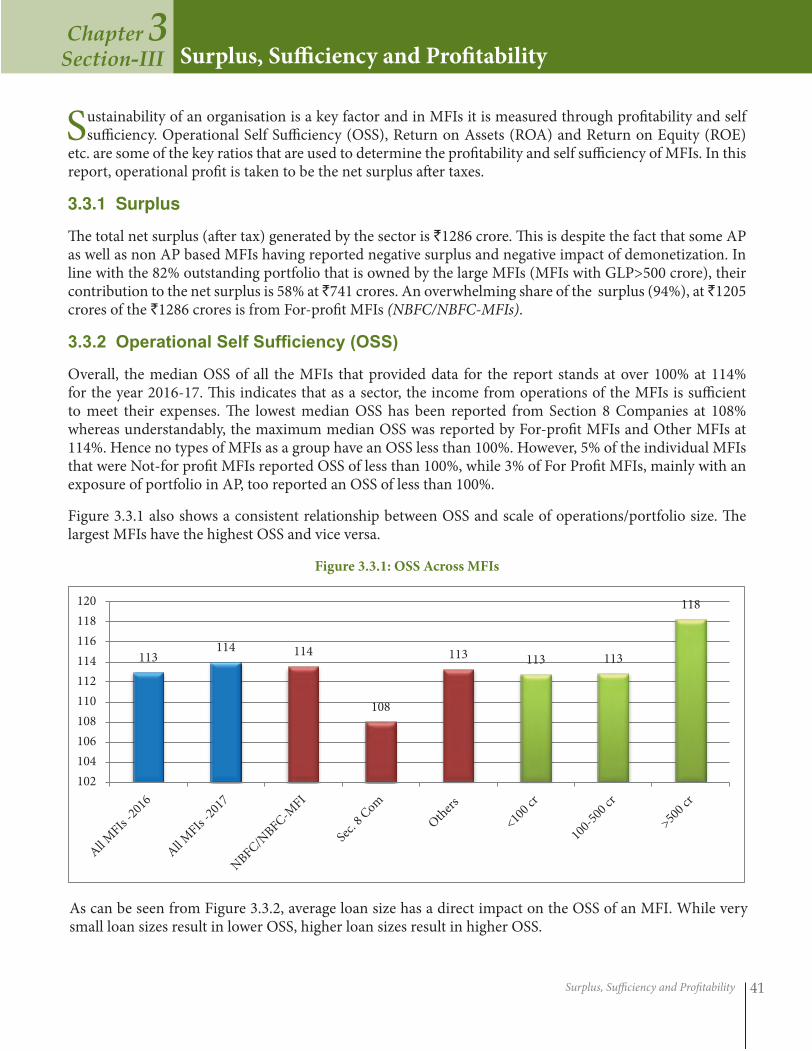
Surplus, Sufficiency and Profitability 41
Surplus, Sufficiency and ProfitabilityChapter 3
Section-III
Sustainability of an organisation is a key factor and in MFIs it is measured through profitability and self sufficiency. Operational Self Sufficiency (OSS), Return on Assets (ROA) and Return on Equity (ROE)
etc. are some of the key ratios that are used to determine the profitability and self sufficiency of MFIs. In this report, operational profit is taken to be the net surplus after taxes.
3.3.1 Surplus
The total net surplus (after tax) generated by the sector is `1286 crore. This is despite the fact that some AP as well as non AP based MFIs having reported negative surplus and negative impact of demonetization. In line with the 82% outstanding portfolio that is owned by the large MFIs (MFIs with GLP>500 crore), their contribution to the net surplus is 58% at ̀ 741 crores. An overwhelming share of the surplus (94%), at `1205 crores of the `1286 crores is from For-profit MFIs (NBFC/NBFC-MFIs).
3.3.2 OperationalSelfSufficiency(OSS)
Overall, the median OSS of all the MFIs that provided data for the report stands at over 100% at 114% for the year 2016-17. This indicates that as a sector, the income from operations of the MFIs is sufficient to meet their expenses. The lowest median OSS has been reported from Section 8 Companies at 108% whereas understandably, the maximum median OSS was reported by For-profit MFIs and Other MFIs at 114%. Hence no types of MFIs as a group have an OSS less than 100%. However, 5% of the individual MFIs that were Not-for profit MFIs reported OSS of less than 100%, while 3% of For Profit MFIs, mainly with an exposure of portfolio in AP, too reported an OSS of less than 100%.
Figure 3.3.1 also shows a consistent relationship between OSS and scale of operations/portfolio size. The largest MFIs have the highest OSS and vice versa.
Figure 3.3.1: OSS Across MFIs
As can be seen from Figure 3.3.2, average loan size has a direct impact on the OSS of an MFI. While very small loan sizes result in lower OSS, higher loan sizes result in higher OSS.
113 114 114
108
113 113 113
118
102
104
106
108
110
112
114
116
118
120
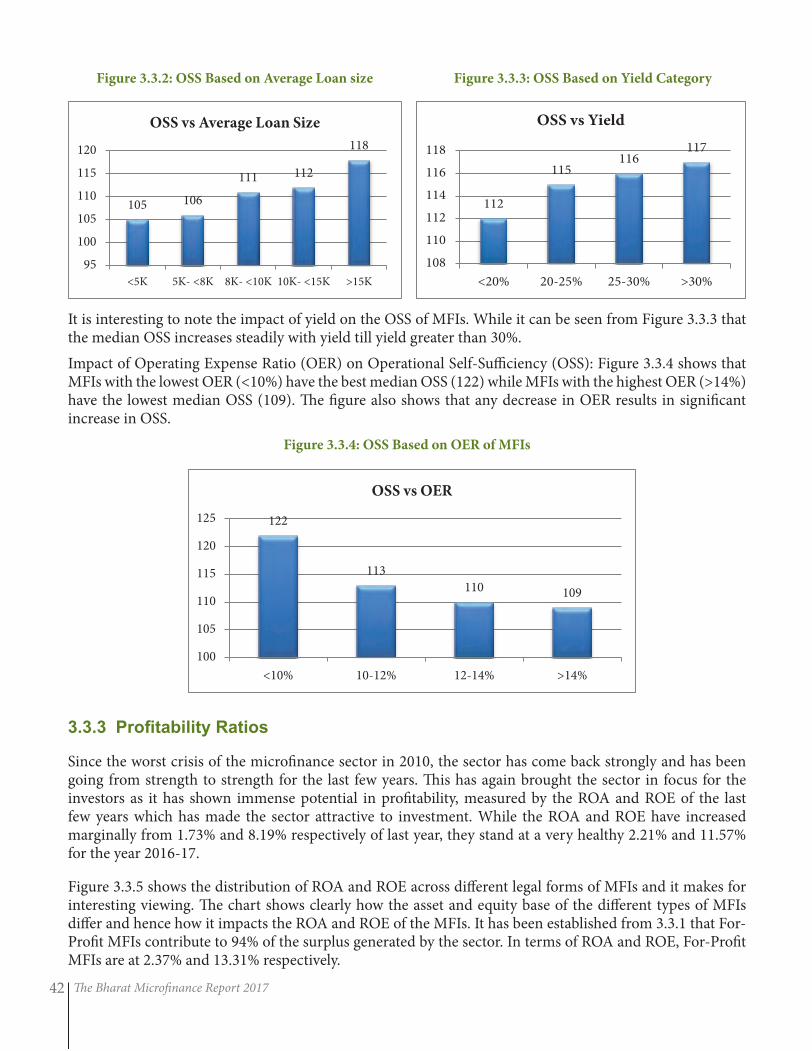
The Bharat Microfinance Report 201742
Figure 3.3.2: OSS Based on Average Loan size Figure 3.3.3: OSS Based on Yield Category
It is interesting to note the impact of yield on the OSS of MFIs. While it can be seen from Figure 3.3.3 that the median OSS increases steadily with yield till yield greater than 30%.
Impact of Operating Expense Ratio (OER) on Operational Self-Sufficiency (OSS): Figure 3.3.4 shows that MFIs with the lowest OER (<10%) have the best median OSS (122) while MFIs with the highest OER (>14%) have the lowest median OSS (109). The figure also shows that any decrease in OER results in significant increase in OSS.
Figure 3.3.4: OSS Based on OER of MFIs
3.3.3 ProfitabilityRatios
Since the worst crisis of the microfinance sector in 2010, the sector has come back strongly and has been going from strength to strength for the last few years. This has again brought the sector in focus for the investors as it has shown immense potential in profitability, measured by the ROA and ROE of the last few years which has made the sector attractive to investment. While the ROA and ROE have increased marginally from 1.73% and 8.19% respectively of last year, they stand at a very healthy 2.21% and 11.57% for the year 2016-17.
Figure 3.3.5 shows the distribution of ROA and ROE across different legal forms of MFIs and it makes for interesting viewing. The chart shows clearly how the asset and equity base of the different types of MFIs differ and hence how it impacts the ROA and ROE of the MFIs. It has been established from 3.3.1 that For-Profit MFIs contribute to 94% of the surplus generated by the sector. In terms of ROA and ROE, For-Profit MFIs are at 2.37% and 13.31% respectively.
122
113
110 109
100
105
110
115
120
125
<10% 10-12% 12-14% >14%
OSS vs OER
105 106
111 112
118
95
100
105
110
115
120
<5K 5K- <8K 8K- <10K 10K- <15K >15K
OSS vs Average Loan Size
112
115 116
117
108
110
112
114
116
118
<20% 20-25% 25-30% >30%
OSS vs Yield
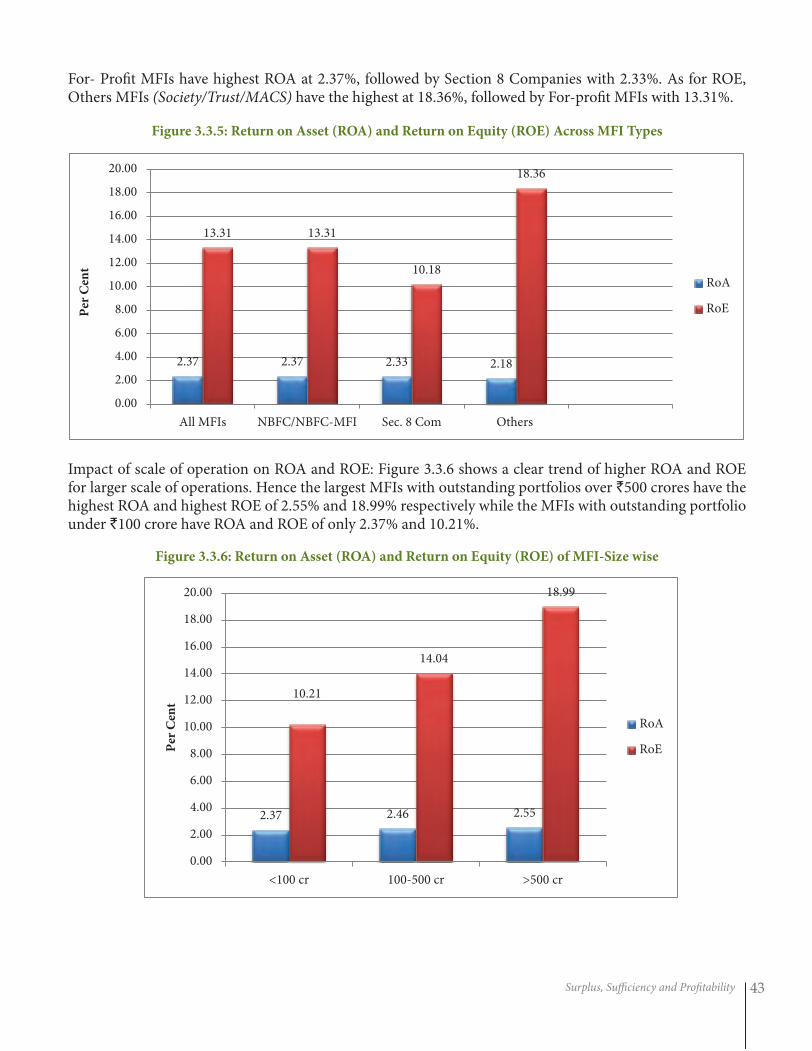
Surplus, Sufficiency and Profitability 43
For- Profit MFIs have highest ROA at 2.37%, followed by Section 8 Companies with 2.33%. As for ROE, Others MFIs (Society/Trust/MACS) have the highest at 18.36%, followed by For-profit MFIs with 13.31%.
Figure 3.3.5: Return on Asset (ROA) and Return on Equity (ROE) Across MFI Types
Impact of scale of operation on ROA and ROE: Figure 3.3.6 shows a clear trend of higher ROA and ROE for larger scale of operations. Hence the largest MFIs with outstanding portfolios over `500 crores have the highest ROA and highest ROE of 2.55% and 18.99% respectively while the MFIs with outstanding portfolio under `100 crore have ROA and ROE of only 2.37% and 10.21%.
Figure 3.3.6: Return on Asset (ROA) and Return on Equity (ROE) of MFI-Size wise
2.37 2.37 2.33 2.18
13.31 13.31
10.18
18.36
0.00
2.00
4.00
6.00
8.00
10.00
12.00
14.00
16.00
18.00
20.00
All MFIs NBFC/NBFC-MFI Sec. 8 Com Others
Per
Cen
t
RoA
RoE
2.37 2.46 2.55
10.21
14.04
18.99
0.00
2.00
4.00
6.00
8.00
10.00
12.00
14.00
16.00
18.00
20.00
<100 cr 100-500 cr >500 cr
Per
Cen
t
RoA
RoE
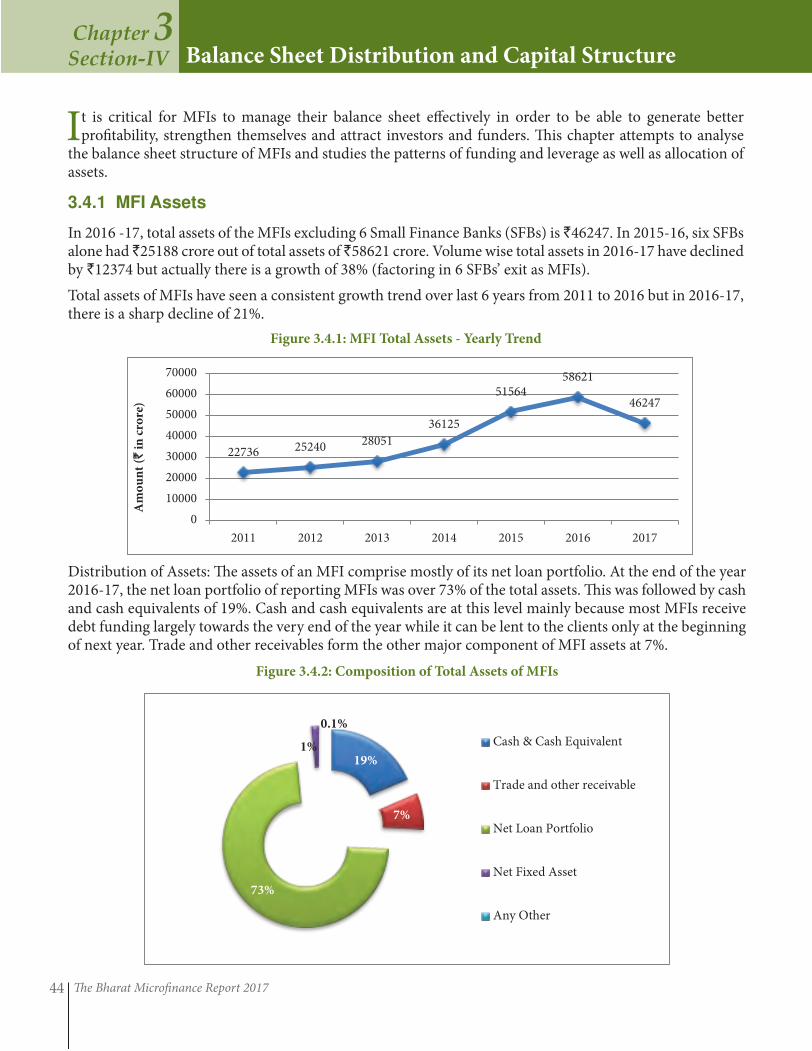
The Bharat Microfinance Report 201744
Balance Sheet Distribution and Capital StructureChapter 3Section-IV
It is critical for MFIs to manage their balance sheet effectively in order to be able to generate better profitability, strengthen themselves and attract investors and funders. This chapter attempts to analyse
the balance sheet structure of MFIs and studies the patterns of funding and leverage as well as allocation of assets.
3.4.1 MFI Assets
In 2016 -17, total assets of the MFIs excluding 6 Small Finance Banks (SFBs) is `46247. In 2015-16, six SFBs alone had ̀ 25188 crore out of total assets of ̀ 58621 crore. Volume wise total assets in 2016-17 have declined by `12374 but actually there is a growth of 38% (factoring in 6 SFBs’ exit as MFIs).
Total assets of MFIs have seen a consistent growth trend over last 6 years from 2011 to 2016 but in 2016-17, there is a sharp decline of 21%.
Figure 3.4.1: MFI Total Assets - Yearly Trend
Distribution of Assets: The assets of an MFI comprise mostly of its net loan portfolio. At the end of the year 2016-17, the net loan portfolio of reporting MFIs was over 73% of the total assets. This was followed by cash and cash equivalents of 19%. Cash and cash equivalents are at this level mainly because most MFIs receive debt funding largely towards the very end of the year while it can be lent to the clients only at the beginning of next year. Trade and other receivables form the other major component of MFI assets at 7%.
Figure 3.4.2: Composition of Total Assets of MFIs
22736 25240 28051
36125
51564 58621
46247
0
10000
20000
30000
40000
50000
60000
70000
2011 2012 2013 2014 2015 2016 2017
Am
ou
nt
(` i
n c
rore
)
19%
7%
73%
1%
0.1%
Cash & Cash Equivalent
Trade and other receivable
Net Loan Portfolio
Net Fixed Asset
Any Other
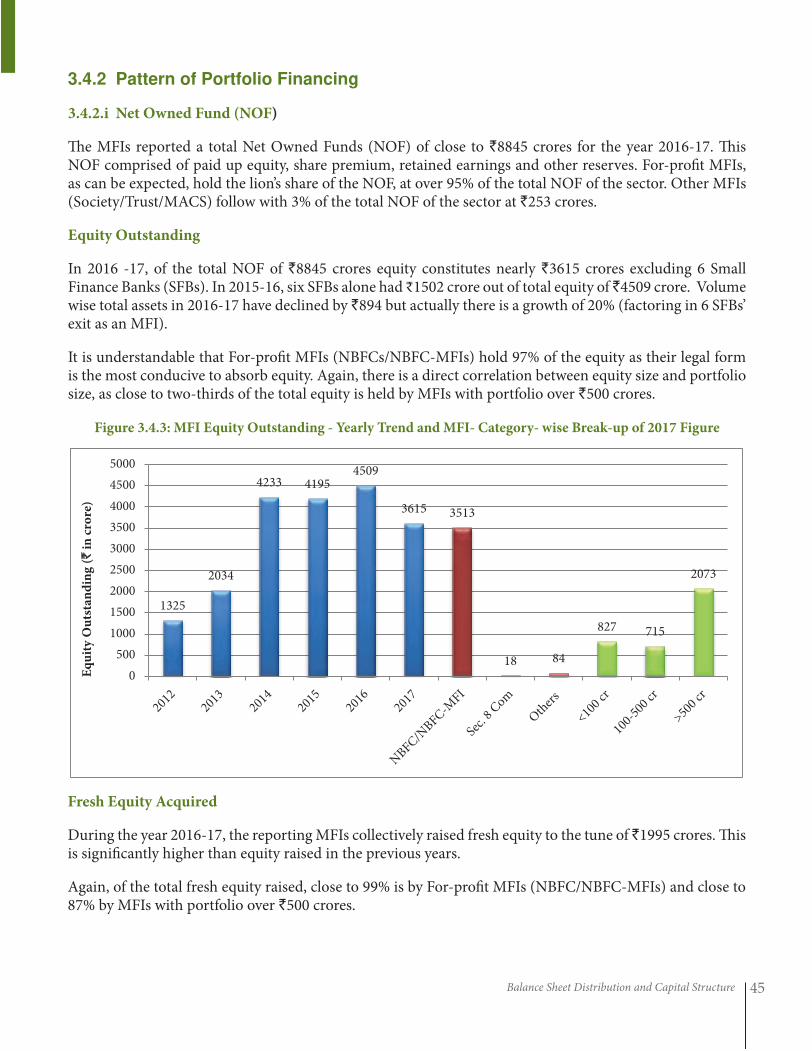
Balance Sheet Distribution and Capital Structure 45
3.4.2 Pattern of Portfolio Financing
3.4.2.i Net Owned Fund (NOF)
The MFIs reported a total Net Owned Funds (NOF) of close to `8845 crores for the year 2016-17. This NOF comprised of paid up equity, share premium, retained earnings and other reserves. For-profit MFIs, as can be expected, hold the lion’s share of the NOF, at over 95% of the total NOF of the sector. Other MFIs (Society/Trust/MACS) follow with 3% of the total NOF of the sector at `253 crores.
Equity Outstanding
In 2016 -17, of the total NOF of `8845 crores equity constitutes nearly `3615 crores excluding 6 Small Finance Banks (SFBs). In 2015-16, six SFBs alone had ₹1502 crore out of total equity of ̀ 4509 crore. Volume wise total assets in 2016-17 have declined by `894 but actually there is a growth of 20% (factoring in 6 SFBs’ exit as an MFI).
It is understandable that For-profit MFIs (NBFCs/NBFC-MFIs) hold 97% of the equity as their legal form is the most conducive to absorb equity. Again, there is a direct correlation between equity size and portfolio size, as close to two-thirds of the total equity is held by MFIs with portfolio over `500 crores.
Figure 3.4.3: MFI Equity Outstanding - Yearly Trend and MFI- Category- wise Break-up of 2017 Figure
Fresh Equity Acquired
During the year 2016-17, the reporting MFIs collectively raised fresh equity to the tune of ̀ 1995 crores. This is significantly higher than equity raised in the previous years.
Again, of the total fresh equity raised, close to 99% is by For-profit MFIs (NBFC/NBFC-MFIs) and close to 87% by MFIs with portfolio over `500 crores.
1325
2034
4233 4195 4509
3615 3513
18 84
827 715
2073
0
500
1000
1500
2000
2500
3000
3500
4000
4500
5000
Eq
uit
y O
uts
tan
din
g (`
in
cro
re)
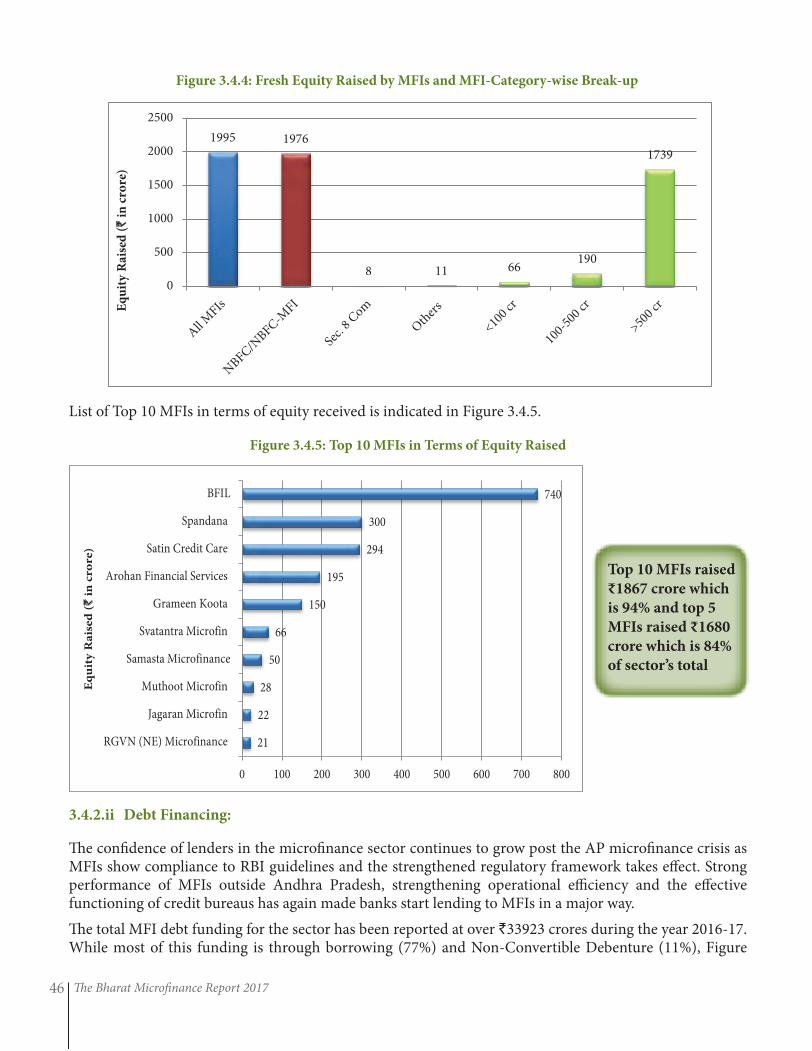
The Bharat Microfinance Report 201746
Figure 3.4.4: Fresh Equity Raised by MFIs and MFI-Category-wise Break-up
List of Top 10 MFIs in terms of equity received is indicated in Figure 3.4.5.
Figure 3.4.5: Top 10 MFIs in Terms of Equity Raised
3.4.2.ii Debt Financing:
The confidence of lenders in the microfinance sector continues to grow post the AP microfinance crisis as MFIs show compliance to RBI guidelines and the strengthened regulatory framework takes effect. Strong performance of MFIs outside Andhra Pradesh, strengthening operational efficiency and the effective functioning of credit bureaus has again made banks start lending to MFIs in a major way.
The total MFI debt funding for the sector has been reported at over `33923 crores during the year 2016-17. While most of this funding is through borrowing (77%) and Non-Convertible Debenture (11%), Figure
21
22
28
50
66
150
195
294
300
740
0 100 200 300 400 500 600 700 800
RGVN (NE) Microfinance
Jagaran Microfin
Muthoot Microfin
Samasta Microfinance
Svatantra Microfin
Grameen Koota
Arohan Financial Services
Satin Credit Care
Spandana
BFIL
Eq
uit
y R
ais
ed
(`
in
cro
re)
Top 10 MFIs raised
₹1867 crore which
is 94% and top 5
MFIs raised ₹1680
crore which is 84%
of sector’s total
1995 1976
8 11 66 190
1739
0
500
1000
1500
2000
2500E
qu
ity
Rai
sed
(`
in
cro
re)
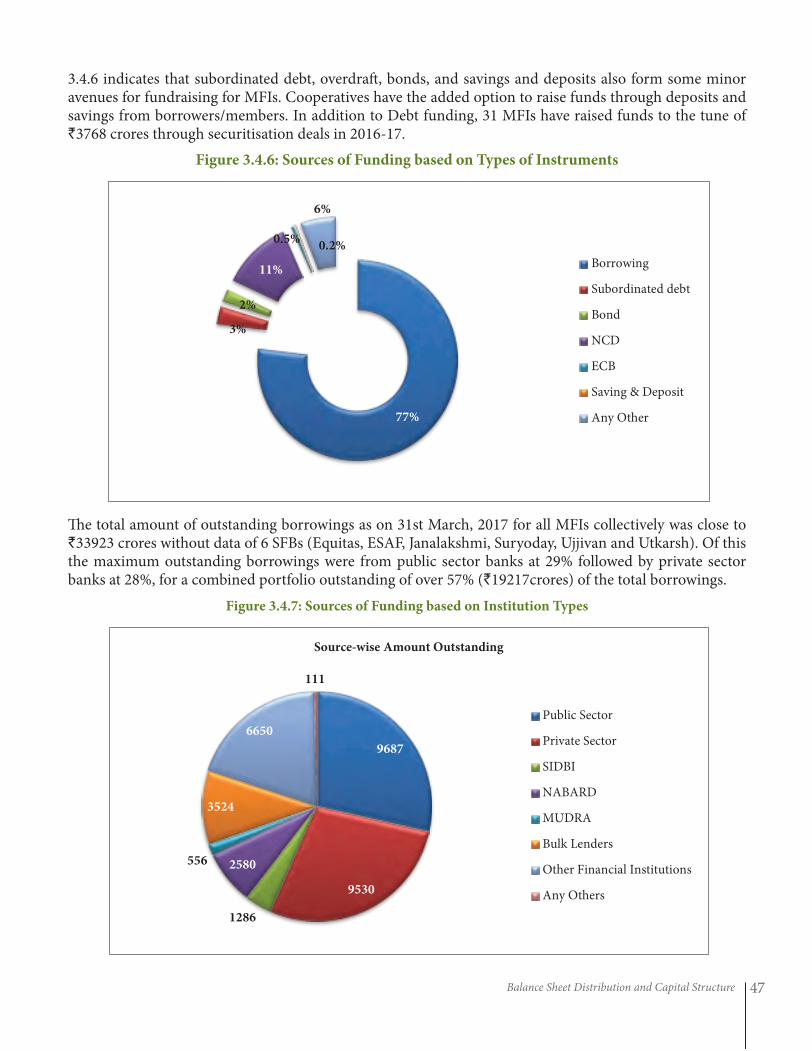
Balance Sheet Distribution and Capital Structure 47
3.4.6 indicates that subordinated debt, overdraft, bonds, and savings and deposits also form some minor avenues for fundraising for MFIs. Cooperatives have the added option to raise funds through deposits and savings from borrowers/members. In addition to Debt funding, 31 MFIs have raised funds to the tune of `3768 crores through securitisation deals in 2016-17.
Figure 3.4.6: Sources of Funding based on Types of Instruments
The total amount of outstanding borrowings as on 31st March, 2017 for all MFIs collectively was close to `33923 crores without data of 6 SFBs (Equitas, ESAF, Janalakshmi, Suryoday, Ujjivan and Utkarsh). Of this the maximum outstanding borrowings were from public sector banks at 29% followed by private sector banks at 28%, for a combined portfolio outstanding of over 57% (`19217crores) of the total borrowings.
Figure 3.4.7: Sources of Funding based on Institution Types
77%
3%
2%
11%
0.5% 0.2%
6%
Borrowing
Subordinated debt
Bond
NCD
ECB
Saving & Deposit
Any Other
9687
9530
1286
2580 556
3524
6650
111
Source-wise Amount Outstanding
Public Sector
Private Sector
SIDBI
NABARD
MUDRA
Bulk Lenders
Other Financial Institutions
Any Others
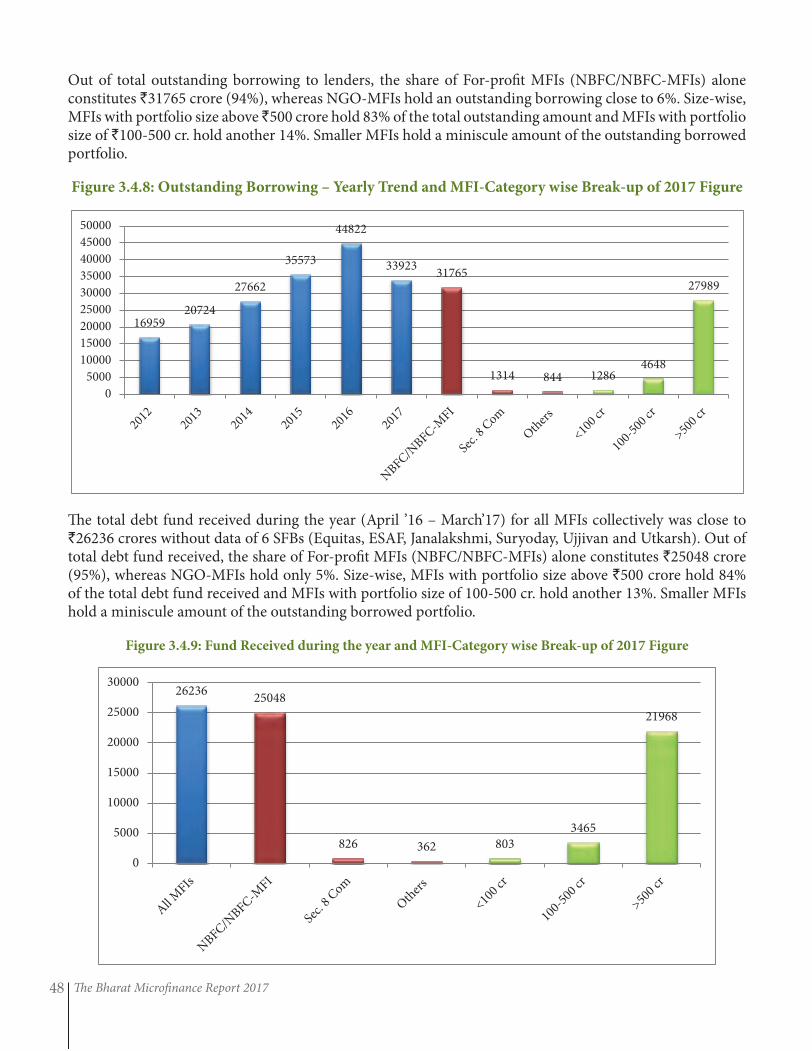
The Bharat Microfinance Report 201748
Out of total outstanding borrowing to lenders, the share of For-profit MFIs (NBFC/NBFC-MFIs) alone constitutes `31765 crore (94%), whereas NGO-MFIs hold an outstanding borrowing close to 6%. Size-wise, MFIs with portfolio size above ̀ 500 crore hold 83% of the total outstanding amount and MFIs with portfolio size of `100-500 cr. hold another 14%. Smaller MFIs hold a miniscule amount of the outstanding borrowed portfolio.
Figure 3.4.8: Outstanding Borrowing – Yearly Trend and MFI-Category wise Break-up of 2017 Figure
The total debt fund received during the year (April ’16 – March’17) for all MFIs collectively was close to `26236 crores without data of 6 SFBs (Equitas, ESAF, Janalakshmi, Suryoday, Ujjivan and Utkarsh). Out of total debt fund received, the share of For-profit MFIs (NBFC/NBFC-MFIs) alone constitutes `25048 crore (95%), whereas NGO-MFIs hold only 5%. Size-wise, MFIs with portfolio size above `500 crore hold 84% of the total debt fund received and MFIs with portfolio size of 100-500 cr. hold another 13%. Smaller MFIs hold a miniscule amount of the outstanding borrowed portfolio.
Figure 3.4.9: Fund Received during the year and MFI-Category wise Break-up of 2017 Figure
16959 20724
27662
35573
44822
33923 31765
1314 844 1286 4648
27989
0
5000
10000
15000
20000
25000
30000
35000
40000
45000
50000
26236 25048
826 362 803 3465
21968
0
5000
10000
15000
20000
25000
30000
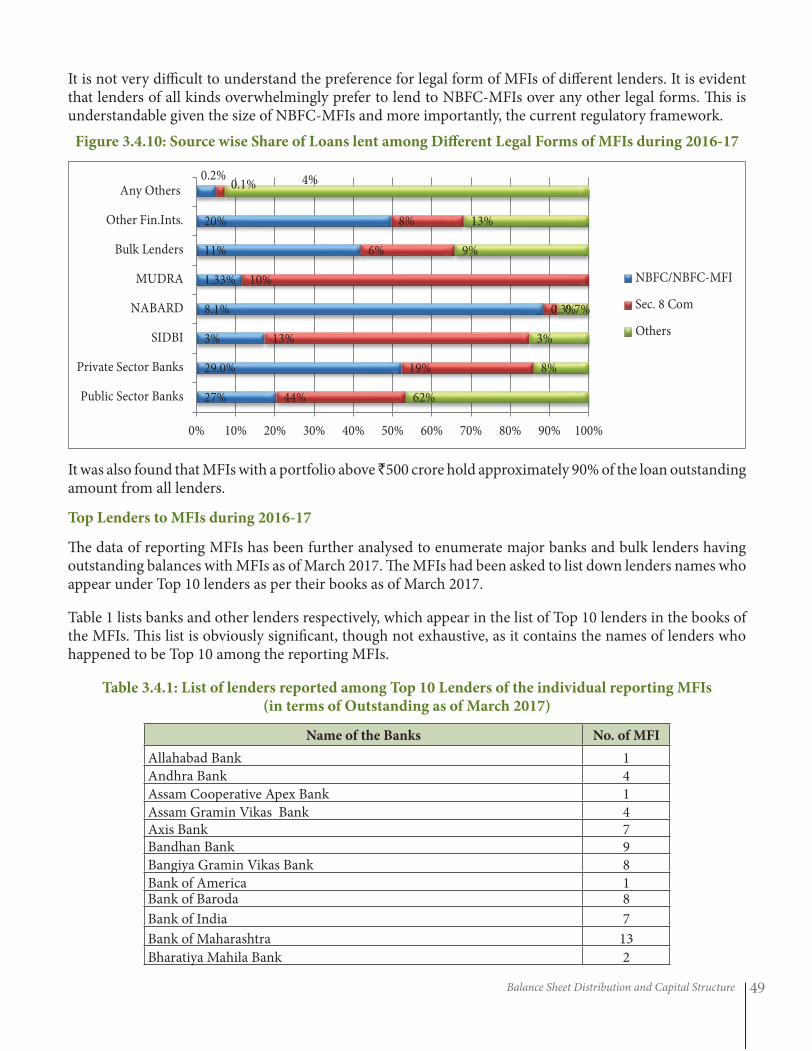
Balance Sheet Distribution and Capital Structure 49
It is not very difficult to understand the preference for legal form of MFIs of different lenders. It is evident that lenders of all kinds overwhelmingly prefer to lend to NBFC-MFIs over any other legal forms. This is understandable given the size of NBFC-MFIs and more importantly, the current regulatory framework.
Figure 3.4.10: Source wise Share of Loans lent among Different Legal Forms of MFIs during 2016-17
It was also found that MFIs with a portfolio above ̀ 500 crore hold approximately 90% of the loan outstanding amount from all lenders.
Top Lenders to MFIs during 2016-17
The data of reporting MFIs has been further analysed to enumerate major banks and bulk lenders having outstanding balances with MFIs as of March 2017. The MFIs had been asked to list down lenders names who appear under Top 10 lenders as per their books as of March 2017.
Table 1 lists banks and other lenders respectively, which appear in the list of Top 10 lenders in the books of the MFIs. This list is obviously significant, though not exhaustive, as it contains the names of lenders who happened to be Top 10 among the reporting MFIs.
Table 3.4.1: List of lenders reported among Top 10 Lenders of the individual reporting MFIs (in terms of Outstanding as of March 2017)
Name of the Banks No. of MFI
Allahabad Bank 1
Andhra Bank 4
Assam Cooperative Apex Bank 1
Assam Gramin Vikas Bank 4Axis Bank 7Bandhan Bank 9
Bangiya Gramin Vikas Bank 8
Bank of America 1Bank of Baroda 8
Bank of India 7
Bank of Maharashtra 13
Bharatiya Mahila Bank 2
27%
29.0%
3%
8.1%
1.33%
11%
20%
0.2%
44%
19%
13%
0.3%
10%
6%
8%
0.1%
62%
8%
3%
0.7%
9%
13%
4%
0% 10% 20% 30% 40% 50% 60% 70% 80% 90% 100%
Public Sector Banks
Private Sector Banks
SIDBI
NABARD
MUDRA
Bulk Lenders
Other Fin.Ints.
Any Others
NBFC/NBFC-MFI
Sec. 8 Com
Others
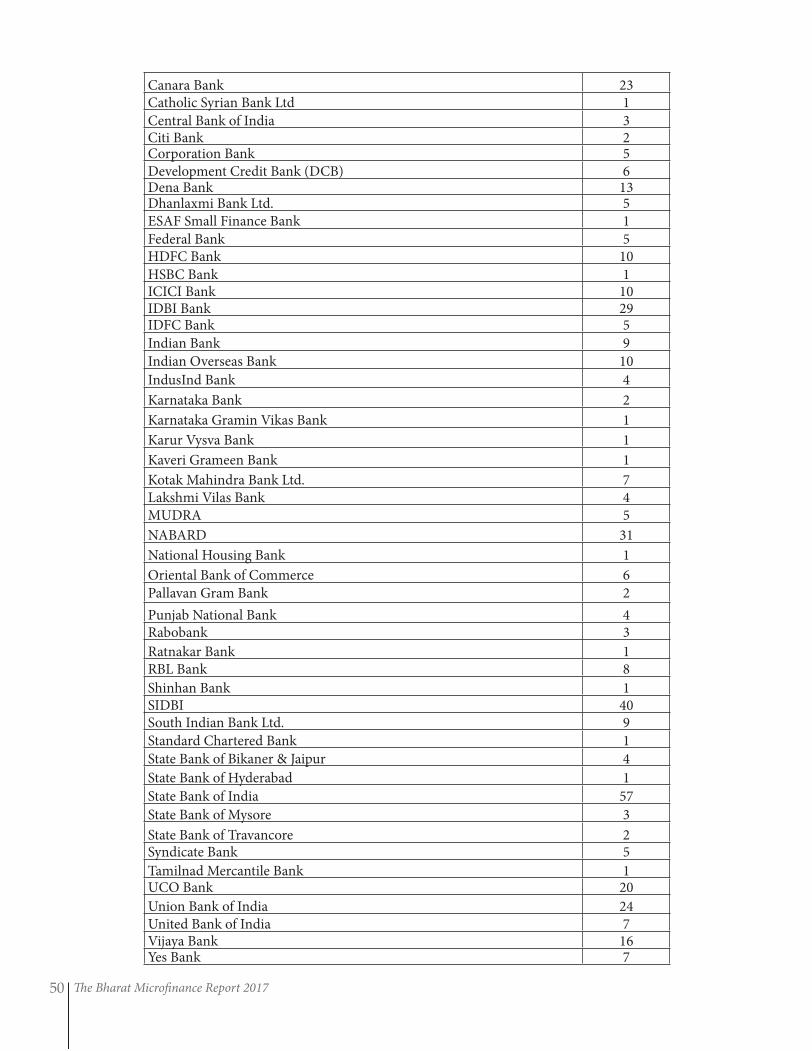
The Bharat Microfinance Report 201750
Canara Bank 23Catholic Syrian Bank Ltd 1
Central Bank of India 3Citi Bank 2Corporation Bank 5Development Credit Bank (DCB) 6Dena Bank 13Dhanlaxmi Bank Ltd. 5ESAF Small Finance Bank 1
Federal Bank 5HDFC Bank 10
HSBC Bank 1ICICI Bank 10IDBI Bank 29IDFC Bank 5
Indian Bank 9
Indian Overseas Bank 10
IndusInd Bank 4
Karnataka Bank 2
Karnataka Gramin Vikas Bank 1
Karur Vysva Bank 1
Kaveri Grameen Bank 1
Kotak Mahindra Bank Ltd. 7Lakshmi Vilas Bank 4MUDRA 5
NABARD 31
National Housing Bank 1
Oriental Bank of Commerce 6
Pallavan Gram Bank 2
Punjab National Bank 4Rabobank 3
Ratnakar Bank 1RBL Bank 8
Shinhan Bank 1SIDBI 40South Indian Bank Ltd. 9
Standard Chartered Bank 1
State Bank of Bikaner & Jaipur 4
State Bank of Hyderabad 1
State Bank of India 57
State Bank of Mysore 3
State Bank of Travancore 2Syndicate Bank 5
Tamilnad Mercantile Bank 1UCO Bank 20
Union Bank of India 24United Bank of India 7Vijaya Bank 16Yes Bank 7
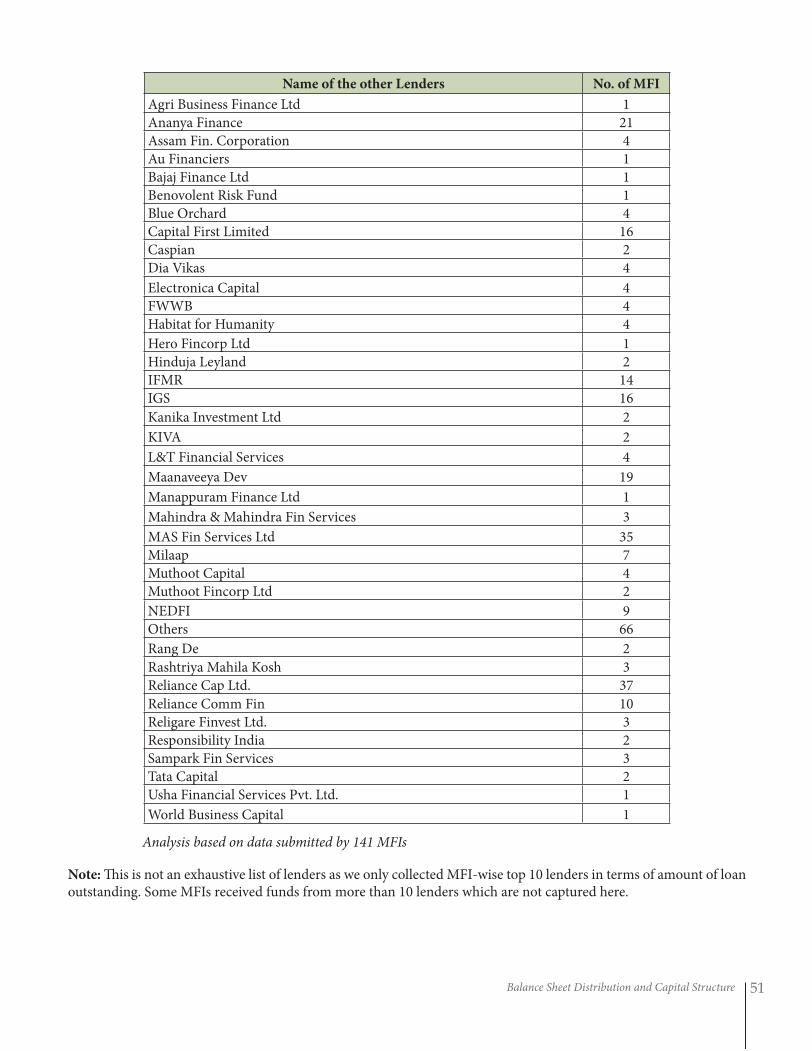
Balance Sheet Distribution and Capital Structure 51
Name of the other Lenders No. of MFI
Agri Business Finance Ltd 1
Ananya Finance 21
Assam Fin. Corporation 4
Au Financiers 1
Bajaj Finance Ltd 1
Benovolent Risk Fund 1
Blue Orchard 4
Capital First Limited 16
Caspian 2
Dia Vikas 4
Electronica Capital 4
FWWB 4
Habitat for Humanity 4
Hero Fincorp Ltd 1
Hinduja Leyland 2
IFMR 14
IGS 16
Kanika Investment Ltd 2
KIVA 2
L&T Financial Services 4
Maanaveeya Dev 19
Manappuram Finance Ltd 1
Mahindra & Mahindra Fin Services 3
MAS Fin Services Ltd 35
Milaap 7
Muthoot Capital 4
Muthoot Fincorp Ltd 2
NEDFI 9
Others 66
Rang De 2
Rashtriya Mahila Kosh 3
Reliance Cap Ltd. 37
Reliance Comm Fin 10
Religare Finvest Ltd. 3
Responsibility India 2
Sampark Fin Services 3
Tata Capital 2
Usha Financial Services Pvt. Ltd. 1
World Business Capital 1
Analysis based on data submitted by 141 MFIs
Note: This is not an exhaustive list of lenders as we only collected MFI-wise top 10 lenders in terms of amount of loan outstanding. Some MFIs received funds from more than 10 lenders which are not captured here.
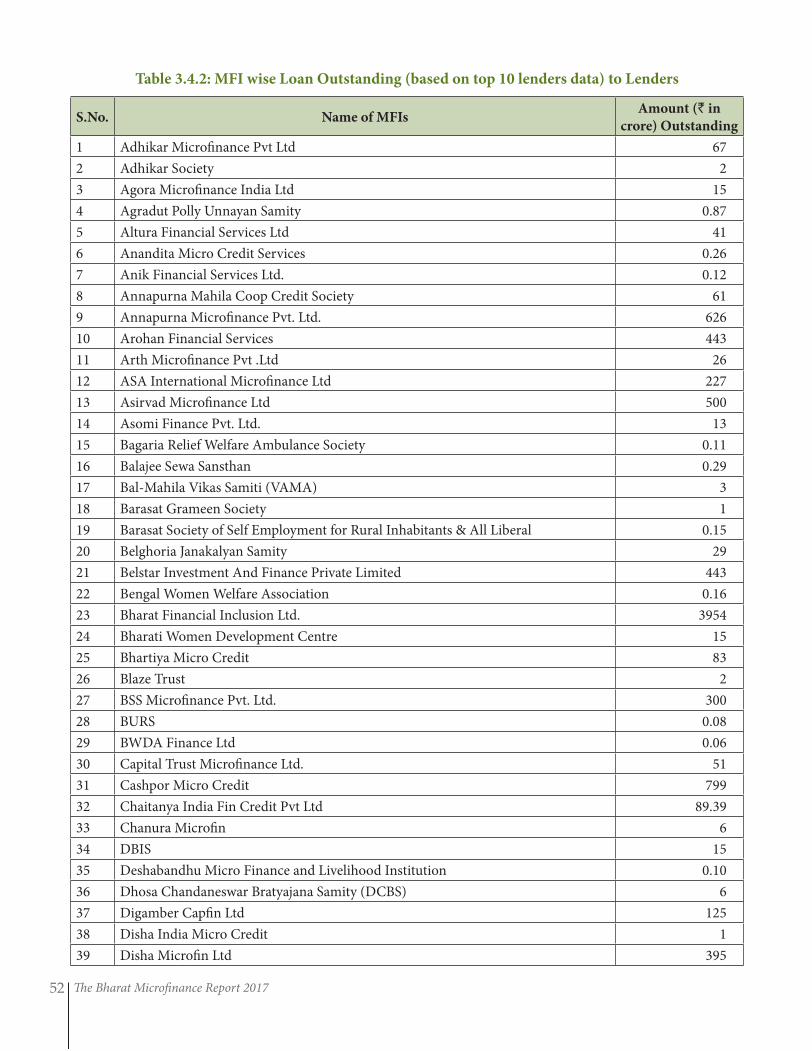
The Bharat Microfinance Report 201752
Table 3.4.2: MFI wise Loan Outstanding (based on top 10 lenders data) to Lenders
S.No. Name of MFIsAmount (` in
crore) Outstanding
1 Adhikar Microfinance Pvt Ltd 67
2 Adhikar Society 2
3 Agora Microfinance India Ltd 15
4 Agradut Polly Unnayan Samity 0.87
5 Altura Financial Services Ltd 41
6 Anandita Micro Credit Services 0.26
7 Anik Financial Services Ltd. 0.12
8 Annapurna Mahila Coop Credit Society 61
9 Annapurna Microfinance Pvt. Ltd. 626
10 Arohan Financial Services 443
11 Arth Microfinance Pvt .Ltd 26
12 ASA International Microfinance Ltd 227
13 Asirvad Microfinance Ltd 500
14 Asomi Finance Pvt. Ltd. 13
15 Bagaria Relief Welfare Ambulance Society 0.11
16 Balajee Sewa Sansthan 0.29
17 Bal-Mahila Vikas Samiti (VAMA) 3
18 Barasat Grameen Society 1
19 Barasat Society of Self Employment for Rural Inhabitants & All Liberal 0.15
20 Belghoria Janakalyan Samity 29
21 Belstar Investment And Finance Private Limited 443
22 Bengal Women Welfare Association 0.16
23 Bharat Financial Inclusion Ltd. 3954
24 Bharati Women Development Centre 15
25 Bhartiya Micro Credit 83
26 Blaze Trust 2
27 BSS Microfinance Pvt. Ltd. 300
28 BURS 0.08
29 BWDA Finance Ltd 0.06
30 Capital Trust Microfinance Ltd. 51
31 Cashpor Micro Credit 799
32 Chaitanya India Fin Credit Pvt Ltd 89.39
33 Chanura Microfin 6
34 DBIS 15
35 Deshabandhu Micro Finance and Livelihood Institution 0.10
36 Dhosa Chandaneswar Bratyajana Samity (DCBS) 6
37 Digamber Capfin Ltd 125
38 Disha India Micro Credit 1
39 Disha Microfin Ltd 395
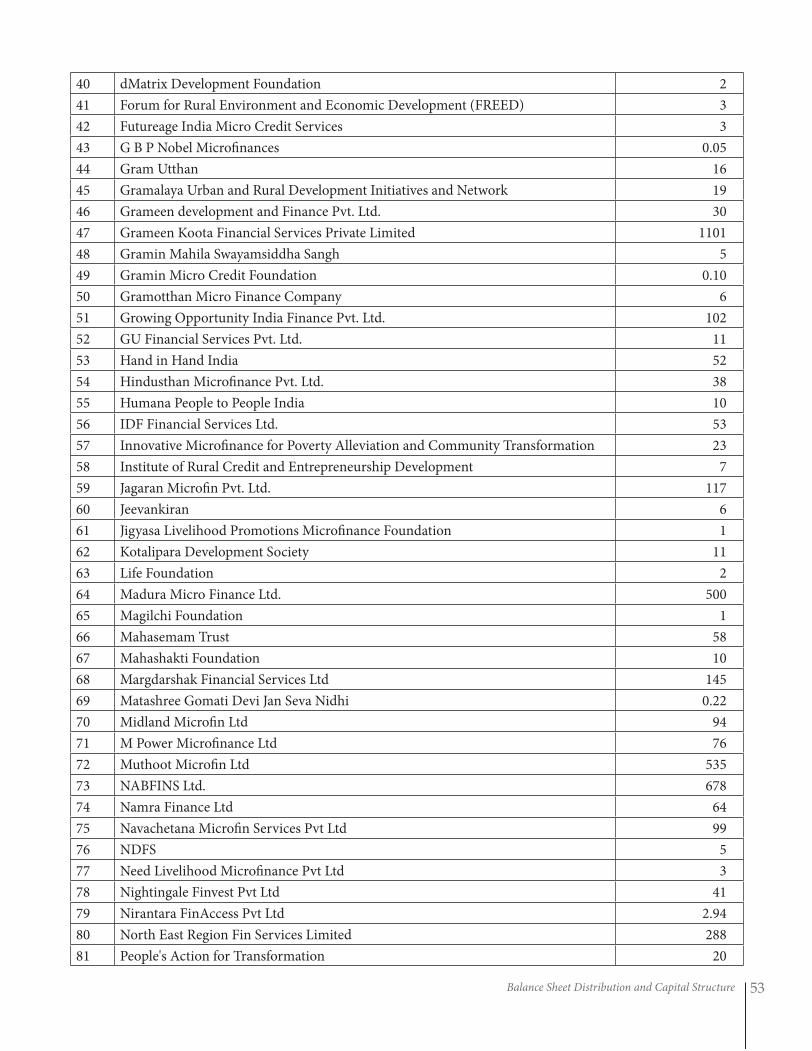
Balance Sheet Distribution and Capital Structure 53
40 dMatrix Development Foundation 2
41 Forum for Rural Environment and Economic Development (FREED) 3
42 Futureage India Micro Credit Services 3
43 G B P Nobel Microfinances 0.05
44 Gram Utthan 16
45 Gramalaya Urban and Rural Development Initiatives and Network 19
46 Grameen development and Finance Pvt. Ltd. 30
47 Grameen Koota Financial Services Private Limited 1101
48 Gramin Mahila Swayamsiddha Sangh 5
49 Gramin Micro Credit Foundation 0.10
50 Gramotthan Micro Finance Company 6
51 Growing Opportunity India Finance Pvt. Ltd. 102
52 GU Financial Services Pvt. Ltd. 11
53 Hand in Hand India 52
54 Hindusthan Microfinance Pvt. Ltd. 38
55 Humana People to People India 10
56 IDF Financial Services Ltd. 53
57 Innovative Microfinance for Poverty Alleviation and Community Transformation 23
58 Institute of Rural Credit and Entrepreneurship Development 7
59 Jagaran Microfin Pvt. Ltd. 117
60 Jeevankiran 6
61 Jigyasa Livelihood Promotions Microfinance Foundation 1
62 Kotalipara Development Society 11
63 Life Foundation 2
64 Madura Micro Finance Ltd. 500
65 Magilchi Foundation 1
66 Mahasemam Trust 58
67 Mahashakti Foundation 10
68 Margdarshak Financial Services Ltd 145
69 Matashree Gomati Devi Jan Seva Nidhi 0.22
70 Midland Microfin Ltd 94
71 M Power Microfinance Ltd 76
72 Muthoot Microfin Ltd 535
73 NABFINS Ltd. 678
74 Namra Finance Ltd 64
75 Navachetana Microfin Services Pvt Ltd 99
76 NDFS 5
77 Need Livelihood Microfinance Pvt Ltd 3
78 Nightingale Finvest Pvt Ltd 41
79 Nirantara FinAccess Pvt Ltd 2.94
80 North East Region Fin Services Limited 288
81 People's Action for Transformation 20
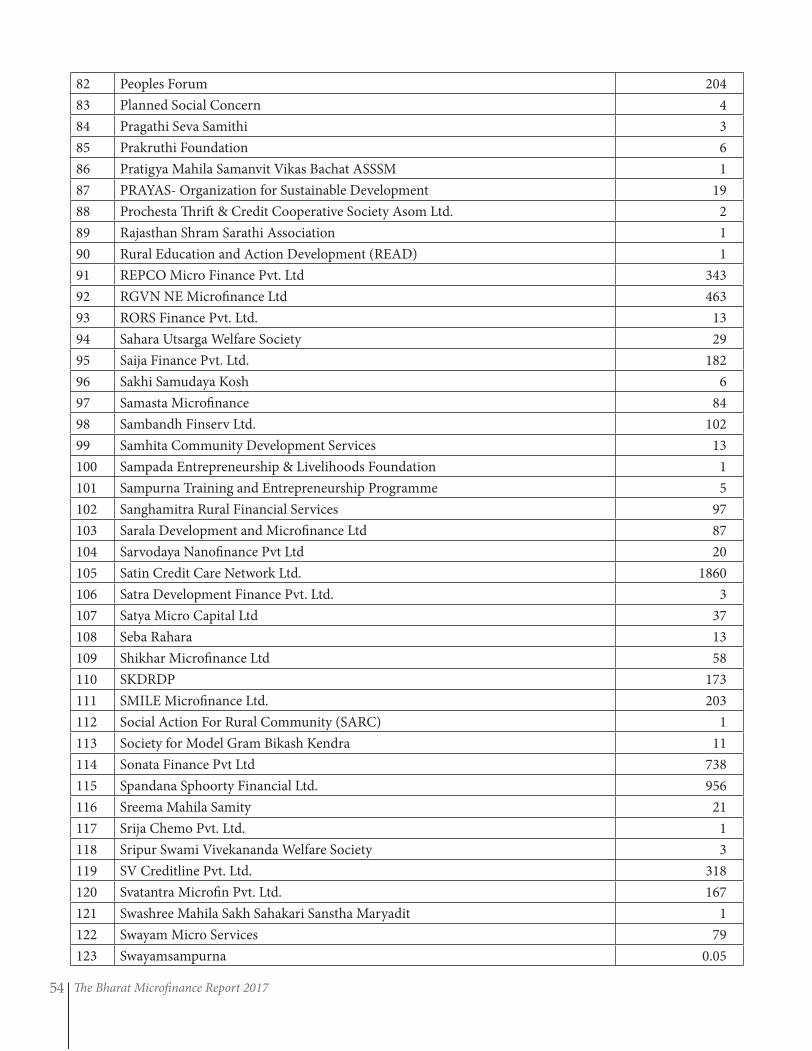
The Bharat Microfinance Report 201754
82 Peoples Forum 204
83 Planned Social Concern 4
84 Pragathi Seva Samithi 3
85 Prakruthi Foundation 6
86 Pratigya Mahila Samanvit Vikas Bachat ASSSM 1
87 PRAYAS- Organization for Sustainable Development 19
88 Prochesta Thrift & Credit Cooperative Society Asom Ltd. 2
89 Rajasthan Shram Sarathi Association 1
90 Rural Education and Action Development (READ) 1
91 REPCO Micro Finance Pvt. Ltd 343
92 RGVN NE Microfinance Ltd 463
93 RORS Finance Pvt. Ltd. 13
94 Sahara Utsarga Welfare Society 29
95 Saija Finance Pvt. Ltd. 182
96 Sakhi Samudaya Kosh 6
97 Samasta Microfinance 84
98 Sambandh Finserv Ltd. 102
99 Samhita Community Development Services 13
100 Sampada Entrepreneurship & Livelihoods Foundation 1
101 Sampurna Training and Entrepreneurship Programme 5
102 Sanghamitra Rural Financial Services 97
103 Sarala Development and Microfinance Ltd 87
104 Sarvodaya Nanofinance Pvt Ltd 20
105 Satin Credit Care Network Ltd. 1860
106 Satra Development Finance Pvt. Ltd. 3
107 Satya Micro Capital Ltd 37
108 Seba Rahara 13
109 Shikhar Microfinance Ltd 58
110 SKDRDP 173
111 SMILE Microfinance Ltd. 203
112 Social Action For Rural Community (SARC) 1
113 Society for Model Gram Bikash Kendra 11
114 Sonata Finance Pvt Ltd 738
115 Spandana Sphoorty Financial Ltd. 956
116 Sreema Mahila Samity 21
117 Srija Chemo Pvt. Ltd. 1
118 Sripur Swami Vivekananda Welfare Society 3
119 SV Creditline Pvt. Ltd. 318
120 Svatantra Microfin Pvt. Ltd. 167
121 Swashree Mahila Sakh Sahakari Sanstha Maryadit 1
122 Swayam Micro Services 79
123 Swayamsampurna 0.05
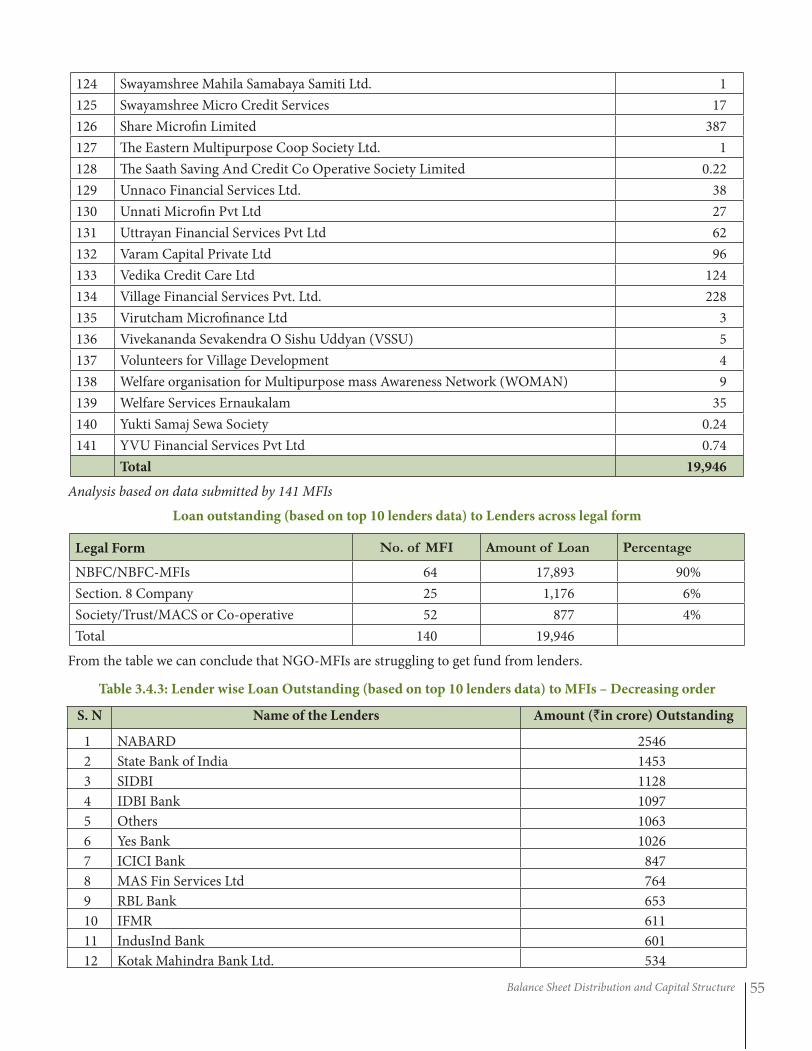
Balance Sheet Distribution and Capital Structure 55
124 Swayamshree Mahila Samabaya Samiti Ltd. 1
125 Swayamshree Micro Credit Services 17
126 Share Microfin Limited 387
127 The Eastern Multipurpose Coop Society Ltd. 1
128 The Saath Saving And Credit Co Operative Society Limited 0.22
129 Unnaco Financial Services Ltd. 38
130 Unnati Microfin Pvt Ltd 27
131 Uttrayan Financial Services Pvt Ltd 62
132 Varam Capital Private Ltd 96
133 Vedika Credit Care Ltd 124
134 Village Financial Services Pvt. Ltd. 228
135 Virutcham Microfinance Ltd 3
136 Vivekananda Sevakendra O Sishu Uddyan (VSSU) 5
137 Volunteers for Village Development 4
138 Welfare organisation for Multipurpose mass Awareness Network (WOMAN) 9
139 Welfare Services Ernaukalam 35
140 Yukti Samaj Sewa Society 0.24
141 YVU Financial Services Pvt Ltd 0.74
Total 19,946
Analysis based on data submitted by 141 MFIs
Loan outstanding (based on top 10 lenders data) to Lenders across legal form
Legal Form No. of MFI Amount of Loan Percentage
NBFC/NBFC-MFIs 64 17,893 90%
Section. 8 Company 25 1,176 6%
Society/Trust/MACS or Co-operative 52 877 4%
Total 140 19,946
From the table we can conclude that NGO-MFIs are struggling to get fund from lenders.
Table 3.4.3: Lender wise Loan Outstanding (based on top 10 lenders data) to MFIs – Decreasing order
S. N Name of the Lenders Amount (`in crore) Outstanding
1 NABARD 2546
2 State Bank of India 1453
3 SIDBI 1128
4 IDBI Bank 1097
5 Others 1063
6 Yes Bank 1026
7 ICICI Bank 847
8 MAS Fin Services Ltd 764
9 RBL Bank 653
10 IFMR 611
11 IndusInd Bank 601
12 Kotak Mahindra Bank Ltd. 534
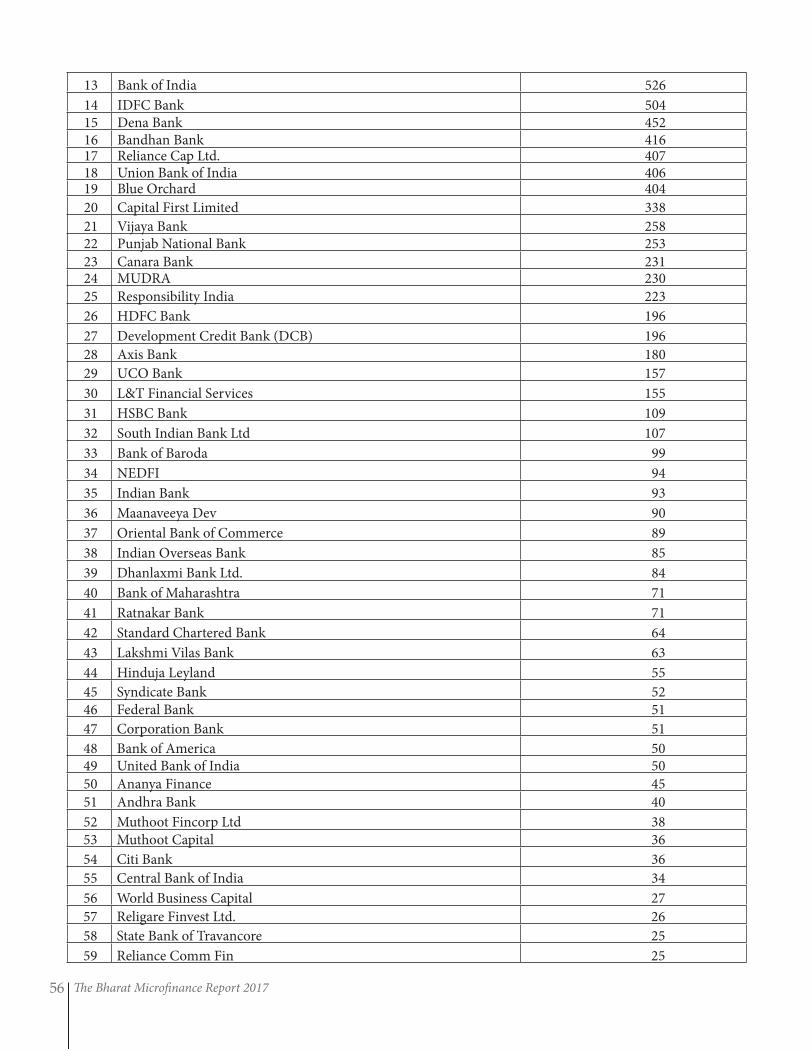
The Bharat Microfinance Report 201756
13 Bank of India 526
14 IDFC Bank 50415 Dena Bank 45216 Bandhan Bank 41617 Reliance Cap Ltd. 40718 Union Bank of India 40619 Blue Orchard 404
20 Capital First Limited 338
21 Vijaya Bank 25822 Punjab National Bank 253
23 Canara Bank 23124 MUDRA 230
25 Responsibility India 223
26 HDFC Bank 196
27 Development Credit Bank (DCB) 196
28 Axis Bank 180
29 UCO Bank 157
30 L&T Financial Services 155
31 HSBC Bank 109
32 South Indian Bank Ltd 107
33 Bank of Baroda 99
34 NEDFI 94
35 Indian Bank 93
36 Maanaveeya Dev 90
37 Oriental Bank of Commerce 89
38 Indian Overseas Bank 85
39 Dhanlaxmi Bank Ltd. 84
40 Bank of Maharashtra 71
41 Ratnakar Bank 71
42 Standard Chartered Bank 64
43 Lakshmi Vilas Bank 63
44 Hinduja Leyland 55
45 Syndicate Bank 5246 Federal Bank 51
47 Corporation Bank 51
48 Bank of America 5049 United Bank of India 50
50 Ananya Finance 45
51 Andhra Bank 40
52 Muthoot Fincorp Ltd 38
53 Muthoot Capital 36
54 Citi Bank 36
55 Central Bank of India 34
56 World Business Capital 27
57 Religare Finvest Ltd. 26
58 State Bank of Travancore 25
59 Reliance Comm Fin 25
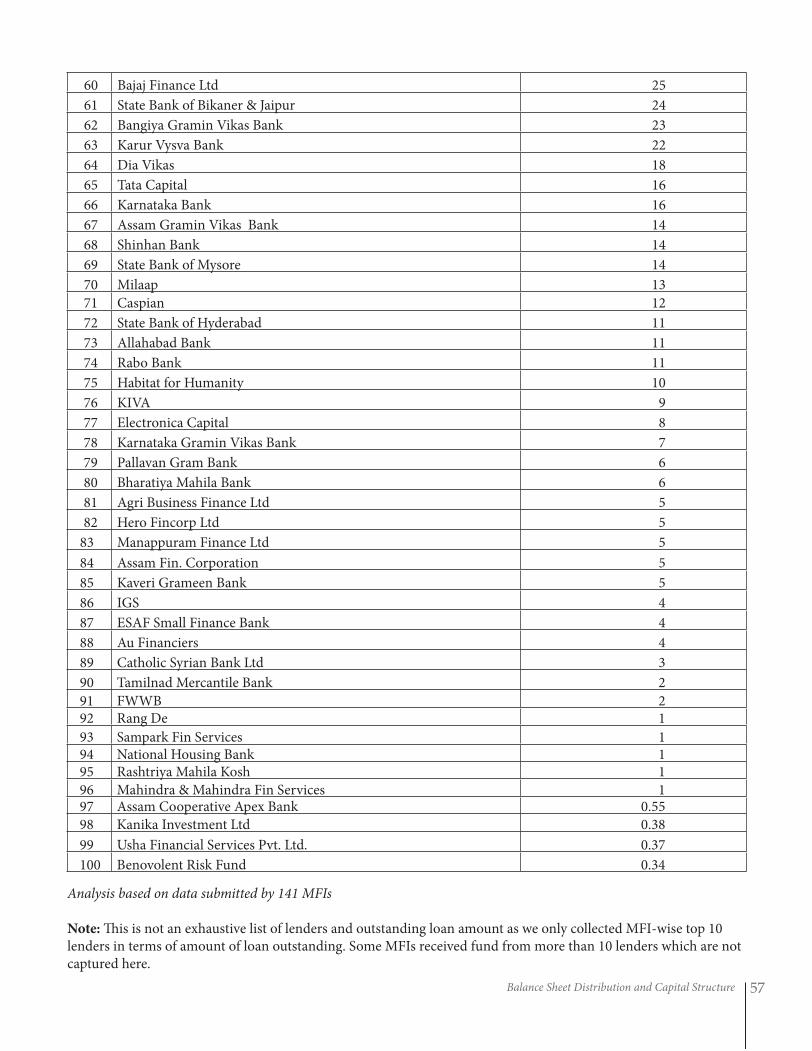
Balance Sheet Distribution and Capital Structure 57
60 Bajaj Finance Ltd 25
61 State Bank of Bikaner & Jaipur 24
62 Bangiya Gramin Vikas Bank 23
63 Karur Vysva Bank 22
64 Dia Vikas 18
65 Tata Capital 16
66 Karnataka Bank 16
67 Assam Gramin Vikas Bank 14
68 Shinhan Bank 14
69 State Bank of Mysore 14
70 Milaap 13
71 Caspian 12
72 State Bank of Hyderabad 11
73 Allahabad Bank 11
74 Rabo Bank 11
75 Habitat for Humanity 10
76 KIVA 9
77 Electronica Capital 8
78 Karnataka Gramin Vikas Bank 7
79 Pallavan Gram Bank 6
80 Bharatiya Mahila Bank 6
81 Agri Business Finance Ltd 5
82 Hero Fincorp Ltd 5
83 Manappuram Finance Ltd 5
84 Assam Fin. Corporation 5
85 Kaveri Grameen Bank 5
86 IGS 4
87 ESAF Small Finance Bank 4
88 Au Financiers 4
89 Catholic Syrian Bank Ltd 3
90 Tamilnad Mercantile Bank 2
91 FWWB 292 Rang De 1
93 Sampark Fin Services 194 National Housing Bank 195 Rashtriya Mahila Kosh 1
96 Mahindra & Mahindra Fin Services 197 Assam Cooperative Apex Bank 0.55
98 Kanika Investment Ltd 0.38
99 Usha Financial Services Pvt. Ltd. 0.37
100 Benovolent Risk Fund 0.34
Analysis based on data submitted by 141 MFIs
Note: This is not an exhaustive list of lenders and outstanding loan amount as we only collected MFI-wise top 10 lenders in terms of amount of loan outstanding. Some MFIs received fund from more than 10 lenders which are not captured here.
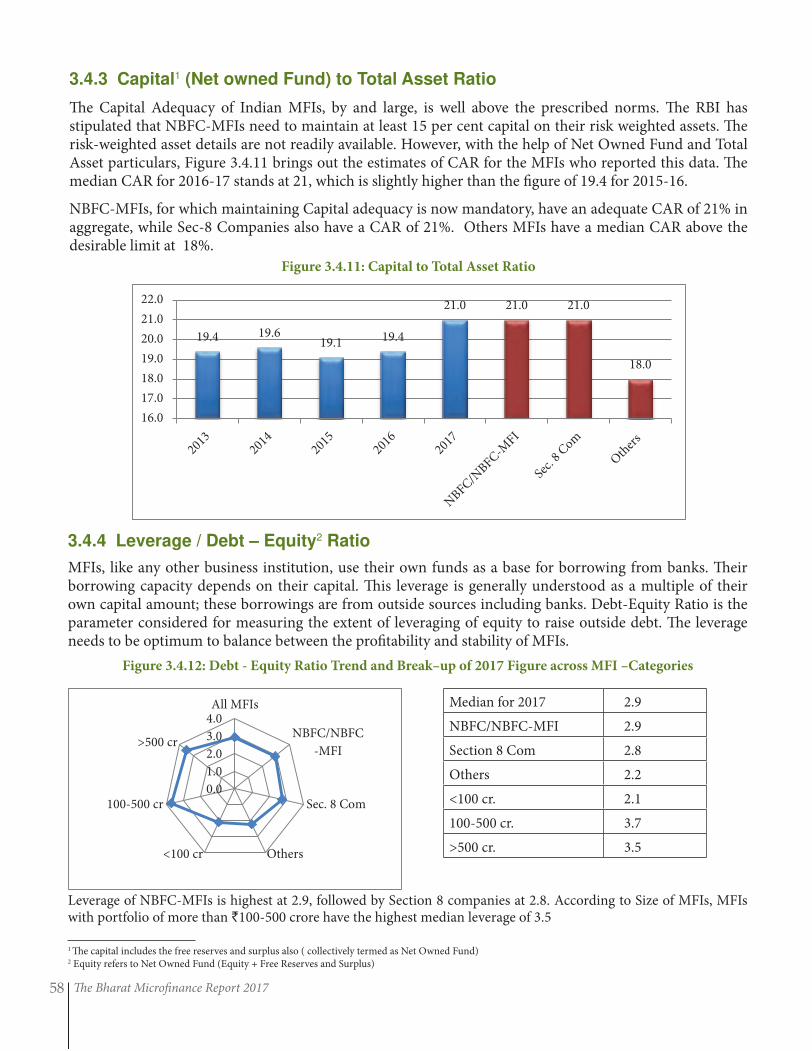
The Bharat Microfinance Report 201758
3.4.3 Capital1 (Net owned Fund) to Total Asset Ratio
The Capital Adequacy of Indian MFIs, by and large, is well above the prescribed norms. The RBI has stipulated that NBFC-MFIs need to maintain at least 15 per cent capital on their risk weighted assets. The risk-weighted asset details are not readily available. However, with the help of Net Owned Fund and Total Asset particulars, Figure 3.4.11 brings out the estimates of CAR for the MFIs who reported this data. The median CAR for 2016-17 stands at 21, which is slightly higher than the figure of 19.4 for 2015-16.
NBFC-MFIs, for which maintaining Capital adequacy is now mandatory, have an adequate CAR of 21% in aggregate, while Sec-8 Companies also have a CAR of 21%. Others MFIs have a median CAR above the desirable limit at 18%.
Figure 3.4.11: Capital to Total Asset Ratio
1 The capital includes the free reserves and surplus also ( collectively termed as Net Owned Fund)2 Equity refers to Net Owned Fund (Equity + Free Reserves and Surplus)
3.4.4 Leverage / Debt – Equity2 Ratio
MFIs, like any other business institution, use their own funds as a base for borrowing from banks. Their borrowing capacity depends on their capital. This leverage is generally understood as a multiple of their own capital amount; these borrowings are from outside sources including banks. Debt-Equity Ratio is the parameter considered for measuring the extent of leveraging of equity to raise outside debt. The leverage needs to be optimum to balance between the profitability and stability of MFIs.
Figure 3.4.12: Debt - Equity Ratio Trend and Break–up of 2017 Figure across MFI –Categories
19.4 19.6 19.1 19.4
21.0 21.0 21.0
18.0
16.0
17.0
18.0
19.0
20.0
21.0
22.0
0.0
1.0
2.0
3.0
4.0All MFIs
NBFC/NBFC
-MFI
Sec. 8 Com
Others<100 cr
100-500 cr
>500 cr
Leverage of NBFC-MFIs is highest at 2.9, followed by Section 8 companies at 2.8. According to Size of MFIs, MFIs with portfolio of more than `100-500 crore have the highest median leverage of 3.5
Median for 2017 2.9
NBFC/NBFC-MFI 2.9
Section 8 Com 2.8
Others 2.2
<100 cr. 2.1
100-500 cr. 3.7
>500 cr. 3.5
Credit Plus Activities 59
Credit Plus ActivitiesChapter 4
In the Indian context, the term “Financial Inclusion” was used for the first time in April 2005 in the Annual Policy Statement presented by Y. Venugopal Reddy, the then Governor, Reserve Bank of India. Later on,
this concept gained ground and came to be widely used in India and abroad. While recognizing the concerns in regard to the banking practices that tend to exclude rather than attract vast sections of population, banks were urged to review their existing practices to align them with the objective of financial inclusion.The Report of the Internal Group to Examine Issues relating to Rural Credit and Microfinance (Khan Committee) in July 2005 drew strength from this announcement by Governor Y. Venugopal Reddy in the Annual Policy Statement for 2005-06 wherein he had expressed deep concern on the exclusion of vast sections of the population from the formal financial system. In the Khan Committee Report, the RBI exhorted the banks with a view to achieving greater financial inclusion to make available a basic “no-frills” banking account.The recommendations of the Khan Committee were incorporated into the mid-term review of the policy (2005–06). Financial inclusion again featured later in 2005 when it was used by K.C. Chakraborthy, the Chairman of Indian Bank. Mangalam, Puducherry became the first village in India where all households were provided banking facilities. Norms were relaxed for people intending to open accounts with annual deposits of less than `50,000. General credit cards (GCCs) were issued to the poor and the disadvantaged with a view to help them access easy credit. In January 2006, the Reserve Bank permitted commercial banks to make use of the services of non-governmental organizations (NGOs/SHGs), micro-finance institutions, and other civil society organizations as intermediaries for providing financial and banking services. These intermediaries could be used as business facilitators or business correspondents by commercial banks. The bank asked the commercial banks in different regions to start a 100% financial inclusion campaign on a pilot basis. As a result of the campaign, states or union territories like Puducherry, Himachal Pradesh and Kerala announced 100% financial inclusion in all their districts. Reserve Bank of India’s vision for 2020 is to open nearly 600 million new customers’ accounts and service them through a variety of channels by leveraging on IT. However, illiteracy and the low income savings and lack of bank branches in rural areas continue to be a roadblock to financial inclusion in many states and there is inadequate legal and financial structure.
The Government of India announced “Pradhan Mantri Jan Dhan Yojna,” a national financial inclusion mission which aims to provide bank accounts to at least 75 million people by January 26, 2015. To achieve this milestone, it’s important for both service providers and policy makers to have readily available information outlining gaps in access and interactive tools that help better understand the context at the district level. MIX designed the FINclusion Lab India FI workbook to support these actors as they craft strategies to achieve these goals.
Several Startups are working towards increasing Financial Inclusion in India by organising various large unorganised sectors where payments primarily happen in cash, instead of a bank transaction.
Recently, the Government of India came up with a policy under the name “rupee exchange” to exchange higher notes with the intent of: clamping down on tax defaulters, track down corrupt officers ( by rendering valueless heavy cash stashed away secretly) and generally restoring sanity to the economic system. First off it is alarming that despite the fact that India’s CRISIL index is in excess of 40% and it is reputed to be heavy on technology, over 85% of its financial transactions are cash based. While income and inequality gaps will widen anyways, it is recommended that India embraces - proposed - as a matter of policy financial inclusion.
In India, RBI has initiated several measures to achieve greater financial inclusion, such as facilitating no-frills accounts and GCCs for small deposits and credit. Some of these steps are:
Financial inclusion is not an Indian specific problem, it is global one. So now financial inclusion is a topic of increasing interest on the international policy agenda. But in India, home to the second largest population in
The Bharat Microfinance Report 201760
the world, with huge mass of people below the poverty line spread across nearly 600,000 villages in 600 districts, it assumes utmost importance. India’s government has a long tradition of promoting financial inclusion. For more than 40 years, the Reserve Bank of India has been operating priority sector lending mandating a portion of banks’ loan portfolios to be in the agriculture sector and to small and micro enterprises. In 2005, it required banks to offer basic no-frills accounts with no, or very low, minimum balances and affordable charges. However, use of these accounts has been very low. In 2011, banks were advised to provide at a minimum four products: (a) a savings or overdraft account, (b) a remittance product for electronic transfer of government benefits and other remittances, (c) a pure savings product (ideally a recurring-deposit scheme), and (d) entrepreneurial credit. In a parallel initiative, in 2010 the government and the central bank set goals to provide by 2015 all villages in India with a banking outlet (either by a branch or a retail agent, in India known as a business correspondent), with stipulated annual targets along the way. While these targets were not specified by law, the Reserve Bank of India requires all banks to report progress regularly and closely monitors their achievements. It is still too early to say how successful the implementation of these ambitious goals will be. Some banks have risen to the challenge and opened numerous new outlets (mostly business correspondents). Others have complained that the financial inclusion targets hurt their profits.
For taking Financial Inclusion agenda forward, RBI granted “in-principle” licensing of 11 payments banks and 10 small finance banks. 11 payments Banks includes, Indian Post Office as the Indian post office has a huge network of branches with an unique outreach in rural areas. The sector is poised for much-needed disruption that will bring millions of Indian households into the formal financial system for the first time.
The nation has also enlarged the envelope of Financial Inclusion by including insurance, pension and other activities into its definition and priorities. The Pradhan Mantri Jan Dhan Yojana (PMJDY), which advocates for micro insurance and pension along with credit and savings, is one such recent development for an inclusive financial system. However, the Microfinance sector which is comprised of MFIs and SHPIs/SHGs has been proactively providing credit plus services such as micro-credit, savings, micro-insurance, micro-pensions, and other development related activities. The sector clearly understands the importance of credit plus services to low-income people. This chapter throws a light on such credit plus activities provided by MFIs and SHPIs.
4.1 Micro Insurance1
In order to facilitate penetration of insurance to the lower income segments of population, IRDA had formulated the micro insurance regulations. Micro Insurance Regulations, 2005 provide a platform to distribute insurance products, which are affordable to the rural and urban poor and to enable micro insurance to be an integral part of the country’s wider insurance system.
The main thrust of micro insurance regulations is protection of low income people with affordable insurance products to help cope with and recover from common risks with standardized popular insurance products adhering to certain levels of cover, premium and benefit standards. These regulations allow Non Government Organizations (NGOs) and Self Help Groups (SHGs) to act as agents to insurance companies in marketing the micro insurance products and also allow both life and non-life insurers to promote combi-micro insurance products (combination of different lines of business).
The Authority undertook the review of the Micro Insurance Regulations, 2005 comprehensively. In this connection, the Authority has notified the Amended Regulations on 13th March 2015 wherein it has permitted several more entities like District Co-operative Banks, Regional Rural Banks including Business Correspondents of Scheduled Commercial Banks to be appointed as Micro Insurance agents facilitating better penetration of Micro Insurance business.
1 IRDA Annual Report 2015-16.
Credit Plus Activities 61
The Authority has reviewed the Micro Insurance Regulations, 2005 comprehensively and notified IRDAI (Micro Insurance) Regulations, 2015. Micro Insurance is the insurance provided through the Micro Insurance Products which includes “general micro-insurance product”. General Micro Insurance Products cover health insurance contract, any contract covering the belongings, such as, hut, livestock or tools or instruments or any personal accident contract, either on individual or group basis with a maximum amount of cover as Rupees one lakh and minimum and maximum term cover of one year.
The Authority in order to propagate micro insurance in various segments has permitted more entities or individuals to be appointed as Micro Insurance Agents which include Non-Government Organisations (NGO), Self-Help Groups (SHG), Micro-Finance Institution(MFI), RBI regulated NBFC-MFIs, District Cooperative Banks, Regional Rural Banks, Urban Co-operative banks, Business correspondents, Primary Agricultural Cooperative Societies and Other Cooperative Societies.
There are around fifty two products offered by all registered non-life insurance companies targeting low income segment of the population e.g., Cattle Micro Insurance, Kisan Agriculture Pumpset Micro Insurance Policy, Janata Personal Accident Sukshma Bima Policy, Silkworm Sukshma Bima Policy, Sheep & Goat Micro Insurance Policy, Sampoorna Griha Suraksha Policy etc. Further, General Insurance Policies issued to Micro, Small and Medium Enterprises as classified in MSMED Act, 2006 under various lines of General Insurance business will also be qualified as general micro insurance business upto ₹10,000 premium p.a. per MSM enterprise.
Micro Insurance being a low price-high volume business, its success and sustainability depends mainly on keeping the transactions costs down. Section 32B and 32C of the Insurance Act, 1938 and IRDAI (Obligations of insurers to rural and social sectors) 2015, stipulate obligations to insurers in respect of rural and social sector, which have also contributed a lot in development and promotion of micro insurance products by insurers in India.
Box 4.1: Microfinance and Affordable Insurance Access - A path to achieve Sustainable
Development Goals
Bajaj Allianz Life Insurance is one of the largest private players in the rural insurance space and the largest micro insurance provider in India. It has covered more than 20 crore lives through 350 Rural Partners and settled more than `47,139 crore worth of claims. It has also covered MFI client through 50 MFI Partners and settled 3,97,942 claims during last six months with 98% claim settlement ratio. Claims paid of `1015.43 crore under Financial Inclusion (Group Scheme). It has entered into more than `2700 crore new business and more than `1600 crore renewal business.
All the insurance products are designed through extensive market research to fit the budget of the rural clients. It also involves in training the rural clients on various livelihood earning activities such as Nukkad Nataks, Drum beating etc.
Bajaj Allianz Life Insurance is a joint venture between Allianz SE, the world’s leading insurer, and Bajaj Finserv Limited. Allianz SE is a leading insurance conglomerate globally and one of the largest asset managers in the world. Bajaj Allianz Life Insurance Company was incorporated on 12th March 2001 and started its operations on 3rd August 2001 with a commitment to offer premium financial solutions providing financial security to individuals and their families. It is one of India’s leading private life insurance companies today. The Company has developed insurance solutions that cater to all kinds of customer needs from ULIPs to Child plans, and from group insurance to health insurance. The Company has a pan-India presence with 638 branches in India. Recently, the Company achieved a milestone of crossing `50,000 crores of Assets Under Management (AUM) on 31 May 2017.
Courtesy: Bajaj Allianz Life Insurance Co Ltd.
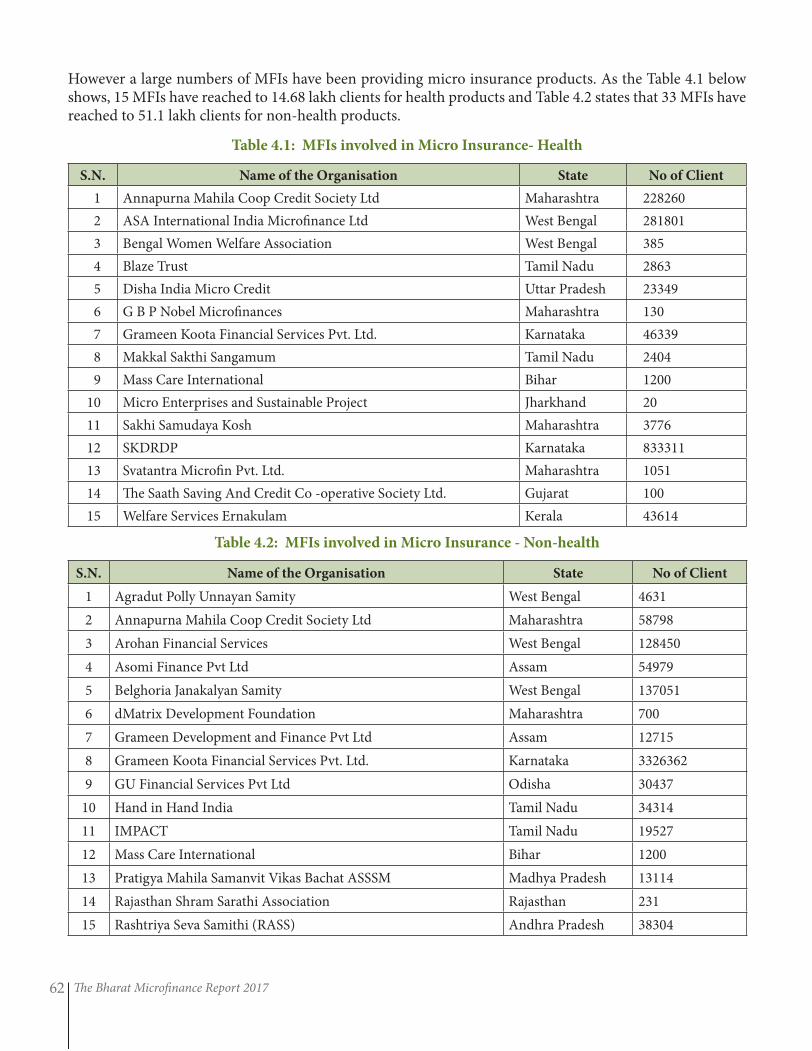
The Bharat Microfinance Report 201762
However a large numbers of MFIs have been providing micro insurance products. As the Table 4.1 below shows, 15 MFIs have reached to 14.68 lakh clients for health products and Table 4.2 states that 33 MFIs have reached to 51.1 lakh clients for non-health products.
Table 4.1: MFIs involved in Micro Insurance- Health
S.N. Name of the Organisation State No of Client
1 Annapurna Mahila Coop Credit Society Ltd Maharashtra 228260
2 ASA International India Microfinance Ltd West Bengal 281801
3 Bengal Women Welfare Association West Bengal 385
4 Blaze Trust Tamil Nadu 2863
5 Disha India Micro Credit Uttar Pradesh 23349
6 G B P Nobel Microfinances Maharashtra 130
7 Grameen Koota Financial Services Pvt. Ltd. Karnataka 46339
8 Makkal Sakthi Sangamum Tamil Nadu 2404
9 Mass Care International Bihar 1200
10 Micro Enterprises and Sustainable Project Jharkhand 20
11 Sakhi Samudaya Kosh Maharashtra 3776
12 SKDRDP Karnataka 833311
13 Svatantra Microfin Pvt. Ltd. Maharashtra 1051
14 The Saath Saving And Credit Co -operative Society Ltd. Gujarat 100
15 Welfare Services Ernakulam Kerala 43614
Table 4.2: MFIs involved in Micro Insurance - Non-health
S.N. Name of the Organisation State No of Client
1 Agradut Polly Unnayan Samity West Bengal 4631
2 Annapurna Mahila Coop Credit Society Ltd Maharashtra 58798
3 Arohan Financial Services West Bengal 128450
4 Asomi Finance Pvt Ltd Assam 54979
5 Belghoria Janakalyan Samity West Bengal 137051
6 dMatrix Development Foundation Maharashtra 700
7 Grameen Development and Finance Pvt Ltd Assam 12715
8 Grameen Koota Financial Services Pvt. Ltd. Karnataka 3326362
9 GU Financial Services Pvt Ltd Odisha 30437
10 Hand in Hand India Tamil Nadu 34314
11 IMPACT Tamil Nadu 19527
12 Mass Care International Bihar 1200
13 Pratigya Mahila Samanvit Vikas Bachat ASSSM Madhya Pradesh 13114
14 Rajasthan Shram Sarathi Association Rajasthan 231
15 Rashtriya Seva Samithi (RASS) Andhra Pradesh 38304
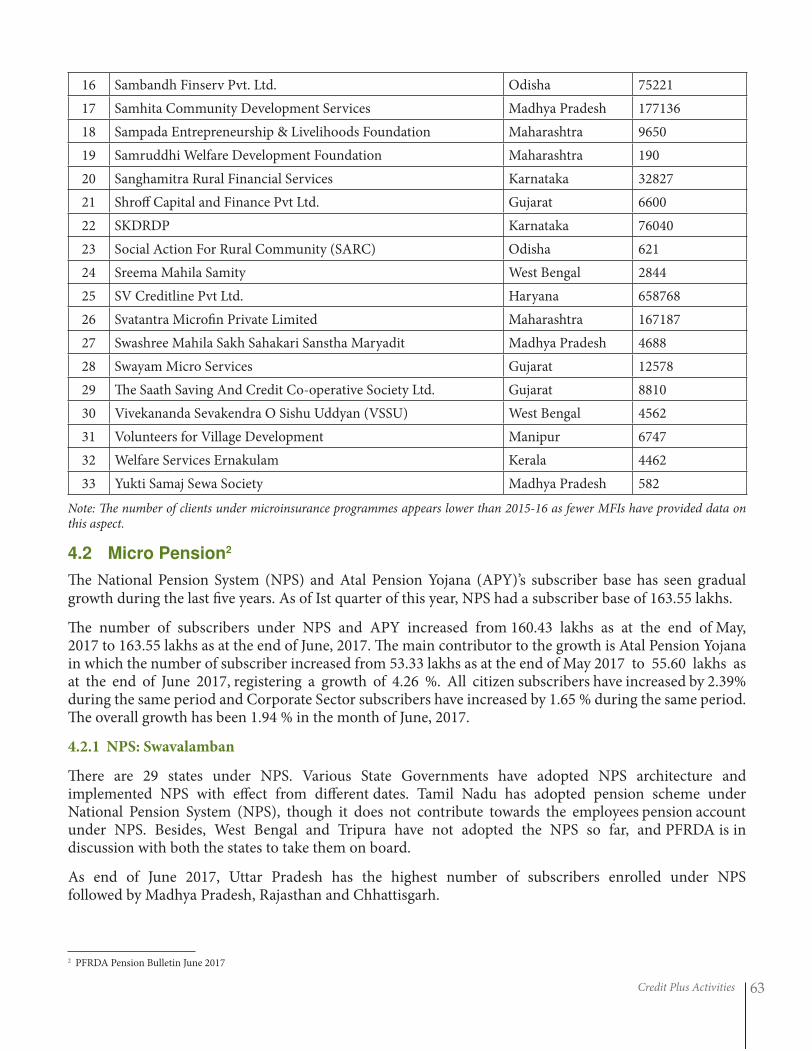
Credit Plus Activities 63
16 Sambandh Finserv Pvt. Ltd. Odisha 75221
17 Samhita Community Development Services Madhya Pradesh 177136
18 Sampada Entrepreneurship & Livelihoods Foundation Maharashtra 9650
19 Samruddhi Welfare Development Foundation Maharashtra 190
20 Sanghamitra Rural Financial Services Karnataka 32827
21 Shroff Capital and Finance Pvt Ltd. Gujarat 6600
22 SKDRDP Karnataka 76040
23 Social Action For Rural Community (SARC) Odisha 621
24 Sreema Mahila Samity West Bengal 2844
25 SV Creditline Pvt Ltd. Haryana 658768
26 Svatantra Microfin Private Limited Maharashtra 167187
27 Swashree Mahila Sakh Sahakari Sanstha Maryadit Madhya Pradesh 4688
28 Swayam Micro Services Gujarat 12578
29 The Saath Saving And Credit Co-operative Society Ltd. Gujarat 8810
30 Vivekananda Sevakendra O Sishu Uddyan (VSSU) West Bengal 4562
31 Volunteers for Village Development Manipur 6747
32 Welfare Services Ernakulam Kerala 4462
33 Yukti Samaj Sewa Society Madhya Pradesh 582
Note: The number of clients under microinsurance programmes appears lower than 2015-16 as fewer MFIs have provided data on this aspect.
4.2 Micro Pension2
The National Pension System (NPS) and Atal Pension Yojana (APY)’s subscriber base has seen gradual growth during the last five years. As of Ist quarter of this year, NPS had a subscriber base of 163.55 lakhs.
The number of subscribers under NPS and APY increased from 160.43 lakhs as at the end of May, 2017 to 163.55 lakhs as at the end of June, 2017. The main contributor to the growth is Atal Pension Yojana in which the number of subscriber increased from 53.33 lakhs as at the end of May 2017 to 55.60 lakhs as at the end of June 2017, registering a growth of 4.26 %. All citizen subscribers have increased by 2.39% during the same period and Corporate Sector subscribers have increased by 1.65 % during the same period. The overall growth has been 1.94 % in the month of June, 2017.
4.2.1 NPS: Swavalamban
There are 29 states under NPS. Various State Governments have adopted NPS architecture and implemented NPS with effect from different dates. Tamil Nadu has adopted pension scheme under National Pension System (NPS), though it does not contribute towards the employees pension account under NPS. Besides, West Bengal and Tripura have not adopted the NPS so far, and PFRDA is in discussion with both the states to take them on board.
As end of June 2017, Uttar Pradesh has the highest number of subscribers enrolled under NPS followed by Madhya Pradesh, Rajasthan and Chhattisgarh.
2 PFRDA Pension Bulletin June 2017
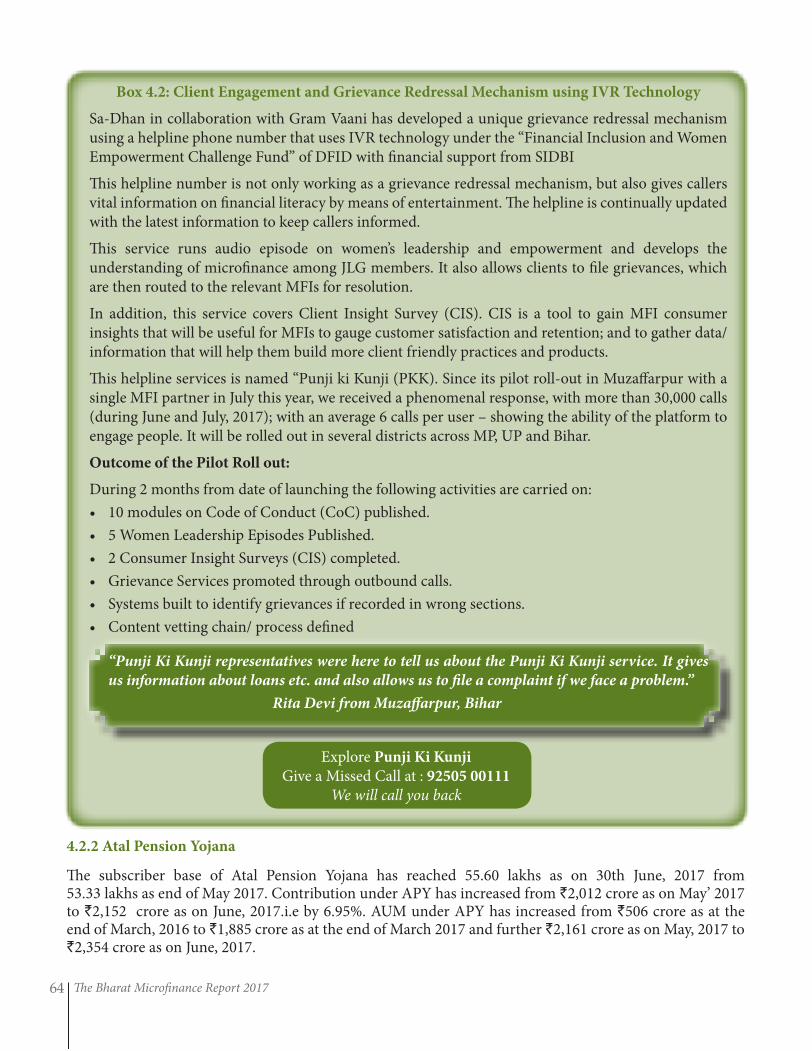
The Bharat Microfinance Report 201764
4.2.2 Atal Pension Yojana
The subscriber base of Atal Pension Yojana has reached 55.60 lakhs as on 30th June, 2017 from 53.33 lakhs as end of May 2017. Contribution under APY has increased from `2,012 crore as on May’ 2017 to `2,152 crore as on June, 2017.i.e by 6.95%. AUM under APY has increased from `506 crore as at the end of March, 2016 to `1,885 crore as at the end of March 2017 and further `2,161 crore as on May, 2017 to `2,354 crore as on June, 2017.
Explore Punji Ki Kunji
Give a Missed Call at : 92505 00111
We will call you back
Box 4.2: Client Engagement and Grievance Redressal Mechanism using IVR Technology
Sa-Dhan in collaboration with Gram Vaani has developed a unique grievance redressal mechanism using a helpline phone number that uses IVR technology under the “Financial Inclusion and Women Empowerment Challenge Fund” of DFID with financial support from SIDBI
This helpline number is not only working as a grievance redressal mechanism, but also gives callers vital information on financial literacy by means of entertainment. The helpline is continually updated with the latest information to keep callers informed.
This service runs audio episode on women’s leadership and empowerment and develops the understanding of microfinance among JLG members. It also allows clients to file grievances, which are then routed to the relevant MFIs for resolution.
In addition, this service covers Client Insight Survey (CIS). CIS is a tool to gain MFI consumer insights that will be useful for MFIs to gauge customer satisfaction and retention; and to gather data/information that will help them build more client friendly practices and products.
This helpline services is named “Punji ki Kunji (PKK). Since its pilot roll-out in Muzaffarpur with a single MFI partner in July this year, we received a phenomenal response, with more than 30,000 calls (during June and July, 2017); with an average 6 calls per user – showing the ability of the platform to engage people. It will be rolled out in several districts across MP, UP and Bihar.
Outcome of the Pilot Roll out:
During 2 months from date of launching the following activities are carried on:
• 10 modules on Code of Conduct (CoC) published.
• 5 Women Leadership Episodes Published.
• 2 Consumer Insight Surveys (CIS) completed.
• Grievance Services promoted through outbound calls.
• Systems built to identify grievances if recorded in wrong sections.
• Content vetting chain/ process defined
“Punji Ki Kunji representatives were here to tell us about the Punji Ki Kunji service. It gives
us information about loans etc. and also allows us to file a complaint if we face a problem.”
Rita Devi from Muzaffarpur, Bihar
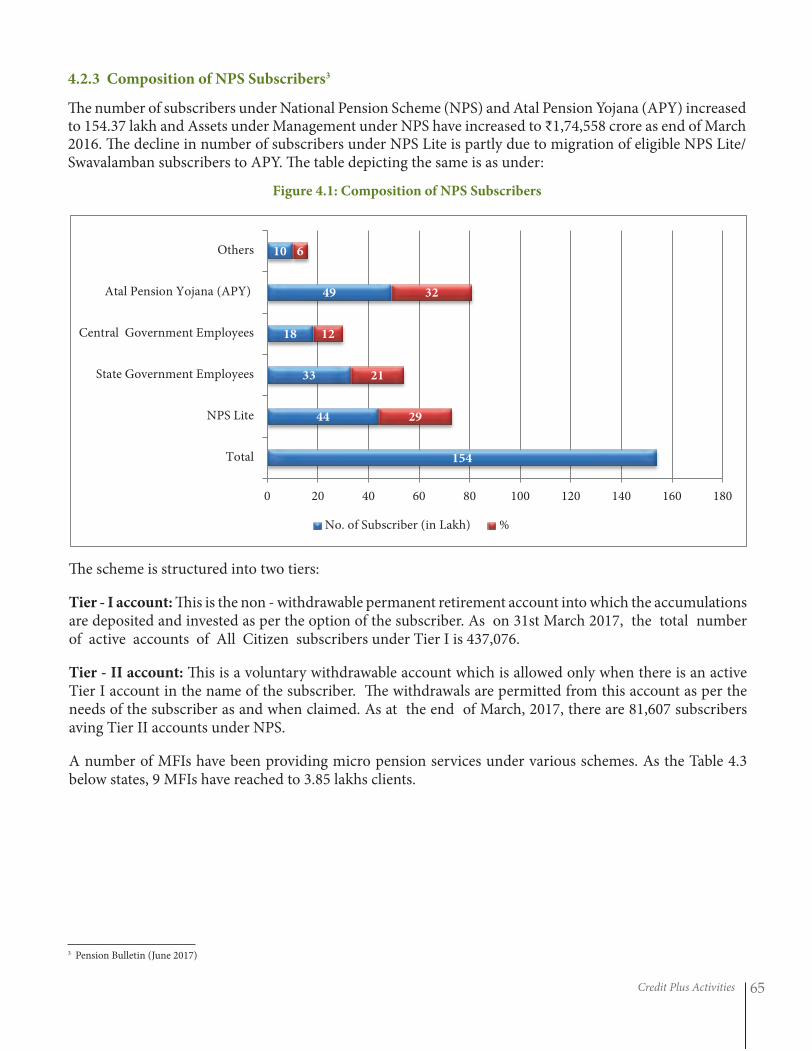
Credit Plus Activities 65
4.2.3 Composition of NPS Subscribers3
The number of subscribers under National Pension Scheme (NPS) and Atal Pension Yojana (APY) increased to 154.37 lakh and Assets under Management under NPS have increased to ₹1,74,558 crore as end of March 2016. The decline in number of subscribers under NPS Lite is partly due to migration of eligible NPS Lite/Swavalamban subscribers to APY. The table depicting the same is as under:
Figure 4.1: Composition of NPS Subscribers
3 Pension Bulletin (June 2017)
154
44
33
18
49
10
29
21
12
32
6
0 20 40 60 80 100 120 140 160 180
Total
NPS Lite
State Government Employees
Central Government Employees
Atal Pension Yojana (APY)
Others
No. of Subscriber (in Lakh) %
The scheme is structured into two tiers:
Tier - I account: This is the non - withdrawable permanent retirement account into which the accumulations are deposited and invested as per the option of the subscriber. As on 31st March 2017, the total number of active accounts of All Citizen subscribers under Tier I is 437,076.
Tier - II account: This is a voluntary withdrawable account which is allowed only when there is an active Tier I account in the name of the subscriber. The withdrawals are permitted from this account as per the needs of the subscriber as and when claimed. As at the end of March, 2017, there are 81,607 subscribers aving Tier II accounts under NPS.
A number of MFIs have been providing micro pension services under various schemes. As the Table 4.3 below states, 9 MFIs have reached to 3.85 lakhs clients.
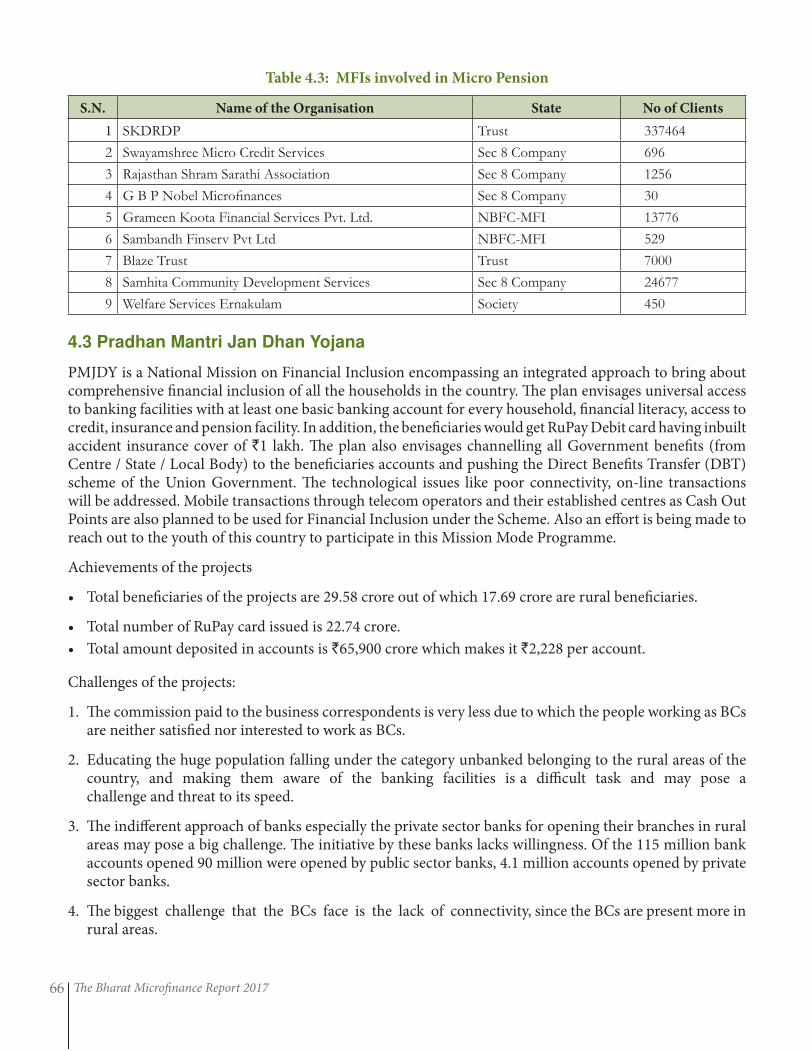
The Bharat Microfinance Report 201766
Table 4.3: MFIs involved in Micro Pension
S.N. Name of the Organisation State No of Clients
1 SKDRDP Trust 337464
2 Swayamshree Micro Credit Services Sec 8 Company 696
3 Rajasthan Shram Sarathi Association Sec 8 Company 1256
4 G B P Nobel Microfinances Sec 8 Company 30
5 Grameen Koota Financial Services Pvt. Ltd. NBFC-MFI 13776
6 Sambandh Finserv Pvt Ltd NBFC-MFI 529
7 Blaze Trust Trust 7000
8 Samhita Community Development Services Sec 8 Company 24677
9 Welfare Services Ernakulam Society 450
4.3 Pradhan Mantri Jan Dhan Yojana
PMJDY is a National Mission on Financial Inclusion encompassing an integrated approach to bring about comprehensive financial inclusion of all the households in the country. The plan envisages universal access to banking facilities with at least one basic banking account for every household, financial literacy, access to credit, insurance and pension facility. In addition, the beneficiaries would get RuPay Debit card having inbuilt accident insurance cover of `1 lakh. The plan also envisages channelling all Government benefits (from Centre / State / Local Body) to the beneficiaries accounts and pushing the Direct Benefits Transfer (DBT) scheme of the Union Government. The technological issues like poor connectivity, on-line transactions will be addressed. Mobile transactions through telecom operators and their established centres as Cash Out Points are also planned to be used for Financial Inclusion under the Scheme. Also an effort is being made to reach out to the youth of this country to participate in this Mission Mode Programme.
Achievements of the projects
• Total beneficiaries of the projects are 29.58 crore out of which 17.69 crore are rural beneficiaries.
• Total number of RuPay card issued is 22.74 crore.
• Total amount deposited in accounts is `65,900 crore which makes it `2,228 per account.
Challenges of the projects:
1. The commission paid to the business correspondents is very less due to which the people working as BCs are neither satisfied nor interested to work as BCs.
2. Educating the huge population falling under the category unbanked belonging to the rural areas of the country, and making them aware of the banking facilities is a difficult task and may pose a challenge and threat to its speed.
3. The indifferent approach of banks especially the private sector banks for opening their branches in rural areas may pose a big challenge. The initiative by these banks lacks willingness. Of the 115 million bank accounts opened 90 million were opened by public sector banks, 4.1 million accounts opened by private sector banks.
4. The biggest challenge that the BCs face is the lack of connectivity, since the BCs are present more in rural areas.
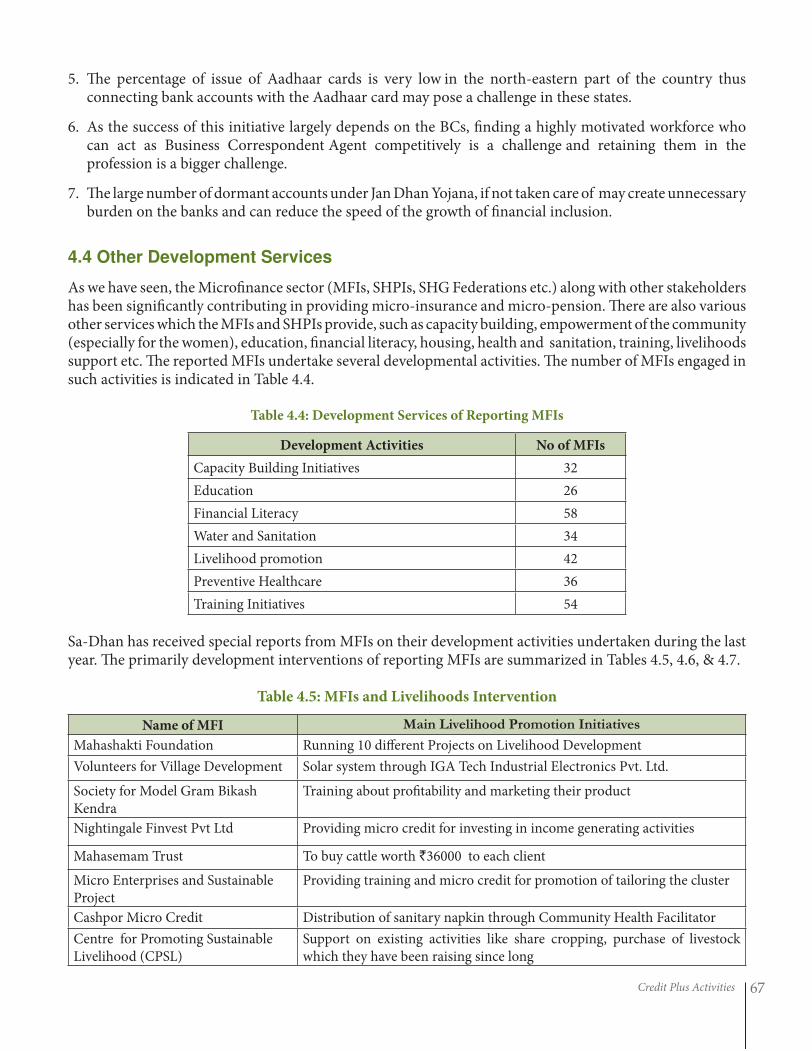
Credit Plus Activities 67
5. The percentage of issue of Aadhaar cards is very low in the north-eastern part of the country thus connecting bank accounts with the Aadhaar card may pose a challenge in these states.
6. As the success of this initiative largely depends on the BCs, finding a highly motivated workforce who can act as Business Correspondent Agent competitively is a challenge and retaining them in the profession is a bigger challenge.
7. The large number of dormant accounts under Jan Dhan Yojana, if not taken care of may create unnecessary burden on the banks and can reduce the speed of the growth of financial inclusion.
4.4 Other Development Services
As we have seen, the Microfinance sector (MFIs, SHPIs, SHG Federations etc.) along with other stakeholders has been significantly contributing in providing micro-insurance and micro-pension. There are also various other services which the MFIs and SHPIs provide, such as capacity building, empowerment of the community (especially for the women), education, financial literacy, housing, health and sanitation, training, livelihoods support etc. The reported MFIs undertake several developmental activities. The number of MFIs engaged in such activities is indicated in Table 4.4.
Table 4.4: Development Services of Reporting MFIs
Development Activities No of MFIs
Capacity Building Initiatives 32
Education 26
Financial Literacy 58
Water and Sanitation 34
Livelihood promotion 42
Preventive Healthcare 36
Training Initiatives 54
Sa-Dhan has received special reports from MFIs on their development activities undertaken during the last year. The primarily development interventions of reporting MFIs are summarized in Tables 4.5, 4.6, & 4.7.
Table 4.5: MFIs and Livelihoods Intervention
Name of MFI Main Livelihood Promotion Initiatives
Mahashakti Foundation Running 10 different Projects on Livelihood Development
Volunteers for Village Development Solar system through IGA Tech Industrial Electronics Pvt. Ltd.
Society for Model Gram Bikash Kendra
Training about profitability and marketing their product
Nightingale Finvest Pvt Ltd Providing micro credit for investing in income generating activities
Mahasemam Trust To buy cattle worth `36000 to each client
Micro Enterprises and Sustainable Project
Providing training and micro credit for promotion of tailoring the cluster
Cashpor Micro Credit Distribution of sanitary napkin through Community Health Facilitator
Centre for Promoting Sustainable Livelihood (CPSL)
Support on existing activities like share cropping, purchase of livestock which they have been raising since long
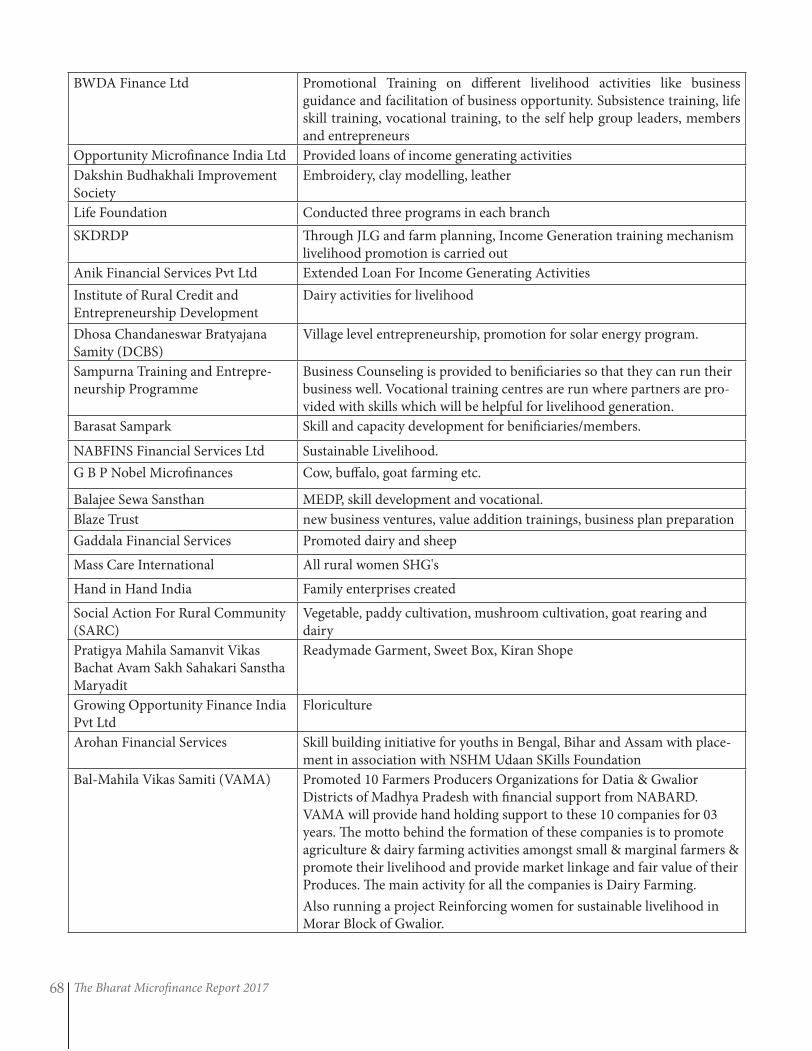
The Bharat Microfinance Report 201768
BWDA Finance Ltd Promotional Training on different livelihood activities like business guidance and facilitation of business opportunity. Subsistence training, life skill training, vocational training, to the self help group leaders, members and entrepreneurs
Opportunity Microfinance India Ltd Provided loans of income generating activities
Dakshin Budhakhali Improvement Society
Embroidery, clay modelling, leather
Life Foundation Conducted three programs in each branch
SKDRDP Through JLG and farm planning, Income Generation training mechanism livelihood promotion is carried out
Anik Financial Services Pvt Ltd Extended Loan For Income Generating Activities
Institute of Rural Credit and Entrepreneurship Development
Dairy activities for livelihood
Dhosa Chandaneswar Bratyajana Samity (DCBS)
Village level entrepreneurship, promotion for solar energy program.
Sampurna Training and Entrepre-neurship Programme
Business Counseling is provided to benificiaries so that they can run their business well. Vocational training centres are run where partners are pro-vided with skills which will be helpful for livelihood generation.
Barasat Sampark Skill and capacity development for benificiaries/members.
NABFINS Financial Services Ltd Sustainable Livelihood.
G B P Nobel Microfinances Cow, buffalo, goat farming etc.
Balajee Sewa Sansthan MEDP, skill development and vocational.
Blaze Trust new business ventures, value addition trainings, business plan preparation
Gaddala Financial Services Promoted dairy and sheep
Mass Care International All rural women SHG's
Hand in Hand India Family enterprises created
Social Action For Rural Community (SARC)
Vegetable, paddy cultivation, mushroom cultivation, goat rearing and dairy
Pratigya Mahila Samanvit Vikas Bachat Avam Sakh Sahakari Sanstha Maryadit
Readymade Garment, Sweet Box, Kiran Shope
Growing Opportunity Finance India Pvt Ltd
Floriculture
Arohan Financial Services Skill building initiative for youths in Bengal, Bihar and Assam with place-ment in association with NSHM Udaan SKills Foundation
Bal-Mahila Vikas Samiti (VAMA) Promoted 10 Farmers Producers Organizations for Datia & Gwalior Districts of Madhya Pradesh with financial support from NABARD. VAMA will provide hand holding support to these 10 companies for 03 years. The motto behind the formation of these companies is to promote agriculture & dairy farming activities amongst small & marginal farmers & promote their livelihood and provide market linkage and fair value of their Produces. The main activity for all the companies is Dairy Farming.
Also running a project Reinforcing women for sustainable livelihood in Morar Block of Gwalior.
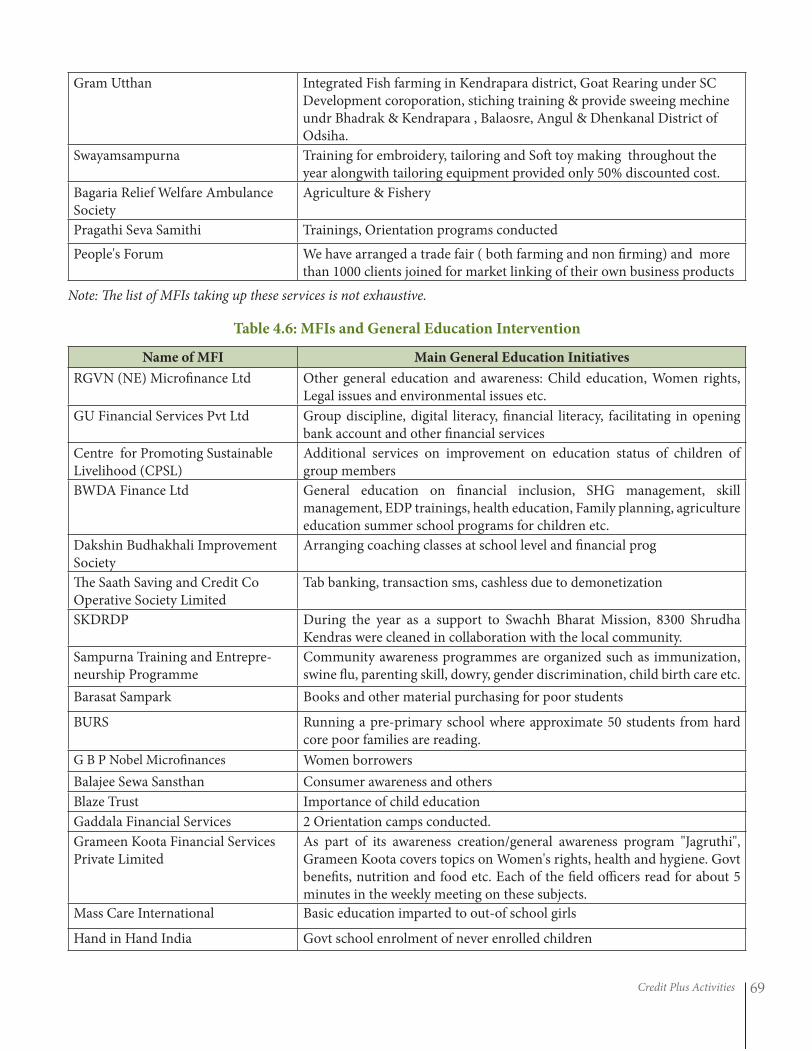
Credit Plus Activities 69
Gram Utthan Integrated Fish farming in Kendrapara district, Goat Rearing under SC Development coroporation, stiching training & provide sweeing mechine undr Bhadrak & Kendrapara , Balaosre, Angul & Dhenkanal District of Odsiha.
Swayamsampurna Training for embroidery, tailoring and Soft toy making throughout the year alongwith tailoring equipment provided only 50% discounted cost.
Bagaria Relief Welfare Ambulance Society
Agriculture & Fishery
Pragathi Seva Samithi Trainings, Orientation programs conducted
People's Forum We have arranged a trade fair ( both farming and non firming) and more than 1000 clients joined for market linking of their own business products
Note: The list of MFIs taking up these services is not exhaustive.
Table 4.6: MFIs and General Education Intervention
Name of MFI Main General Education Initiatives
RGVN (NE) Microfinance Ltd Other general education and awareness: Child education, Women rights, Legal issues and environmental issues etc.
GU Financial Services Pvt Ltd Group discipline, digital literacy, financial literacy, facilitating in opening bank account and other financial services
Centre for Promoting Sustainable Livelihood (CPSL)
Additional services on improvement on education status of children of group members
BWDA Finance Ltd General education on financial inclusion, SHG management, skill management, EDP trainings, health education, Family planning, agriculture education summer school programs for children etc.
Dakshin Budhakhali Improvement Society
Arranging coaching classes at school level and financial prog
The Saath Saving and Credit Co Operative Society Limited
Tab banking, transaction sms, cashless due to demonetization
SKDRDP During the year as a support to Swachh Bharat Mission, 8300 Shrudha Kendras were cleaned in collaboration with the local community.
Sampurna Training and Entrepre-neurship Programme
Community awareness programmes are organized such as immunization, swine flu, parenting skill, dowry, gender discrimination, child birth care etc.
Barasat Sampark Books and other material purchasing for poor students
BURS Running a pre-primary school where approximate 50 students from hard core poor families are reading.
G B P Nobel Microfinances Women borrowers
Balajee Sewa Sansthan Consumer awareness and others
Blaze Trust Importance of child education
Gaddala Financial Services 2 Orientation camps conducted.
Grameen Koota Financial Services Private Limited
As part of its awareness creation/general awareness program "Jagruthi", Grameen Koota covers topics on Women's rights, health and hygiene. Govt benefits, nutrition and food etc. Each of the field officers read for about 5 minutes in the weekly meeting on these subjects.
Mass Care International Basic education imparted to out-of school girls
Hand in Hand India Govt school enrolment of never enrolled children
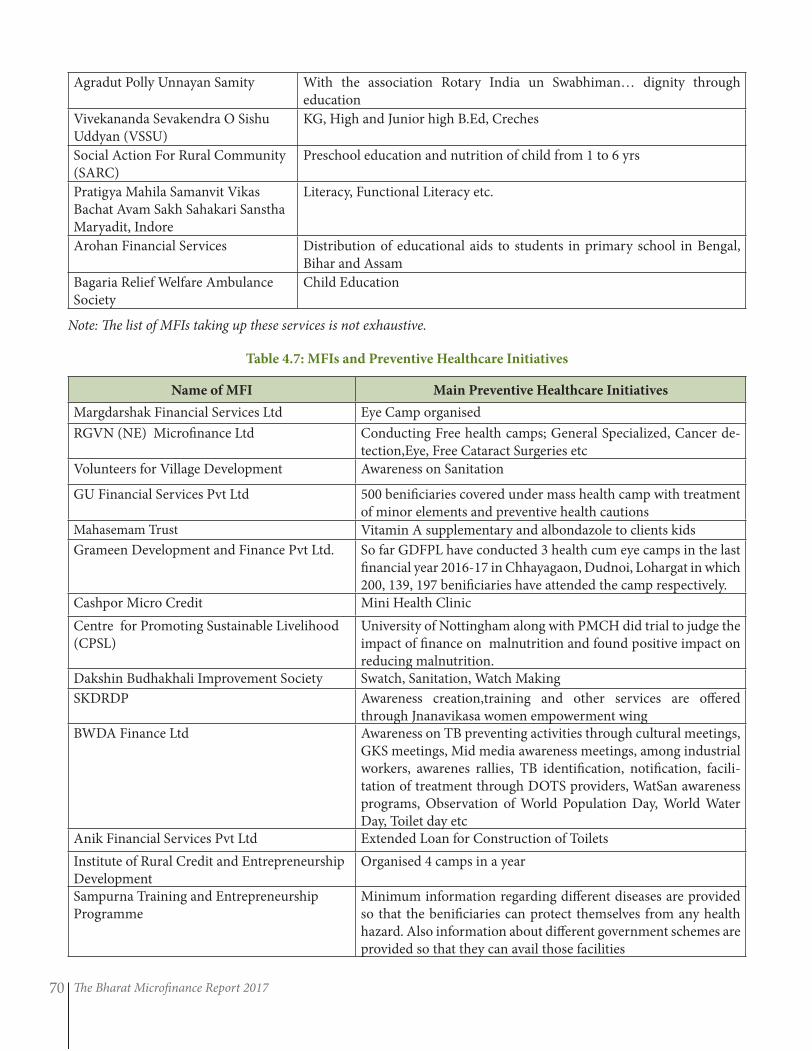
The Bharat Microfinance Report 201770
Agradut Polly Unnayan Samity With the association Rotary India un Swabhiman… dignity through education
Vivekananda Sevakendra O Sishu Uddyan (VSSU)
KG, High and Junior high B.Ed, Creches
Social Action For Rural Community (SARC)
Preschool education and nutrition of child from 1 to 6 yrs
Pratigya Mahila Samanvit Vikas Bachat Avam Sakh Sahakari Sanstha Maryadit, Indore
Literacy, Functional Literacy etc.
Arohan Financial Services Distribution of educational aids to students in primary school in Bengal, Bihar and Assam
Bagaria Relief Welfare Ambulance Society
Child Education
Note: The list of MFIs taking up these services is not exhaustive.
Table 4.7: MFIs and Preventive Healthcare Initiatives
Name of MFI Main Preventive Healthcare Initiatives
Margdarshak Financial Services Ltd Eye Camp organised
RGVN (NE) Microfinance Ltd Conducting Free health camps; General Specialized, Cancer de-tection,Eye, Free Cataract Surgeries etc
Volunteers for Village Development Awareness on Sanitation
GU Financial Services Pvt Ltd 500 benificiaries covered under mass health camp with treatment of minor elements and preventive health cautions
Mahasemam Trust Vitamin A supplementary and albondazole to clients kids
Grameen Development and Finance Pvt Ltd. So far GDFPL have conducted 3 health cum eye camps in the last financial year 2016-17 in Chhayagaon, Dudnoi, Lohargat in which 200, 139, 197 benificiaries have attended the camp respectively.
Cashpor Micro Credit Mini Health Clinic
Centre for Promoting Sustainable Livelihood (CPSL)
University of Nottingham along with PMCH did trial to judge the impact of finance on malnutrition and found positive impact on reducing malnutrition.
Dakshin Budhakhali Improvement Society Swatch, Sanitation, Watch Making
SKDRDP Awareness creation,training and other services are offered through Jnanavikasa women empowerment wing
BWDA Finance Ltd Awareness on TB preventing activities through cultural meetings, GKS meetings, Mid media awareness meetings, among industrial workers, awarenes rallies, TB identification, notification, facili-tation of treatment through DOTS providers, WatSan awareness programs, Observation of World Population Day, World Water Day, Toilet day etc
Anik Financial Services Pvt Ltd Extended Loan for Construction of Toilets
Institute of Rural Credit and Entrepreneurship Development
Organised 4 camps in a year
Sampurna Training and Entrepreneurship Programme
Minimum information regarding different diseases are provided so that the benificiaries can protect themselves from any health hazard. Also information about different government schemes are provided so that they can avail those facilities
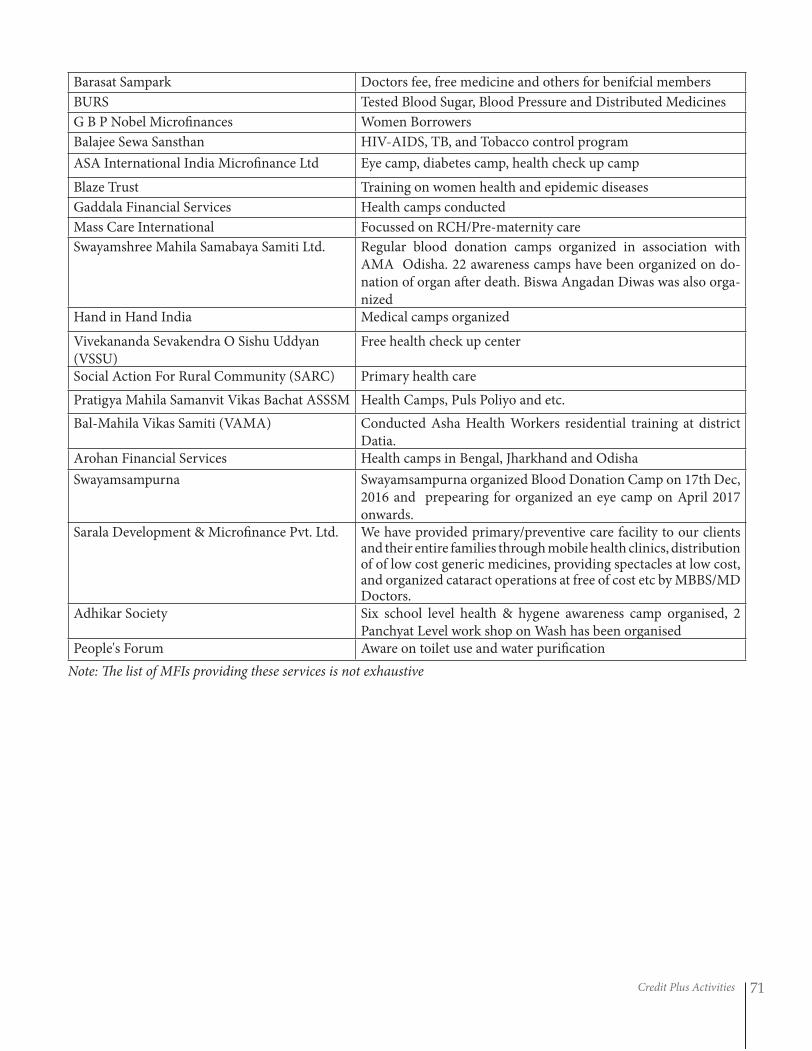
Credit Plus Activities 71
Barasat Sampark Doctors fee, free medicine and others for benifcial members
BURS Tested Blood Sugar, Blood Pressure and Distributed Medicines
G B P Nobel Microfinances Women Borrowers
Balajee Sewa Sansthan HIV-AIDS, TB, and Tobacco control program
ASA International India Microfinance Ltd Eye camp, diabetes camp, health check up camp
Blaze Trust Training on women health and epidemic diseases
Gaddala Financial Services Health camps conducted
Mass Care International Focussed on RCH/Pre-maternity care
Swayamshree Mahila Samabaya Samiti Ltd. Regular blood donation camps organized in association with AMA Odisha. 22 awareness camps have been organized on do-nation of organ after death. Biswa Angadan Diwas was also orga-nized
Hand in Hand India Medical camps organized
Vivekananda Sevakendra O Sishu Uddyan (VSSU)
Free health check up center
Social Action For Rural Community (SARC) Primary health care
Pratigya Mahila Samanvit Vikas Bachat ASSSM Health Camps, Puls Poliyo and etc.
Bal-Mahila Vikas Samiti (VAMA) Conducted Asha Health Workers residential training at district Datia.
Arohan Financial Services Health camps in Bengal, Jharkhand and Odisha
Swayamsampurna Swayamsampurna organized Blood Donation Camp on 17th Dec, 2016 and prepearing for organized an eye camp on April 2017 onwards.
Sarala Development & Microfinance Pvt. Ltd. We have provided primary/preventive care facility to our clients and their entire families through mobile health clinics, distribution of of low cost generic medicines, providing spectacles at low cost, and organized cataract operations at free of cost etc by MBBS/MD Doctors.
Adhikar Society Six school level health & hygene awareness camp organised, 2 Panchyat Level work shop on Wash has been organised
People's Forum Aware on toilet use and water purification
Note: The list of MFIs providing these services is not exhaustive
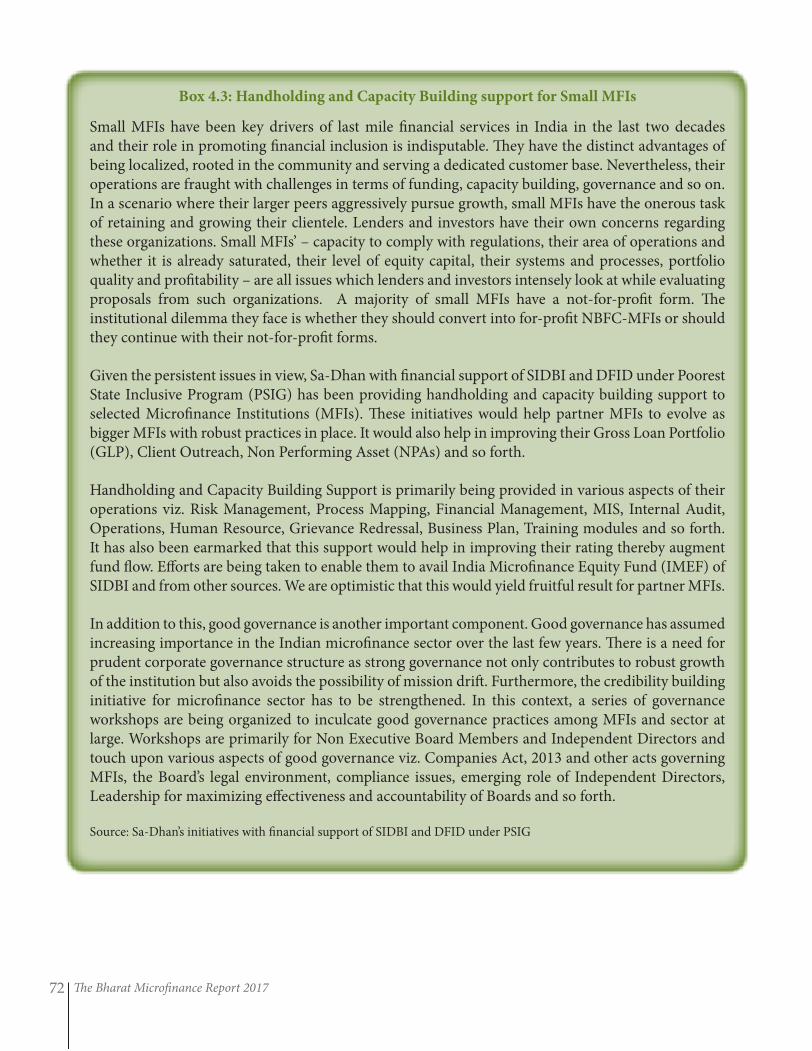
The Bharat Microfinance Report 201772
Box 4.3: Handholding and Capacity Building support for Small MFIs
Small MFIs have been key drivers of last mile financial services in India in the last two decades and their role in promoting financial inclusion is indisputable. They have the distinct advantages of being localized, rooted in the community and serving a dedicated customer base. Nevertheless, their operations are fraught with challenges in terms of funding, capacity building, governance and so on. In a scenario where their larger peers aggressively pursue growth, small MFIs have the onerous task of retaining and growing their clientele. Lenders and investors have their own concerns regarding these organizations. Small MFIs’ – capacity to comply with regulations, their area of operations and whether it is already saturated, their level of equity capital, their systems and processes, portfolio quality and profitability – are all issues which lenders and investors intensely look at while evaluating proposals from such organizations. A majority of small MFIs have a not-for-profit form. The institutional dilemma they face is whether they should convert into for-profit NBFC-MFIs or should they continue with their not-for-profit forms.
Given the persistent issues in view, Sa-Dhan with financial support of SIDBI and DFID under Poorest State Inclusive Program (PSIG) has been providing handholding and capacity building support to selected Microfinance Institutions (MFIs). These initiatives would help partner MFIs to evolve as bigger MFIs with robust practices in place. It would also help in improving their Gross Loan Portfolio (GLP), Client Outreach, Non Performing Asset (NPAs) and so forth.
Handholding and Capacity Building Support is primarily being provided in various aspects of their operations viz. Risk Management, Process Mapping, Financial Management, MIS, Internal Audit, Operations, Human Resource, Grievance Redressal, Business Plan, Training modules and so forth. It has also been earmarked that this support would help in improving their rating thereby augment fund flow. Efforts are being taken to enable them to avail India Microfinance Equity Fund (IMEF) of SIDBI and from other sources. We are optimistic that this would yield fruitful result for partner MFIs.
In addition to this, good governance is another important component. Good governance has assumed increasing importance in the Indian microfinance sector over the last few years. There is a need for prudent corporate governance structure as strong governance not only contributes to robust growth of the institution but also avoids the possibility of mission drift. Furthermore, the credibility building initiative for microfinance sector has to be strengthened. In this context, a series of governance workshops are being organized to inculcate good governance practices among MFIs and sector at large. Workshops are primarily for Non Executive Board Members and Independent Directors and touch upon various aspects of good governance viz. Companies Act, 2013 and other acts governing MFIs, the Board’s legal environment, compliance issues, emerging role of Independent Directors, Leadership for maximizing effectiveness and accountability of Boards and so forth.
Source: Sa-Dhan’s initiatives with financial support of SIDBI and DFID under PSIG
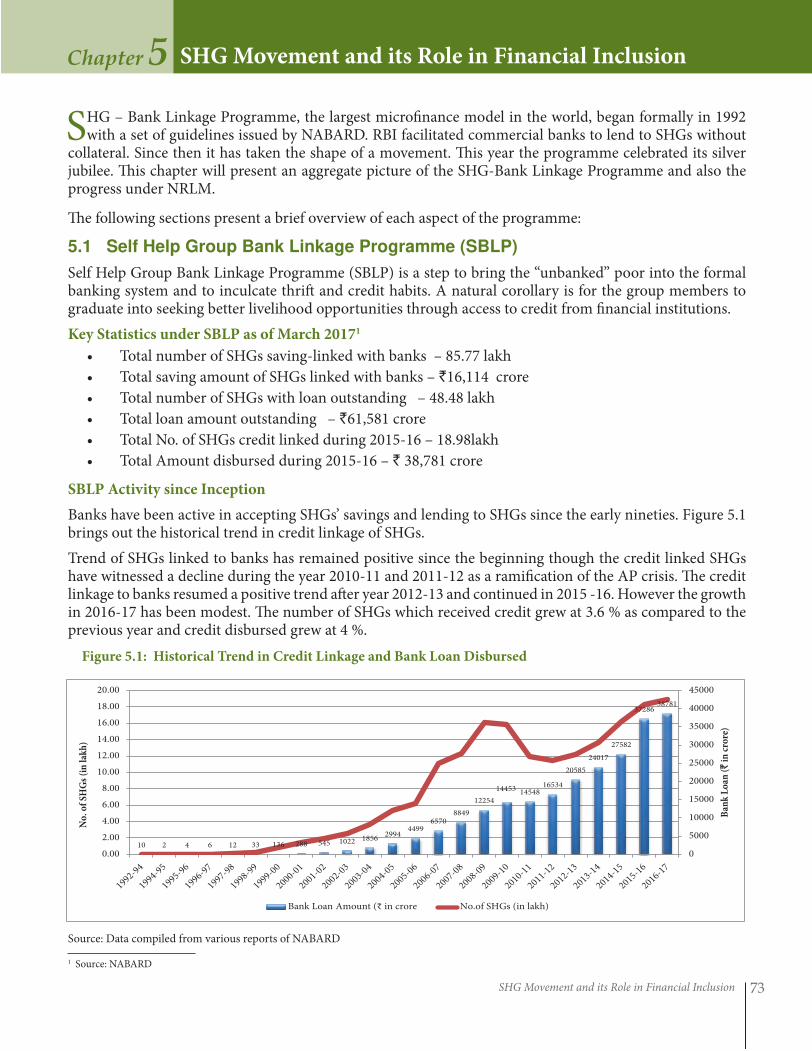
SHG Movement and its Role in Financial Inclusion 73
SHG Movement and its Role in Financial InclusionChapter 5
1 Source: NABARD
SHG – Bank Linkage Programme, the largest microfinance model in the world, began formally in 1992 with a set of guidelines issued by NABARD. RBI facilitated commercial banks to lend to SHGs without
collateral. Since then it has taken the shape of a movement. This year the programme celebrated its silver jubilee. This chapter will present an aggregate picture of the SHG-Bank Linkage Programme and also the progress under NRLM.
The following sections present a brief overview of each aspect of the programme:
5.1 Self Help Group Bank Linkage Programme (SBLP)
Self Help Group Bank Linkage Programme (SBLP) is a step to bring the “unbanked” poor into the formal banking system and to inculcate thrift and credit habits. A natural corollary is for the group members to graduate into seeking better livelihood opportunities through access to credit from financial institutions.
Key Statistics under SBLP as of March 20171
• Total number of SHGs saving-linked with banks – 85.77 lakh
• Total saving amount of SHGs linked with banks – `16,114 crore
• Total number of SHGs with loan outstanding – 48.48 lakh
• Total loan amount outstanding – `61,581 crore
• Total No. of SHGs credit linked during 2015-16 – 18.98lakh
• Total Amount disbursed during 2015-16 – ` 38,781 crore
SBLP Activity since Inception
Banks have been active in accepting SHGs’ savings and lending to SHGs since the early nineties. Figure 5.1 brings out the historical trend in credit linkage of SHGs.
Trend of SHGs linked to banks has remained positive since the beginning though the credit linked SHGs have witnessed a decline during the year 2010-11 and 2011-12 as a ramification of the AP crisis. The credit linkage to banks resumed a positive trend after year 2012-13 and continued in 2015 -16. However the growth in 2016-17 has been modest. The number of SHGs which received credit grew at 3.6 % as compared to the previous year and credit disbursed grew at 4 %.
Figure 5.1: Historical Trend in Credit Linkage and Bank Loan Disbursed
Source: Data compiled from various reports of NABARD
10 2 4 6 12 33 136 288 545 1022 1856 2994
4499 6570
8849
12254
14453 14548 16534
20585
24017
27582
37286 38781
0
5000
10000
15000
20000
25000
30000
35000
40000
45000
0.00
2.00
4.00
6.00
8.00
10.00
12.00
14.00
16.00
18.00
20.00
Ban
k L
oan
(`
in c
rore
)
No
. of
SHG
s (i
n la
kh)
Bank Loan Amount (₹ in crore No.of SHGs (in lakh)
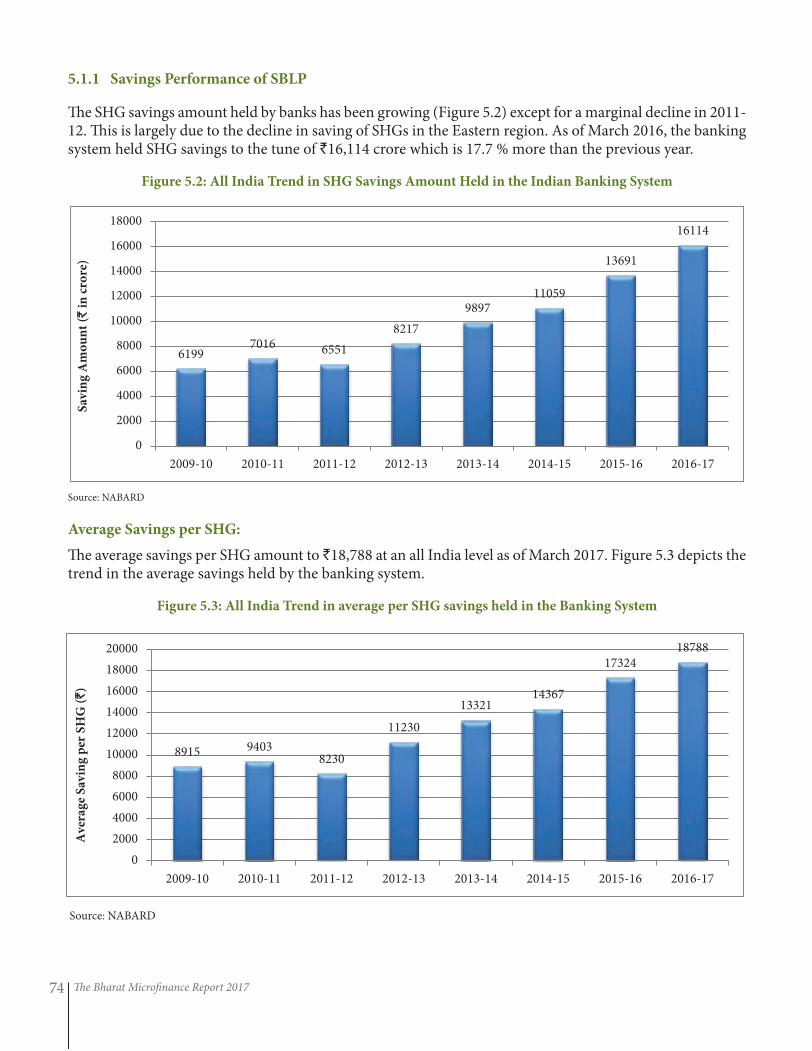
The Bharat Microfinance Report 201774
5.1.1 Savings Performance of SBLP
The SHG savings amount held by banks has been growing (Figure 5.2) except for a marginal decline in 2011-12. This is largely due to the decline in saving of SHGs in the Eastern region. As of March 2016, the banking system held SHG savings to the tune of `16,114 crore which is 17.7 % more than the previous year.
Figure 5.2: All India Trend in SHG Savings Amount Held in the Indian Banking System
Source: NABARD
Average Savings per SHG:
The average savings per SHG amount to `18,788 at an all India level as of March 2017. Figure 5.3 depicts the trend in the average savings held by the banking system.
Figure 5.3: All India Trend in average per SHG savings held in the Banking System
Source: NABARD
6199 7016 6551
8217
9897 11059
13691
16114
0
2000
4000
6000
8000
10000
12000
14000
16000
18000
2009-10 2010-11 2011-12 2012-13 2013-14 2014-15 2015-16 2016-17
Sav
ing
Am
ou
nt
(` i
n c
rore
)
8915 9403 8230
11230
13321 14367
17324 18788
0
2000
4000
6000
8000
10000
12000
14000
16000
18000
20000
2009-10 2010-11 2011-12 2012-13 2013-14 2014-15 2015-16 2016-17
Ave
rag
e S
avin
g p
er S
HG
(`
)
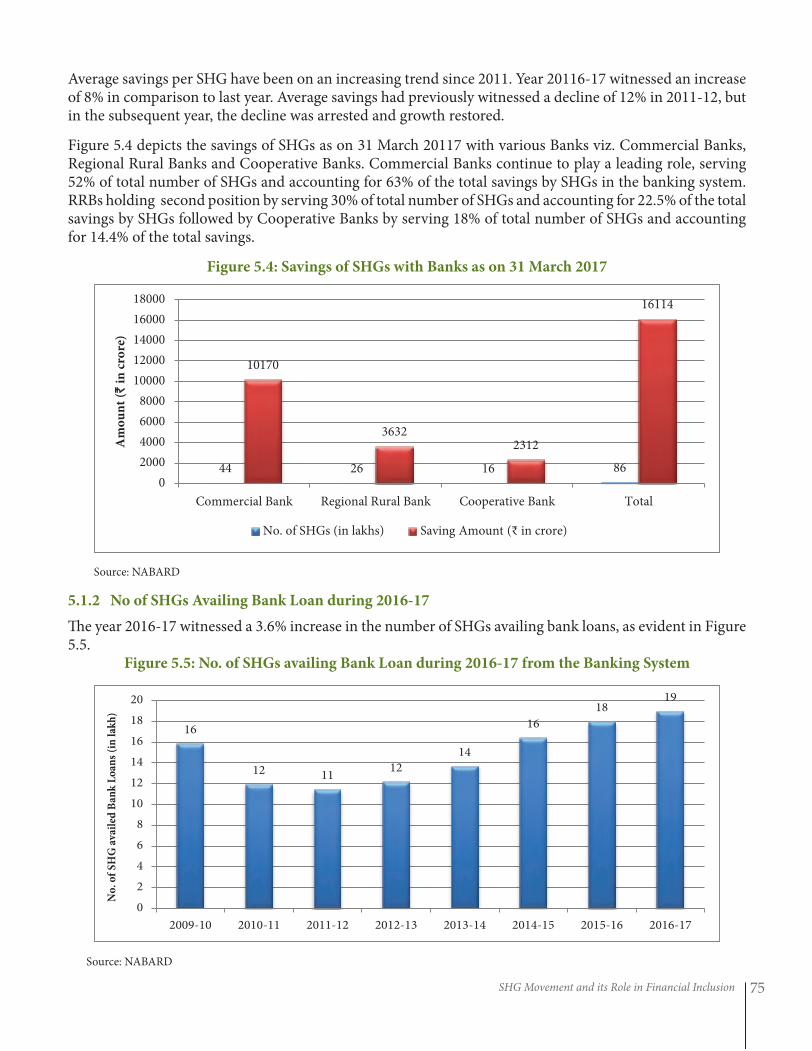
SHG Movement and its Role in Financial Inclusion 75
Average savings per SHG have been on an increasing trend since 2011. Year 20116-17 witnessed an increase of 8% in comparison to last year. Average savings had previously witnessed a decline of 12% in 2011-12, but in the subsequent year, the decline was arrested and growth restored.
Figure 5.4 depicts the savings of SHGs as on 31 March 20117 with various Banks viz. Commercial Banks, Regional Rural Banks and Cooperative Banks. Commercial Banks continue to play a leading role, serving 52% of total number of SHGs and accounting for 63% of the total savings by SHGs in the banking system. RRBs holding second position by serving 30% of total number of SHGs and accounting for 22.5% of the total savings by SHGs followed by Cooperative Banks by serving 18% of total number of SHGs and accounting for 14.4% of the total savings.
Figure 5.4: Savings of SHGs with Banks as on 31 March 2017
Source: NABARD
5.1.2 No of SHGs Availing Bank Loan during 2016-17
The year 2016-17 witnessed a 3.6% increase in the number of SHGs availing bank loans, as evident in Figure 5.5.
Figure 5.5: No. of SHGs availing Bank Loan during 2016-17 from the Banking System
Source: NABARD
16
12 11 12
14
16
18 19
0
2
4
6
8
10
12
14
16
18
20
2009-10 2010-11 2011-12 2012-13 2013-14 2014-15 2015-16 2016-17
No
. of
SH
G a
vail
ed B
ank
Lo
ans
(in
lak
h)
44 26 16 86
10170
3632 2312
16114
0
2000
4000
6000
8000
10000
12000
14000
16000
18000
Commercial Bank Regional Rural Bank Cooperative Bank Total
Am
ou
nt
(` i
n c
rore
)
No. of SHGs (in lakhs) Saving Amount (₹ in crore)
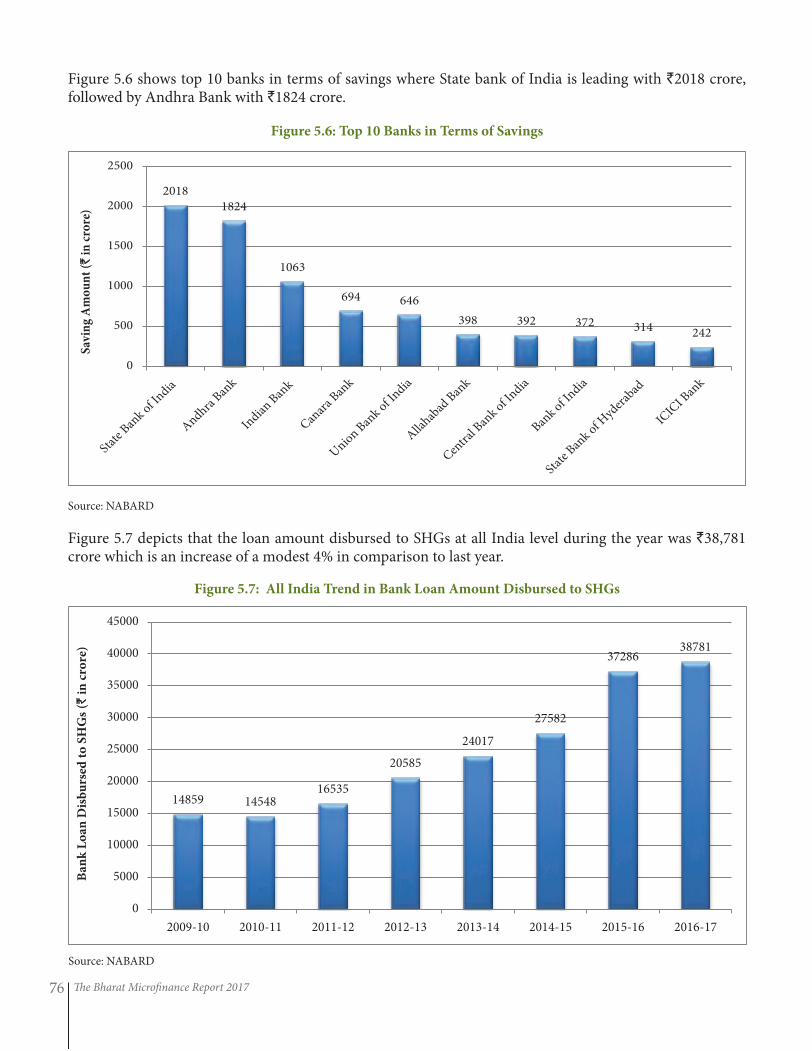
The Bharat Microfinance Report 201776
Figure 5.6 shows top 10 banks in terms of savings where State bank of India is leading with `2018 crore, followed by Andhra Bank with `1824 crore.
Figure 5.6: Top 10 Banks in Terms of Savings
Source: NABARD
Figure 5.7 depicts that the loan amount disbursed to SHGs at all India level during the year was `38,781 crore which is an increase of a modest 4% in comparison to last year.
Figure 5.7: All India Trend in Bank Loan Amount Disbursed to SHGs
Source: NABARD
14859 14548 16535
20585
24017
27582
37286 38781
0
5000
10000
15000
20000
25000
30000
35000
40000
45000
2009-10 2010-11 2011-12 2012-13 2013-14 2014-15 2015-16 2016-17
Ban
k L
oan
Dis
bu
rsed
to
SH
Gs
(` i
n c
rore
)
2018
1824
1063
694 646
398 392 372 314 242
0
500
1000
1500
2000
2500
Sav
ing
Am
ou
nt
(` in
cro
re)
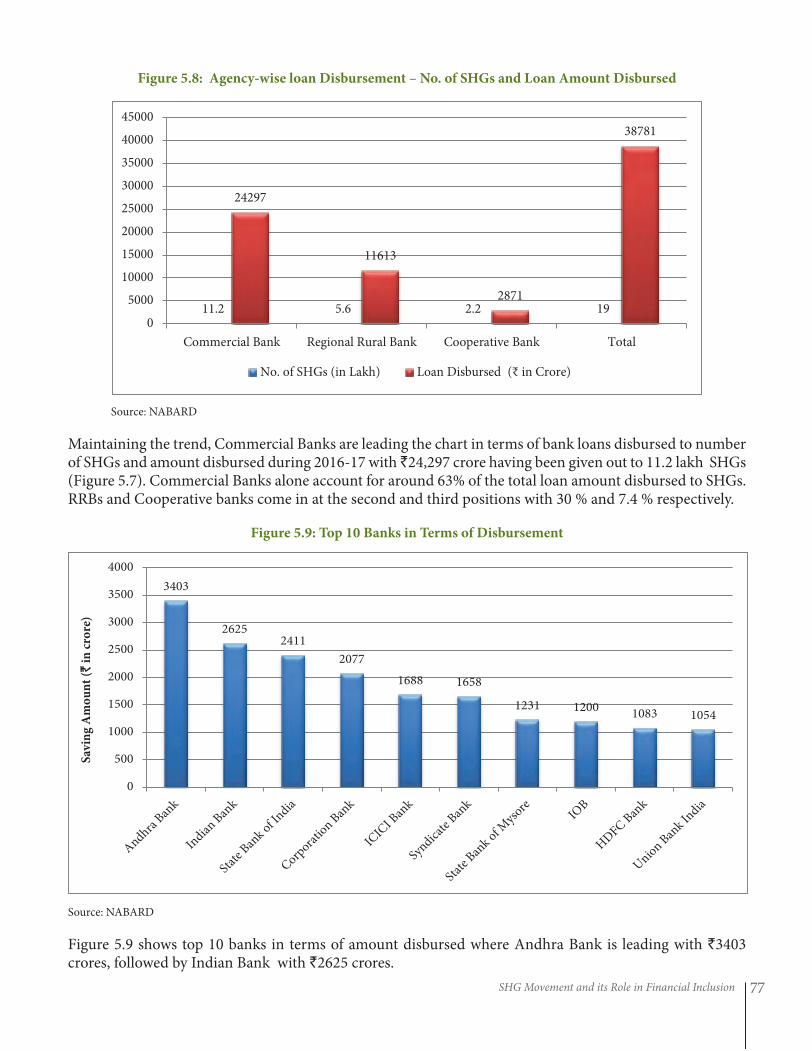
SHG Movement and its Role in Financial Inclusion 77
Figure 5.8: Agency-wise loan Disbursement – No. of SHGs and Loan Amount Disbursed
Source: NABARD
Maintaining the trend, Commercial Banks are leading the chart in terms of bank loans disbursed to number of SHGs and amount disbursed during 2016-17 with ̀ 24,297 crore having been given out to 11.2 lakh SHGs (Figure 5.7). Commercial Banks alone account for around 63% of the total loan amount disbursed to SHGs. RRBs and Cooperative banks come in at the second and third positions with 30 % and 7.4 % respectively.
Figure 5.9: Top 10 Banks in Terms of Disbursement
Source: NABARD
Figure 5.9 shows top 10 banks in terms of amount disbursed where Andhra Bank is leading with `3403 crores, followed by Indian Bank with `2625 crores.
3403
2625 2411
2077
1688 1658
1231 1200 1083 1054
0
500
1000
1500
2000
2500
3000
3500
4000
Sav
ing
Am
ou
nt
(` in
cro
re)
11.2 5.6 2.2 19
24297
11613
2871
38781
0
5000
10000
15000
20000
25000
30000
35000
40000
45000
Commercial Bank Regional Rural Bank Cooperative Bank Total
No. of SHGs (in Lakh) Loan Disbursed (₹ in Crore)
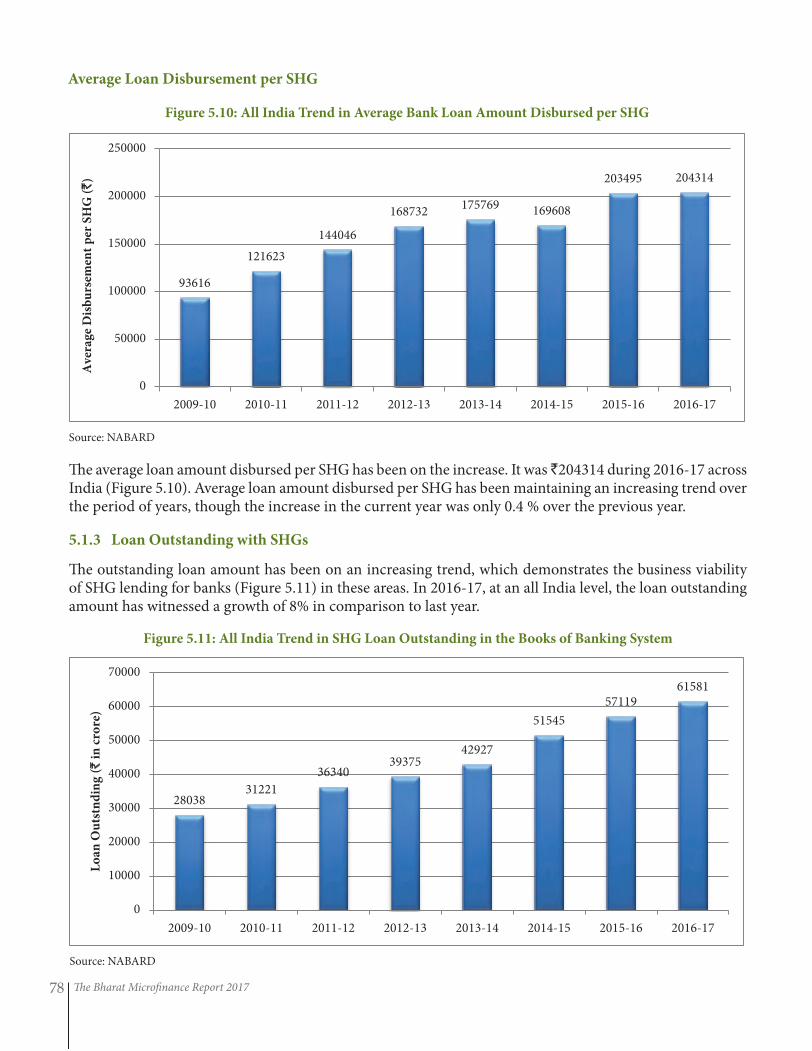
The Bharat Microfinance Report 201778
Average Loan Disbursement per SHG
Figure 5.10: All India Trend in Average Bank Loan Amount Disbursed per SHG
Source: NABARD
The average loan amount disbursed per SHG has been on the increase. It was ̀ 204314 during 2016-17 across India (Figure 5.10). Average loan amount disbursed per SHG has been maintaining an increasing trend over the period of years, though the increase in the current year was only 0.4 % over the previous year.
5.1.3 Loan Outstanding with SHGs
The outstanding loan amount has been on an increasing trend, which demonstrates the business viability of SHG lending for banks (Figure 5.11) in these areas. In 2016-17, at an all India level, the loan outstanding amount has witnessed a growth of 8% in comparison to last year.
Figure 5.11: All India Trend in SHG Loan Outstanding in the Books of Banking System
Source: NABARD
93616
121623
144046
168732 175769 169608
203495 204314
0
50000
100000
150000
200000
250000
2009-10 2010-11 2011-12 2012-13 2013-14 2014-15 2015-16 2016-17
Ave
rag
e D
isb
urs
emen
t p
er S
HG
(`
)
28038 31221
36340 39375
42927
51545
57119 61581
0
10000
20000
30000
40000
50000
60000
70000
2009-10 2010-11 2011-12 2012-13 2013-14 2014-15 2015-16 2016-17
Lo
an O
uts
tnd
ing
(`
in
cro
re)
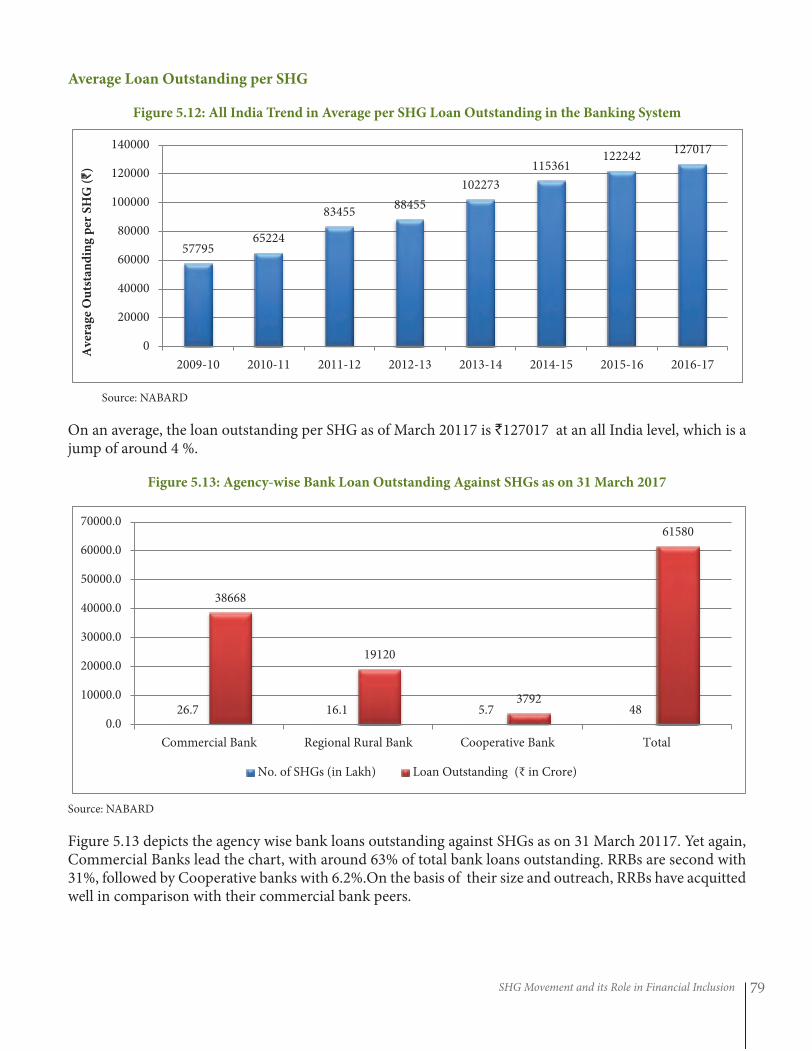
SHG Movement and its Role in Financial Inclusion 79
Average Loan Outstanding per SHG
Figure 5.12: All India Trend in Average per SHG Loan Outstanding in the Banking System
Source: NABARD
On an average, the loan outstanding per SHG as of March 20117 is `127017 at an all India level, which is a jump of around 4 %.
Figure 5.13: Agency-wise Bank Loan Outstanding Against SHGs as on 31 March 2017
Source: NABARD
Figure 5.13 depicts the agency wise bank loans outstanding against SHGs as on 31 March 20117. Yet again, Commercial Banks lead the chart, with around 63% of total bank loans outstanding. RRBs are second with 31%, followed by Cooperative banks with 6.2%.On the basis of their size and outreach, RRBs have acquitted well in comparison with their commercial bank peers.
57795 65224
83455 88455
102273
115361 122242
127017
0
20000
40000
60000
80000
100000
120000
140000
2009-10 2010-11 2011-12 2012-13 2013-14 2014-15 2015-16 2016-17
Ave
rag
e O
uts
tan
din
g p
er S
HG
(`
)
26.7 16.1 5.7 48
38668
19120
3792
61580
0.0
10000.0
20000.0
30000.0
40000.0
50000.0
60000.0
70000.0
Commercial Bank Regional Rural Bank Cooperative Bank Total
No. of SHGs (in Lakh) Loan Outstanding (₹ in Crore)
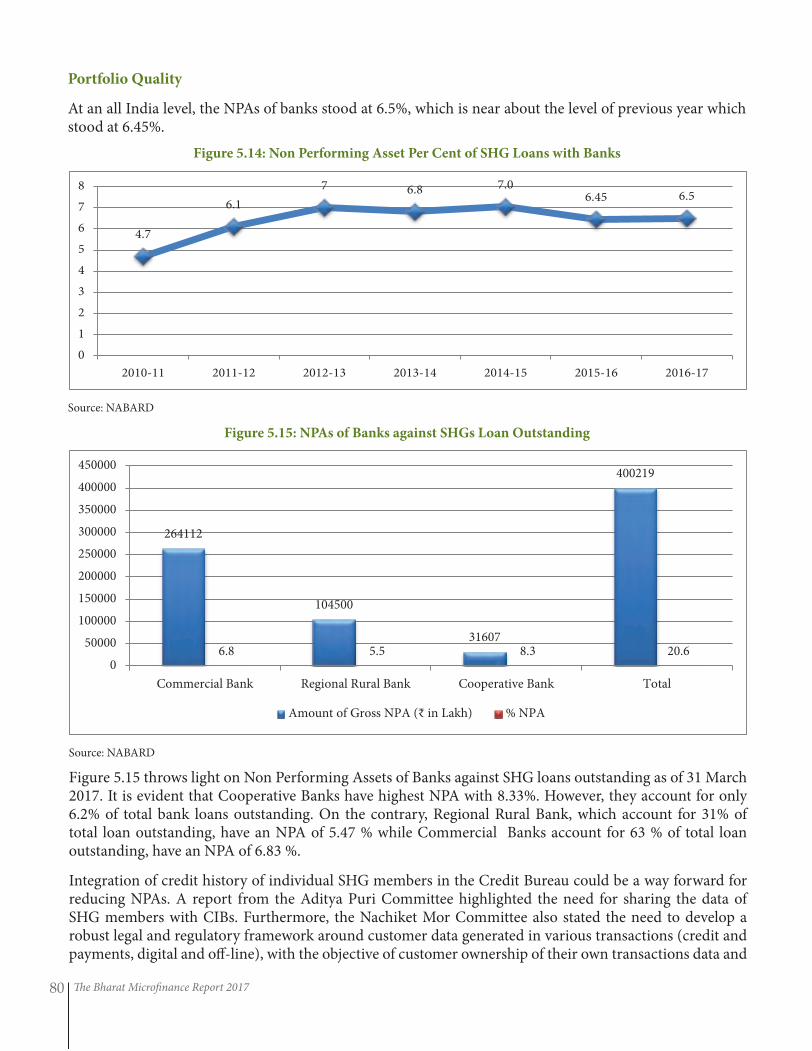
The Bharat Microfinance Report 201780
Portfolio Quality
At an all India level, the NPAs of banks stood at 6.5%, which is near about the level of previous year which stood at 6.45%.
Figure 5.14: Non Performing Asset Per Cent of SHG Loans with Banks
Source: NABARD
Figure 5.15: NPAs of Banks against SHGs Loan Outstanding
Source: NABARD
Figure 5.15 throws light on Non Performing Assets of Banks against SHG loans outstanding as of 31 March 2017. It is evident that Cooperative Banks have highest NPA with 8.33%. However, they account for only 6.2% of total bank loans outstanding. On the contrary, Regional Rural Bank, which account for 31% of total loan outstanding, have an NPA of 5.47 % while Commercial Banks account for 63 % of total loan outstanding, have an NPA of 6.83 %.
Integration of credit history of individual SHG members in the Credit Bureau could be a way forward for reducing NPAs. A report from the Aditya Puri Committee highlighted the need for sharing the data of SHG members with CIBs. Furthermore, the Nachiket Mor Committee also stated the need to develop a robust legal and regulatory framework around customer data generated in various transactions (credit and payments, digital and off-line), with the objective of customer ownership of their own transactions data and
4.7
6.1
7 6.8 7.0 6.45 6.5
0
1
2
3
4
5
6
7
8
2010-11 2011-12 2012-13 2013-14 2014-15 2015-16 2016-17
264112
104500
31607
400219
6.8 5.5 8.3 20.6 0
50000
100000
150000
200000
250000
300000
350000
400000
450000
Commercial Bank Regional Rural Bank Cooperative Bank Total
Amount of Gross NPA (₹ in Lakh) % NPA
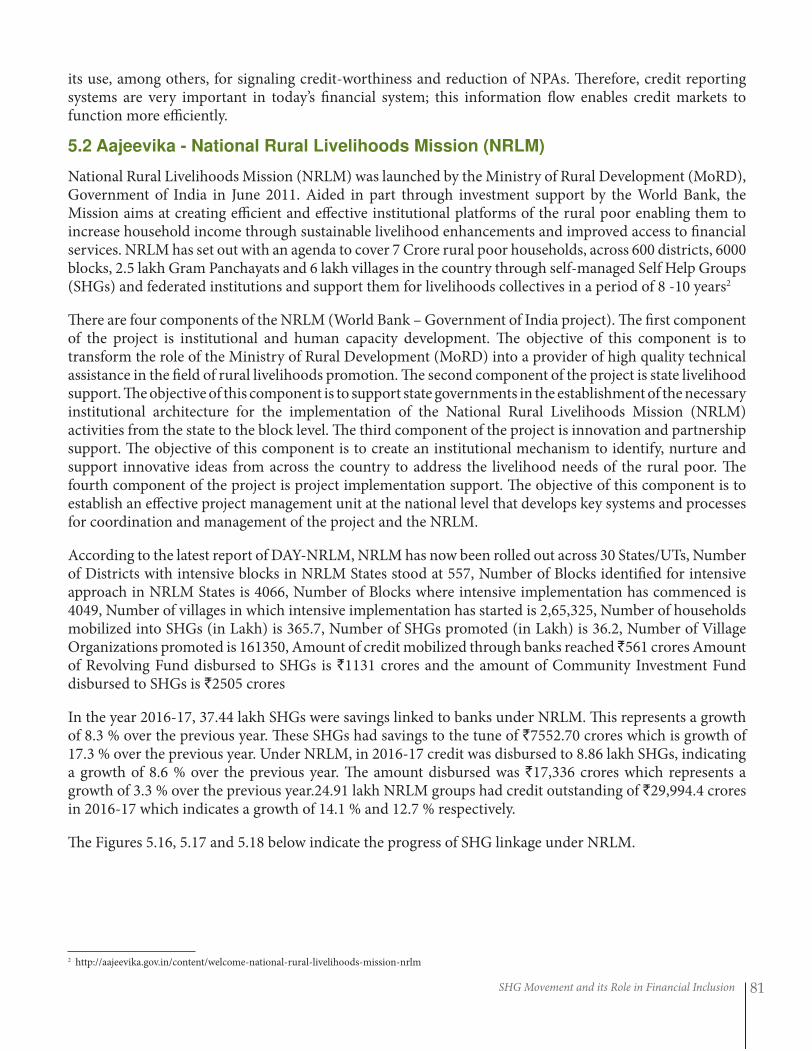
SHG Movement and its Role in Financial Inclusion 81
its use, among others, for signaling credit-worthiness and reduction of NPAs. Therefore, credit reporting systems are very important in today’s financial system; this information flow enables credit markets to function more efficiently.
5.2 Aajeevika - National Rural Livelihoods Mission (NRLM)
National Rural Livelihoods Mission (NRLM) was launched by the Ministry of Rural Development (MoRD), Government of India in June 2011. Aided in part through investment support by the World Bank, the Mission aims at creating efficient and effective institutional platforms of the rural poor enabling them to increase household income through sustainable livelihood enhancements and improved access to financial services. NRLM has set out with an agenda to cover 7 Crore rural poor households, across 600 districts, 6000 blocks, 2.5 lakh Gram Panchayats and 6 lakh villages in the country through self-managed Self Help Groups (SHGs) and federated institutions and support them for livelihoods collectives in a period of 8 -10 years2
There are four components of the NRLM (World Bank – Government of India project). The first component of the project is institutional and human capacity development. The objective of this component is to transform the role of the Ministry of Rural Development (MoRD) into a provider of high quality technical assistance in the field of rural livelihoods promotion. The second component of the project is state livelihood support. The objective of this component is to support state governments in the establishment of the necessary institutional architecture for the implementation of the National Rural Livelihoods Mission (NRLM) activities from the state to the block level. The third component of the project is innovation and partnership support. The objective of this component is to create an institutional mechanism to identify, nurture and support innovative ideas from across the country to address the livelihood needs of the rural poor. The fourth component of the project is project implementation support. The objective of this component is to establish an effective project management unit at the national level that develops key systems and processes for coordination and management of the project and the NRLM.
According to the latest report of DAY-NRLM, NRLM has now been rolled out across 30 States/UTs, Number of Districts with intensive blocks in NRLM States stood at 557, Number of Blocks identified for intensive approach in NRLM States is 4066, Number of Blocks where intensive implementation has commenced is 4049, Number of villages in which intensive implementation has started is 2,65,325, Number of households mobilized into SHGs (in Lakh) is 365.7, Number of SHGs promoted (in Lakh) is 36.2, Number of Village Organizations promoted is 161350, Amount of credit mobilized through banks reached ̀ 561 crores Amount of Revolving Fund disbursed to SHGs is `1131 crores and the amount of Community Investment Fund disbursed to SHGs is `2505 crores
In the year 2016-17, 37.44 lakh SHGs were savings linked to banks under NRLM. This represents a growth of 8.3 % over the previous year. These SHGs had savings to the tune of `7552.70 crores which is growth of 17.3 % over the previous year. Under NRLM, in 2016-17 credit was disbursed to 8.86 lakh SHGs, indicating a growth of 8.6 % over the previous year. The amount disbursed was `17,336 crores which represents a growth of 3.3 % over the previous year.24.91 lakh NRLM groups had credit outstanding of `29,994.4 crores in 2016-17 which indicates a growth of 14.1 % and 12.7 % respectively.
The Figures 5.16, 5.17 and 5.18 below indicate the progress of SHG linkage under NRLM.
2 http://aajeevika.gov.in/content/welcome-national-rural-livelihoods-mission-nrlm
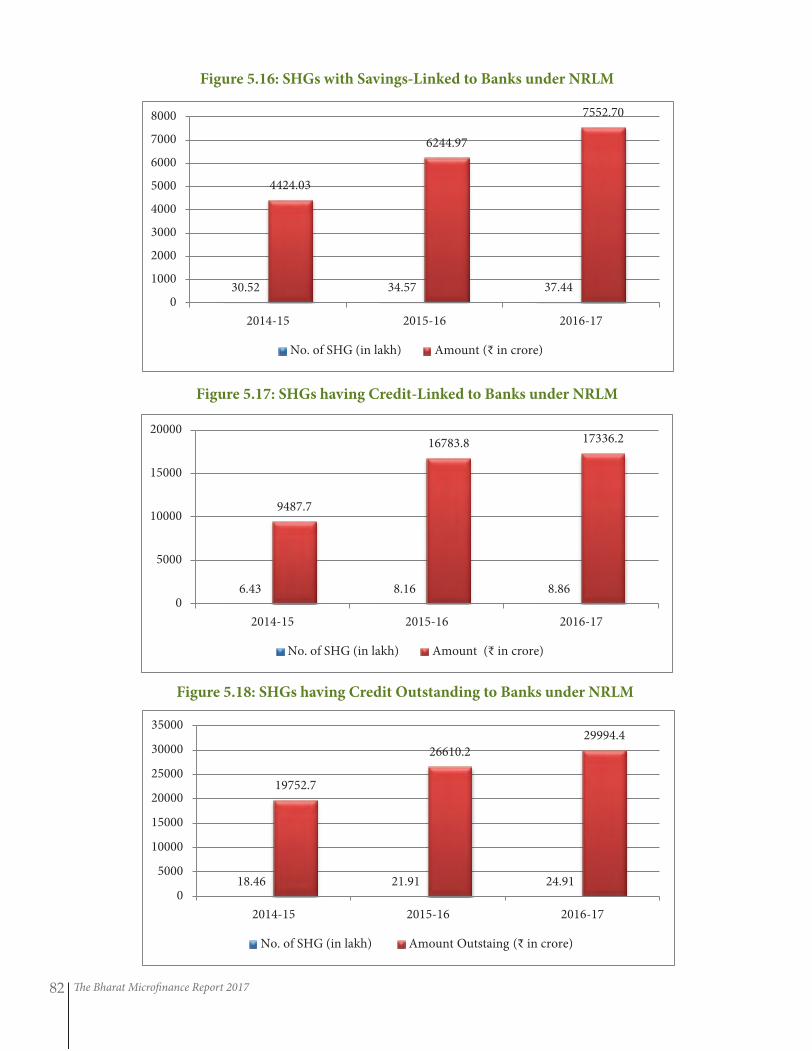
The Bharat Microfinance Report 201782
Figure 5.16: SHGs with Savings-Linked to Banks under NRLM
Figure 5.17: SHGs having Credit-Linked to Banks under NRLM
Figure 5.18: SHGs having Credit Outstanding to Banks under NRLM
30.52 34.57 37.44
4424.03
6244.97
7552.70
0
1000
2000
3000
4000
5000
6000
7000
8000
2014-15 2015-16 2016-17
No. of SHG (in lakh) Amount (₹ in crore)
6.43 8.16 8.86
9487.7
16783.8 17336.2
0
5000
10000
15000
20000
2014-15 2015-16 2016-17
No. of SHG (in lakh) Amount (₹ in crore)
18.46 21.91 24.91
19752.7
26610.2
29994.4
0
5000
10000
15000
20000
25000
30000
35000
2014-15 2015-16 2016-17
No. of SHG (in lakh) Amount Outstaing (₹ in crore)
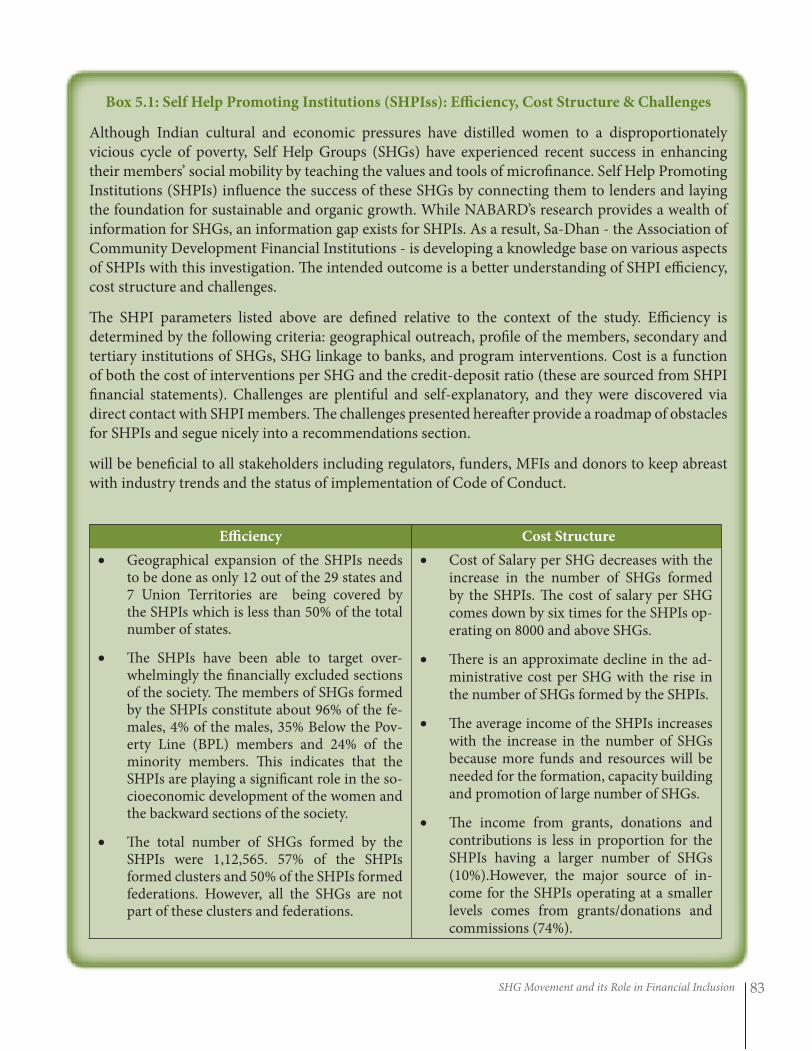
SHG Movement and its Role in Financial Inclusion 83
Box 5.1: Self Help Promoting Institutions (SHPIss): Efficiency, Cost Structure & Challenges
Although Indian cultural and economic pressures have distilled women to a disproportionately vicious cycle of poverty, Self Help Groups (SHGs) have experienced recent success in enhancing their members’ social mobility by teaching the values and tools of microfinance. Self Help Promoting Institutions (SHPIs) influence the success of these SHGs by connecting them to lenders and laying the foundation for sustainable and organic growth. While NABARD’s research provides a wealth of information for SHGs, an information gap exists for SHPIs. As a result, Sa-Dhan - the Association of Community Development Financial Institutions - is developing a knowledge base on various aspects of SHPIs with this investigation. The intended outcome is a better understanding of SHPI efficiency, cost structure and challenges.
The SHPI parameters listed above are defined relative to the context of the study. Efficiency is determined by the following criteria: geographical outreach, profile of the members, secondary and tertiary institutions of SHGs, SHG linkage to banks, and program interventions. Cost is a function of both the cost of interventions per SHG and the credit-deposit ratio (these are sourced from SHPI financial statements). Challenges are plentiful and self-explanatory, and they were discovered via direct contact with SHPI members. The challenges presented hereafter provide a roadmap of obstacles for SHPIs and segue nicely into a recommendations section.
will be beneficial to all stakeholders including regulators, funders, MFIs and donors to keep abreast with industry trends and the status of implementation of Code of Conduct.
Efficiency Cost Structure
• Geographical expansion of the SHPIs needs to be done as only 12 out of the 29 states and 7 Union Territories are being covered by the SHPIs which is less than 50% of the total number of states.
• The SHPIs have been able to target over-whelmingly the financially excluded sections of the society. The members of SHGs formed by the SHPIs constitute about 96% of the fe-males, 4% of the males, 35% Below the Pov-erty Line (BPL) members and 24% of the minority members. This indicates that the SHPIs are playing a significant role in the so-cioeconomic development of the women and the backward sections of the society.
• The total number of SHGs formed by the SHPIs were 1,12,565. 57% of the SHPIs formed clusters and 50% of the SHPIs formed federations. However, all the SHGs are not part of these clusters and federations.
• Cost of Salary per SHG decreases with the increase in the number of SHGs formed by the SHPIs. The cost of salary per SHG comes down by six times for the SHPIs op-erating on 8000 and above SHGs.
• There is an approximate decline in the ad-ministrative cost per SHG with the rise in the number of SHGs formed by the SHPIs.
• The average income of the SHPIs increases with the increase in the number of SHGs because more funds and resources will be needed for the formation, capacity building and promotion of large number of SHGs.
• The income from grants, donations and contributions is less in proportion for the SHPIs having a larger number of SHGs (10%).However, the major source of in-come for the SHPIs operating at a smaller levels comes from grants/donations and commissions (74%).
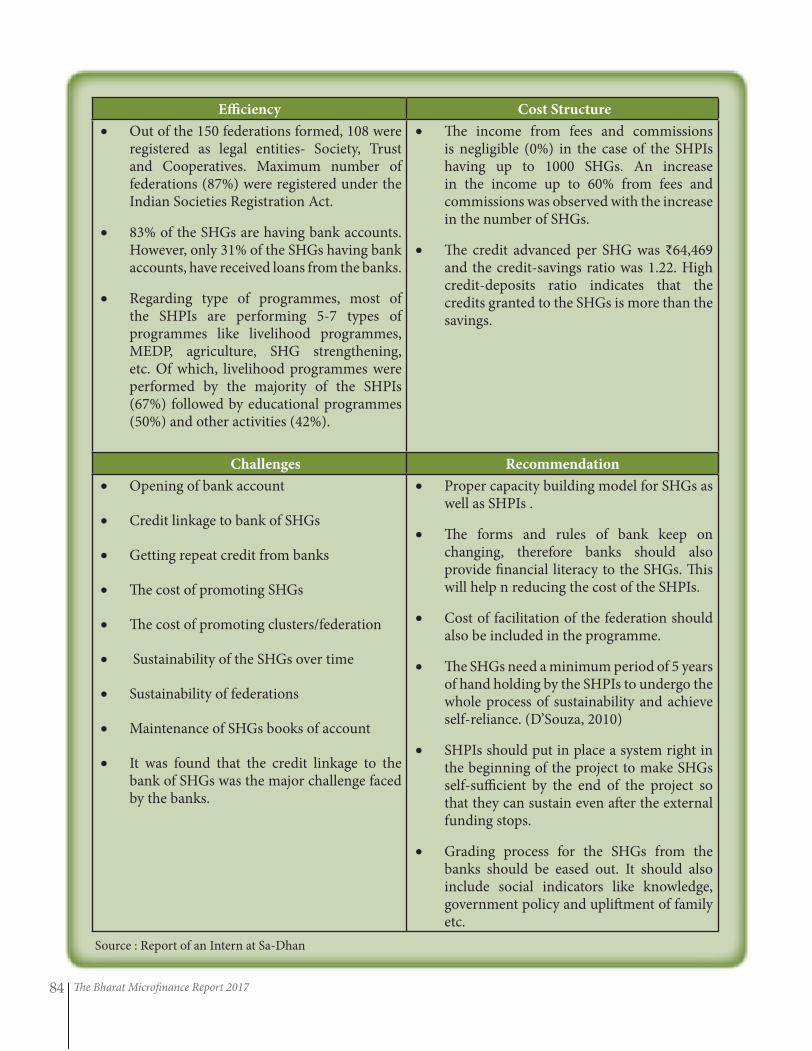
The Bharat Microfinance Report 201784
Efficiency Cost Structure
• Out of the 150 federations formed, 108 were registered as legal entities- Society, Trust and Cooperatives. Maximum number of federations (87%) were registered under the Indian Societies Registration Act.
• 83% of the SHGs are having bank accounts. However, only 31% of the SHGs having bank accounts, have received loans from the banks.
• Regarding type of programmes, most of the SHPIs are performing 5-7 types of programmes like livelihood programmes, MEDP, agriculture, SHG strengthening, etc. Of which, livelihood programmes were performed by the majority of the SHPIs (67%) followed by educational programmes (50%) and other activities (42%).
• The income from fees and commissions is negligible (0%) in the case of the SHPIs having up to 1000 SHGs. An increase in the income up to 60% from fees and commissions was observed with the increase in the number of SHGs.
• The credit advanced per SHG was ₹64,469 and the credit-savings ratio was 1.22. High credit-deposits ratio indicates that the credits granted to the SHGs is more than the savings.
Challenges Recommendation
• Opening of bank account
• Credit linkage to bank of SHGs
• Getting repeat credit from banks
• The cost of promoting SHGs
• The cost of promoting clusters/federation
• Sustainability of the SHGs over time
• Sustainability of federations
• Maintenance of SHGs books of account
• It was found that the credit linkage to the bank of SHGs was the major challenge faced by the banks.
• Proper capacity building model for SHGs as well as SHPIs .
• The forms and rules of bank keep on changing, therefore banks should also provide financial literacy to the SHGs. This will help n reducing the cost of the SHPIs.
• Cost of facilitation of the federation should also be included in the programme.
• The SHGs need a minimum period of 5 years of hand holding by the SHPIs to undergo the whole process of sustainability and achieve self-reliance. (D’Souza, 2010)
• SHPIs should put in place a system right in the beginning of the project to make SHGs self-sufficient by the end of the project so that they can sustain even after the external funding stops.
• Grading process for the SHGs from the banks should be eased out. It should also include social indicators like knowledge, government policy and upliftment of family etc.
Source : Report of an Intern at Sa-Dhan
BC Model and Technology 85
BC Model and TechnologyChapter 6
Financial Inclusion has been always at the forefront in India, which includes access to useful and affordable financial products and services that meet the needs of – transactions, payments, savings, credit and
insurance – delivered in a responsible and sustainable manner .
The main focus of this programme was to give access to the credit flow to the unbanked population of the country. But in the last decade a strategic shift has been observed where the focus is shifting from the credit to a more holistic approach.
This new approach has changed the core banking architecture of the Indian economy. Since bank account creation is an integral part of the agenda, banks are more directly involved, with the regulations mandating that deposit taking be retained as their exclusive domain. One of the popular informal mode of the banking is ‘Business Correspondent’. The BC model is an innovative technology-based banking model which enables people in remote areas of India access to formal financial institutions.
The Reserve Bank had taken several steps to provide banking facilities in all the unbanked villages in the country. A roadmap to cover villages with population more than 2,000 was first rolled out in 2010. A total of 74,414 villages with population more than 2,000 were identified and allotted to various banks (public sector banks, private sector banks and regional rural banks) through State Level Bankers’ Committees (SLBCs) for coverage. All the identified villages have been provided banking services through branches or business correspondents or through other modes such as ATMs and mobile vans. In June 2012, a roadmap was rolled out to provide banking services to unbanked villages with population less than 2,000. A total of 491,825 unbanked villages across the country with a population of less than 2,000 were allotted to various banks through SLBCs for coverage. As on 31 March 2017, 96.0 per cent (472,136 villages) of the total villages allotted had been covered comprising of 19,875 villages through brick and mortar branches, 431,359 villages through BCs and 20,902 villages through other modes.
6.1 Strengthening the BC Model1
Reserve Bank of India (RBI) on 15 July 2015 formed a committee on Medium-term Path on Financial In-clusion to create a five-year plan for financial inclusion in India. It is headed by Deepak Mohanty, Executive Director of RBI. The Committee submitted its report in December 2015, sought to propel the economy onto a medium-term sustainable inclusion path. The Committee had recommended for setting up a framework for a BC registry and BC certification, following which instructions regarding the same were issued to the Indian Banks’ Association (IBA) during the year. As recommended by the Committee, a financial literacy week was conducted across the country from June 5-9, 2017. The literacy week focussed on four broad themes, viz., Know Your Customer (KYC), Exercising Credit Discipline, Grievance Redressal and Going Digital. During the week, banks were advised to display posters on the four common themes inside branch premises and also display one message each day on the home page of their respective websites as well as ATM screens across the country. Further, Financial Literacy Centers (FLCs) and rural branches were ad-vised to conduct special camps during the week. A movable asset registry was also launched by the Central Registry of Securitisation Asset Reconstruction and Security Interest of India (CERSAI), as recommended by the Committee to facilitate lending to the MSME sector.
BC Registry
A BC registry is proposed to be structured as a database of comprehensive information pertaining to the existing or potential business correspondents. The BC registry will give a holistic view of under-banked and less penetrated areas in a region and accordingly the delivery of financial services can be improved in
1 RBI Annual Report 2016-17
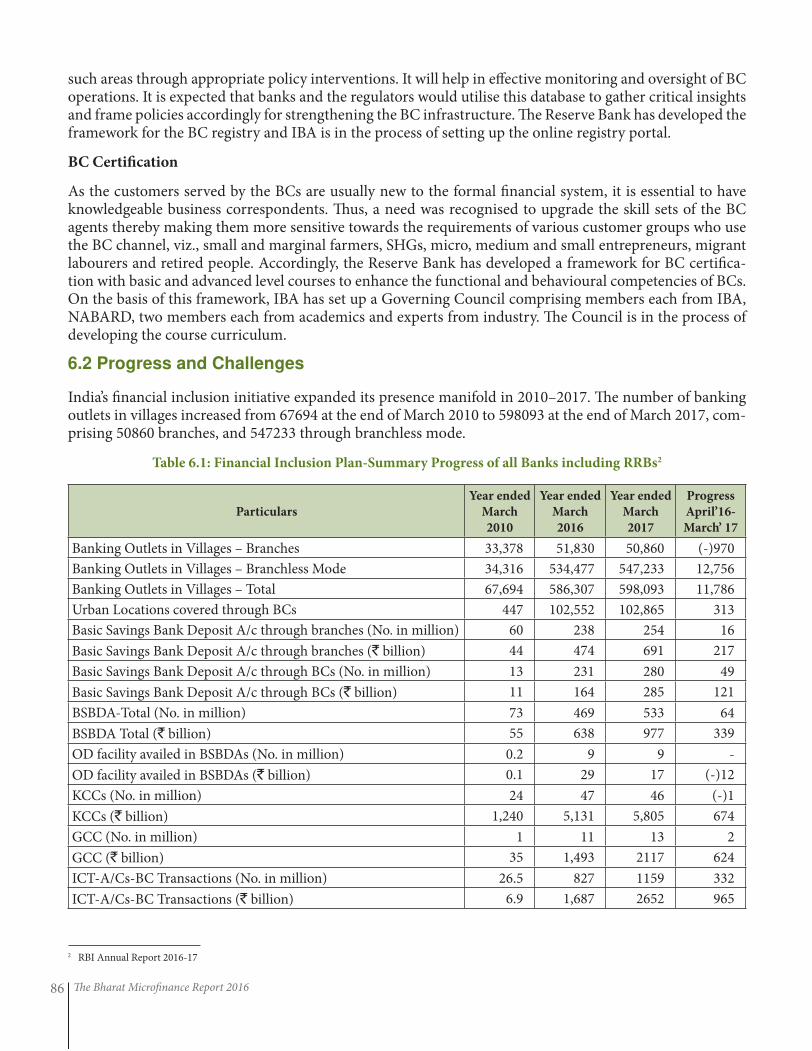
The Bharat Microfinance Report 201686
such areas through appropriate policy interventions. It will help in effective monitoring and oversight of BC operations. It is expected that banks and the regulators would utilise this database to gather critical insights and frame policies accordingly for strengthening the BC infrastructure. The Reserve Bank has developed the framework for the BC registry and IBA is in the process of setting up the online registry portal.
BC Certification
As the customers served by the BCs are usually new to the formal financial system, it is essential to have knowledgeable business correspondents. Thus, a need was recognised to upgrade the skill sets of the BC agents thereby making them more sensitive towards the requirements of various customer groups who use the BC channel, viz., small and marginal farmers, SHGs, micro, medium and small entrepreneurs, migrant labourers and retired people. Accordingly, the Reserve Bank has developed a framework for BC certifica-tion with basic and advanced level courses to enhance the functional and behavioural competencies of BCs. On the basis of this framework, IBA has set up a Governing Council comprising members each from IBA, NABARD, two members each from academics and experts from industry. The Council is in the process of developing the course curriculum.
6.2 Progress and Challenges
India’s financial inclusion initiative expanded its presence manifold in 2010–2017. The number of banking outlets in villages increased from 67694 at the end of March 2010 to 598093 at the end of March 2017, com-prising 50860 branches, and 547233 through branchless mode.
Table 6.1: Financial Inclusion Plan-Summary Progress of all Banks including RRBs2
Particulars
Year ended
March
2010
Year ended
March
2016
Year ended
March
2017
Progress
April’16-
March’ 17
Banking Outlets in Villages – Branches 33,378 51,830 50,860 (-)970
Banking Outlets in Villages – Branchless Mode 34,316 534,477 547,233 12,756
Banking Outlets in Villages – Total 67,694 586,307 598,093 11,786
Urban Locations covered through BCs 447 102,552 102,865 313
Basic Savings Bank Deposit A/c through branches (No. in million) 60 238 254 16
Basic Savings Bank Deposit A/c through branches (` billion) 44 474 691 217
Basic Savings Bank Deposit A/c through BCs (No. in million) 13 231 280 49
Basic Savings Bank Deposit A/c through BCs (` billion) 11 164 285 121
BSBDA-Total (No. in million) 73 469 533 64
BSBDA Total (` billion) 55 638 977 339
OD facility availed in BSBDAs (No. in million) 0.2 9 9 -
OD facility availed in BSBDAs (` billion) 0.1 29 17 (-)12
KCCs (No. in million) 24 47 46 (-)1
KCCs (` billion) 1,240 5,131 5,805 674
GCC (No. in million) 1 11 13 2
GCC (` billion) 35 1,493 2117 624
ICT-A/Cs-BC Transactions (No. in million) 26.5 827 1159 332
ICT-A/Cs-BC Transactions (` billion) 6.9 1,687 2652 965
2 RBI Annual Report 2016-17
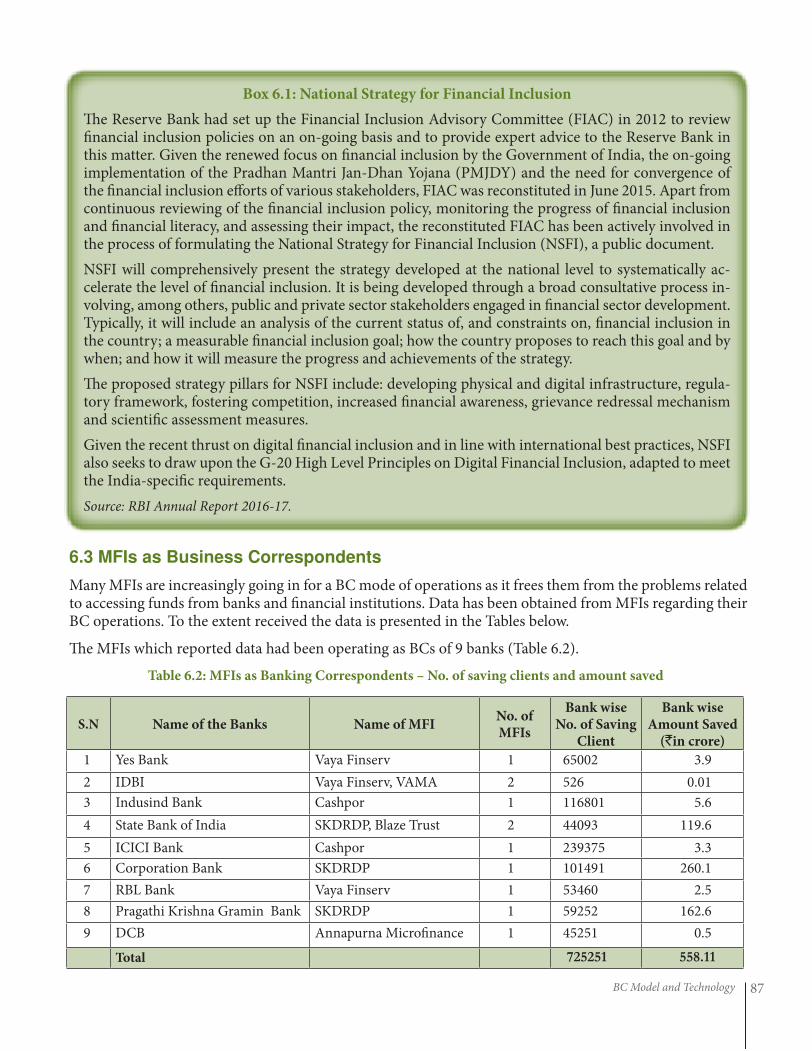
BC Model and Technology 87
Box 6.1: National Strategy for Financial Inclusion
The Reserve Bank had set up the Financial Inclusion Advisory Committee (FIAC) in 2012 to review financial inclusion policies on an on-going basis and to provide expert advice to the Reserve Bank in this matter. Given the renewed focus on financial inclusion by the Government of India, the on-going implementation of the Pradhan Mantri Jan-Dhan Yojana (PMJDY) and the need for convergence of the financial inclusion efforts of various stakeholders, FIAC was reconstituted in June 2015. Apart from continuous reviewing of the financial inclusion policy, monitoring the progress of financial inclusion and financial literacy, and assessing their impact, the reconstituted FIAC has been actively involved in the process of formulating the National Strategy for Financial Inclusion (NSFI), a public document.
NSFI will comprehensively present the strategy developed at the national level to systematically ac-celerate the level of financial inclusion. It is being developed through a broad consultative process in-volving, among others, public and private sector stakeholders engaged in financial sector development. Typically, it will include an analysis of the current status of, and constraints on, financial inclusion in the country; a measurable financial inclusion goal; how the country proposes to reach this goal and by when; and how it will measure the progress and achievements of the strategy.
The proposed strategy pillars for NSFI include: developing physical and digital infrastructure, regula-tory framework, fostering competition, increased financial awareness, grievance redressal mechanism and scientific assessment measures.
Given the recent thrust on digital financial inclusion and in line with international best practices, NSFI also seeks to draw upon the G-20 High Level Principles on Digital Financial Inclusion, adapted to meet the India-specific requirements.
Source: RBI Annual Report 2016-17.
6.3 MFIs as Business Correspondents
Many MFIs are increasingly going in for a BC mode of operations as it frees them from the problems related to accessing funds from banks and financial institutions. Data has been obtained from MFIs regarding their BC operations. To the extent received the data is presented in the Tables below.
The MFIs which reported data had been operating as BCs of 9 banks (Table 6.2).
Table 6.2: MFIs as Banking Correspondents – No. of saving clients and amount saved
S.N Name of the Banks Name of MFINo. of MFIs
Bank wise No. of Saving
Client
Bank wise Amount Saved
(`in crore)
1 Yes Bank Vaya Finserv 1 65002 3.9
2 IDBI Vaya Finserv, VAMA 2 526 0.01
3 Indusind Bank Cashpor 1 116801 5.6
4 State Bank of India SKDRDP, Blaze Trust 2 44093 119.6
5 ICICI Bank Cashpor 1 239375 3.3
6 Corporation Bank SKDRDP 1 101491 260.1
7 RBL Bank Vaya Finserv 1 53460 2.5
8 Pragathi Krishna Gramin Bank SKDRDP 1 59252 162.6
9 DCB Annapurna Microfinance 1 45251 0.5
Total 725251 558.11
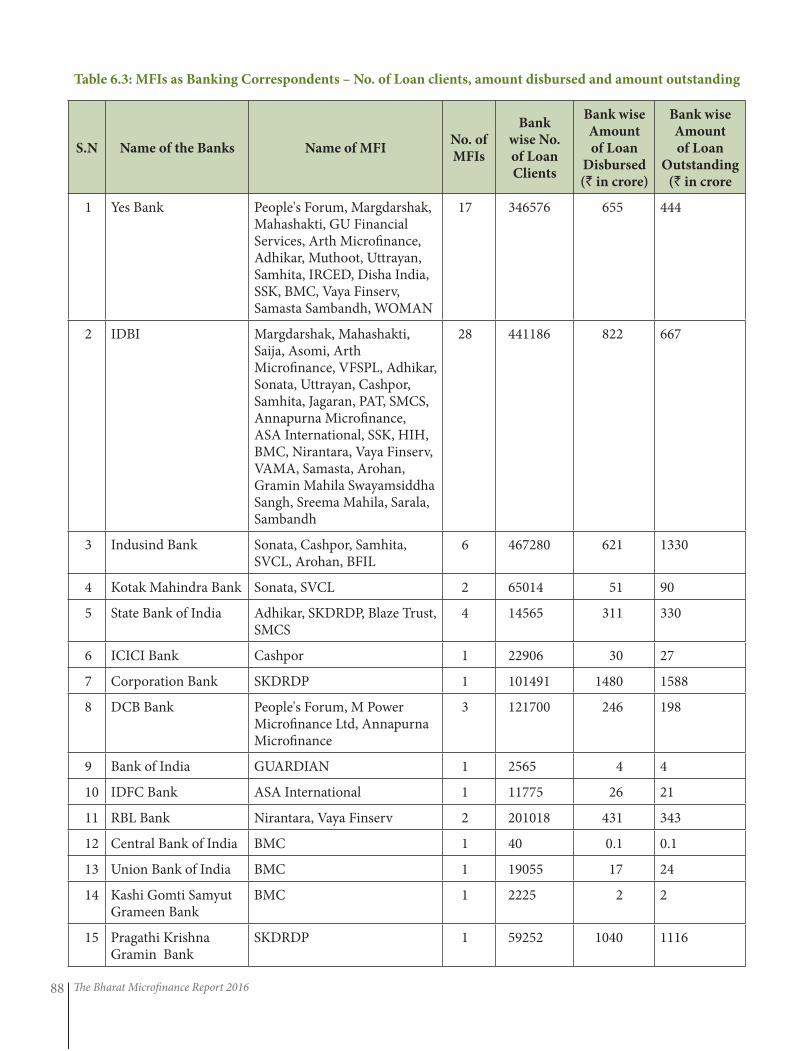
The Bharat Microfinance Report 201688
Table 6.3: MFIs as Banking Correspondents – No. of Loan clients, amount disbursed and amount outstanding
S.N Name of the Banks Name of MFINo. of MFIs
Bank wise No. of Loan Clients
Bank wise Amount of Loan
Disbursed (` in crore)
Bank wise Amount of Loan
Outstanding (` in crore
1 Yes Bank People's Forum, Margdarshak, Mahashakti, GU Financial Services, Arth Microfinance, Adhikar, Muthoot, Uttrayan, Samhita, IRCED, Disha India, SSK, BMC, Vaya Finserv, Samasta Sambandh, WOMAN
17 346576 655 444
2 IDBI Margdarshak, Mahashakti, Saija, Asomi, Arth Microfinance, VFSPL, Adhikar, Sonata, Uttrayan, Cashpor, Samhita, Jagaran, PAT, SMCS, Annapurna Microfinance, ASA International, SSK, HIH, BMC, Nirantara, Vaya Finserv, VAMA, Samasta, Arohan, Gramin Mahila Swayamsiddha Sangh, Sreema Mahila, Sarala, Sambandh
28 441186 822 667
3 Indusind Bank Sonata, Cashpor, Samhita, SVCL, Arohan, BFIL
6 467280 621 1330
4 Kotak Mahindra Bank Sonata, SVCL 2 65014 51 90
5 State Bank of India Adhikar, SKDRDP, Blaze Trust, SMCS
4 14565 311 330
6 ICICI Bank Cashpor 1 22906 30 27
7 Corporation Bank SKDRDP 1 101491 1480 1588
8 DCB Bank People's Forum, M Power Microfinance Ltd, Annapurna Microfinance
3 121700 246 198
9 Bank of India GUARDIAN 1 2565 4 4
10 IDFC Bank ASA International 1 11775 26 21
11 RBL Bank Nirantara, Vaya Finserv 2 201018 431 343
12 Central Bank of India BMC 1 40 0.1 0.1
13 Union Bank of India BMC 1 19055 17 24
14 Kashi Gomti Samyut Grameen Bank
BMC 1 2225 2 2
15 Pragathi Krishna Gramin Bank
SKDRDP 1 59252 1040 1116
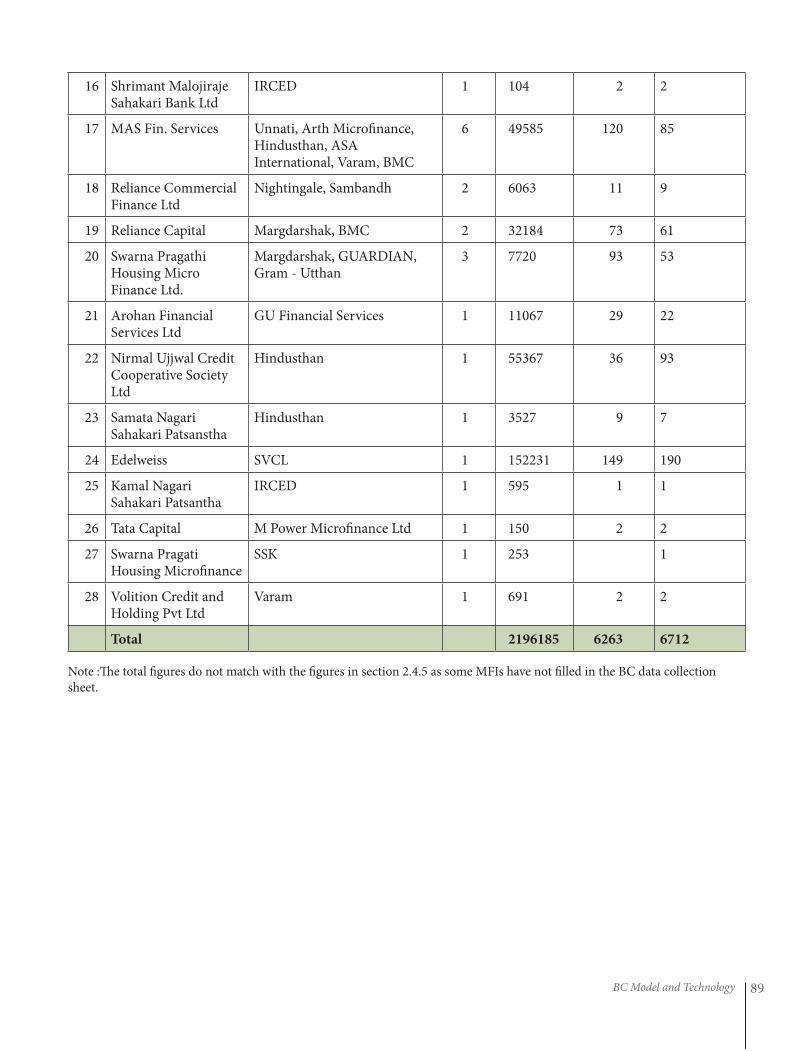
BC Model and Technology 89
16 Shrimant Malojiraje Sahakari Bank Ltd
IRCED 1 104 2 2
17 MAS Fin. Services Unnati, Arth Microfinance, Hindusthan, ASA International, Varam, BMC
6 49585 120 85
18 Reliance Commercial Finance Ltd
Nightingale, Sambandh 2 6063 11 9
19 Reliance Capital Margdarshak, BMC 2 32184 73 61
20 Swarna Pragathi Housing Micro Finance Ltd.
Margdarshak, GUARDIAN, Gram - Utthan
3 7720 93 53
21 Arohan Financial Services Ltd
GU Financial Services 1 11067 29 22
22 Nirmal Ujjwal Credit Cooperative Society Ltd
Hindusthan 1 55367 36 93
23 Samata Nagari Sahakari Patsanstha
Hindusthan 1 3527 9 7
24 Edelweiss SVCL 1 152231 149 190
25 Kamal Nagari Sahakari Patsantha
IRCED 1 595 1 1
26 Tata Capital M Power Microfinance Ltd 1 150 2 2
27 Swarna Pragati Housing Microfinance
SSK 1 253 1
28 Volition Credit and Holding Pvt Ltd
Varam 1 691 2 2
Total 2196185 6263 6712
Note :The total figures do not match with the figures in section 2.4.5 as some MFIs have not filled in the BC data collection sheet.
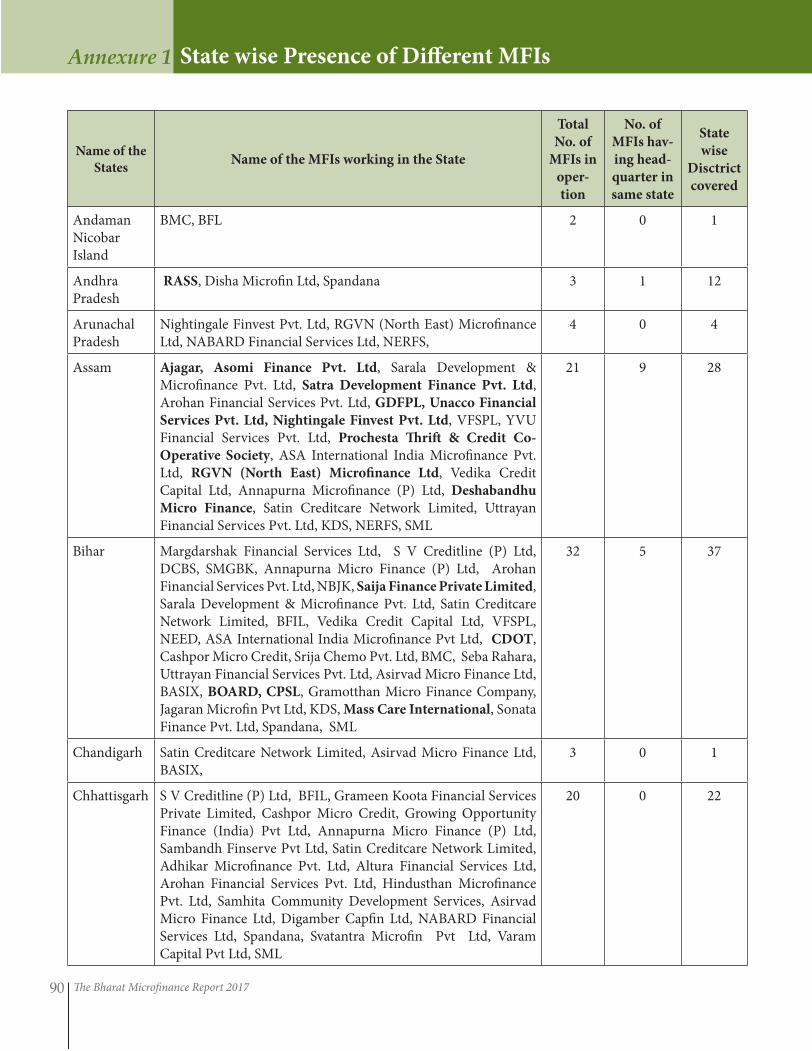
The Bharat Microfinance Report 201790
State wise Presence of Different MFIsAnnexure 1
Name of the
StatesName of the MFIs working in the State
Total
No. of
MFIs in
oper-
tion
No. of
MFIs hav-
ing head-
quarter in
same state
State
wise
Disctrict
covered
Andaman Nicobar Island
BMC, BFL 2 0 1
Andhra Pradesh
RASS, Disha Microfin Ltd, Spandana 3 1 12
Arunachal Pradesh
Nightingale Finvest Pvt. Ltd, RGVN (North East) Microfinance Ltd, NABARD Financial Services Ltd, NERFS,
4 0 4
Assam Ajagar, Asomi Finance Pvt. Ltd, Sarala Development & Microfinance Pvt. Ltd, Satra Development Finance Pvt. Ltd, Arohan Financial Services Pvt. Ltd, GDFPL, Unacco Financial
Services Pvt. Ltd, Nightingale Finvest Pvt. Ltd, VFSPL, YVU Financial Services Pvt. Ltd, Prochesta Thrift & Credit Co-
Operative Society, ASA International India Microfinance Pvt. Ltd, RGVN (North East) Microfinance Ltd, Vedika Credit Capital Ltd, Annapurna Microfinance (P) Ltd, Deshabandhu
Micro Finance, Satin Creditcare Network Limited, Uttrayan Financial Services Pvt. Ltd, KDS, NERFS, SML
21 9 28
Bihar Margdarshak Financial Services Ltd, S V Creditline (P) Ltd, DCBS, SMGBK, Annapurna Micro Finance (P) Ltd, Arohan Financial Services Pvt. Ltd, NBJK, Saija Finance Private Limited, Sarala Development & Microfinance Pvt. Ltd, Satin Creditcare Network Limited, BFIL, Vedika Credit Capital Ltd, VFSPL, NEED, ASA International India Microfinance Pvt Ltd, CDOT, Cashpor Micro Credit, Srija Chemo Pvt. Ltd, BMC, Seba Rahara, Uttrayan Financial Services Pvt. Ltd, Asirvad Micro Finance Ltd, BASIX, BOARD, CPSL, Gramotthan Micro Finance Company, Jagaran Microfin Pvt Ltd, KDS, Mass Care International, Sonata Finance Pvt. Ltd, Spandana, SML
32 5 37
Chandigarh Satin Creditcare Network Limited, Asirvad Micro Finance Ltd, BASIX,
3 0 1
Chhattisgarh S V Creditline (P) Ltd, BFIL, Grameen Koota Financial Services Private Limited, Cashpor Micro Credit, Growing Opportunity Finance (India) Pvt Ltd, Annapurna Micro Finance (P) Ltd, Sambandh Finserve Pvt Ltd, Satin Creditcare Network Limited, Adhikar Microfinance Pvt. Ltd, Altura Financial Services Ltd, Arohan Financial Services Pvt. Ltd, Hindusthan Microfinance Pvt. Ltd, Samhita Community Development Services, Asirvad Micro Finance Ltd, Digamber Capfin Ltd, NABARD Financial Services Ltd, Spandana, Svatantra Microfin Pvt Ltd, Varam Capital Pvt Ltd, SML
20 0 22
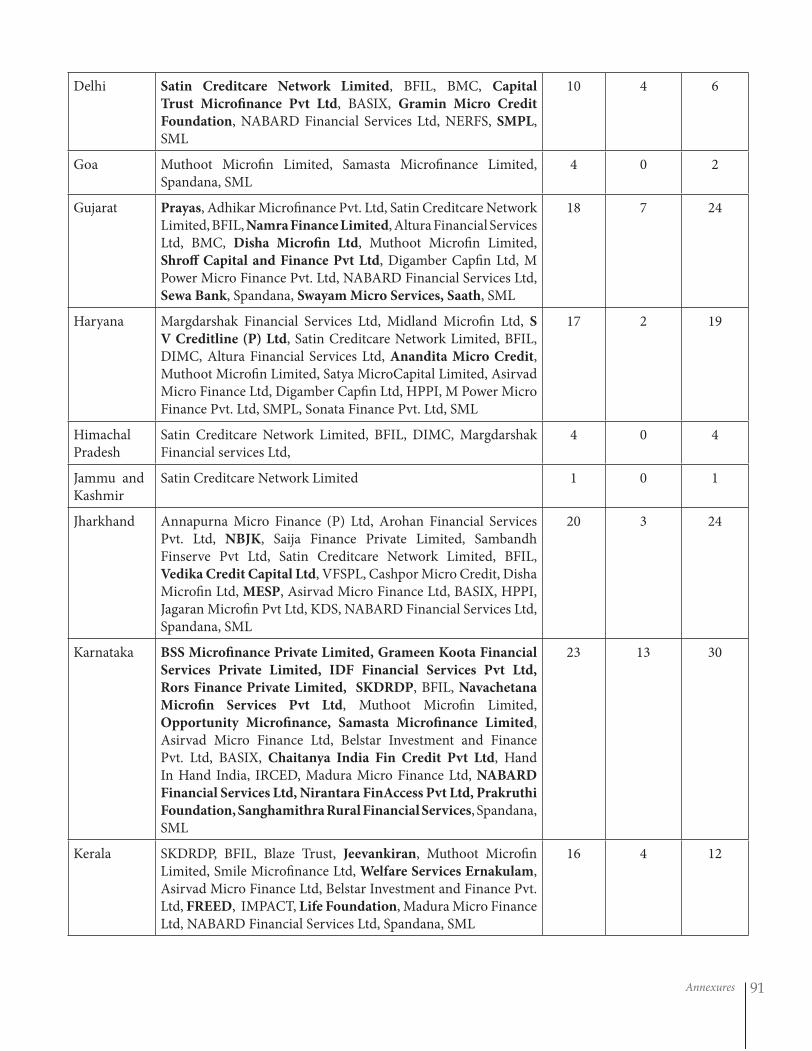
Annexures 91
Delhi Satin Creditcare Network Limited, BFIL, BMC, Capital
Trust Microfinance Pvt Ltd, BASIX, Gramin Micro Credit
Foundation, NABARD Financial Services Ltd, NERFS, SMPL, SML
10 4 6
Goa Muthoot Microfin Limited, Samasta Microfinance Limited, Spandana, SML
4 0 2
Gujarat Prayas, Adhikar Microfinance Pvt. Ltd, Satin Creditcare Network Limited, BFIL, Namra Finance Limited, Altura Financial Services Ltd, BMC, Disha Microfin Ltd, Muthoot Microfin Limited, Shroff Capital and Finance Pvt Ltd, Digamber Capfin Ltd, M Power Micro Finance Pvt. Ltd, NABARD Financial Services Ltd, Sewa Bank, Spandana, Swayam Micro Services, Saath, SML
18 7 24
Haryana Margdarshak Financial Services Ltd, Midland Microfin Ltd, S
V Creditline (P) Ltd, Satin Creditcare Network Limited, BFIL, DIMC, Altura Financial Services Ltd, Anandita Micro Credit, Muthoot Microfin Limited, Satya MicroCapital Limited, Asirvad Micro Finance Ltd, Digamber Capfin Ltd, HPPI, M Power Micro Finance Pvt. Ltd, SMPL, Sonata Finance Pvt. Ltd, SML
17 2 19
Himachal Pradesh
Satin Creditcare Network Limited, BFIL, DIMC, Margdarshak Financial services Ltd,
4 0 4
Jammu and Kashmir
Satin Creditcare Network Limited 1 0 1
Jharkhand Annapurna Micro Finance (P) Ltd, Arohan Financial Services Pvt. Ltd, NBJK, Saija Finance Private Limited, Sambandh Finserve Pvt Ltd, Satin Creditcare Network Limited, BFIL, Vedika Credit Capital Ltd, VFSPL, Cashpor Micro Credit, Disha Microfin Ltd, MESP, Asirvad Micro Finance Ltd, BASIX, HPPI, Jagaran Microfin Pvt Ltd, KDS, NABARD Financial Services Ltd, Spandana, SML
20 3 24
Karnataka BSS Microfinance Private Limited, Grameen Koota Financial
Services Private Limited, IDF Financial Services Pvt Ltd,
Rors Finance Private Limited, SKDRDP, BFIL, Navachetana
Microfin Services Pvt Ltd, Muthoot Microfin Limited, Opportunity Microfinance, Samasta Microfinance Limited, Asirvad Micro Finance Ltd, Belstar Investment and Finance Pvt. Ltd, BASIX, Chaitanya India Fin Credit Pvt Ltd, Hand In Hand India, IRCED, Madura Micro Finance Ltd, NABARD
Financial Services Ltd, Nirantara FinAccess Pvt Ltd, Prakruthi
Foundation, Sanghamithra Rural Financial Services, Spandana, SML
23 13 30
Kerala SKDRDP, BFIL, Blaze Trust, Jeevankiran, Muthoot Microfin Limited, Smile Microfinance Ltd, Welfare Services Ernakulam, Asirvad Micro Finance Ltd, Belstar Investment and Finance Pvt. Ltd, FREED, IMPACT, Life Foundation, Madura Micro Finance Ltd, NABARD Financial Services Ltd, Spandana, SML
16 4 12
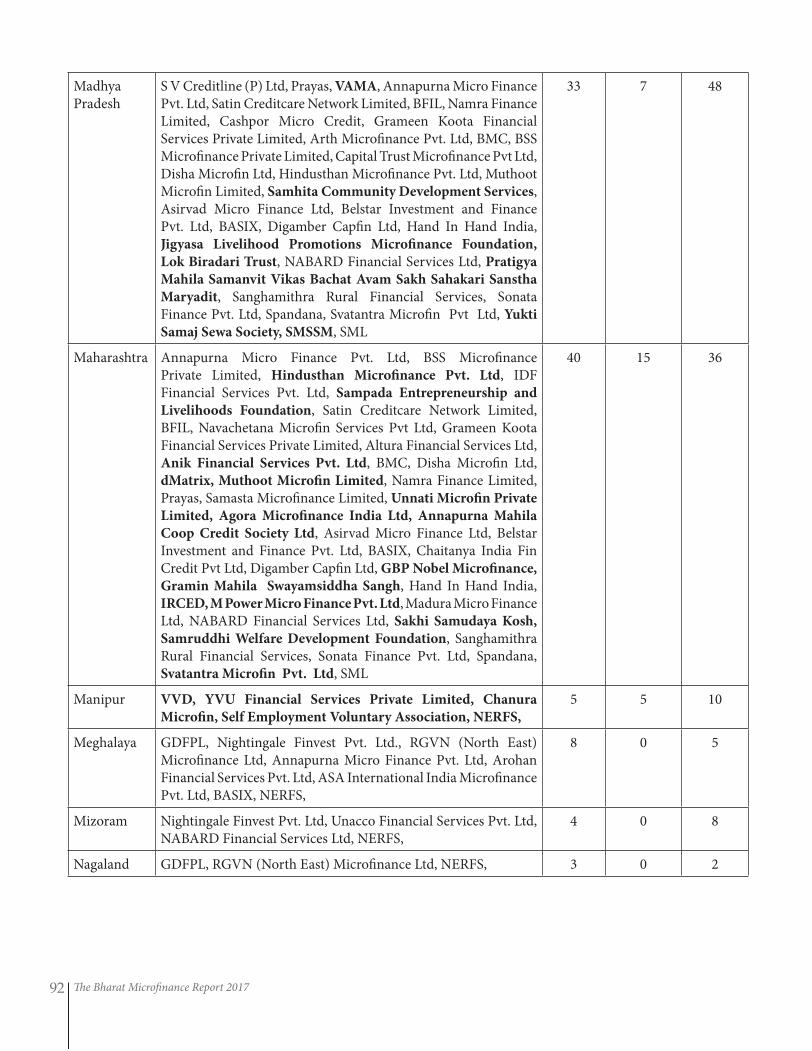
The Bharat Microfinance Report 201792
Madhya Pradesh
S V Creditline (P) Ltd, Prayas, VAMA, Annapurna Micro Finance Pvt. Ltd, Satin Creditcare Network Limited, BFIL, Namra Finance Limited, Cashpor Micro Credit, Grameen Koota Financial Services Private Limited, Arth Microfinance Pvt. Ltd, BMC, BSS Microfinance Private Limited, Capital Trust Microfinance Pvt Ltd, Disha Microfin Ltd, Hindusthan Microfinance Pvt. Ltd, Muthoot Microfin Limited, Samhita Community Development Services, Asirvad Micro Finance Ltd, Belstar Investment and Finance Pvt. Ltd, BASIX, Digamber Capfin Ltd, Hand In Hand India, Jigyasa Livelihood Promotions Microfinance Foundation,
Lok Biradari Trust, NABARD Financial Services Ltd, Pratigya
Mahila Samanvit Vikas Bachat Avam Sakh Sahakari Sanstha
Maryadit, Sanghamithra Rural Financial Services, Sonata Finance Pvt. Ltd, Spandana, Svatantra Microfin Pvt Ltd, Yukti
Samaj Sewa Society, SMSSM, SML
33 7 48
Maharashtra Annapurna Micro Finance Pvt. Ltd, BSS Microfinance Private Limited, Hindusthan Microfinance Pvt. Ltd, IDF Financial Services Pvt. Ltd, Sampada Entrepreneurship and
Livelihoods Foundation, Satin Creditcare Network Limited, BFIL, Navachetana Microfin Services Pvt Ltd, Grameen Koota Financial Services Private Limited, Altura Financial Services Ltd, Anik Financial Services Pvt. Ltd, BMC, Disha Microfin Ltd, dMatrix, Muthoot Microfin Limited, Namra Finance Limited, Prayas, Samasta Microfinance Limited, Unnati Microfin Private
Limited, Agora Microfinance India Ltd, Annapurna Mahila
Coop Credit Society Ltd, Asirvad Micro Finance Ltd, Belstar Investment and Finance Pvt. Ltd, BASIX, Chaitanya India Fin Credit Pvt Ltd, Digamber Capfin Ltd, GBP Nobel Microfinance,
Gramin Mahila Swayamsiddha Sangh, Hand In Hand India, IRCED, M Power Micro Finance Pvt. Ltd, Madura Micro Finance Ltd, NABARD Financial Services Ltd, Sakhi Samudaya Kosh,
Samruddhi Welfare Development Foundation, Sanghamithra Rural Financial Services, Sonata Finance Pvt. Ltd, Spandana, Svatantra Microfin Pvt. Ltd, SML
40 15 36
Manipur VVD, YVU Financial Services Private Limited, Chanura
Microfin, Self Employment Voluntary Association, NERFS,
5 5 10
Meghalaya GDFPL, Nightingale Finvest Pvt. Ltd., RGVN (North East) Microfinance Ltd, Annapurna Micro Finance Pvt. Ltd, Arohan Financial Services Pvt. Ltd, ASA International India Microfinance Pvt. Ltd, BASIX, NERFS,
8 0 5
Mizoram Nightingale Finvest Pvt. Ltd, Unacco Financial Services Pvt. Ltd, NABARD Financial Services Ltd, NERFS,
4 0 8
Nagaland GDFPL, RGVN (North East) Microfinance Ltd, NERFS, 3 0 2
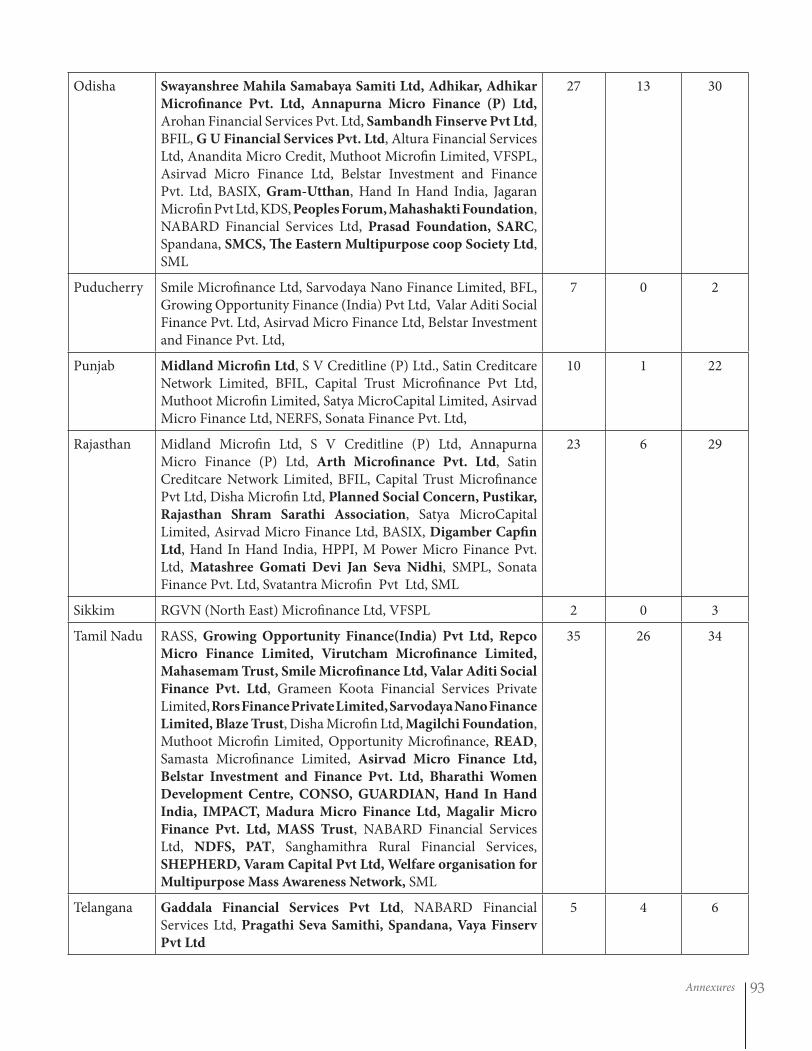
Annexures 93
Odisha Swayanshree Mahila Samabaya Samiti Ltd, Adhikar, Adhikar
Microfinance Pvt. Ltd, Annapurna Micro Finance (P) Ltd, Arohan Financial Services Pvt. Ltd, Sambandh Finserve Pvt Ltd, BFIL, G U Financial Services Pvt. Ltd, Altura Financial Services Ltd, Anandita Micro Credit, Muthoot Microfin Limited, VFSPL, Asirvad Micro Finance Ltd, Belstar Investment and Finance Pvt. Ltd, BASIX, Gram-Utthan, Hand In Hand India, Jagaran Microfin Pvt Ltd, KDS, Peoples Forum, Mahashakti Foundation, NABARD Financial Services Ltd, Prasad Foundation, SARC, Spandana, SMCS, The Eastern Multipurpose coop Society Ltd, SML
27 13 30
Puducherry Smile Microfinance Ltd, Sarvodaya Nano Finance Limited, BFL, Growing Opportunity Finance (India) Pvt Ltd, Valar Aditi Social Finance Pvt. Ltd, Asirvad Micro Finance Ltd, Belstar Investment and Finance Pvt. Ltd,
7 0 2
Punjab Midland Microfin Ltd, S V Creditline (P) Ltd., Satin Creditcare Network Limited, BFIL, Capital Trust Microfinance Pvt Ltd, Muthoot Microfin Limited, Satya MicroCapital Limited, Asirvad Micro Finance Ltd, NERFS, Sonata Finance Pvt. Ltd,
10 1 22
Rajasthan Midland Microfin Ltd, S V Creditline (P) Ltd, Annapurna Micro Finance (P) Ltd, Arth Microfinance Pvt. Ltd, Satin Creditcare Network Limited, BFIL, Capital Trust Microfinance Pvt Ltd, Disha Microfin Ltd, Planned Social Concern, Pustikar,
Rajasthan Shram Sarathi Association, Satya MicroCapital Limited, Asirvad Micro Finance Ltd, BASIX, Digamber Capfin
Ltd, Hand In Hand India, HPPI, M Power Micro Finance Pvt. Ltd, Matashree Gomati Devi Jan Seva Nidhi, SMPL, Sonata Finance Pvt. Ltd, Svatantra Microfin Pvt Ltd, SML
23 6 29
Sikkim RGVN (North East) Microfinance Ltd, VFSPL 2 0 3
Tamil Nadu RASS, Growing Opportunity Finance(India) Pvt Ltd, Repco
Micro Finance Limited, Virutcham Microfinance Limited,
Mahasemam Trust, Smile Microfinance Ltd, Valar Aditi Social
Finance Pvt. Ltd, Grameen Koota Financial Services Private Limited, Rors Finance Private Limited, Sarvodaya Nano Finance
Limited, Blaze Trust, Disha Microfin Ltd, Magilchi Foundation, Muthoot Microfin Limited, Opportunity Microfinance, READ, Samasta Microfinance Limited, Asirvad Micro Finance Ltd,
Belstar Investment and Finance Pvt. Ltd, Bharathi Women
Development Centre, CONSO, GUARDIAN, Hand In Hand
India, IMPACT, Madura Micro Finance Ltd, Magalir Micro
Finance Pvt. Ltd, MASS Trust, NABARD Financial Services Ltd, NDFS, PAT, Sanghamithra Rural Financial Services, SHEPHERD, Varam Capital Pvt Ltd, Welfare organisation for
Multipurpose Mass Awareness Network, SML
35 26 34
Telangana Gaddala Financial Services Pvt Ltd, NABARD Financial Services Ltd, Pragathi Seva Samithi, Spandana, Vaya Finserv
Pvt Ltd
5 4 6
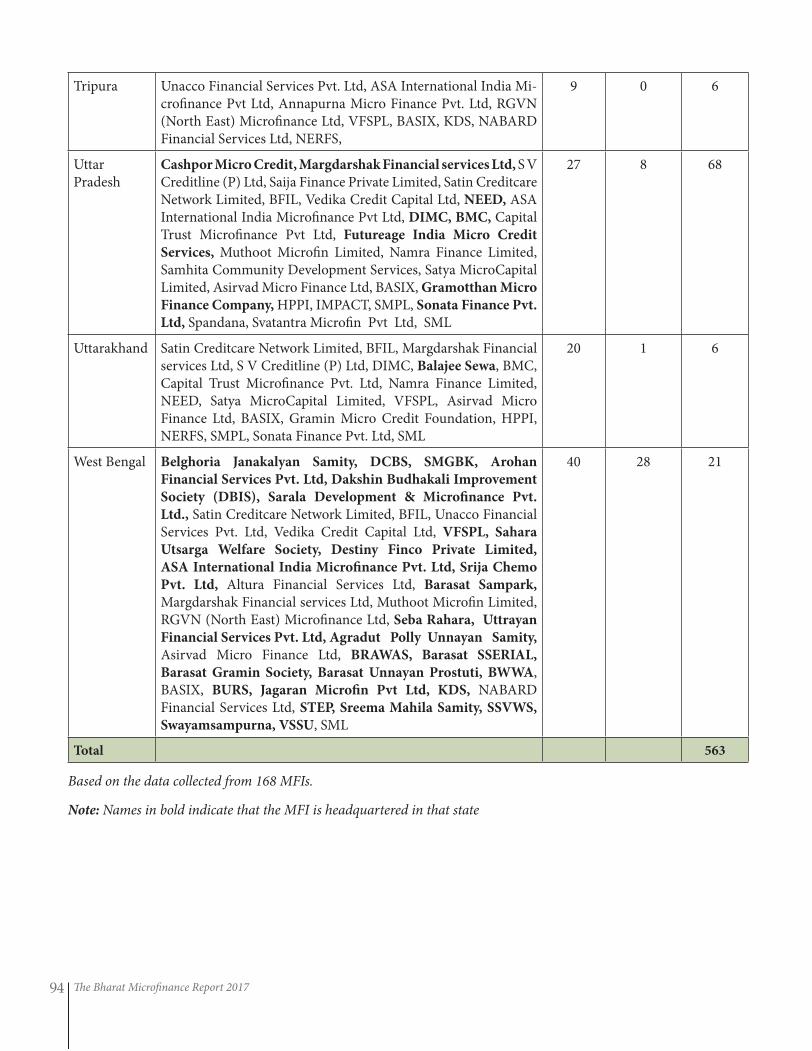
The Bharat Microfinance Report 201794
Tripura Unacco Financial Services Pvt. Ltd, ASA International India Mi-crofinance Pvt Ltd, Annapurna Micro Finance Pvt. Ltd, RGVN (North East) Microfinance Ltd, VFSPL, BASIX, KDS, NABARD Financial Services Ltd, NERFS,
9 0 6
Uttar Pradesh
Cashpor Micro Credit, Margdarshak Financial services Ltd, S V Creditline (P) Ltd, Saija Finance Private Limited, Satin Creditcare Network Limited, BFIL, Vedika Credit Capital Ltd, NEED, ASA International India Microfinance Pvt Ltd, DIMC, BMC, Capital Trust Microfinance Pvt Ltd, Futureage India Micro Credit
Services, Muthoot Microfin Limited, Namra Finance Limited, Samhita Community Development Services, Satya MicroCapital Limited, Asirvad Micro Finance Ltd, BASIX, Gramotthan Micro
Finance Company, HPPI, IMPACT, SMPL, Sonata Finance Pvt.
Ltd, Spandana, Svatantra Microfin Pvt Ltd, SML
27 8 68
Uttarakhand Satin Creditcare Network Limited, BFIL, Margdarshak Financial services Ltd, S V Creditline (P) Ltd, DIMC, Balajee Sewa, BMC, Capital Trust Microfinance Pvt. Ltd, Namra Finance Limited, NEED, Satya MicroCapital Limited, VFSPL, Asirvad Micro Finance Ltd, BASIX, Gramin Micro Credit Foundation, HPPI, NERFS, SMPL, Sonata Finance Pvt. Ltd, SML
20 1 6
West Bengal Belghoria Janakalyan Samity, DCBS, SMGBK, Arohan
Financial Services Pvt. Ltd, Dakshin Budhakali Improvement
Society (DBIS), Sarala Development & Microfinance Pvt.
Ltd., Satin Creditcare Network Limited, BFIL, Unacco Financial Services Pvt. Ltd, Vedika Credit Capital Ltd, VFSPL, Sahara
Utsarga Welfare Society, Destiny Finco Private Limited,
ASA International India Microfinance Pvt. Ltd, Srija Chemo
Pvt. Ltd, Altura Financial Services Ltd, Barasat Sampark, Margdarshak Financial services Ltd, Muthoot Microfin Limited, RGVN (North East) Microfinance Ltd, Seba Rahara, Uttrayan
Financial Services Pvt. Ltd, Agradut Polly Unnayan Samity, Asirvad Micro Finance Ltd, BRAWAS, Barasat SSERIAL,
Barasat Gramin Society, Barasat Unnayan Prostuti, BWWA, BASIX, BURS, Jagaran Microfin Pvt Ltd, KDS, NABARD Financial Services Ltd, STEP, Sreema Mahila Samity, SSVWS,
Swayamsampurna, VSSU, SML
40 28 21
Total 563
Based on the data collected from 168 MFIs.
Note: Names in bold indicate that the MFI is headquartered in that state
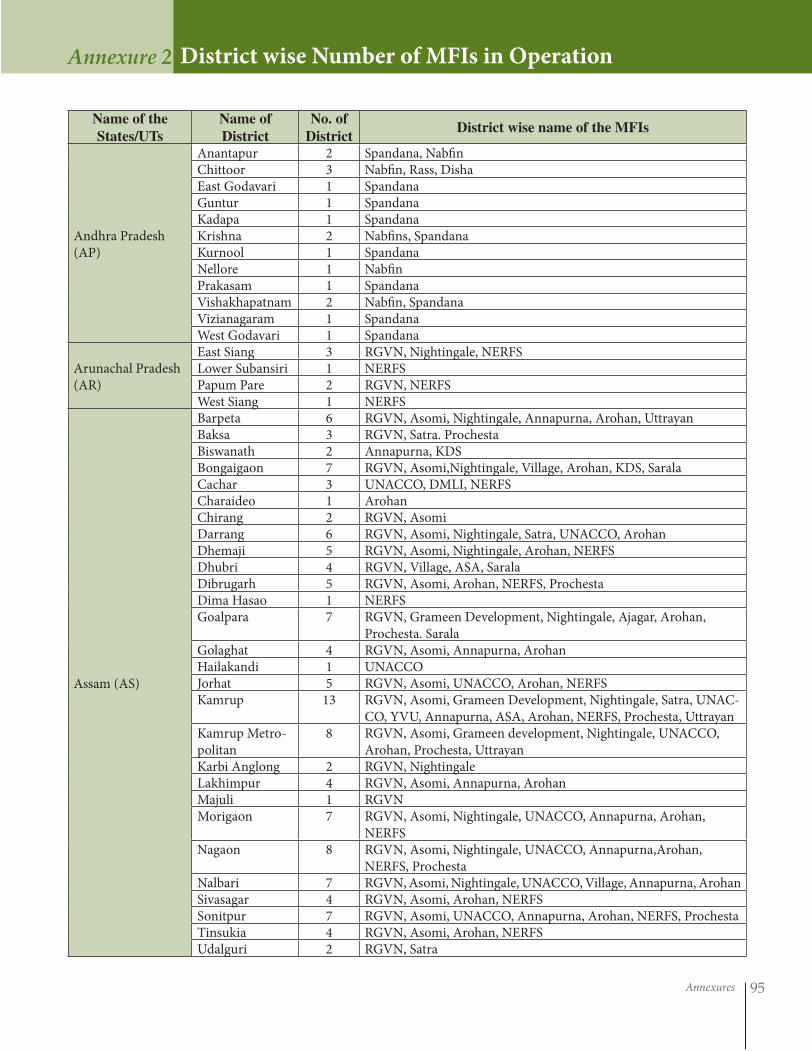
Annexures 95
District wise Number of MFIs in OperationAnnexure 2
Name of the
States/UTs
Name of
District
No. of
District District wise name of the MFIs
Andhra Pradesh (AP)
Anantapur 2 Spandana, NabfinChittoor 3 Nabfin, Rass, DishaEast Godavari 1 SpandanaGuntur 1 SpandanaKadapa 1 SpandanaKrishna 2 Nabfins, SpandanaKurnool 1 SpandanaNellore 1 NabfinPrakasam 1 SpandanaVishakhapatnam 2 Nabfin, SpandanaVizianagaram 1 SpandanaWest Godavari 1 Spandana
Arunachal Pradesh (AR)
East Siang 3 RGVN, Nightingale, NERFSLower Subansiri 1 NERFSPapum Pare 2 RGVN, NERFSWest Siang 1 NERFS
Assam (AS)
Barpeta 6 RGVN, Asomi, Nightingale, Annapurna, Arohan, UttrayanBaksa 3 RGVN, Satra. ProchestaBiswanath 2 Annapurna, KDSBongaigaon 7 RGVN, Asomi,Nightingale, Village, Arohan, KDS, SaralaCachar 3 UNACCO, DMLI, NERFSCharaideo 1 ArohanChirang 2 RGVN, AsomiDarrang 6 RGVN, Asomi, Nightingale, Satra, UNACCO, ArohanDhemaji 5 RGVN, Asomi, Nightingale, Arohan, NERFSDhubri 4 RGVN, Village, ASA, SaralaDibrugarh 5 RGVN, Asomi, Arohan, NERFS, ProchestaDima Hasao 1 NERFSGoalpara 7 RGVN, Grameen Development, Nightingale, Ajagar, Arohan,
Prochesta. SaralaGolaghat 4 RGVN, Asomi, Annapurna, ArohanHailakandi 1 UNACCOJorhat 5 RGVN, Asomi, UNACCO, Arohan, NERFSKamrup 13 RGVN, Asomi, Grameen Development, Nightingale, Satra, UNAC-
CO, YVU, Annapurna, ASA, Arohan, NERFS, Prochesta, UttrayanKamrup Metro-politan
8 RGVN, Asomi, Grameen development, Nightingale, UNACCO, Arohan, Prochesta, Uttrayan
Karbi Anglong 2 RGVN, NightingaleLakhimpur 4 RGVN, Asomi, Annapurna, ArohanMajuli 1 RGVNMorigaon 7 RGVN, Asomi, Nightingale, UNACCO, Annapurna, Arohan,
NERFSNagaon 8 RGVN, Asomi, Nightingale, UNACCO, Annapurna,Arohan,
NERFS, ProchestaNalbari 7 RGVN, Asomi, Nightingale, UNACCO, Village, Annapurna, ArohanSivasagar 4 RGVN, Asomi, Arohan, NERFSSonitpur 7 RGVN, Asomi, UNACCO, Annapurna, Arohan, NERFS, ProchestaTinsukia 4 RGVN, Asomi, Arohan, NERFSUdalguri 2 RGVN, Satra
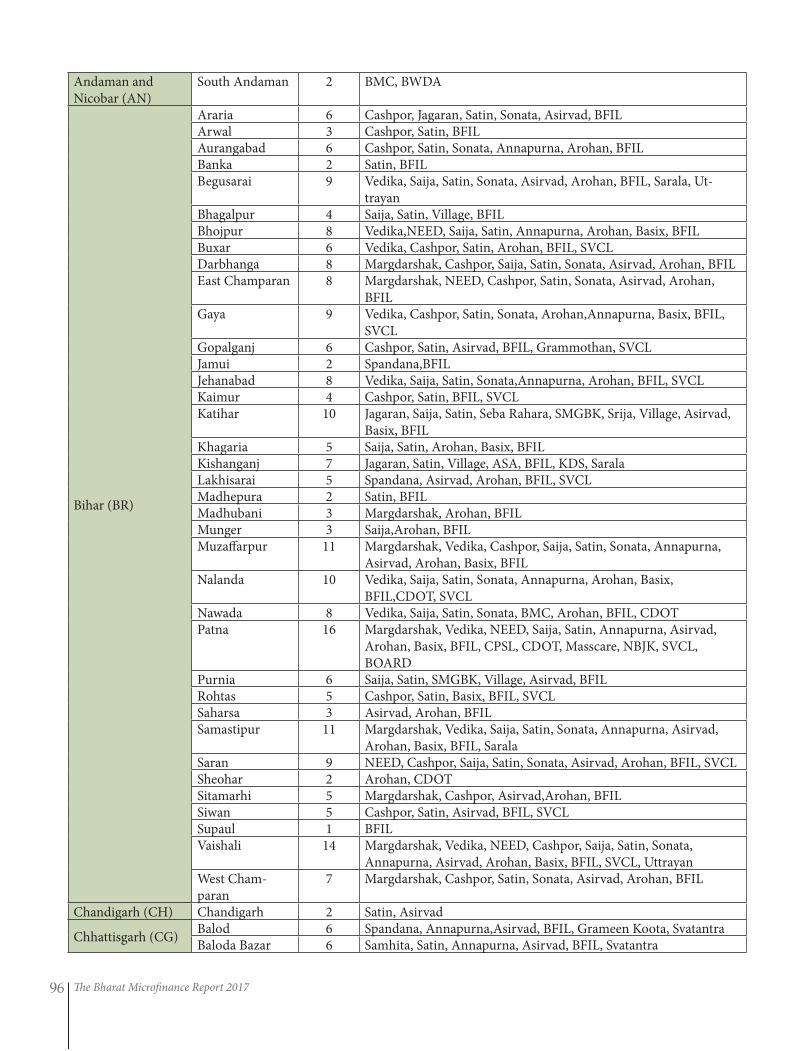
The Bharat Microfinance Report 201796
Andaman and Nicobar (AN)
South Andaman 2 BMC, BWDA
Bihar (BR)
Araria 6 Cashpor, Jagaran, Satin, Sonata, Asirvad, BFILArwal 3 Cashpor, Satin, BFILAurangabad 6 Cashpor, Satin, Sonata, Annapurna, Arohan, BFILBanka 2 Satin, BFILBegusarai 9 Vedika, Saija, Satin, Sonata, Asirvad, Arohan, BFIL, Sarala, Ut-
trayanBhagalpur 4 Saija, Satin, Village, BFILBhojpur 8 Vedika,NEED, Saija, Satin, Annapurna, Arohan, Basix, BFILBuxar 6 Vedika, Cashpor, Satin, Arohan, BFIL, SVCLDarbhanga 8 Margdarshak, Cashpor, Saija, Satin, Sonata, Asirvad, Arohan, BFILEast Champaran 8 Margdarshak, NEED, Cashpor, Satin, Sonata, Asirvad, Arohan,
BFILGaya 9 Vedika, Cashpor, Satin, Sonata, Arohan,Annapurna, Basix, BFIL,
SVCLGopalganj 6 Cashpor, Satin, Asirvad, BFIL, Grammothan, SVCLJamui 2 Spandana,BFILJehanabad 8 Vedika, Saija, Satin, Sonata,Annapurna, Arohan, BFIL, SVCLKaimur 4 Cashpor, Satin, BFIL, SVCLKatihar 10 Jagaran, Saija, Satin, Seba Rahara, SMGBK, Srija, Village, Asirvad,
Basix, BFILKhagaria 5 Saija, Satin, Arohan, Basix, BFILKishanganj 7 Jagaran, Satin, Village, ASA, BFIL, KDS, SaralaLakhisarai 5 Spandana, Asirvad, Arohan, BFIL, SVCLMadhepura 2 Satin, BFILMadhubani 3 Margdarshak, Arohan, BFILMunger 3 Saija,Arohan, BFILMuzaffarpur 11 Margdarshak, Vedika, Cashpor, Saija, Satin, Sonata, Annapurna,
Asirvad, Arohan, Basix, BFILNalanda 10 Vedika, Saija, Satin, Sonata, Annapurna, Arohan, Basix,
BFIL,CDOT, SVCLNawada 8 Vedika, Saija, Satin, Sonata, BMC, Arohan, BFIL, CDOTPatna 16 Margdarshak, Vedika, NEED, Saija, Satin, Annapurna, Asirvad,
Arohan, Basix, BFIL, CPSL, CDOT, Masscare, NBJK, SVCL, BOARD
Purnia 6 Saija, Satin, SMGBK, Village, Asirvad, BFILRohtas 5 Cashpor, Satin, Basix, BFIL, SVCLSaharsa 3 Asirvad, Arohan, BFILSamastipur 11 Margdarshak, Vedika, Saija, Satin, Sonata, Annapurna, Asirvad,
Arohan, Basix, BFIL, SaralaSaran 9 NEED, Cashpor, Saija, Satin, Sonata, Asirvad, Arohan, BFIL, SVCLSheohar 2 Arohan, CDOTSitamarhi 5 Margdarshak, Cashpor, Asirvad,Arohan, BFILSiwan 5 Cashpor, Satin, Asirvad, BFIL, SVCLSupaul 1 BFILVaishali 14 Margdarshak, Vedika, NEED, Cashpor, Saija, Satin, Sonata,
Annapurna, Asirvad, Arohan, Basix, BFIL, SVCL, UttrayanWest Cham-paran
7 Margdarshak, Cashpor, Satin, Sonata, Asirvad, Arohan, BFIL
Chandigarh (CH) Chandigarh 2 Satin, Asirvad
Chhattisgarh (CG)Balod 6 Spandana, Annapurna,Asirvad, BFIL, Grameen Koota, SvatantraBaloda Bazar 6 Samhita, Satin, Annapurna, Asirvad, BFIL, Svatantra
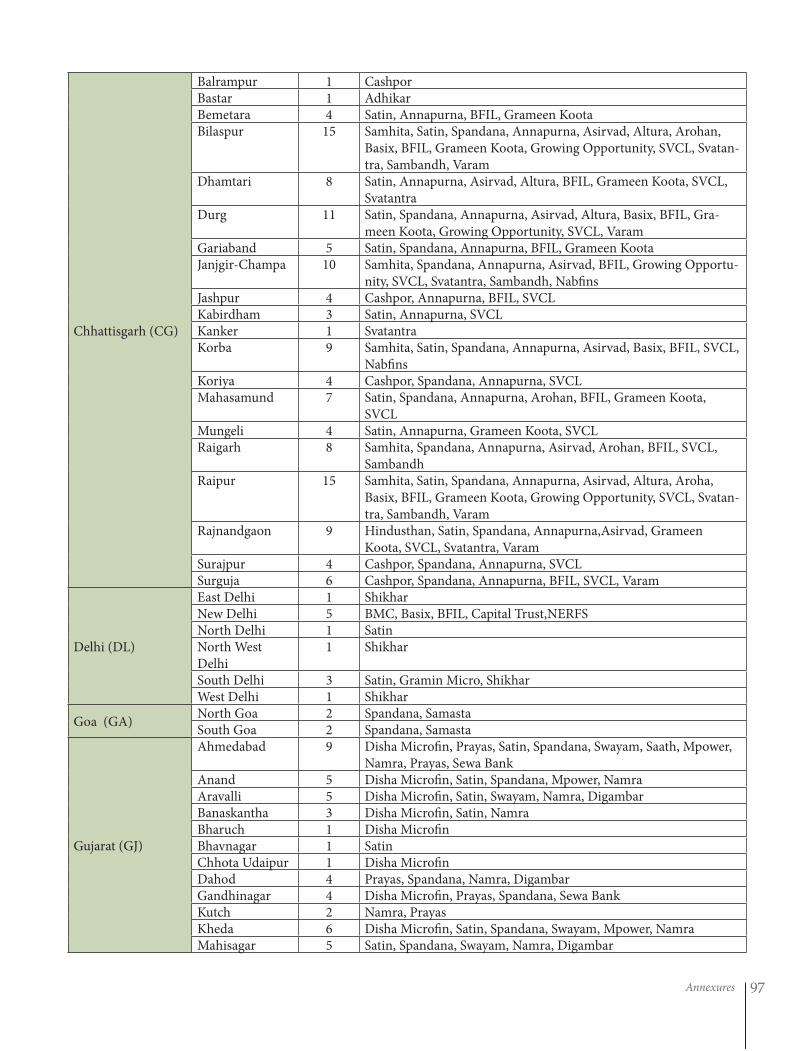
Annexures 97
Chhattisgarh (CG)
Balrampur 1 CashporBastar 1 AdhikarBemetara 4 Satin, Annapurna, BFIL, Grameen KootaBilaspur 15 Samhita, Satin, Spandana, Annapurna, Asirvad, Altura, Arohan,
Basix, BFIL, Grameen Koota, Growing Opportunity, SVCL, Svatan-tra, Sambandh, Varam
Dhamtari 8 Satin, Annapurna, Asirvad, Altura, BFIL, Grameen Koota, SVCL, Svatantra
Durg 11 Satin, Spandana, Annapurna, Asirvad, Altura, Basix, BFIL, Gra-meen Koota, Growing Opportunity, SVCL, Varam
Gariaband 5 Satin, Spandana, Annapurna, BFIL, Grameen KootaJanjgir-Champa 10 Samhita, Spandana, Annapurna, Asirvad, BFIL, Growing Opportu-
nity, SVCL, Svatantra, Sambandh, NabfinsJashpur 4 Cashpor, Annapurna, BFIL, SVCLKabirdham 3 Satin, Annapurna, SVCLKanker 1 SvatantraKorba 9 Samhita, Satin, Spandana, Annapurna, Asirvad, Basix, BFIL, SVCL,
NabfinsKoriya 4 Cashpor, Spandana, Annapurna, SVCLMahasamund 7 Satin, Spandana, Annapurna, Arohan, BFIL, Grameen Koota,
SVCLMungeli 4 Satin, Annapurna, Grameen Koota, SVCLRaigarh 8 Samhita, Spandana, Annapurna, Asirvad, Arohan, BFIL, SVCL,
SambandhRaipur 15 Samhita, Satin, Spandana, Annapurna, Asirvad, Altura, Aroha,
Basix, BFIL, Grameen Koota, Growing Opportunity, SVCL, Svatan-tra, Sambandh, Varam
Rajnandgaon 9 Hindusthan, Satin, Spandana, Annapurna,Asirvad, Grameen Koota, SVCL, Svatantra, Varam
Surajpur 4 Cashpor, Spandana, Annapurna, SVCLSurguja 6 Cashpor, Spandana, Annapurna, BFIL, SVCL, Varam
Delhi (DL)
East Delhi 1 ShikharNew Delhi 5 BMC, Basix, BFIL, Capital Trust,NERFSNorth Delhi 1 SatinNorth West Delhi
1 Shikhar
South Delhi 3 Satin, Gramin Micro, ShikharWest Delhi 1 Shikhar
Goa (GA) North Goa 2 Spandana, SamastaSouth Goa 2 Spandana, Samasta
Gujarat (GJ)
Ahmedabad 9 Disha Microfin, Prayas, Satin, Spandana, Swayam, Saath, Mpower, Namra, Prayas, Sewa Bank
Anand 5 Disha Microfin, Satin, Spandana, Mpower, NamraAravalli 5 Disha Microfin, Satin, Swayam, Namra, DigambarBanaskantha 3 Disha Microfin, Satin, NamraBharuch 1 Disha MicrofinBhavnagar 1 SatinChhota Udaipur 1 Disha MicrofinDahod 4 Prayas, Spandana, Namra, DigambarGandhinagar 4 Disha Microfin, Prayas, Spandana, Sewa BankKutch 2 Namra, PrayasKheda 6 Disha Microfin, Satin, Spandana, Swayam, Mpower, NamraMahisagar 5 Satin, Spandana, Swayam, Namra, Digambar
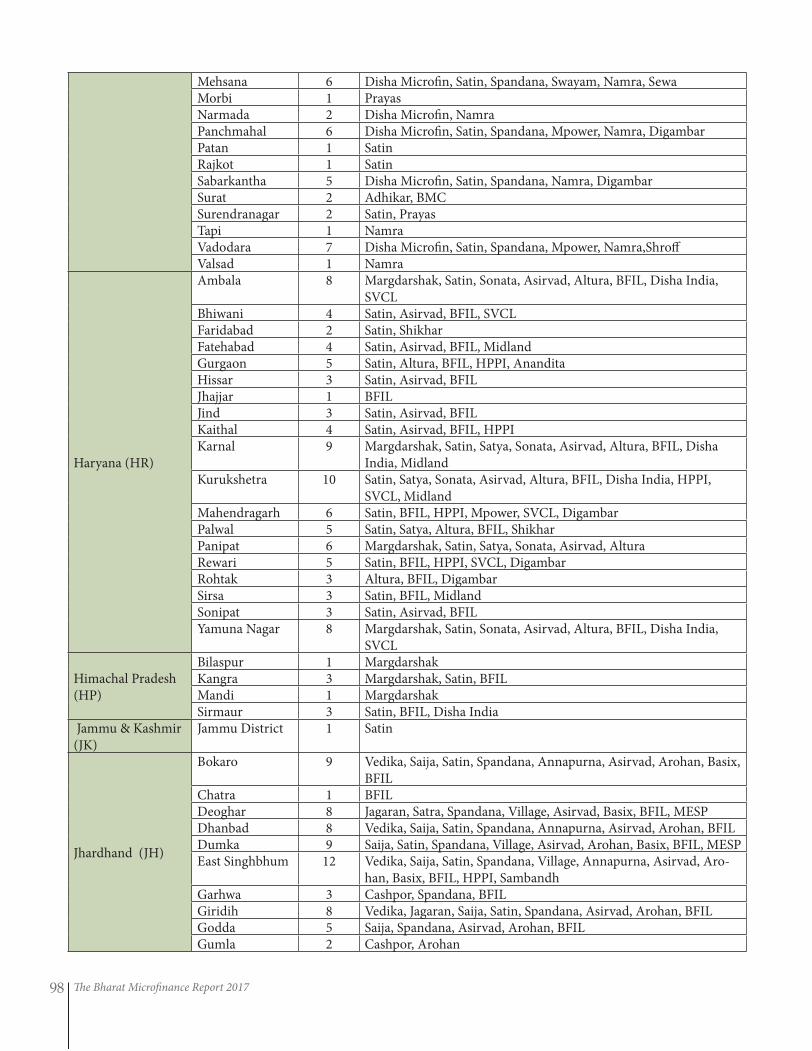
The Bharat Microfinance Report 201798
Mehsana 6 Disha Microfin, Satin, Spandana, Swayam, Namra, SewaMorbi 1 PrayasNarmada 2 Disha Microfin, NamraPanchmahal 6 Disha Microfin, Satin, Spandana, Mpower, Namra, DigambarPatan 1 SatinRajkot 1 SatinSabarkantha 5 Disha Microfin, Satin, Spandana, Namra, DigambarSurat 2 Adhikar, BMCSurendranagar 2 Satin, PrayasTapi 1 NamraVadodara 7 Disha Microfin, Satin, Spandana, Mpower, Namra,ShroffValsad 1 Namra
Haryana (HR)
Ambala 8 Margdarshak, Satin, Sonata, Asirvad, Altura, BFIL, Disha India, SVCL
Bhiwani 4 Satin, Asirvad, BFIL, SVCLFaridabad 2 Satin, ShikharFatehabad 4 Satin, Asirvad, BFIL, MidlandGurgaon 5 Satin, Altura, BFIL, HPPI, AnanditaHissar 3 Satin, Asirvad, BFILJhajjar 1 BFILJind 3 Satin, Asirvad, BFILKaithal 4 Satin, Asirvad, BFIL, HPPIKarnal 9 Margdarshak, Satin, Satya, Sonata, Asirvad, Altura, BFIL, Disha
India, MidlandKurukshetra 10 Satin, Satya, Sonata, Asirvad, Altura, BFIL, Disha India, HPPI,
SVCL, MidlandMahendragarh 6 Satin, BFIL, HPPI, Mpower, SVCL, DigambarPalwal 5 Satin, Satya, Altura, BFIL, ShikharPanipat 6 Margdarshak, Satin, Satya, Sonata, Asirvad, AlturaRewari 5 Satin, BFIL, HPPI, SVCL, DigambarRohtak 3 Altura, BFIL, DigambarSirsa 3 Satin, BFIL, MidlandSonipat 3 Satin, Asirvad, BFILYamuna Nagar 8 Margdarshak, Satin, Sonata, Asirvad, Altura, BFIL, Disha India,
SVCL
Himachal Pradesh (HP)
Bilaspur 1 MargdarshakKangra 3 Margdarshak, Satin, BFILMandi 1 MargdarshakSirmaur 3 Satin, BFIL, Disha India
Jammu & Kashmir (JK)
Jammu District 1 Satin
Jhardhand (JH)
Bokaro 9 Vedika, Saija, Satin, Spandana, Annapurna, Asirvad, Arohan, Basix, BFIL
Chatra 1 BFILDeoghar 8 Jagaran, Satra, Spandana, Village, Asirvad, Basix, BFIL, MESPDhanbad 8 Vedika, Saija, Satin, Spandana, Annapurna, Asirvad, Arohan, BFILDumka 9 Saija, Satin, Spandana, Village, Asirvad, Arohan, Basix, BFIL, MESPEast Singhbhum 12 Vedika, Saija, Satin, Spandana, Village, Annapurna, Asirvad, Aro-
han, Basix, BFIL, HPPI, SambandhGarhwa 3 Cashpor, Spandana, BFILGiridih 8 Vedika, Jagaran, Saija, Satin, Spandana, Asirvad, Arohan, BFILGodda 5 Saija, Spandana, Asirvad, Arohan, BFILGumla 2 Cashpor, Arohan
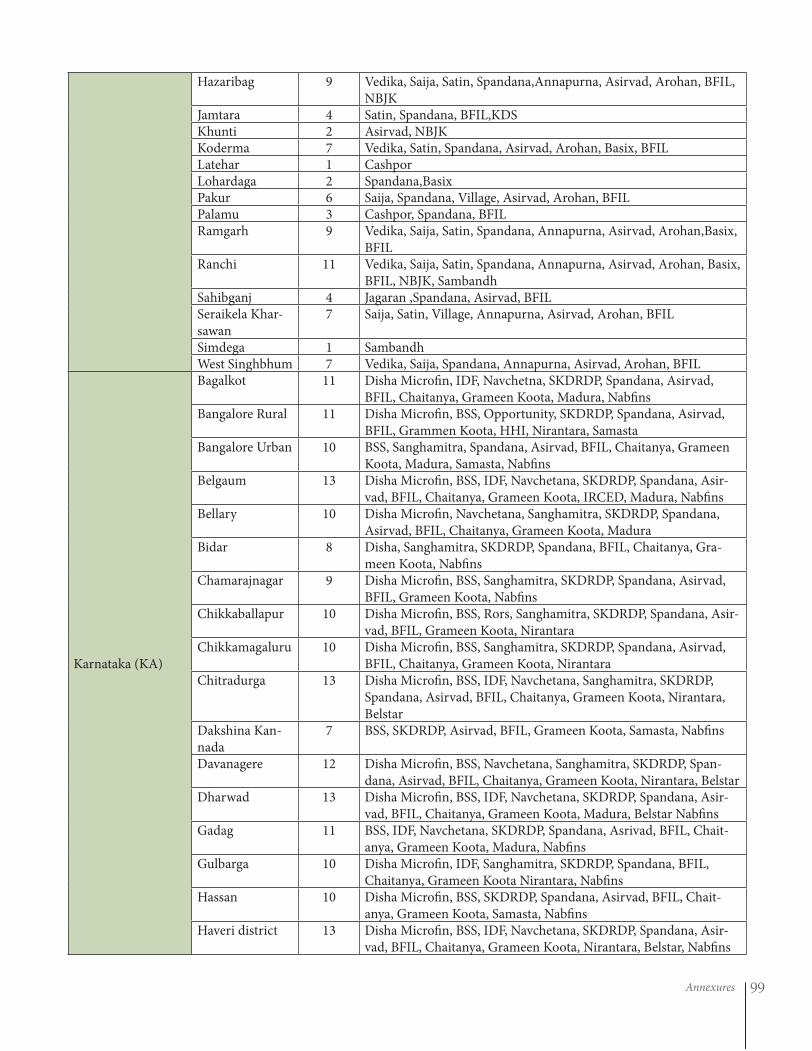
Annexures 99
Hazaribag 9 Vedika, Saija, Satin, Spandana,Annapurna, Asirvad, Arohan, BFIL, NBJK
Jamtara 4 Satin, Spandana, BFIL,KDSKhunti 2 Asirvad, NBJKKoderma 7 Vedika, Satin, Spandana, Asirvad, Arohan, Basix, BFILLatehar 1 CashporLohardaga 2 Spandana,BasixPakur 6 Saija, Spandana, Village, Asirvad, Arohan, BFILPalamu 3 Cashpor, Spandana, BFILRamgarh 9 Vedika, Saija, Satin, Spandana, Annapurna, Asirvad, Arohan,Basix,
BFILRanchi 11 Vedika, Saija, Satin, Spandana, Annapurna, Asirvad, Arohan, Basix,
BFIL, NBJK, SambandhSahibganj 4 Jagaran ,Spandana, Asirvad, BFILSeraikela Khar-sawan
7 Saija, Satin, Village, Annapurna, Asirvad, Arohan, BFIL
Simdega 1 SambandhWest Singhbhum 7 Vedika, Saija, Spandana, Annapurna, Asirvad, Arohan, BFIL
Karnataka (KA)
Bagalkot 11 Disha Microfin, IDF, Navchetna, SKDRDP, Spandana, Asirvad, BFIL, Chaitanya, Grameen Koota, Madura, Nabfins
Bangalore Rural 11 Disha Microfin, BSS, Opportunity, SKDRDP, Spandana, Asirvad, BFIL, Grammen Koota, HHI, Nirantara, Samasta
Bangalore Urban 10 BSS, Sanghamitra, Spandana, Asirvad, BFIL, Chaitanya, Grameen Koota, Madura, Samasta, Nabfins
Belgaum 13 Disha Microfin, BSS, IDF, Navchetana, SKDRDP, Spandana, Asir-vad, BFIL, Chaitanya, Grameen Koota, IRCED, Madura, Nabfins
Bellary 10 Disha Microfin, Navchetana, Sanghamitra, SKDRDP, Spandana, Asirvad, BFIL, Chaitanya, Grameen Koota, Madura
Bidar 8 Disha, Sanghamitra, SKDRDP, Spandana, BFIL, Chaitanya, Gra-meen Koota, Nabfins
Chamarajnagar 9 Disha Microfin, BSS, Sanghamitra, SKDRDP, Spandana, Asirvad, BFIL, Grameen Koota, Nabfins
Chikkaballapur 10 Disha Microfin, BSS, Rors, Sanghamitra, SKDRDP, Spandana, Asir-vad, BFIL, Grameen Koota, Nirantara
Chikkamagaluru 10 Disha Microfin, BSS, Sanghamitra, SKDRDP, Spandana, Asirvad, BFIL, Chaitanya, Grameen Koota, Nirantara
Chitradurga 13 Disha Microfin, BSS, IDF, Navchetana, Sanghamitra, SKDRDP, Spandana, Asirvad, BFIL, Chaitanya, Grameen Koota, Nirantara, Belstar
Dakshina Kan-nada
7 BSS, SKDRDP, Asirvad, BFIL, Grameen Koota, Samasta, Nabfins
Davanagere 12 Disha Microfin, BSS, Navchetana, Sanghamitra, SKDRDP, Span-dana, Asirvad, BFIL, Chaitanya, Grameen Koota, Nirantara, Belstar
Dharwad 13 Disha Microfin, BSS, IDF, Navchetana, SKDRDP, Spandana, Asir-vad, BFIL, Chaitanya, Grameen Koota, Madura, Belstar Nabfins
Gadag 11 BSS, IDF, Navchetana, SKDRDP, Spandana, Asrivad, BFIL, Chait-anya, Grameen Koota, Madura, Nabfins
Gulbarga 10 Disha Microfin, IDF, Sanghamitra, SKDRDP, Spandana, BFIL, Chaitanya, Grameen Koota Nirantara, Nabfins
Hassan 10 Disha Microfin, BSS, SKDRDP, Spandana, Asirvad, BFIL, Chait-anya, Grameen Koota, Samasta, Nabfins
Haveri district 13 Disha Microfin, BSS, IDF, Navchetana, SKDRDP, Spandana, Asir-vad, BFIL, Chaitanya, Grameen Koota, Nirantara, Belstar, Nabfins
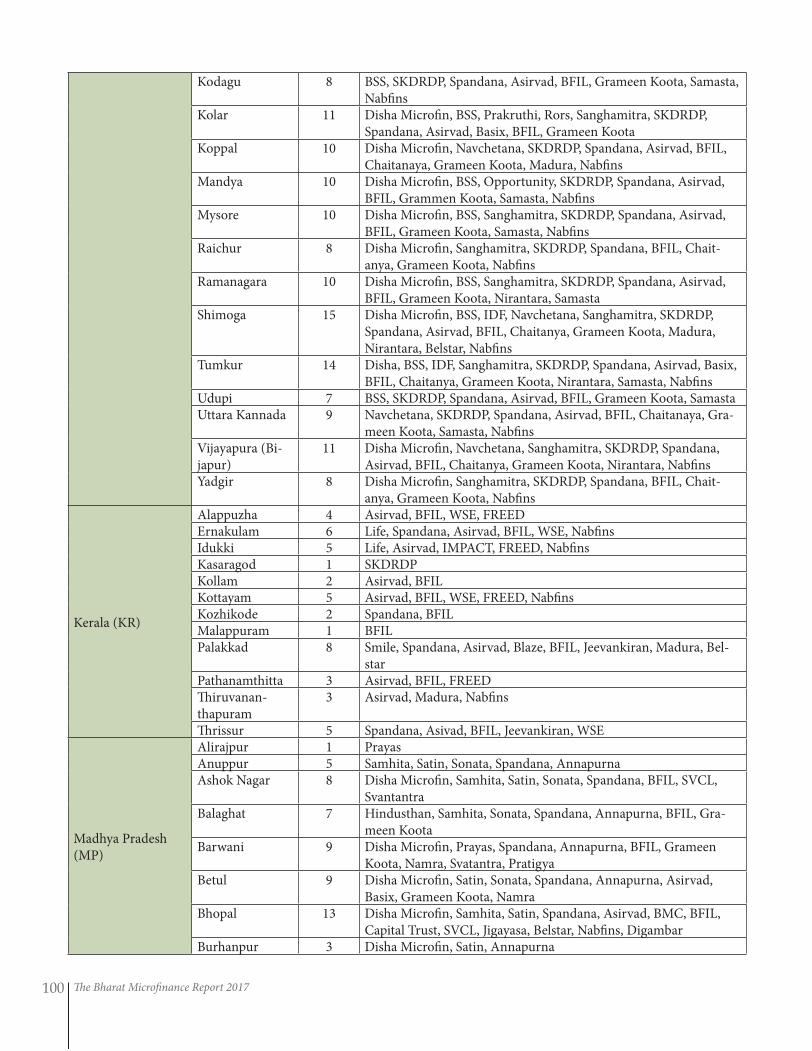
The Bharat Microfinance Report 2017100
Kodagu 8 BSS, SKDRDP, Spandana, Asirvad, BFIL, Grameen Koota, Samasta, Nabfins
Kolar 11 Disha Microfin, BSS, Prakruthi, Rors, Sanghamitra, SKDRDP, Spandana, Asirvad, Basix, BFIL, Grameen Koota
Koppal 10 Disha Microfin, Navchetana, SKDRDP, Spandana, Asirvad, BFIL, Chaitanaya, Grameen Koota, Madura, Nabfins
Mandya 10 Disha Microfin, BSS, Opportunity, SKDRDP, Spandana, Asirvad, BFIL, Grammen Koota, Samasta, Nabfins
Mysore 10 Disha Microfin, BSS, Sanghamitra, SKDRDP, Spandana, Asirvad, BFIL, Grameen Koota, Samasta, Nabfins
Raichur 8 Disha Microfin, Sanghamitra, SKDRDP, Spandana, BFIL, Chait-anya, Grameen Koota, Nabfins
Ramanagara 10 Disha Microfin, BSS, Sanghamitra, SKDRDP, Spandana, Asirvad, BFIL, Grameen Koota, Nirantara, Samasta
Shimoga 15 Disha Microfin, BSS, IDF, Navchetana, Sanghamitra, SKDRDP, Spandana, Asirvad, BFIL, Chaitanya, Grameen Koota, Madura, Nirantara, Belstar, Nabfins
Tumkur 14 Disha, BSS, IDF, Sanghamitra, SKDRDP, Spandana, Asirvad, Basix, BFIL, Chaitanya, Grameen Koota, Nirantara, Samasta, Nabfins
Udupi 7 BSS, SKDRDP, Spandana, Asirvad, BFIL, Grameen Koota, SamastaUttara Kannada 9 Navchetana, SKDRDP, Spandana, Asirvad, BFIL, Chaitanaya, Gra-
meen Koota, Samasta, NabfinsVijayapura (Bi-japur)
11 Disha Microfin, Navchetana, Sanghamitra, SKDRDP, Spandana, Asirvad, BFIL, Chaitanya, Grameen Koota, Nirantara, Nabfins
Yadgir 8 Disha Microfin, Sanghamitra, SKDRDP, Spandana, BFIL, Chait-anya, Grameen Koota, Nabfins
Kerala (KR)
Alappuzha 4 Asirvad, BFIL, WSE, FREEDErnakulam 6 Life, Spandana, Asirvad, BFIL, WSE, NabfinsIdukki 5 Life, Asirvad, IMPACT, FREED, NabfinsKasaragod 1 SKDRDPKollam 2 Asirvad, BFILKottayam 5 Asirvad, BFIL, WSE, FREED, NabfinsKozhikode 2 Spandana, BFILMalappuram 1 BFILPalakkad 8 Smile, Spandana, Asirvad, Blaze, BFIL, Jeevankiran, Madura, Bel-
starPathanamthitta 3 Asirvad, BFIL, FREEDThiruvanan-thapuram
3 Asirvad, Madura, Nabfins
Thrissur 5 Spandana, Asivad, BFIL, Jeevankiran, WSE
Madhya Pradesh (MP)
Alirajpur 1 PrayasAnuppur 5 Samhita, Satin, Sonata, Spandana, AnnapurnaAshok Nagar 8 Disha Microfin, Samhita, Satin, Sonata, Spandana, BFIL, SVCL,
SvantantraBalaghat 7 Hindusthan, Samhita, Sonata, Spandana, Annapurna, BFIL, Gra-
meen KootaBarwani 9 Disha Microfin, Prayas, Spandana, Annapurna, BFIL, Grameen
Koota, Namra, Svatantra, PratigyaBetul 9 Disha Microfin, Satin, Sonata, Spandana, Annapurna, Asirvad,
Basix, Grameen Koota, NamraBhopal 13 Disha Microfin, Samhita, Satin, Spandana, Asirvad, BMC, BFIL,
Capital Trust, SVCL, Jigayasa, Belstar, Nabfins, DigambarBurhanpur 3 Disha Microfin, Satin, Annapurna
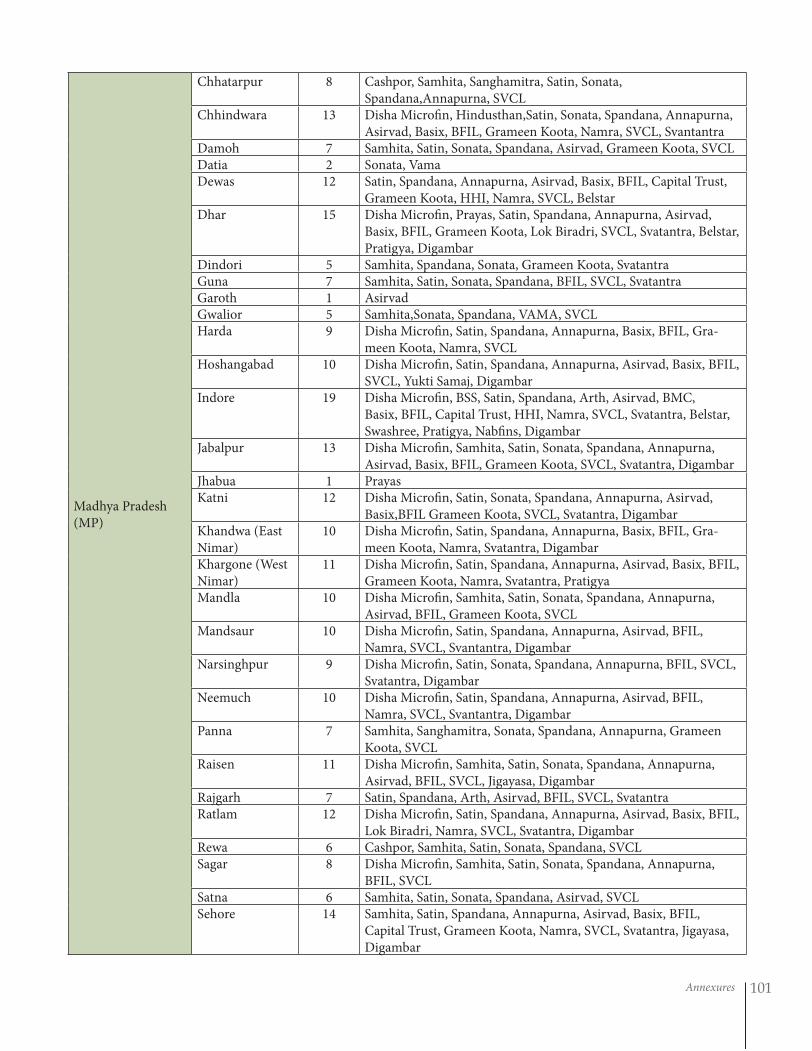
Annexures 101
Madhya Pradesh (MP)
Chhatarpur 8 Cashpor, Samhita, Sanghamitra, Satin, Sonata, Spandana,Annapurna, SVCL
Chhindwara 13 Disha Microfin, Hindusthan,Satin, Sonata, Spandana, Annapurna, Asirvad, Basix, BFIL, Grameen Koota, Namra, SVCL, Svantantra
Damoh 7 Samhita, Satin, Sonata, Spandana, Asirvad, Grameen Koota, SVCLDatia 2 Sonata, VamaDewas 12 Satin, Spandana, Annapurna, Asirvad, Basix, BFIL, Capital Trust,
Grameen Koota, HHI, Namra, SVCL, BelstarDhar 15 Disha Microfin, Prayas, Satin, Spandana, Annapurna, Asirvad,
Basix, BFIL, Grameen Koota, Lok Biradri, SVCL, Svatantra, Belstar, Pratigya, Digambar
Dindori 5 Samhita, Spandana, Sonata, Grameen Koota, SvatantraGuna 7 Samhita, Satin, Sonata, Spandana, BFIL, SVCL, SvatantraGaroth 1 AsirvadGwalior 5 Samhita,Sonata, Spandana, VAMA, SVCLHarda 9 Disha Microfin, Satin, Spandana, Annapurna, Basix, BFIL, Gra-
meen Koota, Namra, SVCLHoshangabad 10 Disha Microfin, Satin, Spandana, Annapurna, Asirvad, Basix, BFIL,
SVCL, Yukti Samaj, DigambarIndore 19 Disha Microfin, BSS, Satin, Spandana, Arth, Asirvad, BMC,
Basix, BFIL, Capital Trust, HHI, Namra, SVCL, Svatantra, Belstar, Swashree, Pratigya, Nabfins, Digambar
Jabalpur 13 Disha Microfin, Samhita, Satin, Sonata, Spandana, Annapurna, Asirvad, Basix, BFIL, Grameen Koota, SVCL, Svatantra, Digambar
Jhabua 1 PrayasKatni 12 Disha Microfin, Satin, Sonata, Spandana, Annapurna, Asirvad,
Basix,BFIL Grameen Koota, SVCL, Svatantra, DigambarKhandwa (East Nimar)
10 Disha Microfin, Satin, Spandana, Annapurna, Basix, BFIL, Gra-meen Koota, Namra, Svatantra, Digambar
Khargone (West Nimar)
11 Disha Microfin, Satin, Spandana, Annapurna, Asirvad, Basix, BFIL, Grameen Koota, Namra, Svatantra, Pratigya
Mandla 10 Disha Microfin, Samhita, Satin, Sonata, Spandana, Annapurna, Asirvad, BFIL, Grameen Koota, SVCL
Mandsaur 10 Disha Microfin, Satin, Spandana, Annapurna, Asirvad, BFIL, Namra, SVCL, Svantantra, Digambar
Narsinghpur 9 Disha Microfin, Satin, Sonata, Spandana, Annapurna, BFIL, SVCL, Svatantra, Digambar
Neemuch 10 Disha Microfin, Satin, Spandana, Annapurna, Asirvad, BFIL, Namra, SVCL, Svantantra, Digambar
Panna 7 Samhita, Sanghamitra, Sonata, Spandana, Annapurna, Grameen Koota, SVCL
Raisen 11 Disha Microfin, Samhita, Satin, Sonata, Spandana, Annapurna, Asirvad, BFIL, SVCL, Jigayasa, Digambar
Rajgarh 7 Satin, Spandana, Arth, Asirvad, BFIL, SVCL, SvatantraRatlam 12 Disha Microfin, Satin, Spandana, Annapurna, Asirvad, Basix, BFIL,
Lok Biradri, Namra, SVCL, Svatantra, DigambarRewa 6 Cashpor, Samhita, Satin, Sonata, Spandana, SVCLSagar 8 Disha Microfin, Samhita, Satin, Sonata, Spandana, Annapurna,
BFIL, SVCLSatna 6 Samhita, Satin, Sonata, Spandana, Asirvad, SVCLSehore 14 Samhita, Satin, Spandana, Annapurna, Asirvad, Basix, BFIL,
Capital Trust, Grameen Koota, Namra, SVCL, Svatantra, Jigayasa, Digambar
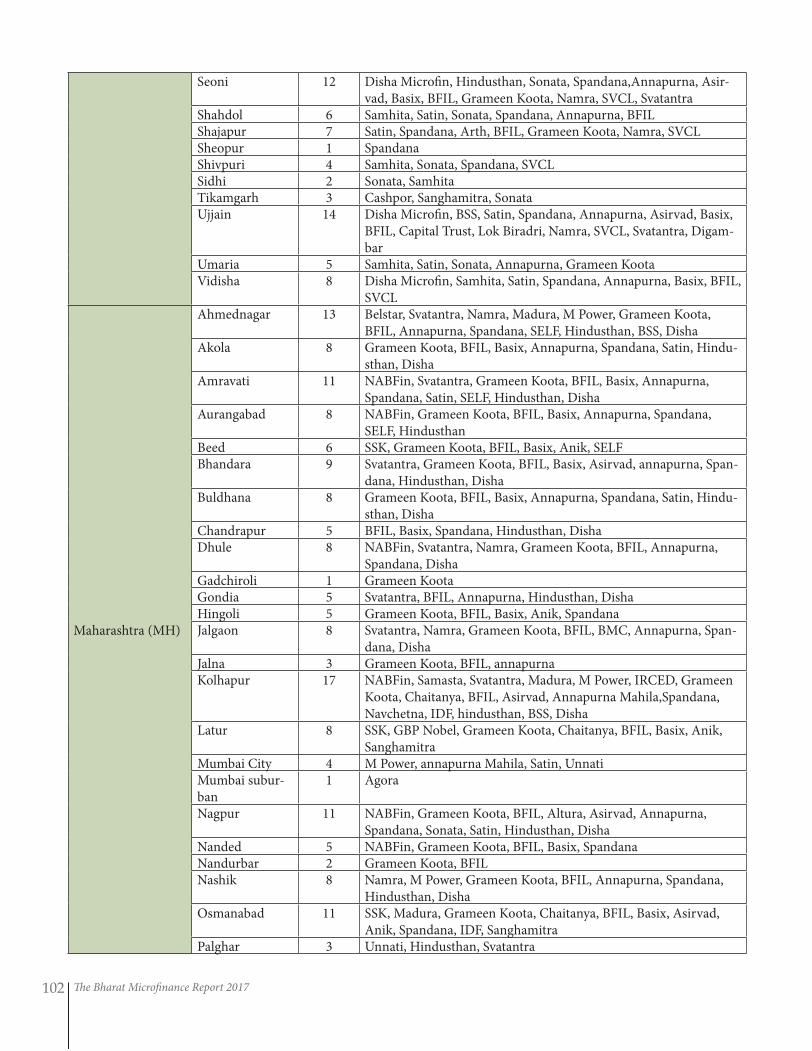
The Bharat Microfinance Report 2017102
Seoni 12 Disha Microfin, Hindusthan, Sonata, Spandana,Annapurna, Asir-vad, Basix, BFIL, Grameen Koota, Namra, SVCL, Svatantra
Shahdol 6 Samhita, Satin, Sonata, Spandana, Annapurna, BFILShajapur 7 Satin, Spandana, Arth, BFIL, Grameen Koota, Namra, SVCLSheopur 1 SpandanaShivpuri 4 Samhita, Sonata, Spandana, SVCLSidhi 2 Sonata, SamhitaTikamgarh 3 Cashpor, Sanghamitra, SonataUjjain 14 Disha Microfin, BSS, Satin, Spandana, Annapurna, Asirvad, Basix,
BFIL, Capital Trust, Lok Biradri, Namra, SVCL, Svatantra, Digam-bar
Umaria 5 Samhita, Satin, Sonata, Annapurna, Grameen KootaVidisha 8 Disha Microfin, Samhita, Satin, Spandana, Annapurna, Basix, BFIL,
SVCL
Maharashtra (MH)
Ahmednagar 13 Belstar, Svatantra, Namra, Madura, M Power, Grameen Koota, BFIL, Annapurna, Spandana, SELF, Hindusthan, BSS, Disha
Akola 8 Grameen Koota, BFIL, Basix, Annapurna, Spandana, Satin, Hindu-sthan, Disha
Amravati 11 NABFin, Svatantra, Grameen Koota, BFIL, Basix, Annapurna, Spandana, Satin, SELF, Hindusthan, Disha
Aurangabad 8 NABFin, Grameen Koota, BFIL, Basix, Annapurna, Spandana, SELF, Hindusthan
Beed 6 SSK, Grameen Koota, BFIL, Basix, Anik, SELFBhandara 9 Svatantra, Grameen Koota, BFIL, Basix, Asirvad, annapurna, Span-
dana, Hindusthan, DishaBuldhana 8 Grameen Koota, BFIL, Basix, Annapurna, Spandana, Satin, Hindu-
sthan, DishaChandrapur 5 BFIL, Basix, Spandana, Hindusthan, DishaDhule 8 NABFin, Svatantra, Namra, Grameen Koota, BFIL, Annapurna,
Spandana, DishaGadchiroli 1 Grameen KootaGondia 5 Svatantra, BFIL, Annapurna, Hindusthan, DishaHingoli 5 Grameen Koota, BFIL, Basix, Anik, SpandanaJalgaon 8 Svatantra, Namra, Grameen Koota, BFIL, BMC, Annapurna, Span-
dana, DishaJalna 3 Grameen Koota, BFIL, annapurnaKolhapur 17 NABFin, Samasta, Svatantra, Madura, M Power, IRCED, Grameen
Koota, Chaitanya, BFIL, Asirvad, Annapurna Mahila,Spandana, Navchetna, IDF, hindusthan, BSS, Disha
Latur 8 SSK, GBP Nobel, Grameen Koota, Chaitanya, BFIL, Basix, Anik, Sanghamitra
Mumbai City 4 M Power, annapurna Mahila, Satin, UnnatiMumbai subur-ban
1 Agora
Nagpur 11 NABFin, Grameen Koota, BFIL, Altura, Asirvad, Annapurna, Spandana, Sonata, Satin, Hindusthan, Disha
Nanded 5 NABFin, Grameen Koota, BFIL, Basix, SpandanaNandurbar 2 Grameen Koota, BFILNashik 8 Namra, M Power, Grameen Koota, BFIL, Annapurna, Spandana,
Hindusthan, DishaOsmanabad 11 SSK, Madura, Grameen Koota, Chaitanya, BFIL, Basix, Asirvad,
Anik, Spandana, IDF, SanghamitraPalghar 3 Unnati, Hindusthan, Svatantra
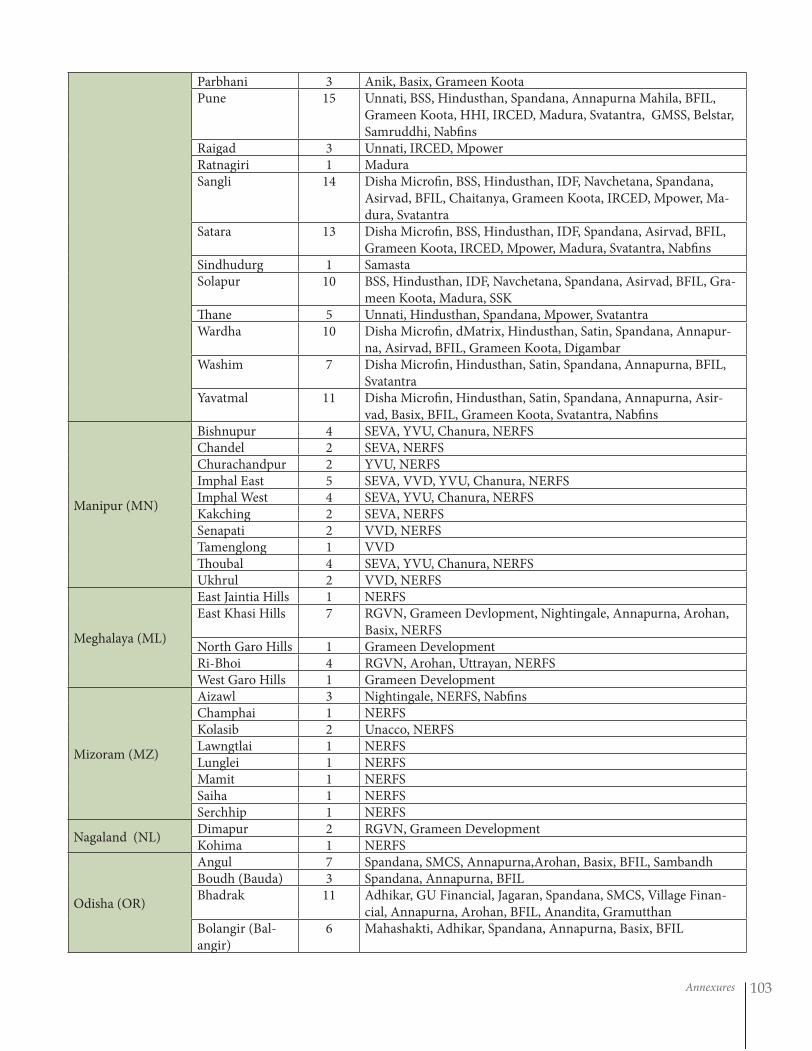
Annexures 103
Parbhani 3 Anik, Basix, Grameen KootaPune 15 Unnati, BSS, Hindusthan, Spandana, Annapurna Mahila, BFIL,
Grameen Koota, HHI, IRCED, Madura, Svatantra, GMSS, Belstar, Samruddhi, Nabfins
Raigad 3 Unnati, IRCED, MpowerRatnagiri 1 MaduraSangli 14 Disha Microfin, BSS, Hindusthan, IDF, Navchetana, Spandana,
Asirvad, BFIL, Chaitanya, Grameen Koota, IRCED, Mpower, Ma-dura, Svatantra
Satara 13 Disha Microfin, BSS, Hindusthan, IDF, Spandana, Asirvad, BFIL, Grameen Koota, IRCED, Mpower, Madura, Svatantra, Nabfins
Sindhudurg 1 SamastaSolapur 10 BSS, Hindusthan, IDF, Navchetana, Spandana, Asirvad, BFIL, Gra-
meen Koota, Madura, SSKThane 5 Unnati, Hindusthan, Spandana, Mpower, SvatantraWardha 10 Disha Microfin, dMatrix, Hindusthan, Satin, Spandana, Annapur-
na, Asirvad, BFIL, Grameen Koota, DigambarWashim 7 Disha Microfin, Hindusthan, Satin, Spandana, Annapurna, BFIL,
SvatantraYavatmal 11 Disha Microfin, Hindusthan, Satin, Spandana, Annapurna, Asir-
vad, Basix, BFIL, Grameen Koota, Svatantra, Nabfins
Manipur (MN)
Bishnupur 4 SEVA, YVU, Chanura, NERFSChandel 2 SEVA, NERFSChurachandpur 2 YVU, NERFSImphal East 5 SEVA, VVD, YVU, Chanura, NERFSImphal West 4 SEVA, YVU, Chanura, NERFSKakching 2 SEVA, NERFSSenapati 2 VVD, NERFSTamenglong 1 VVDThoubal 4 SEVA, YVU, Chanura, NERFSUkhrul 2 VVD, NERFS
Meghalaya (ML)
East Jaintia Hills 1 NERFSEast Khasi Hills 7 RGVN, Grameen Devlopment, Nightingale, Annapurna, Arohan,
Basix, NERFSNorth Garo Hills 1 Grameen DevelopmentRi-Bhoi 4 RGVN, Arohan, Uttrayan, NERFSWest Garo Hills 1 Grameen Development
Mizoram (MZ)
Aizawl 3 Nightingale, NERFS, NabfinsChamphai 1 NERFSKolasib 2 Unacco, NERFSLawngtlai 1 NERFSLunglei 1 NERFSMamit 1 NERFSSaiha 1 NERFSSerchhip 1 NERFS
Nagaland (NL) Dimapur 2 RGVN, Grameen DevelopmentKohima 1 NERFS
Odisha (OR)
Angul 7 Spandana, SMCS, Annapurna,Arohan, Basix, BFIL, SambandhBoudh (Bauda) 3 Spandana, Annapurna, BFILBhadrak 11 Adhikar, GU Financial, Jagaran, Spandana, SMCS, Village Finan-
cial, Annapurna, Arohan, BFIL, Anandita, GramutthanBolangir (Bal-angir)
6 Mahashakti, Adhikar, Spandana, Annapurna, Basix, BFIL
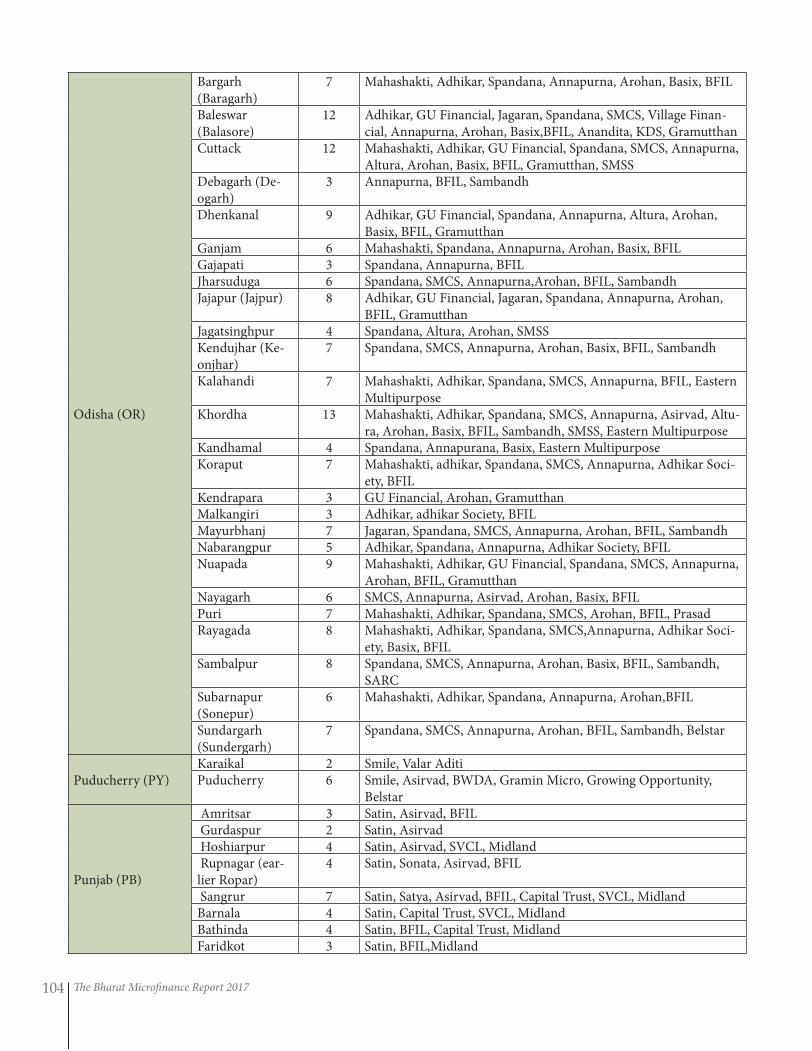
The Bharat Microfinance Report 2017104
Odisha (OR)
Bargarh (Baragarh)
7 Mahashakti, Adhikar, Spandana, Annapurna, Arohan, Basix, BFIL
Baleswar (Balasore)
12 Adhikar, GU Financial, Jagaran, Spandana, SMCS, Village Finan-cial, Annapurna, Arohan, Basix,BFIL, Anandita, KDS, Gramutthan
Cuttack 12 Mahashakti, Adhikar, GU Financial, Spandana, SMCS, Annapurna, Altura, Arohan, Basix, BFIL, Gramutthan, SMSS
Debagarh (De-ogarh)
3 Annapurna, BFIL, Sambandh
Dhenkanal 9 Adhikar, GU Financial, Spandana, Annapurna, Altura, Arohan, Basix, BFIL, Gramutthan
Ganjam 6 Mahashakti, Spandana, Annapurna, Arohan, Basix, BFILGajapati 3 Spandana, Annapurna, BFILJharsuduga 6 Spandana, SMCS, Annapurna,Arohan, BFIL, SambandhJajapur (Jajpur) 8 Adhikar, GU Financial, Jagaran, Spandana, Annapurna, Arohan,
BFIL, GramutthanJagatsinghpur 4 Spandana, Altura, Arohan, SMSSKendujhar (Ke-onjhar)
7 Spandana, SMCS, Annapurna, Arohan, Basix, BFIL, Sambandh
Kalahandi 7 Mahashakti, Adhikar, Spandana, SMCS, Annapurna, BFIL, Eastern Multipurpose
Khordha 13 Mahashakti, Adhikar, Spandana, SMCS, Annapurna, Asirvad, Altu-ra, Arohan, Basix, BFIL, Sambandh, SMSS, Eastern Multipurpose
Kandhamal 4 Spandana, Annapurana, Basix, Eastern MultipurposeKoraput 7 Mahashakti, adhikar, Spandana, SMCS, Annapurna, Adhikar Soci-
ety, BFILKendrapara 3 GU Financial, Arohan, GramutthanMalkangiri 3 Adhikar, adhikar Society, BFILMayurbhanj 7 Jagaran, Spandana, SMCS, Annapurna, Arohan, BFIL, SambandhNabarangpur 5 Adhikar, Spandana, Annapurna, Adhikar Society, BFILNuapada 9 Mahashakti, Adhikar, GU Financial, Spandana, SMCS, Annapurna,
Arohan, BFIL, GramutthanNayagarh 6 SMCS, Annapurna, Asirvad, Arohan, Basix, BFILPuri 7 Mahashakti, Adhikar, Spandana, SMCS, Arohan, BFIL, PrasadRayagada 8 Mahashakti, Adhikar, Spandana, SMCS,Annapurna, Adhikar Soci-
ety, Basix, BFILSambalpur 8 Spandana, SMCS, Annapurna, Arohan, Basix, BFIL, Sambandh,
SARCSubarnapur (Sonepur)
6 Mahashakti, Adhikar, Spandana, Annapurna, Arohan,BFIL
Sundargarh (Sundergarh)
7 Spandana, SMCS, Annapurna, Arohan, BFIL, Sambandh, Belstar
Puducherry (PY) Karaikal 2 Smile, Valar AditiPuducherry 6 Smile, Asirvad, BWDA, Gramin Micro, Growing Opportunity,
Belstar
Punjab (PB)
Amritsar 3 Satin, Asirvad, BFIL Gurdaspur 2 Satin, Asirvad Hoshiarpur 4 Satin, Asirvad, SVCL, Midland Rupnagar (ear-lier Ropar)
4 Satin, Sonata, Asirvad, BFIL
Sangrur 7 Satin, Satya, Asirvad, BFIL, Capital Trust, SVCL, MidlandBarnala 4 Satin, Capital Trust, SVCL, MidlandBathinda 4 Satin, BFIL, Capital Trust, MidlandFaridkot 3 Satin, BFIL,Midland
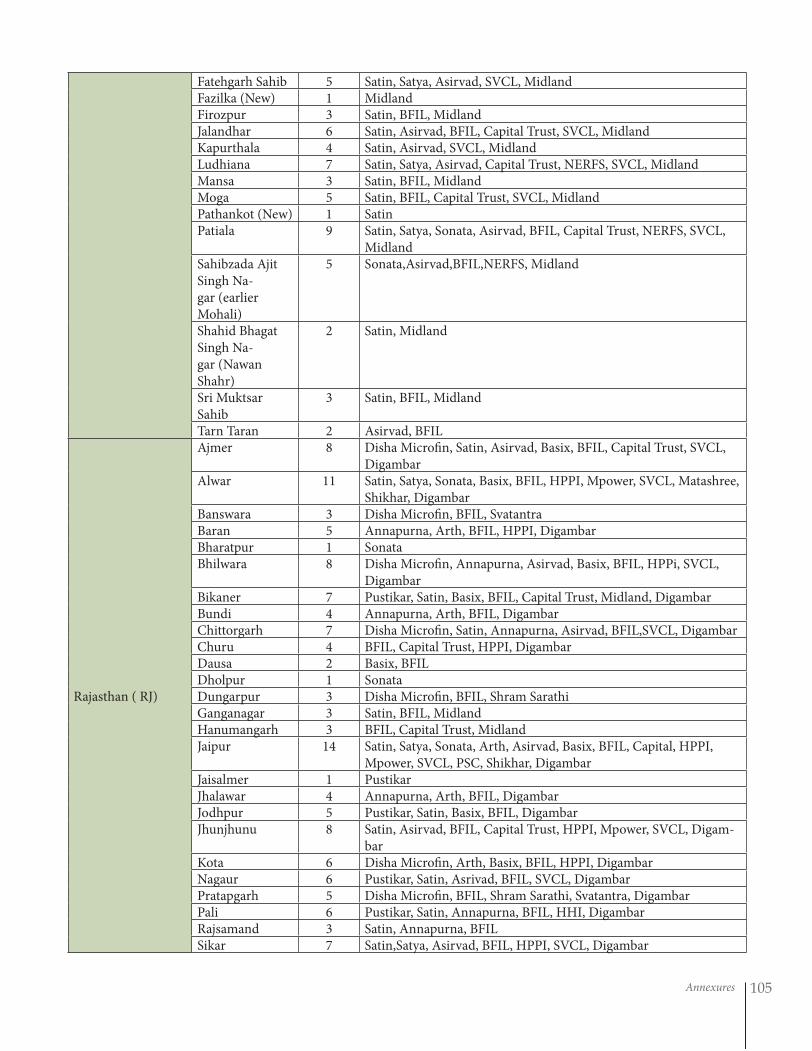
Annexures 105
Fatehgarh Sahib 5 Satin, Satya, Asirvad, SVCL, MidlandFazilka (New) 1 MidlandFirozpur 3 Satin, BFIL, MidlandJalandhar 6 Satin, Asirvad, BFIL, Capital Trust, SVCL, MidlandKapurthala 4 Satin, Asirvad, SVCL, MidlandLudhiana 7 Satin, Satya, Asirvad, Capital Trust, NERFS, SVCL, MidlandMansa 3 Satin, BFIL, MidlandMoga 5 Satin, BFIL, Capital Trust, SVCL, MidlandPathankot (New) 1 SatinPatiala 9 Satin, Satya, Sonata, Asirvad, BFIL, Capital Trust, NERFS, SVCL,
MidlandSahibzada Ajit Singh Na-gar (earlier Mohali)
5 Sonata,Asirvad,BFIL,NERFS, Midland
Shahid Bhagat Singh Na-gar (Nawan Shahr)
2 Satin, Midland
Sri Muktsar Sahib
3 Satin, BFIL, Midland
Tarn Taran 2 Asirvad, BFIL
Rajasthan ( RJ)
Ajmer 8 Disha Microfin, Satin, Asirvad, Basix, BFIL, Capital Trust, SVCL, Digambar
Alwar 11 Satin, Satya, Sonata, Basix, BFIL, HPPI, Mpower, SVCL, Matashree, Shikhar, Digambar
Banswara 3 Disha Microfin, BFIL, SvatantraBaran 5 Annapurna, Arth, BFIL, HPPI, DigambarBharatpur 1 SonataBhilwara 8 Disha Microfin, Annapurna, Asirvad, Basix, BFIL, HPPi, SVCL,
DigambarBikaner 7 Pustikar, Satin, Basix, BFIL, Capital Trust, Midland, DigambarBundi 4 Annapurna, Arth, BFIL, DigambarChittorgarh 7 Disha Microfin, Satin, Annapurna, Asirvad, BFIL,SVCL, DigambarChuru 4 BFIL, Capital Trust, HPPI, DigambarDausa 2 Basix, BFILDholpur 1 SonataDungarpur 3 Disha Microfin, BFIL, Shram SarathiGanganagar 3 Satin, BFIL, MidlandHanumangarh 3 BFIL, Capital Trust, MidlandJaipur 14 Satin, Satya, Sonata, Arth, Asirvad, Basix, BFIL, Capital, HPPI,
Mpower, SVCL, PSC, Shikhar, DigambarJaisalmer 1 PustikarJhalawar 4 Annapurna, Arth, BFIL, DigambarJodhpur 5 Pustikar, Satin, Basix, BFIL, DigambarJhunjhunu 8 Satin, Asirvad, BFIL, Capital Trust, HPPI, Mpower, SVCL, Digam-
barKota 6 Disha Microfin, Arth, Basix, BFIL, HPPI, DigambarNagaur 6 Pustikar, Satin, Asrivad, BFIL, SVCL, DigambarPratapgarh 5 Disha Microfin, BFIL, Shram Sarathi, Svatantra, DigambarPali 6 Pustikar, Satin, Annapurna, BFIL, HHI, DigambarRajsamand 3 Satin, Annapurna, BFILSikar 7 Satin,Satya, Asirvad, BFIL, HPPI, SVCL, Digambar
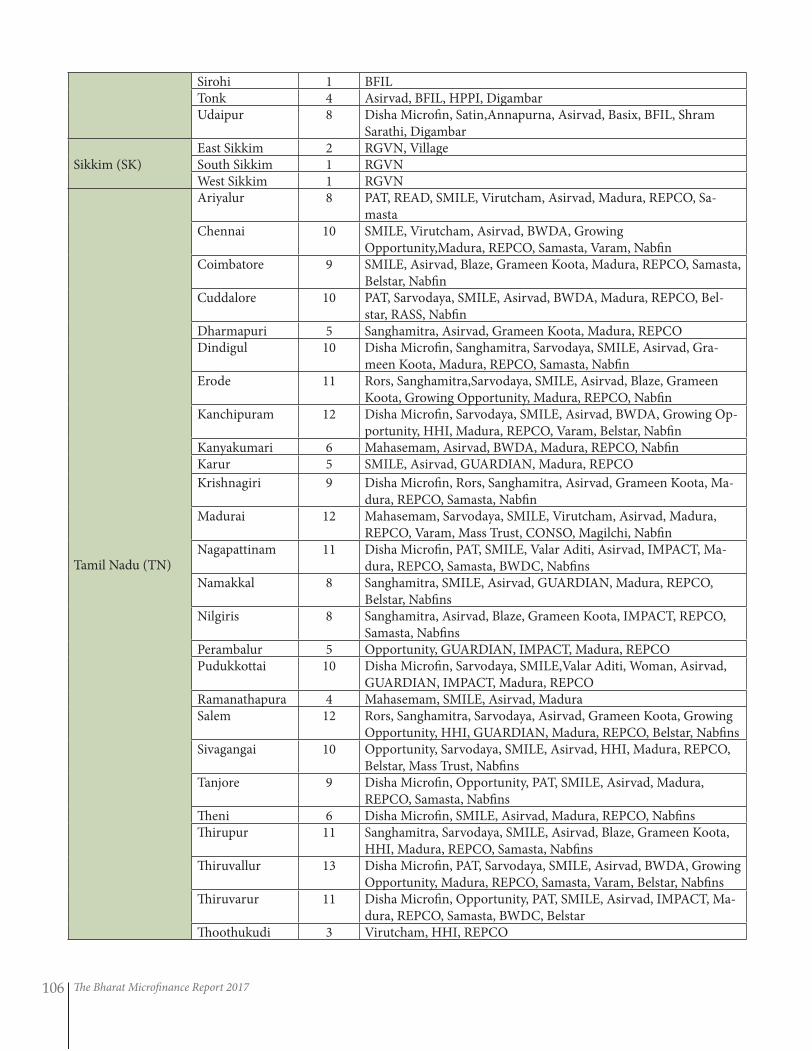
The Bharat Microfinance Report 2017106
Sirohi 1 BFILTonk 4 Asirvad, BFIL, HPPI, DigambarUdaipur 8 Disha Microfin, Satin,Annapurna, Asirvad, Basix, BFIL, Shram
Sarathi, Digambar
Sikkim (SK) East Sikkim 2 RGVN, VillageSouth Sikkim 1 RGVNWest Sikkim 1 RGVN
Tamil Nadu (TN)
Ariyalur 8 PAT, READ, SMILE, Virutcham, Asirvad, Madura, REPCO, Sa-masta
Chennai 10 SMILE, Virutcham, Asirvad, BWDA, Growing Opportunity,Madura, REPCO, Samasta, Varam, Nabfin
Coimbatore 9 SMILE, Asirvad, Blaze, Grameen Koota, Madura, REPCO, Samasta, Belstar, Nabfin
Cuddalore 10 PAT, Sarvodaya, SMILE, Asirvad, BWDA, Madura, REPCO, Bel-star, RASS, Nabfin
Dharmapuri 5 Sanghamitra, Asirvad, Grameen Koota, Madura, REPCODindigul 10 Disha Microfin, Sanghamitra, Sarvodaya, SMILE, Asirvad, Gra-
meen Koota, Madura, REPCO, Samasta, NabfinErode 11 Rors, Sanghamitra,Sarvodaya, SMILE, Asirvad, Blaze, Grameen
Koota, Growing Opportunity, Madura, REPCO, NabfinKanchipuram 12 Disha Microfin, Sarvodaya, SMILE, Asirvad, BWDA, Growing Op-
portunity, HHI, Madura, REPCO, Varam, Belstar, NabfinKanyakumari 6 Mahasemam, Asirvad, BWDA, Madura, REPCO, NabfinKarur 5 SMILE, Asirvad, GUARDIAN, Madura, REPCO
Krishnagiri 9 Disha Microfin, Rors, Sanghamitra, Asirvad, Grameen Koota, Ma-dura, REPCO, Samasta, Nabfin
Madurai 12 Mahasemam, Sarvodaya, SMILE, Virutcham, Asirvad, Madura, REPCO, Varam, Mass Trust, CONSO, Magilchi, Nabfin
Nagapattinam 11 Disha Microfin, PAT, SMILE, Valar Aditi, Asirvad, IMPACT, Ma-dura, REPCO, Samasta, BWDC, Nabfins
Namakkal 8 Sanghamitra, SMILE, Asirvad, GUARDIAN, Madura, REPCO, Belstar, Nabfins
Nilgiris 8 Sanghamitra, Asirvad, Blaze, Grameen Koota, IMPACT, REPCO, Samasta, Nabfins
Perambalur 5 Opportunity, GUARDIAN, IMPACT, Madura, REPCOPudukkottai 10 Disha Microfin, Sarvodaya, SMILE,Valar Aditi, Woman, Asirvad,
GUARDIAN, IMPACT, Madura, REPCORamanathapura 4 Mahasemam, SMILE, Asirvad, MaduraSalem 12 Rors, Sanghamitra, Sarvodaya, Asirvad, Grameen Koota, Growing
Opportunity, HHI, GUARDIAN, Madura, REPCO, Belstar, NabfinsSivagangai 10 Opportunity, Sarvodaya, SMILE, Asirvad, HHI, Madura, REPCO,
Belstar, Mass Trust, NabfinsTanjore 9 Disha Microfin, Opportunity, PAT, SMILE, Asirvad, Madura,
REPCO, Samasta, NabfinsTheni 6 Disha Microfin, SMILE, Asirvad, Madura, REPCO, NabfinsThirupur 11 Sanghamitra, Sarvodaya, SMILE, Asirvad, Blaze, Grameen Koota,
HHI, Madura, REPCO, Samasta, NabfinsThiruvallur 13 Disha Microfin, PAT, Sarvodaya, SMILE, Asirvad, BWDA, Growing
Opportunity, Madura, REPCO, Samasta, Varam, Belstar, NabfinsThiruvarur 11 Disha Microfin, Opportunity, PAT, SMILE, Asirvad, IMPACT, Ma-
dura, REPCO, Samasta, BWDC, BelstarThoothukudi 3 Virutcham, HHI, REPCO
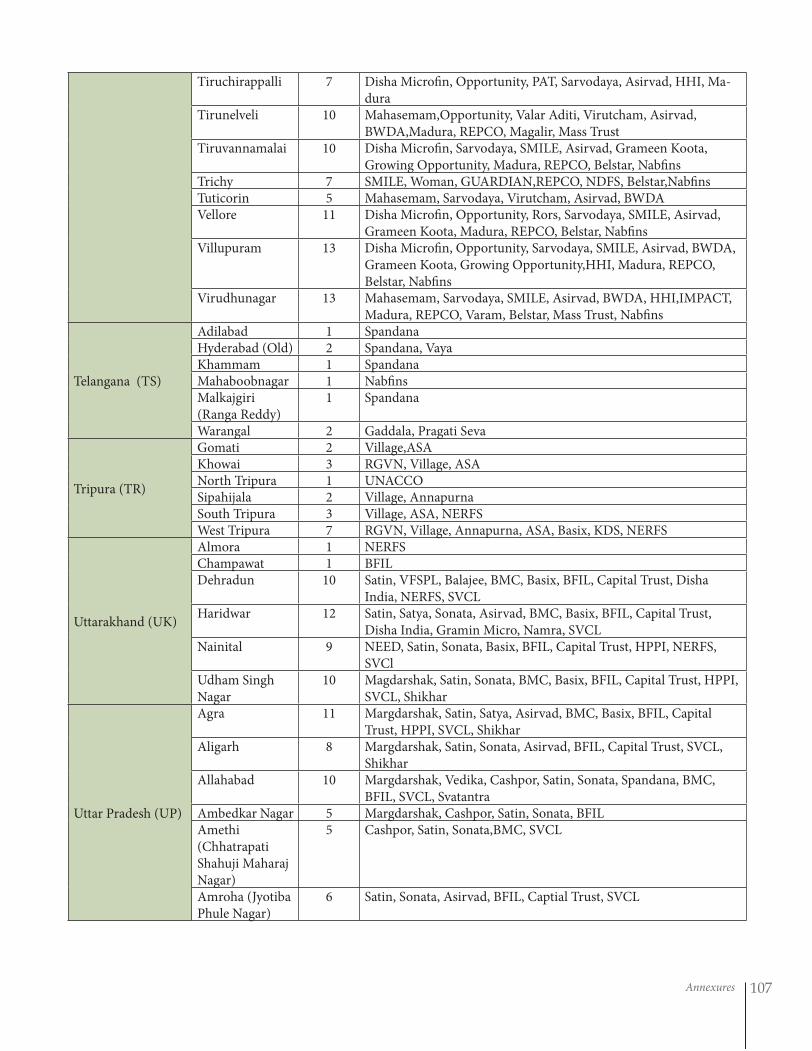
Annexures 107
Tiruchirappalli 7 Disha Microfin, Opportunity, PAT, Sarvodaya, Asirvad, HHI, Ma-dura
Tirunelveli 10 Mahasemam,Opportunity, Valar Aditi, Virutcham, Asirvad, BWDA,Madura, REPCO, Magalir, Mass Trust
Tiruvannamalai 10 Disha Microfin, Sarvodaya, SMILE, Asirvad, Grameen Koota, Growing Opportunity, Madura, REPCO, Belstar, Nabfins
Trichy 7 SMILE, Woman, GUARDIAN,REPCO, NDFS, Belstar,NabfinsTuticorin 5 Mahasemam, Sarvodaya, Virutcham, Asirvad, BWDAVellore 11 Disha Microfin, Opportunity, Rors, Sarvodaya, SMILE, Asirvad,
Grameen Koota, Madura, REPCO, Belstar, NabfinsVillupuram 13 Disha Microfin, Opportunity, Sarvodaya, SMILE, Asirvad, BWDA,
Grameen Koota, Growing Opportunity,HHI, Madura, REPCO, Belstar, Nabfins
Virudhunagar 13 Mahasemam, Sarvodaya, SMILE, Asirvad, BWDA, HHI,IMPACT, Madura, REPCO, Varam, Belstar, Mass Trust, Nabfins
Telangana (TS)
Adilabad 1 SpandanaHyderabad (Old) 2 Spandana, VayaKhammam 1 SpandanaMahaboobnagar 1 NabfinsMalkajgiri (Ranga Reddy)
1 Spandana
Warangal 2 Gaddala, Pragati Seva
Tripura (TR)
Gomati 2 Village,ASAKhowai 3 RGVN, Village, ASANorth Tripura 1 UNACCOSipahijala 2 Village, AnnapurnaSouth Tripura 3 Village, ASA, NERFSWest Tripura 7 RGVN, Village, Annapurna, ASA, Basix, KDS, NERFS
Uttarakhand (UK)
Almora 1 NERFSChampawat 1 BFILDehradun 10 Satin, VFSPL, Balajee, BMC, Basix, BFIL, Capital Trust, Disha
India, NERFS, SVCLHaridwar 12 Satin, Satya, Sonata, Asirvad, BMC, Basix, BFIL, Capital Trust,
Disha India, Gramin Micro, Namra, SVCLNainital 9 NEED, Satin, Sonata, Basix, BFIL, Capital Trust, HPPI, NERFS,
SVClUdham Singh Nagar
10 Magdarshak, Satin, Sonata, BMC, Basix, BFIL, Capital Trust, HPPI, SVCL, Shikhar
Uttar Pradesh (UP)
Agra 11 Margdarshak, Satin, Satya, Asirvad, BMC, Basix, BFIL, Capital Trust, HPPI, SVCL, Shikhar
Aligarh 8 Margdarshak, Satin, Sonata, Asirvad, BFIL, Capital Trust, SVCL, Shikhar
Allahabad 10 Margdarshak, Vedika, Cashpor, Satin, Sonata, Spandana, BMC, BFIL, SVCL, Svatantra
Ambedkar Nagar 5 Margdarshak, Cashpor, Satin, Sonata, BFILAmethi (Chhatrapati Shahuji Maharaj Nagar)
5 Cashpor, Satin, Sonata,BMC, SVCL
Amroha (Jyotiba Phule Nagar)
6 Satin, Sonata, Asirvad, BFIL, Captial Trust, SVCL
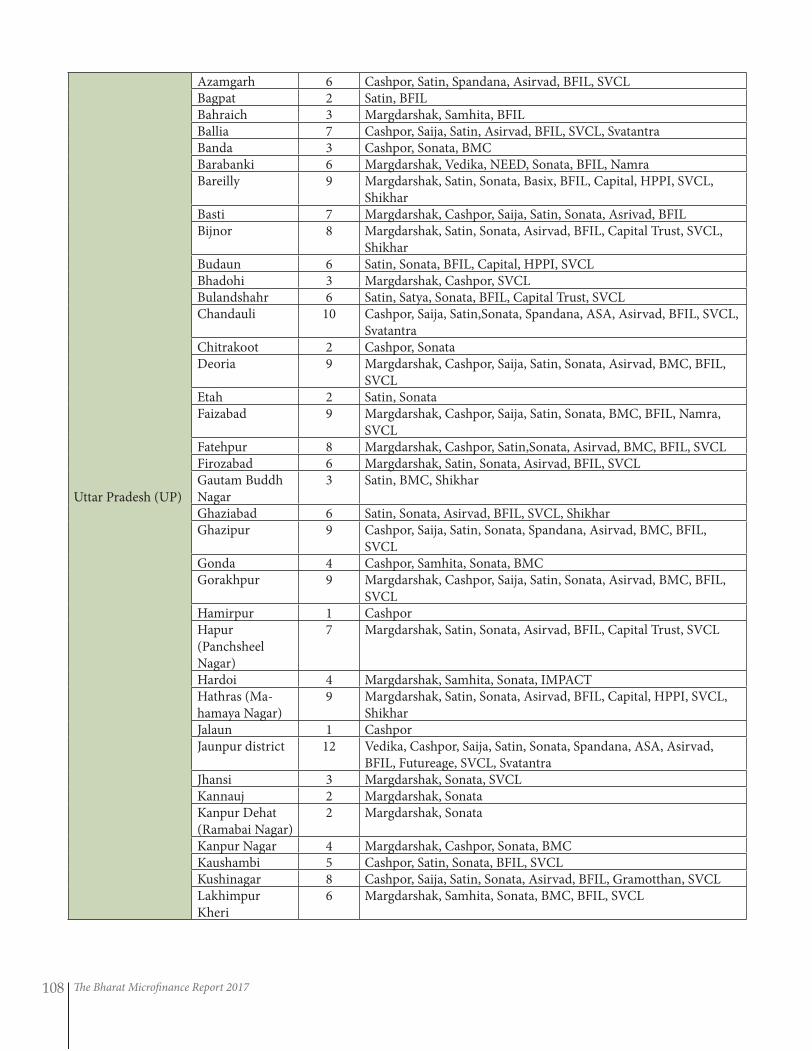
The Bharat Microfinance Report 2017108
Uttar Pradesh (UP)
Azamgarh 6 Cashpor, Satin, Spandana, Asirvad, BFIL, SVCLBagpat 2 Satin, BFILBahraich 3 Margdarshak, Samhita, BFILBallia 7 Cashpor, Saija, Satin, Asirvad, BFIL, SVCL, SvatantraBanda 3 Cashpor, Sonata, BMCBarabanki 6 Margdarshak, Vedika, NEED, Sonata, BFIL, NamraBareilly 9 Margdarshak, Satin, Sonata, Basix, BFIL, Capital, HPPI, SVCL,
ShikharBasti 7 Margdarshak, Cashpor, Saija, Satin, Sonata, Asrivad, BFILBijnor 8 Margdarshak, Satin, Sonata, Asirvad, BFIL, Capital Trust, SVCL,
ShikharBudaun 6 Satin, Sonata, BFIL, Capital, HPPI, SVCLBhadohi 3 Margdarshak, Cashpor, SVCLBulandshahr 6 Satin, Satya, Sonata, BFIL, Capital Trust, SVCLChandauli 10 Cashpor, Saija, Satin,Sonata, Spandana, ASA, Asirvad, BFIL, SVCL,
SvatantraChitrakoot 2 Cashpor, SonataDeoria 9 Margdarshak, Cashpor, Saija, Satin, Sonata, Asirvad, BMC, BFIL,
SVCLEtah 2 Satin, SonataFaizabad 9 Margdarshak, Cashpor, Saija, Satin, Sonata, BMC, BFIL, Namra,
SVCLFatehpur 8 Margdarshak, Cashpor, Satin,Sonata, Asirvad, BMC, BFIL, SVCLFirozabad 6 Margdarshak, Satin, Sonata, Asirvad, BFIL, SVCLGautam Buddh Nagar
3 Satin, BMC, Shikhar
Ghaziabad 6 Satin, Sonata, Asirvad, BFIL, SVCL, ShikharGhazipur 9 Cashpor, Saija, Satin, Sonata, Spandana, Asirvad, BMC, BFIL,
SVCLGonda 4 Cashpor, Samhita, Sonata, BMCGorakhpur 9 Margdarshak, Cashpor, Saija, Satin, Sonata, Asirvad, BMC, BFIL,
SVCLHamirpur 1 CashporHapur (Panchsheel Nagar)
7 Margdarshak, Satin, Sonata, Asirvad, BFIL, Capital Trust, SVCL
Hardoi 4 Margdarshak, Samhita, Sonata, IMPACTHathras (Ma-hamaya Nagar)
9 Margdarshak, Satin, Sonata, Asirvad, BFIL, Capital, HPPI, SVCL, Shikhar
Jalaun 1 CashporJaunpur district 12 Vedika, Cashpor, Saija, Satin, Sonata, Spandana, ASA, Asirvad,
BFIL, Futureage, SVCL, SvatantraJhansi 3 Margdarshak, Sonata, SVCLKannauj 2 Margdarshak, SonataKanpur Dehat (Ramabai Nagar)
2 Margdarshak, Sonata
Kanpur Nagar 4 Margdarshak, Cashpor, Sonata, BMCKaushambi 5 Cashpor, Satin, Sonata, BFIL, SVCLKushinagar 8 Cashpor, Saija, Satin, Sonata, Asirvad, BFIL, Gramotthan, SVCLLakhimpur Kheri
6 Margdarshak, Samhita, Sonata, BMC, BFIL, SVCL
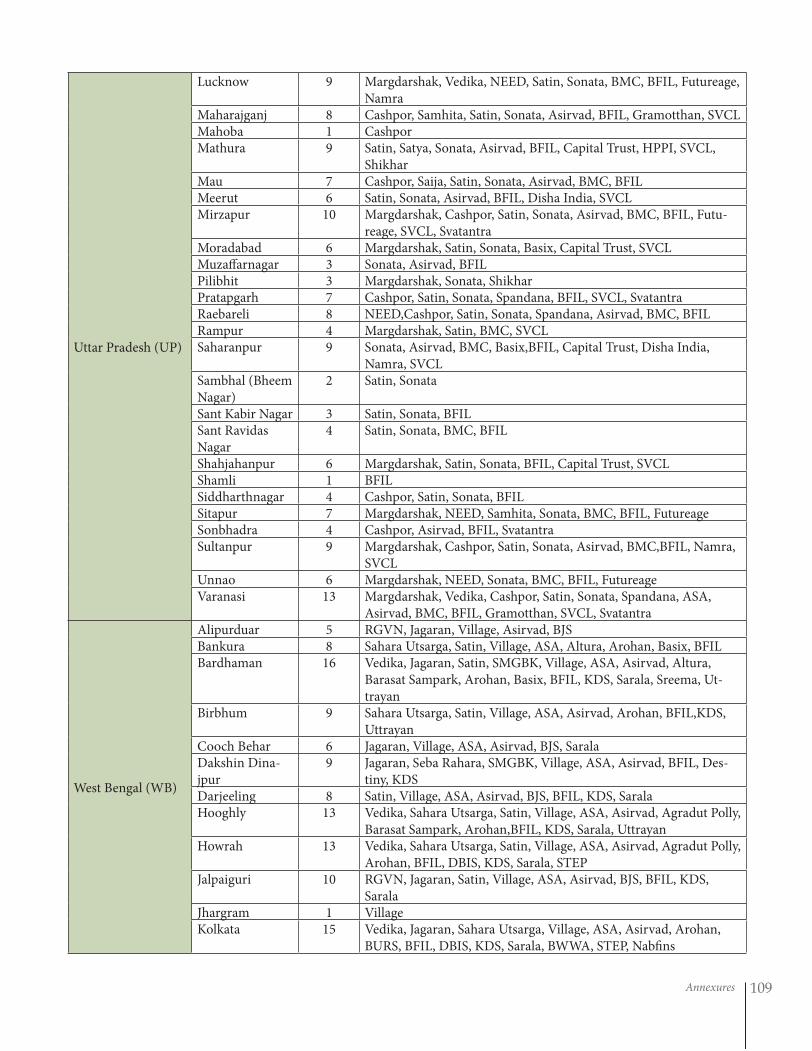
Annexures 109
Uttar Pradesh (UP)
Lucknow 9 Margdarshak, Vedika, NEED, Satin, Sonata, BMC, BFIL, Futureage, Namra
Maharajganj 8 Cashpor, Samhita, Satin, Sonata, Asirvad, BFIL, Gramotthan, SVCLMahoba 1 CashporMathura 9 Satin, Satya, Sonata, Asirvad, BFIL, Capital Trust, HPPI, SVCL,
ShikharMau 7 Cashpor, Saija, Satin, Sonata, Asirvad, BMC, BFILMeerut 6 Satin, Sonata, Asirvad, BFIL, Disha India, SVCLMirzapur 10 Margdarshak, Cashpor, Satin, Sonata, Asirvad, BMC, BFIL, Futu-
reage, SVCL, SvatantraMoradabad 6 Margdarshak, Satin, Sonata, Basix, Capital Trust, SVCLMuzaffarnagar 3 Sonata, Asirvad, BFILPilibhit 3 Margdarshak, Sonata, ShikharPratapgarh 7 Cashpor, Satin, Sonata, Spandana, BFIL, SVCL, SvatantraRaebareli 8 NEED,Cashpor, Satin, Sonata, Spandana, Asirvad, BMC, BFILRampur 4 Margdarshak, Satin, BMC, SVCLSaharanpur 9 Sonata, Asirvad, BMC, Basix,BFIL, Capital Trust, Disha India,
Namra, SVCLSambhal (Bheem Nagar)
2 Satin, Sonata
Sant Kabir Nagar 3 Satin, Sonata, BFILSant Ravidas Nagar
4 Satin, Sonata, BMC, BFIL
Shahjahanpur 6 Margdarshak, Satin, Sonata, BFIL, Capital Trust, SVCLShamli 1 BFILSiddharthnagar 4 Cashpor, Satin, Sonata, BFILSitapur 7 Margdarshak, NEED, Samhita, Sonata, BMC, BFIL, FutureageSonbhadra 4 Cashpor, Asirvad, BFIL, SvatantraSultanpur 9 Margdarshak, Cashpor, Satin, Sonata, Asirvad, BMC,BFIL, Namra,
SVCLUnnao 6 Margdarshak, NEED, Sonata, BMC, BFIL, FutureageVaranasi 13 Margdarshak, Vedika, Cashpor, Satin, Sonata, Spandana, ASA,
Asirvad, BMC, BFIL, Gramotthan, SVCL, Svatantra
West Bengal (WB)
Alipurduar 5 RGVN, Jagaran, Village, Asirvad, BJSBankura 8 Sahara Utsarga, Satin, Village, ASA, Altura, Arohan, Basix, BFILBardhaman 16 Vedika, Jagaran, Satin, SMGBK, Village, ASA, Asirvad, Altura,
Barasat Sampark, Arohan, Basix, BFIL, KDS, Sarala, Sreema, Ut-trayan
Birbhum 9 Sahara Utsarga, Satin, Village, ASA, Asirvad, Arohan, BFIL,KDS, Uttrayan
Cooch Behar 6 Jagaran, Village, ASA, Asirvad, BJS, SaralaDakshin Dina-jpur
9 Jagaran, Seba Rahara, SMGBK, Village, ASA, Asirvad, BFIL, Des-tiny, KDS
Darjeeling 8 Satin, Village, ASA, Asirvad, BJS, BFIL, KDS, SaralaHooghly 13 Vedika, Sahara Utsarga, Satin, Village, ASA, Asirvad, Agradut Polly,
Barasat Sampark, Arohan,BFIL, KDS, Sarala, UttrayanHowrah 13 Vedika, Sahara Utsarga, Satin, Village, ASA, Asirvad, Agradut Polly,
Arohan, BFIL, DBIS, KDS, Sarala, STEPJalpaiguri 10 RGVN, Jagaran, Satin, Village, ASA, Asirvad, BJS, BFIL, KDS,
SaralaJhargram 1 VillageKolkata 15 Vedika, Jagaran, Sahara Utsarga, Village, ASA, Asirvad, Arohan,
BURS, BFIL, DBIS, KDS, Sarala, BWWA, STEP, Nabfins
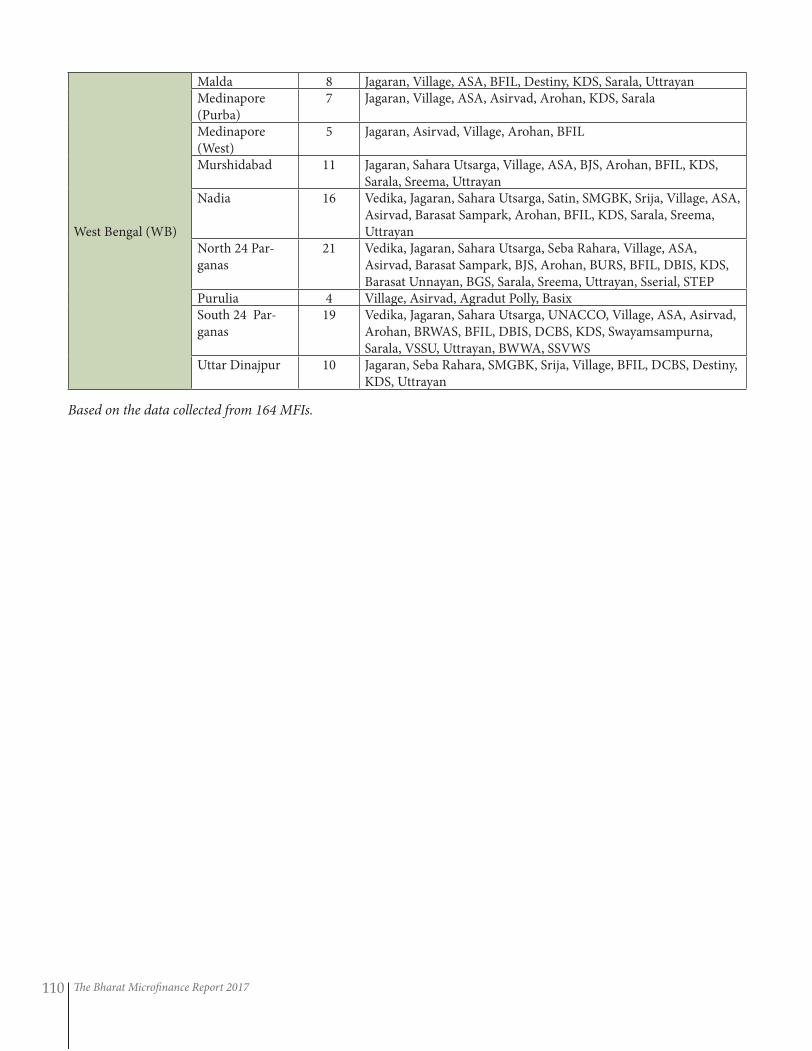
The Bharat Microfinance Report 2017110
Based on the data collected from 164 MFIs.
West Bengal (WB)
Malda 8 Jagaran, Village, ASA, BFIL, Destiny, KDS, Sarala, UttrayanMedinapore (Purba)
7 Jagaran, Village, ASA, Asirvad, Arohan, KDS, Sarala
Medinapore (West)
5 Jagaran, Asirvad, Village, Arohan, BFIL
Murshidabad 11 Jagaran, Sahara Utsarga, Village, ASA, BJS, Arohan, BFIL, KDS, Sarala, Sreema, Uttrayan
Nadia 16 Vedika, Jagaran, Sahara Utsarga, Satin, SMGBK, Srija, Village, ASA, Asirvad, Barasat Sampark, Arohan, BFIL, KDS, Sarala, Sreema, Uttrayan
North 24 Par-ganas
21 Vedika, Jagaran, Sahara Utsarga, Seba Rahara, Village, ASA, Asirvad, Barasat Sampark, BJS, Arohan, BURS, BFIL, DBIS, KDS, Barasat Unnayan, BGS, Sarala, Sreema, Uttrayan, Sserial, STEP
Purulia 4 Village, Asirvad, Agradut Polly, BasixSouth 24 Par-ganas
19 Vedika, Jagaran, Sahara Utsarga, UNACCO, Village, ASA, Asirvad, Arohan, BRWAS, BFIL, DBIS, DCBS, KDS, Swayamsampurna, Sarala, VSSU, Uttrayan, BWWA, SSVWS
Uttar Dinajpur 10 Jagaran, Seba Rahara, SMGBK, Srija, Village, BFIL, DCBS, Destiny, KDS, Uttrayan
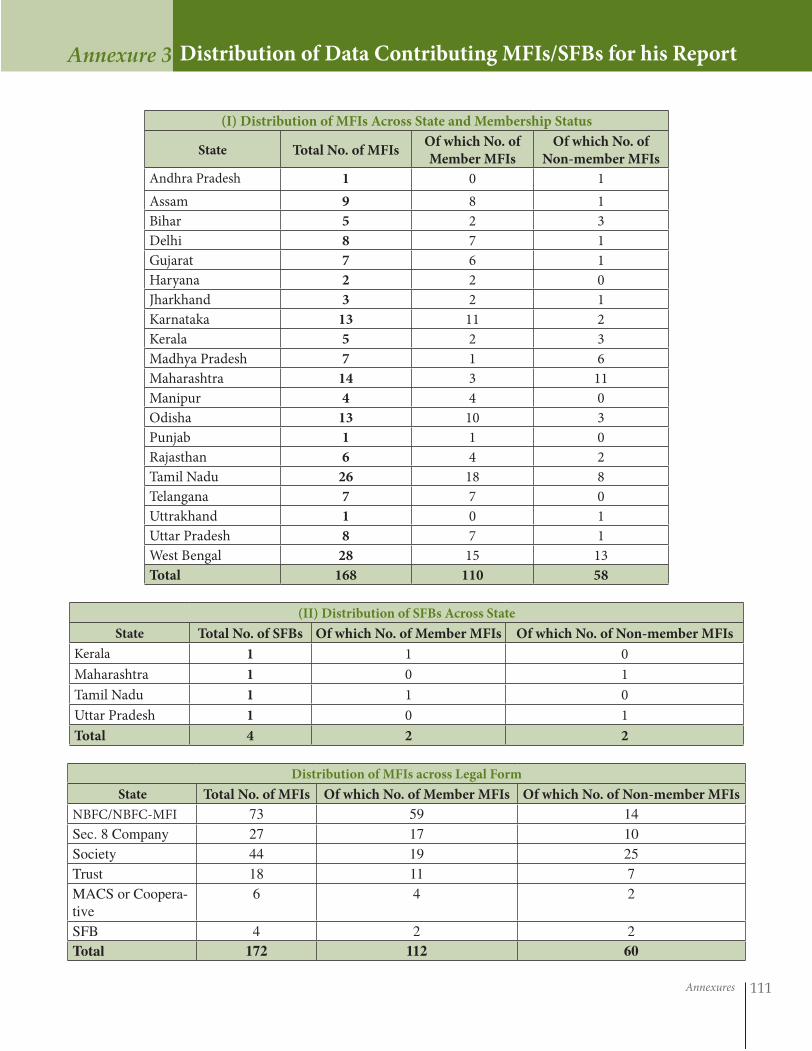
Annexures 111
(I) Distribution of MFIs Across State and Membership Status
State Total No. of MFIsOf which No. of
Member MFIs
Of which No. of
Non-member MFIs
Andhra Pradesh 1 0 1
Assam 9 8 1
Bihar 5 2 3
Delhi 8 7 1
Gujarat 7 6 1
Haryana 2 2 0
Jharkhand 3 2 1
Karnataka 13 11 2
Kerala 5 2 3
Madhya Pradesh 7 1 6
Maharashtra 14 3 11
Manipur 4 4 0
Odisha 13 10 3
Punjab 1 1 0
Rajasthan 6 4 2
Tamil Nadu 26 18 8
Telangana 7 7 0
Uttrakhand 1 0 1
Uttar Pradesh 8 7 1
West Bengal 28 15 13
Total 168 110 58
(II) Distribution of SFBs Across State
State Total No. of SFBs Of which No. of Member MFIs Of which No. of Non-member MFIs
Kerala 1 1 0
Maharashtra 1 0 1
Tamil Nadu 1 1 0
Uttar Pradesh 1 0 1
Total 4 2 2
Distribution of MFIs across Legal Form
State Total No. of MFIs Of which No. of Member MFIs Of which No. of Non-member MFIs
NBFC/NBFC-MFI 73 59 14
Sec. 8 Company 27 17 10
Society 44 19 25
Trust 18 11 7
MACS or Coopera-
tive
6 4 2
SFB 4 2 2
Total 172 112 60
Distribution of Data Contributing MFIs/SFBs for his ReportAnnexure 3
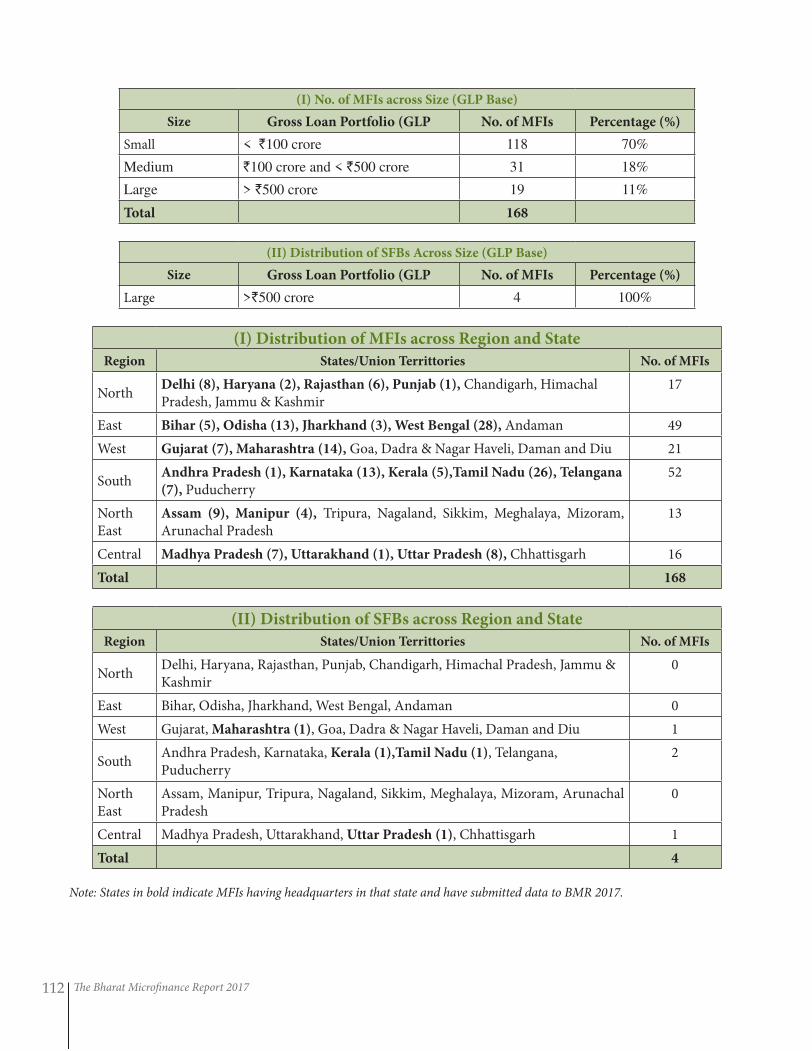
The Bharat Microfinance Report 2017112
Note: States in bold indicate MFIs having headquarters in that state and have submitted data to BMR 2017.
(I) No. of MFIs across Size (GLP Base)
Size Gross Loan Portfolio (GLP No. of MFIs Percentage (%)
Small < `100 crore 118 70%
Medium `100 crore and < `500 crore 31 18%
Large > `500 crore 19 11%
Total 168
(II) Distribution of SFBs Across Size (GLP Base)
Size Gross Loan Portfolio (GLP No. of MFIs Percentage (%)
Large >`500 crore 4 100%
(I) Distribution of MFIs across Region and State
Region States/Union Territtories No. of MFIs
North Delhi (8), Haryana (2), Rajasthan (6), Punjab (1), Chandigarh, Himachal Pradesh, Jammu & Kashmir
17
East Bihar (5), Odisha (13), Jharkhand (3), West Bengal (28), Andaman 49
West Gujarat (7), Maharashtra (14), Goa, Dadra & Nagar Haveli, Daman and Diu 21
South Andhra Pradesh (1), Karnataka (13), Kerala (5),Tamil Nadu (26), Telangana
(7), Puducherry52
North East
Assam (9), Manipur (4), Tripura, Nagaland, Sikkim, Meghalaya, Mizoram, Arunachal Pradesh
13
Central Madhya Pradesh (7), Uttarakhand (1), Uttar Pradesh (8), Chhattisgarh 16
Total 168
(II) Distribution of SFBs across Region and State
Region States/Union Territtories No. of MFIs
North Delhi, Haryana, Rajasthan, Punjab, Chandigarh, Himachal Pradesh, Jammu & Kashmir
0
East Bihar, Odisha, Jharkhand, West Bengal, Andaman 0
West Gujarat, Maharashtra (1), Goa, Dadra & Nagar Haveli, Daman and Diu 1
South Andhra Pradesh, Karnataka, Kerala (1),Tamil Nadu (1), Telangana, Puducherry
2
North East
Assam, Manipur, Tripura, Nagaland, Sikkim, Meghalaya, Mizoram, Arunachal Pradesh
0
Central Madhya Pradesh, Uttarakhand, Uttar Pradesh (1), Chhattisgarh 1
Total 4
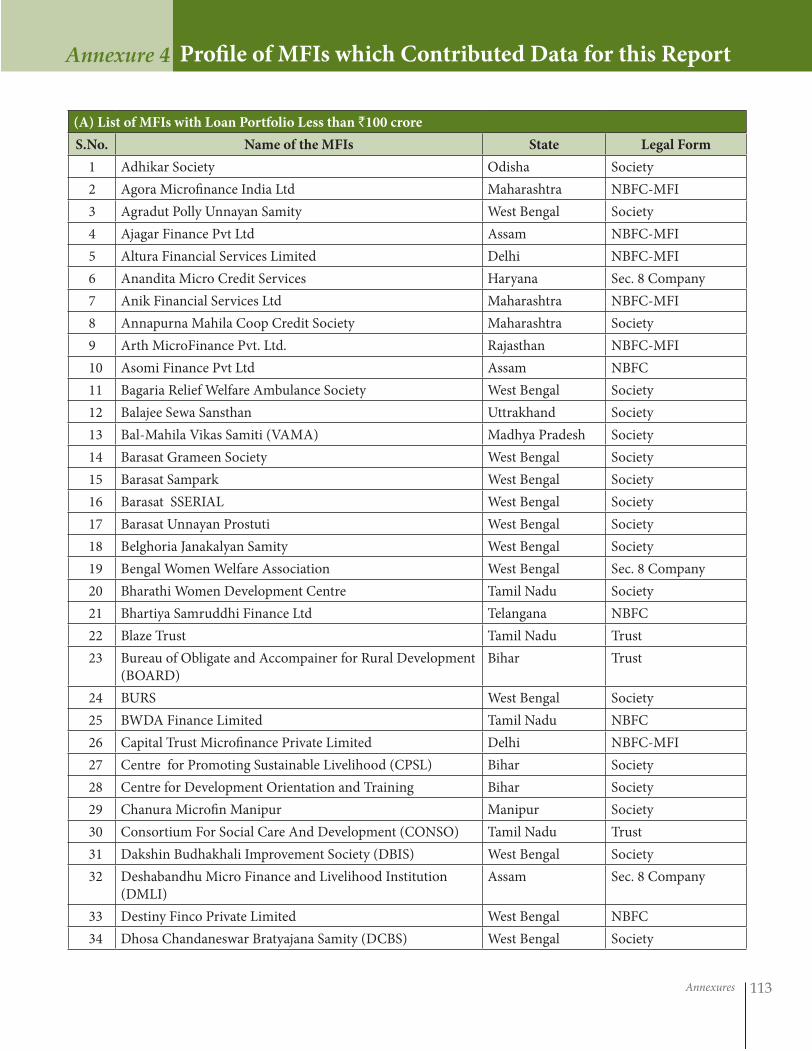
Annexures 113
(A) List of MFIs with Loan Portfolio Less than `100 crore
S.No. Name of the MFIs State Legal Form
1 Adhikar Society Odisha Society
2 Agora Microfinance India Ltd Maharashtra NBFC-MFI
3 Agradut Polly Unnayan Samity West Bengal Society
4 Ajagar Finance Pvt Ltd Assam NBFC-MFI
5 Altura Financial Services Limited Delhi NBFC-MFI
6 Anandita Micro Credit Services Haryana Sec. 8 Company
7 Anik Financial Services Ltd Maharashtra NBFC-MFI
8 Annapurna Mahila Coop Credit Society Maharashtra Society
9 Arth MicroFinance Pvt. Ltd. Rajasthan NBFC-MFI
10 Asomi Finance Pvt Ltd Assam NBFC
11 Bagaria Relief Welfare Ambulance Society West Bengal Society
12 Balajee Sewa Sansthan Uttrakhand Society
13 Bal-Mahila Vikas Samiti (VAMA) Madhya Pradesh Society
14 Barasat Grameen Society West Bengal Society
15 Barasat Sampark West Bengal Society
16 Barasat SSERIAL West Bengal Society
17 Barasat Unnayan Prostuti West Bengal Society
18 Belghoria Janakalyan Samity West Bengal Society
19 Bengal Women Welfare Association West Bengal Sec. 8 Company
20 Bharathi Women Development Centre Tamil Nadu Society
21 Bhartiya Samruddhi Finance Ltd Telangana NBFC
22 Blaze Trust Tamil Nadu Trust
23 Bureau of Obligate and Accompainer for Rural Development (BOARD)
Bihar Trust
24 BURS West Bengal Society
25 BWDA Finance Limited Tamil Nadu NBFC
26 Capital Trust Microfinance Private Limited Delhi NBFC-MFI
27 Centre for Promoting Sustainable Livelihood (CPSL) Bihar Society
28 Centre for Development Orientation and Training Bihar Society
29 Chanura Microfin Manipur Manipur Society
30 Consortium For Social Care And Development (CONSO) Tamil Nadu Trust
31 Dakshin Budhakhali Improvement Society (DBIS) West Bengal Society
32 Deshabandhu Micro Finance and Livelihood Institution (DMLI)
Assam Sec. 8 Company
33 Destiny Finco Private Limited West Bengal NBFC
34 Dhosa Chandaneswar Bratyajana Samity (DCBS) West Bengal Society
Profile of MFIs which Contributed Data for this ReportAnnexure 4
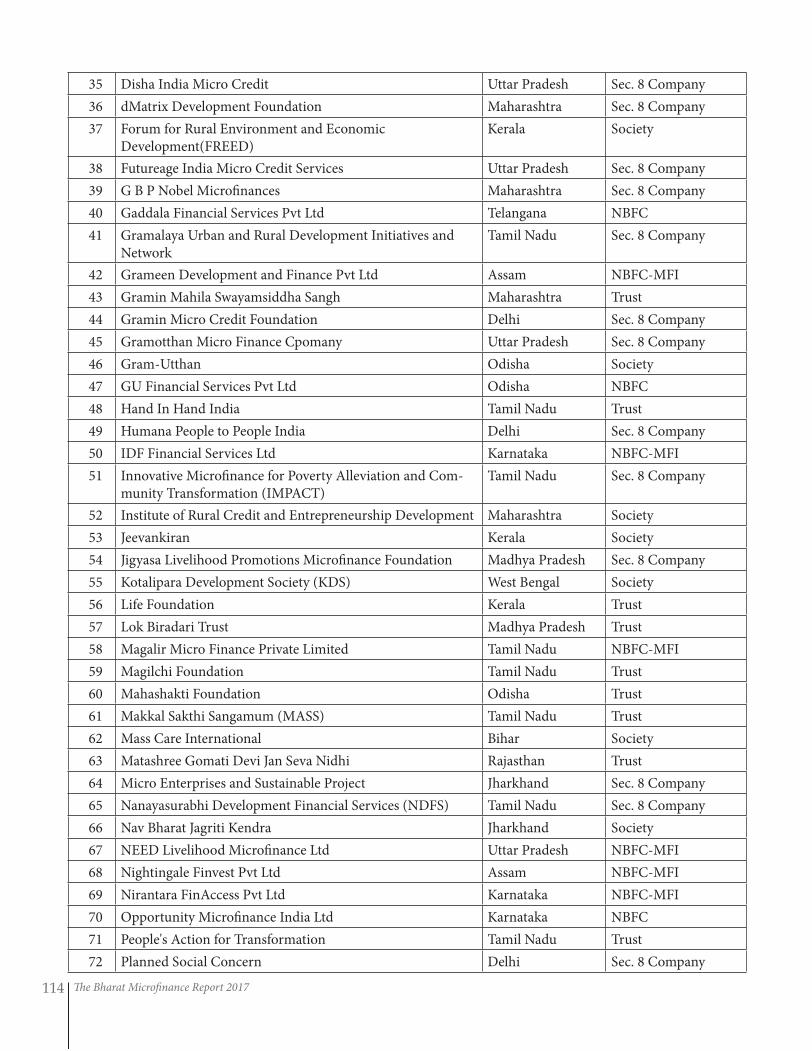
The Bharat Microfinance Report 2017114
35 Disha India Micro Credit Uttar Pradesh Sec. 8 Company
36 dMatrix Development Foundation Maharashtra Sec. 8 Company
37 Forum for Rural Environment and Economic Development(FREED)
Kerala Society
38 Futureage India Micro Credit Services Uttar Pradesh Sec. 8 Company
39 G B P Nobel Microfinances Maharashtra Sec. 8 Company
40 Gaddala Financial Services Pvt Ltd Telangana NBFC
41 Gramalaya Urban and Rural Development Initiatives and Network
Tamil Nadu Sec. 8 Company
42 Grameen Development and Finance Pvt Ltd Assam NBFC-MFI
43 Gramin Mahila Swayamsiddha Sangh Maharashtra Trust
44 Gramin Micro Credit Foundation Delhi Sec. 8 Company
45 Gramotthan Micro Finance Cpomany Uttar Pradesh Sec. 8 Company
46 Gram-Utthan Odisha Society
47 GU Financial Services Pvt Ltd Odisha NBFC
48 Hand In Hand India Tamil Nadu Trust
49 Humana People to People India Delhi Sec. 8 Company
50 IDF Financial Services Ltd Karnataka NBFC-MFI
51 Innovative Microfinance for Poverty Alleviation and Com-munity Transformation (IMPACT)
Tamil Nadu Sec. 8 Company
52 Institute of Rural Credit and Entrepreneurship Development Maharashtra Society
53 Jeevankiran Kerala Society
54 Jigyasa Livelihood Promotions Microfinance Foundation Madhya Pradesh Sec. 8 Company
55 Kotalipara Development Society (KDS) West Bengal Society
56 Life Foundation Kerala Trust
57 Lok Biradari Trust Madhya Pradesh Trust
58 Magalir Micro Finance Private Limited Tamil Nadu NBFC-MFI
59 Magilchi Foundation Tamil Nadu Trust
60 Mahashakti Foundation Odisha Trust
61 Makkal Sakthi Sangamum (MASS) Tamil Nadu Trust
62 Mass Care International Bihar Society
63 Matashree Gomati Devi Jan Seva Nidhi Rajasthan Trust
64 Micro Enterprises and Sustainable Project Jharkhand Sec. 8 Company
65 Nanayasurabhi Development Financial Services (NDFS) Tamil Nadu Sec. 8 Company
66 Nav Bharat Jagriti Kendra Jharkhand Society
67 NEED Livelihood Microfinance Ltd Uttar Pradesh NBFC-MFI
68 Nightingale Finvest Pvt Ltd Assam NBFC-MFI
69 Nirantara FinAccess Pvt Ltd Karnataka NBFC-MFI
70 Opportunity Microfinance India Ltd Karnataka NBFC
71 People's Action for Transformation Tamil Nadu Trust
72 Planned Social Concern Delhi Sec. 8 Company
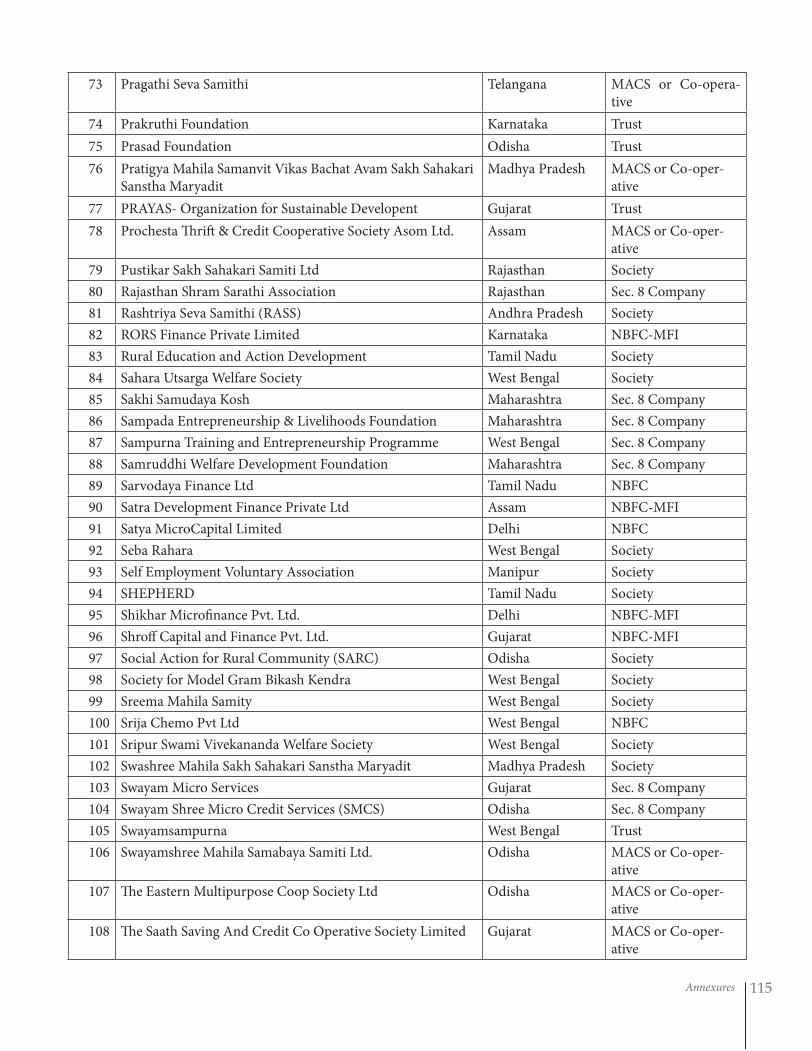
Annexures 115
73 Pragathi Seva Samithi Telangana MACS or Co-opera-tive
74 Prakruthi Foundation Karnataka Trust
75 Prasad Foundation Odisha Trust
76 Pratigya Mahila Samanvit Vikas Bachat Avam Sakh Sahakari Sanstha Maryadit
Madhya Pradesh MACS or Co-oper-ative
77 PRAYAS- Organization for Sustainable Developent Gujarat Trust
78 Prochesta Thrift & Credit Cooperative Society Asom Ltd. Assam MACS or Co-oper-ative
79 Pustikar Sakh Sahakari Samiti Ltd Rajasthan Society
80 Rajasthan Shram Sarathi Association Rajasthan Sec. 8 Company
81 Rashtriya Seva Samithi (RASS) Andhra Pradesh Society
82 RORS Finance Private Limited Karnataka NBFC-MFI
83 Rural Education and Action Development Tamil Nadu Society
84 Sahara Utsarga Welfare Society West Bengal Society
85 Sakhi Samudaya Kosh Maharashtra Sec. 8 Company
86 Sampada Entrepreneurship & Livelihoods Foundation Maharashtra Sec. 8 Company
87 Sampurna Training and Entrepreneurship Programme West Bengal Sec. 8 Company
88 Samruddhi Welfare Development Foundation Maharashtra Sec. 8 Company
89 Sarvodaya Finance Ltd Tamil Nadu NBFC
90 Satra Development Finance Private Ltd Assam NBFC-MFI
91 Satya MicroCapital Limited Delhi NBFC
92 Seba Rahara West Bengal Society
93 Self Employment Voluntary Association Manipur Society
94 SHEPHERD Tamil Nadu Society
95 Shikhar Microfinance Pvt. Ltd. Delhi NBFC-MFI
96 Shroff Capital and Finance Pvt. Ltd. Gujarat NBFC-MFI
97 Social Action for Rural Community (SARC) Odisha Society
98 Society for Model Gram Bikash Kendra West Bengal Society
99 Sreema Mahila Samity West Bengal Society
100 Srija Chemo Pvt Ltd West Bengal NBFC
101 Sripur Swami Vivekananda Welfare Society West Bengal Society
102 Swashree Mahila Sakh Sahakari Sanstha Maryadit Madhya Pradesh Society
103 Swayam Micro Services Gujarat Sec. 8 Company
104 Swayam Shree Micro Credit Services (SMCS) Odisha Sec. 8 Company
105 Swayamsampurna West Bengal Trust
106 Swayamshree Mahila Samabaya Samiti Ltd. Odisha MACS or Co-oper-ative
107 The Eastern Multipurpose Coop Society Ltd Odisha MACS or Co-oper-ative
108 The Saath Saving And Credit Co Operative Society Limited Gujarat MACS or Co-oper-ative
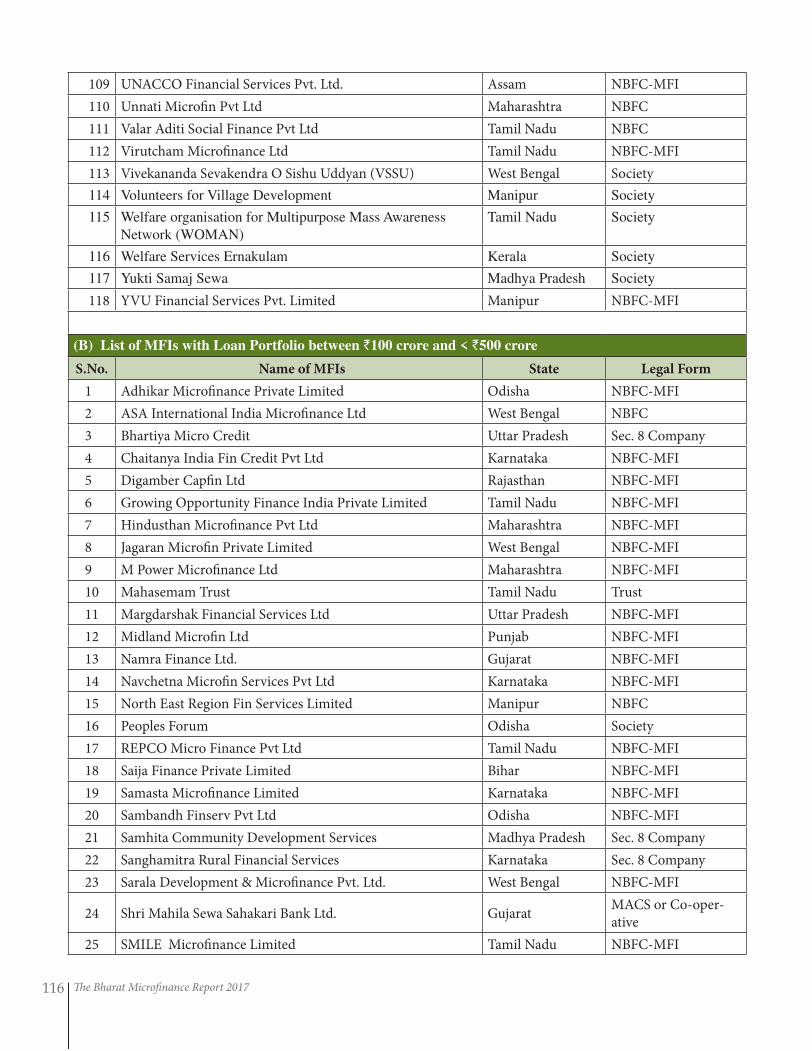
The Bharat Microfinance Report 2017116
109 UNACCO Financial Services Pvt. Ltd. Assam NBFC-MFI
110 Unnati Microfin Pvt Ltd Maharashtra NBFC
111 Valar Aditi Social Finance Pvt Ltd Tamil Nadu NBFC
112 Virutcham Microfinance Ltd Tamil Nadu NBFC-MFI
113 Vivekananda Sevakendra O Sishu Uddyan (VSSU) West Bengal Society
114 Volunteers for Village Development Manipur Society
115 Welfare organisation for Multipurpose Mass Awareness
Network (WOMAN)
Tamil Nadu Society
116 Welfare Services Ernakulam Kerala Society
117 Yukti Samaj Sewa Madhya Pradesh Society
118 YVU Financial Services Pvt. Limited Manipur NBFC-MFI
(B) List of MFIs with Loan Portfolio between `100 crore and < `500 crore
S.No. Name of MFIs State Legal Form
1 Adhikar Microfinance Private Limited Odisha NBFC-MFI
2 ASA International India Microfinance Ltd West Bengal NBFC
3 Bhartiya Micro Credit Uttar Pradesh Sec. 8 Company
4 Chaitanya India Fin Credit Pvt Ltd Karnataka NBFC-MFI
5 Digamber Capfin Ltd Rajasthan NBFC-MFI
6 Growing Opportunity Finance India Private Limited Tamil Nadu NBFC-MFI
7 Hindusthan Microfinance Pvt Ltd Maharashtra NBFC-MFI
8 Jagaran Microfin Private Limited West Bengal NBFC-MFI
9 M Power Microfinance Ltd Maharashtra NBFC-MFI
10 Mahasemam Trust Tamil Nadu Trust
11 Margdarshak Financial Services Ltd Uttar Pradesh NBFC-MFI
12 Midland Microfin Ltd Punjab NBFC-MFI
13 Namra Finance Ltd. Gujarat NBFC-MFI
14 Navchetna Microfin Services Pvt Ltd Karnataka NBFC-MFI
15 North East Region Fin Services Limited Manipur NBFC
16 Peoples Forum Odisha Society
17 REPCO Micro Finance Pvt Ltd Tamil Nadu NBFC-MFI
18 Saija Finance Private Limited Bihar NBFC-MFI
19 Samasta Microfinance Limited Karnataka NBFC-MFI
20 Sambandh Finserv Pvt Ltd Odisha NBFC-MFI
21 Samhita Community Development Services Madhya Pradesh Sec. 8 Company
22 Sanghamitra Rural Financial Services Karnataka Sec. 8 Company
23 Sarala Development & Microfinance Pvt. Ltd. West Bengal NBFC-MFI
24 Shri Mahila Sewa Sahakari Bank Ltd. GujaratMACS or Co-oper-ative
25 SMILE Microfinance Limited Tamil Nadu NBFC-MFI
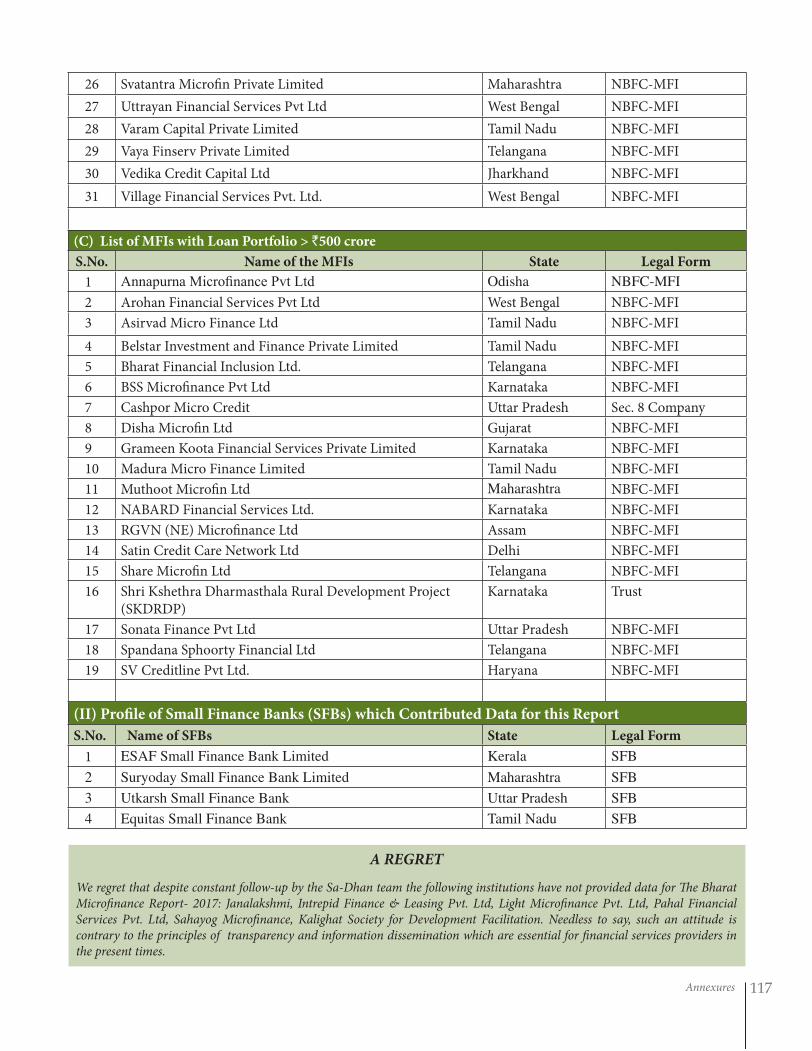
Annexures 117
26 Svatantra Microfin Private Limited Maharashtra NBFC-MFI
27 Uttrayan Financial Services Pvt Ltd West Bengal NBFC-MFI
28 Varam Capital Private Limited Tamil Nadu NBFC-MFI
29 Vaya Finserv Private Limited Telangana NBFC-MFI
30 Vedika Credit Capital Ltd Jharkhand NBFC-MFI
31 Village Financial Services Pvt. Ltd. West Bengal NBFC-MFI
(C) List of MFIs with Loan Portfolio > `500 crore
S.No. Name of the MFIs State Legal Form
1 Annapurna Microfinance Pvt Ltd Odisha NBFC-MFI
2 Arohan Financial Services Pvt Ltd West Bengal NBFC-MFI
3 Asirvad Micro Finance Ltd Tamil Nadu NBFC-MFI
4 Belstar Investment and Finance Private Limited Tamil Nadu NBFC-MFI
5 Bharat Financial Inclusion Ltd. Telangana NBFC-MFI
6 BSS Microfinance Pvt Ltd Karnataka NBFC-MFI
7 Cashpor Micro Credit Uttar Pradesh Sec. 8 Company
8 Disha Microfin Ltd Gujarat NBFC-MFI
9 Grameen Koota Financial Services Private Limited Karnataka NBFC-MFI
10 Madura Micro Finance Limited Tamil Nadu NBFC-MFI
11 Muthoot Microfin Ltd Maharashtra NBFC-MFI
12 NABARD Financial Services Ltd. Karnataka NBFC-MFI
13 RGVN (NE) Microfinance Ltd Assam NBFC-MFI
14 Satin Credit Care Network Ltd Delhi NBFC-MFI
15 Share Microfin Ltd Telangana NBFC-MFI
16 Shri Kshethra Dharmasthala Rural Development Project (SKDRDP)
Karnataka Trust
17 Sonata Finance Pvt Ltd Uttar Pradesh NBFC-MFI
18 Spandana Sphoorty Financial Ltd Telangana NBFC-MFI
19 SV Creditline Pvt Ltd. Haryana NBFC-MFI
(II) Profile of Small Finance Banks (SFBs) which Contributed Data for this Report
S.No. Name of SFBs State Legal Form
1 ESAF Small Finance Bank Limited Kerala SFB
2 Suryoday Small Finance Bank Limited Maharashtra SFB
3 Utkarsh Small Finance Bank Uttar Pradesh SFB
4 Equitas Small Finance Bank Tamil Nadu SFB
A REGRET
We regret that despite constant follow-up by the Sa-Dhan team the following institutions have not provided data for The Bharat Microfinance Report- 2017: Janalakshmi, Intrepid Finance & Leasing Pvt. Ltd, Light Microfinance Pvt. Ltd, Pahal Financial Services Pvt. Ltd, Sahayog Microfinance, Kalighat Society for Development Facilitation. Needless to say, such an attitude is contrary to the principles of transparency and information dissemination which are essential for financial services providers in the present times.
Head�Office:A�1-�248,�3rd�Floor,�Safdarjung�EnclaveNew�Delhi�‒�110029,�IndiaTel:�+�91-�11-47174400Fax:�+�91-11-47174405E-mail:�[email protected]:�www.sa-dhan.net
Mission of Sa-Dhan
“To build the field of community development finance in India, to help its members and associate institutions to better serve low income households, particularly women, in both rural and urban India, in their quest for establishing stable livelihoods and improving their quality of life”.
Mission of NABARD
“Promotion of sustainable and equitable agriculture and rural development through effective credit support, related services, institution development and other innovative initiatives”.


