Embed Size (px)
Citation preview

Biaxial Response of Passive Human Cerebral Arteries
Kenneth L. Monson, Nicholas M. Barbaro, and Geoffrey T. ManleyDepartment of Neurological Surgery, University of California, San Francisco
AbstractThe cerebral circulation is fundamental to the health and maintenance of brain tissue, but injury anddisease may result in dysfunction of the vessels. Characterization of cerebral vessel mechanicalresponse is an important step toward a more complete understanding of injury mechanisms anddisease development in these vessels, paving the way for improved prevention and treatment. Werecently reported a large series of uniaxial tests on fresh human cerebral vessels, but the multi-axialbehavior of these vessels has not been previously described. Twelve arteries were obtained from thesurface of the temporal lobe of patients undergoing surgery and were subjected to variouscombinations of axial stretch and pressure around typical physiological conditions before beingstretched to failure. Axial and circumferential responses were compared, and measured data were fitto a four parameter, Fung-type hyperelastic constitutive model. Artery behavior was nonlinear andanisotropic, with considerably greater resistance to deformation in the axial direction than aroundthe circumference. Results from axial failure tests of pressurized vessels resulted in a small shift instress-stretch response compared to previously reported data from unpressurized specimens. Theseresults further define the biaxial response of the cerebral arteries and provide data required for morerigorous study of head injury mechanisms and development of cerebrovascular disease.
Key Termscerebral artery properties; mechanical testing; traumatic brain injury; head injury; cerebrovasculardisease
IntroductionThe cerebral blood vessels play a critical role in the health and maintenance of the brain, buttheir proper function can be disrupted by trauma or by the development of other disease.Approximately 1.4 million people suffer traumatic brain injury (TBI) each year in the UnitedStates; of these, 50,000 die15. Total costs associated with both mortality and morbidity of TBIwere estimated at 60 billion dollars in the year 20005. Traumatic brain injury commonlyincludes damage to the vessels8, manifest as hemorrhage following mechanical disruption ofthe vessel wall. Even in the absence of obvious mechanical damage, trauma may additionallyproduce physiological dysfunction in the vessels leading to transient breakdown of the blood-brain barrier or to loss of cerebral autoregulation. Stroke, or brain ischemia due to lack of bloodsupply, occurs in approximately 780,000 people each year, resulting in about 150,000 deaths,and costs an estimated 65 billion dollars annually18. While stroke is generally consideredseparate from trauma, it is associated with similar disruption of vessel function. Such conditionsmay result from rupture of aneurysms or other cerebrovascular malformations, often alsoleading to vasospasm, or from embolism or thrombosis of the vessels. Efforts to better
Corresponding Author: Kenneth L. Monson, Ph.D., University of Utah, Department of Mechanical Engineering, 50 S. Central CampusDr., 2132 MEB, Salt Lake City, UT 84112, [email protected].
NIH Public AccessAuthor ManuscriptAnn Biomed Eng. Author manuscript; available in PMC 2009 January 2.
Published in final edited form as:Ann Biomed Eng. 2008 December ; 36(12): 2028–2041. doi:10.1007/s10439-008-9578-9.
NIH
-PA Author Manuscript
NIH
-PA Author Manuscript
NIH
-PA Author Manuscript

understand these injuries and disease processes commonly include modeling techniquesrequiring knowledge of vessel properties, but only a limited set of data has been available forthe cerebral vessels. Definition of cerebrovascular mechanical response is thus a critical steptoward enhanced understanding of the mechanisms by which vascular injuries occur and alsoserves as an important foundation for study of cerebrovascular disease13 and treatment.
The few previous studies of the mechanical properties of cerebral arteries have revealed someof the fundamental characteristics of these vessels, including observations that they are stifferin both the axial2, 16 and circumferential2, 9 directions than most extracranial arteries and thatcerebral arteries are stiffer than cerebral veins16. This increased stiffness also leads to arelatively low extent of stretch to failure, at least in the axial direction. The increased stiffnessmay be a result of the presence of an additional layer of adventitial pia-arachnoid tissue thecerebral vessels acquire (and lose) and they pass into (and out of) the subarachnoid space1.Work from our lab has also shown that large and small cerebral arteries, referring respectivelyto those in or near the Circle of Willis and those found on the surface of the cortex, behavesimilarly in the axial direction17. This is an important consideration given that most otherstudies of the cerebral arteries have focused on large vessels. We have also demonstrated thatarteries from autopsy tend to be less extensible than those obtained fresh from surgery17. Ithas additionally been reported that cerebral arteries become less distensible with age2, 9, atleast in the circumferential direction.
While previous studies of passive human cerebral arteries have revealed some of their uniquecharacteristics, the multi-axial response of healthy vessels over a broad range of loadingconditions has not been defined. Our objective was to provide this information in order to allowmore rigorous study of head trauma and other conditions and diseases affecting these vessels.
ProcedureSpecimen Preparation and Testing Apparatus
Following procedures described previously16, 12 normal cerebral arteries were obtained fromthe lateral surface of the temporal lobe of 6 male and 5 female patients undergoing surgery totreat epilepsy. Patient age ranged from 16 to 62 years, with a mean of 37 years. Specimenswere collected and tested over a period of two years. Signed, informed consent for the use oftissue was obtained from each patient using an approved human subjects protocol (UCSFCommittee on Human Research).
Prior to resection, a piece of suture was placed next to the specimen to be removed and wascut to identify the vessel’s in vivo length. Following removal, specimens were immediatelyplaced in a container of cold physiological saline and transported to the laboratory in a cooler.Both specimen and suture lengths were measured to identify zero-load and in vivo lengths,respectively, and pia-arachnoid and brain tissue commonly resected along with the artery werecarefully dissected away under a stereo microscope. Most arterial segments from the temporalsurface include numerous small branches that are intimately associated with the pia-arachnoidtissue that surrounds them in the subarachnoid space. Due to the small size of some branchesand the surprising strength of the membranous tissues, it was easy to tear the branches at theirconnection to the main vessel segment such that the specimen could not be subsequentlypressurized. Following removal of surrounding tissue, thin cross-sections were cut from theends of the main segment, photographed under a microscope, cut radially to release residualstresses, and then photographed again once the section appeared to have reached equilibrium.Branches were ligated with a single fibril of unwound 6-0 silk suture. Ends of the main vesselsegment were then tied, using 6-0 silk suture, to blunt-tipped, luer-hub, 25–30 G (dependingon specimen diameter) needles attached to acrylic blocks through which holes had been drilledto allow fluid passage and pressure measurement; grooves were machined around the end of
Monson et al. Page 2
Ann Biomed Eng. Author manuscript; available in PMC 2009 January 2.
NIH
-PA Author Manuscript
NIH
-PA Author Manuscript
NIH
-PA Author Manuscript

the needles to give purchase to sutures and reduce slippage of the specimen under axial tension.The relative position of the blocks was then fixed with a length-adjustable support armconnecting them, such that the assembly could be moved without risking damage to the vessel,and saline was gently pushed into the vessel lumen at low pressures. Following vesselattachment, the specimen was removed from the saline bath, fluid around it was wicked awaywith a small strip of paper towel, and a small amount of cyanoacrylate was applied around thevessel-needle interfaces – on the distal sides of the sutures – to ensure a good seal. While theglue was drying, 10 μm microspheres (Polysciences, Inc.; Polybead) were spread over thevessel surface to allow visual tracking of deformations during testing. Attached between oneof the needles and its associated block was an acrylic tube over which a square polystyrenecuvette, with a round hole cut out of its bottom, could slide so as to be out of the way duringthe vessel attachment process. Once the vessel was attached, the assembly was orientedvertically, the cuvette was slid down over the specimen, its base was pressed over a gasketaround the hub of the opposite needle, and the cuvette was filled with room-temperature salineto immerse the specimen.
Following specimen preparation, the assembly was connected to the actuator of a computer-controlled servo-hydraulic load frame (MTS, Model 858 Mini-Bionix) on which testing wasconducted (Fig. 1). The upper acrylic block was attached to the actuator, and the position ofthe actuator was carefully lowered until the lower acrylic block was in position to attach to an11 N load cell (Transducer Techniques, MDB 2.5) fixed to the rigid base of the load frame.The support arm was then released and removed so specimen length would change with actuatorposition. The chamber of the lower acrylic block was then connected to a saline delivery system,a linear actuator (Ultramotion, Digit) driving the position of a syringe. Pressure was measuredwith a 200 kPa pressure transducer (Honeywell, MicroSwitch 26PCDFM6G) attached to theupper block. Actuator displacement was monitored through the linear variable displacementtransducer (LVDT) built into the load frame, and specimen deformations were recorded (3frames/sec) using a digital camera (Pixelink, PL-A641), with an attached high-powered zoomlens (Edmund Optics, VZM 450i; FOV: 1.4–17.6 mm), connected to a computer. Typical imageresolution was 0.004 mm/pix. All non-video signals were recorded at 100 Hz using the dataacquisition (DAQ) card provided with the load frame system.
Mechanical TestingSince structural and fluidic rearrangements likely occur in vessels between the time of resection– when natural loads are removed – and testing, a preconditioning process was completed priorto testing to restore, as closely as possible, the vessels to their in vivo state. The processconsisted of a series of typically 3 to 4 inflation tests in which the vessel was stretched axiallyto a target position, and its length was held constant for approximately two minutes whilepressure in the vessel was cycled 5 times between 6.7 and 20.0 kPa (50 and 150 mmHg). Thetarget axial position was gradually increased from one test to another, guided initially by thein vivo length measurement, until measured force increased noticeably with pressure (as a resultof vessel length exceeding the in vivo length22) and reached peak values near 0.1 N. Betweenthese preconditioning tests, vessel length and pressure were held constant at the estimated invivo length and 13.3 kPa (100 mmHg). Following these initial procedures, a test was conductedin which specimen length was reduced sufficiently to induce buckling and then increased tothe maximum value utilized during preconditioning, all while a valve connected to the upperblock was open so as to maintain near-zero pressure; this reference test provided foridentification of the unloaded specimen length for use during data analysis. The vessel wasthen subjected to a series of three inflation tests where vessel length was held constant at variousvalues and pressure was increased from near zero to approximately 20 kPa (same range as forpreconditioning tests) and three axial stretch tests where pressure was set to a target value andthe length of the specimen was cycled between a state of compressive buckling and the
Monson et al. Page 3
Ann Biomed Eng. Author manuscript; available in PMC 2009 January 2.
NIH
-PA Author Manuscript
NIH
-PA Author Manuscript
NIH
-PA Author Manuscript

maximum length used in previous tests. Each of these six tests involved five identical cycles,the fifth of which was used for determination of mechanical properties. Typical stretch ratiosobtained during the six tests for one specimen are shown in Fig. 2. The illustrated stretch pathsare labeled in the order in which they were performed. Following the six physiological-leveltests, each specimen was pressurized to approximately 13.3 kPa and stretched axially to failure.All tests were conducted at quasi-static rates.
Data Processing and AnalysisChanges in outer diameter and the axial position of selected microspheres during the tests weredetermined through subsequent analysis of the recorded video using a program written inLabVIEW (National Instruments) and utilizing tools in its companion Vision DevelopmentModule. Actuator displacement recorded in the video was similarly determined and comparedto LVDT measurements to allow synchronization of video and DAQ card data. Because onlythree images were saved during each second of testing, points were added to the video data inorder to obtain a one-to-one correspondence with DAQ-recorded measurements; added datavalues were defined by interpolation between measurements. The resulting video data werethen smoothed using the phaseless low-pass digital filter specified in SAE J21119. Filteredtraces were compared to original data to ensure fidelity, though the process often resulted in awaviness, as seen in Fig. 2, that was on the same order of magnitude as the level of noise inthe original measurements. Load cell data were similarly processed to filter noise due tomachine vibrations. Because the pressure transducer was positioned approximately 8 mmabove the center of the specimen, recorded pressure values were increased by a value of 0.8kPa to account for pressure due to the saline column height.
Measurement software was also used to define cross-section characteristics. Cross-sectionalarea was measured by tracing the inner and outer contours of each uncut cross-section andtaking the difference of their calculated areas. Zero-load outer diameter was defined as theaverage outer diameter along two perpendicular lines passing through the center of the uncutsection. For slightly elliptical sections, these two lines were chosen as the major and minoraxes of the ellipse. Outer diameter in the zero-stress configuration was estimated by drawinga circle, having a radius approximately equal to that of the cross-section arc, over the imageof the cut section. Using the center of the circle and underlying arc, the associated openingangle was then approximated as half the angle over which the section had receded when cut(applying the definition provided by Chuong and Fung4; also see Humphrey13, pp. 272–274).Zero-load arc length was then approximated as the product of opening angle and zero-stressouter diameter. Inner and outer arc lengths in both the zero-load (where arc length equalscircumference) and stress-free configurations were also measured from images using software.Inner and outer values were averaged for each configuration and the result for the zero-loadstate was divided by that for the stress-free configuration to determine the zero-loadcircumferential stretch ratio.
Considering the vessels to be homogenous circular cylinders, mid-wall specimen stretch λi wasdefined using Equations 1,
(1a, b)
where i =θ, z correspond to the circumferential and axial directions, respectively, and di, de,and l represent internal and external diameters, and axial distance between two microspheresin the current configuration; Di, De, and L are corresponding values in the zero-loadconfiguration. Internal diameters were approximated using the measured cross-sectional areaA and the assumption of incompressibility. Reference length L was measured in the video framefrom the unpressurized axial stretch reference test that most closely corresponded to the time
Monson et al. Page 4
Ann Biomed Eng. Author manuscript; available in PMC 2009 January 2.
NIH
-PA Author Manuscript
NIH
-PA Author Manuscript
NIH
-PA Author Manuscript
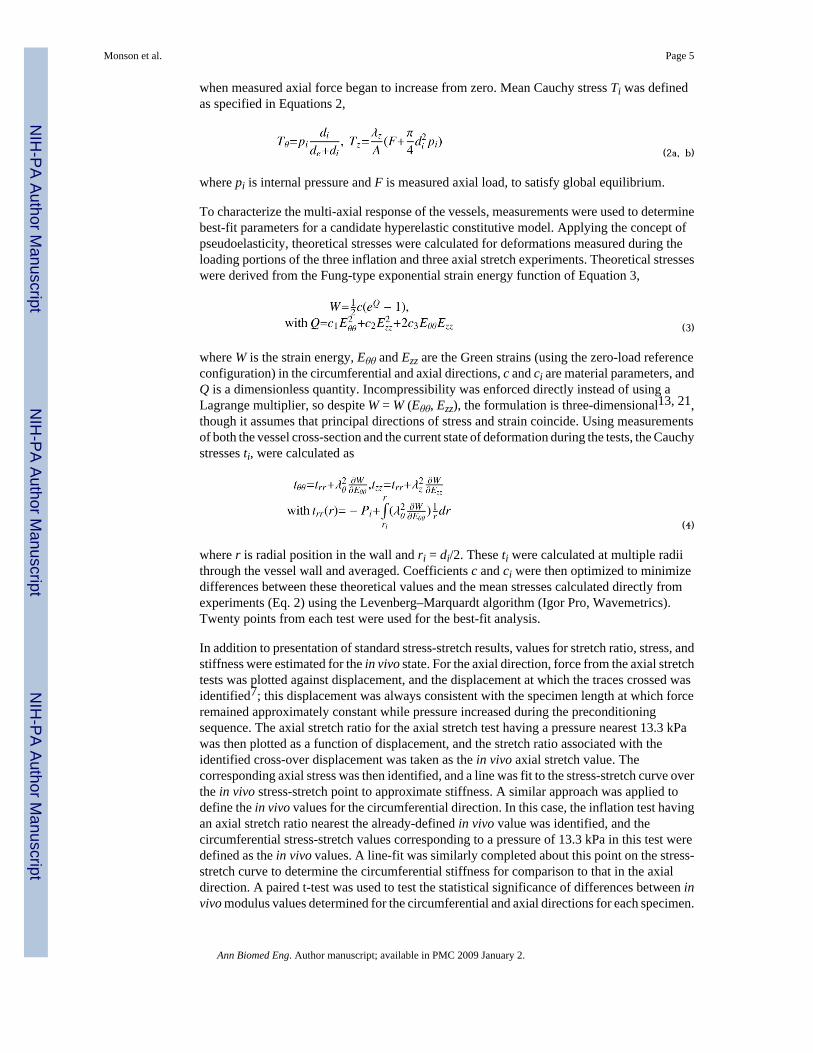
when measured axial force began to increase from zero. Mean Cauchy stress Ti was definedas specified in Equations 2,
(2a, b)
where pi is internal pressure and F is measured axial load, to satisfy global equilibrium.
To characterize the multi-axial response of the vessels, measurements were used to determinebest-fit parameters for a candidate hyperelastic constitutive model. Applying the concept ofpseudoelasticity, theoretical stresses were calculated for deformations measured during theloading portions of the three inflation and three axial stretch experiments. Theoretical stresseswere derived from the Fung-type exponential strain energy function of Equation 3,
(3)
where W is the strain energy, Eθθ and Ezz are the Green strains (using the zero-load referenceconfiguration) in the circumferential and axial directions, c and ci are material parameters, andQ is a dimensionless quantity. Incompressibility was enforced directly instead of using aLagrange multiplier, so despite W = W (Eθθ, Ezz), the formulation is three-dimensional13, 21,though it assumes that principal directions of stress and strain coincide. Using measurementsof both the vessel cross-section and the current state of deformation during the tests, the Cauchystresses ti, were calculated as
(4)
where r is radial position in the wall and ri = di/2. These ti were calculated at multiple radiithrough the vessel wall and averaged. Coefficients c and ci were then optimized to minimizedifferences between these theoretical values and the mean stresses calculated directly fromexperiments (Eq. 2) using the Levenberg–Marquardt algorithm (Igor Pro, Wavemetrics).Twenty points from each test were used for the best-fit analysis.
In addition to presentation of standard stress-stretch results, values for stretch ratio, stress, andstiffness were estimated for the in vivo state. For the axial direction, force from the axial stretchtests was plotted against displacement, and the displacement at which the traces crossed wasidentified7; this displacement was always consistent with the specimen length at which forceremained approximately constant while pressure increased during the preconditioningsequence. The axial stretch ratio for the axial stretch test having a pressure nearest 13.3 kPawas then plotted as a function of displacement, and the stretch ratio associated with theidentified cross-over displacement was taken as the in vivo axial stretch value. Thecorresponding axial stress was then identified, and a line was fit to the stress-stretch curve overthe in vivo stress-stretch point to approximate stiffness. A similar approach was applied todefine the in vivo values for the circumferential direction. In this case, the inflation test havingan axial stretch ratio nearest the already-defined in vivo value was identified, and thecircumferential stress-stretch values corresponding to a pressure of 13.3 kPa in this test weredefined as the in vivo values. A line-fit was similarly completed about this point on the stress-stretch curve to determine the circumferential stiffness for comparison to that in the axialdirection. A paired t-test was used to test the statistical significance of differences between invivo modulus values determined for the circumferential and axial directions for each specimen.
Monson et al. Page 5
Ann Biomed Eng. Author manuscript; available in PMC 2009 January 2.
NIH
-PA Author Manuscript
NIH
-PA Author Manuscript
NIH
-PA Author Manuscript

Comparison between specimens was accomplished by plotting one stress-stretch curve(separately for both inflation and axial stretch tests) most closely approximating in vivoconditions for each specimen. Because differences between the specimens appeared bestdescribed by shifts in stretch values, the potential significance of donor age on in vivo stretchvalues in the data were analyzed using multiple regression (Statacorp; Stata IC 10). Becausethe stretch ratio in the orthogonal direction of loading at the time of in vivo stretch determinationwas not consistent between specimens, this was used as the second independent variable in themultiple regression analysis. While stretch ratios defined in Equation 1 reference the zero-loadconfiguration, additional analysis was conducted to view some of the measured data using thein vivo state as reference configuration. To accomplish this, stretch ratios defined in Equation1 were divided by the identified in vivo stretch values.
ResultsCerebral artery response to biaxial loading was qualitatively consistent with what has beenreported elsewhere for similar tests on other types of blood vessels. Figure 3 provides agraphical summary of loading conditions and measurements for three representativespecimens. Detailed information for these specimens, and summary data for all specimens, isgiven in Table 1. As Fig. 3 (Row 1) shows for inflation tests, diameter increased with pressurein characteristic nonlinear, concave-downward fashion. Curves naturally shifted downwardwith increased fixed specimen length. Degree of nonlinearity in the diameter-pressure curvesalso tended to decrease with greater axial stretch. Figure 3 (Row 1) additionally demonstratesthat axial force values during inflation tests increased more dramatically with pressure forhigher levels of fixed axial stretch. Similar to diameter-pressure behavior during inflation tests,the force-displacement relationship in axial stretch tests (Fig. 3, Row 2) was nonlinear, and thearteries developed higher forces at lower axial stretch values for higher imposed pressures.While pressure decreased slightly with displacement for some cases (likely due to fluidleakage), it remained remarkably constant for most specimens, even though it was internalfluid volume, rather than pressure, that was held fixed during the tests. Row 2 of Fig. 3 alsodemonstrates the tendency for force-displacement traces in these tests to cross one another nearthe vessels’ in vivo length7, 22; these crossover displacements were consistent with specimenlengths where axial force remained relatively constant during pressure changes in inflationtests.
Calculated stress-stretch responses (Row 3 of Fig. 3) demonstrate a striking difference betweenaxial and circumferential loading. In particular, axial data from stretch tests generally exhibitedsignificantly higher stresses at much lower stretch ratios compared to circumferential data frominflation tests, suggesting material anisotropy. A relatively wide toe region is also apparent inthe circumferential response. The data in Rows 3 and 4 of the figure additionally suggest thatthe circumferential response was more sensitive to changes in axial stretch during inflationtests than the axial response was to changes in circumferential stretch during axial stretch tests.These stress-stretch observations were generally consistent for all vessels tested, though therewas some variability from specimen to specimen, as is illustrated by the stress-stretch plots inFig. 4.
Further supporting the observation of anisotropy, fits of the selected Fung-type constitutivemodel (Eq. 3) to data from inflation and axial stretch tests for each specimen resulted in c2coefficients that were many times greater than values for c1 (Table 2). Figure 5 showsexperimental and best-fit axial and circumferential stress values in inflation and axial stretchtests for a specimen (A6) with average fit quality. As Table 2 shows, unconstrained fitsproduced values for c2 that were particularly high relative to all other coefficient values. Eachof the reported coefficient combinations satisfied the requirement that 10, 12 but anumber of the fits resulted in physically unrealistic negative values for c3. Nearly all cases with
Monson et al. Page 6
Ann Biomed Eng. Author manuscript; available in PMC 2009 January 2.
NIH
-PA Author Manuscript
NIH
-PA Author Manuscript
NIH
-PA Author Manuscript

a negative c3 value settled on c3 = 0 when constrained. While it is common to assumeorthotropy, as Equation 3 does, for blood vessels, negative and near-zero c3 values may be aresult of the above observation that the circumferential response sometimes appeared to bemore sensitive to changes in fixed axial stretch than vice-versa, a non-orthotropic behavior. Itis also interesting to note that while Equation 4 was used for results reported in Table 2, asimplified approach assuming trr = 0 produced nearly identical results for all cases, despite thefact that the vessels studied would generally not be considered to have thin walls.
Artery response was further explored by examining behavior around in vivo conditions. Thepoints most closely corresponding to the in vivo state for both inflation and axial stretch testsfor each of the specimens are identified by the “IV” tags given in the stress-stretch plots inFigs. 3 and 4. These points were available for both inflation and axial stretch protocols for 9of the 12 specimens; in the other 3 specimens, none of either, or both of, the inflation or stretchsequences passed through the in vivo state. As the plots suggest, stress values at the approximatein vivo state were similar for both directions of loading, each averaging 0.07 MPa. However,stiffness measurements at the same points ranged from 1.8 to 5.5 MPa and from 0.8 to 2.6 MPafor the axial and circumferential directions, respectively. While there is clearly some overlapbetween these ranges (Fig. 6), paired t-tests, both including and excluding the two specimenswith particularly high axial modulus values, suggested a significant difference between thegroups (p < 0.025). While this result does not support a strong statistical difference betweenthese groups, there is a clear trend of greater stiffness in the axial direction. More significantly,the ratio of axial to circumferential stiffness for each specimen varied from 0.9 to 3.4, with anaverage of 1.9. Modulus values were not statistically dependent on age.
While the general response of the individual vessels, as shown in Figs. 3 and 4, is similar, it isalso clear that there is some variation between specimens. In order to better understanddifferences in response between vessels and to investigate possible influential factors, we firstplotted together one curve from the inflation protocols for each specimen. Circumferentialstress-stretch data (from inflation tests) for most of the specimens are plotted together in Fig.7a. Displayed data are limited to results from inflation test sequences where axial stretch washeld near its in vivo value, so tests where axial stretch was relatively high were excluded. Thefigure demonstrates a large range in circumferential stretch among specimens, though generalcurve shape is similar. Corresponding axial stretch ratios ranged from 1.02 to 1.16 but had noobvious visual correlation with horizontal shift in the circumferential response. Multipleregression of circumferential in vivo stretch values with the associated axial stretch ratio, aswell as age, suggested a lack of correlation with both parameters (p > 0.4). Because the mostnatural application of these data would utilize an in vivo reference, the stress data were re-plotted (Fig. 7b) against the circumferential “IV Ref” stretch ratio, where the reference is theapproximated in vivo, instead of zero-load, diameter. With this adjustment, response in thecircumferential direction is remarkably similar across specimens.
Figure 8 gives a similar presentation of results from axial stretch tests. In this case, a singletest from each specimen where the internal pressure was between 10.7 and 16 kPa (80 and 120mmHg) is included. As shown, there is a significant amount of variation, both in general curveshape and in axial stretch range, in the zero-load reference data (Fig. 8a). Similar to the inflationdata, curve characteristics did not exhibit obvious dependence upon correspondingcircumferential stretch values (which varied from 0.99 to 1.57). Multiple regression confirmeda lack of axial stretch dependence on the circumferential stretch ratio (p > 0.8) but suggestedslightly significant negative correlation with age (p < 0.02). As with inflation test results, thesestress-stretch data were also adjusted to reference the approximated in vivo state (Fig. 8b),again resulting in a more consistent set of data, though curve shape still varies somewhat. Whileit is not customary to utilize a reference configuration associated with a non-zero-stress state,the adjustment to referencing the in vivo configuration helps isolate potential causes for
Monson et al. Page 7
Ann Biomed Eng. Author manuscript; available in PMC 2009 January 2.
NIH
-PA Author Manuscript
NIH
-PA Author Manuscript
NIH
-PA Author Manuscript

variability among specimens. In the context of the anisotropy presented earlier, it is importantto state here that the ratio of axial and circumferential moduli at in vivo conditions did notchange significantly with the reference adjustment, averaging a value of 1.8.
In contrast to the highly nonlinear response of the cerebral arteries around in vivo conditions,most specimens demonstrated approximate linearity at larger deformations (Fig. 9). Thetransition to linearity is likely attributable to straightening of the previously tortuous collagenfibers in the vessel wall. As with tests around in vivo conditions, scatter between specimenswas notable, so data are again plotted against axial stretch values referencing the in vivoconfiguration. Although only one failure test could be conducted with each specimen, theinfluence of pressurization within a specimen is demonstrated by one case that lost its abilityto maintain pressure prior to the occurrence of axial failure (rightmost line in Fig. 9). Themagnitude of the obvious shift to the right with loss of pressure is consistent with changes inaxial stress-stretch data with pressure during in vivo level tests. While these experiments wereconducted to failure, structural disruption invariably occurred at either a branch point or at theattachment to a needle. In addition, the assumption of incompressibility produced physicallyinvalid predictions for internal diameter at the highest deformations, so the presented datagenerally do not extend to failure.
As defined in Methods, stress-stretch results presented in this paper reference the zero-loadconfiguration (unless otherwise specified) and are thus mean values. However, measurementsof opening angle, required to define the zero-stress state and through-wall stress-stretchdistributions, were conducted on these specimens but were found to exhibit a large degree ofvariability (Table 1; Fig. 10). Upon release of residual stress by radial cut, immersed sectionsopened immediately, generally reaching their nearly final opening angle within 30 seconds.Some specimens did not open at all and one inverted itself, resulting in overall angle variationfrom −17 to 180 degrees. Opening angle was also found to be variable along the length of asingle specimen. While only one or two sections could be obtained from most specimens priorto testing, one vessel too short to test was cut into multiple sections. Corresponding openingangles varied from 10–170 deg. In addition, sections from 2 of the 12 specimens (A8, A12)exhibited elliptical shapes with what might be described as folds at opposing points (see uncutsection of Fig. 10b). Radial cuts through these specimens resulted in non-uniform arcs in whichthe folds were preserved. This is illustrated in Fig. 10b, which shows two open sections cutfrom nearly identical cross-sections (one shown in the left panel) corresponding to the samespecimen. However, one section was cut radially at the location of a fold, while the other wascut radially between folds. Given the variations in opening angle and cut section uniformity,estimation of arc length using these measurements was not considered reliable, so the zero-load state was utilized as the reference configuration. Direct measurement of arc length,however, demonstrated a mean circumferential stretch ratio of 1.06 for the unloadedcircumference relative to the stress-free arc length.
DiscussionThe objectives of this research were to more fully define the multi-axial behavior of passivehuman cerebral arteries and to provide data that would be useful in future studies of injury anddisease in these vessels. Findings demonstrate that the arteries are anisotropic, typicallydeveloping significant stresses at much lower levels of deformation axially thancircumferentially. Consideration of vessel response around in vivo conditions, rather than atthe same levels of deformation from the zero-load reference, reduces the degree of observeddirectional difference, but axial stiffness values are still typically higher. To our knowledge,the implications of cerebral vessel anisotropy for injury and disease development have not beeninvestigated, but these findings lay the foundation for future research in these areas.
Monson et al. Page 8
Ann Biomed Eng. Author manuscript; available in PMC 2009 January 2.
NIH
-PA Author Manuscript
NIH
-PA Author Manuscript
NIH
-PA Author Manuscript
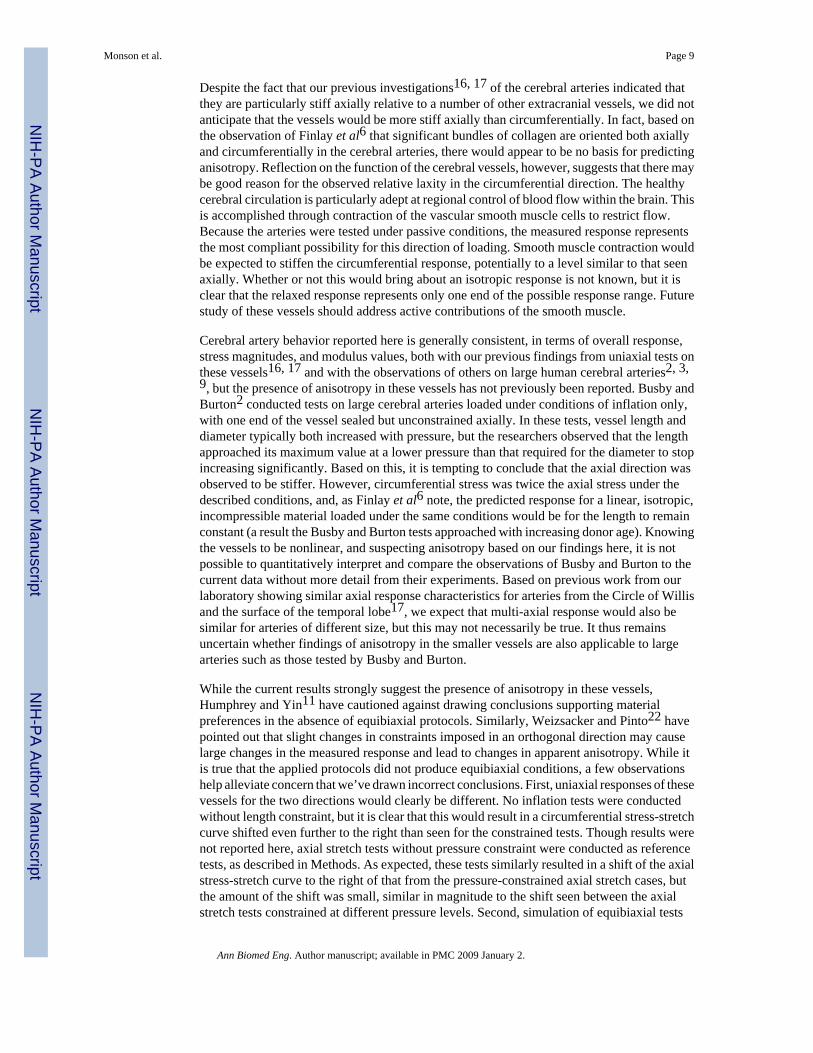
Despite the fact that our previous investigations16, 17 of the cerebral arteries indicated thatthey are particularly stiff axially relative to a number of other extracranial vessels, we did notanticipate that the vessels would be more stiff axially than circumferentially. In fact, based onthe observation of Finlay et al6 that significant bundles of collagen are oriented both axiallyand circumferentially in the cerebral arteries, there would appear to be no basis for predictinganisotropy. Reflection on the function of the cerebral vessels, however, suggests that there maybe good reason for the observed relative laxity in the circumferential direction. The healthycerebral circulation is particularly adept at regional control of blood flow within the brain. Thisis accomplished through contraction of the vascular smooth muscle cells to restrict flow.Because the arteries were tested under passive conditions, the measured response representsthe most compliant possibility for this direction of loading. Smooth muscle contraction wouldbe expected to stiffen the circumferential response, potentially to a level similar to that seenaxially. Whether or not this would bring about an isotropic response is not known, but it isclear that the relaxed response represents only one end of the possible response range. Futurestudy of these vessels should address active contributions of the smooth muscle.
Cerebral artery behavior reported here is generally consistent, in terms of overall response,stress magnitudes, and modulus values, both with our previous findings from uniaxial tests onthese vessels16, 17 and with the observations of others on large human cerebral arteries2, 3,9, but the presence of anisotropy in these vessels has not previously been reported. Busby andBurton2 conducted tests on large cerebral arteries loaded under conditions of inflation only,with one end of the vessel sealed but unconstrained axially. In these tests, vessel length anddiameter typically both increased with pressure, but the researchers observed that the lengthapproached its maximum value at a lower pressure than that required for the diameter to stopincreasing significantly. Based on this, it is tempting to conclude that the axial direction wasobserved to be stiffer. However, circumferential stress was twice the axial stress under thedescribed conditions, and, as Finlay et al6 note, the predicted response for a linear, isotropic,incompressible material loaded under the same conditions would be for the length to remainconstant (a result the Busby and Burton tests approached with increasing donor age). Knowingthe vessels to be nonlinear, and suspecting anisotropy based on our findings here, it is notpossible to quantitatively interpret and compare the observations of Busby and Burton to thecurrent data without more detail from their experiments. Based on previous work from ourlaboratory showing similar axial response characteristics for arteries from the Circle of Willisand the surface of the temporal lobe17, we expect that multi-axial response would also besimilar for arteries of different size, but this may not necessarily be true. It thus remainsuncertain whether findings of anisotropy in the smaller vessels are also applicable to largearteries such as those tested by Busby and Burton.
While the current results strongly suggest the presence of anisotropy in these vessels,Humphrey and Yin11 have cautioned against drawing conclusions supporting materialpreferences in the absence of equibiaxial protocols. Similarly, Weizsacker and Pinto22 havepointed out that slight changes in constraints imposed in an orthogonal direction may causelarge changes in the measured response and lead to changes in apparent anisotropy. While itis true that the applied protocols did not produce equibiaxial conditions, a few observationshelp alleviate concern that we’ve drawn incorrect conclusions. First, uniaxial responses of thesevessels for the two directions would clearly be different. No inflation tests were conductedwithout length constraint, but it is clear that this would result in a circumferential stress-stretchcurve shifted even further to the right than seen for the constrained tests. Though results werenot reported here, axial stretch tests without pressure constraint were conducted as referencetests, as described in Methods. As expected, these tests similarly resulted in a shift of the axialstress-stretch curve to the right of that from the pressure-constrained axial stretch cases, butthe amount of the shift was small, similar in magnitude to the shift seen between the axialstretch tests constrained at different pressure levels. Second, simulation of equibiaxial tests
Monson et al. Page 9
Ann Biomed Eng. Author manuscript; available in PMC 2009 January 2.
NIH
-PA Author Manuscript
NIH
-PA Author Manuscript
NIH
-PA Author Manuscript

using the presented constitutive model and the optimized coefficients result in a clearlyanisotropic response. Third, the applied experimental protocols explored various combinationsof loading conditions, thus allowing evaluation of sensitivity to imposed constraints. Becauseloading conditions were defined based on pressure and needle displacement, stretch values alsonaturally varied, yet results related to directional differences were consistent across specimens.
In considering the comparison between responses in the axial and circumferential directions,it is important to recognize that somewhat different ranges of deformation were explored forthe two directions. Figures 3 and 4 demonstrate that most of the tested range falls above andbelow the in vivo stretch values for the axial and circumferential directions, respectively. Thiswas a natural consequence both of not pressurizing the vessels too far beyond knownphysiological levels and of stretching vessels far enough axially to avoid buckling duringinflation. Nevertheless, the Fung model coefficients reported in Table 2 are dominated by thecomparatively high stresses and accompanying nonlinearity developed in the axial direction,though testing over a different range would not be expected to change the reported in vivomodulus values. Although not representative of physiological conditions, experimentsincluding greater pressures and circumferential stretch would lead to increased nonlinearity inthe response for that direction and thus larger values for c1. Similarly, a decrease in thedifference between c1 and c2 can be demonstrated by fitting the Fung model to a limited set ofdata for specimen A9. In this case, data were limited to results from the inflation test havingthe lowest axial stretch value and to measurements from axial stretch tests not producing axialstress values greater than the maximum circumferential stress produced during the includedinflation test. Resulting coefficient values were c = 5.34 kPa, c1 = 3.44, c2 = 28.96, and c3 =0.65, showing a reduced difference between c1 and c2 values in comparison to that reportedfor the full A9 dataset in Table 2. It should be noted that a number of different constitutiveequations have been suggested for modeling blood vessel behavior, some of which may modelthe observed response more accurately than Equation 3, but evaluation of constitutive modelswas considered beyond the scope of this paper.
Given the previously reported significance of age on the mechanical properties of the cerebralarteries2, 9, it is interesting that this factor did not appear to be as significant in our results.Similar to our previous findings in uniaxial stretch tests on these vessels17, there was atendency for vessels obtained from older donors to be less compliant, but this was only foundto be true for the axial direction, contrary to the significance of age in the circumferentialdirection reported by Busby and Burton2 as well as by Hayashi et al9. A few factors maycontribute to these differences. As a natural result of the patient population typically undergoingtemporal lobectomy surgery, the range of donor age in the present study is not as broad incomparison to the other two investigations. In addition, it may be that large cerebral vesselsare more susceptible to age-related disease or changes in the vessel wall. Finally, the previousinvestigators focus much of their reports on findings observed using parameters not normalizedby wall thickness. Both groups, however, note circumferential modulus values to be largelyindependent of age. Hayashi et al additionally found wall stress to be relatively constant overthe first 40 years of life. These observations together suggest that age is an important factor invessel mechanical response, but that its influence is less significant for normalized parameterssuch as stress and modulus, consistent with the concept that the vessel wall seeks to maintaina homeostatic stress level. There did not appear to be any age-related dimensional changes inthe arteries tested here, but limitations inherent to obtaining vessels from surgery, along withthe anatomical variability of the vasculature on the surface of the brain, make it impossible toobtain the same specimen from each patient. Nevertheless, given the similarity of the large andsmall vessels to longitudinal deformation17, we expect that age does play a role in the responseof the cortical arteries, though perhaps a limited one in comparison to larger arteries.
Monson et al. Page 10
Ann Biomed Eng. Author manuscript; available in PMC 2009 January 2.
NIH
-PA Author Manuscript
NIH
-PA Author Manuscript
NIH
-PA Author Manuscript

Results reported for large axial deformation are similar to what we have previously reportedfor unpressurized vessels16, 17, i.e. the initial nonlinear component of the stress-stretch curvequickly becomes linear with greater deformation. Previous comparisons of our unpressurizeddata to pressurized results from Circle of Willis artery tests by Chalupnik et al3 suggested thatpressure would produce a leftward shift in response. This is consistent with the data presentedhere. Although the failure tests here were conducted at quasi-static rates, Chalupnik et alreported a lack of strain rate dependence in fluid-filled vessels at rates consistent with trauma,similar to our previous work on unpressurized vessels.
While some natural variation in response between biological specimens is expected, thedemonstration of increased uniformity in stress-stretch response as a result of utilizing the invivo state as the reference configuration for stretch values is interesting and would appear tohave two possible explanations – one, that variability is introduced in identifying the zero-loadreference, or two, that there is some significant natural variability in the sub-in vivo behaviorof these arteries. While each may contribute, we are confident that some of the observed scatteris associated with zero-load reference definition. Identification of the zero-load reference forthe axial direction was often difficult since many of the vessels displayed some degree ofcurvature along their length and were thus not tested in their natural geometry. In addition, itis possible that vessels were gripped non-uniformly by the suture at the attachment points.Adventitia is a rough, fibrous material, and its fibers can get caught up differently around thesuture. Such end effects are expected to have been minimized by preconditioning and byfocusing analysis on specimen midsections, but natural curvature and slightly uneven endattachment should be recognized as potentially confounding factors in identification of thezero-load length. Interestingly, there is no similar difficulty in defining the zero-loadcircumferential reference, since it is measured directly from the specimen cross-section, yetthe level of scatter in the circumferential data appears to be at least as great as that for the axialdirection. Variation in the circumferential direction would result if cross-sections taken fromthe end of the vessel did not accurately reflect the geometry of the vessel midsection measuredduring testing. While this would not be expected for the short vessel lengths tested here, it ispossible that preconditioning of the tested segment may produce a slight change in zero-loaddiameter not reflected in the reference section, especially considering the high compliance ofthe vessel wall at low pressures. While there appears to be no reason to suspect that sub-physiological response of these specimens would be particularly variable, quantification oferror in identifying the circumferential reference would lend insight into whether or not this isthe case. In future testing, it is thus recommended that the preconditioned segment outerdiameter, measured under conditions of zero pressure, be compared to outer diameter of a cutcross-section.
In considering variations, another potential limitation of the reported data is the unknowninfluence of vessel branches. The cerebral arteries branch frequently enough that it isuncommon to find a segment of testable length not having branches. As a result, our analysiswas focused on regions away from branches, but the extent of any possible branch influencehas not been defined. Based on preliminary evaluation of branch effects in our laboratory,however, it appears that the data reported here are not influenced by branches.
While stress-stretch results for specimens A8 and A12 (Fig. 4) do not appear to be particularlydifferent from the other specimens, it is important to note that the presented response does notrigorously represent the behavior of these two vessels, due to their relatively non-circular cross-sections. The equations utilized in the present analysis assume circularity, and uniformity ofstress around the circumference (for a given radius), whereas the stress at the mid-wall locationfor elliptical vessels would be expected to vary around the circumference14. Calculating anaverage diameter from measurements of the major and minor axes of an ellipse, as was donehere, results in stress predictions between those associated with the two extremes.
Monson et al. Page 11
Ann Biomed Eng. Author manuscript; available in PMC 2009 January 2.
NIH
-PA Author Manuscript
NIH
-PA Author Manuscript
NIH
-PA Author Manuscript

The observed variation of opening angle in these specimens was unexpected but notunprecedented; Schulze-Bauer et al20 recently reported a large range of opening angles inhuman iliac arteries. It is unclear, however, whether or not it would be appropriate to modelthrough-wall stresses using these measurements. Further, the observation of sections from twospecimens taking on non-circular shapes and demonstrating “folds” in the vessel wall at somelocations is similarly puzzling, though this suggests that there may be some variation inproperties around the circumference of these vessels, perhaps especially when smooth muscleis not active. Such would be unexpected, but the relatively small number of layers of medialsmooth muscle and the thinness of the vessel could potentially contribute to any suchinhomogeneity. This requires further investigation.
While the presented findings represent an important step toward a more completeunderstanding of cerebral vessel response, it is clear that further definition of these vessels isneeded. In addition to issues already discussed here, other areas of study that will enhanceability to prevent and treat cerebrovascular injury and disease include accounting forinteractions with surrounding tissues, characterizing branch point mechanics, and isolatingindividual vessel layer response.
AcknowledgementsFunding for this study was provided by the Centers for Disease Control and Prevention (R49 CE000460) and theNational Institutes of Health (1K25HD048643-01A1). The authors would like to express their appreciation to thefellows and residents of the UCSF Neurosurgery Department, in particular Karl Sillay, M.D., and Paul House, M.D.,who assisted in the surgical acquisition of tissue. We also greatly appreciate the help of Tyler Siebert and AaronRutman in tissue acquisition and transport.
References1. Alcolado R, Weller RO, Parrish EP, Garrod D. The cranial arachnoid and pia mater in man: anatomical
and ultrastructural observations. Neuropathol Appl Neurobiol 1988;14:1–17. [PubMed: 3374751]2. Busby D, Burton A. The effect of age on the elasticity of the major brain arteries. Can J Physiol
Pharmacol 1965;43:185–202. [PubMed: 14329327]3. Chalupnik, J.; Daly, C.; Merchant, H. Material Properties of Cerebral Blood Vessels. University of
Washington; Seattle: 1971.4. Chuong CJ, Fung YC. On residual stresses in arteries. J Biomech Eng 1986;108:189–192. [PubMed:
3079517]5. Finkelstein, E.; Corso, PS.; Miller, TR. The incidence and economic burden of injuries in the United
States. New York: Oxford University Press; 2006. p. 1876. Finlay HM, McCullough L, Canham PB. Three-dimensional collagen organization of human brain
arteries at different transmural pressures. J Vasc Res 1995;32:301–312. [PubMed: 7578798]7. Gleason RL, Wilson E, Humphrey JD. Biaxial biomechanical adaptations of mouse carotid arteries
cultured at altered axial extension. J Biomech 2007;40:766–776. [PubMed: 16750537]8. Graham, DI. Neuropathology of head injury. In: Nrayan, RK.; Wilberger, JE.; Povlishock, JT., editors.
Neurotrauma. New York: McGraw-Hill; 1996. p. 43-59.9. Hayashi K, Handa H, Nagasawa S, Okumura A, Moritake K. Stiffness and elastic behavior of human
intracranial and extracranial arteries. J Biomech 1980;13:175–179. [PubMed: 7364778]10. Holzapfel GA, Gasser TC, Ogden RW. A new constitutive framework for arterial wall mechanics
and a comparative study of material models. J Elast 2000;61:1, 48.11. Humphrey J, Yin F. Fiber-induced material behavior in composites. Mech Res Commun
1986;13:277–284.12. Humphrey JD. An evaluation of pseudoelastic descriptors used in arterial mechanics. J Biomech Eng
1999;121:259–262. [PubMed: 10211463]13. Humphrey, JD. Cardiovascular Solid Mechanics: Cells, Tissues, and Organs. New York: Springer;
2002. p. 757
Monson et al. Page 12
Ann Biomed Eng. Author manuscript; available in PMC 2009 January 2.
NIH
-PA Author Manuscript
NIH
-PA Author Manuscript
NIH
-PA Author Manuscript

14. Janz RF, Ozpetek S, Ginzton LE, Laks MM. Regional stress in a noncircular cylinder. Biophys J1989;55:173–182. [PubMed: 2930818]
15. Langlois, JA.; Rutland-Brown, W.; Thomas, KE. Traumatic brain injury in the United States:emergency department visits, hospitalizations, and deaths. Centers for Disease Control andPrevention, National Center for Injury Prevention and Control; Atlanta: 2006.
16. Monson KL, Goldsmith W, Barbaro NM, Manley GT. Axial mechanical properties of fresh humancerebral blood vessels. J Biomech Eng 2003;125:288–294. [PubMed: 12751292]
17. Monson KL, Goldsmith W, Barbaro NM, Manley GT. Significance of source and size in themechanical response of human cerebral blood vessels. J Biomech 2005;38:737–744. [PubMed:15713294]
18. Rosamond W, Flegal K, Furie K, Go A, Greenlund K, Haase N, Hailpern SM, Ho M, Howard V,Kissela B, Kittner S, Lloyd-Jones D, McDermott M, Meigs J, Moy C, Nichol G, Donnell C, RogerV, Sorlie P, Steinberger J, Thom T, Wilson M, Hong Y. Heart disease and stroke statistics--2008update: a report from the American Heart Association Statistics Committee and Stroke StatisticsSubcommittee. Circulation 2008;117:e25–146. [PubMed: 18086926]
19. S. A. E. SAE Handbook. Warrendale, PA: Society of Automotive Engineers; 1995. Instrumentationfor impact test. Part 1: Electronic instrumentation, SAE J211-1; p. 384-392.
20. Schulze-Bauer CA, Morth C, Holzapfel GA. Passive biaxial mechanical response of aged human iliacarteries. J Biomech Eng 2003;125:395–406. [PubMed: 12929245]
21. Vaishnav RN, Young JT, Patel DJ. Distribution of stresses and of strain-energy density through thewall thickness in a canine aortic segment. Circ Res 1973;32:577–583. [PubMed: 4713199]
22. Weizsacker HW, Pinto JG. Isotropy and anisotropy of the arterial wall. J Biomech 1988;21:477–487.[PubMed: 3209593]
Monson et al. Page 13
Ann Biomed Eng. Author manuscript; available in PMC 2009 January 2.
NIH
-PA Author Manuscript
NIH
-PA Author Manuscript
NIH
-PA Author Manuscript

Figure 1.(a) Mechanical testing apparatus and (b) accompanying close-up of specimen A9, with (c)zoomed-in image showing microspheres. Microspheres labeled 1 and 2 were used to determineaxial stretch for this specimen. For reference, outer diameter of the specimen as shown in (b)is approximately 0.7 mm.
Monson et al. Page 14
Ann Biomed Eng. Author manuscript; available in PMC 2009 January 2.
NIH
-PA Author Manuscript
NIH
-PA Author Manuscript
NIH
-PA Author Manuscript

Figure 2.Stretch ratios for inflation and axial stretch tests on representative specimen (A7). Traces arenumbered in the order in which tests were run.
Monson et al. Page 15
Ann Biomed Eng. Author manuscript; available in PMC 2009 January 2.
NIH
-PA Author Manuscript
NIH
-PA Author Manuscript
NIH
-PA Author Manuscript
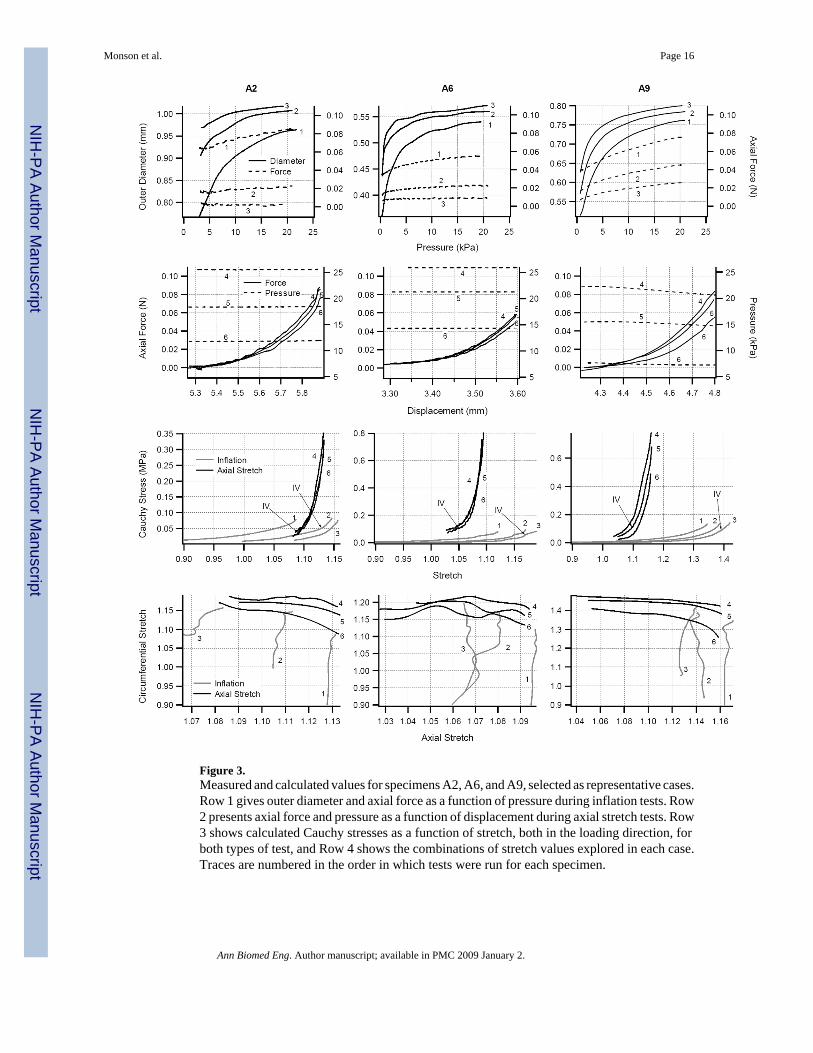
Figure 3.Measured and calculated values for specimens A2, A6, and A9, selected as representative cases.Row 1 gives outer diameter and axial force as a function of pressure during inflation tests. Row2 presents axial force and pressure as a function of displacement during axial stretch tests. Row3 shows calculated Cauchy stresses as a function of stretch, both in the loading direction, forboth types of test, and Row 4 shows the combinations of stretch values explored in each case.Traces are numbered in the order in which tests were run for each specimen.
Monson et al. Page 16
Ann Biomed Eng. Author manuscript; available in PMC 2009 January 2.
NIH
-PA Author Manuscript
NIH
-PA Author Manuscript
NIH
-PA Author Manuscript

Figure 4.Cauchy stress-stretch response from inflation and axial stretch tests for all specimens notincluded in Fig. 3. Specimens are identified at the top of each graph.
Monson et al. Page 17
Ann Biomed Eng. Author manuscript; available in PMC 2009 January 2.
NIH
-PA Author Manuscript
NIH
-PA Author Manuscript
NIH
-PA Author Manuscript

Figure 5.Measured and predicted axial and circumferential stress values from inflation (1–3) and axialstretch (4–6) tests on specimen A6.
Monson et al. Page 18
Ann Biomed Eng. Author manuscript; available in PMC 2009 January 2.
NIH
-PA Author Manuscript
NIH
-PA Author Manuscript
NIH
-PA Author Manuscript

Figure 6.Axial and circumferential modulus values at in vivo conditions in axial stretch and inflationtests, respectively.
Monson et al. Page 19
Ann Biomed Eng. Author manuscript; available in PMC 2009 January 2.
NIH
-PA Author Manuscript
NIH
-PA Author Manuscript
NIH
-PA Author Manuscript

Figure 7.Circumferential Cauchy stress in inflation tests for cases having axial stretch ratios near theaxial in vivo stretch ratio plotted against the circumferential stretch ratio referencing the (a)zero-load and (b) in vivo configurations.
Monson et al. Page 20
Ann Biomed Eng. Author manuscript; available in PMC 2009 January 2.
NIH
-PA Author Manuscript
NIH
-PA Author Manuscript
NIH
-PA Author Manuscript

Figure 8.Axial stress from axial stretch tests conducted at physiological pressures plotted against theaxial stretch ratio referencing the (a) zero-load and (b) in vivo states.
Monson et al. Page 21
Ann Biomed Eng. Author manuscript; available in PMC 2009 January 2.
NIH
-PA Author Manuscript
NIH
-PA Author Manuscript
NIH
-PA Author Manuscript

Figure 9.Axial stress in axial stretch tests to failure plotted against axial stretch referencing the in vivoconfiguration.
Monson et al. Page 22
Ann Biomed Eng. Author manuscript; available in PMC 2009 January 2.
NIH
-PA Author Manuscript
NIH
-PA Author Manuscript
NIH
-PA Author Manuscript

Figure 10.Whole and radially cut vessel cross sections in (a) a relatively circular case (A6) and (b) a lesscircular case (A8) displaying “folds” that persist in the cut sections. Scale bars (0.5 mm) applyto (a) and (b) separately. (Dark, non-uniform coloring of tissue in part a is due to use of blackdye to enhance contrast.)
Monson et al. Page 23
Ann Biomed Eng. Author manuscript; available in PMC 2009 January 2.
NIH
-PA Author Manuscript
NIH
-PA Author Manuscript
NIH
-PA Author Manuscript

NIH
-PA Author Manuscript
NIH
-PA Author Manuscript
NIH
-PA Author Manuscript
Monson et al. Page 24Ta
ble
1D
etai
led
data
for s
peci
men
s A2,
A6,
and
A9,
alon
g w
ith su
mm
ary
data
for a
ll sp
ecim
ens.
From
left
to ri
ght,
the t
able
giv
e age
, sex
, cro
ss-
sect
iona
l are
a, z
ero-
load
ext
erna
l dia
met
er a
nd w
all t
hick
ness
, ope
ning
ang
le, c
ircum
fere
ntia
l stre
tch
betw
een
zero
-stre
ss a
nd z
ero-
load
conf
igur
atio
n, a
nd z
ero-
load
leng
th.
Age
Sex
A (m
m2 )
De (
mm
)h
(mm
)θ
(deg
)λ θ
,0L 0
(mm
)
A2
17M
0.32
50.
920.
1414
01.
055.
11A
651
M0.
090
0.51
0.07
145
1.01
3.23
A9
18F
0.13
60.
610.
0810
51.
054.
05Su
mm
ary
data
for a
ll sp
ecim
ens
max
625
F0.
325
0.92
0.18
180
1.14
6.98
min
166
M0.
090
0.51
0.06
−17
1.00
3.23
avg
37.6
0.18
00.
670.
1110
71.
065.
03
Ann Biomed Eng. Author manuscript; available in PMC 2009 January 2.

NIH
-PA Author Manuscript
NIH
-PA Author Manuscript
NIH
-PA Author Manuscript
Monson et al. Page 25Ta
ble
2U
ncon
stra
ined
Fun
g m
odel
(Eq.
3) c
oeff
icie
nt v
alue
s res
ultin
g fr
om fi
tting
pro
cedu
re o
f dat
a fr
om b
oth
infla
tion
and
axia
l stre
tch
test
s.χ2
is a
goo
dnes
s-of
-fit
mea
sure
whi
ch d
ecre
ases
in m
agni
tude
with
qua
lity
of fi
t.
Spec
A1
A2
A3
A4
A5
A6
A7
A8
A9
A10
A11
A12
c (k
Pa)
0.16
1.16
3.75
1.5
15.7
72.
786.
580.
988.
906.
792.
482.
37c1
11.3
213
.54
3.13
2.48
6.73
5.36
32.3
23.
511.
682.
022.
277.
86c2
126.
6911
1.25
171.
8347
.68
188.
9219
9.41
105.
3018
8.27
42.3
926
.11
259.
4862
3.14
c314
.44
−0.3
6−5
.51
−0.4
7−1
3.71
6.73
18.0
5−1
2.79
0.01
−0.0
1−0
.78
−28.
49χ2
0.05
0.39
0.07
1.94
0.92
0.54
0.15
0.23
0.86
0.96
0.28
0.16
Ann Biomed Eng. Author manuscript; available in PMC 2009 January 2.


