Embed Size (px)
Citation preview
Big Data Algorithm Design and Application
SIGBPS Workshop on Business Processes and Services Tutorial, Auckland, 2014
Kunpeng Zhang Assistant Professor
Information and Decision Sciences University of Illinois at Chicago
December, 2014

More about me…
• Past big data analytics teaching experience o Several semester-long big data courses
o http://kzhang6.people.uic.edu/teaching/ids594_f14/ o Tutorials on big data algorithm and application
o http://kzhang6.people.uic.edu/tutorial/amcis2014.html
• Past big data analytics research experience o http://kzhang6.people.uic.edu/research.html
What we’ll cover…
• Big data overview • Hadoop overview
o Framework o MapReduce programming
• Applications o Scalable clustering algorithm: K-Means o Iterative graph algorithm: single source shortest path o Scalable recommender system: Item-based
collaborative filtering
Focus on MapReduce-based algorithm design
We can not cover all…

Big data
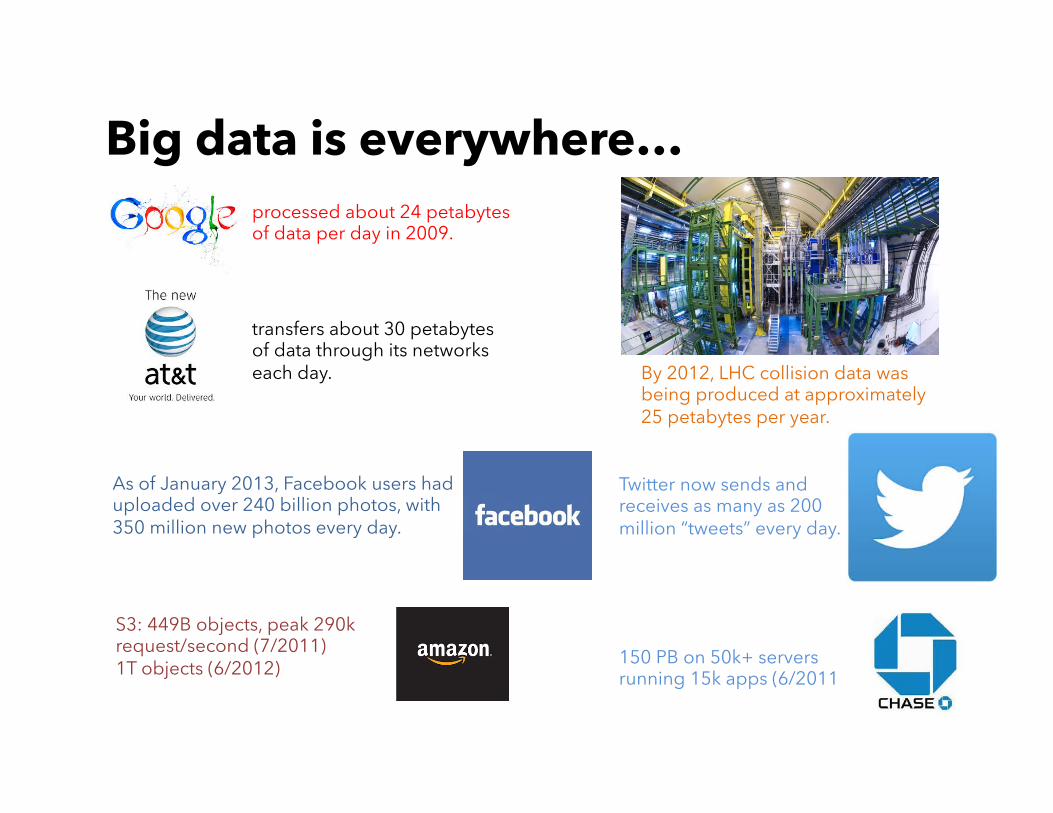
Big data is everywhere… processed about 24 petabytes of data per day in 2009.
transfers about 30 petabytes of data through its networks each day.
As of January 2013, Facebook users had uploaded over 240 billion photos, with 350 million new photos every day.
S3: 449B objects, peak 290k request/second (7/2011) 1T objects (6/2012)
By 2012, LHC collision data was being produced at approximately 25 petabytes per year.
Twitter now sends and receives as many as 200 million “tweets” every day.
150 PB on 50k+ servers running 15k apps (6/2011)
Why big data?
Science Engineering Business Healthcare …
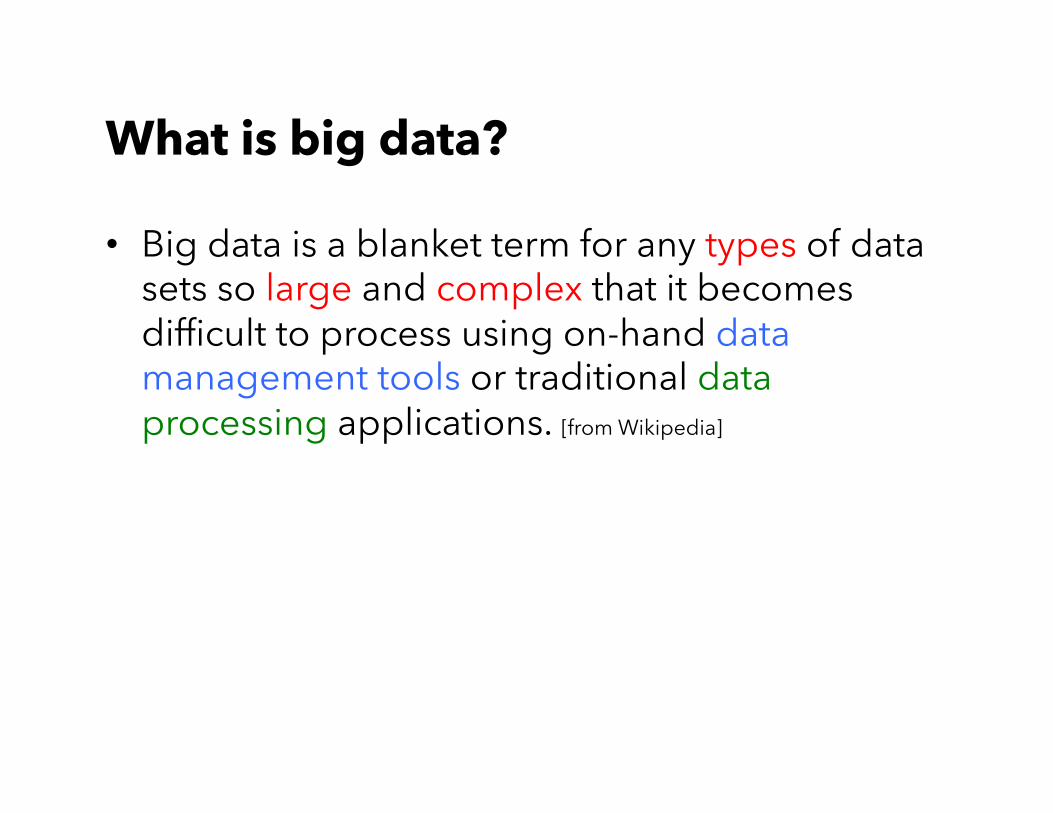
What is big data?
• Big data is a blanket term for any types of data sets so large and complex that it becomes difficult to process using on-hand data management tools or traditional data processing applications. [from Wikipedia]
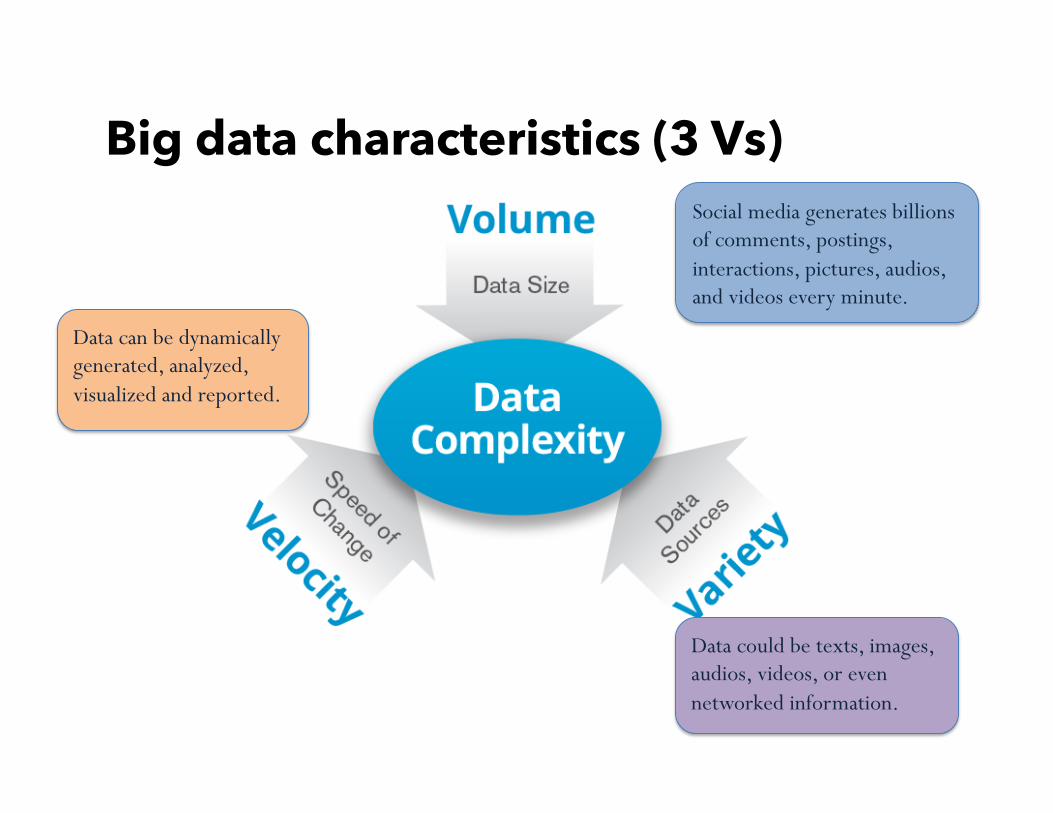
Big data characteristics (3 Vs) Social media generates billions of comments, postings, interactions, pictures, audios, and videos every minute.
Data could be texts, images, audios, videos, or even networked information.
Data can be dynamically generated, analyzed, visualized and reported.
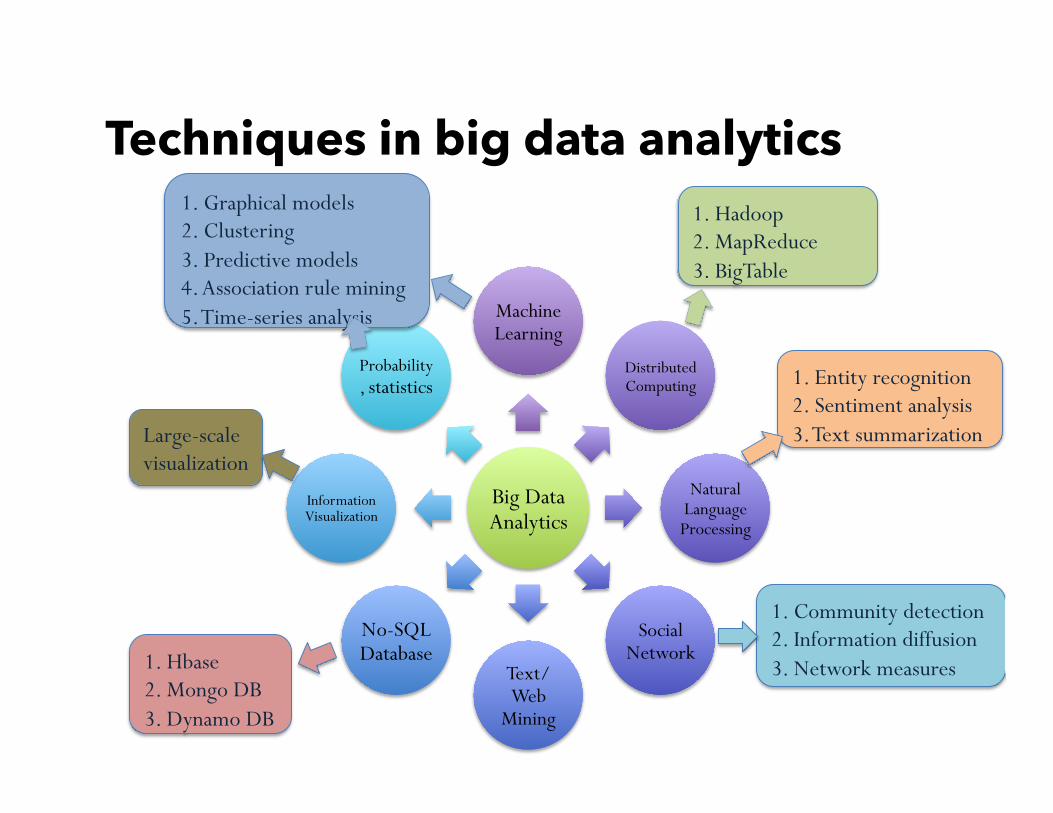
Big Data Analytics
Machine Learning
Distributed Computing
Natural Language Processing
Social Network
Text/Web
Mining
No-SQL Database
Information Visualization
Probability, statistics
1. Graphical models 2. Clustering 3. Predictive models 4. Association rule mining 5. Time-series analysis
1. Entity recognition 2. Sentiment analysis 3. Text summarization
1. Community detection 2. Information diffusion 3. Network measures
1. Hbase 2. Mongo DB 3. Dynamo DB
1. Hadoop 2. MapReduce 3. BigTable
Large-scale visualization
Techniques in big data analytics
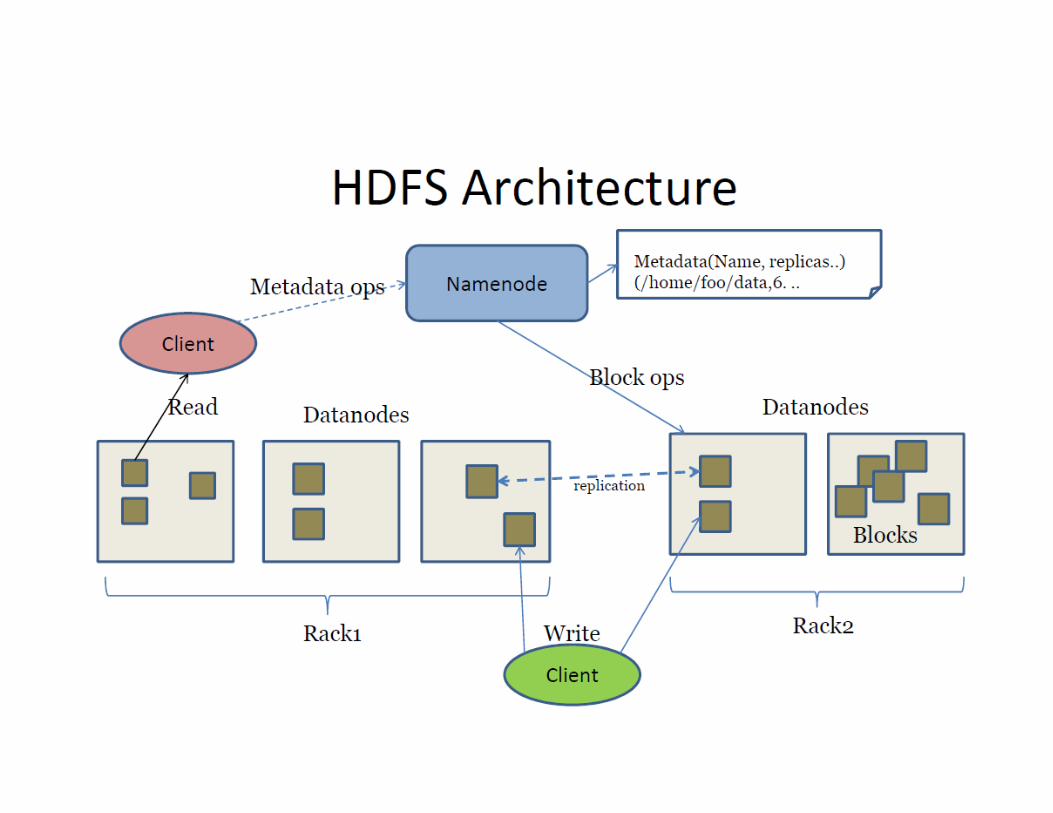
• Hadoop is a software framework for distributed processing of large datasets across large clusters of computers.
• It is based on a simple programming model called MapReduce.
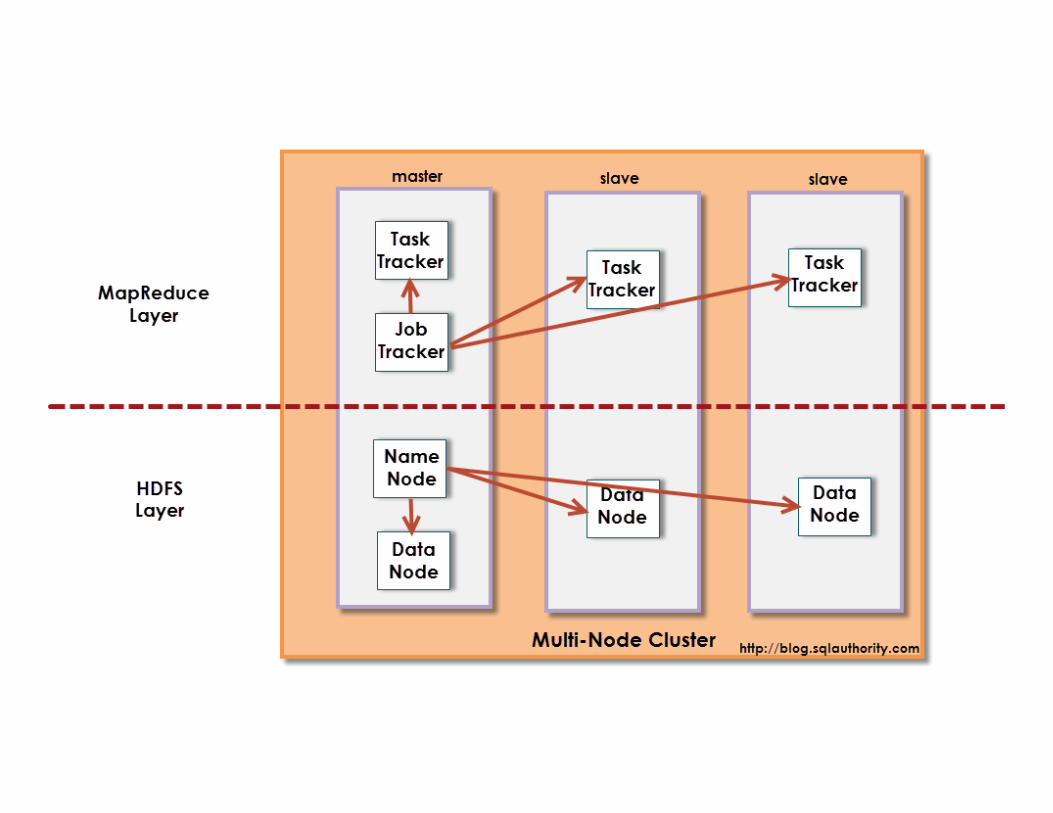
• It has two main layers: o Distributed file system (HDFS) o Execution engine (MapReduce)
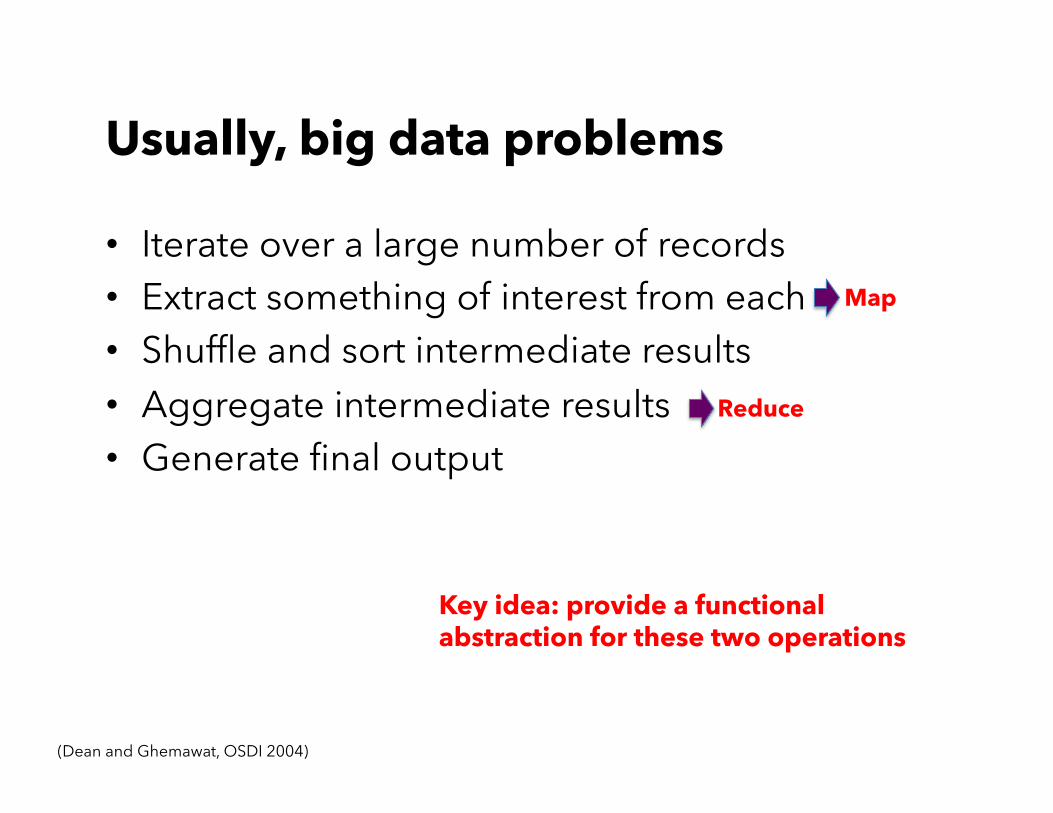
Usually, big data problems
• Iterate over a large number of records • Extract something of interest from each • Shuffle and sort intermediate results • Aggregate intermediate results • Generate final output
(Dean and Ghemawat, OSDI 2004)
Map
Reduce
Key idea: provide a functional abstraction for these two operations
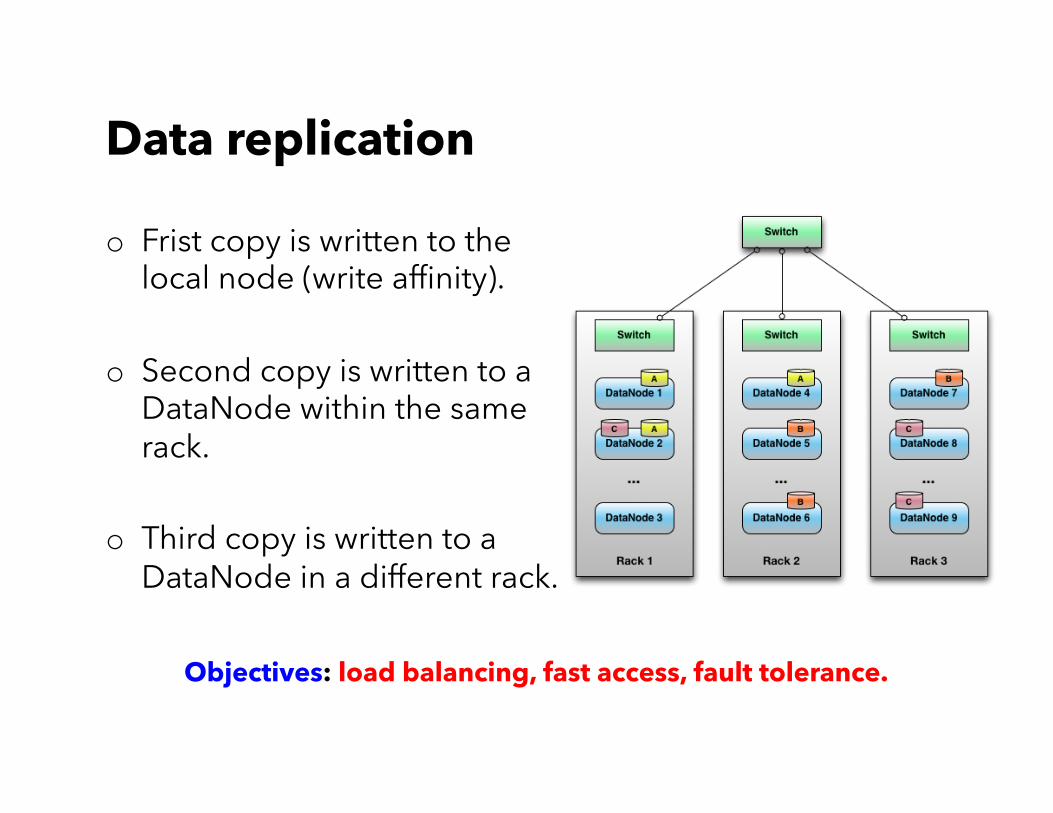
o Frist copy is written to the local node (write affinity).
o Second copy is written to a DataNode within the same rack.
o Third copy is written to a DataNode in a different rack.
Data replication
Objectives: load balancing, fast access, fault tolerance.
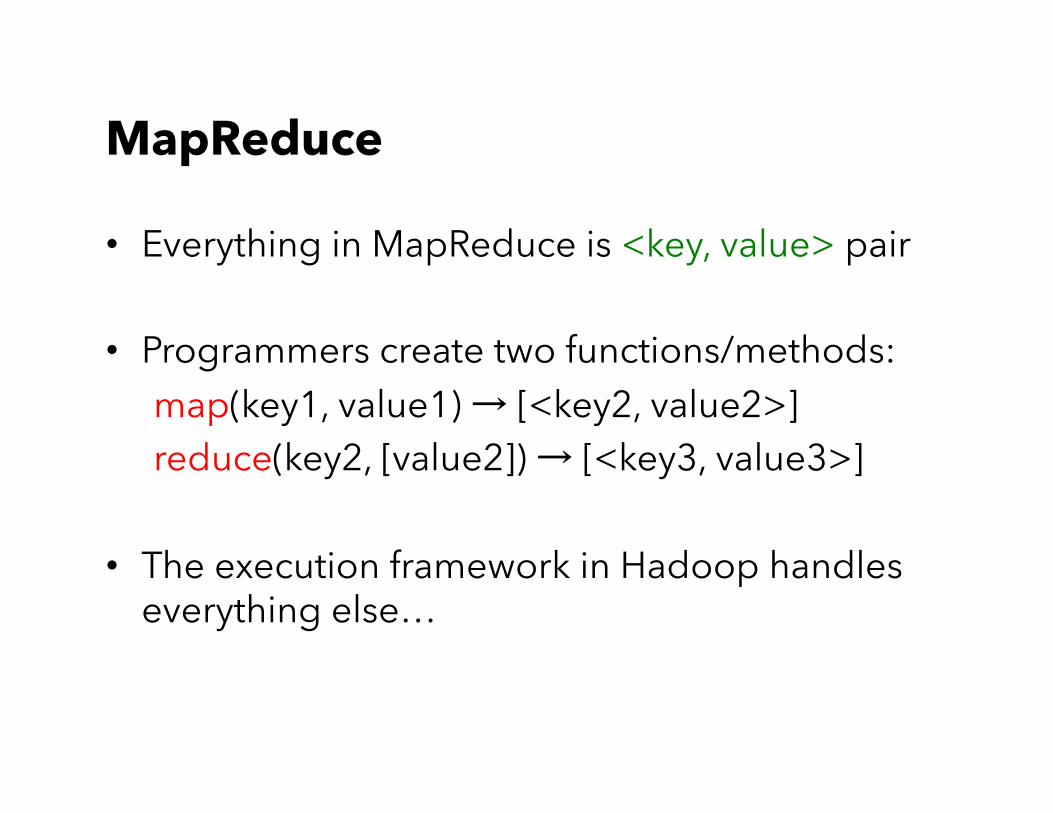
MapReduce
• Everything in MapReduce is <key, value> pair
• Programmers create two functions/methods: map(key1, value1) → [<key2, value2>] reduce(key2, [value2]) → [<key3, value3>]
• The execution framework in Hadoop handles everything else…
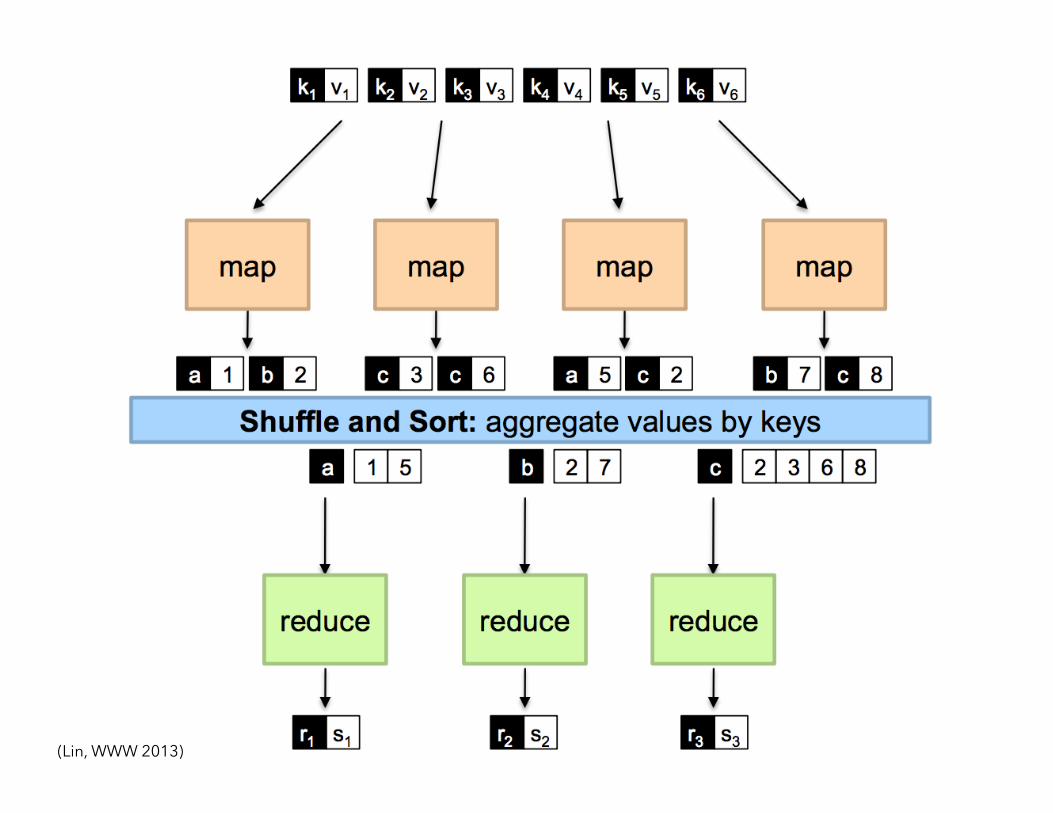
(Lin, WWW 2013)
MapReduce
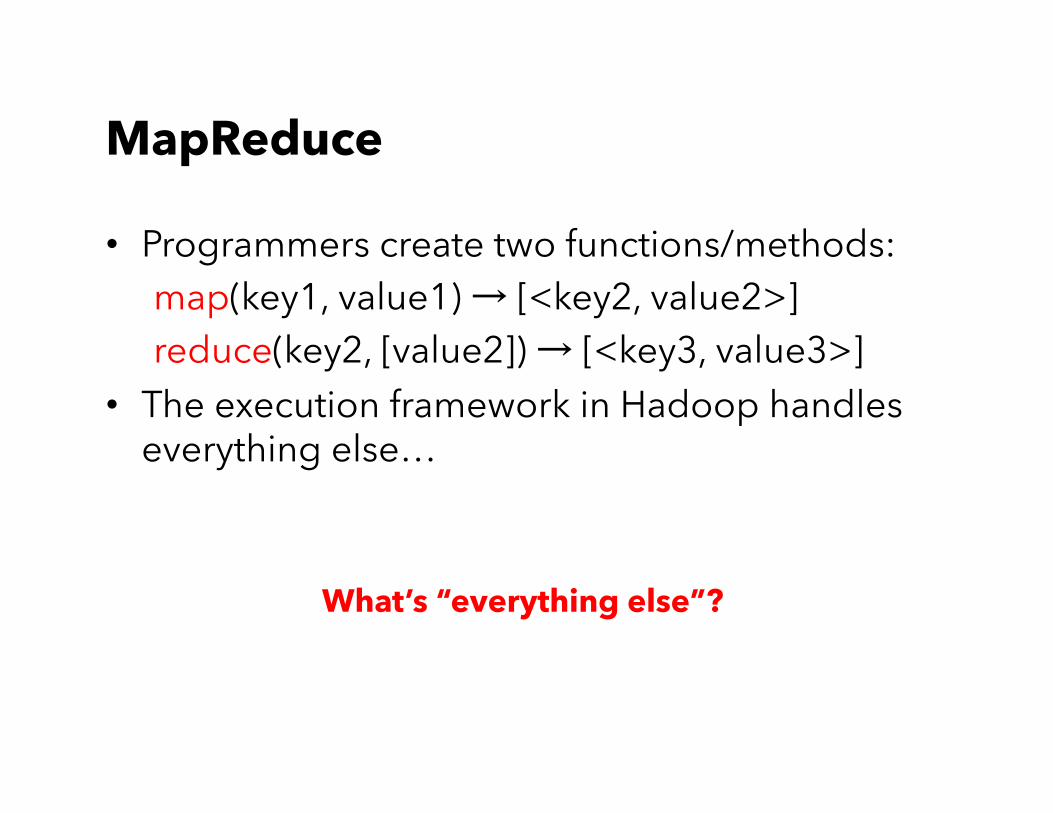
• Programmers create two functions/methods: map(key1, value1) → [<key2, value2>] reduce(key2, [value2]) → [<key3, value3>]
• The execution framework in Hadoop handles everything else…
What’s “everything else”?
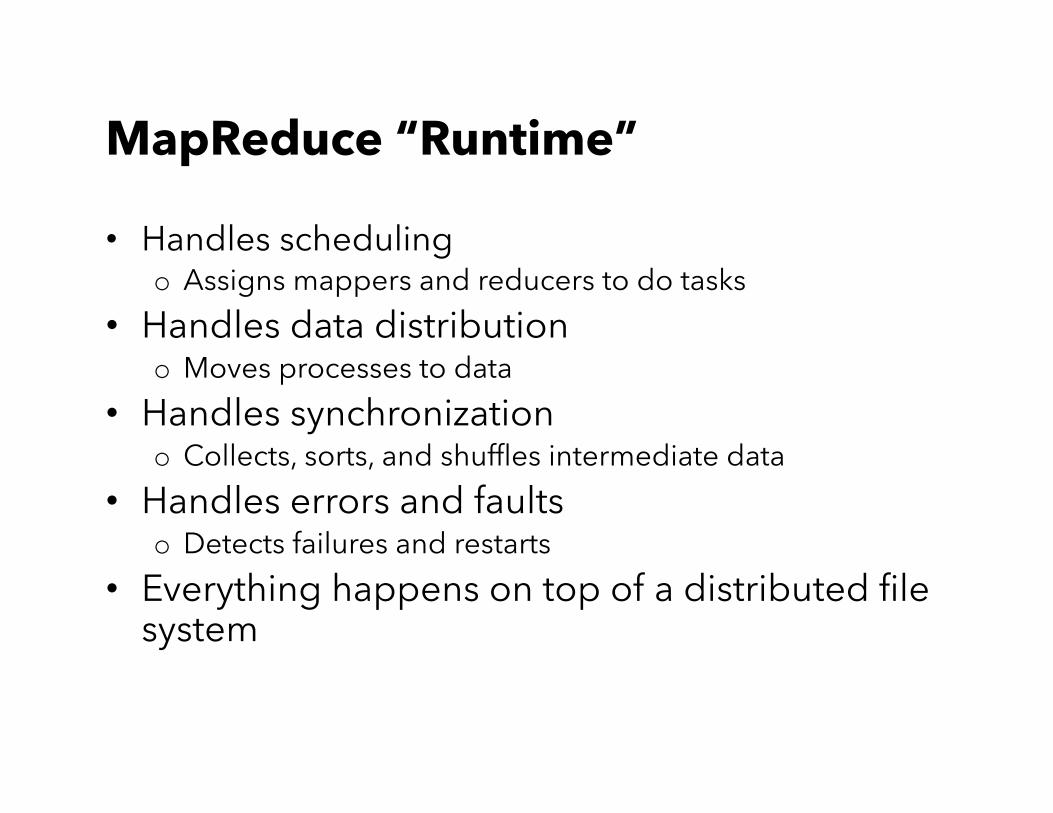
MapReduce “Runtime”
• Handles scheduling o Assigns mappers and reducers to do tasks
• Handles data distribution o Moves processes to data
• Handles synchronization o Collects, sorts, and shuffles intermediate data
• Handles errors and faults o Detects failures and restarts
• Everything happens on top of a distributed file system
MapReduce
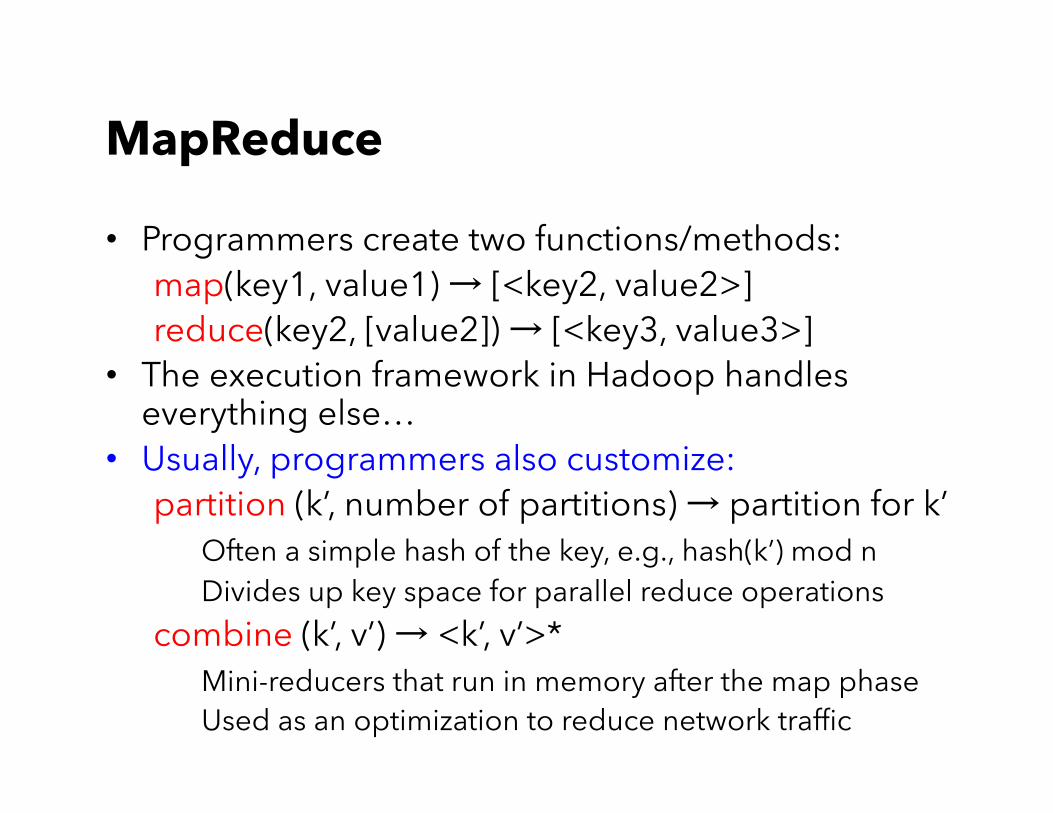
• Programmers create two functions/methods: map(key1, value1) → [<key2, value2>] reduce(key2, [value2]) → [<key3, value3>]
• The execution framework in Hadoop handles everything else…
• Usually, programmers also customize: partition (k’, number of partitions) → partition for k’ Often a simple hash of the key, e.g., hash(k’) mod n Divides up key space for parallel reduce operations combine (k’, v’) → <k’, v’>* Mini-reducers that run in memory after the map phase Used as an optimization to reduce network traffic
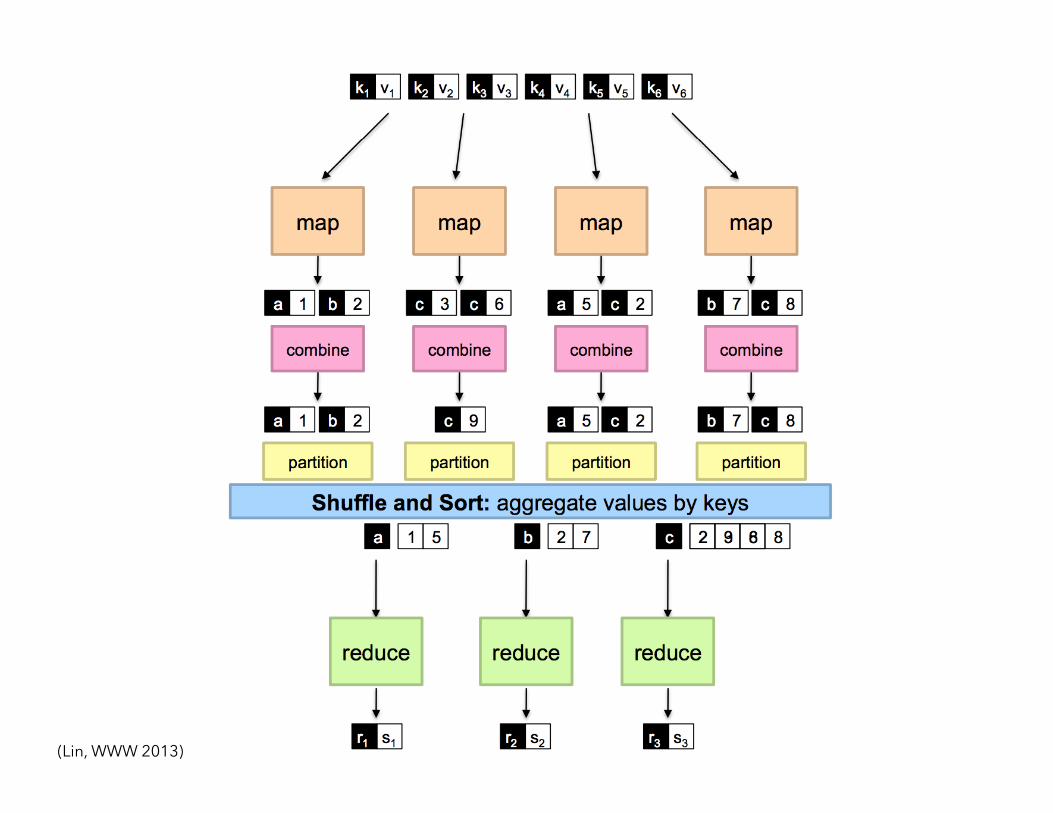
(Lin, WWW 2013)
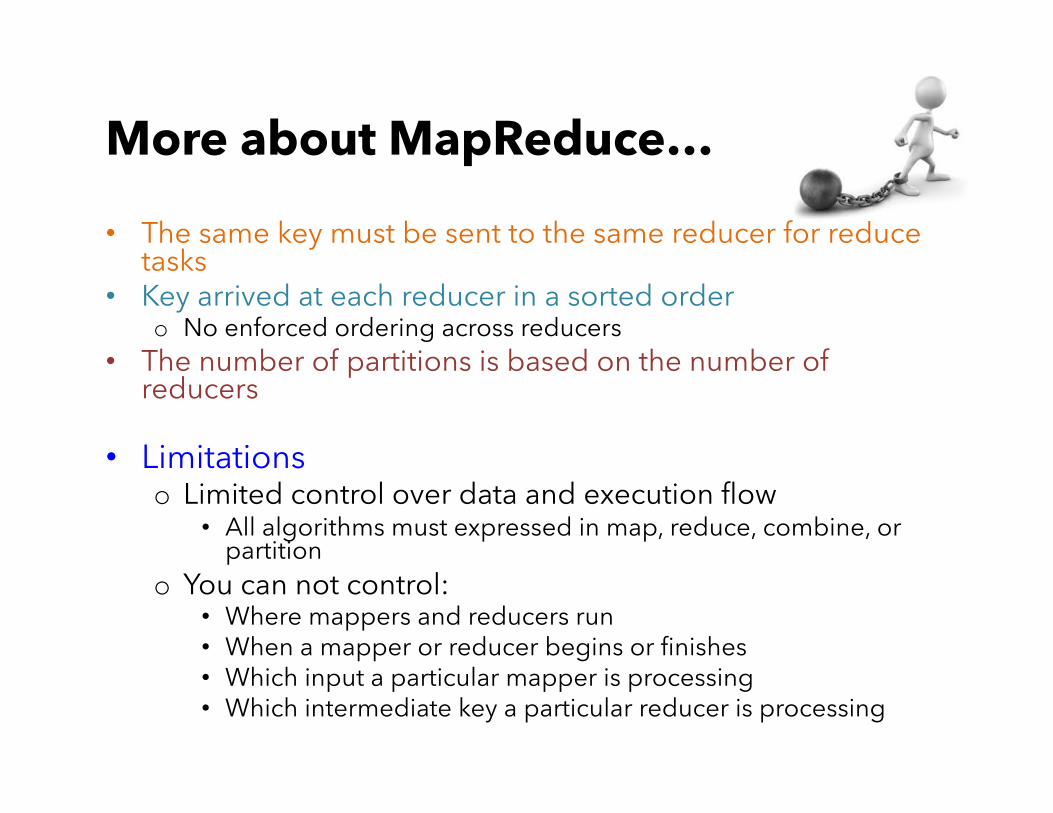
More about MapReduce…
• The same key must be sent to the same reducer for reduce tasks
• Key arrived at each reducer in a sorted order o No enforced ordering across reducers
• The number of partitions is based on the number of reducers
• Limitations o Limited control over data and execution flow
• All algorithms must expressed in map, reduce, combine, or partition
o You can not control: • Where mappers and reducers run • When a mapper or reducer begins or finishes • Which input a particular mapper is processing • Which intermediate key a particular reducer is processing
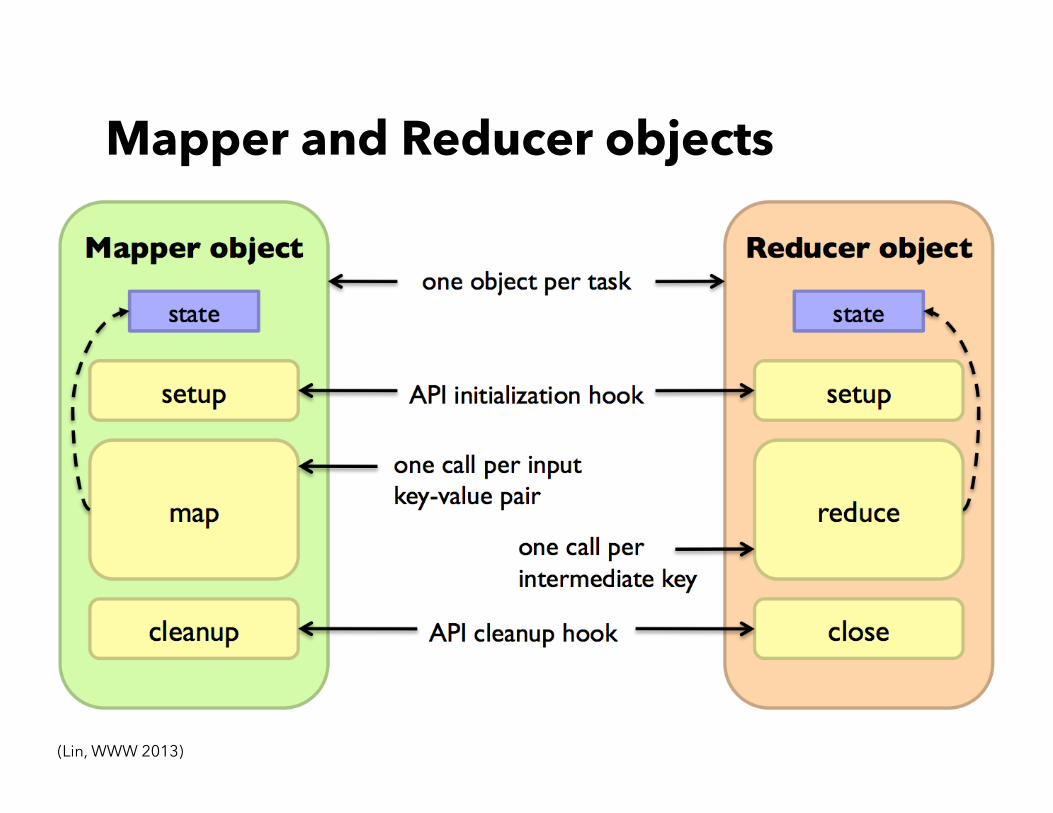
Mapper and Reducer objects
(Lin, WWW 2013)
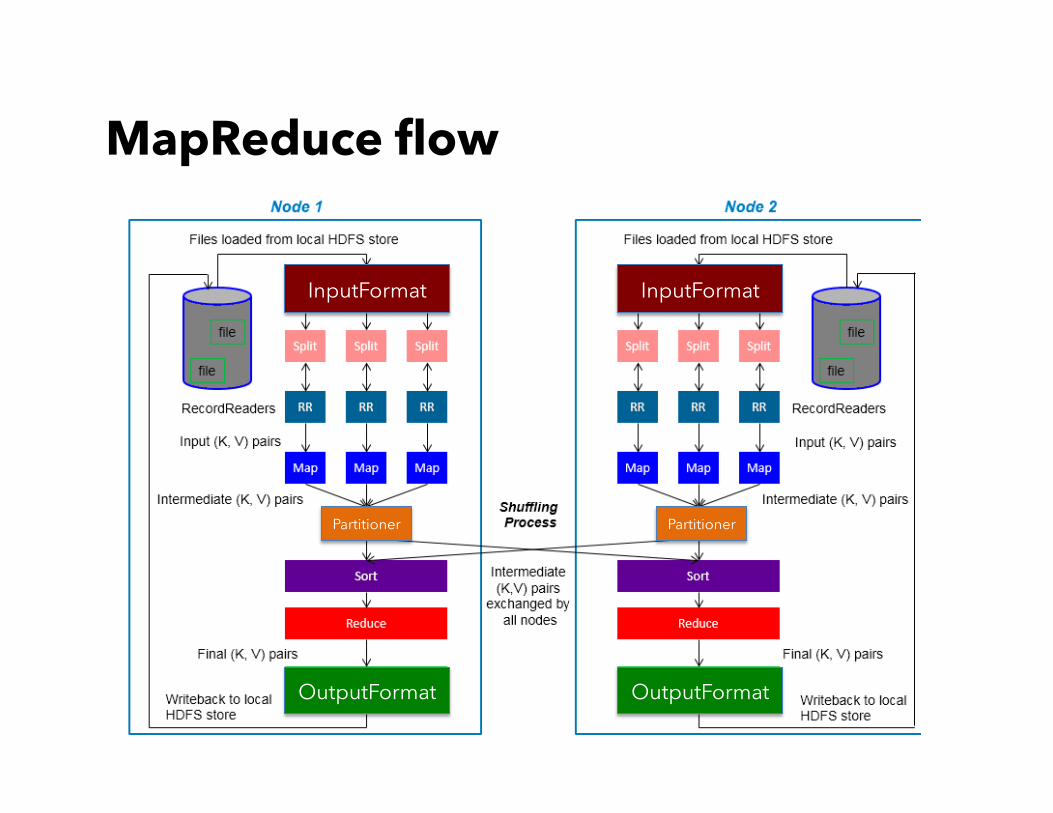
MapReduce flow
InputFormat
Partitioner
OutputFormat
InputFormat
Partitioner
OutputFormat
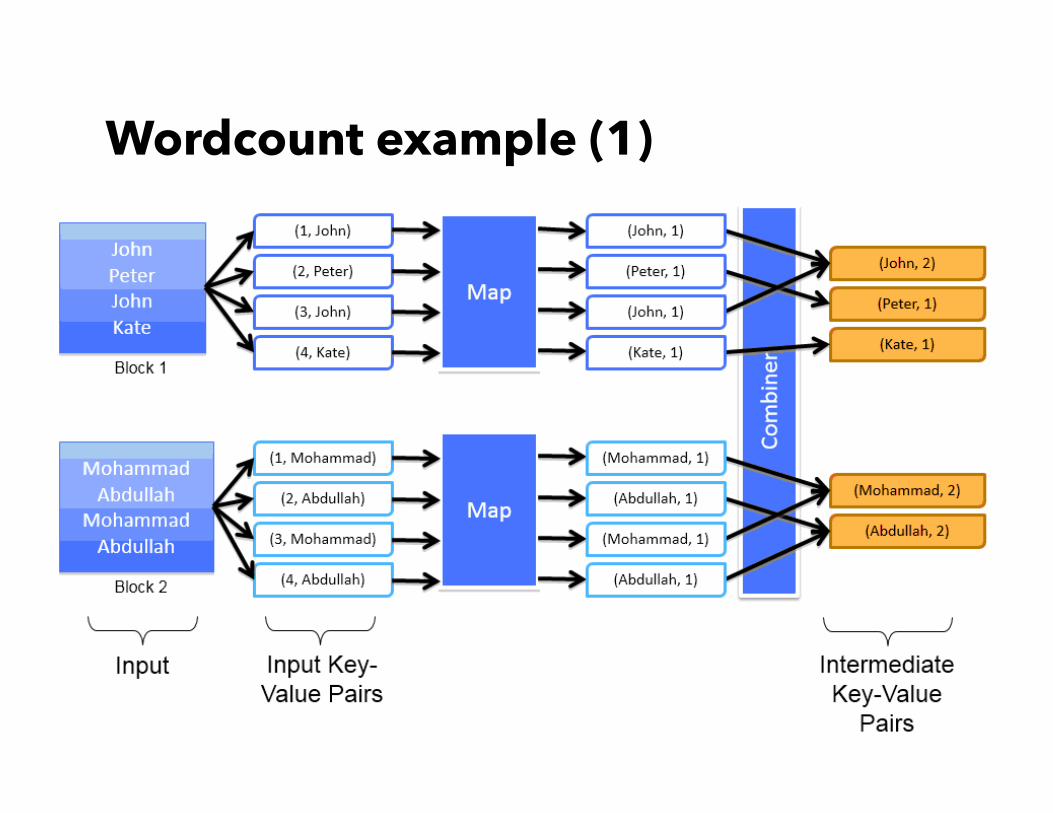
Wordcount example (1)
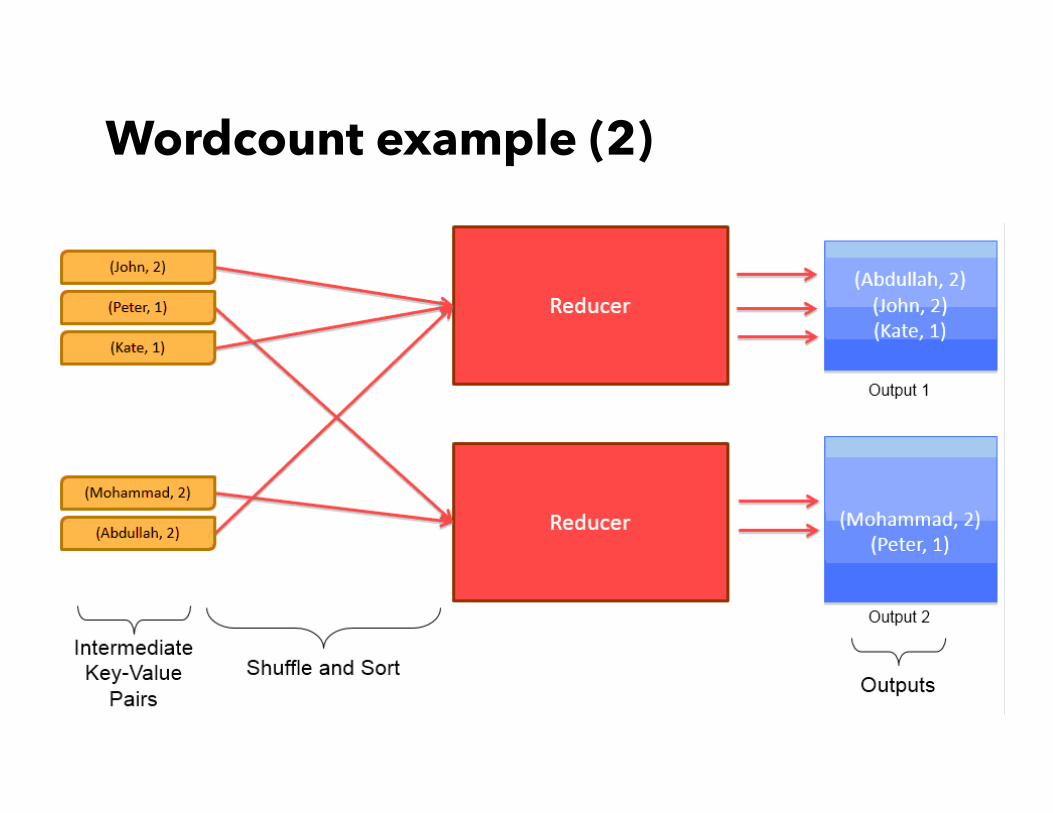
Wordcount example (2)
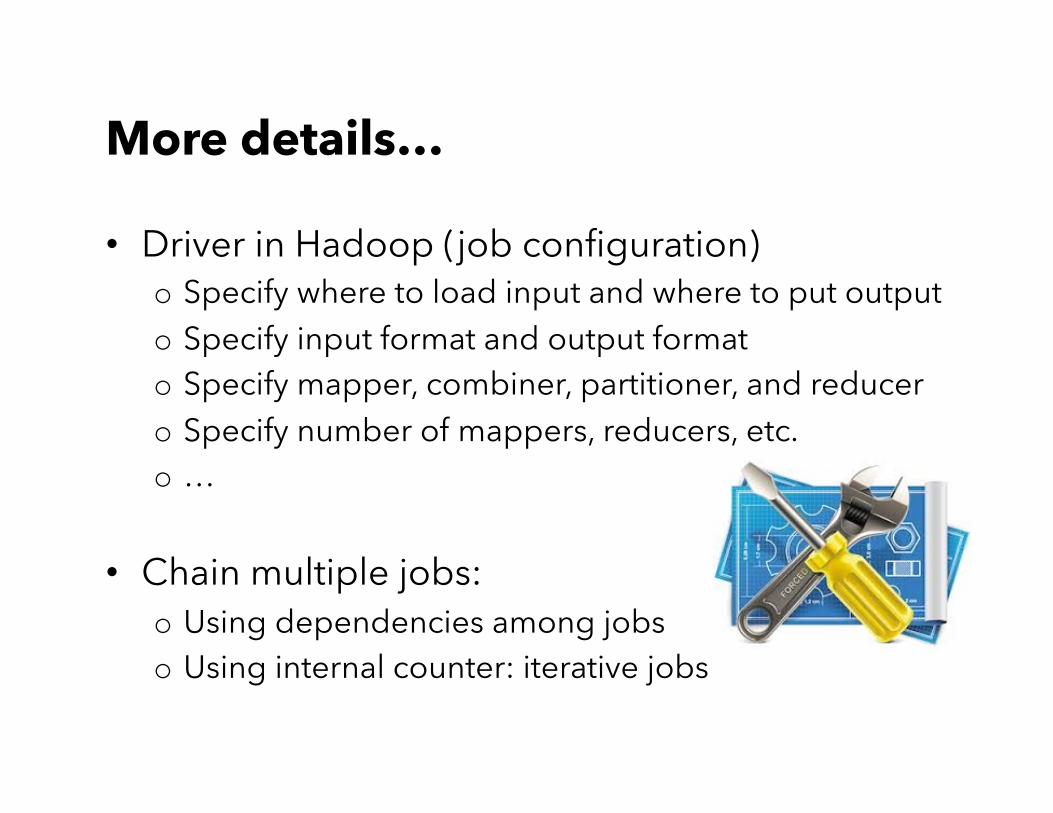
More details…
• Driver in Hadoop (job configuration) o Specify where to load input and where to put output o Specify input format and output format o Specify mapper, combiner, partitioner, and reducer o Specify number of mappers, reducers, etc. o …
• Chain multiple jobs: o Using dependencies among jobs o Using internal counter: iterative jobs
K-Means clustering algorithm (MapReduce)
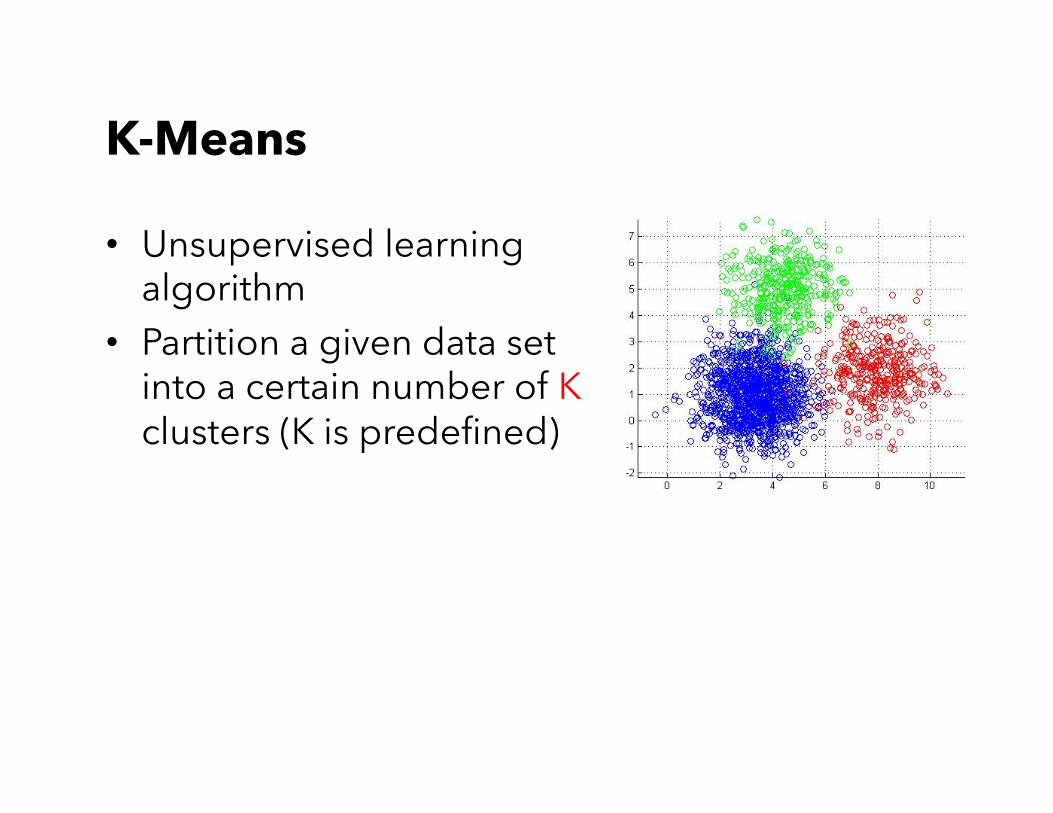
K-Means
• Unsupervised learning algorithm
• Partition a given data set into a certain number of K clusters (K is predefined)
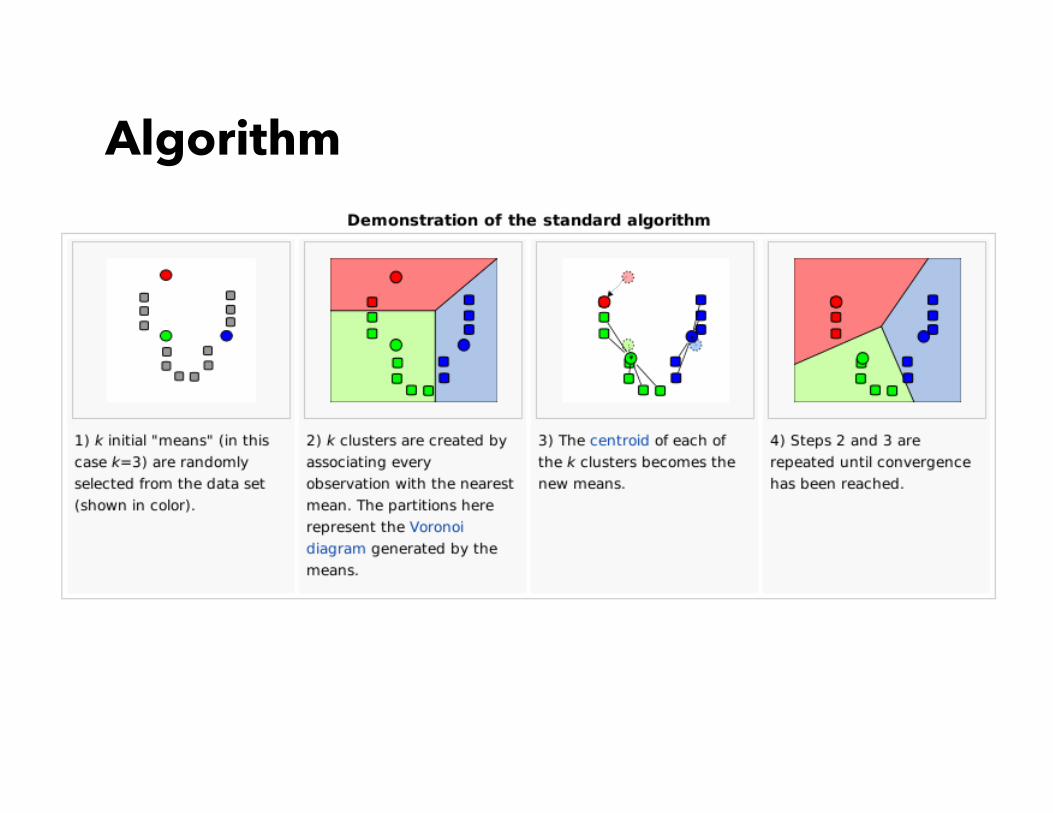
Algorithm
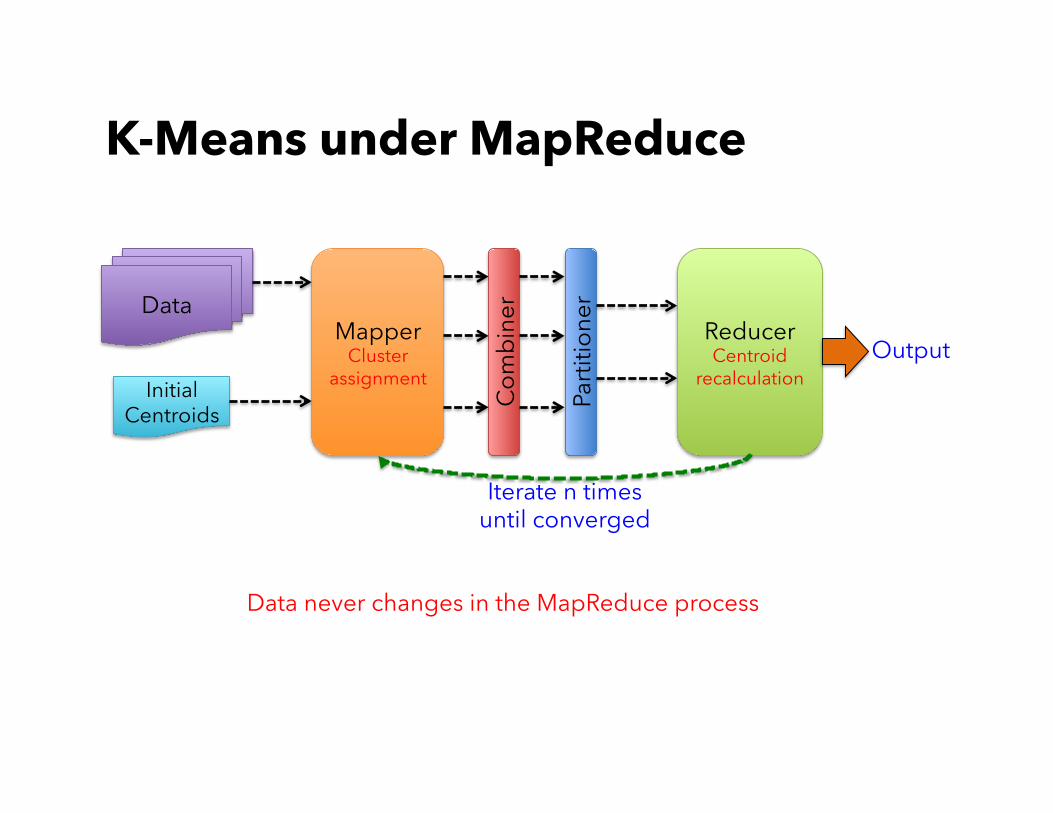
K-Means under MapReduce
Data
Initial Centroids
Mapper Cluster
assignment Reducer Centroid
recalculation
Com
bine
r
Parti
tione
r
Iterate n times until converged
Output
Data never changes in the MapReduce process
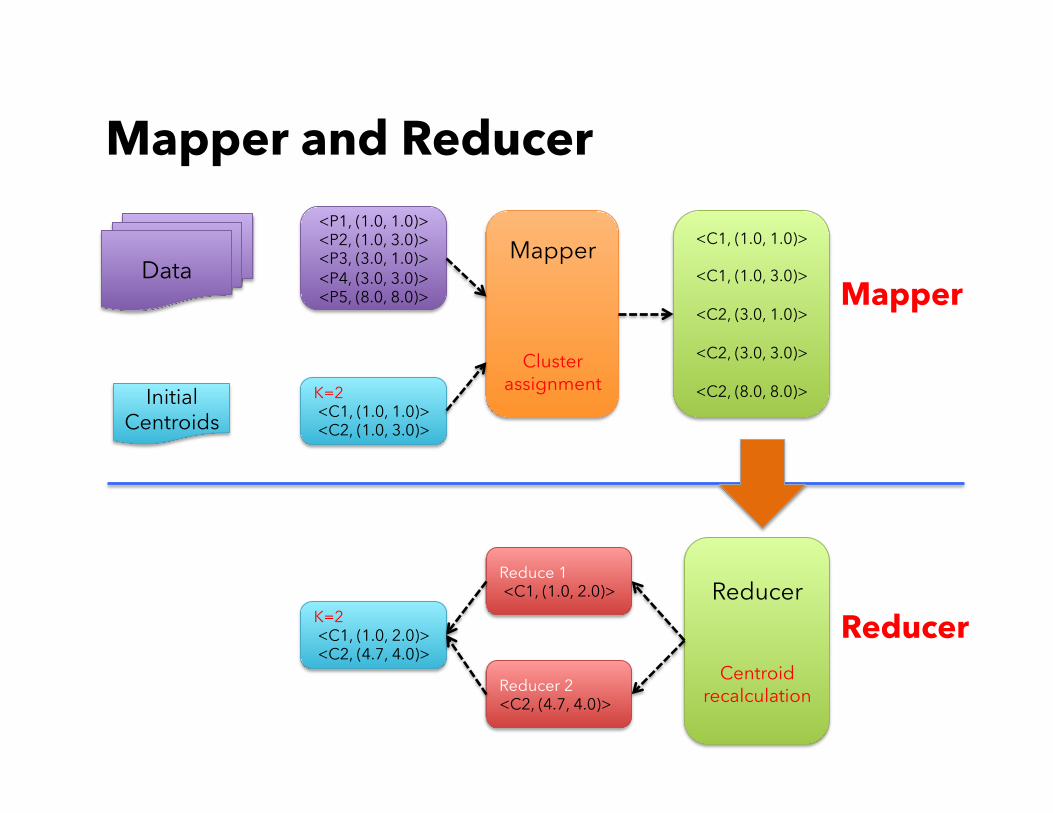
Mapper and Reducer
Data
Initial Centroids
<P1, (1.0, 1.0)> <P2, (1.0, 3.0)> <P3, (3.0, 1.0)> <P4, (3.0, 3.0)> <P5, (8.0, 8.0)>
K=2 <C1, (1.0, 1.0)> <C2, (1.0, 3.0)>
Mapper
Cluster assignment
<C1, (1.0, 1.0)>
<C1, (1.0, 3.0)>
<C2, (3.0, 1.0)>
<C2, (3.0, 3.0)>
<C2, (8.0, 8.0)>
Mapper
Reducer K=2 <C1, (1.0, 2.0)> <C2, (4.7, 4.0)>
Reducer
Centroid recalculation
Reduce 1 <C1, (1.0, 2.0)>
Reducer 2 <C2, (4.7, 4.0)>
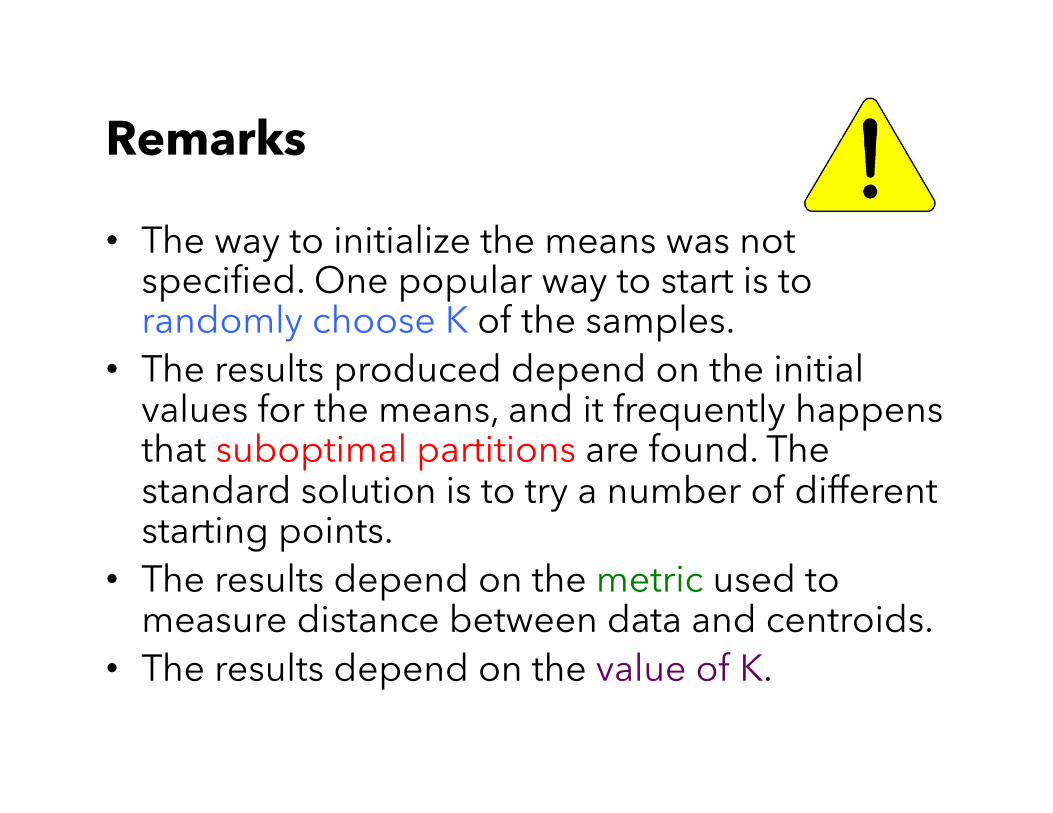
Remarks
• The way to initialize the means was not specified. One popular way to start is to randomly choose K of the samples.
• The results produced depend on the initial values for the means, and it frequently happens that suboptimal partitions are found. The standard solution is to try a number of different starting points.
• The results depend on the metric used to measure distance between data and centroids.
• The results depend on the value of K.
Iterative graph algorithm: single source shortest path
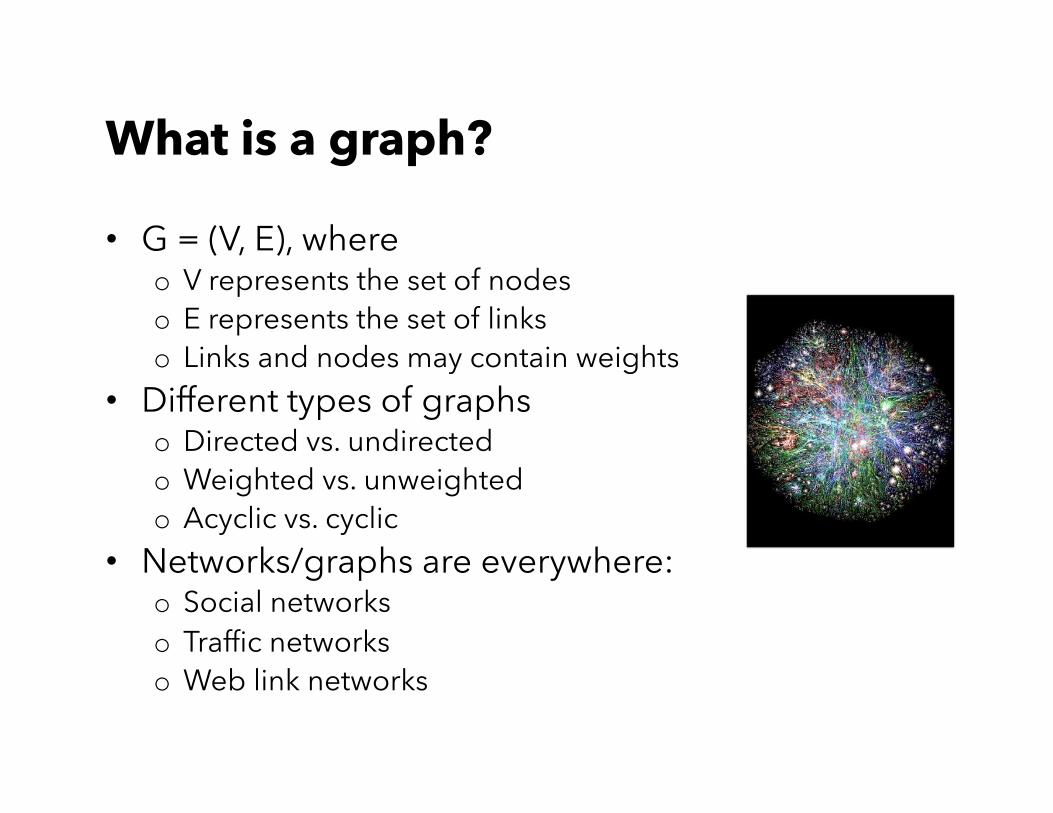
What is a graph?
• G = (V, E), where o V represents the set of nodes o E represents the set of links o Links and nodes may contain weights
• Different types of graphs o Directed vs. undirected o Weighted vs. unweighted o Acyclic vs. cyclic
• Networks/graphs are everywhere: o Social networks o Traffic networks o Web link networks
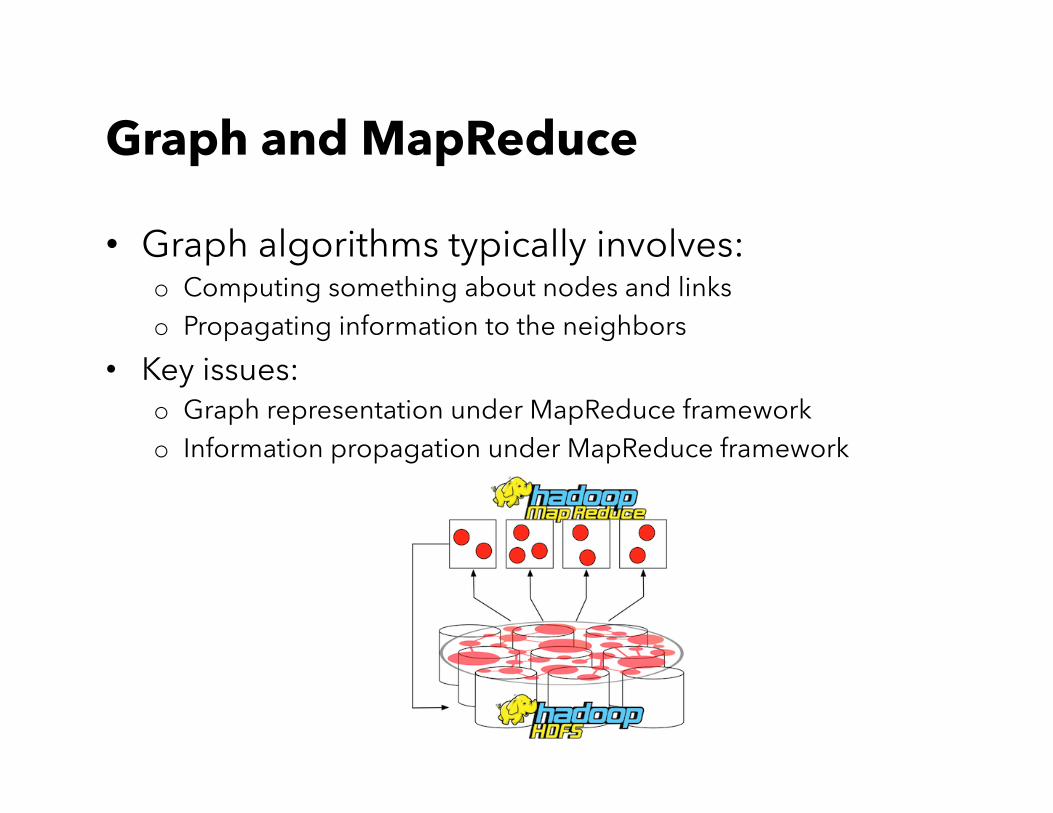
Graph and MapReduce
• Graph algorithms typically involves: o Computing something about nodes and links o Propagating information to the neighbors
• Key issues: o Graph representation under MapReduce framework o Information propagation under MapReduce framework
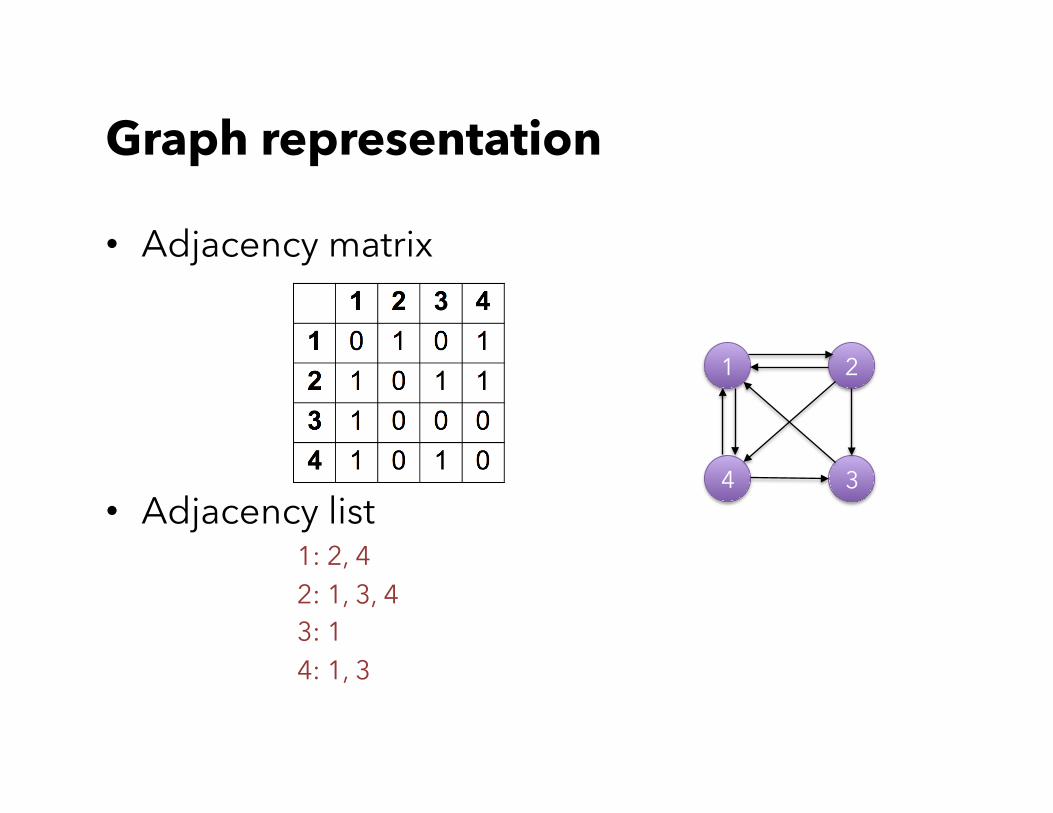
Graph representation
• Adjacency matrix
• Adjacency list
1: 2, 4 2: 1, 3, 4 3: 1 4: 1, 3
1 2
34
Single source shortest path
• Problem: find shortest path from a source node to one or more target nodes
• Single processor: Dijkstra’s algorithm
• MapReduce: parallel breadth-first search (BFS)
Algorithm design
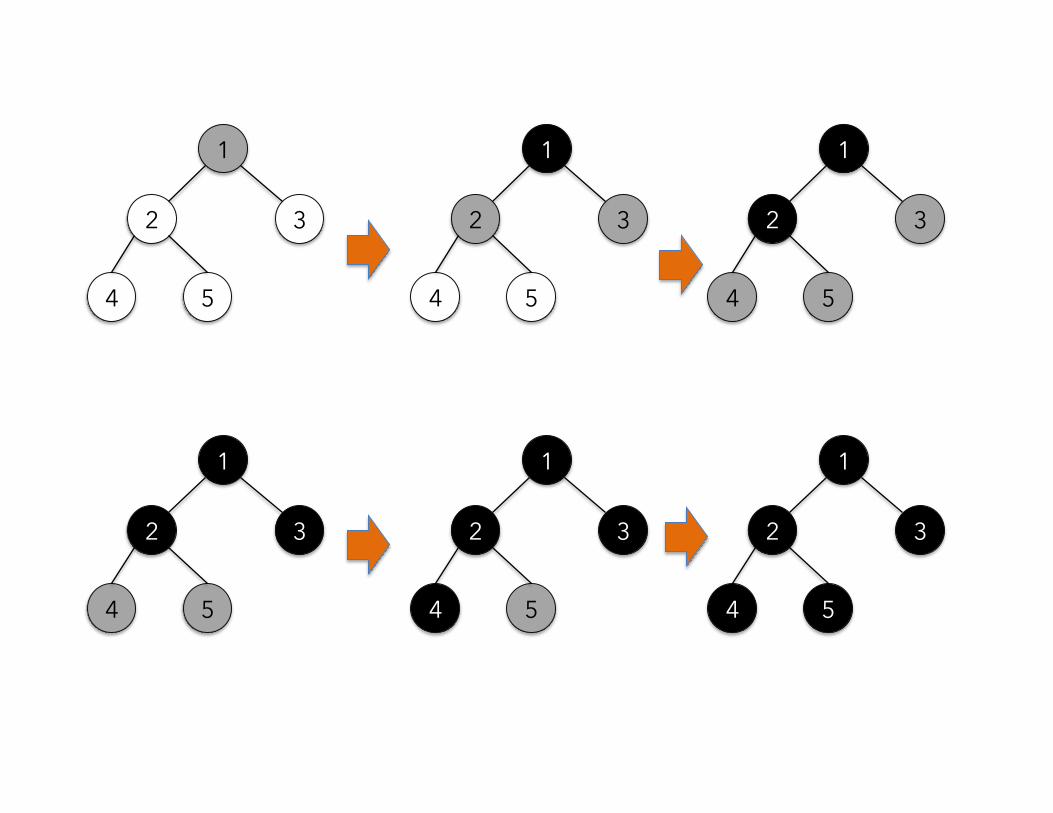
• One way of performing the BFS is by coloring the nodes and traversing according to the color of the nodes. – WHITE(unvisited), GRAY(visited) and BLACK(finished)
• At the beginning, all nodes are colored white. • The source node is colored gray. • The gray node indicates that it is visited and its
neighbors should be processed. • All the nodes adjacent to a gray node that are white are
changed to be gray colored. • The original gray node is colored. • The process continues until there are no more gray
nodes to process in the graph.
1
2 3
4 5
1
2 3
4 5
1
2 3
4 5
1
2 3
4 5
1
2 3
4 5
1
2 3
4 5
Algorithm design
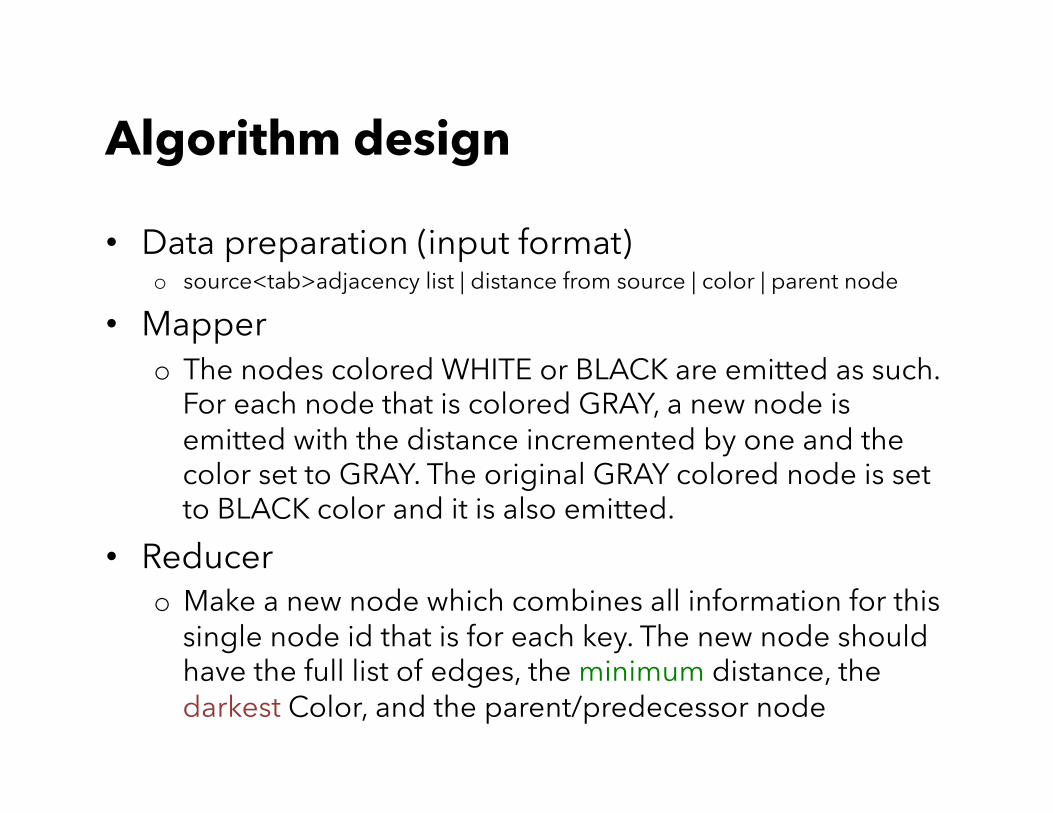
• Data preparation (input format) o source<tab>adjacency list | distance from source | color | parent node
• Mapper o The nodes colored WHITE or BLACK are emitted as such.
For each node that is colored GRAY, a new node is emitted with the distance incremented by one and the color set to GRAY. The original GRAY colored node is set to BLACK color and it is also emitted.
• Reducer o Make a new node which combines all information for this
single node id that is for each key. The new node should have the full list of edges, the minimum distance, the darkest Color, and the parent/predecessor node
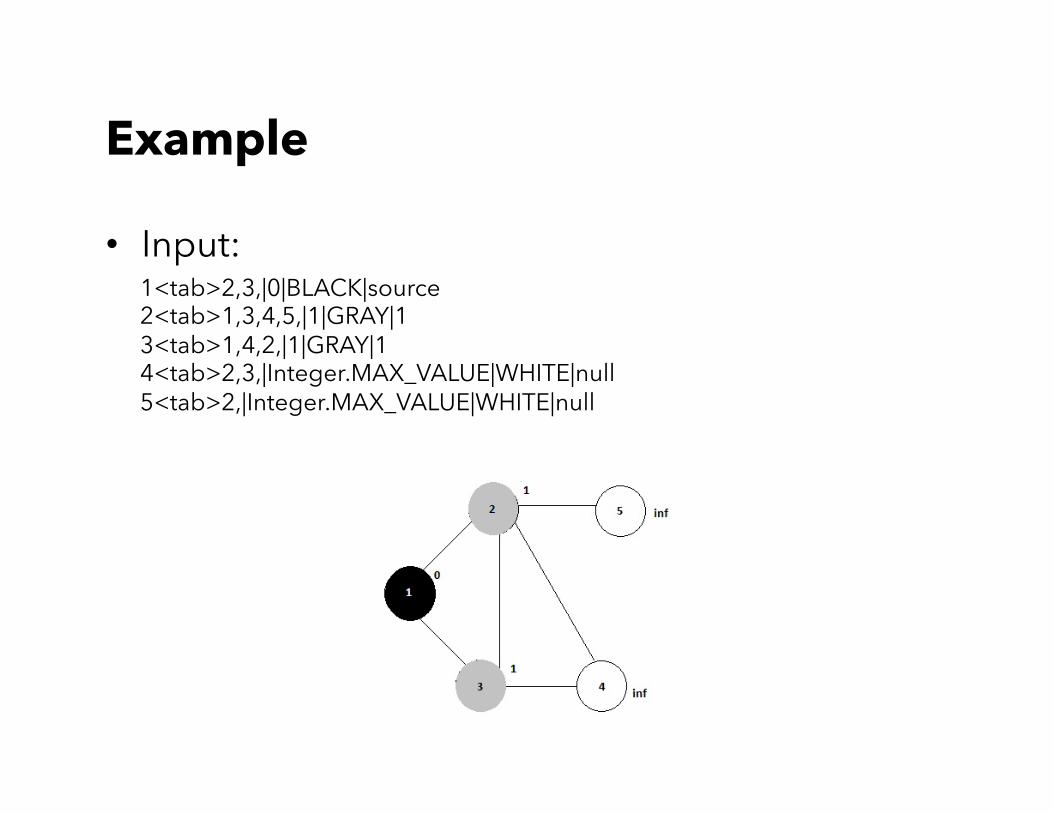
Example
• Input: 1<tab>2,3,|0|BLACK|source 2<tab>1,3,4,5,|1|GRAY|1 3<tab>1,4,2,|1|GRAY|1 4<tab>2,3,|Integer.MAX_VALUE|WHITE|null 5<tab>2,|Integer.MAX_VALUE|WHITE|null
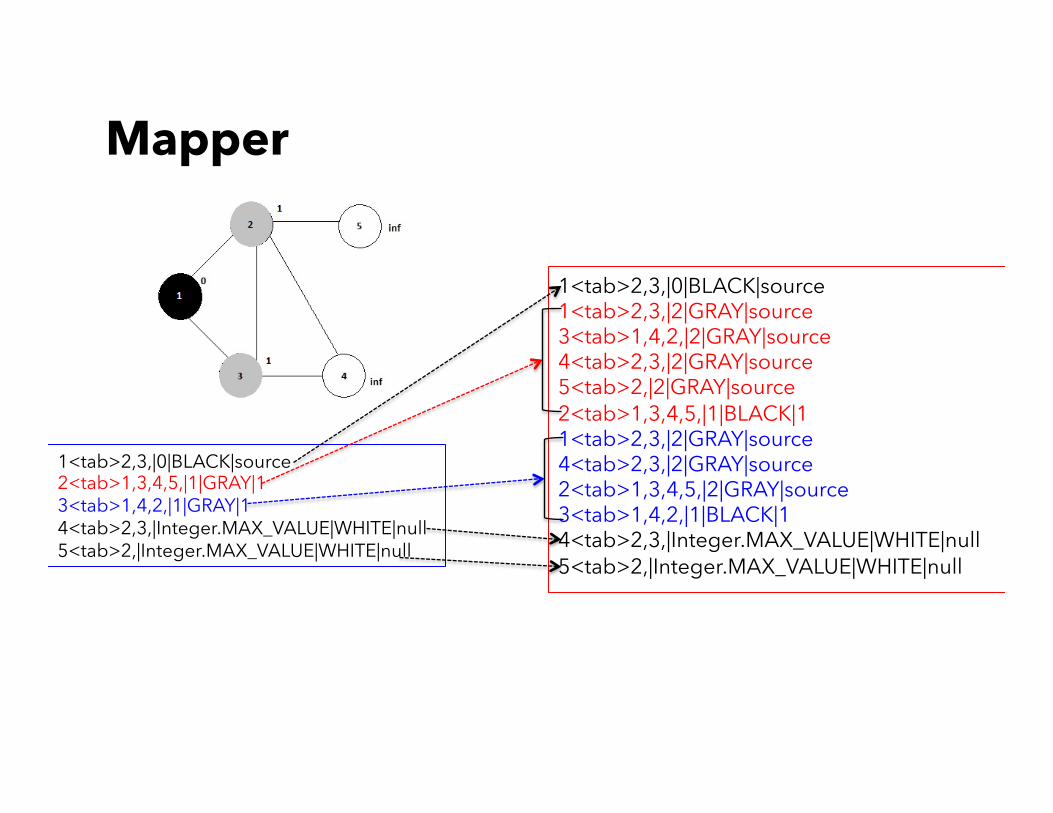
Mapper
1<tab>2,3,|0|BLACK|source 2<tab>1,3,4,5,|1|GRAY|1 3<tab>1,4,2,|1|GRAY|1 4<tab>2,3,|Integer.MAX_VALUE|WHITE|null 5<tab>2,|Integer.MAX_VALUE|WHITE|null
1<tab>2,3,|0|BLACK|source 1<tab>2,3,|2|GRAY|source 3<tab>1,4,2,|2|GRAY|source 4<tab>2,3,|2|GRAY|source 5<tab>2,|2|GRAY|source 2<tab>1,3,4,5,|1|BLACK|1 1<tab>2,3,|2|GRAY|source 4<tab>2,3,|2|GRAY|source 2<tab>1,3,4,5,|2|GRAY|source 3<tab>1,4,2,|1|BLACK|1 4<tab>2,3,|Integer.MAX_VALUE|WHITE|null 5<tab>2,|Integer.MAX_VALUE|WHITE|null
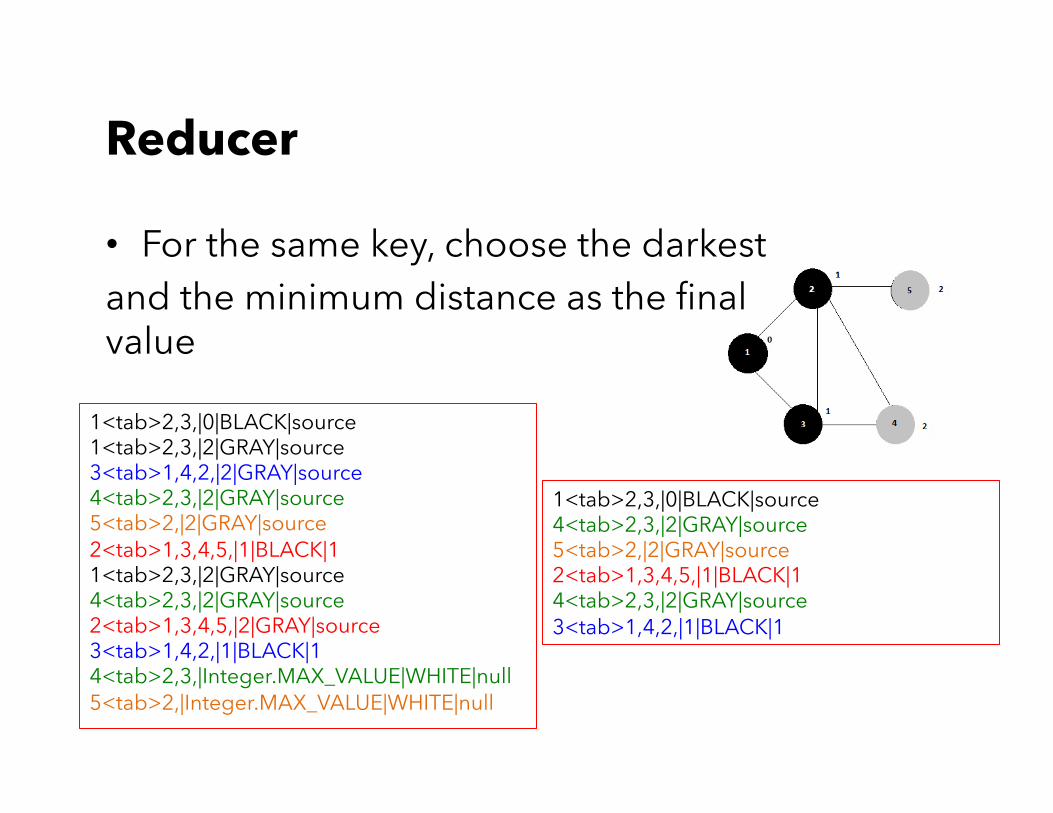
Reducer
1<tab>2,3,|0|BLACK|source 1<tab>2,3,|2|GRAY|source 3<tab>1,4,2,|2|GRAY|source 4<tab>2,3,|2|GRAY|source 5<tab>2,|2|GRAY|source 2<tab>1,3,4,5,|1|BLACK|1 1<tab>2,3,|2|GRAY|source 4<tab>2,3,|2|GRAY|source 2<tab>1,3,4,5,|2|GRAY|source 3<tab>1,4,2,|1|BLACK|1 4<tab>2,3,|Integer.MAX_VALUE|WHITE|null 5<tab>2,|Integer.MAX_VALUE|WHITE|null
1<tab>2,3,|0|BLACK|source 4<tab>2,3,|2|GRAY|source 5<tab>2,|2|GRAY|source 2<tab>1,3,4,5,|1|BLACK|1 4<tab>2,3,|2|GRAY|source 3<tab>1,4,2,|1|BLACK|1
• For the same key, choose the darkest and the minimum distance as the final value

Recommender system
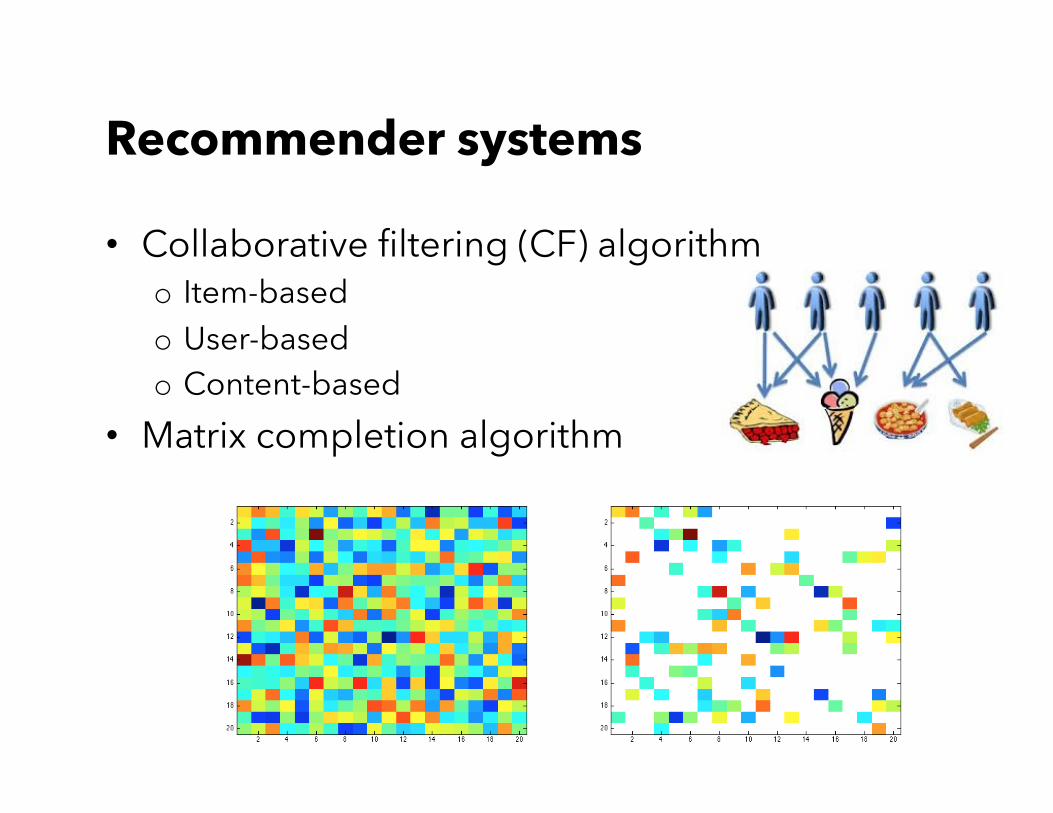
Recommender systems
• Collaborative filtering (CF) algorithm o Item-based o User-based o Content-based
• Matrix completion algorithm
Item-based CF
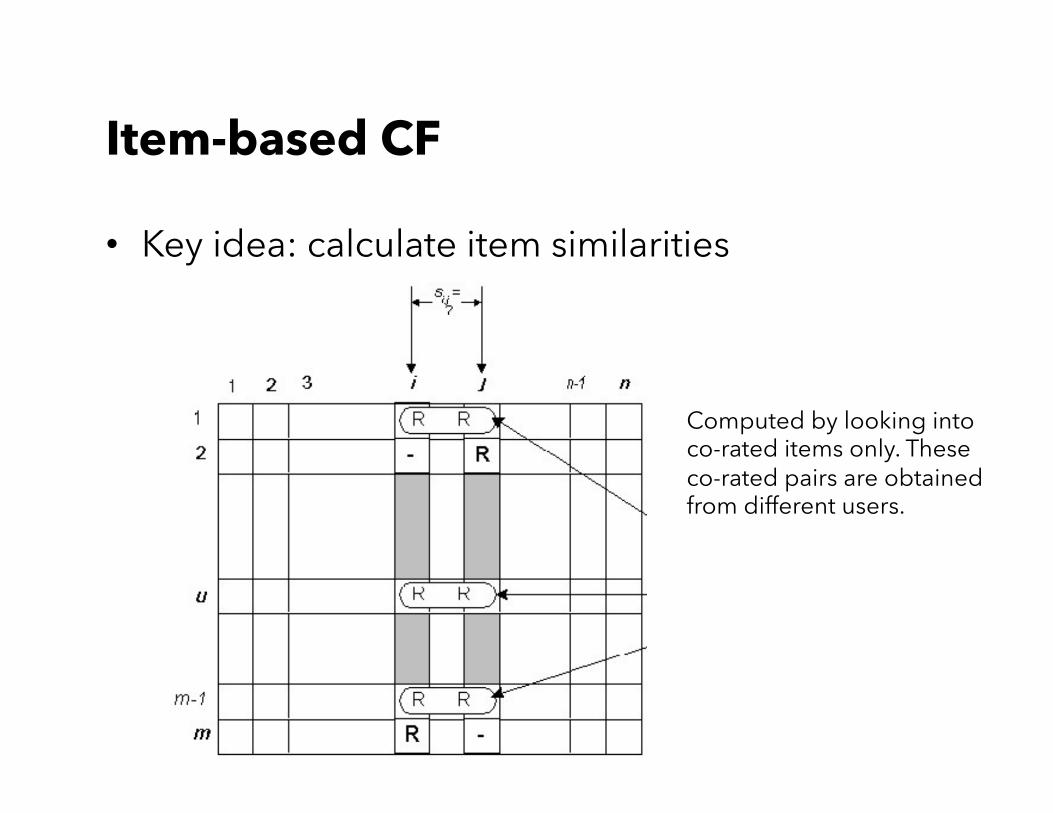
• Key idea: calculate item similarities
Computed by looking into co-rated items only. These co-rated pairs are obtained from different users.
Item similarity
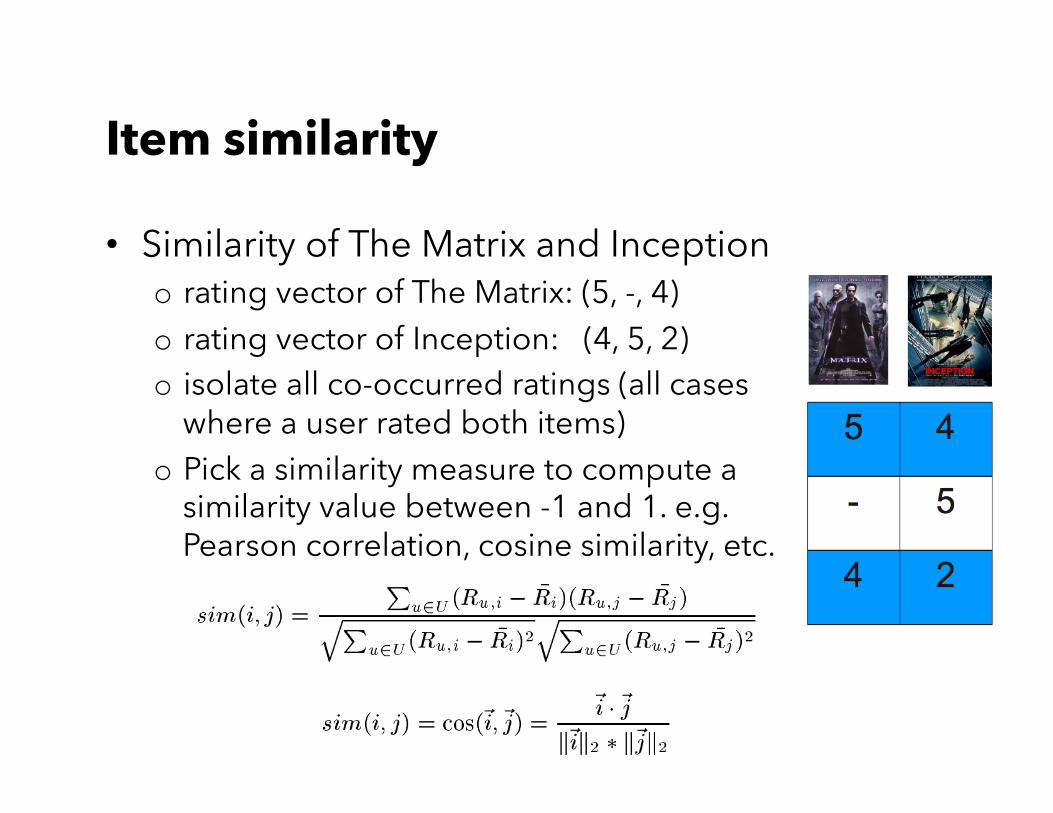
• Similarity of The Matrix and Inception o rating vector of The Matrix: (5, -, 4) o rating vector of Inception: (4, 5, 2) o isolate all co-occurred ratings (all cases
where a user rated both items) o Pick a similarity measure to compute a
similarity value between -1 and 1. e.g. Pearson correlation, cosine similarity, etc.
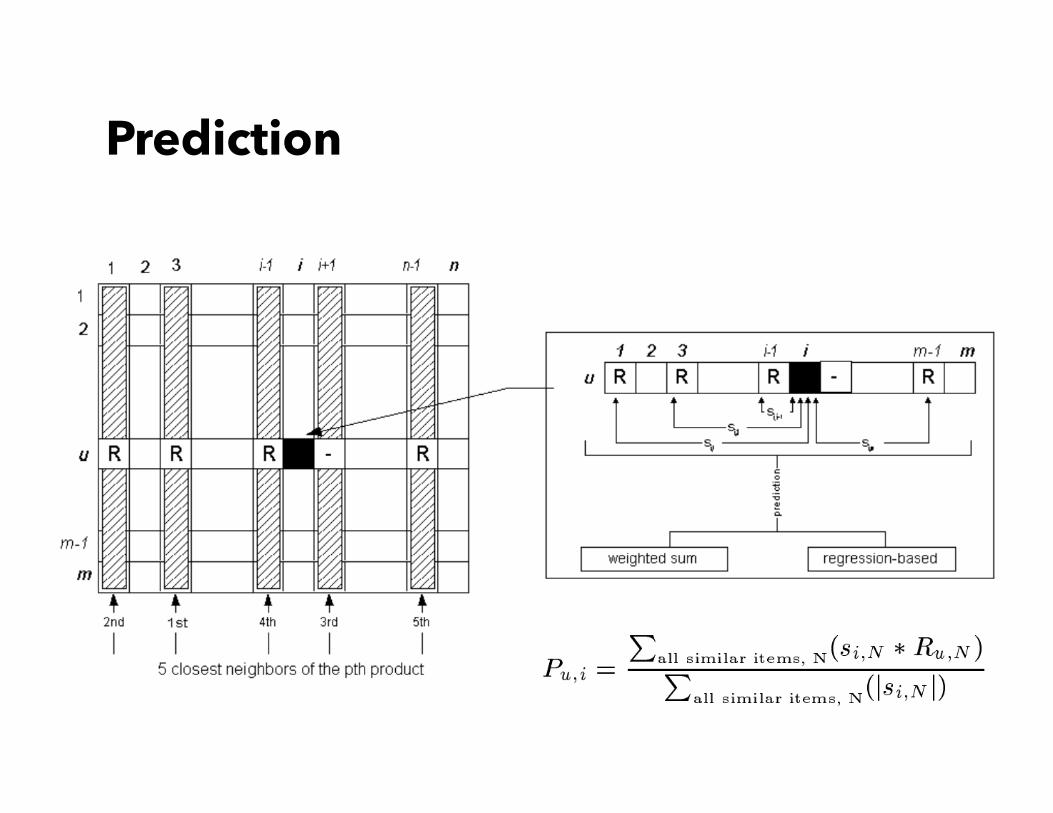
Prediction
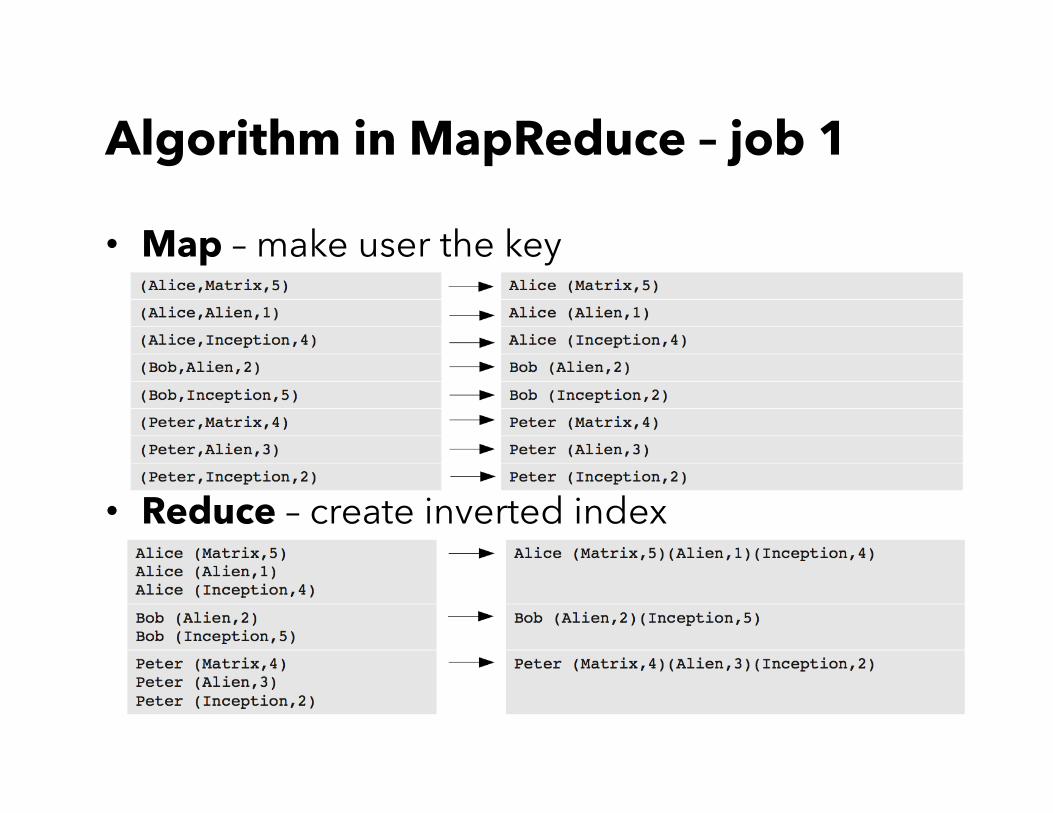
Algorithm in MapReduce – job 1
• Map – make user the key
• Reduce – create inverted index
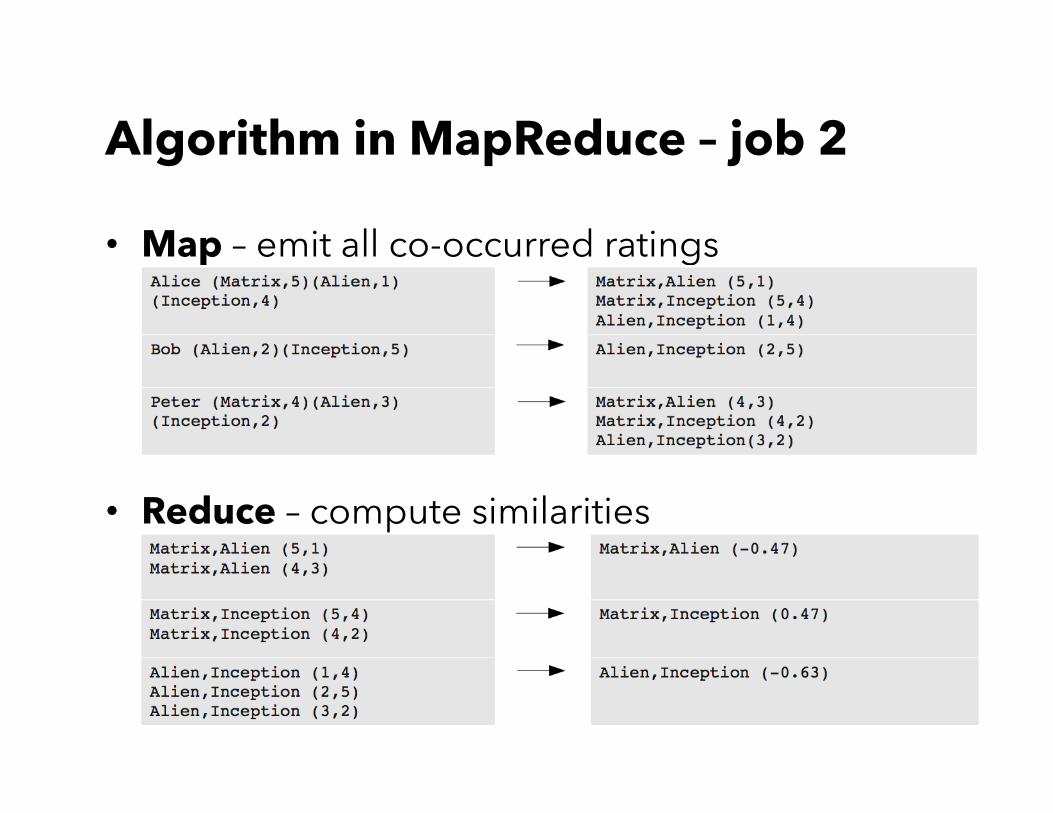
Algorithm in MapReduce – job 2
• Map – emit all co-occurred ratings
• Reduce – compute similarities
Some good tools
• Spark o http://spark.apache.org
• Mahout o https://mahout.apache.org
• D3.js o http://d3js.org
• Others
• E-Mail: [email protected] • Website: http://kzhang6.people.uic.edu