Embed Size (px)
Citation preview
“g06071” — 2007/12/14 — 11:07 — page 103 — #1�
�
�
�
�
�
�
�
Genet. Sel. Evol. 40 (2008) 103–128 Available online at:c© INRA, EDP Sciences, 2008 www.gse-journal.orgDOI: 10.1051/gse:2007039
Original article
Biodiversity of pig breeds from Chinaand Europe estimated from pooled DNA
samples: differences in microsatellitevariation between two areas
of domestication
Hendrik-Jan Megens1∗, Richard P.M.A. Crooijmans1,Magali San Cristobal2, Xiao Hui3, Ning Li3,
Martien A.M. Groenen1
1 Wageningen University, Animal Breeding and Genomics Centre, PO Box 338, 6700AH,Wageningen, The Netherlands
2 INRA, UMR444 Laboratoire de génétique cellulaire, 31326 Castanet Tolosan, France3 China Agricultural University, National Laboratories for Agrobiotechnology, Yuanmingyuan
West Road 2, Haidian District, 100094 Beijing, P.R. China
(Received 24 July 2006; accepted 18 July 2007)
Abstract – Microsatellite diversity in European and Chinese pigs was assessed using a pooledsampling method on 52 European and 46 Chinese pig populations. A Neighbor Joining analysison genetic distances revealed that European breeds were grouped together and showed littleevidence for geographic structure, although a southern European and English group could ten-tatively be assigned. Populations from international breeds formed breed specific clusters. TheChinese breeds formed a second major group, with the Sino-European synthetic Tia Meslanin-between the two large clusters. Within Chinese breeds, in contrast to the European pigs, alarge degree of geographic structure was noted, in line with previous classification schemes forChinese pigs that were based on morphology and geography. The Northern Chinese breeds weremost similar to the European breeds. Although some overlap exists, Chinese breeds showed ahigher average degree of heterozygosity and genetic distance compared to European ones. Be-tween breed diversity was even more pronounced and was the highest in the Central Chinesepigs, reflecting the geographically central position in China. Comparing correlations betweengenetic distance and heterozygosity revealed that China and Europe represent different domes-tication or breed formation processes. A likely cause is a more diverse wild boar population inAsia, but various other possible contributing factors are discussed.
pigs / Chinese breeds / European breeds / DNA pools / microsatellite / diversity
∗ Corresponding author: [email protected]
Article published by EDP Sciences and available at http://www.gse-journal.org or http://dx.doi.org/10.1051/gse:2007039
“g06071” — 2007/12/14 — 11:07 — page 104 — #2�
�
�
�
�
�
�
�
104 H.-J. Megens et al.
1. INTRODUCTION
Domestication of the pig occurred independently on several occa-sions [15, 25], and some gene flow with the wild boar may have remaineduntil pigs were kept in sties [48]. Historically, there are two major areas ofpig breeding, Europe and China, and each seems to represent an independentdomestication event. In both areas pig breeding has been applied for at least7-8000 years [8] resulting in many local breeds but also specialized breeds witha wider distribution, which were selected for the production of particular meattypes such as pork or bacon. Europe and China are the origin of about 70%of breed diversity in the world [41] (Europe has 228 listed existing breeds,plus 105 now extinct; China has 118 listed breeds and 10 more extinct). Inboth China and Europe, the pig has been and remains a major meat producer.However, over the past centuries, pig breeding has shown marked differencesbetween these two areas.
In Europe, pig breeding became decreasingly local, with breeders importinggenetic material from elsewhere in Europe [21, 48]. Particularly in the late18th century many new pig breeds, some the ancestors of currently globallyapplied commercial breeds, were formed often with the aid of pigs importedfrom China [8, 48]. In the UK, several popular breeds such as the Berkshireand Large White came into existence and were distributed globally to replaceor improve local breeds [21]. Already in 1868, Charles Darwin [10] noted thedemise of many indigenous breeds. Nowadays, many of the European localpig breeds have been heavily altered and three-quarters of local or traditionalbreeds are extinct or marginalized [41].
Conversely, in China traditional local pig breeding has been applied untilmore recent times [33], although recently these practices have been chang-ing. Although undoubtedly Chinese pig breeders have sought to use animalsfrom other than the local breeds to enhance their breeding practice [12], thishas apparently been much less pronounced than in Europe. The result is thatChina has more pig breeds than any other country in the world by far; theWorld Watch List for Domestic Animal Diversity [41] lists 118 distinct breeds.Most of these breeds are still local, although unfortunately the advent of mod-ern pig breeding techniques, involving European or new Chinese × Europeansynthetic breeds results in rapid marginalization of many of these traditionalbreeds ([33, 41]; 10 listed as endangered, but 30 more show no populationdata).
There is currently no widely accepted way of grouping European breeds in aclassification system. Substantial mixing of types had occurred even before theconcept of a ‘breed’ had been clarified by the end of the 19th century. At the
“g06071” — 2007/12/14 — 11:07 — page 105 — #3�
�
�
�
�
�
�
�
Genetic variation in pig breeds from China and Europe 105
start of the 20th century, breeds were classified based on production goals (porkor bacon), and in the 1960s a common practice was to divide pigs into “(Gen-eral) White Meat type”, “Highly Specialised” and “Local Breeds” [33]. Tradi-tional European breeds are sometimes grouped as ‘Celtic’ for Northern Europevs. Iberian for Southern European breeds. Nowadays, this grouping system isapplied mainly for traditional pig breeds from France and northern Iberia vs.the southern “Iberian” breeds [18, 33].
Pig diversity in China has been categorized, based on exterior and produc-tion traits and historical data, into six geographic areas [49]. Most local breedscome from the Central Chinese (CC), South Chinese (SC), and South WesternChinese (SWC) areas. The Lower Changjiang River Basin (LCRB) type hasperhaps fewer breeds, but is commercially very important as it has some ofthe most fertile breeds such as Meishan that are currently used to create newsynthetic lines. The remaining areas represent the Northern Chinese (NC) pigs,and the Plateau (Plat) type from the Tibetan area, which is the home of a fewbreeds adapted to marginal feeding and high altitude.
Currently there is a trend to improve and even replace Chinese breeds us-ing European commercial lines, which mirrors the introgression of Chinesebreeds into European stock to some extent. A comprehensive, global assess-ment of pig diversity would give better insight into the genetic relationshipsand distinctiveness of pigs from different parts of the world, and may aid inpreservation of worldwide livestock diversity. Recent papers have reported onrelations between pigs using microsatellite markers [12, 22, 26, 28, 40, 47, 50],but mainly between pig breeds from either China or Europe. For instance,Zhang et al. [50] concluded that a number of major groups could be discerned,in part congruent with previous classification schemes. By contrast, a similarstudy [40] showed that for European breeds such subdivisions are very diffi-cult to establish. This discrepancy tantalizingly hints at differences in historyand processes of domestication and breed formation and maintenance betweenthese areas. From these studies, it is difficult to gain better insight into differ-ences between Europe and China as there is limited overlap in breeds, and evenif overlap existed in markers it would be difficult to reliably merge datasets dueto calibration and marker evaluation inconsistencies. The most accurate wayto get a better insight into the differences between the Chinese and Europeanbreeds would be to include all in a single dedicated study.
A major limitation for global assessment of pig diversity has been the diffi-culty of obtaining an adequate number of specimens of a reasonable number ofbreeds from both China and Europe. The current study is part of a large-scalecooperation between many research groups from Europe and China through
“g06071” — 2007/12/14 — 11:07 — page 106 — #4�
�
�
�
�
�
�
�
106 H.-J. Megens et al.
the PigBioDiv 1 [32] and PigBioDiv 2 [3] projects, funded by the EuropeanUnion and the Chinese Academy of Sciences. This cooperation has allowedcompilation of a large DNA collection from pig breeds by exchange betweenlaboratories.
A second major limiting factor is cost [38]. A meaningful comparison be-tween pig breeds means genotyping at least dozens of specimens from dozensof breeds from each region to gain adequate insight into diversification pat-terns, for dozens of markers. For a study such as the present one, this wouldmean over 150 000 individual genotypings, which would imply an investmentin labor and not easily financed consumables. Several meaningful popula-tion statistics and comparisons can be deduced from allele frequency data.Although individual genotyping is the most accurate method to estimate al-lele frequencies in populations, it has been shown that pooled sampling meth-ods [9, 16, 20, 42–44], and references therein can perform very adequately aswell, at a fraction of the cost of labor and consumables.
Using DNA pools for 52 populations from Europe and 46 from China, wereport on the first comprehensive study on patterns of variation in both of themajor areas of pig domestication and breed diversity.
2. MATERIAL AND METHODS
2.1. Sampling and DNA preparation
A total of 98 lines from Europe and China were sampled; these are listedin Table I including the number of specimens per line used. The materialfrom these lines was collected in the framework of the PigBioDiv 1 [32, 40]and PigBioDiv 2 projects [3] (www.pigbiodiv2.com). The European breedsare represented by a number of commercial lines as well as local or regionalbreeds from essentially the whole of Europe, although pig breeds from theformer Soviet Union and Scandinavia were not included. Included are alsobreeds that originate from the United States, since these breeds such as Hamp-shire and Duroc are derived in turn (largely) from European pigs. For the cur-rent study, 52 European populations out of 58 included in the PigBioDiv 1project [40] were sampled. The 45 sampled Chinese breeds show a very goodrepresentation of all six recognized types [49], including the Tibetan (Plateau)type. Names of European breeds are according to Porter [34], Chinese breedsmainly according to Zhang [49], Zhang et al. [50], and Fang et al. [12]. DNAwas isolated from individual samples using standard phenol-chloroform proto-cols [32]. Pools of DNA were made by adding equal amounts of DNA for eachof the individuals to a single vial for each of the lines [9, 16].
“g06071” — 2007/12/14 — 11:07 — page 107 — #5�
�
�
�
�
�
�
�
Genetic variation in pig breeds from China and Europe 107
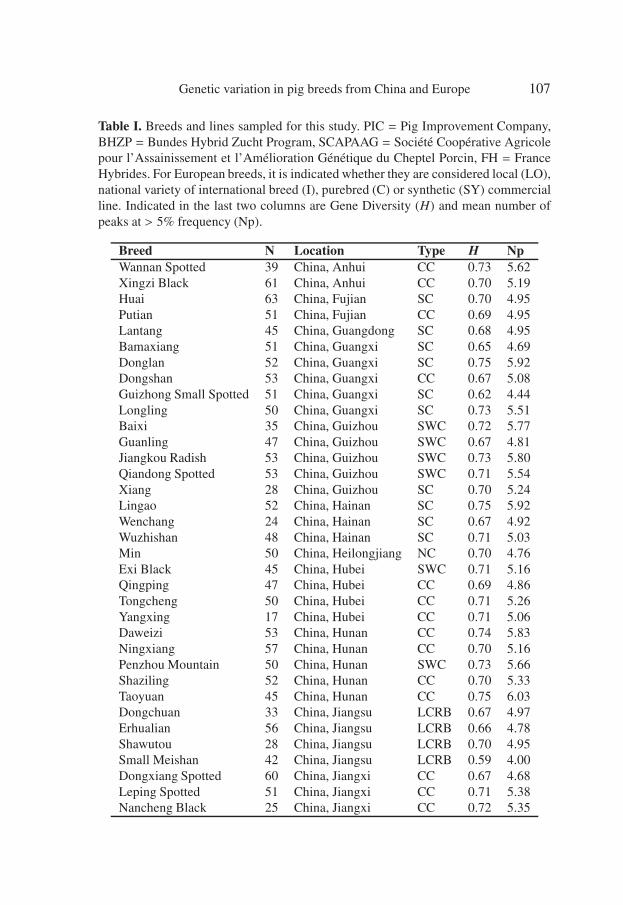
Table I. Breeds and lines sampled for this study. PIC = Pig Improvement Company,BHZP = Bundes Hybrid Zucht Program, SCAPAAG = Société Coopérative Agricolepour l’Assainissement et l’Amélioration Génétique du Cheptel Porcin, FH = FranceHybrides. For European breeds, it is indicated whether they are considered local (LO),national variety of international breed (I), purebred (C) or synthetic (SY) commercialline. Indicated in the last two columns are Gene Diversity (H) and mean number ofpeaks at > 5% frequency (Np).
Breed N Location Type H NpWannan Spotted 39 China, Anhui CC 0.73 5.62Xingzi Black 61 China, Anhui CC 0.70 5.19Huai 63 China, Fujian SC 0.70 4.95Putian 51 China, Fujian CC 0.69 4.95Lantang 45 China, Guangdong SC 0.68 4.95Bamaxiang 51 China, Guangxi SC 0.65 4.69Donglan 52 China, Guangxi SC 0.75 5.92Dongshan 53 China, Guangxi CC 0.67 5.08Guizhong Small Spotted 51 China, Guangxi SC 0.62 4.44Longling 50 China, Guangxi SC 0.73 5.51Baixi 35 China, Guizhou SWC 0.72 5.77Guanling 47 China, Guizhou SWC 0.67 4.81Jiangkou Radish 53 China, Guizhou SWC 0.73 5.80Qiandong Spotted 53 China, Guizhou SWC 0.71 5.54Xiang 28 China, Guizhou SC 0.70 5.24Lingao 52 China, Hainan SC 0.75 5.92Wenchang 24 China, Hainan SC 0.67 4.92Wuzhishan 48 China, Hainan SC 0.71 5.03Min 50 China, Heilongjiang NC 0.70 4.76Exi Black 45 China, Hubei SWC 0.71 5.16Qingping 47 China, Hubei CC 0.69 4.86Tongcheng 50 China, Hubei CC 0.71 5.26Yangxing 17 China, Hubei CC 0.71 5.06Daweizi 53 China, Hunan CC 0.74 5.83Ningxiang 57 China, Hunan CC 0.70 5.16Penzhou Mountain 50 China, Hunan SWC 0.73 5.66Shaziling 52 China, Hunan CC 0.70 5.33Taoyuan 45 China, Hunan CC 0.75 6.03Dongchuan 33 China, Jiangsu LCRB 0.67 4.97Erhualian 56 China, Jiangsu LCRB 0.66 4.78Shawutou 28 China, Jiangsu LCRB 0.70 4.95Small Meishan 42 China, Jiangsu LCRB 0.59 4.00Dongxiang Spotted 60 China, Jiangxi CC 0.67 4.68Leping Spotted 51 China, Jiangxi CC 0.71 5.38Nancheng Black 25 China, Jiangxi CC 0.72 5.35
“g06071” — 2007/12/14 — 11:07 — page 108 — #6�
�
�
�
�
�
�
�
108 H.-J. Megens et al.
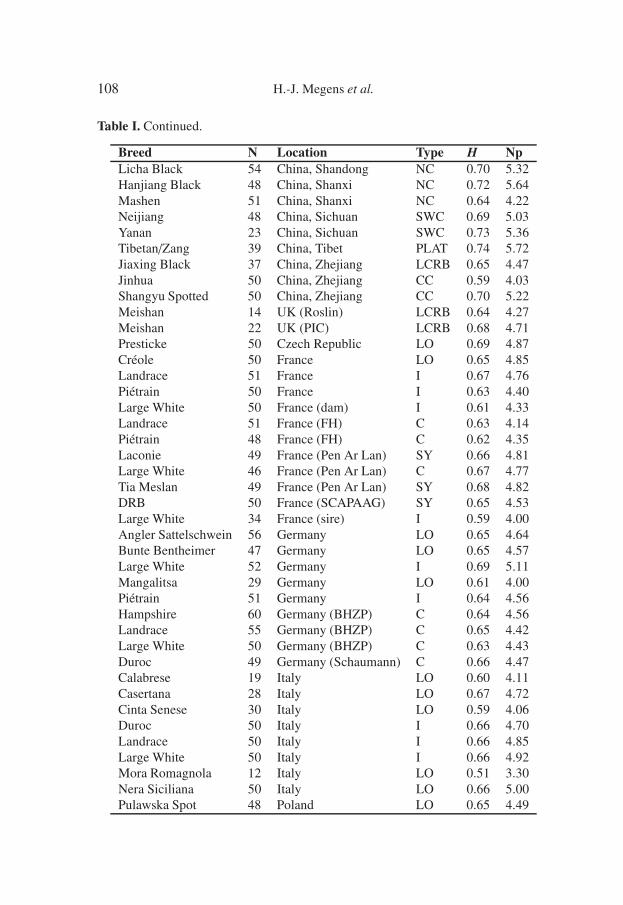
Table I. Continued.
Breed N Location Type H NpLicha Black 54 China, Shandong NC 0.70 5.32Hanjiang Black 48 China, Shanxi NC 0.72 5.64Mashen 51 China, Shanxi NC 0.64 4.22Neijiang 48 China, Sichuan SWC 0.69 5.03Yanan 23 China, Sichuan SWC 0.73 5.36Tibetan/Zang 39 China, Tibet PLAT 0.74 5.72Jiaxing Black 37 China, Zhejiang LCRB 0.65 4.47Jinhua 50 China, Zhejiang CC 0.59 4.03Shangyu Spotted 50 China, Zhejiang CC 0.70 5.22Meishan 14 UK (Roslin) LCRB 0.64 4.27Meishan 22 UK (PIC) LCRB 0.68 4.71Presticke 50 Czech Republic LO 0.69 4.87Créole 50 France LO 0.65 4.85Landrace 51 France I 0.67 4.76Piétrain 50 France I 0.63 4.40Large White 50 France (dam) I 0.61 4.33Landrace 51 France (FH) C 0.63 4.14Piétrain 48 France (FH) C 0.62 4.35Laconie 49 France (Pen Ar Lan) SY 0.66 4.81Large White 46 France (Pen Ar Lan) C 0.67 4.77Tia Meslan 49 France (Pen Ar Lan) SY 0.68 4.82DRB 50 France (SCAPAAG) SY 0.65 4.53Large White 34 France (sire) I 0.59 4.00Angler Sattelschwein 56 Germany LO 0.65 4.64Bunte Bentheimer 47 Germany LO 0.65 4.57Large White 52 Germany I 0.69 5.11Mangalitsa 29 Germany LO 0.61 4.00Piétrain 51 Germany I 0.64 4.56Hampshire 60 Germany (BHZP) C 0.64 4.56Landrace 55 Germany (BHZP) C 0.65 4.42Large White 50 Germany (BHZP) C 0.63 4.43Duroc 49 Germany (Schaumann) C 0.66 4.47Calabrese 19 Italy LO 0.60 4.11Casertana 28 Italy LO 0.67 4.72Cinta Senese 30 Italy LO 0.59 4.06Duroc 50 Italy I 0.66 4.70Landrace 50 Italy I 0.66 4.85Large White 50 Italy I 0.66 4.92Mora Romagnola 12 Italy LO 0.51 3.30Nera Siciliana 50 Italy LO 0.66 5.00Pulawska Spot 48 Poland LO 0.65 4.49
“g06071” — 2007/12/14 — 11:07 — page 109 — #7�
�
�
�
�
�
�
�
Genetic variation in pig breeds from China and Europe 109
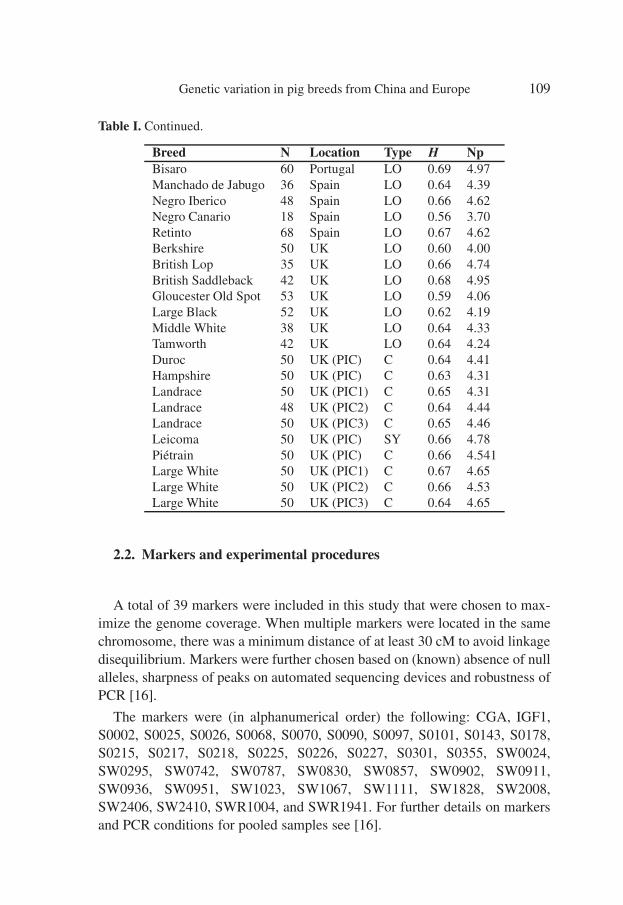
Table I. Continued.
Breed N Location Type H NpBisaro 60 Portugal LO 0.69 4.97Manchado de Jabugo 36 Spain LO 0.64 4.39Negro Iberico 48 Spain LO 0.66 4.62Negro Canario 18 Spain LO 0.56 3.70Retinto 68 Spain LO 0.67 4.62Berkshire 50 UK LO 0.60 4.00British Lop 35 UK LO 0.66 4.74British Saddleback 42 UK LO 0.68 4.95Gloucester Old Spot 53 UK LO 0.59 4.06Large Black 52 UK LO 0.62 4.19Middle White 38 UK LO 0.64 4.33Tamworth 42 UK LO 0.64 4.24Duroc 50 UK (PIC) C 0.64 4.41Hampshire 50 UK (PIC) C 0.63 4.31Landrace 50 UK (PIC1) C 0.65 4.31Landrace 48 UK (PIC2) C 0.64 4.44Landrace 50 UK (PIC3) C 0.65 4.46Leicoma 50 UK (PIC) SY 0.66 4.78Piétrain 50 UK (PIC) C 0.66 4.541Large White 50 UK (PIC1) C 0.67 4.65Large White 50 UK (PIC2) C 0.66 4.53Large White 50 UK (PIC3) C 0.64 4.65
2.2. Markers and experimental procedures
A total of 39 markers were included in this study that were chosen to max-imize the genome coverage. When multiple markers were located in the samechromosome, there was a minimum distance of at least 30 cM to avoid linkagedisequilibrium. Markers were further chosen based on (known) absence of nullalleles, sharpness of peaks on automated sequencing devices and robustness ofPCR [16].
The markers were (in alphanumerical order) the following: CGA, IGF1,S0002, S0025, S0026, S0068, S0070, S0090, S0097, S0101, S0143, S0178,S0215, S0217, S0218, S0225, S0226, S0227, S0301, S0355, SW0024,SW0295, SW0742, SW0787, SW0830, SW0857, SW0902, SW0911,SW0936, SW0951, SW1023, SW1067, SW1111, SW1828, SW2008,SW2406, SW2410, SWR1004, and SWR1941. For further details on markersand PCR conditions for pooled samples see [16].
“g06071” — 2007/12/14 — 11:07 — page 110 — #8�
�
�
�
�
�
�
�
110 H.-J. Megens et al.
Individual PCR reactions for each of the markers were subsequently pooledinto sets of two to five markers in such a way that overlap of alleles was avoidedeven if markers differed for the fluorescent dye. Sets of markers were analysedon the ABI 3100 capillary automated sequencer, using 36 cm capillaries, andstandard microsatellite genotyping settings. Because typing was performed inmultiple batches, a calibration panel was used to evaluate inter-batch typingvariation.
Instead of allele frequencies, peak frequencies were calculated based on thearea under the peaks, using the ABI PRISMr© GeneMapperr© Software v3.7.Previous results on pooled chicken DNA [9] revealed that it was more reliableto use peak frequencies rather than to correct for stutter bands. Peak frequen-cies lower than 5% were discarded and peak frequencies higher than 5% weresubsequently re-calculated to add up to 100%.
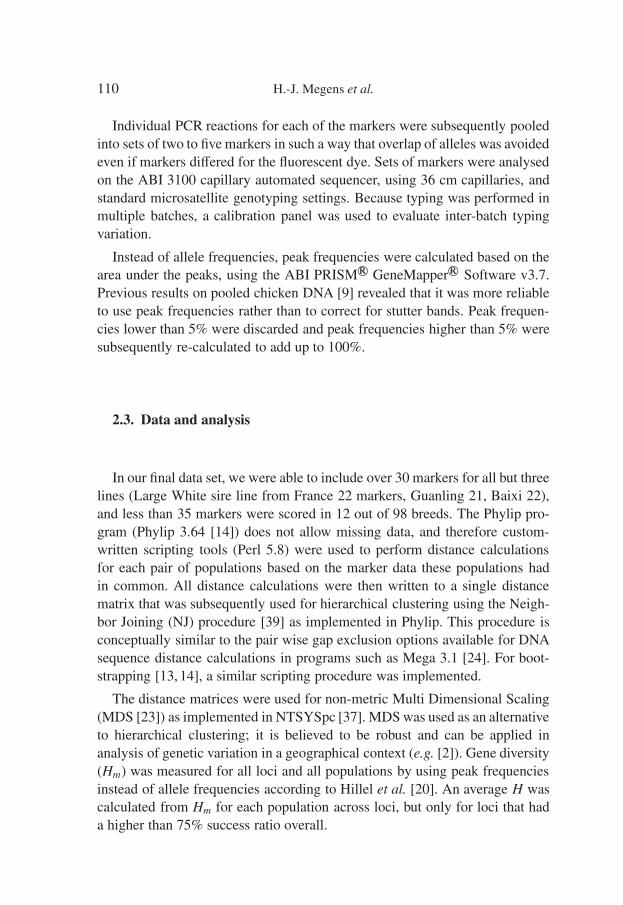
2.3. Data and analysis
In our final data set, we were able to include over 30 markers for all but threelines (Large White sire line from France 22 markers, Guanling 21, Baixi 22),and less than 35 markers were scored in 12 out of 98 breeds. The Phylip pro-gram (Phylip 3.64 [14]) does not allow missing data, and therefore custom-written scripting tools (Perl 5.8) were used to perform distance calculationsfor each pair of populations based on the marker data these populations hadin common. All distance calculations were then written to a single distancematrix that was subsequently used for hierarchical clustering using the Neigh-bor Joining (NJ) procedure [39] as implemented in Phylip. This procedure isconceptually similar to the pair wise gap exclusion options available for DNAsequence distance calculations in programs such as Mega 3.1 [24]. For boot-strapping [13, 14], a similar scripting procedure was implemented.
The distance matrices were used for non-metric Multi Dimensional Scaling(MDS [23]) as implemented in NTSYSpc [37]. MDS was used as an alternativeto hierarchical clustering; it is believed to be robust and can be applied inanalysis of genetic variation in a geographical context (e.g. [2]). Gene diversity(Hm) was measured for all loci and all populations by using peak frequenciesinstead of allele frequencies according to Hillel et al. [20]. An average H wascalculated from Hm for each population across loci, but only for loci that hada higher than 75% success ratio overall.
“g06071” — 2007/12/14 — 11:07 — page 111 — #9�
�
�
�
�
�
�
�
Genetic variation in pig breeds from China and Europe 111
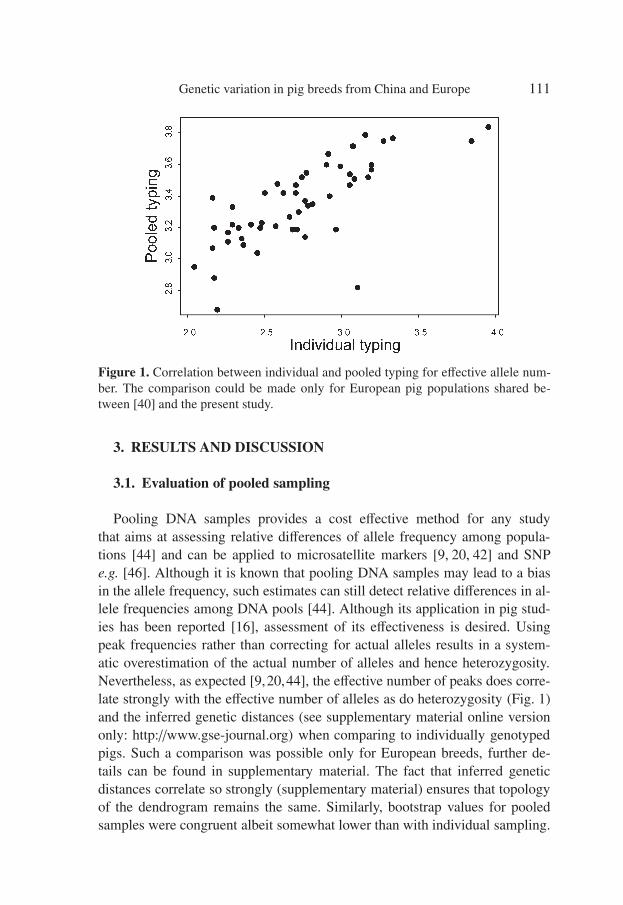
Figure 1. Correlation between individual and pooled typing for effective allele num-ber. The comparison could be made only for European pig populations shared be-tween [40] and the present study.
3. RESULTS AND DISCUSSION
3.1. Evaluation of pooled sampling
Pooling DNA samples provides a cost effective method for any studythat aims at assessing relative differences of allele frequency among popula-tions [44] and can be applied to microsatellite markers [9, 20, 42] and SNPe.g. [46]. Although it is known that pooling DNA samples may lead to a biasin the allele frequency, such estimates can still detect relative differences in al-lele frequencies among DNA pools [44]. Although its application in pig stud-ies has been reported [16], assessment of its effectiveness is desired. Usingpeak frequencies rather than correcting for actual alleles results in a system-atic overestimation of the actual number of alleles and hence heterozygosity.Nevertheless, as expected [9,20,44], the effective number of peaks does corre-late strongly with the effective number of alleles as do heterozygosity (Fig. 1)and the inferred genetic distances (see supplementary material online versiononly: http://www.gse-journal.org) when comparing to individually genotypedpigs. Such a comparison was possible only for European breeds, further de-tails can be found in supplementary material. The fact that inferred geneticdistances correlate so strongly (supplementary material) ensures that topologyof the dendrogram remains the same. Similarly, bootstrap values for pooledsamples were congruent albeit somewhat lower than with individual sampling.
“g06071” — 2007/12/14 — 11:07 — page 112 — #10�
�
�
�
�
�
�
�
112 H.-J. Megens et al.
Three distance measures available from the Phylip package (Phylip3.64 [14]) were considered: Nei standard (Ds [29]), Reynolds (Dr [36]), andCavalli-Sforza chord (Dc [5, 20]). Hillel et al. [20] found a significant andlarge degree of correlation between these three distance measures in chickenlines for pooled samples. Moreover, all distance measures should show a highdegree of correlation to the Fst [6]. For most of the analyses in our currentpaper, we calculated all three to evaluate robustness of the results in lieu of themethod applied. Overall, the general conclusions drawn in this paper do notseem considerably biased due to the use of one or the other distance measure,although a few minor discrepancies occur for instance in the topology of thetrees.
We chose to report on the results derived from the Dc measure becausefirst of all it is very similar in nature and performance to the widely used(e.g. [2, 12, 50]) Nei Da measure [30, 35, 45], and it seems superior in treebuilding performance particularly for intra-species phylogenies [45]. Ds seemsless appropriate for our current study since it cannot cope well with fluctuatingpopulations sizes [14], which is something that is likely to have been commonin most breeds. The Dc and Dr measures, however, are not designed to allowmutation. Dr appears to be a good measure for very closely related breeds [27],but may be less appropriate for the current study since the Chinese and Euro-pean breeds are believed to derive from independent domestication events ofwild boar populations [15,25]. Effectively, breeds from these two regions showa separation in time larger than their domestication histories, as illustrated bythe mitochondrial phylogeography [25].
3.2. European breeds: clustering
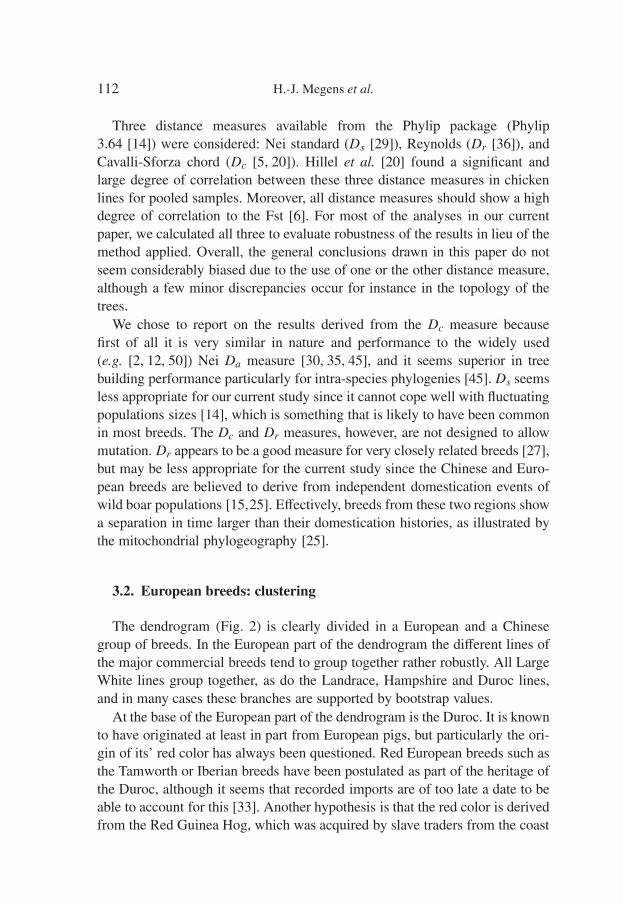
The dendrogram (Fig. 2) is clearly divided in a European and a Chinesegroup of breeds. In the European part of the dendrogram the different lines ofthe major commercial breeds tend to group together rather robustly. All LargeWhite lines group together, as do the Landrace, Hampshire and Duroc lines,and in many cases these branches are supported by bootstrap values.
At the base of the European part of the dendrogram is the Duroc. It is knownto have originated at least in part from European pigs, but particularly the ori-gin of its’ red color has always been questioned. Red European breeds such asthe Tamworth or Iberian breeds have been postulated as part of the heritage ofthe Duroc, although it seems that recorded imports are of too late a date to beable to account for this [33]. Another hypothesis is that the red color is derivedfrom the Red Guinea Hog, which was acquired by slave traders from the coast
“g06071” — 2007/12/14 — 11:07 — page 113 — #11�
�
�
�
�
�
�
�
Genetic variation in pig breeds from China and Europe 113
of Africa. The fact that the Duroc breed is currently so genetically differentfrom other European breeds adds support for this hypothesis.
The history of the Pietrain has been largely unknown. Its origin has beenthought to lie in French or British prick eared breeds [18], although locallandpig has also been postulated [33]. Our results suggest a considerableLandrace heritage for the Pietrain, which is not supported by earlier geneticstudies [40]. The Bunte Bentheimer has been crossed with the Pietrain quiteextensively [33], and accordingly clusters closely together with this breed.
Historically, it is thought that the Large Black, Berkshire, Gloucester OldSpot and the British Saddleback are part of a south English and Midlands de-scent, while the British Lop and Large White/Yorkshire are thought to orig-inate from a northern English stock. Furthermore, it is thought that thesesouth/Midlands English groups are all heavily influenced by crossbreedingwith Neapolitan and/or Asian pigs in the 18th century [1]. The British Lopis a notable exception of the ‘English’ group of traditional breeds in Figure 1,which is consistent with the historical records. The Créole on the other handis part of the ‘English’ group, and is most closely related to the Large Black.This is in line with the documented history of this uniform black breed, whichdesignates Large Black as the most important founding breed, together with afew others [33].
The Tamworth breed is one of the old English breeds that reportedly hasescaped (to some extent) 19th century improvement practices and is be-lieved to have remained more or less in its original state [18, 33]. Fang andAndersson [11] nevertheless found a large proportion of Asian mitochondrialhaplotypes in this breed. Although not very dissimilar in overall genetic dis-tance to the Berkshire and Gloucester Old Spot (MDS analysis, results notshown), the Tamworth does also not cluster together with the ‘English’ group.A ‘landrace’ origin was postulated by Hammond et al. [18], but historicallya close relationship with the Berkshire breed is more probable [1, 33]. Inter-estingly, the Pulawska breed was created in the early 20th century by a crossbetween Berkshire and local pigs. The fact that it is the Tamworth and not theBerkshire that clusters with this Polish breed may be a result of further cross-breeding and marginalization of the Berkshires [33]. This may have resulted inthe Tamworth of today being more like the Berkshire of a century ago than isthe present Berkshire breed itself.
The Angler Sattleschwein is also close to the Tamworth and Pulawska. Thiscould be due to the fact that the Pulawska and Sattleschwein share a similarGerman/Polish landpig heritage, but here more likely to the English connection
“g06071” — 2007/12/14 — 11:07 — page 114 — #12�
�
�
�
�
�
�
�
114 H.-J. Megens et al.
(a)
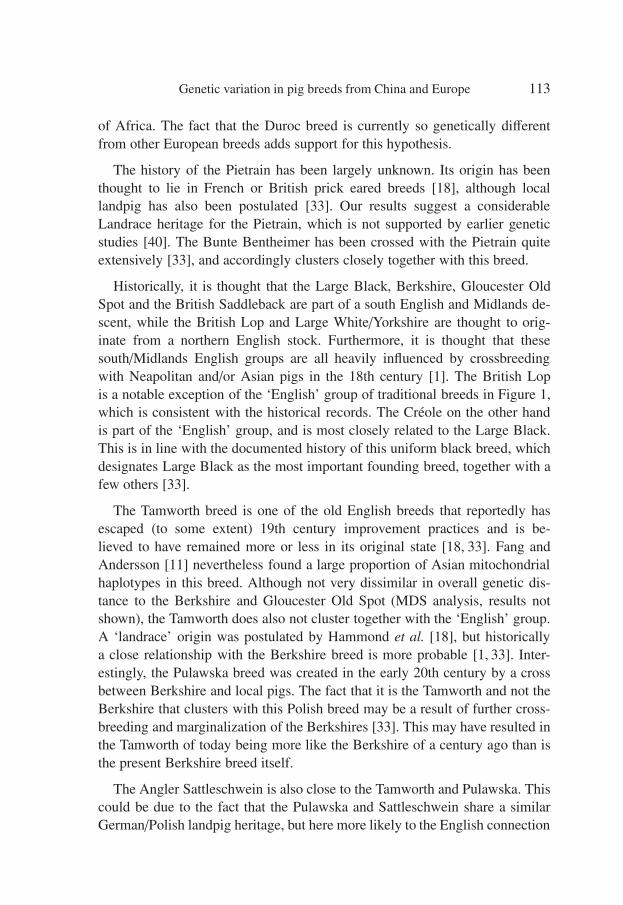
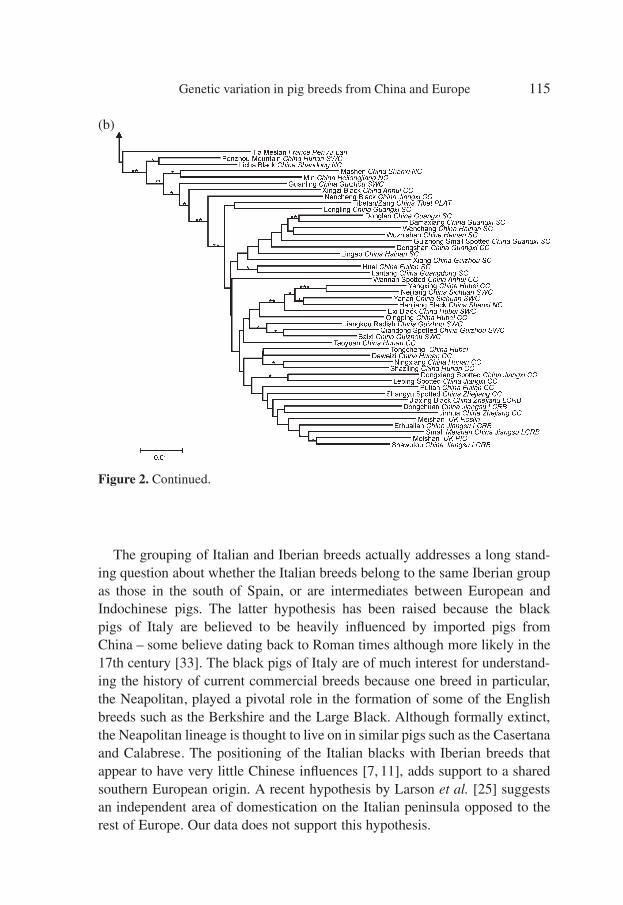
Figure 2. Dendrogram of 98 pig lines from Europe and China, derived from theDc using Neigbor Joining clustering. Bootstrap support is indicated at the branches:∗ > 50%, ∗∗ > 70%, ∗∗∗ > 90%. For Chinese breeds, the types according to Zhang [49]are indicated: NC = North China type, CC = Central China type, SC = South Chinatype, SWC = Southwest China type, Plat = Tibetan/Plateau type, LCRB = LowerChangjiang River Basin type. Figure 2a shows the European part of the dendrogram,Figure 2b the Chinese part. The two parts are connected at the arrow.
that becomes visible; the Angler Sattleschwein has been heavily influenced bythe British (Wessex) Saddleback [18].
A southern European cluster (although not supported by bootstrap values)is found in Figure 1, which contains Spanish and Italian breeds, and also theMangalitsa. Interestingly, furry pigs are thought to have existed for thousandsof years [18] and are known from Roman pictures; the Mangalitsa itself isthought to originate from the Balkans [33].
“g06071” — 2007/12/14 — 11:07 — page 115 — #13�
�
�
�
�
�
�
�
Genetic variation in pig breeds from China and Europe 115
(b)
Figure 2. Continued.
The grouping of Italian and Iberian breeds actually addresses a long stand-ing question about whether the Italian breeds belong to the same Iberian groupas those in the south of Spain, or are intermediates between European andIndochinese pigs. The latter hypothesis has been raised because the blackpigs of Italy are believed to be heavily influenced by imported pigs fromChina – some believe dating back to Roman times although more likely in the17th century [33]. The black pigs of Italy are of much interest for understand-ing the history of current commercial breeds because one breed in particular,the Neapolitan, played a pivotal role in the formation of some of the Englishbreeds such as the Berkshire and the Large Black. Although formally extinct,the Neapolitan lineage is thought to live on in similar pigs such as the Casertanaand Calabrese. The positioning of the Italian blacks with Iberian breeds thatappear to have very little Chinese influences [7, 11], adds support to a sharedsouthern European origin. A recent hypothesis by Larson et al. [25] suggestsan independent area of domestication on the Italian peninsula opposed to therest of Europe. Our data does not support this hypothesis.
“g06071” — 2007/12/14 — 11:07 — page 116 — #14�
�
�
�
�
�
�
�
116 H.-J. Megens et al.
There are a few exceptions to the ‘southern European’ group, most no-tably the Nera Siciliana and the Bisaro. These two breeds are now veryrare and it is known for both breeds that they have been crossbred heav-ily in recent times with commercial western European breeds. The NeraSiciliana is listed in the EAAP-Animal Genetic Data Bank (www.tiho-hannover.de/einricht/zucht/eaap/index.htm) as having > 20% introgression offoreign breeds per generation, including Duroc to which it seems rather similargenetically. The Iberian Celtic types to which the Bisaro belongs are thoughtto be all but extinct and the Bisaro itself has been reported as so heavily cross-bred with foreign breeds that it effectively has ceased to exist [33]. The currentanalysis may be an accurate testimonial to these two breeds’ demise, but maysimultaneously also indicate some of the problems associated with evaluatingbreed history with hierarchical clustering methods; the history of breeds maybecome so complex that a simple dichotomous scheme may not adequatelypresent the relationships between populations.
Many of the synthetic breeds show interesting genetic relationships thatseem perfectly in line with their listed history. The Laconie synthetic, whichis reportedly one third each of Hampshire, Piétrain and Large White [33], sitsin the dendrogram actually in-between the Hampshires and Large Whites. The‘ancient’ synthetic breed Middle White clusters are also very close to the LargeWhites. The German Leicoma synthetic, based on landraces and local saddle-backs but later heavily crossed with Duroc, shows that the latter part of itsheritage is most pronounced by its clustering close to the Duroc lines [33].The only synthetic line whose history is difficult to reconcile with the positionin the tree is the DRB. This line is based on Duroc, although it is noted thatthere is a lot of introgression from the DRC line, which reportedly is created,next to Duroc, from Large White and Landrace (EAAP-Animal Genetic DataBank).
Perhaps the most interesting synthetic is the Tia Meslan, which is a cross ofChinese (Meishan × Jiaxing) boars and European sows, and has been a closedline since its creation [4]. As a consequence of this split Chinese-Europeanheritage, it is positioned perfectly in-between in the dendrogram.
3.3. Chinese breeds: clustering
Although geographical structure is present in the European breeds to someextent, it is not very pronounced and not well supported in the analysis. Thisis in contrast with the Chinese breeds. Here we found a very pronounced clus-tering pattern that largely reflects the types defined by Zhang [49].
“g06071” — 2007/12/14 — 11:07 — page 117 — #15�
�
�
�
�
�
�
�
Genetic variation in pig breeds from China and Europe 117
The breeds of the North China type are most closely related to the Europeanpigs. This observation was congruent with Fang et al. [12] and Kim et al. [22]and was in line with the biogeography of the wild boar, that occurs throughoutEurasia but is absent in the desert areas in the Gobi and at high altitudes inthe Himalayas [31]. This effectively presented a barrier for dispersion in whatis currently the central Asian part of China (i.e. Gobi desert and Tibet), and ifthere was gene flow between Europe and China it was likely through Siberiainto Northern China. Phenotypically, the Northern Chinese wild boar is inter-mediate between European and South Chinese populations [47]. It is thoughtthat throughout history there has been extensive gene flow between domes-ticated pig and wild boar populations and it is likely that this pattern is stillpresent in geographical diversity in pig populations today.
Perhaps the most commercially interesting group is the extremely prolificLower Changjiang River Basin (LCRB) type pigs from East Central China.These also include the now ‘European’ Meishan pigs and together form arather well defined group in the dendrogram. Included in the LCRB clade is theJinhua, a breed from the Zhejiang province that is listed as a Central China type(CC) breed. Its grouping with LCRB types reflects the close geographic prox-imity of this breeds’ origin to the LCRB heartland. Within the LCRB cluster,the Taihu pigs, which are sometimes referred to as a single breed [12] (repre-sented here by European Meishan, Small Meishan, Shawutou and Erhualian)form a single group.
A second very distinct group is a South Chinese group (SC), that does notseem to have exceptions apart from the Dongshan, which is listed as a CentralChinese breed. However, Zhang et al. [50] also found this breed to be closelyrelated to South Chinese breeds. The Tibetan Zang pig is intermediate betweenthe SC and SWC type pigs. This may reflect its geographic distribution, sincethe Tibetan actually exists also in Yunnan and Sichuan provinces that are hometo SC and SWC type breeds.
The Central Chinese types from Jiangxi and Fujian provinces are positionedexactly in-between LCRB and SC types, whereas the CC types from Hubeiand Hunan provinces appear more similar to each other and to the SWC types.This also suggests that genetic relationships are determined in large part bygeographic distance [47].
With a few exceptions, the current results for Chinese breeds are congruentwith the results obtained by Zhang et al. [50]. There are a few breeds that do notgroup as expected based on either previous studies or based on geography. ThePenzhou Mountain appears close to Northern Chinese breeds, which is com-pletely in contrast with previous studies on this breed [12, 50]. The Guanling
“g06071” — 2007/12/14 — 11:07 — page 118 — #16�
�
�
�
�
�
�
�
118 H.-J. Megens et al.
breed has previously been reported as clustering firmly together with otherSWC type breeds. The Longling pigs do not group as expected with other SCtype breeds. The Nancheng Black and Xingzi Black breeds, together in onebranch, were expected to cluster with other CC types from Jiangxi province,although Zhang et al. [50] also found the Nancheng Black to cluster outside ofthe other CC types from the same region.
3.4. Classification of Chinese pigs
From the study by Zhang et al. [50] as well as from our current studythere appears to be grounds to revise the classical classification scheme byZhang [49]. Zhang et al. [50] proposed a completely new system based ontheir phylogenetic analysis, which led to the formation of no less than twelvegroups. In this paper, we chose not to adopt this system.
First of all, the classification is based upon a single tree by Zhang et al. [50]that is likely to show very poor support at various nodes critical to the classi-fication scheme (but not shown in their study). In our study for instance, theMin and Mashen (and in the MDS analysis also the Licha Black) clearly form asingle group, fully congruent to Zhang’s [49] northern Chinese type. However,Zhang et al. [50] chose to make two groups for Min and Mashen. In our anal-ysis, the Jiaxing Black clusters with the other LCRB types, whereas accordingto Zhang et al. [50] it does not and subsequently is designated as a differentgroup. These examples show that building a classification scheme based on an(partly) unreliable tree will only introduce confusion.
Second, methodologically the groupings, as done by Zhang et al. [50], basedon ‘monophyletic’ clusters may seem sound [19], but here we are dealing withpopulations that show some degree of interbreeding and will, as such, notevolve as discrete entities. For population history studies, especially for thoseimplying a large degree of hybridisation, a strictly dichotomous, hierarchicalrepresentation of interrelationships can be a flawed metaphor.
The two-dimensional MDS plot (Fig. 3) shows that some of the inconsis-tencies with expected clustering in the NJ analysis are in truth artefacts ofthe clustering algorithm. The Penzhou Mountain is unexpectedly placed in thetree, but in the MDS plot is in fact close to other SWC type breeds. It is alsorelatively similar to the Licha Black, which in turn is similar to other north-ern types and as a result of clustering order, the Penzhou Mountain is placednear the base of the Chinese part of the tree. The same principal is true for theunexpected placement of the Guanling and Longling breeds.
The MDS plot shows a remarkable congruence with the classificationscheme by Zhang [49] although a few exceptions exist that for the most part
“g06071” — 2007/12/14 — 11:07 — page 119 — #17�
�
�
�
�
�
�
�
Genetic variation in pig breeds from China and Europe 119
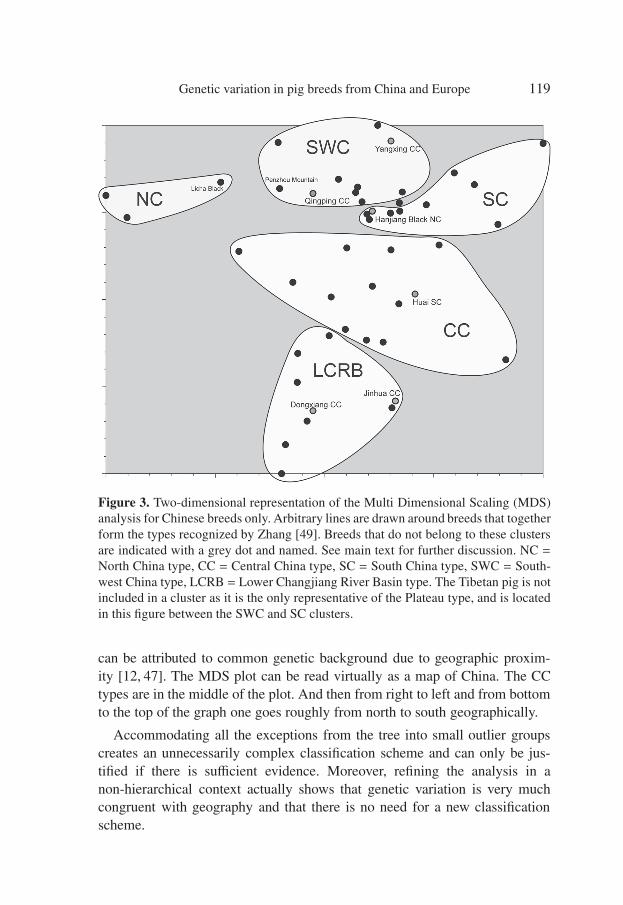
Figure 3. Two-dimensional representation of the Multi Dimensional Scaling (MDS)analysis for Chinese breeds only. Arbitrary lines are drawn around breeds that togetherform the types recognized by Zhang [49]. Breeds that do not belong to these clustersare indicated with a grey dot and named. See main text for further discussion. NC =North China type, CC = Central China type, SC = South China type, SWC = South-west China type, LCRB = Lower Changjiang River Basin type. The Tibetan pig is notincluded in a cluster as it is the only representative of the Plateau type, and is locatedin this figure between the SWC and SC clusters.
can be attributed to common genetic background due to geographic proxim-ity [12, 47]. The MDS plot can be read virtually as a map of China. The CCtypes are in the middle of the plot. And then from right to left and from bottomto the top of the graph one goes roughly from north to south geographically.
Accommodating all the exceptions from the tree into small outlier groupscreates an unnecessarily complex classification scheme and can only be jus-tified if there is sufficient evidence. Moreover, refining the analysis in anon-hierarchical context actually shows that genetic variation is very muchcongruent with geography and that there is no need for a new classificationscheme.
“g06071” — 2007/12/14 — 11:07 — page 120 — #18�
�
�
�
�
�
�
�
120 H.-J. Megens et al.
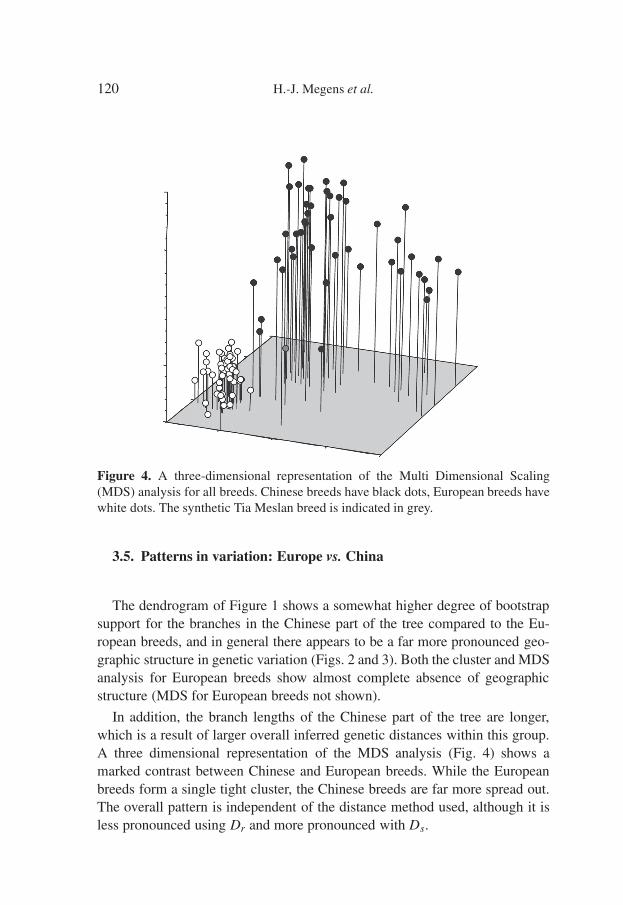
Figure 4. A three-dimensional representation of the Multi Dimensional Scaling(MDS) analysis for all breeds. Chinese breeds have black dots, European breeds havewhite dots. The synthetic Tia Meslan breed is indicated in grey.
3.5. Patterns in variation: Europe vs. China
The dendrogram of Figure 1 shows a somewhat higher degree of bootstrapsupport for the branches in the Chinese part of the tree compared to the Eu-ropean breeds, and in general there appears to be a far more pronounced geo-graphic structure in genetic variation (Figs. 2 and 3). Both the cluster and MDSanalysis for European breeds show almost complete absence of geographicstructure (MDS for European breeds not shown).
In addition, the branch lengths of the Chinese part of the tree are longer,which is a result of larger overall inferred genetic distances within this group.A three dimensional representation of the MDS analysis (Fig. 4) shows amarked contrast between Chinese and European breeds. While the Europeanbreeds form a single tight cluster, the Chinese breeds are far more spread out.The overall pattern is independent of the distance method used, although it isless pronounced using Dr and more pronounced with Ds.
“g06071” — 2007/12/14 — 11:07 — page 121 — #19�
�
�
�
�
�
�
�
Genetic variation in pig breeds from China and Europe 121
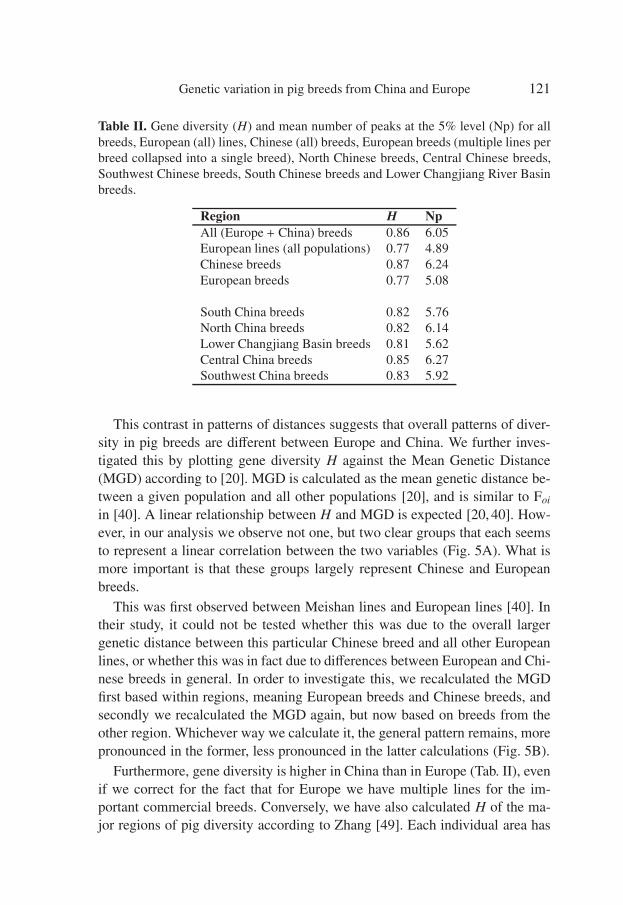
Table II. Gene diversity (H) and mean number of peaks at the 5% level (Np) for allbreeds, European (all) lines, Chinese (all) breeds, European breeds (multiple lines perbreed collapsed into a single breed), North Chinese breeds, Central Chinese breeds,Southwest Chinese breeds, South Chinese breeds and Lower Changjiang River Basinbreeds.
Region H NpAll (Europe + China) breeds 0.86 6.05European lines (all populations) 0.77 4.89Chinese breeds 0.87 6.24European breeds 0.77 5.08
South China breeds 0.82 5.76North China breeds 0.82 6.14Lower Changjiang Basin breeds 0.81 5.62Central China breeds 0.85 6.27Southwest China breeds 0.83 5.92
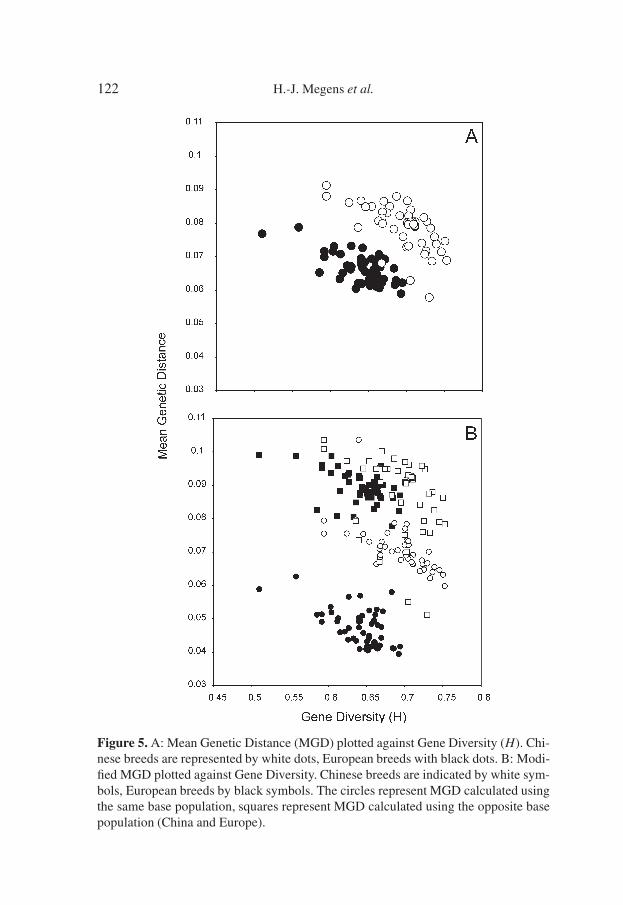
This contrast in patterns of distances suggests that overall patterns of diver-sity in pig breeds are different between Europe and China. We further inves-tigated this by plotting gene diversity H against the Mean Genetic Distance(MGD) according to [20]. MGD is calculated as the mean genetic distance be-tween a given population and all other populations [20], and is similar to Foi
in [40]. A linear relationship between H and MGD is expected [20, 40]. How-ever, in our analysis we observe not one, but two clear groups that each seemsto represent a linear correlation between the two variables (Fig. 5A). What ismore important is that these groups largely represent Chinese and Europeanbreeds.
This was first observed between Meishan lines and European lines [40]. Intheir study, it could not be tested whether this was due to the overall largergenetic distance between this particular Chinese breed and all other Europeanlines, or whether this was in fact due to differences between European and Chi-nese breeds in general. In order to investigate this, we recalculated the MGDfirst based within regions, meaning European breeds and Chinese breeds, andsecondly we recalculated the MGD again, but now based on breeds from theother region. Whichever way we calculate it, the general pattern remains, morepronounced in the former, less pronounced in the latter calculations (Fig. 5B).
Furthermore, gene diversity is higher in China than in Europe (Tab. II), evenif we correct for the fact that for Europe we have multiple lines for the im-portant commercial breeds. Conversely, we have also calculated H of the ma-jor regions of pig diversity according to Zhang [49]. Each individual area has
“g06071” — 2007/12/14 — 11:07 — page 122 — #20�
�
�
�
�
�
�
�
122 H.-J. Megens et al.
Figure 5. A: Mean Genetic Distance (MGD) plotted against Gene Diversity (H). Chi-nese breeds are represented by white dots, European breeds with black dots. B: Modi-fied MGD plotted against Gene Diversity. Chinese breeds are indicated by white sym-bols, European breeds by black symbols. The circles represent MGD calculated usingthe same base population, squares represent MGD calculated using the opposite basepopulation (China and Europe).
“g06071” — 2007/12/14 — 11:07 — page 123 — #21�
�
�
�
�
�
�
�
Genetic variation in pig breeds from China and Europe 123
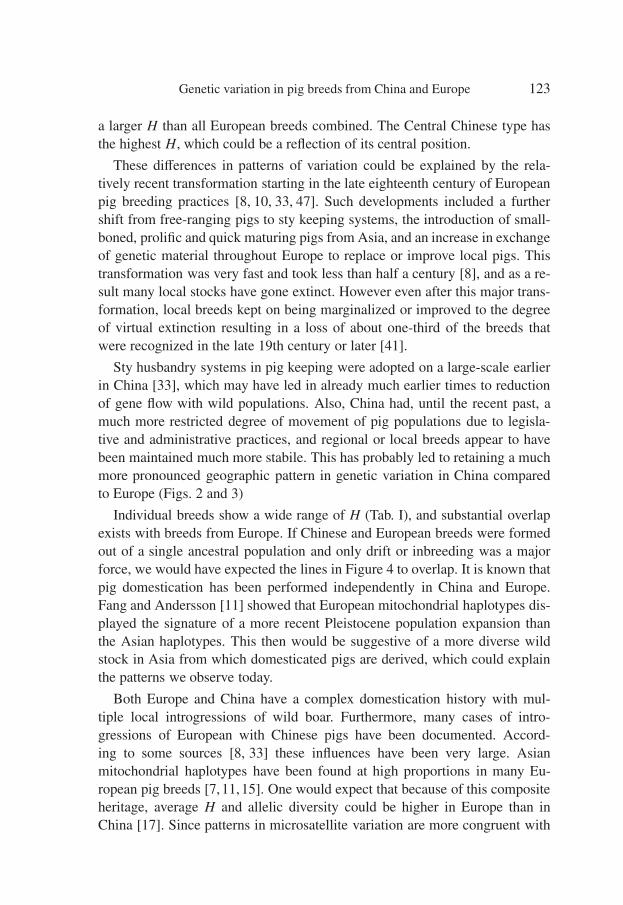
a larger H than all European breeds combined. The Central Chinese type hasthe highest H, which could be a reflection of its central position.
These differences in patterns of variation could be explained by the rela-tively recent transformation starting in the late eighteenth century of Europeanpig breeding practices [8, 10, 33, 47]. Such developments included a furthershift from free-ranging pigs to sty keeping systems, the introduction of small-boned, prolific and quick maturing pigs from Asia, and an increase in exchangeof genetic material throughout Europe to replace or improve local pigs. Thistransformation was very fast and took less than half a century [8], and as a re-sult many local stocks have gone extinct. However even after this major trans-formation, local breeds kept on being marginalized or improved to the degreeof virtual extinction resulting in a loss of about one-third of the breeds thatwere recognized in the late 19th century or later [41].
Sty husbandry systems in pig keeping were adopted on a large-scale earlierin China [33], which may have led in already much earlier times to reductionof gene flow with wild populations. Also, China had, until the recent past, amuch more restricted degree of movement of pig populations due to legisla-tive and administrative practices, and regional or local breeds appear to havebeen maintained much more stabile. This has probably led to retaining a muchmore pronounced geographic pattern in genetic variation in China comparedto Europe (Figs. 2 and 3)
Individual breeds show a wide range of H (Tab. I), and substantial overlapexists with breeds from Europe. If Chinese and European breeds were formedout of a single ancestral population and only drift or inbreeding was a majorforce, we would have expected the lines in Figure 4 to overlap. It is known thatpig domestication has been performed independently in China and Europe.Fang and Andersson [11] showed that European mitochondrial haplotypes dis-played the signature of a more recent Pleistocene population expansion thanthe Asian haplotypes. This then would be suggestive of a more diverse wildstock in Asia from which domesticated pigs are derived, which could explainthe patterns we observe today.
Both Europe and China have a complex domestication history with mul-tiple local introgressions of wild boar. Furthermore, many cases of intro-gressions of European with Chinese pigs have been documented. Accord-ing to some sources [8, 33] these influences have been very large. Asianmitochondrial haplotypes have been found at high proportions in many Eu-ropean pig breeds [7,11,15]. One would expect that because of this compositeheritage, average H and allelic diversity could be higher in Europe than inChina [17]. Since patterns in microsatellite variation are more congruent with
“g06071” — 2007/12/14 — 11:07 — page 124 — #22�
�
�
�
�
�
�
�
124 H.-J. Megens et al.
‘ancestral’ mitochondrial variation, it seems likely that contributions of sowsand boars have not been equal.
Although currently we can only hypothesize on the causes for differencesbetween European and Chinese pig breeds, this study clearly shows that theydo represent two different groups not only in general terms of diversity butlikely also in domestication and breed formation and maintenance processes.This knowledge should be incorporated in genetic diversity management sys-tems [17, 38]. Crossing pig breeds from the same sub-cluster in the phyloge-netic analysis has been proposed as a means of conserving genetic diversity ofChinese pigs [12]. Given the distinctiveness of many Chinese breeds and thelarger overall gene diversity compared to European breeds it seems more ap-propriate to maintain current stocks in sufficient numbers to avoid inbreeding.
3.6. Conclusions
The pooled sampling method is a very effective method to discern pat-terns of relatedness of breeds or populations as shown by our clusteringmethod. Although there are minor differences in details of the trees, in gen-eral our results were in line with previous work on Chinese and Europeanbreeds [12, 40, 47, 50]. In a few cases the conclusions we draw, are differ-ent from earlier published work. This may in part reflect different methodsof analysis or differences in interpretation. However, we believe that it alsoreflects the increased number of markers and breeds included compared to anumber of other studies. Most importantly, this study was, for the first time,able to demonstrate patterns of diversity in a large part of the breed diversityof China and Europe simultaneously, demonstrating the differences in geneticvariation reflecting differences in domestication and breed formation historybetween these two major regions of pig domestication.
ACKNOWLEDGEMENTS
This work was funded by European Union grant QLK5-CT-2002-01059.European DNA samples, other than those provided by the authors, wereprovided by Agence de la Sélection Porcine, France, Georg-August Uni-versity Göttingen, Germany, Universidad de Córdoba, Spain, Universidadede Trás-os-Montes e Alto Douro, Portugal, Rare Breeds Survival Trust,UK, Roslin Insitute, UK, PIC International Group, UK. We thank Colinevan Moorsel for helpful remarks on the manuscript.
“g06071” — 2007/12/14 — 11:07 — page 125 — #23�
�
�
�
�
�
�
�
Genetic variation in pig breeds from China and Europe 125
REFERENCES
[1] Alderson L., The chance to survive, Helm Publishers, Bromley, UK, 1990.[2] Beja-Pereira A., Alexandrino P., Bessa I., Carretero Y., Dunner S., Ferrand N.,
Jordana J., Laloë D., Moazami-Goudarzi K., Sanchez A., Canon J., Genetic char-acterization of Southwestern European bovine breeds: a historical and biogeo-graphical reassessment with a set of 16 microsatellites, J. Heredity 94 (2003)243–250.
[3] Blott S., Andersson L., Groenen M., San Cristobal M., Chevalet C., CardellinoR., Li N., Huang L., Li K., Plastow G., Haley C., Characterisation of geneticvariation in the pig breeds of China and Europe – the PigBioDiv2 project, Arch.Zootec. 52 (2003) 207–217.
[4] Burlot T., Zhang S., Naveau J., Legault C., Bidanel J.P., Genetic parametersand genetic trends in the Sino-European Tia Meslan composite line, 6th WorldCongress on Genetics Applied to Livestock Production 23 (1998) 599–602.
[5] Cavalli-Sforza L.L., Edwards A.W.F., Phylogenetic analysis: models and esti-mation procedures, Am. J. Hum. Genet. 19 (1967) 233–257.
[6] Cavalli-Sforza L.L., Menozzi P., Piazza A., The history and geography of humangenes, Princeton University Press, Princeton, NY, USA, 1994.
[7] Clop A., Amills M., Noguera J.L., Fernandez A., Capote J., Ramon M.M., KellyL., Kijas J.M.H., Andersson L., Sanchez A., Estimating the frequency of Asiancytochrome B haplotypes in standard European and local Spanish breeds, Genet.Sel. Evol. 36 (2004) 97–104.
[8] Clutton-Brock J., A natural history of domesticated mammals, Second Edn.Cambridge University Press, Cambridge UK, 1999.
[9] Crooijmans R., Groen A.F., van Kampen J.A., van der Beek S., van der Poel J.J.,Groenen M.A.M., Microsatellite polymorphism in commercial broiler and layerlines estimated using pooled blood samples, Poultry Sci. 75 (1996) 904–909.
[10] Darwin C., The variation of animals and plants under domestication, London,John Murray, 1868.
[11] Fang M., Andersson L., Mitochondrial diversity in European and Chinese pigsis consistent with population expansions that occurred prior to domestication,Proc. Biol. Sci. 273 (2006) 1803–1810.
[12] Fang M., Hu X., Jiang T., Braunschweig M., Hu L., Du Z., Feng J., Zhang Q.,Wu C., Li N., The phylogeny of Chinese indigenous pig breeds inferred frommicrosatellite markers, Anim. Genet. 36 (2005) 7–13.
[13] Felsenstein J., Confidence limits on phylogenies: an approach using the boot-strap, Evolution 39 (1985) 783–791.
[14] Felsenstein J., PHYLIP (Phylogeny Inference Package) version 3.6, Distributedby the author, Department of Genome Sciences, University of Washington,Seattle, 2005.
[15] Giuffra E., Kijas J.M.H., Amarger V., Carlborg O., Jeon J.-T., Andersson L., Theorigin of the domestic pig: independent domestication and subsequent introgres-sion, Genetics 154 (2000) 1785–1791.
“g06071” — 2007/12/14 — 11:07 — page 126 — #24�
�
�
�
�
�
�
�
126 H.-J. Megens et al.
[16] Groenen M.A.M., Joosten R., Boscher M.-Y., Amigues Y., Rattink A., HarliziusB., van der Poel J.J., Crooijmans R., The use of microsatellite genotyping forpopulation studies in the pig with individual and pooled samples, Arch. Zootec.52 (2003) 145–155.
[17] Hall S.J.G., Livestock Biodiversity. Genetic Resources for the Farming of theFuture, Blackwell Science, Oxford, UK, 2004.
[18] Hammond J., Johansson I., Haring F., Handbuch der Tierzüchtung, Dritter BandRassenkunde, Verlag Paul Parey, Hamburg, 1961.
[19] Hennig W., Phylogenetic systematics (English trans. and extensively rev., D.Dwight Davis & Rainer Zangerl), Urbana: U. Ill. Press, 1966.
[20] Hillel J., Groenen M.A.M., Tixier-Boichard M., Korol A.B., David L., KirzhnerV., Burke T., Barre-Dirie A., Crooijmans R.P.M.A., Elo K., Feldman M.W.,Freidlin P.J., Maki-Tanila A., Oortwijn M., Thomson P., Vignal A., WimmersK., Weigend S., Biodiversity of 52 chicken populations assessed by microsatel-lite typing of DNA pools, Genet. Sel. Evol. 35 (2003) 533–557.
[21] Jones G.F., Genetic aspects of domestication, common breeds and their ori-gin, in: Ruvinsky A., Rothschild M.F. (Eds.), The Genetics of the Pig, CABInternational, Oxon, UK, 1998, pp. 17–50.
[22] Kim T.H., Kim K.S., Choi B.H., Yoon D.H., Jang G.W., Lee K.T., Chung H.Y.,Lee H.Y., Park H.S., Lee J.W., Genetic structure of pig breeds from Korea andChina using microsatellite loci analysis, J. Anim. Sci. 83 (2005) 2255–2263.
[23] Kruskal J.B., Multidimensional scaling by optimizing goodness of fit to a non-metric hypothesis, Psychometrika 29 (1964) 1–27.
[24] Kumar S., Tamura K., Nei M., MEGA 3: Integrated software for molecularevolutionary genetics analysis and sequence alignment, Brief. Bioinformatics5 (2004) 150–163.
[25] Larson G., Dobney K., Albarella U., Fang M., Matisoo-Smith E., Robins J.,Lowden S., Finlayson H., Brand T., Willerslev E., Rowley-Conwy P., AnderssonL., Cooper A., Worldwide phylogeography of wild boar reveals multiple centersof pig domestication, Science 307 (2005) 1618–1621.
[26] Laval G., Iannuccelli N., Legault C., Milan D., Groenen M.A.M., Giuffra E.,Andersson L., Nissen P.H., Jorgensen C.B., Beeckman P., Geldermann H.,Foulley J.-L., Chevalet C., Ollivier L., Genetic diversity of eleven pig breeds,Genet. Sel. Evol. 32 (2000) 187–203.
[27] Laval G., San Cristobal M., Chevalet C., Measuring genetic distances betweenbreeds: use of some distances in various short term evolution models, Genet. Sel.Evol. 34 (2002) 481–507.
[28] Martinez A.M., Delgado J.V., Rodero A., Vega-Pla J.L., Genetic structure of theIberian pig breed using microsatellites, Anim. Genet. 31 (2000) 295–301.
[29] Nei M., Genetic distance between populations, Amer. Nat. 106 (1972) 283–292.[30] Nei M., Tajima F., Tateno T., Accuracy of estimated phylogenetic trees from
molecular data, J. Mol. Evol. 19 (1983) 153–170.[31] Oliver W.L.R., Brisbin I.L., Takahashi S., The Eurasian wild pig (Sus scrofa), in:
Pigs, Peccaries and Hippos: Status Survey and Action Plan, W.L.R. Oliver (Ed.),Gland, Switzerland: IUCN,1993, pp. 112–121.
“g06071” — 2007/12/14 — 11:07 — page 127 — #25�
�
�
�
�
�
�
�
Genetic variation in pig breeds from China and Europe 127
[32] Ollivier L., Amigues Y., Boscher M.-Y., An EC-funded project on characteri-zation of genetic variation in the European pig. Objectives, organization, breedsampling, DNA preparation and circulation, Arch. Zootec. 52 (2003) 137–144.
[33] Porter V., Pigs. A Handbook to the Breeds of the World, Helm Information Ltd.,Near Robertsbridge, UK, 1993.
[34] Porter V., Mason’s World Dictionary of Livestock Breeds, Types and Varieties,5th edn., CABI Publishing, Wallingford, UK, 2002.
[35] Reif J.C., Melchinger A.E., Frisch M., Genetical and mathematical properties ofsimilarity and dissimilarity coefficients applied in plant breeding and seed bankmanagement, Crop Sci. 45 (2005) 1–7.
[36] Reynolds J.B., Weir B.S., Cockerham C.C., Estimation of the coancestry coeffi-cient: basis for a short-term genetic distance, Genetics 105 (1983) 767–779.
[37] Rohlf F.J., NTSYSpc 2.1, Numerical Taxonomy and Multivariate AnalysisSystem, Exeter Software, Setauket, NY, USA, 2000.
[38] Ruane J., A critical review of the value of genetic distance studies in conservationof animal genetic resources, J. Anim. Breed. Genet. 116 (1999) 317–323.
[39] Saitou N., Nei M., The neighbor-joining method: a new method for reconstruct-ing phylogenetic trees, Mol. Biol. Evol. 4 (1987) 406–425.
[40] San Cristobal M., Chevalet C., Haley C.S., Joosten R., Rattink A.P., HarliziusB., Groenen M.A.M., Amigues Y., Boscher M.-Y., Russell G., Law A., DavoliR., Russo V., Désautés C., Alderson L., Fimland E., Bagga M., Delgado J.V.,Vega-Pla J.L., Martinez A.M., Ramos M., Glodek P., Meyer J.N., Gandini G.C.,Matassino D., Plastow G.S., Siggens K.W., Laval G., Archibald A.L., Milan D.,Hammond K., Cardellino R., Genetic diversity within and between European pigbreeds using microsatellite markers, Anim. Genet. 37 (2006) 189–198.
[41] Scherf B.D., World Watch List for Animal Diversity, 3rd edn., FAO, Rome, Italy,2000.
[42] Schnack H.G., Bakker S.C., Van’T Slot R., Groot B.M., Sinke R.J., KahnR.S., Pearson P.L., Accurate determination of microsatellite allele frequenciesin pooled DNA samples, Eur. J. Hum. Genet. 2 (2004) 925–934.
[43] Silva L.K., Liu S., Blanton R.E., Microsatellite analysis of pooled Schistosomamansoni DNA: an approach for studies of parasite populations, Parasitology 132(2006) 1–8.
[44] Skalski G.T, Couch C.R., Garber A.F., Weir B.S., Sullivan C.V., Evaluation ofDNA Pooling for the estimation of microsatellite allele frequencies: a case studyusing Striped Bass (Morone saxatilis), Genetics 178 (2006) 863–875.
[45] Takezaki N., Nei M., Genetic distances and reconstruction of phylogenetic treesfrom microsatellite DNA, Genetics 144 (1996) 389–399.
[46] Yang H.-C., Liang Y.-J., Huang M.-C., Li L.-H., Lin C.-H., Wu J.-Y., Chen Y.-T.,Fann C.S.J., A genome-wide study of preferential amplification/hybridization inmicro-array-based pooled DNA experiments, Nucleic Acids Res. 34 (2006) 1–11.
[47] Yang S.-L., Wang Z.-G., Liu B., Zhang G.-X., Zhao S.-H., Yu M., Fan B.,Li M.-H., Xiong T.A., Li K., Genetic variation and relationships of eighteenChinese indigenous pig breeds, Genet. Sel. Evol. 35 (2003) 657–671.
“g06071” — 2007/12/14 — 11:07 — page 128 — #26�
�
�
�
�
�
�
�
128 H.-J. Megens et al.
[48] Zeuner F.E., A History of Domesticated Animals, Harper and Row Publishers,New York, NY, USA, 1963.
[49] Zhang Z., Pig Breeds in China, Shanghai Scientific and Technical Publishers,Shanghai, China, 1986.
[50] Zhang G.-X., Wang Z.-G., Sun F.-Z., Chen W.-S., Yang G.-Y., Guo S.-J., Li Y.-J,Zhao X.-L., Zhang Y., Sun J., Fan B., Yang S.-L., Li K., Genetic diversity ofmicrosatellite loci in fifty-six Chinese native pig breeds, Acta Genet. Sinica 30(2003) 225–233.


