Embed Size (px)
Citation preview
Biomass and Bioenergy 20 (2001) 71–82
Biofuel availability and domestic use patterns in Kenya
Evans Kituyia;b, Lackson Marufub, Shem O. Wandigaa, Isaac O. Jumbaa,Meinrat O. Andreaeb, G�unter Helasb; ∗
aUniversity of Nairobi, Department of Chemistry, P.O. Box 30197, Nairobi, KenyabMax Planck Institute for Chemistry, Biogeochemistry Department, P.O. Box 3060, D-55020 Mainz, Germany
Received 28 May 1999; received in revised form 26 June 2000; accepted 28 September 2000
Abstract
The annual domestic consumption levels and patterns of various common biofuels in Kenya were surveyed. The mainfuelwood sources were farmland trees, indigenous forests, woodlands and timber o�-cuts from plantations. In 1997, about15.4 million tonnes of �rewood (air-dried) were consumed and an equivalent of 17.1 million tonnes round wood wet weight(w=w) was converted to charcoal. In the same year, 1.4 million tonnes of a variety of crop residues were also consumed asdomestic fuel. Biofuel availability was the major factor in uencing the reported annual spatial species use and consumptionpatterns. Competing demand for the commonly-used tree species (mainly eucalyptus trees) for commercial and other purposesaccounts, to a large extent, for the reported dwindling amounts. Communities in various regions have responded by graduallyshifting to other available types including those in gazetted forests. Such a response strategy has implications on the long-termspatial and temporal biofuel use patterns. c© 2001 Elsevier Science Ltd. All rights reserved.
Keywords: Biomass assessment; Biofuel species; Kenya; Use patterns
1. Introduction
Biomass burning is recognised as a major sourceof important atmospheric trace gases [1–3], and ourunderstanding of the emissions from most of theknown biomass burning-related sources (mainly sa-vanna and forest �res) has advanced signi�cantlyover the last decade (see for example, specialissue of Journal of Atmospheric Chemistry, 22(1,2) 1995 on FOS=DECAFE-91 and special issue ofJournal of Geophysical Research, 101 (D19) 1996on SAFARI-92). However, there are diverse knowl-edge gaps in our understanding of the role that
∗ Corresponding author. Fax: +49-6131-305487.E-mail address: [email protected] (G. Helas).
domestic biomass burning in developing countriesplays in in uencing the overall biomass burning emis-sion budgets. Most important is the lack of reliablebiofuel consumption data for most developing coun-tries, a situation that has hampered e�orts to quantifythe contribution of emissions from domestic biomassburning to the global atmospheric trace gas budgets.Apart from being very costly, energy surveys are
di�cult and time-consuming to carry out accurately[4]. For instance, whereas biofuel consumption datafor Kenya exist in o�cial records, much is recycledand traceable back to original data sources, many ofwhich are already obsolete and therefore of question-able value. High population growth rates and increas-ing household fuel demands in Kenya are bound tooccasional increases in the levels of trace gases, most
0961-9534/01/$ - see front matter c© 2001 Elsevier Science Ltd. All rights reserved.PII: S0961 -9534(00)00071 -4
72 E. Kituyi et al. / Biomass and Bioenergy 20 (2001) 71–82
of which potentially in uence the local and regionalatmospheric chemistry and climate.This paper identi�es the common domestic biofuels
used in Kenya and reports on their respective annualconsumption estimates and species use patterns. Datawere obtained by means of bibliographic study andquestionnaire survey involving households, boardingacademic institutions and local catering outlets, all ofwhich are referred to in this paper as domestic con-sumers. It was not the intention of this study to assessindustrial and other biofuel use in the country.The closed indigenous forests in Kenya cover an
area of 1.4 million hectares, representing 2.5% of thetotal land area. They are predominantly located inthe highlands and the Nyanza plateau where the cli-mate is humid to semi-humid [5]. The total standingvolume of indigenous forests is estimated to be 200million cubic metres with sustainable fuelwood yieldsof about 769; 100m3 [6]. The forest areas fall underdi�erent management regimes and have di�erent le-gal status, where the majority of closed canopy for-est land is gazetted forest reserve [6]. It is estimatedthat about 2.9 million people (given as 530,000 house-holds) live within 5 km of the forest edge, representingover 10% of the population of Kenya. Similarly, about3000 households dwell in forests in scattered commu-nities while about 4000 squatter households live andcultivate within the forest reserves [6]. Firewood col-lection (deadwood only) in these gazetted forests ispermitted under licence and is normally obtained at asmall fee.Government-owned forest plantations cover about
170,000 ha of which about 20,000 ha are open landor have been felled and not replanted [7]. These aredistributed in medium- and high-potential areas in 17districts. There are also 70,000 ha of privately ownedplantations, of which 67% are covered by eucalyptusand wattle trees [7].Kenyan soils, which are grouped into various units
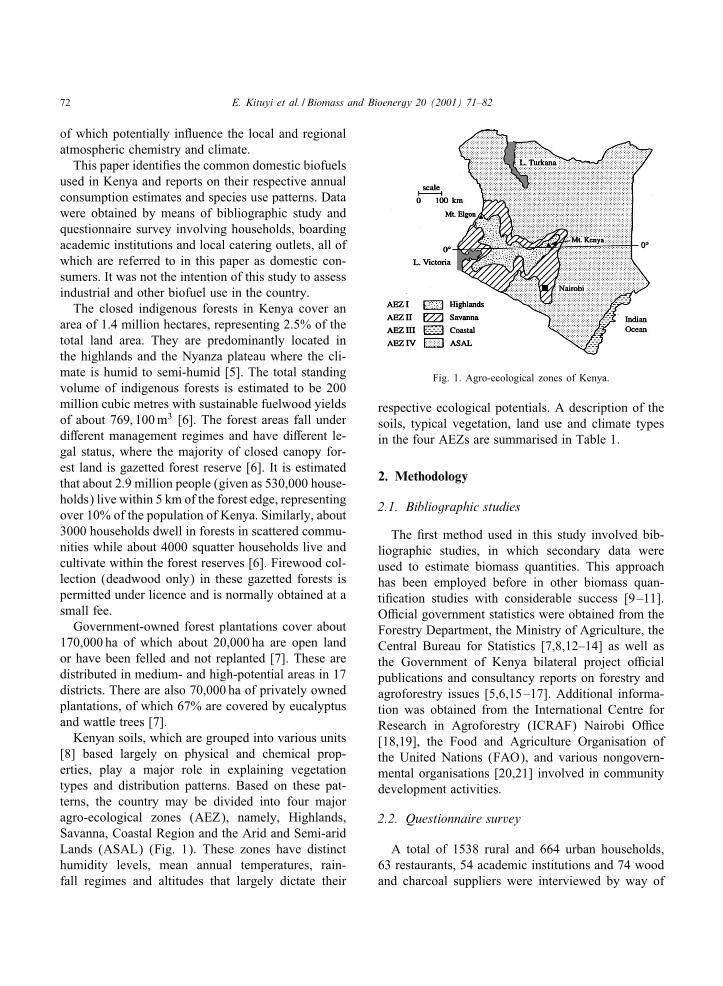
[8] based largely on physical and chemical prop-erties, play a major role in explaining vegetationtypes and distribution patterns. Based on these pat-terns, the country may be divided into four majoragro-ecological zones (AEZ), namely, Highlands,Savanna, Coastal Region and the Arid and Semi-aridLands (ASAL) (Fig. 1). These zones have distincthumidity levels, mean annual temperatures, rain-fall regimes and altitudes that largely dictate their
Fig. 1. Agro-ecological zones of Kenya.
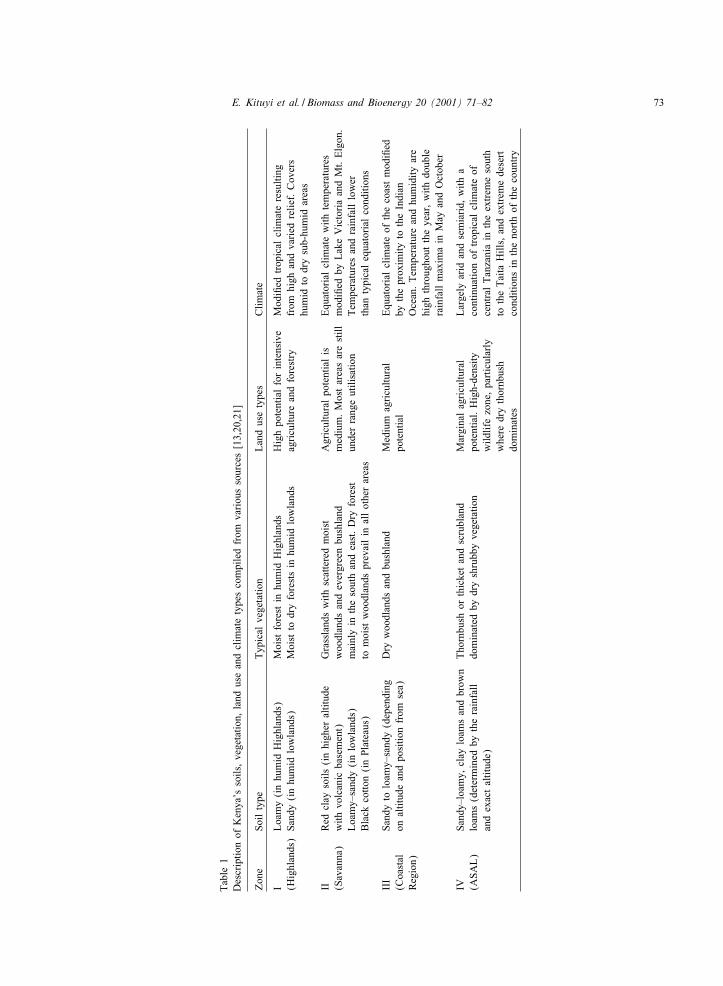
respective ecological potentials. A description of thesoils, typical vegetation, land use and climate typesin the four AEZs are summarised in Table 1.
2. Methodology
2.1. Bibliographic studies
The �rst method used in this study involved bib-liographic studies, in which secondary data wereused to estimate biomass quantities. This approachhas been employed before in other biomass quan-ti�cation studies with considerable success [9–11].O�cial government statistics were obtained from theForestry Department, the Ministry of Agriculture, theCentral Bureau for Statistics [7,8,12–14] as well asthe Government of Kenya bilateral project o�cialpublications and consultancy reports on forestry andagroforestry issues [5,6,15–17]. Additional informa-tion was obtained from the International Centre forResearch in Agroforestry (ICRAF) Nairobi O�ce[18,19], the Food and Agriculture Organisation ofthe United Nations (FAO), and various nongovern-mental organisations [20,21] involved in communitydevelopment activities.
2.2. Questionnaire survey
A total of 1538 rural and 664 urban households,63 restaurants, 54 academic institutions and 74 woodand charcoal suppliers were interviewed by way of
E. Kituyi et al. / Biomass and Bioenergy 20 (2001) 71–82 73
Table1
DescriptionofKenya’ssoils,vegetation,landuseandclimatetypescompiledfrom
varioussources[13,20,21]
Zone
Soiltype
Typicalvegetation
Landusetypes
Climate
ILoamy(inhumidHighlands)
MoistforestinhumidHighlands
Highpotentialforintensive
Modi�edtropicalclimateresulting
(Highlands)Sandy(inhumidlowlands)
Moisttodryforestsinhumidlowlands
agricultureandforestry
from
highandvariedrelief.Covers
humidtodrysub-humidareas
IIRedclaysoils(inhigheraltitude
Grasslandswithscatteredmoist
Agriculturalpotentialis
Equatorialclimatewithtemperatures
(Savanna)
withvolcanicbasement)
woodlandsandevergreenbushland
medium.Mostareasarestill
modi�edbyLakeVictoriaandMt.Elgon.
Loamy–sandy(inlowlands)
mainlyinthesouthandeast.Dryforest
underrangeutilisation
Temperaturesandrainfalllower
Blackcotton(inPlateaus)
tomoistwoodlandsprevailinallotherareas
thantypicalequatorialconditions
III
Sandytoloamy–sandy(depending
Drywoodlandsandbushland
Mediumagricultural
Equatorialclimateofthecoastmodi�ed
(Coastal
onaltitudeandpositionfrom
sea)
potential
bytheproximitytotheIndian
Region)
Ocean.Temperatureandhumidityare
highthroughouttheyear,withdouble
rainfallmaximainMayandOctober
IVSandy–loamy,clayloamsandbrownThornbushorthicketandscrubland
Marginalagricultural
Largelyaridandsemiarid,witha
(ASAL)
loams(determinedbytherainfall
dominatedbydryshrubbyvegetation
potential.High-density
continuationoftropicalclimateof
andexactaltitude)
wildlifezone,particularly
centralTanzaniaintheextremesouth
wheredrythornbush
totheTaitaHills,andextremedesert
dominates
conditionsinthenorthofthecountry
74 E. Kituyi et al. / Biomass and Bioenergy 20 (2001) 71–82
questionnaire between January and March 1997. Thequestionnaire survey was conducted to gather infor-mation, which, together with secondary data, wouldgive a reliable estimate of the national demand forvarious wood and residue species. The questionnairewas adopted from that of Marufu et al. [22] withadjustments to suit situations in Kenya. Informationobtained was also intended to verify the potential offorest-yields in meeting supply and demand trends. Atthe completion of this survey, information on issuessuch as biofuel availability, access to biomass sources,common wood species and spatial distribution withinthe country’s ecological zones was gathered.Eight rural regions and �ve urban centres were
selected within the country’s agro-ecological zones(Fig. 1). To obtain the required data, these areaswere strati�ed further into several clusters based onsocio-economic parameters among the urban dwellersand on cultural di�erences, relief, land use patternsand population densities for rural sites according tothe procedure of Hosier [23].
3. Results and discussion
3.1. National forestry resources
3.1.1. Indigenous forestsThe Kenya Forestry Master Plan [7] reports on the
indigenous forest resources which can be summarisedas follows: (1) Closed broad-leaved forests whichinclude the Rainforest, Camphor (Ocotea), Wet mon-tane (Aningera, Albizia, Olea), Pillarwood (Cas-sipourea), Croton types, Diospyros, Coastal (Afzelia,Milicia, Paramacrolobium) and the Riverine forests.(2) Open broad-leaved forests which include the Wetupland (Hagenia), Dry upland (Afrocrania) andCoastal (Cyanometra, Brachystegia, Combretum).(3) The coniferous forest types which include thePodo (Podocarpus) and Cedar (Juniperus) trees. (3)Other forest types which include the Bamboo (Arund-inaria) and Mangrove forests (Rhizophora=Ceriops).These species types and their distribution have beendescribed in detail elsewhere [5,6].
3.1.2. Plantation forestsThere have been changes over the years in the
choice of plantation species as a result of changing
end-use objectives, the e�ectiveness of regeneration,and relative susceptibility or resistance to insects,diseases and damage by wild herbivores. Presently,Cupressus lusitanica, Pinus patula and Eucalyptussaligna are the main species [7]. Details on the sizeand distribution of the major plantation forests havebeen reported by the Kenya Forestry Master Plan [7].
3.1.3. Farmland treesFarmlands and settlements contain an average of
about 9:3m3 ha−1 of woody biomass, increasing an-nually at a rate of about 0:5m3 ha−1 [7]. Amongthe commonly planted trees on farmlands are theeucalyptus, cypress and jacaranda. These are plantedowing largely to their fast-growing nature and capa-city to provide construction wood for households.Cypress is planted mainly as hedge=fence. Othercommonly planted trees include fruit trees such asavocado (Persea americana), citrus (Citrus limonand C. sinensis), mango (Mangifera indica) andguava (Psidium guajava). Most of these provide goodshades and act as wind breaks in the homes.Agroforestry is not a very new farming system in
Kenya. A traditional agroforestry practice at the coastinvolves the inter-cropping of coconut and cashew nuttrees with maize, beans and cassava [18]. Farmersin the central highlands grow indigenous trees suchas Cordia abyssinica and Markhamia lutea and theexotic Grevillea robusta with crops on farmland andpasture lands. Acacia albida is left in cultivated �eldsmainly due to its nitrogen-�xing characteristics.Some of the bene�ts which farmers get from such
farming systems include domestic fuel supply, live-stock fodder, food production, economic by-products,soil structure and fertility improvement and othergeneral environmentally friendly bene�ts [21]. It isprojected that farms will produce 17.8 million cubicmetres of wood in 2020 (up from 7.4 million cubicmetres in 1995), about 80% of which would be pro-duced in the high- and medium-potential districts [7].
3.2. Biofuel species use patterns
3.2.1. Typical �rewood tree species for householdsThe survey revealed a wide variety of species used
by households for fuel in various parts of the country.Almost all households reported preference of a par-ticular wood species and resort to other species only
E. Kituyi et al. / Biomass and Bioenergy 20 (2001) 71–82 75
Table 2Fuelwood species preference patterns for charcoal production and �rewood use
AEZ Species for �rewood use % HH Species for % Daily Species for �rewood use in % Inst.by rural households reporting charcoal production ordersa institutions reporting
I Eucalyptus spp. 37.8 Eucalyptus spp. 20.4 Eucalyptus spp. 51.2Cupressus spp. 29.5 Olea africana 17.7 Pinus spp. 4.6Pinus patula 13.5 Cupressus spp. 15.0 Cupressus spp. 11.6Acacia mearnsii 5.3 Olea welwitschii 11.5 Jacaranda mimosifolia 2.3Ocotea usambarensis 3.0 Acacia mearnsii 8.8 Acacia mearnsii 9.3Lantana camara 2.0 Psidium guajava 7.1 Olea africana 9.3Strychnos usambarensis 1.7 Strychnos usambarensis 3.5 Co�ea arabica 7.0Psidium guajava 1.5 Ficus spp. 2.7 Celtis africana 4.6Jacaranda mimosifolia 1.0 Mangifera indica 2.7 Others 0.1Co�ea arabica 0.6 Others 10.6Others 4.1
II Eucalyptus spp. 15.4 Eucalyptus spp. 40.2 Eucalyptus spp. 54.5Lantana camara 11.4 Acacia spp. 16.5 Pinus spp. 13.6Cupressus lusitanica 5.0 Mangifera indica 11.0 Cupressus spp. 13.6Acacia mearnsii 3.6 Albizia coriaria 7.1 Jacaranda mimosifolia 9.1other Acacia spp. 3.4 Combretum binderianum 6.3 Acacia spp. 9.1Euphorbia tirucalli 1.7 Cupressus spp. 5.5 Others 0.1Ocotea usambarensis 1.4 Euphorbia turicalli 3.2Psidium guajava 0.6 Ficus spp. 2.4Jacaranda mimosifolia 0.5 Psidium guajava 2.4Ficus spp. 0.5 Jacaranda mimosifolia 2.4Croton megalocarpus 0.2 Others 3.0Albizia coriaria 0.2Others 56.1
III Anacardium occidentalis 21.2 Brachystegia spiciformis 50.0 Azadirachta indica 50.0Azadirachta indica 1.8 Anacardium occidentale 16.7 Brachystegia spiciformis 33.3Mangifera indica 0.7 Others 33.3 Anacardium occidentale 16.7Lantana camara 0.4Other 75.9
IV Acacia elatior 47.6 Acacia spp. 100 Acacia spp. 100other Acacia spp. 25.4Others 27.0
aOnly restaurants with daily orders above 1% are included in the table. Only information from suppliers was used in developing thelist on species preferences. Species reported by less than 1% of institutions and 0.1% of households are covered under “others”.
in the absence of the preferred one. The preferredspecies was used most of the year in most of thesecases. We have therefore reported the species consis-tently used as �rewood by a household for a periodlasting between nine and twelve months. Except forKili� (in AEZ III, where most homes relied on cropresidues throughout the year), between 73 and 99% ofall households in other centres met this criterion. Mostof the reported tree species are tabulated in Table 2in order of preference for �rewood use by house-holds and institutions and for charcoal production bysuppliers.
Various use patterns were observed across the eco-logical zones, and each showed unique combinations.Eucalyptus spp. were the most common in the High-lands (AEZ I) and Savanna (AEZ II), being usedfor �rewood by about 38 and 15% of the respondingfamilies, respectively. Various Eucalyptus spp. weremainly planted within farmlands and settlements,especially those observed in Nakuru and Kakamega.They were preferred for their fast growth, easy-to-cut,quick-drying and good burning characteristics. Ofthe responding households in AEZ I which is rich inexotic tree species, 30 and 14% depended for their
76 E. Kituyi et al. / Biomass and Bioenergy 20 (2001) 71–82
daily needs on cypress and pine, respectively. Thesewere available mainly in the form of o�-cuts from thetimber industry, disposed of at a small fee to localresidents and retail agents for eventual sale in otherareas. AEZ II, on the other hand, rich in indigenousspecies, showed a wider range of species.The cool moist climatic conditions and soil types in
AEZ I seem to favour the existence and productivityof exotic tree plantations for species such as Euca-lyptus spp. (for timber), Cupressus lusitanica, Pinuspatula (both mainly for the pulp industry) and Aca-cia mearnsii (for the tanning industry). Other studies[24] have also reported the wide distribution and useof these exotic species in highlands south of Lake Vic-toria that cover the Kisii region. The wider range ofspecies choices noted among communities in the Sa-vanna zone could be attributed to, inter alia, the pre-vailing modi�ed equatorial climate, the highly varyingtopography and soil types. The reliance by over 11%of the interviewed households in this Savanna zone onLantana camara, an inferior quality fuelwood speciesmainly planted as a hedge, could indicate that otherpreviously preferred species have been denuded. Themajority of these households were located in Bungomadistrict. Many of the households, however, reportedcombining Lantana and other available types through-out the use period. Although 78% of the households inthis zone contended fuelwood su�ciency, they werepessimistic about future supply.In most surveyed sites within AEZs I and II, use
of agroforestry-oriented technologies was exhibitedon land owned by small holder communities. Someof these sites included Meru, Nyeri and Kakamega,where tree plantations were inter-cropped with foodcrops. Apart from fruit trees such as mango, guava and�g, prevalent species found on such farms were theEucalyptus spp., Grevillea robusta, Croton megalo-carpus and Leucaena leucocephala. These species arefast growing and yield good-quality �rewood. Furtherspecies found on such farms are published elsewhere[16–19].The cashew nut tree (Anacardium occidentale)
was the most common species used for cooking atthe coast, where over 21% of households reportedits use. The neem (Azadirachta indica) and mango(Mangifera indica) trees, suited best for the typi-cal climatic conditions in AEZ III, were also verycommon among the rural Kili� households. Acacia
elatior, locally known as Ewoi, was used throughoutthe year by over 48% of responding households in thevast arid and semi-arid lands (ASAL). In this zone,largely an acacia-commiphora ecosystem, over 25%of its households relied upon the other various acaciavarieties. In similar but localised studies carried outin the northern Kenyan ASAL district of Turkana,Ellis et al. [25] found 38% of the respondents relyingon Acacia tortilis, 20% on Acacia re�ciens, while8% depended on Commiphora africana. Jensen [26]established Acacia nubica as the most popular tree(used by 37% of the population most of the year)in the southern part of the ASAL. The same reportfound 19% largely reliant upon Acacia mellifera,12% on Acacia ancistroclada and 8% on Acaciaxanthophloea. Mungala and Openshaw [27] reportedCommiphora spp. and Acacia spp. as the majorspecies types utilised for fuel in the vast Machakosand Makueni districts where savanna and semiaridconditions prevail.The consumption period for wood for cooking in
the domestic sector was in all cases between Januaryand December. However, 26% of the households inNakuru (AEZ I) which otherwise relied mainly oncharcoal and kerosene stoves for cooking (through-out the year) reported consumption of wood only inthe cold season (between March and June) for spaceheating.
3.2.2. Typical �rewood tree species for academicinstitutionsAcademic institutions in AEZs I and II preferred
use of the various eucalyptus tree species, mainlyE. saligna, for their �rewood, that was normally sup-plied during each study term. This preference wasreported by 51 and 54% of responding institutionsin AEZs I and II, respectively. In both zones, pilesof cypress, pine and jacaranda logs (Jacaranda mi-mosifolia) were also commonly seen in storage, beingnormally delivered in 7-ton lorry loads from forestsand saw mills. Schools and colleges in AEZ III pre-ferred the neem tree, and 50% reported unchangingannual trends in its use. Unlike charcoal productionand rural household �rewood usage, which showed awide species range, institutional choices were limitedto mainly a single species per institution in each AEZ(Table 2).
E. Kituyi et al. / Biomass and Bioenergy 20 (2001) 71–82 77
The fuel acquisition system in most communalinstitutions such as schools, hospitals, prisons andcolleges enables the management of such institu-tions to select the preferred species, and hence thelimited choices recorded (Table 2). Supply tenderswere awarded to suppliers who could readily deliverthe required species from existing scattered sourcesin speci�ed sizes and at favourable prices. Thefast-disappearing volumes of popular species such asthe Eucalyptus saligna has led to an increase in thedelivery frequency within each three-month schoolterm, with a resultant upward adjustment of pricesto o�set transport costs expended in search of spe-ci�c fuelwood qualities. Some of the supply agentsbased in AEZ II reportedly make their way to forestsin AEZ I to harvest some of their clients’ needs.Academic institutions consumed wood throughoutthe year except during vacations (April, August andDecember).
3.2.3. Typical tree species for charcoal productionAs in the case of household �rewood types,
Eucalyptus spp. were the most available for char-coal production in AEZs I and II, with 20 and 40%,respectively, of all daily charcoal orders (each ordercomprises a 50 kg gunny sack) being derived fromthese species. Besides, the charcoal from this genus oftrees is of higher quality in that it ignites more easilythan most others and, on production, does not easilycrumble into a �ne, powdery form. Acacia Mearn-sii was also reportedly used for charcoal productionmainly due to its abundance in the production areas.The observed shift from most exotic to indigenoustree species and fruit trees such as Psidium guajavaand Mangifera indica for charcoal production wasmainly due to their availability. Large-sized coalsand long-burning characteristics of charcoal fromBrachystegia speciformis at the Coastal zone largelyaccounted for its preference, despite the abundantsupply of cashew nut and neem trees. Although thesewere preferred for �rewood use, charcoal from them isof poor quality since it crumbles into a near-powderyform.Charcoal in the ASAL is processed from the vari-
ous acacia species and, although some is used locally,the bulk of it is transported to urban areas includingNairobi, for sale. All responding charcoal suppliers
reported using traditional earth kilns, most of whichyield 15–20% charcoal by weight [9,28].Mixing of wood species during charcoal process-
ing within plantation areas was rarely done since eachspecies a�ects the carbonisation process and rate dif-ferently. This was contrary to observations in otherareas where all available species would be carbonisedtogether in a kiln. The urban restaurants in particular,placed their charcoal orders based on speci�c quali-ties of charcoal as determined by the di�erent woodtypes. This was true of the restaurants located in ma-jor towns such as Nakuru, Nairobi, Eldoret, Kisumuand Meru, where some of the tendered suppliers re-ported the high risk of losing their contracts by sup-plying lower quality charcoal from some tree species.During periods when the preferred-species was scarce,many other species were also used, but the impact onoverall quality and pricing was negative.
3.2.4. Common agricultural crops for residueproductionThe questionnaire survey revealed only �ve crops
(maize, coconut, sugarcane, sun ower and rice)whose residues were a substitute for wood. Maizestalks and cobs were the most available agriculturalresidues, with about 22% of the national samplereporting use. Maize cob use was, however, mainlycon�ned to the Highlands and Savanna ecologicalzones, where maize production is highest. The su�-cient fuelwood supplies, especially on the farmlands,did not encourage the use of the otherwise abundantmaize cobs produced in these zones. No householdreported use of maize cobs in the ASAL and Coastalzones, where unfavourable climatic conditions formaize cultivation prevail. At the coast, coconut shellsand husks were the commonly used residues, whilebagasse (sugarcane residue) was used within sugar-cane growing zones. The shells were popular mainlyowing to their higher heat intensity (only a smallquantity gives hot ames for a long period), while thehusks and bagasse were preferred to maize cobs fortheir ability to light and sustain a �re in rural westernKenya sugar-belt of Mumias.Coconut shells and husks, dried palm ribs and dried
sugarcane stalks were reportedly used throughout theyear. Maize residues, by contrast, are only availablefor an average of three months following each of
78 E. Kituyi et al. / Biomass and Bioenergy 20 (2001) 71–82
the two harvesting seasons. This was the case in boththe Highlands and Savanna zones, where most homes(58%) reported use of maize residues between Julyand November, and a few (37%) between Decemberand March. A small section of the central Highlands inNyeri reported use between May and July each year.
3.3. Biofuel consumption levels
3.3.1. Household size and population estimatesThe average national household size was estab-
lished as 5.5, the quotient of the total population ofthe sample divided by the total number of interviewedhouseholds. Given the nature and functioning of lo-cal academic institutions and restaurants, it wouldbe di�cult to de�ne them separately as households.However, for the sake of this report, we introducethe concept of household equivalents (HHEq) to putthese two consumer classes within the perspectiveof normal households whose size has been de�nedas 5.5.Our national annual consumption estimates for
fuelwood in 1997 were obtained by assuming con-stant consumption rates throughout the year by alluser groups. They included households, 2900 board-ing academic institutions, 41 prisons, 82 hospitals(estimated from data in [13]) and about 6970 restau-rants nation-wide (according to data from the TradeO�ce, Ministry of Local Government). Based on apopulation growth rate of 2.9% [12], we estimatedthe 1997 population at 29.1 million (up from the1995 �gure of 27.5 million). The corresponding es-timates for population, population density and landarea for the respective AEZs are presented in Table 3.This overall population of 29.1 million represents anequivalent of 5.3 million households. Of this number,about 430,400 and 190,000 HHEq are representedby institutions and restaurants, respectively, and therest by rural and urban households. The arithmeticmeans for institutional enrollment and daily numberof guests in restaurants were calculated to be 608 and188, respectively. However, owing to the skewed na-ture of the distributions, the medians were consideredfor calculation of the sectoral population estimatesand household equivalents. The median values were816 for boarding institutions and 150 for restaurants,assuming a �gure of 5.5 as the household equivalent.
3.3.2. Overall fuelwood consumptionThe total daily consumption was obtained by sum-
ming up the reported individual household require-ments for charcoal (converted to their round woodequivalents (r.w.e.)) and �rewood, separately, in eachAEZ. The results are reported in Table 4, which alsogives the daily per capita consumption levels for thevarious fuels. The charcoal r.w.e., that is, the fuelwoodused for production of the charcoal consumed, werecomputed assuming kiln e�ciencies of 17% for woodof moisture content about 30%, which corresponds tothe characteristics of wood in most traditional char-coal processing areas in Kenya [28]. Taking one yearto be 365 days for households and restaurants, and270 days for academic institutions (closed for threemonths each year), we established the annual lev-els by weighting the consumption over the individualAEZs. The results obtained are presented in Table 5and imply a national total fuelwood consumption of32.6 million tonnes (17.13 million tonnes of charcoalr.w.e. (w/w) and 15.42 million tonnes �rewood, airdry) in 1997, assuming minimum temporal variationsin consumption. Of this amount, 95% was consumedby households, while 2 and 3% ( a total of 1.4 mil-lion tonnes per annum) were consumed by institutionsand restaurants, respectively. The mean of the ratiosof �rewood consumed to charcoal r.w.e (w=w) con-sumed among households in all AEZs was 0:85 : 1.By comparison, the 1991 total annual fuelwood con-sumption stood at 23.7 million tonnes [29]. The lowernational population in that year (about 22 million) andcorresponding lower urban population (hence lowercharcoal demand), as well as the scope of the surveyamong other factors, could account to a larger extent,for the low consumption level that year.Households in AEZ I consumed the highest quan-
tities, and the consumption decreased from AEZ I toEZ IV. Apart from restaurants in AEZ I andacademic institutions in AEZ II, which registeredrelatively high annual demand, no signi�cant patternswere detected among these two consumer groups.The results also imply that for every 850 kg (air dry)of �rewood consumed, another 1000 kg (wet weight)of wood is converted to charcoal. The higher con-sumption values by households in AEZ I, which is cha-racterised by cooler, humid, high altitude lands(between 1600 and 2600m), could be attributed to theneed for space heating by the large population in the
E. Kituyi et al. / Biomass and Bioenergy 20 (2001) 71–82 79
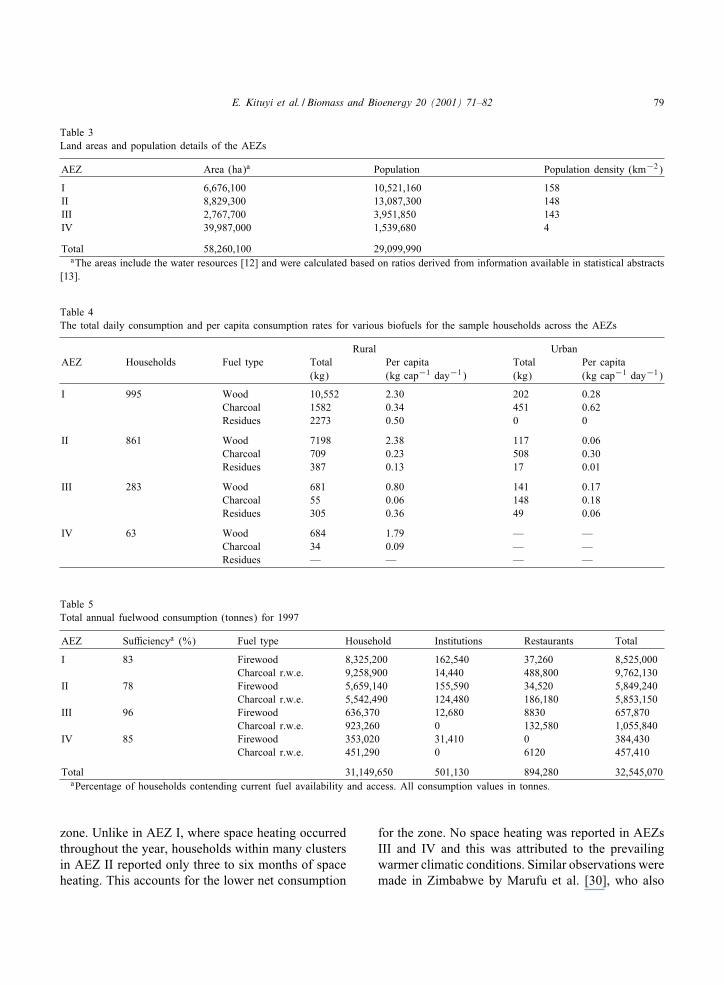
Table 3Land areas and population details of the AEZs
AEZ Area (ha)a Population Population density (km−2)
I 6,676,100 10,521,160 158II 8,829,300 13,087,300 148III 2,767,700 3,951,850 143IV 39,987,000 1,539,680 4
Total 58,260,100 29,099,990aThe areas include the water resources [12] and were calculated based on ratios derived from information available in statistical abstracts
[13].
Table 4The total daily consumption and per capita consumption rates for various biofuels for the sample households across the AEZs
Rural UrbanAEZ Households Fuel type Total Per capita Total Per capita
(kg) (kg cap−1 day−1) (kg) (kg cap−1 day−1)
I 995 Wood 10,552 2.30 202 0.28Charcoal 1582 0.34 451 0.62Residues 2273 0.50 0 0
II 861 Wood 7198 2.38 117 0.06Charcoal 709 0.23 508 0.30Residues 387 0.13 17 0.01
III 283 Wood 681 0.80 141 0.17Charcoal 55 0.06 148 0.18Residues 305 0.36 49 0.06
IV 63 Wood 684 1.79 — —Charcoal 34 0.09 — —Residues — — — —
Table 5Total annual fuelwood consumption (tonnes) for 1997
AEZ Su�ciencya (%) Fuel type Household Institutions Restaurants Total
I 83 Firewood 8,325,200 162,540 37,260 8,525,000Charcoal r.w.e. 9,258,900 14,440 488,800 9,762,130
II 78 Firewood 5,659,140 155,590 34,520 5,849,240Charcoal r.w.e. 5,542,490 124,480 186,180 5,853,150
III 96 Firewood 636,370 12,680 8830 657,870Charcoal r.w.e. 923,260 0 132,580 1,055,840
IV 85 Firewood 353,020 31,410 0 384,430Charcoal r.w.e. 451,290 0 6120 457,410
Total 31,149,650 501,130 894,280 32,545,070aPercentage of households contending current fuel availability and access. All consumption values in tonnes.
zone. Unlike in AEZ I, where space heating occurredthroughout the year, households within many clustersin AEZ II reported only three to six months of spaceheating. This accounts for the lower net consumption
for the zone. No space heating was reported in AEZsIII and IV and this was attributed to the prevailingwarmer climatic conditions. Similar observations weremade in Zimbabwe by Marufu et al. [30], who also
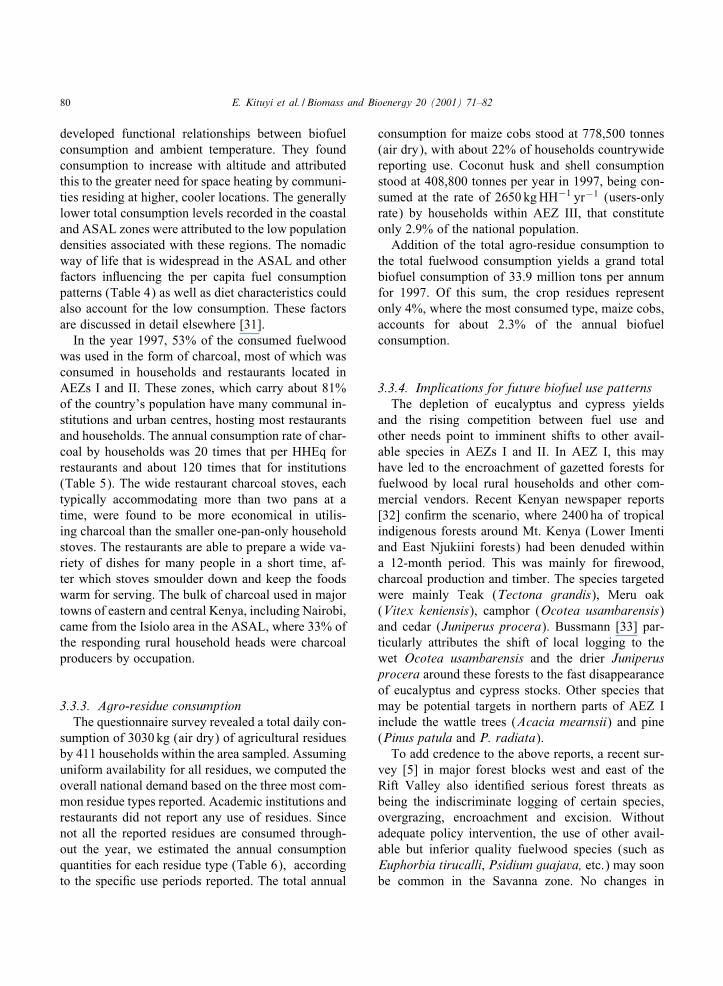
80 E. Kituyi et al. / Biomass and Bioenergy 20 (2001) 71–82
developed functional relationships between biofuelconsumption and ambient temperature. They foundconsumption to increase with altitude and attributedthis to the greater need for space heating by communi-ties residing at higher, cooler locations. The generallylower total consumption levels recorded in the coastaland ASAL zones were attributed to the low populationdensities associated with these regions. The nomadicway of life that is widespread in the ASAL and otherfactors in uencing the per capita fuel consumptionpatterns (Table 4) as well as diet characteristics couldalso account for the low consumption. These factorsare discussed in detail elsewhere [31].In the year 1997, 53% of the consumed fuelwood
was used in the form of charcoal, most of which wasconsumed in households and restaurants located inAEZs I and II. These zones, which carry about 81%of the country’s population have many communal in-stitutions and urban centres, hosting most restaurantsand households. The annual consumption rate of char-coal by households was 20 times that per HHEq forrestaurants and about 120 times that for institutions(Table 5). The wide restaurant charcoal stoves, eachtypically accommodating more than two pans at atime, were found to be more economical in utilis-ing charcoal than the smaller one-pan-only householdstoves. The restaurants are able to prepare a wide va-riety of dishes for many people in a short time, af-ter which stoves smoulder down and keep the foodswarm for serving. The bulk of charcoal used in majortowns of eastern and central Kenya, including Nairobi,came from the Isiolo area in the ASAL, where 33% ofthe responding rural household heads were charcoalproducers by occupation.
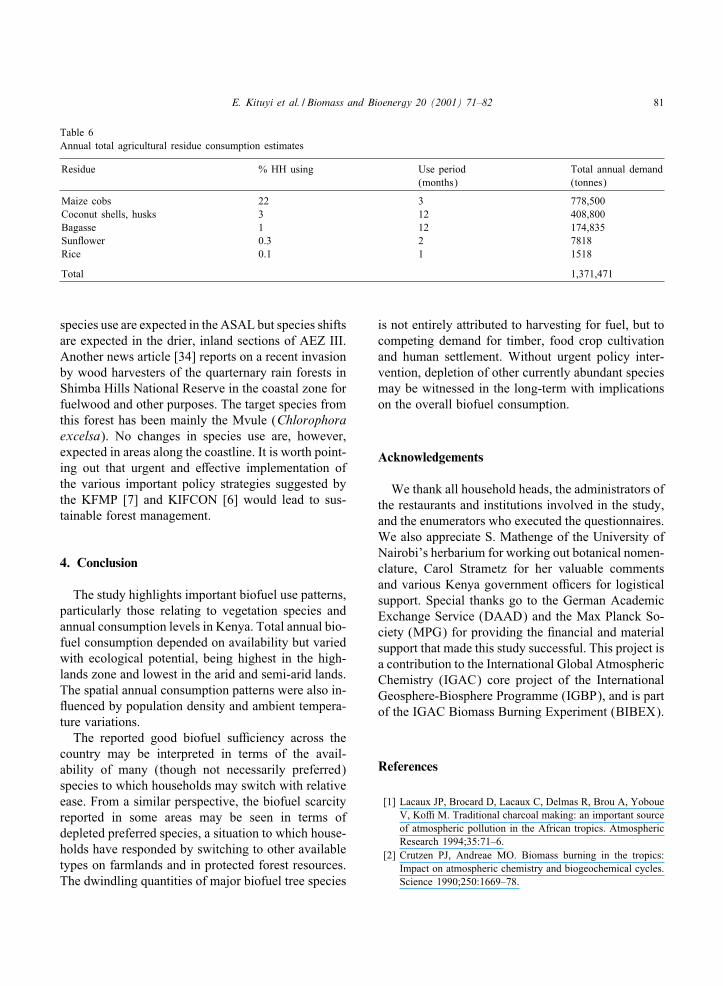
3.3.3. Agro-residue consumptionThe questionnaire survey revealed a total daily con-
sumption of 3030 kg (air dry) of agricultural residuesby 411 households within the area sampled. Assuminguniform availability for all residues, we computed theoverall national demand based on the three most com-mon residue types reported. Academic institutions andrestaurants did not report any use of residues. Sincenot all the reported residues are consumed through-out the year, we estimated the annual consumptionquantities for each residue type (Table 6), accordingto the speci�c use periods reported. The total annual
consumption for maize cobs stood at 778,500 tonnes(air dry), with about 22% of households countrywidereporting use. Coconut husk and shell consumptionstood at 408,800 tonnes per year in 1997, being con-sumed at the rate of 2650 kgHH−1 yr−1 (users-onlyrate) by households within AEZ III, that constituteonly 2.9% of the national population.Addition of the total agro-residue consumption to
the total fuelwood consumption yields a grand totalbiofuel consumption of 33.9 million tons per annumfor 1997. Of this sum, the crop residues representonly 4%, where the most consumed type, maize cobs,accounts for about 2.3% of the annual biofuelconsumption.
3.3.4. Implications for future biofuel use patternsThe depletion of eucalyptus and cypress yields
and the rising competition between fuel use andother needs point to imminent shifts to other avail-able species in AEZs I and II. In AEZ I, this mayhave led to the encroachment of gazetted forests forfuelwood by local rural households and other com-mercial vendors. Recent Kenyan newspaper reports[32] con�rm the scenario, where 2400 ha of tropicalindigenous forests around Mt. Kenya (Lower Imentiand East Njukiini forests) had been denuded withina 12-month period. This was mainly for �rewood,charcoal production and timber. The species targetedwere mainly Teak (Tectona grandis), Meru oak(Vitex keniensis), camphor (Ocotea usambarensis)and cedar (Juniperus procera). Bussmann [33] par-ticularly attributes the shift of local logging to thewet Ocotea usambarensis and the drier Juniperusprocera around these forests to the fast disappearanceof eucalyptus and cypress stocks. Other species thatmay be potential targets in northern parts of AEZ Iinclude the wattle trees (Acacia mearnsii) and pine(Pinus patula and P. radiata).To add credence to the above reports, a recent sur-
vey [5] in major forest blocks west and east of theRift Valley also identi�ed serious forest threats asbeing the indiscriminate logging of certain species,overgrazing, encroachment and excision. Withoutadequate policy intervention, the use of other avail-able but inferior quality fuelwood species (such asEuphorbia tirucalli, Psidium guajava, etc.) may soonbe common in the Savanna zone. No changes in
E. Kituyi et al. / Biomass and Bioenergy 20 (2001) 71–82 81
Table 6Annual total agricultural residue consumption estimates
Residue % HH using Use period Total annual demand(months) (tonnes)
Maize cobs 22 3 778,500Coconut shells, husks 3 12 408,800Bagasse 1 12 174,835Sun ower 0.3 2 7818Rice 0.1 1 1518
Total 1,371,471
species use are expected in the ASAL but species shiftsare expected in the drier, inland sections of AEZ III.Another news article [34] reports on a recent invasionby wood harvesters of the quarternary rain forests inShimba Hills National Reserve in the coastal zone forfuelwood and other purposes. The target species fromthis forest has been mainly the Mvule (Chlorophoraexcelsa). No changes in species use are, however,expected in areas along the coastline. It is worth point-ing out that urgent and e�ective implementation ofthe various important policy strategies suggested bythe KFMP [7] and KIFCON [6] would lead to sus-tainable forest management.
4. Conclusion
The study highlights important biofuel use patterns,particularly those relating to vegetation species andannual consumption levels in Kenya. Total annual bio-fuel consumption depended on availability but variedwith ecological potential, being highest in the high-lands zone and lowest in the arid and semi-arid lands.The spatial annual consumption patterns were also in- uenced by population density and ambient tempera-ture variations.The reported good biofuel su�ciency across the
country may be interpreted in terms of the avail-ability of many (though not necessarily preferred)species to which households may switch with relativeease. From a similar perspective, the biofuel scarcityreported in some areas may be seen in terms ofdepleted preferred species, a situation to which house-holds have responded by switching to other availabletypes on farmlands and in protected forest resources.The dwindling quantities of major biofuel tree species
is not entirely attributed to harvesting for fuel, but tocompeting demand for timber, food crop cultivationand human settlement. Without urgent policy inter-vention, depletion of other currently abundant speciesmay be witnessed in the long-term with implicationson the overall biofuel consumption.
Acknowledgements
We thank all household heads, the administrators ofthe restaurants and institutions involved in the study,and the enumerators who executed the questionnaires.We also appreciate S. Mathenge of the University ofNairobi’s herbarium for working out botanical nomen-clature, Carol Strametz for her valuable commentsand various Kenya government o�cers for logisticalsupport. Special thanks go to the German AcademicExchange Service (DAAD) and the Max Planck So-ciety (MPG) for providing the �nancial and materialsupport that made this study successful. This project isa contribution to the International Global AtmosphericChemistry (IGAC) core project of the InternationalGeosphere-Biosphere Programme (IGBP), and is partof the IGAC Biomass Burning Experiment (BIBEX).
References
[1] Lacaux JP, Brocard D, Lacaux C, Delmas R, Brou A, YoboueV, Ko� M. Traditional charcoal making: an important sourceof atmospheric pollution in the African tropics. AtmosphericResearch 1994;35:71–6.
[2] Crutzen PJ, Andreae MO. Biomass burning in the tropics:Impact on atmospheric chemistry and biogeochemical cycles.Science 1990;250:1669–78.
82 E. Kituyi et al. / Biomass and Bioenergy 20 (2001) 71–82
[3] Goldammer JG, Crutzen PJ. Fire in the environment:scienti�c rationale and summary of results of the Dahlemworkshop. In: Goldammer JG, Crutzen PJ. editors. Fire inthe environment: the ecological, atmospheric and climaticimportance of vegetation �res. New York: Wiley, 1993.p. 1–14.
[4] Scurlock JMO, Hall DO. The contribution of biomass toglobal energy use. Biomass 1990;21:75–81.
[5] Njuguna P, Mbegera M, Mbithi D. Reconnaissance surveyof forest blocks in the west and east of the Rift Valley.Permanent Presidential Commission on Soil Conservation andA�orestation (PPCSCA), Nairobi, 1999. 43pp.
[6] KIFCON. In: Wass P, editor. Kenya’s indigenousforests: status, management and conservation. IUCN ForestConservation Programme, IUCN, Gland, Switzerland andCambridge, UK, 1995. xii+205pp.
[7] KFMP. Kenya Forestry Master Plan. Ministry of Environmentand Natural Resources, Nairobi, 1994. xvi+421pp.
[8] NEAP. The Kenya National Environment Action Plan.Ministry of Environment and Natural Resources, Nairobi,1994. 203pp.
[9] Senelwa KA, Hall DO. A biomass energy ow chart forKenya. Biomass and Bioenergy 1993;4:35–48.
[10] Hemstock SL, Hall DO. Biomass energy ows in Zimbabwe.Biomass and Bioenergy 1995;8:151–73.
[11] Aron J, Eherhard AA, Gandar MV. Fuelwood de�cits in ruralSouth Africa. Biomass and Bioenergy 1991;8:89–98.
[12] NDP. National Development Plan 1997–2002. Ministry ofPlanning and National Development, Republic of Kenya,Nairobi, 1997. 254pp.
[13] CBS, Statistical Abstracts. Central Bureau of Statistics, O�ceof the Vice President and Ministry of Planning and NationalDevelopment, Republic of Kenya, Nairobi, 1995. 340pp.
[14] CBS, Economic Survey. Central Bureau of Statistics, O�ceof the Vice President and Ministry of Planning and NationalDevelopment, Nairobi, 1997. 209pp.
[15] Openshaw K. Costs and bene�ts of proposed tree plantingprogramme for satisfying Kenya’s wood energy requirements.Kenya Woodfuel Development Programme, Nairobi, 1982.
[16] KEAP. Energy and the environment: an introduction toenvironmental assessment procedures. Kenya=Canada EnergyAdvisory Project, Nairobi, 1991. 346pp.
[17] KREDP. Information pamphlet on the Kenya RenewableEnergy Development Project. Ministry of Energy andRegional Development, Republic of Kenya, Nairobi, 1995.12pp.
[18] Getahun A, Reshid K. Agroforestry in Kenya: a �eld guide.Nairobi: ICRAF, 1988. 59pp.
[19] ICRAF=BAT, Agroforestry systems for small-scale farmers.In: Hoekstra DA, Kuguru FM, editors. ICRAF=BATWorkshop. ICRAF=BAT, Nairobi, 1982. 283pp.
[20] Teel W. A pocket dictionary of trees and seeds in Kenya.KENGO, Nairobi, 1984. 150pp.
[21] Karinge P. An introduction to Agroforestry. TechnicalAssistance Programme. KENGO, Nairobi, 1996. 12pp.
[22] Marufu L, Ludwig J, Andreae MO, Meixner FX, Helas G.Domestic biomass burning in rural and urban Zimbabwe-PartA. Biomass and Bioenergy 1997;12:53–68.
[23] Hosier R. Domestic energy consumption in rural Kenya:results of a nationwide survey. In: Barnes C, EnsmingerJ, O’Keefe P, editors. Wood, energy and household:perspectives on rural Kenya. Stockholm, The Beijer Institute,1984, p. 14–59.
[24] Barnes C. The historical context of the fuelwood situation inKisii District. In: Barnes C, Ensminger J, O’Keefe P, editors.Wood, energy and household: perspectives on rural Kenya.Stockholm: The Beijer Institute, 1984.
[25] Ellis EJ, Coppock DL, McCabe JT, Galvin K, Wienpahl J.Aspects of energy consumption in a pastoral ecosystem: wooduse by the South Turkana. In: Barnes C, Ensminger J, O’KeefeP, editors. Wood, energy and household: perspectiveson rural Kenya. Stockholm: The Beijer Institute, 1984.p. 164–187.
[26] Jensen CL. Wood use by the Amboseli Maasai. In: BarnesC, Ensminger J, O’Keefe P, editors. Wood, energy andhousehold: perspectives on rural Kenya. Stockholm: TheBeijer Institute, 1984.
[27] Mungala PM. Openshaw K. Estimation of present and futuredemand for woodfuel in the Machakos District. In: BarnesC, Ensminger J, O’Keefe P, editors. Wood, energy andhousehold: perspectives on rural Kenya. Stockholm, TheBeijer Institute, 1984. p. 102–123.
[28] Wamukonya L. Energy consumption in three rural Kenyanhouseholds: a survey. Biomass and Bioenergy 1995;8:445–51.
[29] Baraka M. Ethanol as supplementary fuel for transport.Resources: Journal for sustainable development in Africa1991;2:23–6.
[30] Marufu L, Ludwig J, Andreae MO, Lelieveld J, HelasG. Spatial and temporal variation in domestic biofuelconsumption rates and patterns in Zimbabwe: implicationsfor atmospheric trace gas emission. Biomass and Bioenergy1999;16:311–32.
[31] Kituyi E, Marufu L, Huber B, Wandiga SO, Jumba IO,Andreae MO, Helas G, Biofuel consumption rates andpatterns in Kenya. Biomass and Bioenergy 2001;20:83–99.
[32] Mwai M. Destruction that has the experts worried. DailyNation, October 5, Nairobi, 1997.
[33] Bussmann RW. Destruction and management of MountKenya’s forests. Ambio 1996;5:314–7.
[34] Conservationist. Curb timber poaching in park. Daily Nation,October 20, Nairobi, 1997.


