Embed Size (px)
Citation preview
Biogeochemical processes and trace element
mobility in alkaline waste affected soils
Cindy Louise Lockwood
Submitted in accordance with the requirements for the degree of
Doctor of Philosophy
The University of Leeds
School of Earth and Environment
May 2014
The candidate confirms that the work submitted is her own, except where work which
has formed part of jointly authored publications has been included. The contribution of
the candidate and the other authors to the work has been explicitly indicated below. The
candidate confirms that appropriate credit has been given within the thesis where
reference has been made to the work of others.
The work in Chapter 5 of the thesis has appeared in publication as follows:
Lehoux A. P., Lockwood C. L., Mayes W. M., Stewart D. I., Mortimer R. J. G., Gruiz
K., and Burke I. T. (2013) Gypsum addition to soils contaminated by red mud:
Implications for aluminium, arsenic, molybdenum and vanadium solubility.
Environmental Geochemistry and Health, 35(5), 643-656.
I was responsible for the sampling of the soil and red mud at Ajka, the
interpretation of the soil characterisation of the soil and red mud sampled above,
arranging for analysis and preparing samples for XRD, XRF and TOC analysis,
carrying out the experimental work (Soil pH, BET), providing laboratory assistance to
the main author and assistance with the collection of data especially with regards to
ICP-MS and writing of the manuscript with regards to the soil characterisation. Alizée
Lehoux carried out the majority of laboratory work (except for soil characterisation, see
above) and contributed to the interpretation of the data and writing of the manuscript.
William Mayes acted as fieldwork support and carried out extensive manuscript review,
together with the contribution of Principle Component Analysis. Douglas Stewart and
Robert Mortimer acted as field work support and carried out manuscript review. Katalin
Gruiz granted site access and offered advice and comments on the manuscript. Ian
Burke acted as fieldwork support, MSc supervisor to Miss Lehoux and contributed
considerably to the interpretation of the results together with writing the majority of the
manuscript.
The work in Chapter 6 of the thesis has been prepared for publication for submission as
follows:
Lockwood C. L., Mortimer R. J. G., Stewart D. I., Mayes, W. M., Peacock C. L., Polya
D. A., Lythgoe P. R., Lehoux A. P., Gruiz K., Burke I. T. (Submitted to Applied
Geochemistry, June 2014)
I was responsible for the sampling the soil and red mud at Ajka, arranging for
analysis and preparing samples for XRD, XRF and TOC analysis, sampling,
experimental design, processing and analysis of all microcosms, data collection,
interpretation of data and statistical analysis, writing the paper and preparation of all
tables and figures, except where listed below. Robert Mortimer acted as field work
support and manuscript review. Douglas Stewart acted as fieldwork support, carried out
manuscript review and assisted with the collection of XAS data. William Mayes acted
as fieldwork support, carried out manuscript review, together with the contribution of
Principle Component Analysis. Caroline Peacock assisted with the collection of XAS
data and offered advice and comments on the manuscript. David Polya was responsible
for organising the HPLC-ICP-MS analysis and offered advice and comments on the
manuscript. Paul Lythgoe carried out HPLC-ICP-MS analysis for As speciation. Alizée
Lehoux provided the data for the red mud leaching batch tests. Katalin Gruiz granted
site access and assisted with site orientation. Ian Burke acted as fieldwork support,
assisted with collection of XAS data and interpretation of As EXAFS data and provided
extensive manuscript review.
The work in Chapter 7 of the thesis has been prepared for publication for submission as
follows:
Lockwood C. L., Stewart D. I., Mortimer R. J. G., Mayes, W. M., Gruiz K., Burke I. T.,
Leaching of copper and nickel in soil-water systems contaminated by red mud from
Ajka, Hungary: The importance of soil organic matter. (in preparation for The Journal
of Hazardous Materials, 2014)
I was responsible for the sampling the soil and red mud at Ajka, arranging for
analysis and preparing samples for XRD, XRF and TOC analysis, sampling,
experimental design, processing and analysis of anaerobic and aerobic microcosms, data
collection, interpretation and statistical analysis, writing the paper and preparation of
tables and figures. Douglas Stewart acted as fieldwork support, carried out extensive
manuscript review. Robert Mortimer acted as field work support and manuscript review.
William Mayes acted as fieldwork support together with the contribution of Principle
Component Analysis. Katalin Gruiz granted site access and assisted with site orientation.
Ian Burke acted as fieldwork support and provided manuscript review.
This copy has been supplied on the understanding that it is copyrighted material and
that no quotation from the thesis may be published without proper acknowledgement
©2014 The University of Leeds and Cindy Louise Lockwood
The right of Cindy Louise Lockwood to be identified as the author of this work has
been asserted by her in accordance with the Copyright, Designs and Patents Act 1988.
Acknowledgements
I would like to express my sincere thanks to Doug Stewart, Will Mayes, Rob Mortimer
and Ian Burke and for their invaluable help, support and enthusiasm throughout my
PhD. I would also like to thank them for all their personal advice, encouragement and
for putting up with my excessive bouts of worrying. Field trips were always a great
source of amusement; I’m sure that there is a joke that starts “There were four
academics and a PhD student in car travelling to Budapest”. I would to thank Katalin
Gruiz and her team at BME in Budapest for field support and site orientation in
Hungary. I would also like to thank others who have helped me out with technical
guidance and data collection including but not limited to; David Ashley, Rachel Gasior,
Lesley Neve, Clare Gordon, David Elliot, Sheena Bennett, Ann Mennim, Nick Marsh,
Fred Mosselmans, Tina Geraki, Alizée Lehoux and Stephen Reid. A massive massive
‘thank you’ goes to Bob Knight and Sam Allshorn, my all time PhD heros. A big
thanks to members past and present of Cohen Geochemistry a.k.a. ‘Cohenites’
especially; Liane Benning, for always being interested and giving out good advice,
Caroline Peacock, for beamtime help and advice, Rob Whittleston and Sarah Wallace
for having done it all before me and sharing their experiences, Romain Guilbaud for
helping me with a very important presentation and Jörgen Rosenqvist, my PhD
therapist. Thank you to all the occupants of office 8.154 over the past 3 1/2 years
especially Andy Bray, Steffi Lutz, Pieter Bots, Santiago Clerici and Daniela Meier for
their willingness to help and, listen to me whinge but mainly for their tolerance of my
grumpiness. A special thank you to Lizzy Moyce, Janice Littlewood and Amy Atkins –
it has been an absolute pleasure, I really don’t think I could have come this far without
your friendship.
Outside of University Life, to my friends; Jax Spud, LB, Rads, Heather, Andy W, Guy
‘Oatcake’ Hassall, Mr. Wasif, Peaches, Tori and even Mr. Strange; my fellow Captains
of the Ruptured Core Confederation, Timothy Taylor for his Championship Beers, Mr.
Scratchings for his tasty pork rinds and all the whippets and rabbits on the internet -
thank you all, for keeping me sane.
A huge thank you to my family and extended family of Jones’, Phil, Kath and Tobes,
my sister Sally, my beautiful niece Jess, my epic nephew Lucas and most of all my
Mum and Dad, you have all been so supportive and I am eternally grateful. Finally, lots
of love and thanks to Andy ‘The Jones’ Jones for putting up with and helping me get
through this with my sense of humour intact, ‘Loving you is easy cos you make good
food’. Now let’s go for a pint.
This project has been funded by the UK Engineering and Physical Science Research
Council (Doctoral training award EP/P505593/1) and I thank Diamond Light Source for
access to beamline I18 (Grant SP7525) that contributed to the results presented in this
thesis.
Abstract
High pH leachates can mobilise oxyanion forming elements from alkaline waste, such
as iron and steel slags and bauxite ore processing residue, into the wider environment.
Red mud is a highly alkaline waste product from bauxite ore processing. It contains
elevated concentrations of oxyanion forming elements such as Al, As, V and Mo that
are mobilised at high pH together with other trace metals including Cu and Ni. The red
mud spill at Ajka, Hungary released 1 million m3 of caustic red mud into the
surrounding area. As part of the initial clean-up, some thinner red mud deposits (< 5
cm) were ploughed into fields to prevent dust formation whereas wetland areas were left
untreated. This study used aerobic and anaerobic batch microcosms together with XAS
spectroscopy, (HPLC)-ICP-MS and solid phase extraction techniques to investigate the
effects of red mud addition to unaffected soils with respect to biogeochemical processes
and trace element release. Experiments were designed to be analogous to soil conditions
following the remediation efforts. The results showed that the effect of red mud addition
to soils was highly dependent upon soil properties, experimental pH, and total organic
carbon (TOC) content. As and V were found to be persistently mobile under both
aerobic and anaerobic conditions. Red mud addition to soils with a high TOC content
mobilised high aqueous concentrations of organic matter complexing metals such as Cu,
Ni and V under anaerobic conditions. Gypsum addition to red mud affected soils
showed a reduction in aqueous oxyanion concentrations compared to soils with red mud
addition alone indicating that it is potential ameliorant for red mud contaminated soils.
The results showed that the extensive remediation efforts by the Hungarian authorities
were justified but that red mud should be used with caution as a soil amendment.
Table of Contents
ABBREVIATIONS .................................................................................................................................... 1
CHAPTER 1 INTRODUCTION ........................................................................................................... 2
1.1 PROJECT BACKGROUND AND SIGNIFICANCE ............................................................................................2
1.2 RESEARCH OBJECTIVES .......................................................................................................................4
1.2.1 Hownsgill Valley, nr Consett, U.K. ...........................................................................................4
1.2.2 Ajka, western Hungary ............................................................................................................4
1.3 EXPERIMENTAL APPROACHES ..............................................................................................................6
1.4 THESIS STRUCTURE ...........................................................................................................................8
1.5 REFERENCES ....................................................................................................................................9
CHAPTER 2 BACKGROUND INFORMATION AND SITE PROCESSES ................................................. 11
2.1 ALKALINE ENVIRONMENTS ...............................................................................................................11
2.2 ALKALINE INDUSTRIAL WASTES ..........................................................................................................12
2.2.1 Problems associated with high alkaline industrial wastes ....................................................12
2.2.2 Iron and steel slags ...............................................................................................................14
2.2.3 Bauxite ore processing waste (red mud) ...............................................................................16
2.3 FATE AND TRANSPORT OF METAL/LOIDS IN THE ENVIRONMENT ................................................................19
2.3.1 Brief introduction to the contaminants of interest ...............................................................20
2.3.2 Sorption .................................................................................................................................22
2.3.3 Complexation with natural organic matter (NOM) ...............................................................25
2.3.4 Biogeochemical Redox processes ..........................................................................................26
2.4 SOIL MICROORGANISMS ...................................................................................................................30
2.4.1 Alkaliphiles ............................................................................................................................30
2.4.2 Microbial metal/loid reduction .............................................................................................31
2.5 STUDY SITES ..................................................................................................................................33
2.5.1 Hownsgill Valley, near Consett .............................................................................................33
2.7.2 Ajka, Vesprém County, western Hungary .............................................................................39
2.8 REFERENCES ..................................................................................................................................44
CHAPTER 3 MATERIALS AND METHODS ....................................................................................... 55
3.1 SAMPLE COLLECTION ......................................................................................................................55
3.1.1 Hownsgill Valley Site .............................................................................................................55
3.1.2 Veszprém County, western Hungary .....................................................................................56 3.1.2.1 Sandy Soil (SS) .................................................................................................................................... 56 3.1.2.2 Organic-rich Soil (OR) ......................................................................................................................... 57 3.1.2.3 Wetland Soil (WL) ............................................................................................................................... 57 3.1.2.4 Tailings Pond (X), MAL Zrt .................................................................................................................. 58
3.1.3 Principle Component Analysis ...............................................................................................59
3.2 SAMPLE CHARACTERISATION ............................................................................................................59
3.2.1 Sample pH .............................................................................................................................59
3.2.2 % 0.5 M Acid extractable Iron as Fe(II) .................................................................................60
3.2.3 X-ray powder diffraction (XRD) .............................................................................................62
3.2.4 X-ray fluorescence .................................................................................................................63
3.2.5 BET specific surface area .......................................................................................................63
3.2.6 Total carbon, organic and inorganic carbon .........................................................................64
3.2.7 Inorganic phosphate in samples ...........................................................................................64
3.3 BATCH MICROCOSM EXPERIMENTS .....................................................................................................65
3.3.1 Microcosm Sterilisation ........................................................................................................ 65 3.3.1.1 Gamma (γ-) irradition .................................................................................................................66 3.3.1.2 Chemical Sterilisation .................................................................................................................66 3.3.1.3 Heat Sterilisation ........................................................................................................................67
3.3.2 Microcosm sampling technique ............................................................................................ 68
3.4 GEOCHEMICAL ANALYSIS ................................................................................................................. 69
3.4.1 Determination of Vanadium (V) ........................................................................................... 69
3.4.2 Anion analysis by Ion Chromatography ................................................................................ 69
3.4.3 Aqueous trace metal/loid analysis by Inductively Coupled Plasma Mass Spectrometry (ICP-
MS) .............................................................................................................................................. 70
3.4.4 Aqueous trace metal/loid analysis by Inductively Coupled Plasma Optical Emission
Spectroscopy ...................................................................................................................................... 72
3.4.5 Aqueous arsenic speciation analysis by High Performance Liquid Chromatography,
Inductively Coupled Plasma Mass Spectrometry ............................................................................... 73
3.5 ORGANIC GEOCHEMISTRY ............................................................................................................... 74
3.5.1 Dissolved Organic Carbon Analysis ....................................................................................... 74
3.5.2 Solid Phase Extraction by C18 Resin Filters .......................................................................... 75
3.6 X-RAY ABSORPTION SPECTROSCOPY .................................................................................................. 76
3.6.1 EXAFS modelling ................................................................................................................... 79
3.7 MICROBIAL COMMUNITY ANALYSIS ................................................................................................... 80
3.7.1 DNA Extraction, Sequencing and Analysis ........................................................................... 80
3.7.2 16S rRNA gene sequencing .................................................................................................. 80
3.7.3 Phylogenetic assignment ...................................................................................................... 81
3.7.4 Phylogenetic tree building .................................................................................................... 82
3.8 STATISTICAL ANALYSIS .................................................................................................................... 82
3.8.1 Standard deviation, relative standard deviation and relative error. .................................... 82
3.8.2 Pearson’s correlation measures (r and p-values) ................................................................. 83
3.9 REFERENCES ................................................................................................................................. 84
CHAPTER 4 BIOGEOCHEMICAL PROCESSES CONTROLLING THE FATE OF VANADIUM AT A LEGACY
STEEL SLAG DISPOSAL SITE. ..................................................................................................................88
ABSTRACT ................................................................................................................................................. 88
4.1 INTRODUCTION ............................................................................................................................. 89
4.2 MATERIAL AND METHODS ............................................................................................................... 93
4.2.1 Site Description ..................................................................................................................... 93
4.2.2 Site Sampling ........................................................................................................................ 94
4.2.3 Sample Characterisation ...................................................................................................... 95
4.2.4 Reduction Microcosm Experiments ...................................................................................... 96
4.2.5 Geochemical Analysis .......................................................................................................... 97
4.2.6 X-ray Absorption Near Edge Structure Spectroscopy (XANES) ............................................. 98
4.2.7 DNA Extraction, Sequencing and Analysis ............................................................................ 98
4.2.8 16S rRNA gene sequencing ................................................................................................... 99
4.2.9 Phylogenetic tree building .................................................................................................. 100
4.3 RESULTS..................................................................................................................................... 101
4.3.1 Soil Characterisation and Groundwater Analysis ............................................................... 101
4.3.2 Reduction microcosm experiments ..................................................................................... 104
4.3.3 XANES spectroscopy ........................................................................................................... 107
4.3.4 DNA extraction, amplification and sequencing .................................................................. 109
4.4 DISCUSSION ................................................................................................................................ 112
4.4.1 Extent of Soil Alteration by highly alkaline steel slag leachates ......................................... 112
4.4.2 Microcosm experiments ..................................................................................................... 112
4.4.3 Microbial Community Analysis ........................................................................................... 116
4.5 CONCLUSIONS ............................................................................................................................ 117
4.6 REFERENCES ............................................................................................................................... 119
CHAPTER 5 GYPSUM ADDITION TO SOILS CONTAMINATED BY RED MUD: IMPLICATIONS FOR
ALUMINIUM, ARSENIC, MOLYBDENUM AND VANADIUM SOLUBILITY. ............................................. 125
ABSTRACT ............................................................................................................................................... 125
5.1 INTRODUCTION ........................................................................................................................... 127
5.2 MATERIALS AND METHODS .......................................................................................................... 130
5.2.1 Sample Collection ............................................................................................................... 130
5.2.2 Sample Characterisation .................................................................................................... 130
5.2.3 Batch Experiments ............................................................................................................. 131
5.2.4 Column Experiments .......................................................................................................... 132
5.2.5 Geochemical Analysis ......................................................................................................... 133
5.3 RESULTS .................................................................................................................................... 133
5.3.1 Sample Characterization .................................................................................................... 133
5.3.2 Red Mud Addition to Soils .................................................................................................. 137
5.3.3 Gypsum Addition to Red Mud / Soil Mixtures .................................................................... 139
5.3.4 Column Experiments .......................................................................................................... 140
5.4 DISCUSSION ............................................................................................................................... 141
5.4.1 Effect of red mud contamination on Hungarian soils ........................................................ 141
5.4.2 Effectiveness of Gypsum for the Treatment of Red Mud contaminated soils .................... 143
5.5 CONCLUSIONS AND IMPLICATIONS FOR REMEDIATION ......................................................................... 146
5.6 REFERENCES ............................................................................................................................... 149
CHAPTER 6 MOBILISATION OF ARSENIC FROM BAUXITE RESIDUE (RED MUD) AFFECTED SOILS:
EFFECT OF PH AND REDOX CONDITIONS. ........................................................................................... 153
ABSTRACT ............................................................................................................................................... 153
6.1 INTRODUCTION .......................................................................................................................... 155
6.2 MATERIALS AND METHODS ........................................................................................................... 158
6.2.1 Field Sampling and Sample Handling ................................................................................. 158
6.2.2 Sample Characterization .................................................................................................... 158
6.2.3 Red mud batch leaching tests ............................................................................................ 159
6.2.4 Aerobic batch experiments ................................................................................................ 159
6.2.5 Anaerobic batch experiments ............................................................................................ 160
6.2.6 Geochemical Methods ....................................................................................................... 161
6.2.7 X-ray Absorption Spectroscopy (XAS) ................................................................................. 161
6.3 RESULTS .................................................................................................................................... 162
6.3.1 Sample Characterization .................................................................................................... 162
6.3.2 Arsenic in red mud ............................................................................................................. 162
6.3.3 Effect of red mud addition on experimental pH and ORP ................................................. 166
6.3.4 Biogeochemical Redox Indicators ...................................................................................... 170
6.3.5 Arsenic in microcosm experiments ..................................................................................... 176
6.4 DISCUSSION ............................................................................................................................... 180
6.4.1 The occurrence of As in red mud and the effect of pH / completing ions on As solubility . 180
6.4.2 Controls on As release during aerobic incubation .............................................................. 180
6.4.3 Effects of red mud addition on biogeochemical redox processes ...................................... 181
6.4.4 As release in anaerobic experiments with no red mud addition ........................................ 184
6.4.5 As release in anaerobic experiments with red mud addition ............................................. 185
6.5 CONCLUSIONS ............................................................................................................................. 186
6.6 REFERENCES ............................................................................................................................... 189
CHAPTER 7 LEACHING OF COPPER AND NICKEL IN SOIL-WATER SYSTEMS CONTAMINATED BY RED
MUD FROM AJKA, HUNGARY: THE IMPORTANCE OF SOIL ORGANIC MATTER. ................................... 194
ABSTRACT ............................................................................................................................................... 194
7.1 INTRODUCTION ........................................................................................................................... 195
7.2 MATERIALS AND METHODS ........................................................................................................... 199
7.2.1 Field Sampling and Sample Handling ................................................................................. 199
7.2.2 Long-Term Batch Experiments ............................................................................................ 199
7.2.3 Geochemical Methods. ....................................................................................................... 200
7.2.4 Solid Phase Extraction (SPE) .............................................................................................. 201
7.3 RESULTS..................................................................................................................................... 201
7.3.1 Sample Characterization ................................................................................................... 201
7.3.2 Effect of RM addition on microcosm pH and DOC .............................................................. 202
7.3.3 Mobilisation of Cu and Ni from RM affected soil-water systems ...................................... 204
7.3.5 Organically bound metals ................................................................................................... 209
7.4 DISCUSSION ................................................................................................................................ 210
7.4.1 Effect of red mud addition on soil pH and DOC .................................................................. 210
7.4.2 Controls on Cu release ........................................................................................................ 212
7.4.3 Controls on Ni release ......................................................................................................... 214
7.5 CONCLUSIONS ............................................................................................................................. 218
7.6 REFERENCES ............................................................................................................................... 220
CHAPTER 8 LEACHING OF VANADIUM IN SOIL-WATER SYSTEMS CONTAMINATED BY RED MUD
FROM AJKA, HUNGARY ...................................................................................................................... 224
ABSTRACT ............................................................................................................................................... 224
8.1 INTRODUCTION ........................................................................................................................... 225
8.2 MATERIALS AND METHODS ........................................................................................................... 227
8.2.1 Field Sampling and Sample Handling. ................................................................................ 227
8.2.2 Reduction Microcosm Experiments .................................................................................... 228
8.2.3 Geochemical Methods. ....................................................................................................... 228
8.2.4 Solid Phase Extraction (SPE) ............................................................................................... 229
8.2.5 X-ray Absorption Near Edge Structure Spectroscopy (XANES) ........................................... 229
8.3 RESULTS..................................................................................................................................... 231
8.3.1 Sample Characterization .................................................................................................... 231
8.3.2 Evolution of V from red mud affected soil-waters systems ................................................ 231
8.3.5 % Organically bound vanadium .......................................................................................... 234
8.3.6 XAS Spectroscopy................................................................................................................ 235
............................................................................................................................................................. 236
8.4 DISCUSSION ................................................................................................................................ 237
8.5 CONCLUSIONS ............................................................................................................................. 242
8.6 REFERENCES ............................................................................................................................... 243
CHAPTER 9 SUMMARY AND FUTURE CONSIDERATIONS ............................................................. 246
9.1 SUMMARY .................................................................................................................................. 246
9.2 PRELIMINARY HYPOTHESES REVISITED AND MAJOR FINDINGS................................................................. 246
9.2.1 V from iron and steel slag - Hownsgill Valley, nr Consett, U. K .......................................... 246
9.2.2 Addition of red mud to soils (Chapters 5 -8) ....................................................................... 247
9.2.3 Red mud addition to aerobic soil-water systems (Chapters 6 -8) ....................................... 250

9.2.4 Red mud addition to anaerobic soil-water systems (Chapters 6 - 8) ................................. 250
9.3 IMPLICATIONS ............................................................................................................................. 252
9.4 FUTURE CONSIDERATIONS ............................................................................................................. 254
9.6 REFERENCES ............................................................................................................................... 256
APPENDIX A ADDITIONAL RESULTS ............................................................................................... 258
A1 Clone Library .............................................................................................................................. 258
A2 XRD Patterns .............................................................................................................................. 259
APPENDIX B ASSOCIATED PUBLICATIONS ..................................................................................... 263
B1 RELEVANT PUBLICATIONS .................................................................................................................. 263
B2 OTHER PUBLICATIONS ...................................................................................................................... 263
B3 CONFERENCE PROCEEDINGS ............................................................................................................... 263
List of Figures
Figure 2.1 Molecular Environmental Processes affecting contaminants 19
Figure 2.2 Adsorption of metals cations on ferrihydrite 24
Figure 2.3 Adsorption of metal/loid oxyanions on ferrihydrite 24
Figure 2.4 Historic map of The Grove Heaps, nr Consett 35
Figure 2.5 Satellite image of Hownsgill Valley, nr Consett 36
Figure 2.6 Digital photograph of alkaline leachate pond 37
Figure 2.7 Digital photograph of calcite precipitates around leachate pond 37
Figure 2.8 Satellite image showing extent of red mud release 41
Figure 2.9 Digital photograph of red mud house, awaiting destruction 41
Figure 3.1 Digital photograph of Consett Soil 56
Figure 3.2 Map of affected area at Ajka, with sampling locations 57
Figure 4.1 Schematic diagram of Hownsgill Valley site, nr Consett 95
Figure 4.2 Geochemical responses for Consett batch experiments 106
Figure 4.3 V K-Edge XANES spectra for Consett samples 108
Figure 4.4 V K-Edge XANES plot 109
Figure 4.5 Rarefaction curve for Consett soil sample 110
Figure 4.6 Pie chart showing microbial community of Consett soil sample 110
Figure 4.7 Phylogenetic tree – sequence CL-R0-38 111
Figure 4.8 Eh/pH diagram of V species for Consett experiments 115
Figure 5.1 PCA analysis of Ajka red mud and soils 134
Figure 5.2 Red mud additions to Hungarian soils, pH, TDS and DOC 138
Figure 5.3 Red mud additions to Hungarian soils, oxyanions (no gypsum) 138
Figure 5.4 Red mud additions to Hungarian soils, oxyanions (with gypsum) 140
Figure 5.5 Column experiments, evolution of pH, TDS and DOC 141
Figure 5.6 Oxyanion concentration vs pH (with and without gypsum) 145
Figure 6.1 As K-Edge XANES for red mud sample 164
Figure 6.2 As EXAFS for red mud sample 165
Figure 6.3 Red mud batch leaching tests 166
Figure 6.4 Geochemical time series; pH and ORP (aerobic) 168
Figure 6.5 Geochemical time series; pH and ORP (anaerobic) 169
Figure 6.6 Geochemical time series; nitrate and nitrite (anaerobic) 172
Figure 6.7 Geochemical time series; Fe(II), As (aerobic) 173
Figure 6.8 Geochemical time series; Fe(II), SO42-, As (anaerobic) 174
Figure 6.9 Geochemical time series; pH, Fe(II), SO42- (heat treated controls) 175
Figure 6.10 As K-Edge XANES for anaerobic experiments 179
Figure 6.11 [As] vs pH for aerobic and anaerobic experiments 188
Figure 7.1 Geochemical time series; Cu and Ni (unamended controls) 206
Figure 7.2 Geochemical time series; Cu and Ni (aerobic and anaerobic) 207
Figure 7.3 Eh/pH diagram of Cu species 216
Figure 7.4 Eh/pH diagram of Ni species 217
Figure 8.1 Geochemical time series; V (aerobic and anaerobic) 233
Figure 8.2 V K-Edge XANES for anaerobic experiments 236
Figure 8.3 V K-Edge XANES plot 237
Figure 8.4 Eh/pH diagram of V species 241
Figure A1 XRD pattern – Consett surface soil 259
Figure A2 XRD pattern – Consett deep soil 260
Figure A3 XRD patterns – Ajka soils 261
Figure A4 XRD pattern – Ajka red mud 262
List of Tables
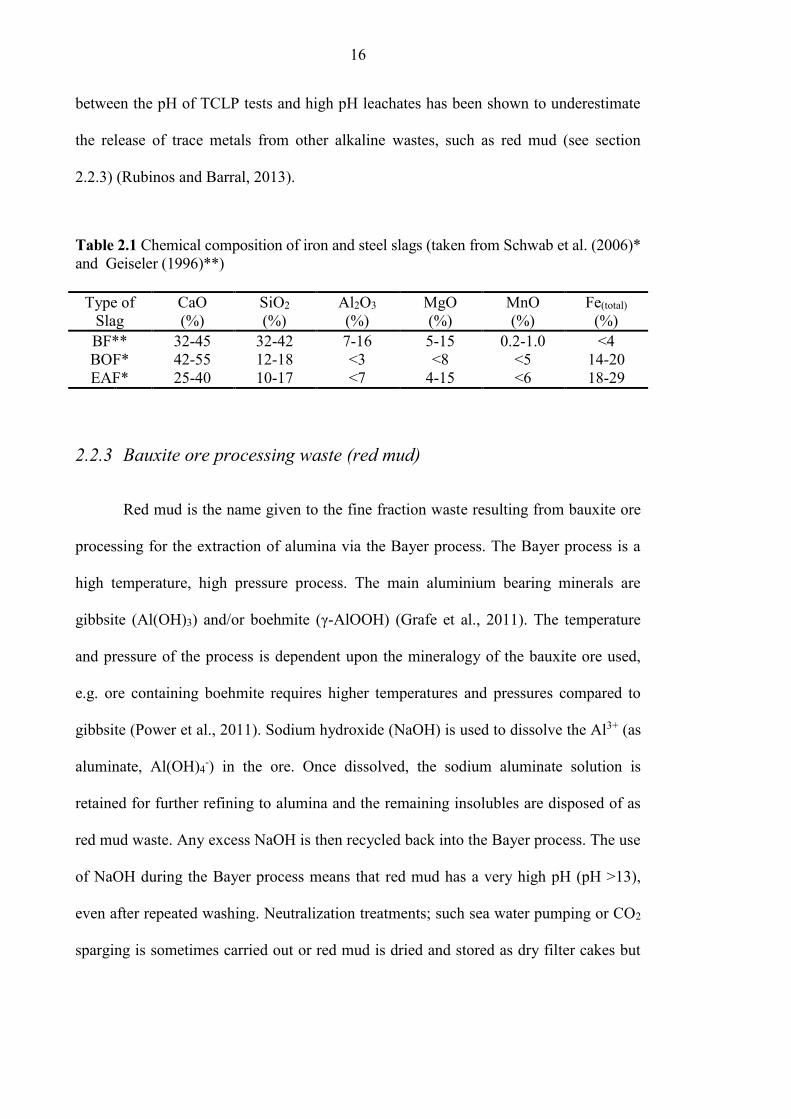
Table 2.1 Chemical composition of iron and steel slags 16
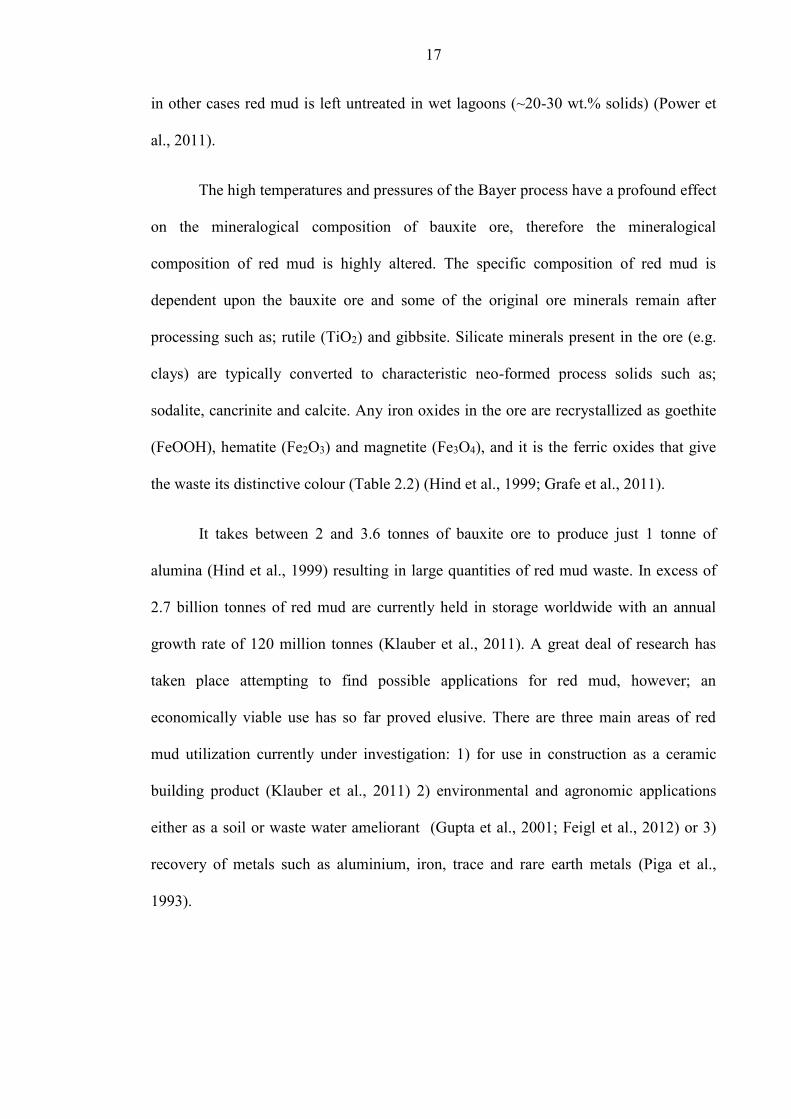
Table 2.2 Elemental and mineral composition of various red muds 18
Table 2.3 Environmentally significant microbial half reaction reduction potentials 29
Table 2.4 Typical slag analyses from former Consett Steelworks 34
Table 2.5 Mean hydrochemical composition of Consett leachate 38
Table 2.6 Composition of digested sediments from Hownsgill Valley 38
Table 4.1 Consett soil elemental composition 102
Table 4.2 Consett soil characterisation 103
Table 4.3 Consett groundwater analysis 103
Table 4.4 V K-Edge XANES summary 107
Table 5.1 Red mud and Hungarian soil characterisation 135
Table 5.2 Red mud and Hungarian soil elemental analysis 136
Table 6.1 As K-Edge EXAFS fitting 163
Table 6.2 % As(V) and As(III) in aqueous phase 177
Table 7.1 DOC concentrations 203
Table 7.2 Range of other metal concentrations from end point solutions 208
Table 7.3a % Organically bound Cu and Ni from anaerobic experiments 209
Table 7.3b % Organically bound Cu and Ni from aerobic experiments 209
Table 7.4 Pearson’s regression analysis; DOC, pH for Cu and Ni 215
Table 8.1 % Organically bound V from aerobic and anaerobic experiments 234
Table 8.2 V K-Edge XANES summary 235
Table 8.3 Pearson’s regression analysis; DOC and pH for V 239
Table A1 Clone library – Consett soil microbial sequences 258
Table A2 Data from duplicate batch experiment data 262

1
Abbreviations
AMD Acid Mine Drainage
BDRA Bauxite Disposal Residue Area
COPR Chromate Ore Processing Residue
BF Blast Furnace
BOF Basic Oxygen Furnace
CRM Certified Reference Material
DCTA 1,2-diaminocyclohexanetetra acetic acid
DIW Deionised Water
DOC/M Dissolved Organic Carbon / Matter
EAF Electric Arc Furnace
EXAFS Extended X-Ray Absorption Fine Structure
FT Fourier Transform
IC Ion Chromatography
ICP-MS / OES Inductively Coupled Plasma-Mass Spectrometry / Optical
Emission Spectrometry
LOI Loss on Ignition
[M+] Concentration of metal ions
NOM / OM Natural Organic Matter / Organic Matter
OFN Oxygen Free Nitrogen
ORP Oxidation/Reduction Potential
OTU Operational Taxonomic Unit
PCA Principle Component Analysis
PCR Polymerase Chain Reaction
RDP Ribosomal Database Project
SD / RSD Standard Deviation / Relative Standard Deviation
SOM Soil Organic Matter
SPE Solid Phase Extraction
TEA / P Terminal Electron Acceptors / Accepting Process
TCLP Toxic Characteristic Leaching Procedure
TDS Total Dissolved Solids
WHO World Health Organisation
XANES X-ray Absorption Near Edge Structure
XAS X-Ray Absorption Spectroscopy
XRD / F X-Ray Diffraction / Fluorescence
2
Chapter 1 Introduction
1.1 Project background and significance
The main focus of this thesis was to investigate the fate and environmental
behaviour of potentially toxic trace elements derived from alkaline waste into the wider
environment.
Past research and legislation relating to waste management has focussed on
heavy metal contamination from mining activities. The environmental problems
associated with acid mine/rock drainage from sulfide minerals are well documented
(Johnson and Hallberg, 2005). These acidic waters often contain elevated concentrations
of Cu, Cd Fe, Mn, Pb, Ni and Zn which are mobilised due to their increased solubility at
low pH and can have a considerable impact on the surrounding environment (Younger
et al., 2005)
In the past, alkaline wastes, usually derived from industrial activities such as;
bauxite ore processing, steel production, chromite ore processing, have received less
attention due to relatively low volumes of waste. However, recent increases in
production of steel (worldwide steel production increased from 851 Mt in 2001 to 1,607
Mt in 2013 (World Steel Association, 2014)) and a lack of economically viable
recycling options for bauxite processing waste (Power et al., 2011) means that the
problems associated with alkaline wastes are gaining more attention. Alkaline wastes
give cause for concern not only due to the high concentrations of heavy metals found in
the wastes but high pH leachates can mobilise toxic oxyanion forming elements such as
As, Cr, Mo, Se and V (Cornelis et al., 2008).
3
The original aim of this thesis was to investigate the processes controlling the
fate and transport of vanadium (and then possibly other metals such as Cr) from a
legacy steel slag site; the Hownsgill Valley, nr Consett, County Durham, U.K. The
Hownsgill Valley was used to dump iron and steel slags for over a century until the
closure of the Consett Steelworks in 1980. The valley contains a wetland that has been
affected by high pH leachates percolating through the slag wastes forming a large
alkaline leachate pond. The surrounding soil is characterised by high rates of calcite
precipitation and relatively high aqueous vanadium concentrations occur across the site
(Mayes et al., 2006; Mayes et al., 2008).
However, on the 4th October 2010, towards the start of the doctoral research, a
spill occurred at a bauxite residue disposal area (BDRA) in Ajka, western Hungary
where 1 million m3 of caustic red mud suspension was released from a failed tailings
dam. The spill caused 10 deaths, injured over 100 people, ruined homes, property and
land. A red mud spill of this magnitude was unprecedented and relief efforts were
hampered due to a lack of knowledge of the contaminant material (Adam et al., 2011a).
It is now known that the Ajka red mud has a very high pH (pH >13) and contains high
concentrations of oxyanion forming elements as well as other potentially toxic metals
(Ruyters et al., 2011; Mayes et al., 2011). The opportunity to go to the area affected by
the red mud spill arose and the aim of the thesis shifted to an investigation of the
mobilisation of trace metals from Ajka red mud with a particular focus on soils and
wetland areas inundated by red mud as a result of the spill.
4
1.2 Research objectives
This thesis reports the findings of an investigation into the mobilisation of trace
elements from red mud into soil-water systems and a pilot study into the mobilisation of
V from steel slag. The research hypotheses for these two sites have therefore been
shown separately.
1.2.1 Hownsgill Valley, nr Consett, U.K.
The pilot study beginning the investigation into the processes controlling V
mobilisation from steel slag started with the following hypotheses:
Soils affected by steel slag leachates will contain an indigenous population of
microorganisms that are adapted to survive and grow at high pH; microbial
bioreduction processes will, therefore be supported in this environment.
The observed decrease in aqueous vanadium concentrations in the alkaline
leachate with distance away from the source is (at least in part) due to in situ
microbially mediated reduction of V(V) to produce less soluble V(IV) species.
1.2.2 Ajka, western Hungary
The following research hypotheses were used as a guide to the main body of the
research:
Addition of caustic red mud to soils will cause an increase in soil pH and as a
consequence concentrations of several toxic oxyanion forming elements (e.g.
5
As, Al, V, Mo) will increase in associated waters due to their lower sorption to
minerals at high pH.
Soils containing higher concentrations of organic matter (or larger quantities of
clay minerals) content will have a higher intrinsic buffering capacity with
respect to addition of alkalinity (from red mud), producing lower soil pH, and
lower aqueous concentrations of oxyanion forming elements.
Addition of red mud in soils will cause the solubilisation of soil organic matter
(due to higher pH), resulting in increased dissolved organic carbon (DOC)
concentrations, and, higher concentrations of elements known to complex
strongly with DOC (e.g. Cu and Ni).
Increasing the concentration of anionic species in solution (e.g. phosphate,
carbonate) that are known to compete for available sorption sites on minerals,
will result in enhanced solubility of toxic oxyanion forming species (such as As)
regardless of soil pH.
Addition of gypsum (as a source of Ca2+) to red mud affected soils will promote
OH- consuming carbonate precipitation reactions, reducing soil pH, and
producing lower oxyanion concentrations due to enhanced sorption at
circumneutral pH.
In aerobic soil-water systems containing red mud, equilibration with
atmospheric CO2 will also result in lower soil pH and lower oxyanion
concentrations.
In anaerobic soil-water systems containing red mud, microbial bioreduction
processes will produce reducing conditions with time, promoting the reduction
6
of As(V) to generally more soluble As(III) species, thus increasing the risk of
enhanced As mobility.
Conversely, bioreduction processes will also promote the transformation of
V(V) to V(IV) species, which strongly adsorbs to minerals at alkaline pH,
resulting in lower solution concentrations.
Soil affected by red mud additions will not contain microbial communities that
are adjusted to alkaline conditions, therefore bioreduction processes will be
inhibited at high pH.
1.3 Experimental approaches
To test these hypotheses, a multidisciplinary approach was taken. To this end,
research methods and analytical techniques from a variety of scientific disciplines
including; geochemistry, biogeochemistry and molecular biology were employed.
Extensive soil and sample characterisation was completed on the soils from both sites
and the red mud using various techniques such as XRD, XRF and BET specific surface
area.
At the Ajka site, three main comparisons were made, being the differences
between 1) unremediated wetland areas and soils where red mud had been ploughed
into the soil, 2) aerobic and anaerobic conditions and, 3) oxyanion forming elements
(As and V) and cationic elements (Cu and Ni). In order to fully elucidate these
differences batch microcosm experiments were prepared using unaffected Hungarian
soils mixed with red mud. Heat treated controls were prepared to distinguish between
biotic and abiotic processes and soil-only microcosms were prepared to determine
7
background concentrations. The aqueous phase and sediment sampled from the
microcosms at various time points were then tested for aqueous metal/loid ion
evolution, biogeochemical indicators (Fe(II), nitrate, sulfate), pH and redox potential
over time. This enabled the production of time series data and a comparison between the
changes during the development of microbial anoxia and without. Only a small volume
of sample was extracted during the time series making it difficult for lots of different
analyses but further testing at the end of the incubation periods on both the aqueous
phase and sediment allowed for the use of additional techniques including: XAS
analysis, As speciation via HPLC-ICP-MS, dissolved organic carbon, and % organically
bound metals using a solid phase extraction technique.
Anaerobic batch microcosms were also used for the pilot study at the Hownsgill
Valley site but the amount of additional analysis was less extensive. An important
aspect at this site however, was to establish the presence of an alkaliphilic microbial
community. 16s rRNA gene fragments were recovered in order to determine the
microorganisms present. The quality of each sequence was assessed and non-chimeric
sequences were uploaded to the EMBL Genbank database. A combination of the
Ribosomal Database Project (RDP) Naïve Bayesian classifier (Wang et al., 2007), the
construction of a phylogenetic tree and MOTHUR analysis (Schloss et al., 2009)
allowed for these sequences to be assigned to taxonomy and the community structure to
be investigated. This allowed for the comparison of the dominant species to be
compared to those found at other important alkaline waste sites (Whittleston et al.,
2013).
8
1.4 Thesis structure
This thesis consists of nine chapters. The thesis begins with an introduction to
the problems associated with alkaline wastes and specifically steel slags and red mud.
This is followed with an overview of the chemistry and processes that govern the fate of
As, Cu, Ni and V in the environment. There is also a brief introduction to the two study
sites that are the focus of this research. A detailed chapter of the methods and analytical
techniques then follows. Results are in the form of five working chapters, three of
which have been prepared or are in the processes of preparation for publication and two
pilot studies into the behaviour of vanadium at the different sites. Finally, the results
from chapters 4 to 8 are summarised and discussed in chapter 9. In addition,
comprehensive appendices of additional data are included together with a list of
associated publications.
9
1.5 References
ADAM, J., BANVOLGYI, G., DURA, G., GRENERCZY, G., GUBECK, N., GUPTER, I.,
SIMON, G., SZEGFALVI, Z., SZEKACS, A., SZEPVOLGYI, J. & UJLAKY, E. 2011. The
Kolontar report: Causes and Lessons from the Red Mud Disaster. In: B, J. (ed.). Budapest:
Sustainable Development Committee of the Hungarian Parliament.
CORNELIS, G., JOHNSON, C. A., VAN GERVEN, T. & VANDECASTEELE, C. 2008.
Leaching mechanisms of oxyanionic metalloid and metal species in alkaline solid wastes: A
review. Applied Geochemistry, 23, 955-976.
JOHNSON, D. B. & HALLBERG, K. B. 2005. Acid mine drainage remediation options: a
review. Science of the Total Environment, 338, 3-14.
MAYES, W. M., JARVIS, A. P., BURKE, I. T., WALTON, M., FEIGL, V., KLEBERCZ, O. &
GRUIZ, K. 2011. Dispersal and Attenuation of Trace Contaminants Downstream of the Ajka
Bauxite Residue (Red Mud) Depository Failure, Hungary. Environmental Science &
Technology, 45, 5147-5155.
MAYES, W. M., YOUNGER, P. L. & AUMONIER, J. 2006. Buffering of alkaline steel slag
leachate across a natural wetland. Environmental Science & Technology, 40, 1237-1243.
MAYES, W. M., YOUNGER, P. L. & AUMONIER, J. 2008. Hydrogeochemistry of alkaline
steel slag leachates in the UK. Water Air and Soil Pollution, 195, 35-50.
POWER, G., GRAFE, M. & KLAUBER, C. 2011. Bauxite residue issues: I. Current
management, disposal and storage practices. Hydrometallurgy, 108, 33-45.
RUYTERS, S., MERTENS, J., VASSILIEVA, E., DEHANDSCHUTTER, B., POFFIJN, A. &
SMOLDERS, E. 2011. The Red Mud Accident in Ajka (Hungary): Plant Toxicity and Trace
Metal Bioavailability in Red Mud Contaminated Soil. Environmental Science & Technology, 45,
1616-1622.
SCHLOSS, P. D., WESTCOTT, S. L., RYABIN, T., HALL, J. R., HARTMANN, M.,
HOLLISTER, E. B., LESNIEWSKI, R. A., OAKLEY, B. B., PARKS, D. H., ROBINSON, C. J.,
SAHL, J. W., STRES, B., THALINGER, G. G., VAN HORN, D. J., WEBER, C. F. 2009.
Introducing mothur: Open-Source, Platform-Independent, Community-Supported Software for
Describing and Comparing Microbial Communities. Applied and Environmental Microbiology,
75, 7537-7541.
WANG, Q., GARRITY, G. M., TIEDJE, J. M. & COLE, J. R. 2007. Naive Bayesian classifier
for rapid assignment of rRNA sequences into the new bacterial taxonomy. Applied and
Environmental Microbiology, 73, 5261-5267.
WHITTLESTON, R. A., STEWART, D. I., MORTIMER, R. J. G. & BURKE, I. T. 2013.
Enhancing microbial iron reduction in hyperalkaline, chromium contaminated sediments by pH
amendment. Applied Geochemistry, 28, 135-144.
WORLD STEEL ASSOCIATION. 2014. Key Facts about the world of steel [Online]. Available:
http://www.worldsteel.org/media-centre/key-facts.html [Accessed 18th April 2014]

10
YOUNGER, P. L., COULTON, R. H. & FROGGATT, E. C. 2005. The contribution of science
to risk-based decision-making: lessons from the development of full-scale treatment measures
for acidic mine waters at Wheal Jane, UK. Science of the Total Environment, 338, 137-154.
11
Chapter 2 Background Information and Site Processes
This chapter provides an overview of industrial processes responsible for the
production of alkaline waste whilst looking specifically at the contaminants: arsenic,
copper, nickel and vanadium and the main processes controlling the transport of these
contaminants from alkaline waste into affected soils. This chapter will also provide an
introduction to the study sites investigated in this thesis.
2.1 Alkaline Environments
Alkaline environments occur both naturally and as a direct result of
anthropogenic activities. Naturally occurring alkaline environments are relatively
uncommon. Typical examples are; soda lakes (Jones et al., 1998), some thermal springs
(e.g. Mushroom Springs at Yellowstone National Park (Ward et al., 2006)),
oceanographic cold seeps (Takai et al., 2005) and ground-waters affected by the
weathering of ultramafic rocks (Tiago et al., 2004). Soda lakes, such as those found in
the East African Rift Valley and in the western United States typically have a pH of
between 9 -12 and high salinity (ranging from brackish to hyper-saline) (Jones et al.,
1998; Lanzen et al., 2013). Despite high salinity and high pH, soda lakes have been
found to be areas of high microbial productivity (Jones et al., 1998; Pollock et al., 2007;
Zhilina et al., 2009).
Much more common are anthropogenic sites, which occur as a result of high pH
industrial waste. Industries such as chromium ore processing (Deakin et al., 2001), lime
burning (Burke et al., 2012b), borax production (Ye et al., 2004), bauxite mining (Grafe
et al., 2011) and steel manufacturing (Mayes et al., 2008) generate alkaline wastes.
12
Although each of these wastes are essentially different due to the origin of ores and
differing production processes, there are some similarities (Cornelis et al., 2008). When
alkaline wastes are left to degrade in the open, equilibration takes place with the
external environment which results in a leaching process. Typically the leachate
generated has a very high pH (pH 10-13) due to the presence of Ca, Na and K oxides
that hydrolyse in water to produce soluble metal hydroxides (Hind, et al., 1999). The
mobilisation of these soluble metal hydroxides into adjacent soil and water systems are
therefore a cause for environmental concern.
2.2 Alkaline industrial wastes
2.2.1 Problems associated with high alkaline industrial wastes
The legacy of the inefficient disposal of alkaline waste can lead to several
environmental issues. Disposal sites rarely have impermeable barriers underneath the
waste, therefore allowing the leachate to migrate and mobilise any soluble contaminants
into the wider environment (Burke et al., 2012b). In some cases, the weathering of
alkaline waste has resulted in the alkalisation of groundwater or the formation of large
alkaline leachate ponds (Roadcap et al., 2005; Mayes et al., 2006; Czop et al., 2011).
Large-scale infilling of wetlands with steel slag in the Lake Calumet region, Illinois,
United States has resulted in an alkaline groundwater system where pH is as high as
12.8 (Roadcap et al., 2005). Bauxite processing residue dumped in a former limestone
quarry has resulted in the formation of an alkaline pit lake (pH 11.5 - 13.3) in the
Chrzanow region, southern Poland (Czop et al., 2011). The high pH water, can itself be
toxic to some fish populations (Wilkie and Wood, 1996) but there are other
environmental and ecological problems that are associated with alkaline leachates.
13
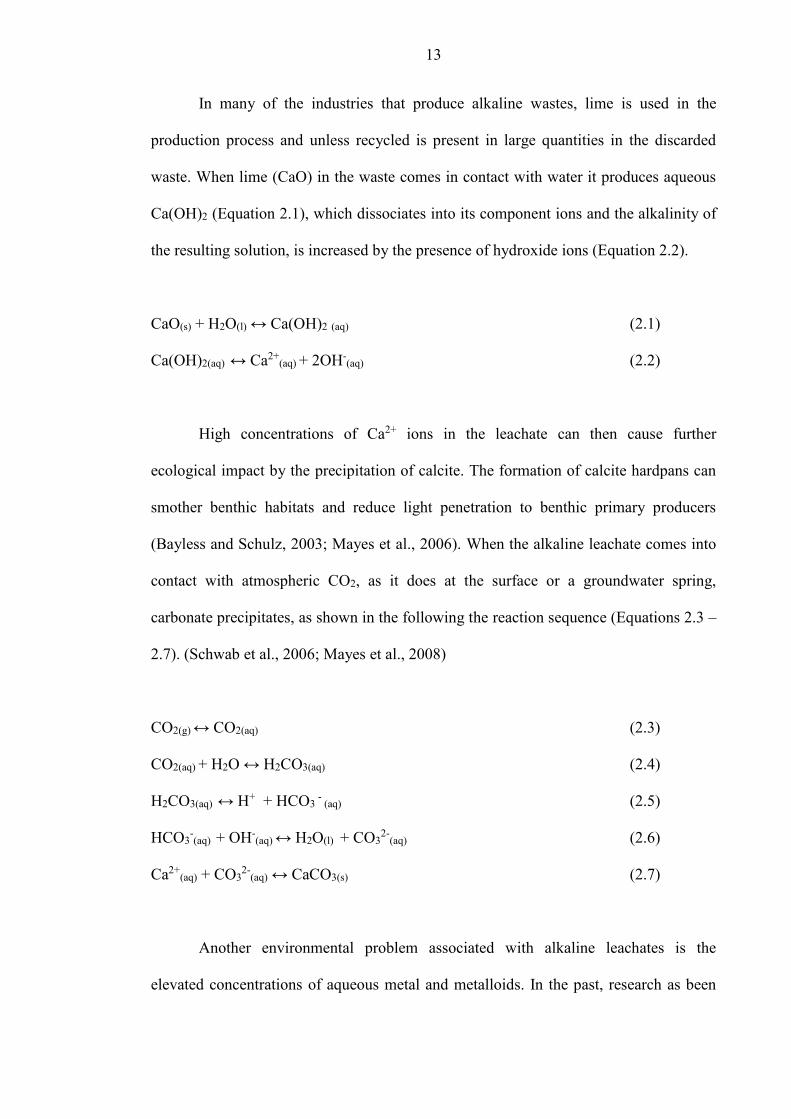
In many of the industries that produce alkaline wastes, lime is used in the
production process and unless recycled is present in large quantities in the discarded
waste. When lime (CaO) in the waste comes in contact with water it produces aqueous
Ca(OH)2 (Equation 2.1), which dissociates into its component ions and the alkalinity of
the resulting solution, is increased by the presence of hydroxide ions (Equation 2.2).
CaO(s) + H2O(l) ↔ Ca(OH)2 (aq) (2.1)
Ca(OH)2(aq) ↔ Ca2+(aq) + 2OH-
(aq) (2.2)
High concentrations of Ca2+ ions in the leachate can then cause further
ecological impact by the precipitation of calcite. The formation of calcite hardpans can
smother benthic habitats and reduce light penetration to benthic primary producers
(Bayless and Schulz, 2003; Mayes et al., 2006). When the alkaline leachate comes into
contact with atmospheric CO2, as it does at the surface or a groundwater spring,
carbonate precipitates, as shown in the following the reaction sequence (Equations 2.3 –
2.7). (Schwab et al., 2006; Mayes et al., 2008)
CO2(g) ↔ CO2(aq) (2.3)
CO2(aq) + H2O ↔ H2CO3(aq) (2.4)
H2CO3(aq) ↔ H+ + HCO3 -
(aq) (2.5)
HCO3-(aq) + OH-
(aq) ↔ H2O(l) + CO32-
(aq) (2.6)
Ca2+(aq) + CO3
2-(aq) ↔ CaCO3(s) (2.7)
Another environmental problem associated with alkaline leachates is the
elevated concentrations of aqueous metal and metalloids. In the past, research as been
14
mainly focused on metals that have been found at high solid concentrations in alkaline
wastes such as; Cu, Cd, Hg, Pb and Zn (Cornelis et al., 2008). However, oxyanion
forming elements, such as As, Cr, Mo and V, are often found in relatively high
concentrations in alkaline leachates, despite being present at a low weight % in solid
waste, due to their increased solubility at high pH (Langmuir, 1997; Cornelis et al.,
2008). The mobilisation of oxyanion forming elements by leachates is dependent upon a
number of factors including; redox state, precipitation and sorption with metal oxides
and microbial processes, all of which will be explored further in this chapter.
2.2.2 Iron and steel slags
It is estimated that between 270 and 320 million tonnes of iron slag and 150 -
230 million tonnes of steel slag are produced annually worldwide (U.S. Geological
Survey, 2013). The process of slag recycling is relatively modern and in the past slags
have been dumped in slag heaps and left to degrade in the open allowing for
contamination of the surrounding area (Roadcap et al., 2005; Mayes et al., 2008).
However, slag recycling is becoming increasingly popular and it is currently used in the
construction industry (Chaurand et al., 2007a; U.S. Geological Survey, 2013), as
fertilizers or soil conditioners (Haynes et al., 2013) and some research suggests that it
may be useful for CO2 sequestration (Bonenfant et al., 2008). The recycling of slags is
not without issues and several problems have been reported. Schwab et al. (2006)
reported a high pH leachate with a strong sulfur odour emerging from weathered slag
used in road construction only two years after construction. The use of basic slag
containing ~3% vanadium when used as a soil fertilizer resulted in the death of 23
heifers from acute vanadium poisoning (Frank et al., 1996).
15
There are three main types of slag produced in the UK 1) blast furnace (BF)
which is formed from the production of iron 2) basic oxygen furnace (BOF) which uses
hot iron from BF or steel scraps to produce steel and 3) electric arc furnace (EAF)
which uses cold scrap steel only for steel production (The European Slag Association,
2014). In each method of production, fluxing agents (limestone [CaCO3] or dolomite
[CaMg(CO3)2]) are added to increase heat transfer and remove impurities. The fluxing
agents combine with impurities in the molten iron or steel to create slag. Once removed
from the molten metal, the slag is either cooled by water or left to air cool and broken
up for transport (The European Slag Association, 2014).
Due to the presence of the limestone and dolomite fluxing agents the
composition of slag produced from each method is generally very similar, although
there tend to be more impurity in BF originating from the iron ore (Proctor et al., 2000).
The main components of slags, in varying concentrations, (see Table 2.1) are oxides of
calcium, silicon, aluminium, magnesium, manganese and iron, with trace concentrations
of various sulfates and phosphates (Proctor et al., 2000; Navarro et al., 2010). Slags can
also contain, in varying concentrations, toxic elements such as As, Cr, Cd, Hg, Mo, Pb
and V (Roadcap et al., 2005; Chaurand et al., 2007a; Navarro et al., 2010).
Although, slag is generally considered to be a non-hazardous material there is
some environmental concern about the highly alkaline leachates produced from slag
weathering and the mobilisation of trace metal/loids (Schwab et al., 2006; Chaurand et
al., 2007a; Navarro et al., 2010). Toxicity characteristic leaching procedure (TCLP)
tests have shown that many of the trace metals are not readily leachable (Proctor et al.,
2000). However, the pH of the TCLP test is ~4.9 (United States Environmental
Protection Agency, 1992) and the leachate produced from weathered slag is generally
between pH 10 and 13 (Schwab et al., 2006; Cornelis et al., 2008). This large difference
16
between the pH of TCLP tests and high pH leachates has been shown to underestimate
the release of trace metals from other alkaline wastes, such as red mud (see section
2.2.3) (Rubinos and Barral, 2013).
Table 2.1 Chemical composition of iron and steel slags (taken from Schwab et al. (2006)*
and Geiseler (1996)**)
Type of
Slag
CaO
(%)
SiO2
(%)
Al2O3
(%)
MgO
(%)
MnO
(%)
Fe(total)
(%)
BF** 32-45 32-42 7-16 5-15 0.2-1.0 <4
BOF* 42-55 12-18 <3 <8 <5 14-20
EAF* 25-40 10-17 <7 4-15 <6 18-29
2.2.3 Bauxite ore processing waste (red mud)
Red mud is the name given to the fine fraction waste resulting from bauxite ore
processing for the extraction of alumina via the Bayer process. The Bayer process is a
high temperature, high pressure process. The main aluminium bearing minerals are
gibbsite (Al(OH)3) and/or boehmite (γ-AlOOH) (Grafe et al., 2011). The temperature
and pressure of the process is dependent upon the mineralogy of the bauxite ore used,
e.g. ore containing boehmite requires higher temperatures and pressures compared to
gibbsite (Power et al., 2011). Sodium hydroxide (NaOH) is used to dissolve the Al3+ (as
aluminate, Al(OH)4-) in the ore. Once dissolved, the sodium aluminate solution is
retained for further refining to alumina and the remaining insolubles are disposed of as
red mud waste. Any excess NaOH is then recycled back into the Bayer process. The use
of NaOH during the Bayer process means that red mud has a very high pH (pH >13),
even after repeated washing. Neutralization treatments; such sea water pumping or CO2
sparging is sometimes carried out or red mud is dried and stored as dry filter cakes but
17
in other cases red mud is left untreated in wet lagoons (~20-30 wt.% solids) (Power et
al., 2011).
The high temperatures and pressures of the Bayer process have a profound effect
on the mineralogical composition of bauxite ore, therefore the mineralogical
composition of red mud is highly altered. The specific composition of red mud is
dependent upon the bauxite ore and some of the original ore minerals remain after
processing such as; rutile (TiO2) and gibbsite. Silicate minerals present in the ore (e.g.
clays) are typically converted to characteristic neo-formed process solids such as;
sodalite, cancrinite and calcite. Any iron oxides in the ore are recrystallized as goethite
(FeOOH), hematite (Fe2O3) and magnetite (Fe3O4), and it is the ferric oxides that give
the waste its distinctive colour (Table 2.2) (Hind et al., 1999; Grafe et al., 2011).
It takes between 2 and 3.6 tonnes of bauxite ore to produce just 1 tonne of
alumina (Hind et al., 1999) resulting in large quantities of red mud waste. In excess of
2.7 billion tonnes of red mud are currently held in storage worldwide with an annual
growth rate of 120 million tonnes (Klauber et al., 2011). A great deal of research has
taken place attempting to find possible applications for red mud, however; an
economically viable use has so far proved elusive. There are three main areas of red
mud utilization currently under investigation: 1) for use in construction as a ceramic
building product (Klauber et al., 2011) 2) environmental and agronomic applications
either as a soil or waste water ameliorant (Gupta et al., 2001; Feigl et al., 2012) or 3)
recovery of metals such as aluminium, iron, trace and rare earth metals (Piga et al.,
1993).
18
Table 2.2 – Elemental and mineralogical composition of various worldwide red mud
(taken from Grafe and Klauber (2011))
Element Content %
(avg ±std) Minerals
Fe2O3 40.9 ±15.6 Hematite, Goethite, Magnetite
Al2O3 16.3 ± 6.4 Boehmite, Gibbsite, Diaspore,
SiO2 9.6 ± 6.7 Quartz, sodalite, Cancrinite
TiO2 8.8 ± 4.4 Rutile, Anatase, Perovskite, Ilmenite
CaO 8.6 ± 9.4 Calcite, Perovskite
Whewellite, hydro-calumite
Na2O 4.5 ± 3.3 Sodalite, Cancrinite, Dawsonite
LOI 10.0 ± 2.8 Water, oxalate, other organics
One of the main problems associated with red mud reuse is regarding the nature
of red mud itself, not only does red mud have a very high pH but it also has a high salt
content and is known to contain elevated concentrations of toxic and potentially toxic
metal/loids (Czop et al., 2011; Grafe et al., 2011; Rubinos and Barral, 2013). In some
cases, red mud can contain high concentrations of radiogenic elements such as Th and U
(Gamaletsos et al., 2011). There has been much research on the use of red mud as a soil
ameliorant, identifying it as a possible amendment for heavy metal or arsenic
contaminated soils (Lombi et al., 2002; Castaldi et al., 2010; Garau et al., 2011).
However, other researchers have shown that there can be a trade off effect to this type
of soil remediation: when added in increasing quantities the use of red mud becomes
unattractive due to the release of toxic oxyanion forming elements such as As, Cr and V
(Summers et al., 1993; Friesl et al., 2004). Other researchers have shown that there are
some eco-toxicological effects from the addition of red mud to soils due to increased
soil pH and stress due to increased soil salinity (Ruyters et al., 2011; Klebercz et al.,
2012).
19
2.3 Fate and transport of metal/loids in the environment
The chemistry and reactivity of each element is different (for example, solubility
in water) and can change depending upon many factors; pH, Eh, elemental
concentration, microbial transformation and complexation to inorganic and organic
substrates. These factors control the chemical speciation, bioavailability (and thereby
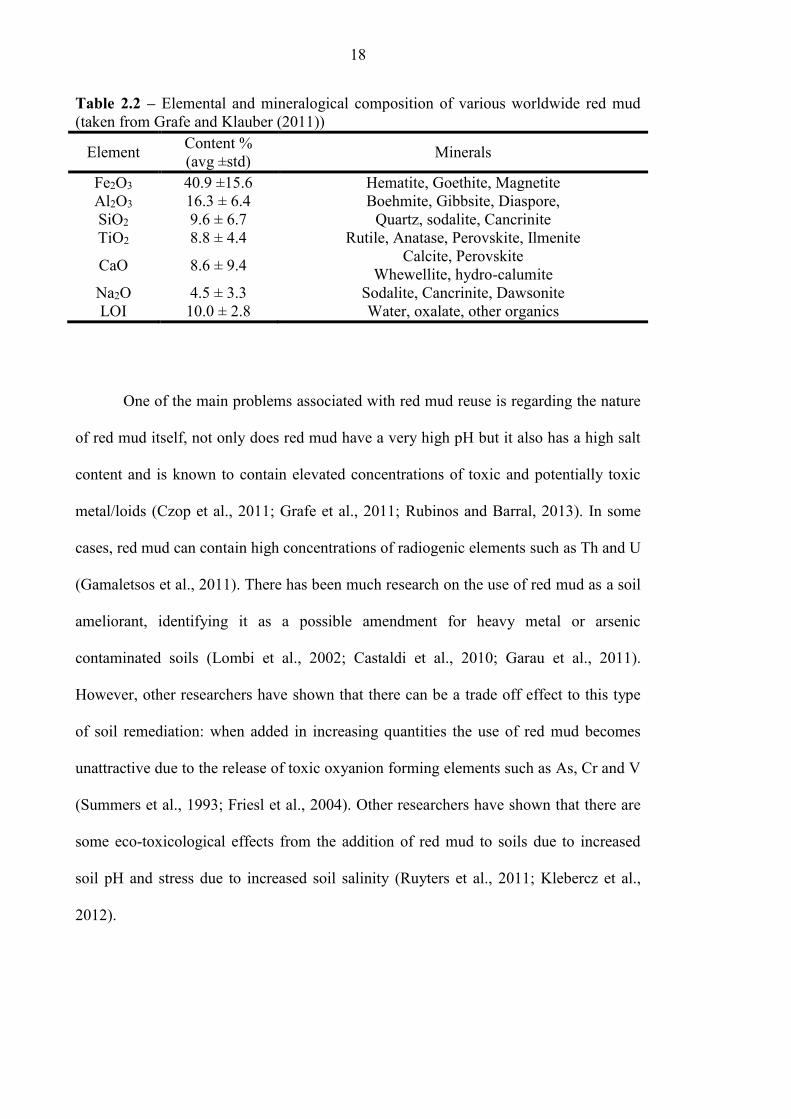
the toxicity) and transport mechanisms of contaminants in the environment. Figure 2.1
shows some of the important processes affecting trace metal/loids in the environment.
Figure 2.1 - Schematic illustration of a variety of molecular environmental processes
affecting contaminant elements in soils and groundwater (adapted from Brown et al.
(1999)).
20
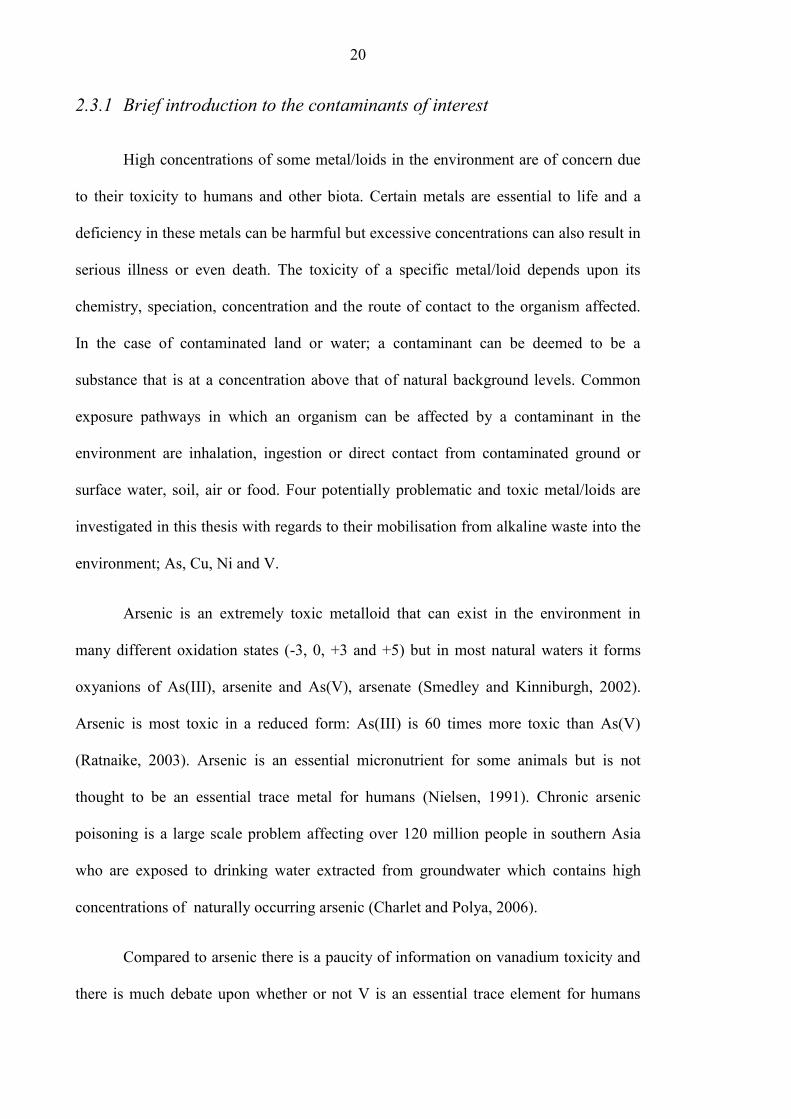
2.3.1 Brief introduction to the contaminants of interest
High concentrations of some metal/loids in the environment are of concern due
to their toxicity to humans and other biota. Certain metals are essential to life and a
deficiency in these metals can be harmful but excessive concentrations can also result in
serious illness or even death. The toxicity of a specific metal/loid depends upon its
chemistry, speciation, concentration and the route of contact to the organism affected.
In the case of contaminated land or water; a contaminant can be deemed to be a
substance that is at a concentration above that of natural background levels. Common
exposure pathways in which an organism can be affected by a contaminant in the
environment are inhalation, ingestion or direct contact from contaminated ground or
surface water, soil, air or food. Four potentially problematic and toxic metal/loids are
investigated in this thesis with regards to their mobilisation from alkaline waste into the
environment; As, Cu, Ni and V.
Arsenic is an extremely toxic metalloid that can exist in the environment in
many different oxidation states (-3, 0, +3 and +5) but in most natural waters it forms
oxyanions of As(III), arsenite and As(V), arsenate (Smedley and Kinniburgh, 2002).
Arsenic is most toxic in a reduced form: As(III) is 60 times more toxic than As(V)
(Ratnaike, 2003). Arsenic is an essential micronutrient for some animals but is not
thought to be an essential trace metal for humans (Nielsen, 1991). Chronic arsenic
poisoning is a large scale problem affecting over 120 million people in southern Asia
who are exposed to drinking water extracted from groundwater which contains high
concentrations of naturally occurring arsenic (Charlet and Polya, 2006).
Compared to arsenic there is a paucity of information on vanadium toxicity and
there is much debate upon whether or not V is an essential trace element for humans
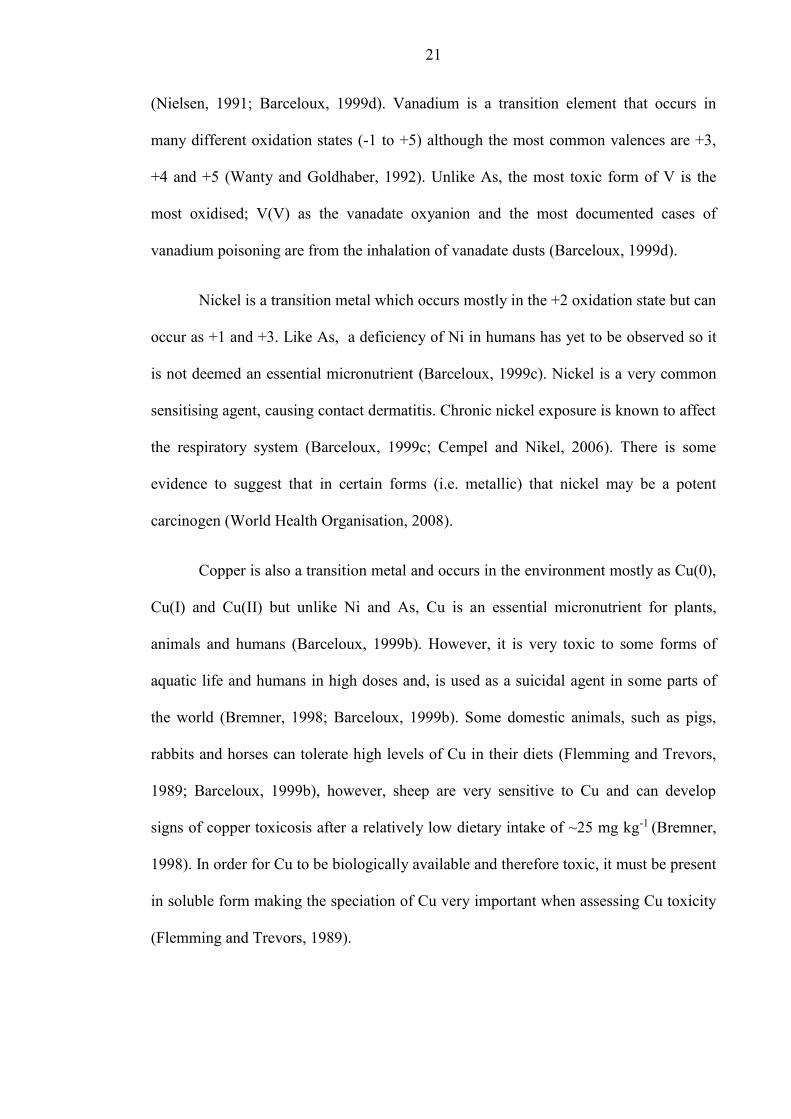
21
(Nielsen, 1991; Barceloux, 1999d). Vanadium is a transition element that occurs in
many different oxidation states (-1 to +5) although the most common valences are +3,
+4 and +5 (Wanty and Goldhaber, 1992). Unlike As, the most toxic form of V is the
most oxidised; V(V) as the vanadate oxyanion and the most documented cases of
vanadium poisoning are from the inhalation of vanadate dusts (Barceloux, 1999d).
Nickel is a transition metal which occurs mostly in the +2 oxidation state but can
occur as +1 and +3. Like As, a deficiency of Ni in humans has yet to be observed so it
is not deemed an essential micronutrient (Barceloux, 1999c). Nickel is a very common
sensitising agent, causing contact dermatitis. Chronic nickel exposure is known to affect
the respiratory system (Barceloux, 1999c; Cempel and Nikel, 2006). There is some
evidence to suggest that in certain forms (i.e. metallic) that nickel may be a potent
carcinogen (World Health Organisation, 2008).
Copper is also a transition metal and occurs in the environment mostly as Cu(0),
Cu(I) and Cu(II) but unlike Ni and As, Cu is an essential micronutrient for plants,
animals and humans (Barceloux, 1999b). However, it is very toxic to some forms of
aquatic life and humans in high doses and, is used as a suicidal agent in some parts of
the world (Bremner, 1998; Barceloux, 1999b). Some domestic animals, such as pigs,
rabbits and horses can tolerate high levels of Cu in their diets (Flemming and Trevors,
1989; Barceloux, 1999b), however, sheep are very sensitive to Cu and can develop
signs of copper toxicosis after a relatively low dietary intake of ~25 mg kg-1 (Bremner,
1998). In order for Cu to be biologically available and therefore toxic, it must be present
in soluble form making the speciation of Cu very important when assessing Cu toxicity
(Flemming and Trevors, 1989).
22
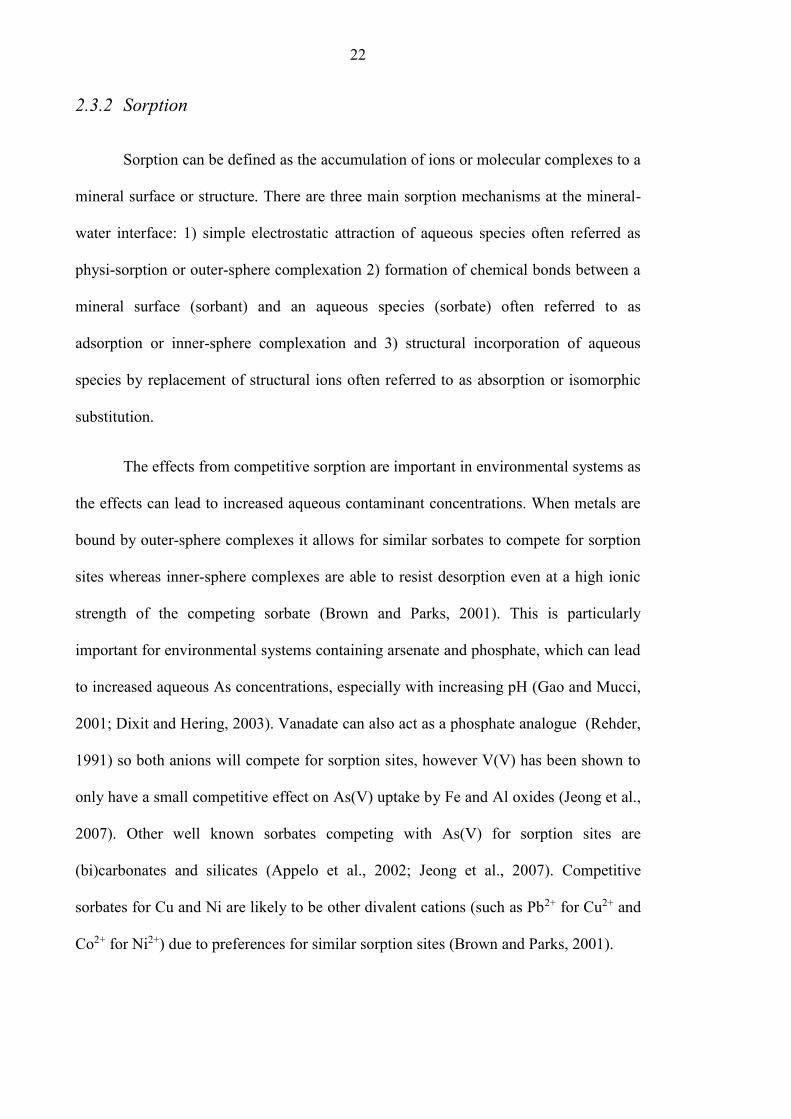
2.3.2 Sorption
Sorption can be defined as the accumulation of ions or molecular complexes to a
mineral surface or structure. There are three main sorption mechanisms at the mineral-
water interface: 1) simple electrostatic attraction of aqueous species often referred as
physi-sorption or outer-sphere complexation 2) formation of chemical bonds between a
mineral surface (sorbant) and an aqueous species (sorbate) often referred to as
adsorption or inner-sphere complexation and 3) structural incorporation of aqueous
species by replacement of structural ions often referred to as absorption or isomorphic
substitution.
The effects from competitive sorption are important in environmental systems as
the effects can lead to increased aqueous contaminant concentrations. When metals are
bound by outer-sphere complexes it allows for similar sorbates to compete for sorption
sites whereas inner-sphere complexes are able to resist desorption even at a high ionic
strength of the competing sorbate (Brown and Parks, 2001). This is particularly
important for environmental systems containing arsenate and phosphate, which can lead
to increased aqueous As concentrations, especially with increasing pH (Gao and Mucci,
2001; Dixit and Hering, 2003). Vanadate can also act as a phosphate analogue (Rehder,
1991) so both anions will compete for sorption sites, however V(V) has been shown to
only have a small competitive effect on As(V) uptake by Fe and Al oxides (Jeong et al.,
2007). Other well known sorbates competing with As(V) for sorption sites are
(bi)carbonates and silicates (Appelo et al., 2002; Jeong et al., 2007). Competitive
sorbates for Cu and Ni are likely to be other divalent cations (such as Pb2+ for Cu2+ and
Co2+ for Ni2+) due to preferences for similar sorption sites (Brown and Parks, 2001).
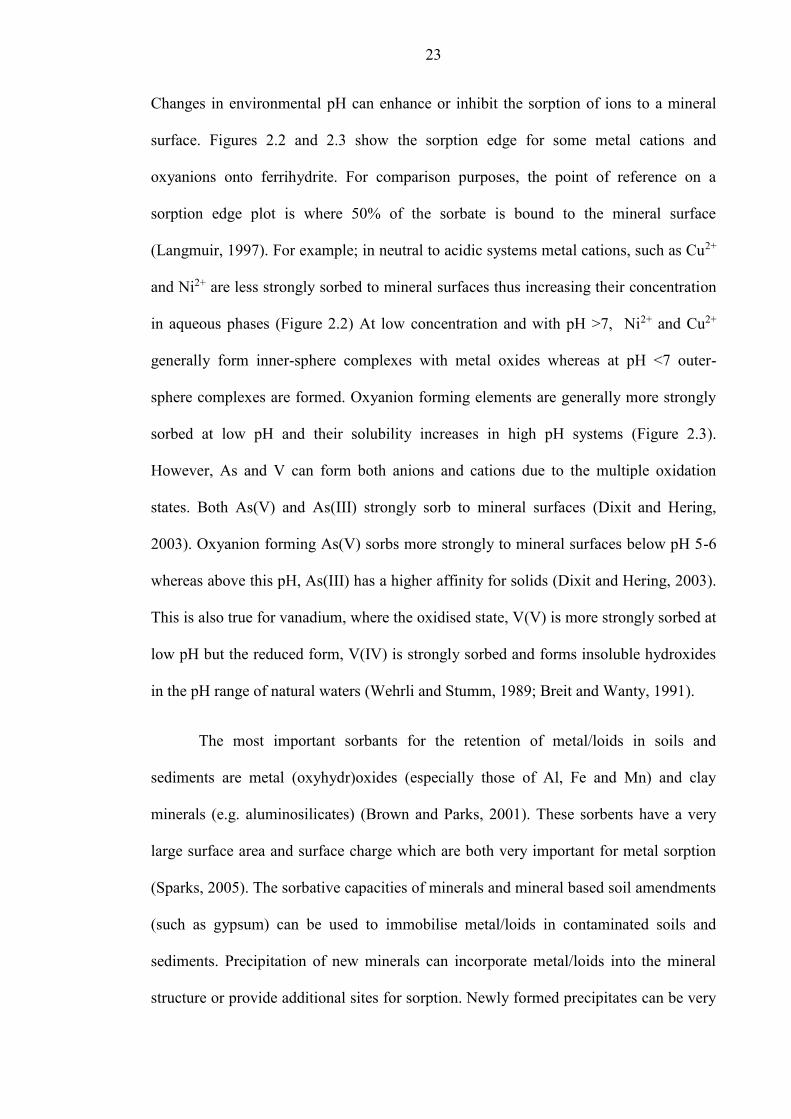
23
Changes in environmental pH can enhance or inhibit the sorption of ions to a mineral
surface. Figures 2.2 and 2.3 show the sorption edge for some metal cations and
oxyanions onto ferrihydrite. For comparison purposes, the point of reference on a
sorption edge plot is where 50% of the sorbate is bound to the mineral surface
(Langmuir, 1997). For example; in neutral to acidic systems metal cations, such as Cu2+
and Ni2+ are less strongly sorbed to mineral surfaces thus increasing their concentration
in aqueous phases (Figure 2.2) At low concentration and with pH >7, Ni2+ and Cu2+
generally form inner-sphere complexes with metal oxides whereas at pH <7 outer-
sphere complexes are formed. Oxyanion forming elements are generally more strongly
sorbed at low pH and their solubility increases in high pH systems (Figure 2.3).
However, As and V can form both anions and cations due to the multiple oxidation
states. Both As(V) and As(III) strongly sorb to mineral surfaces (Dixit and Hering,
2003). Oxyanion forming As(V) sorbs more strongly to mineral surfaces below pH 5-6
whereas above this pH, As(III) has a higher affinity for solids (Dixit and Hering, 2003).
This is also true for vanadium, where the oxidised state, V(V) is more strongly sorbed at
low pH but the reduced form, V(IV) is strongly sorbed and forms insoluble hydroxides
in the pH range of natural waters (Wehrli and Stumm, 1989; Breit and Wanty, 1991).
The most important sorbants for the retention of metal/loids in soils and
sediments are metal (oxyhydr)oxides (especially those of Al, Fe and Mn) and clay
minerals (e.g. aluminosilicates) (Brown and Parks, 2001). These sorbents have a very
large surface area and surface charge which are both very important for metal sorption
(Sparks, 2005). The sorbative capacities of minerals and mineral based soil amendments
(such as gypsum) can be used to immobilise metal/loids in contaminated soils and
sediments. Precipitation of new minerals can incorporate metal/loids into the mineral
structure or provide additional sites for sorption. Newly formed precipitates can be very
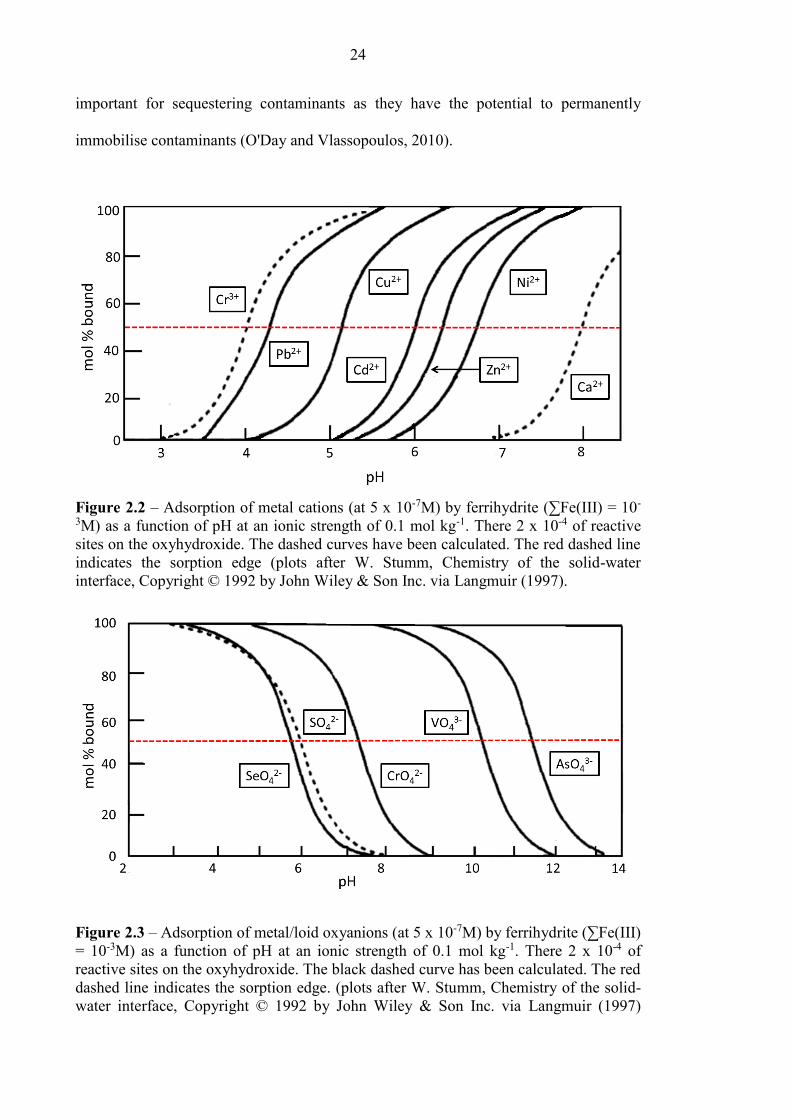
24
important for sequestering contaminants as they have the potential to permanently
immobilise contaminants (O'Day and Vlassopoulos, 2010).
Figure 2.2 – Adsorption of metal cations (at 5 x 10⁻⁷M) by ferrihydrite (∑Fe(III) = 10-
3M) as a function of pH at an ionic strength of 0.1 mol kg-1. There 2 x 10⁻⁴ of reactive
sites on the oxyhydroxide. The dashed curves have been calculated. The red dashed line
indicates the sorption edge (plots after W. Stumm, Chemistry of the solid-water
interface, Copyright © 1992 by John Wiley & Son Inc. via Langmuir (1997).
Figure 2.3 – Adsorption of metal/loid oxyanions (at 5 x 10⁻⁷M) by ferrihydrite (∑Fe(III)
= 10-3M) as a function of pH at an ionic strength of 0.1 mol kg-1. There 2 x 10⁻⁴ of
reactive sites on the oxyhydroxide. The black dashed curve has been calculated. The red
dashed line indicates the sorption edge. (plots after W. Stumm, Chemistry of the solid-
water interface, Copyright © 1992 by John Wiley & Son Inc. via Langmuir (1997)
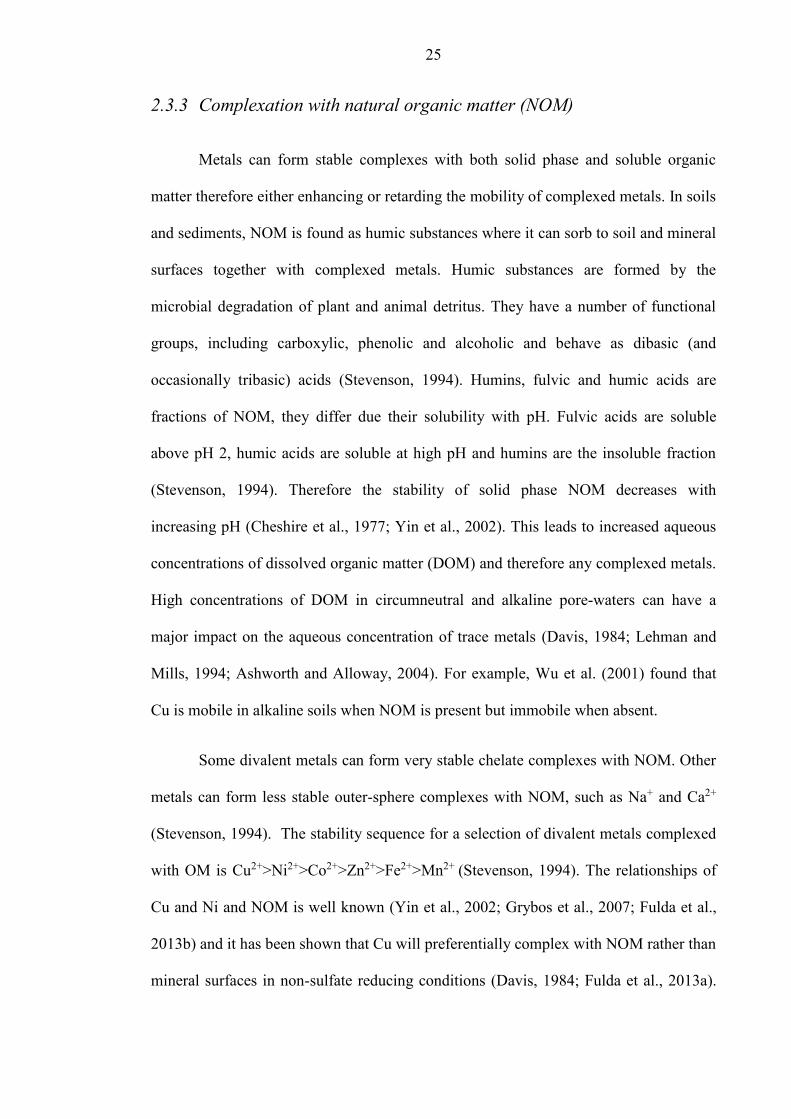
25
2.3.3 Complexation with natural organic matter (NOM)
Metals can form stable complexes with both solid phase and soluble organic
matter therefore either enhancing or retarding the mobility of complexed metals. In soils
and sediments, NOM is found as humic substances where it can sorb to soil and mineral
surfaces together with complexed metals. Humic substances are formed by the
microbial degradation of plant and animal detritus. They have a number of functional
groups, including carboxylic, phenolic and alcoholic and behave as dibasic (and
occasionally tribasic) acids (Stevenson, 1994). Humins, fulvic and humic acids are
fractions of NOM, they differ due their solubility with pH. Fulvic acids are soluble
above pH 2, humic acids are soluble at high pH and humins are the insoluble fraction
(Stevenson, 1994). Therefore the stability of solid phase NOM decreases with
increasing pH (Cheshire et al., 1977; Yin et al., 2002). This leads to increased aqueous
concentrations of dissolved organic matter (DOM) and therefore any complexed metals.
High concentrations of DOM in circumneutral and alkaline pore-waters can have a
major impact on the aqueous concentration of trace metals (Davis, 1984; Lehman and
Mills, 1994; Ashworth and Alloway, 2004). For example, Wu et al. (2001) found that
Cu is mobile in alkaline soils when NOM is present but immobile when absent.
Some divalent metals can form very stable chelate complexes with NOM. Other
metals can form less stable outer-sphere complexes with NOM, such as Na+ and Ca2+
(Stevenson, 1994). The stability sequence for a selection of divalent metals complexed
with OM is Cu2+>Ni2+>Co2+>Zn2+>Fe2+>Mn2+ (Stevenson, 1994). The relationships of
Cu and Ni and NOM is well known (Yin et al., 2002; Grybos et al., 2007; Fulda et al.,
2013b) and it has been shown that Cu will preferentially complex with NOM rather than
mineral surfaces in non-sulfate reducing conditions (Davis, 1984; Fulda et al., 2013a).
26
Sauve et al. (1997) found that nearly all Cu in contaminated soils was complexed with
NOM. Problematic aqueous concentrations of Ni associated with DOM were reported
as being released from soils treated with sewage sludge (Ashworth and Alloway, 2004).
Vanadium and to a lesser extent arsenic are also able to form complexes with
OM. Vanadate can form complexes with OM between pH 7 - 9 (Lu et al., 1998) and can
be reduced by OM to vanadyl as [VO2+] (Szalay and Szilagyi, 1967). Vanadyl is not
thermodynamically stable above pH 7 (Wehrli and Stumm, 1989) but it forms stable
complexes with OM increasing its stability under a wide range of Eh and pH conditions
(Goncalves and Mota, 1987). It has been estimated that between 20 – 80% of V in
natural waters is complexed with DOM depending upon DOM concentrations (Breit and
Wanty, 1991). It has been suggested that As binds to NOM via a cation bridge (such as
Fe) to form a ternary As-M-NOM complex (Bauer and Blodau, 2006; Ritter et al., 2006;
Sharma et al., 2010). These ternary complexes have shown to be important in
mobilising As in iron-rich waters (Bauer and Blodau, 2009).
2.3.4 Biogeochemical Redox processes
An understanding of biological and geochemical redox processes in
contaminated and uncontaminated systems is crucial for predicting the behaviour of
contaminants with respect to their transport and fate into unaffected areas. The direct
biotic and indirect abiotic redox mechanisms of elements such as; C, Fe, Mn, N and S
control the speciation, bioavailability and toxicity of many other trace metal/loids in the
environment (Borch et al., 2010).
27
It is generally accepted that bacterially mediated oxidation of organic matter (the
electron donor) in soils, sediments and natural waters, follows a sequence of terminal-
electron accepting processes (TEAPs). The sequence changes upon increasingly anoxic
conditions which are usually related to depth. Once any O2 in a system has been
exhausted the sequence is followed by the availability of the next terminal electron
acceptor (TEA) which gives the greatest free energy yield to the bacteria. Table 2.3
shows some of the most common redox processes in natural systems. In reality, the
ideal system with well defined biogeochemical zones is an over-simplified one, research
has shown there is a great deal of cross over in the vertical stratification (Postma and
Jakobsen, 1996; Mortimer et al., 2004).
Iron is ubiquitous on the Earth’s surface and is present in the environment as
minerals or in clays for ions to sorb and associate with, complexed with NOM in an
aqueous form or covered with NOM in a solid phase (Kappler, 2005). Fe(III)-
(hydr)oxides form at circumneutral pH and act as highly effective sorbents for many
metal/loids (see section 2.3.2). Fe(III)-(hydr)oxides can be reduced, either biotically (by
dissimilatory iron reducing bacteria (Lovley, 1997) (Table 2.3) or abiotically (via
sulfides (Afonso and Stumm, 1992). The reductive dissolution of Fe(III) minerals can
release sorbates into surrounding pore-waters thus increasing contaminant
concentrations (Zachara et al., 2001; Grybos et al., 2007). Fe(II) formed by the
reduction process can then act as a reductant for other redox sensitive metals, such as
Cu (Matocha et al., 2005) or can be oxidised back to Fe(III) by Fe(II) oxidising bacteria
(Kappler, 2005).
It is thought that the release of As following the reductive dissolution of Fe-
(hydr)oxides might be important in controlling As concentrations in contaminated
aquifers in south-east Asia (Charlet et al., 2011). It is generally agreed that the
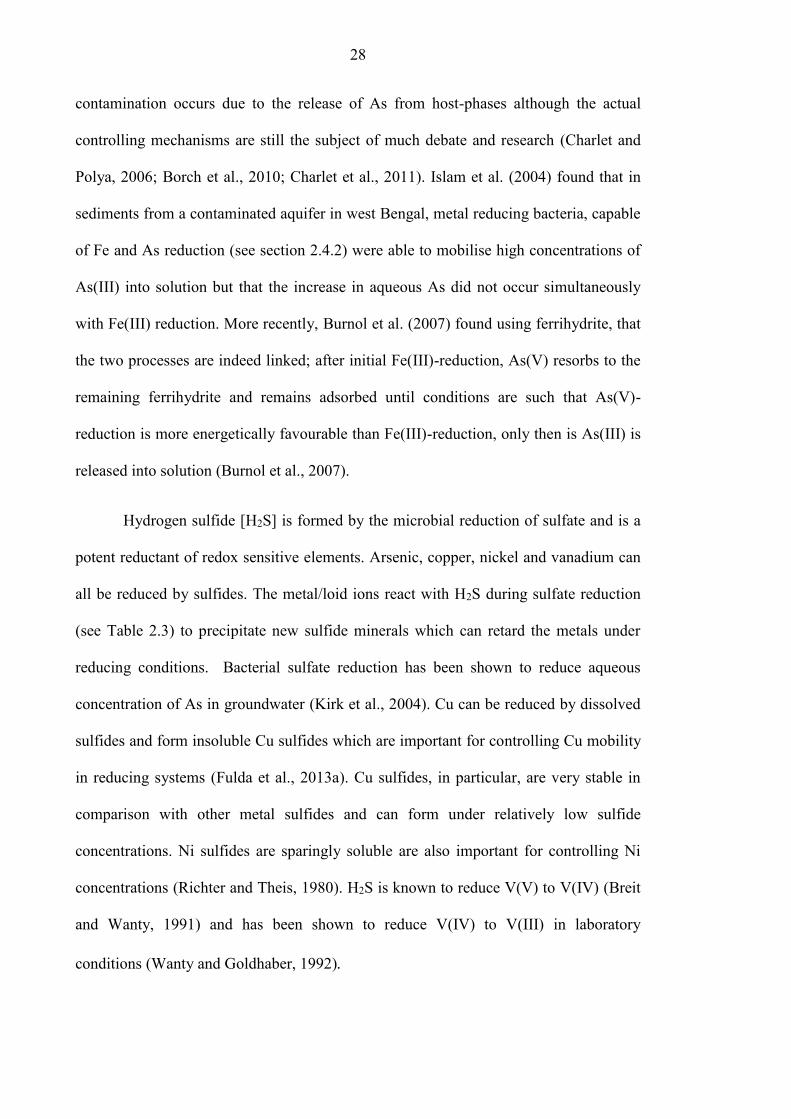
28
contamination occurs due to the release of As from host-phases although the actual
controlling mechanisms are still the subject of much debate and research (Charlet and
Polya, 2006; Borch et al., 2010; Charlet et al., 2011). Islam et al. (2004) found that in
sediments from a contaminated aquifer in west Bengal, metal reducing bacteria, capable
of Fe and As reduction (see section 2.4.2) were able to mobilise high concentrations of
As(III) into solution but that the increase in aqueous As did not occur simultaneously
with Fe(III) reduction. More recently, Burnol et al. (2007) found using ferrihydrite, that
the two processes are indeed linked; after initial Fe(III)-reduction, As(V) resorbs to the
remaining ferrihydrite and remains adsorbed until conditions are such that As(V)-
reduction is more energetically favourable than Fe(III)-reduction, only then is As(III) is
released into solution (Burnol et al., 2007).
Hydrogen sulfide [H2S] is formed by the microbial reduction of sulfate and is a
potent reductant of redox sensitive elements. Arsenic, copper, nickel and vanadium can
all be reduced by sulfides. The metal/loid ions react with H2S during sulfate reduction
(see Table 2.3) to precipitate new sulfide minerals which can retard the metals under
reducing conditions. Bacterial sulfate reduction has been shown to reduce aqueous
concentration of As in groundwater (Kirk et al., 2004). Cu can be reduced by dissolved
sulfides and form insoluble Cu sulfides which are important for controlling Cu mobility
in reducing systems (Fulda et al., 2013a). Cu sulfides, in particular, are very stable in
comparison with other metal sulfides and can form under relatively low sulfide
concentrations. Ni sulfides are sparingly soluble are also important for controlling Ni
concentrations (Richter and Theis, 1980). H2S is known to reduce V(V) to V(IV) (Breit
and Wanty, 1991) and has been shown to reduce V(IV) to V(III) in laboratory
conditions (Wanty and Goldhaber, 1992).
29
Table 2.3 - Environmentally significant microbial half reaction reduction potentials: Standard Reduction Potential, E0, and redox potential, Eh,
at ph 7, 10.5 and 12 (at standard temperature and pressure)
Transformation Reaction E0 (V) Eh @ pH 7 Eh @ pH 10.5 Eh @ pH 12 Assumptions
O2 depletion+ O2 + 4H+ + 4e- = 2H2O 1.23 0.805 0.598 0.510$ PO2 = 0.2 bar
Denitrification+ NO3- + 6H+ + 5e- = ½N2 + 3H2O 1.24 0.713 0.464 0.884$ [NO3
-] = 1 mmol L-1
PN2 = 0.8 bar
Mn reduction+
Mn(III) to Mn(II)
Mn3O4 + 2H+ + 2H2O + 2e- = 3Mn(OH)2 0.480 0.066 -0.140 -0.230$ -
Fe reduction+
Fe(III) to Fe(II)+
Fe(OH)3 + HCO3- + 2H+ + e- = FeCO3 + 3H2O 1.078 - -0.266 -
0.321
0.453$ [HCO3-] = 20 mmol L-1
[HCO3-] = 1 mmol L-1
Fe reduction+
Fe(III) to Fe(II) *
Fe(OH)3 + H+ + e- = Fe(OH)2 +H2O 0.257 -0.157 -0.364 -0.402$ -
Sulfate reduction+
S(VI) to S(-II)
SO42- + 10H+ + 8e- = H2S + 4H2O 0.301 -0.217 -0.476 -0.587$ [SO4
2-] = [H2S]
Bicarbonate reduction to acetate x
C(IV) to C(0)
2HCO3- + 9H+ + 8e- = CH3COO- + 4H2O 0.187 -0.292 -0.525 -0.648$ [HCO3
-] = [CH3COO-]
= 20 mmol L-1
+ after (Langmuir, 1997) $ after (Burke et al., 2012b) x calculated using thermodynamic data from Thauer (1977) via Whittleston et al. (2011) *calculated using thermodynamic data from Stumm and Morgan (1996) via Whittleston et al. (2011)
30
2.4 Soil microorganisms
Soil microorganisms represent a huge fraction of the biomass in soils and
sediments, for example; surface soils contain between 103 to 104 kg of microbial
biomass per hectare (Fierer et al., 2007). Microorganisms have adapted to survive in
nearly every extreme seen on earth; from high temperature in thermal vents (Tunnaclife,
1991) to high pressures of the deep sub-surface (Schippers et al., 2005). More recently,
microorganisms have also adapted to living in areas of anthropogenic pollution such as;
radiation (Fredickson et al., 2004), areas of heavy metal contamination (Whittleston et
al., 2013), and in environments of both very low and very high pH (Baker and Banfield,
2006; Burke et al., 2012).
2.4.1 Alkaliphiles
Alkaliphiles are a variety of extremophile that grow “optimally or very well at
pH values above 9 and often above 10 and 12 but cannot grow or grow very slowly at
near neutral pH” (Horikoshi, 1999). The above definition means that the optimal growth
pH of alkaliphilic bacteria is ~pH 9 whereas neutrophilic bacteria growth rates peak at
pH 7. The main challenge for alkaliphiles is how to maintain a neutral intracellular pH,
when the extracellular pH can be up to 2 pH units higher (Krulwich and Guffanti, 1989;
Horikoshi, 1999). Sturr et al. (1994) report that alkaliphilic Bacillis firmus shows
decreasing growth rates above an external pH of 11 which relates directly to an apparent
decrease in the microbes ability to regulate internal pH. One mechanism for maintaining
internal pH homeostasis by alkaliphiles is by the selective exchange of sodium and
hydronium ions across plasma membranes via a Na+/H+ and K+/H+ antiporter system.
31
Here, Na+ or K+ ions from within the cell are exchanged with external H+ ions, thus
decreasing internal pH (Ito et al., 1997; Horikoshi, 1999).
Alkaliphilic bacteria have been isolated from different types of alkaline
environments; the guts of higher termites, animal manure, indigo fermentation waste,
Mariana trench mud and soda lakes (Shiba et al., 1989; Hind et al., 1999; Horikoshi,
1999; Pollock et al., 2007; Zhilina et al., 2009). Alkaliphilic bacteria isolated from soda
lakes have been capable of using alternative electron acceptors; O2, Fe(III), As(V)
nitrate and fumarate (Oremland et al., 2004; Pollock et al., 2007; Zhilina et al., 2009).
Alkaliphilic bacteria have also been isolated from sites where a hyper alkaline
environment has been created due to industry. Ye et al. (2004) describes a metal
reducing bacteria isolated from a leachate pond formed at the U. S. Borax Company site
in Boron, California, United States. The bacteria show evidence of Fe(III)- reduction
and had an optimum growth pH of 9.5 (Ye et al., 2004). Takai et al. (2001) report on the
isolation of an extremely alkaliphilic bacterium from a deep South African gold mine.
Alkaliphilus transvaalensis has an optimum growth pH of 10 and was capable of growth
at a pH of 12.5 (Takai et al., 2001). Roadcap et al. (2006) report on a variety of
alkaliphilic bacteria found in ground water located in the Lake Calumet area of Illinois,
United States. The area has been used in the past for dumping steel slag where ground
water had become hyper-alkaline due to high pH slag leachates (Roadcap et al., 2006).
2.4.2 Microbial metal/loid reduction
Microbial metal/loid reduction can occur in a range of environments. Some
microorganisms have evolved to survive by incorporating changes in oxidation state of
32
toxic metals (Lloyd, 2003). Under certain conditions, microorganisms can mobilise
toxic metals into the wider environment (Islam et al., 2004) or retard mobility by
reducing metals to a less mobile and less toxic form (Whittleston et al., 2011).
Microbial As reduction has been much studied due to the problems it presents in
contaminated aquifers (as discussed previously). Some microorganisms have adapted to
tolerate high concentrations of As and are able to reduce As(V) to As(III) directly, a
process known as dissimilatory arsenic reduction or to oxidise As(III) to As(V)
(Oremland and Stolz, 2003). As(V) has been shown to be one of the main electron
acceptors at Mono Lake and Searles Lake in California, United States (Zobrist et al.,
2000; Oremland et al., 2000; Oremland et al., 2005). These lakes are extreme
environments with respect to an alkaline pH (pH 9.8) (Lloyd and Oremland, 2006) and
hypersalinity (Mono Lake salinity = 75-90g L-1 whereas Searles Lake is at or near
saturation ~350 gL-1) (Oremland et al., 2000; Hollibaugh et al., 2005; Oremland et al.,
2005).
Microbial reduction of vanadium has not been studied to any great extent but
several V(V) reducing organisms have been identified (Carpentier et al., 2003; Ortiz-
Bernad et al., 2004; van Marwijk et al., 2009). It is thought that the process of V(V)
reduction is not very important in the wider environment due to the relatively low
concentrations of V, with respect to Fe(III) and other electron acceptors (Ortiz-Bernad
et al., 2004). However, V(V) reduction may be an effective way of immobilising mobile
V(V) where V contamination is problematic (Ortiz-Bernad et al., 2004).
33
2.5 Study Sites
2.5.1 Hownsgill Valley, near Consett
The Grove Heaps in the Hownsgill Valley, near Consett were used for slag
tipping for nearly a century until the closure of Consett Steelworks in 1980. At the
height of the steel industry the Consett Steelworks employed over 6000 people and
resulted in the loss of jobs for over 3000 people when it was closed. Since the closure,
the site of the steelworks and tip area (around 290 hectares) have been extensively
landscaped and very little remains today of the former steelworks.
The Hownsgill Valley is a glacial melt water channel, overlying superficial
alluvium above Lower Coal Measures strata (Mayes et al., 2006). To the North of the
site runs the A692, Consett Road and to the South is the Hownsgill Viaduct (see Figure.
2.4). A large leachate pond, approximately 1500 m2 (see Figure 2.5) has formed in the
valley bottom where hyper-alkaline (pH 11-12) leachates have filtered through the slag
heaps via subterranean tip drains. There is no vegetation around the leachate pond due
to the high pH and an area of calcite has formed around the pond. Calcite precipitation
rates at the site, have been estimated at between 0.4 and 15 g m-2 day-1 (Mayes et al.,
2006). Downstream of the leachate pond the vegetation gradually becomes more dense,
with reeds, rushes and grasses. The heaps are approximately 45 m in depth and consist
of both blast bottom furnace and steel slag (see Table 2.4 for typical composition).
Buffering of the slag leachate across the natural wetland area is described by
Mayes et al. (2006). The pH of the water upstream of the leachate flow was between pH
6.6 and 8.7 and changed dramatically at the confluence with the slag leachate when pH
increased to between 11.5 and 12.5. High pH determinations were also concomitant
with high electrical conductivity (EC) readings (between 1164 and 3747 µS cm-1).
34
Progressive lowering of pH and EC occurred downstream of the leachate source across
the wetland area. Calcite precipitation occurs across the wetland area, with peak
precipitation rates around the leachate source and pond (Mayes et al., 2006).
Hydrochemistry of the slag leachate and sediment composition was also described by
Mayes et al. (2008). Major ions and trace elements from the Grove Heap leachate are
shown in Table 2.5 and sediment composition in Table 2.6.
Table 2.4 – Typical slag analyses from the former Consett Steelworks (adapted from
Sheffield (1996) via Mayes et al. (2008)). All values as % content by mass.
CaO SiO2 Al2O3 MgO FeO MnO P2O5 S
Consett blast
furnace slag 41.7 33.6 15.2 5.8 0.4 0.4 - 1.63
Consett steel
slag 38.0 8.8 0.8 8.4 40.5 6.0 1.4 -
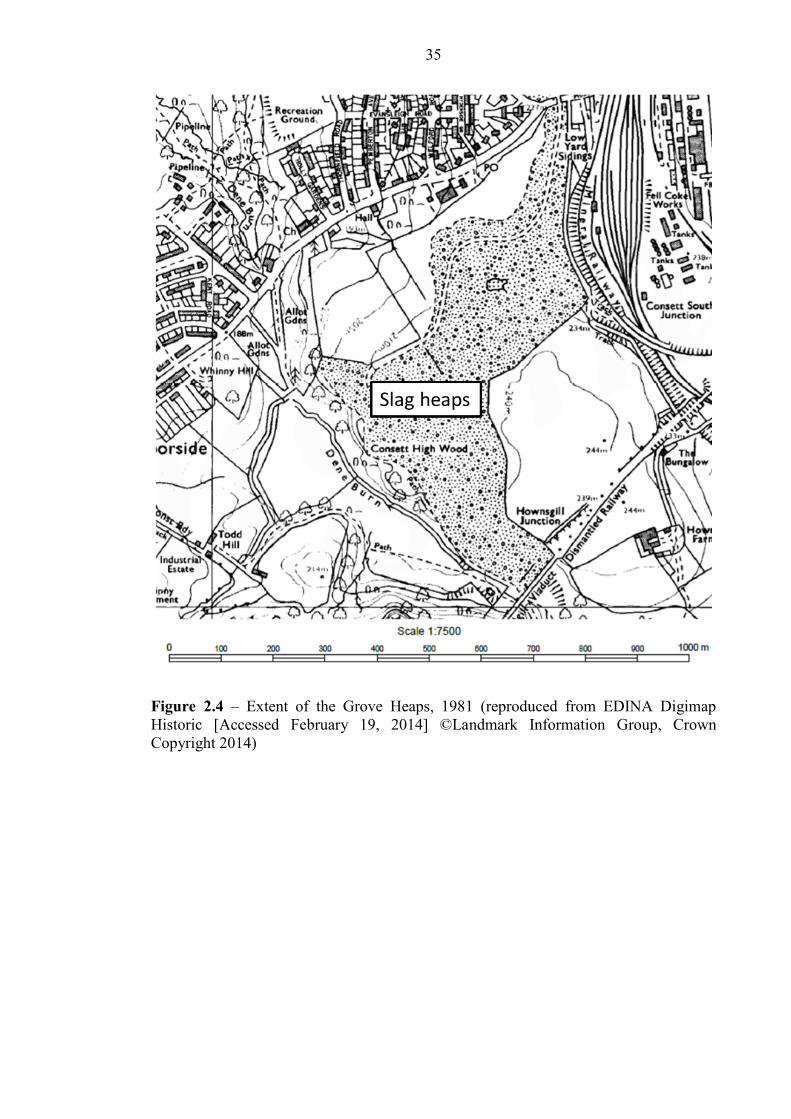
35
Figure 2.4 – Extent of the Grove Heaps, 1981 (reproduced from EDINA Digimap
Historic [Accessed February 19, 2014] ©Landmark Information Group, Crown
Copyright 2014)
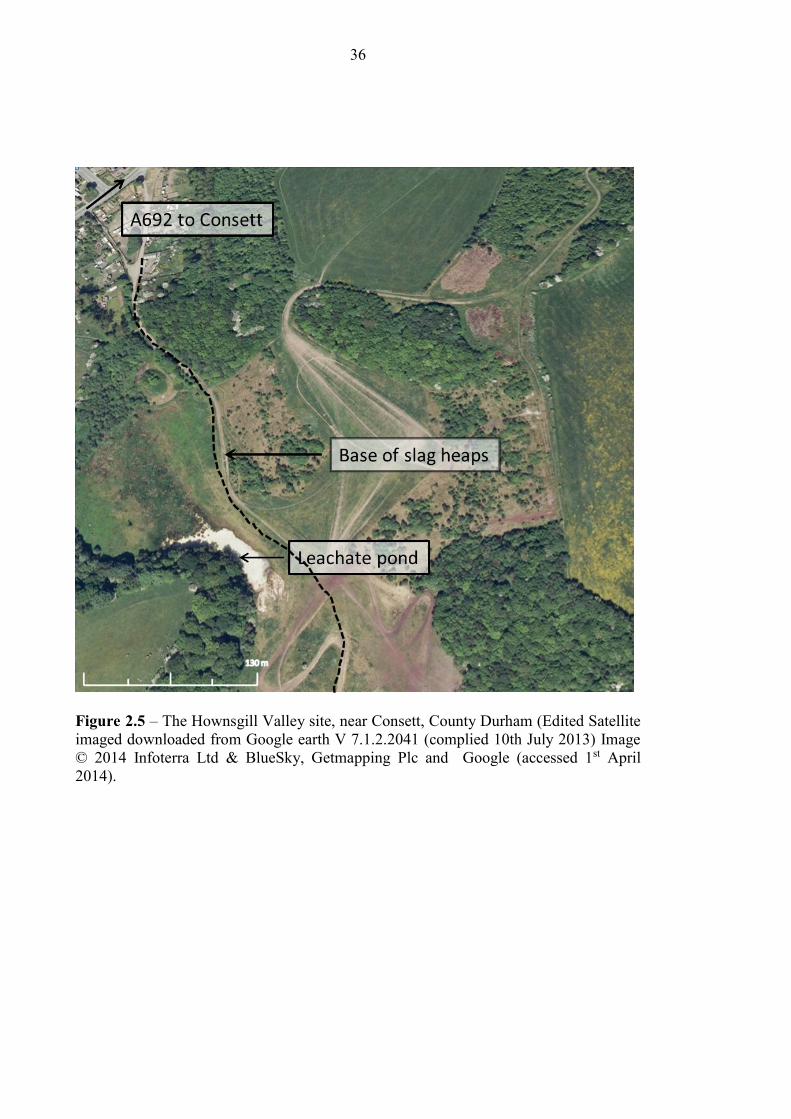
36
Figure 2.5 – The Hownsgill Valley site, near Consett, County Durham (Edited Satellite
imaged downloaded from Google earth V 7.1.2.2041 (complied 10th July 2013) Image
© 2014 Infoterra Ltd & BlueSky, Getmapping Plc and Google (accessed 1st April
2014).
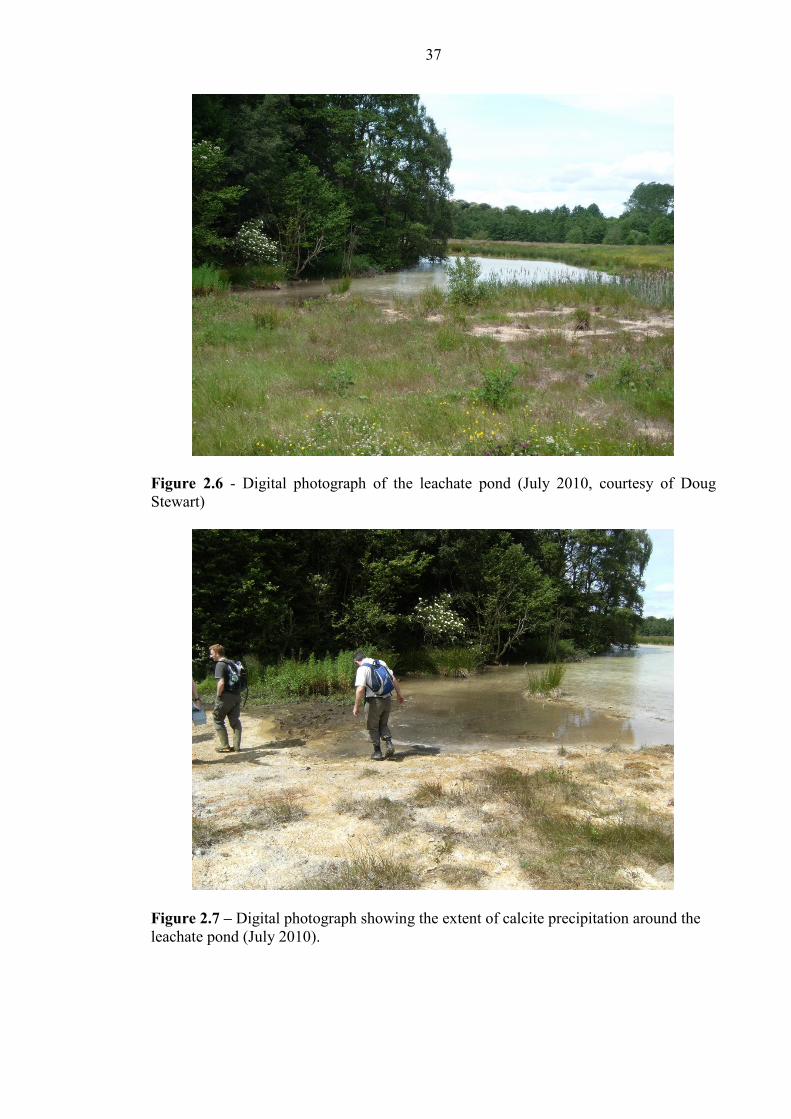
37
Figure 2.6 - Digital photograph of the leachate pond (July 2010, courtesy of Doug
Stewart)
Figure 2.7 – Digital photograph showing the extent of calcite precipitation around the
leachate pond (July 2010).
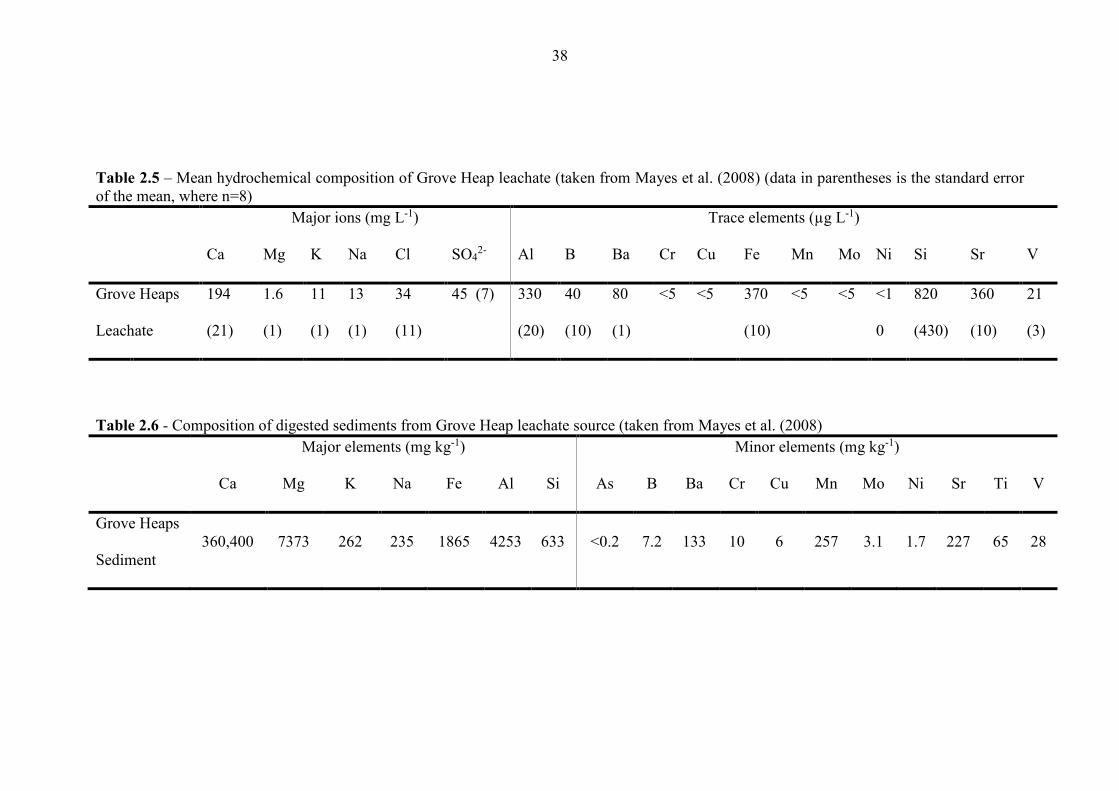
38
Table 2.5 – Mean hydrochemical composition of Grove Heap leachate (taken from Mayes et al. (2008) (data in parentheses is the standard error
of the mean, where n=8)
Major ions (mg L-1) Trace elements (µg L-1)
Ca Mg K Na Cl SO42- Al B Ba Cr Cu Fe Mn Mo Ni Si Sr V
Grove Heaps
Leachate
194
(21)
1.6
(1)
11
(1)
13
(1)
34
(11)
45 (7) 330
(20)
40
(10)
80
(1)
<5 <5 370
(10)
<5 <5 <1
0
820
(430)
360
(10)
21
(3)
Table 2.6 - Composition of digested sediments from Grove Heap leachate source (taken from Mayes et al. (2008)
Major elements (mg kg-1) Minor elements (mg kg-1)
Ca Mg K Na Fe Al Si As B Ba Cr Cu Mn Mo Ni Sr Ti V
Grove Heaps
Sediment
360,400 7373 262 235 1865 4253 633 <0.2 7.2 133 10 6 257 3.1 1.7 227 65 28
39
2.7.2 Ajka, Vesprém County, western Hungary
On the 4th October 2010, the failure of the north-western corner of Cell X of the
Ajkai Timfoldgyar Zrt alumina plant red mud repository caused the release of ~1
million m3 of caustic red mud suspension down the Torna and Upper Marcal valleys
near Ajka, western Hungary. A red mud release of this magnitude was unprecedented,
the waste inundated homes causing 10 deaths and around 150 serious injuries (Adam et
al., 2011a). An estimated 40 km2 of low lying agricultural and riparian wetlands were
affected and red mud was transported over 120 km downstream eventually reaching the
Danube (Reeves et al., 2011).
The alumina plant is situated to the south-west of the town of Ajka, in Vesprém
County. The affected area is characterised by a shallow valley where the Torna Creek
flows in a westerly direction. The most severely impacted villages were Kolontár (1 km
from the breach), Devecser (5 km from the breach) and Somlóvásàrhely (10 km from
the breach) (Reeves et al., 2011). Figure 2.8 shows the extent of the red mud release
down the Torna and Upper Marcel valleys.
The Kolontár Report commissioned by the Hungarian authorities following the
disaster, states a combination of several factors leading to the failure of the dam and
how the impact of the failure significantly exceeded those in the disaster management
plan (Adam et al., 2011a). It is clear from the report that there was not one single cause
for the disaster but many failings over several levels of plant management and the
competent authorities. Some of the contributing factors are briefly summarised below:
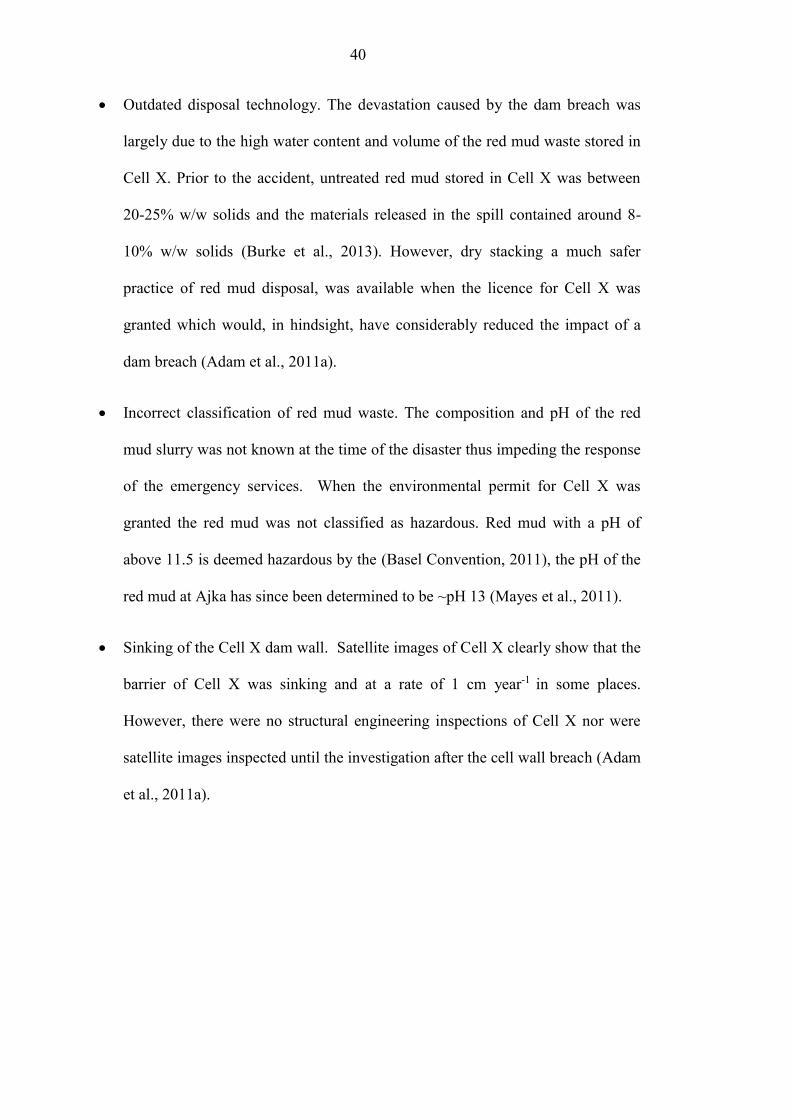
40
Outdated disposal technology. The devastation caused by the dam breach was
largely due to the high water content and volume of the red mud waste stored in
Cell X. Prior to the accident, untreated red mud stored in Cell X was between
20-25% w/w solids and the materials released in the spill contained around 8-
10% w/w solids (Burke et al., 2013). However, dry stacking a much safer
practice of red mud disposal, was available when the licence for Cell X was
granted which would, in hindsight, have considerably reduced the impact of a
dam breach (Adam et al., 2011a).
Incorrect classification of red mud waste. The composition and pH of the red
mud slurry was not known at the time of the disaster thus impeding the response
of the emergency services. When the environmental permit for Cell X was
granted the red mud was not classified as hazardous. Red mud with a pH of
above 11.5 is deemed hazardous by the (Basel Convention, 2011), the pH of the
red mud at Ajka has since been determined to be ~pH 13 (Mayes et al., 2011).
Sinking of the Cell X dam wall. Satellite images of Cell X clearly show that the
barrier of Cell X was sinking and at a rate of 1 cm year-1 in some places.
However, there were no structural engineering inspections of Cell X nor were
satellite images inspected until the investigation after the cell wall breach (Adam
et al., 2011a).
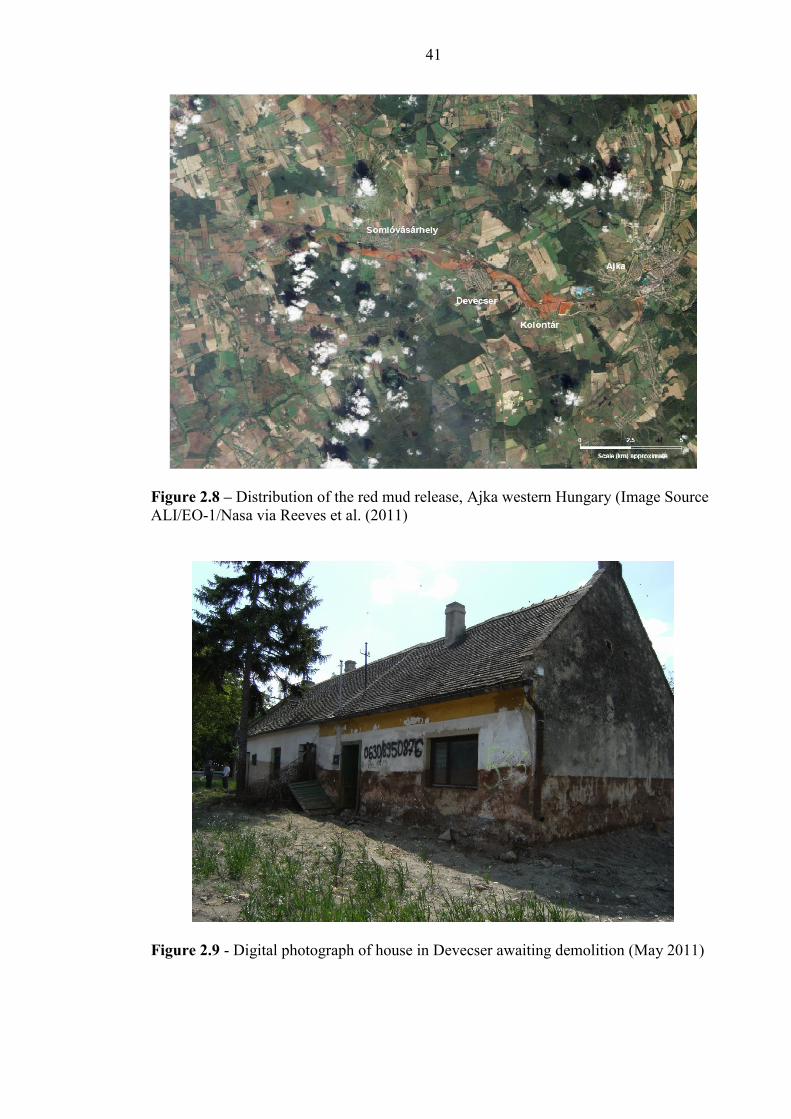
41
Figure 2.8 – Distribution of the red mud release, Ajka western Hungary (Image Source
ALI/EO-1/Nasa via Reeves et al. (2011)
Figure 2.9 - Digital photograph of house in Devecser awaiting demolition (May 2011)
42
Emergency environmental procedures began almost immediately following the
spill. Calcium and magnesium nitrates, gypsum and acids (acetic and sulfuric) were
deployed in the affected rivers to reduce pH and prevent red mud pollution reaching the
Danube (Adam et al., 2011a; Reeves et al., 2011; Nagy et al., 2013). The addition of
gypsum to alkaline solutions provides free aqueous Ca2+ promoting the precipitation of
calcite (in the presence of CO2), which consumes hydroxyl ions thus reducing pH (see
Equations 2.6 and 2.7 above) (Renforth et al., 2012). Precipitated calcite may also
provide additional sorption sites for the uptake of red mud contaminants (Burke et al.,
2013). The effectiveness of gypsum in the remediation effort has been investigated
(Renforth et al., 2012; Burke et al., 2013). Renforth et al. (2012) noted a modest uptake
of As, Cr and Mn on secondary carbonate deposits found downstream of the spill. A
detailed investigation of the neutralization of red mud leachates found that gypsum
precipitation removed a significant proportion (>80%) of both Al and As from red mud
leachates but that very little V was removed from solution in the neutralization process
(Burke et al., 2013).
Shortly after the spill, Mayes et al. (2011) sought to identify the extent of the
spill within the affected river systems. They found that the geochemical signature of the
red mud was apparent throughout the Marcal river system with elevated aqueous
concentrations of As and V (> 50 µg L-1) in the Torna Creek and Upper Marcal (Mayes
et al., 2011). High concentrations of As, Cr, Ni and V were found in fluvial sediments,
however, sequential extraction data suggested that the bulk of these elements were
associated with residual phases (Mayes et al., 2011). Another area of concern following
the spill was of fine red mud dust being emitted into the atmosphere and the effects of
inhalation of these alkaline dusts. Studies showed that inhalation was unlikely to affect
the lungs but that the resuspension of red mud dust may cause irritation in the upper
43
respiratory tract and eyes (Gelencser et al., 2011). In order to prevent any complications
from the inhalation of red mud dust and to lessen effects to soil, removal of thick red
mud deposits (>5cm) commenced a few weeks after the spill whereas thin red mud
deposits (<5cm) were ploughed into soils (Klebercz et al., 2012). The average thickness
of red mud on soil surfaces was 5-10 cm (min. = 3 cm max = 45cm) (Rekasi et al.,
2013). There have since been several studies investigating the effects of red mud
addition to soils. The main risks associated with red mud addition to agricultural soils
and toxicity to plants was the increased concentrations of Na+ and alkalinity, especially
over a 5% red mud addition (Ruyters et al., 2011; Anton et al., 2012; Gruiz, 2012).
Red mud addition to soil was also found to cause changes in characteristic such
as; changes in particle size, increased pH and solubility of DOC (Anton et al., 2012;
Rekasi et al., 2013). An increase in toxic and potentially toxic elements such as Al, As,
Co, Cr, Cu, Ni, Mo, Pb and Zn was also observed (Anton et al., 2012; Milacic et al.,
2012; Rekasi et al., 2013). Other studies have indicated that red mud could act as a
mobile source of V (Burke et al., 2012a).
It is worth noting that all of the studies mentioned above justify the expensive
remediation efforts employed by the Hungarian authorities in removing red mud from
affected land. Follow up studies, assessing the water quality of the Marcal river before
and after the Ajka red mud spill found higher concentrations of As and Ni, two years
after the spill when compared to pre-spill conditions (Nagy et al., 2013).
44
2.8 References
ADAM, J., BANVOLGYI, G., DURA, G., GRENERCZY, G., GUBECK, N., GUPTER, I.,
SIMON, G., SZEGFALVI, Z., SZEKACS, A., SZEPVOLGYI, J. & UJLAKY, E. 2011. The
Kolontar report: Causes and Lessons from the Red Mud Disaster. In: B, J. (ed.). Budapest:
Sustainable Development Committee of the Hungarian Parliament.
AFONSO, M. D. & STUMM, W. 1992. Reductive Dissolution of Iron(III) (Hydr)oxides by
Hydrogen Sulfide. Langmuir, 8, 1671-1675.
ANTON, A., REKASI, M., UZINGER, N., SZEPLABI, G. & MAKO, A. 2012. Modelling the
Potential Effects of the Hungarian Red Mud Disaster on Soil Properties. Water Air and Soil
Pollution, 223, 5175-5188.
APPELO, C. A. J., VAN DER WEIDEN, M. J. J., TOURNASSAT, C. & CHARLET, L. 2002.
Surface Complexation of Ferrous Iron on Ferrihydrite and the Mobilization of Arsenic.
Environmental Science & Technology, 36 3096-3103.
ASHWORTH, D. J. & ALLOWAY, B. J. 2004. Soil mobility of sewage sludge-derived
dissolved organic matter, copper, nickel and zinc. Environmental Pollution, 127, 137-144.
BAKER, B. J. & BANFIELD, J. F. 2006. Microbial Communities and Acid Mine Drainage.
FEMS Microbiology Ecology, 44(2), 139-152.
BARCELOUX, D. G. 1999a. Copper. Journal of Toxicology-Clinical Toxicology, 37, 217-230.
BARCELOUX, D. G. 1999b. Nickel. Journal of Toxicology-Clinical Toxicology, 37, 239-258.
BARCELOUX, D. G. 1999c. Vanadium. Journal of Toxicology-Clinical Toxicology, 37, 265-
278.
BASEL CONVENTION 2011. Basel Convention on the control of transboundary movements
of hazardous waste and their disposal. In: UNITED NATIONS ENVIRONMENT
PROGRAMME (ed.) Annex IX. Switzerland: Secretariat of the Basel Convention,.
BAUER, M. & BLODAU, C. 2006. Mobilization of arsenic by dissolved organic matter from
iron oxides, soils and sediments. Science of the Total Environment, 354, 179-190.
BAUER, M. & BLODAU, C. 2009. Arsenic distribution in the dissolved, colloidal and
particulate size fraction of experimental solutions rich in dissolved organic matter and ferric
iron. Geochimica Et Cosmochimica Acta, 73, 529-542.
BAYLESS, E. R. & SCHULZ, M. S. 2003. Mineral precipitation and dissolution at two slag-
disposal sites in northwestern Indiana, USA. Environmental Geology, 45, 252-261.
BONENFANT, D., KHAROUNE, L., SAUVE, S., HAUSLER, R., NIQUETTE, P.,
MIMEAULT, M. & KHAROUNE, M. 2008. CO2 Sequestration Potential of Steel Slags at
Ambient Pressure and Temperature. Industrial & Engineering Chemistry Research, 47, 7610-
7616.
45
BORCH, T., KRETZSCHMAR, R., KAPPLER, A., VAN CAPPELLEN, P., GINDER-VOGEL,
M., VOEGELIN, A. & CAMPBELL, K. 2010. Biogeochemical Redox Processes and their
Impact on Contaminant Dynamics. Environmental Science & Technology, 44, 15-23.
BREIT, G. N. & WANTY, R. B. 1991. VANADIUM ACCUMULATION IN
CARBONACEOUS ROCKS - A REVIEW OF GEOCHEMICAL CONTROLS DURING
DEPOSITION AND DIAGENESIS. Chemical Geology, 91, 83-97.
BREMNER, I. 1998. Manifestations of copper excess. American Journal of Clinical Nutrition,
67, 1069S-1073S.
BROWN, G. E., FOSTER, A. L. & OSTERGREN, J. D. 1999. Mineral surfaces and
bioavailabity of heavy metals: A molecular-scale perspective. National Academy of Scienes
colloquium on Geology, Mineralogy, and Human Welfare. Irvine, California, U. S.: National
Academy of Sciences.
BROWN, G. E. & PARKS, G. A. 2001. Sorption of trace elements on mineral surfaces: Modern
perspectives from spectroscopic studies, and comments on sorption in the marine environment.
International Geology Review, 43, 963-1073.
BURKE, I. T., MAYES, W. M., PEACOCK, C. L., BROWN, A. P., JARVIS, A. P. & GRUIZ,
K. 2012a. Speciation of arsenic, chromium, and vanadium in red mud samples from the ajka
spill site, hungary. Environmental Science & Technology, 46, 3085-92.
BURKE, I. T., MORTIMER, R. J. G., PALANIYANDI, S., WHITTLESTON, R. A.,
LOCKWOOD, C. L., ASHLEY, D. J. & STEWART, D. I. 2012b. Biogeochemical Reduction
Processes in a Hyper-Alkaline Leachate Affected Soil Profile. Geomicrobiology Journal, 29,
769-779.
BURKE, I. T., PEACOCK, C. L., LOCKWOOD, C. L., STEWART, D. I., MORTIMER, R. J.
G., WARD, M. B., RENFORTH, P., GRUIZ, K. & MAYES, W. M. 2013. Behavior of
Aluminum, Arsenic, and Vanadium during the Neutralization of Red Mud Leachate by HCl,
Gypsum, or Seawater. Environmental Science & Technology, 47, 6527-6535.
BURNOL, A., GARRIDO, F., BARANGER, P., JOULIAN, C., DICTOR, M.-C., BODENAN,
F., MORIN, G. & CHARLET, L. 2007. Decoupling of arsenic and iron release from ferrihydrite
suspension under reducing conditions: a biogeochemical model. Geochemical Transactions, 8.
CARPENTIER, W., SANDRA, K., DE SMET, I., BRIGE, A., DE SMET, L. & VAN
BEEUMEN, J. 2003. Microbial reduction and precipitation of vanadium by Shewanella
oneidensis. Applied and Environmental Microbiology, 69, 3636-3639.
CASTALDI, P., SILVETTI, M., GARAU, G. & DEIANA, S. 2010. Influence of the pH on the
accumulation of phosphate by red mud (a bauxite ore processing waste). Journal of Hazardous
Materials, 182, 266-272.
CEMPEL, M. & NIKEL, G. 2006. Nickel: A Review of Its Sources and Environmental
Toxicology. Polish Journal of Environmental Studies, 15, 375-382.
46
CHARLET, L., MORIN, G., ROSE, J., WANG, Y. H., AUFFAN, M., BURNOL, A. &
FERNANDEZ-MARTINEZ, A. 2011. Reactivity at (nano)particle-water interfaces, redox
processes, and arsenic transport in the environment. Comptes Rendus Geoscience, 343, 123-139.
CHARLET, L. & POLYA, D. A. 2006. Arsenic in shallow, reducing groundwaters in southern
Asia: An environmental health disaster. Elements, 2, 91-96.
CHAURAND, P., ROSE, J., BRIOIS, V., OLIVI, L., HAZEMANN, J. L., PROUX, O.,
DOMAS, J. & BOTTERO, J. Y. 2007. Environmental impacts of steel slag reused in road
construction: A crystallographic and molecular (XANES) approach. Journal of Hazardous
Materials, 139, 537-542.
CHESHIRE, M. V., BERROW, M. L., GOODMAN, B. A. & MUNDIE, C. M. 1977. METAL
DISTRIBUTION AND NATURE OF SOME CU, MN AND V COMPLEXES IN HUMIC
AND FULVIC-ACID FRACTIONS OF SOIL ORGANIC-MATTER. Geochimica Et
Cosmochimica Acta, 41, 1131-1138.
CORNELIS, G., JOHNSON, C. A., VAN GERVEN, T. & VANDECASTEELE, C. 2008.
Leaching mechanisms of oxyanionic metalloid and metal species in alkaline solid wastes: A
review. Applied Geochemistry, 23, 955-976.
CZOP, M., MOTYKA, J., SRACEK, O. & SZUWARZYNSKI, M. 2011. Geochemistry of the
Hyperalkaline Gorka Pit Lake (pH > 13) in the Chrzanow Region, Southern Poland. Water Air
and Soil Pollution, 214, 423-434.
DAVIS, J. A. 1984. Complexation of trace metals by adsorbed natural organic matter.
Geochimica Et Cosmochimica Acta, 48, 679-691.
DEAKIN, D., WEST, L. J., STEWART, D. I. & YARDLEY, B. W. D. 2001. Leaching
behaviour of a chromium smelter waste heap. Waste Management, 21, 265-270.
DIXIT, S. & HERING, J. G. 2003. Comparison of arsenic(V) and arsenic(III) sorption onto iron
oxide minerals: Implications for arsenic mobility. Environmental Science & Technology, 37,
4182-4189.
FEIGL, V., ANTON, A., UZIGNER, N. & GRUIZ, K. 2012. Red Mud as a Chemical Stabilizer
for Soil Contaminated with Toxic Metals. Water Air and Soil Pollution, 223, 1237-1247.
FIERER, N., BREITBART, M., NULTON, J., SALAMON, P., LOZUPONE, C., JONES, R.,
ROBESON, M., EDWARDS, R. A., FELTS, B., RAYHAWK, S., KNIGHT, R., ROHWER, F.
& JACKSON, R. B. 2007. Metagenomic and small-subunit rRNA analyses reveal the genetic
diversity of bacteria, archaea, fungi, and viruses in soil. Applied and Environmental
Microbiology, 73, 7059-7066.
FLEMMING, C. A. & TREVORS, J. T. 1989. COPPER TOXICITY AND CHEMISTRY IN
THE ENVIRONMENT - A REVIEW. Water Air and Soil Pollution, 44, 143-158.
FRANK, A., MADEJ, A., GALGAN, V. & PETERSSON, L. R. 1996. Vanadium poisoning of
cattle with basic slag. Concentrations in tissues from poisoned animals and from a reference,
slaughterhouse material. Science of the Total Environment, 181, 73-92.
47
FREDRICKSON, J. K., ZACHARA, J. M., BALKWILL, D. L., KENNEDY, D., LI, S. W.,
KOSTANDARITHES, H. M., DALY, M. J., ROMAINE, M. F., BROCKMAN, F. J. 2004.
Geomicrobiology of high-level nuclear waste- contaminated vadose sediments at the Hanford
site, Washington State. Applied and Environmental Microbiology, 70(7), 4230-4241.
FRIESL, W., HORAK, O. & WENZEL, W. W. 2004. Immobilization of heavy metals in soils
by the application of bauxite residues: pot experiments under field conditions. Journal of Plant
Nutrition and Soil Science-Zeitschrift Fur Pflanzenernahrung Und Bodenkunde, 167, 54-59.
FULDA, B., VOEGELIN, A., EHLERT, K. & KRETZSCHMAR, R. 2013a. Redox
transformation, solid phase speciation and solution dynamics of copper during soil reduction
and reoxidation as affected by sulfate availability. Geochimica Et Cosmochimica Acta, 123,
385-402.
FULDA, B., VOEGELIN, A., MAURER, F., CHRISTL, I. & KRETZSCHMAR, R. 2013b.
Copper Redox Transformation and Complexation by Reduced and Oxidized Soil Humic Acid. 1.
X-ray Absorption Spectroscopy Study. Environmental Science & Technology, 47, 10903-10911.
GAMALETSOS, P., GODELITSAS, A., MERTZIMEKIS, T. J., GOTTLICHER, J.,
STEININGER, R., XANTHOS, S., BERNDT, J., KLEMME, S., KUZMIN, A. & BARDOSSY,
G. 2011. Thorium partitioning in Greek industrial bauxite investigated by synchrotron radiation
and laser-ablation techniques. Nuclear Instruments and Methods in Physics Research B, 269,
3067-3073.
GAO, Y. & MUCCI, A. 2001. Acid base reactions, phosphate and arsenate complexation and
their competitive adsorption at the surface of goethite in 0.7 M NaCl solution. Geochimica Et
Cosmochimica Acta, 65, 2361-2378.
GARAU, G., SILVETTI, M., DEIANA, S., DEIANA, P. & CASTALDI, P. 2011. Long-term
influence of red mud on As mobility and soil physico-chemical and microbial parameters in a
polluted sub-acidic soil. Journal of Hazardous Materials, 185, 1241-1248.
GEISELER, J. 1996. Use of steelworks slag in Europe. Waste Management, 16, 59-63.
GELENCSER, A., KOVATS, N., TUROCZI, B., ROSTASI, A., HOFFER, A., IMRE, K.,
NYIRO-KOSA, I., CSAKBERENYI-MALASICS, D., TOTH, A., CZITROVSZKY, A., NAGY,
A., NAGY, S., ACS, A., KOVACS, A., FERINCZ, A., HARTYANI, Z. & POSFAI, M. 2011.
The Red Mud Accident in Ajka (Hungary): Characterization and Potential Health Effects of
Fugitive Dust. Environmental Science & Technology, 45, 1608-1615.
GONCALVES, M. L. S. & MOTA, A. M. 1987. Complexes of vanadyl and uranyl ions with
chealting groups of humic matter. Talanta, 34, 839-847.
GRAFE, M. & KLAUBER, C. 2011. Bauxite residue issues: IV. Old obstacles and new
pathways for in situ residue bioremediation. Hydrometallurgy, 108, 46-59.
GRAFE, M., POWER, G. & KLAUBER, C. 2011. Bauxite residue issues: III. Alkalinity and
associated chemistry. Hydrometallurgy, 108, 60-79.
GRUIZ, K., FEIGL, V., KLEBERCZ, O., ANTON, A., AND VASZITA, E. Environmental
Risk Assessment of Red Mud Contaminated Land in Hungary. Geocongress 2012: State of the
48
Art and Practice in Geotechnical Engineering, 2012. American Society of Civil Engineers,
4156-4165.
GRYBOS, M., DAVRANCHE, M., GRUAU, G. & PETITJEAN, P. 2007. Is trace metal release
in wetland soils controlled by organic matter mobility or Fe-oxyhydroxides reduction? Journal
of Colloid and Interface Science, 314, 490-501.
GUPTA, V. K., GUPTA, M. & SHARMA, S. 2001. Process development for the removal of
lead and chromium from aqueous solutions using red mud - an aluminium industry waste. Water
Research, 35, 1125-1134.
HAYNES, R. J., BELYAEVA, O. N. & KINGSTON, G. 2013. Evaluation of industrial wastes
as sources of fertilizer silicon using chemical extractions and plant uptake. Journal of Plant
Nutrition and Soil Science, 176, 238-248.
HIND, A. R., BHARGAVA, S. K. & GROCOTT, S. C. 1999. The surface chemistry of Bayer
process solids: a review. Colloids and Surfaces a-Physicochemical and Engineering Aspects,
146, 359-374.
HOLLIBAUGH, J. T., CARINI, S., GURLEYUK, H., JELLISON, R., JOYE, S. B., LECLEIR,
G., MEILE, C., VASQUEZ, L. & WALLSCHLAGER, D. 2005. Arsenic speciation in Mono
lake, California: Response to seasonal stratification and anoxia. Geochimica Et Cosmochimica
Acta, 69, 1925-1937.
HORIKOSHI, K. 1999. Alkaliphiles: Some applications of their products for biotechnology.
Microbiology and Molecular Biology Reviews, 63, 735-+.
ISLAM, F. S., GAULT, A. G., BOOTHMAN, C., POLYA, D. A., CHARNOCK, J. M.,
CHATTERJEE, D. & LLOYD, J. R. 2004. Role of metal-reducing bacteria in arsenic release
from Bengal delta sediments. Nature, 430, 68-71.
ITO, M., GUFFANTI, A. A., ZEMSKY, J., IVEY, D. M. & KRULWICH, T. A. 1997. Role of
the nhaC-encoded Na+/H+ antiporter of alkaliphilic Bacillus firmus OF4. Journal of
Bacteriology, 179, 3851-3857.
JEONG, Y., MAOHONG, F., VAN LEEUWEN, J. & BELCZYK, J. F. 2007. Effect of
competing solutes on arsenic(V) adsorption using iron and aluminium oxides. Journal of
Environmental Sciences, 19, 910-919.
JONES, B. E., GRANT, W. D., DUCKWORTH, A. W. & OWENSON, G. G. 1998. Microbial
diversity of soda lakes. Extremophiles, 2, 191-200.
KAPPLER, A. A. S., K. L. 2005. Geomicrobiological Cycling of Iron. In: BANFIELD, J. F.,
CERVINI-SILVA, J., NEALSON, K. H (ed.) Molecular Geomicrobiology. Chantilly, Virginia:
The Mineralogical Society of America.
KIRK, M. F., HOLM, T. R., PARK, J., JIN, Q. S., SANFORD, R. A., FOUKE, B. W. &
BETHKE, C. M. 2004. Bacterial sulfate reduction limits natural arsenic contamination in
groundwater. Geology, 32, 953-956.
KLAUBER, C., GRAFE, M. & POWER, G. 2011. Bauxite residue issue: II. options for residue
utilization. Hydrometallurgy, 108, 11-32.
49
KLEBERCZ, O., MAYES, W. M., ANTON, A. D., FEIGL, V., JARVIS, A. P. & GRUIZ, K.
2012. Ecotoxicity of fluvial sediments downstream of the Ajka red mud spill, Hungary. Journal
of environmental monitoring : JEM, 14, 2063-71.
KRULWICH, T. A. & GUFFANTI, A. A. 1989. ALKALOPHILIC BACTERIA. Annual
Review of Microbiology, 43, 435-463.
LANGMUIR, D. 1997. Aqueous environmental geochemistry, Upper Saddle River, N. J.,
Prentice Hall.
LANZEN, A., SIMACHEW, A., GESSESSE, A., CHMOLOWSKA, D., JONASSEN, I. &
OVREAS, L. 2013. Surprising Prokaryotic and Eukaryotic Diversity, Community Structure and
Biogeography of Ethiopian Soda Lakes. Plos One, 8.
LEHMAN, R. M. & MILLS, A. L. 1994. FIELD EVIDENCE FOR COPPER MOBILIZATION
BY DISSOLVED ORGANIC-MATTER. Water Research, 28, 2487-2497.
LLOYD, J. R. 2003. Microbial reduction of metals and radionuclides. Fems Microbiology
Reviews, 27, 411-425.
LLOYD, J. R. & OREMLAND, R. S. 2006. Microbial transformations of arsenic in the
environment: From soda lakes to aquifers. Elements, 2, 85-90.
LOMBI, E., ZHAO, F. J., ZHANG, G. Y., SUN, B., FITZ, W., ZHANG, H. & MCGRATH, S.
P. 2002. In situ fixation of metals in soils using bauxite residue: chemical assessment.
Environmental Pollution, 118, 435-443.
LOVLEY, D. R. 1997. Microbial Fe(III) reduction in subsurface environments. Fems
Microbiology Reviews, 20, 305-313.
LU, X., JOHNSON, W. D. & HOOK, J. 1998. Reaction of Vanadate with Aquatic Humic
Substances: An ESR and 51V NMR Study. Environmental Science & Technology, 32, 2257-
2263.
MATOCHA, C. J., KARATHANASIS, A. D., RAKSHIT, S. & WAGNER, K. M. 2005.
Reduction of Copper(II) by Iron(II). Journal of Environmental Quality, 34, 1539-1546.
MAYES, W. M., JARVIS, A. P., BURKE, I. T., WALTON, M., FEIGL, V., KLEBERCZ, O. &
GRUIZ, K. 2011. Dispersal and Attenuation of Trace Contaminants Downstream of the Ajka
Bauxite Residue (Red Mud) Depository Failure, Hungary. Environmental Science &
Technology, 45, 5147-5155.
MAYES, W. M., YOUNGER, P. L. & AUMONIER, J. 2006. Buffering of alkaline steel slag
leachate across a natural wetland. Environmental Science & Technology, 40, 1237-1243.
MAYES, W. M., YOUNGER, P. L. & AUMONIER, J. 2008. Hydrogeochemistry of alkaline
steel slag leachates in the UK. Water Air and Soil Pollution, 195, 35-50.
MILACIC, R., ZULIANI, T. & SCANCAR, J. 2012. Environmental impact of toxic elements in
red mud studied by fractionation and speciation procedures. Science of the Total Environment,
426, 359-365.
50
MORTIMER, R. J. G., HARRIS, S. J., KROM, M. D., FREITAG, T. E., PROSSER, J. I.,
BARNES, J., ANSCHUTZ, P., HAYES, P. J. & DAVIES, I. M. 2004. Anoxic nitrification in
marine sediments. Marine Ecology-Progress Series, 276, 37-51.
NAGY, A. S., SZABO, J. & VASS, I. 2013. Trace metal and metalloid levels in surface water
of the Marcal River before and after the Ajka red mud spill, Hungary. Environmental Science
and Pollution Research, 20, 7603-7614.
NAVARRO, C., DIAZ, M. & VILLA-GARCIA, M. A. 2010. Physico-Chemical
Characterization of Steel Slag. Study of its Behavior under Simulated Environmental
Conditions. Environmental Science & Technology, 44, 5383-5388.
NIELSEN, F. H. 1991. Nutritional requirements for boron, silicon, vanadium, nickel and arsenic:
current knowledge and speculation. The FASEB Journal, 5, 2661-2667.
O'DAY, P. & VLASSOPOULOS, D. 2010. Mineral-Based Amendments for Remediation.
Elements, 6, 375-381.
OREMLAND, R. S., DOWDLE, P. R., HOEFT, S. E., SHARP, J. O., SCHAEFER, J. K.,
MILLER, L. G., BLUM, J. S., SMITH, R. A., BLOOM, N. S. & WALLSCHLAGER, D. 2000.
Bacterial dissimilatory reduction of arsenate and sulfate in meromictic Mono Lake, California.
Geochimica Et Cosmochimica Acta, 64, 3073-3084.
OREMLAND, R. S., KULP, T. R., BLUM, J. S., HOEFT, S. E., BAESMAN, S., MILLER, L.
G. & STOLZ, J. F. 2005. A microbial arsenic cycle in a salt-saturated, extreme environment.
Science, 308, 1305-1308.
OREMLAND, R. S. & STOLZ, J. F. 2003. The ecology of arsenic. Science, 300, 939-944.
OREMLAND, R. S., STOLZ, J. F. & HOLLIBAUGH, J. T. 2004. The microbial arsenic cycle
in Mono Lake, California. Fems Microbiology Ecology, 48, 15-27.
ORTIZ-BERNAD, I., ANDERSON, R. T., VRIONIS, H. A. & LOVLEY, D. R. 2004.
Vanadium respiration by Geobacter metalireducens: Novel strategy for in situ removal of
vanadium from groundwater. Applied and Environmental Microbiology, 70, 3091-3095.
PIGA, L., POCHETTI, F. & STOPPA, L. 1993. Recovering Metals from Red Mud Generated
during Alumina Production. JOM, 45, 54-59.
POLLOCK, J., WEBER, K. A., LACK, J., ACHENBACH, L. A., MORMILE, M. R. &
COATES, J. D. 2007. Alkaline iron(III) reduction by a novel alkaliphilic, halotolerant, Bacillus
sp isolated from salt flat sediments of Soap Lake. Applied Microbiology and Biotechnology, 77,
927-934.
POSTMA, D. & JAKOBSEN, R. 1996. Redox zonation: Equilibrium constraints on the
Fe(III)/SO4-reduction interface. Geochimica Et Cosmochimica Acta, 60, 3169-3175.
POWER, G., GRAFE, M. & KLAUBER, C. 2011. Bauxite residue issues: I. Current
management, disposal and storage practices. Hydrometallurgy, 108, 33-45.
PROCTOR, D. M., FEHLING, K. A., SHAY, E. C., WITTENBORN, J. L., GREEN, J. J.,
AVENT, C., BIGHAM, R. D., CONNOLLY, M., LEE, B., SHEPKER, T. O. & ZAK, M. A.
51
2000. Physical and chemical characteristics of blast furnace, basic oxygen furnace, and electric
arc furnace steel industry slags. Environmental Science & Technology, 34, 1576-1582.
RATNAIKE, R. N. 2003. Acute and chronic arsenic toxicity. Postgraduate Medical Journal,
391-396.
REEVES, H. J., WEALTHALL, G. & YOUNGER, P. L. 2011. Advisory visit to the bauxite
processings tailings dam near Ajka, Vesprem County, western Hungary. . Keyworth, UK:
British Geological Survey.
REHDER, D. 1991. THE BIOINORGANIC CHEMISTRY OF VANADIUM. Angewandte
Chemie-International Edition in English, 30, 148-167.
REKASI, M., FEIGL, V., UZINGER, N., GRUIZ, K., MAKO, A. & ANTON, A. 2013. Effects
of leaching from alkaline red mud on soil biota: modelling the conditions after the Hungarian
red mud disaster. Chemistry and Ecology, 29, 709-723.
RENFORTH, P., MAYES, W. M., JARVIS, A. P., BURKE, I. T., MANNING, D. A. C. &
GRUIZ, K. 2012. Contaminant mobility and carbon sequestration downstream of the Ajka
(Hungary) red mud spill: The effects of gypsum dosing. The Science of the total environment,
421-422, 253-9.
RICHTER, R. O. & THEIS, T. L. 1980. Nickel Speciation in a Soil/Water System. In: NRIAGU,
J. O. (ed.) Nickel in the Environment.
RITTER, K., AIKEN, G. R., RANVILLE, J. F., BAUER, M. & MACALADY, D. L. 2006.
Evidence for the aquatic binding of arsenate by natural organic matter-suspended Fe(III).
Environmental Science & Technology, 40, 5380-5387.
ROADCAP, G. S., KELLY, W. R. & BETHKE, C. M. 2005. Geochemistry of extremely
alkaline (pH > 12) ground water in slag-fill aquifers. Ground Water, 43, 806-816.
ROADCAP, G. S., SANFORD, R. A., JIN, Q. S., PARDINAS, J. R. & BETHKE, C. M. 2006.
Extremely alkaline (pH > 12) ground water hosts diverse microbial community. Ground Water,
44, 511-517.
RUBINOS, D. A. & BARRAL, M. T. 2013. Fractionation and mobility of metals in bauxite red
mud. Environmental science and pollution research international, 20, 7787-802.
RUYTERS, S., MERTENS, J., VASSILIEVA, E., DEHANDSCHUTTER, B., POFFIJN, A. &
SMOLDERS, E. 2011. The Red Mud Accident in Ajka (Hungary): Plant Toxicity and Trace
Metal Bioavailability in Red Mud Contaminated Soil. Environmental Science & Technology, 45,
1616-1622.
SAUVE, S., MCBRIDE, M. B., NORVELL, W. A. & HENDERSHOT, W. H. 1997. Copper
solubility and speciation of in situ contaminated soils: Effects of copper level, pH and organic
matter. Water Air and Soil Pollution, 100, 133-149.
SCHIPPERS, A., NERETIN, L. N., KALLMEYER, J., FERDELMAN, T. G., CRAGG, B. A.,
PARKES, R. J., JORGENSEN, B. B. 2005. Prokaryotic cells of the deep sub-sea floor
biosphere identified as living bacteria. Nature, 433(7028), 861-864.
52
SCHWAB, A. P., HICKEY, J., HUNTER, J. & BANKS, M. K. 2006. Characteristics of blast
furnace slag leachate produced under reduced and oxidized conditions. J Environ Sci Health A
Tox Hazard Subst Environ Eng, 41, 381-95.
SHARMA, P., OFNER, J. & KAPPLER, A. 2010. Formation of Binary and Ternary Colloids
and Dissolved Complexes of Organic Matter, Fe and As. Environmental Science & Technology,
44, 4479-4485.
SHEFFIELD, P. M. 1996. Investigation and remediation of alkaline leachate from the former
Consett Steelworks Site Unpublished MSc, The University of Sheffield.
SHIBA, H., YAMAMOTO, H. & HORIKOSHI, K. 1989. ISOLATION OF STRICTLY
ANAEROBIC HALOPHILES FROM THE AEROBIC SURFACE SEDIMENTS OF
HYPERSALINE ENVIRONMENTS IN CALIFORNIA AND NEVADA. Fems Microbiology
Letters, 57, 191-195.
SMEDLEY, P. L. & KINNIBURGH, D. G. 2002. A review of the source, behaviour and
distribution of arsenic in natural waters. Applied Geochemistry, 17, 517-568.
SPARKS, D. L. 2005. Toxic Metals in the Environment: The Role of Surfaces. Elements, 1,
193-197.
STEVENSON, F. J. 1994. Humus chemistry: genesis, composition, reactions, John Wiley and
Sons Inc.
STURR, M. G., GUFFANTI, A. A. & KRULWICH, T. A. 1994. Growth and Bioenergetics of
Alkaliphilic Bacillus-Firmus OF4 in continuous-culture at high pH. Journal of Bacteriology,
176, 3111-3116.
SUMMERS, R. N., GUISE, N. R. & SMIRK, D. D. 1993. BAUXITE RESIDUE (RED MUD)
INCREASES PHOSPHORUS RETENTION IN SANDY SOIL CATCHMENTS IN
WESTERN-AUSTRALIA. Fertilizer Research, 34, 85-94.
SZALAY, A. & SZILAGYI, M. 1967. ASSOCIATION OF VANADIUM WITH HUMIC
ACIDS. Geochimica Et Cosmochimica Acta, 31, 1-&.
TAKAI, K., MOSER, D. P., ONSTOTT, T. C., SPOELSTRA, N., PFIFFNER, S. M.,
DOHNALKOVA, A. & FREDRICKSON, J. K. 2001. Alkaliphilus transvaalensis gen. nov., sp
nov., an extremely alkaliphilic bacterium isolated from a deep South African gold mine.
International Journal of Systematic and Evolutionary Microbiology, 51, 1245-1256.
TAKAI, K., MOYER, C. L., MIYAZAKI, M., NOGI, Y., HIRAYAMA, H., NEALSON, K. H.
& HORIKOSHI, K. 2005. Marinobacter alkaliphilus sp nov., a novel alkaliphilic bacterium
isolated from subseafloor alkaline serpentine mud from Ocean Drilling Program Site 1200 at
South Chamorro Seamount, Mariana Forearc. Extremophiles, 9, 17-27.
THE EUROPEAN SLAG ASSOCIATION. 2014. Ferrous Slag - general information [Online].
Germany. Available: http://www.euroslag.com/products/ [Accessed 27.03.2014].
TIAGO, I., CHUNG, A. P. & VERISSIMO, A. 2004. Bacterial diversity in a nonsaline alkaline
environment: Heterotrophic aerobic Populations. Applied and Environmental Microbiology, 70,
7378-7387.
53
TUNNACLIFFE, V. 1991. The Biology of hydrothermal vents - Ecology and Evolution.
Oceanography and Marine Biology, 29, 319-407.
U.S. GEOLOGICAL SURVEY 2013. Mineral commodity summaries 2013. In: U.S.
GEOLOGICAL SURVEY (ed.). Reston Virginia: U.S.Geological Survey,.
UNITED STATES ENVIRONMENTAL PROTECTION AGENCY 1992. Toxicity
Characteristic Leaching Procedure. Method 1311.
VAN MARWIJK, J., OPPERMAN, D. J., PIATER, L. A. & VAN HEERDEN, E. 2009.
Reduction of vanadium(V) by Enterobacter cloacae EV-SA01 isolated from a South African
deep gold mine. Biotechnology Letters, 31, 845-849.
WANTY, R. B. & GOLDHABER, M. B. 1992. THERMODYNAMICS AND KINETICS OF
REACTIONS INVOLVING VANADIUM IN NATURAL SYSTEMS - ACCUMULATION
OF VANADIUM IN SEDIMENTARY-ROCKS. Geochimica Et Cosmochimica Acta, 56,
1471-1483.
WARD, D. M., BATESON, M. M., FERRIS, M. J., KUHL, M., WIELAND, A., KOEPPEL, A.
& COHAN, F. M. 2006. Cyanobacterial ecotypes in the microbial mat community of
Mushroom Spring (Yellowstone National Park, Wyoming) as species-like units linking
microbial community composition, structure and function. Philosophical Transactions of the
Royal Society B-Biological Sciences, 361, 1997-2008.
WEHRLI, B. & STUMM, W. 1989. VANADYL IN NATURAL-WATERS - ADSORPTION
AND HYDROLYSIS PROMOTE OXYGENATION. Geochimica Et Cosmochimica Acta, 53,
69-77.
WHITTLESTON, R. A., STEWART, D. I., MORTIMER, R. J. G., ASHLEY, D. J. & BURKE,
I. T. 2011. Effect of Microbially Induced Anoxia on Cr(VI) Mobility at a Site Contaminated
with Hyperalkaline Residue from Chromite Ore Processing. Geomicrobiology Journal, 28, 68-
82.
WILKIE, M. P. & WOOD, C. M. 1996. The adaptations of fish to extremely alkaline
environments. Comparative Biochemistry and Physiology B-Biochemistry & Molecular
Biology, 113, 665-673.
WORLD HEALTH ORGANISATION. 2008. Guidelines for Drinking-water Quality.
[Accessed 8th April 2014].
WU, J., WEST, L. J. & STEWART, D. I. 2001. Copper(II) humate mobility in kaolinite soil.
Engineering Geology, 60, 275-284.
YE, Q., ROH, Y., CARROLL, S. L., BLAIR, B., ZHOU, J. Z., ZHANG, C. L. & FIELDS, M.
W. 2004. Alkaline anaerobic respiration: Isolation and characterization of a novel alkaliphilic
and metal-reducing bacterium. Applied and Environmental Microbiology, 70, 5595-5602.
YIN, Y. J., IMPELLITTERI, C. A., YOU, S. J. & ALLEN, H. E. 2002. The importance of
organic matter distribution and extract soil : solution ratio on the desorption of heavy metals
from soils. Science of the Total Environment, 287, 107-119.

54
ZACHARA, J. M., FREDRICKSON, J. K., SMITH, S. C. & GASSMAN, P. L. 2001.
Solubilization of Fe(III) oxide-bound trace metals by a dissimilatory Fe(III) reducing bacterium.
Geochimica Et Cosmochimica Acta, 65, 75-93.
ZHILINA, T. N., ZAVARZINA, D. G., KOLGANOVA, T. V., LYSENKO, A. M. &
TOUROVA, T. P. 2009. Alkaliphilus peptidofermentans sp nov., a new alkaliphilic bacterial
soda lake isolate capable of peptide fermentation and Fe(III) reduction. Microbiology, 78, 445-
454.
ZOBRIST, J., DOWDLE, P. R., DAVIS, J. A. & OREMLAND, R. S. 2000. Mobilization of
arsenite by dissimilatory reduction of adsorbed arsenate. Environmental Science & Technology,
34, 4747-4753.
55
Chapter 3 Materials and Methods
This chapter describes in detail the sample collection, and methods used for the
experimental and analytical work presented in this thesis, including some theoretical
background to the instrumental analysis and techniques used where appropriate.
3.1 Sample Collection
3.1.1 Hownsgill Valley Site
Groundwater and soil were sampled from the Hownsgill Valley, near Consett,
Co. Durham on 4th November 2010. A small trial pit was excavated on the calcite
banks of the leachate pond. Once the pit had filled with groundwater (this occurred
rapidly), preliminary readings of the pH (~12) and Eh (~100mV) of the groundwater
were measured with a portable Hanna HI 98129 Combo meter, calibrated using pH 7.01
and 10.01 buffer solutions. 5 L of groundwater was then extracted from the pit, stored
in a polypropylene container and was refrigerated upon return to the lab.
Another small pit was excavated approximately 10 m from the original. The soil
in the second pit showed definite layering of surface and deeper soil (Figure 3.1). Both
soil layers were sampled, and stored in 2 L plastic container. The deeper soil was
homogenised on site with a 1 cm sieve. The soil samples were refrigerated (2°C) upon
return to the laboratory until required.
Laboratory measurements of the sample water pH were measured the following
day (pH 11.83). 100 ml of the water samples and ~150g samples of both soil types were
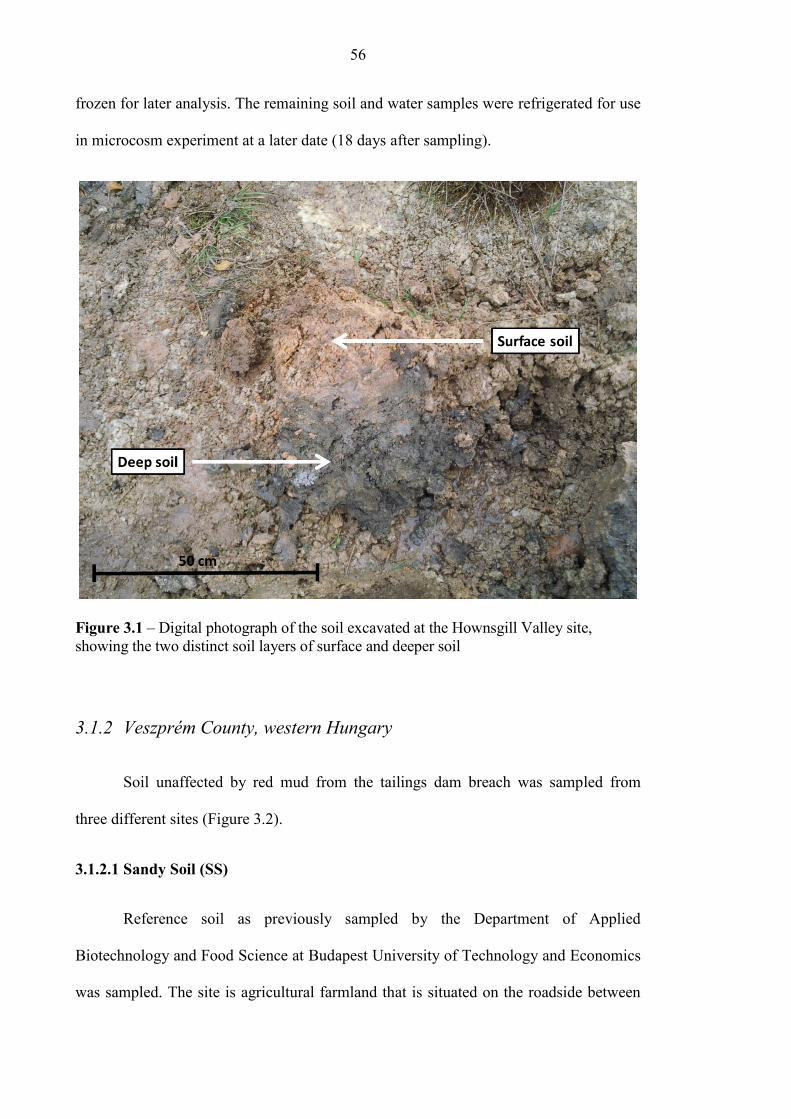
56
frozen for later analysis. The remaining soil and water samples were refrigerated for use
in microcosm experiment at a later date (18 days after sampling).
Figure 3.1 – Digital photograph of the soil excavated at the Hownsgill Valley site,
showing the two distinct soil layers of surface and deeper soil
3.1.2 Veszprém County, western Hungary
Soil unaffected by red mud from the tailings dam breach was sampled from
three different sites (Figure 3.2).
3.1.2.1 Sandy Soil (SS)
Reference soil as previously sampled by the Department of Applied
Biotechnology and Food Science at Budapest University of Technology and Economics
was sampled. The site is agricultural farmland that is situated on the roadside between
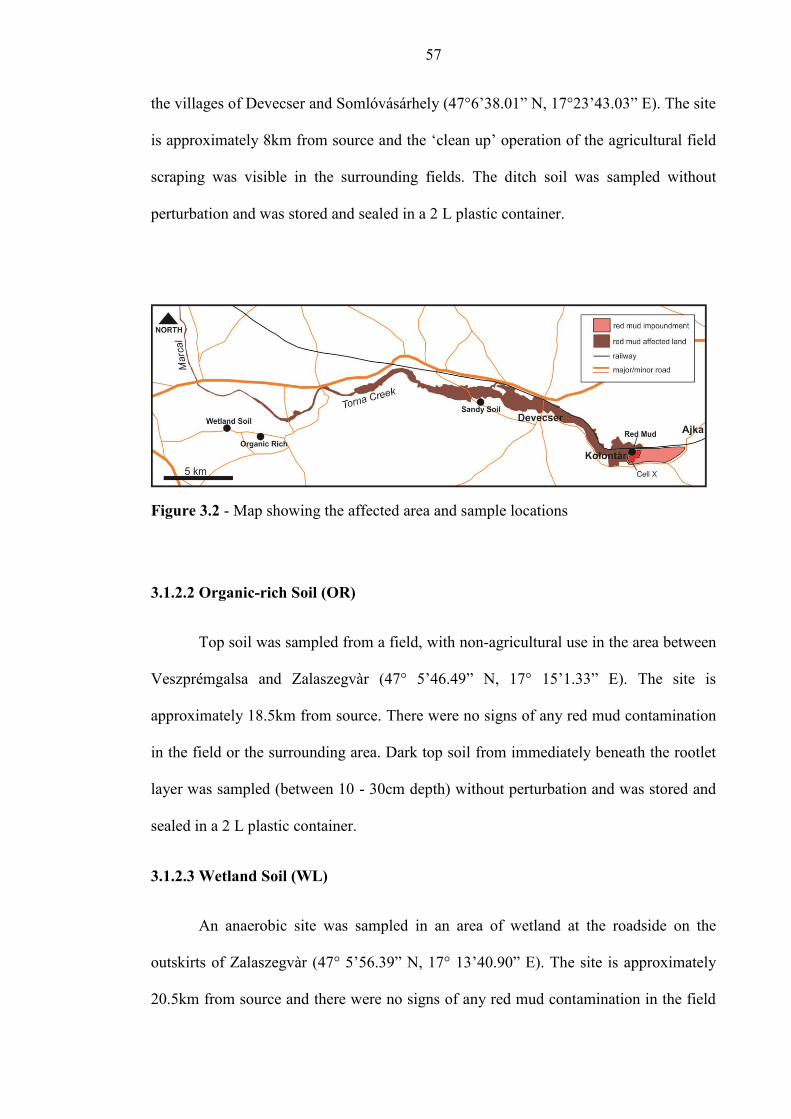
57
the villages of Devecser and Somlóvásárhely (47°6’38.01” N, 17°23’43.03” E). The site
is approximately 8km from source and the ‘clean up’ operation of the agricultural field
scraping was visible in the surrounding fields. The ditch soil was sampled without
perturbation and was stored and sealed in a 2 L plastic container.
Figure 3.2 - Map showing the affected area and sample locations
3.1.2.2 Organic-rich Soil (OR)
Top soil was sampled from a field, with non-agricultural use in the area between
Veszprémgalsa and Zalaszegvàr (47° 5’46.49” N, 17° 15’1.33” E). The site is
approximately 18.5km from source. There were no signs of any red mud contamination
in the field or the surrounding area. Dark top soil from immediately beneath the rootlet
layer was sampled (between 10 - 30cm depth) without perturbation and was stored and
sealed in a 2 L plastic container.
3.1.2.3 Wetland Soil (WL)
An anaerobic site was sampled in an area of wetland at the roadside on the
outskirts of Zalaszegvàr (47° 5’56.39” N, 17° 13’40.90” E). The site is approximately
20.5km from source and there were no signs of any red mud contamination in the field
58
or surrounding area. Dark anaerobic soil was sampled from a reed bed at a depth of
~40cm. The soil was stored in several small plastic containers without further
perturbation. The smaller containers were held inside one large container together with
Anaerogen™ sachets. The large container was double bagged and sealed. Readings of
pH (6.98), Eh (50 mV), total dissolved solids (902 mg L-1) and conductivity (1281 µS)
were taken from mixed surface and ground water at the site.
3.1.2.4 Tailings Pond (X), MAL Zrt
Red mud and affected leachate were sampled from inside the breached dyke at
Ajkai Timfoldgyar Zrt alumina plant on 11th May 2011. Red mud was easily accessible
as it was still present on site in large piles which had been left to dry since the dyke
breach when the majority of the slurry waste had been released. The top layer of the red
mud was very dry and this was removed with a spade to reveal a soft clay-like material.
Both types of red mud were sampled and were stored and sealed in 1 L plastic
containers labelled: Red Mud Dry and Red Mud Clay-like.
Hyper-alkaline leachate was sampled from a leachate pond that had accumulated
behind a 12m deep concrete barrier which had been designed to reach the bottom of the
red mud waste deposits. Preliminary readings of pH (12.2), Eh (-31 mV) and total
dissolved solids (31 ng L-1) and conductivity (31 mS) were measured with a portable
Myron L Ultrameter II 6PSi, that was calibrated using pH 7.01 and 10.01 buffer
solutions. 2 L of leachate was extracted from the pond and stored in 2x 1 L plastic
containers. The samples were stored at ambient temperature until they were returned to
the lab where they were refrigerated at 2°C.
59
3.1.3 Principle Component Analysis
Principle component analysis (PCA) is a statistical tool used to reduce the
number of dimensions of a data set with large numbers of interrelated variables, whilst
retaining as much of the set’s variation as is possible. In computational terms, a new set
of uncorrelated variables are found and ordered so that the first few keep most of the
variation present in all the original set of variables. The first of these newly ordered
variables is the principle component of the new set (Joliffe, 2002). PCA was used for
the samples collected from Ajka to show them in the broader context of large scale soil
and sediment sampling efforts across a 100 km reach of the Torna-Marcal-Raba River
system in the immediate aftermath of the spill (Mayes et al., 2011). The theory behind
the use of PCA in this study is that it will allow for the distinction between soils
samples affected by the red mud spill, as sampled by Mayes et al. (2011) and the
unaffected reference soils sampled at Ajka, in May 2011 (section 3.1.2).
Reference soils and red mud sampled on the site visit to Hungary in May 2011
were plotted alongside the larger scale study (Mayes et al., 2011). Each point represents
a single sampling event from this study and Mayes et al. (2011). PCA was generated
using Minitab v.15 software using XRF and other geochemical data (pH, ORP) from the
red mud and Hungarian soils, as variables (see Figure 5.1).
3.2 Sample Characterisation
3.2.1 Sample pH
All soil sampled and red mud pH was determined following the ASTM (2006)
standard method for pH in soils. 10 g of sample was suspended in a 1:1 ratio with DIW
60
and left to equilibrate for 1 hour before measurements were taken using an Orion
benchtop pH meter with combination pH electrode (VWR International). The pH meter
was calibrated using pH 4.01, 7.01 and 10.01 buffers. The measurements were carried
out in triplicate (≤0.1 SD).
3.2.2 % 0.5 M Acid extractable Iron as Fe(II)
The percentage of microbially available iron (as Fe(II)) in soils, red mud and at
microcosms sampling points was determined with a UV/Vis spectrophotometry method
using ‘ferrozine’ (3-(2-pyridyl)5,6-bis(4-phenylsulfonic acid)-1,2,4-triazine). When
dissolved in ammonium acetate, ferrozine reacts with ferrous iron forming a magenta
coloured solution (λmax = 562 nm). The method can be further adapted by using
hydroxylamine hydrochloride as a reducing agent and an ammonium acetate buffer (pH
9.5) to reduce any ferric iron in solution to Fe(II) thus allowing for the determination of
total Fe in solution. Measuring the change in Fe(II) relative to total Fe (FeT) over time
can be used to monitor microbial Fe(III) reduction. The ratio of Fe(II):Fe(III) increases
as bacterial oxidation of organic material is coupled with Fe(III) reduction of insoluble
iron oxides (Lovley, 1997). The forms of iron considered readily available to bacteria in
the subsurface are poorly crystalline, amorphous iron phases and it is possible to extract
these phases using 0.5 M HCl under a 1 hour extraction time (Lovley and Phillips,
1986b). Therefore determining the change in ratio of Fe(II) to FeT over time in these
phases can be use to monitor the progression of microbial iron reduction.
In order to assess the percentage of reduced iron in samples, 0.5M HCl acid
extractable Fe(II) was measured against the FeT (adapted method from (Lovley and
Phillips, 1986b; Viollier et al., 2000). A ‘pea sized’ amount of soil/red mud was added
61
to a 12.5 mL tube together with 0.5M HCl (5 mL). In the case of microcosm samples, a
pellet of sediment recovered after centrifugation (3 min, 16,000g) was re-suspended
with 0.5 M HCl (1 mL) and transferred to a 12.5 mL tube containing 0.5 M HCl (4 mL).
The tubes were sealed, shaken and left for exactly 60 minutes on an orbital shaker (150
rpm). After 60 minutes the samples were filtered through a 0.2 μm syringe filter into a
clean 12.5 mL tube. Five repeats of each soil sample were analysed and microcosm
samples were in triplicate (% RSD 3.5% microcosm samples, 14% soil samples 12%
red mud).
Cuvette 1 - test for Fe(II): The following reagents were added to a 4 mL cuvette:
sample (100 μL), DIW (2900 μL), ferrozine solution (300 μL, 0.01 M).Cuvette 2 - test
for FeT: The following reagents were added to a 4 mL cuvette: sample (100 μL), DIW
(2000 μL), ferrozine solution (300μL, 0.01 M), hydroxylammonium hydrochloride
solution (600 μL, 1.4 M) and buffer solution (300 μL, 9.8 M, pH 9.5 (adjusted with
ammonium hydroxide).
The cuvettes were sealed with parafilm ™, shaken by hand and left for 10
minutes for a colour to develop. The absorbance was measured against matrix matched
blanks at 562 nm. If high concentrations of iron were seen which resulted in saturation
(Abs >2), the test was repeated using 50 μL of sample and additional DIW. If
concentrations were low (Abs < 0.5) the test was repeated using 200 µL of sample and
less DIW. The percentage of Fe(II) against total Fe was then calculated.
62
3.2.3 X-ray powder diffraction (XRD)
X-ray powder diffraction is used to identify bulk mineral phases present in
samples. A beam of x-rays is directed at the solid and the photons of the x-ray beam are
scattered by atoms as they strike the surface. Any unscattered x-rays pass through to the
next layer of atoms and so forth, thus resulting in a diffraction pattern that is
characteristic to that solid. A diffraction pattern is seen, in accordance with Bragg’s
Law, when
sin 𝜃 =𝑛𝜆
2𝑑 (3.1)
λ = wavelength (Å)
d = spacing between atomic layers (Å)
θ = angle of incidence
n = an integer,
Powder XRD analysis was performed on all soil samples together with the red
mud samples. The soil samples were oven dried at 60°C. The soil was then ground to a
fine talc like powder in a pestle and mortar. Fine red mud powder was crushed lightly in
a pestle and mortar after air drying for several days under a protective cover. The wet
clay-like red mud was smeared in a fine layer across several glass plates and left to air
dry under a protective cover. After several days the dried red mud was removed and
crushed lightly by pestle and mortar. Bulk soil and red mud diffraction patterns were
collected using a Bruker D8 powder X-ray diffractometer with a Ge(111)
monochromator, (CuK alpha = 1.54 Ǻ; 2ϴ = 5 - 70° divergence and antiscatter slits set
to variable 20 mm; patterns were recorded at 0.01 step at 0.5 seconds/step).
63
3.2.4 X-ray fluorescence
X-ray fluorescence provides information on the elemental composition of a
sample. When x-rays are directed at a sample, an electron is removed from a low energy
inner-shell, leaving a vacancy. In order to return to the original configuration, an
electron from a higher energy level shell fills the vacant site. The process of this
electron replacements results in the emission of secondary x-rays, which is measured as
fluorescence. The energy of the emitted x-rays is dependent upon the difference in
energy between the two shells and is unique to individual elements. The intensity of the
secondary x-ray emitted corresponds to the concentration of that element in the sample,
and can be determined by comparison against known standards (Brouwer, 2010).
Homogenised soil and red mud samples were characterised for major and trace
elements using a PANalytical Axios Advanced XRF spectrometer. Major elements were
determined on fused glass beads prepared from ignited powders. Sample to flux ratio 1 :
5, 80% Li metaborate: 20% Li tetraborate flux. Trace elements were analysed on 32 mm
diameter pressed powder pellets produced from mixing 7.5g fine ground sample with 12
– 15 drops of 7% PVA solution (Moviol 8-88) pressed at 10 tons per square inch.
(Analysis carried out by Department of Geology, University of Leicester).
3.2.5 BET specific surface area
Specific surface area is calculated using BET theory (Brunauer et al., 1938) from
gas adsorption isotherm data. It is an expansion of the Langmuir equation of single layer
sorption taking into account multi-layered adsorption. The BET model assumes that i)
1st layer adsorption occurs at strong uniform sites of energy; ii) that the 2nd layer adsorbs
64
to 1st and 3rd to 2nd etc; iii) at equilibrium the rate of condensation is equal to the rate of
evaporation for each layer and iv) when the number of adsorbed layers is greater or
equal to 2, then equilibrium constants are equal.
The surface area of all soil samples and red mud was determined by
measurement of the BET surface area by gas adsorption with helium at 77K. Dried soil
and red mud were gently disaggregated by hand prior to weighing into pre-weighed
sample tubes. Samples were degassed with N2 on a Micromeritics FlowPrep 060 sample
degas system prior to analysis with a Micromeritics Gemini V BET surface area
analyser (%RSD = 3%).
3.2.6 Total carbon, organic and inorganic carbon
Homogenised samples were oven dried at 105°C and disaggregated with a pestle
and mortar. A portion of each sample was washed with 10% HCl to remove any
carbonates following the method of Schumacher (2002) for total organic carbon
determination. Total carbon together with total organic carbon was determined using a
Carlo Erba NA 2500 Elemental Analyser. Total inorganic carbon was deemed to be the
difference between total carbon and total organic carbon.
(Analysis carried out by School of GeoSciences, University of Edinburgh).
3.2.7 Inorganic phosphate in samples
Inorganic phosphate was determined by the molybdenum blue method (Murphy
and Riley, 1962; Aspila et al., 1976) on soil and red mud samples. Dried sample (0.1g)
65
was weighed into a 15 mL centrifuge tube and the weight to 4 decimal places was
recorded. HCl (1 M, 10 mL) was added. The tubes were sealed and left shaking on an
orbital shaker overnight. The samples were then filtered with 0.45 μm syringe filter and
the filtrate was diluted 10x with MilliQ. A mixed reagent solution (50 mL) was made up
using H2SO4 (25 mL, 2.5 M), ammonium molybdate (7.5 mL, 0.2 M), antimony K-
tartrate (2.5 mL, 4.34 x 10⁻³ M) and ascorbic acid (15 mL, 0.1 M).
Diluted sample (2 mL) and mixed reagent (0.5 mL) were pipetted into a 4 mL
cuvette and left for 15 minutes for a colour to develop. The absorbance was measured at
880 nm against a matrix matched blank. Standards were prepared from a 1000 ppm,
PO43- solution in HCl (0.1 M) between 0.25 μM and 20 μM and treated as the samples
above (R2 = 0.999). A certified reference sample (LGC6020) was used to check the
accuracy and precision of the measurements (%RSD 5%, relative error 4%)
3.3 Batch microcosm experiments
Individual batch microcosm experiments are described in detail in the methods
section of the results chapters (Chapters 4, 6, 7 and 8). Below is a description of general
methods used for microcosm sterilisation, and the technique used for sampling the
microcosms
3.3.1 Microcosm Sterilisation
The use of control experiments using sterile microcosms is required in order to
establish background conditions and the abiotic processes that occur in microcosms
without influence from microbially mediated transactions. It is therefore important that
the method of sterilisation chosen is able to inhibit or eliminate organisms without
66
changing chemical and physical soil characteristics (Tuominen et al, 1994). There are
several different methods of soil sterilisation, the most widely used methods include
forms of; heat sterilisation, chemical sterilisation and irradiation. Each method of
sterilisation can affect the soil in different ways, and therefore the chosen method will
depend upon the specificities of the research; i.e. length of incubation period,
geochemical determinations required etc. A brief description of common sterilisation
techniques are described below.
3.3.1.1 Gamma (γ-) irradition
The use of gamma (γ-) irradiation from cobalt-60 has been recommended in
several studies over other soil sterilisation techniques, as minimal soil disturbance
occurs during the sterilisation process (Trevors, 1996, McNamara et al, 2003).
However, this technique can only be carried out at an appropriate irradiation facility,
where soil samples are placed in sealed polythene bags and irradiated at 2.5 Mrad at the
rate of 2 Mrad hour-1 (Trevors, 1996). The main problems associated with γ-irradiation
are the increased release of soil nutrients (e.g. nitrogen species, manganese and
phosphorous) and damage to soil organic matter (Wolf et al, 1989; McNamara et al,
2003).
3.3.1.2 Chemical Sterilisation
Chemical sterilisation can be achieved by either fumigation by gaseous
chemicals or by the addition of chemicals to the soil directly. Common chemical agents
for fumigation are chloroform (CHCl3), propylene oxide (CH3CHCH2) and methyl
bromide (CH3Br) (Trevors, 1996). Chemicals routinely added to soils for sterilisation
are formaldehyde (CH2O), mercuric chloride (HgCl2) and sodium azide (NaN3)
(Trevors, 1996). One of the main problems associated with chemical sterilisation is the
67
toxicity and disposal problems relating to the chemicals required, particularly with
regards to Hg contaminated samples (Trevors, 1996). However, there are other
disadvantages to using chemical sterilisation: for example, Wolf et al., (1989) found that
soil pH increased with the use of propylene oxide and sodium azide. It is worth noting
that sodium azide is an inhibitor and does not sterilise the soil, therefore further
additions of NaN3 are required over the incubation period of the experiments. High
concentrations of NaN3 can also result in Na leaching (Trevors, 1996).
3.3.1.3 Heat Sterilisation
Heat sterilisation of soils by autoclaving is a widely used method, mainly due to
the ease of use and instrument availability. Usually, soil is autoclaved in a glass beaker
at 121°C for 30 - 60 minutes. It is important that the layer of soil in the beaker is not too
deep to allow for the steam to fully penetrate the soil (Trevors, 1996). Heat sterilisation
by autoclaving is more effective after it is repeated for several widely spaced cycles, as
a rest period between cycles allows for the recovery of spore forming bacteria which are
then destroyed in the next cycle (Lotrario et al, 1995). Studies have shown that the use
of autoclaving can decrease the surface area of clays and alter the surface charge of
sandstone (Jenneman et al, 1986; Lotrario et al, 1995), but that it has little effect on soil
pH, organic matter content and cation exchange capacity (Lotrario et al, 1995). It should
be noted that dry soil sterilisation can also be used, but spore-forming bacteria are more
resistant to dry heat than autoclaving (Trevors, 1996).
Heat sterilisation was used in all microcosm experiments in the absence of a
suitable irradiation facility. It was decided that one cycle of 121°C would be adequate to
eliminate the majority of organisms in the soil and red mud slurries. However, the main
reasons for using heat sterilisation was the lack of chemical interference (increase in
68
nutrient leaching from soils, Na+ and Cl- leaching) and to avoid any change to soil pH
which was considered to be crucial to these experiments.
3.3.2 Microcosm sampling technique
Slurry (~3 ml) was extracted with a sterile needle (19G x 2” 1.1mm x 50 mm)
from sealed microcosm bottles with OFN and equally distributed between two 1.5 ml
Eppendorf centrifuge tubes. The tubes were centrifuged for 3 minutes at 14,000 rpm in
Sigma Microcentrifuge 1-14ED. Supernatant from tube 1 was filtered (0.2 μm) into a
clean centrifuge tube and half was acidified with 2% HNO3 for ICP-MS analysis, the
other half was frozen along with the soil residue, for future anion analysis and potential
microbial work.
The supernatant from tube 2 was decanted into a 15 ml blood tube. 100 µL of
each sample was pipetted into 3x 1.5mL micro cuvettes for V(V) analysis if required
(see Section 3.4.1 below). The remaining sample was then used for pH and ORP
measurements using a Thermo Scientific Orion DualStar pH/ISE benchtop meter with a
Hamilton Polyplast ORP BNC electrode and a VWR 662-1759 pH electrode. The
remaining soil was used for % 0.5M HCl acid extractable iron (as Fe(II)) analysis
(Section 3.2.2 above).
69
3.4 Geochemical Analysis
3.4.1 Determination of Vanadium (V)
Aqueous V(V) was determined by a reaction with 4-(2-pyrodylazo)-resorcinol
(PAR) to produce a very sensitive violet colouration (λmax = 550 nm). The optical
density of the reaction is highest between pH 5 – 8. In the past, PAR has also been used
as a reagent for the colorimetric determination of many other metal ions, e.g. Co, Ga, In,
Nb, Pd, Sc, Th and U. However, the selectivity of the PAR/V(V) reaction can be much
improved by the addition of 1,2-diaminocyclohexanetetra acetic acid (DCTA). The
presence of DCTA prevents the reaction of many metals with PAR making it a very
selective method for determining V(V) except in the presence of high concentrations of
Nb, Ti and U. The method obeys the Beer Lambert law between 10 – 1000 µM
(Budevsky, 1965; Ortiz-Bernad et al., 2004).
Sample (100µL) was pipetted into a cuvette (1.5mL). The following reagents
were then added: mixed DCTA (0.011 M) and ammonium acetate (0.088 M) buffer
solution (900µL, pH adjusted to 5.5 with acetic acid) and PAR indicator reagent (100
µL, 0.001 M). The solution was then left for 30 minutes for any colour to develop. The
absorbance was then measured at 550 nm. Standards between 0.01 and 0.5 mM were
prepared from a 10 mM stock solution of V(V) (R2 = ≥0.999, %RSD 1.8%)
3.4.2 Anion analysis by Ion Chromatography
Aqueous concentrations of chloride, nitrate, nitrite and sulfate were determined
using ion chromatography. An aqueous sample is loaded onto a stationary phase column
which is packed with a material that has a high affinity for anionic species. An ionic
70
eluent (e.g. a carbonate solution) is then passed through the column which displaces the
anions. The time interval between the sample injection and anion detection is known as
the retention time. Retention times vary for each anion due to the affinity of the anion to
the stationary column. The anion can be identified by matching elution peaks at given
retention times by comparison to known standard materials. The concentration of the
anions is determined by the definite integral of the elution peak together with
comparisons against a calibration curve with standards at known concentrations.
Analysis was performed for the Hownsgill Valley samples on a Dionex DX600
AS16 column and hydroxide gradient elution with supressed conductivity and UV
detection which was fitted for absorption at 225 nm. Ajka samples were analysed on a
Dionex DX500 AS9 column and sodium carbonate (0.009 M) elution with supressed
conductivity and UV detection which was fitted for absorption at 225 nm. Blanks and
25 mg L-1 standard were checked after every 10 samples to check for drift over the time
of the analysis. Mixed anion standards were prepared from 500 mg L-1 stock solutions
of NaCl, Na2NO3 and Na2SO4 and from a 46 mg L-1 stock for NaNO2. Accuracy was
checked by using certified reference materials (CRM) (LGC6020 and Hamilton-20). (R2
= ≥0.99, % RSD = Cl- = 2.7%, NO3- = 6.2%, SO4
2- = 3.4%, NO2- = 7.0%, % relative
error to CRM Cl- = <8%, SO42- = <7% NO3 = <7% (n = 26).
3.4.3 Aqueous trace metal/loid analysis by Inductively Coupled Plasma
Mass Spectrometry (ICP-MS)
Aqueous concentrations main elements of interest; As, Cd, Co, Cu, Cr, Mn, Mo,
Ni and V were determined using a Perkin-Elmer Elan DRCII inductively coupled
71
plasma-mass spectrometer. Acidified aqueous samples are introduced to an argon
plasma as an aerosol via a nebulizer and spray chamber to ensure an aerosol with
homogeneous particle size. The plasma removes an electron from the components to
form single-charged ions. The single-charged ions are directed into the mass
spectrometer, which is under a high vacuum, through a pumped double platinum cone
interface. The mass spectrometer filters the components according to their mass, where
only one mass to charge ratio is allowed through the spectrometer at a time. Upon
exiting the quadrupole mass spectrometer, the ions strike an electron multiplier which
acts as the detector. The impact of ions on the electron multiplier causes a cascade
release of electrons depending upon the intensity of the component. The intensities of
each component are then compared to those of known standards which are used to
determine the concentration of the element from a calibration line.
Mixed standards were prepared from stock 1000 mg L-1 standard solutions
(Romil Ltd, Cambridge UK) between 1 µg L-1 and 100 µg L-1 (R2 = ≥0.9999, %RSD <
1%). After every 10 samples, blanks and the 50 ppb standard was measured to detect
any drift over the time of the analysis. All samples were diluted 10x with 2% HNO3-.
Ga and In were used as internal standards, which were mixed 1:1 with the sample
stream online.
ICP-MS is a highly sensitive analytical technique and has been primarily used in
this study due the capability for multi-elemental analysis and low detection limits (ng L-
1 level for many elements). However, there can be problems with interferences which
need to be addressed. Generally, interferences occur when polyatomic ions are
generated by the plasma that have a mass to charge ratio that is identical to that of an
analyte (PerkinElmerSCIEX, 2003) when measured with a quadrupole mass
spectrometer such as the Elan DRCII instead of a high resolution instrument. Arsenic, a
72
key element in this study, has one single isotope, 75As and this is overlapped by a 40Ar
35Cl peak. It is possible to correct for this interference using an interference equation, as
follows:
I (As75) = I(75) – I (Ar 40 Cl 35) (3.2)
I (Ar 40 Cl 35) = I (75) – [abundance (Cl 35) / abundance (Cl 37) x I (77)]
Where I = intensity of a specified mass
abundance = natural abundance of the isotope
Which can be combined and rewritten as:
I (As75) = I (75) – [abundance (Cl 35) / abundance (Cl 37)] x I (77) (3.3)
Substituting the abundance for the chlorine isotopes yields the following result
I (As 75) = I (75) – [(0.7577 / 0.2423) x I (77)] = I (75) – 3.127 x I (77) (3.4)
The above equation is then incorporated in the program method and corrects for
the interference (PerkinElmerSCIEX, 2003).
3.4.4 Aqueous trace metal/loid analysis by Inductively Coupled Plasma
Optical Emission Spectroscopy
The concentrations of all other trace metal/loids, other than those mentioned in
Section 3.4.5 above (and Al, in Chapter 5 which was determined by flame atomic
absorption spectroscopy) were determined using an Optima 5300 DV inductively
coupled plasma-optical emission spectrometer. This was a broad spectrum analysis to
73
look at 69 elements. All elements were calibrated with a 10 ppm standard and a blank
solution and a CRM/10 solution was used as an external reference material. It is a 10x
diluted digest of commercial estuarine sediment. It contains the following in undiluted
digest; Al 700.0 mg L-1, Ca 80.0 mg L-1, Fe 350.0 mg L-1, Mg 100.0 mg L-1, K 150.0
mg L-1, Na 200.0 mg L-1, Cr 0.8 mg L-1, Cu 0.20 mg L-1, Co 0.10 mg L-1, Mn 4.0 mg L-
1, P 5.0 mg L-1, V 1.0 mg L-1, Zn 1.5 mg L-1 (instrument % RSD +/- 1-5% depending on
the element, some certified elements being more stable in solution than others).
The detection limit for both the ICP-MS and OES is 3 times the mean standard
deviation of 3 blanks, and all measurements were made in triplicate to obtain this data.
3.4.5 Aqueous arsenic speciation analysis by High Performance Liquid
Chromatography, Inductively Coupled Plasma Mass Spectrometry
High performance liquid chromatography is an improvement on simple column
chromatography where high pressure is used to force a mobile phase through a
stationary phase column. The high pressure allows for the use of a stationary phase with
a high surface area which gives for a much better separation of analytes. As with other
forms of chromatography it is the retention time and the use of known standards which
allows for sample determination. It is important to note that the retention time is highly
dependent upon; pressure, the stationary phase, the type of solvent and the temperature.
Once detected by HPLC, a small amount of sample can be diverted to an ICP-MS.
Coupling HPLC with ICP-MS allows for the analytes to be detected by their
mass/charge ratio making identification of analytes much more simple. This coupling of
techniques also allows for the separation of different species of the same element and
has been used in relating to As, Cr and Se speciation (Wolf et al., 2008).
74
Arsenic speciation from 0.2 µM filtered end point solutions was analysed by
HPLC-ICP-MS. As(V) and As(III) were separated using a Hamilton PRP-X100 250 x
4.6mm column at 30°C, using an Agilent 1260 infinity HPLC system interfaced with an
Agilent 7500 ICP-MS at 30°C. The aqueous mobile phase was ammonium carbonate
(50 mM) at a flow rate of 1.5 mL min-1 and a standard injection volume, 50 µL.
(Analysis carried out by School of Earth, Atmospheric and Environment Sciences,
University of Manchester).
3.5 Organic Geochemistry
3.5.1 Dissolved Organic Carbon Analysis
The aqueous phase sampled at the end point of the Ajka batch experiments were
filtered (0.2 µM, Whatman GD/XP filter) diluted with MilliQ (2x or 5x depending upon
the sample) for dissolved organic carbon analysis (DOC). DOC was determined using
an Analytikjena Multi N/C 2100® using thermocatalytic oxidation, MC-NDIR detection
analysis.
The type of filter used for samples prior to DOC analysis is very important due
to contamination from organic leaching which can impact the results (Khan and
Subramania-Pillai, 2007). Any contamination can be determined through blank MilliQ
samples that are filtered using the same type of filter. Filtered MilliQ blanks from this
analysis were all below detection for DOC.
75
3.5.2 Solid Phase Extraction by C18 Resin Filters
Solid phase extraction (SPE) is a sample preparation technique used to separate
a selected analyte from a mobile phase. The selected analyte is retained in a solid phase,
keeping it isolated from the remaining sample which can then be eluted (Poole, 2003).
C18 resin is a type of low-specificity sorbent which is commonly used in SPE for the
extraction of contaminants from environmental, biological or chemical samples (Poole,
2003). C18 resin is a silica bonded with an octadecyl functional group (Fontanals et al.,
2005). The analyte is isolated from the sample via hydrophobic interactions between
analyte and the resin. The main disadvantage of the use of silica based resins is that the
structure can decompose at pH extremes so pH control is essential (Fontanals et al.,
2005; Dittmar et al., 2008). Despite this, C18 resin filters have been successfully used
for the extraction of dissolved organic matter (DOM) from freshwater (Kim et al., 2003)
and seawater systems (Dittmar et al., 2008). In these studies, the amount of DOM
retained by the resin was between 40 (Dittmar et al., 2008) and 70% (Kim et al., 2003).
Method development using C18 resin filters retained >90% of Fe(II) bound to both
ferrozine and 2,2’-Bipyridine (Ferrozine and BIPY used as analogues for organically
complexed metals in an aqueous matrix) (Thomas, 2000). Following isolation of DOM
by the C18 resin, it is then possible to extract DOM from the resin using an organic
solvent (e.g. methanol) (Biotage, 2006).
Solutions (5 mL) extracted from the end sampling point of the Ajka batch
experiments were passed through ISOLUTE® C18 1g / 6 mL non polar SPE filters in
order to retain any organic substances (and thereby any organically bound metals). The
filters were conditioned according to the manufacturers protocol (Biotage, 2006) using
1 mL MilliQ then a further 1 mL of methanol. The samples were acidified prior to
76
extraction to pH 5.5 (±0.5) using HNO3 (the optimum pH for maximum organic
retention by ISOLUTE® C18 filters (Thomas, 2000). The acidified samples were then
loaded on C18 filters which were fitted to a vacuum-block. The flow rate of the sample
through the filters did not exceed 1 mL / min. The filtrates were then further diluted
with 2% HNO3 (to a final 10x dilution) for ICP-MS analysis (see section 3.4.3) to
determine the inorganic/free aqueous metal concentrations. The concentration of the
organically bound metals was calculated as the difference from the difference in
aqueous metals concentrations measured before (total [M+]) and after SPE
(inorganic/free [M+]). Further extraction of the isolated DOM phase by methanol from
the filters was not attempted as a desolvating nebuliser (required for ICP-MS samples
where an organic solvent is present) was not available on the ICP-MS instrument used.
3.6 X-Ray Absorption Spectroscopy
X-ray absorption spectroscopy (XAS) is an x-ray analytical technique that is
used for determining the formal oxidation state, co-ordination chemistry and species of
the neighbouring atoms of a selected element in a sample. Modern XAS analysis uses
synchrotron radiation, an intense and energy tuneable source of x-rays, which is
generated by accelerating electrons to near the speed of light (Newville, 2004).
Electrons are emitted from an electron gun and accelerated, first in a linear accelerator
and then to a circular accelerator where they reach a very high energy level, typically in
the GeV range. The high energy electrons are then injected into a closed storage ring
and are forced to travel in a circular trajectory by strong dipole magnetic fields
(Zubavichus and Slovokhotov, 2001). As the electrons travel round the storage ring they
77
emit an intense electromagnetic radiation which is channelled along ‘beamlines’ to
spectroscopy stations. (Zubavichus and Slovokhotov, 2001).
When the incident x-ray matches the energy of the binding energy of a core
electron in the selected element of a sample, there is a rise in absorption. The rise in
absorption, known as the absorption edge, corresponds to the promotion of the core
electron out of the atom into the continuum (Newville, 2004). The absorption edge
energy is characteristic of each element and the x-rays can be tuned to the appropriate
absorption edge of the selected element (e.g. As = 11867 eV and V = 5465 eV). The
ejected electron is called a photoelectron and has the properties of both a particle and a
wave (Vlaic and Olivi, 2004). Following the removal of the photoelectron, the ‘core
hole’ is filled by an electron from a higher energy level which emits fluorescent
secondary x-rays upon de-excitation. These fluorescent secondary x-rays are also
characteristic of the selected atom (Newville, 2004).
The occurrence of fluorescent x-rays allows for the use of XAS in fluorescence
mode, allowing for more sensitive analysis than simple transmission mode and is used
where there are low concentrations of the absorbing atom.
𝜇(E) ∝ 𝐼𝑓/𝐼0 (3.5)
Where, µ(E) = is the absorption coefficient
and, If is the intensity of fluorescence
In transmission mode, the intensity of the x-rays is measured before and after the
sample.
𝜇(𝐸) = log(𝐼0 /𝐼) (3.6)
78
The x-ray absorption spectrum can be divided into two parts: x-ray absorption
near-edge spectroscopy (XANES) and extended x-ray absorption fine-structure
spectroscopy (EXAFS). The XANES region comprises of the area just before the
absorption edge, the edge itself and ~30 eV above the edge (Newville, 2004). XANES
spectra are used to determine the oxidation state and co-ordination chemistry of the
absorbing atom. The remainder of the spectrum is the EXAFS region. EXAFS is used to
determine co-ordination number, interatomic distances and species of neighbouring
atoms. EXAFS spectra arise from the interactions of ejected photoelectron with
neighbouring atoms. A backscattering effect is created when the photoelectrons interact
with neighbouring atoms producing wave interferences within the spectra. The
interference for a given photoelectron depends upon the distance of the neighbouring
atoms and their respective atomic numbers (Vlaic and Olivi, 2004).
Samples were prepared for XAS analysis by mounting under an argon
atmosphere into in Perspex holders with Kapton™ windows. Samples were frozen (-
20°C) and transported to the synchrotron on dry ice. Standards were prepared as 1000
mg L-1 solutions and held in polythene bags for analysis.
As K-edge spectra (11867 eV) and V K-edge spectra (5465 eV) were collected
on beamline I18 at the Diamond Light Source operating at 3 GeV with a typical current
of 200 mA, using a nitrogen cooled Si(111) double crystal monochromator and
focussing optics. A pair of plane mirrors was used to reduce the harmonic content of the
beam and Kirkpatrick-Baez mirrors were used to produce a relatively unfocused beam
(approximately 0.5 mm diameter at the sample). For standards prepared as pressed
pellets, K-edge spectra were collected in transmission mode at room temperature (~295
°K). For samples and solutions, data were collected in fluorescence mode using a 9
element solid state Ge detector at room temperature. To prevent beam damage
79
presenting as an apparent change in speciation (Morin et al., 2008; Charlet et al., 2011)
only single spectra were collected (~20 mins) from a spot within the sample and the
sample stage automatically moved to expose an unaffected part of the sample before
subsequent scans.
Multiple scans were then averaged to improve the signal to noise ratio using
Athena version 0.8.061 (Ravel and Newville, 2005b). For XANES spectra absorption
was also normalised in Athena over the full data range and plotted from approximately -
15 eV to +30 eV relative to the edge position with no correction required for drift in E0.
3.6.1 EXAFS modelling
EXAFS data was background subtracted using PySpline v1.1 (Tenderholt et al.,
2007) and analysed in DLexcurv v1.0 (Tomic, 2005) using full curved wave theory
(Gurman et al., 1984). Phaseshifts were derived from ab initio calculations using Hedin-
Lundqvist potentials and von-Barth ground states (Binsted, 1998). Multiple scattering
was allowed for as coded in DLexcurv (Binsted, 1998; Tomic, 2005). Fourier
transforms of the EXAFS spectra were used to obtain an approximate radial distribution
function around the absorber atom; the peaks of the Fourier transform can be related to
“shells” of surrounding backscattering ions characterised by atom type, number of
atoms, absorber-scatterer distance, and the Debye-Waller factor (± 25%), 2σ2. Atomic
distances calculated by DLexcurv have an error of approximately ± 0.02 and ± 0.05 Å
in the first and outer shells respectively (Burke et al., 2005). Debye-Waller factors are
typically 0.002 – 0.02 2σ2 for the first shell and 0.02 – 0.04 2σ2 for the outer shells
(Binsted, 1998).
80
3.7 Microbial Community Analysis
3.7.1 DNA Extraction, Sequencing and Analysis
DNA was extracted using a FastDNA spin kit (Qbiogene, Inc.) and FastPREP
instrument (unless explicitly stated, the manufacturer’s protocol as supplied with the
kits, were followed precisely). DNA fragments in the size range 3kb ~20kb were
isolated on a 1% agarose, “1x” Tris-borate-EDTA (TBE) gel stained with ethidium
bromide to enable viewing under UV light (10x TBE solution from Invitrogen Ltd.,
UK). The DNA was extracted from the gel using a QIAquick gel extraction kit
(QIAGEN Ltd., UK). The purified DNA was then used for subsequent analysis.
3.7.2 16S rRNA gene sequencing
A fragment of the 16S rRNA gene of approximately 500bp was PCR amplified
using broad-specificity bacterial primers 8f (5–AGAGTTTGATCCTGGCTCAG-3)
(Eden et al., 1991) and 519r (5–GWATTACCGCGGCKGCTG-3) where K =G or T,
W = A or T (Lane et al., 1985). The PCR was carried out using an Eppendorf
Mastercycler gradient thermal cycler. The PCR reaction mixture contained: DIW
(10µL), purified DNA solution (25µL), GoTaq DNA polymerase (1µL), PCR reaction
buffer, MgCl2 (1.5mM, 10µL), PCR nucleotide mix (10mM, 1µL) and 8f and 519r
primers (20µM, 1.5µL). The final reaction volume was 50µL. The reaction mixtures
were incubated at 95°C for 2 min and then cycled 30 times through three steps;
denaturing (95°C, 30s), annealing (50°C, 30s), primer extension (72°C, 45s). This was
then followed by a final extension step at 72°C for 7 minutes. The PCR product was
purified using a QIAquick PCR purification kit and amplification product sizes were
81
verified by electrophoresis of 10µL of PCR product and 2µL of 6x loading dye in a 1%
agarose TBE gel with ethidium bromide staining. DNA concentration was determined
using by UV/Vis spectroscopy on a Biomate 3 spectrophotometer.
The PCR product was ligated into the standard cloning vector pGEM-T Easy
(Promega Corp., USA). The ligation mixture contained: DIW (2.6µL), 2X Rapid
ligation buffer (5µL), pGEM-T Easy Vector (50ng, 1µL), PCR product (0.4µL), T4
DNA Ligase (3 Weiss units/µL, 1µL). The final ligation volume was 10µL. The ligated
product was then transformed into E.Coli XL1-Blue supercompetent cells (Stratagene).
The transformed cells were then grown on LB-agar plates containing ampicillin (100µg
mL-1) at 37°C for ~17 hours. The plates were dressed with IPTG and X-gal (as per
Stratgene protocol) for blue-white colour screening. 60 colonies containing an insert
were restreaked on LB-ampicillin agar plates and incubated at 37°C overnight. Single
colonies from the restreaked plates were transferred to a 96 well ampicillin plate
(GATC Biotech Ltd) and were sent for sequencing (GATC Biotech, Germany).
3.7.3 Phylogenetic assignment
The quality of each 16S rRNA sequence recovered from GATC Biotech Ltd was
evaluated with Mallard (version 1.02) (Ashelford et al., 2006) in order to exclude any
putative chimeras from further analysis. The sequences were then assigned to bacterial
phyla using the online Ribosomal Database Project (RDP) naive Bayesian classifier
version 2.2, (available online http://rdp.cme.msu.edu/classifier/classifier.jsp) in
February 2011. The sequences were assigned to the taxonomical hierarchy: RDP
training set 6, based on nomenclatural taxonomy and Bergey’s Manual, with a
82
confidence threshold of 95% (Wang et al., 2007). Good quality sequences were
uploaded to the EMBL Genbank database.
3.7.4 Phylogenetic tree building
Sequences were grouped into operational taxonomic units (OTU’s) using
MOTHUR software (Schloss et al., 2009) using a >98% furthest neighbour sequence
similarity cut off. The Seqmatch tool from RDP was used to identify 16S rRNA gene
sequences from type strains similar to the sequences from this study. The 16S rRNA
gene sequences from these type strains were downloaded from the EMBL database and
aligned with new sequences using Clustal X software package (version 2.0.11) and
phylogenetic trees were constructed from the distance matrix by neighbour joining.
Bootstrap analysis was performed by 1000 replicates and resulting phylograms were
drawn using Treeview (version 1.6.6) software package.
3.8 Statistical Analysis
3.8.1 Standard deviation, relative standard deviation and relative error.
Standard deviation (SD or σ) is a measure of the deviation of a set of data from
the arithmetic mean of the data. If all the measured values across a sample set are the
same then, σ = 0: if there is a wide spread of values across samples then σ >0. SD is
calculated as the square root of the variance in a data set. The standard deviation was
calculated for each set of chemical determinations (where n = 3) using the equation
below (see equation 3.7).
83
𝜎 = √∑(𝓍−�̅�)2
𝓃−1 (3.7)
Relative standard deviation (RSD) is calculated from SD. In this thesis it was
used to express the precision and repeatability of analytical methods described during
the research (especially where data was collected over a number of different days) by
using the equation below (see equation 3.8). A lower percentage represents a lower
variability in the data set.
%𝑅𝑆𝐷 = 𝜎
�̅�× 100 (3.8)
3.8.2 Pearson’s correlation measures (r and p-values)
The Pearsons correlation co-efficient (r) measures the strength of linearity
between two variables. It can be in a range of numbers between +1 and -1 (inclusive). A
value of 0 would indicate that no linearity exists but +1 or -1 would indicate a definite
positive correlation or negative correlation respectively. The p-value, on the other hand
looks at the probability of a result, if the correlation co-efficient was 0. It works on the
basis of rejecting one of two competing hypothesis, in this case the probability that the
release of metal ions is or is not related to increased concentrations of DOC, for
example. Generally speaking, if the probability determined is lower than 5% (i.e. p =
<0.05) then the correlation is said to be statistically significant. Correlation tables are
used to determine p-values. In this thesis, r and p-values were calculated using statistical
on-line software (Wessa, P. 2014) and a two sided p-value was quoted in all cases.
84
3.9 References
ASHELFORD, K. E., CHUZHANOVA, N. A., FRY, J. C., JONES, A. J. & WEIGHTMAN, A.
J. 2006. New screening software shows that most recent large 16S rRNA gene clone libraries
contain chimeras. Applied and Environmental Microbiology, 72, 5734-5741.
ASPILA, K. I., AGEMIAN, H. & CHAU, A. S. Y. 1976. SEMIAUTOMATED METHOD FOR
DETERMINATION OF INORGANIC, ORGANIC AND TOTAL PHOSPHATE IN
SEDIMENTS. Analyst, 101, 187-197.
ASTM 2006. D4972.01: standard test method for pH of soils. Annual Book of ASTM standards,
4, 963-965.
BINSTED, N. 1998. CLRC Daresbury Laboratory EXCURV98 program. Warrington, UK:
CLRC Daresbury Laboratory.
BIOTAGE 2006. Method Development in Solid Phase Extraction using Non-polar ISOLUTE
(R) SPE Columns for the Extraction of Aqueous Samples (TN-101.06).
BROUWER, P. 2010. Theory of XRF: Getting acquainted with the principles, Almelo, The
Netherlands, PANalytical B.V.
BRUNAUER, S., EMMETT, P. H. & TELLER, E. 1938. Adsoprtion of Gases in
Multimolecular Layers. Journal of the American Chemical Society, 60.
BUDEVSKY, O. A. J., L. 1965. Colorimetric determination of vanadium(V) with 4-(2-
pyridylazo)-resorcinol. Talanta, 12, 291 to 301.
BURKE, I. T., BOOTHMAN, C., LLOYD, J. R., MORTIMER, R. J. G., LIVENS, F. R. &
MORRIS, K. 2005. Effects of progressive anoxia on the solubility of technetium in sediments.
Environmental Science & Technology, 39, 4109-4116.
CHARLET, L., MORIN, G., ROSE, J., WANG, Y. H., AUFFAN, M., BURNOL, A. &
FERNANDEZ-MARTINEZ, A. 2011. Reactivity at (nano)particle-water interfaces, redox
processes, and arsenic transport in the environment. Comptes Rendus Geoscience, 343, 123-139.
DITTMAR, T., KOCH, B., HERTKORN, N. & KATTNER, G. 2008. A simple and efficient
method for the solid-phase extraction of dissolved organic matter (SPE-DOM) from seawater.
Limnology and Oceanography-Methods, 6, 230-235.
EDEN, P. A., SCHMIDT, T. M., BLAKEMORE, R. P. & PACE, N. R. 1991.
PHYLOGENETIC ANALYSIS OF AQUASPIRILLUM-MAGNETOTACTICUM USING
POLYMERASE CHAIN REACTION-AMPLIFIED 16S RIBOSOMAL-RNA-SPECIFIC DNA.
International Journal of Systematic Bacteriology, 41, 324-325.
FONTANALS, N., MARCE, R. M. & BORRULL, F. 2005. New hydrophilic materials for
solid-phase extraction. Trac-Trends in Analytical Chemistry, 24, 394-406.
GURMAN, S. J., BINSTED, N. & ROSS, I. 1984. A RAPID, EXACT CURVED-WAVE
THEORY FOR EXAFS CALCULATIONS. Journal of Physics C-Solid State Physics, 17, 143-
151.
85
JENNEMAN, G. E., McINERNEY, M. J., CROCKER, M. E. & KNAPP, R. M. 1986. Effect of
sterilization by dry heat or autoclaving on bacterial penetration through Berea sandstone.
Applied and Environmental Microbiology, 51, 39-43.
JOLIFFE, I. T. 2002. Principle Component Analysis New York, Springer-Verlag
KHAN, E. & SUBRAMANIA-PILLAI, S. 2007. Interferences contributed by leaching from
filters on measurements of collective organic constituents. Water Research, 41, 1841-1850.
KIM, S., SIMPSON, A. J., KUJAWINSKI, E. B., FREITAS, M. A. & HATCHER, P. G. 2003.
High resolution electrospray ionization mass spectrometry and 2D solution NMR for the
analysis of DOM extracted by C-18 solid phase disk. Organic Geochemistry, 34, 1325-1335.
LANE, D. J., PACE, B., OLSEN, G. J., STAHL, D. A., SOGIN, M. L. & PACE, N. R. 1985.
RAPID-DETERMINATION OF 16S RIBOSOMAL-RNA SEQUENCES FOR
PHYLOGENETIC ANALYSES. Proceedings of the National Academy of Sciences of the
United States of America, 82, 6955-6959.
LOVLEY, D. R. 1997. Microbial Fe(III) reduction in subsurface environments. Fems
Microbiology Reviews, 20, 305-313.
LOTRARIO, J. B., STUART, B. J., LAM, T., ARANDS, R. R., O'CONNOR, O. A. &
KOSSON, D. S. 1995. Effects of Sterilization methods on the Physical Characteristics of Soil:
Implications for Sorption Isotherm Analyses. Bulletin of Environmental Contamination and
Toxicology, 54, 668-675.
LOVLEY, D. R. & PHILLIPS, E. J. P. 1986. ORGANIC-MATTER MINERALIZATION
WITH REDUCTION OF FERRIC IRON IN ANAEROBIC SEDIMENTS. Applied and
Environmental Microbiology, 51, 683-689.
McNAMARA, N. P., BLACK, H. I. J., BERESFORD, N. A. & PAREKH, N. R. 2003. Effects
of acute gamma irradiation on chemical, physical and biological properties of soils. Applied
Soil Ecology, 24, 117-132.
MAYES, W. M., JARVIS, A. P., BURKE, I. T., WALTON, M., FEIGL, V., KLEBERCZ, O. &
GRUIZ, K. 2011. Dispersal and Attenuation of Trace Contaminants Downstream of the Ajka
Bauxite Residue (Red Mud) Depository Failure, Hungary. Environmental Science &
Technology, 45, 5147-5155.
MORIN, G., ONA-NGUEMA, G., WANG, Y. H., MENGUY, N., JUILLOT, F., PROUX, O.,
GUYOT, F., CALAS, G. & BROWN, G. E. 2008. Extended X-ray absorption fine structure
analysis of arsenite and arsenate adsorption on maghemite. Environmental Science &
Technology, 42, 2361-2366.
MURPHY, J. & RILEY, J. P. 1962. A MODIFIED SINGLE SOLUTION METHOD FOR
DETERMINATION OF PHOSPHATE IN NATURAL WATERS. Analytica Chimica Acta, 26,
31-&.
NEWVILLE, M. 2004. Fundamentals of XAFS, Chicago, U.S., Consortium for Advanced
Radiation Sources, University of Chicago.
86
ORTIZ-BERNAD, I., ANDERSON, R. T., VRIONIS, H. A. & LOVLEY, D. R. 2004.
Vanadium respiration by Geobacter metalireducens: Novel strategy for in situ removal of
vanadium from groundwater. Applied and Environmental Microbiology, 70, 3091-3095.
PERKINELMERSCIEX 2003. ELAN Version 3.0 Software Guide.
POOLE, C. F. 2003. New trends in solid-phase extraction. Trac-Trends in Analytical Chemistry,
22, 362-373.
RAVEL, B. & NEWVILLE, M. 2005. ATHENA, ARTEMIS, HEPHAESTUS: data analysis for
X-ray absorption spectroscopy using IFEFFIT. Journal of Synchrotron Radiation, 12, 537-541.
SCHLOSS, P. D., WESTCOTT, S. L., RYABIN, T., HALL, J. R., HARTMANN, M.,
HOLLISTER, E. B., LESNIEWSKI, R. A., OAKLEY, B. B., PARKS, D. H., ROBINSON, C. J.,
SAHL, J. W., STRES, B., THALLINGER, G. G., VAN HORN, D. J. & WEBER, C. F. 2009.
Introducing mothur: Open-Source, Platform-Independent, Community-Supported Software for
Describing and Comparing Microbial Communities. Applied and Environmental Microbiology,
75, 7537-7541.
SCHUMACHER, B. A. 2002. Methods for the Detemination of Total Organic Carbon (TOC) in
Soils and Sediments. In: UNITED STATES ENVIRONMENTAL PROTECTION AGENCY
(ed.). Las Vegas, U.S.: United States Environmental Protection Agency,.
TENDERHOLT, A., HEDMAN, B. & HODGSON, K. O. 2007. PySpline: A modern, cross-
platform program for the processing of raw averaged XAS edge and EXAFS data. In:
HEDMAN, B. & PAINETTA, P. (eds.) X-Ray Absorption Fine Structure-XAFS13.
THOMAS, B. 2000. Solid phase extraction for the removal of organic-iron complexes in
contaminated groundwater. MSc MSc The University of Leeds.
TOMIC, S. S., B. G.; WANDER, A.; HARRISON, N. M.; DENT, A. J.; MOSSELMANS, J. F.
W.; INGLESFIELD, J. E. 2005. New Tools for the Analysis of EXAFS: The DL_EXCURV
Package. CCLRC Technical Report DL-TR-2005-01. Daresbury, UK.
TREVORS, J. T. 1996. Sterilization and inhibition of microbial activity in soil. Journal of
Microbiological Methods, 26, 53-59.
TUOMINEN, L., KAIRESALO, T. & HARTIKAINEN, H. 1994. Comparison of Methods for
Inhibiting Bacterial Activity in Sediments. Applied and Environmental Microbiology, 60(9),
3454-3457.
VIOLLIER, E., INGLETT, P. W., HUNTER, K., ROYCHOUDHURY, A. N. & VAN
CAPPELLEN, P. 2000. The ferrozine method revisited: Fe(II)/Fe(III) determination in natural
waters. Applied Geochemistry, 15, 785-790.
VLAIC, G. & OLIVI, L. 2004. EXAFS Spectroscopy: a Brief Introduction. Croatica Chemica
ACTA, 77, 427-433.
WANG, Q., GARRITY, G. M., TIEDJE, J. M. & COLE, J. R. 2007. Naive Bayesian classifier
for rapid assignment of rRNA sequences into the new bacterial taxonomy. Applied and
Environmental Microbiology, 73, 5261-5267.

87
WESSA, P. 2014. Free Statistics Software, Office for Research Development and Education,
version 1.1.23-r7, URL http://www.wessa.net/ [Accessed on-line 10th April 2014]
WOLF, D. C., DAO, T. H., SCOTT, H. D., LAVY, T. L. 1989. Influence of Sterilization
Methods on Selected Soil Microbiological, Physical and Chemical Properties. Journal of
Environmental Quality, 18, 39-44.
WOLF, R. E., MORMAN, S. A., MORRISON, J. A. & LAMONTHE, P. J. 2008. Simultaneous
Speciation of Arsenic, Selenium and Chromium by HPLC-ICP-MS. In: U.S. GEOLOGICAL
SURVEY OPEN-FILE REPORT 2008-1334 (ed.). Virginina, U. S.
ZUBAVICHUS, Y. V. & SLOVOKHOTOV, Y. L. 2001. X-Ray synchrotron radiation in
physicochemical studies. Russian Chemical Reviews, 70, 373-403.
88
Chapter 4 Biogeochemical processes controlling the fate
of vanadium at a legacy steel slag disposal site.
Abstract
Alkaline leachates from weathering of a steel slag waste site in the north of England,
have affected the surrounding natural soil over many years. The leachates can transport
potentially toxic oxyanion forming elements (e.g. As, Cr, Mo and V) from the steel slag
which are more mobile at high pH. The soil underneath a layer of calcite dominated soil
(that has formed around an alkaline leachate pond) has a pH of 12, 170 mg kg-1 V and
36 – 40% of the microbially available iron as Fe(II). XAS analysis of the soil indicated
that the V is present as the less mobile V(IV) suggesting that V had been reduced after
transport in the leachate as V(V). V(V) spiked anaerobic microcosms indicated that
abiotic processes were responsible for the removal of V(V) from solution, and the
microcosms were not able to support nitrate or Fe(III)-reduction. However, despite the
elevated pH, a microbial consortium dominated by β-Proteobacteria and Deinococcus
thermos was found in soil the under calcite crust. A single OTU of a Trupera-like
species was found that was very closely related to a Trupera-like species, which has
been previously isolated from a different alkaline waste site. The results and
interpretations in this chapter introduce the possible site processes controlling the fate
and transport of V mobilised from steel slag leachates to a surrounding soil profile with
a view to developing a further more in depth study.
89
4.1 Introduction
The disposal of waste from industrial activities can have a profound effect on
surrounding environment and water systems. It is estimated that the worldwide steel
industry generates between 150 – 230 million tonnes of steel slag each year (U.S.
Geological Survey, 2013). Historically, the majority was openly dumped in ‘slag heaps’
and left to weather over long periods of time (Proctor et al., 2000; Navarro et al., 2010).
Steel slag recycling is becoming increasingly popular and it is currently used in a
number of industries such as: road construction (Chaurand et al., 2007a); as fertilizers or
soil conditioners (Haynes et al., 2013); and recent research suggests that it may be
useful for CO2 sequestration (Bonenfant et al., 2008).
There are two main methods of steel production in the UK: 1) basic oxygen
furnace (BOF) which uses hot iron from blast furnace production or steel scraps and 2)
Electric arc furnace (EAF) which uses cold scrap steel only. The composition of the slag
produced from each method is generally very similar and the main components of steel
slag are oxides of calcium, magnesium silicon, iron, manganese, aluminium and various
sulfates and phosphates (Proctor et al., 2000). It can also contain, in varying
concentrations, toxic elements such as As, Cr, Cd, Mo, Pb and V (Roadcap et al., 2005;
Chaurand et al., 2007a). Steel production is a high lime process, where lime (CaO) is
used to increase heat transfer and remove impurities. Although, slag is generally
considered to be a non-hazardous material there is some environmental concern about
the highly alkaline leachates produced from slag weathering (Schwab et al., 2006;
Chaurand et al., 2007a; Navarro et al., 2010).
When lime (CaO) in the slag comes in contact with water it undergoes a cascade
of reactions that produce a high pH leachate. These reactions are listed previously in
90
Chapter 2 (see reaction sequence 2.1 to 2.7). Firstly, solid lime mixes with water to
produce aqueous Ca(OH)2 (2.1). Once in contact with water, portlandite dissociates into
its component ions and thus the alkalinity of the resulting solution is increased by the
presence of hydroxide ions (2.2).
Together with high pH leachates, the precipitation of calcite (CaCO3) can also
be cause for environmental concern. When the alkaline leachate comes into contact
with atmospheric CO2, as it does at the surface or a groundwater spring, then carbonate
precipitates (see Chapter 2 for the reaction sequence, equations 2.3 – 2.7). (Schwab et
al., 2006; Mayes et al., 2008). Calcite precipitation can be very rapid in affected areas
and the formation of calcite hardpans can smother benthic habitats and reduce the light
penetration to benthic primary producers (Bayless and Schulz, 2003; Mayes et al.,
2006).
Other typical problems from steel slag weathering include; high total dissolved
solids (> 5000 mg L-1), increased salinity and elevated aqueous metal and metalloid
concentrations such as; As, Ba, Co Hg, Pb and V (Bayless and Schulz, 2003; Roadcap
et al., 2005; Chaurand et al., 2007a; Cornelis et al., 2008) which can all affect water and
soil profiles after coming into contact with steel slag leachates.
Chromium and vanadium are metals that are regularly found at high
concentrations in steel slags (up to 30,000 mg kg-1 and up to 10,000 mg kg-1
respectively) (Cornelis et al., 2008). Both Cr and V are used as additives in steel
production to increase strength, and resistance to corrosion and metal fatigue. In
particular, the demand for vanadium in steel is growing. This is most evident in China
where stronger steel is required to meet new building regulations since the Sichuan
earthquakes in 2008 (Horn, 2010). Both metals are considered to be potentially toxic
91
(Barceloux, 1999a; Barceloux, 1999d) and can be mobilised at high pH due to the
formation of oxyanions [CrO42-, VO4
3-] (Langmuir, 1997). Vanadium in slag is known
to be toxic to farm animals; in 1990 23 heifers from a herd of 98 died from acute
vanadium poisoning when basic slag containing ~3% vanadium was used as a soil
fertilizer (Frank et al., 1996).
Chaurand et al. (2007a) investigated leaching of Cr and V from BOF slags via
leaching tests at pH 5 and long term field simulations, but found that low concentrations
of Cr were mobilised whilst V release was significantly higher. The difference in the
leaching behaviour between Cr and V here is due to the differences in the geochemical
behaviour of the two metals. In the environment, chromium exists as Cr(III), which is
mostly insoluble and Cr(IV), which is very toxic and readily transported, especially
under oxic conditions (Fendorf, 1995). The pH 5 leaching tests and long term field
simulations found that chromium was found as the less mobile Cr(III) and that the
speciation of Cr did not evolve during either process, thus retarding Cr mobility
(Chaurand et al., 2007a). Vanadium, however, was found as V(IV) in the slags but was
oxidised to V(V) during the leaching process, thus enhancing vanadium mobility
(Chaurand et al., 2007a).
The transport mechanisms of V from steel slag are strongly influenced by pH,
Eh, concentration of V and competing ions, aqueous complexation and surface
complexation to surrounding mineral surfaces (Apul et al., 2005; Chaurand et al.,
2007a; Cornelis et al., 2008). Vanadium has oxidation states ranging from –1 to 5+,
although 3+ 4+ and 5+ are most common in natural environments. The toxicity and
mobility of vanadium increases with valence state and therefore pentavalent V
compounds are the most toxic and most common in natural waters (Wehrli and Stumm,
1989; Wanty and Goldhaber, 1992; Crans, 1998). Vanadium(V) also has a tendency to
92
polymerise at concentrations in excess of 100 µM (5.1 mg L-1) (Peacock and Sherman,
2004b). At lower concentrations V(V) forms mononuclear oxyanionic species which
tend to be mobilised at high pH (Langmuir, 1997; Cornelis et al., 2008). However,
sorption processes have been shown to play a large part in the retardation of V(V) as the
vanadate anions act as a phosphate analogue and bind via ligand exchange (Peacock and
Sherman, 2004b). Sorption processes are also very important for the vanadyl cation
[V(IV), usually as VO2+] (Wehrli and Stumm, 1989). Microbial reduction of V(V) to
less mobile forms V(IV) has also been reported (Lyalikova and Yurkova, 1992;
Carpentier et al., 2003; Lloyd, 2003; Ortiz-Bernad et al., 2004; Carpentier et al., 2005)
which may be another important mechanism involved in the fate of vanadium in steel
slag affected soils.
Soils affected by steel slag leachates have a characteristically high pH. However,
many microorganisms have adapted to life at high pH and ‘alkaliphiles’ grow optimally
when pH is >9. The main challenge for alkaliphiles is how to maintain a neutral
intracellular pH, when the extracellular pH can be up to 2 pH units higher (Krulwich
and Guffanti, 1989; Horikoshi, 1999). One mechanism for maintaining internal pH
homeostasis by alkaliphiles is by the selective exchange of sodium and hydronium ions
across plasma membranes via a Na+/H+ and K+/H+ antiporter system. Here, Na+ or K+
ions from within the cell are exchanged with external H+ ions, thus decreasing internal
pH (Ito et al., 1997; Horikoshi, 1999). Diverse microbial communities have been
described from many high pH industrial waste sites (Horikoshi, 1999; Takai et al.,
2001; Ye et al., 2004; Burke et al., 2012b; Whittleston et al., 2013). Roadcap et al.
(2006) specifically describe a microbial community from a legacy steel slag site at Lake
Calumet, Illinois, USA.
93
Due to the high mobility of vanadium from steel slags it is important to establish
what controls the fate and transport of V into surrounding soils. This chapter reports on
a pilot study into the possible mechanisms controlling vanadium transport from a legacy
steel slag site in the north of England, to the surrounding soil profile. It uses a
multidisciplinary approach to gain insight into the processes controlling V leached from
steel slags. It also investigates redox indicators and the microbial community that exists
in alkaline soils altered by steel slag leachates.
4.2 Material and Methods
4.2.1 Site Description
The Grove Heaps, in the Hownsgill Valley, near Consett, Co. Durham were used
for over a century to dump blast furnace and steel slag until the closure of the Consett
steelworks works in 1980. The heaps are situated in a valley that was a glacial melt
water channel. Rainwater that enters the slag re-emerges in the valley bottom, where a
large alkaline leachate pond has formed (pH 11-12) (Mayes et al., 2006). There is
reduced vegetation around the leachate pond due to high pH and an area of calcite has
formed around the pond. Vegetation in the surrounding area is much denser, with reeds,
rushes and grasses. The hydrochemistry across the wetland has been previously
described by Mayes et al. (2008) and trace metal analysis showed elevated
concentrations of vanadium at some areas across the site, with concentrations breaching
Environment Agency guidance levels for freshwater of 20μg L-1 (The Environment
Agency, 2011).
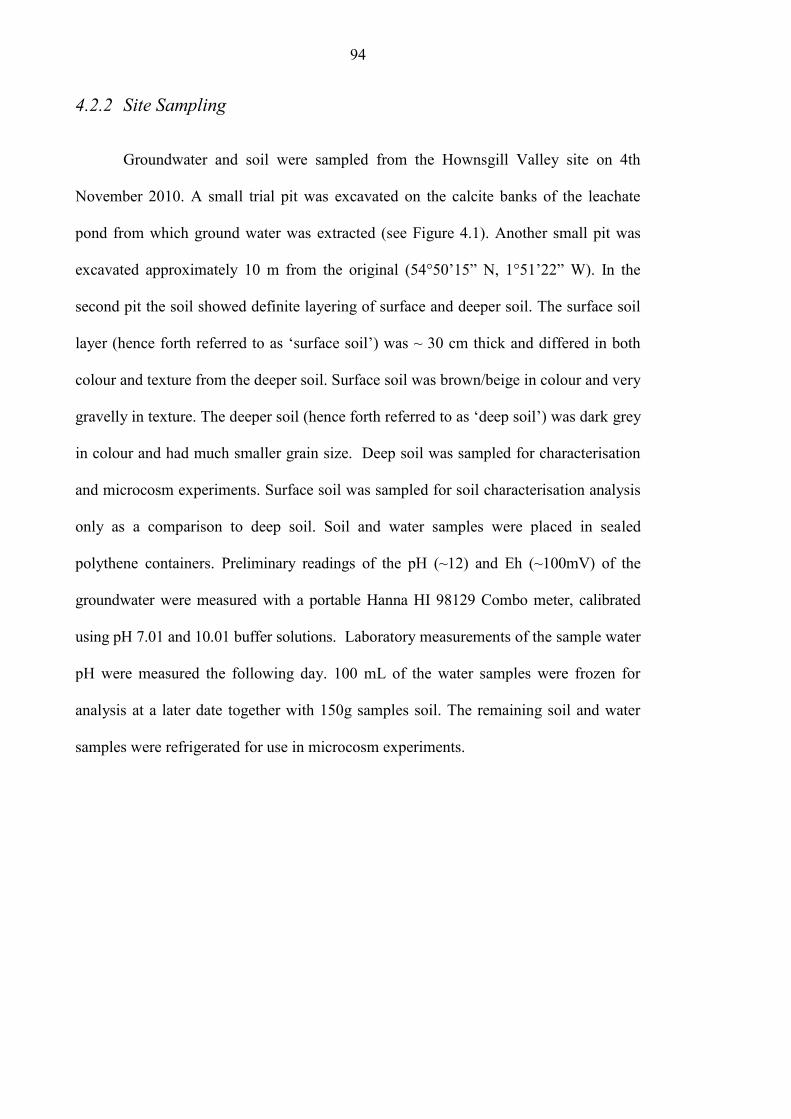
94
4.2.2 Site Sampling
Groundwater and soil were sampled from the Hownsgill Valley site on 4th
November 2010. A small trial pit was excavated on the calcite banks of the leachate
pond from which ground water was extracted (see Figure 4.1). Another small pit was
excavated approximately 10 m from the original (54°50’15” N, 1°51’22” W). In the
second pit the soil showed definite layering of surface and deeper soil. The surface soil
layer (hence forth referred to as ‘surface soil’) was ~ 30 cm thick and differed in both
colour and texture from the deeper soil. Surface soil was brown/beige in colour and very
gravelly in texture. The deeper soil (hence forth referred to as ‘deep soil’) was dark grey
in colour and had much smaller grain size. Deep soil was sampled for characterisation
and microcosm experiments. Surface soil was sampled for soil characterisation analysis
only as a comparison to deep soil. Soil and water samples were placed in sealed
polythene containers. Preliminary readings of the pH (~12) and Eh (~100mV) of the
groundwater were measured with a portable Hanna HI 98129 Combo meter, calibrated
using pH 7.01 and 10.01 buffer solutions. Laboratory measurements of the sample water
pH were measured the following day. 100 mL of the water samples were frozen for
analysis at a later date together with 150g samples soil. The remaining soil and water
samples were refrigerated for use in microcosm experiments.
95
Figure 4.1 – Schematic diagram of the Hownsgill Valley sites, showing sample location
edited from Mayes et al. (2006)
4.2.3 Sample Characterisation
The soil was oven dried at 60°C and finely ground for X-ray powder diffraction
(XRD) and X-ray fluorescence measurements (XRF). XRD analysis was performed on
a Bruker D8 powder X-ray diffractometer with a Ge(111) monochromator. XRF
analysis was performed on a PANalytical Axios Advanced XRF spectrometer. Soil pH
measurements were carried out using standard method for pH of soils (ASTM, 2006).
The 0.5M HCl extractable Fe(II) was measured by Ferrozine assay and the total amount
of 0.5M HCl extractable Fe was measured by reaction with hydroxylammonium
96
hydrochloride and ammonium acetate buffer solution prior to Ferrozine assay (Lovley
and Phillips, 1986a; Viollier et al., 2000). The acid volatile sulfide (AVS) method for
soil sulfide content was also carried out using an extraction with cold 6M HCl followed
by a precipitation step with CuCl (adapted see (Morse and Cornwell, 1987)). Inorganic
phosphate was determined using the molybdate blue method (Aspila et al., 1976). Total
inorganic carbon (TIC) and total organic carbon (TOC) contents were determined from
samples that had been dried and finely ground, using a Carlo Erba NA 2500 Elemental
Analyser. BET specific surface area was also determined. Samples for BET were
degassed with N2 on a Micromeritics FlowPrep 060 sample degas system prior to
analysis with a Micromeritics Gemini V BET surface area analyser.
Groundwater analysis was carried using an Optima 5300 DV inductively
coupled plasma-optical emission spectrometer for all elements mentioned except V.
Groundwater V concentration was measured using a Perkin-Elmer DRCII inductively
coupled plasma-mass spectrometer.
4.2.4 Reduction Microcosm Experiments
Triplicate reduction microcosms spiked with V(V) were prepared as follows:
11g (±0.2g) of homogenised soil was added to a 120 mL glass serum bottle together
with 100 mL of groundwater and V(V) spike from a NaVO3 solution (100 µL, 100 mM,
therefore microcosm concentration was 100µM and no polymerisation of V(V) should
occur). Control experiments were prepared as above and then heat treated by
autoclaving (120°C for 30 mins). A sterile groundwater control was also prepared by
filtering 100 mL groundwater with a V(V) spike (100 µL, 100 mM) through a 0.2 µm
filter and then heat treating by autoclave (120°C for 30 mins). The headspaces of all the
97
experiments were purged with oxygen free nitrogen (OFN) before capping and crimp
sealing. All experiments were incubated in the dark at 21°C for the duration of the
experiments. The microbially-active experiments and heat treated controls were
sampled periodically for geochemical analysis to produce a progressive time series. At
each sample point, microcosms were shaken and 3 mL of slurry was extracted using
aseptic technique with sterile and OFN-flushed needles and syringes (Burke et al.,
2006). Samples were centrifuged (3 min, 16,000 g) and soil and water was analysed for
a range of redox indicators, V(V) and microbiology.
4.2.5 Geochemical Analysis
The pH was measured using a Thermo Scientific Orion DualStar pH/ISE
benchtop meter with calibrated electrodes (the pH electrodes were calibrated daily with
pH 4, 7 and 10 standard buffer solutions). The ORP (as an indicator for Eh) was
measured using a Hamilton Polyplast ORP BNC electrode. Aqueous chloride, sulfate,
nitrate and nitrite concentrations were determined by ion chromatography on a Dionex
DX600 AS16 column and hydroxide gradient elution with supressed conductivity and
UV detection which was fitted for absorption at 225 nm. Aqueous V(V) concentrations
were determined using UV-vis spectroscopy method on a Cecil CE 3021
spectrophotometer using 4-(2-pyrodylazo)-resorcinol (PAR) (Budevsky, 1965; Ortiz-
Bernad et al., 2004) indicator. Fe(II) in solids was also determined using UV/vis
spectroscopy after extraction by 0.5M HCl and reaction with ferrozine (Lovley and
Phillips, 1986a; Viollier et al., 2000). Standards and calibrations were routinely checked
for accuracy and precision. All calibrations had good linearity (typically r2 ≥0.99).
98
4.2.6 X-ray Absorption Near Edge Structure Spectroscopy (XANES)
XANES spectra from the soil were collected at the V K-edge (5465 eV) on
beamline I18 at the Diamond Light Source in May 2012. Approximately 100 mg of
moist soil (day zero) was prepared for XANES analysis by mounting under argon
atmosphere into Perspex holders with Kapton™ windows. Samples were frozen (-20°C)
and transported to the synchrotron on dry ice and kept frozen until analysed. Standard
spectra were collected from various V(III), V(IV) and V(V) aqueous solutions (1000 mg
L-1), and from vanadate adsorbed to Al(OH)3. The V-Al(OH)3 was prepared by
suspension of 1 g Al(OH)3 in 1 L DIW and adding 1 ml of 1000 mg L-1 Na3VO4 (made
up in 0.01 mol L-1 NaOH at pH 12). The mixed suspension was stirred for 48 hours and
the final pH was 7.0. The V-Al(OH)3 solid was recovered by centrifugation (600 g) and
prepared for analysis as a moist paste as above. For each sample and standard multiple
XANES spectra were then averaged and normalised using Athena version 0.8.061
(Ravel and Newville, 2005b). The V pre-edge peak energy was determined by
calculation of the area normalised centroid energy position following the method of
Chaurand et al. (2007b)
4.2.7 DNA Extraction, Sequencing and Analysis
DNA was extracted from the deep soil (0.4307g) using a FastDNA spin kit
(Qbiogene, Inc.) and FastPREP instrument (unless explicitly stated, the manufacturer’s
protocol were followed precisely). DNA fragments in the size range 3kb ~20kb were
isolated on a 1% agarose, “1x” Tris-borate-EDTA (TBE) gel stained with ethidium
bromide to enable viewing under UV light (10x TBE solution from Invitrogen Ltd.,
99
UK). The DNA was extracted from the gel using a QIAquick gel extraction kit
(QIAGEN Ltd., UK). The purified DNA was then used for subsequent analysis.
4.2.8 16S rRNA gene sequencing
A fragment of the 16S rRNA gene of approximately 500bp was PCR amplified
using broad-specificity bacterial primers 8f (5–AGAGTTTGATCCTGGCTCAG-3)
(Eden et al., 1991) and 519r (5–GWATTACCGCGGCKGCTG-3) where K =G or T,
W = A or T (Lane et al., 1985). The PCR reaction mixture contained: DIW (10µL),
purified DNA solution (25µL), GoTaq DNA polymerase (1µL), PCR reaction buffer,
MgCl2 (1.5mM, 10µL), PCR nucleotide mix (10mM, 1µL) and 8f and 519r primers
(20µM, 1.5µL). The final reaction volume was 50µL. The reaction mixtures were
incubated at 95°C for 2 min and then cycled 30 times through three steps; denaturing
(95°C, 30s), annealing (50°C, 30s), primer extension (72°C, 45s). This was then
followed by a final extension step at 72°C for 7 minutes. The PCR product was purified
using a QIAquick PCR purification kit and amplification product sizes were verified by
electrophoresis of 10 µL of PCR product and 2 µL of 6x loading dye in a 1% agarose
TBE gel with ethidium bromide staining.
The PCR product was ligated into the standard cloning vector pGEM-T Easy
(Promega Corp., USA). The ligation mixture contained: DIW (2.6 µL), 2X Rapid
ligation buffer (5 µL), pGEM-T Easy Vector (50ng, 1µL), PCR product (0.4 µL), T4
DNA Ligase (3 Weiss units/µL, 1 µL). The final ligation volume was 10 µL. The
ligated product was then transformed into E.Coli XL1-Blue supercompetent cells
(Stratagene). The transformed cells were then grown on LB-agar plates containing
ampicillin (100 µg mL-1) at 37°C for ~17 hours. The plates were dressed with IPTG and
100
X-gal (as per Stratgene protocol) for blue-white colour screening. 60 colonies
containing an insert were restreaked on LB-ampicillin agar plates and incubated at 37°C
overnight.
60 single colonies from the restreaked plates were transferred to a 96 well
ampicillin plate (GATC Biotech Ltd) and were sent for sequencing (GATC Biotech,
Germany). The sequences were uploaded to the Ribosomal Database Project (RDP)
naive Bayesian classifier version 2.2 (Wang et al., 2007), in February 2011. The quality
of each 16S rRNA sequence was then evaluated with Mallard (version 1.02) (Ashelford
et al., 2006) and probable chimeras were excluded from any further analysis. Non-
chimeric sequences were then submitted to the Genbank database (accession numbers
HE584610 – HE584610, see Appendix A, Table A1 for full details. Sequences were
grouped into operational taxonomic units (OTU’s) using MOTHUR software (Schloss
et al., 2009) (>98% furthest neighbour sequence similarity cut off).
4.2.9 Phylogenetic tree building
The Seqmatch tool from the Ribosomal Database project was used to identify
16S rRNA gene sequences from type strains similar to the sequences from this study.
The 16S rRNA gene sequences from these type strains were downloaded from the
EMBL database and aligned with new sequences using Clustal X software package
(version 2.0.11) and phylogenetic trees were constructed from the distance matrix by
neighbour joining. Bootstrap analysis was performed by 1000 replicates and resulting
phylograms were drawn using Treeview (version 1.6.6) software package.
101
Bootstrap analysis is a form of statistical analysis that determines the accuracy
of a phylogenetic relationship by matching subsets of data (Baldauf, 2003). It is
generally accepted that a figure of >70% indicates reliable phylogenetic grouping (Hillis
and Bull, 1993).
4.3 Results
4.3.1 Soil Characterisation and Groundwater Analysis
Soil characterisation is presented in Tables 4.1 and 4.2. Briefly, the soils were
dominated by quartz (SiO2) and calcite (CaCO3) and with small amounts of layered
silicates and feldspars. The main difference between the surface and deep soils was the
amount of calcite. The XRD patterns indicated that there was much more calcite in the
surface soil (see appendix A Figures A1 and A2 for XRD patterns). Also, there was a
single small characteristic peak indicating a trace of hematite in the deep soil, which
was not present in the surface soil. XRF analysis (Table 4.1) reveals that there are
elevated concentrations of Cr and Pb in the soil (The Environment Agency, 2011).Acid
volatile sulfide analysis was carried out on the soil sample. There was only a very small
amount of sulfide visible on the filter paper (weighing 0.00078g). Due to these minor
quantities the Copper/EDTA titration step for quantification was not carried out. In
order for the quantification step to be viable there must be a sufficient quantity of
sulfide precipitate present to distinguish any difference over the detection limit (Morse
and Cornwell, 1987).
Analysis of the groundwater sampled is summarised in Table 4.3. Briefly the
groundwater has a characteristically high pH (pH 11.8) and a relatively low
concentrations of aqueous Ca2+ when compared to other geochemical data from the site
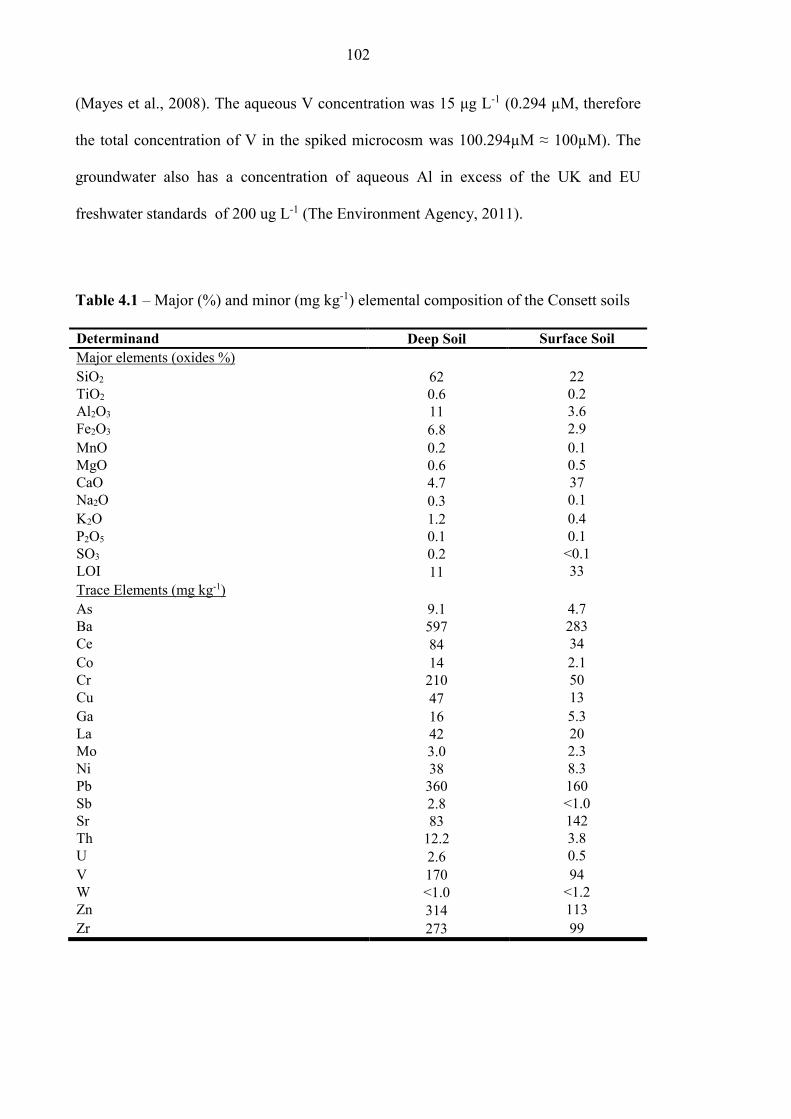
102
(Mayes et al., 2008). The aqueous V concentration was 15 μg L-1 (0.294 µM, therefore
the total concentration of V in the spiked microcosm was 100.294µM ≈ 100µM). The
groundwater also has a concentration of aqueous Al in excess of the UK and EU
freshwater standards of 200 ug L-1 (The Environment Agency, 2011).
Table 4.1 – Major (%) and minor (mg kg-1) elemental composition of the Consett soils
Determinand Deep Soil Surface Soil
Major elements (oxides %)
SiO2 62 22
TiO2 0.6 0.2
Al2O3 11 3.6
Fe2O3 6.8 2.9
MnO 0.2 0.1
MgO 0.6 0.5
CaO 4.7 37
Na2O 0.3 0.1
K2O 1.2 0.4
P2O5 0.1 0.1
SO3 0.2 <0.1
LOI 11 33
Trace Elements (mg kg-1)
As 9.1 4.7
Ba 597 283
Ce 84 34
Co 14 2.1
Cr 210 50
Cu 47 13
Ga 16 5.3
La 42 20
Mo 3.0 2.3
Ni 38 8.3
Pb 360 160
Sb 2.8 <1.0
Sr 83 142
Th 12.2 3.8
U 2.6 0.5
V 170 94
W <1.0 <1.2
Zn 314 113
Zr 273 99
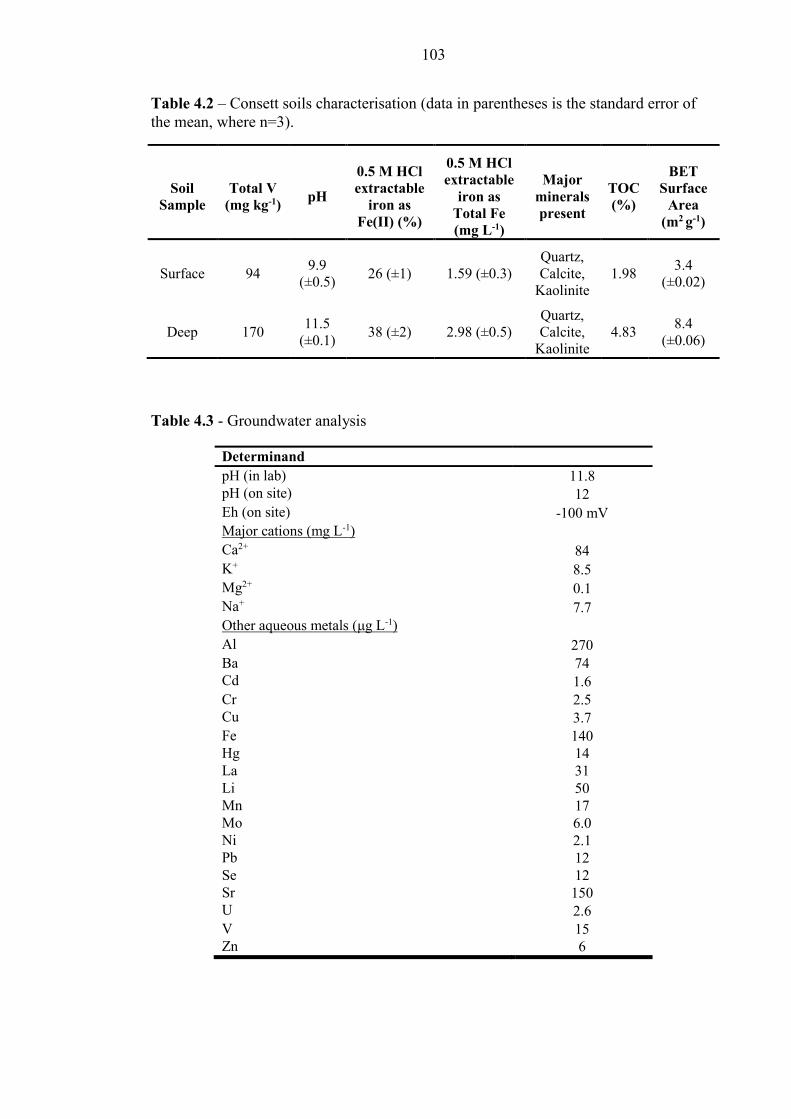
103
Table 4.2 – Consett soils characterisation (data in parentheses is the standard error of
the mean, where n=3).
Soil
Sample
Total V
(mg kg-1) pH
0.5 M HCl
extractable
iron as
Fe(II) (%)
0.5 M HCl
extractable
iron as
Total Fe
(mg L-1)
Major
minerals
present
TOC
(%)
BET
Surface
Area
(m2 g-1)
Surface 94 9.9
(±0.5) 26 (±1) 1.59 (±0.3)
Quartz,
Calcite,
Kaolinite
1.98 3.4
(±0.02)
Deep 170 11.5
(±0.1) 38 (±2) 2.98 (±0.5)
Quartz,
Calcite,
Kaolinite
4.83 8.4
(±0.06)
Table 4.3 - Groundwater analysis
Determinand
pH (in lab) 11.8
pH (on site) 12
Eh (on site) -100 mV
Major cations (mg L-1)
Ca2+ 84
K+ 8.5
Mg2+ 0.1
Na+ 7.7
Other aqueous metals (μg L-1)
Al 270
Ba 74
Cd 1.6
Cr 2.5
Cu 3.7
Fe 140
Hg 14
La 31
Li 50
Mn 17
Mo 6.0
Ni 2.1
Pb 12
Se 12
Sr 150
U 2.6
V 15
Zn 6
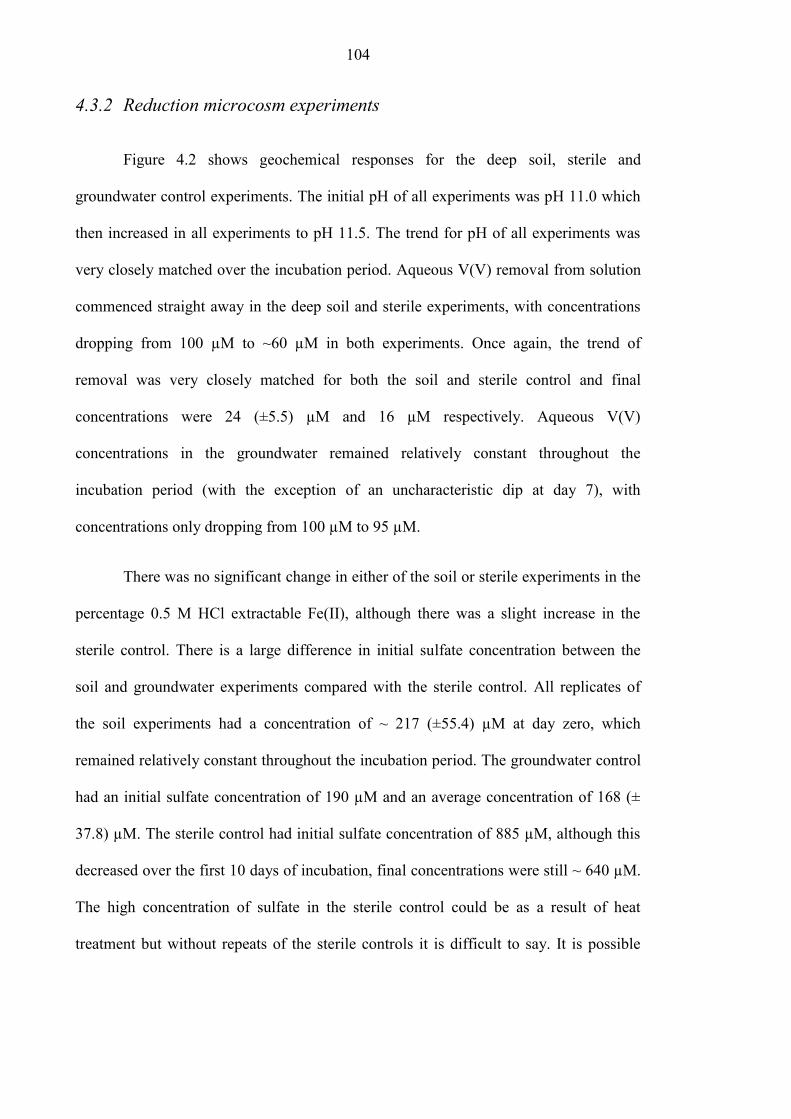
104
4.3.2 Reduction microcosm experiments
Figure 4.2 shows geochemical responses for the deep soil, sterile and
groundwater control experiments. The initial pH of all experiments was pH 11.0 which
then increased in all experiments to pH 11.5. The trend for pH of all experiments was
very closely matched over the incubation period. Aqueous V(V) removal from solution
commenced straight away in the deep soil and sterile experiments, with concentrations
dropping from 100 µM to ~60 µM in both experiments. Once again, the trend of
removal was very closely matched for both the soil and sterile control and final
concentrations were 24 (±5.5) µM and 16 µM respectively. Aqueous V(V)
concentrations in the groundwater remained relatively constant throughout the
incubation period (with the exception of an uncharacteristic dip at day 7), with
concentrations only dropping from 100 µM to 95 µM.
There was no significant change in either of the soil or sterile experiments in the
percentage 0.5 M HCl extractable Fe(II), although there was a slight increase in the
sterile control. There is a large difference in initial sulfate concentration between the
soil and groundwater experiments compared with the sterile control. All replicates of
the soil experiments had a concentration of ~ 217 (±55.4) µM at day zero, which
remained relatively constant throughout the incubation period. The groundwater control
had an initial sulfate concentration of 190 µM and an average concentration of 168 (±
37.8) µM. The sterile control had initial sulfate concentration of 885 µM, although this
decreased over the first 10 days of incubation, final concentrations were still ~ 640 µM.
The high concentration of sulfate in the sterile control could be as a result of heat
treatment but without repeats of the sterile controls it is difficult to say. It is possible
105
that the soil used was not sufficiently homogenised prior to preparing the microcosm
experiments.
Nitrate concentrations in the soil and sterile control were also very low (≤ 5
µM). There was no real evidence of nitrate removal in any of the experiments and
concentrations fluctuate in all experiments. Nitrite concentrations in both the soil
experiments and both sterile and groundwater controls follow a similar trend. Initial
concentrations are both ~ 5 µM, the concentration then increased sharply which was
followed by a period of gradual removal.
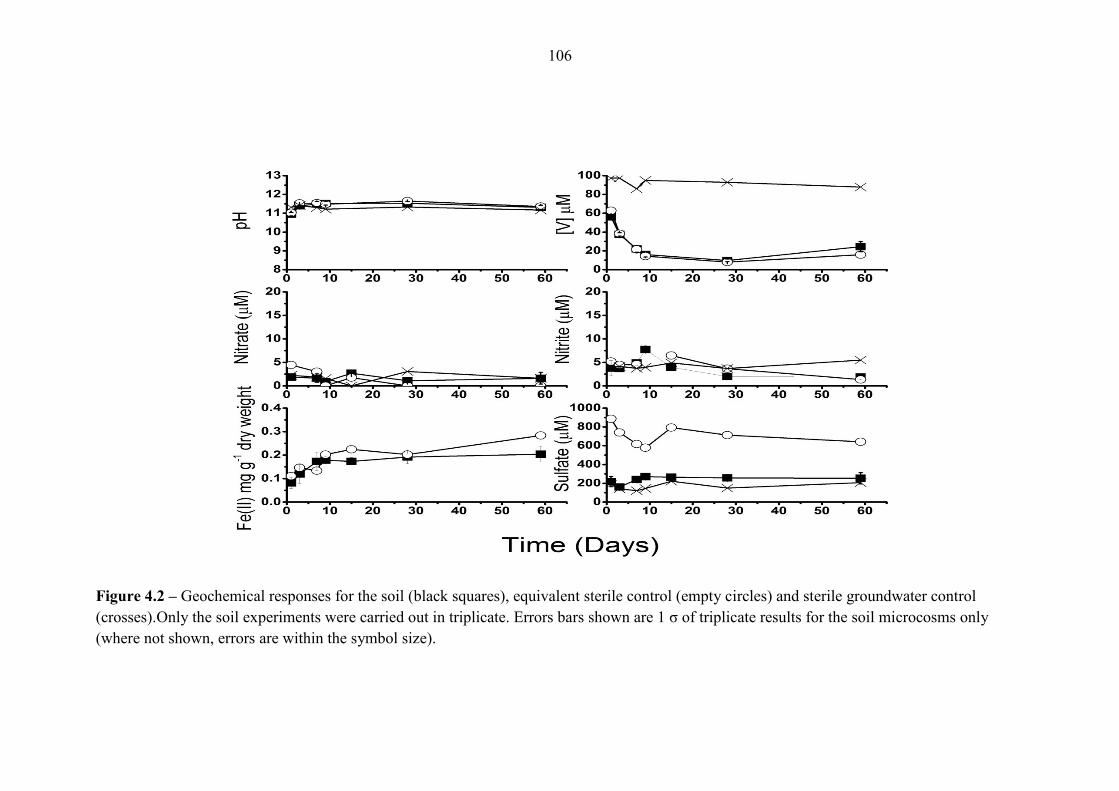
106
Figure 4.2 – Geochemical responses for the soil (black squares), equivalent sterile control (empty circles) and sterile groundwater control
(crosses).Only the soil experiments were carried out in triplicate. Errors bars shown are 1 σ of triplicate results for the soil microcosms only
(where not shown, errors are within the symbol size).
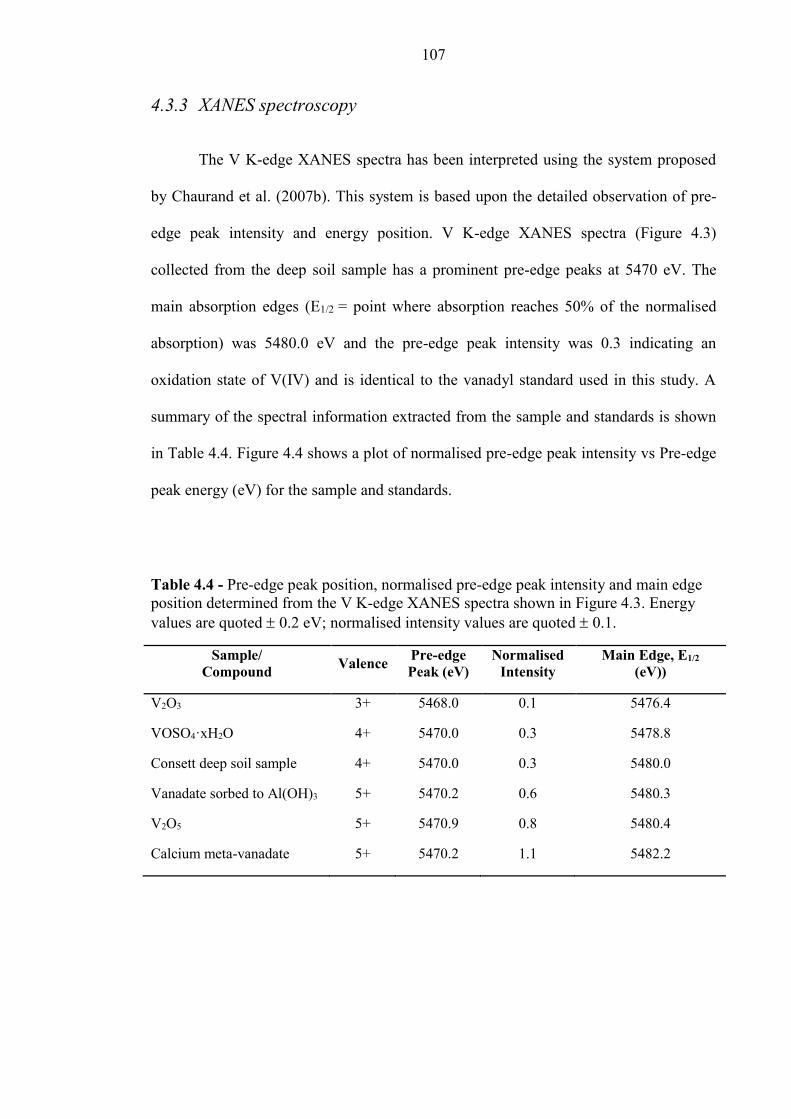
107
4.3.3 XANES spectroscopy
The V K-edge XANES spectra has been interpreted using the system proposed
by Chaurand et al. (2007b). This system is based upon the detailed observation of pre-
edge peak intensity and energy position. V K-edge XANES spectra (Figure 4.3)
collected from the deep soil sample has a prominent pre-edge peaks at 5470 eV. The
main absorption edges (E1/2 = point where absorption reaches 50% of the normalised
absorption) was 5480.0 eV and the pre-edge peak intensity was 0.3 indicating an
oxidation state of V(IV) and is identical to the vanadyl standard used in this study. A
summary of the spectral information extracted from the sample and standards is shown
in Table 4.4. Figure 4.4 shows a plot of normalised pre-edge peak intensity vs Pre-edge
peak energy (eV) for the sample and standards.
Table 4.4 - Pre-edge peak position, normalised pre-edge peak intensity and main edge
position determined from the V K-edge XANES spectra shown in Figure 4.3. Energy
values are quoted 0.2 eV; normalised intensity values are quoted 0.1.
Sample/
Compound Valence
Pre-edge
Peak (eV)
Normalised
Intensity
Main Edge, E1/2
(eV))
V2O3 3+ 5468.0 0.1 5476.4
VOSO4·xH2O 4+ 5470.0 0.3 5478.8
Consett deep soil sample 4+ 5470.0 0.3 5480.0
Vanadate sorbed to Al(OH)3 5+ 5470.2 0.6 5480.3
V2O5 5+ 5470.9 0.8 5480.4
Calcium meta-vanadate 5+ 5470.2 1.1 5482.2
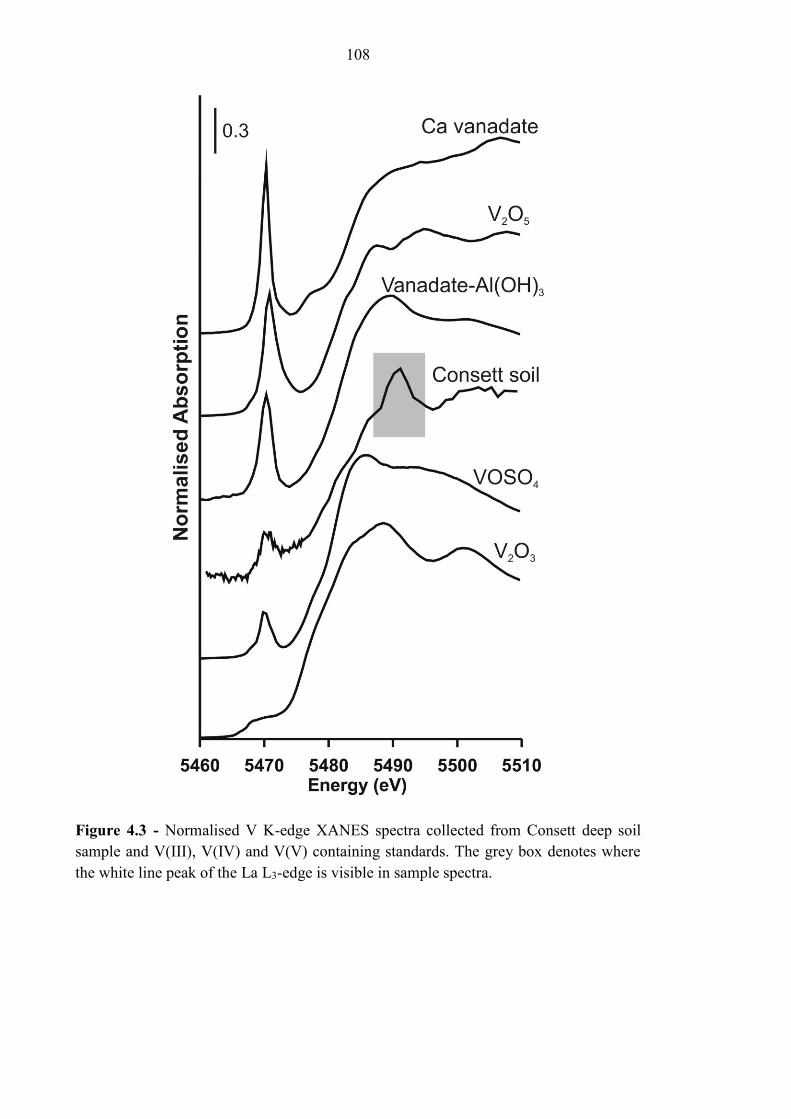
108
Figure 4.3 - Normalised V K-edge XANES spectra collected from Consett deep soil
sample and V(III), V(IV) and V(V) containing standards. The grey box denotes where
the white line peak of the La L3-edge is visible in sample spectra.
109
Figure 4.4 – Plot of normalised intensity vs Pre-edge peak energy derived from V K-
edge XANES spectra for the deep soil sample and standards from this study and Burke
et al. (2013).
4.3.4 DNA extraction, amplification and sequencing
Fifty-six 16S rRNA gene sequences were successfully recovered from the soil,
however Mallard evaluation (Ashelford et al., 2006) identified two probable chimeras
which were excluded from any further analysis. Rarefaction analysis of the sequences
(Figure 4.5) indicates that there are 12 OTU’s in the deep soil sample. Figure 4.6 shows
phylogenetic affiliation of the remaining fifty-four sequences, including ten sequences
that could not be assigned to a phylum with ≥95% confidence and are listed as
unidentified bacteria (see Appendix A, Table A1, for full assignment details). The
dominant species, indicated by a single OTU for the Deinococcus-Thermus was found
to be a Trupera-like species. A phylogenetic tree showing a characteristic member of the
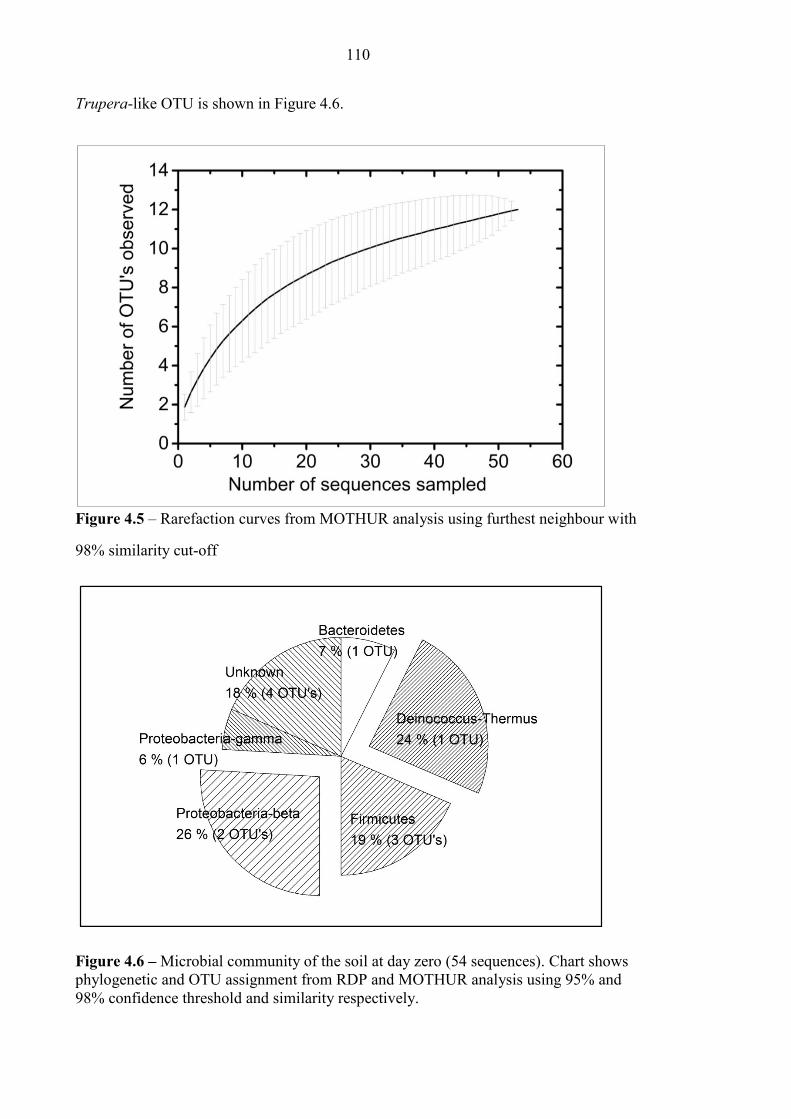
110
Trupera-like OTU is shown in Figure 4.6.
Figure 4.5 – Rarefaction curves from MOTHUR analysis using furthest neighbour with
98% similarity cut-off
Figure 4.6 – Microbial community of the soil at day zero (54 sequences). Chart shows
phylogenetic and OTU assignment from RDP and MOTHUR analysis using 95% and
98% confidence threshold and similarity respectively.
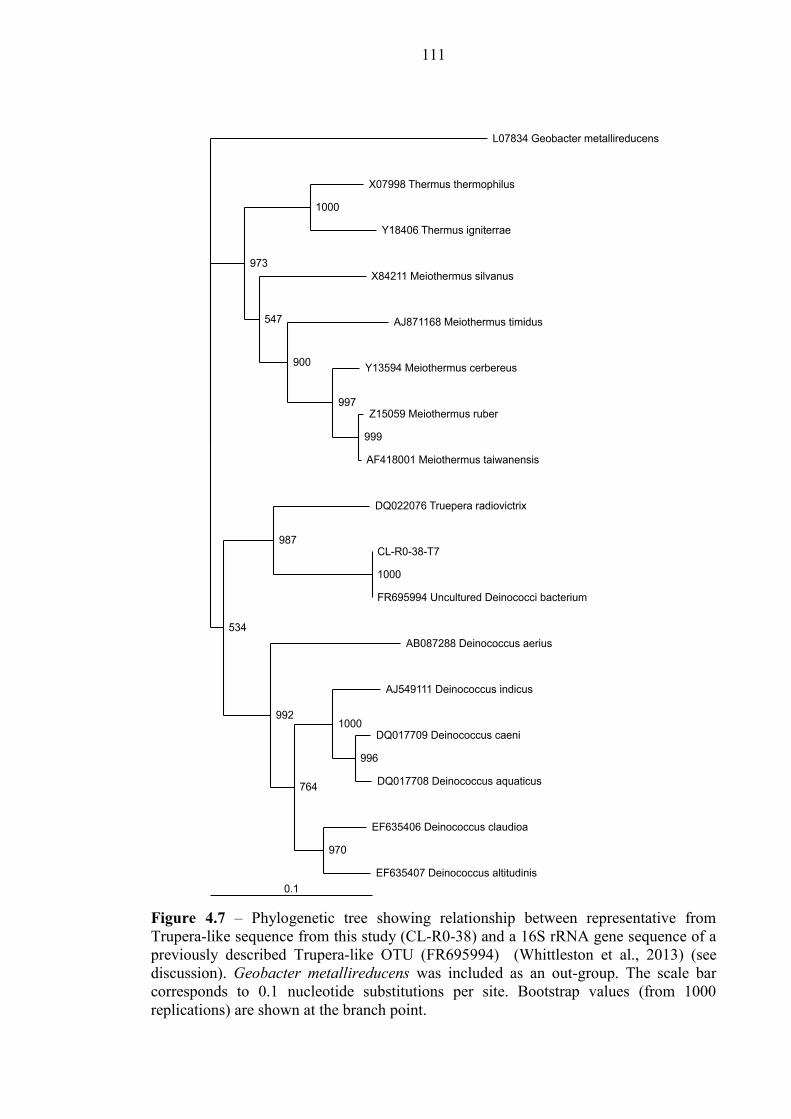
111
Figure 4.7 – Phylogenetic tree showing relationship between representative from
Trupera-like sequence from this study (CL-R0-38) and a 16S rRNA gene sequence of a
previously described Trupera-like OTU (FR695994) (Whittleston et al., 2013) (see
discussion). Geobacter metallireducens was included as an out-group. The scale bar
corresponds to 0.1 nucleotide substitutions per site. Bootstrap values (from 1000
replications) are shown at the branch point.
0.1
L07834 Geobacter metallireducens
X07998 Thermus thermophilus
Y18406 Thermus igniterrae
1000
X84211 Meiothermus silvanus
AJ871168 Meiothermus timidus
Y13594 Meiothermus cerbereus
Z15059 Meiothermus ruber
AF418001 Meiothermus taiwanensis
999
997
900
547
973
DQ022076 Truepera radiovictrix
CL-R0-38-T7
FR695994 Uncultured Deinococci bacterium
1000
987
AB087288 Deinococcus aerius
AJ549111 Deinococcus indicus
DQ017709 Deinococcus caeni
DQ017708 Deinococcus aquaticus
996
1000
EF635406 Deinococcus claudioa
EF635407 Deinococcus altitudinis
970
764
992
534
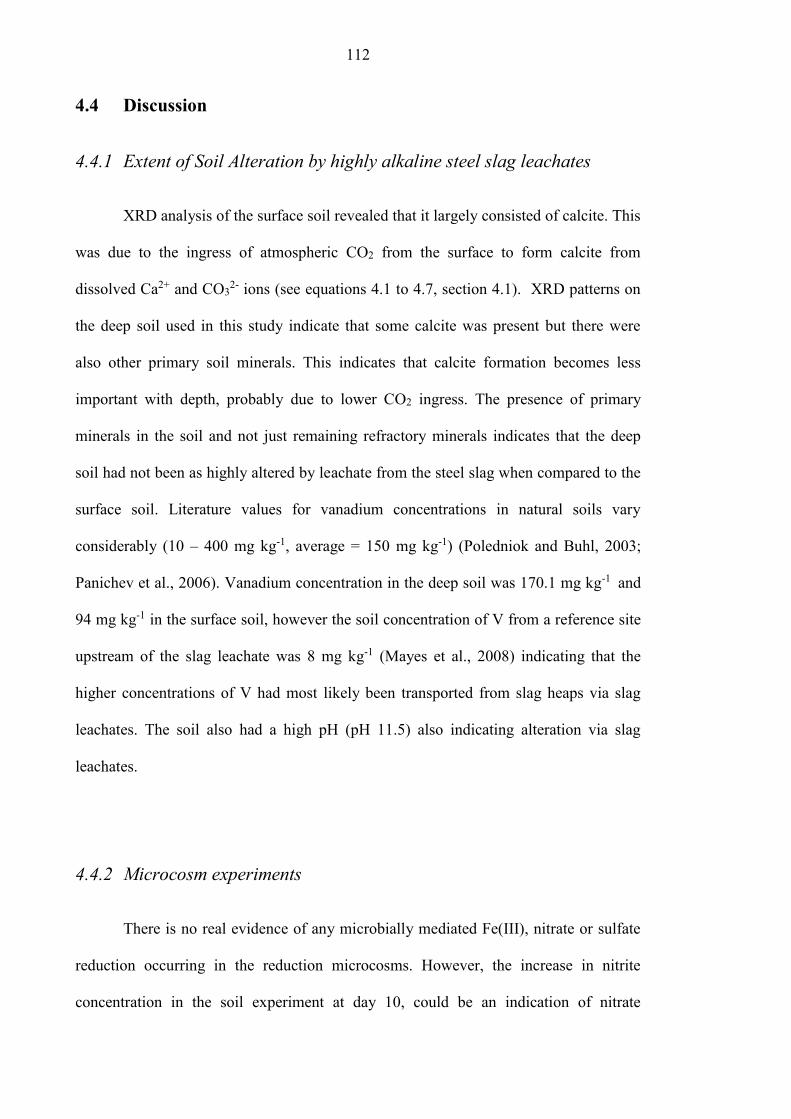
112
4.4 Discussion
4.4.1 Extent of Soil Alteration by highly alkaline steel slag leachates
XRD analysis of the surface soil revealed that it largely consisted of calcite. This
was due to the ingress of atmospheric CO2 from the surface to form calcite from
dissolved Ca2+ and CO32- ions (see equations 4.1 to 4.7, section 4.1). XRD patterns on
the deep soil used in this study indicate that some calcite was present but there were
also other primary soil minerals. This indicates that calcite formation becomes less
important with depth, probably due to lower CO2 ingress. The presence of primary
minerals in the soil and not just remaining refractory minerals indicates that the deep
soil had not been as highly altered by leachate from the steel slag when compared to the
surface soil. Literature values for vanadium concentrations in natural soils vary
considerably (10 – 400 mg kg-1, average = 150 mg kg-1) (Poledniok and Buhl, 2003;
Panichev et al., 2006). Vanadium concentration in the deep soil was 170.1 mg kg-1 and
94 mg kg-1 in the surface soil, however the soil concentration of V from a reference site
upstream of the slag leachate was 8 mg kg-1 (Mayes et al., 2008) indicating that the
higher concentrations of V had most likely been transported from slag heaps via slag
leachates. The soil also had a high pH (pH 11.5) also indicating alteration via slag
leachates.
4.4.2 Microcosm experiments
There is no real evidence of any microbially mediated Fe(III), nitrate or sulfate
reduction occurring in the reduction microcosms. However, the increase in nitrite
concentration in the soil experiment at day 10, could be an indication of nitrate
113
reduction. This slight peak in nitrite was concomitant with a reduction in nitrate but this
trend is matched in both the sterile and groundwater controls. For each redox indicator
measured, the trend for the soil experiment and sterile and groundwater controls
matched (with the exception of sulfate). This could be an indication that the sterile
sample had not been sufficiently heat treated, however there is not any real evidence in
the data to support microbially mediated Fe(III) or sulfate reduction in either the soil or
sterile systems. The sterile system is also somewhat unreliable due to the lack of
replicates. In order to assess if the patterns determined are ‘real’, then further replicates
are required to rule out any artefacts from sampling or analysis.
Abiotic processes also control the removal of V(V) from solution. Up to 90%
removal had occurred in both the soil and sterile control by day 30, whereas
concentrations remained at ~95% of the original spike in the groundwater control.
Vanadium in steel slag can be found in a number of oxidation states but due to reducing
conditions predominately as; V(0), V(III) and V(IV) (Cornelis et al., 2008). Chaurand et
al. (2007a) found V predominately as V(IV) in BOF slag which was then oxidised to
V(V) during the ageing and weathering process. Vanadium K-edge XANES indicated
that V in the Consett soil was predominantly as V(IV) before commencement of
reduction experiments. This indicates that if V was transported as V(V) in the leaching
process that a further reduction has occurred in the soil profile. Removal of the V(V)
spike from the aqueous phase in the microcosm experiments could be due to adsorption
to solids, V(V) is known to sorb weakly at pH > 10.5 (Peacock and Sherman, 2004b;
Langmuir, 1997). Therefore, a reductive precipitation reaction (where the added
vanadate is reduced to a vanadyl species that strongly sorbs to surfaces at high pH
(Peacock and Sherman, 2004b)) within the reduced soils cannot be excluded.
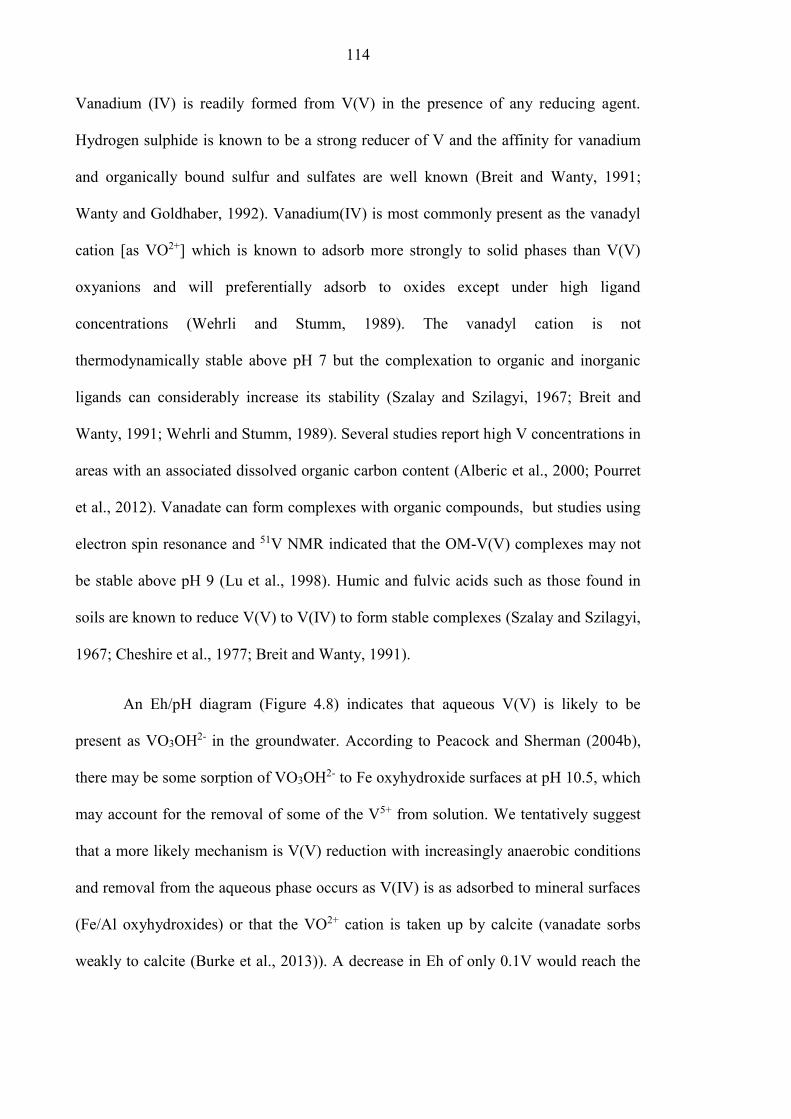
114
Vanadium (IV) is readily formed from V(V) in the presence of any reducing agent.
Hydrogen sulphide is known to be a strong reducer of V and the affinity for vanadium
and organically bound sulfur and sulfates are well known (Breit and Wanty, 1991;
Wanty and Goldhaber, 1992). Vanadium(IV) is most commonly present as the vanadyl
cation [as VO2+] which is known to adsorb more strongly to solid phases than V(V)
oxyanions and will preferentially adsorb to oxides except under high ligand
concentrations (Wehrli and Stumm, 1989). The vanadyl cation is not
thermodynamically stable above pH 7 but the complexation to organic and inorganic
ligands can considerably increase its stability (Szalay and Szilagyi, 1967; Breit and
Wanty, 1991; Wehrli and Stumm, 1989). Several studies report high V concentrations in
areas with an associated dissolved organic carbon content (Alberic et al., 2000; Pourret
et al., 2012). Vanadate can form complexes with organic compounds, but studies using
electron spin resonance and 51V NMR indicated that the OM-V(V) complexes may not
be stable above pH 9 (Lu et al., 1998). Humic and fulvic acids such as those found in
soils are known to reduce V(V) to V(IV) to form stable complexes (Szalay and Szilagyi,
1967; Cheshire et al., 1977; Breit and Wanty, 1991).
An Eh/pH diagram (Figure 4.8) indicates that aqueous V(V) is likely to be
present as VO3OH2- in the groundwater. According to Peacock and Sherman (2004b),
there may be some sorption of VO3OH2- to Fe oxyhydroxide surfaces at pH 10.5, which
may account for the removal of some of the V5+ from solution. We tentatively suggest
that a more likely mechanism is V(V) reduction with increasingly anaerobic conditions
and removal from the aqueous phase occurs as V(IV) is as adsorbed to mineral surfaces
(Fe/Al oxyhydroxides) or that the VO2+ cation is taken up by calcite (vanadate sorbs
weakly to calcite (Burke et al., 2013)). A decrease in Eh of only 0.1V would reach the
115
aqueous V(V)/V(IV) boundary at pH 11.3 (average microcosm pH over the incubation
period) (Figure 4.8).
Figure 4.8 – Eh/pH V species predominance and relative mineral stability diagram
calculated using Geochemists Workbench® for t = 21°C / P = 1 atmos. for the system V-
O-H with log ∑V/m – 0.9194 and a [H2O(aq)] = 1.
116
4.4.3 Microbial Community Analysis
The rarefaction curve (Figure 4.5) indicates that the total microbial diversity of
the soil has not been sequenced as the curve does not quite reach an asymptote (Fierer et
al., 2007). However, there is some flattening off of the curve which may indicate that
the microbial population is not very diverse compared to other soils (Fierer et al., 2007).
The successful sequences indicate that the microbial population of the deep soil appears
to be dominated by three phyla; β-Proteobacteria (25.9%), Deinicoccus-Thermus
(24.1%) and to a lesser extent Firmcutes (18.5%). Firmicutes had 3 OTU’s, 2 of which
were assigned to the order Natranaerobiales and were probably a Dethiobacter species.
The other OTU was not assigned above the class of Clostridia. The β-Proteobacteria had
2 OTU’s, which were both assigned to the order Burkholderiales. β-Proteobacteria in
the order Burkholderiales have been found in other alkaline environments (Burke et al.,
2012b).
The Deinococcus-Thermus had only 1 OTU assigned to the order of
Deinococcales and were Truepera-like species. The phylogenetic tree (Figure 4.6)
confirms this classification. Included in the phylogenetic tree is sequence FR695994,
this sequence was isolated from soil sampled from beneath a chromite ore processing
residue (COPR) disposal site (Whittleston et al., 2013). The maximum bootstrap value
(1000 matches from 1000 repetitions) indicates that the grouping between CL-R0-38-T7
and FR695994 is very reliable (Hillis and Bull, 1993). Very little is known about the
Truepera species. Truepera radiovictrix is the only Truepera species that has been
studied in any depth and has been recently sequenced as part of the Genomic
Encyclopedia of Bacteria and Archaea project (Ivanova et al., 2011). Truepera
radiovictrix was first sampled in 2005 from a hot spring in a geothermal area
117
(Albuquerque et al., 2005). The bacteria is an aerobe known to grow under multiple
extreme conditions; it is alkaliphilic, can tolerate high temperatures, moderate saline
conditions and is also resistant to ionizing radiation (Albuquerque et al., 2005).
The presence of alkaliphiles in the soils does seem to indicate that some
microbial processes (such as Fe(III) reduction, the deep soil shows some Fe(II) present
in the soil, see table 4.1) may be supported in situ despite not being observed in
microcosms. The pH of the microcosms is ~11.3, which is towards the upper limit of
most alkaliphilic bacteria (Horikoshi, 1999). Previous studies have shown that
microcosm experiments where the pH was buffered from pH 11.2 to 9.3 have elicited a
microbial response with regards to nitrate and iron reduction whereas unamended
microcosms were only able to support nitrate reduction (Whittleston et al., 2013).
4.5 Conclusions
A population of alkaliphilic bacteria dominated by a single unidentified species
within the Truepera family of Deinococcus-Thermus and two species of Burkholderiales
of β-Proteobacteria were established in the deep soil prior to the incubation
experiments. A phylogenetic tree confirmed that the Truepera-like species was related
(with high confidence) to another Truepera-like species sequenced from a COPR
disposal site (Whittleston et al., 2013).
The V(V) spiked microcosms indicated that the key processes to the attenuation
of vanadium at the Hownsgill Valley site are abiotic. Despite anaerobic incubation for
60 days, there was no real evidence of any biologically mediated redox processes
occurring in the Consett soil experiments. There was ~80% removal of aqueous V(V)
118
from both the experiment and sterile control also indicating that abiotic processes had
removed V(V) from solution, which might be due to the reduction of V(V) and the
sorption of V(IV) to mineral surfaces and the possible uptake of the VO2+ cation by
calcite present in the soil under reducing conditions.
Several issues with the data set relating to the lack of replicates in the sterile
controls make it difficult to determine between artefacts of sampling and real trends in
the data. However these data act as an interesting pilot study into the attenuation of V in
steel slag affected soils. There are several ways in which this study could be extended to
further our understanding of the microbial processes and processes controlling
vanadium transport at this site; 1) replication of microcosms at a range of different pH,
to span the upper limit of microbial activity; 2) detailed analysis of soil to investigate
the existence of micro-niches of lower pH where microbial Fe(III) reduction might
occur; 3) oxidation experiments to determine if V(IV) can be remobilised during
oxidation and, 4) an extensive site investigation to determine the interaction of the
leachate plume with natural soils.

119
4.6 References
ALBERIC, P., VIOLLIER, E., JEZEQUEL, D., GROSBOIS, C. & MICHARD, G. 2000.
Interactions between trace elements and dissolved organic matter in the stagnant anoxic deep
layer of a meromictic lake. Limnology and Oceanography, 45, 1088-1096.
ALBUQUERQUE, L., SIMOES, C., NOBRE, M. F., PINO, N. M., BATTISTA, J. R., SILVA,
M. T., RAINEY, F. A. & DA COSTA, M. S. 2005. Truepera radiovictrix gen. nov., sp nov., a
new radiation resistant species and the proposal of Trueperaceae fam. nov. Fems Microbiology
Letters, 247, 161-169.
APUL, D. S., GARDNER, K. H., EIGHMY, T. T., FALLMAN, A. M. & COMANS, R. N. J.
2005. Simultaneous application of dissolution/precipitation and surface complexation/surface
precipitation modeling to contaminant leaching. Environmental Science & Technology, 39,
5736-5741.
ASHELFORD, K. E., CHUZHANOVA, N. A., FRY, J. C., JONES, A. J. & WEIGHTMAN, A.
J. 2006. New screening software shows that most recent large 16S rRNA gene clone libraries
contain chimeras. Applied and Environmental Microbiology, 72, 5734-5741.
ASPILA, K. I., AGEMIAN, H. & CHAU, A. S. Y. 1976. SEMIAUTOMATED METHOD FOR
DETERMINATION OF INORGANIC, ORGANIC AND TOTAL PHOSPHATE IN
SEDIMENTS. Analyst, 101, 187-197.
ASTM 2006. D4972.01: standard test method for pH of soils. Annual Book of ASTM standards.
Amer Soc Test Mater.
BALDAUF, S. L. 2003. Phylogeny for the faint of heart: a tutorial. TRENDS in Genetics, 19(6),
345-351.
BARCELOUX, D. G. 1999a. Chromium. Journal of Toxicology-Clinical Toxicology, 37, 173-
194.
BARCELOUX, D. G. 1999b. Vanadium. Journal of Toxicology-Clinical Toxicology, 37, 265-
278.
BAYLESS, E. R. & SCHULZ, M. S. 2003. Mineral precipitation and dissolution at two slag-
disposal sites in northwestern Indiana, USA. Environmental Geology, 45, 252-261.
BONENFANT, D., KHAROUNE, L., SAUVE, S., HAUSLER, R., NIQUETTE, P.,
MIMEAULT, M. & KHAROUNE, M. 2008. CO2 Sequestration Potential of Steel Slags at
Ambient Pressure and Temperature. Industrial & Engineering Chemistry Research, 47, 7610-
7616.
BREIT, G. N. & WANTY, R. B. 1991. VANADIUM ACCUMULATION IN
CARBONACEOUS ROCKS - A REVIEW OF GEOCHEMICAL CONTROLS DURING
DEPOSITION AND DIAGENESIS. Chemical Geology, 91, 83-97.
BUDEVSKY, O. A. J., L. 1965. Colorimetric determination of vanadium(V) with 4-(2-
pyridylazo)-resorcinol. Talanta, 12, 291 to 301.
120
BURKE, I. T., BOOTHMAN, C., LLOYD, J. R., LIVENS, F. R., CHARNOCK, J. M.,
MCBETH, J. M., MORTIMER, R. J. G. & MORRIS, K. 2006. Reoxidation behavior of
technetium, iron, and sulfur in estuarine sediments. Environmental Science & Technology, 40,
3529-3535.
BURKE, I. T., MORTIMER, R. J. G., PALANIYANDI, S., WHITTLESTON, R. A.,
LOCKWOOD, C. L., ASHLEY, D. J. & STEWART, D. I. 2012. Biogeochemical Reduction
Processes in a Hyper-Alkaline Leachate Affected Soil Profile. Geomicrobiology Journal, 29,
769-779.
BURKE, I. T., PEACOCK, C. L., LOCKWOOD, C. L., STEWART, D. I., MORTIMER, R. J.
G., WARD, M. B., RENFORTH, P., GRUIZ, K. & MAYES, W. M. 2013. Behavior of
Aluminum, Arsenic, and Vanadium during the Neutralization of Red Mud Leachate by HCl,
Gypsum, or Seawater. Environmental Science & Technology, 47, 6527-6535.
CARPENTIER, W., DE SMET, L., VAN BEEUMEN, J. & BRIGE, A. 2005. Respiration and
growth of Shewanella oneidensis MR-1 using vanadate as the sole electron acceptor. Journal of
Bacteriology, 187, 3293-3301.
CARPENTIER, W., SANDRA, K., DE SMET, I., BRIGE, A., DE SMET, L. & VAN
BEEUMEN, J. 2003. Microbial reduction and precipitation of vanadium by Shewanella
oneidensis. Applied and Environmental Microbiology, 69, 3636-3639.
CHAURAND, P., ROSE, J., BRIOIS, V., OLIVI, L., HAZEMANN, J. L., PROUX, O.,
DOMAS, J. & BOTTERO, J. Y. 2007a. Environmental impacts of steel slag reused in road
construction: A crystallographic and molecular (XANES) approach. Journal of Hazardous
Materials, 139, 537-542.
CHAURAND, P., ROSE, J., BRIOIS, V., SALOME, M., PROUX, O., NASSIF, V., OLIVI, L.,
SUSINI, J., HAZEMANN, J.-L. & BOTTERO, J.-Y. 2007b. New methodological approach for
the vanadium K-edge X-ray absorption near-edge structure interpretation: Application to the
speciation of vanadium in oxide phases from steel slag. Journal of Physical Chemistry B, 111,
5101-5110.
CHESHIRE, M. V., BERROW, M. L., GOODMAN, B. A. & MUNDIE, C. M. 1977. METAL
DISTRIBUTION AND NATURE OF SOME CU, MN AND V COMPLEXES IN HUMIC
AND FULVIC-ACID FRACTIONS OF SOIL ORGANIC-MATTER. Geochimica Et
Cosmochimica Acta, 41, 1131-1138.
CORNELIS, G., JOHNSON, C. A., VAN GERVEN, T. & VANDECASTEELE, C. 2008.
Leaching mechanisms of oxyanionic metalloid and metal species in alkaline solid wastes: A
review. Applied Geochemistry, 23, 955-976.
CRANS, D. C., AMIN, S. S. AND KERAMIDAS, A. D. 1998. Chemistry of Relevance to
Vanadium in the Environment. In: NRIAGU, J. O. (ed.) Vanadium in the Environment, Part
One: Chemistry and Biochemistry. New York: John Wiley and Sons, Inc.
EDEN, P. A., SCHMIDT, T. M., BLAKEMORE, R. P. & PACE, N. R. 1991.
PHYLOGENETIC ANALYSIS OF AQUASPIRILLUM-MAGNETOTACTICUM USING
POLYMERASE CHAIN REACTION-AMPLIFIED 16S RIBOSOMAL-RNA-SPECIFIC DNA.
International Journal of Systematic Bacteriology, 41, 324-325.
121
FENDORF, S. E. 1995. SURFACE-REACTIONS OF CHROMIUM IN SOILS AND
WATERS. Geoderma, 67, 55-71.
FIERER, N., BREITBART, M., NULTON, J., SALAMON, P., LOZUPONE, C., JONES, R.,
ROBESON, M., EDWARDS, R. A., FELTS, B., RAYHAWK, S., KNIGHT, R., ROHWER, F.
& JACKSON, R. B. 2007. Metagenomic and small-subunit rRNA analyses reveal the genetic
diversity of bacteria, archaea, fungi, and viruses in soil. Applied and Environmental
Microbiology, 73, 7059-7066.
FRANK, A., MADEJ, A., GALGAN, V. & PETERSSON, L. R. 1996. Vanadium poisoning of
cattle with basic slag. Concentrations in tissues from poisoned animals and from a reference,
slaughterhouse material. Science of the Total Environment, 181, 73-92.
HAYNES, R. J., BELYAEVA, O. N. & KINGSTON, G. 2013. Evaluation of industrial wastes
as sources of fertilizer silicon using chemical extractions and plant uptake. Journal of Plant
Nutrition and Soil Science, 176, 238-248.
HILLIS, D. M. & BULL, J. J. 1993. AN EMPIRICAL-TEST OF BOOTSTRAPPING AS A
METHOD FOR ASSESSING CONFIDENCE IN PHYLOGENETIC ANALYSIS. Systematic
Biology, 42, 182-192.
HORIKOSHI, K. 1999. Alkaliphiles: Some applications of their products for biotechnology.
Microbiology and Molecular Biology Reviews, 63, 735-+.
HORN, D. 2010. Vanadium: Going Green. Mining Journal, 19/02/2010, p.2.
ITO, M., GUFFANTI, A. A., ZEMSKY, J., IVEY, D. M. & KRULWICH, T. A. 1997. Role of
the nhaC-encoded Na+/H+ antiporter of alkaliphilic Bacillus firmus OF4. Journal of
Bacteriology, 179, 3851-3857.
IVANOVA, N., ROHDE, C., MUNK, C., NOLAN, M., LUCAS, S., DEL RIO, T. G., TICE, H.,
DESHPANDE, S., CHENG, J.-F., TAPIA, R., HAN, C., GOODWIN, L., PITLUCK, S.,
LIOLIOS, K., MAVROMATIS, K., MIKHAILOVA, N., PATI, A., CHEN, A.,
PALANIAPPAN, K., LAND, M., HAUSER, L., CHANG, Y.-J., JEFFRIES, C. D.,
BRAMBILLA, E., ROHDE, M., GOEKER, M., TINDALL, B. J., WOYKE, T., BRISTOW, J.,
EISEN, J. A., MARKOWITZ, V., HUGENHOLTZ, P., KYRPIDES, N. C., KLENK, H.-P. &
LAPIDUS, A. 2011. Complete genome sequence of Truepera radiovictrix type strain (RQ-
24(T)). Standards in Genomic Sciences, 4, 91-99.
KRULWICH, T. A. & GUFFANTI, A. A. 1989. ALKALOPHILIC BACTERIA. Annual
Review of Microbiology, 43, 435-463.
LANE, D. J., PACE, B., OLSEN, G. J., STAHL, D. A., SOGIN, M. L. & PACE, N. R. 1985.
RAPID-DETERMINATION OF 16S RIBOSOMAL-RNA SEQUENCES FOR
PHYLOGENETIC ANALYSES. Proceedings of the National Academy of Sciences of the
United States of America, 82, 6955-6959.
LANGMUIR, D. 1997. Aqueous environmental geochemistry, Upper Saddle River, N. J.,
Prentice Hall.
122
LLOYD, J. R. 2003. Microbial reduction of metals and radionuclides. Fems Microbiology
Reviews, 27, 411-425.
LOVLEY, D. R. & PHILLIPS, E. J. P. 1986. AVAILABILITY OF FERRIC IRON FOR
MICROBIAL REDUCTION IN BOTTOM SEDIMENTS OF THE FRESH-WATER TIDAL
POTOMAC RIVER. Applied and Environmental Microbiology, 52, 751-757.
LU, X., JOHNSON, W. D. & HOOK, J. 1998. Reaction of Vanadate with Aquatic Humic
Substances: An ESR and 51V NMR Study. Environmental Science & Technology, 32, 2257-
2263.
LYALIKOVA, N. N. & YURKOVA, N. A. 1992. ROLE OF MICROORGANISMS IN
VANADIUM CONCENTRATION AND DISPERSION. Geomicrobiology Journal, 10, 15-26.
MAYES, W. M., YOUNGER, P. L. & AUMONIER, J. 2006. Buffering of alkaline steel slag
leachate across a natural wetland. Environmental Science & Technology, 40, 1237-1243.
MAYES, W. M., YOUNGER, P. L. & AUMONIER, J. 2008. Hydrogeochemistry of alkaline
steel slag leachates in the UK. Water Air and Soil Pollution, 195, 35-50.
MORSE, J. W. & CORNWELL, J. C. 1987. ANALYSIS AND DISTRIBUTION OF IRON
SULFIDE MINERALS IN RECENT ANOXIC MARINE-SEDIMENTS. Marine Chemistry, 22,
55-69.
NAVARRO, C., DIAZ, M. & VILLA-GARCIA, M. A. 2010. Physico-Chemical
Characterization of Steel Slag. Study of its Behavior under Simulated Environmental
Conditions. Environmental Science & Technology, 44, 5383-5388.
ORTIZ-BERNAD, I., ANDERSON, R. T., VRIONIS, H. A. & LOVLEY, D. R. 2004.
Vanadium respiration by Geobacter metalireducens: Novel strategy for in situ removal of
vanadium from groundwater. Applied and Environmental Microbiology, 70, 3091-3095.
PANICHEV, N., MANDIWANA, K., MOEMA, D., MOLATLHEGI, R. & NGOBENI, P. 2006.
Distribution of vanadium(V) species between soil and plants in the vicinity of vanadium mine.
Journal of Hazardous Materials, 137, 649-653.
PEACOCK, C. L. & SHERMAN, D. M. 2004. Vanadium(V) adsorption onto goethite (alpha-
FeOOH) at pH 1.5 to 12: A surface complexation model based on ab initio molecular
geometries and EXAFS spectroscopy. Geochimica Et Cosmochimica Acta, 68, 1723-1733.
POLEDNIOK, J. & BUHL, F. 2003. Speciation of vanadium in soil. Talanta, 59, 1-8.
POURRET, O., DIA, A., GRUAU, G., DAVRANCHE, M. & BOUHNIK-LE COZ, M. 2012.
Assessment of vanadium distribution in shallow groundwaters. Chemical Geology, 294-295, 89-
102.
PROCTOR, D. M., FEHLING, K. A., SHAY, E. C., WITTENBORN, J. L., GREEN, J. J.,
AVENT, C., BIGHAM, R. D., CONNOLLY, M., LEE, B., SHEPKER, T. O. & ZAK, M. A.
2000. Physical and chemical characteristics of blast furnace, basic oxygen furnace, and electric
arc furnace steel industry slags. Environmental Science & Technology, 34, 1576-1582.
123
RAVEL, B. & NEWVILLE, M. 2005. ATHENA, ARTEMIS, HEPHAESTUS: data analysis for
X-ray absorption spectroscopy using IFEFFIT. Journal of Synchrotron Radiation, 12, 537-541.
ROADCAP, G. S., KELLY, W. R. & BETHKE, C. M. 2005. Geochemistry of extremely
alkaline (pH > 12) ground water in slag-fill aquifers. Ground Water, 43, 806-816.
ROADCAP, G. S., SANFORD, R. A., JIN, Q. S., PARDINAS, J. R. & BETHKE, C. M. 2006.
Extremely alkaline (pH > 12) ground water hosts diverse microbial community. Ground Water,
44, 511-517.
SCHLOSS, P. D., WESTCOTT, S. L., RYABIN, T., HALL, J. R., HARTMANN, M.,
HOLLISTER, E. B., LESNIEWSKI, R. A., OAKLEY, B. B., PARKS, D. H., ROBINSON, C. J.,
SAHL, J. W., STRES, B., THALLINGER, G. G., VAN HORN, D. J. & WEBER, C. F. 2009.
Introducing mothur: Open-Source, Platform-Independent, Community-Supported Software for
Describing and Comparing Microbial Communities. Applied and Environmental Microbiology,
75, 7537-7541.
SCHWAB, A. P., HICKEY, J., HUNTER, J. & BANKS, M. K. 2006. Characteristics of blast
furnace slag leachate produced under reduced and oxidized conditions. J Environ Sci Health A
Tox Hazard Subst Environ Eng, 41, 381-95.
SZALAY, A. & SZILAGYI, M. 1967. ASSOCIATION OF VANADIUM WITH HUMIC
ACIDS. Geochimica Et Cosmochimica Acta, 31, 1-&.
TAKAI, K., MOSER, D. P., ONSTOTT, T. C., SPOELSTRA, N., PFIFFNER, S. M.,
DOHNALKOVA, A. & FREDRICKSON, J. K. 2001. Alkaliphilus transvaalensis gen. nov., sp
nov., an extremely alkaliphilic bacterium isolated from a deep South African gold mine.
International Journal of Systematic and Evolutionary Microbiology, 51, 1245-1256.
THE ENVIRONMENT AGENCY. 2011. Chemical Standards Report [Online]. Available:
http://evidence.environment-agency.gov.uk/ChemicalStandards/report.aspx?cid=282 [Accessed
11th April 2014].
U.S. GEOLOGICAL SURVEY 2013. Mineral commodity summaries 2013. In: U.S.
GEOLOGICAL SURVEY (ed.). Reston Virginia: U.S.Geological Survey,.
VIOLLIER, E., INGLETT, P. W., HUNTER, K., ROYCHOUDHURY, A. N. & VAN
CAPPELLEN, P. 2000. The ferrozine method revisited: Fe(II)/Fe(III) determination in natural
waters. Applied Geochemistry, 15, 785-790.
WANG, Q., GARRITY, G. M., TIEDJE, J. M. & COLE, J. R. 2007. Naive Bayesian classifier
for rapid assignment of rRNA sequences into the new bacterial taxonomy. Applied and
Environmental Microbiology, 73, 5261-5267.
WANTY, R. B. & GOLDHABER, M. B. 1992. THERMODYNAMICS AND KINETICS OF
REACTIONS INVOLVING VANADIUM IN NATURAL SYSTEMS - ACCUMULATION
OF VANADIUM IN SEDIMENTARY-ROCKS. Geochimica Et Cosmochimica Acta, 56,
1471-1483.

124
WEHRLI, B. & STUMM, W. 1989. VANADYL IN NATURAL-WATERS - ADSORPTION
AND HYDROLYSIS PROMOTE OXYGENATION. Geochimica Et Cosmochimica Acta, 53,
69-77.
WHITTLESTON, R. A., STEWART, D. I., MORTIMER, R. J. G. & BURKE, I. T. 2013.
Enhancing microbial iron reduction in hyperalkaline, chromium contaminated sediments by pH
amendment. Applied Geochemistry, 28, 135-144.
YE, Q., ROH, Y., CARROLL, S. L., BLAIR, B., ZHOU, J. Z., ZHANG, C. L. & FIELDS, M.
W. 2004. Alkaline anaerobic respiration: Isolation and characterization of a novel alkaliphilic
and metal-reducing bacterium. Applied and Environmental Microbiology, 70, 5595-5602.
125
Chapter 5 Gypsum addition to soils contaminated by red
mud: Implications for aluminium, arsenic, molybdenum and
vanadium solubility.
Abstract
Red mud is highly alkaline (pH 13), saline and can contain elevated
concentrations of several potentially toxic elements (e.g. Al, As, Mo and V). Release of
up to 1 million m3 of bauxite residue (red mud) suspension from the Ajka repository,
western Hungary, caused large scale contamination of downstream rivers and
floodplains. There is now concern about the potential leaching of toxic metal/loids from
the red mud as some have enhanced solubility at high pH. This chapter investigates the
impact of red mud addition to three different Hungarian soils with respect to trace
element solubility and soil geochemistry. The effectiveness of gypsum amendment for
the rehabilitation of red mud-contaminated soils was also examined. Red mud addition
to soils caused a pH increase, proportional to red mud addition, of up to 4 pH units (e.g.
pH 7 11). Increasing red mud addition also led to significant increases in salinity,
dissolved organic carbon (DOC) and aqueous trace element concentrations. However,
the response was highly soil specific and one of the soils tested buffered pH to around
pH 8.5 even with the highest red mud loading tested (33% w/w); experiments using this
soil also had much lower aqueous Al, As, and V concentrations. Gypsum addition to
soil / red mud mixtures, even at relatively low concentrations (1% w/w) was sufficient
to buffer experimental pH to 7.5 - 8.5. This effect was attributed to the reaction of Ca2+
supplied by the gypsum with OH- and carbonate from the red mud to precipitate calcite.
The lowered pH enhanced trace element sorption and largely inhibited the release of Al,
As and V. Mo concentrations, however, were largely unaffected by gypsum induced
126
pH buffering due to the greater solubility of Mo (as molybdate) at circumneutral pH.
Gypsum addition also leads to significantly higher porewater salinities and column
experiments demonstrated that this increase in total dissolved solids persisted even after
25 pore volume replacements. Gypsum addition could therefore provide a cheaper
alternative to recovery (dig and dump) for treatment of red mud affected soils. The
observed inhibition of trace metal release within red mud affected soils was relatively
insensitive to either the percentage of red mud or gypsum present, making the treatment
easy to apply. However, there is risk that over-application of gypsum could lead to
detrimental long term increases in soil salinity.
127
5.1 Introduction
Fine fraction bauxite residue (red mud) is a by-product of alumina refining, with
up to 120 million tonnes produced worldwide each year (Grafe and Klauber, 2011). Red
mud typically comprises residual iron oxides, quartz, sodium aluminosilicates, titanium
dioxide, calcium carbonate/aluminate and sodium hydroxide which raises the pH up to
13 (Grafe et al., 2011; Gelencser et al., 2011; Burke et al., 2012a). The failure of the
bauxite residue dam at the Ajkai Timfoldgyar Zrt alumina plant, western Hungary, on
the 4th October 2010 resulted in the release of up to 1 million m3 of caustic red mud
suspension (Reeves et al., 2011). The waste inundated homes and land downstream
causing 10 deaths and over 150 serious injuries. Approximately 40 km2 of agricultural
and urban land was affected and the red mud was transported over 120 km downstream
(Reeves et al., 2011; Mayes et al., 2011). This was the largest recorded environmental
release of red mud and, as such, studies on the after-effects of the spill have both
improved the knowledge-base on risks associated with red mud (Gruiz et al., 2012) and
informed broader management strategies for stockpiled red mud. At Ajka, Hungary, red
mud samples contained elevated concentrations of potentially toxic trace elements such
as Al (75000 mg kg-1), As (150 mg kg-1) and V (900 mg kg-1) (Mayes et al., 2011;
Ruyters et al., 2011). Red mud leachates are also hyperalkaline (pH 13), and can be
directly toxic to aquatic life (Wilkie and Wood, 1996). Equally important is the
enhanced mobility of several oxyanionic forming trace elements at high pH (Langmuir,
1997). Water in contact with Ajka red mud had dissolved Al concentration of 800 mg L-
1, and dissolved As, V, and Mo concentrations of 4 - 6 mg L-1 (Mayes et al., 2011).
The initial response to the accident was to dose affected rivers with weak acids
and gypsum (up to 23,500 t (Rédey, 2012)) to neutralise the water, and (in some cases)
128
to plough the red mud into the fields to prevent dust formation (Gelencser et al., 2011;
Renforth et al., 2012). Longer term strategies included the building of new containment
dams and the large scale recovery of red mud deposits from affected land, although thin
deposits of red mud (< 5 cm) were not routinely recovered (Klebercz et al., 2012).
Studies on the effect of the red mud in soils conducted in the weeks following the spill
suggested that the high NaOH present inhibits plant growth (Ruyters et al., 2011),
however, little is known about the longer term leaching and potential for
bioaccumulation of metal/loids into plants grown in soils affected by the Ajka red mud
spill.
Acid dosing and gypsum addition to rivers were both effective in lowering pH
values and metal/loid concentrations in river waters downstream of the spill (Burke et
al., 2012a; Mayes et al., 2011; Renforth et al., 2012). Lack of Ca2+ in red mud leachate
(Renforth et al., 2012) limits the natural pH reduction mechanism (Equations 5.1 and
5.2). Providing excess free Ca2+ is therefore the main effect of gypsum addition. The
reaction, which involves CO2 in-gassing to form calcite with net OH- removal, can be
rapid in high pH systems (Renforth et al., 2012).
OH-(aq) + CO2(aq) ↔ HCO3
-(aq) (5.1)
2OH-(aq) + CaSO4.2H2O(s) +2CO2(g) ↔
CaCO3(s) +SO42-
(aq) + 2H2O(l) + H2CO3(aq) (5.2)
The Ca2+ provided by gypsum addition can also displace Na+ from exchange
complexes and potentially reduces salt stress to vegetation (Grafe and Klauber, 2011;
129
Grafe et al., 2011). Although gypsum addition has also been shown to be very effective
in the rehabilitation of stock-piled red mud (Courtney and Timpson, 2004; Courtney and
Timpson, 2005; Courtney and Kirwan, 2012), studies have focussed primarily on soil
sodicity and availability of major ions (e.g. Al, Na, Ca: (Courtney et al., 2009; Courtney
and Kirwan, 2012; Courtney and Harrington, 2012) and less on the mobility of
potentially toxic trace elements (e.g. As, Mo and V). At Ajka, gypsum addition to
affected soils was not attempted, but it is therefore possible that gypsum addition may
have been a useful tool for soil stabilisation and negated the need for such extensive
recovery of marginally-contaminated soils. This was highlighted as a more appropriate
and cost-effective alternative approach for dealing with red mud-contaminated
floodplain areas in official reviews of the disaster response (Adam et al., 2011b).
The primary objective of this chapter is a preliminary investigation into the
potential geochemical effects of red mud mixing with different soils collected from the
Torna and upper Marcal catchments. Batch experiments were used to determine the
evolution of chemical properties (e.g. pH, salinity) when soil was mixed with red mud.
The solubility of several potentially problematic elements (Al, As, Mo and V) was
investigated as a function of red mud loading and the resultant perturbation in soil pH
over short time incubation periods. Finally, gypsum was added to soil / red mixtures in
batch and column tests to determine the effectiveness of gypsum addition for treatment
of red mud-contaminated soils. As such, this chapter provides information not only on
potential remedial strategies for environmental release of red mud but also provides
some basic analogue data on the soil and leachate quality that would be anticipated in
amended red mud in bauxite residue disposal areas (BDRAs).
130
5.2 Materials and Methods
5.2.1 Sample Collection
Samples were collected in May 2011. Red mud was collected from inside the
breached Ajka repository (Lat. 47°4’58”N, Long.17°29’34”E) and three soil samples
(that did not receive red mud during the 2010 spill) were collected from sites
representative of the varying land uses and landforms in the affected Torna and Upper
Marcal catchment, western Hungary. Soil SS was an agricultural topsoil (Lat.
47°6’38”N, Long. 17°23’43”). Soil OR was a non-agricultural topsoil sampled from
below the rootlet layer at 10-50 cm (Lat. 47° 5’46”N, 17° 15’1”E). Soil WL was a
wetland soil from within a reed bed area (Lat. 47°5’56”N, Long. 17°13’41”E). The
Hungarian soils were used in the batch experiments described below. The column
experiments (also described below) required significantly greater amount of soil than
was originally sampled. Therefore, a well characterised sandy silt loam (Soil E1),
collected from north western England in May 2009, was used in column experiments.
All red mud and soils were stored at 4°C ±2°C in polypropylene containers until used.
Soil WL was stored anaerobically using Anaerogen™ sachets.
5.2.2 Sample Characterisation
The red mud and soil samples (after oven drying (105 ⁰C) and grinding in a
mortar and pestle) were characterised by X-ray powder diffraction using a Bruker D8
Advance XRD, X-ray fluorescence using a PANalytical Axios Advanced XRF
spectrometer (data corrected for loss on ignition; % weight loss after furnace treatment
at 1050 ⁰C), total organic carbon analysis using a Carlo Erba NA 2500 Elemental
131
Analyser. The pH was determined (using homogenised field moist soils) after 10 g : 10
mL suspension in deionised water [ASTM method D4972-01]. The BET surface area
was determined (on oven dried samples) after degassing with N2 on a Micromeritics
FlowPrep 060 sample degas system prior to analysis with a Micromeritics Gemini V
BET surface area analyser. Principal Component Analysis (PCA) of the red mud and
soil samples was under-taken on standardized elemental concentration data and
compared against other published samples from the red mud contaminated catchment
(Mayes et al., 2011).
5.2.3 Batch Experiments
All soils and the red mud were homogenised by hand before establishing
experiments, but otherwise were used as collected. Batch experiments were established
by mixing soils OR, SS and WL with red mud to achieve final concentrations of 0, 1, 5,
9, 20, and 33% red mud on a dry weight basis. (After the Ajka spill, red mud deposits in
fields varied from <1cm to, at most, ~20cm; and all deposits >5cm were routinely
recovered (Klebercz et al., 2012). If red mud was ploughed into soils to a typical depth
of ~40-50 cm, an approximate 5:50 mixing ratio (~9%), would therefore, be an
important condition for study. Larger additions, up to 33% red mud, were only
considered as worst case scenario.) The soil / red mud mixtures where suspended at
200 g L-1, in deionised water in 15 ml polypropylene centrifuge tubes, and continuously
shaken on an orbital shaker (100 rpm) for 30 days. In order to maintain an aerobic
headspace, each tube was opened daily (5 days per week, for <1 minute). Additional
batch experiments were established with the same red mud conditions as above but with
4% (w/w) addition of gypsum (CaSO4·2H2O). Finally a set of batch experiments was
132
established which contained 9% (w/w) red mud, with varying quantities of gypsum to
achieve 0, 1, 4, 8, 12, and 15% gypsum additions on a dry weight basis. After 30 days
equilibration, all tubes were centrifuged (6000 g) for 5 minutes to separate aqueous and
solid phases. All aqueous samples were then membrane filtered (0.2 µm). Duplicate
experiments were performed at two key conditions (9% red mud, and, 9% red mud +4%
gypsum) in all three soil types as a check on data reproducibility (duplicate data is
reported in Appendix A, Table A2).
5.2.4 Column Experiments
500 g of Soil E1 (< 2 mm fraction) was homogenised and mixed with red mud
(8% w/w) with and without gypsum addition (also 8% w/w). The amended soils were
hand packed into glass Omnifit™ columns (400 mm length, 50 mm diameter) with
Teflon end pieces and 50 μm filters at both the influent and effluent ends. Columns
were saturated with deionised water and left to equilibrate overnight. Thereafter,
deionised water was pumped vertically upwards through the columns using an isocratic
pump at (0.06 mL min-1; 86.4 mL day-1), with influent at the column bottom and
effluent at the top. This rate of pumping equated to approximately 1 pore volume per
day (determined as the weight difference of dry and saturated columns). Pumping was
continued until approximately 25 pore volumes had passed through each column. At
each sampling point, the volume of effluent was recorded and water samples were
collected and filtered (0.2 µm).
133
5.2.5 Geochemical Analysis
Sample pH was measured using a Microprocessor pH meter with electrodes
calibrated at pH 7 and 10 using standard buffer solutions; Total Dissolved Solids (TDS)
was determined using a Myron Ultrameter calibrated with a KCl solution. Solution
colour was determined by measuring the absorbance at 254 nm using an Uvikon XL
spectrophotometer and a quartz cell. Dissolved organic carbon (DOC) was measured on
a multi N/C® 2100 using thermocatalytic oxidation, MC-NDIR detection analysis. In
these experiments, absorbance at 254 nm and DOC concentrations were found to be
significantly correlated (Pearson’s correlation: r = 0.93, p = <0.001, n = 27), therefore,
absorbance at 254 nm was used routinely to estimate sample DOC concentration (DOC
analysis was performed on 40% of the samples). As, V and Mo concentrations were
determined in aqueous samples (after acidification with 2% HNO3) on a Perkin–Elmer
Elan DRCII inductively coupled plasma-mass spectrometer (ICP-MS) (LoD = 0.49,
0.25, and 0.86 μg L-1 respectively). Aluminium concentrations were determined by
using Flame Atomic Absorption Spectroscopy (FAAS) on an Analytic Jena ContrAA
700 (after acidification with 2% HCl; LoD = 200 μg L-1)
5.3 Results
5.3.1 Sample Characterization
The red mud mineral content is dominated by hematite, calcite, magnetite,
cancrinite and hydrogarnet (with some residual boehmite and gibbsite), which is very
similar to other red mud analysed from the Ajka spill (Gelencser et al., 2011; Burke et
al., 2012a). Sample characterisation data for the red mud, the three Hungarian soils and
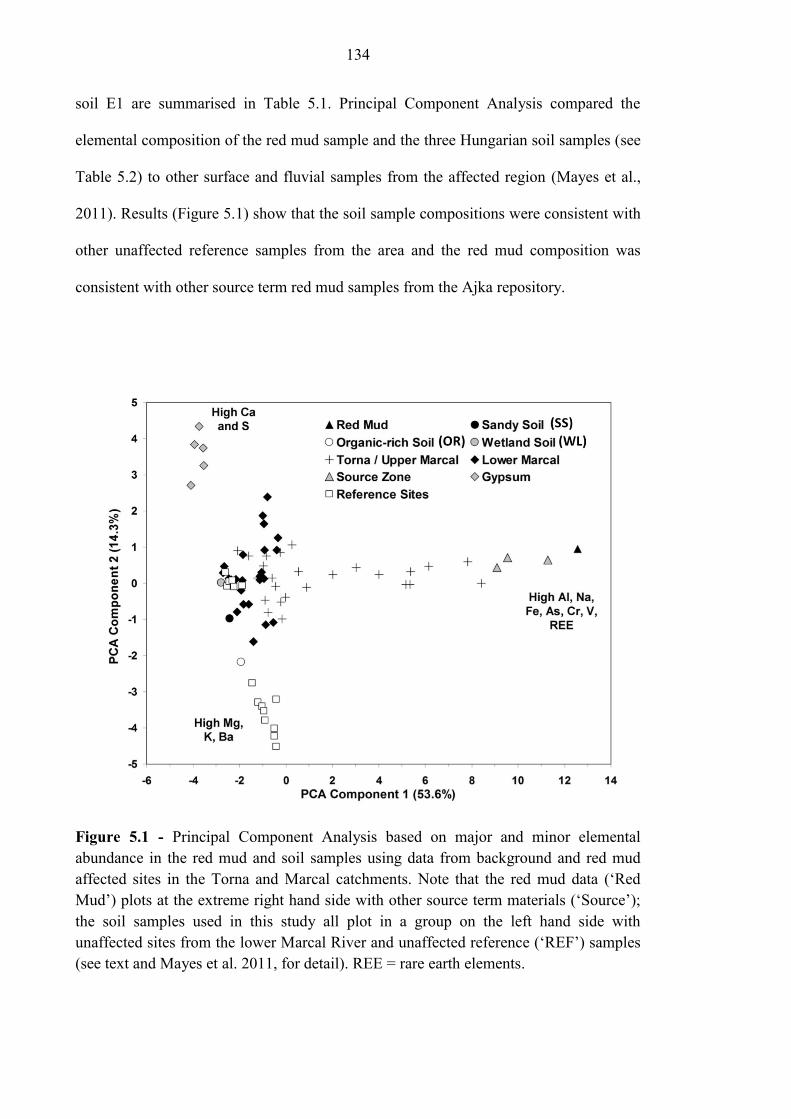
134
soil E1 are summarised in Table 5.1. Principal Component Analysis compared the
elemental composition of the red mud sample and the three Hungarian soil samples (see
Table 5.2) to other surface and fluvial samples from the affected region (Mayes et al.,
2011). Results (Figure 5.1) show that the soil sample compositions were consistent with
other unaffected reference samples from the area and the red mud composition was
consistent with other source term red mud samples from the Ajka repository.
Figure 5.1 - Principal Component Analysis based on major and minor elemental
abundance in the red mud and soil samples using data from background and red mud
affected sites in the Torna and Marcal catchments. Note that the red mud data (‘Red
Mud’) plots at the extreme right hand side with other source term materials (‘Source’);
the soil samples used in this study all plot in a group on the left hand side with
unaffected sites from the lower Marcal River and unaffected reference (‘REF’) samples
(see text and Mayes et al. 2011, for detail). REE = rare earth elements.
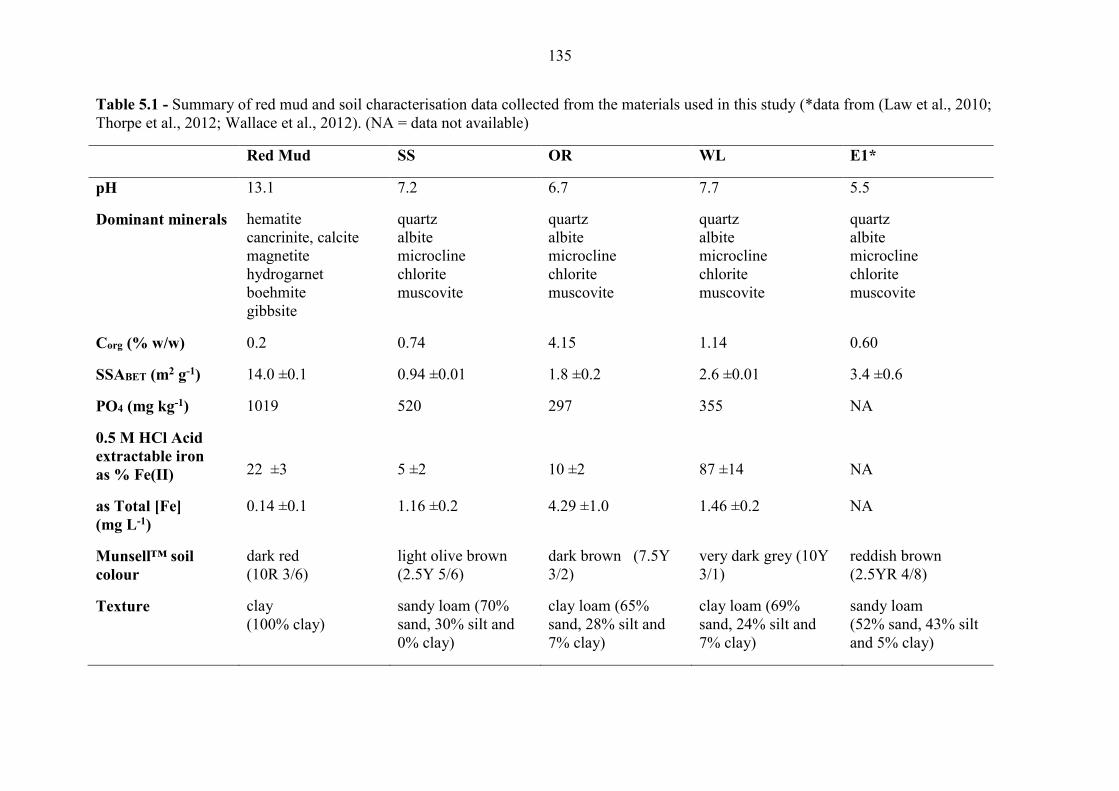
135
Table 5.1 - Summary of red mud and soil characterisation data collected from the materials used in this study (*data from (Law et al., 2010;
Thorpe et al., 2012; Wallace et al., 2012). (NA = data not available)
Red Mud SS OR WL E1*
pH 13.1 7.2 6.7 7.7 5.5
Dominant minerals hematite
cancrinite, calcite
magnetite
hydrogarnet
boehmite
gibbsite
quartz
albite
microcline
chlorite
muscovite
quartz
albite
microcline
chlorite
muscovite
quartz
albite
microcline
chlorite
muscovite
quartz
albite
microcline
chlorite
muscovite
Corg (% w/w) 0.2 0.74 4.15 1.14 0.60
SSABET (m2 g-1) 14.0 ±0.1 0.94 ±0.01 1.8 ±0.2 2.6 ±0.01 3.4 ±0.6
PO4 (mg kg-1) 1019 520 297 355 NA
0.5 M HCl Acid
extractable iron
as % Fe(II)
22 ±3
5 ±2
10 ±2
87 ±14
NA
as Total [Fe]
(mg L-1)
0.14 ±0.1 1.16 ±0.2 4.29 ±1.0 1.46 ±0.2 NA
Munsell™ soil
colour
dark red
(10R 3/6)
light olive brown
(2.5Y 5/6)
dark brown (7.5Y
3/2)
very dark grey (10Y
3/1)
reddish brown
(2.5YR 4/8)
Texture clay
(100% clay)
sandy loam (70%
sand, 30% silt and
0% clay)
clay loam (65%
sand, 28% silt and
7% clay)
clay loam (69%
sand, 24% silt and
7% clay)
sandy loam
(52% sand, 43% silt
and 5% clay)
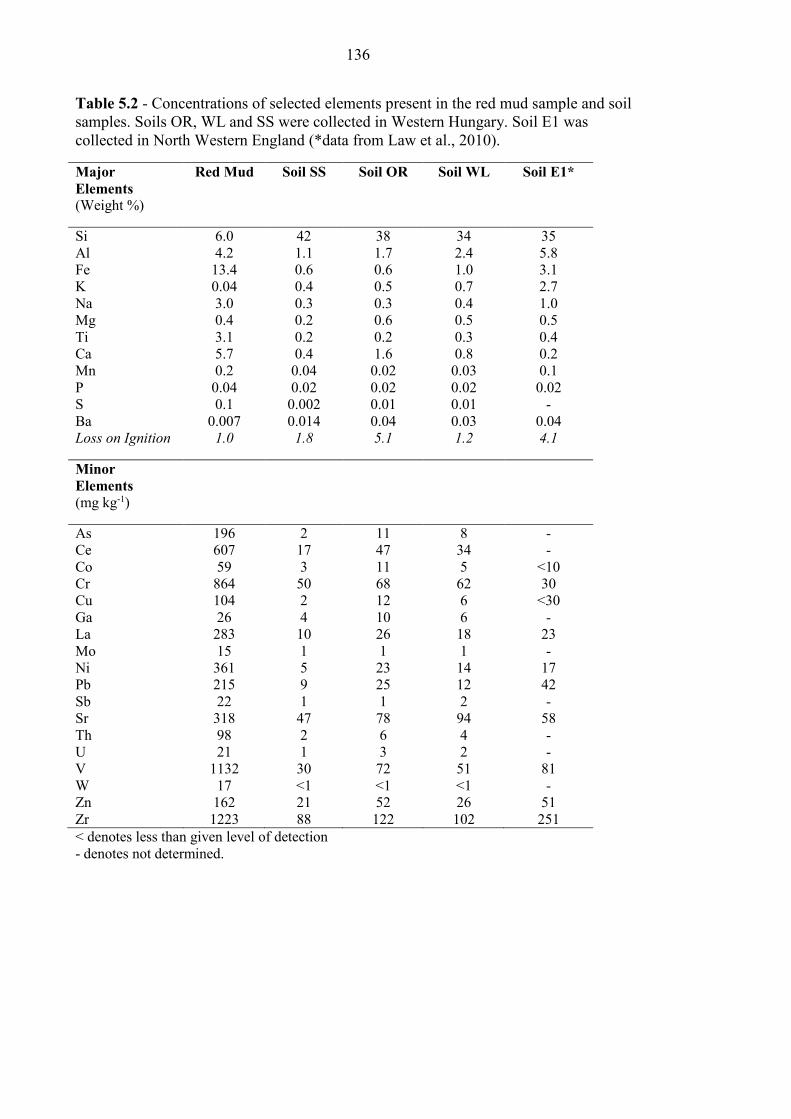
136
Table 5.2 - Concentrations of selected elements present in the red mud sample and soil
samples. Soils OR, WL and SS were collected in Western Hungary. Soil E1 was
collected in North Western England (*data from Law et al., 2010).
Major
Elements (Weight %)
Red Mud Soil SS Soil OR Soil WL Soil E1*
Si 6.0 42 38 34 35
Al 4.2 1.1 1.7 2.4 5.8
Fe 13.4 0.6 0.6 1.0 3.1
K 0.04 0.4 0.5 0.7 2.7
Na 3.0 0.3 0.3 0.4 1.0
Mg 0.4 0.2 0.6 0.5 0.5
Ti 3.1 0.2 0.2 0.3 0.4
Ca 5.7 0.4 1.6 0.8 0.2
Mn 0.2 0.04 0.02 0.03 0.1
P 0.04 0.02 0.02 0.02 0.02
S 0.1 0.002 0.01 0.01 -
Ba 0.007 0.014 0.04 0.03 0.04
Loss on Ignition 1.0 1.8 5.1 1.2 4.1
Minor
Elements
(mg kg-1)
As 196 2 11 8 -
Ce 607 17 47 34 -
Co 59 3 11 5 <10
Cr 864 50 68 62 30
Cu 104 2 12 6 <30
Ga 26 4 10 6 -
La 283 10 26 18 23
Mo 15 1 1 1 -
Ni 361 5 23 14 17
Pb 215 9 25 12 42
Sb 22 1 1 2 -
Sr 318 47 78 94 58
Th 98 2 6 4 -
U 21 1 3 2 -
V 1132 30 72 51 81
W 17 <1 <1 <1 -
Zn 162 21 52 26 51
Zr 1223 88 122 102 251
< denotes less than given level of detection
- denotes not determined.
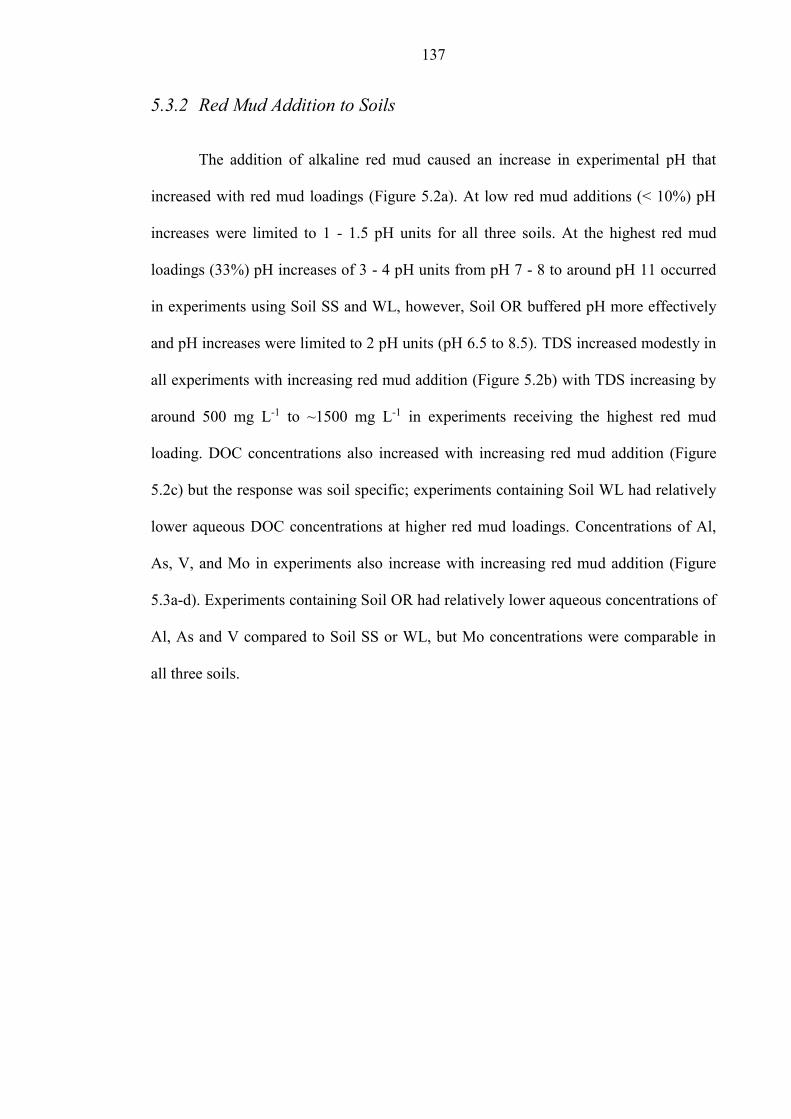
137
5.3.2 Red Mud Addition to Soils
The addition of alkaline red mud caused an increase in experimental pH that
increased with red mud loadings (Figure 5.2a). At low red mud additions (< 10%) pH
increases were limited to 1 - 1.5 pH units for all three soils. At the highest red mud
loadings (33%) pH increases of 3 - 4 pH units from pH 7 - 8 to around pH 11 occurred
in experiments using Soil SS and WL, however, Soil OR buffered pH more effectively
and pH increases were limited to 2 pH units (pH 6.5 to 8.5). TDS increased modestly in
all experiments with increasing red mud addition (Figure 5.2b) with TDS increasing by
around 500 mg L-1 to ~1500 mg L-1 in experiments receiving the highest red mud
loading. DOC concentrations also increased with increasing red mud addition (Figure
5.2c) but the response was soil specific; experiments containing Soil WL had relatively
lower aqueous DOC concentrations at higher red mud loadings. Concentrations of Al,
As, V, and Mo in experiments also increase with increasing red mud addition (Figure
5.3a-d). Experiments containing Soil OR had relatively lower aqueous concentrations of
Al, As and V compared to Soil SS or WL, but Mo concentrations were comparable in
all three soils.
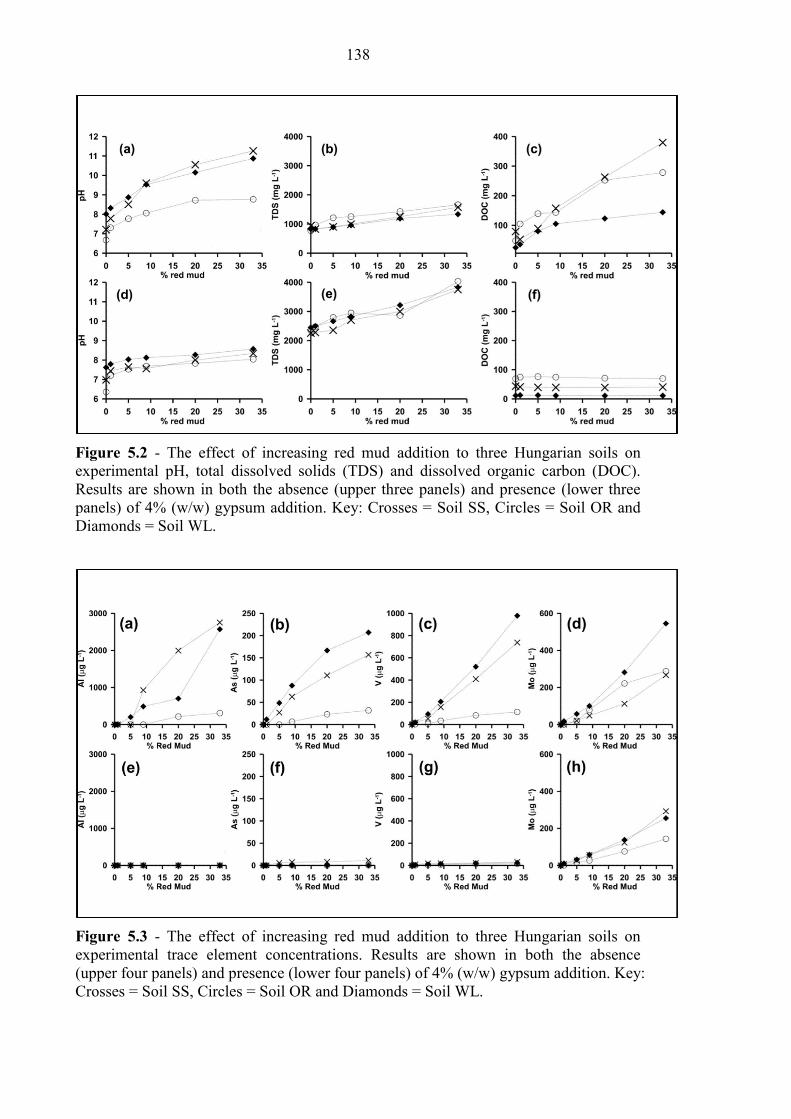
138
Figure 5.2 - The effect of increasing red mud addition to three Hungarian soils on
experimental pH, total dissolved solids (TDS) and dissolved organic carbon (DOC).
Results are shown in both the absence (upper three panels) and presence (lower three
panels) of 4% (w/w) gypsum addition. Key: Crosses = Soil SS, Circles = Soil OR and
Diamonds = Soil WL.
Figure 5.3 - The effect of increasing red mud addition to three Hungarian soils on
experimental trace element concentrations. Results are shown in both the absence
(upper four panels) and presence (lower four panels) of 4% (w/w) gypsum addition. Key:
Crosses = Soil SS, Circles = Soil OR and Diamonds = Soil WL.
139
5.3.3 Gypsum Addition to Red Mud / Soil Mixtures
When 4% gypsum was added to experiments the observed pH increases were
much lower compared to experiments without gypsum (Figure 5.2d). There was a
smaller increase of pH (up to 1 pH unit) observed with increasing red mud loadings and
no experiments had pH values above 8.5 even with 33% red mud addition. TDS,
however, was much higher in gypsum containing experiments (Figure 5.2e). Also the
gradient of TDS increases with increasing red mud addition was greater, with TDS
increasing by nearly 2000 mg L-1 to around 4000 mg L-1 as red mud addition increased
from 0 to 33%. Aqueous DOC concentrations in gypsum amended experiments were
significantly lower compared to experiments without gypsum (Figure 5.2f) and there
was no observed change in DOC concentrations with increasing red mud addition.
Aqueous Al, As and V concentrations in gypsum amended experiments (Figure 5.3e-g)
were also much lower than in unamended experiments. Aqueous Mo concentrations,
however, were only slightly lower in gypsum amended experiments (Figure 5.3h).
In experiments where the amount of gypsum added was varied (from 0 to 15%)
and red mud addition was constant (9%), it was discovered that the soils tested were
relatively insensitive to increasing gypsum addition (Figure 5.4). Approximately equal
reductions in pH and aqueous DOC, Al, As and V values were observed with 1 to 15%
gypsum addition. The observed TDS increase (Figure 5.4b) was about 1000 mg L-1
between 0 and 1% addition and further increased to about 2800-3000 mg L-1 with 4%
gypsum present. No further increase in TDS was observed for gypsum addition above
4%. Aqueous Mo concentrations do not show any reduction at any level of gypsum
addition (Figure 5.4g).
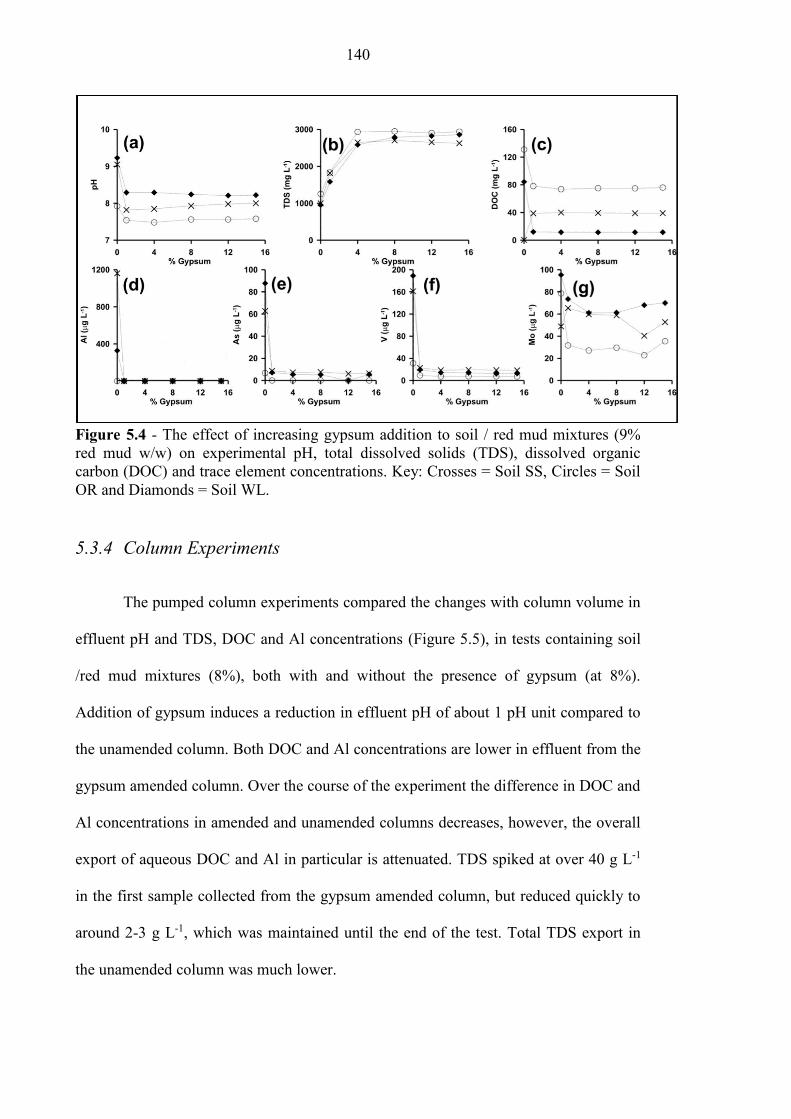
140
Figure 5.4 - The effect of increasing gypsum addition to soil / red mud mixtures (9%
red mud w/w) on experimental pH, total dissolved solids (TDS), dissolved organic
carbon (DOC) and trace element concentrations. Key: Crosses = Soil SS, Circles = Soil
OR and Diamonds = Soil WL.
5.3.4 Column Experiments
The pumped column experiments compared the changes with column volume in
effluent pH and TDS, DOC and Al concentrations (Figure 5.5), in tests containing soil
/red mud mixtures (8%), both with and without the presence of gypsum (at 8%).
Addition of gypsum induces a reduction in effluent pH of about 1 pH unit compared to
the unamended column. Both DOC and Al concentrations are lower in effluent from the
gypsum amended column. Over the course of the experiment the difference in DOC and
Al concentrations in amended and unamended columns decreases, however, the overall
export of aqueous DOC and Al in particular is attenuated. TDS spiked at over 40 g L-1
in the first sample collected from the gypsum amended column, but reduced quickly to
around 2-3 g L-1, which was maintained until the end of the test. Total TDS export in
the unamended column was much lower.
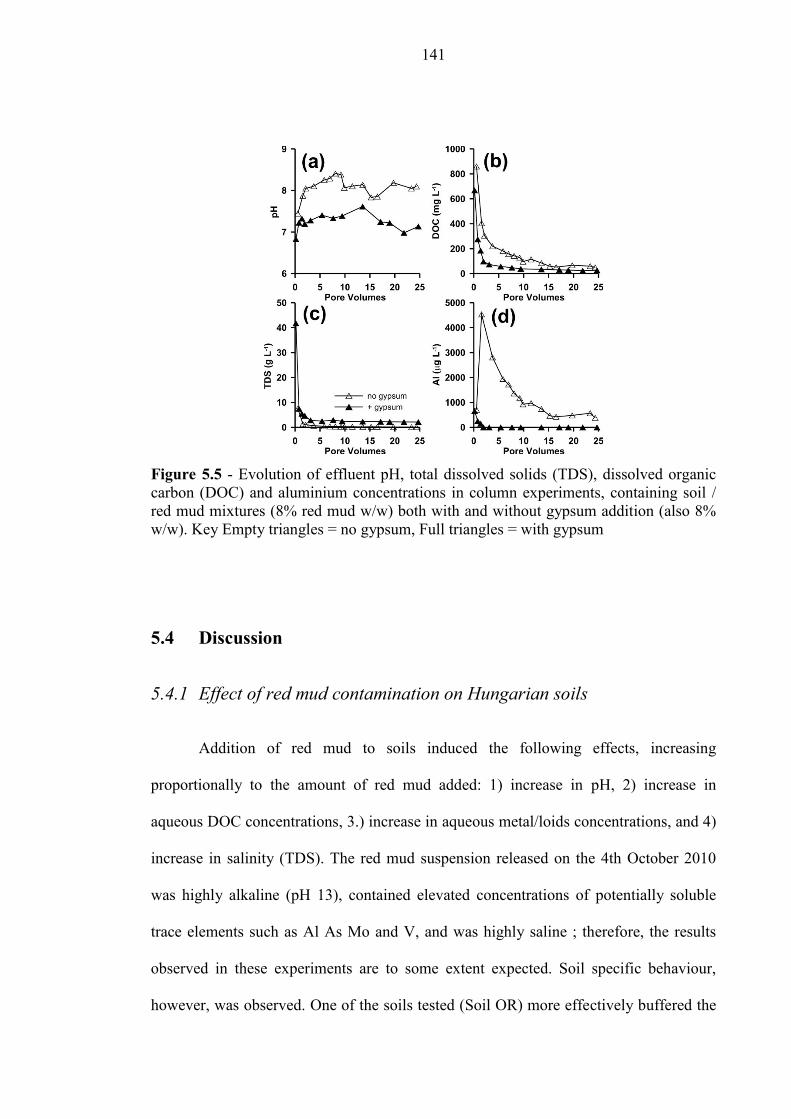
141
Figure 5.5 - Evolution of effluent pH, total dissolved solids (TDS), dissolved organic
carbon (DOC) and aluminium concentrations in column experiments, containing soil /
red mud mixtures (8% red mud w/w) both with and without gypsum addition (also 8%
w/w). Key Empty triangles = no gypsum, Full triangles = with gypsum
5.4 Discussion
5.4.1 Effect of red mud contamination on Hungarian soils
Addition of red mud to soils induced the following effects, increasing
proportionally to the amount of red mud added: 1) increase in pH, 2) increase in
aqueous DOC concentrations, 3.) increase in aqueous metal/loids concentrations, and 4)
increase in salinity (TDS). The red mud suspension released on the 4th October 2010
was highly alkaline (pH 13), contained elevated concentrations of potentially soluble
trace elements such as Al As Mo and V, and was highly saline ; therefore, the results
observed in these experiments are to some extent expected. Soil specific behaviour,
however, was observed. One of the soils tested (Soil OR) more effectively buffered the
142
alkalinity added with the red mud, possibly due to the higher organic carbon content of
this soil. This resulted in more modest increases in pH and trace element concentrations
in experiments using Soil OR compared to those using Soil SS and WL. Interestingly,
the higher pH buffering capacity observed for soil OR was very similar to that of the
single Hungarian soil sample used by Ruyters et al. (2011) who also reported relatively
small pH increases and no significant increase in trace metal concentrations in
experiments using soil / red mud mixtures (up to 17% w/w red mud). In the present
study significant increases in pH and trace element concentration were observed at red
mud loadings less than 10% w/w using two of the three soils studied.
The pattern of increasing DOC concentrations with increasing red mud addition
has not been reported previously, but can be explained by the reaction between the
alkalinity present in the red mud and organic matter present in the soils. Red mud
contains elevated concentrations of NaOH and Na2CO3, both of which have been used
in alkaline extractions designed to solubilise natural organic matter (Séby et al., 1997;
Macleod and Semple, 2000). Furthermore, in other studies increases in DOC under
analogous hyperalkaline conditions associated with a steel slag / wood shavings mix
have been ascribed to alkaline hydrolysis that releases low molecular weight carboxylic
acids (Karlsson et al., 2011). Therefore, red mud addition to soils produces an
unintended alkaline extraction liberating organic matter to solution. Along with clay
mineral dissolution (Deng et al., 2006; Fernandez et al., 2009) and sorption reactions
(Konan et al., 2012), the reaction of alkalinity with natural organic matter will therefore
be one of the main short term mechanisms for pH buffering in red mud / soil mixtures.
Also, at higher red mud loadings, where alkalinity may be present in excess, the supply
of extractable organic matter may limit DOC concentrations. The increased DOC loss
from red mud affected soils in itself has potential for wider environmental impacts in
143
terms of degradation of soil fertility and quality, loss of carbon storage and impacts on
downstream water quality.
5.4.2 Effectiveness of Gypsum for the Treatment of Red Mud contaminated
soils
Gypsum addition is highly effective in controlling soil pH even under high red
mud loading (maximum pH observed in experiments was 8.5). Gypsum addition to red
mud affected soils buffers pH by providing a source of available Ca2+ that can react
with soluble alkalinity (both carbonate and hydroxide) to produce calcite and a pH
reduction (see equation 5.2). The formation of calcite also provides solid alkalinity that
helps buffer the system to any further changes in pH. The consumption of alkalinity
prevents the alkaline extraction of natural organic matter and thus produces lower DOC
concentrations in gypsum amended experiments. The Ca2+ produced by gypsum
dissolution can displace Na+ from exchange complexes in the red mud (Grafe et al.,
2011). It is also possible that the reduction in pH might enhance the dissolution of high
pH phases that are present in the red mud (Hind et al., 1999; Hillier et al., 2007). These
effects combined with the sulfate that is released during gypsum dissolution will all
contribute to the increased amount of salinity generation observed in gypsum amended
batch experiments (i.e. there is a greater relative increase in TDS observed as red mud
loading is increased in experiments with gypsum present compared to experiments
without gypsum). This is consistent with an observation made during the initial
response to the Ajka incident that gypsum dosing of directly affected rivers resulted in
an increase in sulfate concentration long distances downstream of the spill (Mayes et al.,
2011). Batch experiments designed to test the effect of varying the concentration of
144
gypsum used found no difference in TDS between 4 and 15% additions. This implies
that once gypsum is added in excess an equilibrium (controlled by the solubility of
gypsum) is established that limits TDS release. Interestingly the same equilibrium TDS
concentration was observed in batch and column tests where gypsum was added
(Figures, 5.4b and 5.5c), implying that gypsum containing soils will continue to export
salinity until the gypsum is depleted. Overall the column tests also demonstrate that the
positive effects of 8% gypsum addition (i.e. reduction in pH, Al and DOC
concentrations) are maintained over many porewater exchanges.
In order to understand the effect of gypsum addition on trace element
concentrations, aqueous Al, As, Mo and V concentrations from all the batch
experiments have been plotted as a function of the measured pH (Figure 5.6). In
experiments without gypsum present, higher red mud loadings lead to both higher
additions of trace elements to the soil and higher pH. At the pH of the red mud, As, V,
Al and Mo are all predicted to be present as soluble oxyanions (as arsenate, vanadate,
aluminate and molybdate (Langmuir, 1997)). Strong adsorption of both arsenate and
vanadate to mineral surfaces at circumneutral pH is widely documented (Wehrli and
Stumm, 1989; Genc et al., 2003; Sherman and Randall, 2003; Peacock and Sherman,
2004b). Aluminate becomes highly insoluble below about pH 10.5 and precipitates as
an amorphous oxyhydroxide phase (Langmuir, 1997; Burke et al., 2012a). The
solubility of oxyanion-forming elements is, therefore, highly affected by pH, with
sorption / precipitation reactions limiting solution concentrations at low pH (Langmuir,
1997; Ladeira et al., 2001; Genc-Fuhrman et al., 2004; Peacock and Sherman, 2004b).
In these experiments significant increases in aqueous Al, As and V concentrations are
observed above approximately pH 8.5. Addition of gypsum to the soil / red mud
mixtures substantially reduces pH, in many cases to below 8.5. Therefore, the pH
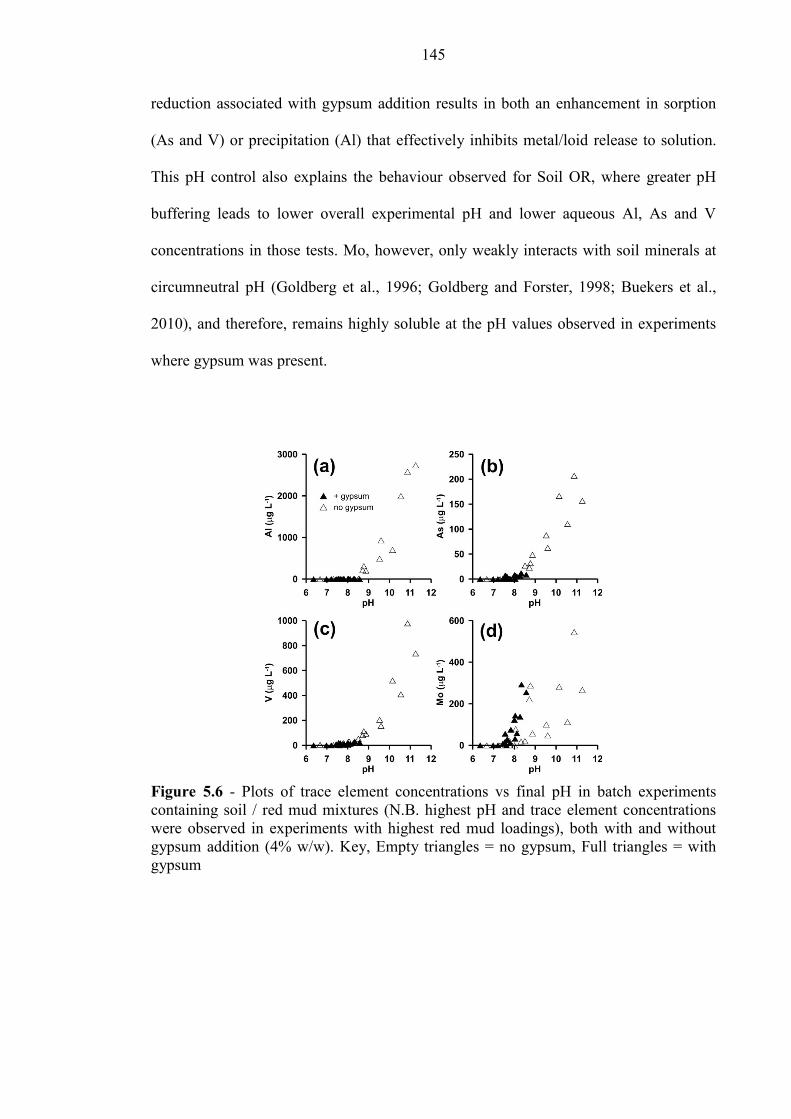
145
reduction associated with gypsum addition results in both an enhancement in sorption
(As and V) or precipitation (Al) that effectively inhibits metal/loid release to solution.
This pH control also explains the behaviour observed for Soil OR, where greater pH
buffering leads to lower overall experimental pH and lower aqueous Al, As and V
concentrations in those tests. Mo, however, only weakly interacts with soil minerals at
circumneutral pH (Goldberg et al., 1996; Goldberg and Forster, 1998; Buekers et al.,
2010), and therefore, remains highly soluble at the pH values observed in experiments
where gypsum was present.
Figure 5.6 - Plots of trace element concentrations vs final pH in batch experiments
containing soil / red mud mixtures (N.B. highest pH and trace element concentrations
were observed in experiments with highest red mud loadings), both with and without
gypsum addition (4% w/w). Key, Empty triangles = no gypsum, Full triangles = with
gypsum
146
5.5 Conclusions and implications for remediation
Addition of red mud to soils causes an increase in pH, TDS, DOC and aqueous
concentrations of oxyanion-forming trace elements. The extent of the increases
observed is ultimately controlled by the amount of red mud present; however, the
intrinsic ability of the soils to buffer pH is also important. Soils with low organic matter
and clay content, also have lower buffering capacities, and therefore, are more at risk of
suffering larger relative increases in pH, Al, As and V concentrations. In these
experiments, there appeared to be threshold pH value between pH 8.5 - 9, above which
significant increases in Al, As and V concentrations occurred. Therefore soil pH
measurements could be used as a simple screening method to identify red mud affected
soils where significant deleterious effects might be expected, with pH values higher
than 8.5 equating to greater risk.
Gypsum addition resulted in soil pH values below 8.5 in all experiments and
inhibited Al, As, V and DOC release. The immobilisation of As, V and Al is related to
their enhanced adsorption at circumneutral pH. Although adsorption is reversible (e.g.
at high pH; Langmuir (1997), the associated precipitation of calcite will typically buffer
soil pH. However, sorbed oxyanions may be remobilised by anion exchange reactions,
particularly with phosphate (and to a lesser extent carbonate), at circumneutral pH
(Altundogan et al., 2000; Genc-Fuhrman et al., 2004). Mo concentrations were not
affected by gypsum addition as sorption of the molybdate ion to soil minerals is low at
circumneutral pH. These results indicate that gypsum addition to soils receiving red
mud could be used as an emergency measure to consume the associated excess
alkalinity and reduce porewater concentrations of several toxic elements, including Al,
As and V. Although some long term potential for partial remobilisation may remain, the
147
results also highlight the potential benefits that may arise in BDRAs with lower
concentrations of potentially problematic trace elements where residue undergoes
organic matter and gypsum amendment. The effectiveness of the treatment was found to
be relatively insensitive to both the amounts of gypsum or red mud present, making this
approach easy to administer. At Ajka, up to 1 million m3 red mud slurry was released
with an estimated solids content of ~8% (w/w) and density of ~1.20 g mL-1 (Szépvölgyi,
2011) this equates to approximately 100,000 t red mud. Using the ~2:1 red mud to
gypsum ratio (i.e. 9% red mud + 4% gypsum) used in many of our experiments, we
calculate that around 50,000 t of gypsum would be required to treat of all the released
material (cf. ~23,500 t gypsum was added to rivers following the spill; Rédey (2012)).
However, lower gypsum dosing ratios were also affective in our experiments (up to
~8:1 red mud: gypsum) and many thinner red mud deposits may require no treatment if
the intrinsic pH buffering capacity of the soil is not exceeded. Also, much of the red
mud released was transported out of the system by rivers and not deposited on land
(Mayes et al., 2011); therefore, in reality much lower amounts of gypsum may actually
be required (~5-10,000 t) to treat red mud / soil mixtures. There is also the potential
advantage of preventing dust formation by ploughing in the gypsum during application.
However, caution is also required when drawing conclusions at the field scale from
laboratory experiments, as for example, the ability to achieve large scale homogenous
mixing may be difficult, reducing the effectiveness of treatment.
Although addition of gypsum to soils can improve soil structure (e.g. by
increasing hydraulic conductivity Chen and Dick (2011)), increased salinity (TDS) is
the major disadvantage associated with gypsum addition. Indeed, for larger gypsum
loadings, these salinity increases persisted for over 25 pore water exchanges (as did the
beneficial effects). Increased soil salinity can cause damage to plant growth and soil
148
microbes (Ruyters et al., 2011), therefore, gypsum addition should be carefully limited
to that required to produce pH values between 8.5 and 9 in affected soils. Long terms
trials of plant germination, and trace metal uptake would be a useful extension to this
work to determine the effects of gypsum addition to red mud affected soils on plant
growth. Alternate treatments such as soil washing and increasing dilution (of the red
mud) may also significantly reduce the risk of trace metal leaching, without the
associated risk of increased salinity due to gypsum addition; however, these methods
are likely to be expensive and slower to administer.
149
5.6 References
ADAM, J., BANVOLGYI, G., DURA, G., GRENERCZY, G., GUBEK, N., GUTPER, I.,
SIMON, G., SZEGFALVI, Z., SZEKACS, A., SZEPVOLGYI, J. & UJLAKY, E. 2011. The
Kolontár Report. Causes and lessons from the red mud disaster. In: JAVOR, B. & HARGITAI,
M. (eds.). Budapest: Greens / European Free Alliance Parliamentary Group in the European
Parliament and LMP - Politics Can Be Different.
ALTUNDOGAN, H. S., ALTUNDOGAN, S., TUMEN, F. & BILDIK, M. 2000. Arsenic
removal from aqueous solutions by adsorption on red mud. Waste Management, 20, 761-767.
BUEKERS, J., MERTENS, J. & SMOLDERS, E. 2010. Toxicity of the molybdata anion in soil
is partially explained by effects of the accompanying cation or by soil pH. Environmental
Toxicology and Chemistry, 29, 1274-1278.
BURKE, I. T., MAYES, W. M., PEACOCK, C. L., BROWN, A. P., JARVIS, A. P. & GRUIZ,
K. 2012. Speciation of arsenic, chromium, and vanadium in red mud samples from the ajka spill
site, hungary. Environmental Science & Technology, 46, 3085-92.
CHEN, L. & DICK, W. A. 2011. Gypsum as an agricultural ammendment:General use
guidelines, Wooster OH, Ohio State University Extension
COURTNEY, R. G. & HARRINGTON, T. 2012. Growth and nutrition of Holcus lanatus in
bauxite residue amended with combinations of spent mushroom compost and gypsum. Land
Degradation & Development, 23, 144-149.
COURTNEY, R. G., JORDAN, S. N. & HARRINGTON, T. 2009. Physico-chemical changes
in bauxite residue following application of spent mushroom compost and gypsum. Land
Degradation & Development, 20, 572-581.
COURTNEY, R. G. & KIRWAN, L. 2012. Gypsum amendment of alkaline bauxite residue -
Plant available aluminium and implications for grassland restoration. Ecological Engineering,
42, 279-282.
COURTNEY, R. G. & TIMPSON, J. P. 2004. Nutrient status of vegetation grown in alkaline
bauxite processing residue amended with gypsum and thermally dried sewage sludge - A two-
year field study. Plant and Soil, 266, 187-194.
COURTNEY, R. G. & TIMPSON, J. P. 2005. Reclamation of fine fraction bauxite processing
residue (red mud) amended with coarse fraction residue and gypsum. Water Air and Soil
Pollution, 164, 91-102.
DENG, Y. J., HARSH, J. B., FLURY, M., YOUNG, J. S. & BOYLE, J. S. 2006. Mineral
formation during simulated leaks of Hanford waste tanks. Applied Geochemistry, 21, 1392-
1409.
FERNANDEZ, R., MADER, U. K., RODRIGUEZ, M., DE LA VILLA, R. V. & CUEVAS, J.
2009. Alteration of compacted bentonite by diffusion of highly alkaline solutions. European
Journal of Mineralogy, 21, 725-735.
150
GELENCSER, A., KOVATS, N., TUROCZI, B., ROSTASI, A., HOFFER, A., IMRE, K.,
NYIRO-KOSA, I., CSAKBERENYI-MALASICS, D., TOTH, A., CZITROVSZKY, A., NAGY,
A., NAGY, S., ACS, A., KOVACS, A., FERINCZ, A., HARTYANI, Z. & POSFAI, M. 2011.
The Red Mud Accident in Ajka (Hungary): Characterization and Potential Health Effects of
Fugitive Dust. Environmental Science & Technology, 45, 1608-1615.
GENC-FUHRMAN, H., TJELL, J. C. & MCCONCHIE, D. 2004. Adsorption of arsenic from
water using activated neutralized red mud. Environmental Science & Technology, 38, 2428-
2434.
GENC, H., TJELL, J. C., MCCONCHIE, D. & SCHUILING, O. 2003. Adsorption of arsenate
from water using neutralized red mud. Journal of Colloid and Interface Science, 264, 327-334.
GOLDBERG, S. & FORSTER, H. S. 1998. Factors affecting molybdenum adsorption by soils
and minerals. Soil Science, 163, 109-114.
GOLDBERG, S., FORSTER, H. S. & GODFREY, C. L. 1996. Molybdenum adsorption on
oxides, clay minerals, and soils. Soil Science Society of America Journal, 60, 425-432.
GRAFE, M. & KLAUBER, C. 2011. Bauxite residue issues: IV. Old obstacles and new
pathways for in situ residue bioremediation. Hydrometallurgy, 108, 46-59.
GRAFE, M., POWER, G. & KLAUBER, C. 2011. Bauxite residue issues: III. Alkalinity and
associated chemistry. Hydrometallurgy, 108, 60-79.
GRUIZ, K., FEIGL, V., KLEBERCZ, O., ANTON, A. & VASZITA, E. Environmental Risk
Assessment of Red Mud Contaminated Land in Hungary. In: HRYCIW, R. D.,
ATHANASOPOULOS-ZEKKOS, A. & YESILLER, N., eds. GeoCongress 2012: State of the
Art and Practice in Geotechnical Engineering, 2012. American Society of Civil Engineers,
4156-4165.
HILLIER, S., LUMSDON, D. G., BRYDSON, R. & PATERSON, E. 2007. Hydrogarnet: A
host phase for Cr(VI) in chromite ore processing residue (COPR) and other high pH wastes.
Environmental Science & Technology, 41, 1921-1927.
HIND, A. R., BHARGAVA, S. K. & GROCOTT, S. C. 1999. The surface chemistry of Bayer
process solids: a review. Colloids and Surfaces a-Physicochemical and Engineering Aspects,
146, 359-374.
KARLSSON, S., SÖBERG, V. & GRANDIN, A. 2011. Hetertrophic leaching of LD-slag -
formation of organic ligands. In: RÜDE, T. R., FREUND, A. & C., W. (eds.) 1th IMWA
congress, Mine Water - Managing the Challenges. Aachen, Germany.
KLEBERCZ, O., MAYES, W. M., ANTON, A. D., FEIGL, V., JARVIS, A. P. & GRUIZ, K.
2012. Ecotoxicity of fluvial sediments downstream of the Ajka red mud spill, Hungary. Journal
of environmental monitoring : JEM, 14, 2063-71.
KONAN, K. L., PEYRATOUT, C., SMITH, A., BONNET, J. P., MAGNOUX, P. &
AYRAULT, P. 2012. Surface modifications of illite in concentrated lime solutions investigated
by pyridine adsorption. Journal of Colloid and Interface Science, 382, 17-21.
151
LADEIRA, A. C. Q., CIMINELLI, V. S. T., DUARTE, H. A., ALVES, M. C. M. & RAMOS,
A. Y. 2001. Mechanism of anion retention from EXAFS and density functional calculations:
Arsenic (V) adsorbed on gibbsite. Geochimica Et Cosmochimica Acta, 65, 1211-1217.
LANGMUIR, D. 1997. Aqueous environmental geochemistry, Upper Saddle River, N. J.,
Prentice Hall.
LAW, G. T. W., GEISSLER, A., BOOTHMAN, C., BURKE, I. T., LIVENS, F. R., LLOYD, J.
R. & MORRIS, K. 2010. Role of Nitrate in Conditioning Aquifer Sediments for Technetium
Bioreduction. Environmental Science & Technology, 44, 150-155.
MACLEOD, C. J. A. & SEMPLE, K. T. 2000. Influence of contact time on extractability and
degradation of pyrene in soils. Environmental Science & Technology, 34, 4952-4957.
MAYES, W. M., JARVIS, A. P., BURKE, I. T., WALTON, M., FEIGL, V., KLEBERCZ, O. &
GRUIZ, K. 2011. Dispersal and Attenuation of Trace Contaminants Downstream of the Ajka
Bauxite Residue (Red Mud) Depository Failure, Hungary. Environmental Science &
Technology, 45, 5147-5155.
PEACOCK, C. L. & SHERMAN, D. M. 2004. Vanadium(V) adsorption onto goethite (alpha-
FeOOH) at pH 1.5 to 12: A surface complexation model based on ab initio molecular
geometries and EXAFS spectroscopy. Geochimica Et Cosmochimica Acta, 68, 1723-1733.
RÉDEY, A. 2012. The red mud disaster of Ajka in Hungary and its consequences. 4th
EUCHeMS Chemistry Congress. Prague, Czech Republic.
REEVES, H. J., WEALTHALL, G. & YOUNGER, P. L. 2011. Advisory visit to the bauxite
processings tailings dam near Ajka, Vesprem County, western Hungary. . Keyworth, UK:
British Geological Survey.
RENFORTH, P., MAYES, W. M., JARVIS, A. P., BURKE, I. T., MANNING, D. A. C. &
GRUIZ, K. 2012. Contaminant mobility and carbon sequestration downstream of the Ajka
(Hungary) red mud spill: The effects of gypsum dosing. The Science of the total environment,
421-422, 253-9.
RUYTERS, S., MERTENS, J., VASSILIEVA, E., DEHANDSCHUTTER, B., POFFIJN, A. &
SMOLDERS, E. 2011. The Red Mud Accident in Ajka (Hungary): Plant Toxicity and Trace
Metal Bioavailability in Red Mud Contaminated Soil. Environmental Science & Technology, 45,
1616-1622.
SÉBY, F., POTIN GAUTIER, M., LESPÉS, G. & ASTRUC, M. 1997. Selenium speciation in
soils after alkaline extraction. Science of The Total Environment, 207, 81-90.
SHERMAN, D. M. & RANDALL, S. R. 2003. Surface complexation of arsenie(V) to iron(III)
(hydr)oxides: Structural mechanism from ab initio molecular geometries and EXAFS
spectroscopy. Geochimica Et Cosmochimica Acta, 67, 4223-4230.
SZÉPVÖLGYI, J. 2011. A Chemical Engineer's View of the Red Mud Disaster. Nachrichten
aus der Chemie, 59, 5-7.
152
THORPE, C. L., LLOYD, J. R., LAW, G. T. W., BURKE, I. T., SHAW, S., BRYAN, N. D. &
MORRIS, K. 2012. Strontium sorption and precipitation behaviour during bioreduction in
nitrate impacted sediments. Chemical Geology, 306, 114-122.
WALLACE, S. H., SHAW, S., MORRIS, K., SMALL, J. S., FULLER, A. J. & BURKE, I. T.
2012. Effect of groundwater pH and ionic strength on strontium sorption in aquifer sediments:
Implications for Sr-90 mobility at contaminated nuclear sites. Applied Geochemistry, 27, 1482-
1491.
WEHRLI, B. & STUMM, W. 1989. VANADYL IN NATURAL-WATERS - ADSORPTION
AND HYDROLYSIS PROMOTE OXYGENATION. Geochimica Et Cosmochimica Acta, 53,
69-77.
WILKIE, M. P. & WOOD, C. M. 1996. The adaptations of fish to extremely alkaline
environments. Comparative Biochemistry and Physiology B-Biochemistry & Molecular
Biology, 113, 665-673.
153
Chapter 6 Mobilisation of arsenic from bauxite residue
(red mud) affected soils: Effect of pH and redox conditions.
Abstract
Fine fraction bauxite residue (red mud) has a characteristically alkaline pH and
contains several potentially toxic elements, including arsenic. The tailings dam breach
at the Ajka alumina plant, western Hungary in 2010 introduced ~1 million m3 of red
mud suspension into the surrounding area. Aerobic and anaerobic batch experiments
were prepared using Hungarian soils in order to investigate the effects of red mud
addition on soil biogeochemistry and arsenic mobility in soil-water experiments
representative of land affected by the red mud spill. XAS analysis showed that As was
present in the red mud as As(V) in the form of arsenate. The solubility of red mud
associated arsenate was highly pH dependant and the addition of phosphate (and to a
lesser extent carbonate) to red mud suspensions greatly enhanced As solubility. In
aerobic batch experiments, where red mud was mixed with soils, As release to solution
was highly dependent on experimental pH. With increasing incubation time carbonation
of the experiments occurred (as atmospheric CO2 dissolved in the alkaline solutions)
and lower pH resulted in lower aqueous As concentrations. However, this did not result
in complete removal of aqueous As in any of the experiments. In anaerobic
experiments carbonation reactions were prevented and pH remained high. Under these
conditions, microbial populations from three different soils were able to support both
Fe(III) and SO42- reduction in soil water systems with moderate pH increases (up to ~pH
10.5) following red mud addition. Aqueous As concentrations increased in all the
anaerobic red mud amended experiments, however, both XANES and HPLC-ICP-MS
154
showed that no As reduction processes occurred and that only As(V) species were
present. These experiments show that when red mud is mixed with a range of Hungarian
soils the resultant increases in soil pH promote the release of As(V) to solution under a
range of alkaline pH and under both aerobic and anaerobic conditions. Therefore, there
is the potential for increased As mobility / bioavailability in soil-water systems affected
by red mud addition and recovery of red mud deposits from land is recommended.
155
6.1 Introduction
Bauxite residue (red mud) is the fine fraction waste remaining after Al extraction
from bauxite using the Bayer Process. The composition of red mud varies depending
upon the quality of the ore and processing methods (Hind et al., 1999; Liu et al., 2007;
Somlai et al., 2008). Typically, it comprises residual iron oxides, quartz, sodium
aluminosilicates, titanium dioxide, calcium carbonate/aluminate and sodium hydroxide
(Hind et al., 1999; Brunori et al., 2005; Grafe et al., 2011; Gelencser et al., 2011). Red
mud can also contain problematic concentrations of potentially toxic metals and
metalloids, including As, Cr, Ni, Pb, Mo and V (Brunori et al., 2005; Grafe et al., 2011;
Klebercz et al., 2012). Water in contact with red mud is saline and highly alkaline
(between 1.4 - 28.4 mS m-1, up to pH 13 (Mayes et al., 2011; Grafe et al., 2011) due to
the presence of NaOH. Under these conditions there is potential for enhanced mobility
of oxyanion forming trace elements (e.g. Al, As, Cr, Mo and V) (Langmuir, 1997;
Smedley and Kinniburgh, 2002; Cornelis et al., 2008) due to their higher solubility and
reduced adsorption to surfaces at high pH. These issues aside, the abundance of red mud
as a waste product (up to 120 million tonnes are produced annually (Power et al., 2011))
has led to much research into possible uses. These include: recovery of Al, Fe, trace and
rare earth metals (Hind et al., 1999; Hammond, 2013); a low cost sorbent for water
decontamination (Altundogan et al., 2002; Bhatnagar et al., 2011; Liu et al., 2011); in
CO2 sequestration (Yadav et al., 2010); and as an additive to ceramics and building
materials (Somlai et al., 2008; Liu and Zhang, 2011) or as a soil amendment (Lombi et
al., 2002; Friesl et al., 2004; Gray et al., 2006; Feigl et al., 2012).
On 4th October 2010 the tailings dam of Cell X at the Ajkai Timfoldgyar Zrt
alumina plant was breached, releasing ~1 million m3 of red mud suspension (Adam et
156
al., 2011a; Reeves et al., 2011). The surge of red mud down the Torna and upper Marcal
valleys inundated homes and land, killing 10 people and injuring over 150 (Adam et al.,
2011a; Enserink, 2010). An estimated 40 km2 of low-lying agricultural land and riparian
wetlands were affected (Mayes et al., 2011; Reeves et al., 2011) and red mud was
transported 120 km downstream by rivers, eventually reaching the Danube (Enserink,
2010; Adam et al., 2011a; Reeves et al., 2011). The immediate emergency
environmental response sought to neutralise the affected rivers and streams by the
addition of acid and/or gypsum (Adam et al., 2011a; Renforth et al., 2012). Further
remediation efforts removed red mud from the affected land (Adam et al., 2011a) but at
some locations thin red mud deposits (<5cm) were ploughed in to soils to prevent dust
formation and further dispersal (Gelencser et al., 2011; Adam et al., 2011a; Anton et al.,
2012). It was not possible to recover red mud deposited in low lying riparian wetlands.
This addition of red mud to soils introduced several potential contaminant trace
elements (Ruyters et al., 2011; Mayes et al., 2011), including the highly toxic and redox
sensitive metalloid arsenic. Ajka red mud contains ~200 mg kg-1 As, primarily as
inorganic arsenate phases (Burke et al., 2012a). Adsorption of As to red mud is known
to be enhanced at circumneutral pH (as opposed to very high (>11.5) and very low
(<4.5) pH) (Altundogan et al., 2000; Genc-Fuhrman et al., 2004) and previous tests
have found As leaching from Ajka red mud/soil mixtures (up to 16% red mud w/w)
does not occur readily under aerobic conditions (Ruyters et al., 2011). These and similar
findings have led researchers to conclude that fears of toxic metal/loid leaching from
red mud to soils have been overstated and that the main short-term issues from red mud
addition to soils relate to increased pH and salinity (Ruyters et al., 2011; Gelencser et
al., 2011; Klebercz et al., 2012; Anton et al., 2012; Gruiz, 2012).
157
Redox conditions in natural soils and sediments are prone to seasonal variations,
particularly with fluctuations in groundwater levels. This can have a profound influence
on the transport of As in the environment. Soils containing only modest As
concentrations (< 7 mg kg-1) can produce unacceptably high concentrations of aqueous
As in soil porewaters under reducing conditions (Charlet and Polya, 2006; Hery et al.,
2010). One of the key mechanisms responsible for high As concentrations is the
reduction of arsenate to more soluble arsenite species during microbially mediated
processes and the mobilisation of further As during the reductive dissolution of
arsenate-bearing Fe(III) oxides (Islam et al., 2004; Lloyd and Oremland, 2006). Thus, if
red mud deposits that have been mixed with soils in floodplain settings become exposed
to anaerobic conditions, there is an increased possibility of microbial processes leading
to As release, and very high porewater As concentrations might be expected (Smedley
and Kinniburgh, 2002; O'Day et al., 2004).
The specific objectives of this study were: 1) To use aerobic and anaerobic batch
experiments to investigate the potential for arsenic mobilisation from Ajka red muds
and representative soil-red mud mixtures. 2) To use a combination of X-ray absorption
spectroscopy and high performance liquid chromatography-ion coupled plasma-mass
spectroscopy to determine changes in solid or aqueous phase As speciation induced by
long term anaerobic incubation. 3) To determine the effects of red mud addition on
biogeochemical processes in soil-water systems and relate soil geochemistry to
mechanisms controlling As mobilisation in red mud amended soils.
158
6.2 Materials and Methods
6.2.1 Field Sampling and Sample Handling
Samples were collected in May 2011. A red mud sample (RM) was collected
from within Cell X of the Ajka impoundment (Location 47°0’18.48”N, 17°29’46.77”E).
Soil was sampled from three locations in the Torna and upper Marcal floodplains that
did not receive red mud during the 2010 dam breach (see Figure 3.2, for sampling
locations). The sampling locations were chosen to capture local variations in
composition, total organic carbon (TOC) and initial redox conditions. Two of the soils
were agricultural top soils and the third sample was collected from below the rootlet
layer 50 cm below the surface of a wetland. Samples were stored at 4°C in polythene
containers, (sub-samples were stored for XAS analysis at -80 ⁰C). The wetland soil was
stored anaerobically using Anaerogen™ sachets.
6.2.2 Sample Characterization
Red mud and soil samples were characterised by X-ray powder diffraction using
a Bruker D8 Advance XRD, X-ray fluorescence using a PANalytical Axios Advanced
XRF spectrometer; TOC using a Carlo Erba NA 2500 Elemental Analyser; pH was
determined after 1 g : 1 ml suspension in deionised water (ASTM, 2006); and 0.5 N
HCl extractable Fe(II) was determined by ferrozine assay (Lovley and Phillips, 1986a).
Inorganic phosphate was determined using molybdate blue method (Aspila et al., 1976).
159
6.2.3 Red mud batch leaching tests
2 g red mud were suspended in 10 mL of 0.1 M salt solutions (NaCl Na2SO4,
Na2CO3 or NaHPO4) as a background electrolyte or deionised water for the ‘no
amendment’ system. The pH values were adjusted to between 5.5 and 12.5 by addition
of HCl or NaOH. After 7 days agitation on an orbital shaker (100 rpm), pH was
determined and the aqueous phase was removed by filtration (0.45 μm) and As
concentrations were determined using a Perkin-Elmer Optima 5300 DV ICP-OES.
6.2.4 Aerobic batch experiments
Triplicate aerobic microcosms for each soil type were prepared under three
different conditions (all weights given as dry weight equivalents): (1) Unamended - 6.0
g of homogenised soil with 30 ml of deionised water in 50 mL polypropylene centrifuge
tubes; (2) 9% RM addition (representing a thin red mud deposit (~5 cm) mixed with 40-
50 cm soil by ploughing) – the same as the unamended system with addition of 0.6 g
RM; (3) 33% RM addition (representing a thick red mud deposit (~15 cm) mixed with
~30 cm soil by ploughing or as a worst case scenario for wetland areas) - the same as
the unamended system with addition of 3.0 g RM. Microcosms were incubated in the
dark at 21 °C. The headspace was regularly exchanged with air (1 hour each weekday)
over a period of 100 days. During sampling microcosms were shaken and 3 mL aliquots
of soil/RM slurry was extracted. Samples were centrifuged (3 min, 6000 g) and the soil
analysed for 0.5 N HCl extractable Fe(II). Water was analysed for pH,
oxidation/reduction potential (ORP) and aliquots were filtered (0.2 µM) and acidified
for ICP-MS analysis.
160
6.2.5 Anaerobic batch experiments
Triplicate anaerobic microcosms for each soil type were prepared under three
different conditions, equivalent to the aerobic experiments (all weights given as dry
weight equivalents): (1) Unamended - 20.0 g of homogenised soil with 100 ml of
deionised water in 120 mL glass serum bottles; (2) 9% RM addition – the same as the
unamended system with addition of 2.0 g RM; (3) 33% RM addition - the same as the
unamended system with addition of 10.0 g RM. All bottles were purged with nitrogen
before capping and crimp sealing and sampled periodically ~180 days. Triplicate
anaerobic heat treated controls were also established as anaerobic experiments as, above
but using autoclaved soils and red mud (120 °C, 1 hour) and were sampled over 120
days. All microcosms were incubated in the dark at 21 °C. During sampling microcosms
were shaken and 4.5 mL aliquots of soil/RM slurry was extracted using aseptic
technique. Samples were centrifuged (3 min, 6000 g) and the soil analysed for 0.5 N
HCl extractable Fe(II). Water was analysed for pH, ORP and aliquots were filtered (0.2
µM) and acidified for ICP-MS analysis or frozen (-20 °C) for anion analysis. At the end
point of each experiment 15 mL of slurry was extracted and centrifuged, the solution
and the solids were frozen (-80 °C) until required for HPLC-ICP-MS analysis and XAS.
These experiments were designed primarily to investigate biogeochemical
effects of red mud addition to the soils, therefore, the same inoculation of
uncontaminated soil was used in all microcosms, however, the solid : liquid ratio varied
by red mud loading. All experiments were initially sampled over a 100-120 day period,
however the anaerobic experiments were sampled again at 180 days as some
biogeochemical reactions were still ongoing at 120 days in some tests.
161
(Note – henceforth the experiments and controls will be referred to as ‘aerobic
experiments’ ‘anaerobic experiments’, ‘heat treated controls’.)
6.2.6 Geochemical Methods
pH and ORP (as an indicator for Eh) were measured using a Thermo Scientific
Orion Dualstar pH benchtop meter (calibrated daily at pH values of 4, 7 and 10 and a
new factory calibrated ORP electrode was used). Acid extractable Fe(II) was
determined by ferrozine assay (Lovley and Phillips, 1986a). Arsenic concentrations
were determined using a Perkin Elmer Elan DRCII ICP-MS. Anion concentrations were
determined by ion chromatography using a Dionex DX500 and AS9 column. Arsenic
speciation in 0.2 µm filtered end point solutions was analysed by HPLC-ICP-MS.
As(V) (as arsenate) and As(III) (as arsenite) were separated using a Hamilton PRP-
X100 250 x 4.6 mm column at 30°C, using an Agilent 1260 Infinity HPLC system
interfaced with an Agilent 7500 ICP-MS.
6.2.7 X-ray Absorption Spectroscopy (XAS)
As K-edge (11867 eV) XANES and EXAFS spectra were collected on station
I18 at the Diamond Light Source, UK, in May, 2012. Approximately 100 mg of sample
was prepared under anaerobic conditions for analysis as moist pastes in Perspex holders
with Kapton™ windows. Standard spectra were collected from aqueous As(III) and
As(V) solutions (1000 mg L-1). For each sample and standard multiple XANES spectra
were averaged and normalised using Athena v0.8.061. Arsenic K-edge EXAFS spectra
were background subtracted using PySpline v1.1. EXAFS spectra were then fit in
DLexcurv v1.0 (Tomic, 2005) to model clusters.
162
6.3 Results
6.3.1 Sample Characterization
Sample characterization of the red mud and soils has been summarised (see
Tables 5.1 and 5.2) (See Appendix A Figure A3 and A4 for XRD patterns). Briefly;
XRD analysis showed that the red mud was dominated by hematite (Fe2O3), calcite
(CaCO3), magnetite (Fe3O4), cancrinite (Na6CaAl6Si6(CO3)O24.2H2O) and hydrogarnet
(Ca3AlFe(SiO4)(OH8) with residual boehmite (γ-AlOOH) and gibbsite (Al(OH3))
phases. This assemblage is very similar to that of other red mud samples taken from the
breach area (Gelencser et al., 2011; Burke et al., 2012a). The pH value of the three soils
was between pH 7 and 8. The dominant mineral in all three soil samples was quartz:
feldspars and clays were also present. The first topsoil was a sandy clay loam and had
4.15% organic carbon content (hereafter referred to as Soil OR). The wetland sample
was a very dark grey sandy clay loam with 1.14% organic carbon (hereafter referred to
as Soil WL). The third soil was sandy loam topsoil with 0.74% organic carbon (hereafter
referred to as Soil SS). Principle component analysis of red mud and the 3 soils shows
that the soils have similar composition to other unaffected soils from the region and that
the red mud sampled here is of a similar composition to other red mud samples from the
Ajka source (Mayes et al., 2011) (see Figure 5.1).
6.3.2 Arsenic in red mud
XANES spectra collected from red mud shows that As is present as As(V)
(Figure 6.1). Arsenic K-edge EXAFS spectra from the same red mud sample (Figures
6.2) could be fitted with a co-ordination environment of 4 oxygen backscatterers at 1.67
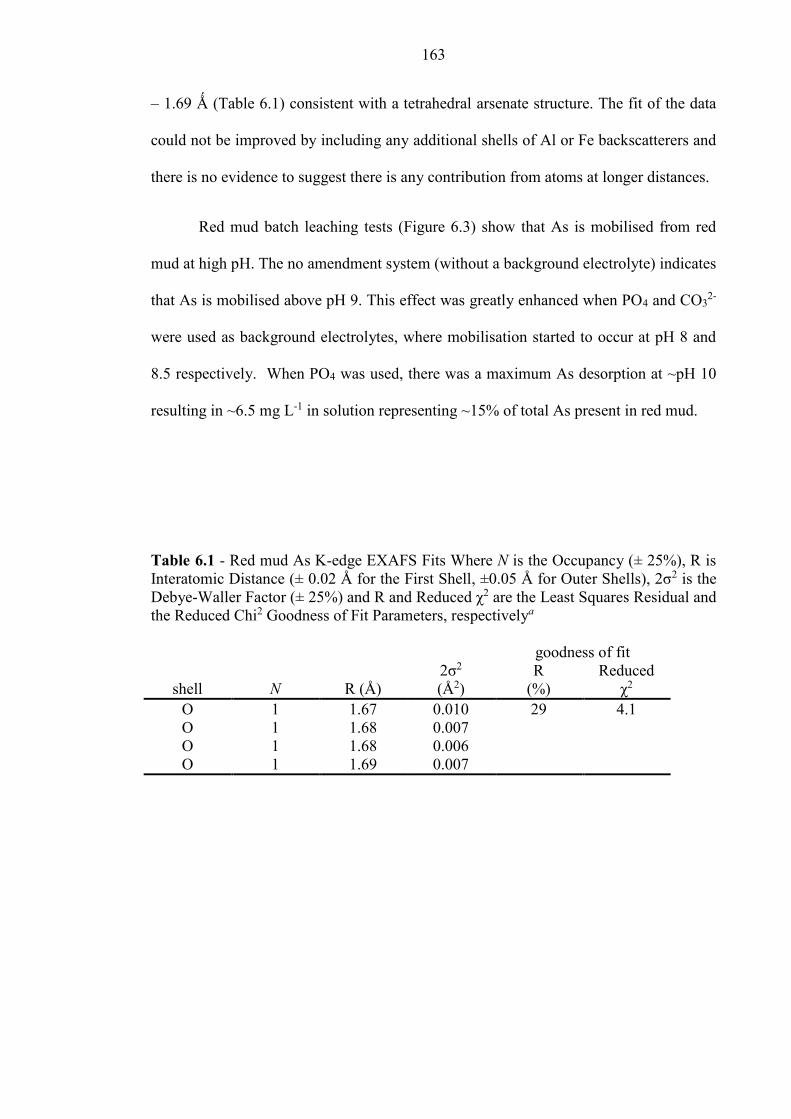
163
– 1.69 Ǻ (Table 6.1) consistent with a tetrahedral arsenate structure. The fit of the data
could not be improved by including any additional shells of Al or Fe backscatterers and
there is no evidence to suggest there is any contribution from atoms at longer distances.
Red mud batch leaching tests (Figure 6.3) show that As is mobilised from red
mud at high pH. The no amendment system (without a background electrolyte) indicates
that As is mobilised above pH 9. This effect was greatly enhanced when PO4 and CO32-
were used as background electrolytes, where mobilisation started to occur at pH 8 and
8.5 respectively. When PO4 was used, there was a maximum As desorption at ~pH 10
resulting in ~6.5 mg L-1 in solution representing ~15% of total As present in red mud.
Table 6.1 - Red mud As K-edge EXAFS Fits Where N is the Occupancy (± 25%), R is
Interatomic Distance (± 0.02 Å for the First Shell, ±0.05 Å for Outer Shells), 2σ2 is the
Debye-Waller Factor (± 25%) and R and Reduced χ2 are the Least Squares Residual and
the Reduced Chi2 Goodness of Fit Parameters, respectivelya
goodness of fit
shell
N
R (Å)
2σ2
(Å2)
R
(%)
Reduced
χ2
O 1 1.67 0.010 29 4.1
O 1 1.68 0.007
O 1 1.68 0.006
O 1 1.69 0.007
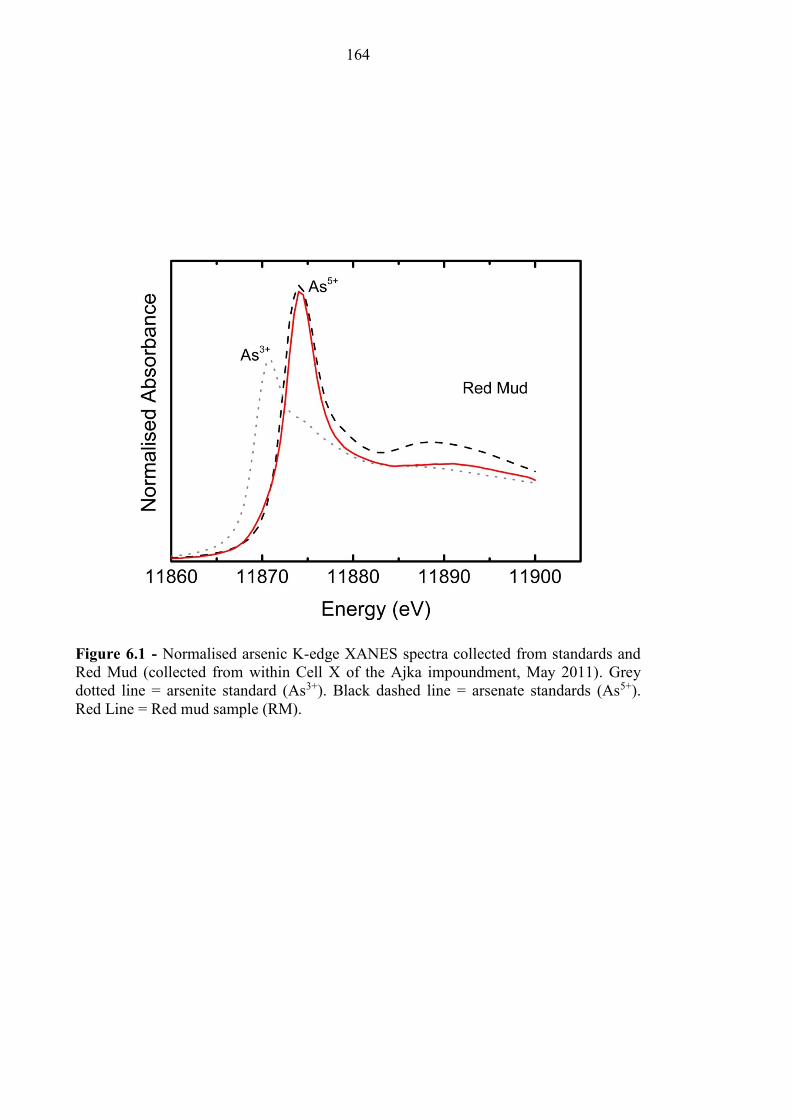
164
Figure 6.1 - Normalised arsenic K-edge XANES spectra collected from standards and
Red Mud (collected from within Cell X of the Ajka impoundment, May 2011). Grey
dotted line = arsenite standard (As3+). Black dashed line = arsenate standards (As5+).
Red Line = Red mud sample (RM).
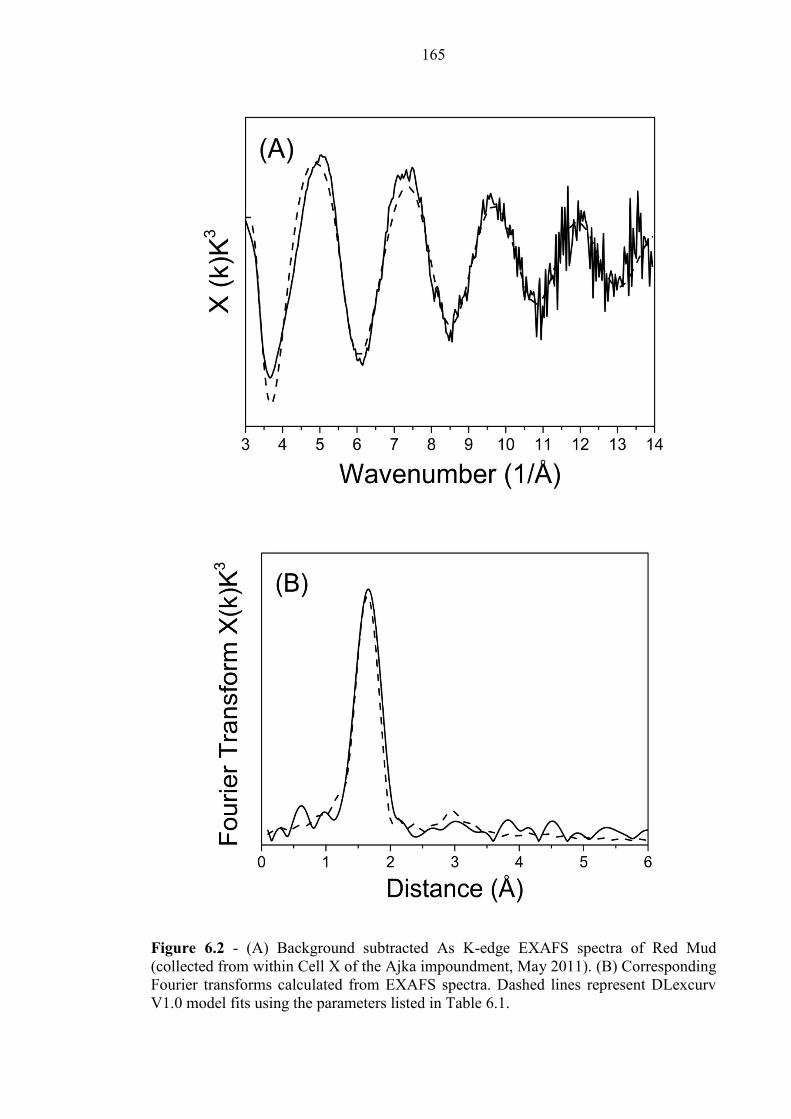
165
Figure 6.2 - (A) Background subtracted As K-edge EXAFS spectra of Red Mud
(collected from within Cell X of the Ajka impoundment, May 2011). (B) Corresponding
Fourier transforms calculated from EXAFS spectra. Dashed lines represent DLexcurv
V1.0 model fits using the parameters listed in Table 6.1.
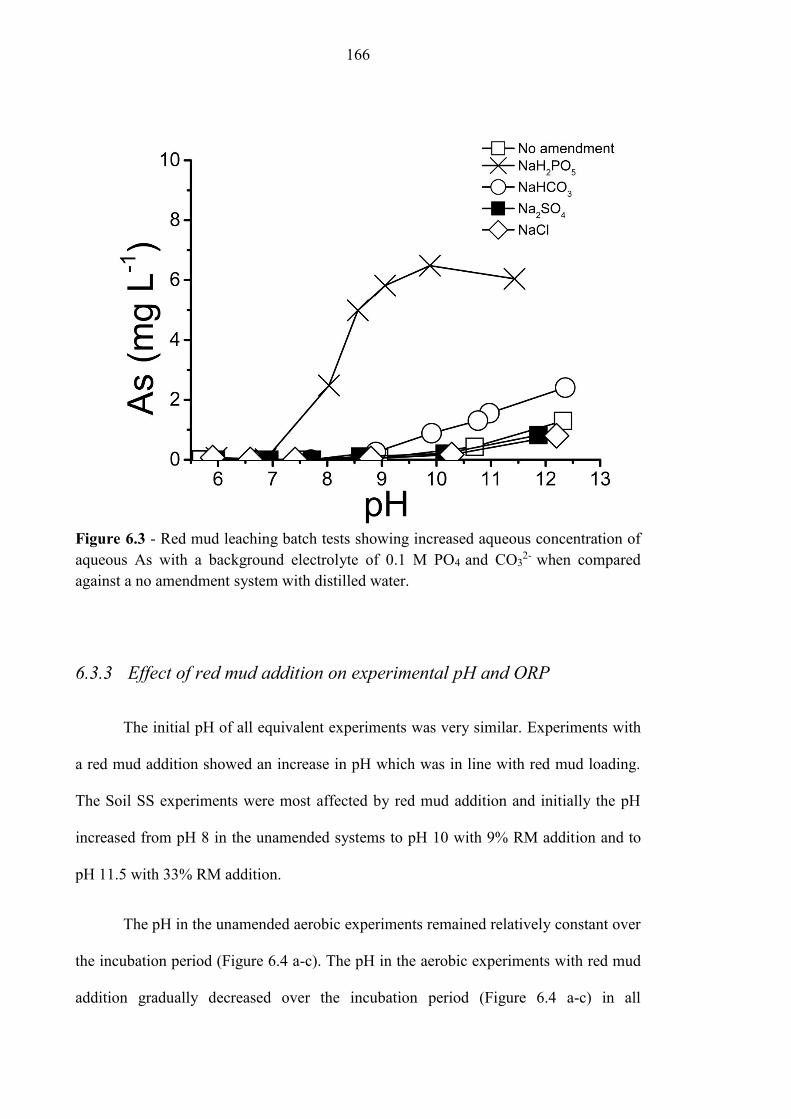
166
Figure 6.3 - Red mud leaching batch tests showing increased aqueous concentration of
aqueous As with a background electrolyte of 0.1 M PO4 and CO32-
when compared
against a no amendment system with distilled water.
6.3.3 Effect of red mud addition on experimental pH and ORP
The initial pH of all equivalent experiments was very similar. Experiments with
a red mud addition showed an increase in pH which was in line with red mud loading.
The Soil SS experiments were most affected by red mud addition and initially the pH
increased from pH 8 in the unamended systems to pH 10 with 9% RM addition and to
pH 11.5 with 33% RM addition.
The pH in the unamended aerobic experiments remained relatively constant over
the incubation period (Figure 6.4 a-c). The pH in the aerobic experiments with red mud
addition gradually decreased over the incubation period (Figure 6.4 a-c) in all
167
experiments except for Soil OR experiment with 9% RM addition (Figure 6.4 a). In this
experiment, there was an initial increase in pH from pH 7 to 8, which then remained
constant. In both the anaerobic experiments and heat treated controls the pH remained
relatively constant after an initial equilibration period of 5 days, (Figure 6.5 a-c and
Figure 6.6 a-c.).
ORP measurements in the aerobic experiments rose over the first 20
days from +50 to +150 mV to reach values around +250 mV in all experiments
indicating that generally oxic conditions were maintained throughout the
incubation (Figure 6.4 d-f). In the anaerobic microcosms ORP values show the
opposite trend, reducing to negative values (between 0 and -400 mV)
indicating progressively more reducing conditions occurred with time (Figure
6.5d-f).
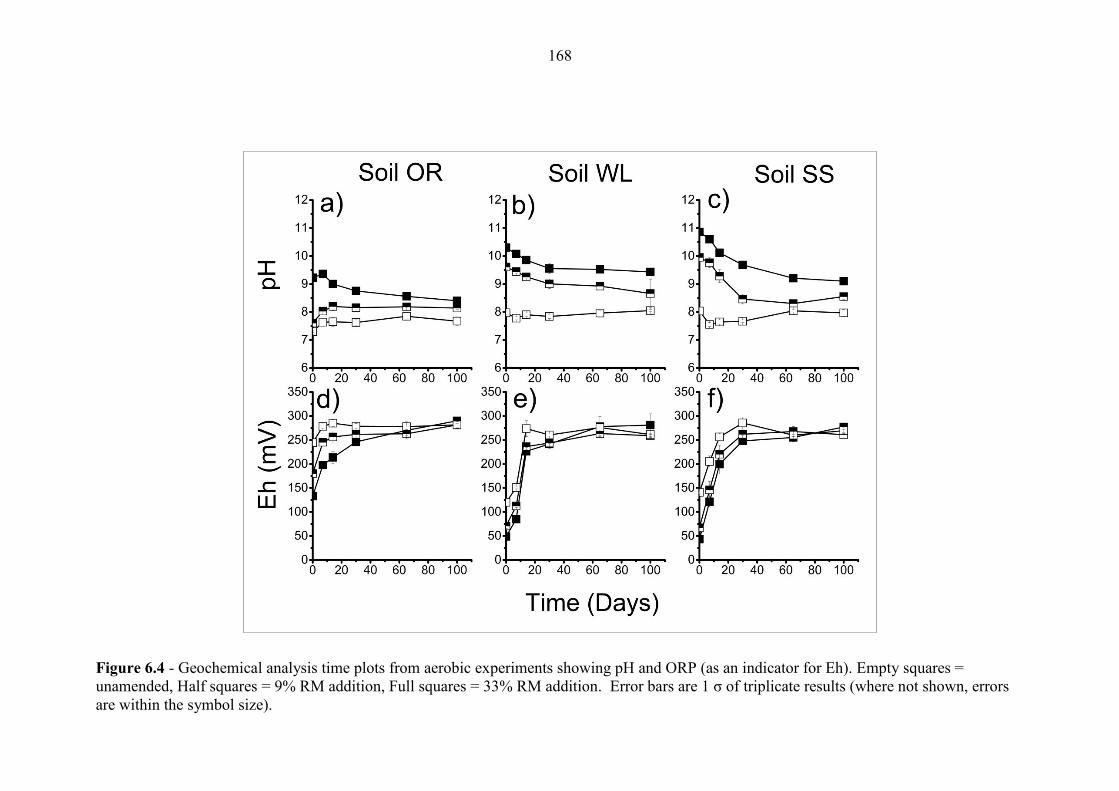
168
Figure 6.4 - Geochemical analysis time plots from aerobic experiments showing pH and ORP (as an indicator for Eh). Empty squares =
unamended, Half squares = 9% RM addition, Full squares = 33% RM addition. Error bars are 1 σ of triplicate results (where not shown, errors
are within the symbol size).
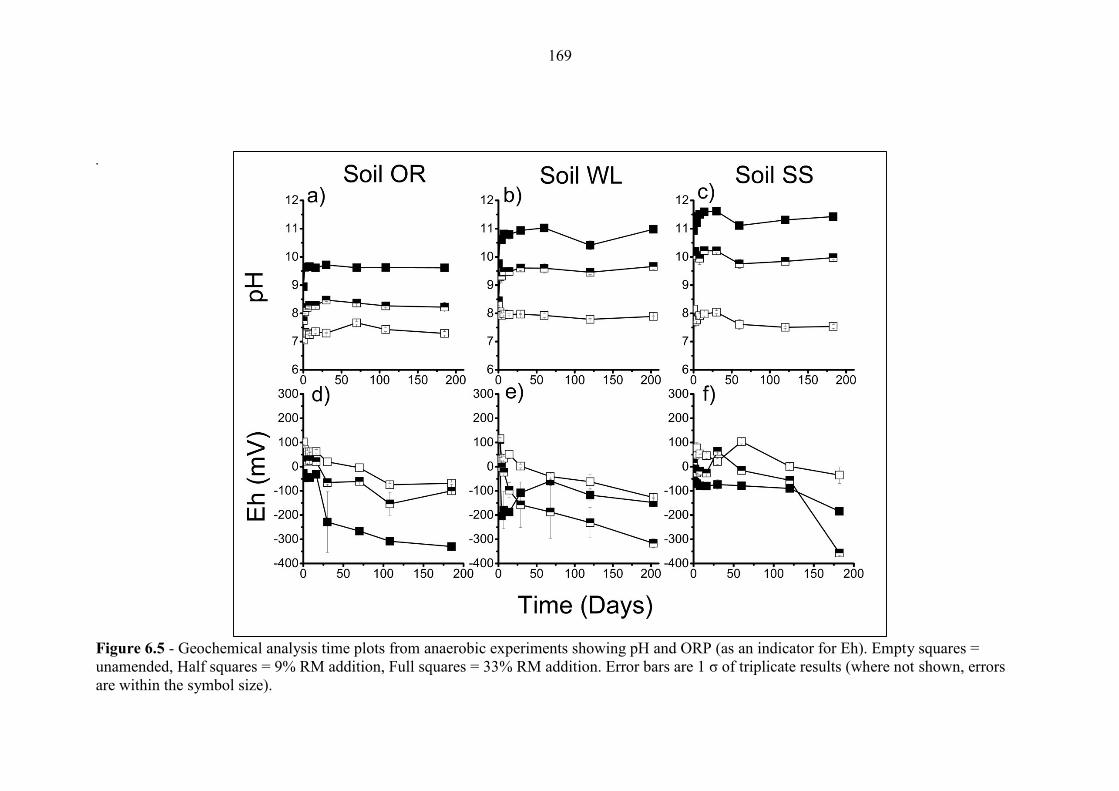
169
.
Figure 6.5 - Geochemical analysis time plots from anaerobic experiments showing pH and ORP (as an indicator for Eh). Empty squares =
unamended, Half squares = 9% RM addition, Full squares = 33% RM addition. Error bars are 1 σ of triplicate results (where not shown, errors
are within the symbol size).
170
6.3.4 Biogeochemical Redox Indicators
There was no evidence of any increase in acid extractable Fe(II) in the aerobic
experiments. Concentrations in all the aerobic experiments were < 1 mg g-1 dry weight
(Figure 6.7 d-f). Acid extractable Fe(II) was monitored in the aerobic experiments as a
check on whether bioreduction processes occurred that might affect As mobilisation
(i.e. there is a strong link expected between Fe(III)-reduction and enhanced As
solubility (Islam et al., 2004)). Aqueous phase electron acceptors such as nitrate and
sulphate were not monitored as a combination of high ORP and negligible Fe(II)
accumulation was considered a sufficient negative control.
In the anaerobic experiments, there was some evidence of rapid nitrate removal
occurring in Soil OR and Soil SS anaerobic experiments at the beginning of the
incubation period (Figure 6.6). The amount of 0.5 N HCl extractable Fe(II) in the solid
phase increased significantly with incubation time in most anaerobic experiments from
initial values 1 mg g-1 (Figure 6.8 d-f). For each soil type the largest increases in acid
extractable Fe(II) were observed in the unamended experiments, although in the Soil
OR system, the unamended and 9% RM addition experiments had a similar overall
increase in acid extractable Fe(II). The greatest increase in acid extractable Fe(II) was
observed in the Soil SS unamended experiments, with progressively less acid
extractable Fe(II) found in the 9% RM and 33% RM microcosms at the end of the
experiments. The rate of accumulation of acid extractable Fe(II) varied with soil type.
The Soil OR and Soil WL systems showed increases after only short incubation times
(before 30 days), but the Soil SS experiments responded much more slowly. Heat
treated controls showed no significant increases in acid extractable Fe(II) in the wetland
or the sandy soil systems (Figure 6.9). Acid extractable Fe(II) does increase in heat
171
treated Soil OR controls, but the increases are smaller than those observed in the
equivalent anaerobic experiments.
In the unamended anaerobic experiments the aqueous SO42- concentration was
~25 mg L-1 in the Soil OR, and negligible in the Soil WL and Soil SS experiments
(Figure 6.8 g-i). The 33% RM addition anaerobic experiments had the highest SO42-
concentrations for all the soil types. The pattern of SO42- removal was different for each
soil system. In the Soil OR anaerobic experiments complete removal of SO42- occurred
after 100 days under all conditions (no removal occurred in corresponding heat treated
controls, Figure 6.9 g-i). The Soil WL system exhibited a rapid increase in SO42-
concentrations between 30 and 60 days in the 9% RM and 33% RM additions which
was followed by a gradual removal. Again, no removal occurred in corresponding heat
treated controls. In the Soil SS system the SO42- concentrations were proportional to the
amount of RM addition and remained relatively constant throughout the incubation
period for both the anaerobic experiments and heat treated controls.
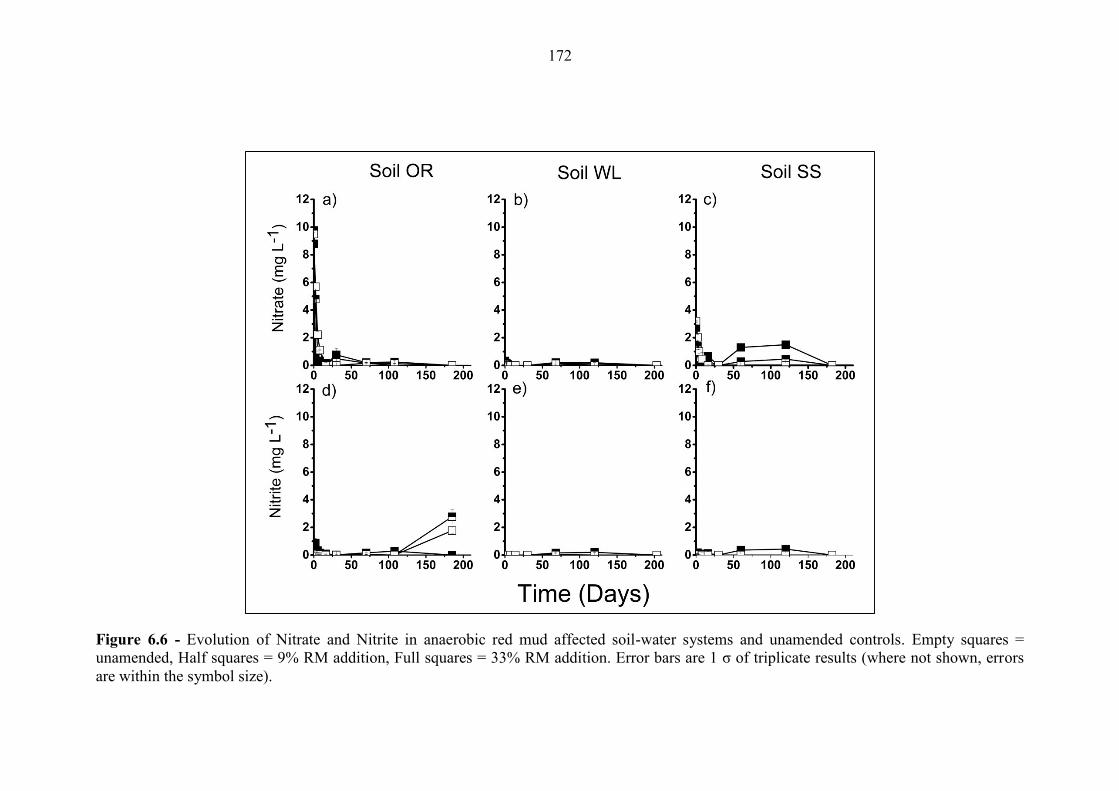
172
Figure 6.6 - Evolution of Nitrate and Nitrite in anaerobic red mud affected soil-water systems and unamended controls. Empty squares =
unamended, Half squares = 9% RM addition, Full squares = 33% RM addition. Error bars are 1 σ of triplicate results (where not shown, errors
are within the symbol size).
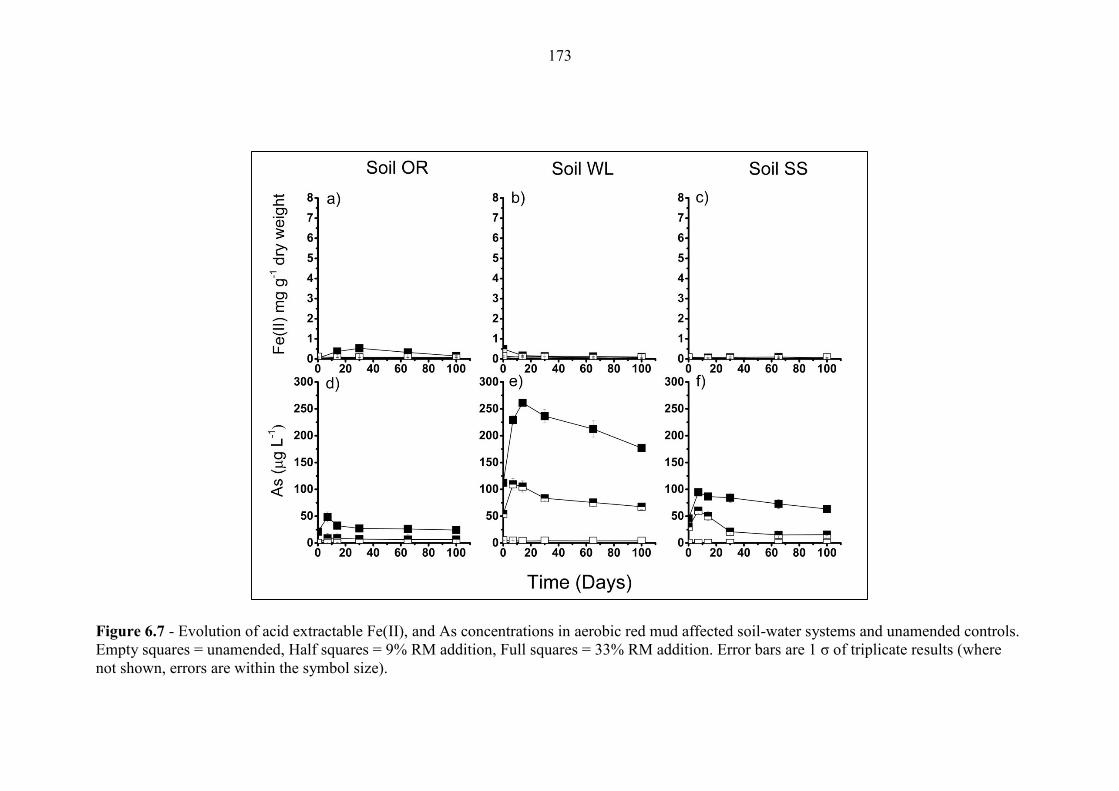
173
Figure 6.7 - Evolution of acid extractable Fe(II), and As concentrations in aerobic red mud affected soil-water systems and unamended controls.
Empty squares = unamended, Half squares = 9% RM addition, Full squares = 33% RM addition. Error bars are 1 σ of triplicate results (where
not shown, errors are within the symbol size).
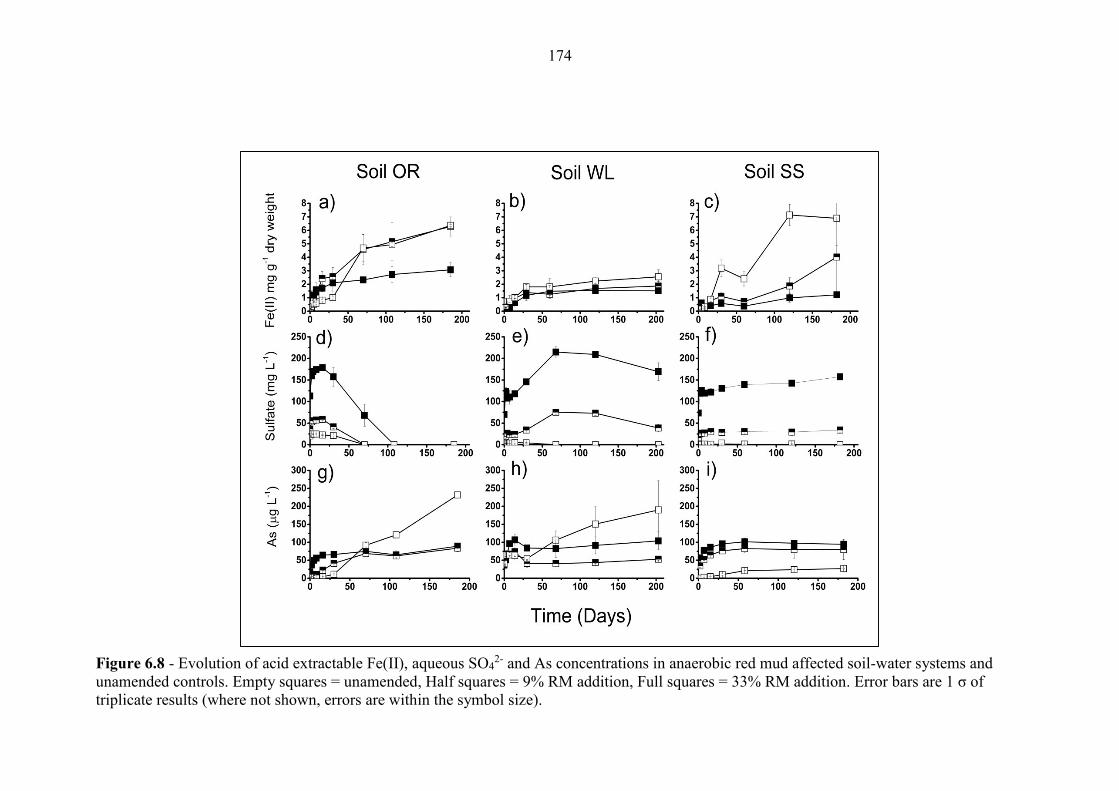
174
Figure 6.8 - Evolution of acid extractable Fe(II), aqueous SO42- and As concentrations in anaerobic red mud affected soil-water systems and
unamended controls. Empty squares = unamended, Half squares = 9% RM addition, Full squares = 33% RM addition. Error bars are 1 σ of
triplicate results (where not shown, errors are within the symbol size).
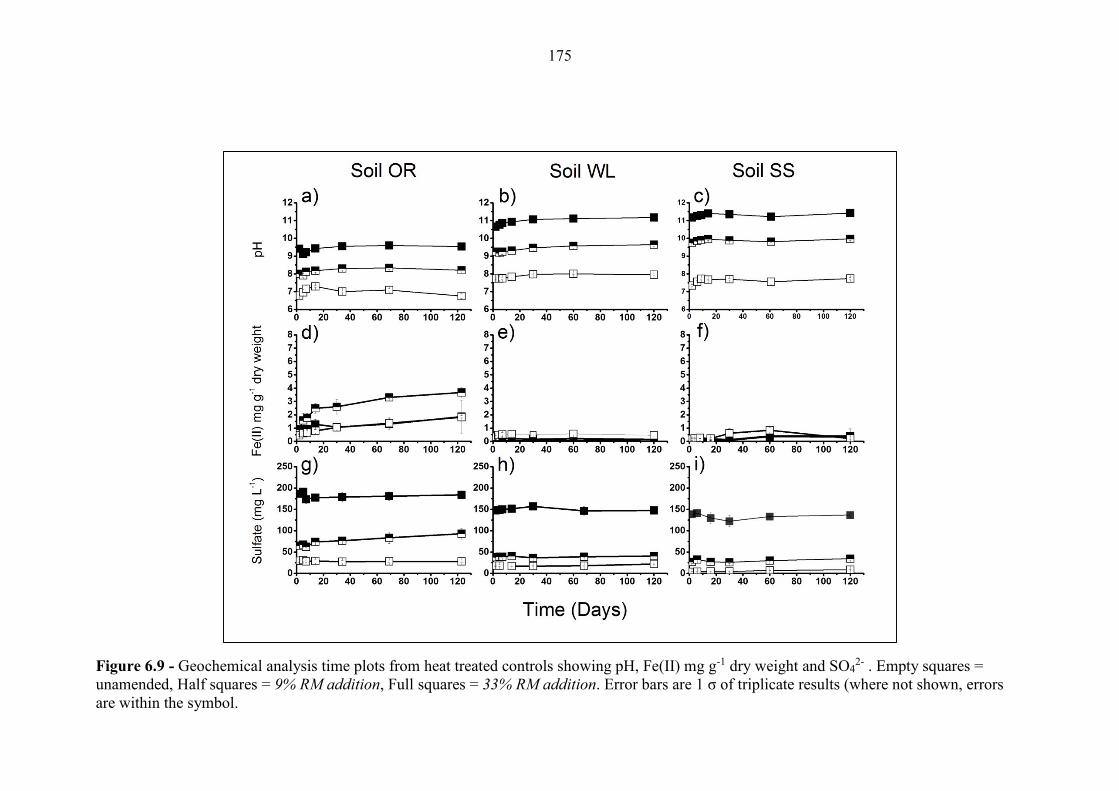
175
Figure 6.9 - Geochemical analysis time plots from heat treated controls showing pH, Fe(II) mg g-1 dry weight and SO42- . Empty squares =
unamended, Half squares = 9% RM addition, Full squares = 33% RM addition. Error bars are 1 σ of triplicate results (where not shown, errors
are within the symbol.
176
6.3.5 Arsenic in microcosm experiments
At the initial sampling points the unamended aerobic experiments all had no
detectable aqueous As present. However, in the experiments with a red mud addition,
there was detectable aqueous As in all the aerobic experiments, with the exception of
the Soil OR experiment with a 9% RM addition. The initial aqueous As concentration
was highest (~ 100 µg L-1) in the Soil WL experiment with a 33% RM addition of
(Figure 6.7 d-f).
There was no increase in aqueous As concentrations in unamended aerobic
experiments over the incubation period. When red mud was added to the aerobic
experiments aqueous As concentrations increased in line with red mud loading to
between 50 and 250 μg L-1 with lowest concentrations in the Soil OR system and
highest in the Soil WL system (Figure 6.7 d-f). Each aerobic experiment with red mud
addition followed a similar trend of rapid release over the first 10 day followed by a
long period of removal.
At the initial sampling point the unamended anaerobic experiments (Figure 6.8
g-i) containing the Soil SS and OR had no detectable aqueous As present. However, the
Soil WL anaerobic experiments contained ~40 µg L-1 As. The aqueous As
concentrations in all three unamended anaerobic experiments had increased above their
initial values by day 30, and continued to rise for the remainder of the experiments.
Concentrations reached >200 µg L-1 in the Soil OR and WL microcosms, but did not
exceed 25 µg L-1 in the Soil SS experiments. HPLC-ICP-MS analysis performed on the
aqueous phase sampled a end point solutions showed that ~50% of aqueous As was
present as As(III) in all three soil-only systems (Table 6.2).
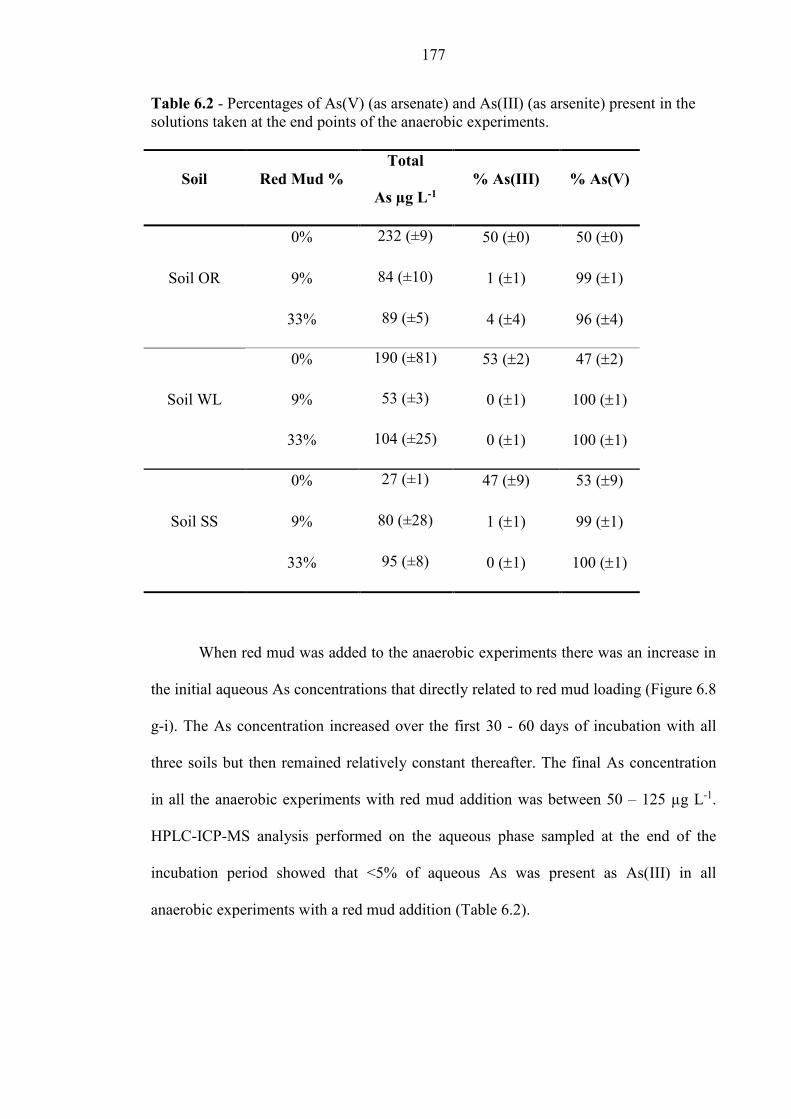
177
Table 6.2 - Percentages of As(V) (as arsenate) and As(III) (as arsenite) present in the
solutions taken at the end points of the anaerobic experiments.
Soil Red Mud %
Total
As µg L-1
% As(III) % As(V)
Soil OR
0% 232 (±9) 50 (0) 50 (0)
9% 84 (±10) 1 (1) 99 (1)
33% 89 (±5) 4 (4) 96 (4)
Soil WL
0% 190 (±81) 53 (2) 47 (2)
9% 53 (±3) 0 (1) 100 (1)
33% 104 (±25) 0 (1) 100 (1)
Soil SS
0% 27 (±1) 47 (9) 53 (9)
9% 80 (±28) 1 (1) 99 (1)
33% 95 (±8) 0 (1) 100 (1)
When red mud was added to the anaerobic experiments there was an increase in
the initial aqueous As concentrations that directly related to red mud loading (Figure 6.8
g-i). The As concentration increased over the first 30 - 60 days of incubation with all
three soils but then remained relatively constant thereafter. The final As concentration
in all the anaerobic experiments with red mud addition was between 50 – 125 µg L-1.
HPLC-ICP-MS analysis performed on the aqueous phase sampled at the end of the
incubation period showed that <5% of aqueous As was present as As(III) in all
anaerobic experiments with a red mud addition (Table 6.2).
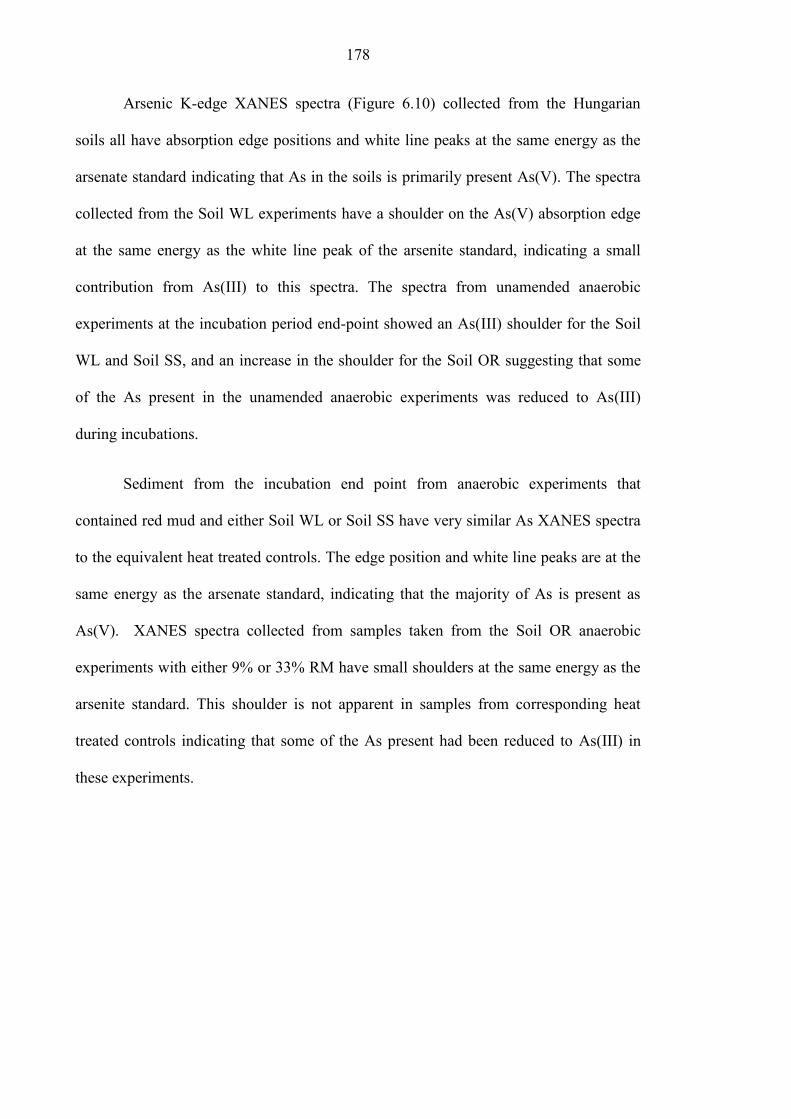
178
Arsenic K-edge XANES spectra (Figure 6.10) collected from the Hungarian
soils all have absorption edge positions and white line peaks at the same energy as the
arsenate standard indicating that As in the soils is primarily present As(V). The spectra
collected from the Soil WL experiments have a shoulder on the As(V) absorption edge
at the same energy as the white line peak of the arsenite standard, indicating a small
contribution from As(III) to this spectra. The spectra from unamended anaerobic
experiments at the incubation period end-point showed an As(III) shoulder for the Soil
WL and Soil SS, and an increase in the shoulder for the Soil OR suggesting that some
of the As present in the unamended anaerobic experiments was reduced to As(III)
during incubations.
Sediment from the incubation end point from anaerobic experiments that
contained red mud and either Soil WL or Soil SS have very similar As XANES spectra
to the equivalent heat treated controls. The edge position and white line peaks are at the
same energy as the arsenate standard, indicating that the majority of As is present as
As(V). XANES spectra collected from samples taken from the Soil OR anaerobic
experiments with either 9% or 33% RM have small shoulders at the same energy as the
arsenite standard. This shoulder is not apparent in samples from corresponding heat
treated controls indicating that some of the As present had been reduced to As(III) in
these experiments.
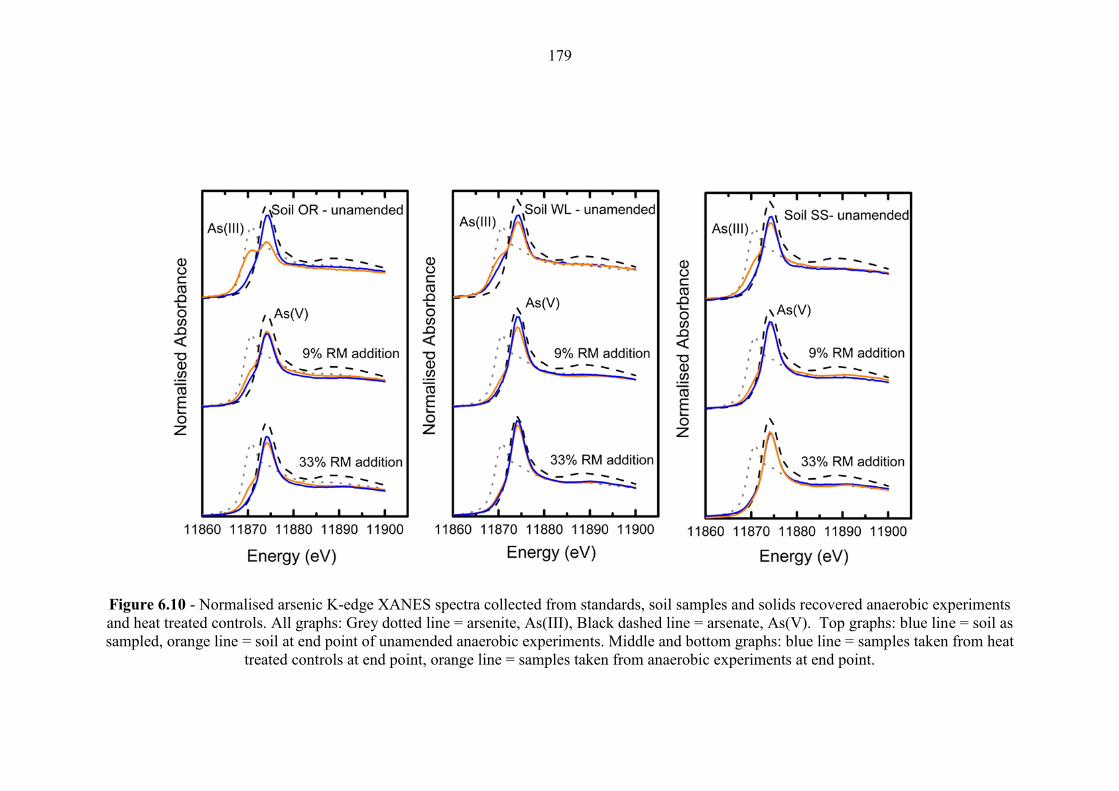
179
Figure 6.10 - Normalised arsenic K-edge XANES spectra collected from standards, soil samples and solids recovered anaerobic experiments
and heat treated controls. All graphs: Grey dotted line = arsenite, As(III), Black dashed line = arsenate, As(V). Top graphs: blue line = soil as
sampled, orange line = soil at end point of unamended anaerobic experiments. Middle and bottom graphs: blue line = samples taken from heat
treated controls at end point, orange line = samples taken from anaerobic experiments at end point.
180
6.4 Discussion
6.4.1 The occurrence of As in red mud and the effect of pH / completing
ions on As solubility
XAS analysis determined that As in the red mud sampled is present primarily as
an inorganic arsenate phase (Figure 6.2), most of which could only be extracted by
HF/aqua regia in sequential extractions (Mayes et al., 2011) suggesting that it is mostly
associated with residual phases. However, alkaline leaching tests indicate that a
potentially mobile source of surface bound exchangeable As exists in red mud.
Although, sequential extraction data shows that ~0.3% of As in red mud is extractable
by MgCl2 at pH 7 (Mayes et al., 2011) (~0.6 mg kg-1), alkaline leaching tests (Figure
6.3) indicated that up to 15 % of the red mud associated arsenic can be desorbed
particularly when phosphate is present as a competing ion at pH values >8. Therefore,
there is significant potential for surface bound As to be released from red mud by
competitive desorption processes involving OH-, phosphate or carbonate ion.
6.4.2 Controls on As release during aerobic incubation
In aerobic experiments containing red mud, there was a large variation in the
concentrations of aqueous As which varied depending upon red mud loading and soil
type. All the aerobic experiments showed an overall decrease in solution pH with time.
This is attributed to the ingress of atmospheric CO2 to the experiments. Dissolution of
CO2, in alkaline solutions results in a pH reduction as alkalinity is consumed (see
Chapter 2, for the reaction sequence 2.3 - 2.7).
181
In the presence of M2+ ions (such as Ca2+ and Mg2+, which may be exchanged
from the soil by Na+ present in the red mud, or; alternatively sourced from dissolution
of Ca aluminosilicate minerals (e.g. cancrinite / hydrogarnet; (Hind et al., 1999;
Rubinos and Barral, 2013) present in red mud that are unstable below pH 12 (Castaldi et
al., 2010), carbonate phases can precipitate (e.g., Ca2+(aq) + CO3
2-(aq) → CaCO3(s)),
promoting the further dissolution of atmospheric CO2 as carbonate is removed from
solution (Renforth et al., 2012; Burke et al., 2013).
Thus, As release from the aerobic experiments is largely controlled by solution
pH (Figure 6.11a). There was a positive correlation between high aqueous As
concentrations and higher pH at the experimental end point for all the aerobic
experiments containing red mud. Although the observed reduction in pH with time
tended to also result in a trend towards lower As concentrations with time, the final pH
was buffered in all systems to pH values (pH 8.5-9.5) where small amounts of arsenate
is expected to become desorbed from red mud. It is also possible that in these aerobic
experiments, CO2 ingress lead to higher aqueous carbonate concentrations (where pH
buffers > 9) which acted as a competing ion for available sorption sites, further
promoting As solubility.
6.4.3 Effects of red mud addition on biogeochemical redox processes
Unamended anaerobic experiments using Soil WL and Soil SS showed increases
in acid extractable Fe(II) that were not observed in either the equivalent heat treated
controls or equivalent aerobic experiments, suggesting that microbially mediated Fe(III)
reduction occurred during anaerobic incubation. In the case of the unamended anaerobic
experiments using Soil OR, an increase in acid extractable Fe(II) was observed in both
182
the heat-treated controls and anaerobic experiments (but not in equivalent aerobic
experiments). The Fe(II) increase observed in heat-treated controls may be related to
recovery of microbial activity in these tests e.g. involving the survival of bacterial
spores (Esty and Williams, 1924). However, the concentration of acid extractable Fe(II)
detected in the heat-treated controls was much lower than in the unamended anaerobic
experiments (i.e. an increase of <1.5 mg g-1 compared with >6 mg g-1).
When comparing the heat treated controls (Figure 6.9) with the anaerobic
experiments (Figure 6.8) there is evidence to suggest that microbial Fe(III) reduction
also occurred in both red mud amended anaerobic experiments using the Soil OR
amended with red mud (pH 8.5 and 9.5 respectively); the Soil WL amended with red
mud (pH 9.5 and 10.5 respectively), and the Soil SS amended with 9% red mud (pH
10). Microbial Fe(III) reduction was probably inhibited in the Soil SS amended with
33% red mud due to the high pH (pH 11.5). These results are consistent with
thermodynamic calculations indicating that Fe(III) reduction is not generally favoured
above pH 11 (Burke et al., 2012b; Rizoulis et al., 2012). Although several groups of
alkaliphilic bacteria are capable of Fe(III)-reduction at pH values up to pH 11(Ye et al.,
2004; Pollock et al., 2007; Zhilina et al., 2009; Whittleston et al., 2011; Burke et al.,
2012b), these bacteria have adapted to high pH conditions by prolonged exposure. It is,
therefore, unlikely that any microbes present in the sample soils have quickly adapted to
life at high pH. However, these data indicate that the microbial communities present in
these soils contain species capable of Fe(III)-reduction that are tolerant of the increase
in pH and other challenges (e.g. increased salinity and toxic metal loadings) caused by
red mud addition.
Despite the large amounts of Fe(III)-oxides present in Ajka red mud (~40-50%
hematite determined previously by Gelencser et al., (2011)), the increases in acid
183
extractable Fe(II) detected in the red mud amended anaerobic microcosms is equivalent
(or less than) unamended anaerobic microcosms. The hematite present in red mud is
nanoparticulate (50-200 nm) (Gelencser et al., 2011; Mayes et al., 2011; Burke et al.,
2012a) . Although smaller hematite nanoparticles (<10 nm in size) are potentially
bioavailable (Dehner et al., 2011), hematite is much less bioavailable than poorly
ordered iron oxyhydroxides (Cutting et al., 2009). Therefore the low bioavailability of
hematite can account for the lack of additional Fe(II) production observed in red mud
amended experiments. The lack of reactive Fe is further evidenced from sequential
extraction data indicating that all Fe in red mud was associated with residual phases
(Mayes et al., 2011). Any increases in Fe(II) seen in the experiments containing red
mud were, therefore, most likely the result of bioreduction of the reactive Fe(III)-oxides
already present in the soils.
Addition of red mud to microcosms increases initial sulfate concentrations
compared to soil only systems. Rapid removal of SO42- was seen in Soil OR anaerobic
experiments amended with both 9% and 33 % red mud. The Soil WL anaerobic
experiments containing red mud appear to following a similar trend to the red mud
amended organic-rich experiments (initially rising concentrations, followed by removal)
but SO42- removal occurred at a much slower rate in these experiments. No removal of
SO42- occurred in any of the Soil SS anaerobic experiments where red mud was present.
In the heat treated controls SO42- concentrations were similar to the peak concentrations
seen in the anaerobic experiments. There was no SO42- removal observed in any of the
heat treated controls. This difference in behaviour between anaerobic experiments and
heat treated controls suggests that SO42- removal was a result of microbial sulfate
reduction.
184
Microbial sulfate reduction is observed in some alkaline soda lakes (with an
average pH up to 11) (Foti et al., 2007), but more generally sulfate reduction is not
thermodynamically favoured much above pH 9 (Burke et al., 2012b; Rizoulis et al.,
2012). In these experiments, three anaerobic experiments that all equilibrated between
pH 9.5 - 10 had entirely different responses (i.e. Soil OR + 33% red mud = complete
removal; Soil WL + 9% red mud addition = partial removal; and Soil SS + 9% red mud
= no removal), suggesting that trends in SO42- removal in the different systems appear to
be soils specific, as they cannot be completely explained by the impact of the pH change
or amount of red mud present.
6.4.4 As release in anaerobic experiments with no red mud addition
The concentration of As in unamended anaerobic experiments were minimal at
the start of incubation. However, large increases in aqueous As concentrations were
seen in both the Soil OR and Soil WL unamended anaerobic experiments which were
found to be ~50% As(III). Although increases of aqueous As were much lower in the
Soil SS unamended anaerobic experiment (this is consistent with the lower native As
content of this soil); aqueous As was also found to be ~50% As(III). The reduction of
As(V) to As(III) in the unamended anaerobic experiments could be an indication that
microbial arsenic reduction was occurring. Microbial As(V)-reduction in natural soils is
well documented (Dowdle et al., 1996; Oremland and Stolz, 2003; Lloyd and
Oremland, 2006) and is a key mechanism contributing to high As concentrations in
naturally contaminated waters (Islam et al., 2004; Oremland and Stolz, 2005; Charlet
and Polya, 2006). As(III) is generally more soluble than As(V) at circumneutral pH
(Smedley and Kinniburgh, 2002) thus accounting for the increased concentrations seen
185
in unamended anaerobic experiments. Further evidence of As reduction is present in the
XANES spectra from these experiments. XANES spectra revealed that As in each of the
soils was initially present primarily as As(V) but small increases in the contribution of
As(III) to XANES spectra were observed as a result of the microcosm incubation.
6.4.5 As release in anaerobic experiments with red mud addition
XANES and HPLC-ICP-MS analysis of the anaerobic experiments containing
red mud found that As was almost entirely present as As(V) with no evidence of As(III)
accumulation in either solution or in the solids. Therefore, As reduction did not occur in
any of the experiments with a red mud addition despite having supported microbial
Fe(III)- and sulfate reduction in several of the experiments. In addition microbial
mediated As reduction occurred in all the unamended anaerobic experiments,
demonstrating that both bioavailable As(V) and a microbial community capable of As-
reduction was present in the soils used. Arsenic reduction is a common biological
process in soda lakes, which are both alkaline and saline like red mud contaminated
systems (Oremland et al., 2004; Oremland et al., 2005). However, the population of As
reducing bacteria present in these soils was not able to tolerate the additional stresses
caused by red mud addition and did not support As(V) reduction processes even when
pH increases observed were relatively modest (e.g. in the experiments using the organic
rich soil).
In the absence of microbial induced changes of As speciation, experimental pH
should be the primary control of surface bound arsenate associated with red mud. In the
anaerobic experiments, pH values were higher than equivalent aerobic experiments (as
CO2 ingress was prevented) but As concentrations were similar (or slightly lower) than
186
in the aerobic experiments (Figure 6.11b). However, in the anaerobic experiments using
Soil OR with a 9% RM addition (at pH 8-8.5), As concentrations were between 5-10
times higher than the equivalent aerobic experiments. Fe(III)-reducing conditions
developed in the anaerobic experiments (Figure. 6.7a). The reductive dissolution of iron
oxides minerals is expected to promote the release of surface bound arsenate into
solution (Zachara et al., 2001; Islam et al., 2004), which might explain the increased
As(V) concentrations observed in this experiment (and the overall lack of relationship
between As concentration and pH observed in Fig 6.11b). However, the addition of
non-reactive nanoparticulate hematite particles associated with the red mud, should
reduce the overall extent of this effect by providing additional surfaces for arsenate
adsorption.
6.5 Conclusions
Arsenic in red mud is present as As(V) as arsenate species where up to 15% is
present in phosphate exchangeable surface bound complexes that have the potential to
be remobilised. Arsenate solubility from red mud is enhanced at high pH and also in the
presence of competing ions such as phosphate and carbonate. In aerobic soil systems,
As release is related to red mud loading and the pH value that occurs due to soil
buffering reactions. Under aerobic conditions, carbonation reactions also produced
lower pH with time resulting in a trend towards lower aqueous As concentrations.
However, dissolved CO2 (speciated as carbonate at pH >9) may also provide a source of
competing ions thus increasing As concentrations in some cases. In anaerobic
experiments, carbonation reactions do not occur and experimental pH is determined by
red mud loading and the buffering capacity of the soils used. As(V) release is not
187
strongly dependent on experimental pH, and some As release is observed in all
experiments. Although no reduction of As(V) to As(III) occurs, Fe(III)-reduction
occurred in several experiments, and dissolution of high surface area iron
(oxy)hydroxides may play a role in As release by reducing the overall sorption capacity
present.
The results of this study, suggest that the pH of all the red mud affected soil
systems studied (during both aerobic and anaerobic incubation) was typically
sufficiently high (>pH 8.5) that release of small amounts of surface bound As from red
mud occurred to some extent. Leaching of As from red mud affected soils may have
contributed to the moderate increases in As concentrations found in river waters up to
two years after the spill (Nagy et al., 2013). These data, therefore, vindicate the decision
by Hungarian authorities to recover most of the red mud from affected land as arsenic
leaching is likely to have been much greater without this intervention.
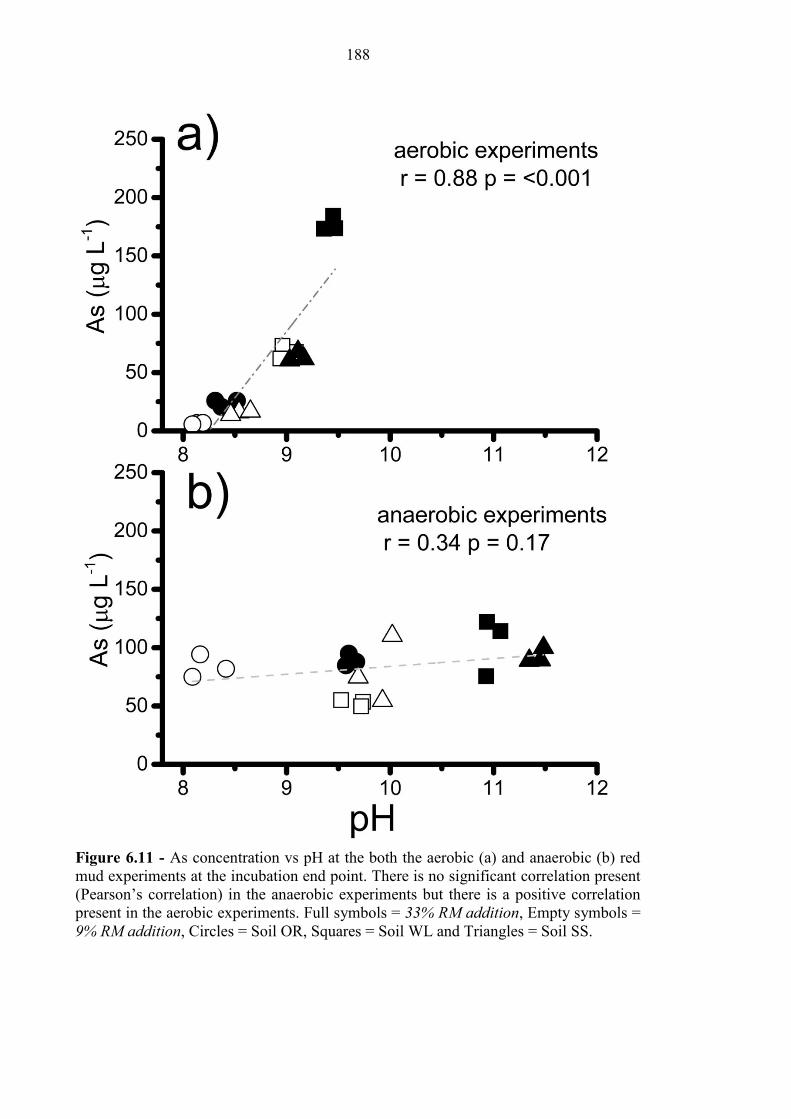
188
Figure 6.11 - As concentration vs pH at the both the aerobic (a) and anaerobic (b) red
mud experiments at the incubation end point. There is no significant correlation present
(Pearson’s correlation) in the anaerobic experiments but there is a positive correlation
present in the aerobic experiments. Full symbols = 33% RM addition, Empty symbols =
9% RM addition, Circles = Soil OR, Squares = Soil WL and Triangles = Soil SS.
189
6.6 References
ADAM, J., BANVOLGYI, G., DURA, G., GRENERCZY, G., GUBECK, N., GUPTER, I.,
SIMON, G., SZEGFALVI, Z., SZEKACS, A., SZEPVOLGYI, J. & UJLAKY, E. 2011. The
Kolontar report: Causes and Lessons from the Red Mud Disaster. In: B, J. (ed.). Budapest:
Sustainable Development Committee of the Hungarian Parliament.
ALTUNDOGAN, H. S., ALTUNDOGAN, S., TUMEN, F. & BILDIK, M. 2000. Arsenic
removal from aqueous solutions by adsorption on red mud. Waste Management, 20, 761-767.
ALTUNDOGAN, H. S., ALTUNDOGAN, S., TUMEN, F. & BILDIK, M. 2002. Arsenic
adsorption from aqueous solutions by activated red mud. Waste Management, 22, 357-363.
ANTON, A., REKASI, M., UZINGER, N., SZEPLABI, G. & MAKO, A. 2012. Modelling the
Potential Effects of the Hungarian Red Mud Disaster on Soil Properties. Water Air and Soil
Pollution, 223, 5175-5188.
ASPILA, K. I., AGEMIAN, H. & CHAU, A. S. Y. 1976. SEMIAUTOMATED METHOD FOR
DETERMINATION OF INORGANIC, ORGANIC AND TOTAL PHOSPHATE IN
SEDIMENTS. Analyst, 101, 187-197.
ASTM 2006. D4972.01: standard test method for pH of soils. Annual Book of ASTM standards.
Amer Soc Test Mater.
BHATNAGAR, A., VILAR, V. J. P., BOTELHO, C. M. S. & BOAVENTURA, R. A. R. 2011.
A review of the use of red mud as adsorbent for the removal of toxic pollutants from water and
wastewater. Environmental Technology, 32, 231-249.
BRUNORI, C., CREMISINI, C., MASSANISSO, P., PINTO, V. & TORRICELLI, L. 2005.
Reuse of a treated red mud bauxite waste: studies on environmental compatibility. Journal of
Hazardous Materials, 117, 55-63.
BURKE, I. T., MAYES, W. M., PEACOCK, C. L., BROWN, A. P., JARVIS, A. P. & GRUIZ,
K. 2012a. Speciation of arsenic, chromium, and vanadium in red mud samples from the ajka
spill site, hungary. Environmental Science & Technology, 46, 3085-92.
BURKE, I. T., MORTIMER, R. J. G., PALANIYANDI, S., WHITTLESTON, R. A.,
LOCKWOOD, C. L., ASHLEY, D. J. & STEWART, D. I. 2012b. Biogeochemical Reduction
Processes in a Hyper-Alkaline Leachate Affected Soil Profile. Geomicrobiology Journal, 29,
769-779.
BURKE, I. T., PEACOCK, C. L., LOCKWOOD, C. L., STEWART, D. I., MORTIMER, R. J.
G., WARD, M. B., RENFORTH, P., GRUIZ, K. & MAYES, W. M. 2013. Behavior of
Aluminum, Arsenic, and Vanadium during the Neutralization of Red Mud Leachate by HCl,
Gypsum, or Seawater. Environmental Science & Technology, 47, 6527-6535.
CASTALDI, P., SILVETTI, M., GARAU, G. & DEIANA, S. 2010. Influence of the pH on the
accumulation of phosphate by red mud (a bauxite ore processing waste). Journal of Hazardous
Materials, 182, 266-272.
190
CHARLET, L. & POLYA, D. A. 2006. Arsenic in shallow, reducing groundwaters in southern
Asia: An environmental health disaster. Elements, 2, 91-96.
CORNELIS, G., JOHNSON, C. A., VAN GERVEN, T. & VANDECASTEELE, C. 2008.
Leaching mechanisms of oxyanionic metalloid and metal species in alkaline solid wastes: A
review. Applied Geochemistry, 23, 955-976.
CUTTING, R. S., COKER, V. S., FELLOWES, J. W., LLOYD, J. R. & VAUGHAN, D. J.
2009. Mineralogical and morphological constraints on the reduction of Fe(III) minerals by
Geobacter sulfurreducens. Geochimica Et Cosmochimica Acta, 73, 4004-4022.
DEHNER, C. A., BARTON, L., MAURICE, P. A. & DUBOIS, J. L. 2011. Size-Dependent
Bioavailability of Hematite (alpha-Fe2O3) Nanoparticles to a Common Aerobic Bacterium.
Environmental Science & Technology, 45, 977-983.
DOWDLE, P. R., LAVERMAN, A. M. & OREMLAND, R. S. 1996. Bacterial dissimilatory
reduction of arsenic(V) to arsenic(III) in anoxic sediments. Applied and Environmental
Microbiology, 62, 1664-1669.
ENSERINK, M. 2010. ENVIRONMENT After Red Mud Flood, Scientists Try to Halt Wave of
Fear and Rumors. Science, 330, 432-433.
ESTY, J. R. & WILLIAMS, C. C. 1924. Heat resistance studies I A new method for the
determination of heat resistance let of bacterial spores. Journal of Infectious Diseases, 34, 516-
528.
FEIGL, V., ANTON, A., UZIGNER, N. & GRUIZ, K. 2012. Red Mud as a Chemical Stabilizer
for Soil Contaminated with Toxic Metals. Water Air and Soil Pollution, 223, 1237-1247.
FOTI, M., SOROKIN, D. Y., LOMANS, B., MUSSMAN, M., ZACHAROVA, E. E.,
PIMENOV, N. V., KUENEN, J. G. & MUYZER, G. 2007. Diversity, activity, and abundance
of sulfate-reducing bacteria in saline and hypersaline soda lakes. Applied and Environmental
Microbiology, 73, 2093-2100.
FRIESL, W., HORAK, O. & WENZEL, W. W. 2004. Immobilization of heavy metals in soils
by the application of bauxite residues: pot experiments under field conditions. Journal of Plant
Nutrition and Soil Science-Zeitschrift Fur Pflanzenernahrung Und Bodenkunde, 167, 54-59.
GELENCSER, A., KOVATS, N., TUROCZI, B., ROSTASI, A., HOFFER, A., IMRE, K.,
NYIRO-KOSA, I., CSAKBERENYI-MALASICS, D., TOTH, A., CZITROVSZKY, A., NAGY,
A., NAGY, S., ACS, A., KOVACS, A., FERINCZ, A., HARTYANI, Z. & POSFAI, M. 2011.
The Red Mud Accident in Ajka (Hungary): Characterization and Potential Health Effects of
Fugitive Dust. Environmental Science & Technology, 45, 1608-1615.
GENC-FUHRMAN, H., TJELL, J. C. & MCCONCHIE, D. 2004. Adsorption of arsenic from
water using activated neutralized red mud. Environmental Science & Technology, 38, 2428-
2434.
GRAFE, M., POWER, G. & KLAUBER, C. 2011. Bauxite residue issues: III. Alkalinity and
associated chemistry. Hydrometallurgy, 108, 60-79.
191
GRAY, C. W., DUNHAM, S. J., DENNIS, P. G., ZHAO, F. J. & MCGRATH, S. P. 2006. Field
evaluation of in situ remediation of a heavy metal contaminated soil using lime and red-mud.
Environmental Pollution, 142, 530-539.
GRUIZ, K., FEIGL, V., KLEBERCZ, O., ANTON, A., AND VASZITA, E. Environmental
Risk Assessment of Red Mud Contaminated Land in Hungary. Geocongress 2012: State of the
Art and Practice in Geotechnical Engineering, 2012. American Society of Civil Engineers,
4156-4165.
HAMMOND, K., MISHRA, B., APELIAN, D., BLANPAIN, B. 2013. CR3 Communication:
Red Mud - A Resource or a Waste. JOM, 65, 340-341.
HERY, M., VAN DONGEN, B. E., GILL, F., MONDAL, D., VAUGHAN, D. J., PANCOST, R.
D., POLYA, D. A. & LLOYD, J. R. 2010. Arsenic release and attenuation in low organic
carbon aquifer sediments from West Bengal. Geobiology, 8, 155-168.
HIND, A. R., BHARGAVA, S. K. & GROCOTT, S. C. 1999. The surface chemistry of Bayer
process solids: a review. Colloids and Surfaces a-Physicochemical and Engineering Aspects,
146, 359-374.
ISLAM, F. S., GAULT, A. G., BOOTHMAN, C., POLYA, D. A., CHARNOCK, J. M.,
CHATTERJEE, D. & LLOYD, J. R. 2004. Role of metal-reducing bacteria in arsenic release
from Bengal delta sediments. Nature, 430, 68-71.
KLEBERCZ, O., MAYES, W. M., ANTON, A. D., FEIGL, V., JARVIS, A. P. & GRUIZ, K.
2012. Ecotoxicity of fluvial sediments downstream of the Ajka red mud spill, Hungary. Journal
of environmental monitoring : JEM, 14, 2063-71.
LANGMUIR, D. 1997. Aqueous environmental geochemistry, Upper Saddle River, N. J.,
Prentice Hall.
LIU, X. & ZHANG, N. 2011. Utilization of red mud in cement production: a review. Waste
Management & Research, 29, 1053-1063.
LIU, Y., LIN, C. & WU, Y. 2007. Characterization of red mud derived from a combined Bayer
Process and bauxite calcination method. Journal of Hazardous Materials, 146, 255-261.
LIU, Y., NAIDU, R. & MING, H. 2011. Red mud as an amendment for pollutants in solid and
liquid phases. Geoderma, 163, 1-12.
LLOYD, J. R. & OREMLAND, R. S. 2006. Microbial transformations of arsenic in the
environment: From soda lakes to aquifers. Elements, 2, 85-90.
LOMBI, E., ZHAO, F. J., ZHANG, G. Y., SUN, B., FITZ, W., ZHANG, H. & MCGRATH, S.
P. 2002. In situ fixation of metals in soils using bauxite residue: chemical assessment.
Environmental Pollution, 118, 435-443.
LOVLEY, D. R. & PHILLIPS, E. J. P. 1986. AVAILABILITY OF FERRIC IRON FOR
MICROBIAL REDUCTION IN BOTTOM SEDIMENTS OF THE FRESH-WATER TIDAL
POTOMAC RIVER. Applied and Environmental Microbiology, 52, 751-757.
192
MAYES, W. M., JARVIS, A. P., BURKE, I. T., WALTON, M., FEIGL, V., KLEBERCZ, O. &
GRUIZ, K. 2011. Dispersal and Attenuation of Trace Contaminants Downstream of the Ajka
Bauxite Residue (Red Mud) Depository Failure, Hungary. Environmental Science &
Technology, 45, 5147-5155.
NAGY, A. S., SZABO, J. & VASS, I. 2013. Trace metal and metalloid levels in surface water
of the Marcal River before and after the Ajka red mud spill, Hungary. Environmental Science
and Pollution Research, 20, 7603-7614.
O'DAY, P. A., VLASSOPOULOS, D., ROOT, R. & RIVERA, N. 2004. The influence of sulfur
and iron on dissolved arsenic concentrations in the shallow subsurface under changing redox
conditions. Proceedings of the National Academy of Sciences of the United States of America,
101, 13703-13708.
OREMLAND, R. S., KULP, T. R., BLUM, J. S., HOEFT, S. E., BAESMAN, S., MILLER, L.
G. & STOLZ, J. F. 2005. A microbial arsenic cycle in a salt-saturated, extreme environment.
Science, 308, 1305-1308.
OREMLAND, R. S. & STOLZ, J. F. 2003. The ecology of arsenic. Science, 300, 939-944.
OREMLAND, R. S. & STOLZ, J. F. 2005. Arsenic, microbes and contaminated aquifers.
Trends in Microbiology, 13, 45-49.
OREMLAND, R. S., STOLZ, J. F. & HOLLIBAUGH, J. T. 2004. The microbial arsenic cycle
in Mono Lake, California. Fems Microbiology Ecology, 48, 15-27.
POLLOCK, J., WEBER, K. A., LACK, J., ACHENBACH, L. A., MORMILE, M. R. &
COATES, J. D. 2007. Alkaline iron(III) reduction by a novel alkaliphilic, halotolerant, Bacillus
sp isolated from salt flat sediments of Soap Lake. Applied Microbiology and Biotechnology, 77,
927-934.
POWER, G., GRAFE, M. & KLAUBER, C. 2011. Bauxite residue issues: I. Current
management, disposal and storage practices. Hydrometallurgy, 108, 33-45.
REEVES, H. J., WEALTHALL, G. & YOUNGER, P. L. 2011. Advisory visit to the bauxite
processings tailings dam near Ajka, Vesprem County, western Hungary. . Keyworth, UK:
British Geological Survey.
RENFORTH, P., MAYES, W. M., JARVIS, A. P., BURKE, I. T., MANNING, D. A. C. &
GRUIZ, K. 2012. Contaminant mobility and carbon sequestration downstream of the Ajka
(Hungary) red mud spill: The effects of gypsum dosing. The Science of the total environment,
421-422, 253-9.
RIZOULIS, A., STEELE, H. M., MORRIS, K. & LLOYD, J. R. 2012. The potential impact of
anaerobic microbial metabolism during the geological disposal of intermediate-level waste.
Mineralogical Magazine, 76, 3261-3270.
RUBINOS, D. A. & BARRAL, M. T. 2013. Fractionation and mobility of metals in bauxite red
mud. Environmental science and pollution research international, 20, 7787-802.
RUYTERS, S., MERTENS, J., VASSILIEVA, E., DEHANDSCHUTTER, B., POFFIJN, A. &
SMOLDERS, E. 2011. The Red Mud Accident in Ajka (Hungary): Plant Toxicity and Trace
193
Metal Bioavailability in Red Mud Contaminated Soil. Environmental Science & Technology, 45,
1616-1622.
SMEDLEY, P. L. & KINNIBURGH, D. G. 2002. A review of the source, behaviour and
distribution of arsenic in natural waters. Applied Geochemistry, 17, 517-568.
SOMLAI, J., JOBBAGY, V., KOVACS, J., TARJAN, S. & KOVACS, T. 2008. Radiological
aspects of the usability of red mud as building material additive. Journal of Hazardous Materials,
150, 541-545.
TOMIC, S. S., B. G.; WANDER, A.; HARRISON, N. M.; DENT, A. J.; MOSSELMANS, J. F.
W.; INGLESFIELD, J. E. 2005. New Tools for the Analysis of EXAFS: The DL_EXCURV
Package. CCLRC Technical Report DL-TR-2005-01. Daresbury, UK.
WHITTLESTON, R. A., STEWART, D. I., MORTIMER, R. J. G., ASHLEY, D. J. & BURKE,
I. T. 2011. Effect of Microbially Induced Anoxia on Cr(VI) Mobility at a Site Contaminated
with Hyperalkaline Residue from Chromite Ore Processing. Geomicrobiology Journal, 28, 68-
82.
YADAV, V. S., PRASAD, M., KHAN, J., AMRITPHALE, S. S., SINGH, M. & RAJU, C. B.
2010. Sequestration of carbon dioxide (CO2) using red mud. Journal of Hazardous Materials,
176, 1044-1050.
YE, Q., ROH, Y., CARROLL, S. L., BLAIR, B., ZHOU, J. Z., ZHANG, C. L. & FIELDS, M.
W. 2004. Alkaline anaerobic respiration: Isolation and characterization of a novel alkaliphilic
and metal-reducing bacterium. Applied and Environmental Microbiology, 70, 5595-5602.
ZACHARA, J. M., FREDRICKSON, J. K., SMITH, S. C. & GASSMAN, P. L. 2001.
Solubilization of Fe(III) oxide-bound trace metals by a dissimilatory Fe(III) reducing bacterium.
Geochimica Et Cosmochimica Acta, 65, 75-93.
ZHILINA, T. N., ZAVARZINA, D. G., KOLGANOVA, T. V., LYSENKO, A. M. &
TOUROVA, T. P. 2009. Alkaliphilus peptidofermentans sp nov., a new alkaliphilic bacterial
soda lake isolate capable of peptide fermentation and Fe(III) reduction. Microbiology, 78, 445-
454.
194
Chapter 7 Leaching of copper and nickel in soil-water
systems contaminated by red mud from Ajka, Hungary: The
importance of soil organic matter.
Abstract
The red mud spill at Ajka, Hungary released 1 million m3 of caustic red mud into the
surrounding area with devastating results. Red mud is a highly alkaline (pH >12) waste
product from bauxite ore processing. It contains elevated concentrations of oxyanion
forming elements such as As and V that are mobilised at high pH but also trace metals
that form stable complexes with organic matter (OM), such as Cu and Ni. Land
remediation after the spill sought to remove red mud from affected areas or plough
thinner deposits (< 5 cm) to prevent dust formation whereas wetland areas were left
untreated. The addition of red mud to soils increases aqueous dissolved organic carbon
(DOC) concentrations due to soil alkalisation. The mobilisation of Cu and Ni from red
mud affected soil-water systems was investigated using aerobic and anaerobic batch
microcosms together with solid phase extraction techniques to assess the amount of
organically bound metals. The results showed that if the red mud loading and TOC
content is sufficient there will be increased mobilisation of Cu and Ni through OM
complexation, when compared to unaffected soils. This mechanism was found to be
more prevalent under anaerobic conditions. These data indicate that the extensive
remediation efforts by the Hungarian authorities were justified but that red mud should
be used with caution as a soil amendment, especially in soils with a high TOC content.
These data also highlight the problematic leaching of other oxyanion forming elements
such as Mo, Se and Ti under anaerobic conditions and concerns over the water quality
of unremediated wetland areas.
195
7.1 Introduction
The accidental release of ~1 million m3 (Reeves et al., 2011; Adam et al., 2011a)
of bauxite processing residue (red mud) from the Ajkai Timfoldgyar Zrt alumina plant
in Ajka, western Hungary in October 2010 focused world attention on the potential
public health and environmental hazards associated with red mud. The spill had
devastating effects; causing damage to property, serious injuries and killing 10 people
(Enserink, 2010; Adam et al., 2011a). An estimated 40km2 of low lying agricultural
land and riparian wetlands were affected and the red mud was transported 120 km
downstream by rivers eventually reaching the Danube (Reeves et al., 2011; Mayes et al.,
2011).
Red mud is the name given to the fine fraction residue that remains after
alumina is extracted from bauxite ore during the Bayer process. The composition of red
mud is highly dependent upon the bauxite ore used (Hind et al., 1999; Liu et al., 2007),
but is typically comprised of; residual iron oxides, quartz, sodium aluminosilicates,
titanium dioxide, calcium carbonate/aluminate and sodium hydroxide (Hind et al., 1999;
Grafe et al., 2011; Gelencser et al., 2011). There has been considerable attention drawn
to the potential hazards of red mud since the disaster, mainly in relation to its caustic
nature (Grafe et al., 2011) which can be toxic to plants and some freshwater biota
(Wilkie and Wood, 1996). The use of NaOH during the Bayer process means that unless
neutralisation steps are taken during the refining process the red mud produced is very
alkaline (Grafe et al., 2011; Power et al., 2011). At Ajka it had a pH>12 (Adam et al.,
2011a) making it a hazardous substance as defined by the Basel Convention (Basel
Convention, 2011).
196
Red mud also is known to contain elevated concentrations of toxic and
potentially toxic metals and metalloids. The majority of these problematic elements are
associated with sparingly soluble red mud minerals (Mayes et al., 2011; Rubinos and
Barral, 2013) but research since the disaster has highlighted oxyanion forming elements
such as; Al, As, Cr, Mo and V as persistently mobile (Milacic et al., 2012; Burke et al.,
2013). The red mud leachate from Ajka had high levels of dissolved salts (up to 160 mS
cm-2) and contained up to 350 mg L-1 Al, 8 mg L-1 As, 12 mg L-1 Mo and 16 mg L-1 V
(these oxyanion forming elements are very soluble at high pH) (Mayes et al., 2011;
Burke et al., 2013).
Several studies since the spill have investigated the effects of red mud on human
health (Gelencser et al., 2011); soil toxicity (Anton et al., 2012); freshwater and soil
ecology (Klebercz et al., 2012; Rekasi et al., 2013); the mobility of red mud associated
trace metals in the wider environment (Mayes et al., 2011; Burke et al., 2012a); and the
effects dosing of rivers and streams with acid and gypsum to reduce pH (Renforth et al.,
2012; Burke et al., 2013). After the Ajka disaster, the affected land was treated in two
different ways: 1) removal of red mud where deposits were >5cm and 2) ploughing any
red mud into land where deposits were <5cm. The land clean-up began a few weeks
after the disaster but in some areas the red mud covered the soils for several months
(Rekasi et al., 2013), and removal of red mud from fields was still continuing in May
2011. The clean-up operation focussed on recovering farmland, and, any affected
wetland areas remain unremediated.
Humic acids are an important component of soil organic matter (SOM) whose
solubility varies with pH. They are produced by microbial degradation of plant and
animal residues, and represent a range of chemically similar compounds that contain
carboxyl and phenolate groups, and behave functionally as a dibasic (occasionally tri-
197
basic) acid (Stevenson, 1994). As a result the amount of dissolved organic matter
(DOM) in soil pore water tends to increase as the pH increases (Cheshire et al., 1977;
Yin et al., 2002). Indeed, addition of dilute NaOH is used as a standard method for
extracting humic substances from soil (Parsons, 1988; Sparks, 1998). The addition of
red mud to soil increases both the pH and DOC of soil pore-waters (Lombi et al., 2002;
Rekasi et al., 2013). The degree to which a particular soil is affected by the pH increase
associated with red mud addition will depend on the nature of the soil affected. For
example; sandy soils will undergo a greater pH increase, as they lack the intrinsic
buffering capacity of a clay soil; but soil with high SOM contents will release more
DOC into soil porewaters upon soil alkalisation (see Chapter 5). DOC in soil pore-
waters has a major impact on the aqueous concentrations of trace metals in
circumneutral and alkaline pore-waters (Davis, 1984; Ashworth and Alloway, 2004)
due to formation of complexes between metal cations and SOM functional groups (at
acidic pH, SOM adsorption to soil mineral surfaces is enhanced)(Wu et al., 2002).
Therefore the addition of red mud to soil can create two problems: 1) oxyanion forming
elements become more soluble as soil pH increases and 2) the increase in DOC also
increases the solubility of metals that form stable complexes with organic matter.
Cu and Ni have been highlighted, alongside As, as occurring in elevated
concentrations in the Torna and Marcel Rivers since the spill (Nagy et al., 2013). Unlike
oxyanions, Cu and Ni cations are both generally more mobile under more acidic
conditions (sorption edge Cu ~pH 5.1, Ni ~ pH 6.8, (Langmuir, 1997)). However Lombi
et al. (2002) found that Cu mobility increased in Cu contaminated soils with red mud
amendment (2% w/w) over 100 and 200 days compared to non-amended soils although
Ni mobility from the same experiments was not found to be problematic. Since the red
mud spill, Rekasi et al. (2013) found that the aqueous concentration of Cu increased in
198
red mud affected soil experiments which they attributed to increased soil pH and DOC
concentration. Wu et al. (2001) found that Cu is mobile in alkaline soil when the humate
is present, but immobile when it is absent. Cu and Ni can form complexes with organic
matter (Cheshire et al., 1977; Richter and Theis, 1980). Cu(II) in particular, forms
strong complexes with electron donors from O, N and S with SOM functional groups
(Leckie and Davis, 1979), which may explain the persistence of this metal solution in
alkaline conditions.
Cu is a redox sensitive element that occurs in the (+II) state under oxic
conditions and can be reduced to Cu(I) or Cu(0) in reducing environments forming
insoluble oxides, sulfides and Cu(s) (Weber et al., 2009; Fulda et al., 2013a). The
solubility of Ni is less affected by changes in redox potential but forms insoluble
hydroxides (as Ni(OH)2) as pH increases (above pH 9) (Richter and Theis, 1980;
Bradbury and Baeyens, 2009). Sorption to Fe and especially Mn oxides are also very
important in controlling aqueous Ni concentrations (Peacock and Sherman, 2007).
Here, results are presented from a series of long-term aerobic and anaerobic
batch experiments designed to investigate the mobility of Cu and Ni from red mud
contaminated soil-water systems analogous to soil conditions post the Ajka disaster
clean-up. These data build on recent work relating to oxyanion release (see chapter 5)
and As mobility (see chapter 6) in similar systems. The specific objectives of this study
were 1) to determine the potential for Cu and Ni release in red mud affected soil-water
systems 2) to determine the effect of complexation with soil derived DOC on metal
behaviour as a function of soil type 3) Discuss the long-term implications of ploughing
in red mud to soils as an emergency remediation method and the potential hazards
associated with unremediated wetland areas.
199
7.2 Materials and Methods
7.2.1 Field Sampling and Sample Handling
Sampling was undertaken in May 2011 (see Figure 3.2 for sampling locations). Red
mud (RM) was sampled from within Cell X of the Ajka impoundment (Location
47°05’18.48”N, 17°29’46.77”E) and red mud leachate was collected from an open
leachate pond at the same location. Three uncontaminated soils were sampled from
locations in the Torna and upper Marcal river catchments unaffected by the release of
red mud in 2010. Two were agricultural top soils (one was organic-rich (OR), the other
a sandy soil (SS)) and the third was collected from 50cm from below the surface (i.e.
beneath the rootlet layer) of a wetland (WL). All samples were stored at 4°C in
polythene containers and a small sub-sample was stored at −80°C for X-ray absorption
spectroscopy. The wetland soil was stored anaerobically using AnaerogenTM sachets.
7.2.2 Long-Term Batch Experiments
Batch microcosm experiments were established under both aerobic and
anaerobic conditions. Two different red mud-soil mixtures were prepared for each soil
type (triplicate microcosms were prepared for each condition). A 9% red mud addition
(by dry weight) was chosen as an analogue for where red mud had been ploughed into
fields (based on ~5cm ploughed to a typical depth of 40-50cm, an approximate 5:50
mixing ratio). The 33% addition was used as a worst case scenario for any unremediated
wetlands. Deionised water was added in a 5:1 ratio to the amount of soil.
Anaerobic experiments were carried out in 120 mL glass serum bottles, which
were purged with nitrogen before capping and crimp sealing. Aerobic experiments were
200
carried out in 50 mL polypropylene centrifuge tubes and opened every week day for an
hour in order to exchange the experimental headspace with air and prevent anaerobic
conditions forming due to microbial respiration. Both aerobic and anaerobic
experiments were incubated in the dark at 21 °C and sampled periodically over 100 -
120 days. During sampling bottles / tubes were shaken and 2 to 4 mL aliquots of soil /
RM slurry was extracted. Aseptic technique was used where appropriate. Extractions
were centrifuged (3 min, 6,000 g) and water pH and oxidation/reduction potential
(ORP) was determined. The aqueous phase was filtered (0.2 µm) and acidified with 2%
HNO3 for ICP-MS analysis. At the end point of each experiment between 6 - 15 ml of
slurry was extracted and centrifuged, the solutions were used for dissolved organic
carbon (DOC) analysis and solid phase extraction (SPE) experiments. Control
experiments without red mud addition for each soil type were incubated under anaerobic
and aerobic conditions as described above.
7.2.3 Geochemical Methods.
ORP (as an indicator for Eh) and pH were measured using a Thermo Scientific
Orion Dualstar pH/ISE benchtop meter (pH was calibrated daily at pH 4, 7 and 10; a
new factory calibrated ORP electrode was used). Aqueous As, Cd, Co, Cr, Cu, Mo, Ni
and V concentrations were determined using a Perkin Elmer Elan DRCII inductively
coupled plasma-mass spectrometer and an Optima 5300 DV ICP-OES was used to
determine aqueous concentrations of other elements. DOC in end point solutions was
determined by a multi N/C® 2100 using thermocatalytic oxidation, MC-NDIR detection
analysis. Standards were used to check the accuracy and precision of the methods.
Calibration regression had R2 ≥0.999. Reference materials were used where appropriate.
201
7.2.4 Solid Phase Extraction (SPE)
The solutions from the end points of the batch experiments were passed through
Isolute™ C18 1 g / 6 mL non polar SPE filters to retain organic substances (and thereby
any organically bound metals). These filters were conditioned according to the
manufacturer’s instructions, and the solutions acidified to pH 5.5 prior to filtration using
HNO3 (the optimum pH for maximum organic matter retention by Isolute C18 filters
(Thomas, 2000). The filtrates were further diluted with 2% HNO3 for ICP-MS analysis
to determine the inorganic/free aqueous metal concentrations. The concentration of
organically bound metals was calculated from the difference in aqueous metals
concentrations measured before (total [M+]) and after SPE (inorganic/free [M+]). Please
note the important caveat that this is an operationally defined extraction and it is
possible that a small percentage of metals bound to organic compounds may not
retained by C18 filters will therefore be included in the aqueous fraction. The
percentages calculated from this method should be used only as an indicator for the
amount of organically bound metals.
7.3 Results
7.3.1 Sample Characterization
The full sample characterisation of RM and the 3 different soil samples has been
described previously and is presented in chapter 5 (see Table 5.1and full XRF analysis
is presented in Table 5.2). Briefly, the RM mineral content was dominated by hematite
(Fe2O3), calcite (CaCO3), magnetite (Fe3O4), cancrinite (Na6CaAl6Si6(CO3)O24.2H2O)
and hydrogarnet (Ca3AlFe(SiO4)(OH8) with residual boehmite (γ-AlOOH) and gibbsite
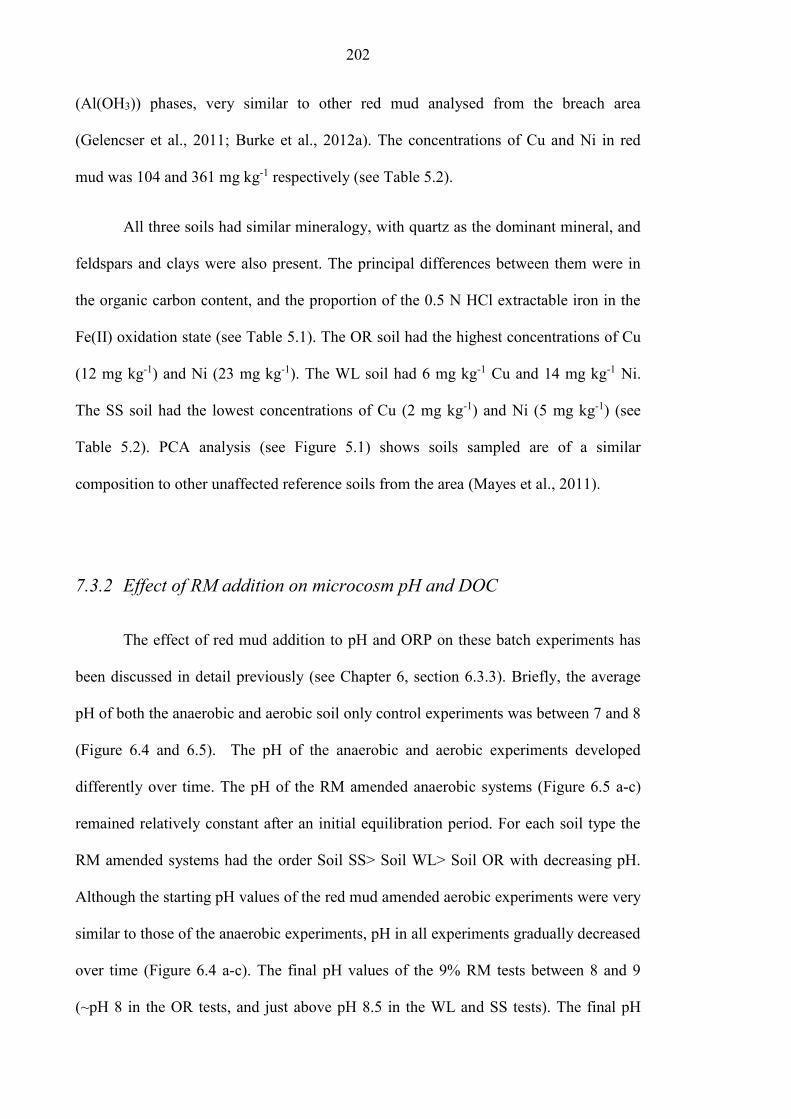
202
(Al(OH3)) phases, very similar to other red mud analysed from the breach area
(Gelencser et al., 2011; Burke et al., 2012a). The concentrations of Cu and Ni in red
mud was 104 and 361 mg kg-1 respectively (see Table 5.2).
All three soils had similar mineralogy, with quartz as the dominant mineral, and
feldspars and clays were also present. The principal differences between them were in
the organic carbon content, and the proportion of the 0.5 N HCl extractable iron in the
Fe(II) oxidation state (see Table 5.1). The OR soil had the highest concentrations of Cu
(12 mg kg-1) and Ni (23 mg kg-1). The WL soil had 6 mg kg-1 Cu and 14 mg kg-1 Ni.
The SS soil had the lowest concentrations of Cu (2 mg kg-1) and Ni (5 mg kg-1) (see
Table 5.2). PCA analysis (see Figure 5.1) shows soils sampled are of a similar
composition to other unaffected reference soils from the area (Mayes et al., 2011).
7.3.2 Effect of RM addition on microcosm pH and DOC
The effect of red mud addition to pH and ORP on these batch experiments has
been discussed in detail previously (see Chapter 6, section 6.3.3). Briefly, the average
pH of both the anaerobic and aerobic soil only control experiments was between 7 and 8
(Figure 6.4 and 6.5). The pH of the anaerobic and aerobic experiments developed
differently over time. The pH of the RM amended anaerobic systems (Figure 6.5 a-c)
remained relatively constant after an initial equilibration period. For each soil type the
RM amended systems had the order Soil SS> Soil WL> Soil OR with decreasing pH.
Although the starting pH values of the red mud amended aerobic experiments were very
similar to those of the anaerobic experiments, pH in all experiments gradually decreased
over time (Figure 6.4 a-c). The final pH values of the 9% RM tests between 8 and 9
(~pH 8 in the OR tests, and just above pH 8.5 in the WL and SS tests). The final pH
203
values of the 33% RM tests were slightly higher than the equivalent 9% RM tests (~pH
8.5 in the OR tests, and between pH9 and 9.5 in the WL and SS tests). In all anaerobic
experiments the ORP decreased to between 100 and 300 mV (Figure 6.4 d-f). In the
aerobic experiments it increased to ~+250 mV (Figure 6.4 d-f.).
There is a clear pattern to the DOC concentrations measured at the end of the
incubation periods (Table 7.1). In each of the six systems (three soils in anaerobic and
aerobic conditions) the amount of DOC in solution increases with the RM loading. For
each soil type there is also a significantly higher DOC concentration in the anaerobic
system than in the equivalent aerobic system at the end of testing (this is most apparent
in the OR Soil, 33% RM experiment, where the DOC concentration is ~850mg L-1 in the
anaerobic system, but only ~82 mg L-1 in the aerobic system). Comparison of the three
soils indicates that the DOC concentrations in OR soil tests were higher than in the
equivalent WL or SS soil tests (the WL and SS soils exhibited broadly similar DOC
concentrations in equivalent tests).
Table 7.1 – DOC concentrations (mg L-1) at experiment end points
Experimental
Conditions
Soil OR Soil WL Soil SS
Anaerobic Aerobic Anaerobic Aerobic Anaerobic Aerobic
Unamended
Control 81 (±8) 11 (±2) 21 (±2) 8 (±5) NR 13 (±3)
9% RM
Addition 150 (±3) 31 (±4) 95 (±16) 37 (±1) 149 (±22) 22 (±4)
33% RM
Addition 850 (±6) 82 (±8) 209 (±39) 67 (±3) 262 (±4) 58 (±7)
NR – not analysed
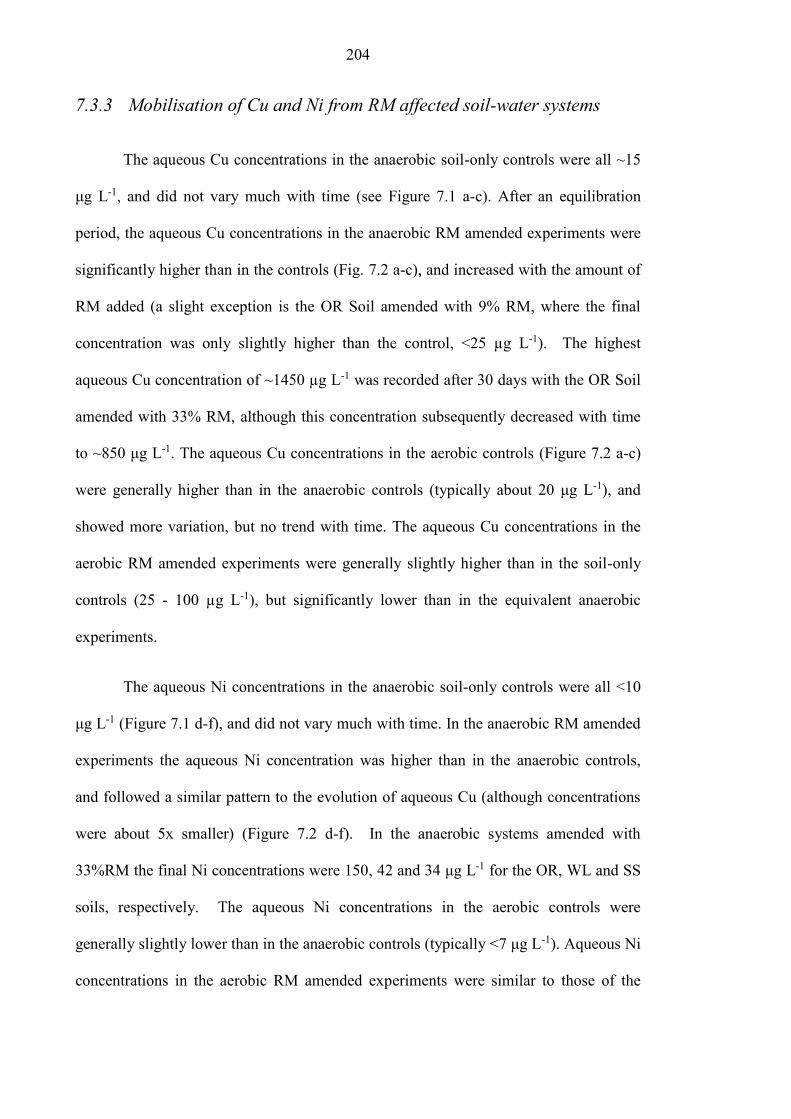
204
7.3.3 Mobilisation of Cu and Ni from RM affected soil-water systems
The aqueous Cu concentrations in the anaerobic soil-only controls were all ~15
μg L-1, and did not vary much with time (see Figure 7.1 a-c). After an equilibration
period, the aqueous Cu concentrations in the anaerobic RM amended experiments were
significantly higher than in the controls (Fig. 7.2 a-c), and increased with the amount of
RM added (a slight exception is the OR Soil amended with 9% RM, where the final
concentration was only slightly higher than the control, <25 µg L-1). The highest
aqueous Cu concentration of ~1450 µg L-1 was recorded after 30 days with the OR Soil
amended with 33% RM, although this concentration subsequently decreased with time
to ~850 μg L-1. The aqueous Cu concentrations in the aerobic controls (Figure 7.2 a-c)
were generally higher than in the anaerobic controls (typically about 20 μg L-1), and
showed more variation, but no trend with time. The aqueous Cu concentrations in the
aerobic RM amended experiments were generally slightly higher than in the soil-only
controls (25 - 100 µg L-1), but significantly lower than in the equivalent anaerobic
experiments.
The aqueous Ni concentrations in the anaerobic soil-only controls were all <10
μg L-1 (Figure 7.1 d-f), and did not vary much with time. In the anaerobic RM amended
experiments the aqueous Ni concentration was higher than in the anaerobic controls,
and followed a similar pattern to the evolution of aqueous Cu (although concentrations
were about 5x smaller) (Figure 7.2 d-f). In the anaerobic systems amended with
33%RM the final Ni concentrations were 150, 42 and 34 μg L-1 for the OR, WL and SS
soils, respectively. The aqueous Ni concentrations in the aerobic controls were
generally slightly lower than in the anaerobic controls (typically <7 μg L-1). Aqueous Ni
concentrations in the aerobic RM amended experiments were similar to those of the
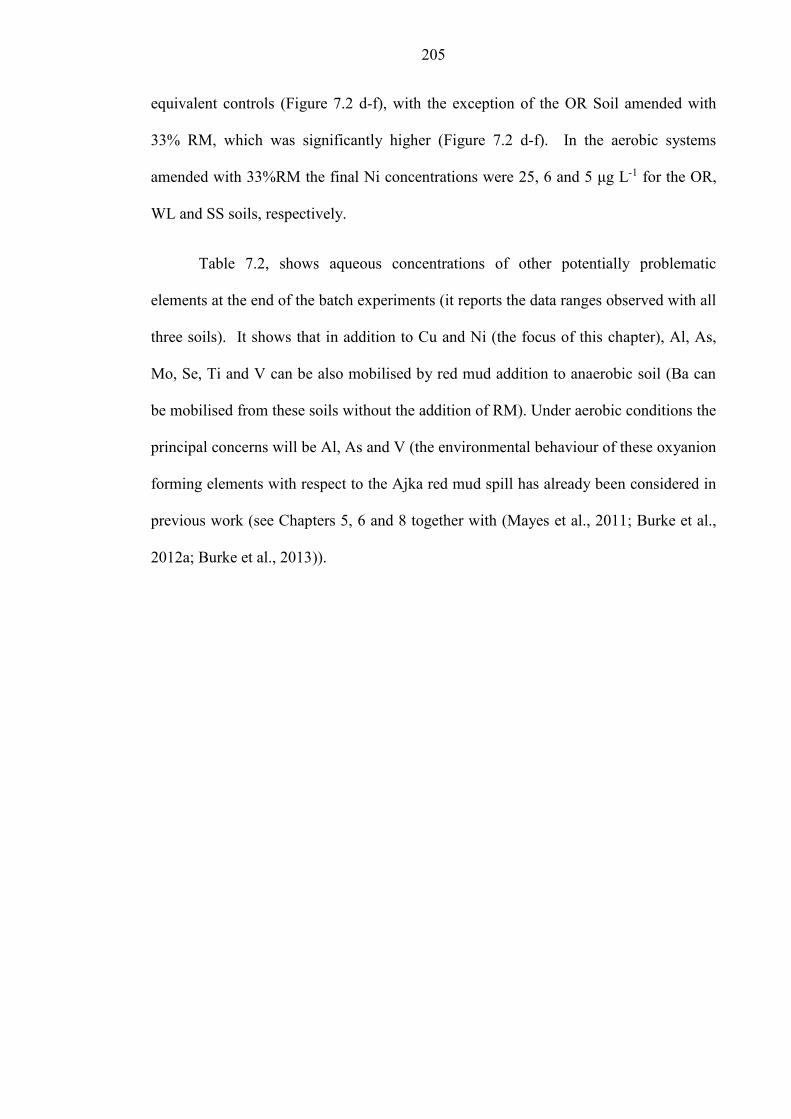
205
equivalent controls (Figure 7.2 d-f), with the exception of the OR Soil amended with
33% RM, which was significantly higher (Figure 7.2 d-f). In the aerobic systems
amended with 33%RM the final Ni concentrations were 25, 6 and 5 μg L-1 for the OR,
WL and SS soils, respectively.
Table 7.2, shows aqueous concentrations of other potentially problematic
elements at the end of the batch experiments (it reports the data ranges observed with all
three soils). It shows that in addition to Cu and Ni (the focus of this chapter), Al, As,
Mo, Se, Ti and V can be also mobilised by red mud addition to anaerobic soil (Ba can
be mobilised from these soils without the addition of RM). Under aerobic conditions the
principal concerns will be Al, As and V (the environmental behaviour of these oxyanion
forming elements with respect to the Ajka red mud spill has already been considered in
previous work (see Chapters 5, 6 and 8 together with (Mayes et al., 2011; Burke et al.,
2012a; Burke et al., 2013)).
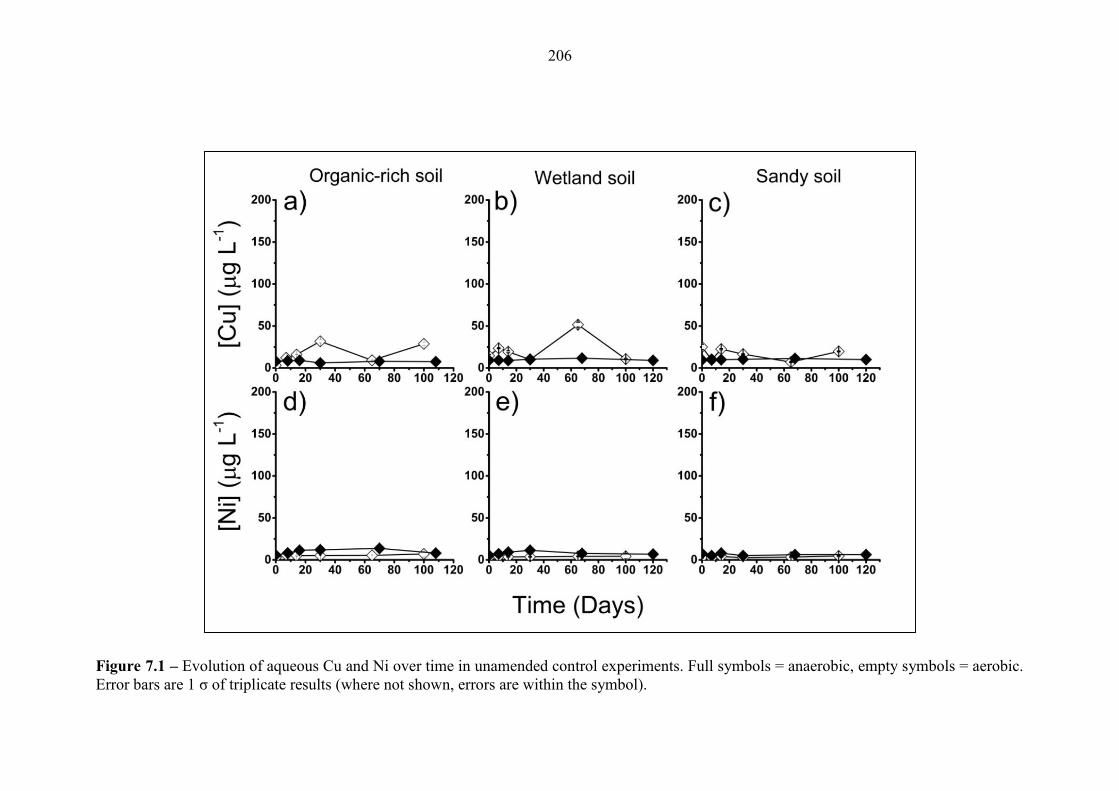
206
Figure 7.1 – Evolution of aqueous Cu and Ni over time in unamended control experiments. Full symbols = anaerobic, empty symbols = aerobic. Error bars are 1 σ of triplicate results (where not shown, errors are within the symbol).
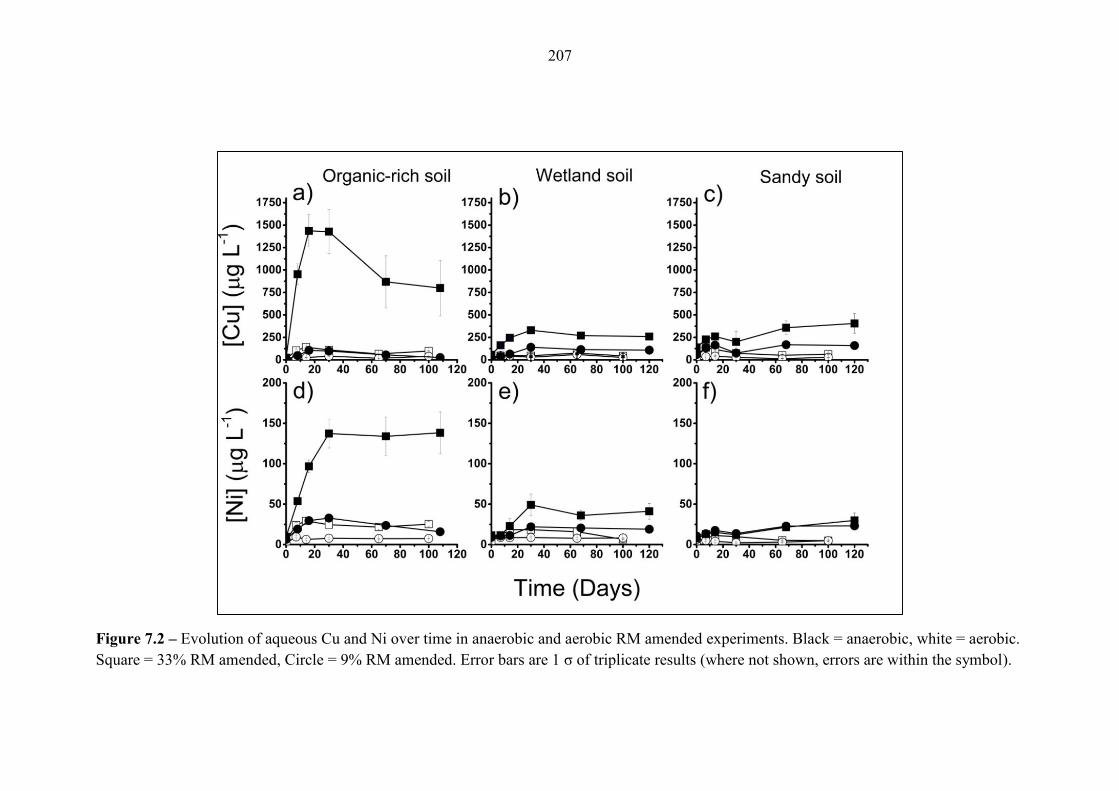
207
Figure 7.2 – Evolution of aqueous Cu and Ni over time in anaerobic and aerobic RM amended experiments. Black = anaerobic, white = aerobic.
Square = 33% RM amended, Circle = 9% RM amended. Error bars are 1 σ of triplicate results (where not shown, errors are within the symbol).
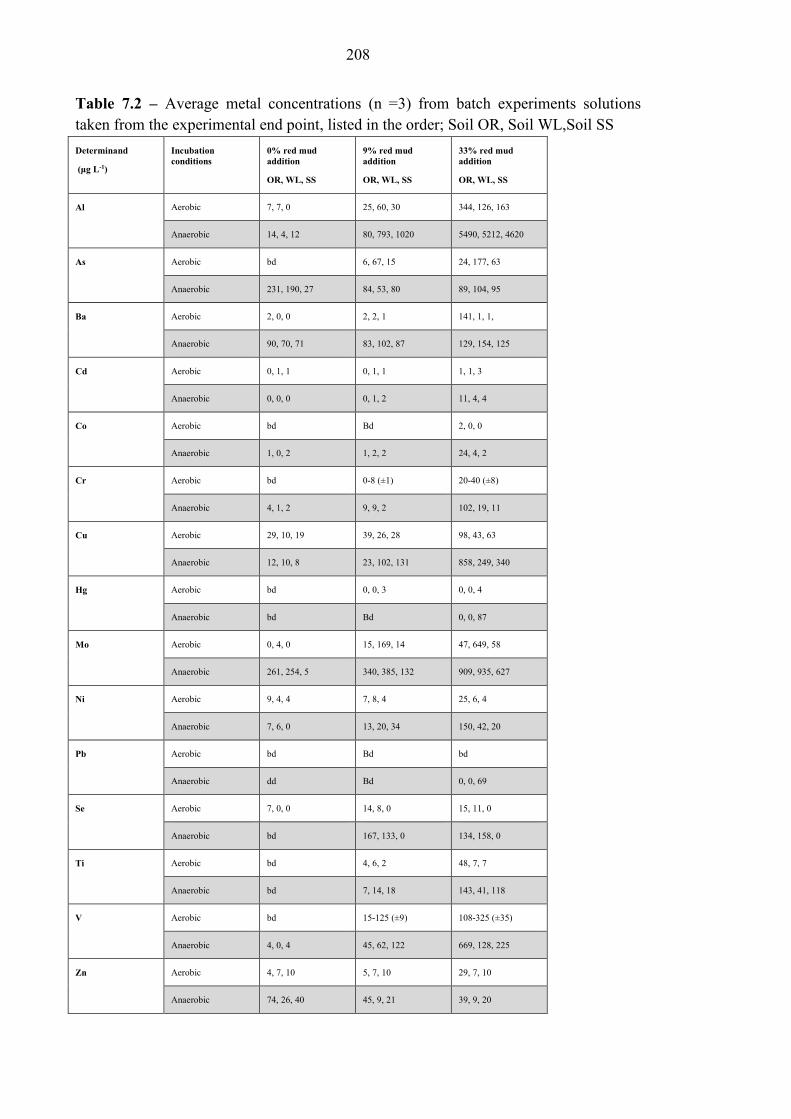
208
Table 7.2 – Average metal concentrations (n =3) from batch experiments solutions
taken from the experimental end point, listed in the order; Soil OR, Soil WL,Soil SS
Determinand
(μg L-1)
Incubation
conditions
0% red mud
addition
OR, WL, SS
9% red mud
addition
OR, WL, SS
33% red mud
addition
OR, WL, SS
Al Aerobic 7, 7, 0 25, 60, 30 344, 126, 163
Anaerobic 14, 4, 12 80, 793, 1020 5490, 5212, 4620
As Aerobic bd 6, 67, 15 24, 177, 63
Anaerobic 231, 190, 27 84, 53, 80 89, 104, 95
Ba Aerobic 2, 0, 0 2, 2, 1 141, 1, 1,
Anaerobic 90, 70, 71 83, 102, 87 129, 154, 125
Cd Aerobic 0, 1, 1 0, 1, 1 1, 1, 3
Anaerobic 0, 0, 0 0, 1, 2 11, 4, 4
Co Aerobic bd Bd 2, 0, 0
Anaerobic 1, 0, 2 1, 2, 2 24, 4, 2
Cr Aerobic bd 0-8 (±1) 20-40 (±8)
Anaerobic 4, 1, 2 9, 9, 2 102, 19, 11
Cu Aerobic 29, 10, 19 39, 26, 28 98, 43, 63
Anaerobic 12, 10, 8 23, 102, 131 858, 249, 340
Hg Aerobic bd 0, 0, 3 0, 0, 4
Anaerobic bd Bd 0, 0, 87
Mo Aerobic 0, 4, 0 15, 169, 14 47, 649, 58
Anaerobic 261, 254, 5 340, 385, 132 909, 935, 627
Ni Aerobic 9, 4, 4 7, 8, 4 25, 6, 4
Anaerobic 7, 6, 0 13, 20, 34 150, 42, 20
Pb Aerobic bd Bd bd
Anaerobic dd Bd 0, 0, 69
Se Aerobic 7, 0, 0 14, 8, 0 15, 11, 0
Anaerobic bd 167, 133, 0 134, 158, 0
Ti Aerobic bd 4, 6, 2 48, 7, 7
Anaerobic bd 7, 14, 18 143, 41, 118
V Aerobic bd 15-125 (±9) 108-325 (±35)
Anaerobic 4, 0, 4 45, 62, 122 669, 128, 225
Zn Aerobic 4, 7, 10 5, 7, 10 29, 7, 10
Anaerobic 74, 26, 40 45, 9, 21 39, 9, 20
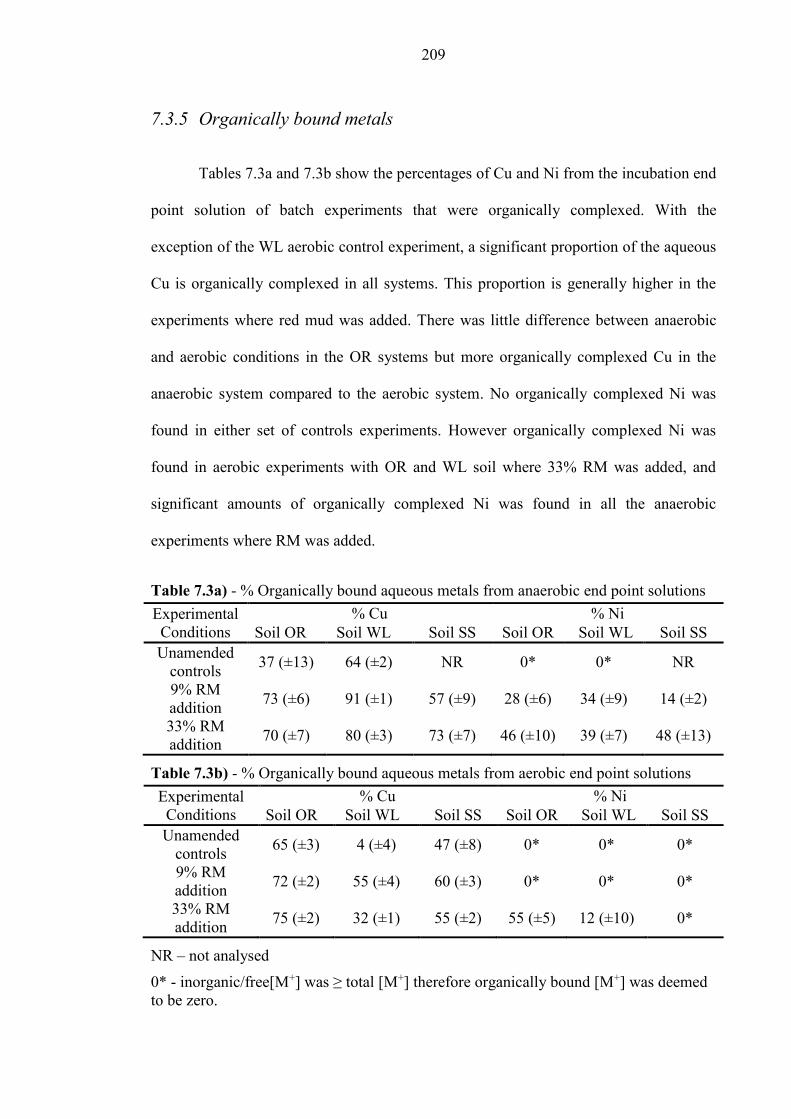
209
7.3.5 Organically bound metals
Tables 7.3a and 7.3b show the percentages of Cu and Ni from the incubation end
point solution of batch experiments that were organically complexed. With the
exception of the WL aerobic control experiment, a significant proportion of the aqueous
Cu is organically complexed in all systems. This proportion is generally higher in the
experiments where red mud was added. There was little difference between anaerobic
and aerobic conditions in the OR systems but more organically complexed Cu in the
anaerobic system compared to the aerobic system. No organically complexed Ni was
found in either set of controls experiments. However organically complexed Ni was
found in aerobic experiments with OR and WL soil where 33% RM was added, and
significant amounts of organically complexed Ni was found in all the anaerobic
experiments where RM was added.
Table 7.3a) - % Organically bound aqueous metals from anaerobic end point solutions
Experimental
Conditions
% Cu % Ni
Soil OR Soil WL Soil SS Soil OR Soil WL Soil SS
Unamended
controls 37 (±13) 64 (±2) NR 0* 0* NR
9% RM
addition 73 (±6) 91 (±1) 57 (±9) 28 (±6) 34 (±9) 14 (±2)
33% RM
addition 70 (±7) 80 (±3) 73 (±7) 46 (±10) 39 (±7) 48 (±13)
Table 7.3b) - % Organically bound aqueous metals from aerobic end point solutions
Experimental
Conditions
% Cu % Ni
Soil OR Soil WL Soil SS Soil OR Soil WL Soil SS
Unamended
controls 65 (±3) 4 (±4) 47 (±8) 0* 0* 0*
9% RM
addition 72 (±2) 55 (±4) 60 (±3) 0* 0* 0*
33% RM
addition 75 (±2) 32 (±1) 55 (±2) 55 (±5) 12 (±10) 0*
NR – not analysed
0* - inorganic/free[M+] was ≥ total [M+] therefore organically bound [M+] was deemed
to be zero.
210
7.4 Discussion
7.4.1 Effect of red mud addition on soil pH and DOC
When red mud was added to the anaerobic soil-water systems there was an
immediate increase in pH which was related to the red mud loading, after which there
the pH remained relatively constant throughout the incubation period. The final pH of
values of these systems increased with red mud loading because red mud contains
sodium hydroxide, but also varied with soil type due to differences in buffering
capacity. In previous experiments the pH buffering capacity of these soils was attributed
to the clay minerals and particularly to the amount of organic matter present (see
Chapter 5), with buffering of alkaline perturbations resulting from deprotonation
(reactions 7.1 and 7.2: (Celik, 2004) (Stevenson, 1994):
[Clay-M-OH] + [OH-] ↔[Clay-M-O-] + H2O (7.1)
[R-COOH] + [OH-] ↔[R-COO-] +H2O (7.2)
The dissolution of amorphous and poorly crystalline silica starts to become
important in systems with a pH above 9.8 (Langmuir, 1997) so may also affect the
buffering capacity of systems with a high pH and a high quartz content (reaction 7.3
(Langmuir, 1997)).
[SiO2] + 2[H2O] ↔ [H2SiO4-] + [ H+] (7.3)
Thus, at each red mud loading, the pH value of the SS system > the WL system
> the OR system.
In aerobic systems there was also an initial increase in pH upon red mud
addition (similar to the anaerobic systems), however there was a subsequent gradual
211
decrease of pH. The latter trend is explained by carbonation by atmospheric CO2, as
formation of aqueous carbonate species consumes OH- resulting in a reduction in pH
(Schwab et al., 2006). The carbonate ions can also react with any M2+ ions present (e.g.
Ca2+ and Mg2+ from either the soils or the red mud) to precipitate carbonate minerals,
therefore the final pH of all the systems is buffered to between 8.0 and 9.5 regardless of
soil type.
For the anaerobic experiments, the DOC released from the organic rich soil
systems was between 3 and 4 times higher than that released from the wetland or sandy
soil systems at the same level of red mud loading. This suggests that the amount of soil
organic matter present is the main factor controlling DOC release in these experiments
(Soil OR has 4.15% TOC compared to 1.14% in Soil WL and 0.74% in Soil SS). The
higher initial pH values of Soil WL and Soil SS compared with Soil OR (7.9, 7.9 and
7.0 respectively) may have meant that SOM in these soils contained a lower proportion
of humic acids (humic acids are a mixture of chemically similar compounds that
dissolve progressively with increasing pH). Under aerobic conditions, the DOC
concentration in the batch experiment end point solutions were much lower than in the
equivalent anaerobic tests (up to 10x less at the same red mud loading). This is likely to
be due to the carbonation reactions described above removing OH- from solution,
resulting in lower amount of organic carbon mobilisation. Another mechanism that may
have contributed to the increased DOC concentrations in the anaerobic experiments is
release during microbial reduction of Fe(III) oxyhydroxides (when Fe oxydroxides
dissolve they can release sorbed organic matter (Zachara et al., 2001; Grybos et al.,
2009).
212
7.4.2 Controls on Cu release
Cu solubility in soils is often controlled by variation in pH, with high aqueous
concentrations found at low pH due to reductive adsorption to positively charged
mineral surfaces (Peacock and Sherman, 2004a; Peacock and Sherman, 2005). At
neutral and high pH values, Cu2+ adsorbs strongly to negatively charged mineral
surfaces and solution concentrations are low (Peacock and Sherman, 2004a). In the
presence of DOC, Cu can form stable aqueous complexes thus increasing Cu
concentrations in neutral and alkaline conditions (Wu et al., 2002; Fulda et al., 2013b).
In the alkaline red mud amended soil experiments, there was a significant proportion of
dissolved Cu (Table 7.3a and 7.3b) retained on SPE resin filters in all experiments,
suggesting that organically complexed Cu formed a significant fraction of the total
dissolved Cu. There was also a significant positive correlation between aqueous Cu
concentrations and DOC during both anaerobic and aerobic incubations (Pearson’s r =
0.82-0.87; p = <0.001; Table 7.4), suggesting that the main control of Cu solubility in
these experiments was complexation of Cu with dissolved organic matter. These
findings are in agreement with previous work, which found that ~ 62% of Cu mobilised
from soils amended with red mud was associated primarily with OM (Lombi et al.,
2002).
In the anaerobic soil-water systems there was a general trend of increasing
aqueous Cu concentration with increasing DOC concentration at the end of the
incubation periods. This trend is very strong when maximum aqueous Cu concentration
is correlated with the DOC concentration measured in the end point solutions (Table
7.3a), but the aqueous Cu concentrations at the end of Soil OR tests fall below this
trend. The pH values in these tests do not vary significantly between the point when the
213
maximum aqueous Cu concentration was measured and the end of the test, so the
decrease in aqueous Cu concentration is unlikely to be associated with humate
solubility, however there was also a decrease in the redox potential in this time period
(see Fig. 6.5) that may have may affected Cu speciation and solubility.
Microbial sulfate reduction occurred in the anaerobic Soil OR tests, to a small
extent in the WL tests, but not in the SS tests (see Chapter 6, section 6.3.4). Under
oxidising conditions the stable Cu species in inorganic systems are Cu(II), but they are
Cu(I) and Cu(0) under more reducing conditions (Leckie and Davis, 1979; Weber et al.,
2009). An Eh/pH diagram for relevant inorganic Cu species is shown in Figure 7.3, with
the Eh/pH states of the anaerobic tests annotated on it. This shows that the anaerobic
OR tests reached an Eh/pH state where sulfide can complete for Cu. Both Cu(II) and
Cu(I) form complexes with organic matter thus increasing the stability of Cu(I) under
certain conditions. However, in strongly reducing sulfide-rich environments inorganic
sulfide is thought to compete with OM for Cu(I) (Fulda et al., 2013b). Thus, formation
of solid sulfide associated Cu following sulfate reduction may account for the trend of
reducing Cu concentrations observed in the Soil OR experiments after 30 days in red
mud amended experiments, although Cu concentrations in these experiment still remain
relatively high (Figure 7.2 a-b).
For all the tests on the three soils, the maximum aqueous Cu concentration is
less than the amount of Cu that was present in the soil prior to the addition of red mud
(the highest proportion was mobilised in the anaerobic OR 33% RM addition
experiment, where it is equivalent to 90% of the Cu originally associated with the soil).
Thus it is not possible to determine whether it is soil associated or red mud associated
Cu that is mobilised to solution. However it is entirely possible that the Cu mobilised to
214
solution represents organically complex Cu associated with the soils that is mobilised
due to the pH increases associated with red mud addition alone.
7.4.3 Controls on Ni release
Like Cu, nickel solubility decreases with increasing pH due to increased
sorption to negatively charged minerals surfaces (Richter and Theis, 1980), and above
pH 9 Ni forms insoluble Ni(OH)+ and Ni(OH)2 species (Bradbury and Baeyens, 2009).
Whilst Ni speciation is not affected by redox chemistry (it tends to form Ni(II) ions and
complexes (Brookins, 1988)), it is known to form stable complexes with OM which can
increase the solubility of Ni in some systems (Richter and Theis, 1980; Achterberg et
al., 1997; Ashworth and Alloway, 2004).
Concentrations of Ni solubilised in red mud affected soil-water systems and the
percentage of aqueous Ni retained by SPE filters was generally lower than for Cu. Only
low concentrations (<25 μg L-1) of Ni were mobilised under aerobic conditions and
soluble organically bound Ni (i.e. the amount retained on SPE filters) was not
measurable for most of the experiments (except for the organic rich and wetland soil
systems amended with 33% red mud) (Tables 7.3a and 7.3b). Under anaerobic
conditions the amount of organically bound Ni retained on SPE filters increased in line
with red mud loading. However, Ni release was still relatively low (<50 µL-1) in all
anaerobic experiments except where DOC concentrations are elevated in the organic-
rich 33% amended experiment. There is a strong positive correlation with DOC under
both anaerobic and aerobic conditions (Table 7.4 r = 0.64-0.62, p value = ≤0.01). An
Eh/pH diagram for relevant inorganic Ni species is shown in Fig. 7.4, with the Eh/pH
states of the anaerobic tests annotated on it. This figure shows the thermodynamically
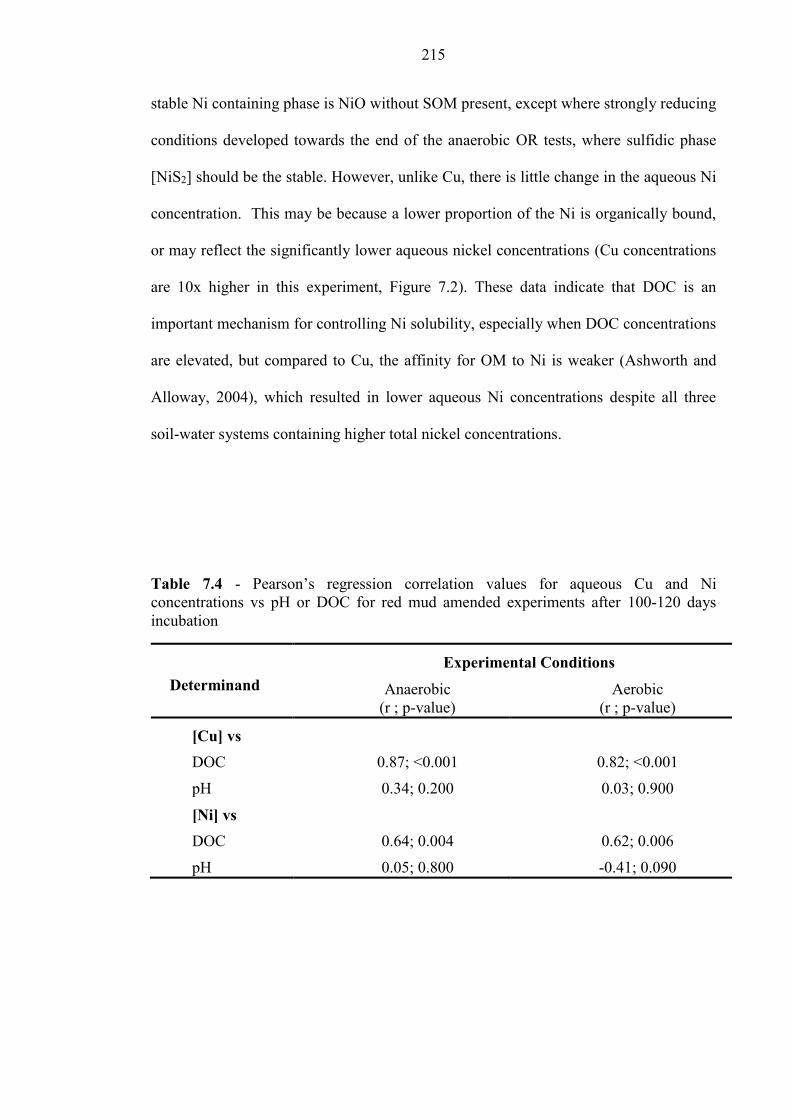
215
stable Ni containing phase is NiO without SOM present, except where strongly reducing
conditions developed towards the end of the anaerobic OR tests, where sulfidic phase
[NiS2] should be the stable. However, unlike Cu, there is little change in the aqueous Ni
concentration. This may be because a lower proportion of the Ni is organically bound,
or may reflect the significantly lower aqueous nickel concentrations (Cu concentrations
are 10x higher in this experiment, Figure 7.2). These data indicate that DOC is an
important mechanism for controlling Ni solubility, especially when DOC concentrations
are elevated, but compared to Cu, the affinity for OM to Ni is weaker (Ashworth and
Alloway, 2004), which resulted in lower aqueous Ni concentrations despite all three
soil-water systems containing higher total nickel concentrations.
Table 7.4 - Pearson’s regression correlation values for aqueous Cu and Ni
concentrations vs pH or DOC for red mud amended experiments after 100-120 days
incubation
Determinand
Experimental Conditions
Anaerobic
(r ; p-value)
Aerobic
(r ; p-value)
[Cu] vs
DOC 0.87; <0.001 0.82; <0.001
pH 0.34; 0.200 0.03; 0.900
[Ni] vs
DOC 0.64; 0.004 0.62; 0.006
pH 0.05; 0.800 -0.41; 0.090
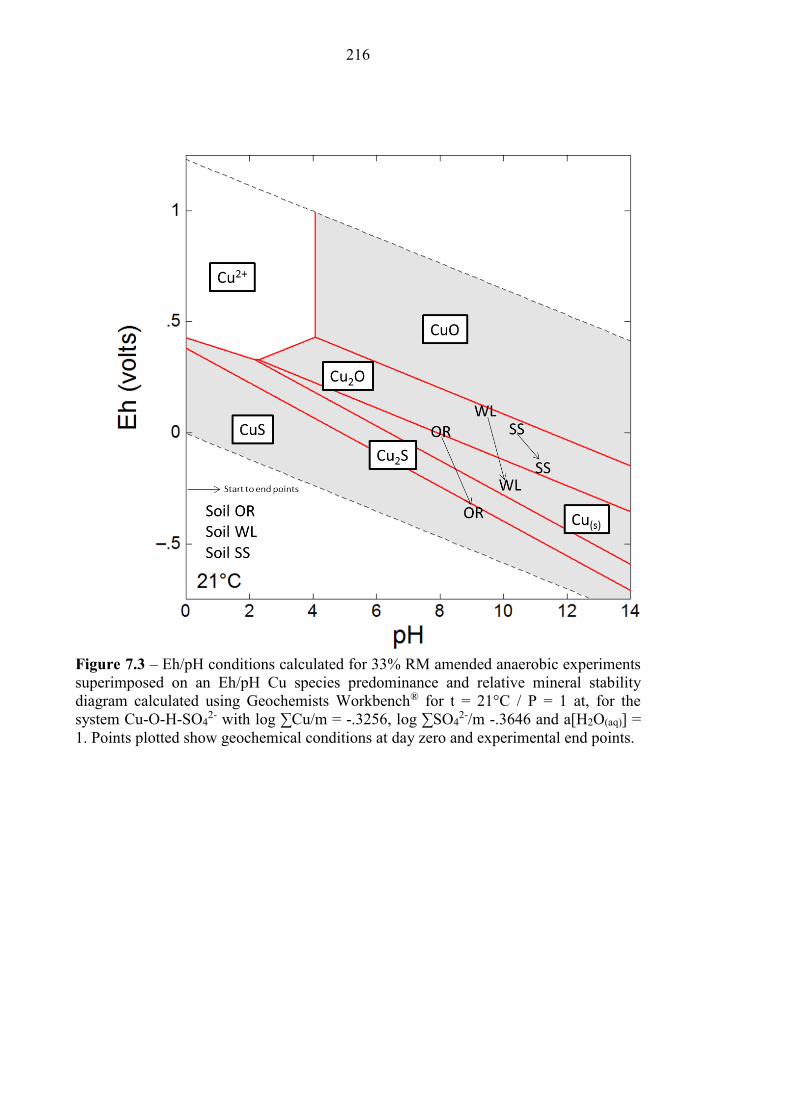
216
Figure 7.3 – Eh/pH conditions calculated for 33% RM amended anaerobic experiments
superimposed on an Eh/pH Cu species predominance and relative mineral stability
diagram calculated using Geochemists Workbench® for t = 21°C / P = 1 at, for the
system Cu-O-H-SO42- with log ∑Cu/m = -.3256, log ∑SO4
2-/m -.3646 and a[H2O(aq)] =
1. Points plotted show geochemical conditions at day zero and experimental end points.
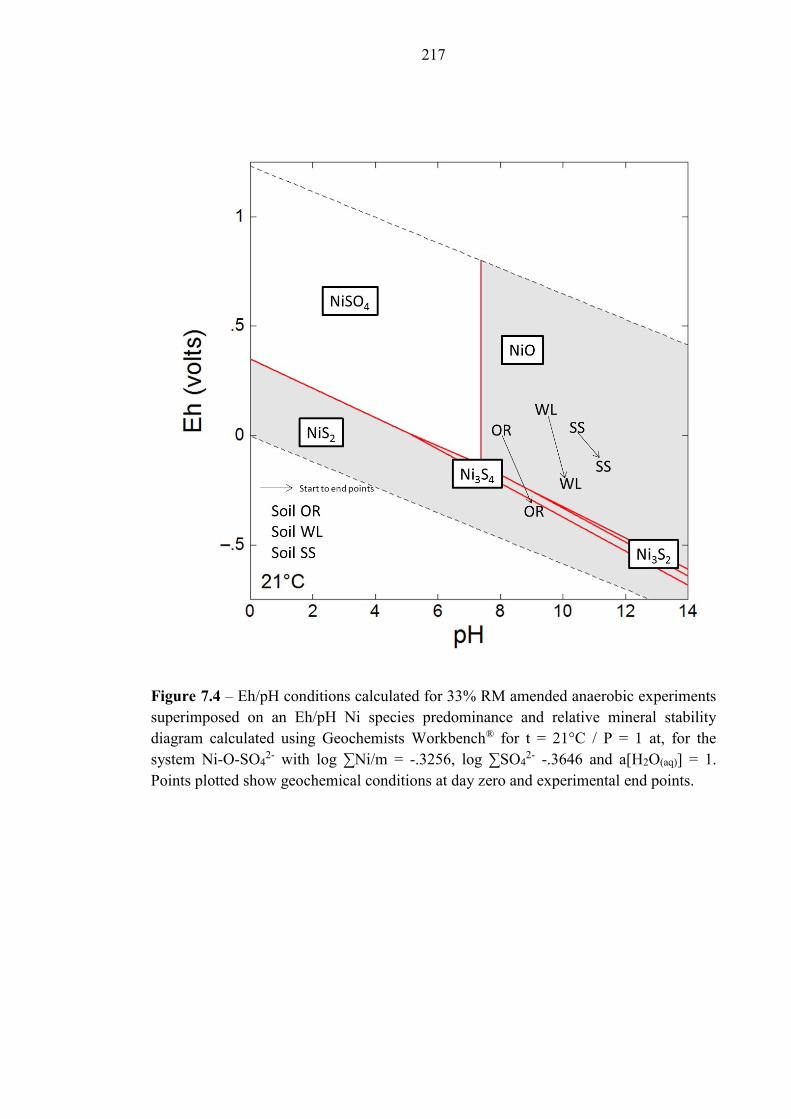
217
Figure 7.4 – Eh/pH conditions calculated for 33% RM amended anaerobic experiments
superimposed on an Eh/pH Ni species predominance and relative mineral stability
diagram calculated using Geochemists Workbench® for t = 21°C / P = 1 at, for the
system Ni-O-SO42- with log ∑Ni/m = -.3256, log ∑SO4
2- -.3646 and a[H2O(aq)] = 1.
Points plotted show geochemical conditions at day zero and experimental end points.
218
7.5 Conclusions
The alkalisation of soils following red mud addition increased the leaching of
DOC from soils. If the red mud loading and SOM are sufficiently high this will result in
increased mobilisation of Cu and Ni through OM complexation compared to unaffected
soils. This mechanism is especially prevalent under anaerobic conditions, where the
lack of carbonation reactions, that did occur in the aerobic experiments, that remove
OH- from solution, result in higher concentrations of aqueous organic carbon
mobilisation and also reductive dissolution of mineral surfaces which releases further
DOM previously bound to surfaces (Zachara et al., 2001) .
SPE extraction shows that Cu has a greater affinity for DOC compared to Ni in
these experiments. The mobility of Cu may be retarded under sufficiently reducing
conditions (after SO42- reduction), where Cu removal will occur due to the formation of
insoluble Cu mineral phases. Nickel mobility is not likely to be problematic. The pH
increase following red mud addition means that Ni will likely form insoluble
(hydr)oxides and will not be mobilised unless very high concentrations of DOC are
present.
Further to previous studies following the Kolontár disaster (Mayes et al., 2011;
Klebercz et al., 2012; Milacic et al., 2012; Gruiz, 2012), this study also verifies that
costly large scale red mud removal from soils by Hungarian authorities was vindicated.
However, as the leaching of metals is much greater under anaerobic conditions, this
leads to concerns about the water quality in unremediated wetland areas, especially
those that received high red mud loadings. These experiments also highlight the
problematic leaching of several other elements under anaerobic conditions; Al, As, Mo,
219
Se, Ti and V, although only Al, As and V were found to be potentially problematic
under aerobic conditions.
These data also call for caution in the use of high pH red mud as a soil
ameliorant for Cu contaminated soils which are high in SOM. Soil alkalisation promotes
DOC release and thus the mobilisation of complexed metals; such as Cu and to some
extent Ni (and potentially other metals which are known to form stable OM complexes,
such as Cd, V and Zn).
220
7.6 References
ACHTERBERG, E. P., VAN DEN BERG, C. M. G., BOUSSEMART, M. & DAVISON, W.
1997. Speciation and cycling of trace metals in Esthwaite Water: A productive English lake
with seasonal deep-water anoxia. Geochimica Et Cosmochimica Acta, 61, 5233-5253.
ADAM, J., BANVOLGYI, G., DURA, G., GRENERCZY, G., GUBECK, N., GUPTER, I.,
SIMON, G., SZEGFALVI, Z., SZEKACS, A., SZEPVOLGYI, J. & UJLAKY, E. 2011. The
Kolontar report: Causes and Lessons from the Red Mud Disaster. In: B, J. (ed.). Budapest:
Sustainable Development Committee of the Hungarian Parliament.
ANTON, A., REKASI, M., UZINGER, N., SZEPLABI, G. & MAKO, A. 2012. Modelling the
Potential Effects of the Hungarian Red Mud Disaster on Soil Properties. Water Air and Soil
Pollution, 223, 5175-5188.
ASHWORTH, D. J. & ALLOWAY, B. J. 2004. Soil mobility of sewage sludge-derived
dissolved organic matter, copper, nickel and zinc. Environmental Pollution, 127, 137-144.
BASEL CONVENTION 2011. Basel Convention on the control of transboundary movements
of hazardous waste and their disposal. In: UNITED NATIONS ENVIRONMENT
PROGRAMME (ed.) Annex IX. Switzerland: Secretariat of the Basel Convention,.
BRADBURY, M. H. & BAEYENS, B. 2009. Sorption modelling on illite Part I: Titration
measurements and the sorption of Ni, Co, Eu and Sn. Geochimica Et Cosmochimica Acta, 73,
990-1003.
BROOKINS, D. 1988. Eh, pH diagrams for geochemistry, Berlin., Springer-Verlag.
BURKE, I. T., MAYES, W. M., PEACOCK, C. L., BROWN, A. P., JARVIS, A. P. & GRUIZ,
K. 2012. Speciation of arsenic, chromium, and vanadium in red mud samples from the ajka spill
site, hungary. Environmental Science & Technology, 46, 3085-92.
BURKE, I. T., PEACOCK, C. L., LOCKWOOD, C. L., STEWART, D. I., MORTIMER, R. J.
G., WARD, M. B., RENFORTH, P., GRUIZ, K. & MAYES, W. M. 2013. Behavior of
Aluminum, Arsenic, and Vanadium during the Neutralization of Red Mud Leachate by HCl,
Gypsum, or Seawater. Environmental Science & Technology, 47, 6527-6535.
CELIK, M. S. 2004. Electrokinetic behaviour of clay surfaces. In: WYPYCK, F. &
SATYANARAYANA, K. G. (eds.) Clay Surfaces: Fundamentals and Applications. London:
Elsevier Ltd.
CHESHIRE, M. V., BERROW, M. L., GOODMAN, B. A. & MUNDIE, C. M. 1977. METAL
DISTRIBUTION AND NATURE OF SOME CU, MN AND V COMPLEXES IN HUMIC
AND FULVIC-ACID FRACTIONS OF SOIL ORGANIC-MATTER. Geochimica Et
Cosmochimica Acta, 41, 1131-1138.
DAVIS, J. A. 1984. Complexation of trace metals by adsorbed natural organic matter.
Geochimica Et Cosmochimica Acta, 48, 679-691.
221
ENSERINK, M. 2010. ENVIRONMENT After Red Mud Flood, Scientists Try to Halt Wave of
Fear and Rumors. Science, 330, 432-433.
FULDA, B., VOEGELIN, A., EHLERT, K. & KRETZSCHMAR, R. 2013a. Redox
transformation, solid phase speciation and solution dynamics of copper during soil reduction
and reoxidation as affected by sulfate availability. Geochimica Et Cosmochimica Acta, 123,
385-402.
FULDA, B., VOEGELIN, A., MAURER, F., CHRISTL, I. & KRETZSCHMAR, R. 2013b.
Copper Redox Transformation and Complexation by Reduced and Oxidized Soil Humic Acid. 1.
X-ray Absorption Spectroscopy Study. Environmental Science & Technology, 47, 10903-10911.
GELENCSER, A., KOVATS, N., TUROCZI, B., ROSTASI, A., HOFFER, A., IMRE, K.,
NYIRO-KOSA, I., CSAKBERENYI-MALASICS, D., TOTH, A., CZITROVSZKY, A., NAGY,
A., NAGY, S., ACS, A., KOVACS, A., FERINCZ, A., HARTYANI, Z. & POSFAI, M. 2011.
The Red Mud Accident in Ajka (Hungary): Characterization and Potential Health Effects of
Fugitive Dust. Environmental Science & Technology, 45, 1608-1615.
GRAFE, M., POWER, G. & KLAUBER, C. 2011. Bauxite residue issues: III. Alkalinity and
associated chemistry. Hydrometallurgy, 108, 60-79.
GRUIZ, K., FEIGL, V., KLEBERCZ, O., ANTON, A., AND VASZITA, E. Environmental
Risk Assessment of Red Mud Contaminated Land in Hungary. Geocongress 2012: State of the
Art and Practice in Geotechnical Engineering, 2012. American Society of Civil Engineers,
4156-4165.
GRYBOS, M., DAVRANCHE, M., GRUAU, G., PETITJEAN, P. & PEDROT, M. 2009.
Increasing pH drives organic matter solubilization from wetland soils under reducing conditions.
Geoderma, 154, 13-19.
HIND, A. R., BHARGAVA, S. K. & GROCOTT, S. C. 1999. The surface chemistry of Bayer
process solids: a review. Colloids and Surfaces a-Physicochemical and Engineering Aspects,
146, 359-374.
KLEBERCZ, O., MAYES, W. M., ANTON, A. D., FEIGL, V., JARVIS, A. P. & GRUIZ, K.
2012. Ecotoxicity of fluvial sediments downstream of the Ajka red mud spill, Hungary. Journal
of environmental monitoring : JEM, 14, 2063-71.
LANGMUIR, D. 1997. Aqueous environmental geochemistry, Upper Saddle River, N. J.,
Prentice Hall.
LECKIE, J. O. & DAVIS, J. A. 1979. Aqueous Environmental Chemistry of Copper. In:
NRIAGU, J. O. (ed.) Copper in the Environment Part 1: Ecological Cycling. New York: John
Wiley & Sons Inc.
LIU, Y., LIN, C. & WU, Y. 2007. Characterization of red mud derived from a combined Bayer
Process and bauxite calcination method. Journal of Hazardous Materials, 146, 255-261.
LOMBI, E., ZHAO, F. J., ZHANG, G. Y., SUN, B., FITZ, W., ZHANG, H. & MCGRATH, S.
P. 2002. In situ fixation of metals in soils using bauxite residue: chemical assessment.
Environmental Pollution, 118, 435-443.
222
MAYES, W. M., JARVIS, A. P., BURKE, I. T., WALTON, M., FEIGL, V., KLEBERCZ, O. &
GRUIZ, K. 2011. Dispersal and Attenuation of Trace Contaminants Downstream of the Ajka
Bauxite Residue (Red Mud) Depository Failure, Hungary. Environmental Science &
Technology, 45, 5147-5155.
MILACIC, R., ZULIANI, T. & SCANCAR, J. 2012. Environmental impact of toxic elements in
red mud studied by fractionation and speciation procedures. Science of the Total Environment,
426, 359-365.
NAGY, A. S., SZABO, J. & VASS, I. 2013. Trace metal and metalloid levels in surface water
of the Marcal River before and after the Ajka red mud spill, Hungary. Environmental Science
and Pollution Research, 20, 7603-7614.
PARSONS, J. W. 1988. Isolation of Humic Substances from Soils and Sediments. In:
FRIMMEL, F. H. A. C., R. F. (ed.) Humic Substances and Their Role in the Environment.
Berlin, Germany: John Wiley & Sons.
PEACOCK, C. L. & SHERMAN, D. M. 2004. Copper(II) sorption onto goethite, hematite and
lepidocrocite: A surface complexation model based on ab initio molecular geometries and
EXAFS spectroscopy. Geochimica Et Cosmochimica Acta, 68, 2623-2637.
PEACOCK, C. L. & SHERMAN, D. M. 2005. Surface complexation model for multisite
adsorption of copper(II) onto kaolinite. Geochimica Et Cosmochimica Acta, 69, 3733-3745.
PEACOCK, C. L. & SHERMAN, D. M. 2007. Sorption of Ni by birnessite: Equilibrium
controls on Ni in seawater. Chemical Geology, 238, 94-106.
POWER, G., GRAFE, M. & KLAUBER, C. 2011. Bauxite residue issues: I. Current
management, disposal and storage practices. Hydrometallurgy, 108, 33-45.
REEVES, H. J., WEALTHALL, G. & YOUNGER, P. L. 2011. Advisory visit to the bauxite
processings tailings dam near Ajka, Vesprem County, western Hungary. . Keyworth, UK:
British Geological Survey.
REKASI, M., FEIGL, V., UZINGER, N., GRUIZ, K., MAKO, A. & ANTON, A. 2013. Effects
of leaching from alkaline red mud on soil biota: modelling the conditions after the Hungarian
red mud disaster. Chemistry and Ecology, 29, 709-723.
RENFORTH, P., MAYES, W. M., JARVIS, A. P., BURKE, I. T., MANNING, D. A. C. &
GRUIZ, K. 2012. Contaminant mobility and carbon sequestration downstream of the Ajka
(Hungary) red mud spill: The effects of gypsum dosing. The Science of the total environment,
421-422, 253-9.
RICHTER, R. O. & THEIS, T. L. 1980. Nickel Speciation in a Soil/Water System. In: NRIAGU,
J. O. (ed.) Nickel in the Environment.
RUBINOS, D. A. & BARRAL, M. T. 2013. Fractionation and mobility of metals in bauxite red
mud. Environmental science and pollution research international, 20, 7787-802.
SCHWAB, A. P., HICKEY, J., HUNTER, J. & BANKS, M. K. 2006. Characteristics of blast
furnace slag leachate produced under reduced and oxidized conditions. J Environ Sci Health A
Tox Hazard Subst Environ Eng, 41, 381-95.
223
SPARKS, D. L., SCHEIDEGGER, A. M., STRAWN, D. G. AND SCHECKEL, K.G. 1998.
Kinetics and Mechanisms of Metal Sorption at the Mineral-Water Interface. In: SPARKS, D. L.
A. G., T. J. (ed.) Mineral-Water Interfacial Reactions: Kinetics and Mechanisms. Washington:
ACS
STEVENSON, F. J. 1994. Humus chemistry: genesis, composition, reactions, John Wiley and
Sons Inc.
THOMAS, B. 2000. Solid phase extraction for the removal of organic-iron complexes in
contaminated groundwater. MSc MSc The University of Leeds.
WEBER, F.-A., VOEGELIN, A. & KRETZSCHMAR, R. 2009. Multi-metal contaminant
dymanics in temporarily flooded soil under sulfate limitation. Geochimica Et Cosmochimica
Acta, 73, 5513-5527.
WILKIE, M. P. & WOOD, C. M. 1996. The adaptations of fish to extremely alkaline
environments. Comparative Biochemistry and Physiology B-Biochemistry & Molecular
Biology, 113, 665-673.
WU, J., WEST, L. J. & STEWART, D. I. 2001. Copper(II) humate mobility in kaolinite soil.
Engineering Geology, 60, 275-284.
WU, J., WEST, L. J. & STEWART, D. I. 2002. Effect of humic substances on Cu(II) solubility
in kaolin-sand soil. Journal of Hazardous Materials, 94, 223-238.
YIN, Y. J., IMPELLITTERI, C. A., YOU, S. J. & ALLEN, H. E. 2002. The importance of
organic matter distribution and extract soil : solution ratio on the desorption of heavy metals
from soils. Science of the Total Environment, 287, 107-119.
ZACHARA, J. M., FREDRICKSON, J. K., SMITH, S. C. & GASSMAN, P. L. 2001.
Solubilization of Fe(III) oxide-bound trace metals by a dissimilatory Fe(III) reducing bacterium.
Geochimica Et Cosmochimica Acta, 65, 75-93.
224
Chapter 8 Leaching of vanadium in soil-water systems
contaminated by red mud from Ajka, Hungary
Abstract
Red mud is a highly alkaline (pH >12) waste product from bauxite ore processing, it
contains elevated concentrations of vanadium, an oxyanion forming element that is
mobilised at high pH. In 2010, a tailings dam failure at a red mud repository released 1
million m3 of red mud into the surrounding area. It has been determined that V is a
likely contaminant from red mud, due to a lack of immobilisation during neutralisation
processes and elevated concentrations of V found at depositional hot spots. The
mobilisation of V from red mud into affected soil-water systems was investigated in
experiments analogous to soil conditions following the remediation efforts. Three
different Hungarian soils with a red mud addition were incubated in aerobic and
anaerobic batch microcosm experiment to assess the mechanisms of V mobilisation,
together with XAS spectroscopy and solid phase extraction techniques. The results
showed that V release in red mud affected soil-water systems was highly dependent
upon the different properties of the three soils. XAS spectroscopy showed that V in two
of the soils was reduced from V(V) to V(IV), in one soil this resulted in a reduction of
aqueous V concentrations but in another soil with a high TOC content, increased
concentrations due to complexation with DOC. These results also proved that the
extensive remediation efforts by the Hungarian authorities were justified but that red
mud should be used with caution as a soil amendment especially in soils with a high
TOC content. These results also highlight the complex competing processes of V at
high pH and how a more fundamental understanding of these processes is required.
225
8.1 Introduction
Red mud is the name given to the fine fraction residue that remains after
alumina is extracted from bauxite ore during the Bayer process. The composition of red
mud is highly dependent upon the type of bauxite ore used (Hind et al., 1999; Liu et al.,
2007), but is typically comprised of; residual iron oxides, quartz, sodium
aluminosilicates, titanium dioxide, calcium carbonate/aluminate and sodium hydroxide
(Hind et al., 1999; Grafe et al., 2011; Gelencser et al., 2011). The use of NaOH during
the Bayer process means that unless neutralisation steps are taken during the refining
process then red mud often has pH in excess of 12, (Grafe et al., 2011; Power et al.,
2011). Red mud also is known to contain elevated concentrations of toxic and
potentially toxic metals and metalloids (such as Al, As, Cr, Cu, Mo, Ni and V) (Cornelis
et al., 2008; Grafe et al., 2011). High pH red mud leachates (up to pH 13 (Burke et al.,
2013)) also have high levels of dissolved salts (up to 160 mS cm-2) (Mayes et al., 2011)
and can mobilise high concentrations of oxyanion forming elements which are more
soluble at high pH (Langmuir, 1997; Burke et al., 2013).
Since the catastrophic tailings dam failure at the Ajkai Timfoldgyar Zrt alumina
plant in Ajka, western Hungary in October 2010 there have been several studies on the
possible consequences from large quantities of caustic red mud reaching the wider
environment. These studies have investigated the effects of red mud on human health
(Gelencser et al., 2011); soil toxicity (Ruyters et al., 2011; Anton et al., 2012);
freshwater and soil ecology (Klebercz et al., 2012; Rekasi et al., 2013); the mobility of
red mud associated trace metals in the wider environment (Mayes et al., 2011; Burke et
al., 2012a) and the effectiveness of the remediation efforts (Renforth et al., 2012; Burke
et al., 2013).
226
Remediation efforts began almost immediately following the spill and consisted
of the addition of gypsum and acids (acetic and sulfuric) to reduce the pH of affected
rivers and streams and, removal of red mud from affected land. The removal of red mud
from land sought to prevent any complications red mud dust inhalation and to lessen
effects to soils (Adam et al., 2011a). The land remediation effort was split in to two
categories, thick red mud deposits (>5cm) were removed from the soil whereas thin red
mud deposits (<5cm) were ploughed into soils (Klebercz et al., 2012).
The oxyanion forming element vanadium has been highlighted as a persistently
mobile contaminant since the red mud spill. Mayes et al. (2011) found that although V
was mostly associated with residual phases, at some sample points down the affected
Marcel and Rába river systems, V was associated with weak acid and oxalate
extractable phase which could lead to further contamination of the river system in the
future. Another study focusing on the effectiveness of the gypsum addition to affected
rivers and streams also found that V was not substantially removed from solution by
gypsum or indeed any of the other neutralisation methods commonly used in practice
(Burke et al., 2013). Previous work detailed in this thesis has also highlighted the
mobility of V from red mud into soil-water systems (see Chapters 5 and 7).
Vanadium has a very complex chemistry, it has a range of redox states (between
-1 to +5) but exists in most natural waters in the V(V) oxidation state as the highly
mobile phosphate-like oxyanion vanadate [H2VO4-, HVO42-] (Peacock and Sherman,
2004b). In more reducing environments, the V(IV) oxidation state can exist as the
vanadyl cation [VO2+, VO(OH)+]. Vanadate can form complexes with humic and fulvic
acids between pH 7 to 9 (Lu et al., 1998) and can also be easily reduced to VO2+ by soil
organic matter (Szalay and Szilagyi, 1967) thus increasing the stability and solubility of
[VO2+] across a wide range of pH and Eh boundaries (Goncalves and Mota, 1987; Breit
227
and Wanty, 1991). It is estimated that between 20-80% of V is complexed with DOC in
natural waters depending upon DOC concentrations (Breit and Wanty, 1991).
The complexation of Cu to DOC (dissolved organic carbon) has been found to
be very important in controlling the aqueous concentrations of Cu in red mud affected
soil water systems. Soils with a high total organic carbon content released high
concentrations of DOC complexed with Cu (and to a lesser extent Ni) due to soil
alkalisation upon red mud addition (see Chapter 7). Both vanadate and vanadyl form
complexes with organic matter therefore, increased aqueous concentrations of DOC
may also affect aqueous V concentrations in red mud affected soil-water systems.
Due to the potential problems of vanadium contamination from red mud it is
important to establish what controls the fate and transport of V from red mud into
surrounding soil-water systems. The chemistry and control mechanisms of V are
complex and a complete understanding of these processes at high pH and interactions
with SOM are not yet fully understood. This chapter reports on a pilot study into the
possible mechanisms controlling vanadium transport from red mud into soil-water
systems analogous to post remediation conditions.
8.2 Materials and Methods
8.2.1 Field Sampling and Sample Handling.
As described in previous chapters (see Chapters 5, 6 and 7) sampling was
undertaken in May 2011. Red mud (RM) was sampled from within Cell X of the Ajka
impoundment (Location 47°05’18.48”N, 17°29’46.77”E). Uncontaminated soils were
sampled from locations in the Torna and upper Marcal river catchments unaffected by
228
the release of red mud in 2010 (see Figure 3.2 for locations, PCA analysis see Figure
5.1). Two were agricultural top soils (one was organic-rich (Soil OR), the other a sandy
soil (Soil SS)) and the third was collected from 50cm (under the rootlet layer) from
below the surface of a wetland (Soil WL).
8.2.2 Reduction Microcosm Experiments
Triplicate aerobic and anaerobic microcosms for each soil type were prepared
with differing loadings of red mud by mixing soils with red mud to achieve a 9% and a
33% addition of red mud on a dry weight basis with deionised water was added in a 5:1
ratio to the soil addition (as previously described in Chapters 6 and 7). The 9% addition
was chosen as an analogue for where red mud had been ploughed into fields (based on
~5cm ploughed to a typical depth of 40-50cm, an approximate 5:50 mixing ratio). The
33% addition was used as a worst case scenario and for any unremediated wetland
areas.
8.2.3 Geochemical Methods.
ORP (as an indicator for Eh) and pH were measured using a Thermo Scientific
Orion Dualstar pH/ISE benchtop meter (pH was calibrated at pH 4, 7 and 10 daily).
Aqueous V concentrations were determined using a Perkin Elmer Elan DRCII
inductively coupled plasma-mass spectrometer. DOC in aliquots of end point solutions
was determined by a multi N/C® 2100 using thermocatalytic oxidation, MC-NDIR
detection analysis. Standards were used to check the accuracy and precision of the
229
methods and calibration regression had R2 ≥0.999. Reference materials were used where
appropriate.
8.2.4 Solid Phase Extraction (SPE)
The solutions sampled at the end of the incubation period were passed through
Isolute™ C18 1 g / 6 mL non polar SPE filters to retain organic substances (and
therefore any organically bound vanadium). These filters were conditioned according to
the manufacturer’s instructions, and the solutions acidified to pH 5.5 prior to filtration
using HNO3 (the optimum pH for maximum organic matter retention by Isolute C18
filters (Thomas, 2000). The filtrates were further diluted with 2% HNO3 for ICP-MS
analysis to determine the inorganic/free aqueous metal concentrations. The
concentration of organically bound metals was deemed to be the difference in aqueous
metals concentrations measured before (total [V]) and after SPE (inorganic/free [V]).
8.2.5 X-ray Absorption Near Edge Structure Spectroscopy (XANES)
V K-edge (5465 eV) spectra were collected at Diamond Light Source, UK, in
May 2012. Approximately 100 mg of moist paste RM and soils recovered from
sediment recovered at the end points of the anaerobic microcosms were prepared for
XANES analysis by mounting under argon atmosphere into Perspex holders with
Kapton™ windows. Samples were frozen (-20°C) and transported to the synchrotron on
dry ice and kept frozen until analysed.
230
Standard materials were prepared as pressed pellets using cellulose as a diluent
to reduce chemical thickness (to achieve an edge step between 0.5 and 1.5 in
transmission mode, see below) and held in Kapton™ tape. A sodium vanadate solution
was prepared in 0.1 M NaOH, also at 1000 mg L-1, and held in a polythene bags as
above. Vanadate adsorbed to Al(OH)3 was prepared by suspension of 1 g Al(OH)3 in 1
L DIW and adding 1 ml of 1000 mg L-1 NaVO4 (made up in 0.01 M NaOH at pH 12).
The mixed suspension was stirred for 48 hours and the final pH was 7.0. The V-
Al(OH)3 solid was recovered by centrifugation (600 g) and prepared for analysis as a
moist paste as above.
XANES spectra were collected at the V K-edge (5465 eV) on beamline I18 at
the Diamond Light Source operating at 3 GeV with a typical current of 200 mA, using a
nitrogen cooled Si(111) double crystal monochromator and focussing optics. A pair of
plane mirrors was used to reduce the harmonic content of the beam and Kirkpatrick-
Baez mirrors were used to produce a relatively unfocused beam (approximately 0.5 mm
diameter at the sample). For standards prepared as pressed pellets, K-edge spectra were
collected in transmission mode at room temperature (~295 °K). For samples and
solutions, data were collected in fluorescence mode using a 9 element solid state Ge
detector at room temperature. Multiple scans were then averaged to improve the signal
to noise ratio using Athena version 0.8.061 (Ravel and Newville, 2005a; Ravel and
Newville, 2005b). XANES spectra absorption was normalised in Athena over the full
data range and plotted from approximately -15 eV to +30 eV relative to the edge
position with no correction required for drift in E0. V data was calibrated using E0
measured from thin metal foil, The V pre-edge peak energy was determined by
calculation of the area normalised centroid energy position following the method of
Chaurand et al. (2007b).
231
8.3 Results
8.3.1 Sample Characterization
The full sample characterisation of the red mud and the 3 different soil samples
has been described previously in Chapter 5, and is presented in Table 5.1 and full XRF
analysis is presented in Table 5.2. Briefly, red mud was dominated by hematite (Fe2O3),
calcite (CaCO3), magnetite (Fe3O4), cancrinite (Na6CaAl6Si6(CO3)O24.2H2O) and
hydrogarnet (Ca3AlFe(SiO4)(OH8) with residual boehmite (γ-AlOOH) and gibbsite
(Al(OH3)) phases, very similar to other red mud analysed from the breach area
(Gelencser et al., 2011; Burke et al., 2012a). All three soils had similar mineralogy, with
quartz as the dominant mineral and feldspars and clays were also present. The principal
differences between them were in the organic carbon content, and the proportion of the
0.5 N HCl extractable iron in the Fe(II) oxidation state (Table 5.1). The concentration of
V in red mud was 1132 mg kg-1. Soil OR had a highest concentration of V (72 mg kg-1)
followed by Soil WL and Soil SS (51 mg kg-1 and 30 mg kg-1 respectively). The
percentage TOC followed the same order, Soil OR 4.15%, Soil WL 1.14% and Soil SS
0.74. The red mud had a %TOC of 0.23%.
8.3.2 Evolution of V from red mud affected soil-waters systems
Trends for evolution of aqueous V concentrations are shown in Figure 8.1).
Here, the highest concentrations of V were seen in the Soil SS 33% RM amended
experiment, under aerobic conditions where 900 μg L-1 was mobilised in the first 7 days
of incubation. This rapid release of V was followed by a period of rapid removal. The
Soil SS, 9% RM amended experiment followed a similar trend under aerobic conditions
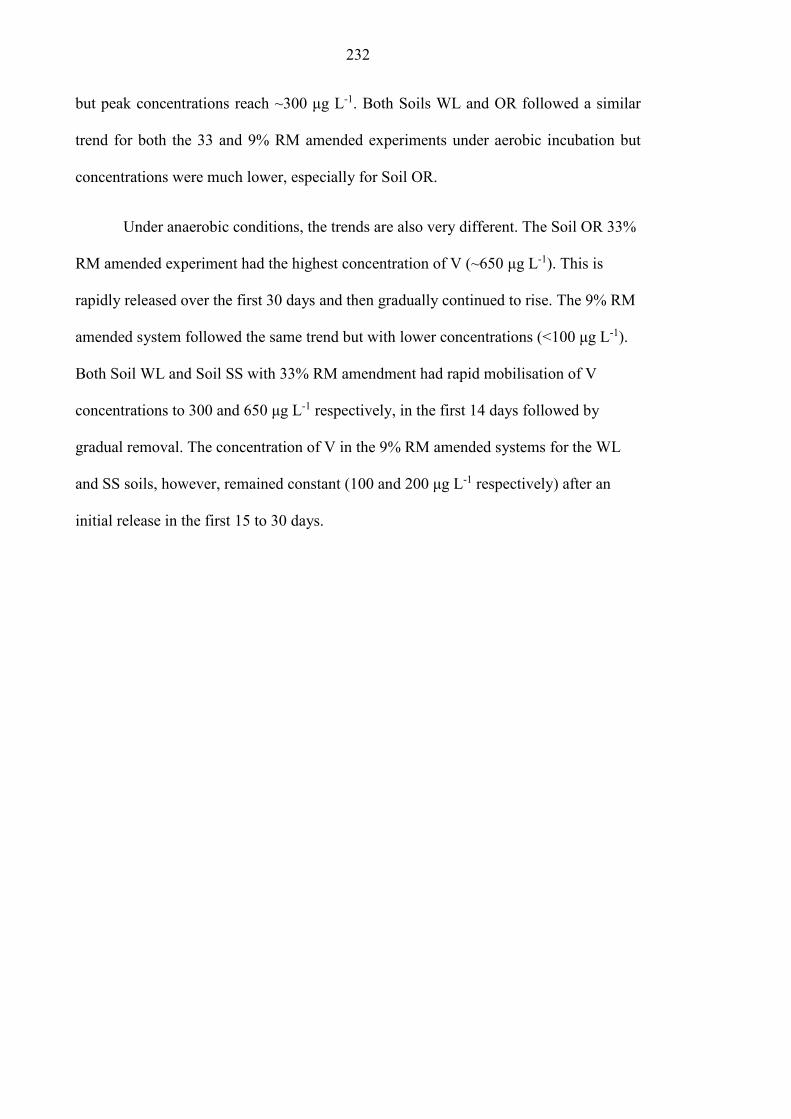
232
but peak concentrations reach ~300 μg L-1. Both Soils WL and OR followed a similar
trend for both the 33 and 9% RM amended experiments under aerobic incubation but
concentrations were much lower, especially for Soil OR.
Under anaerobic conditions, the trends are also very different. The Soil OR 33%
RM amended experiment had the highest concentration of V (~650 μg L-1). This is
rapidly released over the first 30 days and then gradually continued to rise. The 9% RM
amended system followed the same trend but with lower concentrations (<100 μg L-1).
Both Soil WL and Soil SS with 33% RM amendment had rapid mobilisation of V
concentrations to 300 and 650 μg L-1 respectively, in the first 14 days followed by
gradual removal. The concentration of V in the 9% RM amended systems for the WL
and SS soils, however, remained constant (100 and 200 μg L-1 respectively) after an
initial release in the first 15 to 30 days.
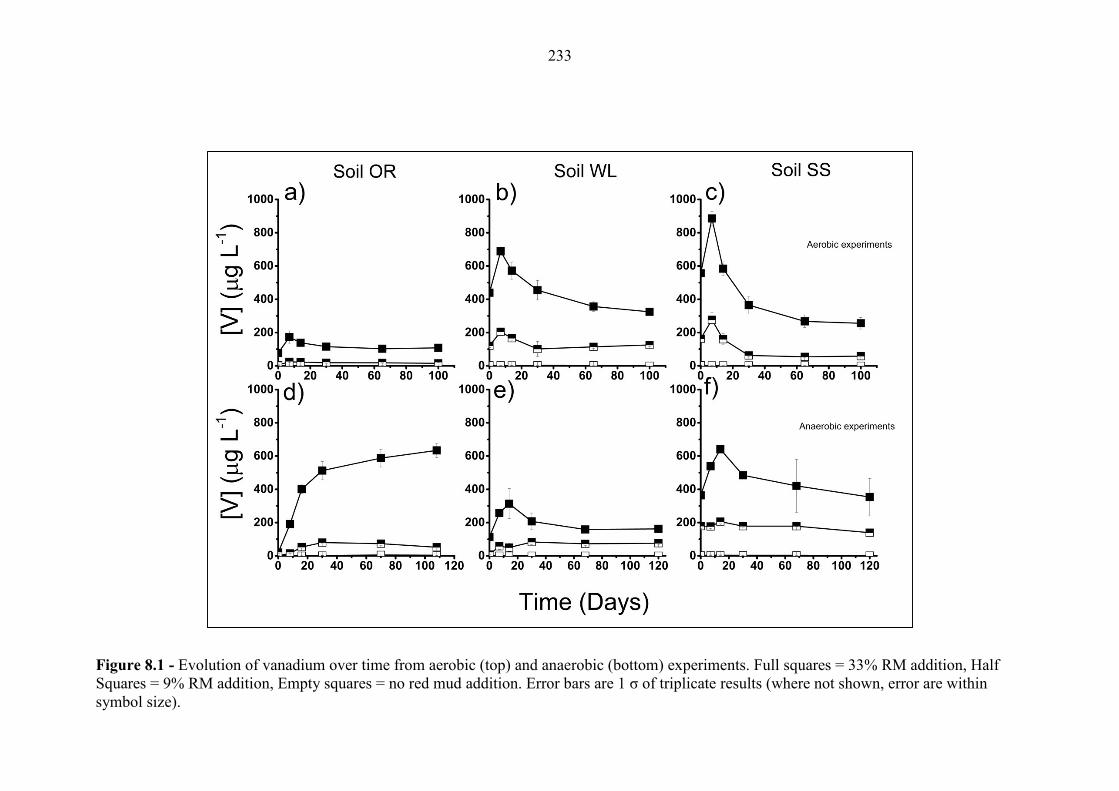
233
Figure 8.1 - Evolution of vanadium over time from aerobic (top) and anaerobic (bottom) experiments. Full squares = 33% RM addition, Half
Squares = 9% RM addition, Empty squares = no red mud addition. Error bars are 1 σ of triplicate results (where not shown, error are within
symbol size).
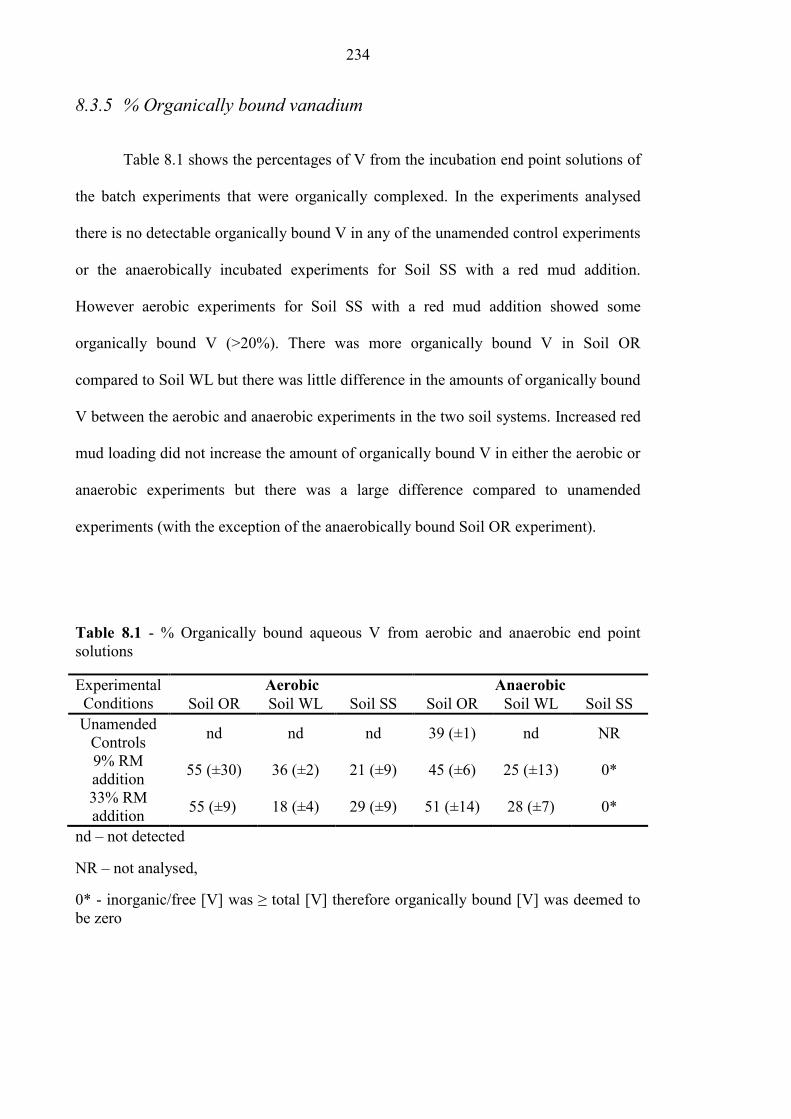
234
8.3.5 % Organically bound vanadium
Table 8.1 shows the percentages of V from the incubation end point solutions of
the batch experiments that were organically complexed. In the experiments analysed
there is no detectable organically bound V in any of the unamended control experiments
or the anaerobically incubated experiments for Soil SS with a red mud addition.
However aerobic experiments for Soil SS with a red mud addition showed some
organically bound V (>20%). There was more organically bound V in Soil OR
compared to Soil WL but there was little difference in the amounts of organically bound
V between the aerobic and anaerobic experiments in the two soil systems. Increased red
mud loading did not increase the amount of organically bound V in either the aerobic or
anaerobic experiments but there was a large difference compared to unamended
experiments (with the exception of the anaerobically bound Soil OR experiment).
Table 8.1 - % Organically bound aqueous V from aerobic and anaerobic end point
solutions
Experimental
Conditions
Aerobic Anaerobic
Soil OR Soil WL Soil SS Soil OR Soil WL Soil SS
Unamended
Controls nd nd nd 39 (±1) nd NR
9% RM
addition 55 (±30) 36 (±2) 21 (±9) 45 (±6) 25 (±13) 0*
33% RM
addition 55 (±9) 18 (±4) 29 (±9) 51 (±14) 28 (±7) 0*
nd – not detected
NR – not analysed,
0* - inorganic/free [V] was ≥ total [V] therefore organically bound [V] was deemed to
be zero
235
8.3.6 XAS Spectroscopy
The V K-edge XANES spectra has been interpreted using the system proposed
by Chaurand et al. (2007). This system is based upon the detailed observation of pre-
edge peak intensity and energy position. V K-edge XANES spectra (Figure 8.2)
collected from the red mud and red mud addition experiments under anaerobic
incubation all have prominent pre-edge peaks between 5469.5 and 5470.1 eV. The main
absorption edges (E1/2 = point where absorption reaches 50% of the normalised
absorption) are between 5480.5 and 5481.0 eV. A summary of the spectral information
extracted from all samples and standards is shown in Table 8.2. A plot of normalised
pre-edge peak intensity vs Pre-edge peak energy (eV) for samples and standards is
shown in Figure 8.3.
Table 8.2 – Pre-Edge Peak Position, Normalised Pre-Edge Peak Intensity and Main
Edge Position Determined from V K-edge XANES spectra shown in Figure 8.2. Energy
values are quoted ±0.2 eV; normalised intensity values are quoted ±0.1.
sample/standard valence Pre-edge peak
(eV)
Normalised
intensity
Main edge
E1/2 (eV)
V2O3 3+ 5468.0 0.1 5478.0
VOSO4.xH2O 4+ 5470.0 0.3 5480.0
Soil OR + RM 4+ 5469.5 0.45 5480.5
Soil WL + RM 4+ 5470.0 0.41 5481.0
Soil SS + RM 5+ 5470.0 0.7 5481.5
red mud (RM) 5+ 5470.1 0.68 5481.0
vanadate sorbed to Al(OH)3 5+ 5470.0 0.7 5481.0
vanadate (aq) 5+ 5470.0 1.07 5482.0
Calcium meta-vanadate 5+ 5470.2 1.06 5482.2
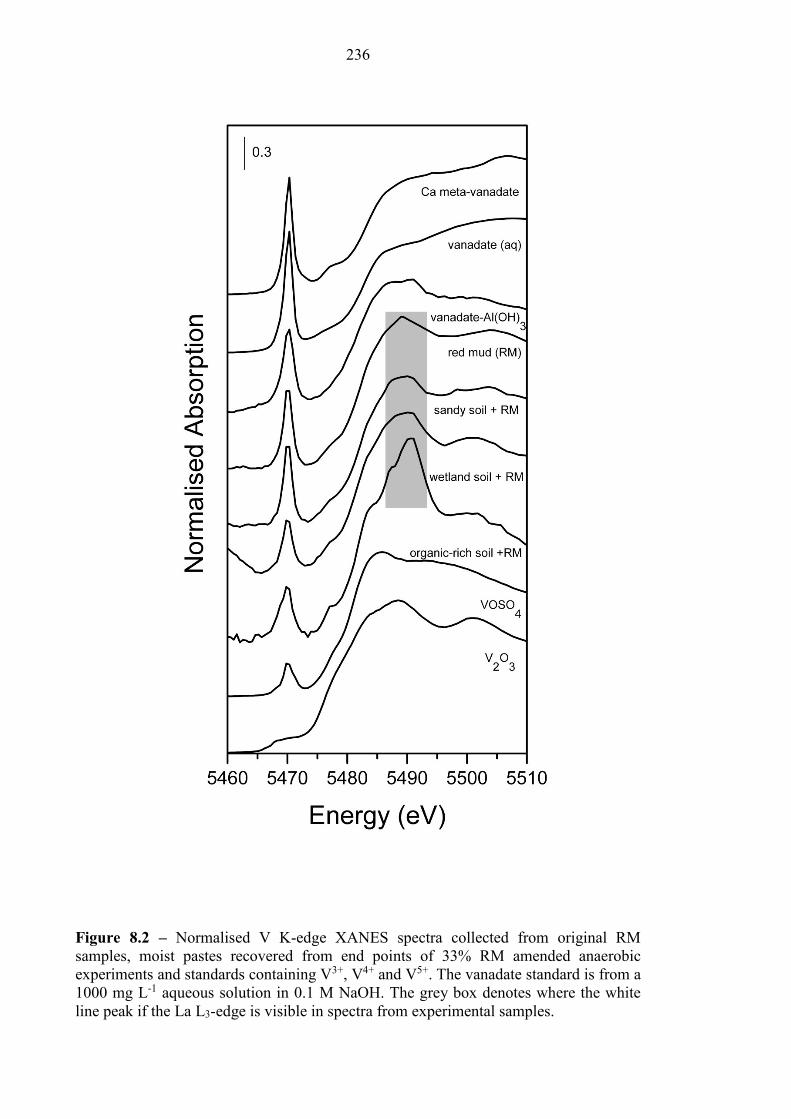
236
Figure 8.2 – Normalised V K-edge XANES spectra collected from original RM
samples, moist pastes recovered from end points of 33% RM amended anaerobic
experiments and standards containing V3+, V4+ and V5+. The vanadate standard is from a
1000 mg L-1 aqueous solution in 0.1 M NaOH. The grey box denotes where the white
line peak if the La L3-edge is visible in spectra from experimental samples.
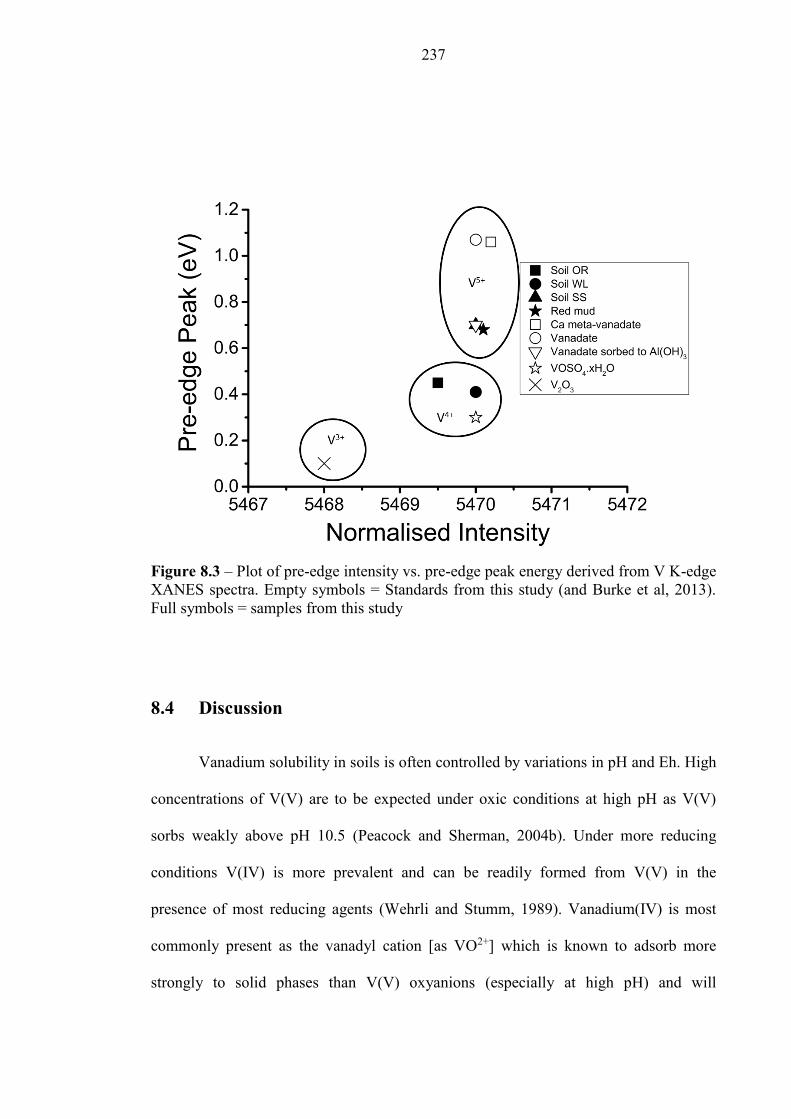
237
Figure 8.3 – Plot of pre-edge intensity vs. pre-edge peak energy derived from V K-edge
XANES spectra. Empty symbols = Standards from this study (and Burke et al, 2013).
Full symbols = samples from this study
8.4 Discussion
Vanadium solubility in soils is often controlled by variations in pH and Eh. High
concentrations of V(V) are to be expected under oxic conditions at high pH as V(V)
sorbs weakly above pH 10.5 (Peacock and Sherman, 2004b). Under more reducing
conditions V(IV) is more prevalent and can be readily formed from V(V) in the
presence of most reducing agents (Wehrli and Stumm, 1989). Vanadium(IV) is most
commonly present as the vanadyl cation [as VO2+] which is known to adsorb more
strongly to solid phases than V(V) oxyanions (especially at high pH) and will
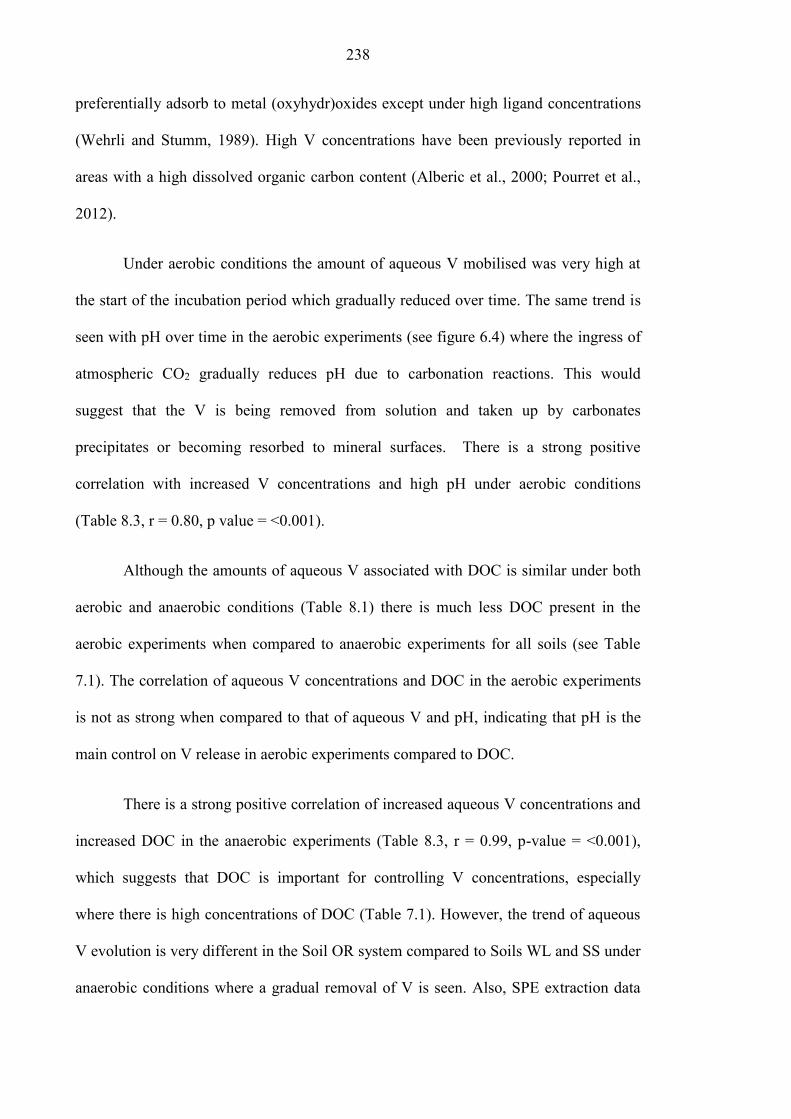
238
preferentially adsorb to metal (oxyhydr)oxides except under high ligand concentrations
(Wehrli and Stumm, 1989). High V concentrations have been previously reported in
areas with a high dissolved organic carbon content (Alberic et al., 2000; Pourret et al.,
2012).
Under aerobic conditions the amount of aqueous V mobilised was very high at
the start of the incubation period which gradually reduced over time. The same trend is
seen with pH over time in the aerobic experiments (see figure 6.4) where the ingress of
atmospheric CO2 gradually reduces pH due to carbonation reactions. This would
suggest that the V is being removed from solution and taken up by carbonates
precipitates or becoming resorbed to mineral surfaces. There is a strong positive
correlation with increased V concentrations and high pH under aerobic conditions
(Table 8.3, r = 0.80, p value = <0.001).
Although the amounts of aqueous V associated with DOC is similar under both
aerobic and anaerobic conditions (Table 8.1) there is much less DOC present in the
aerobic experiments when compared to anaerobic experiments for all soils (see Table
7.1). The correlation of aqueous V concentrations and DOC in the aerobic experiments
is not as strong when compared to that of aqueous V and pH, indicating that pH is the
main control on V release in aerobic experiments compared to DOC.
There is a strong positive correlation of increased aqueous V concentrations and
increased DOC in the anaerobic experiments (Table 8.3, r = 0.99, p-value = <0.001),
which suggests that DOC is important for controlling V concentrations, especially
where there is high concentrations of DOC (Table 7.1). However, the trend of aqueous
V evolution is very different in the Soil OR system compared to Soils WL and SS under
anaerobic conditions where a gradual removal of V is seen. Also, SPE extraction data
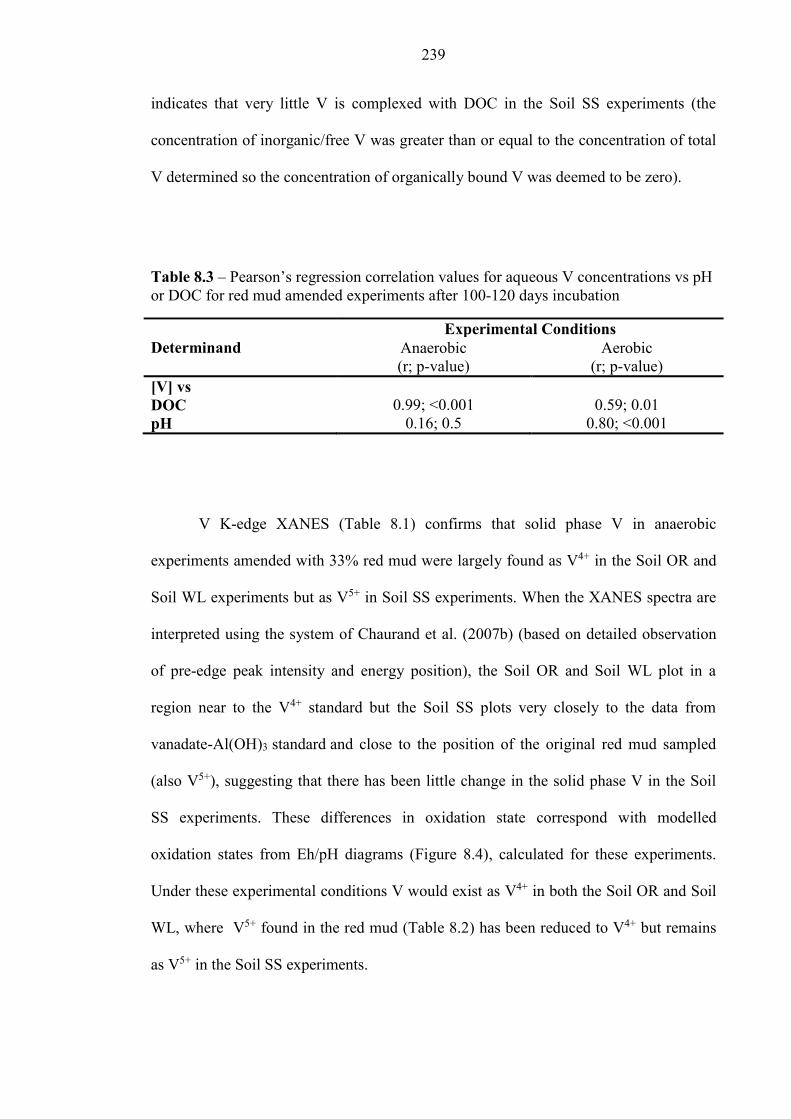
239
indicates that very little V is complexed with DOC in the Soil SS experiments (the
concentration of inorganic/free V was greater than or equal to the concentration of total
V determined so the concentration of organically bound V was deemed to be zero).
Table 8.3 – Pearson’s regression correlation values for aqueous V concentrations vs pH
or DOC for red mud amended experiments after 100-120 days incubation
Determinand
Experimental Conditions
Anaerobic
(r; p-value)
Aerobic
(r; p-value)
[V] vs
DOC 0.99; <0.001 0.59; 0.01
pH 0.16; 0.5 0.80; <0.001
V K-edge XANES (Table 8.1) confirms that solid phase V in anaerobic
experiments amended with 33% red mud were largely found as V4+ in the Soil OR and
Soil WL experiments but as V5+ in Soil SS experiments. When the XANES spectra are
interpreted using the system of Chaurand et al. (2007b) (based on detailed observation
of pre-edge peak intensity and energy position), the Soil OR and Soil WL plot in a
region near to the V4+ standard but the Soil SS plots very closely to the data from
vanadate-Al(OH)3 standard and close to the position of the original red mud sampled
(also V5+), suggesting that there has been little change in the solid phase V in the Soil
SS experiments. These differences in oxidation state correspond with modelled
oxidation states from Eh/pH diagrams (Figure 8.4), calculated for these experiments.
Under these experimental conditions V would exist as V4+ in both the Soil OR and Soil
WL, where V5+ found in the red mud (Table 8.2) has been reduced to V4+ but remains
as V5+ in the Soil SS experiments.
240
It is clear from the differences in the solid phase oxidation states, trends of
aqueous V evolution and SPE data that there is a different mechanism controlling the
mobilisation of V from red mud amended experiments in each soil under anaerobic
conditions. The suggested control mechanism (looking at the 33% red mud amended
experiments) for each soil is listed below:
Soil OR: The pH of the red mud amended system is sufficiently low
enough for stable OM-V complexes at the experiment pH and Eh (~ pH
9.5, -300 mV Figure 6.5) (Breit and Wanty, 1991; Lu et al., 1998)
therefore high concentrations of DOC can outcompete mineral surface
hydroxyl groups for vanadyl cations to form stable complexes increasing
aqueous V concentrations.
Soil WL: The pH of the red mud amended system is between pH 10.5 –
11 (see Figure 6.5) hence V-OM complexes will be less stable but, there
is still sufficient DOC for V-OM complexes to form. Redox conditions
are such that some vanadate is reduced to vanadyl, which will
preferentially sorb to mineral surfaces as redox potential drops but some
V remains in the aqueous phase due elevated pH or as OM-bound
complexes.
Soil SS: The mechanisms controlling the mobilisation of V from these
red mud amended systems are less clear. The pH of the experiments is
too high for stable V-OM complexes to form and although some removal
of V is seen it does not appear to be related to a decrease in redox
conditions. V K-edge XANES indicates that V is relatively unchanged in
the solid phases from the original red mud. The initial peak of V ~ day
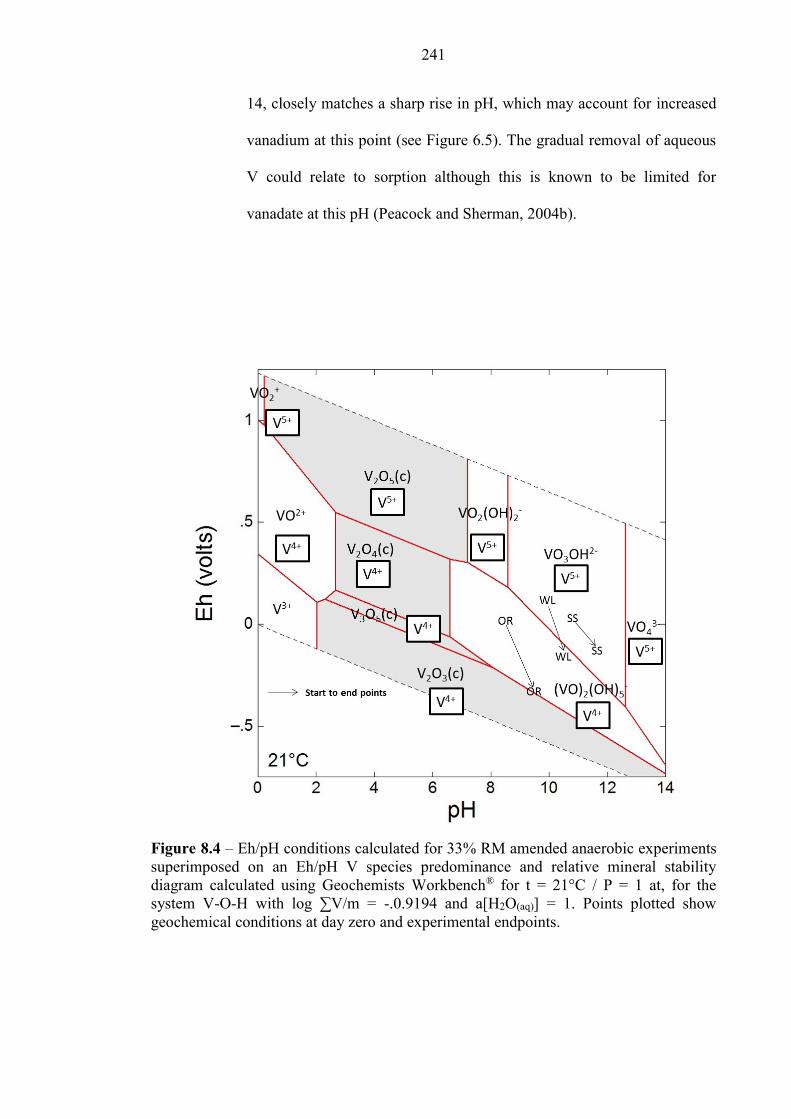
241
14, closely matches a sharp rise in pH, which may account for increased
vanadium at this point (see Figure 6.5). The gradual removal of aqueous
V could relate to sorption although this is known to be limited for
vanadate at this pH (Peacock and Sherman, 2004b).
Figure 8.4 – Eh/pH conditions calculated for 33% RM amended anaerobic experiments
superimposed on an Eh/pH V species predominance and relative mineral stability
diagram calculated using Geochemists Workbench® for t = 21°C / P = 1 at, for the
system V-O-H with log ∑V/m = -.0.9194 and a[H2O(aq)] = 1. Points plotted show
geochemical conditions at day zero and experimental endpoints.
242
8.5 Conclusions
Vanadium remains an element of concern in red mud affected soils under both
aerobic and anaerobic conditions. It is especially problematic where high concentrations
of DOC are released upon soil alkalisation or in soil that has a low buffering capacity
(see Chapter 5). Where DOC is low, V is quickly mobilised upon the addition of red
mud and then gradually removed due to sorption processes but concentrations can still
reach ≥0.2 mg L-1 even with low red mud loadings due to increased pH.
High pH red mud should be used with caution as a soil ameliorant for
contaminated soils, especially those which are high in OM. This is due to the
alkalisation of the soils which promotes DOC release and thus the mobilisation of any
complexed metals such Cu and V. Further to previous studies following the Kolontár
disaster, this study also verifies that costly large scale red mud removal from soils by
Hungarian authorities was vindicated.
This chapter also highlights the complex chemistry of vanadium at high pH
where competing processes such as SOM and sorption to mineral surfaces is not yet
fully understood. The increased use of V over the past decade in steel and titanium
alloys (Horn, 2010) could lead to increased vanadium contamination from alkaline
wastes in the future. It is therefore important to understand the mechanisms controlling
V transport at a much more fundamental level.
243
8.6 References
ADAM, J., BANVOLGYI, G., DURA, G., GRENERCZY, G., GUBECK, N., GUPTER, I.,
SIMON, G., SZEGFALVI, Z., SZEKACS, A., SZEPVOLGYI, J. & UJLAKY, E. 2011. The
Kolontar report: Causes and Lessons from the Red Mud Disaster. In: B, J. (ed.). Budapest:
Sustainable Development Committee of the Hungarian Parliament.
ALBERIC, P., VIOLLIER, E., JEZEQUEL, D., GROSBOIS, C. & MICHARD, G. 2000.
Interactions between trace elements and dissolved organic matter in the stagnant anoxic deep
layer of a meromictic lake. Limnology and Oceanography, 45, 1088-1096.
ANTON, A., REKASI, M., UZINGER, N., SZEPLABI, G. & MAKO, A. 2012. Modelling the
Potential Effects of the Hungarian Red Mud Disaster on Soil Properties. Water Air and Soil
Pollution, 223, 5175-5188.
BREIT, G. N. & WANTY, R. B. 1991. VANADIUM ACCUMULATION IN
CARBONACEOUS ROCKS - A REVIEW OF GEOCHEMICAL CONTROLS DURING
DEPOSITION AND DIAGENESIS. Chemical Geology, 91, 83-97.
BURKE, I. T., MAYES, W. M., PEACOCK, C. L., BROWN, A. P., JARVIS, A. P. & GRUIZ,
K. 2012. Speciation of arsenic, chromium, and vanadium in red mud samples from the ajka spill
site, hungary. Environmental Science & Technology, 46, 3085-92.
BURKE, I. T., PEACOCK, C. L., LOCKWOOD, C. L., STEWART, D. I., MORTIMER, R. J.
G., WARD, M. B., RENFORTH, P., GRUIZ, K. & MAYES, W. M. 2013. Behavior of
Aluminum, Arsenic, and Vanadium during the Neutralization of Red Mud Leachate by HCl,
Gypsum, or Seawater. Environmental Science & Technology, 47, 6527-6535.
CHAURAND, P., ROSE, J., BRIOIS, V., SALOME, M., PROUX, O., NASSIF, V., OLIVI, L.,
SUSINI, J., HAZEMANN, J.-L. & BOTTERO, J.-Y. 2007. New methodological approach for
the vanadium K-edge X-ray absorption near-edge structure interpretation: Application to the
speciation of vanadium in oxide phases from steel slag. Journal of Physical Chemistry B, 111,
5101-5110.
CORNELIS, G., JOHNSON, C. A., VAN GERVEN, T. & VANDECASTEELE, C. 2008.
Leaching mechanisms of oxyanionic metalloid and metal species in alkaline solid wastes: A
review. Applied Geochemistry, 23, 955-976.
GELENCSER, A., KOVATS, N., TUROCZI, B., ROSTASI, A., HOFFER, A., IMRE, K.,
NYIRO-KOSA, I., CSAKBERENYI-MALASICS, D., TOTH, A., CZITROVSZKY, A., NAGY,
A., NAGY, S., ACS, A., KOVACS, A., FERINCZ, A., HARTYANI, Z. & POSFAI, M. 2011.
The Red Mud Accident in Ajka (Hungary): Characterization and Potential Health Effects of
Fugitive Dust. Environmental Science & Technology, 45, 1608-1615.
GONCALVES, M. L. S. & MOTA, A. M. 1987. Complexes of vanadyl and uranyl ions with
chealting groups of humic matter. Talanta, 34, 839-847.
GRAFE, M., POWER, G. & KLAUBER, C. 2011. Bauxite residue issues: III. Alkalinity and
associated chemistry. Hydrometallurgy, 108, 60-79.
244
HIND, A. R., BHARGAVA, S. K. & GROCOTT, S. C. 1999. The surface chemistry of Bayer
process solids: a review. Colloids and Surfaces a-Physicochemical and Engineering Aspects,
146, 359-374.
HORN, D. 2010. Vanadium: Going Green. Mining Journal, 19/02/2010, p.2.
KLEBERCZ, O., MAYES, W. M., ANTON, A. D., FEIGL, V., JARVIS, A. P. & GRUIZ, K.
2012. Ecotoxicity of fluvial sediments downstream of the Ajka red mud spill, Hungary. Journal
of environmental monitoring : JEM, 14, 2063-71.
LANGMUIR, D. 1997. Aqueous environmental geochemistry, Upper Saddle River, N. J.,
Prentice Hall.
LIU, Y., LIN, C. & WU, Y. 2007. Characterization of red mud derived from a combined Bayer
Process and bauxite calcination method. Journal of Hazardous Materials, 146, 255-261.
LU, X., JOHNSON, W. D. & HOOK, J. 1998. Reaction of Vanadate with Aquatic Humic
Substances: An ESR and 51V NMR Study. Environmental Science & Technology, 32, 2257-
2263.
MAYES, W. M., JARVIS, A. P., BURKE, I. T., WALTON, M., FEIGL, V., KLEBERCZ, O. &
GRUIZ, K. 2011. Dispersal and Attenuation of Trace Contaminants Downstream of the Ajka
Bauxite Residue (Red Mud) Depository Failure, Hungary. Environmental Science &
Technology, 45, 5147-5155.
PEACOCK, C. L. & SHERMAN, D. M. 2004. Vanadium(V) adsorption onto goethite (alpha-
FeOOH) at pH 1.5 to 12: A surface complexation model based on ab initio molecular
geometries and EXAFS spectroscopy. Geochimica Et Cosmochimica Acta, 68, 1723-1733.
POURRET, O., DIA, A., GRUAU, G., DAVRANCHE, M. & BOUHNIK-LE COZ, M. 2012.
Assessment of vanadium distribution in shallow groundwaters. Chemical Geology, 294-295, 89-
102.
POWER, G., GRAFE, M. & KLAUBER, C. 2011. Bauxite residue issues: I. Current
management, disposal and storage practices. Hydrometallurgy, 108, 33-45.
RAVEL, B. & NEWVILLE, M. 2005a. ATHENA and ARTEMIS: Interactive graphical data
analysis using IFEFFIT. Physica Scripta, T115, 1007-1010.
RAVEL, B. & NEWVILLE, M. 2005b. ATHENA, ARTEMIS, HEPHAESTUS: data analysis
for X-ray absorption spectroscopy using IFEFFIT. Journal of Synchrotron Radiation, 12, 537-
541.
REKASI, M., FEIGL, V., UZINGER, N., GRUIZ, K., MAKO, A. & ANTON, A. 2013. Effects
of leaching from alkaline red mud on soil biota: modelling the conditions after the Hungarian
red mud disaster. Chemistry and Ecology, 29, 709-723.
RENFORTH, P., MAYES, W. M., JARVIS, A. P., BURKE, I. T., MANNING, D. A. C. &
GRUIZ, K. 2012. Contaminant mobility and carbon sequestration downstream of the Ajka
(Hungary) red mud spill: The effects of gypsum dosing. The Science of the total environment,
421-422, 253-9.
245
RUYTERS, S., MERTENS, J., VASSILIEVA, E., DEHANDSCHUTTER, B., POFFIJN, A. &
SMOLDERS, E. 2011. The Red Mud Accident in Ajka (Hungary): Plant Toxicity and Trace
Metal Bioavailability in Red Mud Contaminated Soil. Environmental Science & Technology, 45,
1616-1622.
SZALAY, A. & SZILAGYI, M. 1967. ASSOCIATION OF VANADIUM WITH HUMIC
ACIDS. Geochimica Et Cosmochimica Acta, 31, 1-&.
THOMAS, B. 2000. Solid phase extraction for the removal of organic-iron complexes in
contaminated groundwater. MSc MSc The University of Leeds.
WEHRLI, B. & STUMM, W. 1989. VANADYL IN NATURAL-WATERS - ADSORPTION
AND HYDROLYSIS PROMOTE OXYGENATION. Geochimica Et Cosmochimica Acta, 53,
69-77.
246
Chapter 9 Summary and future considerations
9.1 Summary
This thesis sought to identify the main biogeochemical processes controlling the
mobility of trace elements from alkaline wastes in soil-water systems. The main focus
of the thesis was an investigation into the mobilisation of trace elements from red mud
into soil-water systems analogous to conditions following the 2010 red mud spill in
Hungary. The secondary focus was a pilot study into the mobility of vanadium in soil-
water systems affected by leachate from iron and steel slag at a legacy steel slag site in
the north of England. These two work packages both sought to improve our
understanding of trace element transport and fate in alkaline waste affected soils, with a
particular emphasis on several oxyanion forming elements that are mobilised at high
pH. The effects of high pH on biogeochemical processes in soils that can either enhance
or inhibit the release of these trace elements was also considered.
In this concluding chapter, the 11 preliminary research hypotheses (see Section
1.2) are revisited and are linked together with major findings from the thesis. Finally,
the wider implications of the research and future considerations will be discussed.
9.2 Preliminary hypotheses revisited and major findings
9.2.1 V from iron and steel slag - Hownsgill Valley, nr Consett, U. K
There were two research hypotheses associated with the samples taken from the
Hownsgill Valley study site.
247
i. Soils affected by steel slag leachates will contain an indigenous population of
microorganisms that are adapted to survive and grow at high pH; microbial
bioreduction processes will therefore, be supported in this environment.
ii. The observed decrease in aqueous vanadium concentrations in the alkaline
leachate with distance away from the source is (at least in part) due to in situ
microbially mediated reduction of V(V) to produce less soluble V(VI) species.
Chapter 4, reports a pilot study into the processes controlling vanadium in the
Hownsgill Valley, near Consett. Although the hypotheses predicted that biological
processes would play a role in the transport of V at the site, the results indicated that the
main processes attenuating V at the site were abiotic. However, the existence of an
alkaliphilic community at the site was confirmed. Vanadate (added as a spike to the
experiments) was removed from solution when incubated with anoxic high pH soils. V
in the soils was found as V(IV) therefore reductive removal was presumed, although the
exact mechanism remains unclear (neither Fe(III)- or sulfate-reduction was observed in
the experiments). Although the results were inconclusive regarding the exact
mechanism of V reduction, the results highlighted several areas for future work which
are discussed below (see section 9.4).
9.2.2 Addition of red mud to soils (Chapters 5 -8)
There were 5 preliminary hypotheses that predicted that effect of red mud
addition to soils. The work undertaken to address these hypotheses is covered across the
whole thesis.
248
i. Addition of caustic red mud to soils will cause an increase in soil pH and as a
consequence concentrations of several toxic oxyanion forming elements (e.g.
As, Al, V, Mo) will increase in associated waters due to their lower sorption to
minerals at high pH.
ii. Soils containing higher concentrations of organic matter (or larger quantities of
clay minerals) content will have a higher intrinsic buffering capacity with
respect to addition of alkalinity (from red mud), producing lower soil pH, and
lower concentrations of oxyanion forming elements.
iii. Addition of red mud in soils will cause the solubilisation of soil organic matter
(due to higher pH), resulting in increased dissolved organic carbon (DOC)
concentrations, and, higher concentrations of elements know to complex
strongly with DOC (e.g. Cu and Ni)
iv. Addition of gypsum (as a source of Ca2+) to red mud affected soils will promote
OH- consuming carbonate precipitation reactions, reducing soil pH, and
producing lower oxyanion concentrations due to enhanced sorption at
circumneutral pH.
v. Increasing the concentration of anionic species in solution (e.g. phosphate,
carbonate) that are known to compete for available sorption sites on minerals,
will result in enhanced solubility of toxic oxyanion forming species (such as As)
regardless of soil pH.
The addition of Ajka red mud to soils does cause an increase in pH, total dissolved
solids, dissolved organic carbon and concentrations of oxyanion forming trace elements,
which is proportional to red mud loading (Chapter 5). The effect of red mud addition to
249
soils was found to be very different depending upon various soil properties; e.g. total
organic carbon and clay content of the soils.
As predicted, the soils with lower organic matter and clay mineral content had a
greater increases in pH after red mud addition (Chapter 5). Soils with increased TOC,
however, experienced a different detrimental effect. In high TOC soils-red mud mixture
very high concentrations of DOC were released under anaerobic conditions (up to850
mg L-1). The increased DOC was found to complex to Cu, Ni and V increased aqueous
concentrations of these elements considerably with respect to soils with lower overall
TOC (Chapter 7 and 8).
The effect of gypsum addition to red mud affected soils was also examined in
Chapter 5 with a view to emergency soil remediation after red mud spills. Gypsum
addition to soils was found to lower pH values. This inhibited the release of Al, As, and
V due and enhanced anion sorption at pH values <8.5. Lower DOC solubility was also
found due to the lower soil pH. However, Mo solubility was found to be largely
unaffected by gypsum addition as Mo (as molybdate) is not strongly sorbed to solids as
circumneutral pH. Gypsum treated soils also exhibited high dissolved sulphate content
(due to gypsum dissolution).
The effect of competitive ions on As mobilisation from red mud was
investigated in Chapter 6. It was observed that ~15% of As in red mud is present as
phosphate exchangeable surface bound complexes. Therefore As solubility from red
mud is enhanced at high pH and in the presence of competing ions. This hypotheses
could be further explored by looking at the effect of PO4 and CO32- on V mobility in red
mud; like As, V is also a phosphate analogue (Wehrli and Stumm, 1989) and therefore
mobility might be enhanced under high PO4 concentrations.
250
9.2.3 Red mud addition to aerobic soil-water systems (Chapters 6 -8)
Results from aerobic microcosms were discussed in Chapters 6, 7 and 8. There
was one hypothesis that related to the effect of aerobic conditions on red mud affected
soil water systems.
vi. In aerobic soil-water systems containing red mud, equilibration with
atmospheric CO2 will result in lower soil pH and lower oxyanion concentrations.
The ingress of atmospheric CO2 in these experiments and the subsequent
carbonation reactions (Equations 2.1 to 2.7) had a dramatic effect reducing experimental
pH. The reduced pH in these experiments, in comparison to those under anaerobic
conditions where pH remained high, minimised the effect of pH related desorption of
As and DOM. The minimised desorption of DOM (as DOC) into the aqueous phase
under aerobic conditions meant that any OM complexed Cu, Ni and V were also
retained in the solid phase. However, experimental pH was sufficiently high enough (>
pH 8.5) for some As and V to be released into the aqueous phase from red mud affected
soils despite the lower overall pH cf. anaerobic experiments.
9.2.4 Red mud addition to anaerobic soil-water systems (Chapters 6 - 8)
The final three hypotheses relate red mud soil-water systems under anaerobic
condition. Chapters 6, 7 and 8 examine the mobilisation of trace metals from anaerobic
experiments together with the effects of red mud addition on soil biogeochemical
processes during anaerobic incubation.
251
vii. In anaerobic soil-water systems containing red mud, microbial bioreduction
processes will produce reducing conditions with time, promoting the reduction
of As(V) to generally more soluble As(III) species and, an increased risk of
enhanced As mobility.
viii. Conversely, bioreduction processes will promote the transformation of V(V) to
V(IV) species, which strongly adsorb to minerals at alkaline pH, resulting in
lower aqueous V concentrations.
ix. Soil affected by red mud addition will not contain microbial communities that
are adjusted to alkaline conditions, therefore bioreduction processes will be
inhibited at high pH.
It was found that microcosm experiments with a pH < ~9.5 were able to support
‘normal’ microbially mediated soil Fe(III)-reduction. However, above this pH, Fe(III)
reduction was inhibited. Likewise microbial sulfate- reduction was observed in some
experiments with pH < ~10, but the efficiency of the process appeared to be a soil
specific response to red mud addition rather than a simple relationship with pH.
Soil only control microcosms without red mud addition showed increased aqueous
As concentrations with increased incubation time. This was most likely as a result of
microbial As reduction; however contrary to the predicted outcome, this observation
was inhibited upon red mud addition. XAS spectroscopy analysis showed that the
reduction of solid phase V(V) to V(IV) only occurred in experiments where active
sulphate-reduction was also observed (Chapter 8). In these tests, vanadate reduction was
probably achieved by reaction with microbially generated sulphide. Despite evidence
for solid phase reduction in some systems, aqueous V remained high in these
experiments, this might be due to V complexation with DOC either inhibiting abiotic
252
reduction or maintaining V(IV) in solution. The exact controls on V solubility in anoxic
red mud amended soils therefore remain poorly defined and could be a topic for further
investigation (see section 9.4).
Anaerobic incubation had several other effects on contaminant mobility; 1) the lack
of CO2 ingression and subsequent carbonation reactions kept experimental pH high in
anaerobic experiments, this lead to increased leaching of DOC with increased pH 2)
Increased concentrations of DOC lead to increased concentration of organic matter
complexing metals such as Cu, Ni and V 3) the reductive dissolution of Fe
(oxyhydr)oxides during Fe(III)-reduction increased aqueous As concentrations by
reducing the availability of sorption surfaces. .
9.3 Implications
Following the red mud spill the Hungarian authorities began an extensive clean
up operation of removing red mud from affected land and ploughing red mud into soils
(Klebercz et al., 2012). The main risks associated with the addition of red mud to soils
have already been identified as increased Na+ and alkalinity (Ruyters et al., 2011; Gruiz
et al., 2012; Anton et al., 2012). Although some studies since the spill have considered
the mobilisation of trace elements from red mud to soil-water systems (Anton et al.,
2012; Milacic et al., 2012; Rekasi et al., 2013), few have examined the release of trace
metals under both aerobic and anaerobic conditions and with respect to biogeochemical
processes. This study together with other studies since the spill justify these expensive
remediation efforts as red mud addition to soils will cause an increase Al, As, Cu, Mo
and V (and to a lesser extent Ni) to soil-water systems.
253
Wetland areas affected by the 2010 spill were not been remediated, presumably
due to logistical reasons (certainly this was the case in May 2011) but it is likely that
some these areas received a high dosing of red mud. Results from experiments with a
33% red mud addition (an experimental analogue for these areas) showed problematic
concentrations of As, Cu and V especially under anaerobic conditions. It is therefore
possible that there is a serious contamination issue in these untreated wetland areas,
especially those with high TOC content.
The red mud from the breached dam at Ajka represents the very worst case
scenario, the pH of the red mud exceeded 12 and had a very high water content making
the dam breach exceed provisions in disaster management planning (Adam, et al.,
2011). Very few red mud repositories store red mud at such a high pH and water content
as refineries have some sort of system for removing excess water and waste
neutralisation (Power et al., 2011). In this respect, Ajka red mud may not be very
representative of other red mud, however the possibility of red mud from other sites
affecting land and homes is very real (there have been recent much smaller scale
incidents in both China and India (Boily, 2012)). Therefore the results in this thesis can
go some way to aid others in decision making processes regarding worst case scenarios
when it comes to risk management.
Red mud has been considered as a potential soil ameliorant for certain
contaminants, including As and Cu (Lombi et al., 2002; Garau et al., 2011) with
encouraging results (the red mud used in these studies usually has a pH <12). However,
the results from this thesis show the importance of soil properties with regards to red
mud addition and that a thorough understanding of these soil properties must be held
before red mud addition is considered for use as an amendment to reduce the effects of
an additional red mud associated metal/loids.
254
9.4 Future considerations
As discussed earlier, the pilot study into mobilisation of V from iron and steel
slags was unable to elucidate the exact mechanisms for V(V) reduction. This study
could be extended in a number of ways. An alkaliphilic microbial community was
found at the site, by producing microcosm experiments that span a pH range of the
upper limits of microbial activity, it may be possible to find the optimum pH for this
community. These experiments coupled with a detailed investigation into the soil
profile to investigate the existence of any micro-niches where microbial Fe(III)
reduction might occur would explain the reducing environment and Fe(II) observed in
the deep soil sampled. A more detailed investigation of the site, examining the
interactions of the leachate plume with the natural soils of the site could confirm the
oxidation state of V during the leaching process (via XAS spectroscopy).
Chapters 4 and 8 examine the mobilisation of vanadium from both iron and steel
slags and red mud. Both studies poorly constrained the exact processes resulting in
removal of aqueous V(V). It is clear that more fundamental experiments investigating
the interaction of V with NOM and mineral phases over an alkaline pH range is needed.
This could be achieved using well characterised soil/NOM and minerals. The
experiments should be carried out with and without the presence of Fe(III)-reducing
bacteria to determine the main controls for V(V) removal from solution at high pH.
As mentioned previously, it is possible that wetland areas affected by the red
mud spill could have serious contamination issues with regards to trace metal release
from red mud. ICP-MS and OES analysis on the solutions extracted from the end point
of the anaerobic experiments indicated that Al, Mo, Se and Ti are other potentially
problematic elements. A logical progression from this project would be to investigate
255
any wetland areas affected by the spill. A number of years have now passed since the
spill but the signal of the red mud may still be apparent: Nagy et al. (2013) were able to
detect the signal of the red mud spill in the Torna and Marcel river system up to two
years after the spill with increased As and Ni concentrations.
The anaerobic experiments highlighted the different effects that red mud
addition had to the soil biogeochemical processes and indigenous microbial
communities; this was largely due to experimental pH and the capacity of the soil to
buffer the effects from red mud addition. A novel approach therefore would be to
examine the effects of increased red mud addition on the different soils with respect to
the microbial communities present and observe any changes in the dominant species of
the microbial communities.
256
9.6 References
ADAM, J., BANVOLGYI, G., DURA, G., GRENERCZY, G., GUBECK, N., GUPTER, I.,
SIMON, G., SZEGFALVI, Z., SZEKACS, A., SZEPVOLGYI, J. & UJLAKY, E. 2011. The
Kolontar report: Causes and Lessons from the Red Mud Disaster. In: B, J. (ed.). Budapest:
Sustainable Development Committee of the Hungarian Parliament.
ANTON, A., REKASI, M., UZINGER, N., SZEPLABI, G. & MAKO, A. 2012. Modelling the
Potential Effects of the Hungarian Red Mud Disaster on Soil Properties. Water Air and Soil
Pollution, 223, 5175-5188.
BOILY, R. 2012. Twenty Cases of Red Hazard: An Inventory of Ecological Problems Caused
by Bauxite Residue from Alumina Production. Inforex Inc. Laval, Quebec, Canada.
GARAU, G., SILVETTI, M., DEIANA, S., DEIANA, P. & CASTALDI, P. 2011. Long-term
influence of red mud on As mobility and soil physico-chemical and microbial parameters in a
polluted sub-acidic soil. Journal of Hazardous Materials, 185, 1241-1248.
GRUIZ, K., FEIGL, V., KLEBERCZ, O., ANTON, A. & VASZITA, E. Environmental Risk
Assessment of Red Mud Contaminated Land in Hungary. In: HRYCIW, R. D.,
ATHANASOPOULOS-ZEKKOS, A. & YESILLER, N., eds. GeoCongress 2012: State of the
Art and Practice in Geotechnical Engineering, 2012. American Society of Civil Engineers,
4156-4165.
KLEBERCZ, O., MAYES, W. M., ANTON, A. D., FEIGL, V., JARVIS, A. P. & GRUIZ, K.
2012. Ecotoxicity of fluvial sediments downstream of the Ajka red mud spill, Hungary. Journal
of environmental monitoring : JEM, 14, 2063-71.
LOMBI, E., ZHAO, F. J., ZHANG, G. Y., SUN, B., FITZ, W., ZHANG, H. & MCGRATH, S.
P. 2002. In situ fixation of metals in soils using bauxite residue: chemical assessment.
Environmental Pollution, 118, 435-443.
MILACIC, R., ZULIANI, T. & SCANCAR, J. 2012. Environmental impact of toxic elements in
red mud studied by fractionation and speciation procedures. Science of the Total Environment,
426, 359-365.
NAGY, A. S., SZABO, J. & VASS, I. 2013. Trace metal and metalloid levels in surface water
of the Marcal River before and after the Ajka red mud spill, Hungary. Environmental Science
and Pollution Research, 20, 7603-7614.
POWER, G., GRAFE, M. & KLAUBER, C. 2011. Bauxite residue issues: I. Current
management, disposal and storage practices. Hydrometallurgy, 108, 33-45.
REKASI, M., FEIGL, V., UZINGER, N., GRUIZ, K., MAKO, A. & ANTON, A. 2013. Effects
of leaching from alkaline red mud on soil biota: modelling the conditions after the Hungarian
red mud disaster. Chemistry and Ecology, 29, 709-723.

257
RUYTERS, S., MERTENS, J., VASSILIEVA, E., DEHANDSCHUTTER, B., POFFIJN, A. &
SMOLDERS, E. 2011. The Red Mud Accident in Ajka (Hungary): Plant Toxicity and Trace
Metal Bioavailability in Red Mud Contaminated Soil. Environmental Science & Technology, 45,
1616-1622.
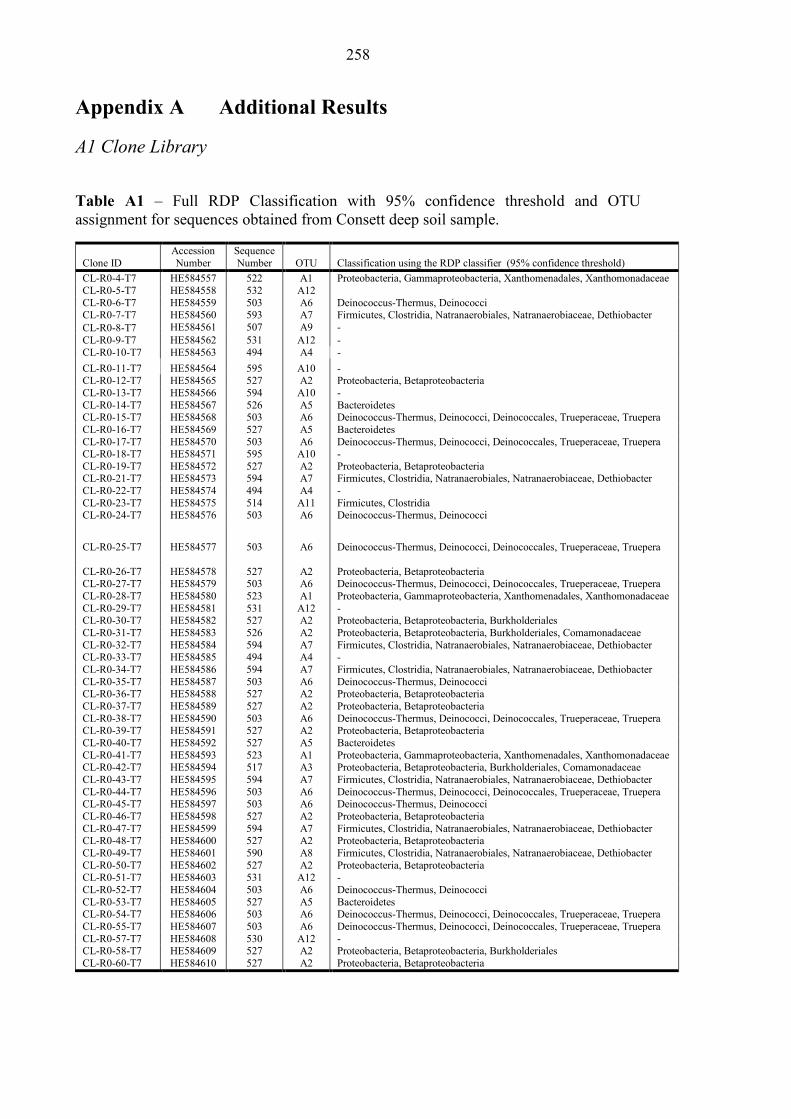
258
Appendix A Additional Results
A1 Clone Library
Table A1 – Full RDP Classification with 95% confidence threshold and OTU
assignment for sequences obtained from Consett deep soil sample.
Clone ID
Accession
Number
Sequence
Number OTU Classification using the RDP classifier (95% confidence threshold)
CL-R0-4-T7 HE584557 522 A1 Proteobacteria, Gammaproteobacteria, Xanthomenadales, Xanthomonadaceae
CL-R0-5-T7 HE584558 532 A12
CL-R0-6-T7 HE584559 503 A6 Deinococcus-Thermus, Deinococci CL-R0-7-T7 HE584560 593 A7 Firmicutes, Clostridia, Natranaerobiales, Natranaerobiaceae, Dethiobacter
CL-R0-8-T7
CL-R0-9-T7
HE584561 507 A9 -
HE584562 531 A12 -
CL-R0-10-T7 HE584563 494 A4 -
CL-R0-11-T7 HE584564 595 A10 -
CL-R0-12-T7 HE584565 527 A2 Proteobacteria, Betaproteobacteria
CL-R0-13-T7 HE584566 594 A10 -
CL-R0-14-T7 HE584567 526 A5 Bacteroidetes CL-R0-15-T7 HE584568 503 A6 Deinococcus-Thermus, Deinococci, Deinococcales, Trueperaceae, Truepera
CL-R0-16-T7 HE584569 527 A5 Bacteroidetes
CL-R0-17-T7 HE584570 503 A6 Deinococcus-Thermus, Deinococci, Deinococcales, Trueperaceae, Truepera CL-R0-18-T7 HE584571 595 A10 -
CL-R0-19-T7 HE584572 527 A2 Proteobacteria, Betaproteobacteria CL-R0-21-T7 HE584573 594 A7 Firmicutes, Clostridia, Natranaerobiales, Natranaerobiaceae, Dethiobacter
CL-R0-22-T7 HE584574 494 A4 -
CL-R0-23-T7 HE584575 514 A11 Firmicutes, Clostridia CL-R0-24-T7 HE584576 503 A6 Deinococcus-Thermus, Deinococci
CL-R0-25-T7 HE584577 503 A6 Deinococcus-Thermus, Deinococci, Deinococcales, Trueperaceae, Truepera
CL-R0-26-T7 HE584578 527 A2 Proteobacteria, Betaproteobacteria CL-R0-27-T7 HE584579 503 A6 Deinococcus-Thermus, Deinococci, Deinococcales, Trueperaceae, Truepera
CL-R0-28-T7 HE584580 523 A1 Proteobacteria, Gammaproteobacteria, Xanthomenadales, Xanthomonadaceae
CL-R0-29-T7 HE584581 531 A12 - CL-R0-30-T7 HE584582 527 A2 Proteobacteria, Betaproteobacteria, Burkholderiales
CL-R0-31-T7 HE584583 526 A2 Proteobacteria, Betaproteobacteria, Burkholderiales, Comamonadaceae
CL-R0-32-T7 HE584584 594 A7 Firmicutes, Clostridia, Natranaerobiales, Natranaerobiaceae, Dethiobacter CL-R0-33-T7 HE584585 494 A4 -
CL-R0-34-T7 HE584586 594 A7 Firmicutes, Clostridia, Natranaerobiales, Natranaerobiaceae, Dethiobacter
CL-R0-35-T7 HE584587 503 A6 Deinococcus-Thermus, Deinococci CL-R0-36-T7 HE584588 527 A2 Proteobacteria, Betaproteobacteria
CL-R0-37-T7 HE584589 527 A2 Proteobacteria, Betaproteobacteria
CL-R0-38-T7 HE584590 503 A6 Deinococcus-Thermus, Deinococci, Deinococcales, Trueperaceae, Truepera CL-R0-39-T7 HE584591 527 A2 Proteobacteria, Betaproteobacteria
CL-R0-40-T7 HE584592 527 A5 Bacteroidetes
CL-R0-41-T7 HE584593 523 A1 Proteobacteria, Gammaproteobacteria, Xanthomenadales, Xanthomonadaceae CL-R0-42-T7 HE584594 517 A3 Proteobacteria, Betaproteobacteria, Burkholderiales, Comamonadaceae
CL-R0-43-T7 HE584595 594 A7 Firmicutes, Clostridia, Natranaerobiales, Natranaerobiaceae, Dethiobacter
CL-R0-44-T7 HE584596 503 A6 Deinococcus-Thermus, Deinococci, Deinococcales, Trueperaceae, Truepera CL-R0-45-T7 HE584597 503 A6 Deinococcus-Thermus, Deinococci
CL-R0-46-T7 HE584598 527 A2 Proteobacteria, Betaproteobacteria
CL-R0-47-T7 HE584599 594 A7 Firmicutes, Clostridia, Natranaerobiales, Natranaerobiaceae, Dethiobacter CL-R0-48-T7 HE584600 527 A2 Proteobacteria, Betaproteobacteria
CL-R0-49-T7 HE584601 590 A8 Firmicutes, Clostridia, Natranaerobiales, Natranaerobiaceae, Dethiobacter
CL-R0-50-T7 HE584602 527 A2 Proteobacteria, Betaproteobacteria
CL-R0-51-T7 HE584603 531 A12 -
CL-R0-52-T7 HE584604 503 A6 Deinococcus-Thermus, Deinococci
CL-R0-53-T7 HE584605 527 A5 Bacteroidetes CL-R0-54-T7 HE584606 503 A6 Deinococcus-Thermus, Deinococci, Deinococcales, Trueperaceae, Truepera
CL-R0-55-T7 HE584607 503 A6 Deinococcus-Thermus, Deinococci, Deinococcales, Trueperaceae, Truepera
CL-R0-57-T7 HE584608 530 A12 - CL-R0-58-T7 HE584609 527 A2 Proteobacteria, Betaproteobacteria, Burkholderiales
CL-R0-60-T7 HE584610 527 A2 Proteobacteria, Betaproteobacteria
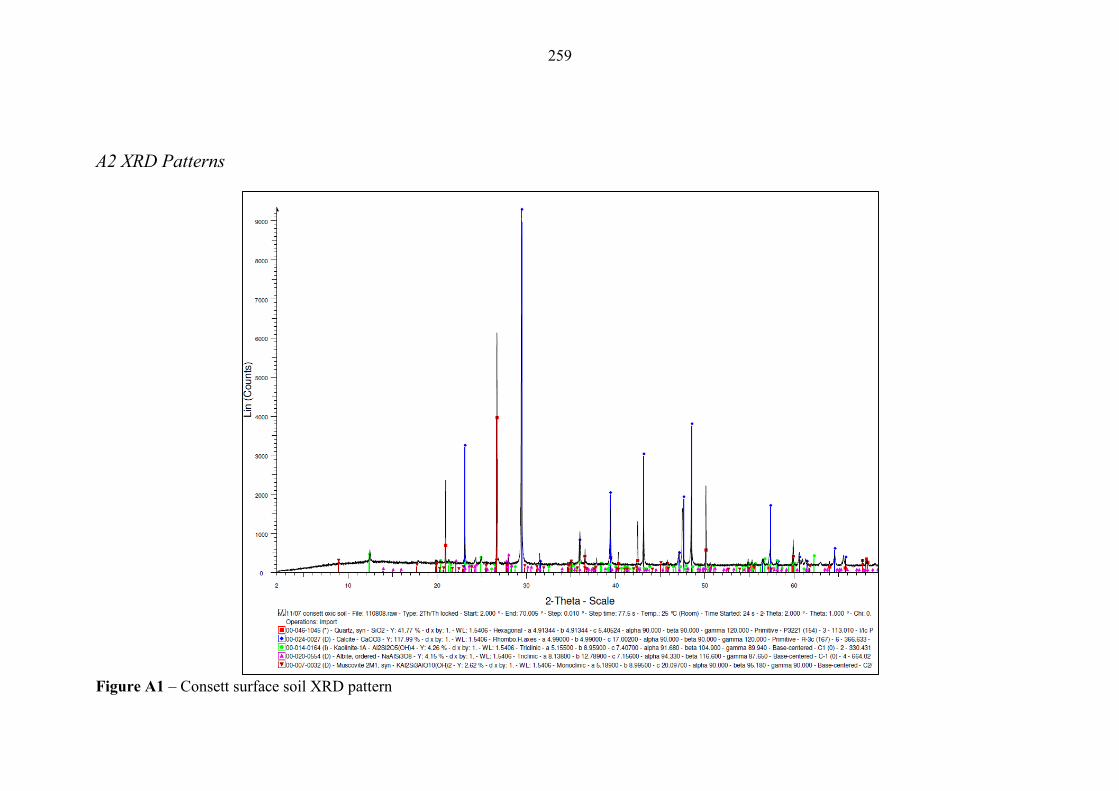
259
A2 XRD Patterns
Figure A1 – Consett surface soil XRD pattern
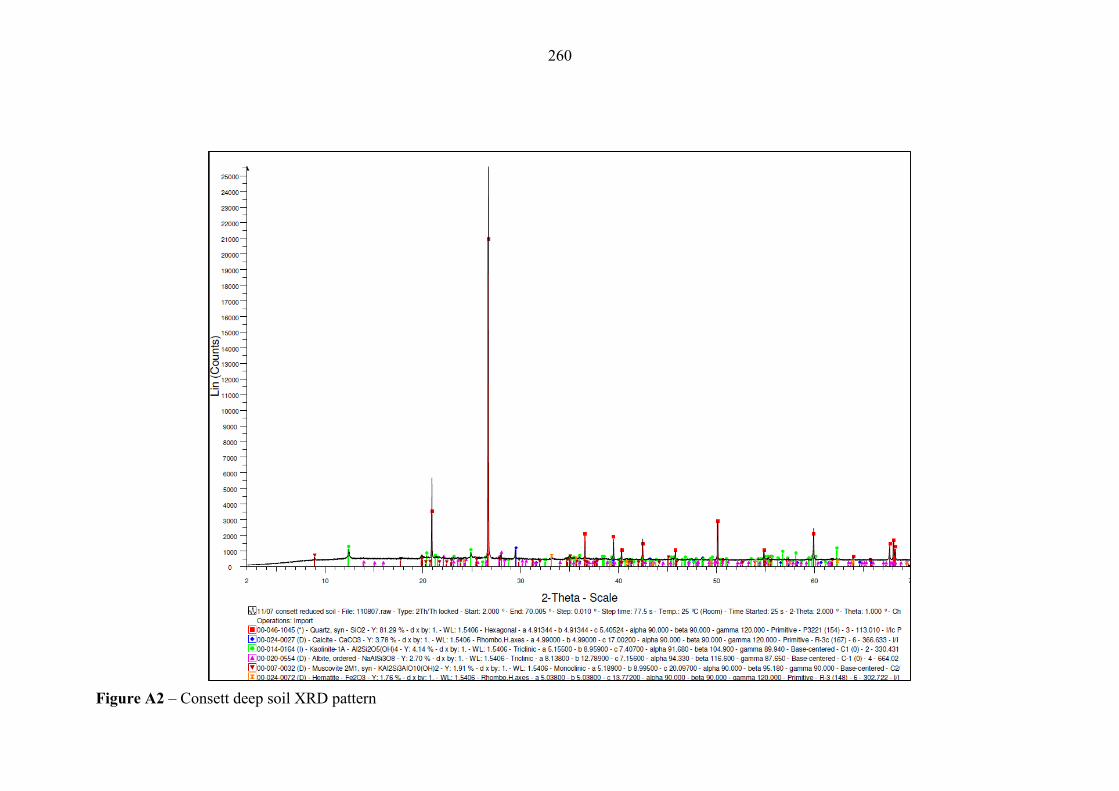
260
Figure A2 – Consett deep soil XRD pattern
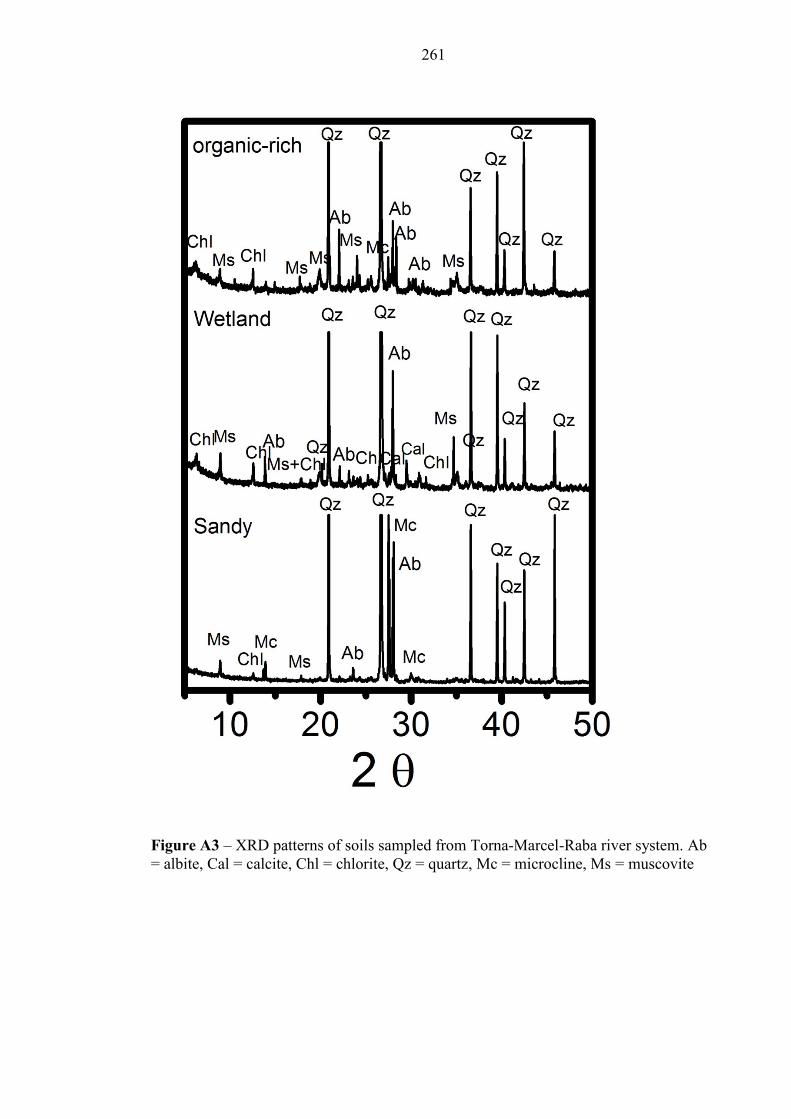
261
Figure A3 – XRD patterns of soils sampled from Torna-Marcel-Raba river system. Ab
= albite, Cal = calcite, Chl = chlorite, Qz = quartz, Mc = microcline, Ms = muscovite
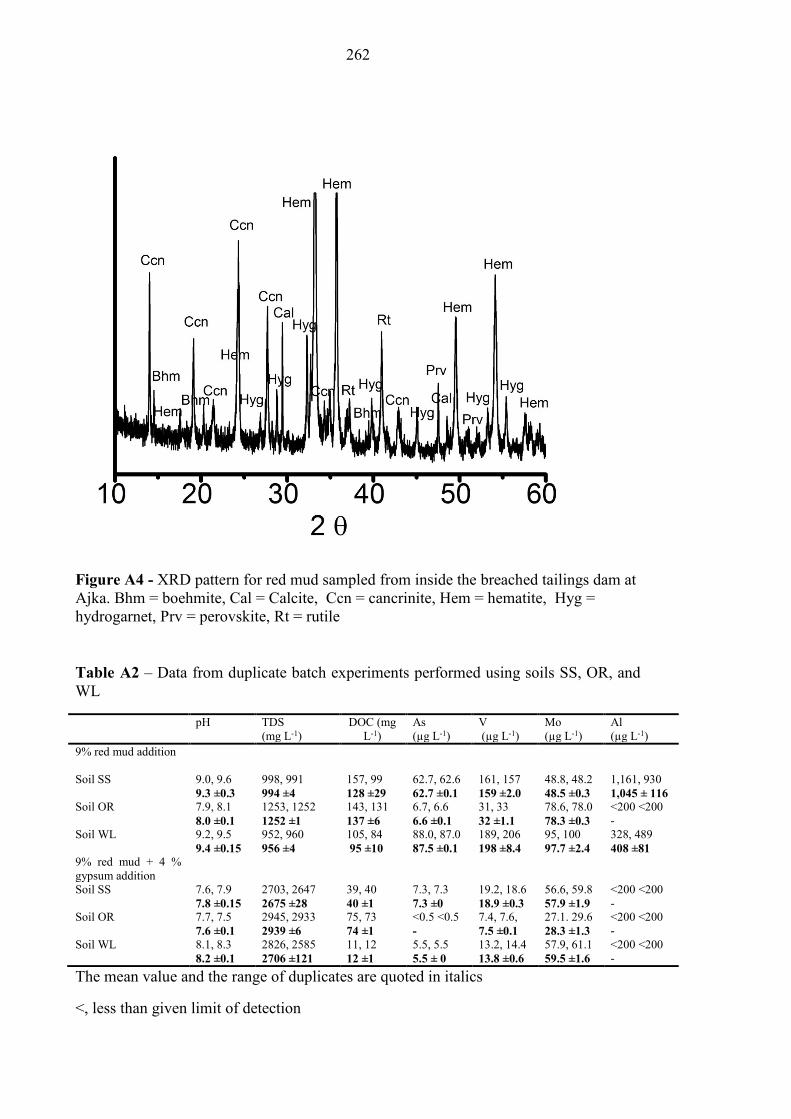
262
Figure A4 - XRD pattern for red mud sampled from inside the breached tailings dam at
Ajka. Bhm = boehmite, Cal = Calcite, Ccn = cancrinite, Hem = hematite, Hyg =
hydrogarnet, Prv = perovskite, Rt = rutile
Table A2 – Data from duplicate batch experiments performed using soils SS, OR, and
WL
pH TDS
(mg L-1)
DOC (mg
L-1)
As
(µg L-1)
V
(µg L-1)
Mo
(µg L-1)
Al
(µg L-1)
9% red mud addition
Soil SS 9.0, 9.6
9.3 ±0.3
998, 991
994 ±4
157, 99
128 ±29
62.7, 62.6
62.7 ±0.1
161, 157
159 ±2.0
48.8, 48.2
48.5 ±0.3
1,161, 930
1,045 ± 116
Soil OR 7.9, 8.1
8.0 ±0.1
1253, 1252
1252 ±1
143, 131
137 ±6
6.7, 6.6
6.6 ±0.1
31, 33
32 ±1.1
78.6, 78.0
78.3 ±0.3
<200 <200
-
Soil WL 9.2, 9.5
9.4 ±0.15
952, 960
956 ±4
105, 84
95 ±10
88.0, 87.0
87.5 ±0.1
189, 206
198 ±8.4
95, 100
97.7 ±2.4
328, 489
408 ±81
9% red mud + 4 %
gypsum addition
Soil SS 7.6, 7.9
7.8 ±0.15
2703, 2647
2675 ±28
39, 40
40 ±1
7.3, 7.3
7.3 ±0
19.2, 18.6
18.9 ±0.3
56.6, 59.8
57.9 ±1.9
<200 <200
-
Soil OR 7.7, 7.5
7.6 ±0.1
2945, 2933
2939 ±6
75, 73
74 ±1
<0.5 <0.5
-
7.4, 7.6,
7.5 ±0.1
27.1. 29.6
28.3 ±1.3
<200 <200
-
Soil WL 8.1, 8.3
8.2 ±0.1
2826, 2585
2706 ±121
11, 12
12 ±1
5.5, 5.5
5.5 ± 0
13.2, 14.4
13.8 ±0.6
57.9, 61.1
59.5 ±1.6
<200 <200
-
The mean value and the range of duplicates are quoted in italics
<, less than given limit of detection
263
Appendix B Associated Publications
Included with this section are publications associated with the work presented in this
thesis. In addition, publications and conference proceedings, related to this work, that
has included contributions from the author, Miss C. L. Lockwood, are also detailed.
B1 Relevant Publications
Lehoux, A. P., Lockwood C. L., Mayes,W. M., Stewart D. I., Mortimer, R. J. G., Gruiz,
K., and Burke, I. T. (2013) Gypsum addition to soils contaminated by red mud:
Implications for aluminium, arsenic, molybdenum and vanadium solubility.
Environmental Geochemistry and Health, 35(5), 643-656.
B2 Other Publications
Burke, I. T., Peacock, C. L., Lockwood, C. L., Stewart, D. I., Mortimer, R. J. G., Ward,
M. B., Renforth, P., Gruiz, K. and Mayes, W. M. (2013) Behaviour of Aluminium,
Arsenic and Vanadium during Neutralization of Red Mud Leachate by HCl, Gypsum or
Seawater. Environmental Science and Technology, 47 (12), 6527-6535.
B3 Conference proceedings
Stewart, D. I., Fuller, S., Burke, I. T., Whittleston, R. A., Lockwood, C. L., Baker, A.
The Role of Molecular Biology in Geotechnical Engineering. 18th International
Conference on Soil Mechanics and Geotechnical Engineering, Paris, France, 2-6
September 2013, 3077-3080 (Poster)
Lockwood, C.L., Mortimer, R. J. G., Stewart, D.,I., Mayes, W. I., Burke, I. T., Arsenic
release from red mud affected soil-water systems. Goldschmidt, Florence, Italy, 25-30
August 2013, Mineralogical Magazine, Vol. 77, pp 1535-1660 (Oral Presentation, CLL)
Lockwood, C. L., Mortimer, R. J. G., Stewart, D. I., Mayes, W. M., Burke, I. T., The
role of biogeochemistry during the release of oxyanions in soil-water systems affected
by bauxite residue (red mud) from the Ajka repository failure, Western Hungary.
Geomicrobiology and its significance for biosphere processes, Manchester, UK, 19-20
April 2012 (Oral presentation, CLL)


