Embed Size (px)
Citation preview

BioMed Central
ss
BMC Immunology
Open AcceResearch articleBioluminescence-based visualization of CD4 T cell dynamics using a T lineage-specific luciferase transgenic model1Joseph H Chewning†1, Kari J Dugger†2, Tandra R Chaudhuri3, Kurt R Zinn†3,4 and Casey T Weaver*†5
Address: 1Department of Pediatrics, University of Alabama at Birmingham, Birmingham, Alabama, USA, 2Department of Microbiology, University of Alabama at Birmingham, Birmingham, Alabama, USA, 3Radiology Department, University of Alabama at Birmingham, Birmingham, Alabama, USA, 4Department of Medicine, University of Alabama at Birmingham, Birmingham, Alabama, USA and 5Department of Pathology, University of Alabama at Birmingham, BBRB 870, 845 19th St. S, Birmingham, Alabama, 35294, USA
Email: Joseph H Chewning - [email protected]; Kari J Dugger - [email protected]; Tandra R Chaudhuri - [email protected]; Kurt R Zinn - [email protected]; Casey T Weaver* - [email protected]
* Corresponding author †Equal contributors
AbstractBackground: Rapid clonal expansion of T cells occurs in response to antigenic challenges. Thekinetics of the T cell response has previously been described using tissue-based studies performedat defined time points. Luciferase bioluminescence has recently been utilized for non-invasiveanalysis of in vivo biologic processes in real-time.
Results: We have created a novel transgenic mouse model (T-Lux) using a human CD2 mini-geneto direct luciferase expression specifically to the T cell compartment. T-Lux T cells demonstratednormal homing patterns within the intact mouse and following adoptive transfer. Bioluminescentsignal correlated with T cell numbers in the whole body images as well as within specific organregions of interest. Following transfer into lymphopenic (RAG2-/-) recipients, homeostaticproliferation of T-Lux T cells was visualized using bioluminescent imaging. Real-time bioluminescentanalysis of CD4+ T cell antigen-specific responses enabled real-time comparison of the kinetics andmagnitude of clonal expansion and contraction in the inductive lymph node and tissue site ofantigen injection. T cell expansion was dose-dependent despite the presence of supraphysiologicnumbers of OVA-specific OT-II transgenic TCR T-Lux T cells. CD4+ T cells subsequentlyunderwent a rapid (3–4 day) contraction phase in the draining lymph node, with a delayedcontraction in the antigen delivery site, with bioluminescent signal diminished below initial levels,representing TCR clonal frequency control.
Conclusion: The T-Lux mouse provides a novel, efficient model for tracking in vivo aspects of theCD4+ T cell response to antigen, providing an attractive approach for studies directed atimmunotherapy or vaccine design.
BackgroundT cell migration to sites of inflammation and infection isessential for adaptive immunity and host protection. Cur-
rent methods of analyzing T cell migration and homingprimarily rely on obtaining mouse end-organ tissues andsubsequent detection of cells within these organs, either
Published: 3 August 2009
BMC Immunology 2009, 10:44 doi:10.1186/1471-2172-10-44
Received: 31 January 2009Accepted: 3 August 2009
This article is available from: http://www.biomedcentral.com/1471-2172/10/44
© 2009 Chewning et al; licensee BioMed Central Ltd. This is an Open Access article distributed under the terms of the Creative Commons Attribution License (http://creativecommons.org/licenses/by/2.0), which permits unrestricted use, distribution, and reproduction in any medium, provided the original work is properly cited.
Page 1 of 14(page number not for citation purposes)

BMC Immunology 2009, 10:44 http://www.biomedcentral.com/1471-2172/10/44
through in situ analysis by immunohistologic methods orby isolation and analysis of recovered T cells from dis-rupted tissues. While each of these approached offersunique advantages (and disadvantages), neither permits"real-time" analysis of T cell dynamics following antigenicexposure and is limited to specific time points and tissueschosen for study. Bioluminescent imaging represents apowerful alternative for the monitoring immune cellhoming and migration in vivo that does not require ani-mal sacrifice for analysis.
Luciferase proteins produce light in the visible spectrum(approximately 560 nm for firefly luciferase) followinginteraction with luciferin substrate molecules. This reac-tion only requires ATP and oxygen and thus can occur inany actively metabolic cell. Luciferin, a small water-solu-ble molecule, readily crosses cell membranes and can pen-etrate into virtually all tissues. Light produced by theluciferase-luciferin reaction is detectable by low-lightdetection devices, such as charge-coupled device(CCD)4cameras. Bioluminescence imaging is a goodmodel for in vivo imaging based on the low backgroundsignal, since it only detects chemical reactions betweenthe enzyme and substrate. Bioluminescence also requiresrelatively short imaging times (seconds to minutes), iseasy to use, and the instrumentation is relatively inexpen-sive [1,2].
Luciferase imaging techniques have previously been usedto track localization of bacterial and viral pathogens,monitor therapeutic responses in tumor xenografts, andallograft cell survival [3-6]. Recent studies have utilizedbioluminescence to track T cell homing patterns followingadoptive transfer of luciferase-expressing allogeneic T cellsinto MHC-mismatched recipient mice [7,8]. We have alsoreported use of luciferase-expressing CD8 T cells for anal-ysis of population dynamics in response to viral-basedantigenic-challenge [9]. These studies reveal that T cellproliferation, in the context of graft versus host disease orviral infection, can be visualized in 'real-time' withinrecipient mice. The luciferase-expressing T cells can alsobe identified within specific tissue sites in order to deter-mine homing and migration kinetics over time [7,8].
In the current study, we describe the generation of a trans-genic mouse (T-Lux) model in which the luciferase gene isspecifically expressed by T cells, thereby permitting analy-sis of T cell population dynamics in living mice in real-time. By crossing the T-lux transgenic mice with OVA-spe-cific CD4 TCR transgenic mice (OT-II), we have generateda reporter model with which to track antigen-specific CD4T cells in vivo, in real-time. Our studies reveal the popula-tion dynamics of the CD4 clonal response within draininglymphoid tissues and antigen injection sites in individualmice and demonstrate the utility of this model for non-invasive analyses of T cell clonal responses.
MethodsMiceC57BL/6 and C57BL/6.Ly5.2 (CD45.1+) mice wereobtained from Jackson Laboratory (Bar Harbor, ME).Thy1.1-expressing C57BL/6 mice were obtained fromCharles River Breeding Laboratories. Mice used for imag-ing were placed on a low light diet (Harlan Tekland) toreduce non-specific luminescence. All mice were housedor bred in our specific pathogen-free facility, and were ini-tially used at 6–10 weeks of age. All mice were housed andtreated according to National Institutes of Health guide-lines under the auspices of the UAB Institutional AnimalCare and Use Committee (IACUC) of the University ofAlabama at Birmingham.
Generation of T-lux transgenic mouseThe luciferase coding sequence was excised from the pGL3plasmid (Promega) by Xba I/Nco I digestion, bluntedwith Klenow and ligated into a Sma I-linearized hCD2minigene cassette plasmid (the kind gift of Dr. DmitriKioussis; [10]). The T-lux transgene was restrictionmapped for correct orientation and sequenced across theintegration joints to confirm the correct reading frameand terminus of the luciferase gene (using primersOCW938 and OCW939). The reporter gene construct wasintroduced into single-cell embryos of donor C57BL/6mice by pronuclear injection in the UAB TransgenicMouse Facility. Potential founder lines were screened byluminescence analysis of peripheral blood. Red bloodcells were lysed from 30 μL of blood using ACK buffer for2 minutes. Cells were then plated into 96-well plates andluciferin (100 μg/ml) added to each well 10 minutes priorto imaging. Bioluminescence imaging of the plates wasperformed using the IVIS® Imaging System with stage at 15cm height for 600 seconds. One founder line (T-lux 9)with readily detectable luminescence that transmitted thetransgene in the germline was selected for subsequentstudies.
AntibodiesThe following antibodies were used for fluorescence label-ling of cells for flow cytometric analyses: fluorescein iso-thiocyanate (FITC)-labelled anti-mouse CD8 (clone 53-6.7); phycoerythrin (PE)-labelled anti-mouse CD4 (RM4-5); PE-labelled anti-mouse CD45.2 (104); biotin-labelledanti-mouse CD8 (H35-17.2) and CD45.1 (A20). All werepurchased from eBiosciences (San Diego, CA). PerCP-labelled anti-mouse CD3 (145-2C11) was purchasedfrom BD Pharmingen (San Jose, CA).
Flow cytometric analysisSingle cell suspensions from specified target organs wereanalyzed by FACS at the indicated time points. Cells werestained for flow cytometry with FITC-, PE-, PerCP-, orbiotin-conjugated mAbs indicated in the appropriate fig-ure legends. Cells labelled with biotinylated primary Ab
Page 2 of 14(page number not for citation purposes)
BMC Immunology 2009, 10:44 http://www.biomedcentral.com/1471-2172/10/44
were detected with allophycocyanin-conjugated streptavi-din. For analytical flow cytometry, at least 100,000 eventswith forward and side scatter properties of lymphocyteswere collected on a FACSCalibur flow cytometer (BD Bio-sciences, San Jose, CA) and analyzed using CellQuest soft-ware (BD Biosciences, San Jose, CA). Some analyses wereperformed using FlowJo software (Treestar, Inc, Ashland,OR).
Isolation and Transfer of T-lux CellsSplenocytes were harvested from T-lux mice and CD4+ Tlymphocytes isolated using Dynal Bead Separation(Dynal Biotech LLC), according to manufacturer's instruc-tions. Briefly, T-lux splenocytes were incubated with CD4+
specific magnetic beads for 20 minutes at 4°C. The cell-attached beads were then incubated with Detach-a-beadat room temperature for 1 hour. Thoroughly washed cellswere counted, resuspended in RPMI medium withoutserum, and transferred to recipient mice via tail vein injec-tion.
In vivo Bioluminescence Imaging of MiceMice were anesthetized with isofluorane gas and placed ina light-tight chamber. A photographic (gray-scale) refer-ence image was obtained at 10 minutes after D-luciferininjection (2.5 mg intraperitoneal); bioluminescentimages were collected immediately thereafter. Imageswere obtained with a CCD camera cooled to -120°C,using the IVIS® 100 Imaging System (Xenogen Corp.,Alameda, CA) with the field of view set at 10 cm height.The photographic images used a 0.2 second exposure, 8f/stop, 2 binning (resolution), and an open filter. The bio-luminescent images used exposures ranging from 120 to600 seconds, 1f/stop, 8 binning and open filter. The bio-luminescent and gray-scale images were overlaid usingLiving Image software (Xenogen Corp.). Igor image anal-yses software (Wavemetrics, Lake Oswego, OR) was alsoused to obtain a pseudocolor image representing biolumi-nescence intensity (blue, least intense, and red, mostintense). Regions of interest were drawn around organsand the total counts (photons) were summed in the entireorgan areas. The total counts in each region of interestwere normalized to total acquisition time to obtaincounts/sec.
ResultsTransgenic mice containing the firefly luciferase gene, luc, under control of a human CD2 mini-gene cassette produce T cell-specific bioluminescenceThe human CD2 (hCD2) minigene cassette has previ-ously been utilized to direct transgene expression inmouse T cells [10-12]. The hCD2 minigene contains an ~5kb 5' flanking/promoter region and a 5.5 kb 3' region thatcontains a locus control region (LCR). The LCR of thehCD2 contains a T cell-specific enhancer and additional
regulatory elements responsible for establishing an activechromatin domain in T lymphocytes [12]. The intact firstintron of human CD2, located downstream of the pro-moter region, improves efficiency of transgene expression.Transgene expression levels are typically independent ofthe integration site, and the level of expression is propor-tional to the number of transgene copies [11].
Firefly luciferase gene, luc, was inserted into the partialsecond exon of hCD2 minigene (Figure 1A). The trans-gene was then injected into the pronuclei of single-cellembryos from C57BL/6 female mice. Two rounds of injec-tions resulted in 24 mice. Red blood cell-depleted periph-eral blood was imaged after the addition of luciferin,using the IVIS® imaging system. Four founder mice thatdisplayed luciferase expression were identified (T-luxfounder lines 9, 16, 20, and 23) (Figure 1B and 1C). Oneof these founders, T-lux founder #9, transmitted the trans-gene in the germline and displayed T lineage-specificexpression (below), and was used for all subsequent stud-ies.
The distribution of luciferase-expressing cells was deter-mined in intact founder mice. Bioluminescent imagingrevealed increased signal within lymphoid tissue regions(Figure 1D). As anticipated, bioluminescence wasdetected from the thymus, as well as spleen, peripherallymph nodes (LNs), and gastrointestinal lymphoid tis-sues, consistent with normal lymphocyte homing patterns[13-15]. Light emission from circulating T cells and skin Tcells delineated the anatomical outlines of the mouse.
Splenocytes from T-lux transgenic mice were isolated inorder to determine the lineage specificity of the luciferasetransgene. Splenocytes were separated by FACS into fourpopulations, CD4+, CD8+, B220+, and a triple-negativepopulation. The FACS purity of the sorted populations ofCD4+ and CD8+ were 98% and 99%, respectively, whilethe B220+ and the negative populations were 96% and90% pure. Cells were plated into 96-well plates in equiv-alent numbers of each population (1 × 10⁶ cells/well) andwere imaged for bioluminescence ex vivo. As shown in Fig-ure 1E, bioluminescent signal was almost exclusivelywithin the CD4+ and CD8+ T cell populations. Quantifica-tion of light emission of these cell populations confirmedthe purity of the sort. Ratios of CD4:B220 and CD4:nega-tive show a 4% and 5% bioluminescent signal, respec-tively. These numbers are consistent with the low level ofT cell contamination of these populations detected byFACS analysis. T-lux T cells retained normal T cell prolif-eration in response to TCR stimulation and produced sim-ilar levels of cytokines compared to wild-type T cells (datanot shown). Thus, the T-lux transgene produces a detecta-ble bioluminescent signal that is limited to the T cell com-partment, and does not alter T cell function in these cells.
Page 3 of 14(page number not for citation purposes)

BMC Immunology 2009, 10:44 http://www.biomedcentral.com/1471-2172/10/44
T-lux CD3+ T cells rapidly home to secondary lymphoid tissues and produce a stable luciferase signal within 24 hours following adoptive transferNaïve T cells are excluded from non-lymphoid tissues andpreferentially home to secondary lymphoid organs [16].Expression of CD62L and CCR7 allow for recognition andbinding to the high endothelial venules within lymphoidtissues [17,18]. T cells typically reside within the lymph
nodes for approximately 24 hours before re-entering thecirculation unless activated by dendritic cells [19,20].Until antigen is encountered, these T cells will migraterandomly between secondary lymphoid tissues [21].
The ability to monitor T cell signal within the live mouseover time provides an opportunity to efficiently analyze Tcell distribution kinetics serially in single mice, eliminat-
T-lux Transgenic Mouse ModelFigure 1T-lux Transgenic Mouse Model. Shown in (A) is a diagrammatic representation of the CD2.luc transgene. The luc gene is located downstream of the 5 kb promoter region and the intact first intron (in red). The CD2.luc transgene was introduced into single-cell embryos of C57Bl/6 mice by standard transgenesis. Equal numbers of peripheral blood mononuclear cells from potential founder lines were screened for luciferase activity in 96 well plates (B). Numbers in positive wells indicate founder line. Actual light emission results are shown in (C), confirming positivity of founder lines #9, 16, 20, and 23. (D) Whole-body bioluminescence image of a transgenic 'T-lux' mouse. A strong primary lymphoid tissue bioluminescent signal (thymus) and sec-ondary lymphoid tissue signal (spleen, mesenteric lymph nodes (LNs), and peripheral LNs) is seen. Pseudocolor scale is shown to right of image. Lineage specificity of transgene expression was confirmed by FACS sorting of splenocytes into four popula-tions, each containing 1 × 10⁶ cells (E). These populations were: CD4+ T cells, CD8+ T cells, B220+ (B cells), and CD4-CD8-
B220- (non-T, non-B cells). A representative bioluminescent image of wells containing each sorted cell population is shown below figure.
Page 4 of 14(page number not for citation purposes)

BMC Immunology 2009, 10:44 http://www.biomedcentral.com/1471-2172/10/44
ing the need for use of large cohorts of mice that can beanalyzed only at individual time points. To test the hom-ing characteristics of the T-lux T cells following adoptivetransfer into immunocompetent mice, we transferred 1 ×10⁷ T-lux CD3+ cells into CD45.1, non-irradiated B6 recip-ients (n = 8). Individual recipient mice were imagedbeginning 15 minutes post-transfer and at the indicatedtime intervals (Figure 2A). Detectable signal was presentwithin the peripheral and mesenteric lymph nodes asearly as 15 min following adoptive transfer, consistentwith previously published studies [20]. A splenic signalwas also visible prior to 1 hour after transfer in anterior-posterior (AP) image orientations, and was readily detect-able 15 min post-transfer in left lateral images (notshown).
Bioluminescent signal (counts/sec) was calculated inorder to quantitate the bioluminescent signal intensitychange over time, as T cell migratory patterns can be delin-eated by analyzing the signal flux within different regionsof measurement. When the signal flux ceases to change, itcan be concluded that pool size homeostasis has beenachieved in the anatomical regions of interest. We col-lected and graphed whole body light emission measure-ments over time and assessed migratory trends of T-lux Tcells. Following a brief decrease in signal due to redistri-bution following injection, whole body bioluminescenceincreased, reaching a plateau between 12 and 24 hours(Figure 2B). Notably, signal intensity in the intestinallymphoid tissues equilibrated more rapidly (1–3 hourspost-transfer), consistent with more rapid recruitment tothese tissue sites prior to redistribution, whereas signalintensities in other secondary lymphoid tissues equili-brated by ~12 hours post-transfer (Figure 2A, and data notshown). There was no detectable early enrichment in thelung fields, indicating that no significant trapping oftransferred T cells in the pulmonary capillary beds was evi-dent.
Correlation of bioluminescent signal intensity with T cell distribution in vivoTo determine the relationship between bioluminescentsignal and T cell numbers in the T-lux mouse, the per-cellsignal intensity was defined under non-attenuating condi-tions in vitro to provide a baseline for subsequent in vivostudies. In vitro, T-lux spleen and peripheral lymph nodeT cells were added to a 96-well plate in decreasing cellnumbers from 1 × 10⁷ to 1 × 10⁴ CD3+ cells. Biolumines-cent signal was quantified for each population (Figure3A). A comparison of signal strength (counts/sec) and Tcell numbers demonstrated a linear relationship (r2 =0.998) (Figure 3B), and the per-cell signal intensity was ≈0.225 counts/cell/sec.
The signal of T cell bioluminescence within the intactmouse was assessed following adoptive transfer of luci-
ferase-expressing cells. Initial studies were designed toanalyze whole body bioluminescent signal generated bydiffering numbers of T-lux T cells. Increasing numbers ofCD3+ T-lux cells (1 × 10⁶, 3 × 10⁶, and 1 × 10⁷; n = 3) wereinjected via tail vein into congenic C57BL/6 recipients.Bioluminescent imaging of the entire mouse was per-formed at 12, 24, and 72 hours following transfer. Repre-sentative images obtained at 72 hours are shown in Figure3C. Stable bioluminescent signals in the abdominalregion, spleen, and cervical lymph node regions werepresent by 12 hours post-transfer (data not shown). Com-parison of whole body counts/sec versus T-lux cell doseconfirmed a linear and proportional relationship (Figure3D).
Subsequent experiments were performed to determine thecorrelation of T cell number to bioluminescent signalwithin specific anatomical tissue regions. T cells (3.5 ×10⁶) were obtained from CD45.2+ T-lux mice and intro-duced into congenic CD45.1+ C57BL/6 recipients. Use ofthe CD45 allelic marker allowed discrimination by FACSof the donor CD45.2-expressing T-lux cells. Recipientmice were imaged every three days in defined anatomicalregions following T cell redistribution to secondary lym-phoid tissues. Direct analysis of transgenic T cell numbersin those sites by flow cytometry was then performed andcompared to the luciferase bioluminescent signal (Figure4).
The peripheral lymph node (inguinal and axillary)regions of interest (ROIs) generated an observable signalfollowing T cell transfer (3.5 × 10⁶) at all time points (Fig-ure 4). Comparison of signal strength to T cell numbersresulted in a 1.54 counts/cell/sec ratio (Table 1). Cervicallymph nodes produced similar results of 1.06 counts/cell/sec. By comparison, the signal to cell ratio within thespleen was reduced in AP positioning (0.075 counts/cell/sec), consistent with increased attenuation of luciferasesignal from T cells resident in the deeper tissues (Table 1),although on lateral view, this attenuation was not appar-ent (data not shown).
Signal to cell ratios from mesenteric lymph nodes surpris-ingly revealed an increased signal to cell ratio (2.04counts/cell/sec) compared to superficial lymph nodes(Figure 4 and Table 1). This is likely due to a contributionof additional signal from other lymphoid tissues withinthe gut, producing a "generalized" signal. Additionalexperiments were performed on mice after surgicallyopening the abdomen under anesthesia and exposingintestinal tissue. These "open" images revealed T-lux sig-nal within individual Peyer's patches and other regionsnot clearly seen within the overall abdominal signal (datanot shown). Collectively, these experiments demon-strated the ability to quantify T cell numbers in situ in real-time using bioluminescence, and although the signal
Page 5 of 14(page number not for citation purposes)

BMC Immunology 2009, 10:44 http://www.biomedcentral.com/1471-2172/10/44
Page 6 of 14(page number not for citation purposes)
Kinetics of Tissue Localization following Adoptive Transfer of T-lux T cellsFigure 2Kinetics of Tissue Localization following Adoptive Transfer of T-lux T cells. The kinetics of naïve T cell homing were assessed following adoptive transfer of 1 × 10⁷ T-lux CD3+ cells into CD45.1-positive, C57BL/6 recipients (N = 8). Recipient mice were imaged for whole body bioluminescence at timed intervals following transfer. (A) Representative images from a sin-gle mouse for each of the indicated time points. Additional reference anatomical map shown below 24-hour time point. Pseu-docolor scales are shown to right of figures. The mean bioluminescent signal of the cohort for each time point is displayed in (B). Control bioluminescence from mice receiving non-transgenic T cells ('non-lux' T cells) is also shown. Error bars indicate SEM.
���������� ��� ���� ��� ���� �����
A.
B.

BMC Immunology 2009, 10:44 http://www.biomedcentral.com/1471-2172/10/44
intensity per cell varied depending on anatomic location,the calculated values proved reliable for estimating T cellnumber in each site at different time points in the sameanimal, and even between individual mice that receivedcomparable T cell transfers.
Tracking homeostatic proliferation in lymphopenic hostsNormal T cells undergo extensive homeostatic prolifera-tion in a lymphopenic setting. Expansion of T cells follow-ing transfer into an immunodeficient host can be due to
both thymic-dependent and -independent mechanisms[22]. An essential role for interleukin-7 in thymic-inde-pendent expansion of T cells has been well described[23,24]. The luciferase-expressing T-lux mouse provided amodel to visualize homeostatic T cell expansion over timewithin the live host.
We transferred 1 × 10⁷ T-lux CD3+ cells into C57BL/6RAG-deficient (RAG-/-) mice (n = 4), which lack mature Tand B cells. Reconstituted RAG-/- mice were then imaged
Correlation of T Cell Dose and Luciferase Bioluminescent SignalFigure 3Correlation of T Cell Dose and Luciferase Bioluminescent Signal. A comparison of T-lux T cell numbers with light emission signal was done both in vitro and in vivo to assess the sensitivity of the T cell luciferase signal. (A) Pooled CD3+ T cells from spleen and peripheral lymph nodes of T-lux mice were plated in triplicate (in columns) into a 96-well plate at the indicated cell numbers per well, and light emission was quantitated following addition of luciferin. Pseudocolor scale is shown to right. (B) Plot of light emission data from (A) versus input T cell numbers. Error bars indicate standard error of the mean (SEM). Medium alone was used as negative control. The r2 value for data is displayed on figure (see text for details). (C) CD3+ T cells isolated from pooled spleen and LN of T-lux mice were adoptively transferred into congenic C57BL/6 recipients. Whole body bioluminescence was quantified at 12, 24, and 72 hours post-transfer. Representative images from 72 hours post-transfer are shown for three cell doses. (D) Whole body luminescence was plotted against transferred T cell numbers in (C). A represent-ative plot is shown for the 72-hour time point.
Page 7 of 14(page number not for citation purposes)

BMC Immunology 2009, 10:44 http://www.biomedcentral.com/1471-2172/10/44
for bioluminescent signal at the indicated time pointspost-transfer. Whole body bioluminescent imagesrevealed rapidly increasing signal during the first twoweeks following transfer (~100-fold increase), followedby plateau. Comparison studies performed with transfersof 1 × 10⁷ T-lux CD3+ cells into WT C57BL/6 mice showedthat, in contrast to the luciferase signal in the lympho-penic RAG-/- mice, immunocompetent mice showed a
modest decline in luciferase signal after two days, fol-lowed by a relatively stable signal over the ensuing threeweeks (Figure 5). In the RAG-deficient recipients, the Tcell signal was evident in both lymphoid and non-lym-phoid tissues, consistent with some degree of memory Tcell development and distribution. Whole body biolumi-nescence signal from reconstituted RAG-/- mice wasapproximately 20% of the intact, wild-type T-lux mouse.
In vivo Bioluminescent Signal Within Different Lymphoid TissuesFigure 4In vivo Bioluminescent Signal Within Different Lymphoid Tissues. To determine the correlation between T-lux T cell numbers and bioluminescent signal in vivo, we adoptively transferred T-lux CD3+ cells (3.5 × 10⁶) into CD45.1-positive, con-genic B6 recipients. Three days post-transfer, light emission was determined for whole body, as well as defined anatomical regions (Regions of Interest, or ROI), including cervical, peripheral, and mesenteric lymph nodes and spleen, and compared to actual T cell numbers recovered from these tissues. FACS analysis was performed on cells obtained from recipient mice and representative plots are shown (left panel). Tissue source is indicated for each FACS plot. Cells were first gated on live CD3-positive lymphocytes. Recipient CD45.1 allotype is shown on the y-axis and donor CD45.2 on x-axis. Numbers indicate the percentages of donor (T-lux) T cells of the total live CD3+ T cells in each tissue. The composite of bioluminescence images (right panel; left image) shows a non-normalized pseudocolor image, with the analyzed ROIs indicated by arrows; the same pseudocolor image is overlayed on a photographic image of the mouse (right panel; right image).
Page 8 of 14(page number not for citation purposes)

BMC Immunology 2009, 10:44 http://www.biomedcentral.com/1471-2172/10/44
This finding correlated with the relative total T cell num-bers when organs were harvested and transferred cellscounted (data not shown).
Non-invasive tracking of T cell half-lifeDiversity of the T cell receptor repertoire is essential forprotection of the host from infection. Previous studieshave demonstrated that the number of cells bearing thesame MHCII:peptide-specific TCR within the naïve CD4+
T cell repertoire is in the range of 20–200 [25]. This samegroup also demonstrated that survival of CD4+ T cells invivo is determined in part by TCR specificity attributes, butalso clonal frequency, with an inverse relationshipbetween T cell number and half-life. The half-life of adop-tively transferred polyclonal CD4+ T cells within second-ary lymphoid tissues was calculated to be 124 days [26].
Whole body bioluminescent imaging using T-lux T cellsprovided a non-invasive method of measuring the half-life of T cells within the entire mouse. Adoptive transferstudies were performed by infusing 3.5 × 10⁶ polyclonalnaïve T-lux CD3+ cells (CD45.2-positive) into CD45.1-positive, B6 mice. Bioluminescent imaging was performedon recipient mice every other day, beginning 1 day post-
transfer and for a total of 33 days, and in some studiesextended for a total of 120 days. As seen in Figure 6A,there was a progressive decline in bioluminescent signalfrom individual mice following transfers. In extendedexperiments, the T cell half-life calculated on the basis ofdecay in luminescent signal yielded a calculated half-lifeof ~120 days, in good agreement with published data[26]. Further, the decline in signal did not appear to bedue to active immune clearance, as parallel studies usingnon-transgenic, CD45.2-positive, CD3+ T cells transferredinto CD45.1 B6 recipients demonstrated a comparabledecline in T cell numbers as determined by FACS analysisof lymphoid tissues (data not shown).
We next determined whether there was stability of single-cell luciferase signal by T-lux cells following adoptivetransfers. After transfer of 3.5 × 10⁶ T-lux CD3+ cells, weimaged distinct regions of interest (ROIs) for peripheral,cervical, and mesenteric lymph nodes. Spleen was notincluded in this analysis due to the attenuation of signalpreviously demonstrated in AP determinations. Weobtained bioluminescent signal measurements from allROIs every 3 days for 5 weeks. We then quantified T cellnumbers from each region using flow cytometric analysesat the indicated time points post-transfer based on theCD45.2 marker, and calculated the counts per cell pro-duced within these lymphoid organs (Figure 6B). Theratio of counts/cell remained constant despite the declinein overall transferred cell numbers, indicating that signalloss was due to decline in the number, not single-cellintensity, of luciferase-expressing cells. Thus, the luci-ferase reporter appears to be stable for prolonged periodsfollowing adoptive transfer and shows no evidence of pro-voking an alloantigenic response, at least in the C57BL/6strain background.
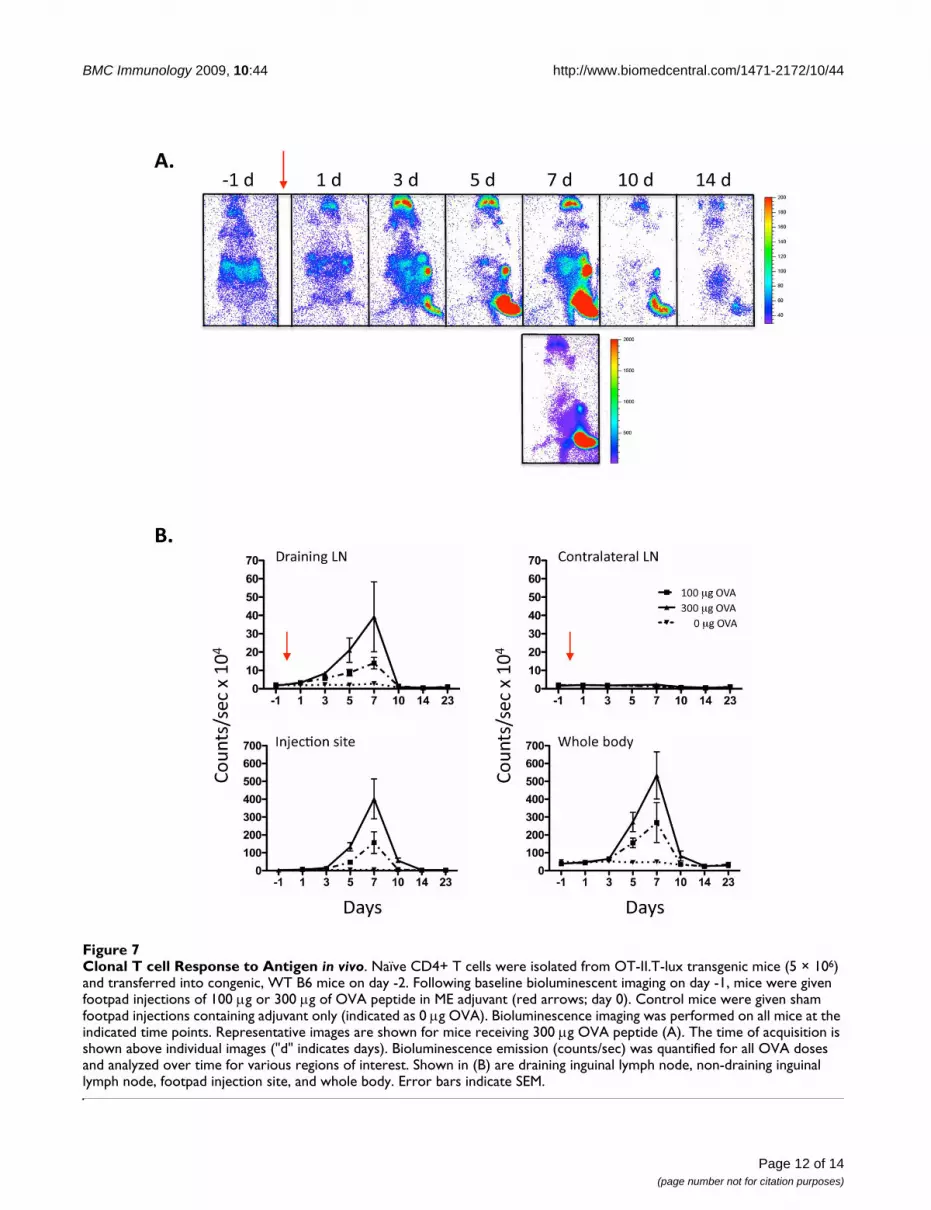
Whole body imaging of clonal CD4+ T cell response to antigenAfter encountering antigen, CD4+ T cells undergo markedclonal expansion followed by a contraction phase onclearance of antigen [27]. The T-lux mouse represents anovel model for the analysis of T cell dynamics followingantigen encounter. To study the CD4+ T cell antigen-spe-cific response in individual mice, we crossed the T-luxmouse with the OT-II TCR transgenic mouse [28], andtransferred T-lux-OT-II T cells into immunocompetentcongenic recipients. OVA peptide emulsified in a non-toxic, multiple emulsion adjuvant (ME) [29], or adjuvantalone, was injected into the footpad of recipient mice andthe clonal CD4+ T cell response imaged over time(Figure 7).
Quantification of the bioluminescent signal was per-formed for the draining lymph nodes (LNs), non-draining(contralateral) LNs, dorsal injected footpad, as well as
Table 1: Detection Efficiency of T-Lux T cells
Region of Interest (ROI) Mean counts/cell/sec (Stdeva)
Cervical lymph nodes 1.06 (0.14)Mesenteric lymph nodes 1.54 (0.20)Peripheral lymph nodes 2.04 (0.25)Spleenb 0.075 (0.015)
a Stdev, standard deviationb Anterior-posterior (AP) imaging view
Homeostatic Proliferation of T-lux CellsFigure 5Homeostatic Proliferation of T-lux Cells. T-lux CD3+ T cells (1 × 10⁷) were transferred to WT, congenic C57BL/6 (B6) mice (N = 8), denoted 'immunocompetent,' or RAG-deficient (RAG-/-) B6 mice (N = 4), denoted 'lymphopenic.' Whole body bioluminescent imaging was performed at the indicated intervals post-transfer for a total of 24 days, and light emission was determined for both groups. Error bars indicate SEM.
Page 9 of 14(page number not for citation purposes)

BMC Immunology 2009, 10:44 http://www.biomedcentral.com/1471-2172/10/44
whole body and other regions of interest. Strict gating onthe injection site (footpad) was performed to isolate injec-tion site signal from the draining popliteal node signal(Additional File 1). Bioluminescent signal was analyzedover time for each of these sites (Figure 7B). Increased Tcell signal was first demonstrated in the draining lymphnode at day 1 (24 hours after OVA injection). This signalwas greater in the group given 300 μg OVA compared to
100 μg (Figure 7B). Increased signal in the draining lymphnode preceded T cell migration to the injection site by 1–2 days, with increasing signal at the injection site apparenton day 3. This pattern is consistent with previous studiesdemonstrating T cell expansion within the draininglymph node followed by migration and accumulationwithin non-lymphoid tissue sites [20,30,31]. T cell biolu-minescent signal in both these regions, as well as whole
Half-Life and Signal Stability of Transferred T-lux Cells In VivoFigure 6Half-Life and Signal Stability of Transferred T-lux Cells In Vivo. (A) T-lux T cells (3.5 × 10⁶ cells) were adoptively transferred into congenic C57BL/6 (B6) mice (N = 8), and whole body bioluminescent imaging was obtained at the indicated times post-transfer. Control mice were given non-transgenic T cells; a representative day 5 image obtained from control mouse is shown to far right. (B) 3.5 × 10⁶ T cells from CD45.2+ T-lux mice were adoptively transferred into congenic, CD45.1+
B6 mice and tissue-specific light emission quantitated. Light emission was calculated at the indicated times post-transfer for spe-cific regions of interest (ROIs), including peripheral, cervical, and mesenteric (gut) lymph nodes. T-lux T cell numbers from recovered tissues were determined by flow cytometric quantitaton of CD45.2+ cells, and counts/sec per T cell were calculated. T-lux bioluminescent emission (counts/cell) within the indicated regions of interest is plotted over time. Error bars indicate SEM.
Page 10 of 14(page number not for citation purposes)

BMC Immunology 2009, 10:44 http://www.biomedcentral.com/1471-2172/10/44
body, peaked at day 7 and showed similar patterns ofdecreasing signal by day 10–12, although residual signalwas evident in the injection site for several days afterattenuation of signal in the draining LN. T cell signal washigher in whole body, draining lymph node, and footpadregions in those mice given 300 μg compared to 100 μgOVA injections (Figure 7B). The non-draining lymphnode showed minimal increase in signal (Figure 7B), butnotably, other distal LNs demonstrated significant signalincrease at the peak of the response (eg, cervical andmesenteric LNs, day 7). T cell migration to non-lymphoidtissues was largely restricted to the injection site, withminimal apparent trafficking to other tissue sites (Figure7A). Notably, the T cell signal was substantially higher inthe injection site than in the draining LNs at the respectivepeaks of signal intensity, suggesting that T cells activatedin the draining LNs rapidly trafficked to the site of anti-gen/adjuvant injection and accumulated there beforedeclining in number. Given that the large majority of thetotal body signal was accounted for in the draining LNsand injection site, the rapid decrement in signal after day7 indicates cell loss, rather than redistribution to other tis-sue sites. Thus, following the contraction phase, T cell bio-luminescent signal diminished to levels comparable tothat of the pre-injection levels (day -1) and those of sham(adjuvant only) injected mice.
DiscussionT cells undergo a complex pattern of clonal proliferationand expansion following primary and secondary anti-genic challenges [32-35]. Using luciferase-expressing OT-II T cells, we were able to monitor antigen-specific CD4+ Tcell dynamics serially in the same animal. In accord withprevious reports, our results demonstrated initial expan-sion within the draining lymph node followed rapidly bymigration and accumulation within a footpad injectionsite [20,30]. Notably, and in agreement with a previousstudy [30], we find that overwhelmingly the T cells thatleave the lymph node draining the site of antigen injec-tion migrate to the antigen injection site, although someenhanced accumulation of cells in other secondary lym-phoid tissues is evident. Despite early increases in T cellsnumbers in the draining lymph nodes, T cell numberswithin both the draining lymph node and the injectionsite demonstrated a peak 7 days after injection, followedby a rapid decline in signal intensity both in the draininglymph nodes and injection site that was only marginallydelayed kinetically in the latter. The concordance of thepeak of T cell expansion in the draining lymph node andinjection site in our study is somewhat different from pre-vious studies, which demonstrated a more prolongedtime course [20] and kinetic delay between peak T cellnumbers in draining lymph node and injection site. Thislikely reflects the more rapid clearance of the antigen-adjuvant depot in our study, as the ME adjuvant is far lessviscous and is more rapidly cleared from tissue sites than
the oil-based emulsions used in previous studies (unpub-lished observations). This highlights the importance ofsustained antigen in the injection site to prolong recruit-ment and/or survival of immigrating T cells attracted tothe site of antigen delivery [30].
In the current study, there was no detectable redistribu-tion of CD4 T cell signal to non-lymphoid tissues follow-ing clonal contraction in the draining LNs and injectionsite, which is in contrast to previous studies wherein anti-gen and adjuvant were delivered systemically, or in stud-ies of the CD8 response to viral infection. Again, thislikely reflects differences in the distribution and kineticsof antigen clearance in the different studies. This may alsoreflect characteristics of the OT-II TCR transgenic model,clonotypic T cells from which have a relatively low avidityfor the MHC-OVAp complex that may allow endogenousclones reactive to OVA peptide to out-compete the OT-IIresponse over time. Future studies, following crosses ofthe T-lux reporter transgene with other TCR transgenicspecificities should help address this. In any case, giventhe relative technical ease with which T cell clonal dynam-ics can be monitored using the T-lux model, efforts toimplement these types of single animal longitudinal stud-ies represents a significant advance for conducting studiesof adjuvant type and delivery for future studies, withattendant advantages for optimizing future vaccine thera-pies for infectious agents and cancer.
Homeostatic proliferation of mature T cells occurs withinthe lymphopenic host and has been shown to be associ-ated with a concomitant shift toward memory phenotypes(reviewed in [36]). T cell expansion in this setting hasbeen shown to be due to IL-7 [23,24] and IL-15/IL-2-dependent mechanisms [37]. IL-15, in particular, hasbeen demonstrated to induce a memory phenotype inCD8+ T cells that is associated with an alteration of cellhoming receptors [38,39]. It is not surprising; therefore,that we observed T cell expansion and localization of T-lux cells within non-lymphoid tissues following transferinto the RAG-deficient mice. Localization within non-lymphoid tissues as well as the activation profile of thesecells has important implications in immune reconstitu-tion following infection and bone marrow transplanta-tion, and implementation of the T-lux model for efficientcharacterization of this process is demonstrated herein.
Bioluminescent imaging technology provides a mecha-nism to observe T cell homing and specific CD4+ T cellimmune responses in vivo, in real-time in individual ani-mals. This technique eliminates the need for large groupsof mice terminated at varying time points, reducing ani-mal usage and cost. In addition, this provides a method toefficiently observe and quantitate T cell responses in alltissue sites simultaneously, providing a window on T cellresponse dynamics not easily achieved using approaches
Page 11 of 14(page number not for citation purposes)
BMC Immunology 2009, 10:44 http://www.biomedcentral.com/1471-2172/10/44
Page 12 of 14(page number not for citation purposes)
Clonal T cell Response to Antigen in vivoFigure 7Clonal T cell Response to Antigen in vivo. Naïve CD4+ T cells were isolated from OT-II.T-lux transgenic mice (5 × 10⁶) and transferred into congenic, WT B6 mice on day -2. Following baseline bioluminescent imaging on day -1, mice were given footpad injections of 100 μg or 300 μg of OVA peptide in ME adjuvant (red arrows; day 0). Control mice were given sham footpad injections containing adjuvant only (indicated as 0 μg OVA). Bioluminescence imaging was performed on all mice at the indicated time points. Representative images are shown for mice receiving 300 μg OVA peptide (A). The time of acquisition is shown above individual images ("d" indicates days). Bioluminescence emission (counts/sec) was quantified for all OVA doses and analyzed over time for various regions of interest. Shown in (B) are draining inguinal lymph node, non-draining inguinal lymph node, footpad injection site, and whole body. Error bars indicate SEM.

BMC Immunology 2009, 10:44 http://www.biomedcentral.com/1471-2172/10/44
that require tissue disruption for localization and quanti-tation of T cells. Also, given the lack of alloreactivity of theluciferase reporter molecule in the C57BL/6 strain, the T-lux mouse provides an excellent method for long-termimmune studies following adoptive transfer. We havemonitored T-lux T cell survival up to 75 days followingadoptive transfer and found no evidence of immune clear-ance in re-transfer studies (Figure 6C, and data notshown). Previous studies in rats have demonstrated theabsence of immunogenicity of firefly luciferase usingtransgenic tissue allografts [40]. In contrast, studies usinggreen fluorescence protein (GFP), another biolumines-cent tracking molecule, have demonstrated an immuneresponse to the molecule and decreased lifespan for GFP-expressing cells [41]. Thus, the T-lux mouse is ideal formodel systems investigating long-term immune recogni-tion, such as mouse bone marrow transplant models.Other groups have utilized luciferase expression for anal-ysis of lymphocyte homing following adoptive transfer [1-4]. These authors have utilized bioluminescence to per-form elegant studies on the role of regulatory T cells ingraft versus host disease [7,8]. We feel that our T-Luxmodel improves on previous luciferase models throughthe generation of T-cell-specific bioluminescence. Limit-ing luciferase expressing to the T cell compartment ena-bles the specific study of T cell dynamics within the intactmouse and eliminates potential confounding factors,such as an alteration of the normal TCR clonal precursorfrequency that can affect T cell dynamics in adoptive trans-fer studies [26].
A current limitation of the T-lux model is the attenuationof bioluminescent signal from T cells in deeper tissues.This is due to light absorption by superficial tissues situ-ated between the T cell source and the detector whenimaging cells within deeper organs. Decreased or attenu-ated luciferase signal is particularly apparent in the case ofinterference within blood rich organs, such as spleen, ashemoglobin absorbs light in the wavelength emitted bythe luciferase enzyme [42]. However, this limitation onlyaffects absolute quantitation of T cells within deep tissues,while relative quantitation and dynamic changes overtime are unaffected, as demonstrated herein. Further, theorientation of the animal can offset much of this limita-tion, depending on the tissue of interest (e.g., spleen).Finally, recent advances in the development of tomo-graphic luminescent imaging instruments that can gener-ate 3D images promise to enhance both sensitivity andspatial resolution of the T cell signal using this model, andshould permit finer mapping of the real-time dynamics ofT cell distribution to all tissue sites in future studies.
ConclusionWe have characterized a novel transgenic mouse modelthat utilizes T-cell specific luciferase bioluminescence fortracking T cell homing and migration dynamics in vivo. To
our knowledge, this represents the first report of real-time,in vivo analysis of CD4+ T cell homeostatic proliferationand clonal response to antigen. Although our results arelargely confirmatory of prior studies that have examined Tcell responses through direct tissue-based analyses of Tcell numbers and distribution, implementation of the T-lux model has provided some important new insights,and highlights certain advantages of this approach fortracking the in vivo T cell response.
AbbreviationsCCD: charge-coupled device; T-Lux: T cell-specific luci-ferase transgenic mouse; hCD2: human CD2; LN: lymphnode; ROI: region of interest.
Competing interestsThe authors declare that they have no competing interests.
Authors' contributionsThe authors contributed to the work as following: JC ana-lyzed data and wrote manuscript; KD performed research;TC contributed design and analytical expertise; KZdesigned research and contributed to the preparation ofthe manuscript; and CW designed research, analyzed dataand wrote manuscript. All authors read and approved thefinal version of the manuscript.
Additional material
AcknowledgementsThis work was supported by grants from the National Institutes of Health (AI035783 to C.T.W., 5P30CA013148 to K.R.Z.) and Children's Center for Research and Innovation of the Alabama Children's Hospital Foundation (to J.H.C.).
The authors thank I.N. Crispe and members of the Weaver lab for helpful discussions, and acknowledge James Oliver, Michael Blake, Karen Janowski and Henrietta Turner for technical assistance. We also acknowledge the UAB Transgenic Facility for embryo injections, the UAB Digestive Diseases Research Developmental Center (DDRDC) for generation and phenotyp-ing of transgenic mice and the UAB Epitope Recognition and Immunorea-gent Core Facility for antibody preparations.
References1. Hardy J, Edinger M, Bachmann MH, Negrin RS, Fathman CG, Contag
CH: Bioluminescence imaging of lymphocyte trafficking invivo. Exp Hematol 2001, 29:1353-60.
Additional file 1Early time point Region of Interest (ROI) gating for bioluminescent imaging. The additional figure contains a detailed gating strategy for quantification of bioluminescent signal arising from specific anatomical sites.Click here for file[http://www.biomedcentral.com/content/supplementary/1471-2172-10-44-S1.pdf]
Page 13 of 14(page number not for citation purposes)

BMC Immunology 2009, 10:44 http://www.biomedcentral.com/1471-2172/10/44
2. Edinger M, Cao YA, Hornig YS, Jenkins DE, Verneris MR, BachmannMH, Negrin RS, Contag CH: Advancing animal models of neo-plasia through in vivo bioluminescence imaging. Eur J Cancer2002, 38:2128-36.
3. Contag CH, Contag PR, Mullins JI, Spilman SD, Stevenson DK,Benaron DA: Photonic detection of bacterial pathogens in liv-ing hosts. Mol Microbiol 1995, 18:593-603.
4. Edinger M, Sweeney TJ, Tucker AA, Olomu AB, Negrin RS, ContagCH: Noninvasive assessment of tumor cell proliferation inanimal models. Neoplasia 1999, 1:303-10.
5. Luker GD, Bardill JP, Prior JL, Pica CM, Piwnica-Worms D, Leib DA:Noninvasive bioluminescence imaging of herpes simplexvirus type 1 infection and therapy in living mice. J Virol 2002,76:12149-61.
6. Min JJ, Ahn Y, Moon S, Kim YS, Park JE, Kim SM, Le UN, Wu JC, JooSY, Hong MH, et al.: In vivo bioluminescence imaging of cordblood derived mesenchymal stem cell transplantation intorat myocardium. Ann Nucl Med 2006, 20:165-70.
7. Nguyen VH, Zeiser R, Dasilva DL, Chang DS, Beilhack A, Contag CH,Negrin RS: In vivo dynamics of regulatory T-cell traffickingand survival predict effective strategies to control graft-ver-sus-host disease following allogeneic transplantation. Blood2007, 109:2649-56.
8. Zeiser R, Nguyen VH, Hou JZ, Beilhack A, Zambricki E, Buess M,Contag CH, Negrin RS: Early CD30 signaling is critical for adop-tively transferred CD4+CD25+ regulatory T cells in preven-tion of acute graft-versus-host disease. Blood 2007,109:2225-33.
9. Azadniv M, Dugger K, Bowers WJ, Weaver C, Crispe IN: ImagingCD8+ T cell dynamics in vivo using a transgenic luciferasereporter. Int Immunol 2007, 19:1165-73.
10. Zhumabekov T, Corbella P, Tolaini M, Kioussis D: Improved ver-sion of a human CD2 minigene based vector for T cell-spe-cific expression in transgenic mice. J Immunol Methods 1995,185:133-40.
11. Greaves DR, Wilson FD, Lang G, Kioussis D: Human CD2 3'-flank-ing sequences confer high-level, T cell-specific, position-inde-pendent gene expression in transgenic mice. Cell 1989,56:979-86.
12. Lake RA, Wotton D, Owen MJ: A 3' transcriptional enhancerregulates tissue-specific expression of the human CD2 gene.Embo J 1990, 9:3129-36.
13. Bargatze RF, Jutila MA, Butcher EC: Distinct roles of L-selectinand integrins alpha 4 beta 7 and LFA-1 in lymphocyte hom-ing to Peyer's patch-HEV in situ: the multistep model con-firmed and refined. Immunity 1995, 3:99-108.
14. Gunn MD, Tangemann K, Tam C, Cyster JG, Rosen SD, Williams LT:A chemokine expressed in lymphoid high endothelialvenules promotes the adhesion and chemotaxis of naive Tlymphocytes. Proc Natl Acad Sci USA 1998, 95:258-63.
15. Reinhardt RL, Khoruts A, Merica R, Zell T, Jenkins MK: Visualizingthe generation of memory CD4 T cells in the whole body.Nature 2001, 410:101-5.
16. von Andrian UH, Mackay CR: T-cell function and migration.Two sides of the same coin. N Engl J Med 2000, 343:1020-34.
17. Imai Y, Singer MS, Fennie C, Lasky LA, Rosen SD: Identification ofa carbohydrate-based endothelial ligand for a lymphocytehoming receptor. J Cell Biol 1991, 113:1213-21.
18. Sallusto F, Lenig D, Forster R, Lipp M, Lanzavecchia A: Two subsetsof memory T lymphocytes with distinct homing potentialsand effector functions. Nature 1999, 401:708-12.
19. Matloubian M, Lo CG, Cinamon G, Lesneski MJ, Xu Y, Brinkmann V,Allende ML, Proia RL, Cyster JG: Lymphocyte egress from thy-mus and peripheral lymphoid organs is dependent on S1Preceptor 1. Nature 2004, 427:355-60.
20. Catron DM, Rusch LK, Hataye J, Itano AA, Jenkins MK: CD4+ T cellsthat enter the draining lymph nodes after antigen injectionparticipate in the primary response and become central-memory cells. J Exp Med 2006, 203:1045-54.
21. Ford WL, Gowans JL: The traffic of lymphocytes. Semin Hematol1969, 6:67-83.
22. Mackall CL, Bare CV, Granger LA, Sharrow SO, Titus JA, Gress RE:Thymic-independent T cell regeneration occurs via antigen-driven expansion of peripheral T cells resulting in a reper-toire that is limited in diversity and prone to skewing. J Immu-nol 1996, 156:4609-16.
23. Schluns KS, Kieper WC, Jameson SC, Lefrancois L: Interleukin-7mediates the homeostasis of naive and memory CD8 T cellsin vivo. Nat Immunol 2000, 1:426-32.
24. Tan JT, Dudl E, LeRoy E, Murray R, Sprent J, Weinberg KI, Surh CD:IL-7 is critical for homeostatic proliferation and survival ofnaive T cells. Proc Natl Acad Sci USA 2001, 98:8732-7.
25. Moon JJ, Chu HH, Pepper M, McSorley SJ, Jameson SC, Kedl RM,Jenkins MK: Naive CD4(+) T cell frequency varies for differentepitopes and predicts repertoire diversity and responsemagnitude. Immunity 2007, 27:203-13.
26. Hataye J, Moon JJ, Khoruts A, Reilly C, Jenkins MK: Naive andmemory CD4+ T cell survival controlled by clonal abun-dance. Science 2006, 312:114-6.
27. Kearney ER, Pape KA, Loh DY, Jenkins MK: Visualization of pep-tide-specific T cell immunity and peripheral tolerance induc-tion in vivo. Immunity 1994, 1:327-39.
28. Barnden MJ, Allison J, Heath WR, Carbone FR: Defective TCRexpression in transgenic mice constructed using cDNA-based alpha- and beta-chain genes under the control of het-erologous regulatory elements. Immunol Cell Biol 1998, 76:34-40.
29. Elson CO, Tomasi M, Dertzbaugh MT, Thaggard G, Hunter R,Weaver C: Oral-antigen delivery by way of a multiple emul-sion system enhances oral tolerance. Ann N Y Acad Sci 1996,778:156-62.
30. Reinhardt RL, Bullard DC, Weaver CT, Jenkins MK: Preferentialaccumulation of antigen-specific effector CD4 T cells at anantigen injection site involves CD62E-dependent migrationbut not local proliferation. J Exp Med 2003, 197:751-62.
31. Ledgerwood LG, Lal G, Zhang N, Garin A, Esses SJ, Ginhoux F, MeradM, Peche H, Lira SA, Ding Y, et al.: The sphingosine 1-phosphatereceptor 1 causes tissue retention by inhibiting the entry ofperipheral tissue T lymphocytes into afferent lymphatics.Nat Immunol 2008, 9:42-53.
32. Butz EA, Bevan MJ: Massive expansion of antigen-specific CD8+T cells during an acute virus infection. Immunity 1998, 8:167-75.
33. Kedl RM, Mescher MF: Qualitative differences between naiveand memory T cells make a major contribution to the morerapid and efficient memory CD8+ T cell response. J Immunol1998, 161:674-83.
34. Merica R, Khoruts A, Pape KA, Reinhardt RL, Jenkins MK: Antigen-experienced CD4 T cells display a reduced capacity forclonal expansion in vivo that is imposed by factors present inthe immune host. J Immunol 2000, 164:4551-7.
35. Busch DH, Pilip IM, Vijh S, Pamer EG: Coordinate regulation ofcomplex T cell populations responding to bacterial infection.Immunity 1998, 8:353-62.
36. Williams KM, Hakim FT, Gress RE: T cell immune reconstitutionfollowing lymphodepletion. Semin Immunol 2007, 19:318-30.
37. Cho JH, Boyman O, Kim HO, Hahm B, Rubinstein MP, Ramsey C, KimDM, Surh CD, Sprent J: An intense form of homeostatic prolif-eration of naive CD8+ cells driven by IL-2. J Exp Med 2007,204:1787-801.
38. Schluns KS, Williams K, Ma A, Zheng XX, Lefrancois L: Cuttingedge: requirement for IL-15 in the generation of primary andmemory antigen-specific CD8 T cells. J Immunol 2002,168:4827-31.
39. Lodolce JP, Boone DL, Chai S, Swain RE, Dassopoulos T, Trettin S, MaA: IL-15 receptor maintains lymphoid homeostasis by sup-porting lymphocyte homing and proliferation. Immunity 1998,9:669-76.
40. Hakamata Y, Murakami T, Kobayashi E: "Firefly rats" as an organ/cellular source for long-term in vivo bioluminescent imaging.Transplantation 2006, 81:1179-84.
41. Bubnic SJ, Nagy A, Keating A: Donor hematopoietic cells fromtransgenic mice that express GFP are immunogenic inimmunocompetent recipients. Hematology 2005, 10:289-95.
42. Carlsen H, Moskaug JO, Fromm SH, Blomhoff R: In vivo imaging ofNF-kappa B activity. J Immunol 2002, 168:1441-6.
Page 14 of 14(page number not for citation purposes)


