Embed Size (px)
Citation preview
Anselmetti, F.S., Isern, A.R., Blum, P., and Betzler, C. (Eds.)Proceedings of the Ocean Drilling Program, Scientific Results Volume 194
BIOSEDIMENTARY AND PALEOENVIRONMENTAL EVOLUTION OF THE SOUTHERN MARION PLATFORM FROM THE MIDDLE TO LATE MIOCENE (NORTHEAST AUSTRALIA, ODP LEG 194, SITES 1196 AND 1199)1
Gilles A.R. Conesa, 2 Eric Favre,3 Philippe Münch,2 Hélène Dalmasso,2 and Christian Chaix4
ABSTRACT
The Southern Marion Plateau (SMP) represents a vertical stacking ofMiocene carbonate platform deposits. Two sites (1196 and 1199) weredrilled on top of this plateau, penetrating a 663-m carbonate succes-sion of bioclastic and reefal sedimentary bodies. The study focuses onthe least dolomitized 410-m-thick upper part of the succession, whichis middle to late Miocene in age. Sedimentological and paleontologicalstudies were conducted at both sites in order to propose a paleoenvi-ronmental model and its evolution through the Miocene age. Six mainmicrofacies of possible environmental significance were defined usingstatistical multivariate analyses, based on the recognition and pointcounting of 24 biogenic components. Depositional environment re-constructions are proposed as well as the biosedimentary and the envi-ronmental evolution regarding seismic architectures, stratigraphy,biosedimentology, and microfacies analysis. The SMP platform mainlyresults from a vertical stacking of lens-shaped bodies in homoclinal todistally steepened ramp settings.
1Conesa, G.A.R., Favre, E., Münch, P., Dalmasso, H., and Chaix, C., 2005. Biosedimentary and paleoenvironmental evolution of the Southern Marion Platform from the middle to late Miocene (northeast Australia, ODP Leg 194, Sites 1196 and 1199). In Anselmetti, F.S., Isern, A.R., Blum, P., and Betzler, C. (Eds.), Proc. ODP, Sci. Results, 194, 1–38 [Online]. Available from World Wide Web: <http://www-odp.tamu.edu/publications/194_SR/VOLUME/CHAPTERS/005.PDF>. [Cited YYYY-MM-DD]2Université Aix-Marseille I, Centre de Sédimentologie-Paléontologie, Case 67, 3 place Victor Hugo, 13331 Marseille Cedex, France.Correspondence author: [email protected]é de Lyon I, UMR 5125 PEPS–CNRS, Bâtiment GEODE, 2 rue Raphael Dubois, 69622 Villeurbanne Cedex, France.4Museum d’Histoire Naturelle de Paris, Département Histoire de la Terre, Bâtiment de Paléontologie, CP 38, 8 rue Buffon, 75005 Paris, France.
Initial receipt: 7 July 2003Acceptance: 7 December 2004Web publication: 3 June 2005Ms 194SR-005

CONESA ET AL.BIOSEDIMENTARY AND PALEOENVIRONMENTAL EVOLUTION OF THE SMP 2
INTRODUCTION
The facies and paleoenvironmental evolution of Miocene carbonateplatforms from northeast Australia were mostly known through scat-tered exploration wells (see synthesis of Davies et al., 1989) and OceanDrilling Program (ODP) Leg 133 drilling of the Queensland and NorthMarion Plateaus (Davies, McKenzie, Palmer-Julson, et al., 1991; Betzlerand Chapronière, 1993; Brachert et al., 1993; Chapronière and Betzler,1993; Isern et al., 1993; Martín and Braga, 1993; Martín et al., 1993;McKenzie and Davies, 1993; Betzler et al., 1993, 1995; Betzler, 1997).ODP Leg 194 drilling operations were performed on two new carbonateplatforms located north and south of the Marion Plateau (Fig. F1).Some of the objectives were to achieve a better understanding of car-bonate platform development in the region with respect to climate, sealevel fluctuations, and paleoceanography and to calculate the second-order magnitude of the late middle Miocene (N12–N14) sea level fall(Shipboard Scientific Party, 2002a, 2002b).
The Southern Marion Platform (SMP) is an isolated platform of theMarion Plateau, which is a deeper extension of the Australian continen-tal margin (Davies et al., 1989) (Fig. F2). Before Leg 194, the SMP wasmainly known through seismic analyses. It was considered late Mi-ocene in age and nucleated on the slope sediments of the NorthernMarion Platform after the late middle Miocene sea level fall (Pigram etal., 1992; Pigram, 1993; Liu et al., 1998). The Shipboard Scientific Party(2002a, 2002b) provided new detailed information about the SMP.Through several seismic transects (Fig. F1), they found evidence of anasymmetrical pattern for the SMP architecture with an escarpment-likemargin on the northwestern side and a thick package of prograding cli-noforms on the southeastern margin (Fig. F2). During Leg 194 drilling,hemipelagic and periplatform deposits on both margins were recoveredfrom Sites 1197 and 1198 (~665 m thick and ~515 m thick, respec-tively), whereas a ~660-m-thick succession of shallow-water carbonateson top of the platform (Figs. F1, F2, F3) was penetrated at Sites 1196and 1199. Underlying acoustic basement was reached and consists of ei-ther highly altered basalts (Sites 1197 and 1198) or phosphate-richsands (Site 1196). The whole deposits were addressed to the seismic re-gional megasequences (A–D) of Pigram (1993), separated by sequenceboundaries (Fig. F2). Megasequences B and C, both Miocene in age,contain the SMP (Fig. F2). In the Marion Plateau, the Megasequence B/C and C/D boundaries were further dated through seismic correlationto ~11.0 Ma and ~7.2 Ma, respectively (Shipboard Scientific Party,2002a). The platform deposits were subdivided into four lithostrati-graphic units at Sites 1196 and 1199. Site 1196 is situated 20 km east ofthe Great Barrier Reef at 304.2 meters below sea level (mbsl) and Site1199 is situated 5 km northeast of Site 1196 at 315.9 mbsl (Fig. F1).Both sites were dated from early Miocene to Pliocene based on the de-termination of large benthic foraminifers, planktonic foraminifers, andcalcareous nannofossils. The substrate was defined as a fifth lithostrati-graphic unit, most likely latest Oligocene in age. At least three phases ofgrowth, exposure, and dolomitization were recognized within the plat-form and partly correlated to the megasequences of Pigram (1993) (Fig.F3). The oldest phase is mostly early Miocene in age and is representedby a ~250-m-thick succession of dolostones with rhodoliths and coralspreserved as ghosts (Units III–IV). The two youngest phases are early(?)to middle Miocene and most likely late Miocene in age, respectively,
100
Barrier
Great
Reef
Coral Sea Basin
Coral Sea Basin
Townsville
Queensland
Trough
Marion Cato Trough
Plateau1194
824
209
811-825
812-814
822
823
817 818815
816
819- 821
1193 1195
1198 1199
1196 1197
1192
200
100
100
100
500
1000 1500
2000
2000
Sydney
N
N
Australia
Trough
151°E 152° 153° 154°
21°
20°S
22°
MAR07MAR20
MAR04
Site 1199Site 1196
MAR70
20°
15°S
QueenslandPlateau
2000
50 km
145°E 155°150°
Cairns
Townsville
Northern
Marion
Platform
Southern
Marion
Platform
F1. Location of Leg 194 and Leg 133 sites, p. 24.
Basement
Site 1196Site 1199(projected)
304.2 mbsl315.9 mbslDepth:
MS
B M
S D
MS
C
MS
B M
S D
MS
C
Line MAR07
Tw
o-w
ay tr
avel
time
(s) IC
ID
IIIA
IIIBIIICIIID
IVV
ID
IA IA
IIA IIA
IIB
III
IB
IIB
IB
IC
Velocity pull upMultiples
10 km
Southern Marion PlatformPeriplatform-hemipelagic deposits
Periplatform-hemipelagic deposits
SENW
1.0
0.6
0.4
0.8
F2. Seismic transect of the SMP, p. 25.
NW
IIA ID
IA-IC
IIB
IIIIV
SE
Basement
Site 1196Site 1199
304.2 mbsl315.9 mbslDepth: 5 km
Southern Marion Platform
Platform growth phases
Reef rim Periplatform-hemipelagic deposits
Periplatform-hemipelagic deposits
MS D
MS C
MS B
MS D
MS C
MS B
Regional seismic megasequencesof Pigram (1993): MS B to MS D
Lithologic units and subunitsof the platform: I to IV
(1) early Miocene dolomitic Platform
(2) (early?) middle Miocene Platform
(3) middle to late Miocene Platform
F3. Lithostratigraphy and architec-ture of the SMP, p. 26.
CONESA ET AL.BIOSEDIMENTARY AND PALEOENVIRONMENTAL EVOLUTION OF THE SMP 3
and consist of ~410-m-thick interbedded rhodalgal, coral, and porcella-neous foraminiferal (dolomitic) limestones (Units I–II). During the lasttwo phases, the SMP was interpreted as asymmetrical with a flat-topped, reef-rimmed western margin and an eastern margin evolvingfrom a distally steepened to a more homoclinal ramp (Shipboard Scien-tific Party, 2002a) (Figs. F2, F3) The lithologic boundary between thelast two phases was ascribed to a surface exposure observed at the top ofSubunit ID at Sites 1196 and 1199 (Fig. F3). A low-amplitude, low-frequency reflection at ~110–130 meters below seafloor (mbsf) under-neath the top of the SMP was considered the corresponding seismicboundary. The reflection was correlated to the Megasequence B/C seis-mic boundary and partly related to the late middle Miocene (N12–N14)sea level fall (Fig. F2). The top of the platform is marked both by an ex-posure surface and by an overlying hardground surface a few centime-ters thick. The hardground surface is represented by planktonicwackestone deposits and infillings dated to Pliocene with a maximumage of 3.2 Ma and by laminated ferromanganese crust (Shipboard Scien-tific Party 2002a, 2002b). It is assumed that the end of the youngestplatform growth phase coincides with the Megasequence C/D seismicboundary and the drowning of the SMP (Fig. F3).
Our study focuses on the two youngest platform growth phases ofthe SMP and concerns the 410-m-thick upper part of the platformdrilled at Sites 1196 (Holes 1196A and 1196B) and 1199. This part of theplatform is the least dolomitized of the whole succession and is middle(early?) to late Miocene in age (Shipboard Scientific Party, 2002a). Theaim of this study is
1. To define and describe microfacies of environmental signifi-cance through statistical multivariate analysis of biogenic com-ponents,
2. To determine and visualize the depositional environments withrespect to the SMP’s geometry and biosedimentology, and
3. To establish a link between the microfacies and environmentalevolution of the platform and sea level fluctuations.
METHODOLOGY
Biosedimentological data from the studied platform succession wereexamined from the cores of both Holes 1196A and 1199A, using the on-board visual core descriptions (Shipboard Scientific Party, 2002b). Mi-crofacies analysis with additional multivariate analysis of bioclasts wasconducted on 84 thin sections originating from Holes 1196A, 1196B,and 1199A. A total of 24 categories of bioclasts were examined, includ-ing invertebrates, coralline algae, and foraminifers. Conventions fromColeman (1963), Adams (1968), Loeblich and Tappan (1988), Betzlerand Chapronière (1993), Chapronière and Betzler (1993), and Boudag-her-Fadel et al. (2000a, 2000b) were used for large benthic foraminiferdetermination, generally at a generic scale. Coral taxa and their ecolog-ical significance were determined following conventions from Beauvaiset al., (1993), Boichart et al., (1985), Cahuzac and Chaix (1996), Chaixet al., (1986), Ditlev (1980), Vaughan and Wells (1943), Veron (2000),and Wells (1956). The coral assemblages are shown in Table T1. ADE-4statistical programs from the University of Lyon I were used to analyzethe data. A total of 59 thin sections with sufficient bioclasts were point-counted with at least 300 counts using a conventional grain solid tech-
T1. Coral taxa with ecological sig-nificance, Sites 1196 and 1199, p. 36.

CONESA ET AL.BIOSEDIMENTARY AND PALEOENVIRONMENTAL EVOLUTION OF THE SMP 4
nique. The quantitative values were entered into a contingency datamatrix with thin sections in rows and categories of bioclasts in col-umns. These values were transformed to percentages and then rankedin value ranging from 0 to 9, using the logarithmic formula
log2(3X + 1),
where X = percentage. The transformation reduces large discrepanciesbetween quantitative values. It allows multivariate analysis to take vari-ables into account that have low values but possible high environmentalsignificance (see Sokal and Rohlf, 2003, for more details). The obtainedencoded data matrix was treated by ascendant cluster analysis (ACA) andby correspondence factor analysis (CFA).
The ACA permits ordering thin sections within groups of both in-creasing hierarchy and decreasing correlation, according to biologicalvariables. Relationships between thin sections and groups are evaluatedon a dendrogram. These groups are believed to represent microfacies.This microfacies matrix is obtained from the percentage matrix by rear-rangement of rows, according to ACA ordination. The microfacies andthe percentage of the biological variables are shown with lithostrati-graphic units in Figure F4.
The CFA simultaneously computes correlations within and betweenthin sections and variables. It represents, within a multidimensionalspace of N factorial axis, the structure of data as two clouds of N + 1variable points and M thin section points, respectively (M > N). The CFAruns an ordination of axes from 1 to N, according to the decrease ofvariance or inertia of both clouds. Complex relationships between thinsections and/or variables and their distribution were examined on fac-torial planes defined by the first axes, which collect most of the vari-ance. Each variable and each thin section provide an absolutecontribution (AC, part of variance) and a relative contribution (RC =10,000 × r2, where r = coefficient of correlation) to each axis. Only dis-criminative variables (AC > 10,000/N+1 and RC > 2500, i.e., |r| > 0.5)were examined (see Benzécri et al., 1980, and Etter, 1999, for more de-tails). The variables are given in Table T2.
The application of both ACA and CFA on the same encoded matrixallows the definition of microfacies that possibly contain specific envi-ronmental significance. Moreover, the application of both ACA andCFA allows us to define and explain the interrelationships between themicrofacies regarding environmental trends (i.e., Cugny and Rey, 1981;Hennebert and Lees, 1991; Nebelsick, 1992). The statistical results arethen used to develop three-dimensional depositional reconstructionsthat take into account information about seismic profiles, lithostratig-raphy, biosedimentology, and microfacies analysis.
AGE AND LITHOSTRATIGRAPHY
In the studied vertical succession of the SMP, the same lithostrati-graphic Units I (Subunits IA–ID) and II (Subunits IIA and IIB) were rec-ognized at both Sites 1196 and 1199 by the Shipboard Scientific Party(2002a, 2002b) as well as Subunit IIIA at Site 1196 (Fig. F5). The total re-covery at Site 1196 shows low percentages (Hole 1196A: Unit I = 13%,Unit 2 = 6.3%, Subunit IIIA = 1.5%; Hole 1196B: Unit I = 15.4%, Unit II= 4.5%) At Site 1199, the percentages are higher in Unit I (52.3%) andon the same order in Unit II (3.3%) with no recovery in Cores 194-
Small benthic foraminifers Larger benthic foraminifers
Aggl.
Ope
rcul
ina
Ope
rcul
inel
la
Cyc
locl
ypeu
s
UnitHole, core, section, interval
(cm)Dendogram (cluster analysis)
194- Decreasing correlationIA 1199A-13R-3, 115-119 6 6 4 1 5 9 2 4IB 1196B-17Z-1 , 54-57 78.5 19.5 1 1IIB 1199A-39R-1, 56-60 8 1 1 5 1 3
1199A-9R-4, 12-16 7 6 2 0 41199A-1R-1, 32-34 99.3 0.71199A-1R-1, 3-6 93.5 5.4 0.4 0.7
ID 1199A-17R-1, 23-26 8 0 2 1 8IIB 1199A-35R-1, 13-17 7 2 2 8
1199A-18R-3, 21-26 8 6 1 41196A-18R-3, 75-78 8 6 1 41199A-14R-1, 137-142 93.7 6.31196A-14R-1, 42-46 9 3 71199A-12R-5, 93-95 8 8 4 81199A-11R-1, 16-20 87.9 7.8 0.5 1.2 1.2 1.4
IIA 1196A-33R-1, 48-53 26.3 3.7 0.7 40.3 5.7 5.7 1 0.3 2.3 0.7 1 0.4 4.7 4.6 1 1 0.7IA 1199A-5R-2, 127-131 59.4 22.1 5.1 1.1 0.4 2.1 1.1 0.4 7.1 1.4IC 1196A-15R-1, 0-3 17.8 1.6 24.1 30.8 1.3 1.3 1.1 1.3 0.8 0.3 0.6 1.6 12.3 0.8 4.3
1196A-34R-1, 96-99 2.8 26.8 9.5 1.4 4.1 4.1 1.4 1.4 1.4 33.4 4.1 9.41196A-20R-1, 45-47 16.4 7.1 7.1 3.1 6.3 3.1 13.1 7.1 23.1 13.71199A-19R-1, 0-4 13.6 20.3 9.6 4.3 12.3 1 9 8.3 1.6 1 1
ID 1199A-16R-3, 40-44 6 7 2 6 1 2 1 1 3 8IB 1196B-20Z-1, 16-20 82.7 0.3 7.3 6 1 0.7 0.3 1 0.7IIB 1199A-40R-1, 27-31 45.3 1 38.3 5.3 0.7 0.3 1 1 1.3 1.3 1 0.7 0.3 0.7 1.7
1196A-35R-1, 1-5 29.7 7.4 1 6 1 6 3 5.4 0.7 1 2 5 6.7 1 1.4 0.4 1.4 0.4 2.71199A-31R-1, 0-3 62.7 2.3 7 11.7 1.7 3 0.3 0.3 0.3 2.7 0.7 2 0.3 1.3 1 0.7 21196A-32R-1, 11-14 28.3 4.3 23.3 2.3 1.3 16.3 1.2 4.3 1.2 7.3 1.3 1.3 5.3 1.3 1.31196B-46Z-1, 14-17 2 8 0.4 2 4 5.7 0.4 13.4 2.7 0.4 3.3 6.7 5 1 1.7 2.4 1.4 1 2.71196A-25R-1, 50-52 30.3 9.7 3 3 1.3 0.3 7.4 1.7 1 2 5.4 1.4 0.7 0.4 1.7 1.7 0.7 0.4 11196A-27R-1, 7-10 2 0 8.3 0.7 1 6 7.3 1 6.3 1.3 1 7.7 17.7 6.3 1.3 1 2.3 1.71196A-33R-2, 57-60 20.3 10.3 3 9.3 7.7 9 3.7 0.7 1.3 0.3 1 9.7 9 5.7 4.3 0.7 0.7 1 2.31196A-24R-1, 13-17 13.4 2.8 24.1 5.4 1.8 2.4 13.8 2.8 0.4 2.8 10.8 1.8 5.4 4.1 0.8 2.8 0.4 0.4 4.11196B-33Z-1, 3-5 5 6 2 4 3 2 4 1 2 3 4 1
ID 1199A-16R-4, 91-96 7 8 9 1 0 31199A-10R-3, 58-60 40.7 4 1 0.7 2.7 0.3 1 2.3 11.31199A-4R-6, 138-140 64.4 31.7 0.7 0.7 1.4 0.7 0.41196B-14Z-1, 68-73 81.1 3.1 7.4 0.8 0.4 0.8 0.8 5.81196A-13R-2, 38-41 82.3 2.3 2.7 7.3 0.3 51196A-11R-1, 24-28 73.3 4.3 1 3 3 0.7 0.3 0.7 4.71196A-10R-1, 8-12 8 2 3.7 1 1.7 7.7 1 1 21199A-33R-1, 11-13 45.3 2.3 21.3 20.3 2.7 0.7 0.3 0.7 0.7 1 1.7 2.7 0.31199A-34R-1, 28-31 71.3 0.3 14.4 1.3 1.3 0.3 0.7 5 1.3 2.7 1.31199A-39R-1, 91-94 68.7 1.3 0.3 6.7 1 0.7 1 1.7 3 1.3 1 7 6.31199A-40R-1, 9-13 58.7 1.7 0.7 7 4 1 1 0.7 2.7 8 1 1.3 11.7 0.71199A-41R-1, 19-22 32.4 3 6.7 13.7 2 8 3 1.4 1.4 0.7 5.7 2 0.4 1 7.7 7.7 31199A-37R-1, 2-6 49.7 1.3 15.7 5.3 4.3 4 0.3 2 0.3 13.3 2.7 11199A-42R-1, 83-85 54.3 1 1.3 7.7 0.7 4.7 2 6.7 1.7 0.3 2.7 11.7 5.3
IC 1196A-16R-1, 25-27 68.4 8.4 4.1 0.4 1 0.4 1.7 0.4 6 0.7 1 0.4 0.7 2 3.1 1.41199A-2R-3, 20-23 54.8 30.8 4.8 0.8 2.8 1.8 1.8 2.51199A-6R-3, 69-72 63.3 11.7 4 3 16.3 1.71196B-4R-1, 28-30 3 3 0.3 14.3 5 0.7 5 0.7 0.3 0.7 6.3 15.7 1.3 0.3 5.3 3.3 7.71196A-5R-1, 70-72 54.4 12.4 5.4 0.4 9.1 13.1 0.4 1.4 0.7 1.1 1.7
ID 1196A-18R-2, 15-18 70.1 3.1 16.4 4.1 1.4 1.1 0.4 1.8 1.41199A-3R-1, 77-81 78.7 0.7 7.7 3 1.3 3.7 0.7 3.3 11196A-7R-1, 106-109 67.4 6.1 1.4 10.8 0.8 0.4 0.8 3.8 5.8 1.1 1.81196A-5R-2, 74-77 47.7 4.7 18.4 1.7 1.4 0.7 4.1 9.1 6.4 4.4 1.41196B-1R-3, 1-6 29.4 29.4 5.1 4.4 1.6 0.8 0.4 0.6 0.8 1.3 1.2 1.1 8.4 1.8 4 1 8.81199A-20R-1, 17-22 20.1 3.1 2.7 18.1 4.1 1.7 1.7 3.1 0.4 0.7 2.1 1.4 11.7 2.1 15.7 4.1 1.7 1.4 1.1 2.7 0.41196A-21R-1, 119-121 2 6 2 3 4.7 1 6 5.3 1.7 2 0.3 3 1.3 3.3 6.7 0.7 6 1 2 2 3 1.7 3.7 2.3 2.3
IA 1196A-1R-1, 35-40 76.4 1.1 0.4 4.1 4.8 0.4 0.8 0.4 0.8 2 3.1 3 2.4 0.8
Gas
trop
ods
B: Corals
Mio
gyps
ina
Alv
eolin
ids
Hya
line
encr
ustin
g fo
ram
.
Am
phis
tegi
na
Lepi
docy
clin
a
Sm
all h
yalin
e fo
ram
.
Ech
inod
erm
s
Biv
alve
s
Rot
aliid
s
Pla
nkto
nic
fora
min
ifers
Mic
rofa
cies
MIO
PLF
A: Porcellaneous foraminifers
C: Miogypsina-Lepidocyclina
D: Halimeda-Nummulitids-Amphistegina
E: Halimeda-Lepidocyclina
OP
A
Algae Invertebrates
Nummulitids
Red
alg
ae
Gen
icul
ate
red
alga
e
Gre
en a
lgae
(H
alim
eda)
Cor
als
Bry
ozoa
ns
Sm
all a
gglu
tinat
ed fo
ram
.
SO
R
HE
F
AM
P
AU
S
ALVBIV
OP
E
GA
S
CY
C
SE
R
BR
Y
SA
F
RO
T
SH
F
MIL
F: Red algae-echinoderms
Mili
olid
s
Aus
trot
rillin
a
Sor
itiid
s
LEP
HyalinePorcellaneousHyaline
IA
Ser
pulid
s
RA
L
GR
A
HA
L
CO
R
EC
H
ID
IB
IA
IIA
IA
IIA
IIA
IA
IIB
IA
F4. Microfacies matrix with bio-clast values and ACA dendrogram, p. 27.
T2. CFA summary, p. 37.
Hole1196A
late
Mio
cene
mid
dle
Mio
cene
(ear
ly?)
-mid
dle
Mio
.
Lith
olog
icun
itLo
ggin
gun
it
AgeHole
1196B
Paleontologicalassemblage
lithology
Depositionalsetting Water
depth
1R2R
3R4R5R
6R
7R8R
9R10R11R12R
1R
IA
IB
IC
ID
IIA
IIB
IIIB
2R
3R4R5R
6R
7R8R9R
10R
11R12R13Z16Z
20Z21Z
24Z26Z
28Z30Z32Z34Z
36Z
38Z
41Z
43Z
46Z48Z
51Z
13R
14R15R
16R
17R18R
19R20R21R
22R23R
24R25R26R
27R28R
29R
30R
31R32R
33R34R
35R
36R37R38R39R
40R
41R42R
43R
44R
-304.2 mbsf
42R400
TextureSize Color
Silt
Rud
ite
San
d
PR
WBY
Pby
LgWP G Ff c R B E DF + -B
OuterPlatform
reefs
Inner
Microfacies
OuterPlatform
Coral Reef
Coral Reef
Outer PF
OuterPlatform
InnerPlatform
(scatteredcoral
patches)
Cor
al r
eef i
nflu
ence
Cor
al r
eef i
nfl.
Cor
al r
eef
influ
ence
Deepening
Deepening
Deepening
Shallowingsequence 3
Shallowingsequence 2
Shallowingsequence 1
C A
Fossils (Hole 1196A; Site 1199):
rhodoliths (big; small: <2 cm)
rhodoliths on coral nucleus
Fossil frequency
LithologyLog information
abundant
branching red algae pieces
rhodoliths with bryozoan
common
bryozoans
serpulids
echinoid fragments
hyaline, larger benthic forms
porcellaneous, small andlarger benthic forminifers
seagrass root?
massiveand lamellar
red algae fragments
gastropods
present
Halimeda plates
bivalves
boundstone
fragments
solitary corals
branching andundetermined
Coral colonies
dolostone
not hatched: limest.
dolomiticlimestone
meters belowseafloor (mbsf)
corerecovery
corenumber
Subunits
boundary(mbsf)
: grayfor 1196B
SampleHolesA B
c
c
c
c
c cc
cc
cc
IIB
IIIA
-117.2
-125.9
-162.8
-182.2
-335.9
-412.7
-345.8
IIBIIB-335.9
-412.7
-130.5
-145
-184.9
-122.9
?
?
?1
2
4
5
6
3
Exposure?
Exp.?
Exposure?
pectinids
?
1
2
3
4
Dep
th (
mbs
f)
0
50
100
150
200
250
300
350
400
A
F5. Biosedimentological data, mi-crofacies, and environment evolu-tion, p. 28.

CONESA ET AL.BIOSEDIMENTARY AND PALEOENVIRONMENTAL EVOLUTION OF THE SMP 5
1199A-22R through 29R (Fig. F5). The Shipboard Scientific Party(2002a, 2002b) correlated the two sites in a schematic diagram repre-senting the lithostratigraphy and the architecture of the SMP (Fig. F3).This lithostratigraphic framework is based on seismic architecture (Fig.F2), facies similarities, biostratigraphy, and some noticeable subunitboundaries interpreted as possible regional surface exposures or hard-grounds (Shipboard Scientific Party 2002a, 2002b). The onboard log-ging stratigraphy proposed a slightly different correlation pattern basedon uranium contents and resistivity of the rocks (Fig. F6). The main dif-ference between the lithostratigraphy and the logging stratigraphy con-cerns the correlation of Subunit IIB between the two sites.
Unit I was dated middle to late Miocene in age by the occurrence ofLepidocyclina spp. and planktonic foraminifers of Pliocene age at the topof the SMP (Shipboard Scientific Party, 2002b). Furthermore, SubunitIIA was dated middle Miocene in age using Flosculinella bontangensis,whereas Subunit IIB was dated early to middle Miocene in age by calcar-eous nannofossils found in the last core of Hole 1196A (Shipboard Sci-entific Party, 2002b). Using the most recent foraminifer biostratigraphyof the Indo-Pacific (Boudagher-Fadel and Banner, 1999; Boudagher-Fadel et al., 2000a, 2000b), we propose to attribute a middle Mioceneage to Subunit IC (Hole 1196A) based on the occurrence of Miogypsinaspp.
Site 1196
The studied vertical succession at Site 1196 comprises seven subunits(Fig. F5).
1. The upper part of Subunit IIIA (345.8–412.7 mbsf, Hole 1196A)consists of a pinkish white to light brown dolomitic limestone.The facies results from both recrystallization and dissolution ofa poorly sorted rudstone-grainstone with massive and branchingcorals, mollusks, and rhodoliths. The lower part of Subunit IIIAis poorly recovered. It contains some intervals of white dolomiticfloatstone with common to rare rhodoliths, red algae and echi-noid fragments, bryozoans, and large hyaline benthic foramini-fers in a grainstone matrix. The lower boundary of Subunit IIIAis defined by the appearance of a brilliant white sucrosic dolo-stone in the underlying Subunit IIIB.
2. Subunit IIB (335.9–345.8 mbsf, Hole 1196A) is a poorly sortedrudstone-boundstone with massive and thick lamellar coral col-onies. Rare mollusks, red algae, and miliolids were observed in amedium to coarse sand-sized packstone-grainstone matrix. Thelower boundary of Subunit IIB is lithologic in nature with dolo-mitization of the rocks.
3. Subunit IIA (182.2–335.9 mbsf, Hole 1196A) is a poorly sortedlight gray to pale brown (yellow) floatstone in a silt-sized grain-stone matrix. The subunit’s predominant components are largeporcellaneous benthic foraminifers (alveolinids and soritids),gastropods, and unbroken bivalves including pectinids, solitarycorals, and bryozoans. Coral fragments of possible secondaryreef frame builders (Table T1) occur especially in the lower partof the subunit. The grainstone matrix contains abraded red algaedebris and small benthic foraminifers (miliolids). Threadlikedark patches up to 1 cm long were observed in the upper part of
Medium resistivity
Deep resistivity
Lith
olog
ic u
nit
Logg
ing
unit
Cor
eR
ecov
ery
0.3 500(Ωm)
0.3 500(Ωm)
Shallow resistivity
Deep resistivity
0.2 200(Ωm)
0.2 200(Ωm)
10R11R
12R
13R
14R
15R
16R
17R
18R
19R
20R
21R
22R
23R
24R
25R
26R
27R
28R
29R
30R
31R
32R
33R
34R
35R
36R
37R
38R
39R
40R
41R
42R
43R
44R
45R
1
2
3
IA
IBIC
ID
IIA
IIB4
III
(ppm)0 12UraniumSite 1199
315.9 mbsf
Site 1196304.2 mbsf
Distance~3 km
(ppm)0 15Uranium
Lith
olog
ic u
nit
Logg
ing
unit
Cor
eR
ecov
ery
IA
IB
IC
ID
IIA
IIBIIIA
IIIB
IIIC
1
2
3
4
?
8R9R
10R
11R
12R
13R
14R
15R
16R
17R
18R
19R
20R
21R
22R
23R
24R
25R
26R
27R
28R
29R
30R
31R
32R
33R
34R
35R
36R
37R
38R
39R
40R
41R
42R
43R
44R
45R
46R
47R
48R
49R
50R
Dep
th (
mbs
f)
Dep
th (
mbs
f)
Limestone Dolomitic limestone Dolostone
100
150
200
250
300
350
400
450
Hole 1196A Hole 1199A
100
150
200
250
300
350
400
F6. Uranium and resistivity log correlation, Holes 1196A and 1199A, p. 30.

CONESA ET AL.BIOSEDIMENTARY AND PALEOENVIRONMENTAL EVOLUTION OF THE SMP 6
the subunit. They were interpreted as preserved sea-grass roots(Shipboard Scientific Party 2002a, 2002b).
4. Subunit ID (162.8–182.2 mbsf, Hole 1196A; 145.0–184.9 mbsf,Hole 1196B) is a pale brown dolomitic floatstone in a grainstonematrix. Biogenic components are elongated fragments of branch-ing red algae, rhodoliths, and large hyaline benthic foraminifers.Lamellar and branching coral fragments, bivalves, and bryozoansare also present. The lower boundary of Subunit ID correspondsto a sharp lithologic change with a thin dolomitic crust in Hole1196B.
5. Subunit IC (125.9–162.8 mbsf, Hole 1196A; 130.5–145.0 mbsf,Hole 1196B) comprises light gray to white floatstone-rudstoneand boundstone with hermatypic corals a few centimeters insize. Subordinate rudite-sized components are similar to those inSubunit ID. They are all included in a fine to medium grainstonematrix. The lower boundary of Subunit IC in Hole 1196A is de-scribed as an iron-stained, 1-cm-thick micritic crust (ShipboardScientific Party, 2002b).
6. Subunit IB (117.2–125.9 mbsf, Hole 1196A; 122.9–130.5 mbsf,Hole 1196B) is a pale brown dolomitized floatstone-rudstonewith predominantly elongated fragments of branching red algaein a recrystallized grainstone matrix. Subordinate rudite-sizedcomponents are molds of large hyaline benthic foraminifers,mollusks, and bryozoans. The lower boundary of Subunit IB con-sists of a sharp lithologic change.
7. Subunit IA (0–117.2 mbsf, Hole 1196A; 0–122.9 mbsf, Hole1196B) is a white to pale brown (or yellow) dolomitic floatstone-rudstone with abundant rhodoliths as large as 10 cm in a grain-stone matrix. Its subordinate rudite-sized components are lamel-lar coral colonies, molds of large hyaline benthic foraminifers,mollusks, and bryozoans. These bioclasts, together with red al-gae fragments, represent a moderately sorted and fine to me-dium sand matrix. Mud is only present as discontinuous laminaeas thin as a few millimeters. A crude stratification with a finingupward trend is sometimes defined by small rhodolith layers.Corals become common upcore in the uppermost five cores,with either colonial secondary reef frame builders or solitaryforms (Table T1). In Hole 1196A, the top of Subunit IA has an ir-regularly iron-stained surface. This surface is capped by a 1-cm-thick layer of wackestone with a planktonic foraminiferal assem-blage of Pliocene age (Shipboard Scientific Party, 2002a).
Site 1199
The vertical succession at Site 1199 (Hole 1199A) is partly similar tothose described at Site 1196. It comprises six subunits (Fig. F5).
Subunit IIB (285.0–410.0 mbsf) is a thick succession of white to paleyellow (dolomitic) limestone. It consists of meter-scale alternations offloatstones with rhodoliths as large as a few centimeters and well-sortedmedium to coarse sand-sized grainstones. The biogenic componentsencountered include red algae fragments, hyaline larger benthic fora-minifers, bivalves, gastropods, echinoid spines, and bryozoans. Coralfragments are present at the top of Subunit IIB in Core 194-1199A-39R.Its lower boundary corresponds to a gradual lithologic change to a 5-cm-thick white sucrosic dolostone. This facies was retrieved by the corecatcher of the lowermost core (194-1199A-45R) from Hole 1199A. Sub-

CONESA ET AL.BIOSEDIMENTARY AND PALEOENVIRONMENTAL EVOLUTION OF THE SMP 7
unit IIB facies and the underlying sucrosic dolostone facies are veryclose to Subunits IIIA and IIIB facies from Hole 1196A, respectively.
Subunit IIA (159.8–285 mbsf) from Site 1199 is very similar to Sub-unit IIA from Site 1196. Its upper part consists of a pale brown, slightlydolomitized floatstone with large porcellaneous foraminifers, mollusks,solitary corals, and bryozoans in a silt-sized grainstone matrix. Its lowerpart also contains a noticeable amount of coral fragments of possiblesecondary reef frame builders (Table T1).
Subunit ID (121.9–159.8 mbsf) is a very pale brown to white dolomi-tic floatstone with a grainstone matrix. Biogenic components consist ofa variable amount of elongated fragments of branching red algae, rhod-oliths with associated bryozoans, and large hyaline benthic foramini-fers as molds. Corals are locally present as branching colonies withinrudstone layers. The top of Subunit ID corresponds to a 3-cm-thick redmicritic layer rich in silt-sized quartz grains (Shipboard Scientific Party,2002b).
Subunit IC (114.1–121.9 mbsf) is a very pale brown to light reddishdolomitized floatstone-rudstone and boundstone. The rocks are locallyleached and infiltrated by reddish silt (Shipboard Scientific Party,2002b). Biogenic components are fragments of branching red algae,molds of large hyaline benthic foraminifers, and massive and branch-ing coral and rare rhodoliths as large as a few centimeters.
The last two subunits from Site 1199, IB (106.6–114.1 mbsf) and IA(0–106.6 mbsf), exhibit the same facies and thicknesses as Subunits IBand IA from Site 1196, respectively. Subunit IB is also a pale browndolomitized floatstone with branching red algae in a recrystallizedgrainstone matrix. The only difference is the occurrence of rare corals.The lower boundary of Subunit IIB corresponds to a sharp lithologicchange. Subunit IA is a white to pale brown (yellow) dolomitic float-stone-rudstone with centimeter-sized rhodoliths in a grainstone matrix.An increasing amount of coral upcore is also observed in the five upper-most cores. The coral assemblages are given in Table T1.
MICROFACIES ANALYSIS AND PALEOENVIRONMENTAL INTERPRETATION
The analysis of biogenic components and foraminiferal assemblagesusing the above methodology and the sedimentary features observed incores and thin sections allowed six microfacies to be defined. Thesewere labeled A through F, and their interrelationships were established(Fig. F7). The microfacies are given with their percentage in Figure F4and are shown next to lithostratigraphic columns (Figs. F8, F9). The mi-crofacies distribution at both Sites 1196 and 1199 does not follow arandom pattern. Indeed, most of the microfacies are restricted to well-defined cored interval of lithostratigraphic subunits with respect to up-core variations of fossils assemblages (Fig. F5) and microscopic biogeniccomponents (Figs. F8, F9). Microfacies uniformity suggests the stabilityof well-defined depositional settings and/or the prevalence of biosedi-mentological and environmental factors. As a consequence, an inter-pretation in terms of depositional setting is proposed with eachmicrofacies description and is reported alongside the lithostratigraphicunits (Fig. F5). Then, CFA is used to establish microfacies interrelation-ships in order to understand the upcore vertical microfacies successionwith respect to environmental changes.
INNER PLATFORM
OUTER PLATFORM
6A01.1
6A05.1
6A05.2
6A07.1
6A10.1
6A11.1
6A13.2
6A14.1 / 9A14.1
6A15.1
6A16.1
6A21.1
6A24.1
6A25.1
6A27.1
6A32.1
6A33.1
6A33.2
6A34.1 6A35.1
6B01.3
6B04.1
6B14.1
6B20.1
6B33.1
6B46.1
9A01.1a
9A01.1b
9A03.1
9A04.6
9A05.2
9A06.3
24.52%
10.77%
14.77%
9A02.3
9A09.4 9A10.3
9A11.1
9A12.5
9A13.3
9A16.3
9A16.4
9A17.1
9A19.1
9A20.1
9A31.1
9A33.1
9A34.1
9A35.1
9A37.1
9A39.1a
9A39.1b9A40.1a
9A40.1b
9A41.1
9A42.1
6B17.1
6A18.2
RAL
GRA
HEF
HAL
COR
SER
BIV
GAS
ECH
BRY
FPLSAF
SHF
AMP
ROT
MIL
AUS
SOR
ALV
OPE
OPA
CYC
LEP
MIO
15.59%
28.59%
30.93%
6A18.3 / 9A18.3 6A20.1
F1
24.52% F1
F1
F3
RAL
GAR
HEF
HAL
COR
SER
BIV
GAS
ECH
BRY
PLF
SAFPFH
AMP
ROT
MIL
AUS
SOR
ALV
OPE
OPACYC
LEPMIO
6A01.1 6A05.1
6A05.2
6A07.1
6A10.1
6A11.1
6A13.2
6A15.1
6A16.1
6A18.2 6A20.1
6A21.1
6A24.1
6A25.1 6A27.1
6A32.1
6A33.1
6A33.2
6A34.1 6A35.1
6B01.3
6B04.1
6B14.1
6B17.1
6B20.1
6B33.1
6B46.1
9A01.1a
9A01.1b
9A02.3
9A03.1
9A04.6
9A05.2
9A06.3
9A09.4
9A10.3
9A11.1
9A12.5
9A13.3
6A14.1 / 9A14.1
9A16.3
9A16.4
9A17.1
6A18.3 / 9A18.3
9A19.1
9A20.1
9A31.1 9A33.1
9A34.1
9A35.1
9A37.1
9A39.1a
9A39.1b
9A40.1a9A40.1b
9A41.1
9A42.1
F211,5% 9,25%
9,49%
5,24%
6,99%4,39%
7,01%
5,35%10,04%
6,96%
17,84%
18,87%
20,43%
RAL
GRA
HEF
HAL
COR
SER
BIV
GAS
ECH
BRY
FPL
SAF
SHF AMPROT
MILAUS
SOR
ALV
OPE
OPA
CYC
LEP
MIOF3
F1
IIBIIA
IA
A: Porcellaneous foraminifers
A: Porcellaneous foraminifers
B: Coral
B: Coral
A
B
F
F
F
A
B
A
E
D
C
A
B
F
ED
C
C: Miogyspina Lepidocyclina
C: Miogyspina Lepidocyclina
ID
IBIC
1199 1196Site
E: Rhodoliths- Halimeda- Lepidocyclina
E: Rhodoliths- Halimeda- Lepidocyclina
F: Rhodoliths- Echinoderms
F: Rhodoliths- Echinoderms
D: Rhodoliths-Halimeda- Nummulitids- Amphistegina
D: Rhodoliths- Halimeda- Nummulitids- Amphistegina
Subunit
IIBIIA
IA
ID
IBIC
1199 1196SiteSubunit
CFA: Log (3X+1) X = percent24 variables 59 thin sections
2
ENERGYDEPTH
ENERGYDEPTH
CORALINFLUENCE
INNER PLATFORM
OUTER PLATFORM
CORAL REEF
RAL
GRA
HEF
HAL
COR
SER
BIV
GAS
ECH
BRY
PLF
SAFSHF
AMPROT
MILAUS
SOR
ALV
OPE
OPA CYC
LEPMIO
F2
F7. CFA planes of axes 1-2 and 1-3 with microfacies and environmen-tal interpretation, p. 31.
Hole1196A U
nit
Sam
ple
Mic
rofa
cies
1196
A11
96B
Hole1196B
1R
2R
3R4R
5R
6R
7R
8R
9R
10R
11R
12R
1R
IA
IB
IC
ID
IIA
2R
3R4R
5R
6R
7R
8R
9R10R
11R12R13Z16Z
20Z21Z
24Z
26Z
28Z30Z32Z
34Z
36Z
38Z
41Z
43Z
46Z48Z
51Z
13R
14R
15R
16R
17R
18R
19R
20R21R
22R
23R
24R
25R
26R
27R
28R
29R
30R
31R
32R
33R34R
35R
36R IIB
-117.2
-125.9
-162.8
-182.2
-335.9
-345.8
-130.5
-145
-184.9
-122.9
20 (%)101010101020 20101010101010 1020 2020 2020 4040404040 20 20 200 100
AUS SOR ALV HEF AMP OPE OPA CYC LEP MIO PLFRAL GRA HAL COR ECH BIV GAS SER BRY SAF ROT SHF MIL
Red
alg
ae
Cor
als
Ech
inod
erm
s
Biv
alve
s
Gas
trop
ods
Ser
pulid
s
Bry
ozoa
ns
Rot
aliid
s
Sm
all a
gglu
tina-
ted
fora
min
ifers
Sm
all h
yalin
efo
ram
inife
rs
Hya
line
encr
us-
ting
fora
min
ifers
Pla
nkto
nic
fora
min
ifers
Mili
olid
s
Sor
itids
Alv
eolin
ids
Am
phis
tegi
na
Ope
rcul
ina
Mio
gyps
ina
Ope
rcul
inel
la
Lepi
docy
clin
a
Cyc
locl
ypeu
s
Aus
trot
rillin
a
Gen
icul
ate
red
alga
e
Gre
en a
lgae
(Hal
imed
a)
Nummulitids
Larger benthic foraminifersSmall benthic foraminifers
Porcellaneous HyalineHyalineInvertebratesAlgae
Agg.
FE
D
D
F
C
E
EE
D
D
D
D
D
B
D
AA
A
A
AA
AA
A
A
AB
F
0
50
100
150
200
250
300
350
Dep
th (
mbs
f)
F8. Microfacies biogenic compo-nents vs. Site 1196 lithostrati-graphic column, p. 32.
Hole1199A U
nit
Sam
ple
Mic
rofa
cies
IA
IBIC
IIA
IIB
III
1R
-315.9 mbsf
2R
4R5R
6R
7R
8R
9R
10R
11R
12R
13R
14R
15R
16R
17R
18R
19R
20R
21R
22R
23R
24R
25R
26R
27R
28R
29R
30R
31R
32R
33R
34R
35R
36R
37R
38R
39R
40R
41R
42R
43R
44R
45R
ID
-106.6-114.1
-121.9
-159.8
-285
-410 ?
RAL GRA HAL COR ECH BIV GAS SER BRY SAF ROT SHF MIL AUS SOR ALV HEF AMP OPE OPA CYC LEP MIO FPL100400 10 5020 4020 10 1010 10 10 10 10 10 10 10 10 20 20 20 (%)20 20 20202020
Red
alg
ae
Cor
als
Ech
inod
erm
s
Biv
alve
s
Gas
trop
ods
Ser
pulid
s
Bry
ozoa
ns
Rot
aliid
s
Sm
all a
gglu
tina-
ted
fora
min
ifers
Sm
all h
yalin
efo
ram
inife
rs
Hya
line
encr
us-
ting
fora
min
ifers
Pla
nkto
nic
fora
min
ifers
Mili
olid
s
Sor
itids
Alv
eolin
ids
Am
phis
tegi
na
Ope
rcul
ina
Mio
gyps
ina
Ope
rcul
inel
la
Lepi
docy
clin
a
Cyc
locl
ypeu
s
Aus
trot
rillin
a
Gen
icul
ate
red
alga
e
Gre
en a
lgae
(Hal
imed
a)
Nummulitids
Larger benthic foraminifersSmall benthic foram.
Porcellaneous HyalineHyalineInvertebratesAlgae
Agg.
FF
E
F
F
FE
ED
F
F
A
A
B
FF
FC
F
A
A
D
D
D
C
C
C
C
C
50
100
150
200
250
300
350
400
Dep
th (
mbs
f)
F9. Microfacies biogenic compo-nents vs. Site 1199 lithostrati-graphic column, p. 33.

CONESA ET AL.BIOSEDIMENTARY AND PALEOENVIRONMENTAL EVOLUTION OF THE SMP 8
Microfacies Descriptions
Microfacies A: Porcellaneous Foraminiferal–Red Algal Packstone
This microfacies is present in Subunit IIA at both sites and in the up-per part of Subunit ID or Subunit IC (Figs. F8, F9). This mud-poor pack-stone to floatstone is defined by porcellaneous foraminifers (1%–33%),small agglutinated foraminifers (1%–19%), small hyaline foraminifers(0%–13%), and bivalves (0%–9%). Red algae is sometimes the majorcomponent (0%–83%).
Microfacies A is especially characterized by large porcellaneous formswith Austrotrillina howchini (0%–18%), alveolinids (0%–5%) including F.bontangensis, and soritids (0%–23%) (Pl. P1, figs. 1, 2). These representthe coarse portion of sediment, together with scattered, unbroken gas-tropods and bivalves up to 1 cm in size, delicate branches of red algae,associated serpulid colonies, and the rare large hyaline foraminifersOperculina, Lepidocyclina, and Miogypsina. Plates of the green algae Hal-imeda are locally abundant (0%–38%), as are rounded endoclasts.
All these bioclasts are mixed in a moderately sorted silt to mediumsand composed of numerous peletoids and micritized red algae,miliolids, echinoderms (6%–33%) (echinoid plates and spines and oph-iurids ossicles), and mollusks. Subordinate small bioclasts are delicate-branched bryozoan colonies (0%–16%), small hyaline benthic foramin-ifers including rotaliids (0%–16%), epiplanktonic foraminifers (0%–14%)(orbulinids and globigeriniids), and geniculate red algae (0%–10%). Bio-turbation occurs only within mud-rich packstones. Early marine ce-mentation sometimes occurs around grains as thin isopachous rims ofMg calcite blades.
Paleoenvironmental Interpretation
The predominant fine-grained sediment in Microfacies A may be re-lated to continuous winnowing by currents. Micritization and associ-ated peloids suggest a long-time presence of grains. The variable mudand endoclast contents and unequal preservation of larger bioclasts at-test to high- to moderate-energy settings. The geniculate red algae, sor-itids, alveolinids, and suspected sea-grass roots suggest sea-grassmeadow areas. Using Austrotrillina and Flosculinella, Chapronière (1975)and Betzler and Chapronière (1993) assigned a shallow and protectedplatform environment to similar middle Miocene facies from Australia.Moreover, Chapronière (1975) proposed a water depth of <30 m for theforaminiferal assemblage. The facies and depositional settings were alsofound by Fournier et al. (2004) in an Oligocene–Miocene isolated plat-form in the Philippines. Microfacies A also shows similarities with themiliolid–small rotaliniid facies of modern restricted platform and la-goon settings defined by Hallock and Glenn (1986). However, the Mi-crofacies A environment appears to be related to more open-oceanconditions, as numerous echinoderm fragments and epiplanktonic for-aminifers are present. Thus, Microfacies A can be assigned to an innerbut not restricted platform setting.
Microfacies B: Coral–Red Algal Rudstone-Floatstone
This microfacies is only represented by three thin sections sampledin Subunits IIA and at either the upper part of Subunit IC or the upperpart of Subunit IA (Figs. F8, F9). This microfacies is defined by the oc-
1 2
3 4
5 6
P1. Floatstone-grainstone speci-mens, p. 38.

CONESA ET AL.BIOSEDIMENTARY AND PALEOENVIRONMENTAL EVOLUTION OF THE SMP 9
currence of scattered coral fragments of solitary and colonial taxa up to1 cm in size (5%–40%) and abundant red algae (17%–59%). The corre-sponding coral assemblages are described in Table T1. The rudite-sizedfraction of Microfacies B consists of thick-branched red algae, rhodo-liths, micritized Halimeda plates (1%–24%), mollusks (2%–7%), andsporadic large benthic foraminifers (7%–13%). The silt to medium sand-sized portion of wackestone-packstone fabric shows dominant subangu-lar to well-rounded red algae fragments, mixed with miscellaneoussmall benthic foraminifers (0%–7%), epiplanktonic foraminifers (1%–4%), and echinoid debris (1%–6%). A broad stratification with thin dis-continuous laminae of micrite is visible in Unit I samples.
Paleoenvironmental Interpretation
Microfacies B likely represents a high- to moderate-energy environ-ment within or near coral patch reefs, indicated by poorly sorted rud-stone to wackestone textures and by the coral assemblages given inTable T1. These corals are second reef frame builders. In Subunits IIAand IC they are characteristic of low-energy and well-oxygenated envi-ronments. At the top of Subunit IA, they hold a high-energy signifi-cance.
Microfacies C: Miogypsina-Lepidocyclina–Red Algal Floatstone-Packstone
This microfacies is represented in Subunit IIB at Site 1199 (Fig. F9)and in one single sample at the base of a coral boundstone within Sub-unit IC at Site 1196 (Fig. F8). This microfacies exhibits upcore texturalvariations from floatstone-grainstone to packstone with common strati-fied geopetal deposits. It is characterized by Miogypsina (1%–12%) and,to a lesser extent, by Lepidocyclina (1%–13%) (Pl. P1, figs. 3, 4). It com-prises an unsorted bioclastic sand with fragmented subangular torounded branching red algae (32%–71%), geniculate red algae (0%–3%), branching bryozoan colonies (1%–8%), echinoderms (5%–20%)including ophiurids ossicles, and a noticeable amount of benthic fora-minifers as large as 2 mm (6%–30%). Two foraminifer assemblages canbe distinguished: one is an association of robust hyaline forms (com-mon Miogypsina, Lepidocyclina, and Amphistegina and sporadically sub-ordinate rotaliids and nummulitids such as Cycloclypeus, Operculina, andOperculinella), and the other one contains porcellaneous forms (alveo-linids including F. bontangensis, soritids, and miliolids). Halimeda platesand bivalves (ostreids and pectinids) occur sporadically. Crusts made ofbranching red algae, lamellar bryozoan colonies, serpulid colonies, andencrusting hyaline foraminifers sometimes develop on a single side oflarge hyaline benthic forms (Lepidocyclina). Other small benthic andepiplanktonic foraminifers are also present.
Paleoenvironmental Interpretation
The microfacies represents a high-energy setting indicated by thefragmentation and roundness of the individual bioclasts. The presenceof large robust well-preserved hyaline benthic foraminifers suggests ahigh-energy, shallow-water environment (Hallock and Glenn, 1986).Microfacies C also contains a foraminifer assemblage of Miogypsina, Lep-idocyclina, and Cycloclypeus. A similar microfacies from northwest Aus-tralia, dated early to middle Miocene, was reported by Chapronière(1975) to a shallow water depth of <50 m.

CONESA ET AL.BIOSEDIMENTARY AND PALEOENVIRONMENTAL EVOLUTION OF THE SMP 10
The common geniculate red algae and the porcellaneous foraminiferassemblage are similar to those of Microfacies A, which we assigned tosea-grass meadow influences. Sedimentation breaks, as exemplified bygeopetal deposits and encrusted Lepidocyclina, and recurrent texturalvariations are indicative of periodic decreases of energy. These sedimen-tary features may be related to periodic storm action and/or debrisflows. Martín and Braga (1993) and Martín et al. (1993) also reportthese two processes for a similar red algal facies of outer-platform set-tings, dated middle Miocene, from the Queensland and Marion pla-teaus. Finally, the lack of coral in Microfacies C suggests an outer-platform setting far away from reef influence.
Microfacies D: Nummulitids-Amphistegina-Halimeda-Rhodolithic Floatstone
The microfacies occurs in the upper parts of both Subunits IA and IIAat both Sites 1196 and 1199 and at the top of Subunit ID at Site 1196(Figs. F8, F9). This unsorted floatstone to mud-poor packstone is de-fined by large, robust, and partly reworked hyaline benthic foraminifersincluding Amphistegina (1%–16%) and the nummulitids Cycloclypeus(0%–5%) and Operculinella (0%–2%) (Pl. P1, figs. 5, 6). Microfacies D isalso characterized by red algae (20%–79%) and Halimeda plates (1%–31%). All these bioclasts compose a coarse amount of rhodoliths a fewcentimeters in size (except in Subunit IIA), encrusting hyaline foramini-fers (0%–16%), and branching red algae. Solitary and colonial coral(0%–5%), mollusks (0%–7%), and well-preserved Lepidocyclina speci-mens 2 mm in size (0%–4%) occur sporadically. Sponge clionids mostlyaffect all these bioclasts, whereas rare bivalve borings are only observedin rhodoliths. The fine portion of the sediment contains echinoderms(1%–18%), subangular red algae fragments, and epiplanktonic foramin-ifers (0%–8%). Most of the bioclasts are fragmented, rounded, andslightly micritized. A broad stratification may occur with faint upward-fining layers a few centimeters thick. Each layer of wackestone-pack-stone fabric contains medium sand-sized particles followed by discon-tinuous wavy laminae of micrite <1 mm thick. Thin micritic-rimmedcement can develop on top of bioclasts and geopetal micritic infillingsof pores. These cements are sometimes buried by another geopetal mi-critic deposit.
Paleoenvironmental Interpretation
Microfacies D indicates a high- to moderate-energy environmentwith occasional coral reef input. The presence of epiplanktonic fora-minifers as well as the rich association of large hyaline benthic foramin-ifers and rarity of porcellaneous foraminifers suggests an outer-platformsetting. The presence of several generations of geopetal deposit sepa-rated by micritic rims suggests sedimentation breaks. These sedimen-tary features with faint upward-fining layers may be characteristic ofslope deposition controlled by sporadic storms. Indeed, Martín et al.(1993) reports a storm-influenced outer-platform setting at depths rang-ing from 30 to 80 m in an almost identical rhodolithic facies, datedmiddle Miocene from the Marion Plateau (Leg 133, Site 816). Marshallet al. (1998) also report depths ranging from 40 to 120 m for a compara-ble facies from a modern Australian environment. In the depositionalenvironment inferred from the analysis of Microfacies D, the high per-centage of Halimeda plates suggests the existence of meadows. Daviesand Marshall (1985) and Drew and Abel (1988) reported finding Hal-

CONESA ET AL.BIOSEDIMENTARY AND PALEOENVIRONMENTAL EVOLUTION OF THE SMP 11
imeda meadows at depths ranging from 20 to 100 m in the Holocene tomodern environments of the Great Barrier Reef Province.
Microfacies E: Lepidocyclina-Halimeda-Rhodolithic Floatstone
This unsorted floatstone to mud-poor packstone is present in thelower part of Subunit IA and in either Subunit IB or Subunit ID (Figs.F8, F9). It is characterized by especially large (up to 5 mm) and flat com-mon Lepidocyclina (0%–11%), rare Amphistegina (0%–2%), and varyingpercentages of Halimeda plates (1%–41%). Red algae (40%–82%) is amajor component with rudite-sized rhodoliths and delicate branches.The sand-sized portion of the sediment mainly contains red algae andechinoid fragments (0%–10%). The other bioclasts are rare and spo-radic.
Paleoenvironmental Interpretation
Microfacies E exhibits the same fabric as microfacies D with preva-lent red algae and Halimeda plates. The restricted large benthic foramin-iferal assemblage, the lower amount of Amphistegina, and the absence,for the most part, of porcellaneous benthic foraminifers, encrusting hy-aline foraminifers, and coral suggest an outer-platform setting in adeeper position with respect to Microfacies D. Such a deep setting mayexplain the occurrence of the especially large and flat, well-preservedspecimens of Lepidocyclina. Indeed, the increasing size and degree offlatness of the benthic foraminifers can be related to light attenuationwith increasing habitat depth (Hallock and Glenn, 1986). Nevertheless,the nature of substrate can also be a controlling factor (Hottinger,1983). Finally, the presence of Halimeda plates with a similar percentageas Microfacies D and absent corals and porcellaneous foraminifers mayreinforce the hypothesis of in situ Halimeda meadows in outer-platformsettings.
Microfacies F: Echinoderm-Rhodolithic Floatstone
This unsorted floatstone to mud-poor packstone is mainly present inSubunits ID, IB, and IA (Figs. F8, F9). It contains abundant rhodolithsand branching red algae fragments (66%–99%) and a rudite-sized frac-tion of echinoderm debris with mainly echinoid plates and spines (1%–28%). The other rare and sporadic bioclasts are coral, nummulitids, al-veolinids, small benthic and epiplanktonic foraminifers, and Halimedaplates.
Paleoenvironmental Interpretation
Microfacies F, as well as Microfacies D and E, may represent an outer-platform setting of high to moderate energy with respect to its fabricand red algae abundance. The paucity of small bioclasts, includingbenthic and planktonic foraminifers, is most likely due to winnowing.Low bioclast diversity and the absence of coral may indicate that thedepositional setting is far away from reef influence.
Microfacies Interrelationships
Microfacies interrelationships are established according to significantbiogenic components (variables) and environmental controlling factorsusing CFA. Results are illustrated in Figure F7.
CONESA ET AL.BIOSEDIMENTARY AND PALEOENVIRONMENTAL EVOLUTION OF THE SMP 12
Description
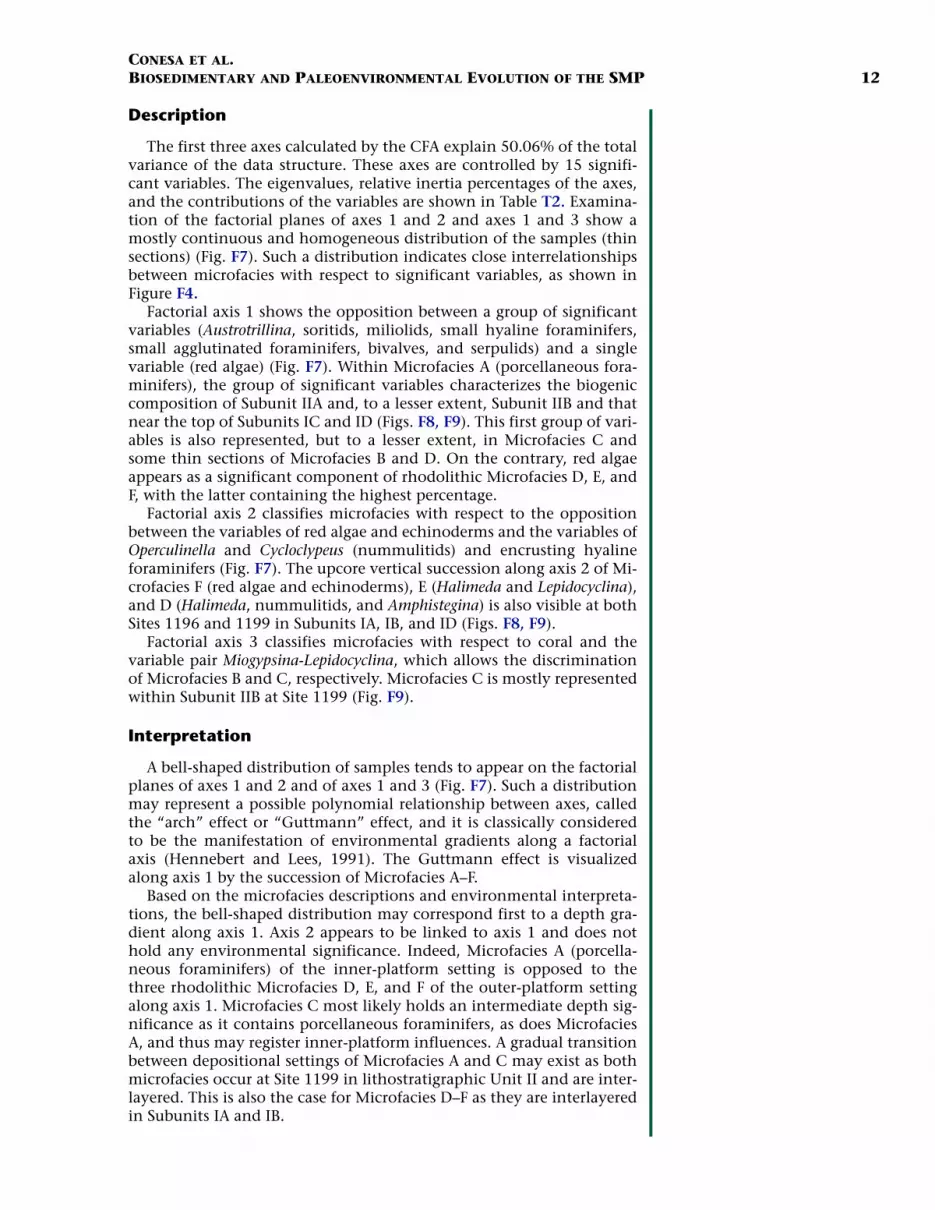
The first three axes calculated by the CFA explain 50.06% of the totalvariance of the data structure. These axes are controlled by 15 signifi-cant variables. The eigenvalues, relative inertia percentages of the axes,and the contributions of the variables are shown in Table T2. Examina-tion of the factorial planes of axes 1 and 2 and axes 1 and 3 show amostly continuous and homogeneous distribution of the samples (thinsections) (Fig. F7). Such a distribution indicates close interrelationshipsbetween microfacies with respect to significant variables, as shown inFigure F4.
Factorial axis 1 shows the opposition between a group of significantvariables (Austrotrillina, soritids, miliolids, small hyaline foraminifers,small agglutinated foraminifers, bivalves, and serpulids) and a singlevariable (red algae) (Fig. F7). Within Microfacies A (porcellaneous fora-minifers), the group of significant variables characterizes the biogeniccomposition of Subunit IIA and, to a lesser extent, Subunit IIB and thatnear the top of Subunits IC and ID (Figs. F8, F9). This first group of vari-ables is also represented, but to a lesser extent, in Microfacies C andsome thin sections of Microfacies B and D. On the contrary, red algaeappears as a significant component of rhodolithic Microfacies D, E, andF, with the latter containing the highest percentage.
Factorial axis 2 classifies microfacies with respect to the oppositionbetween the variables of red algae and echinoderms and the variables ofOperculinella and Cycloclypeus (nummulitids) and encrusting hyalineforaminifers (Fig. F7). The upcore vertical succession along axis 2 of Mi-crofacies F (red algae and echinoderms), E (Halimeda and Lepidocyclina),and D (Halimeda, nummulitids, and Amphistegina) is also visible at bothSites 1196 and 1199 in Subunits IA, IB, and ID (Figs. F8, F9).
Factorial axis 3 classifies microfacies with respect to coral and thevariable pair Miogypsina-Lepidocyclina, which allows the discriminationof Microfacies B and C, respectively. Microfacies C is mostly representedwithin Subunit IIB at Site 1199 (Fig. F9).
Interpretation
A bell-shaped distribution of samples tends to appear on the factorialplanes of axes 1 and 2 and of axes 1 and 3 (Fig. F7). Such a distributionmay represent a possible polynomial relationship between axes, calledthe “arch” effect or “Guttmann” effect, and it is classically consideredto be the manifestation of environmental gradients along a factorialaxis (Hennebert and Lees, 1991). The Guttmann effect is visualizedalong axis 1 by the succession of Microfacies A–F.
Based on the microfacies descriptions and environmental interpreta-tions, the bell-shaped distribution may correspond first to a depth gra-dient along axis 1. Axis 2 appears to be linked to axis 1 and does nothold any environmental significance. Indeed, Microfacies A (porcella-neous foraminifers) of the inner-platform setting is opposed to thethree rhodolithic Microfacies D, E, and F of the outer-platform settingalong axis 1. Microfacies C most likely holds an intermediate depth sig-nificance as it contains porcellaneous foraminifers, as does MicrofaciesA, and thus may register inner-platform influences. A gradual transitionbetween depositional settings of Microfacies A and C may exist as bothmicrofacies occur at Site 1199 in lithostratigraphic Unit II and are inter-layered. This is also the case for Microfacies D–F as they are interlayeredin Subunits IA and IB.

CONESA ET AL.BIOSEDIMENTARY AND PALEOENVIRONMENTAL EVOLUTION OF THE SMP 13
Moreover, axis 1 may correspond to both an energy gradient and awinnowing gradient. Indeed, the prevalent granulometry increasesalong the arch of the factorial plane of axes 1 and 2. Thus, the granu-lometry consists of silt to fine sand in Microfacies A, medium to coarsesand in Microfacies C, and coarse sand with additional numerous rhod-oliths a few centimeters in size in Microfacies D through F. On the con-trary, the fine portion of sediment including mud tends to disappearalong the arch. The gradual disappearance of small bioclasts, includingsmall benthic and planktonic foraminifers, from microfacies D to F canbe also related to an increasing winnowing process.
Finally, axis 3 may represent a coral influence gradient (Fig. F7). In-deed, coral occurs in Microfacies B and in some thin sections of Micro-facies D, whereas it is absent in Microfacies C.
The CFA ordering of Microfacies A–F along the arch is also associatedwith a reduction in the diversity of biogenic components, as shown inFigure F4. This phenomenon can be related to gradients of winnowing,depth, and coral influence. Indeed, an upcore vertical succession fromMicrofacies F and E to Microfacies D occurs in Subunits IA and IB atboth Sites 1196 and 1199. This is consistent with the occurrence ofcommon coral pebbles in the five uppermost cores at both sites in Sub-unit IA, whereas coral is absent in Subunit IB (Fig. F5).
Thus, the CFA ordering of Microfacies A–F with respect to the envi-ronmental gradients is representative of the upcore vertical biosedimen-tary evolution at both Sites 1196 and 1199 (Fig. F5). As a consequence,the microfacies evolution will be examined along with the site lithos-tratigraphic units with respect to the CFA ordering.
DISCUSSION
Depositional Architecture
The combination of the microfacies results and the lithologic synthe-sis with the available seismic and stratigraphic data set from the Ship-board Scientific Party (2002a, 2002b) allowed us to refine thedepositional architecture of the SMP on a regional scale (>5 km). In ad-dition, we will define the geometry of some sedimentary bodies on asmaller scale (a few hundred meters).
SMP’s Depositional Architecture
Based on seismic analysis, stratigraphy, and biosedimentology, theShipboard Scientific Party (2002a) established the depositional architec-ture at the scale of the SMP (>5 km). They described an asymmetricalplatform with a northwestern flat-topped, reef-rimmed margin and anevolving southeastern margin from a distally steepened to a morehomoclinal ramp (Fig. F3). In this pattern, they related the asymmetri-cal platform architecture to the strong influence of currents from thenorth to the south. In addition, the Shipboard Scientific Party (2002a)inferred a water depth increase and a coral reef–development decreasetoward the southwest. Thus, Sites 1196 and 1199 were drilled in theflat-topped inner part of the platform behind a possible reef rim. Such adepositional architecture with rimmed platform and ramps has alreadybeen described or inferred from seismic analysis and biosedimentologi-cal studies in other Cenozoic carbonate platforms from Australia andthe Indian Pacific Ocean (e.g., Chapronière, 1975; Betzler, 1997; Mar-

CONESA ET AL.BIOSEDIMENTARY AND PALEOENVIRONMENTAL EVOLUTION OF THE SMP 14
shall et al., 1998; Noad, 2001; Fournier et al., 2004). Nevertheless, ouranalysis of the SMP’s coral assemblages cannot reinforce the hypothesisof a well-developed reef rim because no primary framebuilders werefound at Sites 1196 and 1199, as shown in Table T1.
The Shipboard Scientific Party (2002a, 2002b) considered the SMP’slithostratigraphic succession to be mostly monoclinal from one site tothe other. They also demonstrated that the corresponding subunitsshowed very similar sedimentary facies, fossil assemblages, and thick-nesses (Figs. F3, F5).
Our statistical analysis of microfacies partly confirms the lithostrati-graphic subdivisions. Indeed, the composition and evolution of micro-facies are mostly identical in each of the subunits represented withinboth sites (Fig. F5). Nevertheless, some exceptions remain for SubunitsIC, ID, and IIB. Indeed, the microfacies composition and the fossil as-semblages of these subunits signal the influence of coral reefs andrather support the alternative logging stratigraphy (Figs. F5, F6). In thelogging stratigraphy, the boundary between logging Units 3 and 2 rep-resents a gradual sedimentary change from rhodolithic floatstones (Mi-crofacies D, E, and F) to coral boundstones-floatstones (Microfacies Band A) within Hole 1199A (Fig. F5). The boundary between the loggingUnits 3 and 4 and the dashed boundary situated just upcore in loggingUnit 3 (Fig. F6) represent a gradual sedimentary change from large hya-line benthic foraminiferal floatstones (Microfacies C), coral bound-stones-rudstones (Microfacies B), and porcellaneous foraminiferalgrainstones (Microfacies A). Further, Subunit IIB and the coral upperpart of Subunit IIIA (Hole 1196A) are correlated to the coral lower partof Subunit IIA (Hole 1199A), with respect to the logging stratigraphicpattern (Fig. F5). Finally, the lower part of Subunit IIIA (Hole 1196A) iscorrelated to Subunit IIB (Hole 1199A) (Fig. F5). At both sites, a dolo-mitic sucrosic facies appears at ~410 mbsf (Fig. F5). This facies mostlikely corresponds to the top of the old dolomitic platform, mostlydated early Miocene in age by the Shipboard Scientific Party (2002a)(Fig. F3). Further, the studied 410-m-thick stratigraphic succession maybe subdivided into two parts with respect to the composition of micro-facies and sedimentary rocks. The lower part would include Unit II andSubunit IIIA, and the upper part would correspond to Unit I.
Geometry of Sedimentary Bodies
A seismic profile a few hundred meters long provides well-definedseismic reflections in the 200-m-thick uppermost part of the platformsuccession at Site 1196 (Fig. F10). The analysis of these reflections sug-gests the existence of lens-shaped sedimentary bodies as thick as 30 mand prograding clinoforms in lithostratigraphic Unit I (Fig. F10). Such asedimentary architecture supports the Shipboard Scientific Party’s(2002b) observation of lateral variations as much as 20 m thick in Sub-units IC and ID from Holes 1196A to 1199A, which lie at a distance of20 m. Indeed, the difference of the thickness between the two holes wasconsidered significant, as it exceeds the depth errors due to coring(Shipboard Scientific Party, 2002b).
Several sedimentary features encountered at both Sites 1196 and1199 are also consistent with the seismic architecture. Thus, some cross-bedded stratifications underlined by rhodolithic layers were observed incore sections from Unit I (Shipboard Scientific Party, 2002b). Thesestratifications may correspond to the clinoforms suspected in the seis-mic profile (Fig. F10). The occasional grading of sediments with recur-
Line MAR07
0.40
100 m
0
100
200
300
400
500
600
666
0.60
0.80
Dep
th(m
)
Site 1196
IA
0Site 1196
Set of progradingclinoforms
Lobe-shaped bodies
Coral patch reef?
100
200 m
IB
IC
ID
IIA
IIB
IIIA
IIIB
IIIC
IIID
IVV
Two-
way
trav
eltim
e (s
)
cr
cr
Lith
olog
icun
it
Seismic interpretation
F10. Seismic reflections of Line MAR07, Site 1196, p. 34.

CONESA ET AL.BIOSEDIMENTARY AND PALEOENVIRONMENTAL EVOLUTION OF THE SMP 15
rent textural variations, the sedimentation breaks as exemplified byseveral generations of geopetal deposits, and the winnowing of the finesand portion of sediment found in the rhodolithic Microfacies D, E,and F of Unit I can be characteristic of debris flows in slope settings.These sedimentary features may characterize the progradation of theclinoforms that are a response to strong currents that are inferred fromthe SMP’s asymmetrical architecture by the Shipboard Scientific Party(2002a). These sedimentary features may also be associated with reef ta-lus deposition. Indeed, an upcore gradual change in sedimentation oc-curs from rhodolithic floatstones to coral rudstones-boundstones inSubunits ID and IC at both sites. The presence of coral boundstones inSubunit IC at both sites points to the settlement of coral reefs at theSMP’s scale. The available seismic data provide poor information of thegeometry of these coral reefs. Nevertheless, some reflections may be in-terpreted as 200-m-long and 20-m-thick lens-shaped bodies (Fig. F10).
Although the association of both coral and rhodolithic facies havebeen documented in Cenozoic and modern platforms from Australia(e.g., Betzler, 1997; Davies, McKenzie, Palmer-Julson, et al., 1991;Davies and Peerdeman, 1998; Marshall et al., 1998), the geometry ofthe sedimentary bodies is poorly illustrated at a small scale. On the con-trary, the geometry of a set of clinoforms, possibly similar to those ofthe SMP, is well known in some rhodolithic distally steepened ramps,dated late Miocene, from the Mediterranean region. Thus, Pomar et al.(1996) and Pomar (2001) reported a set of 2-km-long and 40-m-thickclinoforms in a 20-km-long prograding rhodalgal ramp from theBalearic Islands (Spain). In addition, Saint Martin et al. (1997) char-acterized a vertical stacking set of clinoforms 1–4 km long and 10–30 mthick in a 10-km-long prograding rhodalgal ramp from the MalteseIslands. Within this ramp, the clinoforms exhibit scattered lens-shapedcoral reefs at the toes of their topsets.
Finally, the definition of the seismic profile did not really allow us todiscern the sedimentary architecture of lithostratigraphic Unit II (Fig.F10). Nevertheless, the large hyaline foraminiferal deposits (MicrofaciesC) of Subunit IIB (Site 1199) and Subunit IIIA (Site 1196) indicate theexistence of slope deposition as do the three rhodolithic microfacies (D,E, and F) from Unit I. On the contrary, no sedimentary features charac-teristic of slope deposition were observed in the porcellaneous foramin-iferal deposits (Microfacies A) of Subunit IIA. Chapronière (1975)reported similar porcellaneous foraminiferal deposits in subhorizontalbeds, dated middle Miocene, from western Australia.
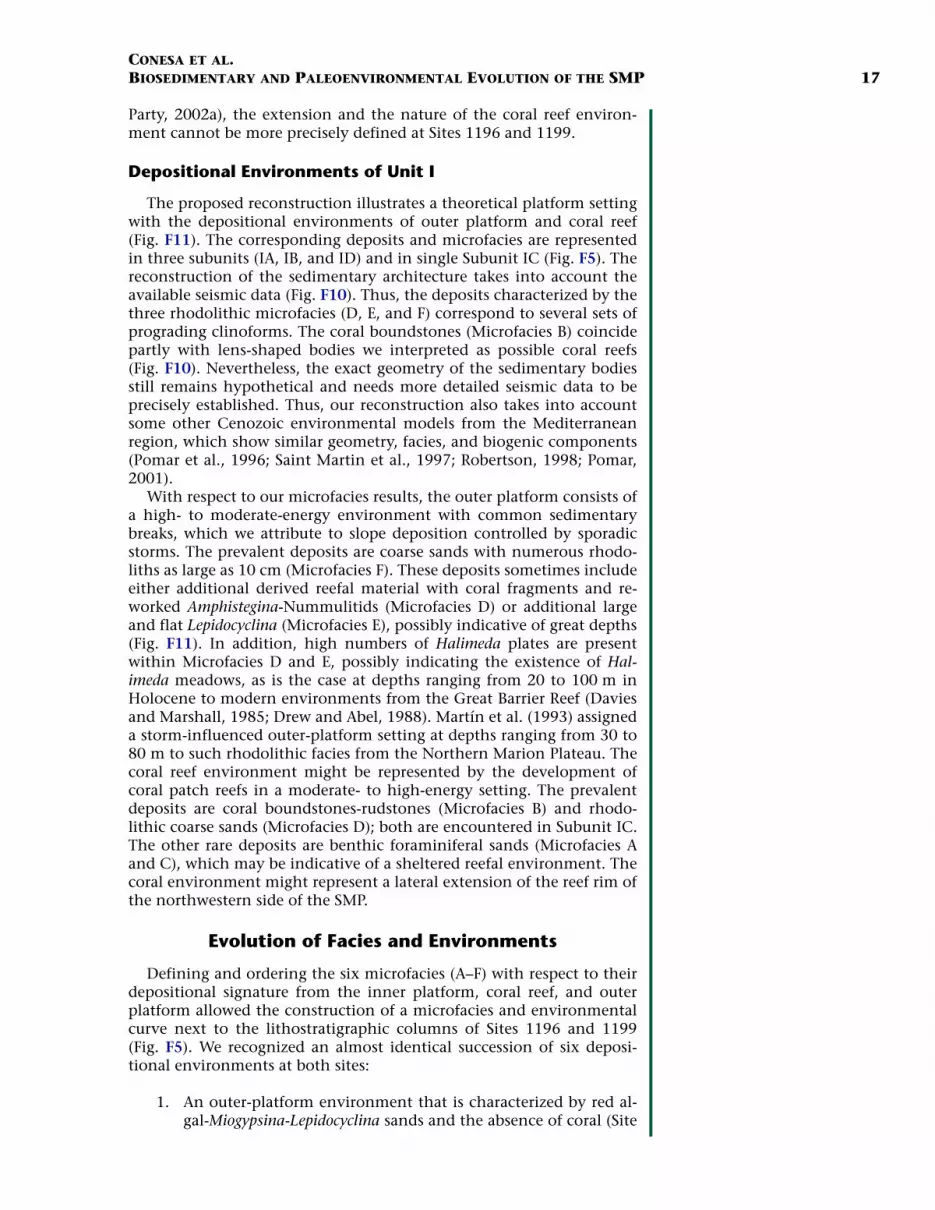
Reconstruction of Depositional Environments
The reconstruction of depositional environments is necessary to bet-ter understand the biosedimentary and paleoenvironmental evolutionof the SMP at Sites 1196 and 1199. Based on the microfacies analysis,the corresponding paleoenvironmental interpretations, and the strati-graphic data, we defined an upcore vertical succession of six deposi-tional environments at both sites (Fig. F5). Further, we proposed tworeconstructions for Unit II–Subunit IIIA and Unit I, respectively (Fig.F11). The reconstructions correspond to the two main lithostrati-graphic subdivisions of the vertical succession at both sites. They repre-sent a theoretical zonation of platform deposits on the scale of thesedimentary bodies (at most 1 km in length) with repartitioned micro-facies and the corresponding depositional environments. Thesereconstructions take into account the seismic architecture, the biosedi-
B/D
A B
B
B
B/D
FE
D
A/C
C
Coral reefCoralpatch reefs
Coralpatch reefs
0
1 km
0
1 km
<60 m?
Austrotrillina
Miogypsina
Lepidocyclina
Alveolinids-Soritids
geniculate red algae
bivalvesgastropods
Halimeda plates
branching red algae pieces
rhodoliths on coral nucleus
rhodoliths
coral colonies (fragments):
red algae fragment
Main bioclasts
MiliolidsNummulitids
0
<100 m?
0
30 m?
0<10 m?
Unit II-Subunit IIIA(early?-middle Miocene)
Unit I(middle-late Miocene)
massive/lamellar
branching/undetermined
1
2
Inner Platform
3
Outer Platform
Depositionalenvironments
Subunits
Depositionalenvironments
Subunits
IIB (Site 1199)
IB/IA
IIA
IIIA (Site 1196)
IIA (Site 1199)IIIA-IIB (Site 1196)
Coral reef
6 4
5
Outer Platform
IC
ID (Site 1199)
ID-IC (Site 1196)
MicrofaciesA: porcellaneous foraminifersB: coralC: Myogypsina-LepidocyclinaD: rhodoliths-Halimeda- Nummulitids-AmphisteginaE: rhodoliths-Halimeda-LepidocyclinaF: rhodoliths-echinoderms
F11. SMP depositional environ-ment reconstruction, p. 35.

CONESA ET AL.BIOSEDIMENTARY AND PALEOENVIRONMENTAL EVOLUTION OF THE SMP 16
mentological data synthesized in the site lithostratigraphic columns(Fig. F5), and the results of the microfacies analysis. Thus, the reparti-tioned microfacies in each reconstruction is inferred from the microfa-cies’ interrelationships with respect to the environmental gradientsdefined by the CFA (Fig. F7) and from their vertical succession and in-terlayering next to the site lithostratigraphic columns (Fig. F5). Theclose interrelationships of the microfacies and the gradual sedimentaryevolution of the corresponding deposits at Sites 1196 and 1199 suggesta lateral coexistence of the superimposed depositional environments.Finally, one must note that these reconstructions illustrate only a re-stricted area of the inner part of the SMP, limited at its northeastern sideby a possible reef rim (Shipboard Scientific Party, 2002a).
Depositional Environments of Unit II–Subunit IIIA
The proposed reconstruction illustrates a theoretical platform settingwith the depositional environments of outer platform, coral reef, andinner platform (Fig. F11). The corresponding deposits and microfaciesare superimposed and show gradual changes along the vertical succes-sion of Subunits IIIA–IIB and IIA at Sites 1196 and 1199 (Fig. F5). Never-theless, the geometry of the sedimentary deposits remains in question,as no well-defined seismic data are available. Consequently, our recon-struction also takes into account some other Cenozoic environmentalmodels from Australia and the Indo-Pacific region, which exhibit com-parable facies and biogenic components (Chapronière, 1975; Hallockand Glenn, 1986; Betzler and Chapronière, 1993; Fournier et al., 2004).
With respect to our microfacies results, the inner platform corre-sponds to a moderate- to high-energy environment under open-oceaninfluences. The prevalent porcellaneous foraminiferal fine sand (Micro-facies A) deposits are only represented in Subunit IIA. Chapronière(1975) assigned a maximum water depth of 30 m to a comparable fora-miniferal assemblage from Australia. The deposits are winnowed, prob-ably from the action of bottom currents. Muddier fine sands are presentand may be related to a sheltering effect of sea-grass meadows and scat-tered coral patch reefs (Microfacies B). The coral reef environment isalso of high to moderate energy with respect to the coral assemblages.The deposits are a mixture of porcellaneous foraminiferal fine sandsand coral–red algal coarse sands (Microfacies B and D) that are encoun-tered in Subunits IIIA–IIB (Site 1196) and Subunit IIA (Site 1199). Theouter-platform environment shows episodic variations of energy andsedimentary breaks, which we attributed to slope deposition and/orstorm action. The prevalent deposits are unsorted Miogypsina-Lepidocy-clina sands (Microfacies C) represented in Subunits IIB (Site 1199) andIIIA (Site 1196). We assigned a maximum water depth of 50–60 m tothis large, hyaline foraminiferal assemblage, following the models ofChapronière (1975) and Hallock and Glenn (1986). Finally, these depos-its register the influence of coral reef and inner-platform environmentsas they contain rare coral and a porcellaneous foraminiferal assemblagesimilar to those of Microfacies A.
Thus, we relate the existence of the inner-platform environment tothe development of coral reefs as shown by others studies for similardepositional settings (e.g., Hallock and Glenn, 1986; Betzler and Chap-ronière, 1993; Robertson, 1998; Fournier et al., 2004). In these studies,the coral reefs form a reef rim and sometimes surround an inner-plat-form area (Robertson, 1998; Fournier et al., 2004). Although a reef rimis reported at the northwestern side of the SMP (Shipboard Scientific
CONESA ET AL.BIOSEDIMENTARY AND PALEOENVIRONMENTAL EVOLUTION OF THE SMP 17
Party, 2002a), the extension and the nature of the coral reef environ-ment cannot be more precisely defined at Sites 1196 and 1199.
Depositional Environments of Unit I
The proposed reconstruction illustrates a theoretical platform settingwith the depositional environments of outer platform and coral reef(Fig. F11). The corresponding deposits and microfacies are representedin three subunits (IA, IB, and ID) and in single Subunit IC (Fig. F5). Thereconstruction of the sedimentary architecture takes into account theavailable seismic data (Fig. F10). Thus, the deposits characterized by thethree rhodolithic microfacies (D, E, and F) correspond to several sets ofprograding clinoforms. The coral boundstones (Microfacies B) coincidepartly with lens-shaped bodies we interpreted as possible coral reefs(Fig. F10). Nevertheless, the exact geometry of the sedimentary bodiesstill remains hypothetical and needs more detailed seismic data to beprecisely established. Thus, our reconstruction also takes into accountsome other Cenozoic environmental models from the Mediterraneanregion, which show similar geometry, facies, and biogenic components(Pomar et al., 1996; Saint Martin et al., 1997; Robertson, 1998; Pomar,2001).
With respect to our microfacies results, the outer platform consists ofa high- to moderate-energy environment with common sedimentarybreaks, which we attribute to slope deposition controlled by sporadicstorms. The prevalent deposits are coarse sands with numerous rhodo-liths as large as 10 cm (Microfacies F). These deposits sometimes includeeither additional derived reefal material with coral fragments and re-worked Amphistegina-Nummulitids (Microfacies D) or additional largeand flat Lepidocyclina (Microfacies E), possibly indicative of great depths(Fig. F11). In addition, high numbers of Halimeda plates are presentwithin Microfacies D and E, possibly indicating the existence of Hal-imeda meadows, as is the case at depths ranging from 20 to 100 m inHolocene to modern environments from the Great Barrier Reef (Daviesand Marshall, 1985; Drew and Abel, 1988). Martín et al. (1993) assigneda storm-influenced outer-platform setting at depths ranging from 30 to80 m to such rhodolithic facies from the Northern Marion Plateau. Thecoral reef environment might be represented by the development ofcoral patch reefs in a moderate- to high-energy setting. The prevalentdeposits are coral boundstones-rudstones (Microfacies B) and rhodo-lithic coarse sands (Microfacies D); both are encountered in Subunit IC.The other rare deposits are benthic foraminiferal sands (Microfacies Aand C), which may be indicative of a sheltered reefal environment. Thecoral environment might represent a lateral extension of the reef rim ofthe northwestern side of the SMP.
Evolution of Facies and Environments
Defining and ordering the six microfacies (A–F) with respect to theirdepositional signature from the inner platform, coral reef, and outerplatform allowed the construction of a microfacies and environmentalcurve next to the lithostratigraphic columns of Sites 1196 and 1199(Fig. F5). We recognized an almost identical succession of six deposi-tional environments at both sites:
1. An outer-platform environment that is characterized by red al-gal-Miogypsina-Lepidocyclina sands and the absence of coral (Site

CONESA ET AL.BIOSEDIMENTARY AND PALEOENVIRONMENTAL EVOLUTION OF THE SMP 18
1196: Subunit IIIA; Site 1199: Subunit IIB, Microfacies C). We in-terpreted a maximum water depth of 50–60 m, based on the for-aminiferal assemblage.
2. A coral reef environment that may be represented by coral patchreefs (Site 1196: Subunits IIIA–IIB; Site 1199: Subunit IIA, Micro-facies B).
3. An inner-platform environment that is under the influence ofpossible scattered coral patch reefs (Sites 1196 and 1199: SubunitIIA). Its transition from the previous coral reef environment isgradual. The prevalent deposits are porcellaneous foraminiferalfine sands (Microfacies A) with occasional coral (Microfacies B),which are interpreted to occur at a maximum water depth of 30m.
4. An outer-platform environment (Site 1196: Subunits ID–IC; Site1199: Subunit ID), which strongly contrasts with the previousinner-platform environment. The prevalent deposits are rhodo-lithic coarse sands (Microfacies F and E). They also contain anamount of coral that increases upcore (Microfacies D). The rhod-olithic facies is assigned to water depths ranging from 30 to80 m.
5. A coral reef environment that has possible scattered coral patchreefs (Sites 1196 and 1199: Subunit IC). The transition from theprevious outer-platform environment is gradual and may be al-ready recorded in the deposits of Subunit ID. The prevalent de-posits are interbedded coral boundstones-rudstones (MicrofaciesA and B) and rhodolithic coarse sands with coral (Microfacies D).
6. An outer-platform environment (Sites 1196 and 1199: SubunitsIB–IA) that has a prevalent rhodolith facies was assigned to waterdepths ranging from 30 to 80 m. The deposits are devoid of coral(Microfacies F and E) in Subunit IB and in the lower part of Sub-unit IIA. They strongly contrast with the underlying coral depos-its of Subunit IC. The upper part of Subunit IIA records anincreasing coral reef influence (Microfacies D), indicative of anupward-shallowing general trend.
Thus, most of the changes of facies and environments clearly coincidewith either the lithostratigraphic or logging stratigraphic subdivisions ofthe SMP proposed by the Shipboard Scientific Party (2002a, 2002b) (Fig.F5). The Shipboard Scientific Party (2002a, 2002b) described most of theretrieved boundaries as iron-stained micritic crusts a few centimetersthick. They interpreted the crusts as the result of hardground develop-ment following a possible exposure. Nevertheless, no unquestionable di-agenetic features were found in thin sections to remove uncertaintiesabout the existence of exposure (Shipboard Scientific Party, 2002b)Therefore, it has been stressed that additional diagenetic and isotopicstudies will be necessary to refine the origin of the boundaries (Ship-board Scientific Party, 2002b).
Sea Level Variations
The analysis of the facies and environmental evolution, with respectto the stratigraphic subdivisions at both sites, points to the existence ofthree main shallowing sequences that are intercalated with three abruptdeepening events (Fig. F5).
Sequence 1 corresponds to Subunits IIIA, IIB, and IIA and is repre-sented by a gradual evolution of environments from (1) outer platform,

CONESA ET AL.BIOSEDIMENTARY AND PALEOENVIRONMENTAL EVOLUTION OF THE SMP 19
(2) coral reef, and (3) inner platform. Using biostratigraphy from Bou-dagher-Fadel and Banner (1999), the upper part of the sequence (Sub-unit IIA) can be dated middle Miocene based on the foraminiferalassemblage of Austrotrillina howchini and F. bontangensis. On the con-trary, the early middle Miocene age attributed to Subunits IIIA–IIB bythe Shipboard Scientific Party (2002a, 2002b) cannot be determinedwith precision.
Sequence 2 corresponds to Subunits ID and IC, recording the succes-sion from (4) an outer-platform environment to (5) a coral reef environ-ment. The onset of this sequence is marked by an abrupt deepeningwith respect to the underlying inner-platform environment of SubunitIIA. The Shipboard Scientific Party (2002a, 2002b) reported iron-stainedmicritic crusts a few centimeters in thickness at the tops of both Sub-units ID and IC. They attributed the boundary between Subunits ID andIC to the major late middle Miocene (N12–N14) sea level fall (Haq et al.,1988). This sea level fall was estimated in the Northern Marion Plateauat 86 m ± 30 mbsl (Shipboard Scientific Party, 2002a). However, wequestion the occurrence of such an event at this lithostratigraphic level.Indeed, our facies analysis instead showed a gradual biosedimentaryevolution from Subunit ID to Subunit IC, which is more consistent withthe alternative logging subdivisions of the Shipboard Scientific Party(2002b) (Figs. F5, F6). Moreover, the overlying Subunit IC contains un-reworked larger benthic foraminifers Miogypsina spp. The last occur-rence of this genus is positioned at the upper end of the planktonicZone N12 or in the lower part of Zone N13 for the Indo-Pacific(Boudagher-Fadel and Banner, 1999; Boudagher-Fadel et al., 2000a).Thus, we propose instead to relate the surface between Subunits IC andIB to this second-order event. This surface would thus correspond to theMegasequence B/C seismic boundary, dated through seismic correla-tions to ∼11 Ma by the Shipboard Scientific Party (2002a).
Sequence 3 occurs in Subunits IB and IA and is characterized by (6)an outer-platform environment. The onset of this sequence is markedby an abrupt deepening with respect to the underlying coral reef envi-ronment of Subunit IC. The lower part of the sequence is devoid ofcoral inputs, whereas its upper part shows the increasing influence of acoral reef environment. The Shipboard Scientific Party (2002a, 2002b)described at the top of Subunit IA an iron-stained irregular surface,overlain by laminated ferromanganese crusts and/or planktonic wacke-stone deposits, which they dated Pliocene in age. Further, they assumedthat this surface coincides with the Megasequence C/D seismic bound-ary they dated to ∼7.2 Ma and the drowning of the SMP. Thus, Sequence3 occurred during the early late Miocene.
The correlation of the three shallowing sequences and the threedeepening events to a global sea level curve remains problematic re-garding potential high sea level variations during the middle and lateMiocene (Haq et al., 1988). Sequences 1 and 2 of middle Miocene agerecord two shallowing phases that are intercalated with an abrupt deep-ening event. The sequences may correspond to two third-order cyclesassociated with the global middle Miocene sea level fall. The end of thisevent is represented at the SMP by an unconformity at the top of Se-quence 2. Sequence 3, dated early late Miocene in age, represents a gen-eral shallowing consecutive to an abrupt deepening event with respectto the underlying coral reefs of Sequence 2. Thus, Sequence 3 may cor-relate to one of the third-order cycles following the major second-ordersea level fall. Finally, the top of Sequence 3 was partly related to the

CONESA ET AL.BIOSEDIMENTARY AND PALEOENVIRONMENTAL EVOLUTION OF THE SMP 20
Pliocene drowning of the Marion Plateau (Pigram et al., 1992; Pigram,1993; Shipboard Scientific Party, 2002a).
In the adjacent Queensland Plateau, depositional sequences of car-bonate platform were established and the sea level variations were esti-mated from the middle Miocene to the Pliocene (Davies, McKenzie,Palmer-Julson, et al., 1991; Brachert et al., 1993; Betzler et al., 1993,1995; Betzler, 1997). Nevertheless, a precise correlation of the platformdeposits from the Queensland and Marion plateaus remains difficult toestablish with respect to the biostratigraphic resolution and core recov-ery. Only some global events can be recognized in both areas. Thus, twodeepening events occurring in the early late Miocene and in thePliocene are reported in the Queensland Plateau (Betzler et al., 1995;Betzler, 1997). They may correlate to the two deepening events presentat the tops of Sequences 2 and 3 from the Southern Marion Plateau. Fi-nally, the effect of the second-order sea level fall (late middle Miocenein age) was also detected in the Queensland Plateau, particularly fromthe basinward shift in onlap along seismic profiles (Davis, McKenzie,Palmer-Julson, et al., 1991).
CONCLUSION
Petrographic facies analysis and supporting statistical analysis of theSMP (Sites 1196 and 1199) revealed the following:
1. The correlation pattern of Sites 1196 and 1199 was refined. Theproposed lithostratigraphic subdivisions best match the loggingsubdivisions of the Shipboard Scientific Party (2002b).
2. The age of Subunits IC and ID was determined. A middle Mi-ocene age is proposed, based on the occurrence of the generaMiogypsina in Subunit IC.
3. Two reconstructions of the depositional environments at a finescale (1 km) were proposed in order to visualize the biosedimen-tary and environmental evolution of the inner part of the SMP.The inferred depositional environments range from inner plat-form and coral reef to outer platform.
4. SMP sedimentation registered three shallowing sequences fol-lowed by three deepening events during the middle Miocene toPliocene time interval. The major late middle Miocene sea levelfall (N12–N14) may correspond to the Subunit IC/IB boundaryrather than to that of the Subunit ID/IC boundary.
ACKNOWLEDGMENTS
This research used samples and data provided by the Ocean DrillingProgram (ODP). ODP is sponsored by the U.S. National Science Founda-tion (NSF) and participating countries under management of JointOceanographic Institutions (JOI), Inc. Funding for this research wasprovided by ODP France and by the French Institut National des Sci-ences de l’Univers–Centre National de la Recherche Scientifique (INSU-CNRS) “ad hoc OCEANS” Program 2001–2003. We are grateful toC. Papy and L. Marié for thin section preparation. We are grateful to F.Samrad for critically reading the manuscript. We thank J.P. André, G.Cabioch, C. Betzler, and J. Reijmer for their helpful reviews of themanuscript.

CONESA ET AL.BIOSEDIMENTARY AND PALEOENVIRONMENTAL EVOLUTION OF THE SMP 21
REFERENCES
Adams, C.G., 1968. A revision of the foraminifer genus Austrotrillina Parr. Bull. Br.Mus. (Nat. Hist.), Geol., 16:71–97.
Beauvais, L., Chaix, C., Lathuilière, B., and Lauser, L., 1993. Morphological terms fordescribing Scleractinian: preliminary list [English translation by B. Rosen]. FossilCnidaria, 22:50–72.
Benzécri, J.P., 1980. L’analyse des Données, II. L’analyse des Correspondances (3rd ed.):Paris (Dunod).
Betzler, C., 1997. Ecological control on geometries of carbonate platforms: Miocene/Pliocene shallow-water microfaunas and carbonate biofacies from the QueenslandPlateau (NE Australia). Facies, 37:147–166.
Betzler, C., Brachert, T.C., and Kroon, D., 1995. Role of climate in partial drowning ofthe Queensland Plateau carbonate platform (northeastern Australia). Mar. Geol.,123:11–32.
Betzler, C., and Chapronière, G.C.H., 1993. Paleogene and Neogene larger foramini-fers from the Queensland Plateau: biostratigraphy and environmental significance.In McKenzie, J.A., Davies, P.J., Palmer-Julson, A., et al., Proc. ODP, Sci. Results, 133:College Station, TX (Ocean Drilling Program), 51–66.
Betzler, C., Kroon, D., Gartner, S., and Wei, W., 1993. Eocene to Miocene chronos-tratigraphy of the Queensland Plateau: control of climate and sea level on platformevolution. In McKenzie, J.A., Davies, P.J., Palmer-Julson, A., et al., Proc. ODP, Sci.Results, 133: College Station, TX (Ocean Drilling Program), 281–289.
Boichart, R., Burollet, P.S., Lambert, B., and Villain, J.M., 1985. La plate-forme carbon-atée de Pater Noster (Est de Kalimantan, Indonésie): étude sédimentologique etécologique. Notes et Mémoires de Total CFP, Paris, 20:1–103.
Boudagher-Fadel, M.K., and Banner, F.T., 1999. Révision de la signification strati-graphique des étages-lettres de l’Oligocène–Miocène. Rev. Micropaléont., 42:93–97.
Boudagher-Fadel, M.K., Lord, A.R., and Banner, F.T., 2000a. Some Miogypsinidae (for-aminifera) in the Miocene of Borneo and nearby countries. Revue Paléobiol.,19:137–156.
Boudagher-Fadel, M.K., Noad, J.J., and Lord, A.R., 2000b. Larger foraminifera fromlate Oligocene–earliest Miocene reefal limestones of northeast Borneo. Rev. Esp.Micropaleontol., 32:341–361.
Brachert, T.C., Betzler, C., Davies, P.J., and Feary, D.A., 1993. Climatic change: controlof carbonate platform development (Eocene–Miocene, Leg 133, northeastern Aus-tralia). In McKenzie, J.A., Davies, P.J., Palmer-Julson, A., et al., Proc. ODP, Sci.Results, 133: College Station, TX (Ocean Drilling Program), 291–300.
Cahuzac, B., and Chaix, C., 1996. Structural and faunal evolution of Chattian–Miocene reefs and corals in western France and northeastern Atlantic Ocean. InFranseen, E., Esteban, M., Ward, W., and Rouchy, J.M. (Eds.), Models for CarbonateStratigraphy from Miocene Reef Complexes of the Mediterranean Regions. Spec. Publ.—SEPM, 5:105–127.
Chaix, C., Moissette, P., and Saint Martin, J.P., 1986. Réflexions sur les biocénoses etpaléobiocénoses en milieu récifal (Messinien d’Algérie). Bull. Mus. Natl. Hist. Nat.,Sect. C, 8(2):219–230.
Chapronière, G.C.H., 1975. Palaeoecology of Oligo–Miocene larger foraminiferida,Australia. Alcheringa, 1:37–58.
Chapronière, G.C.H., and Betzler, C., 1993. Larger foramineral biostratigraphy ofSites 815, 816, and 826, Leg 133, northeastern Australia. In McKenzie, J.A., Davies,P.J., Palmer-Julson, A., et al., Proc. ODP, Sci. Results, 133: College Station, TX (OceanDrilling Program), 39–49.
Coleman, P.J., 1963. Tertiary larger foraminifera of the British Solomon Islands,southwest Pacific. Micropaleontology, 9:1–38.

CONESA ET AL.BIOSEDIMENTARY AND PALEOENVIRONMENTAL EVOLUTION OF THE SMP 22
Cugny, P., and Rey, J., 1981. Analyse factorielle et nuées dynamiques appliquées àl’étude de biofaciès et de leurs enchaînements séquentiels: exemple de l’Albienportugais. Geobios, 14:311–321.
Davies, P.J., and Marshall, J., 1985. Halimeda bioherms—low energy reefs, northernGreat Barrier Reef. Proc. 5th Coral Reef Symp., 5:1–7.
Davies, P.J., McKenzie, J.A., Palmer-Julson, A., et al., 1991. Proc. ODP, Init. Repts., 133(Pts. 1, 2): College Station, TX (Ocean Drilling Program).
Davies, P.J., and Peerdeman, F.M., 1998. The origin of the Great Barrier Reef—theimpact of Leg 133 drilling. Spec. Publ. Int. Assoc. Sedimentol., 25:23–38.
Davies, P.J., Philip, A.S., Feary, D.A., and Pigram, C.J., 1989. The evolution of the car-bonate platforms of northeast Australia. In Crevello, P.D., Wilson, J.L., Sarg, J.F.,and Read, J.F. (Eds.), Controls on Carbonate and Basin Development. Spec. Publ.—SEPM (Soc. Sediment. Geol.), 44:233–258.
Ditlev, H., 1980. A Field Guide to the Reef-Building Corals of the Indo-Pacific: Rotterdam(W. Backhuys), 1–291.
Drew, E.A., and Abel, K.M., 1988. Studies on Halimeda, I. The distribution and speciescomposition of Halimeda meadows throughout the Great Barrier Reef province.Coral Reefs, 6:195–206.
Etter, W., 1999. Community analysis. In Harper, D.A.T. (Ed.), Numerical Palaeobiology:Chichester (J. Wiley and Sons), 285–360.
Fournier, F., Montaggioni, L., and Borgomano, J., 2004. Paleoenvironments and high-frequency cyclicity from Cenozoic southeast Asian shallow-water carbonates: acase study from the Oligo–Miocene buildups of Malampaya (offshore Palawan,Philippines). Mar. Petrol. Geol., 21:1–21.
Hallock, P., and Glenn, E.C., 1986. Larger foraminifera: a tool for paleoenvironmentalanalysis of Cenozoic carbonate depositional facies. Palaios, 1:55–65.
Haq, B.U., Hardenbol, J., and Vail, P.R., 1988. Mesozoic and Cenozoic chronostratig-raphy and cycles of sea-level change. In Wilgus, C.K., Hastings, B.S., Kendall, C.G.St.C., Posamentier, H.W., Ross, C.A., and Van Wagoner, J.C. (Eds.), Sea-LevelChanges—An Integrated Approach. Spec. Publ.—SEPM (Soc. Sediment. Geol.), 42:72–108.
Hennebert, M., and Lees, A., 1991. Environmental gradients in carbonate sedimentsand rocks detected by correspondence analysis: examples from the Recent of Nor-way and the Dinantian of southwest England. Sedimentology, 38:623–642.
Hottinger, L., 1983. Processes determining the distribution of larger Foraminifera inspace and time. Utrecht Micropaleontol. Bull., 30:239–253.
Isern, A.R., McKenzie, J.A., and Müller, D.W., 1993. Paleoceanographic changes andreef growth off the northeastern Australian margin: stable isotopic data from Leg133, Sites 811 and 817, and Leg 21, Site 209. In McKenzie, J.A., Davies, P.J., Palmer-Julson, A., et al., Proc. ODP, Sci. Results, 133: College Station, TX (Ocean DrillingProgram), 263–280.
Liu, K., Pigram, C.J., Paterson, L., and Kendall, C.G.St.C., 1998. Computer simulationof a Cainozoic carbonate platform, Marion Plateau, northeast Australia. Spec. Publ.Int. Assoc. Sedimentol., 25:145–161.
Loeblich, A.R., and Tappan, H., 1988. Foraminiferal Genera and Their Classification(Vol. 2): New York (Van Nostrand Reinhold Co.).
Marshall, J.F., Tsuji, Y., Matsuda, H., Davies, P.J., Iryus, Y., Honda, N., and Satoh, Y.,1998. Quaternary and Tertiary subtropical carbonate platform development on thecontinental margin of southern Queensland, Australia. Spec. Publ. Int. Assoc. Sedi-mentol., 25:163–195.
Martín, J.M., and Braga, J.C., 1993. Eocene to Pliocene coralline algae in the Queen-sland Plateau (northeastern Australia). In McKenzie, J.A., Davies, P.J., Palmer-Jul-son, A., et al., Proc. ODP, Sci. Results, 133: College Station, TX (Ocean DrillingProgram), 67–74.
Martín, J.M., Braga, J.C., Konishi, K., and Pigram, C.J., 1993. A model for the develop-ment of rhodoliths on platforms influenced by storms: middle Miocene carbonates

CONESA ET AL.BIOSEDIMENTARY AND PALEOENVIRONMENTAL EVOLUTION OF THE SMP 23
of the Marion Plateau (northeastern Australia). In McKenzie, J.A., Davies, P.J.,Palmer-Julson, A., et al., Proc. ODP, Sci. Results, 133: College Station, TX (OceanDrilling Program), 455–460.
McKenzie, J.A., and Davies, P.J., 1993. Cenozoic evolution of carbonate platforms onthe northeastern Australian margin: synthesis of Leg 133 drilling results. InMcKenzie, J.A., Davies, P.J., Palmer-Julson, A., et al., Proc. ODP, Sci. Results, 133:College Station, TX (Ocean Drilling Program), 763–770.
Nebelsick, J.H., 1992. Components analysis of sediment composition in earlyMiocene temperate carbonate from the Austrian Paratethys. Palaeogeogr., Palaeocli-matol., Palaeoecol., 91:59–69.
Noad, J., 2001. The Gomantong limestone of eastern Boreneo: a sedimentologicalcomparison with the near-contemporaneous Luconia Province. Palaeogeogr.,Palaeoclimatol., Palaeoecol., 175:273–302.
Pigram, C.J., 1993. Carbonate platform growth, demise and sea level record: MarionPlateau, northeast Australia [Ph.D. dissert.]. Australian National Univ., Canberra.
Pigram, C.J., Davies, P.J., Feary, D.A., and Symonds, P.A., 1992. Absolute magnitude ofthe second-order middle to late Miocene sea-level fall, Marion Plateau, northeastAustralia. Geology, 20:858–862.
Pomar, L., 2001. Ecological control of sedimentary accommodation: evolution from acarbonate ramp to rimmed shelf, upper Miocene, Balearic Islands. Palaeogeogr.,Palaeoclimatol., Palaeoecol., 175:249–272.
Pomar, L., Ward, W.C., and Green, D.G., 1996. Upper Miocene reef complex of theLlucmajor area, Mallorca, Spain. In Franseen, E.K., Esteban, M., Ward, W.C., andRouchy, J.-M. (Eds.), Models for Carbonate Stratigraphy from Miocene Reef Complexesof Mediterranean Regions. Concepts Sedimentol. Paleontol., 5:191–225.
Robertson, A.H.F., 1998. Miocene shallow-water carbonates on the Eratosthenes Sea-mount, easternmost Mediterranean Sea. In Robertson, A.H.F., Emeis, K.-C., Richter,C., and Camerlenghi, A. (Eds.), Proc. ODP, Sci. Results, 160: College Station, TX(Ocean Drilling Program), 419–436.
Saint Martin, J.-P., André, J.-P., Müller, J., and Lapointe, P., 1997. Géométrie de laplate-forme carbonatée d’âge Messinien de Malte: mise en évidence de l’élévationdu plan d’eau méditerranéen au cours du Messinien. C. R. Acad. Sci., Ser. IIa: Sci.Terre Planetes, 324:729–736.
Shipboard Scientific Party, 2002a. Leg 194 summary. In Isern, A.R., Anselmetti, F.S.,Blum, P., et al., Proc. ODP, Init. Repts., 194: College Station TX (Ocean Drilling Pro-gram), 1–88.
Shipboard Scientific Party, 2002b. Sites 1196 and 1199. In Isern, A.R., Anselmetti, F.S.,Blum, P., et al., Proc. ODP, Init. Repts., 194, 1–159 [CD-ROM]. Available from: OceanDrilling Program, Texas A&M University, College Station TX 77845-9547, USA.
Sokal, R.R., and Rohlf, F.J., 2003. Biometry: The Principles and Practice of Statistics in Bio-logical Research: New York (W.H. Freeman).
Vaughan, T.W., and Wells, J.W., 1943. Revision of the suborders, families and generaof the Scleractinia. Geol. Soc. Am., 44:1–363.
Veron, J.E.N., 2000. Corals of the World: Townsville, M.C. (Australian Inst. Mar. Sci.).Wells, J.W., 1956. Part F. Scleractinia. In Moore, R.C. (Ed.), Treatise on Invertebrate Pale-
ontology: New York (Geol. Soc. Am.), F328–F444.

CONESA ET AL.BIOSEDIMENTARY AND PALEOENVIRONMENTAL EVOLUTION OF THE SMP 24
Figure F1. Location maps of ODP Leg 194 Sites 1196 and 1199 and Leg 133 sites with multichannel seismiclines (from Shipboard Scientific Party, 2002a, modified).
100
Barrier
Great
Reef
Coral Sea Basin
Coral Sea Basin
Townsville
Queensland
Trough
Marion Cato Trough
Plateau1194
824
209
811-825
812-814
822
823
817 818815
816
819- 821
1193 1195
1198 1199
1196 1197
1192
200
100
100
100
500
1000 1500
2000
2000
Sydney
N
N
Australia
Trough
151°E 152° 153° 154°
21°
20°S
22°
MAR07MAR20
MAR04
Site 1199Site 1196
MAR70
20°
15°S
QueenslandPlateau
2000
50 km
145°E 155°150°
Cairns
Townsville
Northern
Marion
Platform
Southern
Marion
Platform

CONESA ET AL.BIOSEDIMENTARY AND PALEOENVIRONMENTAL EVOLUTION OF THE SMP 25
Figure F2. Seismic transect of the Southern Marion Plateau showing the position of Sites 1196 and 1199and their respective lithostratigraphic units (Shipboard Scientific Party, 2002a). MS = megasequence.
Basement
Site 1196Site 1199(projected)
304.2 mbsl315.9 mbslDepth:
MS
B M
S D
MS
C
MS
B M
S D
MS
C
Line MAR07
Tw
o-w
ay tr
avel
time
(s) IC
ID
IIIA
IIIBIIICIIID
IVV
ID
IA IA
IIA IIA
IIB
III
IB
IIB
IB
IC
Velocity pull upMultiples
10 km
Southern Marion PlatformPeriplatform-hemipelagic deposits
Periplatform-hemipelagic deposits
SENW
1.0
0.6
0.4
0.8

CONESA ET AL.BIOSEDIMENTARY AND PALEOENVIRONMENTAL EVOLUTION OF THE SMP 26
Figure F3. Schematic diagram representing the lithostratigraphy and the architecture of the SMP (figureF15E in Shipboard Scientific Party, 2002a). MS = megasequence.
NW
IIA ID
IA-IC
IIB
IIIIV
SE
Basement
Site 1196Site 1199
304.2 mbsl315.9 mbslDepth: 5 km
Southern Marion Platform
Platform growth phases
Reef rim Periplatform-hemipelagic deposits
Periplatform-hemipelagic deposits
MS D
MS C
MS B
MS D
MS C
MS B
Regional seismic megasequencesof Pigram (1993): MS B to MS D
Lithologic units and subunitsof the platform: I to IV
(1) early Miocene dolomitic Platform
(2) (early?) middle Miocene Platform
(3) middle to late Miocene Platform

CO
NE
SA E
T AL.
BIO
SED
IME
NT
AR
Y A
ND
PA
LE
OE
NV
IRO
NM
EN
TA
L EV
OL
UT
ION
OF T
HE SM
P2
7
Figure agglutinated.
UnitHol
am (cluster analysis)
194- reasing correlationIA 1199IB 1196BIIB 1199A
1199A1199A1199A
ID 1199AIIB 1199A
1199A1196A1199A1196A1199A1199A
IIA 1196AIA 1199AIC 1196A
1196A1196A1199A
ID 1199AIB 1196BIIB 1199A
1196A1199A1196A1196B1196A1196A1196A1196A1196B
ID 1199A1199A1199A1196B1196A1196A1196A1199A1199A1199A1199A1199A1199A1199A
IC 1196A1199A1199A1196B1196A
ID 1196A1199A1196A11961196B1199A1196A
IA 1196A
IA
ID
IB
IA
IIA
IA
IIA
IIA
IA
IIB
IA
F4. Microfacies matrix with percentage values of bioclasts and ascendant cluster analysis dendrogram. Aggl. =
Small benthic foraminifers Larger benthic foraminifers
Aggl.
Ope
rcul
ina
Ope
rcul
inel
la
Cyc
locl
ypeu
s
e, core, section, interval (cm)
Dendogr
DecA-13R-3, 115-119 6 6 4 1 5 9 2 4
-17Z-1 , 54-57 78.5 19.5 1 1-39R-1, 56-60 8 1 1 5 1 3-9R-4, 12-16 7 6 2 0 4-1R-1, 32-34 99.3 0.7-1R-1, 3-6 93.5 5.4 0.4 0.7-17R-1, 23-26 8 0 2 1 8-35R-1, 13-17 7 2 2 8-18R-3, 21-26 8 6 1 4-18R-3, 75-78 8 6 1 4-14R-1, 137-142 93.7 6.3-14R-1, 42-46 9 3 7-12R-5, 93-95 8 8 4 8-11R-1, 16-20 87.9 7.8 0.5 1.2 1.2 1.4-33R-1, 48-53 26.3 3.7 0.7 40.3 5.7 5.7 1 0.3 2.3 0.7 1 0.4 4.7 4.6 1 1 0.7-5R-2, 127-131 59.4 22.1 5.1 1.1 0.4 2.1 1.1 0.4 7.1 1.4-15R-1, 0-3 17.8 1.6 24.1 30.8 1.3 1.3 1.1 1.3 0.8 0.3 0.6 1.6 12.3 0.8 4.3-34R-1, 96-99 2.8 26.8 9.5 1.4 4.1 4.1 1.4 1.4 1.4 33.4 4.1 9.4-20R-1, 45-47 16.4 7.1 7.1 3.1 6.3 3.1 13.1 7.1 23.1 13.7-19R-1, 0-4 13.6 20.3 9.6 4.3 12.3 1 9 8.3 1.6 1 1-16R-3, 40-44 6 7 2 6 1 2 1 1 3 8-20Z-1, 16-20 82.7 0.3 7.3 6 1 0.7 0.3 1 0.7-40R-1, 27-31 45.3 1 38.3 5.3 0.7 0.3 1 1 1.3 1.3 1 0.7 0.3 0.7 1.7-35R-1, 1-5 29.7 7.4 1 6 1 6 3 5.4 0.7 1 2 5 6.7 1 1.4 0.4 1.4 0.4 2.7-31R-1, 0-3 62.7 2.3 7 11.7 1.7 3 0.3 0.3 0.3 2.7 0.7 2 0.3 1.3 1 0.7 2-32R-1, 11-14 28.3 4.3 23.3 2.3 1.3 16.3 1.2 4.3 1.2 7.3 1.3 1.3 5.3 1.3 1.3-46Z-1, 14-17 2 8 0.4 2 4 5.7 0.4 13.4 2.7 0.4 3.3 6.7 5 1 1.7 2.4 1.4 1 2.7-25R-1, 50-52 30.3 9.7 3 3 1.3 0.3 7.4 1.7 1 2 5.4 1.4 0.7 0.4 1.7 1.7 0.7 0.4 1-27R-1, 7-10 2 0 8.3 0.7 1 6 7.3 1 6.3 1.3 1 7.7 17.7 6.3 1.3 1 2.3 1.7-33R-2, 57-60 20.3 10.3 3 9.3 7.7 9 3.7 0.7 1.3 0.3 1 9.7 9 5.7 4.3 0.7 0.7 1 2.3-24R-1, 13-17 13.4 2.8 24.1 5.4 1.8 2.4 13.8 2.8 0.4 2.8 10.8 1.8 5.4 4.1 0.8 2.8 0.4 0.4 4.1-33Z-1, 3-5 5 6 2 4 3 2 4 1 2 3 4 1-16R-4, 91-96 7 8 9 1 0 3-10R-3, 58-60 40.7 4 1 0.7 2.7 0.3 1 2.3 11.3-4R-6, 138-140 64.4 31.7 0.7 0.7 1.4 0.7 0.4-14Z-1, 68-73 81.1 3.1 7.4 0.8 0.4 0.8 0.8 5.8-13R-2, 38-41 82.3 2.3 2.7 7.3 0.3 5-11R-1, 24-28 73.3 4.3 1 3 3 0.7 0.3 0.7 4.7-10R-1, 8-12 8 2 3.7 1 1.7 7.7 1 1 2-33R-1, 11-13 45.3 2.3 21.3 20.3 2.7 0.7 0.3 0.7 0.7 1 1.7 2.7 0.3-34R-1, 28-31 71.3 0.3 14.4 1.3 1.3 0.3 0.7 5 1.3 2.7 1.3-39R-1, 91-94 68.7 1.3 0.3 6.7 1 0.7 1 1.7 3 1.3 1 7 6.3-40R-1, 9-13 58.7 1.7 0.7 7 4 1 1 0.7 2.7 8 1 1.3 11.7 0.7-41R-1, 19-22 32.4 3 6.7 13.7 2 8 3 1.4 1.4 0.7 5.7 2 0.4 1 7.7 7.7 3-37R-1, 2-6 49.7 1.3 15.7 5.3 4.3 4 0.3 2 0.3 13.3 2.7 1-42R-1, 83-85 54.3 1 1.3 7.7 0.7 4.7 2 6.7 1.7 0.3 2.7 11.7 5.3-16R-1, 25-27 68.4 8.4 4.1 0.4 1 0.4 1.7 0.4 6 0.7 1 0.4 0.7 2 3.1 1.4-2R-3, 20-23 54.8 30.8 4.8 0.8 2.8 1.8 1.8 2.5-6R-3, 69-72 63.3 11.7 4 3 16.3 1.7-4R-1, 28-30 3 3 0.3 14.3 5 0.7 5 0.7 0.3 0.7 6.3 15.7 1.3 0.3 5.3 3.3 7.7-5R-1, 70-72 54.4 12.4 5.4 0.4 9.1 13.1 0.4 1.4 0.7 1.1 1.7-18R-2, 15-18 70.1 3.1 16.4 4.1 1.4 1.1 0.4 1.8 1.4-3R-1, 77-81 78.7 0.7 7.7 3 1.3 3.7 0.7 3.3 1-7R-1, 106-109 67.4 6.1 1.4 10.8 0.8 0.4 0.8 3.8 5.8 1.1 1.8
A-5R-2, 74-77 47.7 4.7 18.4 1.7 1.4 0.7 4.1 9.1 6.4 4.4 1.4-1R-3, 1-6 29.4 29.4 5.1 4.4 1.6 0.8 0.4 0.6 0.8 1.3 1.2 1.1 8.4 1.8 4 1 8.8-20R-1, 17-22 20.1 3.1 2.7 18.1 4.1 1.7 1.7 3.1 0.4 0.7 2.1 1.4 11.7 2.1 15.7 4.1 1.7 1.4 1.1 2.7 0.4-21R-1, 119-121 2 6 2 3 4.7 1 6 5.3 1.7 2 0.3 3 1.3 3.3 6.7 0.7 6 1 2 2 3 1.7 3.7 2.3 2.3-1R-1, 35-40 76.4 1.1 0.4 4.1 4.8 0.4 0.8 0.4 0.8 2 3.1 3 2.4 0.8
Gas
trop
ods
B: Corals
Mio
gyps
ina
Alv
eolin
ids
Hya
line
encr
ustin
g fo
ram
.
Am
phis
tegi
na
Lepi
docy
clin
a
Sm
all h
yalin
e fo
ram
.
Ech
inod
erm
s
Biv
alve
s
Rot
aliid
s
Pla
nkto
nic
fora
min
ifers
Mic
rofa
cies
MIO
PLF
A: Porcellaneous foraminifers
C: Miogypsina-Lepidocyclina
D: Halimeda-Nummulitids-Amphistegina
E: Halimeda-Lepidocyclina
OP
A
Algae Invertebrates
Nummulitids
Red
alg
ae
Gen
icul
ate
red
alga
e
Gre
en a
lgae
(H
alim
eda)
Cor
als
Bry
ozoa
ns
Sm
all a
gglu
tinat
ed fo
ram
.
SO
R
HE
F
AM
P
AU
S
ALVBIV
OP
E
GA
S
CY
C
SE
R
BR
Y
SA
F
RO
T
SH
F
MIL
F: Red algae-echinoderms
Mili
olid
s
Aus
trot
rillin
a
Sor
itiid
s
LEP
HyalinePorcellaneousHyaline
Ser
pulid
s
RA
L
GR
A
HA
L
CO
R
EC
H

CONESA ET AL.BIOSEDIMENTARY AND PALEOENVIRONMENTAL EVOLUTION OF THE SMP 28
Figure F5. Lithostratigraphic columns with biosedimentological data, microfacies, and environment evo-lution. A. Site 1196. Cor. = coral, infl. = influence, PF = platform, Exp. = exposure, limest. = limestone. (Con-tinued on next page.)
Hole1196A
late
Mio
cene
mid
dle
Mio
cene
(ear
ly?)
-mid
dle
Mio
.
Lith
olog
icun
itLo
ggin
gun
it
AgeHole
1196B
Paleontologicalassemblage
lithology
Depositionalsetting Water
depth
1R2R
3R4R5R
6R
7R8R
9R10R11R12R
1R
IA
IB
IC
ID
IIA
IIB
IIIB
2R
3R4R5R
6R
7R8R9R
10R
11R12R13Z16Z
20Z21Z
24Z26Z
28Z30Z32Z34Z
36Z
38Z
41Z
43Z
46Z48Z
51Z
13R
14R15R
16R
17R18R
19R20R21R
22R23R
24R25R26R
27R28R
29R
30R
31R32R
33R34R
35R
36R37R38R39R
40R
41R42R
43R
44R
-304.2 mbsf
42R400
TextureSize Color
Silt
Rud
ite
San
d
PR
WBY
Pby
LgWP G Ff c R B E DF + -B
OuterPlatform
reefs
Inner
Microfacies
OuterPlatform
Coral Reef
Coral Reef
Outer PF
OuterPlatform
InnerPlatform
(scatteredcoral
patches)C
oral
ree
f inf
luen
ceC
oral
ree
f inf
l.C
oral
ree
fin
fluen
ce
Deepening
Deepening
Deepening
Shallowingsequence 3
Shallowingsequence 2
Shallowingsequence 1
C A
Fossils (Hole 1196A; Site 1199):
rhodoliths (big; small: <2 cm)
rhodoliths on coral nucleus
Fossil frequency
LithologyLog information
abundant
branching red algae pieces
rhodoliths with bryozoan
common
bryozoans
serpulids
echinoid fragments
hyaline, larger benthic forms
porcellaneous, small andlarger benthic forminifers
seagrass root?
massiveand lamellar
red algae fragments
gastropods
present
Halimeda plates
bivalves
boundstone
fragments
solitary corals
branching andundetermined
Coral colonies
dolostone
not hatched: limest.
dolomiticlimestone
meters belowseafloor (mbsf)
corerecovery
corenumber
Subunits
boundary(mbsf)
: grayfor 1196B
SampleHolesA B
c
c
c
c
c cc
cc
cc
IIB
IIIA
-117.2
-125.9
-162.8
-182.2
-335.9
-412.7
-345.8
IIBIIB-335.9
-412.7
-130.5
-145
-184.9
-122.9
?
?
?1
2
4
5
6
3
Exposure?
Exp.?
Exposure?
pectinids
?
1
2
3
4
Dep
th (
mbs
f)
0
50
100
150
200
250
300
350
400
A

CONESA ET AL.BIOSEDIMENTARY AND PALEOENVIRONMENTAL EVOLUTION OF THE SMP 29
Figure F5 (continued). B. Site 1199.
Hole1199A
late
Mio
cene
mid
dle
Mio
cene
(ear
ly?)
-mid
dle
Mio
cen
eIA
IBIC
ID
IIA
IIB
III
1R
-315.9 mbsf
2R4R5R6R
7R8R9R
10R11R12R
13R
14R
15R16R17R18R19R20R21R
22R
23R
24R25R
26R27R28R
29R30R
31R
32R
33R
34R
35R36R37R38R
39R40R
41R
42R
43R
44R
45R
Microfacies
Cor
al r
eef i
nflu
ence
Boundary Samples
W = wackestoneP = packstoneG = grainstoneF = floatstoneR = rudstoneB = boundstone
Silt = 4-62.5 m; Sand = 62.5 m-2 mm;f = fine; c = medium to coarse (>0.5 mm);rudite: gravel-pebble (>2 mm)
A to F: microfacies defined by clusteranalysis and ordinated according thecorrespondence factorial analysis
Hole 1196B
Textures Size (Ward's classification)
Facies
texture of matrix
main texture
c
c
cc
c
ID
-106.6-114.1
-121.9
-159.8
-285
-410
lithologic
iron-stainedmicritic crust(exposure?) exposure?+ hard-ground
suspected(not retrieved)
Lg = light gray; B, Y = brown, yellow;Pb, y = (very) pale brown (yellow);W = white; P, R = pink(ish), red(dish).
Color
?
?
? ?
+ -
Deepening
Deepening
Shallowingsequence 3
Shallowingsequence 2
Shallowingsequence 1
OuterPlatform
Coral Reef?
Coral Reef
Outer PF
OuterPlatform
InnerPlatform
(scatteredcoral
patches)
1
2
4
5
6
3
Exposure?
Exposure?
Exp.?
Exp.?
?
Coral reefinfluence
c
1
2
3
4
0
50
100
150
200
250
300
350
400
Dep
th (
mbs
f)
Lith
olog
icun
itLo
ggin
gun
it
Age
Paleontologicalassemblage
lithology
Depositionalsetting Water
depth
TextureSize Color
Silt
Rud
ite
San
d
PR
WBY
Pby
LgW P G Ff c R B E DF B
OuterPlatform
reefs
Inner
DeepeningC AS
ampl
eB
thin sectionspoint-countedcorals

CONESA ET AL.BIOSEDIMENTARY AND PALEOENVIRONMENTAL EVOLUTION OF THE SMP 30
Figure F6. Correlation of uranium and resistivity logs of Holes 1196A and 1199A (figure F70 in ShipboardScientific Party, 2002b).
Medium resistivity
Deep resistivity
Lith
olog
ic u
nit
Logg
ing
unit
Cor
eR
ecov
ery
0.3 500(Ωm)
0.3 500(Ωm)
Shallow resistivity
Deep resistivity
0.2 200(Ωm)
0.2 200(Ωm)
10R11R
12R
13R
14R
15R
16R
17R
18R
19R
20R
21R
22R
23R
24R
25R
26R
27R
28R
29R
30R
31R
32R
33R
34R
35R
36R
37R
38R
39R
40R
41R
42R
43R
44R
45R
1
2
3
IA
IBIC
ID
IIA
IIB4
III
(ppm)0 12UraniumSite 1199
315.9 mbsf
Site 1196304.2 mbsf
Distance~3 km
(ppm)0 15Uranium
Lith
olog
ic u
nit
Logg
ing
unit
Cor
eR
ecov
ery
IA
IB
IC
ID
IIA
IIBIIIA
IIIB
IIIC
1
2
3
4
?
8R9R
10R
11R
12R
13R
14R
15R
16R
17R
18R
19R
20R
21R
22R
23R
24R
25R
26R
27R
28R
29R
30R
31R
32R
33R
34R
35R
36R
37R
38R
39R
40R
41R
42R
43R
44R
45R
46R
47R
48R
49R
50R
Dep
th (
mbs
f)
Dep
th (
mbs
f)
Limestone Dolomitic limestone Dolostone
100
150
200
250
300
350
400
450
Hole 1196A Hole 1199A
100
150
200
250
300
350
400

CONESA ET AL.BIOSEDIMENTARY AND PALEOENVIRONMENTAL EVOLUTION OF THE SMP 31
Figure F7. Correspondence factor analysis (CFA) planes of axes 1-2 and 1-3 with microfacies and environ-mental interpretation. The variance of each axis is given in percentage. Circled groups of samples = mainmicrofacies (A–F) defined by the cluster analysis. See Table T2, p. 37, for variable definitions. Variables inbold with arrow and absolute contribution in percentage = significant variables according to specified fac-torial axes.
INNER PLATFORM
OUTER PLATFORM
6A01.1
6A05.1
6A05.2
6A07.1
6A10.1
6A11.1
6A13.2
6A14.1 / 9A14.1
6A15.1
6A16.1
6A21.1
6A24.1
6A25.1
6A27.1
6A32.1
6A33.1
6A33.2
6A34.1 6A35.1
6B01.3
6B04.1
6B14.1
6B20.1
6B33.1
6B46.1
9A01.1a
9A01.1b
9A03.1
9A04.6
9A05.2
9A06.3
24.52%
10.77%
14.77%
9A02.3
9A09.4 9A10.3
9A11.1
9A12.5
9A13.3
9A16.3
9A16.4
9A17.1
9A19.1
9A20.1
9A31.1
9A33.1
9A34.1
9A35.1
9A37.1
9A39.1a
9A39.1b9A40.1a
9A40.1b
9A41.1
9A42.1
6B17.1
6A18.2
RAL
GRA
HEF
HAL
COR
SER
BIV
GAS
ECH
BRY
FPLSAF
SHF
AMP
ROT
MIL
AUS
SOR
ALV
OPE
OPA
CYC
LEP
MIO
15.59%
28.59%
30.93%
6A18.3 / 9A18.3 6A20.1
F1
24.52% F1
F1
F3
RAL
GAR
HEF
HAL
COR
SER
BIV
GAS
ECH
BRY
PLF
SAFPFH
AMP
ROT
MIL
AUS
SOR
ALV
OPE
OPACYC
LEPMIO
6A01.1 6A05.1
6A05.2
6A07.1
6A10.1
6A11.1
6A13.2
6A15.1
6A16.1
6A18.2 6A20.1
6A21.1
6A24.1
6A25.1 6A27.1
6A32.1
6A33.1
6A33.2
6A34.1 6A35.1
6B01.3
6B04.1
6B14.1
6B17.1
6B20.1
6B33.1
6B46.1
9A01.1a
9A01.1b
9A02.3
9A03.1
9A04.6
9A05.2
9A06.3
9A09.4
9A10.3
9A11.1
9A12.5
9A13.3
6A14.1 / 9A14.1
9A16.3
9A16.4
9A17.1
6A18.3 / 9A18.3
9A19.1
9A20.1
9A31.1 9A33.1
9A34.1
9A35.1
9A37.1
9A39.1a
9A39.1b
9A40.1a9A40.1b
9A41.1
9A42.1
F211,5% 9,25%
9,49%
5,24%
6,99%4,39%
7,01%
5,35%10,04%
6,96%
17,84%
18,87%
20,43%
RAL
GRA
HEF
HAL
COR
SER
BIV
GAS
ECH
BRY
FPL
SAF
SHF AMPROT
MILAUS
SOR
ALV
OPE
OPA
CYC
LEP
MIOF3
F1
IIBIIA
IA
A: Porcellaneous foraminifers
A: Porcellaneous foraminifers
B: Coral
B: Coral
A
B
F
F
F
A
B
A
E
D
C
A
B
F
ED
C
C: Miogyspina Lepidocyclina
C: Miogyspina Lepidocyclina
ID
IBIC
1199 1196Site
E: Rhodoliths- Halimeda- Lepidocyclina
E: Rhodoliths- Halimeda- Lepidocyclina
F: Rhodoliths- Echinoderms
F: Rhodoliths- Echinoderms
D: Rhodoliths-Halimeda- Nummulitids- Amphistegina
D: Rhodoliths- Halimeda- Nummulitids- Amphistegina
Subunit
IIBIIA
IA
ID
IBIC
1199 1196SiteSubunit
CFA: Log (3X+1) X = percent24 variables 59 thin sections
2
ENERGYDEPTH
ENERGYDEPTH
CORALINFLUENCE
INNER PLATFORM
OUTER PLATFORM
CORAL REEF
RAL
GRA
HEF
HAL
COR
SER
BIV
GAS
ECH
BRY
PLF
SAFSHF
AMPROT
MILAUS
SOR
ALV
OPE
OPA CYC
LEPMIO
F2

CO
NE
SA E
T AL.
BIO
SED
IME
NT
AR
Y A
ND
PA
LE
OE
NV
IRO
NM
EN
TA
L EV
OL
UT
ION
OF T
HE SM
P3
2
Figure mn. Agg. = agglutinated.
20 (%)101010101020 20101020
AUS SOR ALV HEF AMP OPE OPA CYC LEP MIO PLF
Hya
line
encr
us-
ting
fora
min
ifers
Pla
nkto
nic
fora
min
ifers
Sor
itids
Alv
eolin
ids
Am
phis
tegi
na
Ope
rcul
ina
Mio
gyps
ina
Ope
rcul
inel
la
Lepi
docy
clin
a
Cyc
locl
ypeu
s
Aus
trot
rillin
a
Nummulitids
Larger benthic foraminifers
llaneous Hyaline
0
50
100
150
200
250
300
350
Dep
th (
mbs
f)
F8. Frequency of microfacies biogenic components vs. Site 1196 lithostratigraphic colu
Hole1196A U
nit
Sam
ple
Mic
rofa
cies
1196
A11
96B
Hole1196B
1R
2R
3R4R
5R
6R
7R
8R
9R
10R
11R
12R
1R
IA
IB
IC
ID
IIA
2R
3R4R
5R
6R
7R
8R
9R
10R
11R12R13Z16Z
20Z21Z
24Z
26Z
28Z30Z32Z
34Z
36Z
38Z
41Z
43Z
46Z48Z
51Z
13R
14R
15R
16R
17R
18R
19R
20R21R
22R
23R
24R
25R
26R
27R
28R
29R
30R
31R
32R
33R34R
35R
36R IIB
-117.2
-125.9
-162.8
-182.2
-335.9
-345.8
-130.5
-145
-184.9
-122.9
10101010 1020 20 2020 4040404040 20 20 200 100
RAL GRA HAL COR ECH BIV GAS SER BRY SAF ROT SHF MILR
ed a
lgae
Cor
als
Ech
inod
erm
s
Biv
alve
s
Gas
trop
ods
Ser
pulid
s
Bry
ozoa
ns
Rot
aliid
s
Sm
all a
gglu
tina-
ted
fora
min
ifers
Sm
all h
yalin
efo
ram
inife
rs
Mili
olid
s
Gen
icul
ate
red
alga
e
Gre
en a
lgae
(Hal
imed
a)
Small benthic foraminifers
PorceHyalineInvertebratesAlgae
Agg.
FE
D
D
F
C
E
EE
D
D
D
D
D
B
D
AA
A
A
AA
AA
A
A
AB
F
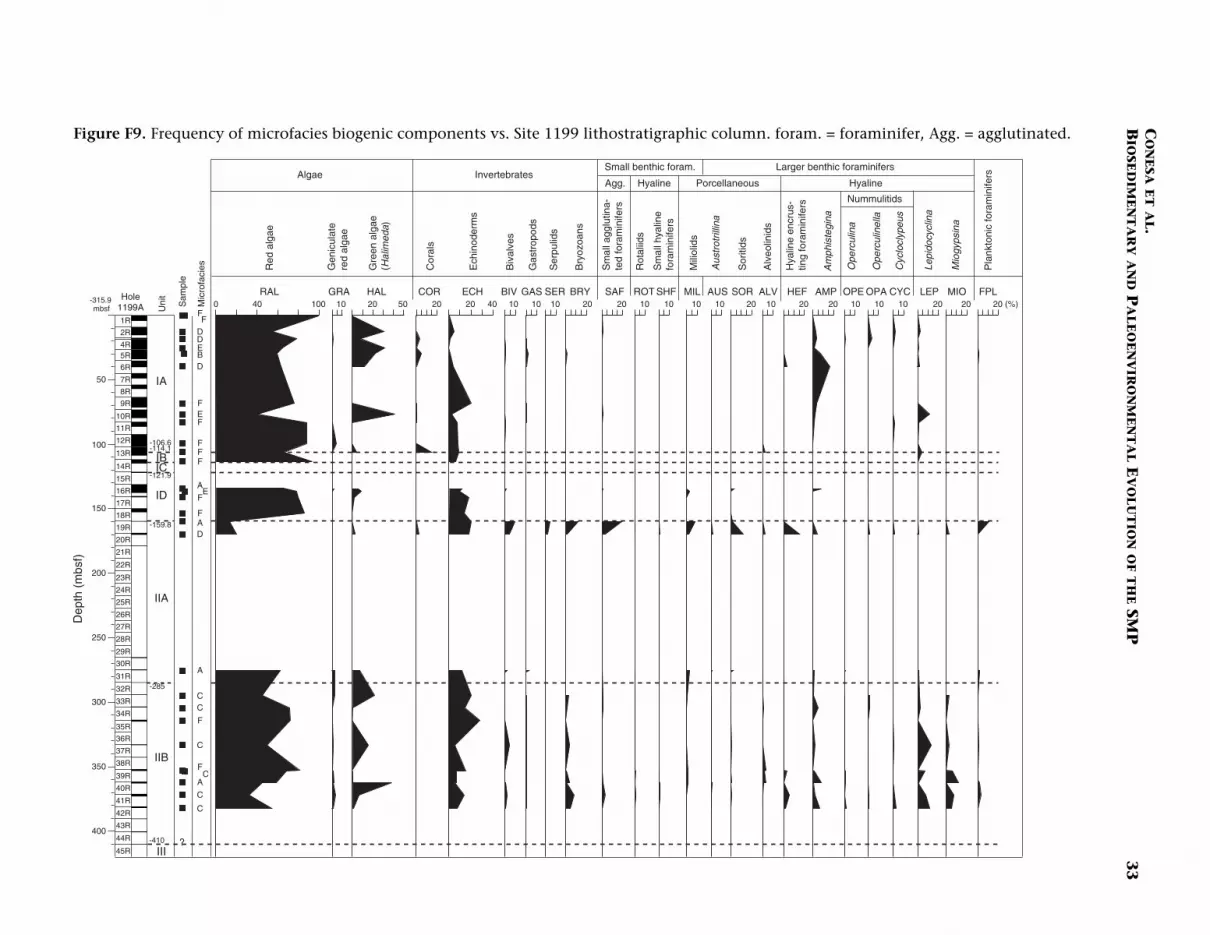
CO
NE
SA E
T AL.
BIO
SED
IME
NT
AR
Y A
ND
PA
LE
OE
NV
IRO
NM
EN
TA
L EV
OL
UT
ION
OF T
HE SM
P3
3
Figure ifer, Agg. = agglutinated.
-315.9 mbsf
YC LEP MIO FPL10 20 20 20 (%)
Pla
nkto
nic
fora
min
ifers
Mio
gyps
ina
Lepi
docy
clin
a
Cyc
locl
ypeu
s
s
50
100
150
200
250
300
350
400
Dep
th (
mbs
f)
F9. Frequency of microfacies biogenic components vs. Site 1199 lithostratigraphic column. foram. = foramin
Hole1199A U
nit
Sam
ple
Mic
rofa
cies
IA
IBIC
IIA
IIB
III
1R
2R
4R5R
6R
7R
8R
9R
10R
11R
12R
13R
14R
15R
16R
17R
18R
19R
20R
21R
22R
23R
24R
25R
26R
27R
28R
29R
30R
31R
32R
33R
34R
35R
36R
37R
38R
39R
40R
41R
42R
43R
44R
45R
ID
-106.6-114.1
-121.9
-159.8
-285
-410 ?
RAL GRA HAL COR ECH BIV GAS SER BRY SAF ROT SHF MIL AUS SOR ALV HEF AMP OPE OPA C100400 10 5020 4020 10 1010 10 10 10 10 10 10 1020 20 20202020
Red
alg
ae
Cor
als
Ech
inod
erm
s
Biv
alve
s
Gas
trop
ods
Ser
pulid
s
Bry
ozoa
ns
Rot
aliid
s
Sm
all a
gglu
tina-
ted
fora
min
ifers
Sm
all h
yalin
efo
ram
inife
rs
Hya
line
encr
us-
ting
fora
min
ifers
Mili
olid
s
Sor
itids
Alv
eolin
ids
Am
phis
tegi
na
Ope
rcul
ina
Ope
rcul
inel
la
Aus
trot
rillin
a
Gen
icul
ate
red
alga
e
Gre
en a
lgae
(Hal
imed
a)
Nummulitid
Larger benthic foraminifersSmall benthic foram.
Porcellaneous HyalineHyalineInvertebratesAlgae
Agg.
FF
E
F
F
FE
ED
F
F
A
A
B
FF
FC
F
A
A
D
D
D
C
C
C
C
C

CONESA ET AL.BIOSEDIMENTARY AND PALEOENVIRONMENTAL EVOLUTION OF THE SMP 34
Figure F10. Traces of well-defined seismic reflections of Line MAR07 at Site 1196 with corresponding lithos-tratigraphic units (seismic data from fig. F74 in Shipboard Scientific Party, 2002b).
Line MAR07
0.40
100 m
0
100
200
300
400
500
600
666
0.60
0.80
Dep
th(m
)
Site 1196
IA
0Site 1196
Set of progradingclinoforms
Lobe-shaped bodies
Coral patch reef?
100
200 m
IB
IC
ID
IIA
IIB
IIIA
IIIB
IIIC
IIID
IVV
Two-
way
trav
eltim
e (s
)
cr
cr
Lith
olog
icun
it
Seismic interpretation

CONESA ET AL.BIOSEDIMENTARY AND PALEOENVIRONMENTAL EVOLUTION OF THE SMP 35
Figure F11. Reconstructions of the depositional environments at the scale of sedimentary bodies (1 km)from the Southern Marion Platform.
B/D
A B
B
B
B/D
FE
D
A/C
C
Coral reefCoralpatch reefs
Coralpatch reefs
0
1 km
0
1 km
<60 m?
Austrotrillina
Miogypsina
Lepidocyclina
Alveolinids-Soritids
geniculate red algae
bivalvesgastropods
Halimeda plates
branching red algae pieces
rhodoliths on coral nucleus
rhodoliths
coral colonies (fragments):
red algae fragment
Main bioclasts
MiliolidsNummulitids
0
<100 m?
0
30 m?
0<10 m?
Unit II-Subunit IIIA(early?-middle Miocene)
Unit I(middle-late Miocene)
massive/lamellar
branching/undetermined
1
2
Inner Platform
3
Outer Platform
Depositionalenvironments
Subunits
Depositionalenvironments
Subunits
IIB (Site 1199)
IB/IA
IIA
IIIA (Site 1196)
IIA (Site 1199)IIIA-IIB (Site 1196)
Coral reef
6 4
5
Outer Platform
IC
ID (Site 1199)
ID-IC (Site 1196)
MicrofaciesA: porcellaneous foraminifersB: coralC: Myogypsina-LepidocyclinaD: rhodoliths-Halimeda- Nummulitids-AmphisteginaE: rhodoliths-Halimeda-LepidocyclinaF: rhodoliths-echinoderms

CONESA ET AL.BIOSEDIMENTARY AND PALEOENVIRONMENTAL EVOLUTION OF THE SMP 36
Table T1. List of coral taxa with their ecological significance (Sites 1196 and 1199).
UnitCore, section, interval (cm) Coral taxa Ecology
IA 194-1196A-6R-1, 105–107 Acanthophyllia cf. deshayesiana (Michelin, 1850) Solitary (within reef) Carbonate rich and warm water
194-1196B-1R-2, 8–12 Lithophyllon cf. mokai Hoeksma, 1989 Secondary framebuilders High energy resistant
194-1199A-1R-3, 125–129 cf. Favites pauciseptata Gerth, 1923 Secondary framebuilders High energy resistant7R-2, 121–125 Stylophora cambridgiensis Wells, 1934 Secondary framebuilders Low energy, well oxygenated
IB 194-1196A-17R-1, 21–25 Stylophora depauperata (Reuss, 1867) Secondary framebuilders Low energy, well oxygenated
IC 194-1196B-22Z-1, 38–44 Alveopora polyacantha Reuss, 1867
Stylophora subseriata (Ehrenberg, 1834)Secondary framebuilders Low energy, well oxygenatedSecondary framebuilders Low energy, well oxygenated
IIA 39Z-1, 24–29 Trematotrochus sp. Solitary Ubiquitous39Z-1, 46–49 Antiguastraea aff. alveolaris (Catullo, 1856) Secondary framebuilders Low energy, well oxygenated41Z-1, 16–19 Stylophora cf. cambridgiensis Wells, 1934 Secondary framebuilders Low energy, well oxygenated
194-1199A-20R-1, 40–50 Pavona (Hydnophoseris) sp. Secondary framebuilders Low energy, well oxygenated21R-1, 6–8 Stylophora granulata Duncan and Wall, 1864 Secondary framebuilders Low energy, well oxygenated
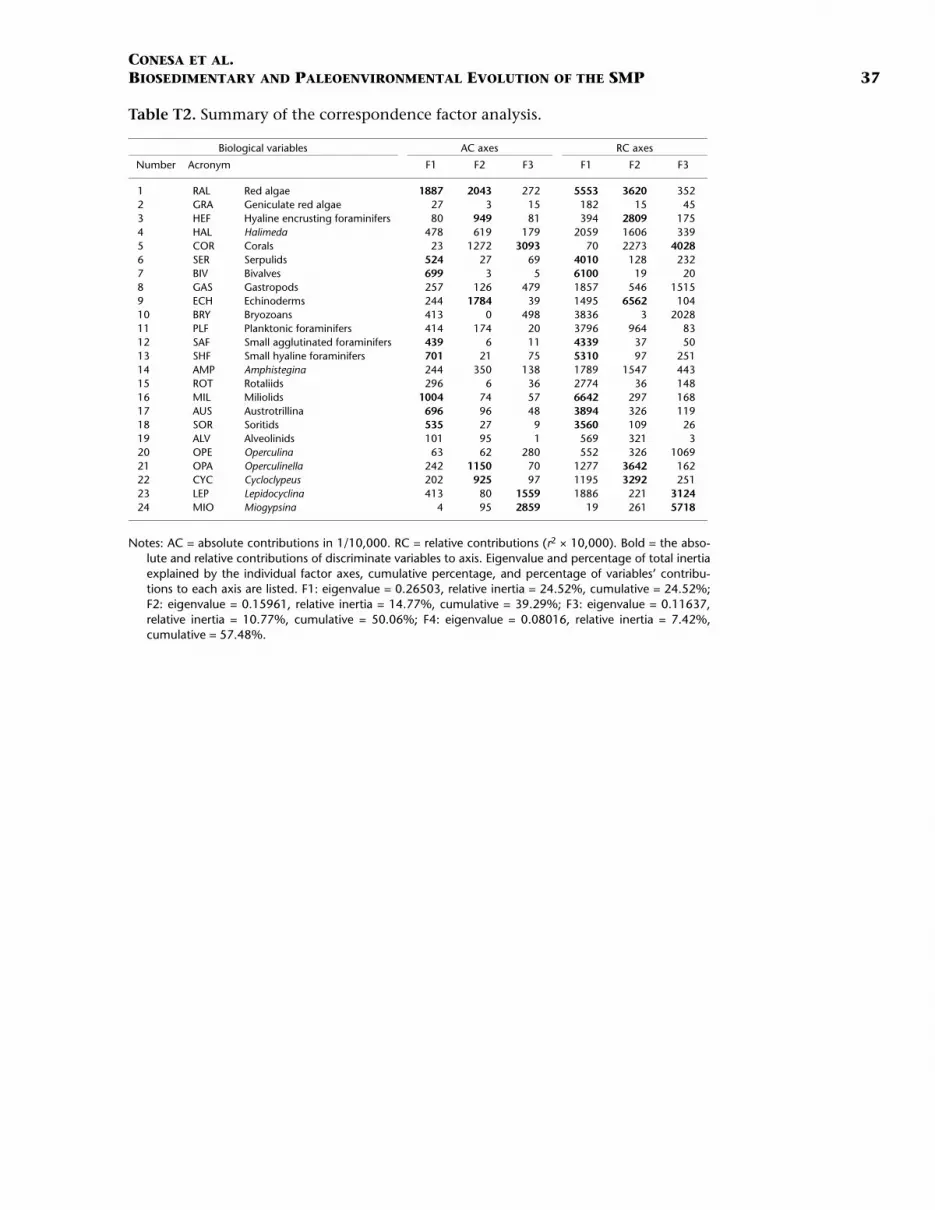
CONESA ET AL.BIOSEDIMENTARY AND PALEOENVIRONMENTAL EVOLUTION OF THE SMP 37
Table T2. Summary of the correspondence factor analysis.
Notes: AC = absolute contributions in 1/10,000. RC = relative contributions (r2 × 10,000). Bold = the abso-lute and relative contributions of discriminate variables to axis. Eigenvalue and percentage of total inertiaexplained by the individual factor axes, cumulative percentage, and percentage of variables’ contribu-tions to each axis are listed. F1: eigenvalue = 0.26503, relative inertia = 24.52%, cumulative = 24.52%;F2: eigenvalue = 0.15961, relative inertia = 14.77%, cumulative = 39.29%; F3: eigenvalue = 0.11637,relative inertia = 10.77%, cumulative = 50.06%; F4: eigenvalue = 0.08016, relative inertia = 7.42%,cumulative = 57.48%.
Biological variables AC axes RC axes
Number Acronym F1 F2 F3 F1 F2 F3
1 RAL Red algae 1887 2043 272 5553 3620 3522 GRA Geniculate red algae 27 3 15 182 15 453 HEF Hyaline encrusting foraminifers 80 949 81 394 2809 1754 HAL Halimeda 478 619 179 2059 1606 3395 COR Corals 23 1272 3093 70 2273 40286 SER Serpulids 524 27 69 4010 128 2327 BIV Bivalves 699 3 5 6100 19 208 GAS Gastropods 257 126 479 1857 546 15159 ECH Echinoderms 244 1784 39 1495 6562 10410 BRY Bryozoans 413 0 498 3836 3 202811 PLF Planktonic foraminifers 414 174 20 3796 964 8312 SAF Small agglutinated foraminifers 439 6 11 4339 37 5013 SHF Small hyaline foraminifers 701 21 75 5310 97 25114 AMP Amphistegina 244 350 138 1789 1547 44315 ROT Rotaliids 296 6 36 2774 36 14816 MIL Miliolids 1004 74 57 6642 297 16817 AUS Austrotrillina 696 96 48 3894 326 11918 SOR Soritids 535 27 9 3560 109 2619 ALV Alveolinids 101 95 1 569 321 320 OPE Operculina 63 62 280 552 326 106921 OPA Operculinella 242 1150 70 1277 3642 16222 CYC Cycloclypeus 202 925 97 1195 3292 25123 LEP Lepidocyclina 413 80 1559 1886 221 312424 MIO Miogypsina 4 95 2859 19 261 5718

CONESA ET AL.BIOSEDIMENTARY AND PALEOENVIRONMENTAL EVOLUTION OF THE SMP 38
Plate P1. 1. Transverse section of Austrotrillina howchini (Schlumberger), 10× (Sample 194-1196A-35R-1, 13–17 cm). 2. Axial section of Flosculinella bontangensis (Rutten), 5× (Sample 194-1196B-46Z-1, 14–17 cm).3. Floatstone-grainstone with Miogypsina sp. and small hyaline foraminifers, 2.5× (Sample 194-1199A-41R-1, 19–22 cm). 4. Lepidocyclina sp., geniculate red algae, and echinoid spine, 2.5× (Sample 194-1199A-41R-1, 19–22 cm). 5. Floatstone-poor packstone with mudstone internal sediment and micritized bioclasts in-cluding Operculinella sp. and Rotaliids, 2.5× (Sample 194-1196A-5R-2, 74–77 cm). 6. Floatstone-grainstonewith Cycloclypeus sp., rounded fragments of red algae, and Halimeda plate, 2.5× (Sample 194-1196A-5R-2,74–77 cm).
1 2
3 4
5 6


