Embed Size (px)
Citation preview
Journal ofCervntology: PSYCHOLOGICAL SCIENCES1998, Vol. 53B, No. 3, P201-P208
Copyright 1998 by The Gerontological Society of America
Black/White Differences in the RelationshipBetween MMSE Scores and Disability:The Women's Health and Aging Study
Suzanne G. Leveille,1 Jack M. Guralnik,1 Luigi Ferrucci,1'2
M. Chiara Corti,1 Judith Kasper,3 and Linda P. Fried4
'Epidemiology, Demography, and Biometry Program, National Institute on Aging, Bethesda, Maryland.2Geriatric Department, Hospital I Fraticini, INRCA, Florence, Italy.
3School of Hygiene and Public Health, "School of Medicine, Johns Hopkins University, Baltimore, Maryland.
The purpose of this article is to examine Black/White differences among older women in the relationship betweenphysical functional difficulties and variations in cognitive status, measured within the low to high normal range ofthe Mini-Mental State Examination (MMSE). We studied 3,585 women with MMSE scores of 18 and above from apopulation-based random sample of 3,841 community-dwelling women aged 65 and older living in East Baltimore,Maryland. Trained interviewers administered the MMSE and obtained information on demographics, medical con-ditions, and functional difficulties. Prevalence of any functional difficulty was 43.3% in Whites and 48.5% inBlacks, who were 25% of the study sample. After adjusting for age and education, a significant trend for increasingfunctional difficulty with decreasing MMSE scores was found in White women but not in Black women. Since noexplanation for these racial differences could be identified, these findings suggest that the MMSE may not be avalid predictor of functional difficulty in Black women who score > 18 on the instrument.
FUNCTIONAL loss places the older adult at increasedrisk for further disability, institutionalization, and death
(Ferrucci et al., 1991; Ford et al., 1988). In addition to de-clines in the domain of physical functioning, cognitive de-cline has been found to be associated with disability, thoughthe relationship is not well understood (Ferrucci et al., 1993;Gill, Richardson, & Tinetti, 1995; Kasper, 1990; Moritz,Kasl, & Berkman, 1995). Compared with functional lossesdue clearly to progressive dementias, results showing asso-ciations between non-dementia-related declines in cognitivefunction and disability are perhaps more complex to ex-plain. Ferrucci et al. proposed that the causal pathway mayexist in which non-neurological chronic conditions and theirtreatments could contribute to cognitive decline and subse-quently lead to functional losses (Ferrucci et al., 1993).Their study, involving persons with Mini-Mental State Ex-amination (MMSE) scores of 20 and above at baseline,found that poorer performance in a test of fluid intelligence,a subset of the Wechsler Adult Intelligence Scale, was asso-ciated with disability in an elderly cohort in Italy.
Others have presented evidence regarding the complexityof the cognitive status-disability relationship. In a popula-tion-based cohort of elderly New Haven, Connecticut resi-dents, cognitive impairment measured using the ShortPortable Mental Status Questionnaire (SPMSQ) was an in-dependent predictor of incident Activities of Daily Living(ADL) limitations in 3 years of follow-up (Moritz et al.,1995). In this study, the level of cognitive impairment thatpredicted ADL limitations included both dementia andnon-dementia-related cognitive problems. In a study ofolder persons with mild to moderate cognitive impairment
(MMSE scores 16-23), Gill et al. found that although thosewith cognitive impairments had increased risk for func-tional loss, there was considerable variability among theseindividuals in their risk for ADL dependence 1 year lateraccording to how well they performed on rapid gait andchair-stand tests at baseline (Gill et al., 1995). While themechanisms are yet to be clarified, there is accumulatingevidence that decline in cognitive function in nondementedolder persons represents a risk factor for the developmentof functional dependence.
One of the most commonly used and tested approachesfor measuring cognitive impairment in older adults is theMini-Mental State Examination (Folstein, Folstein, &McHugh, 1975). The MMSE was developed as an easily ad-ministered clinical screening tool for cognitive impairment.It has been shown that MMSE scores are influenced by sev-eral noncognitive factors such as age, race, and educationlevel, though the adjustments needed in score cutpoints tomake the MMSE as a dementia screening tool comparable indiverse populations continue to be debated (Berkman, 1986;Bohnstedt, Fox, & Kohatsu, 1994; Mungas, Marshall, Wel-don, Haan, & Reed, 1996; Tombaugh & Mclntyre, 1992).
The question of how much race/ethnicity influences per-formance on the MMSE has not been resolved in the scien-tific literature, yet the implications of this debate are vastfor both clinicians and researchers. Some researchers havefound that the race/ethnicity association with MMSEscores is completely explained by education (Murden,McRae, Kaner, & Buckman, 1991), whereas other studieshave demonstrated that the race/ethnicity association per-sists after accounting for education (Escobar et al., 1986;
P201
Dow
nloaded from https://academ
ic.oup.com/psychsocgerontology/article/53B/3/P201/545365 by guest on 05 July 2022
P202 LEVEILLE ET AL
Fillenbaum, Hughes, Heyman, George, & Blazer, 1988).Although screening cutpoint adjustments may enhance theuse of the MMSE for dementia screening in diverse popula-tions, no comparable adjustments have been proposed foruse of the tool as a continuous measure of cognitive func-tioning in racially diverse groups. In fact, no agreement hasbeen reached about the validity of the tool when used inthis way, yet the MMSE is frequently used as a continuousmeasure of cognitive function both clinically and in re-search. Comparability should ideally be established againsta gold standard of cognitive functioning that is known to beindependent of race/ethnicity. Such a measure is unlikely tobe available in a population-based study because of thetime and cost factors associated with extensive cognitivetesting. A reasonable alternative is found in measures ofphysical functioning, specifically, self-reported measuresthat have been found to perform well in racially diversepopulations (Guralnik & Kaplan, 1989; Keil et al., 1989;Mor et al., 1989). In this study, we sought to determinewhether MMSE score, as a continuous measure of cogni-tive function, is associated with functional difficulties innondemented White and Black elderly women.
METHOD
ParticipantsThe study population consisted of women aged 65 years
and older living in Baltimore, Maryland. From an age-strat-ified random sample of 6,521 Medicare enrollees, 5,316women were eligible for screening (living in the area andnoninstitutionalized) and invited to participate in theWomen's Health and Aging Study (WHAS), a study ofolder women with disability. More detailed descriptions ofthe WHAS methods have been published previously (Fried,Kasper, Guralnik, & Simonsick, 1995). Of the 4,137 wom-en (78% of eligible sample) who agreed to be screened,3,841 women (72% of eligible sample) completed thein-home screening interview. The present analysis used thedata on the screened women, excluding those who hadMMSE scores below 18 (n - 237), indicating poor cogni-tive functioning. Although a score of 23 or below is theusual clinical screening cutpoint for dementia (Folstein,Anthony, Parhad, Duffy, & Gruenberg, 1985), the cutpointof 18 was selected based on evidence that the lower cut-point might better capture the normal range of cognitivefunctioning in Blacks and persons with less education(Bohnstedt et al., 1994; Fillenbaum et al., 1988; Murden etal., 1991). Other exclusions were for race other than Whiteor Black (n = 17) and missing race information (n = 2). Thefinal study sample consisted of 2,694 White women and891 Black women.
MeasuresTrained interviewers conducted in-person screening in-
terviews about functional status, medical conditions, anddemographics, and administered the MMSE. For this study,the MMSE scores were grouped into five categories as fol-lows: 18-20, 21-23, 24-26, 27-28, 29-30, with higherscores indicating better cognitive functioning. The MMSEwas scored using the standard method of taking the propor-
tion of correct responses to completed and refused re-sponses, multiplied by 30, the maximum score (Folstein etal., 1975).
Education level was measured by asking the highestgrade of school or year of college completed. Two ques-tions on income were combined to minimize missing infor-mation. Subjects were first asked to report their total house-hold income the previous year. Refusers were then asked toselect an answer from a list shown on a card indicating in-come ranges. To assess chronic disease, screenees wereasked, "Has a doctor ever told you that you have . . . (eachof 14 diseases)?" Presence of heart disease was based on apositive response to having angina, heart attack, congestiveheart failure, or other heart disease.
Using the screening interview data, three areas of disabil-ity are considered in this article: difficulty with instrumentalactivities of daily living (IADLs), activities of daily living(ADLs), and mobility. Specific activities within these areasincluded the following: IADL: shopping for personal items,preparing meals, doing light housework; mobility: walking2 or 3 blocks, climbing 10 steps without resting; and per-forming ADLs (a combined variable including dressing,bathing, eating, transferring, and toileting). Women who re-ported any difficulty performing these tasks versus no diffi-culty were classified as having functional difficulty in theidentified activity. A composite measure was created to clas-sify women with any functional difficulty in any of the threefunctional areas and women with no functional difficulty inany area. Measurement of functional difficulty has beenshown to effectively include those in the earlier stages ofthe disablement process, compared to instruments that mea-sure only need for help with ADLs and IADLs, a marker ofmore severe disability (Langlois et al., 1996).
Data AnalysisWeighted prevalences of functional difficulties were cal-
culated according to race. Sample weights were assignedon the basis of age stratification and were described in moredetail previously (Guralnik et al., 1995). Descriptive statis-tics were used to present demographic data and health sta-tus information by race. Maximum likelihood methodswere used to examine the relationships between health anddemographic factors and risk for functional difficulty. Toassess the relationship between age and education andMMSE scores according to race, Pearson correlations andgeneral linear regression modeling were used. Logistic re-gression methods were used to evaluate the relationship be-tween MMSE scores and functional limitation according torace, with additional adjustment for potential confounders.Variables that were found to be associated with disabilitywere included as potential confounders in the full multivari-ate model (age, marital status, education, income, self-ratedhealth, number of comorbid conditions, and self-reporteddiseases including heart disease, high blood pressure, dia-betes, arthritis, stroke, hip fracture, lung disease). Chi-square tests for trend were performed using the ordinalform of the grouped MMSE variable. Effect modification ofthe race and MMSE association with functional difficultywas evaluated by adding the cross-products term to themultivariate model. In the same way, we evaluated interac-
Dow
nloaded from https://academ
ic.oup.com/psychsocgerontology/article/53B/3/P201/545365 by guest on 05 July 2022
MMSE AND DISABILITY IN BLACKS AND WHITES P203
tions between race and medical conditions in their associa-tion with functional difficulty.
RESULTS
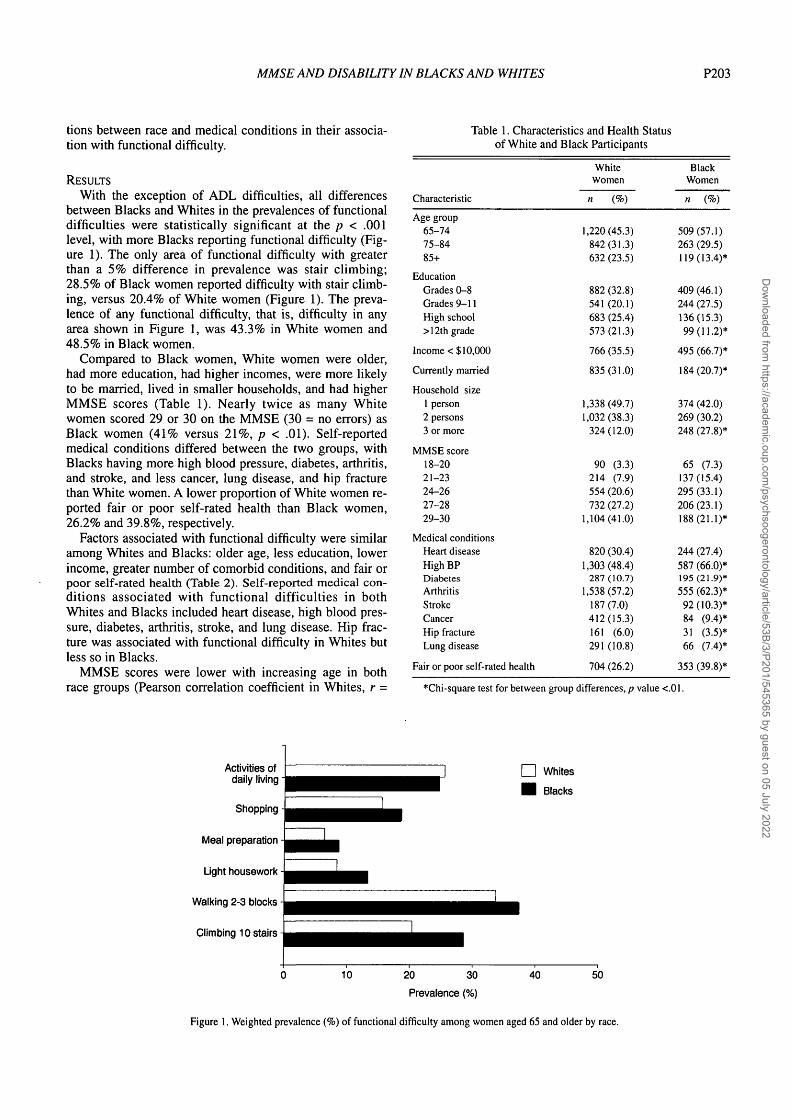
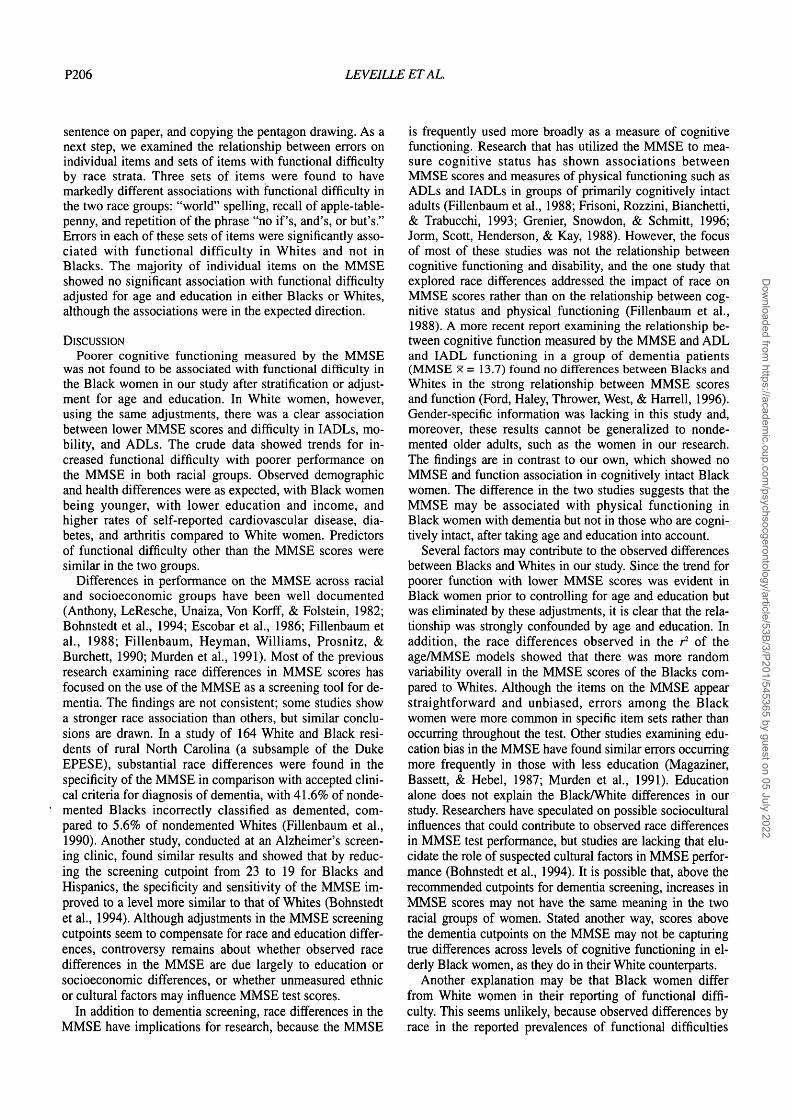
With the exception of ADL difficulties, all differencesbetween Blacks and Whites in the prevalences of functionaldifficulties were statistically significant at the p < .001level, with more Blacks reporting functional difficulty (Fig-ure 1). The only area of functional difficulty with greaterthan a 5% difference in prevalence was stair climbing;28.5% of Black women reported difficulty with stair climb-ing, versus 20.4% of White women (Figure 1). The preva-lence of any functional difficulty, that is, difficulty in anyarea shown in Figure 1, was 43.3% in White women and48.5% in Black women.
Compared to Black women, White women were older,had more education, had higher incomes, were more likelyto be married, lived in smaller households, and had higherMMSE scores (Table 1). Nearly twice as many Whitewomen scored 29 or 30 on the MMSE (30 = no errors) asBlack women (41% versus 21%, p < .01). Self-reportedmedical conditions differed between the two groups, withBlacks having more high blood pressure, diabetes, arthritis,and stroke, and less cancer, lung disease, and hip fracturethan White women. A lower proportion of White women re-ported fair or poor self-rated health than Black women,26.2% and 39.8%, respectively.
Factors associated with functional difficulty were similaramong Whites and Blacks: older age, less education, lowerincome, greater number of comorbid conditions, and fair orpoor self-rated health (Table 2). Self-reported medical con-ditions associated with functional difficulties in bothWhites and Blacks included heart disease, high blood pres-sure, diabetes, arthritis, stroke, and lung disease. Hip frac-ture was associated with functional difficulty in Whites butless so in Blacks.
MMSE scores were lower with increasing age in bothrace groups (Pearson correlation coefficient in Whites, r =
Table 1. Characteristics and Health Statusof White and Black Participants
Characteristic
Age group65-7475-8485+
EducationGrades 0-8Grades 9-11High school> 12th grade
Income < $10,000
Currently married
Household size1 person2 persons3 or more
MMSE score18-2021-2324-2627-2829-30
Medical conditionsHeart diseaseHigh BPDiabetesArthritisStrokeCancerHip fractureLung disease
Fair or poor self-rated health
WhiteWomen
n (%)
1,220(45.3)842(31.3)632 (23.5)
882 (32.8)541 (20.1)683 (25.4)573(21.3)
766 (35.5)
835(31.0)
1,338(49.7)1,032 (38.3)
324(12.0)
90 (3.3)214 (7.9)554 (20.6)732 (27.2)
1,104(41.0)
820 (30.4)1,303(48.4)
287(10.7)1,538(57.2)
187(7.0)412(15.3)161 (6.0)291 (10.8)
704 (26.2)
BlackWomen
n (%)
509(57.1)263 (29.5)119(13.4)*
409(46.1)244 (27.5)136(15.3)99(11.2)*
495 (66.7)*
184(20.7)*
374 (42.0)269 (30.2)248 (27.8)*
65 (7.3)137(15.4)295(33.1)206(23.1)188(21.1)*
244 (27.4)587 (66.0)*195(21.9)*555 (62.3)*92(10.3)*84 (9.4)*31 (3.5)*66 (7.4)*
353 (39.8)*
*Chi-square test for between group differences, p value <.01.
Activities ofdaily living
Shopping
Meal preparation
Light housework
Walking 2-3 blocks
Climbing 10 stairs
Whites
Blacks
20 30
Prevalence (%)
40 50
Figure 1. Weighted prevalence (%) of functional difficulty among women aged 65 and older by race.
Dow
nloaded from https://academ
ic.oup.com/psychsocgerontology/article/53B/3/P201/545365 by guest on 05 July 2022
P204 LEVEILLEETAL
-.40, in Blacks, r = -.30; p < .005 comparing the two coef-ficients). Years of education showed a positive correlationwith the MMSE score, and the coefficient was the same inBlacks and Whites (r = .32) (data not shown). When agewas used as a predictor of MMSE score in regression mod-els by race, r2 was higher in Whites than in Blacks (.16 and.09, respectively).
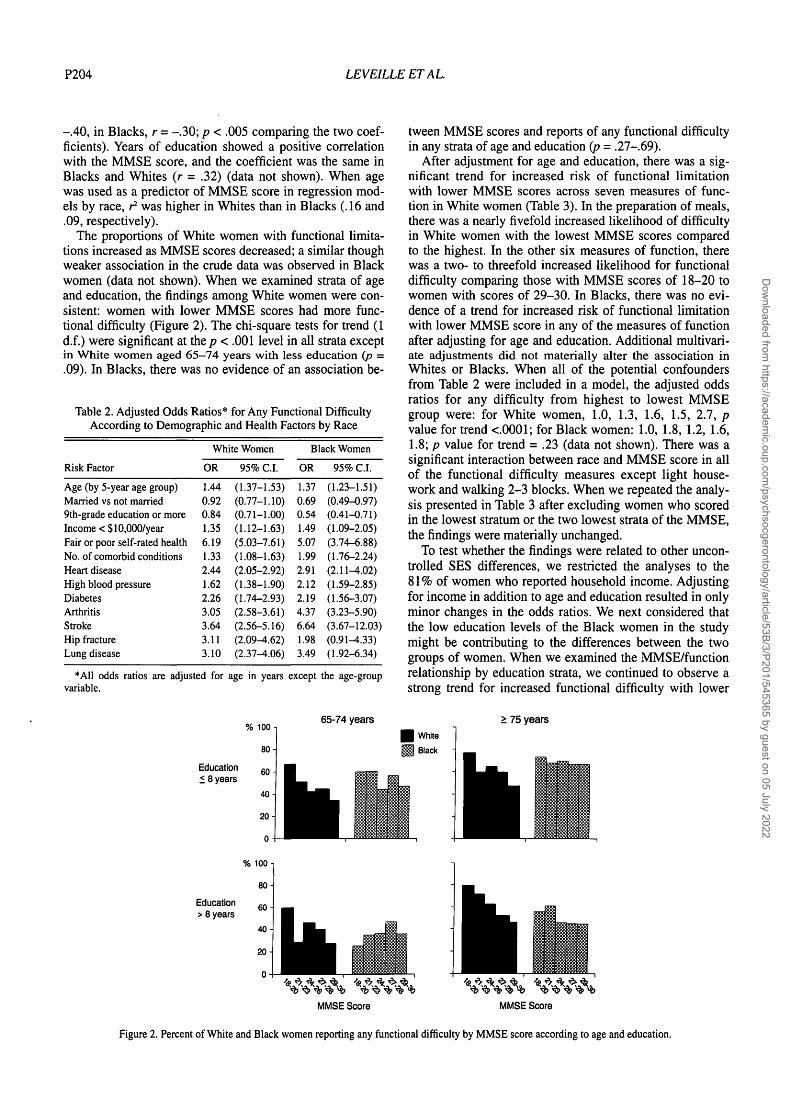
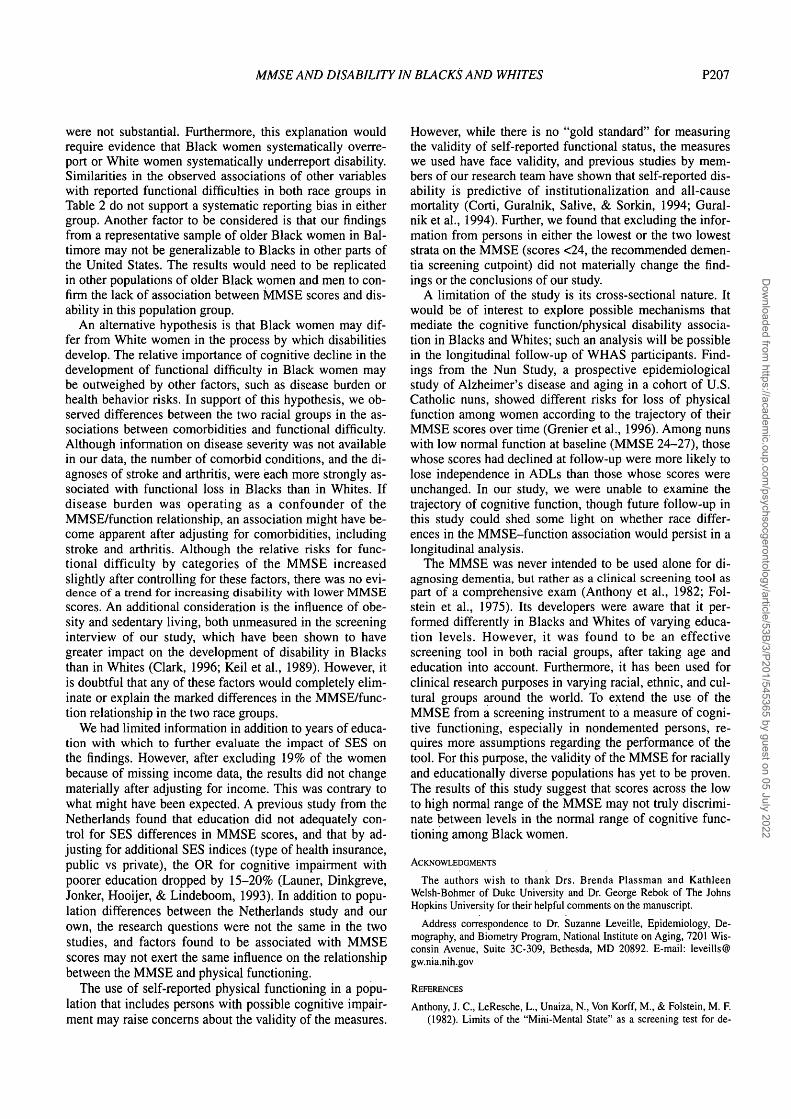
The proportions of White women with functional limita-tions increased as MMSE scores decreased; a similar thoughweaker association in the crude data was observed in Blackwomen (data not shown). When we examined strata of ageand education, the findings among White women were con-sistent: women with lower MMSE scores had more func-tional difficulty (Figure 2). The chi-square tests for trend (1d.f.) were significant at the/7 < .001 level in all strata exceptin White women aged 65—74 years with less education (p =.09). In Blacks, there was no evidence of an association be-
Table 2. Adjusted Odds Ratios* for Any Functional DifficultyAccording to Demographic and Health Factors by Race
White Women Black Women
Risk Factor
Age (by 5-year age group)Married vs not married9th-grade education or moreIncome < $10,000/yearFair or poor self-rated healthNo. of comorbid conditionsHeart diseaseHigh blood pressureDiabetesArthritisStrokeHip fractureLung disease
OR
1.440.920.841.356.191.332.441.622.263.053.643.113.10
•All odds ratios are adjusted forvariable.
95% C.I.
(1.37-1.53)(0.77-1.10)(0.71-1.00)(1.12-1.63)(5.03-7.61)(1.08-1.63)(2.05-2.92)(1.38-1.90)(1.74-2.93)(2.58-3.61)(2.56-5.16)(2.09^.62)(2.37^.06)
age in years
% 100 -
80 -i
OR
1.370.690.541.495.071.992.912.122.194.376.641.983.49
except
95% C.I.
(1.23-1.51)(0.49-0.97)(0.41-0.71)(1.09-2.05)(3.74-6.88)(1.76-2.24)(2.11-4.02)(1.59-2.85)(1.56-3.07)(3.23-5.90)(3.67-12.03)(0.91-4.33)(1.92-6.34)
the age-group
65-74 years
Education< 8 years
60-
40-
Education> 8 years
tween MMSE scores and reports of any functional difficultyin any strata of age and education (p = .27-.69).
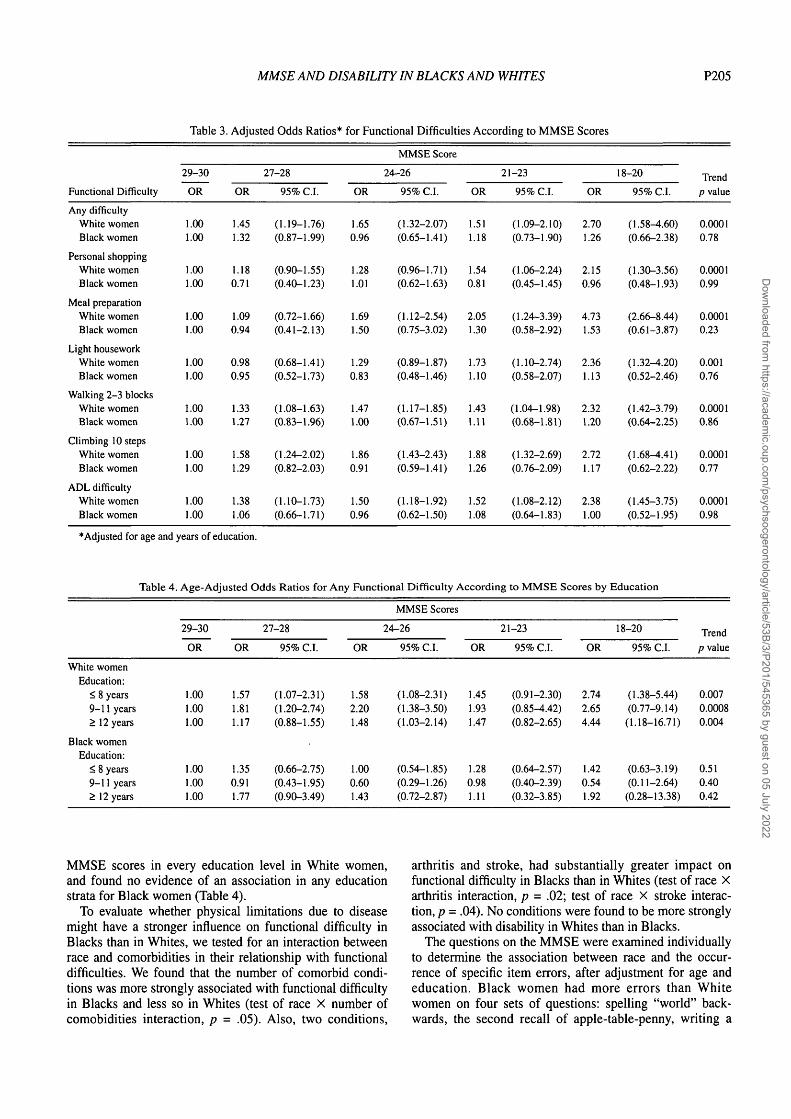
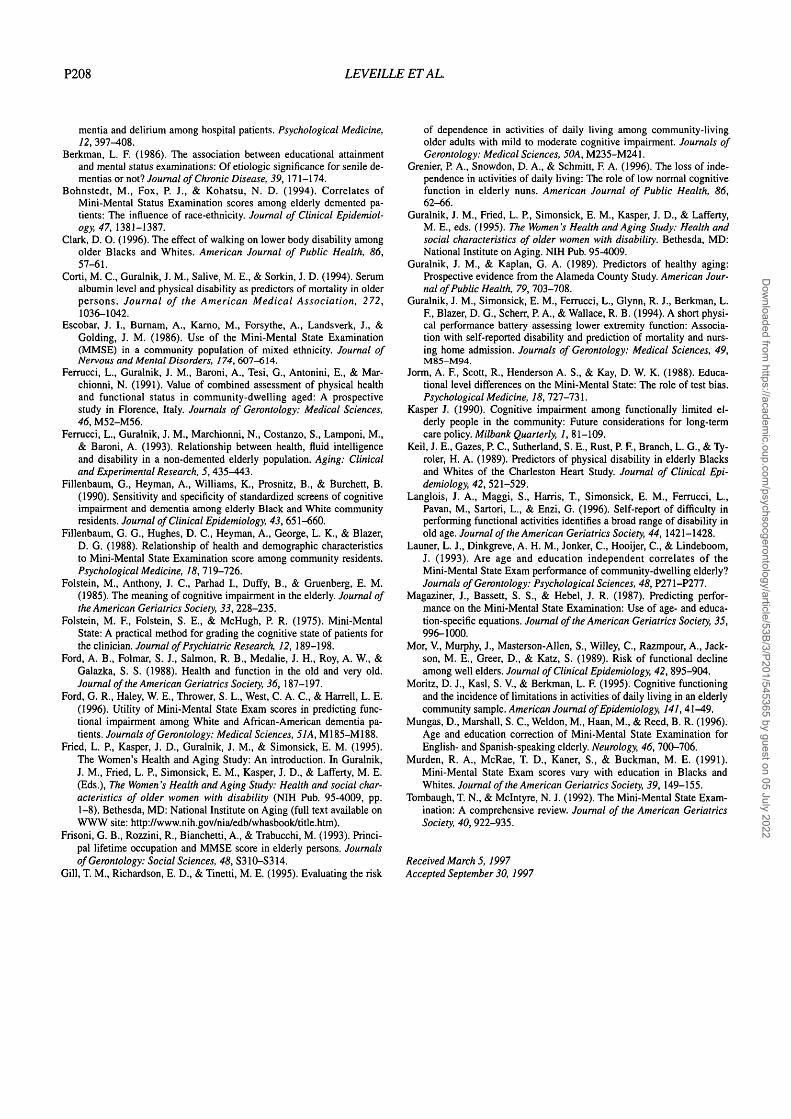
After adjustment for age and education, there was a sig-nificant trend for increased risk of functional limitationwith lower MMSE scores across seven measures of func-tion in White women (Table 3). In the preparation of meals,there was a nearly fivefold increased likelihood of difficultyin White women with the lowest MMSE scores comparedto the highest. In the other six measures of function, therewas a two- to threefold increased likelihood for functionaldifficulty comparing those with MMSE scores of 18-20 towomen with scores of 29-30. In Blacks, there was no evi-dence of a trend for increased risk of functional limitationwith lower MMSE score in any of the measures of functionafter adjusting for age and education. Additional multivari-ate adjustments did not materially alter the association inWhites or Blacks. When all of the potential confoundersfrom Table 2 were included in a model, the adjusted oddsratios for any difficulty from highest to lowest MMSEgroup were: for White women, 1.0, 1.3, 1.6, 1.5, 2.7, pvalue for trend <.0001; for Black women: 1.0, 1.8, 1.2, 1.6,1.8; p value for trend = .23 (data not shown). There was asignificant interaction between race and MMSE score in allof the functional difficulty measures except light house-work and walking 2-3 blocks. When we repeated the analy-sis presented in Table 3 after excluding women who scoredin the lowest stratum or the two lowest strata of the MMSE,the findings were materially unchanged.
To test whether the findings were related to other uncon-trolled SES differences, we restricted the analyses to the81% of women who reported household income. Adjustingfor income in addition to age and education resulted in onlyminor changes in the odds ratios. We next considered thatthe low education levels of the Black women in the studymight be contributing to the differences between the twogroups of women. When we examined the MMSE/functionrelationship by education strata, we continued to observe astrong trend for increased functional difficulty with lower
> 75 years
White
Black
MMSE Score MMSE Score
Figure 2. Percent of White and Black women reporting any functional difficulty by MMSE score according to age and education.
Dow
nloaded from https://academ
ic.oup.com/psychsocgerontology/article/53B/3/P201/545365 by guest on 05 July 2022
MMSE AND DISABILITY IN BLACKS AND WHITES P205
Table 3. Adjusted Odds Ratios* for Functional Difficulties According to MMSE Scores
Functional Difficulty
Any difficultyWhite womenBlack women
Personal shoppingWhite womenBlack women
Meal preparationWhite womenBlack women
Light houseworkWhite womenBlack women
Walking 2-3 blocksWhite womenBlack women
Climbing 10 stepsWhite womenBlack women
ADL difficultyWhite womenBlack women
29-30
OR
1.001.00
1.001.00
1.001.00
1.001.00
1.001.00
1.001.00
1.001.00
OR
1.451.32
1.180.71
1.090.94
0.980.95
1.331.27
1.581.29
1.381.06
27-28
95% C.I.
(1.19-1.76)(0.87-1.99)
(0.90-1.55)(0.40-1.23)
(0.72-1.66)(0.41-2.13)
(0.68-1.41)(0.52-1.73)
(1.08-1.63)(0.83-1.96)
(1.24-2.02)(0.82-2.03)
(1.10-1.73)(0.66-1.71)
OR
1.650.96
1.281.01
1.691.50
1.290.83
1.471.00
1.860.91
1.500.96
MMSE Score
24-26
95% C.I.
(1.32-2.07)(0.65-1.41)
(0.96-1.71)(0.62-1.63)
(1.12-2.54)(0.75-3.02)
(0.89-1.87)(0.48-1.46)
(1.17-1.85)(0.67-1.51)
(1.43-2.43)(0.59-1.41)
(1.18-1.92)(0.62-1.50)
OR
1.511.18
1.540.81
2.051.30
1.731.10
1.431.11
1.881.26
1.521.08
21-23
95% C.I.
(1.09-2.10)(0.73-1.90)
(1.06-2.24)(0.45-1.45)
(1.24-3.39)(0.58-2.92)
(1.10-2.74)(0.58-2.07)
(1.04-1.98)(0.68-1.81)
(1.32-2.69)(0.76-2.09)
(1.08-2.12)(0.64-1.83)
OR
2.701.26
2.150.96
4.731.53
2.361.13
2.321.20
2.721.17
2.381.00
18-20
95% C.I.
(1.58-4.60)(0.66-2.38)
(1.30-3.56)(0.48-1.93)
(2.66-8.44)(0.61-3.87)
(1.32-4.20)(0.52-2.46)
(1.42-3.79)(0.64-2.25)
(1.68^.41)(0.62-2.22)
(1.45-3.75)(0.52-1.95)
Trendp value
0.00010.78
0.00010.99
0.00010.23
0.0010.76
0.00010.86
0.00010.77
0.00010.98
"Adjusted for age and years of education.
Table 4. Age-Adjusted Odds Ratios for Any Functional Difficulty According to MMSE Scores by Education
29-30
OR OR
27-28
95% C.I. OR
MMSE Scores
24-26
95% C.I. OR
21-23
95% C.I. OR
18-20
95% C.I.
Trendp value
White womenEducation:
< 8 years9-11 years> 12 years
Black womenEducation:
< 8 years9-11 years112 years
1.001.001.00
1.001.001.00
1.571.811.17
1.350.911.77
(1.07-2.31)(1.20-2.74)(0.88-1.55)
(0.66-2.75)(0.43-1.95)(0.90-3.49)
1.582.201.48
1.000.601.43
(1.08-2.31)(1.38-3.50)(1.03-2.14)
(0.54-1.85)(0.29-1.26)(0.72-2.87)
1.451.931.47
1.280.981.11
(0.91-2.30) 2.74(0.85^.42) 2.65(0.82-2.65) 4.44
(0.64-2.57) 1.42(0.40-2.39) 0.54(0.32-3.85) 1.92
(1.38-5.44)(0.77-9.14)
(1.18-16.71)
(0.63-3.19)(0.11-2.64)
(0.28-13.38)
0.007
0.0008
0.004
0.510.400.42
MMSE scores in every education level in White women,and found no evidence of an association in any educationstrata for Black women (Table 4).
To evaluate whether physical limitations due to diseasemight have a stronger influence on functional difficulty inBlacks than in Whites, we tested for an interaction betweenrace and comorbidities in their relationship with functionaldifficulties. We found that the number of comorbid condi-tions was more strongly associated with functional difficultyin Blacks and less so in Whites (test of race X number ofcomobidities interaction, p = .05). Also, two conditions,
arthritis and stroke, had substantially greater impact onfunctional difficulty in Blacks than in Whites (test of race Xarthritis interaction, p = .02; test of race X stroke interac-tion, p = .04). No conditions were found to be more stronglyassociated with disability in Whites than in Blacks.
The questions on the MMSE were examined individuallyto determine the association between race and the occur-rence of specific item errors, after adjustment for age andeducation. Black women had more errors than Whitewomen on four sets of questions: spelling "world" back-wards, the second recall of apple-table-penny, writing a
Dow
nloaded from https://academ
ic.oup.com/psychsocgerontology/article/53B/3/P201/545365 by guest on 05 July 2022
P206 LEVEILLE ET AL
sentence on paper, and copying the pentagon drawing. As anext step, we examined the relationship between errors onindividual items and sets of items with functional difficultyby race strata. Three sets of items were found to havemarkedly different associations with functional difficulty inthe two race groups: "world" spelling, recall of apple-table-penny, and repetition of the phrase "no if s, and's, or but's."Errors in each of these sets of items were significantly asso-ciated with functional difficulty in Whites and not inBlacks. The majority of individual items on the MMSEshowed no significant association with functional difficultyadjusted for age and education in either Blacks or Whites,although the associations were in the expected direction.
DISCUSSION
Poorer cognitive functioning measured by the MMSEwas not found to be associated with functional difficulty inthe Black women in our study after stratification or adjust-ment for age and education. In White women, however,using the same adjustments, there was a clear associationbetween lower MMSE scores and difficulty in IADLs, mo-bility, and ADLs. The crude data showed trends for in-creased functional difficulty with poorer performance onthe MMSE in both racial groups. Observed demographicand health differences were as expected, with Black womenbeing younger, with lower education and income, andhigher rates of self-reported cardiovascular disease, dia-betes, and arthritis compared to White women. Predictorsof functional difficulty other than the MMSE scores weresimilar in the two groups.
Differences in performance on the MMSE across racialand socioeconomic groups have been well documented(Anthony, LeResche, Unaiza, Von Korff, & Folstein, 1982;Bohnstedt et al., 1994; Escobar et al., 1986; Fillenbaum etal., 1988; Fillenbaum, Heyman, Williams, Prosnitz, &Burchett, 1990; Murden et al., 1991). Most of the previousresearch examining race differences in MMSE scores hasfocused on the use of the MMSE as a screening tool for de-mentia. The findings are not consistent; some studies showa stronger race association than others, but similar conclu-sions are drawn. In a study of 164 White and Black resi-dents of rural North Carolina (a subsample of the DukeEPESE), substantial race differences were found in thespecificity of the MMSE in comparison with accepted clini-cal criteria for diagnosis of dementia, with 41.6% of nonde-mented Blacks incorrectly classified as demented, com-pared to 5.6% of nondemented Whites (Fillenbaum et al.,1990). Another study, conducted at an Alzheimer's screen-ing clinic, found similar results and showed that by reduc-ing the screening cutpoint from 23 to 19 for Blacks andHispanics, the specificity and sensitivity of the MMSE im-proved to a level more similar to that of Whites (Bohnstedtet al., 1994). Although adjustments in the MMSE screeningcutpoints seem to compensate for race and education differ-ences, controversy remains about whether observed racedifferences in the MMSE are due largely to education orsocioeconomic differences, or whether unmeasured ethnicor cultural factors may influence MMSE test scores.
In addition to dementia screening, race differences in theMMSE have implications for research, because the MMSE
is frequently used more broadly as a measure of cognitivefunctioning. Research that has utilized the MMSE to mea-sure cognitive status has shown associations betweenMMSE scores and measures of physical functioning such asADLs and IADLs in groups of primarily cognitively intactadults (Fillenbaum et al., 1988; Frisoni, Rozzini, Bianchetti,& Trabucchi, 1993; Grenier, Snowdon, & Schmitt, 1996;Jorm, Scott, Henderson, & Kay, 1988). However, the focusof most of these studies was not the relationship betweencognitive functioning and disability, and the one study thatexplored race differences addressed the impact of race onMMSE scores rather than on the relationship between cog-nitive status and physical functioning (Fillenbaum et al.,1988). A more recent report examining the relationship be-tween cognitive function measured by the MMSE and ADLand IADL functioning in a group of dementia patients(MMSE >? = 13.7) found no differences between Blacks andWhites in the strong relationship between MMSE scoresand function (Ford, Haley, Thrower, West, & Harrell, 1996).Gender-specific information was lacking in this study and,moreover, these results cannot be generalized to nonde-mented older adults, such as the women in our research.The findings are in contrast to our own, which showed noMMSE and function association in cognitively intact Blackwomen. The difference in the two studies suggests that theMMSE may be associated with physical functioning inBlack women with dementia but not in those who are cogni-tively intact, after taking age and education into account.
Several factors may contribute to the observed differencesbetween Blacks and Whites in our study. Since the trend forpoorer function with lower MMSE scores was evident inBlack women prior to controlling for age and education butwas eliminated by these adjustments, it is clear that the rela-tionship was strongly confounded by age and education. Inaddition, the race differences observed in the r2 of theage/MMSE models showed that there was more randomvariability overall in the MMSE scores of the Blacks com-pared to Whites. Although the items on the MMSE appearstraightforward and unbiased, errors among the Blackwomen were more common in specific item sets rather thanoccurring throughout the test. Other studies examining edu-cation bias in the MMSE have found similar errors occurringmore frequently in those with less education (Magaziner,Bassett, & Hebel, 1987; Murden et al., 1991). Educationalone does not explain the BlackAVhite differences in ourstudy. Researchers have speculated on possible socioculturalinfluences that could contribute to observed race differencesin MMSE test performance, but studies are lacking that elu-cidate the role of suspected cultural factors in MMSE perfor-mance (Bohnstedt et al., 1994). It is possible that, above therecommended cutpoints for dementia screening, increases inMMSE scores may not have the same meaning in the tworacial groups of women. Stated another way, scores abovethe dementia cutpoints on the MMSE may not be capturingtrue differences across levels of cognitive functioning in el-derly Black women, as they do in their White counterparts.
Another explanation may be that Black women differfrom White women in their reporting of functional diffi-culty. This seems unlikely, because observed differences byrace in the reported prevalences of functional difficulties
Dow
nloaded from https://academ
ic.oup.com/psychsocgerontology/article/53B/3/P201/545365 by guest on 05 July 2022
MMSE AND DISABILITY IN BLACKS AND WHITES P207
were not substantial. Furthermore, this explanation wouldrequire evidence that Black women systematically overre-port or White women systematically underreport disability.Similarities in the observed associations of other variableswith reported functional difficulties in both race groups inTable 2 do not support a systematic reporting bias in eithergroup. Another factor to be considered is that our findingsfrom a representative sample of older Black women in Bal-timore may not be generalizable to Blacks in other parts ofthe United States. The results would need to be replicatedin other populations of older Black women and men to con-firm the lack of association between MMSE scores and dis-ability in this population group.
An alternative hypothesis is that Black women may dif-fer from White women in the process by which disabilitiesdevelop. The relative importance of cognitive decline in thedevelopment of functional difficulty in Black women maybe outweighed by other factors, such as disease burden orhealth behavior risks. In support of this hypothesis, we ob-served differences between the two racial groups in the as-sociations between comorbidities and functional difficulty.Although information on disease severity was not availablein our data, the number of comorbid conditions, and the di-agnoses of stroke and arthritis, were each more strongly as-sociated with functional loss in Blacks than in Whites. Ifdisease burden was operating as a confounder of theMMSE/function relationship, an association might have be-come apparent after adjusting for comorbidities, includingstroke and arthritis. Although the relative risks for func-tional difficulty by categories of the MMSE increasedslightly after controlling for these factors, there was no evi-dence of a trend for increasing disability with lower MMSEscores. An additional consideration is the influence of obe-sity and sedentary living, both unmeasured in the screeninginterview of our study, which have been shown to havegreater impact on the development of disability in Blacksthan in Whites (Clark, 1996; Keil et al., 1989). However, itis doubtful that any of these factors would completely elim-inate or explain the marked differences in the MMSE/func-tion relationship in the two race groups.
We had limited information in addition to years of educa-tion with which to further evaluate the impact of SES onthe findings. However, after excluding 19% of the womenbecause of missing income data, the results did not changematerially after adjusting for income. This was contrary towhat might have been expected. A previous study from theNetherlands found that education did not adequately con-trol for SES differences in MMSE scores, and that by ad-justing for additional SES indices (type of health insurance,public vs private), the OR for cognitive impairment withpoorer education dropped by 15-20% (Launer, Dinkgreve,Jonker, Hooijer, & Lindeboom, 1993). In addition to popu-lation differences between the Netherlands study and ourown, the research questions were not the same in the twostudies, and factors found to be associated with MMSEscores may not exert the same influence on the relationshipbetween the MMSE and physical functioning.
The use of self-reported physical functioning in a popu-lation that includes persons with possible cognitive impair-ment may raise concerns about the validity of the measures.
However, while there is no "gold standard" for measuringthe validity of self-reported functional status, the measureswe used have face validity, and previous studies by mem-bers of our research team have shown that self-reported dis-ability is predictive of institutionalization and all-causemortality (Corti, Guralnik, Salive, & Sorkin, 1994; Gural-nik et al., 1994). Further, we found that excluding the infor-mation from persons in either the lowest or the two loweststrata on the MMSE (scores <24, the recommended demen-tia screening cutpoint) did not materially change the find-ings or the conclusions of our study.
A limitation of the study is its cross-sectional nature. Itwould be of interest to explore possible mechanisms thatmediate the cognitive function/physical disability associa-tion in Blacks and Whites; such an analysis will be possiblein the longitudinal follow-up of WHAS participants. Find-ings from the Nun Study, a prospective epidemiologicalstudy of Alzheimer's disease and aging in a cohort of U.S.Catholic nuns, showed different risks for loss of physicalfunction among women according to the trajectory of theirMMSE scores over time (Grenier et al., 1996). Among nunswith low normal function at baseline (MMSE 24-27), thosewhose scores had declined at follow-up were more likely tolose independence in ADLs than those whose scores wereunchanged. In our study, we were unable to examine thetrajectory of cognitive function, though future follow-up inthis study could shed some light on whether race differ-ences in the MMSE-function association would persist in alongitudinal analysis.
The MMSE was never intended to be used alone for di-agnosing dementia, but rather as a clinical screening tool aspart of a comprehensive exam (Anthony et al., 1982; Fol-stein et al., 1975). Its developers were aware that it per-formed differently in Blacks and Whites of varying educa-tion levels. However, it was found to be an effectivescreening tool in both racial groups, after taking age andeducation into account. Furthermore, it has been used forclinical research purposes in varying racial, ethnic, and cul-tural groups around the world. To extend the use of theMMSE from a screening instrument to a measure of cogni-tive functioning, especially in nondemented persons, re-quires more assumptions regarding the performance of thetool. For this purpose, the validity of the MMSE for raciallyand educationally diverse populations has yet to be proven.The results of this study suggest that scores across the lowto high normal range of the MMSE may not truly discrimi-nate between levels in the normal range of cognitive func-tioning among Black women.
ACKNOWLEDGMENTS
The authors wish to thank Drs. Brenda Plassman and KathleenWelsh-Bohmer of Duke University and Dr. George Rebok of The JohnsHopkins University for their helpful comments on the manuscript.
Address correspondence to Dr. Suzanne Leveille, Epidemiology, De-mography, and Biometry Program, National Institute on Aging, 7201 Wis-consin Avenue, Suite 3C-309, Bethesda, MD 20892. E-mail: leveills®gw.nia.nih.gov
REFERENCES
Anthony, J. C, LeResche, L., Unaiza, N., Von Korff, M., & Folstein, M. F.(1982). Limits of the "Mini-Mental State" as a screening test for de-
Dow
nloaded from https://academ
ic.oup.com/psychsocgerontology/article/53B/3/P201/545365 by guest on 05 July 2022
P208 LEVEILLE ETAL
mentia and delirium among hospital patients. Psychological Medicine,12, 397^08.
Berkman, L. F. (1986). The association between educational attainmentand mental status examinations: Of etiologic significance for senile de-mentias or not? Journal of Chronic Disease, 39, 171-174.
Bohnstedt, M., Fox, P. J., & Kohatsu, N. D. (1994). Correlates ofMini-Mental Status Examination scores among elderly demented pa-tients: The influence of race-ethnicity. Journal of Clinical Epidemiol-ogy, 47, 1381-1387.
Clark, D. O. (1996). The effect of walking on lower body disability amongolder Blacks and Whites. American Journal of Public Health, 86,57-61.
Corti, M. C , Guralnik, J. M., Salive, M. E., & Sorkin, J. D. (1994). Serumalbumin level and physical disability as predictors of mortality in olderpersons. Journal of the American Medical Association, 272,1036-1042.
Escobar, J. I., Burnam, A., Karno, M., Forsythe, A., Landsverk, J., &Golding, J. M. (1986). Use of the Mini-Mental State Examination(MMSE) in a community population of mixed ethnicity. Journal ofNervous and Mental Disorders, 174, 607-614.
Ferrucci, L., Guralnik, J. M., Baroni, A., Tesi, G., Antonini, E., & Mar-chionni, N. (1991). Value of combined assessment of physical healthand functional status in community-dwelling aged: A prospectivestudy in Florence, Italy. Journals of Gerontology: Medical Sciences,46, M52-M56.
Ferrucci, L., Guralnik, J. M., Marchionni, N., Costanzo, S., Lamponi, M.,& Baroni, A. (1993). Relationship between health, fluid intelligenceand disability in a non-demented elderly population. Aging: Clinicaland Experimental Research, 5,435-443.
Fillenbaum, G., Heyman, A., Williams, K., Prosnitz, B., & Burchett, B.(1990). Sensitivity and specificity of standardized screens of cognitiveimpairment and dementia among elderly Black and White communityresidents. Journal of Clinical Epidemiology, 43, 651-660.
Fillenbaum, G. G., Hughes, D. C , Heyman, A., George, L. K., & Blazer,D. G. (1988). Relationship of health and demographic characteristicsto Mini-Mental State Examination score among community residents.Psychological Medicine, 18, 719-726.
Folstein, M., Anthony, J. C , Parhad I., Duffy, B., & Gruenberg, E. M.(1985). The meaning of cognitive impairment in the elderly. Journal ofthe American Geriatrics Society, 33, 228-235.
Folstein, M. F , Folstein, S. E., & McHugh, P. R. (1975). Mini-MentalState: A practical method for grading the cognitive state of patients forthe clinician. Journal of Psychiatric Research, 12, 189-198.
Ford, A. B., Folmar, S. J., Salmon, R. B., Medalie, J. H., Roy, A. W., &Galazka, S. S. (1988). Health and function in the old and very old.Journal of the American Geriatrics Society, 36, 187-197.
Ford, G. R., Haley, W. E., Thrower, S. L., West, C. A. C , & Harrell, L. E.(1996). Utility of Mini-Mental State Exam scores in predicting func-tional impairment among White and African-American dementia pa-tients. Journals of Gerontology: Medical Sciences, 51 A, M185-M188.
Fried, L. P., Kasper, J. D., Guralnik, J. M., & Simonsick, E. M. (1995).The Women's Health and Aging Study: An introduction. In Guralnik,J. M., Fried, L. P., Simonsick, E. M., Kasper, J. D., & Lafferty, M. E.(Eds.), The Women's Health and Aging Study: Health and social char-acteristics of older women with disability (NIH Pub. 95-4009, pp.1-8). Bethesda, MD: National Institute on Aging (full text available onWWW site: http://www.nih.gov/nia/edb/whasbook/title.htm).
Frisoni, G. B., Rozzini, R., Bianchetti, A., & Trabucchi, M. (1993). Princi-pal lifetime occupation and MMSE score in elderly persons. Journalsof Gerontology: Social Sciences, 48, S310-S314.
Gill, T. M., Richardson, E. D., & Tinetti, M. E. (1995). Evaluating the risk
of dependence in activities of daily living among community-livingolder adults with mild to moderate cognitive impairment. Journals ofGerontology: Medical Sciences, 50A, M235-M241.
Grenier, P. A., Snowdon, D. A., & Schmitt, F. A. (1996). The loss of inde-pendence in activities of daily living: The role of low normal cognitivefunction in elderly nuns. American Journal of Public Health, 86,62-66.
Guralnik, J. M., Fried, L. P., Simonsick, E. M., Kasper, J. D., & Lafferty,M. E., eds. (1995). The Women's Health and Aging Study: Health andsocial characteristics of older women with disability. Bethesda, MD:National Institute on Aging. NIH Pub. 95-4009.
Guralnik, J. M., & Kaplan, G. A. (1989). Predictors of healthy aging:Prospective evidence from the Alameda County Study. American Jour-nal of Public Health, 79, 703-708.
Guralnik, J. M., Simonsick, E. M., Ferrucci, L., Glynn, R. J., Berkman, L.F, Blazer, D. G., Scherr, P. A., & Wallace, R. B. (1994). A short physi-cal performance battery assessing lower extremity function: Associa-tion with self-reported disability and prediction of mortality and nurs-ing home admission. Journals of Gerontology: Medical Sciences, 49,M85-M94.
Jorm, A. F., Scott, R., Henderson A. S., & Kay, D. W. K. (1988). Educa-tional level differences on the Mini-Mental State: The role of test bias.Psychological Medicine, 18, 727-731.
Kasper J. (1990). Cognitive impairment among functionally limited el-derly people in the community: Future considerations for long-termcare policy. Milbank Quarterly, 1, 81-109.
Keil, J. E., Gazes, P. C , Sutherland, S. E., Rust, P. F, Branch, L. G., & Ty-roler, H. A. (1989). Predictors of physical disability in elderly Blacksand Whites of the Charleston Heart Study. Journal of Clinical Epi-demiology, 42, 521-529.
Langlois, J. A., Maggi, S., Harris, T, Simonsick, E. M., Ferrucci, L.,Pavan, M., Sartori, L., & Enzi, G. (1996). Self-report of difficulty inperforming functional activities identifies a broad range of disability inold age. Journal of the American Geriatrics Society, 44, 1421-1428.
Launer, L. J., Dinkgreve, A. H. M., Jonker, C , Hooijer, C , & Lindeboom,J. (1993). Are age and education independent correlates of theMini-Mental State Exam performance of community-dwelling elderly?Journals of Gerontology: Psychological Sciences, 48, P271-P277.
Magaziner, J., Bassett, S. S., & Hebel, J. R. (1987). Predicting perfor-mance on the Mini-Mental State Examination: Use of age- and educa-tion-specific equations. Journal of the American Geriatrics Society, 35,996-1000.
Mor, V., Murphy, J., Masterson-Allen, S., Willey, C , Razmpour, A., Jack-son, M. E., Greer, D., & Katz, S. (1989). Risk of functional declineamong well elders. Journal of Clinical Epidemiology, 42, 895-904.
Moritz, D. J., Kasl, S. V., & Berkman, L. F. (1995). Cognitive functioningand the incidence of limitations in activities of daily living in an elderlycommunity sample. American Journal of Epidemiology, 141, 41-49.
Mungas, D., Marshall, S. C , Weldon, M., Haan, M., & Reed, B. R. (1996).Age and education correction of Mini-Mental State Examination forEnglish- and Spanish-speaking elderly. Neurology, 46, 700-706.
Murden, R. A., McRae, T. D., Kaner, S., & Buckman, M. E. (1991).Mini-Mental State Exam scores vary with education in Blacks andWhites. Journal of the American Geriatrics Society, 39, 149-155.
Tombaugh, T. N., & Mclntyre, N. J. (1992). The Mini-Mental State Exam-ination: A comprehensive review. Journal of the American GeriatricsSociety, 40, 922-935.
Received March 5, 1997Accepted September 30, 1997
Dow
nloaded from https://academ
ic.oup.com/psychsocgerontology/article/53B/3/P201/545365 by guest on 05 July 2022


