Embed Size (px)
Citation preview
journalof nuclear
materials ELSEVIER Journal of Nuclear Materials 229 (1996) 36-47
1.3. Hydrogen in Zr
Blister growth in zirconium alloys" experimentation and modeling
Gladys Domizzi a, Rafil A. Enrique b, Joss Ovejero-Garcia a, Gustavo C. Buscaglia b,c a Depto. Materiales, Gerencia Desarrollo, Comisidn Nacional de Energfa At6mica, At:. Libertador 8250, Buenos Aires, 1429Argentina
b Instituto Balseiro, Universidad Nacional de Cuyo and Comisi6n Nacional de Energ{a At6mica, 8400 San Carlos de Bariloche, Argentina
c Centro At6mico Bariloche, Comisi6n Nacional de Energfa At6mica, 8400 San Carlos de Bariloche, Argentina
Received 20 September 1994; accepted 24 March 1995
Abstract
Hydrogen redistribution in the presence of a cold spot is considered, with hydrogen concentrations above the solid-solubility limit and thus with hydrogen flowing through a hydride-matrix mixture. Fully-hydrided regions (frequently called blisters) grow in the samples, beginning at the cold spot. Under equivalent conditions, the experiment is carried out on several Zr-2.5% Nb samples, allowing for the hydrogen migration times to vary from 1 × 10 5 to 6 × 10 5 s, so as to construct a blister-growth curve. Metallographic examination of the samples is performed before and after the imposition of the thermal gradient. A mathematical model is then presented, and the corresponding equations are numerically solved by means of a finite element method, refining the discretization so as to render approximation errors unimportant. Agreement between model and experiment is shown to be quite good for migration times greater than 3 x 10 5 s. For shorter times, implying small blisters around the cold spot, discrepancies arise between model and experiment, which are attributed to errors in estimating the local tempera- ture field near the sample surface.
1. Introduction
A proper understanding of hydrogen migration within zirconium-alloy nuclear components, such as fuel cladding tubes, fuel channels, and pressure tubes, is essential to predict the mechanical response of these components under both normal and abnormal operat- ing conditions. The high diffusion coefficient of hydro- gen, compared to other solutes, makes it necessary to consider redistribution phenomena driven by concen- tration, temperature, or stress gradients.
As is well known, the failure of a pressure tube at Pickering NGS 'A' Unit 2 reactor [1] has motivated intensive research concerning the effect of localized temperature gradients, specifically cold spots such as those originating in the neighborhood of an hypotheti- cal pressure-tube/calandria-tube contact [2-6]. More recently, temperature gradients have been used to ex- plain hydrogen localization in boiling water reactor fuel rods [7].
The basic physical mechanism is the thermal diffu- sion of hydrogen through the hexagonal closed packed c~-phase, with hydride precipitation in the colder re- gions, once the local solubility limit is exceeded (under the thermal conditions of interest, the metastable -/- phase does not precipitate [8], and we will thus refer to the hydride as g-phase hereafter). Extensive work on this subject was carried out by Sawatzky and co- workers, and Markowitz, in the sixties, both perform- ing experiments and developing theoretical models [9- 13]. As discussed in Ref. [2], however, Sawatzky's model is unable to predict several experimental observations, mainly because it does not consider the hysteresis that appears in the ~-~ phase transformation, reported in Refs. [14,15].
In Ref. [3], Jovanovic et al. reported 24 thermal-dif- fusion experiments. In eight of them, only the a-phase was present and the concentration profiles were used to determine the heat of transport. In the rest of the samples, the terminal solid solubility was exceeded
0022-3115/96/$15.00 © 1996 Elsevier Science B.V. All rights reserved SSDI 0022-3 11 5(95)00204-9
G. Domizzi et al. / Journal of Nuclear Materials 229 (1996) 36-47 37
somewhere within the sample, and the distribution and orientation of hydrides were studied. In both cases, experimental concentration profiles were compared with those predicted by a numerical simulation based on the model of Byrne and Leger [2]. The symmetry of the experimental setup rendered the physical situation essentially one-dimensional in those experiments.
This work follows the line of Refs. [3,4], we consider a three-dimensional situation (revolution symmetry around an axis simplifies it to 2D) and conditions that allow for large massively-hydrided regions (frequently called blisters) to develop in the cold zones of the samples. Blister characteristics and overall hydrogen distributions are studied by metallographic examina- tion, and compared to finite element simulations based on the thermal-diffusion model of Byrne and Leger. We find good agreement between model and experi- ment for large blisters. Discrepancies that are observed for small blisters are attributed to uncertainties in the estimation of the local temperature field near the sample surface.
2. Experimental procedure
2.1. Generalities
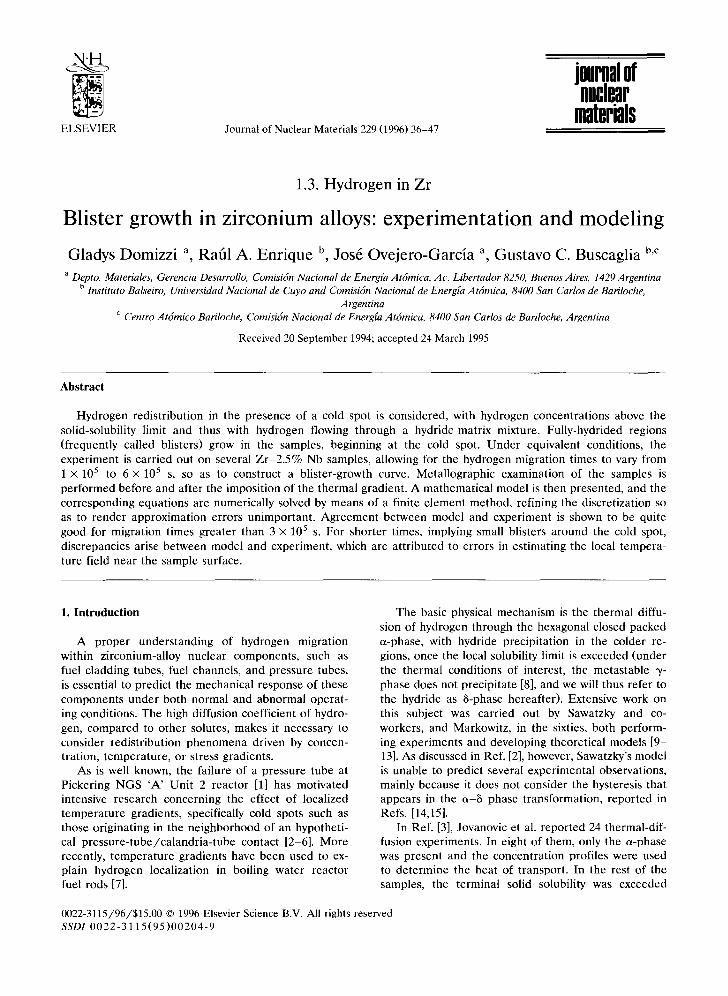
The experiment consisted of the creation of a small cold spot (~ 200°C) on the surface of a Zr-2.5% Nb pressure-tube cylindrical fragment (see Fig. la), previ- ously charged with an homogeneous hydrogen concen- tration of 300 ppm (concentrations are expressed by weight throughout the paper). The bulk temperature was 390°C. The pressure tube was one of those actually used in reactors and initially had a diameter of 112 mm and was 4.25 mm in thickness. Notice that the sample axis corresponded to the radial direction of the pres- sure tube.
Each of the seven samples was first cathodically charged with hydrogen. The hydrogen concentration was then homogenized by thermal annealing at 465°C, and after that the samples were given circular shape (diameter = 30-35 mm). Finally, a thermal gradient was applied to form a blister, during times ranging from 1 x 10⁵ to 6 x 10⁵ s. Simultaneous measurements of the temperature at certain points were performed to estimate the temperature field.
One of the samples (Sample 7) was treated in autoclave (400°C, 105 atm, 76 h) to form an oxide layer (similar to that present in pressure tube as provided) prior to the blister formation experiment.
2.2. Cathodic charge
The hydrogen charge was performed in a sulfuric acid solution 0.05M, with a current density of 150
PRESSURE TUBE
SAMPLE ,~1,~: "~"-~:!:'~ ;'~
a) I
/
COLD F I NGER j SAtIPLE
b) FURNACE
Fig. 1. (a) Scheme showing geometrical relationship between the sample and the pressure tube from which it was extracted. (b) Experimental device for blister formation.
mA / c m 2 at 98°C during 3 days. After the charge, a zirconium-hydride layer with thickness 35-60 I~m was observed on the sample surface (axial-circumferential planes). Such a layer ensures an average concentration above 300 ppm within the sample.
2.3. Homogenization annealing
To homogenize the hydrogen distribution within the sample, an isothermal annealing at 465°C was per- formed during 16-19 h, followed by air-cooling. At this temperature, the diffusion coefficient of hydrogen takes the value 7.848 x 10 -4 mm2/s [3]. Using as length scale half the sample thickness (2.125 mm), a time scale for diffusion is T = (2.125 mm)2/(7.848 x 10 -4 mmZ/s) = 1.59 h. We thus expect that, after 10 T = 16 h, the concentration is homogeneous in the interior of the sample, and equal to the concentration in equilib- rium with the hydride layer at 465°C. Different inter- pretations exist in the literature for this equilibrium concentration [16,17], leading to different values in the range 265-343 ppm. It will be shown later that this uncertainty does not affect our conclusions, as our
38 G. Domizzi et al. /Journal of Nuclear Materials 229 (1996) 36-47
model predicts practically the same blister-growth curve for concentrations in this range.
The hydride layer that remained after this anneal- ing was removed by mechanical polishing, followed by etching in a solution of(45 ml NO3H , 45 ml H 2 0 , 6 ml FH). It was observed that these treatments completely removed the hydride layer, and that the hydrogen distribution was indeed homogeneous prior to the im- position of the thermal gradient. Finally, the samples were given circular shape (height = 3.9 mm, diameter = 30-35 mm) and the residue was used to analyze the hydrogen distribution (by metallographic observation after etching in a solution of (45 ml NO3H2, 45 ml lactic acid, 6 ml FH)). Samples 1-6 were further an- nealed at 400°C for 8 h, to oxidize the surface as needed by the thermographer.
2.4. Thermal-diffusion annealing (blister formation)
improving its thermal contact by deposition of a tin drop. Measured values of the temperature at the lower thermocouples ranged between 382 and 404°C, de- pending on the sample, probably due to differences in the aluminum powder layer. The maximum difference with respect to the upper one was 2°C. During blister formation in each sample, the output of the thermo- couples did not change with time.
Thermographic reading allowed for measurements of the temperature at the exterior surfaces of both the sample and the cold finger at several locations. A previous calibration yielded emissivity values of 0.48 for oxidized aluminum, and of 0.62 for oxidized Z r - 2.5% Nb. A 10% error in the emissivity produces a 5%-error in the measured temperatures. Typical tem- perature values measured on the sample and on the cold finger are shown in Table 1.
A non-homogeneous steady thermal field was im- posed on the prepared sample by means of the device depicted in Fig. 1. The sample was placed over an aluminum block kept at (415 + 1)°C with an electrical furnace. To homogenize the sample-block thermal con- tact an 80-mesh aluminum powder was deposited be- tween them. The upper central part of the sample was flattened and polished (after that Sample 7 was auto- claved), then the cold spot was formed by placing a water-cooled polished aluminum finger against it. For the samples 1, 3 and 6 the water was taken directly from the mains (14-16°C), while for the others a closed loop kept at (21.0 + 0.5)°C was used. The cold finger was circular, with diameter 2.5 mm.
After applying this thermal field for 1 × 10⁵-6 × 10⁵ s, the cold contact was removed and the formation of a blister was verified. A transversal cut and repeated polishing allowed us to reach the central part of the blister to measure its diameter and depth.
2.5. Temperature measurements
In each sample, two holes (0.5 mm × 0.8 mm × 5 mm) were made by electroerosion, at (0.5 + 0.1) mm from the upper and lower surfaces, respectively. Inside each hole, a J-type sheathed thermocouple was placed,
3. Experimental results
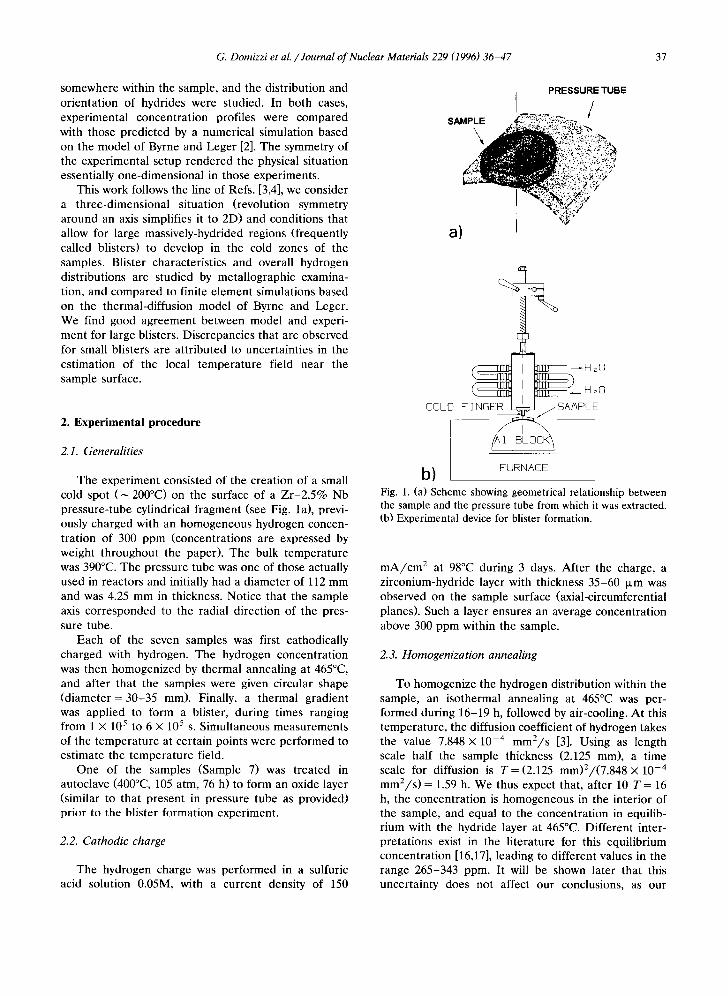
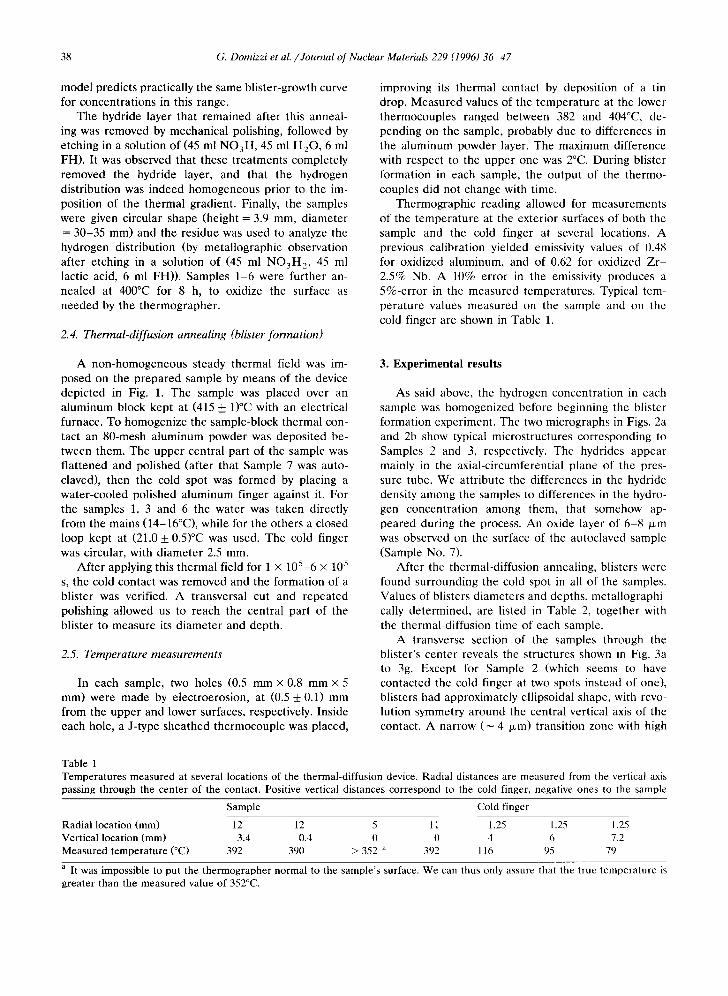
As said above, the hydrogen concentration in each sample was homogenized before beginning the blister formation experiment. The two micrographs in Figs. 2a and 2b show typical microstructures corresponding to Samples 2 and 3, respectively. The hydrides appear mainly in the axial-circumferential plane of the pres- sure tube. We attribute the differences in the hydride density among the samples to differences in the hydro- gen concentration among them, that somehow ap- peared during the process. An oxide layer of 6-8 Ixm was observed on the surface of the autoclaved sample (Sample No. 7).
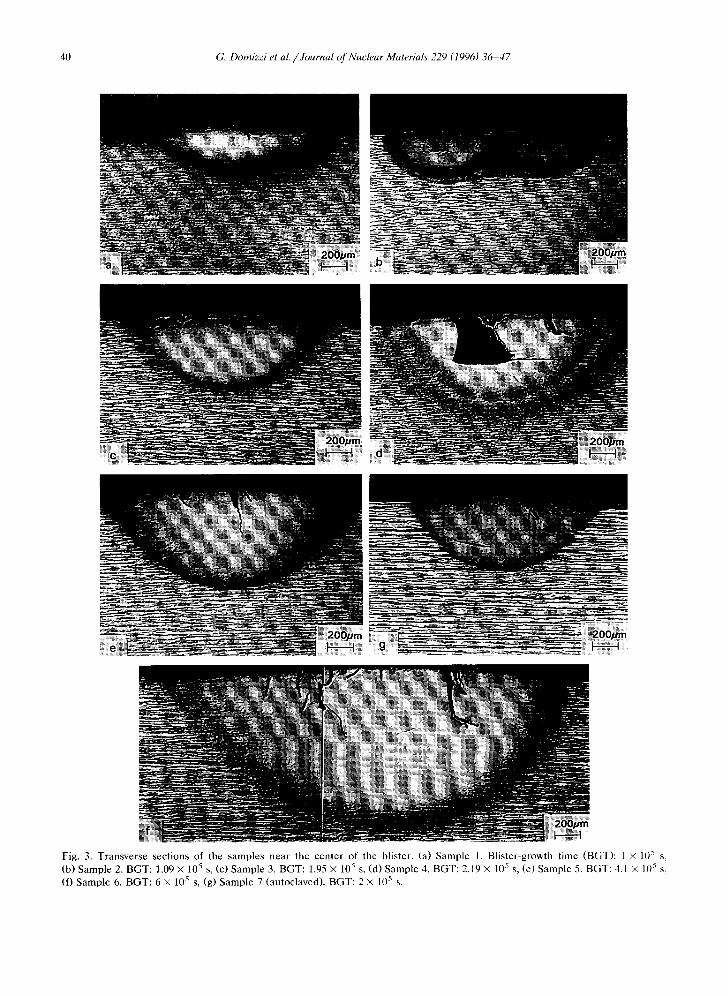
After the thermal-diffusion annealing, blisters were found surrounding the cold spot in all of the samples. Values of blisters diameters and depths, metallographi- cally determined, are listed in Table 2, together with the thermal-diffusion time of each sample.
A transverse section of the samples through the blister's center reveals the structures shown in Fig. 3a to 3g. Except for Sample 2 (which seems to have contacted the cold finger at two spots instead of one), blisters had approximately ellipsoidal shape, with revo- lution symmetry around the central vertical axis of the contact. A narrow (~ 4 ~m) transition zone with high
Table 1 Temperatures measured at several locations of the thermal-diffusion device. Radial distances are measured from the vertical axis passing through the center of the contact. Positive vertical distances correspond to the cold finger, negative ones to the sample
Sample Cold finger
Radial location (mm) 12 12 5 11 1.25 1.25 1.25 Vertical location (mm) - 3.4 - 0.4 0 0 4 6 7.2 Measured temperature (°C) 392 390 > 352 a 392 116 95 79
a It was impossible to put the thermographer normal to the sample's surface. We can thus only assure that the true temperature is greater than the measured value of 352°C.
G. Domizzi et al. /Journal of Nuclear Materials 229 (1996) 36-47 39
It can be seen that the size and shape of the blister formed in Sample 7 (autoclaved) is within the scatter of those observed in the other samples. This confirms that the presence of an oxide layer between the sample and the cold finger does not significantly affect the temper- ature field in our experiment.
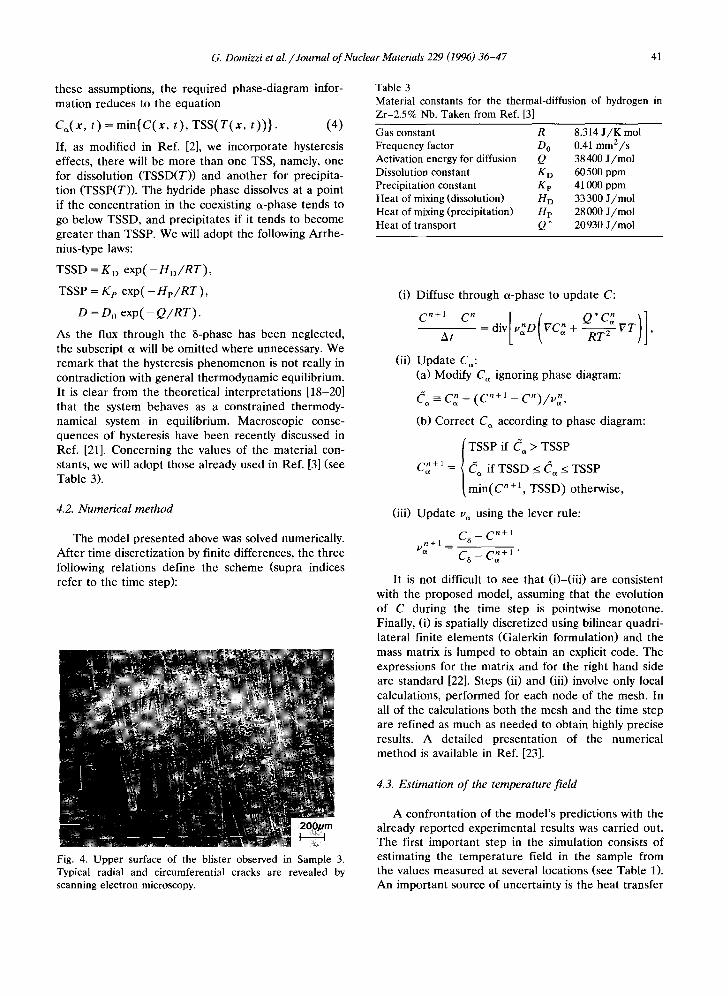
Cracks were observed in all of the blisters, as can be seen Fig. 3. Samples 2 and 7 also had inner cracks (i.e., cracks not initiated at the surface), evidencing the fragile behavior of zirconium hydride. A photograph of the upper surface of Sample 3, showing the cracked surface of the blister, is shown in Fig. 4.
4. Numerical modeling
Fig. 2. Typical microstructures of the homogenized samples, before blister formation. Radial-circumferential plane of the pressure tube. (a) Sample 2, (b) Sample 3.
density of hydrides surrounded the blisters, which were completely hydrided. Outside this narrow region, the microstructure of the rest of the sample was similar to that before blister formation (compare with Fig. 2).
Table 2 Diameter and depth of the experimental blisters
Sample Thermal- Blister depth Blister diameter no. diffusion (mm) a (mm) a
time (>(10 3 s)
1 100 .0 0.37-0.41 1.48-1.85 2 109 .0 0 . 3 7 - 0 . 4 1 1.61-1.67 3 195.3 0.59-0.65 1.57-1.75 4 219 .6 0.70-0.76 1.67-1.89 5 410 .7 0.81-0.85 2.03-2.13 6 600 .0 1 . 1 5 - 1 . 3 0 2.90-3.15 7 b 200 .0 0 . 6 0 - - 0 . 6 0 1.57--1.85
a The first value corresponds to the pure-hydride zone, while the second one corresponds to the heavily hydrided region surrounding it. b This sample was previously oxidized in an autoclave.
4.1. Physical model
The classical model of thermally-assisted diffusion [2,9,10,12] is based upon an homogenization proce- dure. The hydrogen fluxes in the a and ~ phases, weighted with their respective volume fractions, are added to build the total (average) hydrogen flow in any elementary volume (Notation: Actually, in Zr-2.5% Nb, the solid-solution phase denoted by a is not just the thermodynamic a-phase but a mixture of this phase with the niobium-rich [3-phase.) The total concentra- tion field C of hydrogen, inside a domain .O, obeys the conservation equation
0C - - + div(v~J~ + vaJ~) = O, (1) at
where J~ and J~ are the hydrogen fluxes in phases a and ~ and v~ and v~ the corresponding volumetric fractions. The thermal-diffusion flux in the a-phase is given by
with D~, the diffusion coefficient, Q~ the heat of transport, T the temperature in K, and C~ the concen- tration of hydrogen in the a-phase. A similar equation holds for Ja, but, considering that the diffusion coeffi- cient of the hydride is much lower than that of the a-phase [12], and that the hydride phase is discontinu- ous (in the form of small platelets), it is usual [2,3] to neglect the solute flux through the hydride.
The model gets completed after adding the lever- rule equation
C = u,~C,~ + v~Ca = C~ + v,(C~ - Ca), (3)
and a thermodynamic phase diagram. Let us assume that the hydride (a chemical compound) has a fixed concentration C a = 16000 ppm, and, as in Refs. [10,12], that the solubility limit in the a-phase is given by a single equilibrium (or saturation) line TSS(T). Under
40 G. Domizzi et al. /Journal of Nuclear Materials 229 (1996) 36-47
Fig. 3. Transverse sections of the samples near the center of the blister. (a) Sample 1. Blister-growth time (BGT): 1 × 10 > s. (b) Sample 2. BGT: 1.09 x 10⁵ s, (c) Sample 3. BGT: 1.95 x 10 s s, (d) Sample 4. BGT: 2.19 x 10⁵ s, (e) Sample 5. BGT: 4.1 x l0 s s. (f) Sample 6. BGT: 6 x 10⁵ s, (g) Sample 7 (autoclaved). BGT: 2 × 10 s s.
G. Domizzi et al. /Journal of Nuclear Materials 229 (1996) 36-47 41
these assumptions, the required phase-diagram infor- mation reduces to the equation
C~,(x, t ) = min{C(x, t ) , TSS(T(x , t ) ) } . (4)
If, as modified in Ref. [2], we incorporate hysteresis effects, there will be more than one TSS, namely, one for dissolution (TSSD(T)) and another for precipita- tion (TSSP(T)). The hydride phase dissolves at a point if the concentration in the coexisting c~-phase tends to go below TSSD, and precipitates if it tends to become greater than TSSP. We will adopt the following Arrhe- nius-type laws:
TSSD = K D e x p ( - H D / R T ) ,
TSSP = K e e x p ( - H v / R T ) ,
D = D O exp( - Q / R T ) .
As the flux through the 5-phase has been neglected, the subscript c~ will be omitted where unnecessary. We remark that the hysteresis phenomenon is not really in contradiction with general thermodynamic equilibrium. It is clear from the theoretical interpretations [18-20] that the system behaves as a constrained thermody- namical system in equilibrium. Macroscopic conse- quences of hysteresis have been recently discussed in Ref. [21]. Concerning the values of the material con- stants, we will adopt those already used in Ref. [3] (see Table 3).
4.2. Numerical method
The model presented above was solved numerically. After time discretization by finite differences, the three following relations define the scheme (supra indices refer to the time step):
Fig. 4. Upper surface of the blister observed in Sample 3. Typical radial and circumferential cracks are revealed by scanning electron microscopy.
Table 3 Material constants for the thermal-diffusion of hydrogen in Zr-2.5% Nb. Taken from Ref. [3]
Gas constant R 8.314 J /K mol Frequency factor D O 0.41 mm2/s Activation energy for diffusion Q 38400 J/mol Dissolution constant K o 60 500 ppm Precipitation constant K v 41000 ppm Heat of mixing (dissolution) H o 33 300 J/mol Heat of mixing (precipitation) H e 28 000 J/mol Heat of transport Q * 20 930 J/tool
(i) Diffuse through a-phase to update C:
C ' + I - C ' [ ( A t ~ Q * C ~ ' ] =d iv v :D VC n + V T ) ] ,
(ii) Update Ca: (a) Modify C~ ignoring phase diagram:
( a ~ C a n q" ( C n + l - c n ) / p n a ,
(b) Correct C,~ according to phase diagram:
TSSP if C~ > TSSP
Can + 1 = ] Ca if TSSD _< (~,~ < TSSP
min(C" ÷ 1, TSSD) otherwise,
(iii) Update v~ using the lever rule:
C~ - C n + l n + l
Vc~ C 8 - c n + l -
It is not difficult to see that (i)-(iii) are consistent with the proposed model, assuming that the evolution of C during the time step is pointwise monotone. Finally, (i) is spatially discretized using bilinear quadri- lateral finite elements (Galerkin formulation) and the mass matrix is lumped to obtain an explicit code. The expressions for the matrix and for the right hand side are standard [22]. Steps (ii) and (iii) involve only local calculations, performed for each node of the mesh. In all of the calculations both the mesh and the time step are refined as much as needed to obtain highly precise results. A detailed presentation of the numerical method is available in Ref. [23].
4.3. Estimation o f the temperature fieM
A confrontation of the model's predictions with the already reported experimental results was carried out. The first important step in the simulation consists of estimating the temperature field in the sample from the values measured at several locations (see Table 1). An important source of uncertainty is the heat transfer
42 G. Domizzi et al. /Journal of Nuclear Materials 229 (1996) 36-47
Table 4 Thermal parameters used to estimate the temperature field a
Thermal conductivity of Zr-2.5% Nb k ZrNb Thermal conductivity of AI kAl Heat transfer coefficient between sample and cold finger (maximum) hcm~t Heat transfer coefficient between sample and aluminum block hbloc k Heat transfer coefficient between sample and surrounding air h air
0.0215 W/(mm °C) 0.2 W/(mm °C) 1.7852 W/(mm 2 °C) 9.81 X 10 -4 W/(mm 2 °C) 2.1x10 SW/(mm 2oC)
a These parameters were determined so that the estimated temperature field agrees as much as possible with the temperature measurements of Table 1.
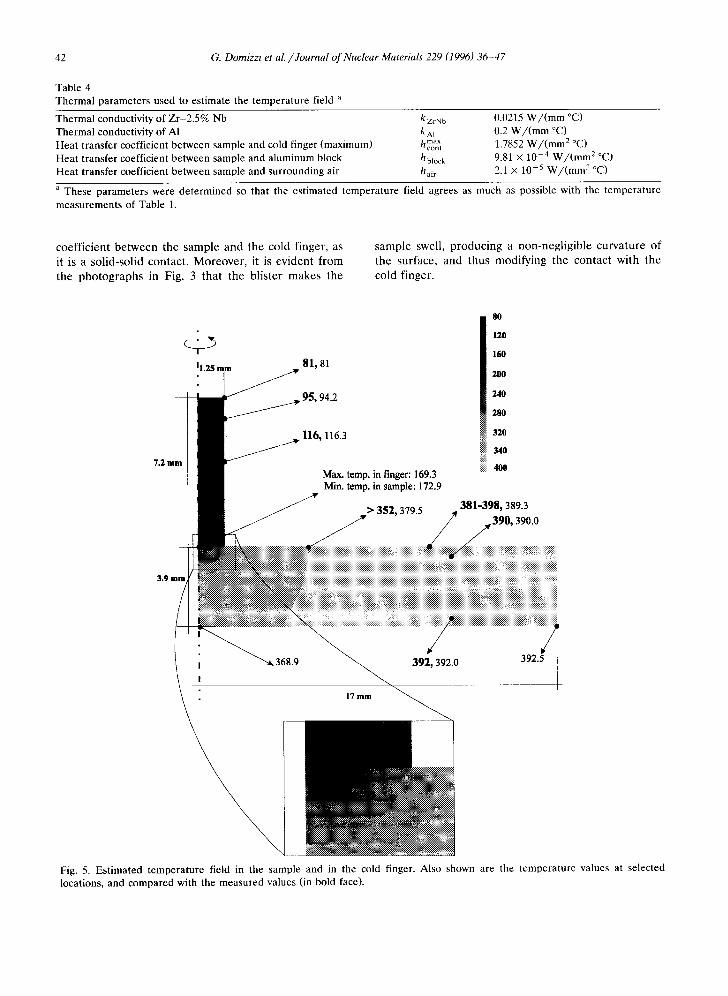
coefficient be tween the sample and the cold finger, as it is a solid-solid contact. Moreover, it is evident from the photographs in Fig. 3 that the blister makes the
sample swell, producing a non-negligible curvature of the surface, and thus modifying the contact with the cold finger.
11.25
7.2 mm
81,81
• 95, 94.2
• 116 , 116.3
Max. temp. in finger: 169.3 Min. temp. in sample: 172.9
379.5
8o
12o
160
200
240
280
320
340
iiiiiii 4o0
381-398, 389.3
_390 . 390.0
3.9 r a i n
368.9 ~ 392, 392.0
17 mi l l
Fig. 5. Estimated temperature field in the sample and in the cold finger. Also shown are the temperature values at selected locations, and compared with the measured values (in bold face).

G. Domizzi et al. /Journal of Nuclear Materials 229 (1996) 36-47 43
Cold finger : /
........~lilli~l~iill~liilliiliili~iiii~}iiiiiiiiiiiiii-.ii.~.~F----------------~-N~-~-------------N" ~F~ |~ i~F |~ -~ |~ | | | | ~ -~H~ | |~H | - . - . - - | -~N | - - - -~ - - - -~ - - | ~iii~i~i~iiiii~iiiiii~i~ii~iiiiiii~iiiiiiiiiiuiii~iiiNiNiWNiiii~N~i~..l~NN|N-N-lll-.llN|.-~. !!iii~iili~iliiiili[i~ii[~i[[[[li~i[[~il[[~i~[~FF~F~l~Z~!..!~!NN|~NN~N|mNN.~l~l~l~ll--l|
i iiNi i i iiil ll iiiiiiil Wiiii i iii i i INHiiN iiiiiiiWi TT N l llll ! E l!!!!!!!!!!!!."!!!~i!ii~ n.k:EiiHEEE.r.'i.:~i.:i~ k: k r'J i l E if.: .: .: l E .: .= E E E l E" l l E=& .-" .-"-" 1"" .= E E E E E E E E ~ E E l E E E E E E E E file E E E E E E E ;Igl|g~l:l g|,~,l|ll;lll:-'l~l-':gIlllllllll|ll::ll|l|=l:lg~|-'-'-*g-'g|:-'gg-'g-'~gggg gggggggg[]gg~gggggg.-.-~[]~[]~[][][][] [][]--
7-
J i I
I I I i
Aluminum block Fig. O. Finite element mesh used in the calculation. It consists of 9000 bilinear quadrilateral elements and 9211 nodes.
As is usual, the heat transfer through the contact was modeled using the law
qs cf(x) =hcon t ( x ) [Ts (x ) - T c f ( X ) ] n ( x ) , (5)
where qs_cf(X) is the heat flux through the contact at point x, generated by a temperature difference [Ts(x) - Tcf(X)] between the sample and the cold finger, and n(x ) is the unit vector normal to the surface. The main difficulty comes from estimating the heat transfer effi- ciency function h~ont(X) from the measured tempera- ture values. Notice that we have neglected the time dependence of the contact coefficient, as determining its variation with time would have required much more refined temperature measurements. We remind that no significant changes were observed during the exper- iment in the output of the thermocouples.
We however, believe that the local thermal field around the cold spot does change as a consequence of blister growth. In fact, the experimental results show that the blister diameter is, during the first 4 x 10⁵ s, smaller than the diameter of the cold finger. This can only happen if the outer part of the cold finger is not actually touching the sample, possibly as a conse- quence of blister's swelling. The thermal efficiency of the contact, hcont(X), must thus decrease from the center of the contact outwards, and vanish outside a circle of radius rcont smaller than the radius of the cold finger (1.25 mm).
After some tests, we have chosen hcont(X) to be a linear function of the radial distance r from the center of the contact, having a maximum value hcmn~ at the center, and vanishing at rcont = 0.69 mm, where the sample is assumed to detach from the cold finger (this value is estimated from the experimental values of the blister radius at small times) i.e., r)
1 max if r < 0.69 ram, hcont(r) = cont 0.69 m m
if r > 0.69 mm.
(6)
One parameter to be determined was thus hcma t. Other unknown coefficients were those corresponding to the heat transfer from the aluminum block to the sample, hblock, and from the sample to the surrounding air, hair; both of them were assumed position-independent. In Table 4 we list our choice of thermal parameters. Solving the heat-diffusion equation with these parame- ters on a very fine finite element mesh (30 368 triangu- lar elements) yielded the temperature values at mea- sured locations that are shown in Fig. 5, in good agreement with the measured values. Taking this steady temperature field as the estimated temperature in the sample, we then proceeded to simulate the redistribu- tion of hydrogen with the finite element method of Section 4.2.
4.4. Numerical simulation o f the experiment
Applying our finite element method, we found the hydrogen concentration fields in the sample for a simu- lated time of 6 x 10⁵ s, printing the results with inter- vals of 5 X 10⁴ s. The accuracy of the computations was assessed using several meshes with increasing refine- ment, the finest of which is shown in Fig. 6 and consists of 9000 elements and 9211 nodes. Comparison between this mesh and a coarser one allows us to assert that discretization errors are not significant. The revolution symmetry was used to reduce the computational do- main to two dimensions, [0 < r < 17 m m , - 3 . 9 mm < z < 0]. In these coordinates, the thermal contact occupies the region {z = 0, 0 < r < 0.69 mm} (see above). The adopted time step was 3 s, and a zero-flux condition was imposed on the boundary.
Two runs were performed, with hydrogen contents of 300 and 400 ppm, respectively. Of this total hydro- gen concentration, it was imposed that, pointwise, only that part that was below the local TSSD value was in solid solution at the beginning of the experiment. This is because the samples were kept at room temperature
44 G. Domizzi et al. /Journal of Nuclear Materials 229 (1996) 36-47
between the hydrogen charge and the imposition of the thermal gradient.
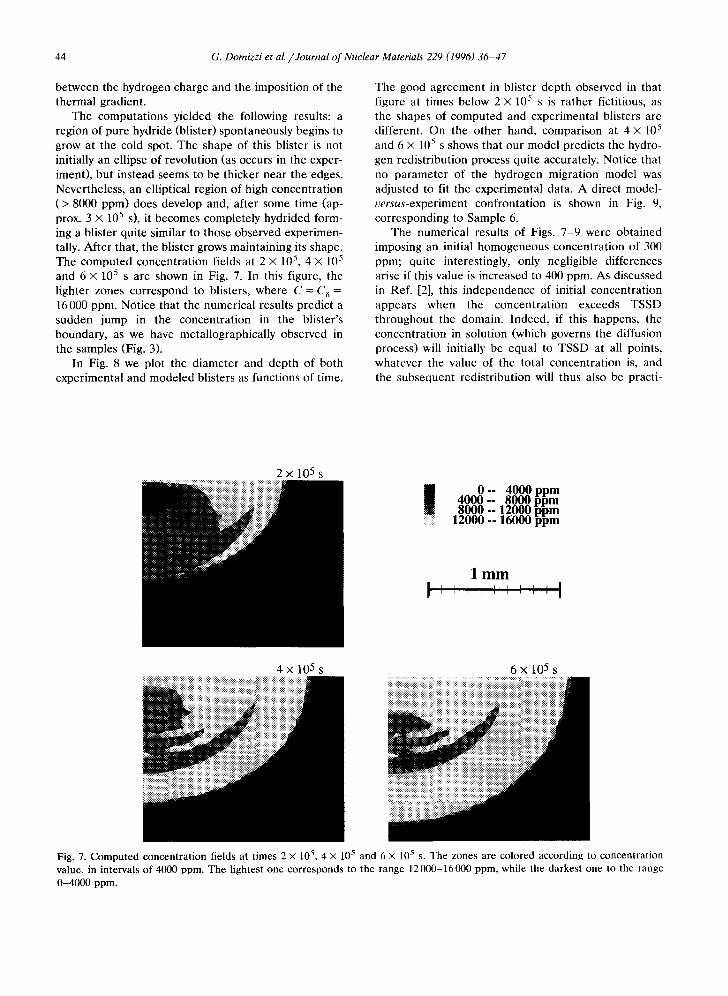
The computations yielded the following results: a region of pure hydride (blister) spontaneously begins to grow at the cold spot. The shape of this blister is not initially an ellipse of revolution (as occurs in the exper- iment), but instead seems to be thicker near the edges. Nevertheless, an elliptical region of high concentration (> 8000 ppm) does develop and, after some time (ap- prox. 3 × 10⁵ s), it becomes completely hydrided form- ing a blister quite similar to those observed experimen- tally. After that, the blister grows maintaining its shape. The computed concentration fields at 2 × 10⁵, 4 x 10⁵ and 6 × 10⁵ s are shown in Fig. 7. In this figure, the lighter zones correspond to blisters, where C = C a = 16 000 ppm. Notice that the numerical results predict a sudden jump in the concentration in the blister's boundary, as we have metallographically observed in the samples (Fig. 3).
In Fig. 8 we plot the diameter and depth of both experimental and modeled blisters as functions of time.
The good agreement in blister depth observed in that figure at times below 2 x 10⁵ s is rather fictitious, as the shapes of computed and experimental blisters are different. On the other hand, comparison at 4 x 10⁵ and 6 x 10⁵ s shows that our model predicts the hydro- gen redistribution process quite accurately. Notice that no parameter of the hydrogen migration model was adjusted to fit the experimental data. A direct model- versus-experiment confrontation is shown in Fig. 9, corresponding to Sample 6.
The numerical results of Figs. 7-9 were obtained imposing an initial homogeneous concentration of 300 ppm; quite interestingly, only negligible differences arise if this value is increased to 400 ppm. As discussed in Ref. [2], this independence of initial concentration appears when the concentration exceeds TSSD throughout the domain. Indeed, if this happens, the concentration in solution (which governs the diffusion process) will initially be equal to TSSD at all points, whatever the value of the total concentration is, and the subsequent redistribution will thus also be practi-
2 × 10⁵s
0 -- 4 0 0 0 p p m 4 0 0 0 -- 8 0 0 0 p p m 8 0 0 0 -- 1 2 0 0 0 p p m
:: :::. 1 2 0 0 0 -- 1 6 0 0 0 p p m
l l n n l
4 × 10⁵ S 6X 10⁵ S
Fig. 7. Computed concentration fields at times 2 x 10⁵, 4 x 10⁵ and 6 x 10⁵ s. The zones are colored according to concentration value, in intervals of 4000 ppm. The lightest one corresponds to the range 12000-16000 ppm, while the darkest one to the range 0-4000 ppm.
G. Domizzi et al. /Journal of Nuclear Materials 229 (1996) 36-47 45
3.5
3 .0
2.5
"~2,0
1.0
0.5
0.0
f
i , i , i , i , i , i
i 0 0 2 0 0 3 0 0 4 0 0 5 0 0 6 0 0 Time (i000 s)
1.5
1.0
0 .5
~_,_-~m j /
J
mm J
i
0 .0 , i , i i i , i , i , i
0 1 0 0 2 0 0 3 0 0 4 0 0 6 0 0 6 0 0 Time (1000 s)
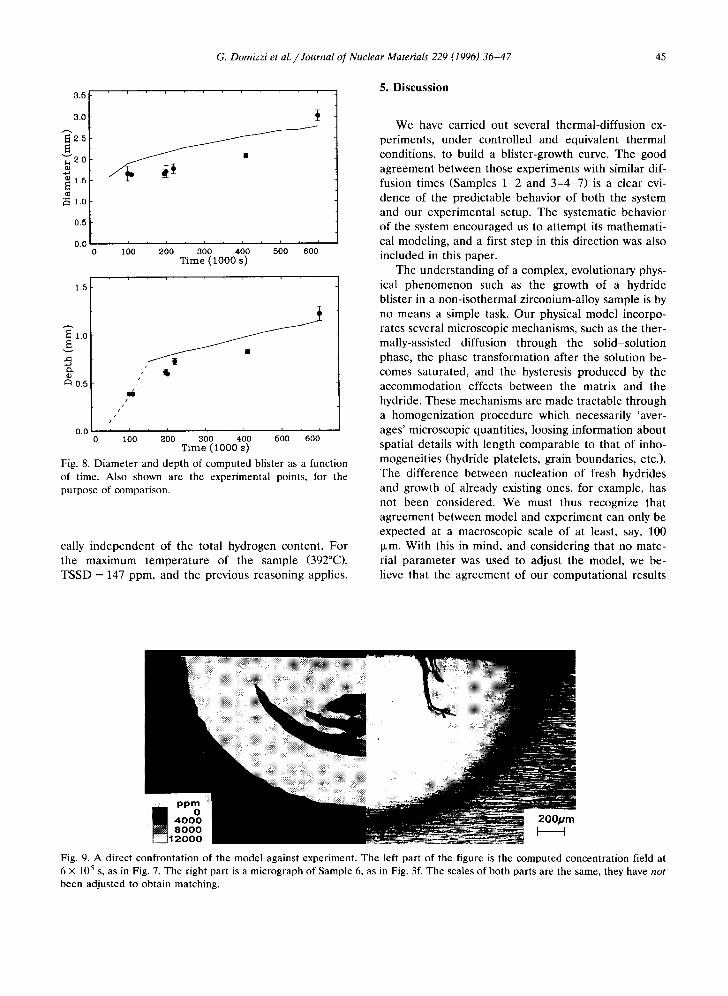
Fig. 8. Diameter and depth of computed blister as a function of time. Also shown are the experimental points, for the purpose of comparison.
cally independent of the total hydrogen content. For the maximum temperature of the sample (392°C), TSSD = 147 ppm, and the previous reasoning applies.
5. Discussion
We have carried out several thermal-diffusion ex- periments, under controlled and equivalent thermal conditions, to build a blister-growth curve. The good agreement between those experiments with similar dif- fusion times (Samples 1-2 and 3-4-7) is a clear evi- dence of the predictable behavior of both the system and our experimental setup. The systematic behavior of the system encouraged us to attempt its mathemati- cal modeling, and a first step in this direction was also included in this paper.
The understanding of a complex, evolutionary phys- ical phenomenon such as the growth of a hydride blister in a non-isothermal zirconium-alloy sample is by no means a simple task. Our physical model incorpo- rates several microscopic mechanisms, such as the ther- mally-assisted diffusion through the solid-solution phase, the phase transformation after the solution be- comes saturated, and the hysteresis produced by the accommodation effects between the matrix and the hydride. These mechanisms are made tractable through a homogenization procedure which necessarily 'aver- ages' microscopic quantities, loosing information about spatial details with length comparable to that of inho- mogeneities (hydride platelets, grain boundaries, etc.). The difference between nucleation of fresh hydrides and growth of already existing ones, for example, has not been considered. We must thus recognize that agreement between model and experiment can only be expected at a macroscopic scale of at least, say, 100 ~zm. With this in mind, and considering that no mate- rial parameter was used to adjust the model, we be- lieve that the agreement of our computational results
Fig. 9. A direct confrontation of the model against experiment. The left part of the figure is the computed concentration field at 6 × 10 5 s, as in Fig. 7. The right part is a micrograph of Sample 6, as in Fig. 3f. The scales of both parts are the same, they have not been adjusted to obtain matching.
46 G. Domizzi et al. /Journal o f Nuclear Materials 229 (1996) 36-47
with experiment for times of 4 x 10⁵ and 6 x 10⁵ s is quite good.
At shorter simulation times, we attribute the differ- ences to an inexact estimation of the heat-transfer efficiency between the cold finger and the sample. As is evident in Fig. 5, the est imated temperature gradient is maximum at r = 0.69 mm, i.e., where the sample is assumed to detach from the cold finger.
We think that bet ter agreement can be obtained adjusting the dependence of hcont with r. However, as the global heat flow is known from the temperature measurements on the cold finger (the heat flow to the surrounding air is in fact quite small), our estimation of the temperature field can only be incorrect locally, near the cold spot. This explains why, once the blister has grown to some extent, experiment and theory agree.
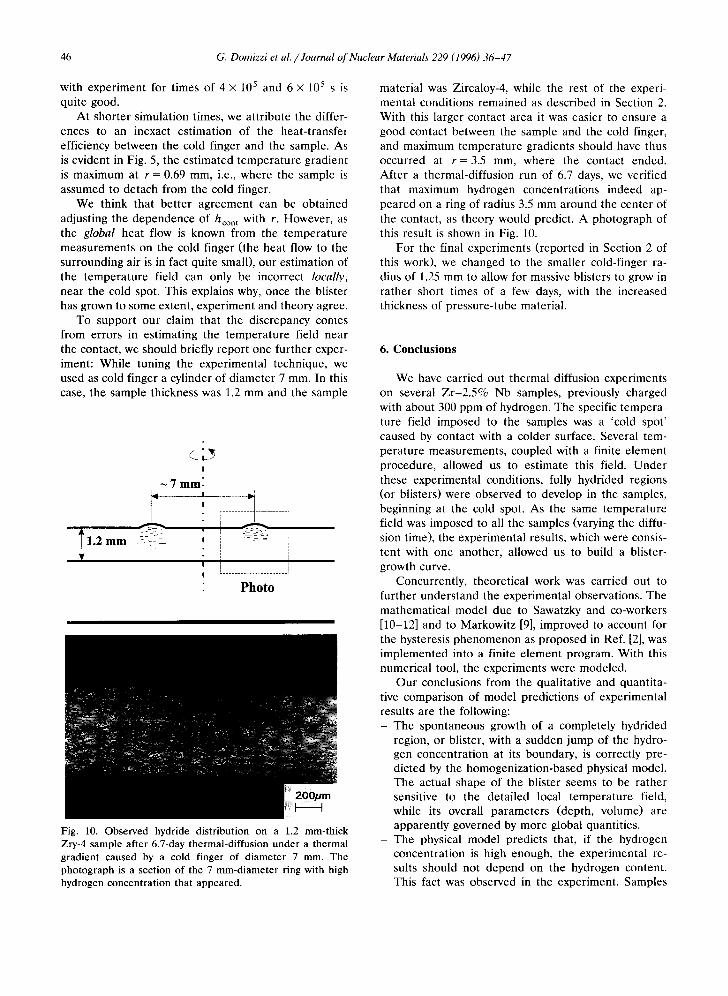
To support our claim that the discrepancy comes from errors in estimating the temperature field near the contact, we should briefly report one further exper- iment: While tuning the experimental technique, we used as cold finger a cylinder of diameter 7 mm. In this case, the sample thickness was 1.2 mm and the sample
<SY I
~ 7 r a m :
. ]
1 . 2 m m - : - = : ~ [ " - : I i i [ L ...................... J
P h o t o
Fig. 10. Observed hydride distribution on a 1.2 mm-thick Zry-4 sample after 6.7-day thermal-diffusion under a thermal gradient caused by a cold finger of diameter 7 mm. The photograph is a section of the 7 mm-diameter ring with high hydrogen concentration that appeared.
material was Zircaloy-4, while the rest of the experi- mental conditions remained as described in Section 2. With this larger contact area it was easier to ensure a good contact between the sample and the cold finger, and maximum temperature gradients should have thus occurred at r = 3.5 mm, where the contact ended. After a thermal-diffusion run of 6.7 days, we verified that maximum hydrogen concentrat ions indeed ap- peared on a ring of radius 3.5 mm around the center of the contact, as theory would predict. A photograph of this result is shown in Fig. 10.
For the final experiments (reported in Section 2 of this work), we changed to the smaller cold-finger ra- dius of 1.25 mm to allow for massive blisters to grow in rather short times of a few days, with the increased thickness of pressure-tube material.
6 . C o n c l u s i o n s
We have carried out thermal diffusion experiments on several Z r - 2 . 5 % Nb samples, previously charged with about 300 ppm of hydrogen. The specific tempera- ture field imposed to the samples was a 'cold spot' caused by contact with a colder surface. Several tem- perature measurements , coupled with a finite e lement procedure, allowed us to est imate this field. Unde r these experimental conditions, fully hydrided regions (or blisters) were observed to develop in the samples, beginning at the cold spot. As the same temperature field was imposed to all the samples (varying the diffu- sion time), the experimental results, which were consis- tent with one another, allowed us to build a blister- growth curve.
Concurrently, theoretical work was carried out to further understand the experimental observations. The mathematical model due to Sawatzky and co-workers [10-12] and to Markowitz [9], improved to account for the hysteresis phenomenon as proposed in Ref. [2], was implemented into a finite e lement program. With this numerical tool, the experiments were modeled.
Our conclusions from the qualitative and quantita- tive comparison of model predictions of experimental results are the following: - The spontaneous growth of a completely hydrided
region, or blister, with a sudden jump of the hydro- gen concentrat ion at its boundary, is correctly pre- dicted by the homogenizat ion-based physical model. The actual shape of the blister seems to be rather sensitive to the detailed local temperature field, while its overall parameters (depth, volume) are apparently governed by more global quantities.
- The physical model predicts that, if the hydrogen concentrat ion is high enough, the experimental re- suits should not depend on the hydrogen content. This fact was observed in the experiment. Samples
G. Domizzi et al. /Journal of Nuclear Materials 229 (1996) 36-47 47
with different hydride densities yielded blister depth values falling on the same growth curve.
- Summing up, the currently available model for hy- drogen migration and hydride precipitat ion in Z r - 2.5% Nb, appears to be suitable for blister assess- ment under complex, three-dimensional conditions, such as those arising in nuclear components. Even though microscopic details are overlooked by the model, macroscopic quantit ies of technological in- terest can be predicted with acceptable accuracy.
Acknowledgements
The authors wish to express their gratitude to E. Savino, J.P. Abriata and A. Fernandez Guil lermet for carefully reading the manuscript and for their useful suggestions, and to J.I. /klvarez Hamel in for extensive help with the thermographical measurements . Thanks are also due to J.C. Almagro and the S U C A N group of CNEA, for sustained encouragement .
References
[1] G.J. Field, J.T. Dunn and B.A. Cheadle, Can. MetaU. Quart. 24 (1985) 181.
[2] P. Byrne and M. Leger, Ontario Hydro Research Divi- sion, Report 85-29-H (1985).
[3] M. Jovanovic, A. Stern, H. Kneis, G.C. Weatherly and M. Leger, Can. Metall. Quart. 27 (1988) 323.
[4] M. Leger and T.P. Byrne, Proc. 12th Conf. on Simulation Symposium on Reactor Dynamics and Plant Control, Hamilton, Canada, April 1986.
[5] A. Sawatzky, Can. Metall. Quart. 24 (1985) 227. [6] A.J. White, A. Sawatzky and C.H. Woo, Atomic Energy
of Canada Limited, Report AECL-8386 (1985). [7] K. Forsberg and A.R. Massih, J. Nucl. Mater. 172 (1990)
130. [8] M. Puls, Acta MetaU. 29 (1981) 1961. [9] J.M. Markowitz, Trans. Metall. Soc. AIME 221 (1961)
819. [10] A. Sawatzky, J. Nucl. Mater. 2 (1960) 321. [11] A. Sawatzky, J. Nucl. Mater. 2 (1960) 62. [12] A. Sawatzky and E. Vogt, Trans. Metall. Soc. AIME 227
(1963) 917. [13] A. Sawatzky and B. Wilkins, J. Nucl. Mater. 22 (1967)
304. [14] W. Erickson and D. Hardie, J. Nucl. Mater. 13 (1964)
254. [15] G.F. Slattery, J. Inst. Met. 95 (1967) 43. [16] M.P. Puls, J. Nucl. Mater. 165 (1989) 128. [17] D.G. Westlake and S.T. Ockers, J. Nucl. Mater. 37 (1970)
236. [18] R. Balasubramaniam, Acta Metall. Mater. 41 (1993) 3341. [19] B. Baranowski, J. Alloy Comp. 200 (1993) 87. [20] M. Puls, Acta Metall. 32 (1984) 1259. [21] R.A. Enrique and G.C. Buscaglia, Proc. Fourth Pan
American Congress of Applied Mechanics, PACAM IV Buenos Aires, January 1995.
[22] O.C. Zienkiewicz and R.L. Taylor, The Finite Element Method, 4th ed. (McGraw-Hill, New York, 1989).
[23] R.A. Enrique, master thesis in physics, Instituto Balseiro (1994).


