Embed Size (px)
Citation preview
TM111 Introduction to computing and information technology 1
Block 3
Connecting people, places and things
This publication forms part of the Open University module TM111 Introduction to computing and information technology 1.Details of this and other Open University modules can be obtained from Student Recruitment, The Open University, POBox 197, Milton Keynes MK7 6BJ, United Kingdom (tel. +44 (0)300 303 5303; email [email protected]).
Alternatively, you may visit the Open University website at www.open.ac.uk where you can learn more about the wide rangeof modules and packs offered at all levels by The Open University.
The Open University, Walton Hall, Milton Keynes MK7 6AA
First published 2017.
Copyright © 2017 The Open University
All rights reserved. No part of this publication may be reproduced, stored in a retrieval system, transmitted or utilised in anyform or by any means, electronic, mechanical, photocopying, recording or otherwise, without written permission from thepublisher or a licence from the Copyright Licensing Agency Ltd. Details of such licences (for reprographic reproduction) maybe obtained from the Copyright Licensing Agency Ltd, Saffron House, 6–10 Kirby Street, London EC1N 8TS (website www.cla.co.uk).
Open University materials may also be made available in electronic formats for use by students of the University. All rights,including copyright and related rights and database rights, in electronic materials and their contents are owned by or licensedto The Open University, or otherwise used by The Open University as permitted by applicable law.
In using electronic materials and their contents you agree that your use will be solely for the purposes of following an OpenUniversity course of study or otherwise as licensed by The Open University or its assigns.
Except as permitted above you undertake not to copy, store in any medium (including electronic storage or use in a website),distribute, transmit or retransmit, broadcast, modify or show in public such electronic materials in whole or in part without theprior written consent of The Open University or in accordance with the Copyright, Designs and Patents Act 1988.
Edited and designed by The Open University.
Typeset by The Open University.
Printed in the United Kingdom by Hobbs the Printers Limited, Brunel Road, Totton, Hampshire SO40 3WX
ISBN 978 1 4730 2104 4
1.1
Contents
Introduction 5
Part 1
Network technologies 7
Part 2
The internet 57
Part 3
Wireless communications 109
Part 4
The Internet of Things 179
Part 5
Online communication 233
Part 6
The networked society 281

Introduction
Welcome to the third block of TM111 Introduction to computing and
information technology 1.
As you study Block 3, Connecting people, places and things, you’ll be
introduced to the key concepts and technologies underpinning networks
including the internet and wireless communication. Other important topics
will be the Internet of Things and the use of online communication tools. You
will continue learning about algorithmic thinking and problem-solving skills.
The block ends with a discussion of the information society and how
computing and IT systems are used in government and large organisations,
such as the National Health Service.
Part 1, Network technologies, begins by introducing some of the fundamental
components upon which communication networks are engineered, including
optical fibre cables and network devices such as routers. This is then
followed by looking at the principles that underpin the technologies,
particularly fibre optics, and the relevant mathematics.
Part 2, The internet, looks at the internet in terms of architecture and
protocols. It introduces the important concepts of routing and switching and
how packets are routed using IP addresses. The role of protocols is looked at
through communication protocols such as TCP and IP, then some service-
enabling protocols such as NAT and DHCP. Network security is also explored
through explanations of firewalls and access control lists.
Part 3, Wireless communications, looks at wireless technologies for voice and
data communication and the technology that has enabled wireless
transmission to overcome some of the challenges of operating in free space.
Part 4, The Internet of Things, looks at some of the technology behind the
term IOT, which is often used to signify a new era of internet communication
in which devices will exchange information with other devices, rather than
people exchanging with people. Such exchanges of information between
things will underpin automated, ‘smart’ processes in manufacturing,
commerce and home life.
Part 5, Online communication, explores how people communicate with each
other using the internet, and particularly the web. We’ll look at some online
communication tools and social networking sites such as Facebook, LinkedIn
and Twitter. We will investigate the benefits of communicating via the web
and look at some of the issues raised by online communication, such as
privacy and safety.
Part 6, The information society, looks at ways in which society has been
changing following the development of information and communication
technologies. The main fields explored are the relationship between the state
and the citizen, and networked health. As well as looking at some specific
technological challenges associated with living in a networked society, such
Introduction
5

as how you prove your identity electronically, this part asks you to think
critically about the relationship between people, technology and society.
Connecting people, places and things
6

Part 1 Network technologiesby Nicky Moss

Contents
Introduction to Part 1 11
1.1 Network of networks 13
1.1.1 Network structure and devices 14
1.1.2 Layers 16
1.1.3 Conclusion 18
1.2 Data transmission 19
1.2.1 Optical fibre 22
1.2.2 Electrical wires 24
1.2.3 Radio waves and microwaves 25
1.2.4 Conclusion 26
1.3 Electromagnetic radiation principles 27
1.3.1 Wavelength 28
1.3.2 Period 28
1.3.3 Frequency 29
1.3.4 The electromagnetic spectrum 31
1.3.5 The communication capacity of the spectrum 33
1.3.6 Conclusion 34
1.4 Fibre, wires or radio? 35
1.4.1 Wireless or wired? 35
1.4.2 Bandwidth 36
1.4.3 How far can you go? 38
1.4.4 Attenuation 39
1.4.5 Conclusion 43
1.5 Engineering mathematics 44
1.5.1 Negative powers of ten 44
1.5.2 Multiplying powers 46
1.5.3 Scientific notation 46
1.5.4 Using numbers 49
1.5.5 Conclusion 49
Summary 50
Answers to self-assessment activities 51
References 54
Acknowledgements 55

Introduction to Part 1
Communication is an essential aspect of what it is to be a human being, and
many of our cognitive processes are tuned to understanding other people (for
example, our ability to recognise faces or identify someone we know from
their voice). While evolution has adequately equipped us for face-to-face
communication, it is our ingenuity that has enabled us to use technology to
communicate over a distance.
Early examples of technology might have included horns for sounding an
alarm, fires for signalling with smoke or signs to show our presence or
indicate a direction. With the widespread use of the written word, letters
became the main way for people to communicate over distance, and letters
were widely used for keeping up to date with family, ordering goods,
agreeing payments and notifying people of important events, such as the birth
of a child. With the invention of electricity, the telegraph became the way to
send important information quickly, and our history still tells us how people
feared receiving a telegram during the First World War. From the 1960s, the
telephone quickly became established as the key communication technology
for both home and business use. The latest development of the telephone, the
mobile phone, plays an essential part in people’s lives, although with most
phones having other capabilities, talking to each other is not always the first
choice for communicating.
A feature of telephones, and this applies to both landlines and mobiles, is that
it is fairly difficult to recognise someone by the sound of their voice over that
medium. This is because the bandwidth required to capture the full nuances
of an individual’s voice is far greater than that available for speaking over a
phone. This limitation does not make the phone any less effective as a
communication tool, as we only need to understand what the person is
saying; after all, we can easily identify the speaker through other means.
Digitisation of the telephone network really started to take hold in the 1980s,
and the internet spread beyond its research routes in the 1990s. The wide use
of mobile phones, and in particular smartphones, has followed through the
early part of this century. I think it is fair to say that today, from the
perspective of a user living in the UK, we have widespread access to digital
communication services at work, at home and on the move. There are
exceptions, of course – as you would know if, like me, you frequently walk
in the Lake District where a mobile phone signal is often absent.
The important point is that we are able to access a wide range of services
from many different locations and using many different devices, and access
to these services is provided by networking technology, often without us
having to give it too much thought. In practice, although it may appear that
we gain our digital communication services from a single network, it is often
many networks joined together – what I will later refer to as a network of
networks. The aim of this part is to give you a better understanding of this
network of networks, before looking specifically at the internet in Block 3
Part 2.
Introduction to Part 1
11
So in this, the first part of Block 3, we take a closer look at communication
networks. In particular, we try to understand how a network is put together
by identifying some of the important physical components, how
communication is carried out across distance and some of the mathematics
that helps us quantify aspects of networks in terms of numbers.
Part 1 Network technologies
12
Network of networks
There seems to be general agreement that we – those of us living in countries
with developed economies – are living in an information age. The
information age is characterised by the dominance of computer-mediated
transactions, as opposed to the more material production of goods which
started with the Industrial Revolution; we have moved from an industrial age
to an information age. This does not mean that industrial goods are not
manufactured anymore, although it is true that much heavy engineering has
moved away from the UK. After all, we still all need the materials that
underpin the development of our cities and provide the transport links we still
use to travel.
However, many of the modern manufacturing and infrastructure projects
involve a very high level of dependence upon computers and information
technology, and there are many other service industries that rely almost
entirely upon computers and the communication architecture that connects
them together. In some ways, it is at the personal level that the information
age has brought the biggest change as it is personal communication,
especially using smartphones and tablets, that has probably had the most
profound changes on individuals.
Here are some statistics about smartphone and internet usage:
. There were 45 million smartphone users in the UK in 2016. (The UK
population is 65 million.)
. Although landline usage has dropped by 2 million since 2007, there are
still 33 million landlines in use in the UK.
. There are 2.5 billion internet users worldwide. (The world population is
7.4 billion.)
Source: Statista (2017)
I am always cautious of reading too much into statistics, especially when
taken from a single source. However, there are some interesting points raised
by these numbers. I was not surprised that there were so many smartphones
in the UK as almost everyone I know has one. However, this does mean there
are more than one per adult living in the UK. Again, this may not be
surprising, as many children will have smartphones, even though the cost of
owning a smartphone is still relatively high. At first I was surprised that
landline usage has not dropped more than it has, but then I remembered that
this is still how most people have broadband delivered to their homes. I
wonder how many homes would still have a landline if they did not need the
telephone line for their broadband. Far fewer, I would expect. All I can say
about the worldwide number of internet users is that it is a huge number, but
I expect it will continue to grow. For those of us studying computing and
information technology, an awareness of the growing number of internet users
is important. First it gives us an idea of how massive the internet has become
and how dependent we are upon it, and second it emphasises the need for the
internet’s reliability.
1.1 Network of networks
13
1.1
In the next section, I will explain how the communication networks
(including the internet) we use for everyday access to the information we
need are put together from many different networks; hence the internet is
sometimes referred to as the network of networks. In the rest of this part, I
will introduce you to some of the underlying principles to provide you with a
deeper understanding of how worldwide communication is possible.
1.1.1 Network structure and devicesThe internet provides the backbone for worldwide communication. We will
look specifically at the internet and the technology that makes it work in
Part 2. The term internet derives from the fact that the internet is itself made
up of many other joined-together networks. But the internet is not the only
player in providing communication. For example, there are the suppliers of
broadband, the internet service providers, mobile phone operators, Wi-Fi
access points and local area networks at work, to name most of the important
ones. It is the joining together of all these different networks belonging to
these service providers that allows us to access our workplace or browse the
web seamlessly – that is, without being aware of the underlying networks that
support the service.
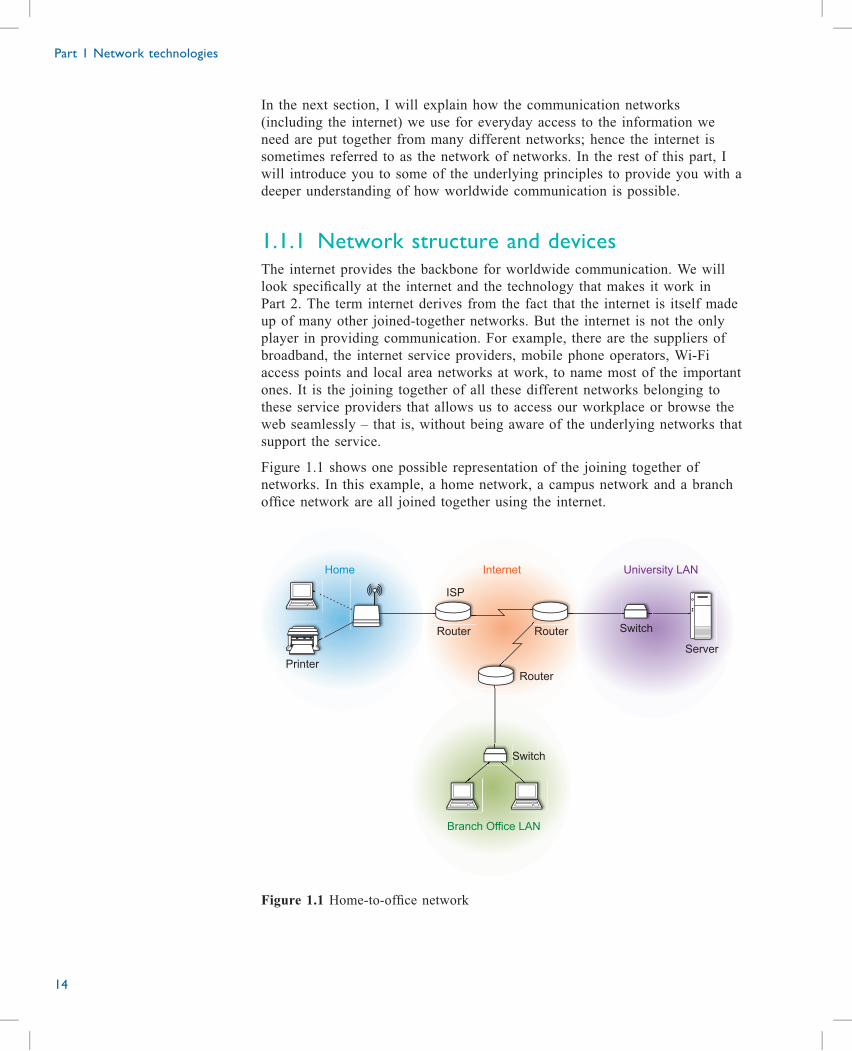
Figure 1.1 shows one possible representation of the joining together of
networks. In this example, a home network, a campus network and a branch
office network are all joined together using the internet.
Home
ISP
Internet University LAN
Switch
Switch
Router Router
Router
Branch Office LAN
Printer
Server
Figure 1.1 Home-to-office network
Part 1 Network technologies
14
This is actually a representation of my own home-to-workplace set-up. At
home, I have a laptop and iPad which both connect to my home hub using
Wi-Fi. My printer is plugged into the hub using an Ethernet port. The hub
was provided to me as part of my contract with my broadband supplier and
connects from my home to fibre-optic broadband. My broadband link will
eventually get me to my internet service provider (ISP), where I will be
connected to the internet through a router, called a gateway router in this
location as it acts a gateway between two networks – in this case, the ISP
and the internet. A connection is established across the internet to get me to
another gateway router at the edge of the Open University network.
In this example, I wish to access a server at my office, which is shown at the
bottom of the diagram. I have to pass through a hierarchy of network devices
(routers and switches) to reach the server as the OU network supports over
3000 staff and many thousands of students. I would follow a similar pathway
if I wanted to exchange emails with a colleague. Connections can be made in
a similar way to a branch office. At both the University and the branch office,
the collection of networking equipment is joined together using a local area
network (LAN). As an alternative to using the internet, the part in the
middle of the diagram, which connects the university to the regional office,
can be provided over privately leased links, when it then is referred to as a
wide area network (WAN). We will look at the differences between WAN,
LAN and the internet later.
In summary, my connection from home to office (university) has been made
possible by joining together my home network, a WAN and a LAN: a
network of networks.
Another important concept to understand is the relationship between my
computer and the various network devices at the university that provide
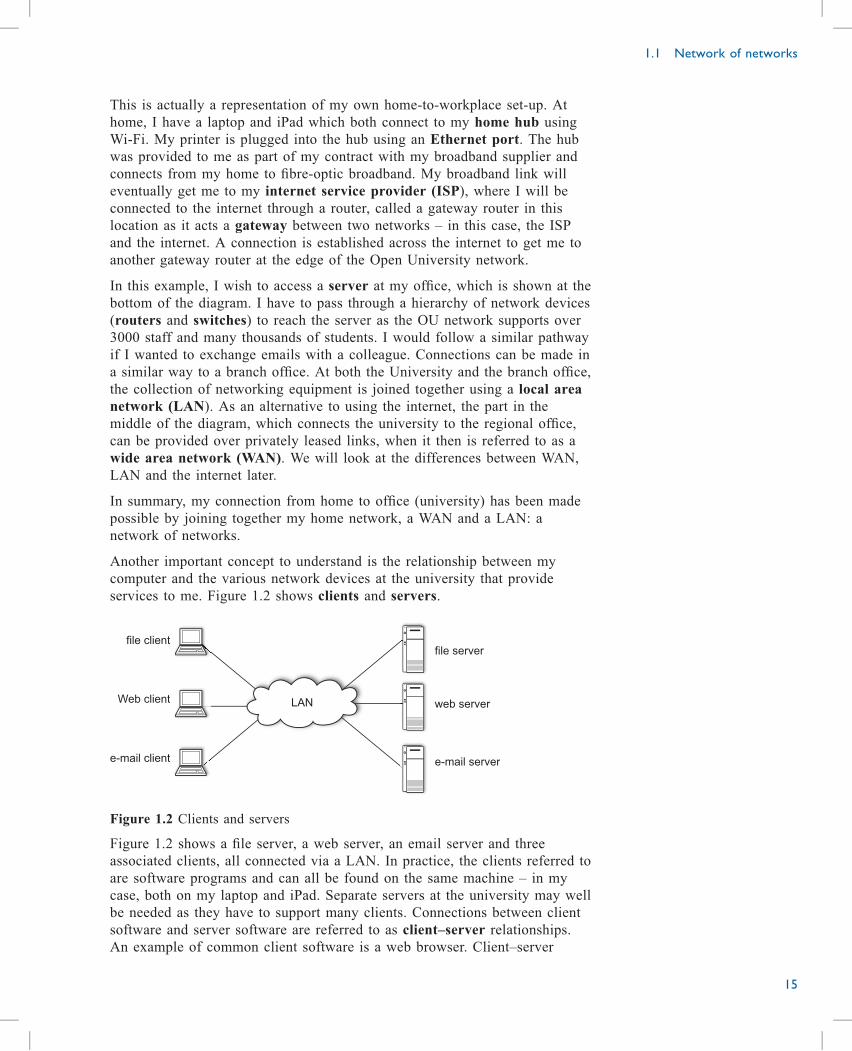
services to me. Figure 1.2 shows clients and servers.
file client
LAN
file server
web server
e-mail servere-mail client
Web client
Figure 1.2 Clients and servers
Figure 1.2 shows a file server, a web server, an email server and three
associated clients, all connected via a LAN. In practice, the clients referred to
are software programs and can all be found on the same machine – in my
case, both on my laptop and iPad. Separate servers at the university may well
be needed as they have to support many clients. Connections between client
software and server software are referred to as client–server relationships.
An example of common client software is a web browser. Client–server
1.1 Network of networks
15
relationships are important in communication networks as they enable us to
define network devices by what they do, rather than by their physical
appearance. For example, it is possible for a computer to be configured as
either a client (a device looking for a service) or a server (providing a
service), and it is possible for a single computer to be a web, email and file
server.
1.1.2 LayersAs we saw when looking at Figure 1.1, my connection from home to the
university crosses more than one network, and each of these networks contain
many devices (network elements). However, my experience of accessing
services at the university does not reflect this complexity. For example, if I
wish to access a web server – as you may also do as a student – then I type
the URL into my web browser and I almost immediately gain access to the
page I requested. As a user, I am not conscious of the detail that is going on
within the various networks; my impression is of a direct connection between
me and the website.
You will often see references to the internet using the metaphor of a cloud,
but an alternative way of talking about it is to say that the messy details
involved in getting the data to you are taking place out of sight, ‘below the
surface’. Although this might be most noticeable with the internet, it is a
general feature of communication systems. When I make a telephone call, I
dial a number and speak to the person at the other end. I don’t know, and
usually don’t care, how the connection is made or what route it takes; nor
might I know or care where the person at the other end is. All I want is to be
able to talk to the right person.
One way of looking at complicated systems, such as the internet, or your
computer itself, is to consider it in terms of layers. For example, you might
think of the computer as a physical hardware layer, the operating system
layer (such as Windows or iOS) and an application layer that contain things
like your web browser or a mobile phone app. The operating system relies on
the hardware and enables applications to be run. You can think of the
hardware as being at the bottom, the operating system ‘on top of’ that and
the applications on top of the operating system. We talk in terms of lower
layers ‘providing a service’ to layers above. When you use an application
such as a word processor, you are not concerned with the operating system or
the hardware of the computer that you are using.
In a similar way, when I use Wikipedia, I don’t need to know how my
computer connects with the Wikipedia server. Furthermore, when I work on
my laptop, sometimes it connects to the internet over a wireless link and
other times I plug it in to the LAN at work. These are physically very
different sorts of networks, but it doesn’t alter the way I use Wikipedia.
When I’m using Wikipedia it is ‘as if’ I have a direct link to the Wikipedia
computer, regardless of what the physical connection is. When I’m talking to
a friend on the telephone, it is ‘as if’ my phone is connected directly to her
phone. These ‘as if’ links are described as virtual channels (Figure 1.3), and
they are said to provide a link between peers.
Part 1 Network technologies
16
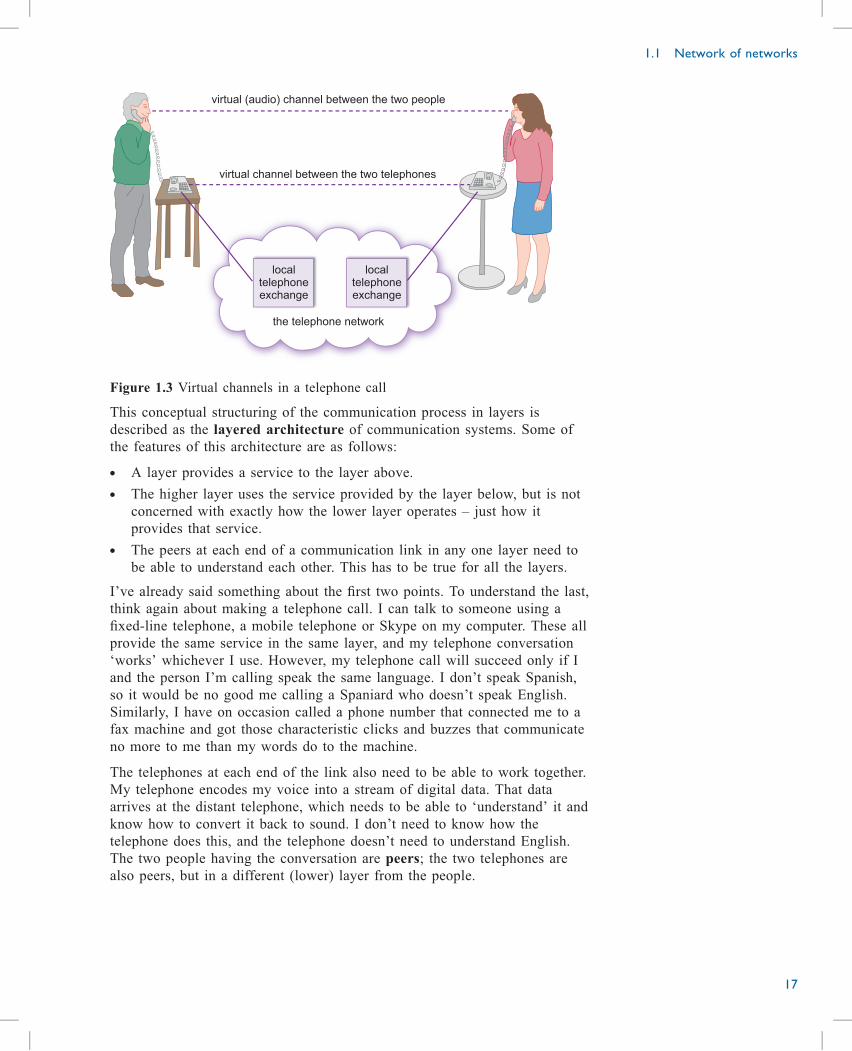
virtual (audio) channel between the two people
virtual channel between the two telephones
localtelephoneexchange
localtelephoneexchange
the telephone network
Figure 1.3 Virtual channels in a telephone call
This conceptual structuring of the communication process in layers is
described as the layered architecture of communication systems. Some of
the features of this architecture are as follows:
. A layer provides a service to the layer above.
. The higher layer uses the service provided by the layer below, but is not
concerned with exactly how the lower layer operates – just how it
provides that service.
. The peers at each end of a communication link in any one layer need to
be able to understand each other. This has to be true for all the layers.
I’ve already said something about the first two points. To understand the last,
think again about making a telephone call. I can talk to someone using a
fixed-line telephone, a mobile telephone or Skype on my computer. These all
provide the same service in the same layer, and my telephone conversation
‘works’ whichever I use. However, my telephone call will succeed only if I
and the person I’m calling speak the same language. I don’t speak Spanish,
so it would be no good me calling a Spaniard who doesn’t speak English.
Similarly, I have on occasion called a phone number that connected me to a
fax machine and got those characteristic clicks and buzzes that communicate
no more to me than my words do to the machine.
The telephones at each end of the link also need to be able to work together.
My telephone encodes my voice into a stream of digital data. That data
arrives at the distant telephone, which needs to be able to ‘understand’ it and
know how to convert it back to sound. I don’t need to know how the
telephone does this, and the telephone doesn’t need to understand English.
The two people having the conversation are peers; the two telephones are
also peers, but in a different (lower) layer from the people.
1.1 Network of networks
17
Notice that I need to know how to use a telephone, but that is not the same
as knowing how the telephone works. In the language of layered
architectures, my use of the telephone is an interface that allows me to
communicate across layers with someone at the far end.
1.1.3 ConclusionAfter studying this section, you should be able to see how a home-to-office
communication channel can be established over the internet, and to
understand the concepts of client–server relationship and layered architecture.
You will also have been introduced to network devices such as routers,
switches and servers. A brief look at some statistical data about the internet
will also have given you some idea of the scale.
Part 1 Network technologies
18
Data transmission
The purpose of a communication network is to provide a pathway to allow
services (such as email) to operate end to end. In networking, as in
computing, the term data is used when we talk about what is transmitted.
When you look inside the cloud or under the surface of communication
networks, sooner or later you come to the basic problem of how to convey
data over a long distance. In the terminology of communications, the process
of getting data from one point to another is referred to as data transmission.
Figure 1.4 takes my home-to-university diagram you met earlier and adds
some detail of the links that could be used to transmit data.
Home
ISP
Router
University
Telco
Cabinet
Home hub
Server
Figure 1.4 Broadband access from home
The connection from my home laptop to a server at the university is
underpinned by different types of medium that connect together key network
devices. We can see this by tracing the connection from my laptop at home to
a mail server at the university. My laptop connects to my home hub (router)
wirelessly using radio waves; the router then connects to equipment housed
in the local cabinet (a roadside box) using a twisted pair cable. Fibre-optic
cable then connects to the local telephone exchange and then on to the ISP.
Many technologies can be used to connect across the internet, but fibre optics
is becoming dominant. The final connection to the server across the LAN at
the university will use a mixture of optical fibre and twisted pair. Figure 1.5
shows a cabinet containing fibre optics technology and a cable distribution
point where cables from many homes may be brought together.
1.2 Data transmission
19
1.2
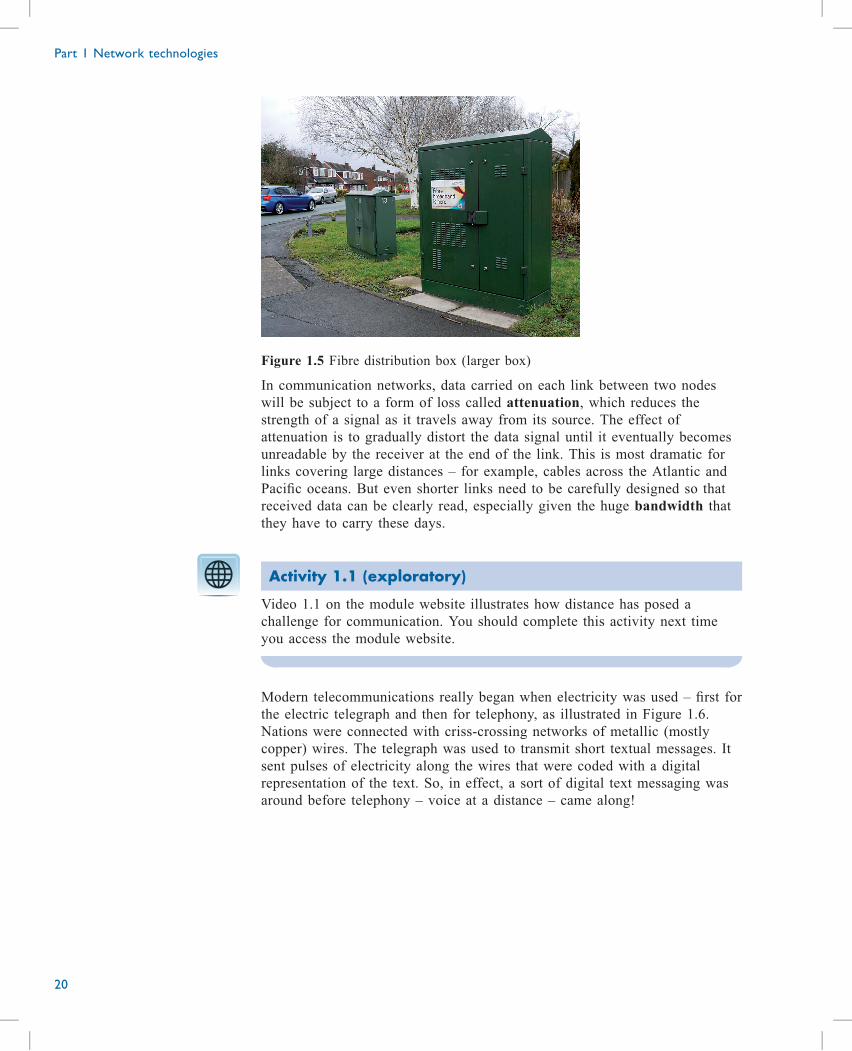
Figure 1.5 Fibre distribution box (larger box)
In communication networks, data carried on each link between two nodes
will be subject to a form of loss called attenuation, which reduces the
strength of a signal as it travels away from its source. The effect of
attenuation is to gradually distort the data signal until it eventually becomes
unreadable by the receiver at the end of the link. This is most dramatic for
links covering large distances – for example, cables across the Atlantic and
Pacific oceans. But even shorter links need to be carefully designed so that
received data can be clearly read, especially given the huge bandwidth that
they have to carry these days.
Activity 1.1 (exploratory)
Video 1.1 on the module website illustrates how distance has posed a
challenge for communication. You should complete this activity next time
you access the module website.
Modern telecommunications really began when electricity was used – first for
the electric telegraph and then for telephony, as illustrated in Figure 1.6.
Nations were connected with criss-crossing networks of metallic (mostly
copper) wires. The telegraph was used to transmit short textual messages. It
sent pulses of electricity along the wires that were coded with a digital
representation of the text. So, in effect, a sort of digital text messaging was
around before telephony – voice at a distance – came along!
Part 1 Network technologies
20
Figure 1.6 Communicating over a distance
Today, metallic wires are still very much in evidence as part of the
communication network (along with satellite, microwave and wireless),
although fibre optics seems to be the technology of choice. Indeed, as I write
this I am looking at the ‘nest’ of wires behind my computer, including one
connecting me to the OU’s local area network. However, in some ways
interest has shifted from metallic wires to optical fibre and wireless
transmission (see the article in Extract 1.1).
Extract 1.1BT to invest £6bn in faster broadband and mobile services
Faster broadband
Under BT’s investment plan, a minimum of 10 million homes and
businesses will receive access to BT’s ultrafast broadband service by
2020, and the company has an “ambition” to reach 12 million.
Most will receive that via BT’s G.fast technology, which is currently
capable of speeds of 300Mbps (megabits-per-second), but will be
capable of speeds of up to 500Mbps, BT says.
On average UK households received speeds of 29Mbps last year,
according to regulator Ofcom.
That would make the new service more than enough for households who
want fast broadband to stream movies and play online games.
“Customers want their broadband to be affordable as well as fast and we
will be able to do that using G.fast,” said BT chief executive Gavin
Patterson.
BT also plans to invest in its mobile phone network EE, so it can offer
fast 4G coverage to 95% of the country by 2020.
‘Limited ambition’
BT’s rivals were not impressed by the investment plan.
Sky complained that the G.fast technology used old copper wires and
said BT should be investing in the faster fibre network.
1.2 Data transmission
21
“Despite BT’s claims, it is clearer than ever that their plans for fibre to
the premise (FTTP) broadband will bypass almost every existing UK
home,” said Andrew Griffith, chief financial officer at Sky.
BBC (2016)
The thrust of the argument in the article is whether a mixture of wire and
fibre will deliver the service that people need, or whether we need fibre to (or
very close to) the home. But it is also about money, as feeding fibre to every
home would cost many billions of pounds, and who is going to pay for it?
Note also that 4G is mentioned, and it will be interesting to see whether
mobile wireless advances such as 4G will make real inroads into the home
broadband market in the future.
Activity 1.2 (exploratory)
Broadband and wireless data technology is developing rapidly and may well
have changed since the article was written. Undertake your own search and
identify which are the latest technologies used in the UK for both broadband
and wireless data.
Since everything is digital in modern communication systems, the basic job
of transmission is simple: to send data as a sequence of 1s and 0s from one
location to another. These 1s and 0s have to be represented by some physical
quantity, and in modern systems three things are used:
. laser light in an optical fibre
. electricity along a pair of wires
. radio waves and microwave radiation through the air (that is, a wireless
signal).
The author of Extract 1.1 presents a rather confusing situation, with little
agreement amongst rival broadband suppliers. However, as a generalisation, it
is broadly true that using optical fibre gives you better (higher-speed)
broadband than using metallic wires. The choice of when to use optical fibre
is not always based upon technology alone – for example, many houses in
the UK still have wires providing the last link for broadband access. The
decision to use wires for this last ‘mile’ is due to the high cost of providing
optical cable to every house, especially with the existence of a legacy wired
network originally provided for telephones.
These are the topics I’ll turn to next, by looking at each of the three modern
transmission methods in turn.
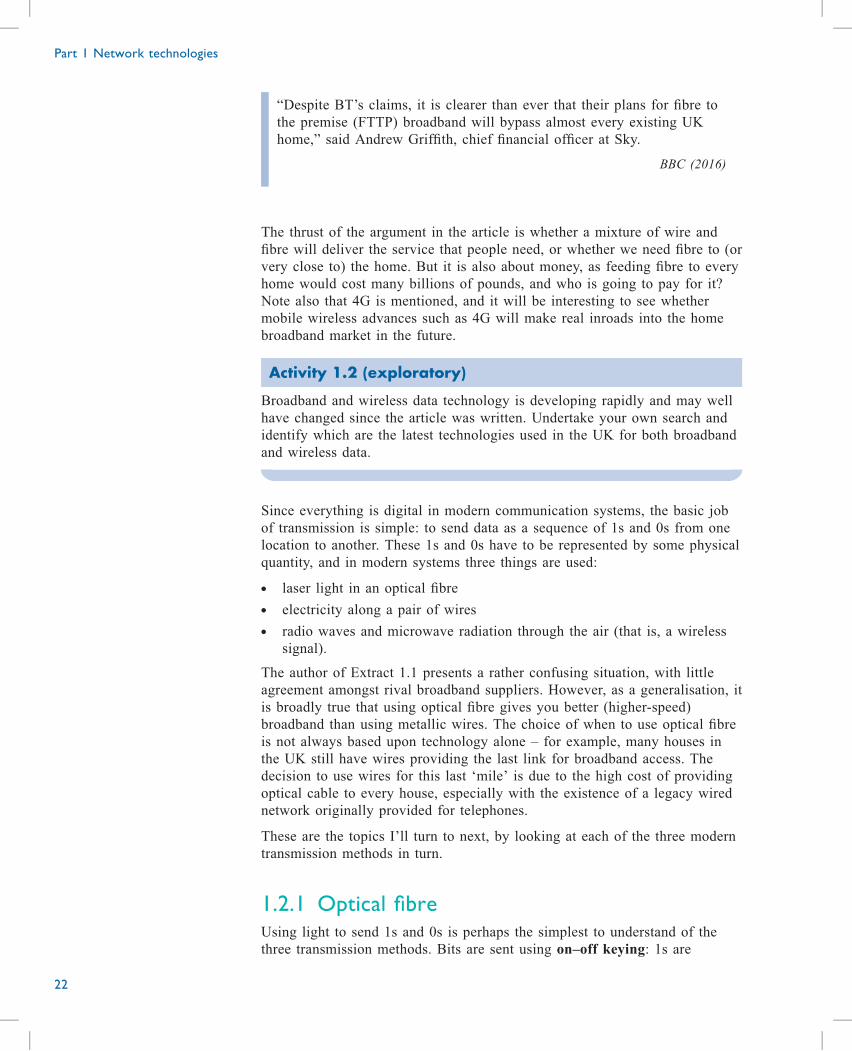
1.2.1 Optical fibreUsing light to send 1s and 0s is perhaps the simplest to understand of the
three transmission methods. Bits are sent using on–off keying: 1s are
Part 1 Network technologies
22
represented by the light being on and 0s by the light being off. For instance,
imagine switching a torch on and off to signal to someone watching from a
distance. This is a step further from that used in 1588 to alert London to the
arrival of the Spanish Armada. When the Armada was seen from the coast, a
beacon fire was lit; when that was seen further along the route to London,
another was lit; and so on, in steps a few miles apart, until one of the
beacons could be seen in London. An on/off signal allows you to send
different information, whereas the lighting of beacons conveys just one piece
of information: the ships have arrived.
Activity 1.3 (exploratory)
Why were there several steps between the coast and London?
CommentIt would not have been possible to see the beacon at the coast from London –
it was too far away. This may seem obvious, but it illustrates attenuation, as
light can only be seen from a finite distance as it is slowly absorbed by the
atmosphere.
The use of several steps to get further than would be possible in just one step
is also a method that is used in modern digital communications. Just as with
beacons, the light in an optical fibre or the electrical signal in a wire gets
weaker as it travels, to the point at which it becomes undetectable. The
process of detecting the incoming signal (seeing the distant beacon lit)
combined with sending out a new signal for the next leg of the journey
(lighting the next beacon) is known as regeneration, because the signal is
generated again: ‘re-generated’.
For beacons to work as a means of communication, there needs to be a line
of sight between each beacon and the person watching it from a distance. If
there was a hill in the way or the curvature of the earth prevented a line of
sight, communication would not be possible. So we say that beacons are an
example of free-space line-of-sight optical communication.
Optical fibres also use light to carry signals, but light travels along inside
them, so a line of sight is not needed – you could bend a fibre around an
obstacle such as a hill! An optical fibre is a strand of glass or plastic (not
much thicker than a human hair; see Figure 1.7) that guides light from one
end of itself to the other. This guidance comes about because of an effect
known as total internal reflection. This means that light shone in at one end
of the fibre doesn’t come out through the sides of the fibre, even if the fibre
is bent around corners. The light just travels inside the fibre until it reaches
the far end. Because the fibre is so thin, it is flexible, and once it is concealed
in protective plastic coverings (at which point it is known as a fibre-optic
cable) it looks and feels much the same as an electrical wire. In Section 1.3 I
will explain how the concept of regeneration relates to optical fibre.
1.2 Data transmission
23
Figure 1.7 Optical fibre of the type used for communications
1.2.2 Electrical wiresUsing pairs of wires to transmit a signal is also conceptually simple. Imagine
operating a switch in one place and observing the effect somewhere else – for
example, closing a switch to turn a light on. This idea is illustrated in
Figure 1.8, which allows you to turn the light on by pressing a button to
close the switch.
press the button tocomplete the circuit
Figure 1.8 Switching a light on at a remote location
Part 1 Network technologies
24
To switch on the light, you close the switch to complete the electrical circuit
from the battery to the light bulb and back again. To switch off the light, you
open the switch to ‘break’ the circuit. Note that a pair of wires is necessary
to form the ‘loop’ of the circuit. When wires are used as a communication
medium, two wires are usually contained within a cable.
When you switch on a light, it appears to come on immediately. There does
not appear to be any delay between the operation of the switch and its effect
(although, depending on the type of bulb, there might be a delay before the
light comes on fully – this is especially noticeable with fluorescent light
tubes). In reality there is a delay – it is just very short indeed. I will talk
about this a little more later.
1.2.3 Radio waves and microwavesRadio waves and microwaves are actually the same phenomenon as light.
They are all electromagnetic waves, although they differ substantially in what
is called the frequency of the wave. The term ‘radio waves’ is sometimes
taken to refer generically to the whole of the radio and microwave bands. I
will explain shortly what these terms mean.
You won’t be surprised to hear that radios receive their signals via radio
waves. However, the term radio wave doesn’t just refer to the signals used by
radios; it is also a generic term for electromagnetic radiation within a
particular range of frequencies. You don’t need to understand what
electromagnetic radiation actually is for the purposes of this module. You
might guess that it is something to do with electricity and magnetism, and
you would be right. It is a combination of an electric field and a magnetic
field, but I am not going to attempt to explain any further. You will need to
study a relevant module in physics if you want to find out more!
Activity 1.4 (exploratory)
Can you think of any ways in which radio waves and light behave similarly,
and any ways in which they behave differently? (Hint: think, for example,
about walls!)
CommentRadio waves and light are similar in that they can both travel through free
space. (When I say ‘free space’ here, I am not distinguishing between the
atmosphere and the vacuum of ‘outer space’. Radio waves and light can
travel through both.)
However, radio waves can also travel through some objects (such as brick
walls) that block light.
1.2 Data transmission
25
1.2.4 ConclusionIn this section, we have looked at some of the network elements that provide
our broadband access at home to an ISP. Cables play a very important part in
providing this connectivity and you should be able to explain why fibre
optics, which offers higher-bandwidth services, is not always used. We finish
with a quick look at radio communication, much more of which you will
cover later in this block.
Part 1 Network technologies
26
Electromagnetic radiation principles
To make any sense of electromagnetic radiation, we require a few more
concepts – in particular, ideas to do with sine waves. So before going any
further, I will spend some time on these ideas.
I want you to visualise a pond into which a stone has been thrown. If the
state of the pond is ‘frozen’ at an instant in time, the height or depth of the
water’s surface at that moment will vary with distance from the source of the
disturbance. If you were to cut a slice through the pond, you would see a
wave shape similar to that in Figure 1.9. The left-hand end is the point where
the stone entered the water and the right-hand end is the point where the
ripples have died away, as viewed in one direction from the centre.
distance fromaverage water level
averagewater level
distancefrom
impact
Figure 1.9 Ripples on a pond
In this example, the magnitude of the peaks and troughs of the wave
decreases as you move away from the disturbance and the energy is
dissipated. We can say that the wave decays. If the energy wasn’t dissipated
and there was no decay, the shape would be as shown in Figure 1.10.
Waveforms with a periodically repeating curve of this general shape are
known as sine waves.
distance fromaverage water level
averagewater level
distancefrom
impact
Figure 1.10 Sine wave
1.3 Electromagnetic radiation principles
27
1.3
1.3.1 WavelengthAn important parameter of a sine wave such as this is the wavelength. If you
look carefully at Figure 1.10 you will see that the basic building-block of the
wave pattern, one cycle of the wave, looks like Figure 1.11. The complete
wave of Figure 1.10 can be made by joining together repeats of the wave
shown in Figure 1.11. The length of this basic unit – that is to say, the length
of one cycle of the wave – is what we mean by the wavelength.
Figure 1.11 One cycle of a sine wave
Electromagnetic waves may also be sinusoidal (that is, having the shape of a
sine wave). If you could freeze a sinusoidal electromagnetic wave at an
instant in time, measure its electric or magnetic field strength at different
points in space and plot these measurements on a graph, the shape of the
graph would be similar to the wave shown in Figure 1.10. However, the
vertical axis would now plot the field strength, as shown in Figure 1.12.
field strength
averagelevel distance
Figure 1.12 Electromagnetic wave at an instant in time
1.3.2 PeriodInstead of measuring the wave’s field strength at different points in space,
you could measure it at different instants in time as it travels through a single
point in space. If you were to do this, measuring the field strength at regular
intervals – say every millisecond (one-thousandth of a second) – and plotting
the results on a graph, it would resemble Figure 1.13. The wave oscillates
regularly and repeatedly with time around its average value. You will notice
that the wave plotted in time looks rather similar to the wave plotted in
space! The difference is that in one graph the horizontal axis has units of
distance, while in the other it has units of time. They both have the same
basic shape – the sine wave – and just as we can identify one cycle of the
wave in space, so too we can identify one cycle in time. The duration of one
cycle is known as the period of the sine wave.
Part 1 Network technologies
28
field strength
averagelevel time
period
Figure 1.13 Electromagnetic wave at a single point in space
1.3.3 FrequencyNow that you’ve met some basic concepts around electromagnetic waves,
let’s return to frequency. The frequency of a wave is the number of cycles it
completes in a single second. The shorter the period, the more cycles
completed in one second, so the higher the frequency.
The unit for measuring frequency is the hertz (Hz). For example, a wave that
completes one cycle every second has a frequency of 1 Hz; a wave that
completes 1000 cycles every second has a frequency of 1000 Hz or 1 kHz
(kilohertz). Higher frequencies can be expressed in terms of MHz (megahertz:
1000 000 cycles per second) or GHz (gigahertz: 1000 000 000 cycles per
second).
The frequency, the period and the wavelength of a sine wave are all related,
and you can use any one of them to describe a particular wave, as illustrated
in Figure 1.14. Higher frequencies correspond to shorter periods. In
particular, electromagnetic waves are described sometimes in terms of their
frequency and sometimes in terms of their wavelength.
field strength
time
period
frequency
wavelength
Figure 1.14 Frequency, period and wavelength are all related
1.3 Electromagnetic radiation principles
29
Activity 1.5 (exploratory)
You will find an interactive version of Figure 1.14 on the module website,
where you can change either the frequency or the wavelength and see the
resultant change in the sine wave. You should complete this activity next
time you access the module website.
Sunlight contains electromagnetic waves with a range of different
frequencies; when light is split up into the colours of the rainbow, the
different colours correspond to different frequencies. (Note that I could
equally well have written that sentence with the word ‘wavelengths’
substituted for the word ‘frequencies’ – but for the moment I will talk only in
terms of frequency.)
The two ends of the rainbow spectrum correspond to the two extremes of
visible radiation, with violet light having a higher frequency than red light.
However, the sun also emits radiation at other frequencies that are not
visible. Radiation with a frequency slightly higher than that of visible violet
light – off the ‘top end’ of the visible light spectrum – is known as
ultraviolet (UV) light. An excess of UV light can damage human skin and
eyes, so sun cream and sunglasses should be designed to block it – you often
see them labelled to that effect. Off the other end of the visible spectrum,
infrared radiation has a frequency slightly lower than that of visible red light.
Infrared radiation warms the skin (as does visible light), but is not harmful to
humans in the way that UV light is (although very powerful infrared
radiation can be harmful, in the same way that very powerful light can). In
fact, the ‘light’ used in optical fibre for communications is infrared.
Moving away from the radiation emitted by the sun, radio waves and
microwaves have frequencies that are lower again than infrared.
Activity 1.6 (self-assessment)
Based on what you have just read, arrange the following in order of
wavelength: from the shortest wavelength (at the top) to the longest
wavelength (at the bottom):
violet, red, ultraviolet, and infrared.
Part 1 Network technologies
30
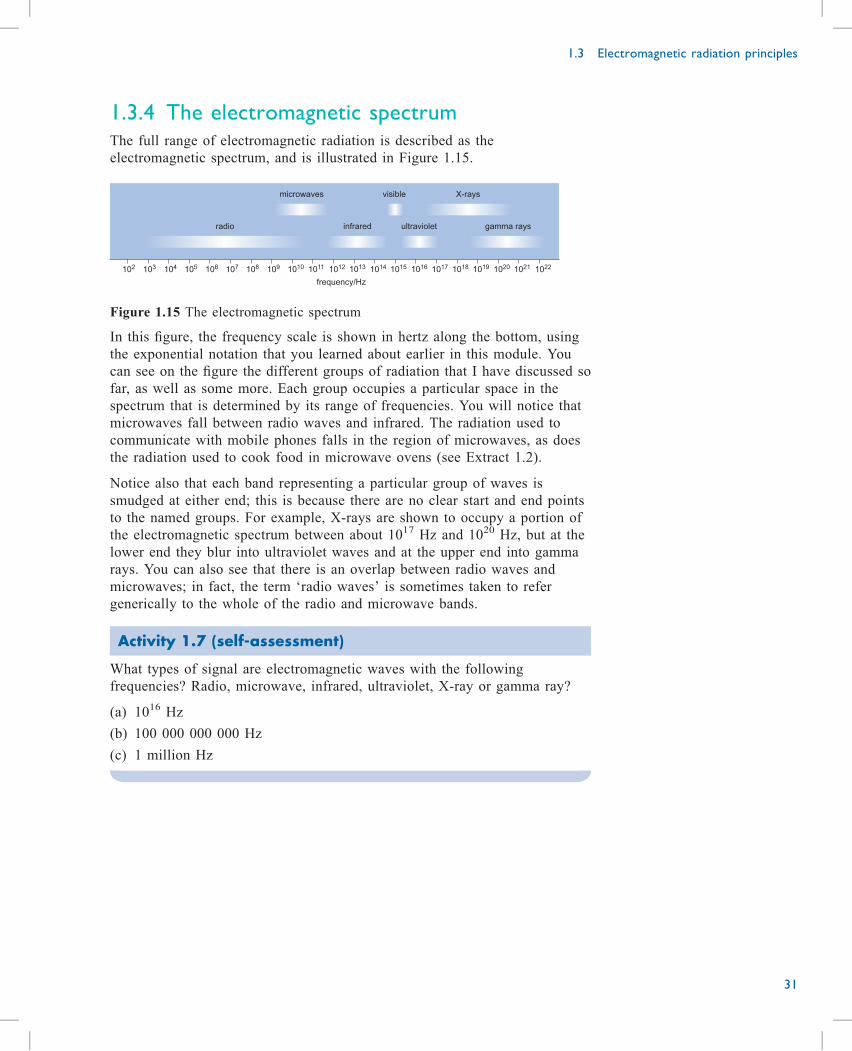
1.3.4 The electromagnetic spectrumThe full range of electromagnetic radiation is described as the
electromagnetic spectrum, and is illustrated in Figure 1.15.
104 105 107 109 1011 1013 1015 1017 1019 10211020
frequency/Hz
103 106 108 1010 1012 1014 1016 1018 1022
microwaves visible X-rays
radio infrared ultraviolet gamma rays
102
Figure 1.15 The electromagnetic spectrum
In this figure, the frequency scale is shown in hertz along the bottom, using
the exponential notation that you learned about earlier in this module. You
can see on the figure the different groups of radiation that I have discussed so
far, as well as some more. Each group occupies a particular space in the
spectrum that is determined by its range of frequencies. You will notice that
microwaves fall between radio waves and infrared. The radiation used to
communicate with mobile phones falls in the region of microwaves, as does
the radiation used to cook food in microwave ovens (see Extract 1.2).
Notice also that each band representing a particular group of waves is
smudged at either end; this is because there are no clear start and end points
to the named groups. For example, X-rays are shown to occupy a portion of
the electromagnetic spectrum between about 1017 Hz and 1020 Hz, but at the
lower end they blur into ultraviolet waves and at the upper end into gamma
rays. You can also see that there is an overlap between radio waves and
microwaves; in fact, the term ‘radio waves’ is sometimes taken to refer
generically to the whole of the radio and microwave bands.
Activity 1.7 (self-assessment)
What types of signal are electromagnetic waves with the following
frequencies? Radio, microwave, infrared, ultraviolet, X-ray or gamma ray?
(a) 1016 Hz
(b) 100 000 000 000 Hz
(c) 1 million Hz
1.3 Electromagnetic radiation principles
31
Activity 1.8 (self-assessment)
The light used in optical fibre for communications purposes is in the infrared
range. Identify, by looking at Figure 1.15, where the frequency range starts
and ends.
Extract 1.2Mobile phone safety
Around 93% of adults in the UK own or use a mobile phone, and
they’re an essential part of many people’s lives. There have been
concerns that the radio waves they produce and receive might be
unsafe.
These radio waves are a type of low-energy, non-ionising
electromagnetic radiation – a class of radiation that also includes visible
light, ultraviolet (UV), and infrared radiation.
Concerns have been expressed that prolonged or frequent exposure to
radio waves might increase a person’s risk of health problems such as
cancer.
However, most current research suggests it’s unlikely that radio waves
from mobile phones or base stations increase the risk of any health
problems.
The researchers acknowledge this evidence is based on use of mobile
phones over the last 20 years, and there’s still some uncertainty about
possible health effects from using a phone for longer than this.
NHS (2016)
Notice that the corresponding reference for Extract 1.2 in the References
section includes the address of the web page where I found the information.
It is important to do this when you use an online resource in your written
work, and to include the date on which you accessed it, because information
on the web can change over time.
Part 1 Network technologies
32
1.3.5 The communication capacity of thespectrumBefore moving on, there’s another feature of Figure 1.15 that you should
think about: the fact that the frequency axis is labelled with a logarithmic
scale. What this means is that each equal-length step along the axis
corresponds to multiplying by the same amount and, as I mentioned
previously, exponential notation is used. Thus the first increment on the axis
is labelled 102 (= 100), the next one is 103 (= 1000), the next 104 (= 10 000)
and so on, each one being ten times the one before it. This differs from
‘ordinary’ linear scales where equal steps correspond to adding equal
amounts.
Notice how the fact that you are looking at a logarithmic scale affects the
‘amount’ of frequency at different ends of the plot. In Activity 1.8, you saw
that the infrared spectrum extends between around 1012 and 1014 Hz. This is
a frequency range of 1014 − 1012. Although it is possible (using exponential
notation) to do this subtraction without writing the numbers out in full, for
the moment I’ll do it the long-winded way: 1014 is 100 000 000 000 000 and
1012 is 1000 000 000 000, so 1014 − 1012 is
100 000 000 000 000 − 1000 000 000 000 = 99 000 000 000 000.
In scientific notation, this would be written as 9.9 × 10¹³.
Yet since these were only approximate numbers to begin with, it is
meaningless to be so precise. The difference between 99 and 100 is not
significant, so we can say that the range is approximately
100 000 000 000 000 = 1014 Hz. You might think it odd that I have shown
that 1014 − 1012 approximately equals 1014, but all it means is that since 1012
is a lot smaller than 1014, subtracting 1012 from 1014 doesn’t make much
difference to 1014.
The technical term for a frequency range such as this is bandwidth – it is the
‘width’ of the frequency band. When considered with this meaning,
bandwidth is measured in hertz (as you’ve seen), so we can say that ‘the
bandwidth of the infrared spectrum is about 1014 Hz’.
The word bandwidth is also used with a different meaning, to refer to data
transmission rates (i.e. communication capacity). In this context, it is
measured in units of bits per second (bps). Indeed, I have already been using
the word bandwidth in this second sense, and you have probably come across
it used in that way before– for example, in references to the bandwidth that
your home broadband can provide.
Although the two meanings of bandwidth discussed above are different, they
are related. Broadly speaking, the greater the frequency range of a
transmission medium, the greater the number of bits per second it can
transmit. In other words, the bigger the bandwidth in hertz available, the
bigger the bandwidth in bits per second that can be transmitted.
1.3 Electromagnetic radiation principles
33
Activity 1.9 (self-assessment)
Taking the range of radio waves as being from about 103 Hz to about
1010 Hz, what is the approximate bandwidth of the radio frequency range?
Looking at Figure 1.15, you might think that the bandwidth of radio is bigger
than the bandwidth of infrared, but what you have just seen is that the
bandwidth of infrared is around 1014 Hz, whereas the bandwidth of radio is
around 1010 Hz. In other words, the bandwidth of infrared is about 10 000
times the bandwidth of radio! When looking at a graph that contains a
logarithmic scale, it’s always important to bear in mind the meaning of the
numbers you are looking at and not to be misled by the visual dimensions.
Activity 1.10 (exploratory)
What does the above paragraph tell you about the communication capacity
(that is, the bandwidth measured in bits per second) of the infrared spectrum
compared to that of the radio spectrum?
CommentI can’t put exact figures on it, but it is clear that there is a lot more capacity
in the infrared spectrum than there is in the radio spectrum.
1.3.6 ConclusionIn this section, we looked at the principles of electromagnetic radiation and
in particular sine waves and the electromagnetic spectrum. After studying this
section, you should be able to describe waves in terms of frequency,
wavelength and period and perform simple bandwidth calculations.
Part 1 Network technologies
34
Fibre, wires or radio?
You have seen that optical fibre, electrical wires, radio waves and
microwaves can all be used for transmission. So why is one used rather than
another in any particular situation? In this section, I’ll compare the different
kinds of transmission media and discuss the kinds of situations for which
each is suited.
In this area of technology, just like many others, very small numbers as well
as very large numbers are involved. For example, a signal might initially
have a strength of 0.0001 watts (this is explained fully later in this section)
and might travel over a total distance of 130 000 000 km. So in this section I
will also show you how the exponential notation that you learned about
earlier in this module can be extended into something called scientific
notation, which allows us to write large and small numbers in a concise and
consistent form.
1.4.1 Wireless or wired?The first, and sometimes obvious, decision to be made is whether to use a
wireless or a wired transmission medium. Electrical wire or optical fibre
wouldn’t be any use for a mobile phone – it wouldn’t be very mobile!
Activity 1.11 (exploratory)
Mobile phones use microwave frequencies. Why do you think they don’t use
infrared radiation? (Remember that infrared radiation behaves very similarly
to visible light.)
CommentThere are several reasons, but the most obvious one is that microwave
radiation can penetrate materials that are opaque to infrared radiation –
materials such as brick and concrete. Microwave ovens have special
screening to contain microwave radiation.
Infrared radiation is used for wireless communication in some applications
where ‘line of sight’ is available. One everyday example is in remote controls
for TVs and other domestic audiovisual equipment. Some of these use radio
signals, but others use infrared.
Sometimes wireless communication is used even where no mobility is
required, because it is generally easier and quicker to install a wireless link
than to install cables, and/or because there are specific obstacles that make it
difficult to install a cable. In cities, for example, fixed microwave links are
sometimes used, because they can be achieved by installing two antennas
pointing at each other instead of having to dig up the streets in order to lay a
1.4 Fibre, wires or radio?
35
1.4
cable. Point-to-point and satellite microwave dishes can also be seen at major
sporting events for relaying TV footage.
1.4.2 BandwidthBroadly speaking, the more bandwidth you can have in a transmission link,
the better, and different transmission media allow different bandwidths.
You read earlier that there is more bandwidth available at higher frequencies.
That is only part of the story, however, because there also needs to be a way
of exploiting the available bandwidth. The challenge is to develop
transmission media, and associated transmission techniques, at the higher
frequencies.
Developments in recent years have enabled a lot of the bandwidth available
in the infrared range to be exploited when using optical fibre; as a result,
optical fibre is now an important transmission medium. It has long been used
in the main transmission links between cities and even across oceans. It is
also increasingly being used within cities to get broadband out to businesses,
it is widely used in local area networks and its use as part of the home
broadband connection is increasing.
I explained earlier that the basic method of communicating digital data over
an optical fibre link is to switch the (infrared) light on and off – on for a 1
and off for a 0. I called this on–off keying, and it is an example of a
modulation technique. In general, modulation is the process of modifying an
electromagnetic wave so that it carries data. On–off keying is the simplest
modulation technique; other techniques include varying the frequency of the
wave (e.g. using a high frequency to represent a 1 and a low frequency to
represent a 0), but I won’t discuss this further. Using on–off keying for high
bandwidth (lots of bits per second) requires turning the light on and off very
fast, and also being able to detect it being turned on and off very fast. The
electronics to do that have been developed to the extent that bit rates of up
to 10 gigabits per second are possible.
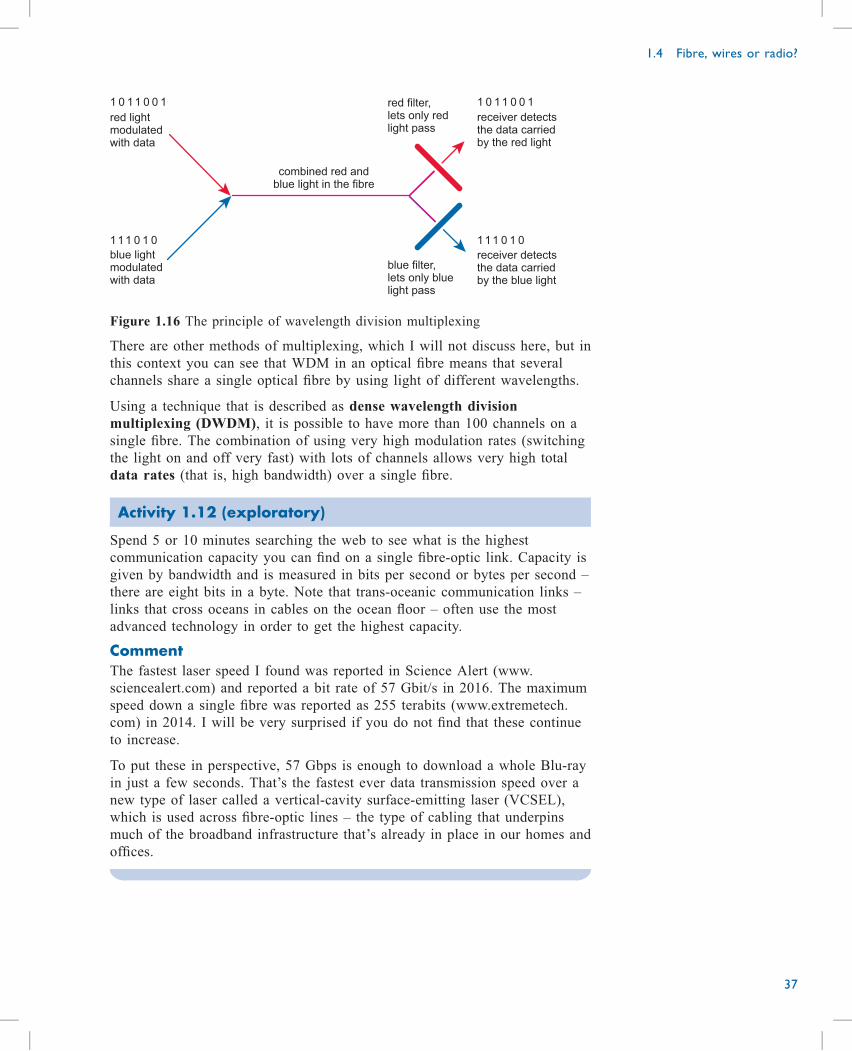
A further refinement is the technique known as wavelength division
multiplexing (WDM). The word multiplexing means sharing a
communication medium between several sources of data. The idea of WDM
is that you send several separate light signals down the same fibre, but each
uses light that has a different wavelength. Each signal can be modulated
separately, so by having two signals (for instance) you can double the
communication capacity of a single fibre. The wavelengths used in practice
are all in the infrared range, but the principle is the same as if light of
different colours were being used. It’s as if there is a blue light that is
modulated (switched on and off) according to one set of data, and a red light
that’s modulated according to another set, as illustrated in Figure 1.16. The
red and blue light is all sent down the same fibre, then at the end there are
two colour filters: one that lets only the blue light through and one that lets
only the red light through.
Part 1 Network technologies
36
1 0 11 0 0 1
red lightmodulatedwith data
blue lightmodulatedwith data
111 0 1 0
1 0 11 0 0 1
111 0 1 0
combined red andblue light in the fibre
red filter,lets only redlight pass
blue filter,lets only bluelight pass
receiver detectsthe data carriedby the red light
receiver detectsthe data carriedby the blue light
Figure 1.16 The principle of wavelength division multiplexing
There are other methods of multiplexing, which I will not discuss here, but in
this context you can see that WDM in an optical fibre means that several
channels share a single optical fibre by using light of different wavelengths.
Using a technique that is described as dense wavelength division
multiplexing (DWDM), it is possible to have more than 100 channels on a
single fibre. The combination of using very high modulation rates (switching
the light on and off very fast) with lots of channels allows very high total
data rates (that is, high bandwidth) over a single fibre.
Activity 1.12 (exploratory)
Spend 5 or 10 minutes searching the web to see what is the highest
communication capacity you can find on a single fibre-optic link. Capacity is
given by bandwidth and is measured in bits per second or bytes per second –
there are eight bits in a byte. Note that trans-oceanic communication links –
links that cross oceans in cables on the ocean floor – often use the most
advanced technology in order to get the highest capacity.
CommentThe fastest laser speed I found was reported in Science Alert (www.
sciencealert.com) and reported a bit rate of 57 Gbit/s in 2016. The maximum
speed down a single fibre was reported as 255 terabits (www.extremetech.
com) in 2014. I will be very surprised if you do not find that these continue
to increase.
To put these in perspective, 57 Gbps is enough to download a whole Blu-ray
in just a few seconds. That’s the fastest ever data transmission speed over a
new type of laser called a vertical-cavity surface-emitting laser (VCSEL),
which is used across fibre-optic lines – the type of cabling that underpins
much of the broadband infrastructure that’s already in place in our homes and
offices.
1.4 Fibre, wires or radio?
37
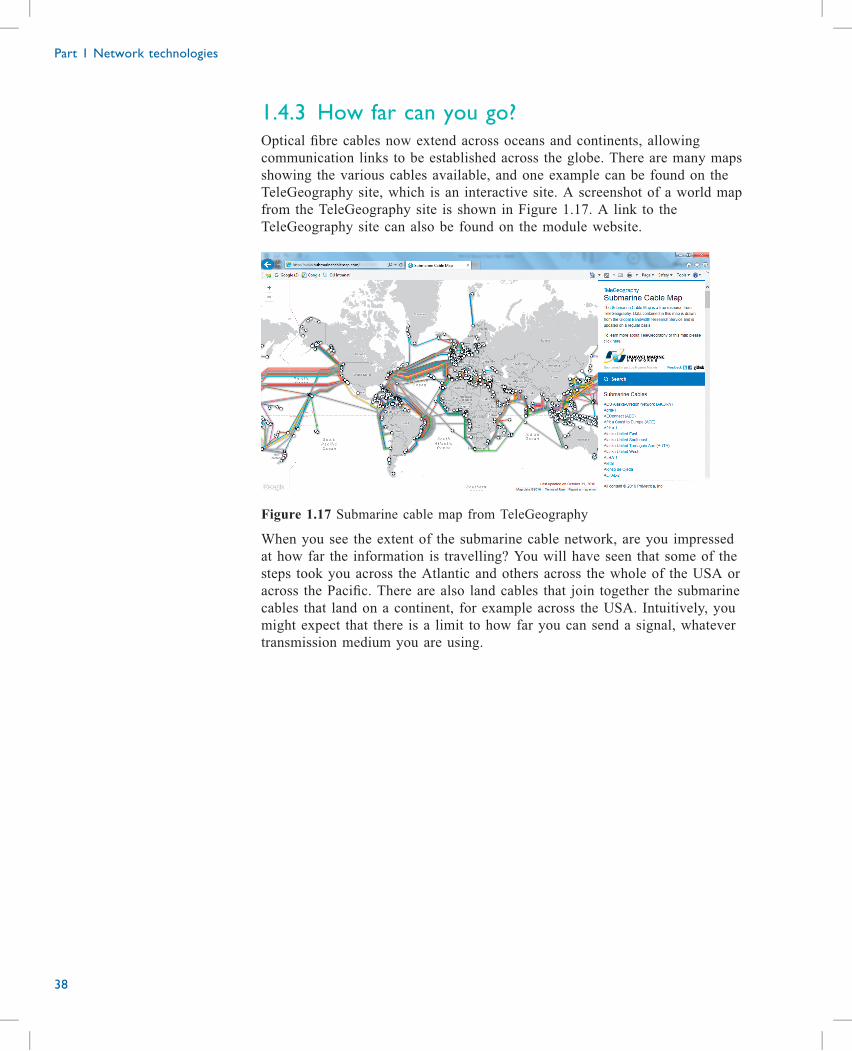
1.4.3 How far can you go?Optical fibre cables now extend across oceans and continents, allowing
communication links to be established across the globe. There are many maps
showing the various cables available, and one example can be found on the
TeleGeography site, which is an interactive site. A screenshot of a world map
from the TeleGeography site is shown in Figure 1.17. A link to the
TeleGeography site can also be found on the module website.
Figure 1.17 Submarine cable map from TeleGeography
When you see the extent of the submarine cable network, are you impressed
at how far the information is travelling? You will have seen that some of the
steps took you across the Atlantic and others across the whole of the USA or
across the Pacific. There are also land cables that join together the submarine
cables that land on a continent, for example across the USA. Intuitively, you
might expect that there is a limit to how far you can send a signal, whatever
transmission medium you are using.
Part 1 Network technologies
38
Activity 1.13 (exploratory)
What do you think determines the limit to how far you can send a signal?
CommentThe signal gets weaker the further it goes, and eventually it is too small to
detect. I mentioned earlier that, when using beacons, if you were too far
away from a beacon then you wouldn’t be able to see it, because the amount
of light reaching you becomes less the further away you are. Something
similar happens with signals in transmission media – the signal strength
reduces with increasing distance.
A signal’s ‘strength’ is defined by its power, which is measured in watts (W).
A signal will be transmitted with some value of power – say, 0.001 W – and
this power will reduce the further the signal goes. There will be some power
level below which the signal is too small to be detected – say, 0.000 0001 W.
However, before I look at this topic in any more detail, let’s consider the
kinds of numbers that I’m using here.
1.4.4 AttenuationThe decrease in power of a signal as it travels away from its source is known
as attenuation. Earlier you learned about exponential growth; attenuation in
both metallic wire and optical fibre takes the form of exponential decay, or a
‘negative exponential’. Whereas with exponential growth the size of
something keeps increasing by the same factor, with exponential decay the
size keeps decreasing by the same factor. This is best illustrated by an
example.
For a given wire being used for transmission, the attenuation might be such
that the power drops by a factor of 10 every 500 metres (m). So, if the power
starts off as 0.2 W, after 500 m it will be 0.2/10 = 0.02 W; after another
500 m (a total of 1000 m) it will be 0.02/10 = 0.002 W; after another 500 m
(a total of 1500 m) it will be 0.0002 W; and so on. Using scientific notation,
I get the results shown in Table 1.1. Negative powers, for example 10−1, are
explained in the booklet Using numbers (maths).
Table 1.1 Example attenuation in a wire
Distance/metres Signal power/W
0 2 × 10⁻¹
500 2 × 10⁻²
1000 2 × 10⁻³
1500 2 × 10⁻⁴
2000 2 × 10⁻⁵
2500 2 × 10⁻⁶
3000 2 × 10⁻⁷
1.4 Fibre, wires or radio?
39
So another way to compare different transmission media is to compare the
distance over which a signal will be attenuated by some fixed factor, such as
10 – in other words, to compare the distance over which the power of a
signal sent via the different media decreases by a factor of 10.
Activity 1.14 (self-assessment)
Suppose a metallic cable attenuates by a factor of 10 over a distance of 1 km.
A second metallic cable attenuates by a factor of 10 over a distance of 2 km.
In all other respects the cables are identical. Which would be the better
transmission medium?
Optical fibre cable is seen as a good choice over wire, primarily because the
distance over which optical fibre can be used is very great due to lower
attenuation. Key to the advantage of fibre-optic cables over metallic cables,
however, is the fact that the attenuation of metallic cables increases with
increasing frequency: as the frequency of the signal increases, the travelling
signal loses power more quickly. This means that, in general, metallic cables
have a higher attenuation when they are being used to carry a higher data
rate. This doesn’t happen in the same way for optical fibre. Attenuation
figures for metallic cables therefore have to state the bandwidth that the
cables are being used for, whereas figures for optical fibre do not.
A type of metallic cable designed to transmit high-frequency signals is called
a coaxial cable. The construction of this type of cable is very different from
a twisted pair as it has a solid centre surrounded by a braided outer. Coaxial
cable is normally used to connect to a domestic TV aerial or to a Sky satellite
dish.
Typical figures are as follows.
. High-quality coaxial cable (LDF5-50A) at 2 Mbps: power drops by a
factor of 10 approximately every 10 km.
. The same coaxial cable (LDF5-50A) at 200 Mbps: power drops by a
factor of 10 approximately every 1 km.
. Optical fibre: power drops by a factor of 10 approximately every 30 km.
You can use these values to get some very approximate ideas as to what
might be possible with different transmission media.
The power that can be sent from a transmitter can generally be no more than
1 W, and is often much less. The lowest acceptable power at the receiver
depends on many factors, including the data rate. (You need a higher power
at the receiver when the data rate is higher – this is true for optical fibre as
well as coaxial cable.) In order to make some comparisons, however, I’ll
suppose that the power at the receiver has to be at least 100 microwatts.
Then, for the case in which the transmitter output power is 1 W, I’ll calculate
the approximate distance that a signal can be transmitted.
Consider first the coaxial cable described above, used at 2 Mbps. In this
cable, the power drops by a factor of 10 approximately every 10 km. So I
Part 1 Network technologies
40
can draw up a table (Table 1.2) to see how far the signal can get before the
power drops to 100 μW (= 10−4 W).
Table 1.2 Attenuation in coaxial cable used at 2 Mbps
Distance/km Signal power/W
0 1
10 10−1
20 10−2
30 10−3
40 10−4
This shows that I can use the cable at this data rate over a distance of up to
40 km.
Activity 1.15 (self-assessment)
Draw up tables to find out how far a signal could be transmitted along:
(a) the coaxial cable with a data rate of 200 Mbps
(b) the optical fibre described above.
Even with the optical fibre you looked at in the last activity, the furthest you
could transmit a signal was 120 km. With different optical fibre, and with
designs that make it possible for the received power to be quite a lot less, it
is possible to achieve greater distances – but not the thousands of kilometres
required to cross the Atlantic, for example.
Activity 1.16 (self-assessment)
Can you recall how the beacons that carried the news of the arrival of the
Spanish Armada to London solved the problem of transmitting over longer
distances?
The main principle of regeneration is used in digital communications to
allow digital signals to be transmitted over greater distances. Electronic
circuits (called regenerators) detect the attenuated incoming signal and
generate a fresh, full-power signal to transmit along the next leg of the
journey. In ideal conditions, this process can be repeated indefinitely,
allowing transmission over unlimited distances. Figure 1.18 gives a graphical
representation of successive regeneration for long-distance transmission.
1.4 Fibre, wires or radio?
41
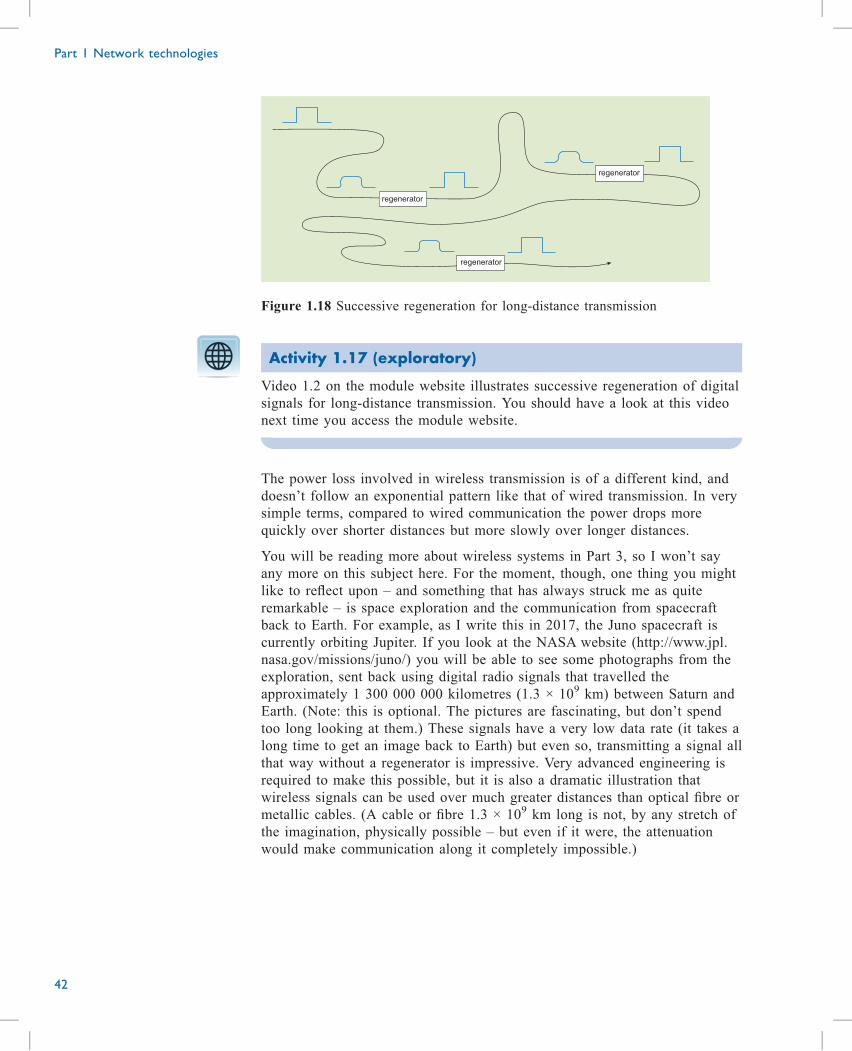
regenerator
regenerator
regenerator
Figure 1.18 Successive regeneration for long-distance transmission
Activity 1.17 (exploratory)
Video 1.2 on the module website illustrates successive regeneration of digital
signals for long-distance transmission. You should have a look at this video
next time you access the module website.
The power loss involved in wireless transmission is of a different kind, and
doesn’t follow an exponential pattern like that of wired transmission. In very
simple terms, compared to wired communication the power drops more
quickly over shorter distances but more slowly over longer distances.
You will be reading more about wireless systems in Part 3, so I won’t say
any more on this subject here. For the moment, though, one thing you might
like to reflect upon – and something that has always struck me as quite
remarkable – is space exploration and the communication from spacecraft
back to Earth. For example, as I write this in 2017, the Juno spacecraft is
currently orbiting Jupiter. If you look at the NASA website (http://www.jpl.
nasa.gov/missions/juno/) you will be able to see some photographs from the
exploration, sent back using digital radio signals that travelled the
approximately 1 300 000 000 kilometres (1.3 × 10⁹ km) between Saturn and
Earth. (Note: this is optional. The pictures are fascinating, but don’t spend
too long looking at them.) These signals have a very low data rate (it takes a
long time to get an image back to Earth) but even so, transmitting a signal all
that way without a regenerator is impressive. Very advanced engineering is
required to make this possible, but it is also a dramatic illustration that
wireless signals can be used over much greater distances than optical fibre or
metallic cables. (A cable or fibre 1.3 × 10⁹ km long is not, by any stretch of
the imagination, physically possible – but even if it were, the attenuation
would make communication along it completely impossible.)
Part 1 Network technologies
42
1.4.5 ConclusionIn this section, we have again looked at optical fibre, wires and radio, but this
time with an emphasis upon their data-carrying capacity or bandwidth. To
make our comparisons more objective, we have started to use more maths.
After studying this section, you should be able to express very large and very
small numbers using exponential notation (often called powers) and perform
calculations using these numbers.
1.4 Fibre, wires or radio?
43
Engineering mathematics
We finish our study of this part by working through some of the uses of
numbers that are essential to the toolkit of knowledge used by engineers and
other professionals working in networking and computing. You have already
met some of the ideas covered in this section, and this is an opportunity to
focus on handling the numbers by carrying out some activities. In this way,
you can check your understanding. Also, by bringing the maths together, it
may be useful for you to be able to refer back to this when necessary.
1.5.1 Negative powers of tenVery small numbers, such as the low signal power mentioned earlier, are
inconvenient to write out in full. For example, if I copy 0.0000034, it is easy
to make a mistake by missing off a 0. You should recall that for very large
numbers we use exponential notation, whereby 106 = 1 000 000, for example.
The first figure (10 in this case) is known as the base, while the second figure
(6 in this case) is known as the power or exponent (or sometimes the
superscript or index). This example would be read as ‘ten to the power of
six’.
Exponential notation can also be used for very small numbers. Though it
might seem rather strange if you haven’t met it before, we use negative
powers for numbers less than 1.
With positive powers of ten, the power gives the number of zeros after the 1.
For example, with 106 the power is 6, and in the number 1000 000 there are
6 zeros after the 1. In the case of negative powers, the power gives the
number of zeros before the 1, including the one zero before the decimal
point. So:
. 0.1 is 10−1
. 0.01 is 10−2
and so on. Another way of thinking about this is that the minus sign means
‘1 divided by’ the number with the equivalent positive power, so that, for
example:
. since 102 = 100, 10−2 = 1/100 = 0.01
. since 106 = 1000 000, 10−6 = 1/1000 000 = 0.000 001.
Part 1 Network technologies
44
1.5
Activity 1.18 (self-assessment)
Express the following in exponential notation.
(a) 0.001
(b) 0.000 0001
(c) 0.000 01
You have already learned of some common prefixes for large numbers: kilo
(normally meaning to multiply by 103), mega (106), giga (109), etc. In
addition to these prefixes that cover the large scales, there are also prefixes to
cover very small scales, as shown in Table 1.3. Here, the abbreviation for
each prefix is always a lower-case letter.
Table 1.3 Prefixes for small numbers and their abbreviations
Prefix Abbreviation Divide by … Power of 10
milli m 1000 10−3
micro μ* 1000 000 10−6
nano n 1000 000 000 10−9
pico p 1000 000 000 000 10−12
femto f 1000 000 000 000 000 10−15
*μ is the Greek letter mu (pronounced as ‘you’ with an ‘m’ on the front).
Prefixes and exponential notation provide alternative ways of expressing
small quantities concisely. For example, the prefix ‘milli’ means ‘divide by
1000’. So 1 mW is 1/1000 watts, which can be written as 10−3 W. Similarly,
10 mW is 10/1000 watts or 1/100 watts, which can be written as 10−2 W.
Activity 1.19 (exploratory)
Many of these ideas also make sense for powers of other numbers. You might
try to work out what 2−2 means, for example. (Try it on your calculator.)
However, I am only interested in powers of ten here.
CommentYou can do this calculation on a scientific calculator by entering 2, xy, –2,
then =. The answer is 0.25. The other way to read this is 1 over 2 squared.
1.5 Engineering mathematics
45
1.5.2 Multiplying powersIf you multiply two numbers in exponential notation together, you add the
powers. Thus, for example:
102 × 103 = 10(2 + 3) = 105 = 100 000.
(You can confirm that this is correct by noting that 102 × 103 = 100× 1000
= 100 000.)
This works when the powers are negative, too. So:
10−2 × 10−3 = 10(−2 − 3) = 10−5 = 0.000 01 (= 1/100 000).
It also works with mixed positive and negative powers:
102 × 10−3 = 10(2 − 3) = 10−1 = 0.1 (= 1/10)
10−2 × 103 = 10(−2 + 3) = 101 = 10.
Notice how this works when the positive and negative powers are the same
number:
102 × 10−2 = 10(2 − 2) = 100 = 1
10−3 × 103 = 10(−3 + 3) = 100 = 1.
This makes sense because, for example, 102 = 100 and 10−2 = 1/100, so
102 × 10−2 = 100 × 1/100 = 1. If you were puzzled by the idea that a number
raised to the power 0 is equal to 1, then maybe this makes it at least
reasonable!
Activity 1.20 (self-assessment)
(a) Write down the answers to the following.
(i) 103 × 107
(ii) 104 × 10−6
(b) Express the following in watts, using exponential notation.
(i) 100 μW
(ii) 10 nW
1.5.3 Scientific notationThe kind of exponential notation you’ve been working with up to now –
writing numbers as powers of ten – is in fact part of a larger system known
as scientific notation. This in turn is very much a part of the language of
technology (and science, of course). I will now explain some of the basic
ideas.
Up to now, I have looked at how to represent large and small numbers using
exponential notation only when they are whole powers of 10. For example,
Part 1 Network technologies
46
you now know that 1000 is represented as 103 and 0.001 is represented as
10−3. However, 99 000 000 000 000 can be written as 9.9 × 10¹³. This
expression, 9.9 × 10¹³, is an example of scientific notation.
In general, writing a number in scientific notation involves writing it in the
form of a number between 1 and 10 multiplied by a power of ten. This
‘number between 1 and 10’ excludes 10 but includes 1. So, in fact, each of
the powers of 10 that you’ve been working with can immediately be
expressed in scientific notation, with the number in question being 1. For
example, 100 = 102 = 1 × 10².
You can see from this that expressing powers of 10 in scientific notation is
not hard, but how do you go about expressing other numbers?
To express a number greater than 10 in scientific notation, the first stage is to
divide it repeatedly by 10 until it is reduced to a number that is less than 10.
For example, to express the number 4865 in scientific notation I would divide
it repeatedly by 10 until I arrived at 4.865. Usually this will result in a
number that includes a decimal fraction (the part that follows the decimal
point) as well as a whole number part. In my example, 4 is the whole number
part and .865 the decimal fraction.
The next stage is to work out how many times the resulting number (4.865
here) would have to be multiplied by 10 in order to return it to its original
value. In my example, I made three successive divisions by 10, so I would
have to multiply by 10 three times – that is, 10 × 10 × 10 – to return to the
original value. My original number, 4865, could therefore be expressed as
4.865 × 10 × 10 × 10, but this is hardly a shorthand alternative. Thus instead
of writing 10 × 10 × 10, I express it as 103.
The final stage is to join together the results from the two earlier stages,
using a multiplication sign. In my example, this gives the scientific notation
for 4865 as 4.865 × 10³.
Any number can be expressed in scientific notation. For example:
5000 = 5 × 10 × 10 × 10 = 5 × 10³
72 000 = 7.2 × 10 × 10 × 10 × 10 = 7.2 × 10⁴
82 600 = 8.26 × 10 × 10 × 10 × 10 = 8.26 × 10⁴
Fortunately, there is a quicker way of doing the conversion than by writing
out all the multiplication stages. I will demonstrate this using the number
7390 000. Start by imagining there is a decimal point at the right-hand end of
the number. (I’ll add a final 0 so that the decimal point can be seen clearly –
this doesn’t alter the original value at all.)
7390 000.0
Now move the decimal point one place at a time through the number until it
sits after the leftmost digit, and count the number of places it has been
moved:
7.390 0000 (decimal point moved 6 places to the left)
1.5 Engineering mathematics
47
Now remove all the consecutive 0s from the right-hand end (doing this does
not alter the value) and multiply what is left by 10 raised to the power of the
number of places the decimal point has been moved.
7.39 × 10⁶
In other words, I’ve shown that 7390 000 expressed in scientific notation is
7.39 × 10⁶.
Activity 1.21 (self-assessment)
Write the following numbers in scientific notation.
(a) 23 000
(b) 478
Expressing a small number – between 0 and 1 – in scientific notation
involves a process very similar to that for large numbers.
I’ll use 0.001 75 as an example. First you move the decimal point to the right
until it sits after the first non-zero digit:
0001.75 (decimal point moved 3 places to the right)
Now remove all the consecutive 0s at the left-hand end (doing this does not
alter the value). This gives:
1.75
(In general, this will give a number between 1 and 10.)
Then multiply this number by 10 raised to the power of minus the number of
places the decimal point has been moved:
1.75 × 10⁻³
In other words, I’ve shown that 0.001 75 expressed in scientific notation is
1.75 × 10⁻³.
Activity 1.22 (self-assessment)
(a) Write the following in scientific notation.
(i) 0.331 25
(ii) 0.4
(iii) 0.000 009 99
(b) Write the following in watts, using scientific notation.
(i) 0.2 mW
(ii) 500 nW
Part 1 Network technologies
48
1.5.4 Using numbersThis is a good time to take a look at the booklet Using numbers (maths). We
have allowed 2 hours for you to work through the booklet. You should feel
free to work through all of the sections where you think you might
experience difficulty. Each section in the booklet contains both explanation
and examples, so you should be able to work through it at your own pace.
You are also free to return to the booklet later, but I would recommend
studying the following sections now:
. using exponent notation
. multiplication and division using exponent notation
. scientific notation.
Study note 1.1
You will learn very little by reading through maths questions. You mustattempt the activities yourself to develop an understanding and your ownmethod for tackling questions of any particular type.
1.5.5 ConclusionThis last section of the block has focused on helping you understand some of
the mathematic principles that are needed to understand some of the
important concepts used in network design and operation. It is for this reason
we have called it engineering maths, as it is the sort of maths used by
network engineers. After studying this section you should be able to carry out
calculations using both positive and negative powers of 10 and use scientific
notation to express and manipulate large and small numbers.
. Analyse and compare different transmission media in terms of bandwidth
and attenuation.
. Work with scientific notation in simple contexts, and with prefixes for
small numbers such as milli and micro.
1.5 Engineering mathematics
49
Summary
In this part of Block 3 we have looked at various aspects of communication
networks, including:
. terminology used to describe the architecture of networks
. the components from which networks are constructed
. details of the physical medium upon which networks are built
. some of the mathematics needed to understand what is happening at the
physical layer.
After studying this part you should be able to:
. identify by name some of the devices that are commonly used in
networks, for example router and home hub
. distinguish different aspects of network architecture, for example LAN
and WAN
. explain why layering is important in network design
. explain the differences between the main transmission media of optical,
wired and radio
. carry out calculations where signals are attenuated
. explain electromagnetic radiation principles, for example wavelength,
period and frequency
. carry out calculations using scientific and exponent notation.
Part 1 Network technologies
50
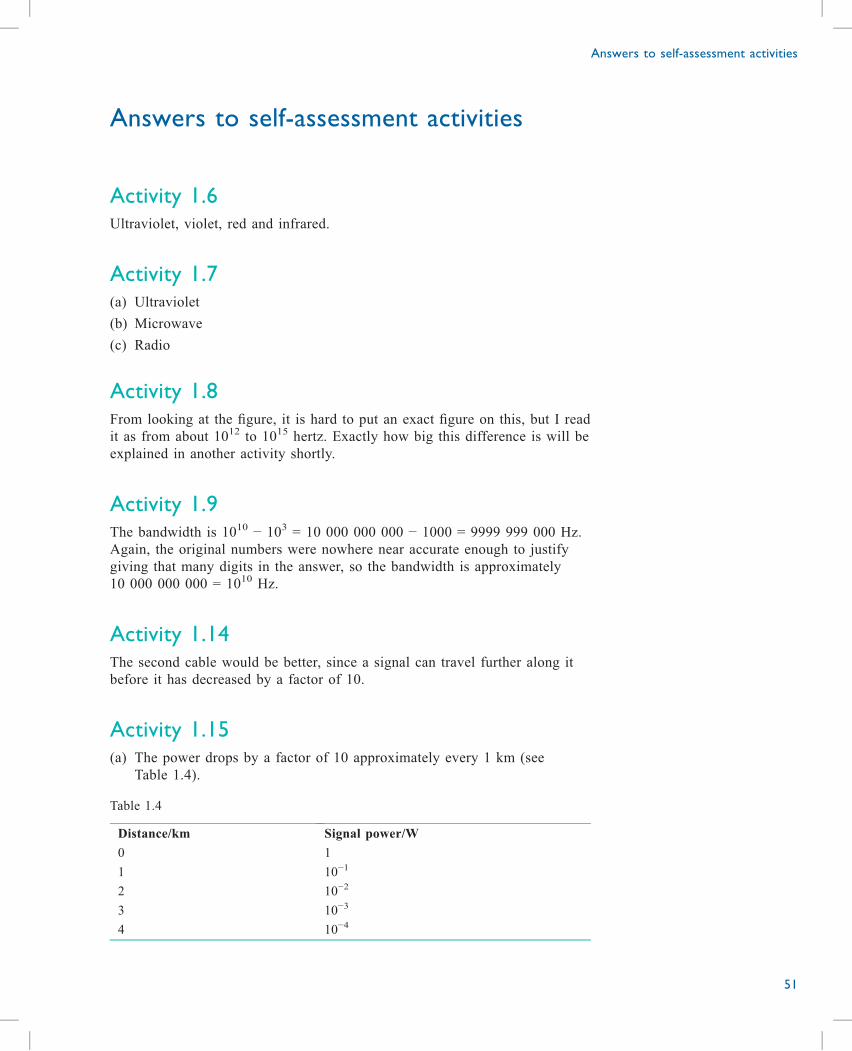
Answers to self-assessment activities
Activity 1.6Ultraviolet, violet, red and infrared.
Activity 1.7(a) Ultraviolet
(b) Microwave
(c) Radio
Activity 1.8From looking at the figure, it is hard to put an exact figure on this, but I read
it as from about 1012 to 1015 hertz. Exactly how big this difference is will be
explained in another activity shortly.
Activity 1.9The bandwidth is 1010 − 103 = 10 000 000 000 − 1000 = 9999 999 000 Hz.
Again, the original numbers were nowhere near accurate enough to justify
giving that many digits in the answer, so the bandwidth is approximately
10 000 000 000 = 1010 Hz.
Activity 1.14The second cable would be better, since a signal can travel further along it
before it has decreased by a factor of 10.
Activity 1.15(a) The power drops by a factor of 10 approximately every 1 km (see
Table 1.4).
Table 1.4
Distance/km Signal power/W
0 1
1 10−1
2 10−2
3 10−3
4 10−4
Answers to self-assessment activities
51
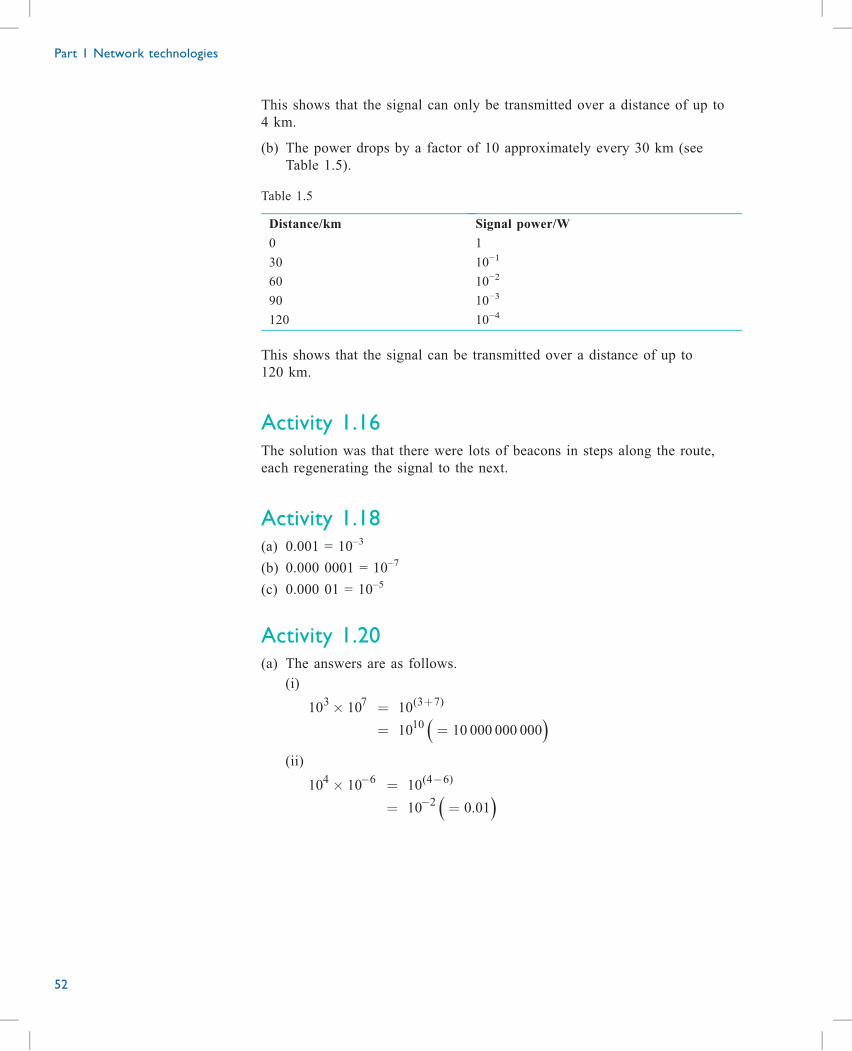
This shows that the signal can only be transmitted over a distance of up to
4 km.
(b) The power drops by a factor of 10 approximately every 30 km (see
Table 1.5).
Table 1.5
Distance/km Signal power/W
0 1
30 10−1
60 10−2
90 10−3
120 10−4
This shows that the signal can be transmitted over a distance of up to
120 km.
Activity 1.16The solution was that there were lots of beacons in steps along the route,
each regenerating the signal to the next.
Activity 1.18(a) 0.001 = 10–3
(b) 0.000 0001 = 10–7
(c) 0.000 01 = 10–5
Activity 1.20(a) The answers are as follows.
(i)
( )10 10 10
10 10 000 000 000
3 7 (3 7)
10× =
= =
+
(ii)
( )10 10 10
10 0.01
4 6 (4 6)
2× =
= =
− −
−
Part 1 Network technologies
52
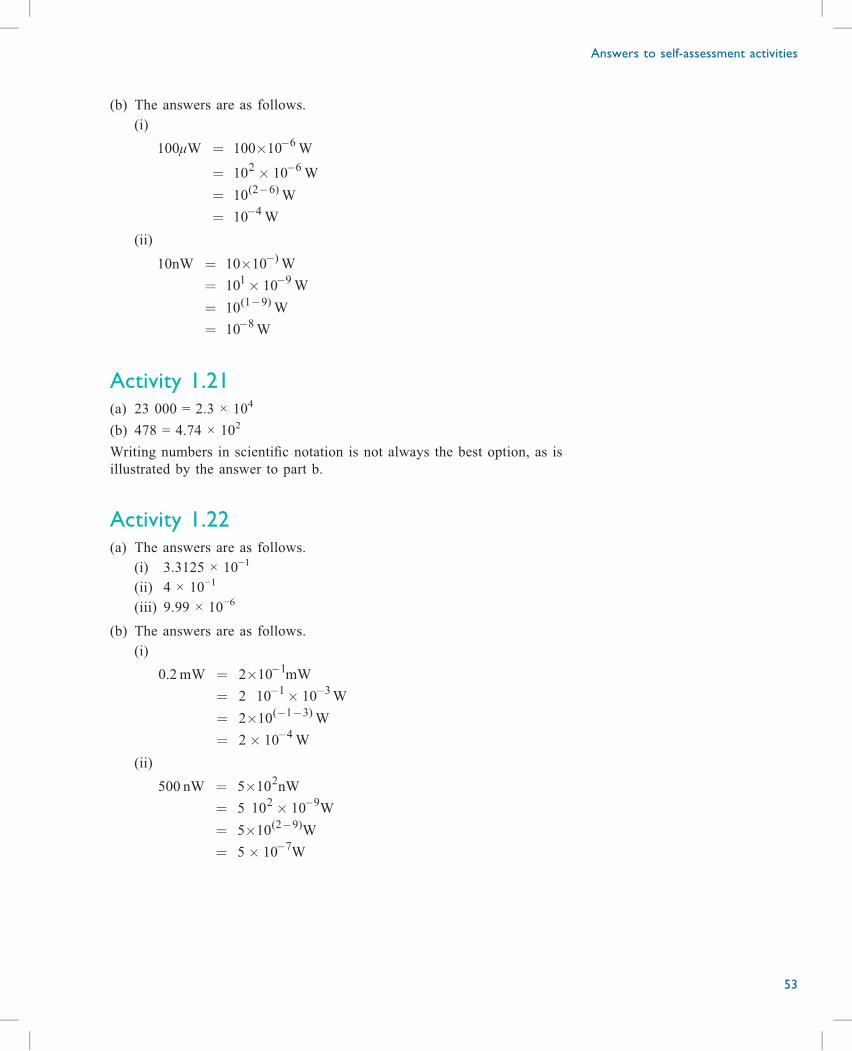
(b) The answers are as follows.
(i)
µ100 W 100 10 W
10 10 W10 W10 W
6
2 6
(2 6)
4
= ×
= ×
==
−
−
−
−
(ii)
10nW 10 10 W10 10 W10 W10 W
)
1 9
(1 9)
8
= ×= ×
==
−
−
−
−
Activity 1.21(a) 23 000 = 2.3 × 10⁴
(b) 478 = 4.74 × 10²
Writing numbers in scientific notation is not always the best option, as is
illustrated by the answer to part b.
Activity 1.22(a) The answers are as follows.
(i) 3.3125 × 10⁻¹
(ii) 4 × 10⁻¹
(iii) 9.99 × 10⁻⁶
(b) The answers are as follows.
(i)
0.2 mW 2 10 mW2 10 10 W2 10 W2 10 W
1
1 3
( 1 3)
4
= ×= ×
= ×= ×
−
− −
− −
−
(ii)
500 nW 5 10 nW5 10 10 W5 10 W5 10 W
2
2 9
(2 9)
7
= ×= ×
= ×= ×
−
−
−
Answers to self-assessment activities
53
References
BBC (2016) BBC Business News [online]. Available at www.bbc.co.uk/news/
business-36210097 (accessed 22 May 2017).
NASA Juno website (n.d.) [online]. Available at www.jpl.nasa.gov/missions/
juno/ (accessed 5 October 2017).
NHS Choices (2016) Mobile phone safety [online]. Available at www.nhs.uk/
conditions/mobile-phone-safety/pages/introduction.aspx (accessed 22
May 2017).
Statista (2017) the portal for statistics. Available at www.statista.com
(accessed 5 October 2017).
Part 1 Network technologies
54
Acknowledgements
Grateful acknowledgement is made to the following sources:
Figure 1.5. Courtesy Alan Jones.
Figure 1.17. www.telegeography.com and Google Maps. This file is licensed
under the Creative Commons Attribution-Non-commercial-No Derivatives
Licence http://creativecommons.org/licenses/by-nc-nd/3.0/.
Extract 1.1. BBC News (2016) ‘BT to invest £6bn in faster broadband and
mobile services’, www.bbc.co.uk/news/business-36210097, 5 May 2016.
Extract 1.2. National Health Service Choices website, www.NHS.uk.
Reproduced under the terms of the OGL, www.nationalarchives.gov.uk/doc/
open-government-licence.
Every effort has been made to contact copyright holders. If any have been
inadvertently overlooked the publishers will be pleased to make the necessary
arrangements at the first opportunity.
Acknowledgements
55

Part 2 The internetby Nicky Moss

Contents
Introduction 61
2.1 Routing and switching 62
2.1.1 Switching 63
2.1.2 Packet switching and the internet 66
2.1.3 Internet addresses 67
2.1.4 Routing principles 68
2.1.5 Conclusion 71
2.2 Internet essentials 72
2.2.1 The development of the internet 72
2.2.2 Standards 73
2.2.3 IP packets 74
2.2.4 The route through the network 75
2.2.5 Conclusion 77
2.3 Internet protocols 78
2.3.1 Internet addresses 78
2.3.2 TCP and connections 81
2.3.3 IP/TCP analogy 83
2.3.4 Protocols, layers and stacks 85
2.3.5 Conclusion 88
2.4 Providing services using protocols 89
2.4.1 Network address translation (NAT) 90
2.4.2 Dynamic host configuration protocol (DHCP) 93
2.4.3 Conclusion 95
2.5 Network security 96
2.5.1 Firewalls 97
2.5.2 Access control list 100
2.5.3 Conclusion 102
Summary 103
Answers to self-assessment activities 104
References 107
Acknowledgements 108

Introduction
The internet has probably had more impact on our daily lives than any other
technology emerging from the information age. Most people, even the young
and old, will have heard of and used the internet, although it may mean
different things to different people. For some, it is the means of accessing the
web; for others, an essential part of their work; for some, an important tool
for keeping in touch with friends or relatives; and for some, something not
well understood and even to be feared.
Activity 2.1 (exploratory)
This activity requires you to undertake a search using Google and find out
some statistics about the internet. You should do this next time you have
access to the module website.
Additional support and guidance in planning the search, how to search using
Google and use of key words are available on the module website.
There are undoubtedly many reasons why the internet has become so
successful, and many of these will be to do with people’s attitudes and use of
the associated technologies that the internet supports; what we might call
social issues. There are also some technical features that stand out as possible
reasons for the success. These include:
. packet technology – which has provided a flexible mechanism for carrying
a wide range of different services over the same network
. internet (IP) addresses – these have provided a universal addressing
scheme
. protocols – these have allowed many new services to be added to existing
architecture.
It is the technology that underlies the operation of the internet that we will
look at in this part of Block 3. In particular, we will see how routers and
switches forward packets, look at the structure of IP addresses, consider some
of the protocols that help to manage addresses and look at some aspects of
security.
Introduction
61
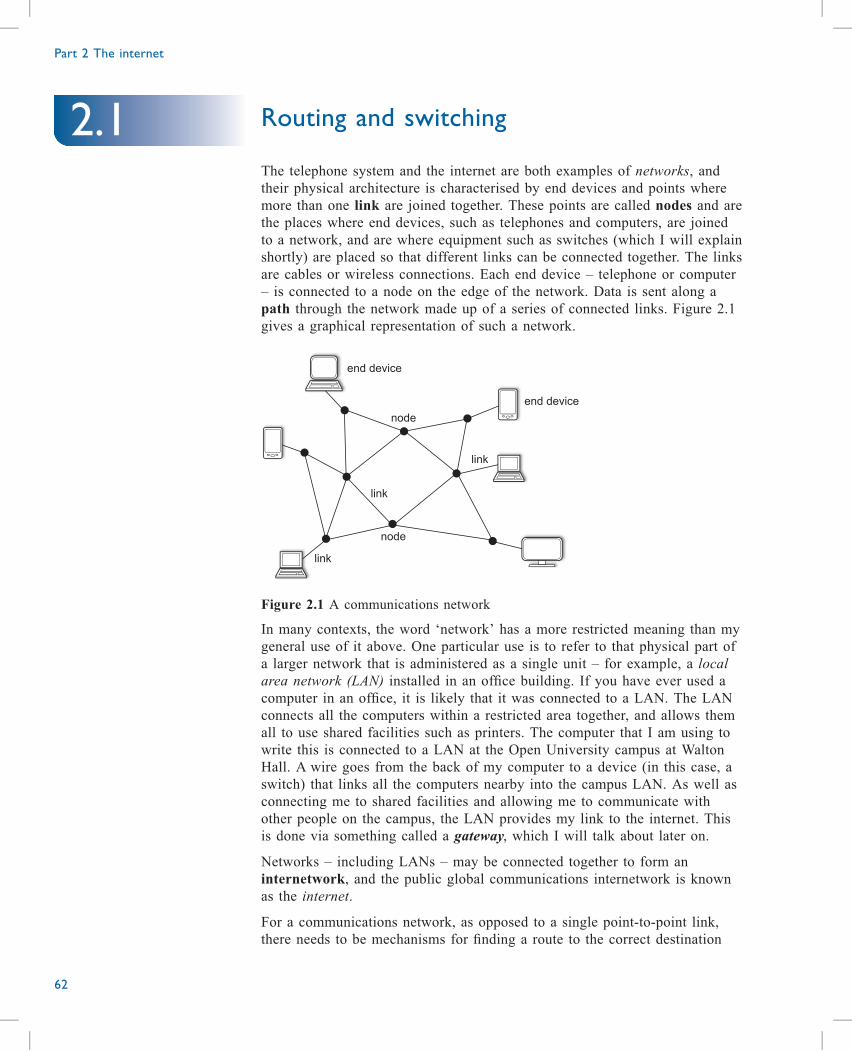
Routing and switching
The telephone system and the internet are both examples of networks, and
their physical architecture is characterised by end devices and points where
more than one link are joined together. These points are called nodes and are
the places where end devices, such as telephones and computers, are joined
to a network, and are where equipment such as switches (which I will explain
shortly) are placed so that different links can be connected together. The links
are cables or wireless connections. Each end device – telephone or computer
– is connected to a node on the edge of the network. Data is sent along a
path through the network made up of a series of connected links. Figure 2.1
gives a graphical representation of such a network.
node
node
link
link
link
end device
end device
Figure 2.1 A communications network
In many contexts, the word ‘network’ has a more restricted meaning than my
general use of it above. One particular use is to refer to that physical part of
a larger network that is administered as a single unit – for example, a local
area network (LAN) installed in an office building. If you have ever used a
computer in an office, it is likely that it was connected to a LAN. The LAN
connects all the computers within a restricted area together, and allows them
all to use shared facilities such as printers. The computer that I am using to
write this is connected to a LAN at the Open University campus at Walton
Hall. A wire goes from the back of my computer to a device (in this case, a
switch) that links all the computers nearby into the campus LAN. As well as
connecting me to shared facilities and allowing me to communicate with
other people on the campus, the LAN provides my link to the internet. This
is done via something called a gateway, which I will talk about later on.
Networks – including LANs – may be connected together to form an
internetwork, and the public global communications internetwork is known
as the internet.
For a communications network, as opposed to a single point-to-point link,
there needs to be mechanisms for finding a route to the correct destination
Part 2 The internet
62
2.1
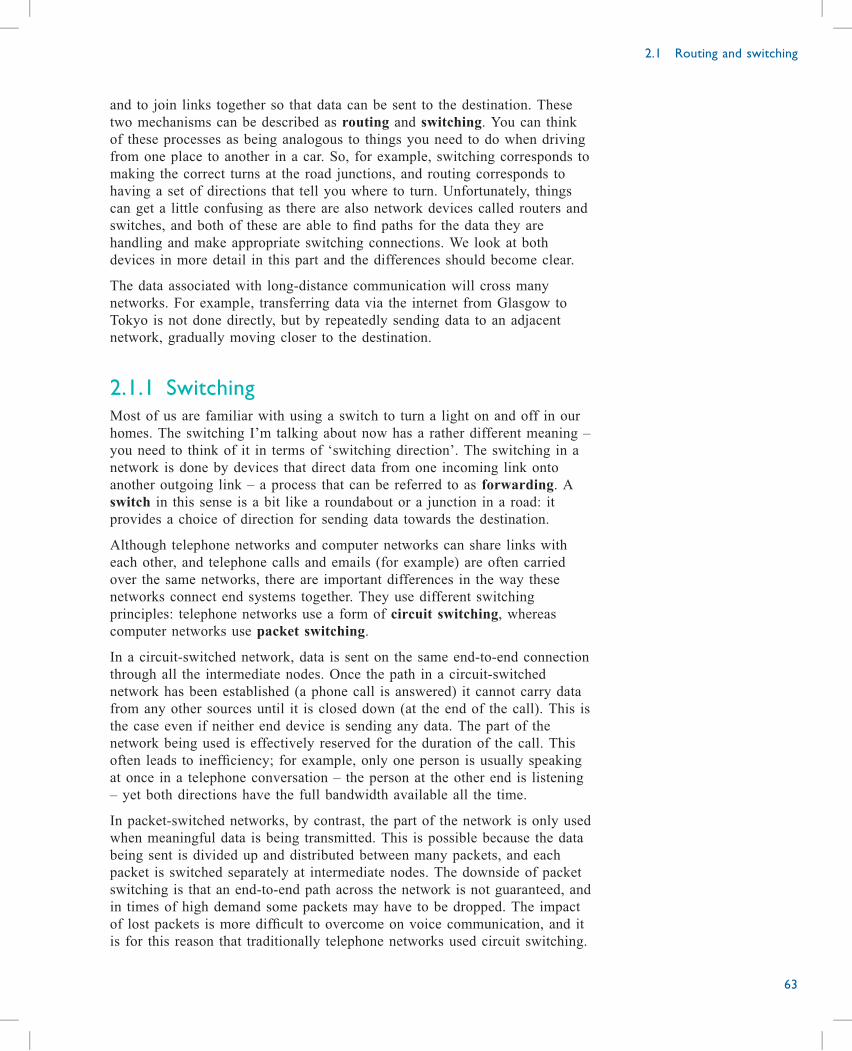
and to join links together so that data can be sent to the destination. These
two mechanisms can be described as routing and switching. You can think
of these processes as being analogous to things you need to do when driving
from one place to another in a car. So, for example, switching corresponds to
making the correct turns at the road junctions, and routing corresponds to
having a set of directions that tell you where to turn. Unfortunately, things
can get a little confusing as there are also network devices called routers and
switches, and both of these are able to find paths for the data they are
handling and make appropriate switching connections. We look at both
devices in more detail in this part and the differences should become clear.
The data associated with long-distance communication will cross many
networks. For example, transferring data via the internet from Glasgow to
Tokyo is not done directly, but by repeatedly sending data to an adjacent
network, gradually moving closer to the destination.
2.1.1 SwitchingMost of us are familiar with using a switch to turn a light on and off in our
homes. The switching I’m talking about now has a rather different meaning –
you need to think of it in terms of ‘switching direction’. The switching in a
network is done by devices that direct data from one incoming link onto
another outgoing link – a process that can be referred to as forwarding. A
switch in this sense is a bit like a roundabout or a junction in a road: it
provides a choice of direction for sending data towards the destination.
Although telephone networks and computer networks can share links with
each other, and telephone calls and emails (for example) are often carried
over the same networks, there are important differences in the way these
networks connect end systems together. They use different switching
principles: telephone networks use a form of circuit switching, whereas
computer networks use packet switching.
In a circuit-switched network, data is sent on the same end-to-end connection
through all the intermediate nodes. Once the path in a circuit-switched
network has been established (a phone call is answered) it cannot carry data
from any other sources until it is closed down (at the end of the call). This is
the case even if neither end device is sending any data. The part of the
network being used is effectively reserved for the duration of the call. This
often leads to inefficiency; for example, only one person is usually speaking
at once in a telephone conversation – the person at the other end is listening
– yet both directions have the full bandwidth available all the time.
In packet-switched networks, by contrast, the part of the network is only used
when meaningful data is being transmitted. This is possible because the data
being sent is divided up and distributed between many packets, and each
packet is switched separately at intermediate nodes. The downside of packet
switching is that an end-to-end path across the network is not guaranteed, and
in times of high demand some packets may have to be dropped. The impact
of lost packets is more difficult to overcome on voice communication, and it
is for this reason that traditionally telephone networks used circuit switching.
2.1 Routing and switching
63
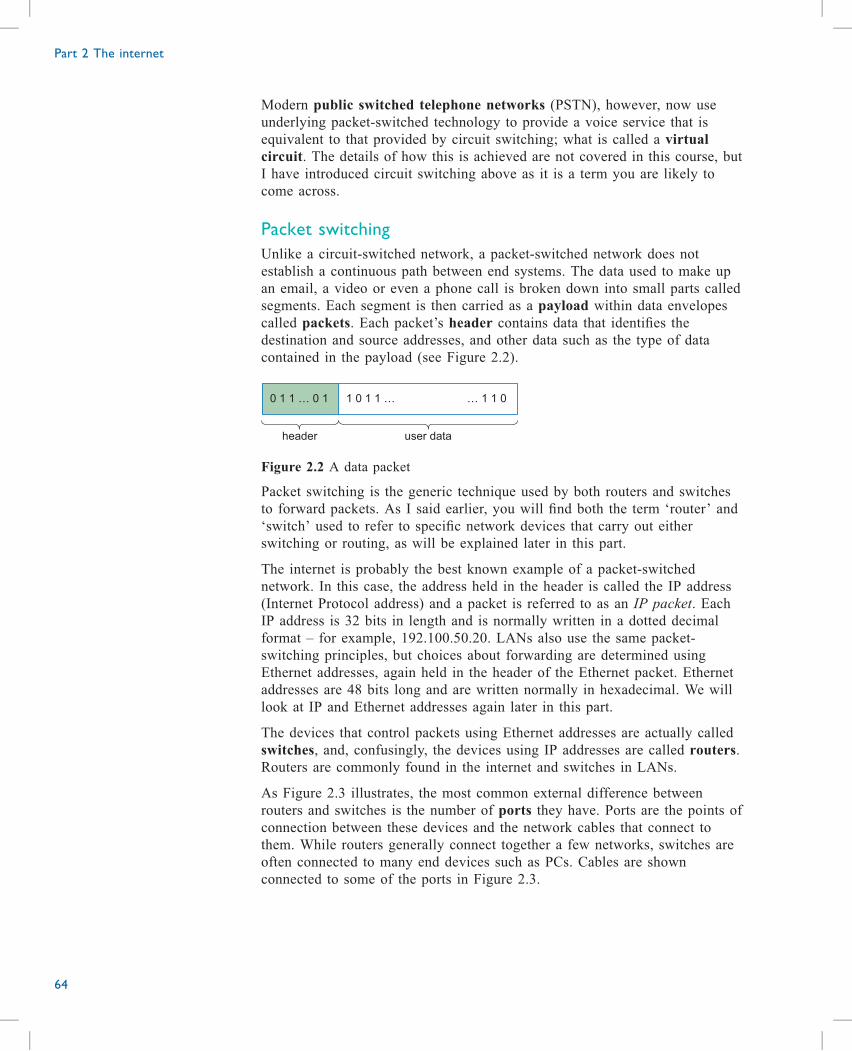
Modern public switched telephone networks (PSTN), however, now use
underlying packet-switched technology to provide a voice service that is
equivalent to that provided by circuit switching; what is called a virtual
circuit. The details of how this is achieved are not covered in this course, but
I have introduced circuit switching above as it is a term you are likely to
come across.
Packet switching
Unlike a circuit-switched network, a packet-switched network does not
establish a continuous path between end systems. The data used to make up
an email, a video or even a phone call is broken down into small parts called
segments. Each segment is then carried as a payload within data envelopes
called packets. Each packet’s header contains data that identifies the
destination and source addresses, and other data such as the type of data
contained in the payload (see Figure 2.2).
0 1 1 … 0 1 1 0 1 1 … … 1 1 0
header user data
Figure 2.2 A data packet
Packet switching is the generic technique used by both routers and switches
to forward packets. As I said earlier, you will find both the term ‘router’ and
‘switch’ used to refer to specific network devices that carry out either
switching or routing, as will be explained later in this part.
The internet is probably the best known example of a packet-switched
network. In this case, the address held in the header is called the IP address
(Internet Protocol address) and a packet is referred to as an IP packet. Each
IP address is 32 bits in length and is normally written in a dotted decimal
format – for example, 192.100.50.20. LANs also use the same packet-
switching principles, but choices about forwarding are determined using
Ethernet addresses, again held in the header of the Ethernet packet. Ethernet
addresses are 48 bits long and are written normally in hexadecimal. We will
look at IP and Ethernet addresses again later in this part.
The devices that control packets using Ethernet addresses are actually called
switches, and, confusingly, the devices using IP addresses are called routers.
Routers are commonly found in the internet and switches in LANs.
As Figure 2.3 illustrates, the most common external difference between
routers and switches is the number of ports they have. Ports are the points of
connection between these devices and the network cables that connect to
them. While routers generally connect together a few networks, switches are
often connected to many end devices such as PCs. Cables are shown
connected to some of the ports in Figure 2.3.
Part 2 The internet
64
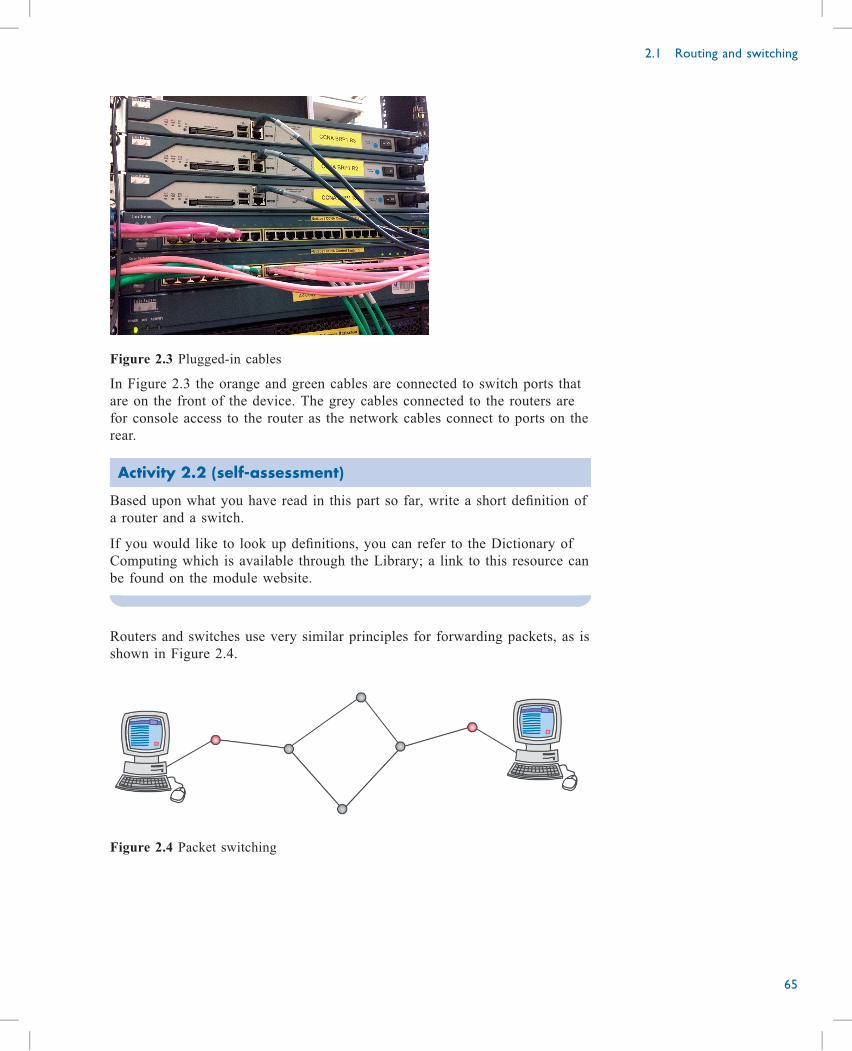
Figure 2.3 Plugged-in cables
In Figure 2.3 the orange and green cables are connected to switch ports that
are on the front of the device. The grey cables connected to the routers are
for console access to the router as the network cables connect to ports on the
rear.
Activity 2.2 (self-assessment)
Based upon what you have read in this part so far, write a short definition of
a router and a switch.
If you would like to look up definitions, you can refer to the Dictionary of
Computing which is available through the Library; a link to this resource can
be found on the module website.
Routers and switches use very similar principles for forwarding packets, as is
shown in Figure 2.4.
Figure 2.4 Packet switching
2.1 Routing and switching
65
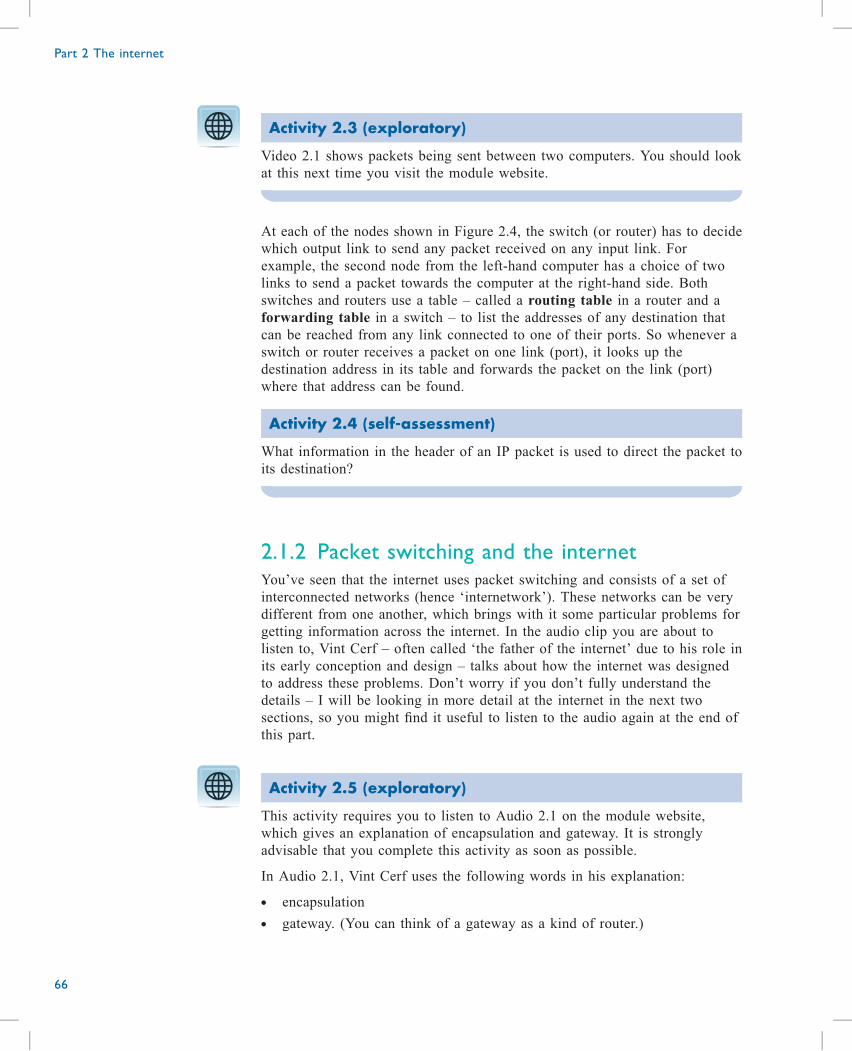
Activity 2.3 (exploratory)
Video 2.1 shows packets being sent between two computers. You should look
at this next time you visit the module website.
At each of the nodes shown in Figure 2.4, the switch (or router) has to decide
which output link to send any packet received on any input link. For
example, the second node from the left-hand computer has a choice of two
links to send a packet towards the computer at the right-hand side. Both
switches and routers use a table – called a routing table in a router and a
forwarding table in a switch – to list the addresses of any destination that
can be reached from any link connected to one of their ports. So whenever a
switch or router receives a packet on one link (port), it looks up the
destination address in its table and forwards the packet on the link (port)
where that address can be found.
Activity 2.4 (self-assessment)
What information in the header of an IP packet is used to direct the packet to
its destination?
2.1.2 Packet switching and the internetYou’ve seen that the internet uses packet switching and consists of a set of
interconnected networks (hence ‘internetwork’). These networks can be very
different from one another, which brings with it some particular problems for
getting information across the internet. In the audio clip you are about to
listen to, Vint Cerf – often called ‘the father of the internet’ due to his role in
its early conception and design – talks about how the internet was designed
to address these problems. Don’t worry if you don’t fully understand the
details – I will be looking in more detail at the internet in the next two
sections, so you might find it useful to listen to the audio again at the end of
this part.
Activity 2.5 (exploratory)
This activity requires you to listen to Audio 2.1 on the module website,
which gives an explanation of encapsulation and gateway. It is strongly
advisable that you complete this activity as soon as possible.
In Audio 2.1, Vint Cerf uses the following words in his explanation:
. encapsulation
. gateway. (You can think of a gateway as a kind of router.)
Part 2 The internet
66
In no more than 100 words, explain what you’ve understood from the audio
about the above terms.
CommentHere are my notes, but don’t worry if you didn’t pick all this up. There are
some quite subtle ideas in here, which you will meet again in the next two
sections.
Encapsulation is the process of ‘wrapping’ internet packets with the format
used by the separate networks that make up the internet. Gateways are the
computers that do this encapsulation. Encapsulated internet packets arrive at
gateways, are ‘unwrapped’, and then encapsulated again for the next network.
Cerf also mentioned routing when talking about gateways and, although it
was not clear from what he said, gateways are also routers.
2.1.3 Internet addressesTo understand how routing works, it is necessary to know a little more about
IP addresses. As I stated earlier, an IP address can be written in dotted
decimal format – for example, 192.100.50.1. To be more precise, this is an
example of an IPv4 (Internet Protocol version 4) address, and this is just one
of more than 4,000 million possible addresses. IPv6 addresses are a newer
version which have been introduced to cope with the increase in demand for
addresses. We look at version 6 again later.
A network host is a device connected to a network and identified by an IP
address. Every host computer that is connected to the internet has a unique IP
address (hence the increased demand and IPv6), and it is possible for any
host computer to find a route to any other host on the internet. As you can
imagine, trying to find our one address (192.100.50.1) out of all of the
possible addresses would be an enormous job if we had to search through
every available address on every router encountered between source and
destination.
To make the search problem easier, addresses are grouped together and
identified by the first part of the IP address in each group. This part of an
address is called the network address as it identifies a network connected to
the internet, rather than a single host. So it is normal practice to divide IP
addresses into two parts: the network part and the host part. In my example,
the network part is 192.100.50, with 254 hosts individually represented by
the values 1 to 255 in the last part of the address; written in full,
192.100.50.1 to 192.100.50.255. So in this example the network part remains
the same for all addresses in this network – for example, 192.100.50.10 and
192.100.50.326. Both of these are unique host addresses. However, we do not
write network addresses with part of the address range missing, so the
network address for our example is actually 192.100.50.0, which is the first
value in the address range. Don’t be confused by the use of 0, as it is normal
practice to use 0, and 192.100.50.0 is still a unique IPv4 address. We will
look in more detail at IPv4 addresses later in this part.
2.1 Routing and switching
67
Activity 2.6 (exploratory)
You should be able to find the IP address of your own computer under
network settings. What is the IP number of your home computer?
CommentI use two iPads, an iPhone and a PC on my network at home. The IP
addresses for my three Apple devices were 192.168.1.87, 192.168.1.82 and
192.168.1.83. I could not look up the IP address on my PC as it is controlled
by my IT department and I seem to be barred from accessing this part of the
setup.
You might like to make a note of your IP address as we will look at this
topic again later.
2.1.4 Routing principlesAs I have explained earlier, routers are network devices that are used to carry
out packet switching in the internet. An IP address can identify any device
that is connected to the internet, as the IP address for each device is unique.
End devices such as PCs or servers normally only have one connection to the
network and therefore one IP address. Routers can have many ports and have
an IP addresses for each of the links connected to their ports. All of these
individual addresses are called host addresses. As I stated above, groups of
hosts have a single network address – normally the first address, as in
192.100.50.0. It is network addresses that routers use to forward packets, and
they do this by keeping a list of any network that can be reached from each
port. This list is stored in a database called a routing table.
Figure 2.5 shows two networks called School and Academy, each of which is
connected to a router: R1 for School and R2 for Academy. The two routers
are joined together through another network. Each network has been allocated
a network address – for example, the network address for school is
192.100.50.0. The School network has two PCs connected to R1 via a switch.
The Academy network has a similar configuration with two servers. The
network between the two routers contains a number of intermediate routers.
A switch is needed in each of the two end networks to connect together all of
the end devices; remember in this example it is possible to have up to 254 in
each of the networks, but only two are shown for simplicity. Individual host
addresses are shown for two devices, PC1 and the web server. At the bottom
of the figure is a routing table which shows which networks are accessible
from each of R1’s two ports. In this figure, no routing table is shown for R2
or the switches, and only the IP addresses for the two end devices are shown.
Part 2 The internet
68
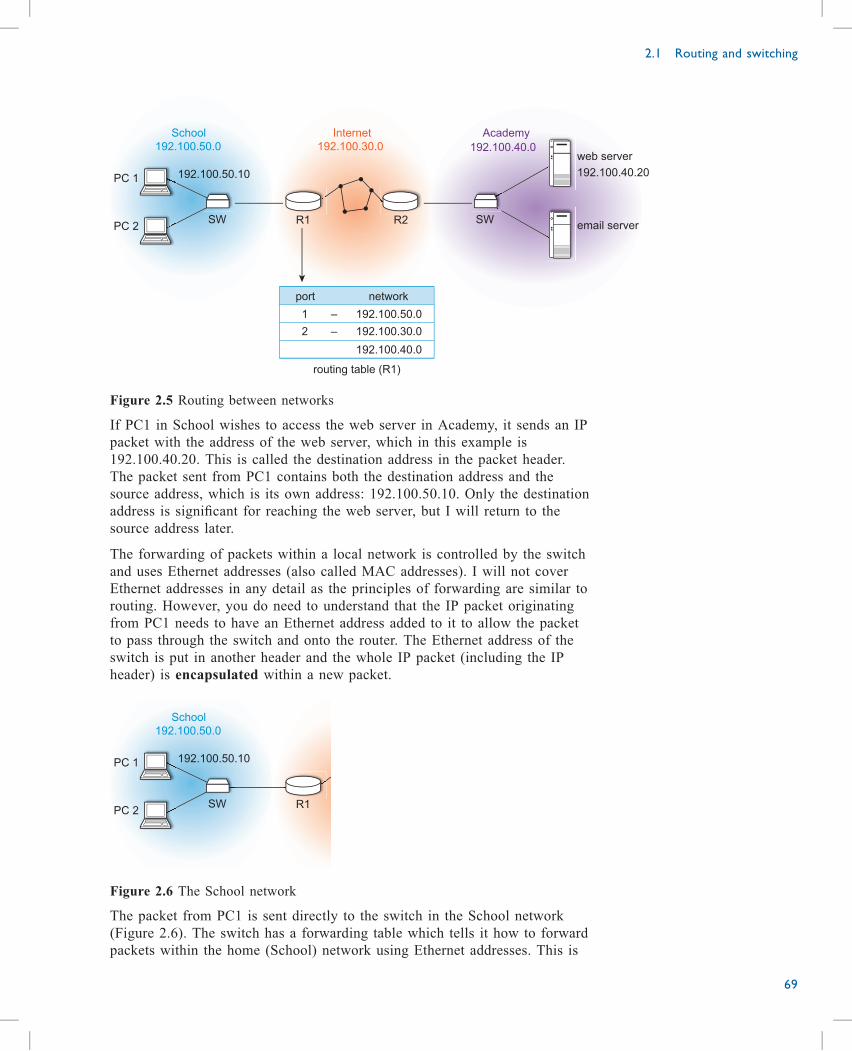
Internet AcademySchool
PC 1
PC 2SW SWR2R1
email server
routing table (R1)
port network
192.100.50.0
192.100.50.10
192.100.30.0 192.100.40.0
192.100.40.20
192.100.50.0
192.100.30.0
192.100.40.0
1
2
–
–
web server
Figure 2.5 Routing between networks
If PC1 in School wishes to access the web server in Academy, it sends an IP
packet with the address of the web server, which in this example is
192.100.40.20. This is called the destination address in the packet header.
The packet sent from PC1 contains both the destination address and the
source address, which is its own address: 192.100.50.10. Only the destination
address is significant for reaching the web server, but I will return to the
source address later.
The forwarding of packets within a local network is controlled by the switch
and uses Ethernet addresses (also called MAC addresses). I will not cover
Ethernet addresses in any detail as the principles of forwarding are similar to
routing. However, you do need to understand that the IP packet originating
from PC1 needs to have an Ethernet address added to it to allow the packet
to pass through the switch and onto the router. The Ethernet address of the
switch is put in another header and the whole IP packet (including the IP
header) is encapsulated within a new packet.
School
PC 1
PC 2SW R1
192.100.50.0
192.100.50.10
Figure 2.6 The School network
The packet from PC1 is sent directly to the switch in the School network
(Figure 2.6). The switch has a forwarding table which tells it how to forward
packets within the home (School) network using Ethernet addresses. This is
2.1 Routing and switching
69
something the switch learns automatically and I will not cover the detail here.
The switch also has an entry in its forwarding table that directs any packet
with an address outside of the School network to the router R1, which is
called the gateway. So our packet has reached R1.
Both routers and switches have routing/forwarding tables which basically do
the same job – that is, they build up a table of information about which port
to send packets out on in accordance with the destination address. As I have
said before, routers use IP addresses and switches use Ethernet addresses.
Switches basically learn about their local networks from addressing
information they read from incoming packets, whereas routers are able to
learn about distant networks because routers share information with each
other about the networks they are connected to.
routing table (R1)
port network
192.100.50.0
192.100.30.0
192.100.40.0
1
2
–
–
Figure 2.7 Routing table
Looking at the simplified routing table for R1 in Figure 2.7, we can see that
it knows about the 192.100.50.0 and the 192.100.30.0 networks because these
are connected directly to it – in this case, to ports 1 and 2, respectively.
However, there is an additional entry in the table which shows another
network (192.100.40.0) available via port 2. This is a network that is
connected to the far side of router R2, and this information enables R1 to
forward our packet (destination address 192.100.40.20) across the
192.100.30.0 network toward R2. Remember from the earlier explanation of
IP addresses that the host address 192.100.40.20 is in the network
192.100.40.0. In this way, our packet reaches R2 which is connected directly
to the destination network (Figure 2.8). R2 now sends the packet to the
switch, which selects the correct port to forward our packet to reach the web
server, as requested. Before sending the packet to the web server, the router
has to encapsulate the IP packet again, adding the correct Ethernet address.
Part 2 The internet
70
Academy
SWemail server
192.100.40.0
192.100.40.20
web server
Figure 2.8 The Academy network
Now we return to the original packet sent from PC1 and the source IP
address. The web server can now use the source address to send a reply to
PC1. It does this by using the source address received as the destination
address for any packets sent back to PC1.
Activity 2.7 (self-assessment)
What encapsulation takes place within the Academy network to enable a
packet from the web server to find its way back to PC1?
In practice, many switches and routers can be joined together as part of a
LAN, and many thousands of routers are connected across the internet. From
this explanation of how a few routers are connected together, you should be
able to visualise how packets will finally find their way across the internet,
always travelling from source to destination using IP addresses. The gateway
router from any network can also be designated as a default route. All this
means is that any packet for which an address cannot be found in a routing
table is sent on the default route, and normally in this way it will find a
router that recognises that address and can eventually get it to the destination.
In practice, the internet is carefully organised with a hierarchy of routers,
with routers at the edges of networks called gateways. This enables certain
gateway routers to be made known to many routers so that the path that
packets follow is much less random than my example may imply.
2.1.5 ConclusionIn this section, we have looked at the basic principles of switching and
routing, the two principle techniques used to connect packets across
networks. After studying this section, you should understand how networks
and internetworks join together and how routers use IP addresses to move
packets across networks. You should also be able to describe the concepts of
switching and routing, identify how they apply to the internet, and describe
the concept of a packet and how this is manifested in the internet.
2.1 Routing and switching
71
Internet essentials
In this section, I will set out some features of the structure and operation of
the internet. This forms an introduction to the more advanced ideas that you
will meet in Sections 2.3 and 2.4. To appreciate the composition of the
internet fully, it is helpful to have an idea of how the internet has developed,
so that is what I will look at first.
2.2.1 The development of the internetAs discussed in Section 2.1, the internet is a public global internetwork made
up of a huge number of networks, each of which can communicate with other
networks. Anyone who has a computer connected to the internet can, in
theory, connect to any other computer connected to the internet. But how was
this giant internetwork first developed? The following points give a brief
summary.
The internet grew out of a 1969 research project that was carried out by the
US government’s Advanced Research Project Agency (ARPA). At the time,
the demand for access to computers was growing at an incredible rate, far
beyond what could be funded; it made sense to try connecting together
computers at locations around the country so that people working at those
locations could share resources.
Although the concept was proved to work in a short space of time (the first
four locations were linked together within a year), it took a lot longer to
grow significantly. By 1980 there were only 15 universities connected to the
ARPA network (ARPANET). This was partly due to cost and partly due to
restrictions on what types of institutions could join the network, which was
funded by the US military.
In 1979, the US National Science Foundation (NSF) started to fund a
separate network, built upon similar principles to the ARPA network but
providing a variety of connection options at different prices. Without ARPA’s
military links and restrictions, this Computer Science Network and its
successor (NSFNET) were able to connect universities across the USA.
Similar academic networks were set up across the world (such as the UK’s
Joint Academic Network, or JANET for short), and links between these
networks began to spring up. As the networks grew and became
interconnected, this ‘network of networks’ became known as the internet.
Since that time, thousands of networks have joined the internet. Organisations
of all sorts – commercial as well as academic and governmental – have
LANs on their premises, and many of them connect their LANs together to
create an organisation-wide network referred to as a wide area network
(WAN). The links that join different segments of networks – joining different
LANs to create a WAN, for example – are described as backbones.
Part 2 The internet
72
2.2
I could continue to identify further types of network – people seem all too
ready to think up new types and acronyms, referring to such things as
metropolitan area networks (MANs) and personal area networks (PANs), for
example – but I hope by now you have got the picture: lots of different
networks of different sizes and shapes, all linked together to form the
internet. You should remember LANs and WANs; you can look up any others
you come across on the web for yourself, if you need to.
2.2.2 StandardsTo some extent, the way any one of these separate networks works internally
is nobody’s business except the owner and users of that network. However,
where it joins to other networks – where it becomes part of the internet – it
has to conform to the standards of the internet. This is what makes
internetworking possible, and it is where the concept of a gateway comes in:
a gateway ensures that data from an individual network is compatible with
the wider world of the internet. When you use an internet service provider
(ISP) to connect to the internet, for example, you are part of the ISP’s
network, and the ISP has a gateway that connects you to the internet.
The internet is not owned by a single organisation, so there is no one
authority that dictates how it works. Yet all the different people and
organisations with their own networks that together make up the internet have
to work to common standards, or data would be unable to move between the
different networks. To make this possible, the standards and guidelines of the
internet are all available publicly. A lot of the relevant information is
accessible from the website of the Internet Engineering Task Force (IETF),
which presents its technical standards in documents called Requests for
Comments (RFCs).
Activity 2.8 (exploratory)
You can access RFCs by using the ‘IETF Repository Retrieval’ function on
the IETF’s ‘Request for Comments’ page: http://www.ietf.org/rfc.html. Enter
the number ‘1935’, which will take you to an RFC entitled ‘What is the
Internet, Anyway?’ Read the introduction to this document, which was
written in 1994. How relevant do you think the issues raised in the
introduction are today?
CommentI was struck by how pertinent the issues are today. For example, it is still
very hard to give a definitive definition of what the internet is, and I would
be surprised if you did not get many different answers if you asked your
friends. Also, some of the concerns about the use of the internet are still
expressed by people today, although perhaps some of these have proved to be
more pertinent to social media such as Twitter.
2.2 Internet essentials
73
2.2.3 IP packetsTo make the job of delivering messages manageable, any internet message
created by an application on your computer (e.g. an email message from your
email software or a request for a web page from your browser) is broken up
into smaller pieces called segments. As you saw in Section 2.1, the IP
address of the destination computer is then added to each piece as part of a
header, to make an IP packet. This is sent onto the internet to be delivered to
its destination, possibly via several sub-networks and involving several
routers and gateways between networks. Each gateway puts another header
on the packet, as well as adding more bits to the end (a ‘trailer’). This
process is called encapsulation, and is done to make the packet suitable for
the network that it is going through. The extra header and trailer are removed
when the packet leaves the network.
When the destination receives the packets from the source, it extracts the data
from each packet (discarding the header), recombines the data and passes it
to the appropriate application running on the destination computer. The
application software then interprets the message. If the message requires a
response – if it is a request for a web page, for example – then the requested
data is sent back, also carried in a series of packets.
Protocol is the general term given to rules and formats that control the
exchange of data between computers on a network. The IPv4 packet that I
have been describing so far is an example of a protocol, and involves
splitting data up into packets and routing each packet using IP addresses. It is
the instructions that are used to create an IP packet (and break it down again)
that make it a protocol. Any computer that follows the protocol correctly can
send and receive IP packets, even if the two computers are quite different –
an iPhone and a PC, for example. IP is often referred to together with some
other important protocols as the TCP/IP family. In Section 2.3, you will
learn about some other protocols involved in the exchange of packets over
the internet, and the individual functions of the protocols TCP and IP.
Activity 2.9 (self-assessment)
Why is the IP address so important when trying to find a destination
computer?
Activity 2.10 (exploratory)
When a user requests a web page, is it likely that the same number of
packets is sent in each direction?
CommentGenerally, the request to download something from the web involves entering
only a few characters or clicking on a link. Compare this to receiving a
Part 2 The internet
74
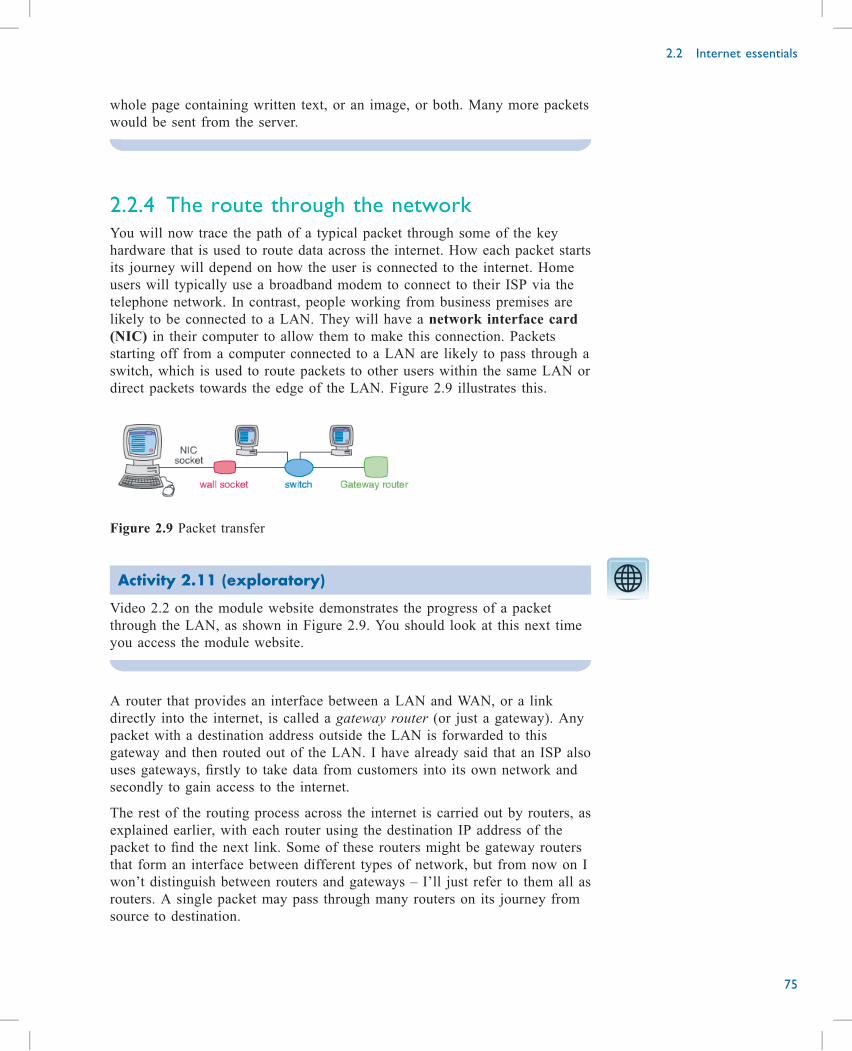
whole page containing written text, or an image, or both. Many more packets
would be sent from the server.
2.2.4 The route through the networkYou will now trace the path of a typical packet through some of the key
hardware that is used to route data across the internet. How each packet starts
its journey will depend on how the user is connected to the internet. Home
users will typically use a broadband modem to connect to their ISP via the
telephone network. In contrast, people working from business premises are
likely to be connected to a LAN. They will have a network interface card
(NIC) in their computer to allow them to make this connection. Packets
starting off from a computer connected to a LAN are likely to pass through a
switch, which is used to route packets to other users within the same LAN or
direct packets towards the edge of the LAN. Figure 2.9 illustrates this.
Figure 2.9 Packet transfer
Activity 2.11 (exploratory)
Video 2.2 on the module website demonstrates the progress of a packet
through the LAN, as shown in Figure 2.9. You should look at this next time
you access the module website.
A router that provides an interface between a LAN and WAN, or a link
directly into the internet, is called a gateway router (or just a gateway). Any
packet with a destination address outside the LAN is forwarded to this
gateway and then routed out of the LAN. I have already said that an ISP also
uses gateways, firstly to take data from customers into its own network and
secondly to gain access to the internet.
The rest of the routing process across the internet is carried out by routers, as
explained earlier, with each router using the destination IP address of the
packet to find the next link. Some of these routers might be gateway routers
that form an interface between different types of network, but from now on I
won’t distinguish between routers and gateways – I’ll just refer to them all as
routers. A single packet may pass through many routers on its journey from
source to destination.
2.2 Internet essentials
75
Although IP addresses are used to forward packets across the internet, it is
unlikely that you will know the IP address of your own device as you will
not explicitly use it when sending a message, unlike a phone call where you
often have to enter the phone number. For example, if you wish to access a
website, you use a URL (a web address), even if the URL is generated from
a search in Google, say. URLs are the way addresses appear to us, but the
addresses used by the Internet Protocol are still IP addresses. This means that
URLs have to be converted to IP addresses, which is done by a system
known as the domain name system (DNS). Computers at various locations
around the internet have databases that convert URLs to IP addresses. These
computers are known as DNS servers; whenever you use a URL, your
computer communicates with a DNS server to find out what the IP address is.
If you know the IP address of the computer that hosts a particular website,
you can use that instead of the URL in a web browser. This isn’t generally a
good idea, because IP addresses are more liable to change than URLs.
However, using IP addresses directly is common practice with network
engineers when they are fault finding networks, as it allows them to break
down the network stage by stage.
Activity 2.12 (exploratory)
‘Warriors of the Net’ is an animated video (not produced by the OU) that
introduces some of the principles of how the internet works. While this is
now a rather old video, it is still informative – and in my opinion quite fun.
You might find it useful to watch this video more than once, as it provides a
very helpful visualisation of the way IP packets travel around the internet. Do
bear in mind, though, that in the interests of making an appealing and
enjoyable film, some of what it says might be a little misleading – and
arguably, some of it is plain wrong! However, provided you accept the
general ideas, rather than looking for a detailed explanation, it is a good aid
to understanding how the internet works.
As an example, the image of IP packets as little spacecraft carrying data and
travelling around the internet is a useful image to have in your head, but the
idea of them being ‘reused’ when the data has been extracted doesn’t mean
anything. A better understanding would be that they are destroyed when the
data has been extracted at the destination, and new ones are created whenever
data is to be sent anywhere.
One thing mentioned in the video that I have not yet covered, but which will
come up in the next section, is a firewall. Make a few notes about what a
firewall does, based on what you saw in the video.
CommentI haven’t given an answer here, since firewalls are covered in the next
section. However, you should make your own notes, as it is a way of making
Part 2 The internet
76
sure you have engaged with the video and will prepare you for when I
discuss firewalls later.
2.2.5 ConclusionThis section looked at the structure and operation of the internet. After
studying this section, you should understand the relationship between IP
addresses and IP packets, the role of routers, gateways and encapsulation in
the transmission of packets through the internet, and the role played in the
internet by DNS servers. You should also be able to describe the structure of
the internet in terms of sub-networks and their connections.
2.2 Internet essentials
77
Internet protocols
When you enter the URL of a website into your browser or click on a link,
you expect – and normally get – a response fairly quickly. Yet quite a lot of
things are going on in the background to enable this interchange to take
place. I have described it as an interchange because you must send a request
to the distant website, which then responds by sending you some data. These
activities are governed by protocols – the rules that specify how data is to be
sent, transmitted and received. If the agreed rules are followed by all the
devices in a network, data can be sent reliably and efficiently.
In this section, I will look in particular at the protocols that support
communication across the internet. Of course, the internet enables many
forms of communication (such as email or video), and some of the same
protocols are involved there as well. But for ease of explanation, in this
section I will concentrate on what happens when a website request is made.
As I mentioned in the previous section, the most important protocols for
communication across the internet are the Internet Protocol (IP) and the
Transmission Control Protocol (TCP), which are often spoken of together
as TCP/IP. IP has the job of getting data packets across the internet, while
TCP is concerned with what happens at the sending and receiving devices. In
the next two sections, I will look at each of these protocols in turn.
2.3.1 Internet addressesAs I said in Section 2.1, any computer connected to the internet is identified
by its IP address. At the time of writing, IPv4 addresses were the most
dominant, although the use of IPv6 addresses was on the increase. The
general principles associated with IPv4 and IPv6 are the same – for example,
uniqueness and their use in routing packets. Most of the explanation in this
block will be about IPv4 addresses. As I have said before, the IP addresses
that a network makes visible to the internet must be unique, because if the
same IP address were visible on the internet in two places then there would
be delivery problems – it would be like two houses having the same postal
address.
An IPv4 address is a set out as four numbers separated by dots, such as
212.44.110.172. Each of the four numbers is stored using one byte, and
therefore can take any value between 0 and 255. A byte is 8 bits, which as
you learned earlier in this module can represent 28 = 256 different numbers.
I will now explain a method for working out the binary equivalent of the IP
address (212.44.110.172) above. To tackle this problem, we need to take each
of the values between the dots one at a time. Before doing that, it is useful to
draw a simple table showing the possible value of each bit in an 8-bit binary
number (sometimes referred to as an octet). This develops the method you
Part 2 The internet
78
2.3
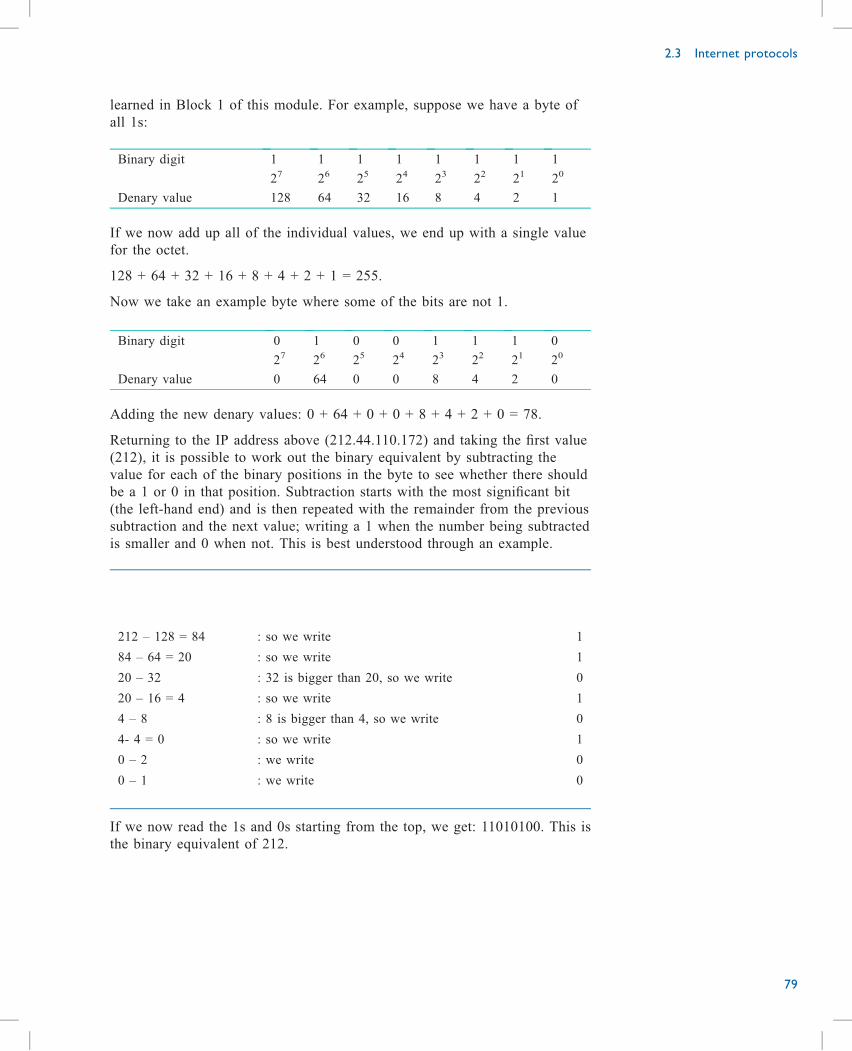
learned in Block 1 of this module. For example, suppose we have a byte of
all 1s:
Binary digit 1 1 1 1 1 1 1 1
27 26 25 24 23 22 21 20
Denary value 128 64 32 16 8 4 2 1
If we now add up all of the individual values, we end up with a single value
for the octet.
128 + 64 + 32 + 16 + 8 + 4 + 2 + 1 = 255.
Now we take an example byte where some of the bits are not 1.
Binary digit 0 1 0 0 1 1 1 0
27 26 25 24 23 22 21 20
Denary value 0 64 0 0 8 4 2 0
Adding the new denary values: 0 + 64 + 0 + 0 + 8 + 4 + 2 + 0 = 78.
Returning to the IP address above (212.44.110.172) and taking the first value
(212), it is possible to work out the binary equivalent by subtracting the
value for each of the binary positions in the byte to see whether there should
be a 1 or 0 in that position. Subtraction starts with the most significant bit
(the left-hand end) and is then repeated with the remainder from the previous
subtraction and the next value; writing a 1 when the number being subtracted
is smaller and 0 when not. This is best understood through an example.
212 – 128 = 84 : so we write 1
84 – 64 = 20 : so we write 1
20 – 32 : 32 is bigger than 20, so we write 0
20 – 16 = 4 : so we write 1
4 – 8 : 8 is bigger than 4, so we write 0
4- 4 = 0 : so we write 1
0 – 2 : we write 0
0 – 1 : we write 0
If we now read the 1s and 0s starting from the top, we get: 11010100. This is
the binary equivalent of 212.
2.3 Internet protocols
79
Activity 2.13 (self-assessment)
The binary equivalent for the IP address 212.44.110.172 can be written as
four bytes, and the convention is to leave a gap between each byte. What is
the binary equivalent of this address?
Activity 2.14 (exploratory)
Given that an IP address is a sequence of four one-byte numbers, how many
different IP addresses can there be? You will probably need to use a
calculator for this activity.
CommentAn IP address has 4 bytes each of 8 bits, so there are 4 × 8 = 32 bits
The total possible combinations of 32 bits = 232 = 4294 967 296.
As I mentioned in Section 2.1.3, for use on the internet, IP addresses have to
be divided into two parts called the network and host portions. Broadly
speaking, the network part is used for routing and the host part identifies a
particular device or port in a device. Originally, IPv4 addresses were
subdivided according to three main classes called simply A, B and C. This
division of addresses is called classful addressing, and essentially divides the
total address space along one boundary between the four octets, allowing for
a different split between the network and host portion. In practice, with the
advent of a technique called classless inter-domain routing (CIDR), the
boundary between network and host can be drawn at many other points,
giving much more flexibility. (CIDR is beyond the scope of this module.)
As seen above, the four-byte IP address seems to provide plenty of different
unique numbers. Yet there are many computers and other devices on the
internet, and they each need an IP address. So the world is running out of IP
addresses. One solution to this problem is a new version of the Internet
Protocol called IPv6..
An IPv6 address in full: 2001:ca45:0db5:0034:0000:0000:0000:ca27
Leading zeros omitted: 2001:ca45:db5:34::ca27
You don’t need to be able to remove the zeros for your study; you just need
to recognise that when you see the shortened form, the full address is always
16 bytes long.
Activity 2.15 (self-assessment)
If an IPv6 address is 16 bytes long, how many bits is this?
Part 2 The internet
80
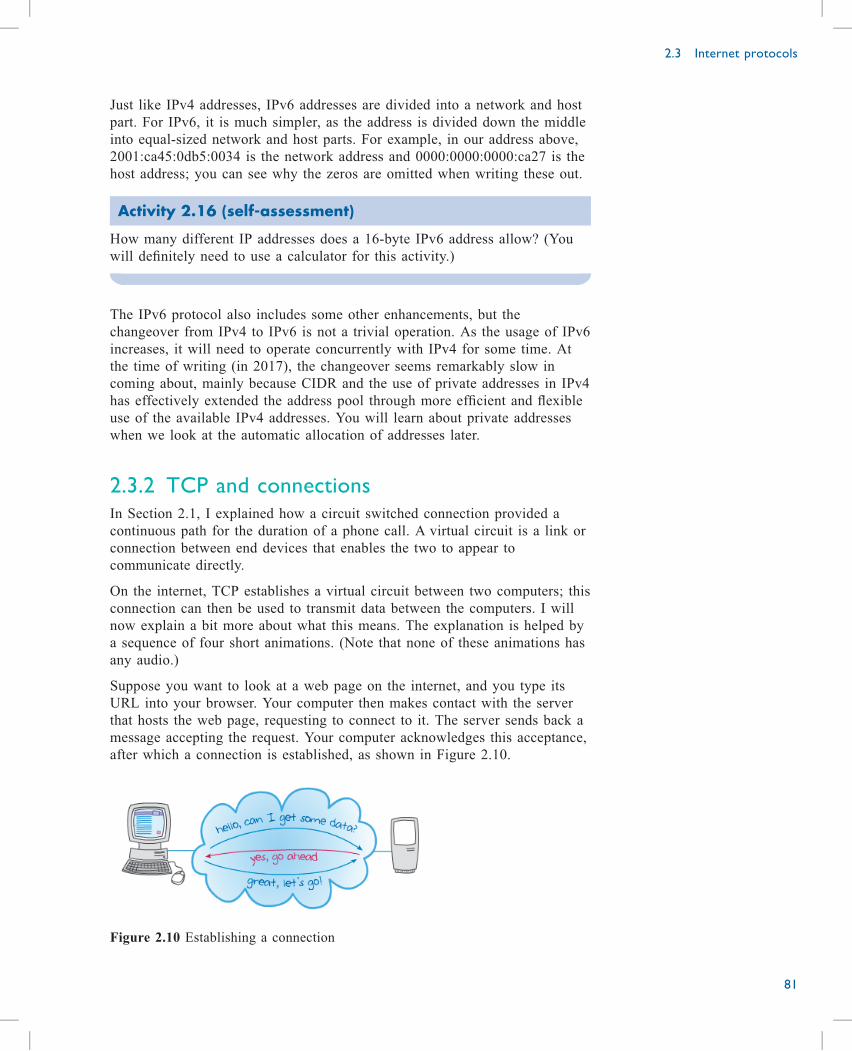
Just like IPv4 addresses, IPv6 addresses are divided into a network and host
part. For IPv6, it is much simpler, as the address is divided down the middle
into equal-sized network and host parts. For example, in our address above,
2001:ca45:0db5:0034 is the network address and 0000:0000:0000:ca27 is the
host address; you can see why the zeros are omitted when writing these out.
Activity 2.16 (self-assessment)
How many different IP addresses does a 16-byte IPv6 address allow? (You
will definitely need to use a calculator for this activity.)
The IPv6 protocol also includes some other enhancements, but the
changeover from IPv4 to IPv6 is not a trivial operation. As the usage of IPv6
increases, it will need to operate concurrently with IPv4 for some time. At
the time of writing (in 2017), the changeover seems remarkably slow in
coming about, mainly because CIDR and the use of private addresses in IPv4
has effectively extended the address pool through more efficient and flexible
use of the available IPv4 addresses. You will learn about private addresses
when we look at the automatic allocation of addresses later.
2.3.2 TCP and connectionsIn Section 2.1, I explained how a circuit switched connection provided a
continuous path for the duration of a phone call. A virtual circuit is a link or
connection between end devices that enables the two to appear to
communicate directly.
On the internet, TCP establishes a virtual circuit between two computers; this
connection can then be used to transmit data between the computers. I will
now explain a bit more about what this means. The explanation is helped by
a sequence of four short animations. (Note that none of these animations has
any audio.)
Suppose you want to look at a web page on the internet, and you type its
URL into your browser. Your computer then makes contact with the server
that hosts the web page, requesting to connect to it. The server sends back a
message accepting the request. Your computer acknowledges this acceptance,
after which a connection is established, as shown in Figure 2.10.
Figure 2.10 Establishing a connection
2.3 Internet protocols
81
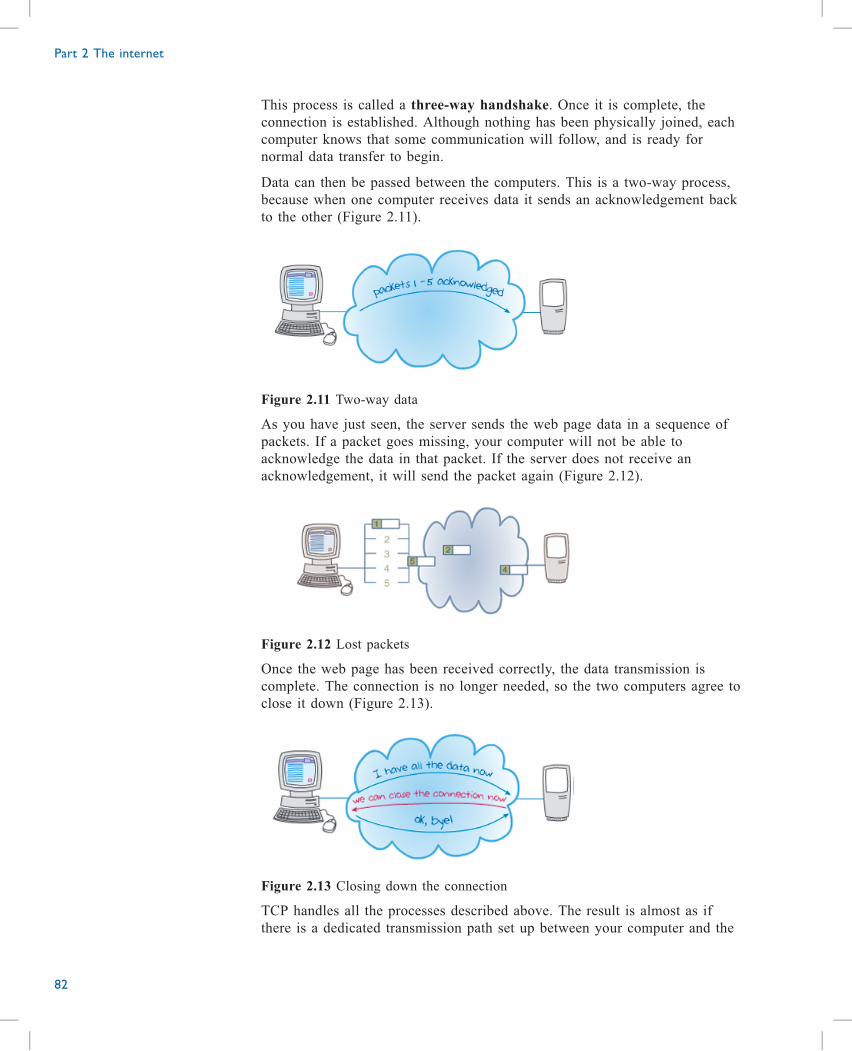
This process is called a three-way handshake. Once it is complete, the
connection is established. Although nothing has been physically joined, each
computer knows that some communication will follow, and is ready for
normal data transfer to begin.
Data can then be passed between the computers. This is a two-way process,
because when one computer receives data it sends an acknowledgement back
to the other (Figure 2.11).
Figure 2.11 Two-way data
As you have just seen, the server sends the web page data in a sequence of
packets. If a packet goes missing, your computer will not be able to
acknowledge the data in that packet. If the server does not receive an
acknowledgement, it will send the packet again (Figure 2.12).
Figure 2.12 Lost packets
Once the web page has been received correctly, the data transmission is
complete. The connection is no longer needed, so the two computers agree to
close it down (Figure 2.13).
Figure 2.13 Closing down the connection
TCP handles all the processes described above. The result is almost as if
there is a dedicated transmission path set up between your computer and the
Part 2 The internet
82
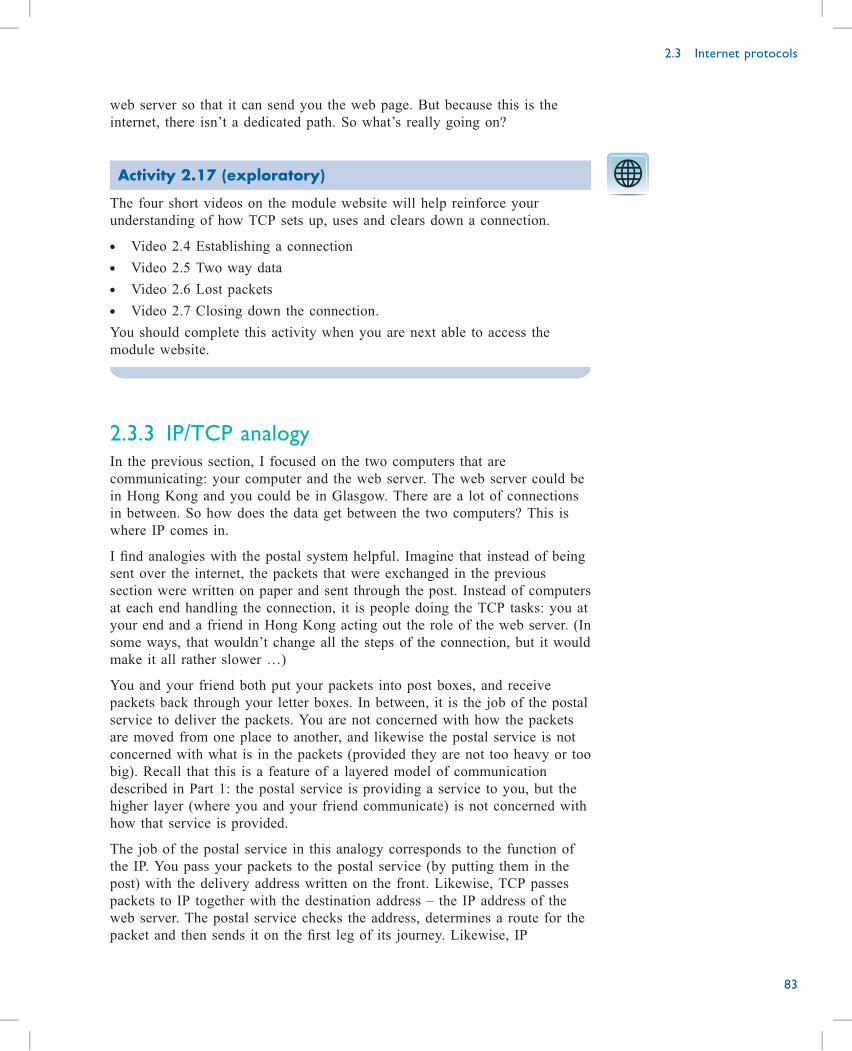
web server so that it can send you the web page. But because this is the
internet, there isn’t a dedicated path. So what’s really going on?
Activity 2.17 (exploratory)
The four short videos on the module website will help reinforce your
understanding of how TCP sets up, uses and clears down a connection.
. Video 2.4 Establishing a connection
. Video 2.5 Two way data
. Video 2.6 Lost packets
. Video 2.7 Closing down the connection.
You should complete this activity when you are next able to access the
module website.
2.3.3 IP/TCP analogyIn the previous section, I focused on the two computers that are
communicating: your computer and the web server. The web server could be
in Hong Kong and you could be in Glasgow. There are a lot of connections
in between. So how does the data get between the two computers? This is
where IP comes in.
I find analogies with the postal system helpful. Imagine that instead of being
sent over the internet, the packets that were exchanged in the previous
section were written on paper and sent through the post. Instead of computers
at each end handling the connection, it is people doing the TCP tasks: you at
your end and a friend in Hong Kong acting out the role of the web server. (In
some ways, that wouldn’t change all the steps of the connection, but it would
make it all rather slower …)
You and your friend both put your packets into post boxes, and receive
packets back through your letter boxes. In between, it is the job of the postal
service to deliver the packets. You are not concerned with how the packets
are moved from one place to another, and likewise the postal service is not
concerned with what is in the packets (provided they are not too heavy or too
big). Recall that this is a feature of a layered model of communication
described in Part 1: the postal service is providing a service to you, but the
higher layer (where you and your friend communicate) is not concerned with
how that service is provided.
The job of the postal service in this analogy corresponds to the function of
the IP. You pass your packets to the postal service (by putting them in the
post) with the delivery address written on the front. Likewise, TCP passes
packets to IP together with the destination address – the IP address of the
web server. The postal service checks the address, determines a route for the
packet and then sends it on the first leg of its journey. Likewise, IP
2.3 Internet protocols
83
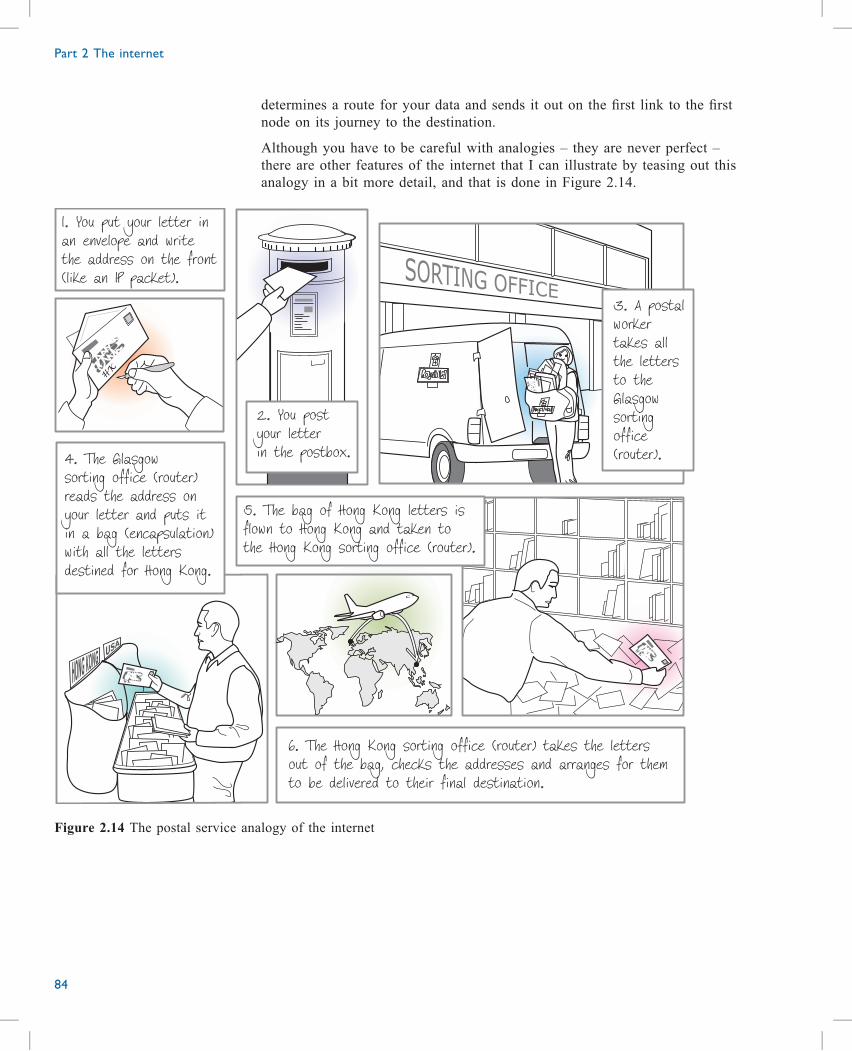
determines a route for your data and sends it out on the first link to the first
node on its journey to the destination.
Although you have to be careful with analogies – they are never perfect –
there are other features of the internet that I can illustrate by teasing out this
analogy in a bit more detail, and that is done in Figure 2.14.
2. You postyour letterin the postbox.
l. You put your letter inan envelope and writethe address on the front(like an IP packet).
4. The Glasgowsorting office (router)reads the address onyour letter and puts itin a bag (encapsulation)with all the lettersdestined for Hong Kong.
5. The bag of Hong Kong letters isflown to Hong Kong and taken tothe Hong Kong sorting office (router).
6. The Hong Kong sorting office (router) takes the lettersout of the bag, checks the addresses and arranges for themto be delivered to their final destination.
3. A postalworkertakes allthe lettersto theGlasgowsortingoffice(router).
Figure 2.14 The postal service analogy of the internet
Part 2 The internet
84
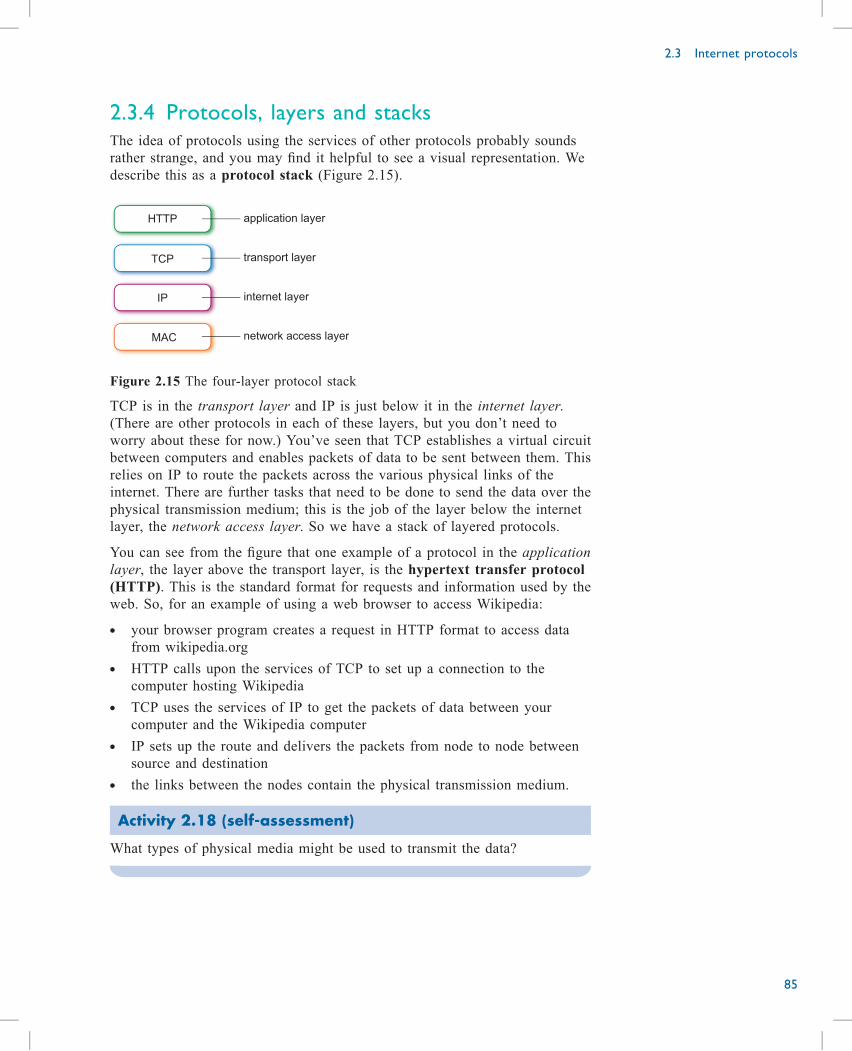
2.3.4 Protocols, layers and stacksThe idea of protocols using the services of other protocols probably sounds
rather strange, and you may find it helpful to see a visual representation. We
describe this as a protocol stack (Figure 2.15).
HTTP application layer
transport layer
internet layer
network access layer
TCP
IP
MAC
Figure 2.15 The four-layer protocol stack
TCP is in the transport layer and IP is just below it in the internet layer.
(There are other protocols in each of these layers, but you don’t need to
worry about these for now.) You’ve seen that TCP establishes a virtual circuit
between computers and enables packets of data to be sent between them. This
relies on IP to route the packets across the various physical links of the
internet. There are further tasks that need to be done to send the data over the
physical transmission medium; this is the job of the layer below the internet
layer, the network access layer. So we have a stack of layered protocols.
You can see from the figure that one example of a protocol in the application
layer, the layer above the transport layer, is the hypertext transfer protocol
(HTTP). This is the standard format for requests and information used by the
web. So, for an example of using a web browser to access Wikipedia:
. your browser program creates a request in HTTP format to access data
from wikipedia.org
. HTTP calls upon the services of TCP to set up a connection to the
computer hosting Wikipedia
. TCP uses the services of IP to get the packets of data between your
computer and the Wikipedia computer
. IP sets up the route and delivers the packets from node to node between
source and destination
. the links between the nodes contain the physical transmission medium.
Activity 2.18 (self-assessment)
What types of physical media might be used to transmit the data?
2.3 Internet protocols
85
Activity 2.19 (self-assessment)
The following statements apply to either TCP or IP. Select the correct option
in each case (either IP or TCP).
1 It sets up connections in order to send data between two computers.
2 It operates in the internet layer.
3 It addresses packets and routes them across networks.
4 It operates in the transport layer.
5 It deals with missing packets.
User datagram protocol (UDP)
User datagram protocol (UDP) is used in place of TCP by some
applications. UDP is actually a simpler protocol than TCP, because it doesn’t
set up connections and doesn’t do anything about missing packets. All it does
is send single packets from one computer to another with no regard to what
was sent before or will be sent after. Because it is simpler than TCP, there is
less delay involved in using it; it is therefore employed instead of TCP for
time-critical applications, such as when live video or audio is being sent
across the internet. The disadvantage of using UDP is that because it does not
use a mechanism to acknowledge packets, there is no re-transmission in the
event of packet loss. For this reason, UDP is called connectionless and relies
upon higher-layer protocols to sort out the consequences when packets are
lost.
We have met the term ‘connection’ many times in this part, and a connection
is normally established between two end points to allow communication. If a
physical connection is established, such as in a traditional telephone call or if
you join two computers together with a cable, then all of the communication
takes place without any loss of data. TCP provides a virtual circuit which, to
a computer, looks like the same service as a physical connection and is
therefore often called connection-oriented, or is said to provide a
connection-oriented service. UDP is called connectionless (provides a
connectionless service) because it does not guarantee the delivery of all
packets that make up a complete data exchange.
Activity 2.20 (self-assessment)
Given that UDP can be used in place of TCP, what layer does it operate in:
application, transport, internet or network access?
Ethernet addresses, otherwise known as media access control (MAC)
addresses, are used at the network access layer of the four-layer IP/TCP
protocol stack. These addresses are used by switches to forward packets
within a LAN until they reach a router where IP addresses take over. We do
not cover Ethernet addressing in any more detail in this module.
Part 2 The internet
86
Now that we have been introduced to protocols at each of the four layers of
the TCP/IP protocol stack, we will consider how encapsulation works in
practice for a simple connection as shown in Figure 2.16.
www.open
www.open
www.open
www.open
tcp
www.open tcp
tcp ip
www.open tcp ip
tcp ip mac
www.open tcp ip mac www.open tcp ip mac
www.open
www.open
www.open
www.open
tcp
tcp ip
tcp ip mac
internet
R1 R2
Figure 2.16 Encapsulation
User data (a request for a web page) is first given a HTTP header at the
application layer. This header will enable the packet to be read by the web
server at the destination. This packet is then encapsulated and given a TCP
header (transport layer) which includes a port number. A port number (not
to be confused with the physical port on a router) is used by TCP to identify
all of the packets associated with a particular communication session – so,
for example, port 80 is used to identify packets associated with a web page.
It is in this way that the TCP header ensures that this packet, and any
subsequent ones that are part of the same session, are delivered because all
packets associated with this web transaction will have the same port number.
Another header (internet layer) is now added, containing the IP address of the
destination, and another header (network access layer) is added, containing
the Ethernet address of the gateway router. As I have stated before, source
addresses are also included in the headers for use when replying.
Activity 2.21 (self-assessment)
Match each of the following sentences to the most appropriate layer of the
protocol stack.
1 Used to route packets across the internet.
2 Used to route packets within the local network.
3 Delivers all the packets associated with a session.
4 Looks after the application.
When the packet reaches the distant router, it needs a new Ethernet address
to reach the web server. This is added by the router and is necessary as end
devices all have unique Ethernet addresses.
2.3 Internet protocols
87
2.3.5 ConclusionIn this section, we have looked at the use of IP addresses and the associated
TCP/IP protocols. After studying this section, you should be able to identify
the different roles of TCP and IP, and explain how they work together, use
the concept of a protocol stack to visualise the relationship between
protocols, and understand IPv4 addresses and be able to convert from denary
to binary.
Part 2 The internet
88
Providing services using protocols
Protocols are an essential part of how the internet is designed and operates,
and they crop up in all sorts of places. In some ways, they are the key to the
success of the internet – and networking generally. This is because, by
introducing new (or updates to existing) protocols, they have allowed
developments to take place. These developments have been designed to slot
into the existing protocol stack and work with the existing protocols above
and below them.
Activity 2.22 (exploratory)
Before IPv6, all packets were routed in the internet using IPv4 (or just IP as
it was called then). How has having an established protocol stack allowed
IPv6 to be integrated into the existing network architecture?
CommentIPv4 operates at the internet layer. It works with transport layer protocols
such as TCP above it, and with network layer protocols such as Ethernet
below. By positioning IPv6 at the same layer as IPv4, all designers had to do
was ensure that it could cooperate with any existing protocols in either the
network or transport layer to ensure it could support existing services. There
was no need to worry specifically about the application layer, as the transport
layer takes care of this.
This is in direct contrast to the telephone network, which has had to go
through many significant transitions in its history, all of which have required
a large-scale replacement of existing technology with new technology. In fact,
the latest-generation telephone network is itself based upon packet technology
using special protocols.
In this section, I am going to introduce you to two protocols that have been
provided on the internet to overcome problems or meet new demands:
. network address translation (NAT) – helping with a shortage of IP
addresses
. dynamic host configuration protocol (DHCP) – the allocation of IP
addresses for temporary access.
You should recall that when I discussed IP addresses in Section 2.2, I said
that there is a shortage of IPv4 addresses. Changing to IPv6 will solve that,
but it is taking a long time to make the transition. In the meantime, certain
techniques are used that to some extent overcome this problem. They are
NAT and DHCP, and they reduce the number of unique IP addresses required.
2.4 Providing services using protocols
89
2.4
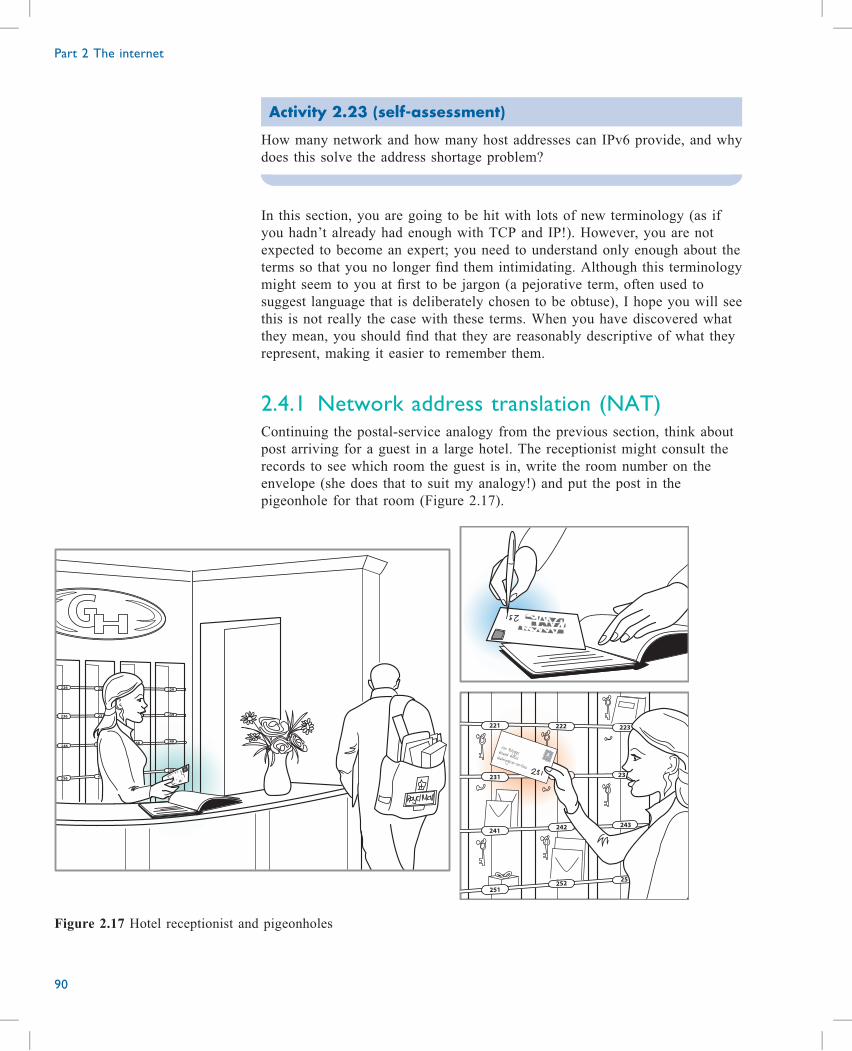
Activity 2.23 (self-assessment)
How many network and how many host addresses can IPv6 provide, and why
does this solve the address shortage problem?
In this section, you are going to be hit with lots of new terminology (as if
you hadn’t already had enough with TCP and IP!). However, you are not
expected to become an expert; you need to understand only enough about the
terms so that you no longer find them intimidating. Although this terminology
might seem to you at first to be jargon (a pejorative term, often used to
suggest language that is deliberately chosen to be obtuse), I hope you will see
this is not really the case with these terms. When you have discovered what
they mean, you should find that they are reasonably descriptive of what they
represent, making it easier to remember them.
2.4.1 Network address translation (NAT)Continuing the postal-service analogy from the previous section, think about
post arriving for a guest in a large hotel. The receptionist might consult the
records to see which room the guest is in, write the room number on the
envelope (she does that to suit my analogy!) and put the post in the
pigeonhole for that room (Figure 2.17).
226
236
246
256
222
237
257
248
229
239
249
259
Joe BloggsGrand HotelWalmington-on-Sea
1 st
221 222 223
231
241242 243
251
25225
23
Figure 2.17 Hotel receptionist and pigeonholes
Part 2 The internet
90
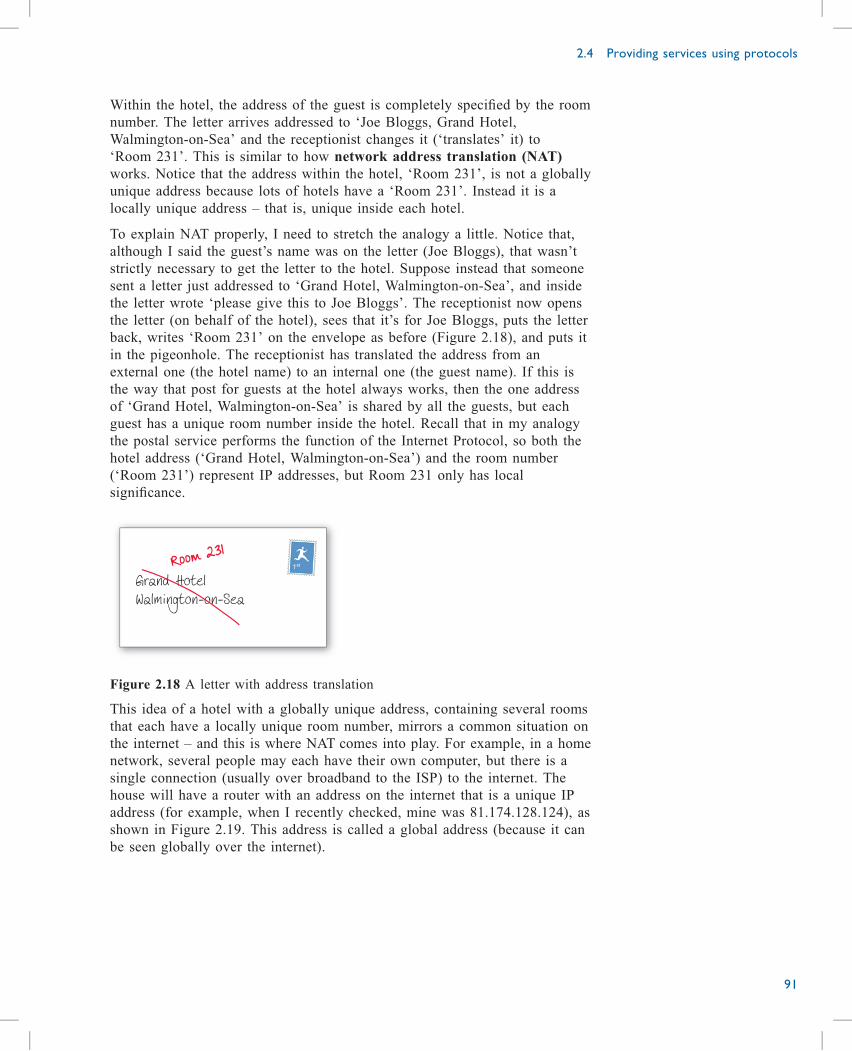
Within the hotel, the address of the guest is completely specified by the room
number. The letter arrives addressed to ‘Joe Bloggs, Grand Hotel,
Walmington-on-Sea’ and the receptionist changes it (‘translates’ it) to
‘Room 231’. This is similar to how network address translation (NAT)
works. Notice that the address within the hotel, ‘Room 231’, is not a globally
unique address because lots of hotels have a ‘Room 231’. Instead it is a
locally unique address – that is, unique inside each hotel.
To explain NAT properly, I need to stretch the analogy a little. Notice that,
although I said the guest’s name was on the letter (Joe Bloggs), that wasn’t
strictly necessary to get the letter to the hotel. Suppose instead that someone
sent a letter just addressed to ‘Grand Hotel, Walmington-on-Sea’, and inside
the letter wrote ‘please give this to Joe Bloggs’. The receptionist now opens
the letter (on behalf of the hotel), sees that it’s for Joe Bloggs, puts the letter
back, writes ‘Room 231’ on the envelope as before (Figure 2.18), and puts it
in the pigeonhole. The receptionist has translated the address from an
external one (the hotel name) to an internal one (the guest name). If this is
the way that post for guests at the hotel always works, then the one address
of ‘Grand Hotel, Walmington-on-Sea’ is shared by all the guests, but each
guest has a unique room number inside the hotel. Recall that in my analogy
the postal service performs the function of the Internet Protocol, so both the
hotel address (‘Grand Hotel, Walmington-on-Sea’) and the room number
(‘Room 231’) represent IP addresses, but Room 231 only has local
significance.
Grand HotelWalmington-on-Sea
Room 2311st
Figure 2.18 A letter with address translation
This idea of a hotel with a globally unique address, containing several rooms
that each have a locally unique room number, mirrors a common situation on
the internet – and this is where NAT comes into play. For example, in a home
network, several people may each have their own computer, but there is a
single connection (usually over broadband to the ISP) to the internet. The
house will have a router with an address on the internet that is a unique IP
address (for example, when I recently checked, mine was 81.174.128.124), as
shown in Figure 2.19. This address is called a global address (because it can
be seen globally over the internet).
2.4 Providing services using protocols
91
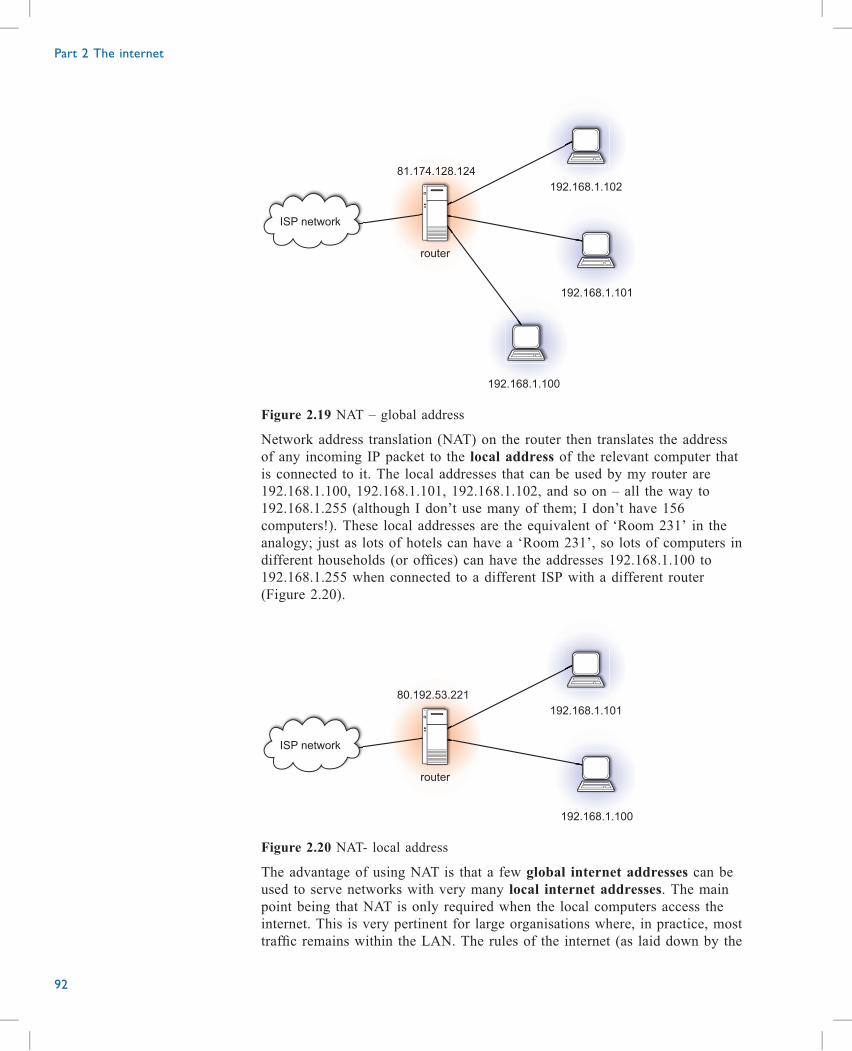
router
81.174.128.124
192.168.1.102
192.168.1.101
192.168.1.100
ISP network
Figure 2.19 NAT – global address
Network address translation (NAT) on the router then translates the address
of any incoming IP packet to the local address of the relevant computer that
is connected to it. The local addresses that can be used by my router are
192.168.1.100, 192.168.1.101, 192.168.1.102, and so on – all the way to
192.168.1.255 (although I don’t use many of them; I don’t have 156
computers!). These local addresses are the equivalent of ‘Room 231’ in the
analogy; just as lots of hotels can have a ‘Room 231’, so lots of computers in
different households (or offices) can have the addresses 192.168.1.100 to
192.168.1.255 when connected to a different ISP with a different router
(Figure 2.20).
router
80.192.53.221
192.168.1.101
192.168.1.100
ISP network
Figure 2.20 NAT- local address
The advantage of using NAT is that a few global internet addresses can be
used to serve networks with very many local internet addresses. The main
point being that NAT is only required when the local computers access the
internet. This is very pertinent for large organisations where, in practice, most
traffic remains within the LAN. The rules of the internet (as laid down by the
Part 2 The internet
92
Internet Engineering Task Force in RFCs) reserve some addresses to be used
only as local addresses. That is the case for 192.168.1.100, 192.168.1.101,
192.168.1.102, etc. They are for use only ‘inside’ local networks; they are
not allowed to be used as addresses in the global IP network, and because of
NAT can be used by many different local networks at the same time.
Activity 2.24 (exploratory)
Briefly explain how NAT has helped extend the time before IPv4 addresses
run out.
CommentEvery end device that connects to the internet has to have a unique address.
So if you have 10 000 end devices in a LAN, without NAT you would need
10 000 different IP addresses that could be used on the internet. If the use of
a LAN is such that normally only 100 users are connected to the internet at
one time (all the others are connected to others within the LAN or offline),
then, using NAT, only 100 addresses are needed, and these can be shared on
an ‘as needed’ basis. In the language of NAT, you would need 100 global
internet addresses and 1000 local addresses: a saving of 900 internet
addresses.
2.4.2 Dynamic host configuration protocol
(DHCP)Returning to the hotel analogy, when a guest arrives at the hotel, the
receptionist allocates them a room, and in doing so allocates them a local
address (like ‘Room 231’). Within the internet, this is the job of the dynamic
host configuration protocol (DHCP). In my home network, when a
computer in my house is connected to the router, a program in the router runs
DHCP, which temporarily assigns a local IP address to that computer.
DHCP also has another role; one that helps to reduce the number of unique
IP addresses required. Customers of ISPs are not all connected to the internet
at the same time, and so an ISP doesn’t have IP addresses permanently
allocated to every one of its customers. Instead, it has a pool of addresses
available and allocates one to each customer (or their home network) each
time they need to access the internet. That way, the ISP can have fewer
addresses than customers, as long as it has enough for the maximum number
of customers who might connect simultaneously. Normally, an ISP will
allocate the same address to a particular customer; in fact, it will not remove
it unless it is needed elsewhere. The allocation of addresses to customers is
handled by DHCP. In this case, though, the allocated IP addresses are visible
to the internet – they are not local addresses.
2.4 Providing services using protocols
93
Activity 2.25 (self-assessment)
Explain briefly why the addresses allocated by DHCP are not local addresses
as in NAT.
DHCP is also widely used in LANs where individual PCs can be
automatically allocated an IP address without the intervention of qualified
staff such as IT support teams. Allocation in this way is a default, using
DHCP for what is called ‘automatic IP address configuration’. These
addresses will remain once allocated, unless there is some major changes to
the design of the network where the PC is connected. A great deal of work,
in the form of manual intervention, is saved if automatic IPv4 address
configuration is used for every end device that has DHCP enabled. Imagine
the amount of time it would take if, every time you connected a new device
to the network, or moved a device, you had to manually enter the IP address
and other related parameters. Multiply that by every user and every device in
an organisation and you see the problem. Manual configuration also increases
the chance of misconfiguration by duplicating another device’s IP address.
Activity 2.26 (exploratory)
Why do you think manual configuration of IP addresses on a PC is more
likely to result in errors?
CommentTo manually configure a PC with an IP address, it is necessary to enter the
address in full in the appropriate field. Like all computer commands, the
address needs to be entered correctly, including any delimiting dots. It is
surprisingly easy to make a mistake, especially by entering a correctly
formatted address with one character changed. In this case, there could be
two PCs with the same IP address.
A Windows PC normally has the default settings ‘Obtain an IP address
automatically’ and ‘Obtain DNS server address automatically’. This enables
your PC to search out a DHCP server and be assigned the address settings
necessary to communicate on the network. It is possible to display the IP
configuration settings on a Windows PC by using the ipconfig command at
the command prompt. The output will show the IP address and gateway
information received from the DHCP server.
Part 2 The internet
94
2.4.3 ConclusionIn this section, we looked at NAT and DHCP as examples of protocols that
provide specific services using TCP/IP. After studying this section, you
should be able to understand the principles used by NAT to use global and
local IP addresses, describe how DHCP is used to provide end users with IP
addresses in home and LAN-connected PCs, and explain how adding
additional protocols, such as IPsec, can provide a secure connection over the
insecure internet.
2.4 Providing services using protocols
95
Network security
The increase in computer use has brought us many benefits. However,
increase in usage has led to many challenges as well, and perhaps the one
that is most prevalent at the time of writing is security.
Activity 2.27 (exploratory)
Which aspects of computer security that you may have heard about in the
news gives you the most concern?
CommentI am concerned about people accessing my bank account and stealing my
money in a way that may make it difficult for me to persuade the bank to
refund the loss.
Access to newspaper resources (optional)
If you would like to have access to newspaper resources through the Library,
you could run a search on a newspaper database called Nexis UK. A link to
the ‘searching online newspapers’ activity can be found on the module
website.
Banking fraud of one kind or another often makes the news, and it can be
very disturbing when we hear of situations where people lose large sums of
money and struggle to persuade the banks that they were not at fault. This is
often made more complicated when people are caught by some sort of scam
where they are persuaded to give away important security information. It is
this combination of technology and human users that can often challenge
those who are trying to protect us from computer fraud.
Although I have chosen to highlight banking fraud, as it is newsworthy, there
are many ways in which those who wish to do us harm can try to access or
disrupt our computer accounts or the communication links that connect them.
Computer and communication engineers and scientists have always been
aware of the potential vulnerability of computer communications from its
outset, and you should not be surprised to learn that they have been building
in defences against attack from the beginning. It is the ubiquity of computers
that means that many of these security applications are invisible to the user;
this does not mean that they all are, and passwords are a clear example of
this.
In this section, I am going to look at examples of some techniques used by
networking engineers to provide security by controlling network traffic. I will
start by looking at firewalls, which most people will have heard of and have
some knowledge of. Then I will introduce access control lists, which you are
unlikely to have met unless you have prior experience in networking.
Part 2 The internet
96
2.5
2.5.1 FirewallsReturning to my hotel analogy, if the receptionist in the hotel opens all the
letters in order to find out which guest (room number) to address them to, he
could also censor the post! You may recall from ‘Warriors of the Net’ that
this is essentially what a firewall on a network does. It looks inside IP
packets on their way both in and out of a network (in the analogy, that means
the receptionist censors the outgoing post as well as the incoming post) and
decides whether to let them through or stop them.
The term firewall itself originates from an analogy that is drawn with
physical firewalls which are included in a building to stop the spread of fire.
For example, it is now necessary to have a firewall between each house in a
terrace from floor to roof. Some older properties did not have firewalls in the
attic space, and this allowed a fire in one property to easily spread along the
whole block. Firewalls can be provided between two or more networks and
are used to prevent unauthorised or undesirable traffic going from one
network to another. Sometimes this unwanted traffic is potentially malicious
or suspect. It can be a type that the owner of one network does not wish to
receive, or the firewall could simply be used to reduce the quantity of traffic
entering a network from outside. It is generally accepted that a firewall is one
of the most effective security tools available for protecting users from
external threats.
Activity 2.28 (exploratory)
In the home, it is very likely that both the broadband hub and your computer
have firewalls, and you as a user are offered different levels of security. In a
family home, what sort of controls might you wish to have?
CommentIf there are children using the internet, then it would be desirable to prevent
them from accessing undesirable sites – for example, those containing adult
content, those allowing gambling and even some social media sites. This is
the type of terminology commonly used, which identifies the content to be
stopped in terms that we can all understand. As we will see later, firewalls in
networks use more technical language that is understood by network
engineers. It is often the case that home networks are less well protected than
corporate ones as they employ professionals to manage their firewalls.
Firewalls are normally placed between a secure part of the network and the
less secure part – the latter often being the internet. This can be seen in
Figure 2.21 in which the firewalls are between a home network and a
corporate network, each containing a router of some sort on the edge of the
network.
2.5 Network security
97
homecomputer
home hub
firewall
firewall
gateway router
internet
Figure 2.21 Firewall placement
In practice, firewalls are normally incorporated within other networking
devices or end computers and are respectively referred to as network or host-
based firewalls. In most cases, the firewall is implemented in software within
another device – in a PC, for example – so there is nothing physical to see.
However, in larger networks there is so much work for a firewall to do that a
computer will be dedicated to this function, and a firewall can be clearly
seen. In our example in Figure 2.21 the most likely location for the firewall
will be in the user’s computer in the home network and integrated in the
router on the edge of the corporate network.
Unlike the original brick firewall built into houses, where the function was to
keep fire out, firewalls in networks are set up to decide to allow certain
messages to pass while blocking others. Firewalls use various techniques for
determining what is permitted or denied access to a network. These
techniques include:
. packet filtering – prevents or allows access based on IP or MAC
addresses
. application filtering – prevents or allows access by specific application
types based on port numbers – for example, those included in TCP
headers
. URL filtering – prevents or allows access to websites based on specific
URLs or keywords.
When we looked at encapsulation earlier, I concentrated mainly on source
and destination addresses contained with packet headers. However, packet
headers also contain many different types of information about the data they
carry – for example, the port numbers used by TCP to identify all the packets
associated with a single transaction. Packet and application filtering both use
information contained within the header of the packet to identify content that
is either allowed or barred from passing.
All packets coming from the internet include a source and destination IP
address, and either or both can be selected for filtering. For example, as the
owner of a corporate network I may wish to allow access to a particular
server (destination address for incoming packets) from trusted users (source
address) only. I can then bar traffic from all other sources heading for that
server, yet still allow access to other servers for packets with those source
addresses.
Part 2 The internet
98
Activity 2.29 (exploratory)
If I only allow access to a particular server from a list of trusted IP source
addresses, why is it possible for those same source addresses to gain access
to other servers?
CommentIn this example, it is the combination of source and destination address that
determines if a particular packet is blocked, and not source alone. So, in this
case, the firewall first looks at the destination address. If it is the address of
the server with restricted access, it then proceeds to see if the source address
is permitted – and if it is, it forwards the packet. Otherwise the packet is
dropped. If the destination address is not one it needs to filter, then the
packet can be forwarded to the destination without further checking of the
source. Filtering based on combinations of source and destination addresses is
a flexible way of filtering traffic.
As I stated earlier, as well as containing IP addresses, IP packets also hold
some details of the contents of the packet, and an example of this content
would be applications being carried as data in the payload. Application
filtering works in a similar way to packet filtering and uses the application
protocol as a means of filtering. For example, ping packets, which are used to
trace routes across the internet, can be identified because their internet control
message protocol (ICMP) is labelled in the packet header; so these can be
easily identified and blocked.
It is also possible to combine filters by looking for combinations of address
and application protocols to provide more fine-grained filtering. Filtering can
be further refined by allowing (permit) or not allowing (deny), as I explained
for packet filtering above.
URL filtering is targeted at web traffic and uses the URL held in the packet
header to block or allow traffic from a particular website. This can be used to
stop people inside a network from accessing certain web pages, as even if
they are able to send a request, nothing is returned.
Activity 2.30 (exploratory)
In the last example, traffic is blocked when returning from the website by
filtering the URL. What is the problem with doing it this way?
CommentIn terms of achieving the desired result, filtering based upon the returned
packet returns the desired outcome; the packet is blocked. However, would it
not be better to block the request before it leaves the source network, rather
than waiting for the request to be sent all the way to the destination and a
reply returned? So as well as deciding what to filter, it is important to decide
where to filter.
2.5 Network security
99
URL filtering can be used to stop employees from accessing sites not
appropriate to their work and can also be used to provide some degree of
protection to vulnerable individuals; this may be how your home network
guards against access to gambling sites, for example. Again, URL filtering
can be combined with packet and application filtering to give a fine-grained
filter.
The settings that provide the required security on firewalls have to be
implemented automatically, semi-automatically or manually. On a home
computer, often the security is set by default – for example, by the Windows
operating system. Alternatively, if you choose to operate the protection
options on your home hub, you can select from a range of options which then
set the filtering to the desired standard; this is semi-automatic. You can, if
you wish, and are suitably well informed, set your own security options,
although usually only within defined boundaries. The same three options are
available for the enterprise firewall; however, in these cases there is more
likely to be manual set-up carried out by experienced network engineers. We
often refer to the chosen set-up as security policies.
2.5.2 Access control listAs we have seen above, firewalls are used to protect networks from
unauthorised use by implementing software and hardware solutions to achieve
the chosen security policies. It is also possible to implement simple firewalls
on most routers (and some switches) to provide basic traffic filtering using
access control lists (ACLs). The application of ACLs within a network will
provide security by limiting access into and within a network primarily based
upon IP addresses and protocol type. The principles of filtering are the same
as filtering in the firewall; it is just that with ACLs, because we do not need
a dedicated firewall, it is possible to place the filtering at many different parts
of the network, and therefore filter traffic as close to the source as possible –
thus keeping wasted network traffic to a minimum.
A simple network is shown in Figure 2.22 in which ACLs are applied to stop
anyone outside of the network from sending ‘ping’ messages and blocking
students from accessing the faculty (an area reserved for teachers).
Part 2 The internet
100
R1ACL 1
ACL 3ACL 2
R2
SW SW
faculty LAN
192.100.20.0
student LAN
192.100.10.0
AC
AC
R3
internet
Figure 2.22 Network with ACLs
Two ACLs are shown in Figure 2.22: one on the gateway router R1 where it
accesses the internet, and one on the Faculty router R2. ACL 1 has been
placed to stop anyone from sending a ping command into the network. Ping
is a tool that was developed to allow engineers to test connectivity by
searching for a given IP address. Unfortunately, ping can be used maliciously
to overload a network in what is called a denial of service attack. It is
therefore common practice to block from entering a corporate network the
ICMP protocol which carries ping.
ACLs are written as a series of statements called a list, and each statement is
written on a separate line. The list is read from top to bottom, with each line
being executed before moving onto the next. As you will have seen earlier in
this module, lists are a simple type of program and are easily read and
understood by a router. A suitable list of statements to block pings in ACL 1
would be:
Access list ping – deny any ICMP
Access list ping – permit any
There are two lines in this ACL, and each is read in turn to determine the
overall action, which is to block IP packets that contain the ICMP protocol.
Each ACL has to have a name, which in this example is ping. The deny
statement means that traffic will be blocked; the any statement means it is
applied to all IP addresses which contain the ICMP protocol. The second line
will permit any other traffic.
Reading through each statement more slowly helps us understand how a
router uses the ACL. An ACL is written into a router using a programming
area called the command line, and this area is used to program many other
functions into a router, so the words ‘access list’ clearly identify this
instruction as one that applies to access control lists. The name ‘ping’ must
be unique on each router, and allows the router to recognise all of the
2.5 Network security
101
statements associated with a particular list. Note that each statement begins
with the name. The second part of each statement (after the dash) contains
three parts: an action (deny or permit), an IP address (in the example, any =
all IP addresses) and a protocol. The first line of the list reads: deny any IP
address that contains the protocol ICMP. The second line reads: permit any IP
address with any protocol. The missing protocol just means it will accept any
protocol. All ACLs must finish with an explicit ‘permit any’ command,
otherwise all other traffic is denied.
ACL 2 is applied to the router on the edge of the Faculty network to stop
students from gaining access to computers used by the teaching staff (for
example, to protect things such as exam papers or grades). In this example,
the ACL would be:
Access list student – deny 192.100.10.0
Access list student – permit any
In this ACL, we are looking to block access based upon the source address,
rather than a protocol, so we specify the address in full (192.100.10.0) and
we do not need to specify a protocol. Again, we have to add the ‘permit any’
command to allow other legitimate traffic. In this example, no students can
access the Faculty network, but both Faculty and Student users can access the
internet, and Faculty staff can access the Student network.
Activity 2.31 (self-assessment)
Write a two-line ACL for ACL 1 which stops students sending files (file
transfer) to the internet using the FTP (file transfer) protocol. In an ACL, the
letters FTP can be used to identify the FTP protocol.
As we have seen in the examples above, an ACL is written as a sequential
list of statements that checks the IP address or protocol (or both) of the
traffic being tested. Each statement in the list is read one at a time from top
to bottom until a match is found between the address/protocol that is being
checked and the one in the ACL. The writing of ACLs and their execution
has many parallels with a simple computer program. ACLs can be much
more complicated than those we have looked at here, with many in common
use containing 10 or more lines. They can also filter both source and
destination addresses in the same line as well as handling a wide range of
protocols.
2.5.3 ConclusionIn this section, we have looked at firewalls and ACLs as examples of
techniques that can be used to provide security on networks. After studying
this section, you should be able explain where firewalls can be applied, and
give examples of ways in which data is filtered and how simple access
control lists are written.
Part 2 The internet
102
Summary
In this part of Block 3 we have looked at the internet. This part builds on the
teaching around networks given in the previous part and looks in detail at the
key technologies that enable the internet to be built and operated. We have
looked at routing and switching, packets, IP addressing, TCP and other
important protocols, and looked briefly at network security.
After studying this part you should be able to:
. explain how packets are used in switches and routers
. explain the different formats for IP addresses
. convert between binary, denary and hexadecimal representations of IP
addresses
. describe the ‘three-way handshake’ used by TCP
. understand more about layers and give examples of protocols used at each
layer
. explain how network address translation (NAT) is used
. describe how security is provided by firewalls and access control lists
(ACLs).
Summary
103
Answers to self-assessment activities
Activity 2.2A switch has many ports and forwards packets using Ethernet addresses. A
router uses IP addresses to forward packets.
Activity 2.4Each packet header contains the destination IP address. The router uses this
address to choose between the different links it has to other parts of the
network, which allows the packet to eventually reach the correct destination.
Activity 2.7The web server has the IP address for PC1 and it uses this as the destination
address in the header of the IP packets in sends to PC1. This is the first
encapsulation. To reach the router (R2), the IP packet needs to be further
encapsulated and an Ethernet address added. This is the second encapsulation.
When the IP packet gets to R2, the Ethernet packet is unpacked, and the IP
packet is used to route across the intermediate network.
Activity 2.9Each computer connected to the internet can be uniquely identified by its IP
address. This means that any computer can find any other computer if the IP
address of the destination is known. Routers use IP addresses to forward
packets towards their destination.
Activity 2.13212.44.110.172 = 11010100.00101100.01101110.10101100
I showed you how to work out 212 earlier. Taking 44 next.
44 – 128 : 128 is bigger than 44, so we write 0
44 – 64 : 64 is bigger than 44, so we write 0
44 – 32 = 12 : we write 1
12 – 16 : 16 is bigger than 12, so we write 0
12 – 8 = 4 : we write 1
4 – 4 = 0 : we write 1
0 – 2 : 2 is bigger than 0, so we write 0
0 – 1 : 1 is bigger than 0, so we write 0
Part 2 The internet
104
Reading from top to bottom, we get: 00101100.
You can follow the same method for 110 and 172. You can also use one of
the many denary to binary converters available on the internet, but it is worth
being able to work out denary conversion for up to 8 bits manually.
Activity 2.15There are 8 bits in each byte, so there are 16 × 8 = 128 bits in each IPv6
address.
Activity 2.16Just as with the IPv4 address, the answer is found by raising 2 to the power
of the total number of bits. An incredibly difficult calculation if you had to
do it by hand, but straightforward using a calculator if you set it out first. We
know that 22 = 4 and 24 = 16. For IPv6, there are 128 bits, so the answer is
2128 = 3.4 × 1038.
Activity 2.18Optical fibre, electrical wires or a wireless signal.
Activity 2.19TCP, IP, IP, TCP and TCP.
Activity 2.20The transport layer, above IP which looks after routing and below the
application.
Activity 2.21This answer is given as the layers are found in the protocol stack.
The application layer (4) looks after the application; the transport layer (3)
delivers all the packets associated with a session; the internet layer (1) is
used to route packets across the internet; and the network access layer (2) is
used to route packets within the local network.
Activity 2.23IPv6 addresses are significantly longer than IPv4 and therefore have the
potential to provide many more addresses – so many, in fact, that it is not
anticipated that the address space will ever run out.
Answers to self-assessment activities
105
IPv6 addresses are 128 bits long, and are divided in equal parts for network
and host addresses – that is, 64 bits for each. This means that there are
264 = 18.4 × 10¹⁸ addresses for networks, each of which can have
18.4 × 10¹⁸ hosts.
Activity 2.25In both DHCP and NAT, addresses are allocated on a needs basis. However,
in DHCP there is no address translation, so once an ISP has assigned an
address to a particular device, it no longer interferes with the IP number, so
the device uses this number to connect to the internet.
Activity 2.31Access list FTP – deny 192.100.10.0 & FTP
Access list FTP – permit any
In this example, the ACL uses both the IP address of the network and the
FTP protocol to stop students transferring files.
Part 2 The internet
106
References
Internet Society (2016) Global Internet Report 2016 [Online]. Available at
https://www.internetsociety.org/globalinternetreport/2016/?
gclid=CJfllZKe5dQCFca77QodosgMbw (accessed 10 October 2017).
Internet world statistics (n.d) [Online]. Available at http://www.
internetworldstats.com/ (accessed 10 October 2017).
References
107
Acknowledgements
Grateful acknowledgement is made to the following sources:
Figure 2.3. Nicky Moss.
Every effort has been made to contact copyright holders. If any have been
inadvertently overlooked the publishers will be pleased to make the necessary
arrangements at the first opportunity.
Part 2 The internet
108
Part 3 Wireless communicationsby Chris Bissell

Contents
Introduction 113
3.1 Using mobile devices 114
3.1.1 Introductory case study 115
3.1.2 Conclusion 116
3.2 Attenuation 117
3.2.1 The inverse square law 117
3.2.2 Other inverse power laws 118
3.2.3 Cellular systems 120
3.2.4 Conclusion 123
3.3 Digitisation and modulation 124
3.3.1 Sampling 124
3.3.2 Quantisation 126
3.3.3 Modulation 127
3.3.4 Conclusion 131
3.4 Mobile telephony technologies 132
3.4.1 GSM 132
3.4.2 Time division 134
3.4.3 3G and 4G mobile telephony and the future 136
3.4.4 Conclusion 138
3.5 Wi-Fi, Bluetooth and ZigBee technologies 139
3.5.1 Wi-Fi 139
3.5.2 Bluetooth 145
3.5.3 ZigBee 148
3.5.4 Conclusion 152
3.6 Radio-frequency identification (RFID) 153
3.6.1 Types of RFID tags 153
3.6.2 RFID systems 155
3.6.3 Conclusion 157
3.7 Error correction 158
3.7.1 Parity checks 159
3.7.2 Conclusion 161
3.8 Security 162
3.8.1 Improving security 162
3.8.2 Conclusion 165
3.9 Regulation and Standardisation 166
3.9.1 The International Telecommunications Union (ITU) 166
3.9.2 The IEEE family of standards 167
3.9.3 Conclusion 169
3.10 Summary 170
Answers to self-assessment activities 171
References 176
Acknowledgements 177
Introduction
From a world where wireless communication meant either voice telephony
(such as the use of mobile phones) or microwave data transmission between
fixed points, we have now reached the point where wireless technologies are
able to support a large variety of applications. In addition to mobile voice
telephony, where we can only hear the other people taking part in the call,
we can now make video calls from mobile devices. Modern wireless
technologies also allow devices to exchange information and connect to the
internet.
The technologies behind the successful operation of such systems build on a
long history of the development of wireless communications. Some of the
problems that have to be overcome are:
1 the decrease of power in a radio signal with distance travelled
2 how to convert a binary bitstream into a form suitable for radio
transmission
3 how to prevent interference between wireless signals being transmitted
simultaneously
4 integrating the major components of a mobile system – often known as
‘system architecture’
5 the detection and correction of errors
6 how to keep systems secure from accidental or deliberate damage.
By the end of this part, you should understand such issues, and be able to
carry out appropriate numerical calculations.
Introduction
113
Using mobile devices
Together with wireless communication technologies, computing technologies
are continuing to advance at a rapid pace. As a result, it is now possible to
integrate into a single handheld device a range of functions that once required
several devices. To begin your studies of this part, please take a few
moments to think about your personal experience of such devices by
attempting the following activity.
Activity 3.1 (exploratory)
List the ways in which you use a mobile phone (a smartphone or otherwise)
or a tablet to record, store, receive or communicate information.
CommentI made the following list. You may have thought of other ways, or organised
them in a different way:
. Recording
◦ Take pictures
◦ Take videos
◦ Record sound
◦ Use electronic diary / phone book / note taking
. Receiving
◦ Access the internet
◦ Watching videos and TV catch-up
◦ Listening to stored music
◦ Internet radio
◦ Weather forecasts, news apps, etc.
. Communicating
◦ Telephone conversation
◦ Texting (SMS)
◦ Sending emails, photos and videos
◦ Playing interactive games with other competitors at a distance
◦ Using Bluetooth or Apple AirDrop for file transfer between
phones, tablets and laptops
Other examples (that I do not have on my devices) might include checking
position using GPS; using a built-in compass; route and direction finding;
recording distance walked using a pedometer function; dictionaries;
translation apps; etc.
Part 3 Wireless communications
114
3.1
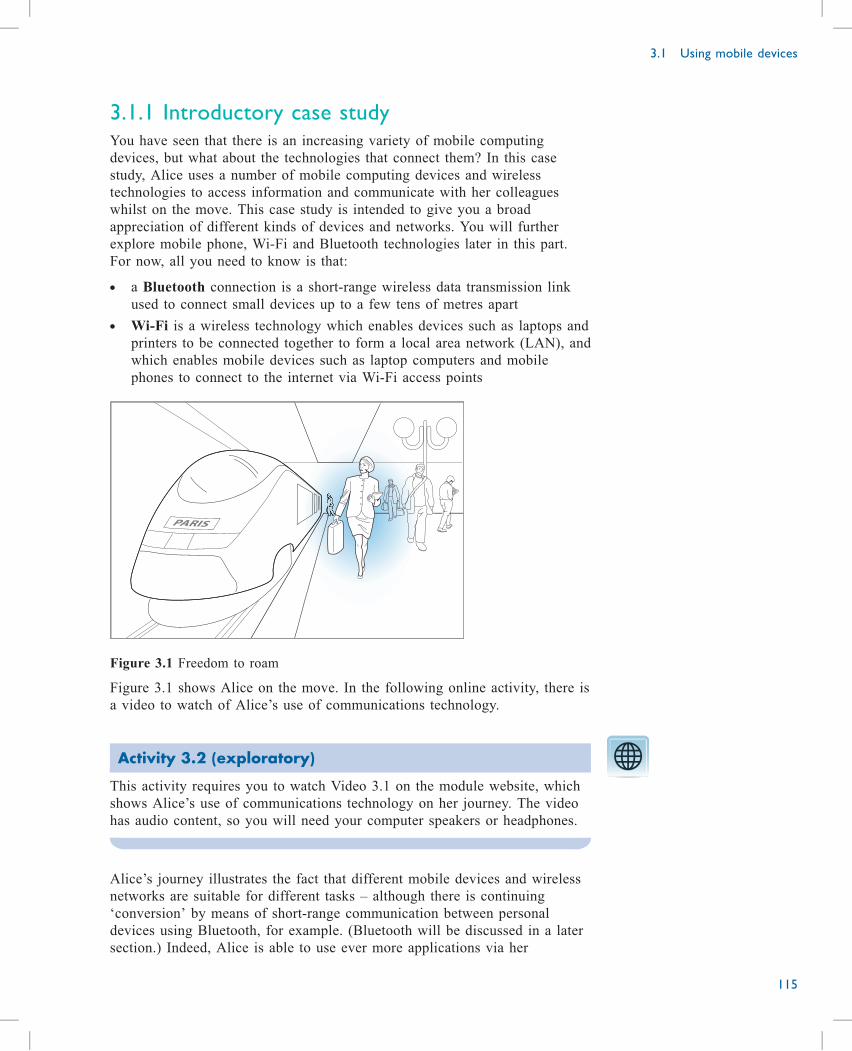
3.1.1 Introductory case studyYou have seen that there is an increasing variety of mobile computing
devices, but what about the technologies that connect them? In this case
study, Alice uses a number of mobile computing devices and wireless
technologies to access information and communicate with her colleagues
whilst on the move. This case study is intended to give you a broad
appreciation of different kinds of devices and networks. You will further
explore mobile phone, Wi-Fi and Bluetooth technologies later in this part.
For now, all you need to know is that:
. a Bluetooth connection is a short-range wireless data transmission link
used to connect small devices up to a few tens of metres apart
. Wi-Fi is a wireless technology which enables devices such as laptops and
printers to be connected together to form a local area network (LAN), and
which enables mobile devices such as laptop computers and mobile
phones to connect to the internet via Wi-Fi access points
Figure 3.1 Freedom to roam
Figure 3.1 shows Alice on the move. In the following online activity, there is
a video to watch of Alice’s use of communications technology.
Activity 3.2 (exploratory)
This activity requires you to watch Video 3.1 on the module website, which
shows Alice’s use of communications technology on her journey. The video
has audio content, so you will need your computer speakers or headphones.
Alice’s journey illustrates the fact that different mobile devices and wireless
networks are suitable for different tasks – although there is continuing
‘conversion’ by means of short-range communication between personal
devices using Bluetooth, for example. (Bluetooth will be discussed in a later
section.) Indeed, Alice is able to use ever more applications via her
3.1 Using mobile devices
115
smartphone; the size of the screen and lack of a proper keyboard are not
significant obstacles for email and some web browsing. In fact, the
unobtrusiveness of the small device is an advantage. However, when it comes
to editing a document, Alice would rather use a small laptop computer since
its larger screen and keyboard make it much easier to see what she is doing
and input the changes; indeed, she still prefers this to her tablet with its
detachable keyboard. Alice also has a tethering facility, which allows her
laptop to connect to the internet via her smartphone using a USB cable,
Bluetooth or Wi-Fi.
3.1.2 ConclusionThis section has reviewed typical uses of mobile devices, and has presented a
simple case study of how an individual might communicate using them while
travelling. Some differences between mobile devices such as size,
connectivity and battery life were indicated.
Part 3 Wireless communications
116
Attenuation
This section covers the first and third of the points in the list in the
introduction to this part: signal attenuation and the prevention of interference.
Recall from Part 1 of this block that the way an electromagnetic wave repeats
can be described by its frequency, period or wavelength.
Activity 3.3 (self-assessment)
Explain what is meant by the terms frequency, period and wavelength. What
units are each measured in?
Also recall that any wave – water, sound or electromagnetic – attenuates
(dies away) with increasing distance from the source. Attenuation also
normally depends on the frequency of the signal, as introduced in
Section 1.4, but frequency dependence will not be discussed further in
TM111.
Attenuation may appear to be a serious disadvantage to wireless transmission;
indeed, for very long distances, special techniques have to be used to reduce
its effects. However, for the type of mobile systems considered in this part,
attenuation brings significant benefits, which we’ll look at later. To begin
with, let’s see how we can quantify the attenuation of an electromagnetic
wave.
3.2.1 The inverse square lawThe easiest situation to think about is the propagation of a wave in free space
– that is, far from objects, geographical features and even the earth’s
atmosphere, all of which can increase the attenuation.
Figure 3.2 shows how the power spreads after transmission. The diagram
shows one portion of the total radiated power. For an antenna radiating in all
directions there could be similar diagrams, with the power travelling in other
directions.
3.2 Attenuation
117
3.2
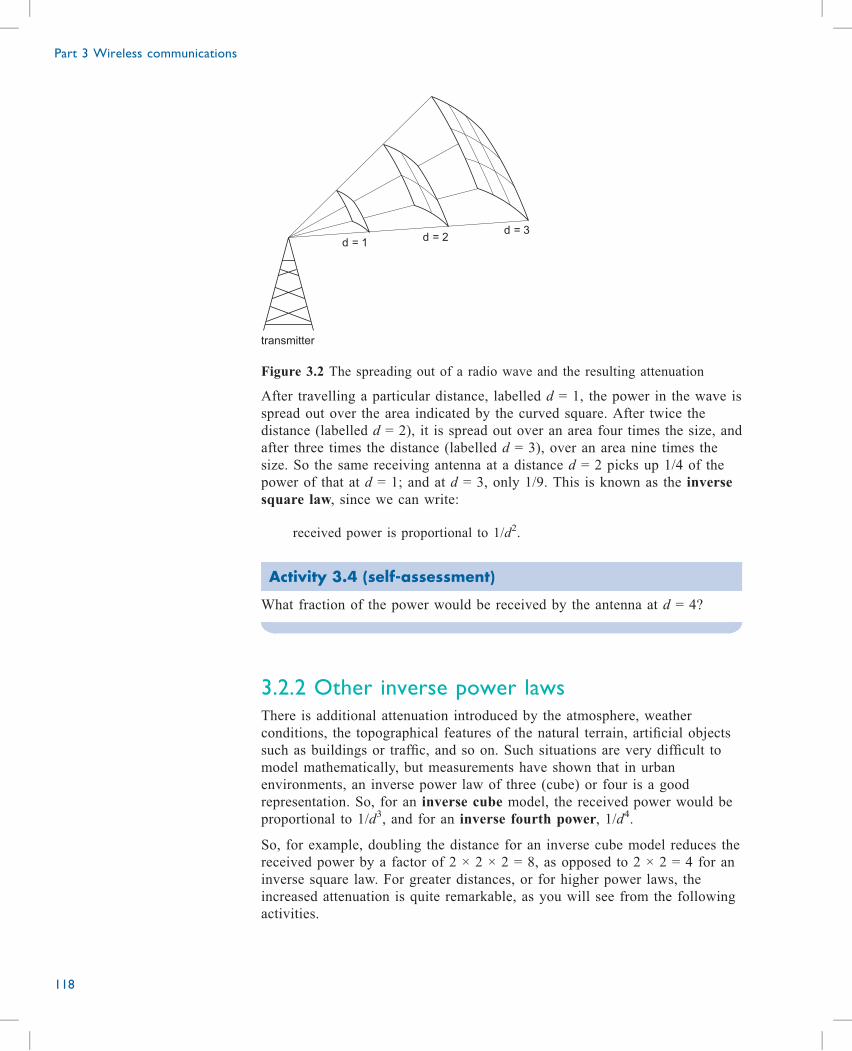
transmitter
d = 1d = 2
d = 3
Figure 3.2 The spreading out of a radio wave and the resulting attenuation
After travelling a particular distance, labelled d = 1, the power in the wave is
spread out over the area indicated by the curved square. After twice the
distance (labelled d = 2), it is spread out over an area four times the size, and
after three times the distance (labelled d = 3), over an area nine times the
size. So the same receiving antenna at a distance d = 2 picks up 1/4 of the
power of that at d = 1; and at d = 3, only 1/9. This is known as the inverse
square law, since we can write:
received power is proportional to 1/d2.
Activity 3.4 (self-assessment)
What fraction of the power would be received by the antenna at d = 4?
3.2.2 Other inverse power lawsThere is additional attenuation introduced by the atmosphere, weather
conditions, the topographical features of the natural terrain, artificial objects
such as buildings or traffic, and so on. Such situations are very difficult to
model mathematically, but measurements have shown that in urban
environments, an inverse power law of three (cube) or four is a good
representation. So, for an inverse cube model, the received power would be
proportional to 1/d3, and for an inverse fourth power, 1/d4.
So, for example, doubling the distance for an inverse cube model reduces the
received power by a factor of 2 × 2 × 2 = 8, as opposed to 2 × 2 = 4 for an
inverse square law. For greater distances, or for higher power laws, the
increased attenuation is quite remarkable, as you will see from the following
activities.
Part 3 Wireless communications
118
Activity 3.5 (self-assessment)
Evaluate the following power expressions without using a calculator:
(a) 25
(b) 26
(c) 35
(d) 73
Activity 3.6 (self-assessment)
Complete Table 3.1, comparing inverse square, cube and fourth power
models.
Table 3.1
Inverse square Inverse cube Inverse fourth power
Power reduced by a factor of
Double the distance 4 8
Three times the distance 9
Four times the distance 16
Five times the distance
It is useful to display this attenuation as the proportion of transmitted power
received at various distances for a particular power law. The following online
activity allows you to investigate various power laws.
Activity 3.7 (exploratory)
You should now go and explore the interactive inverse power law graph on
the module website. You simply enter the power law and observe the
attenuation.
Figure 3.3 (overleaf) is a screen shot of the interactive inverse power law
graph.
In many practical systems, laws in the range 2.5 to 4 have been found useful.
For example, an inverse 3.5 power law is often a good description of
attenuation for mobile telephony.
3.2 Attenuation
119
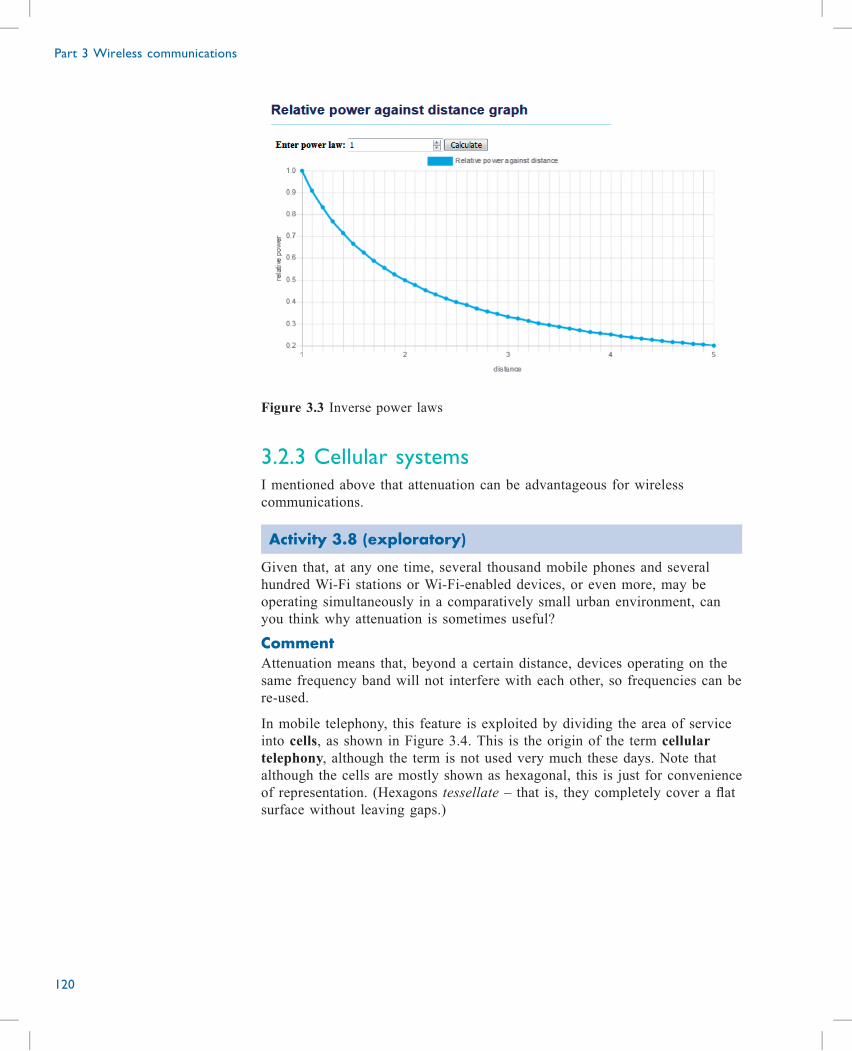
Figure 3.3 Inverse power laws
3.2.3 Cellular systemsI mentioned above that attenuation can be advantageous for wireless
communications.
Activity 3.8 (exploratory)
Given that, at any one time, several thousand mobile phones and several
hundred Wi-Fi stations or Wi-Fi-enabled devices, or even more, may be
operating simultaneously in a comparatively small urban environment, can
you think why attenuation is sometimes useful?
CommentAttenuation means that, beyond a certain distance, devices operating on the
same frequency band will not interfere with each other, so frequencies can be
re-used.
In mobile telephony, this feature is exploited by dividing the area of service
into cells, as shown in Figure 3.4. This is the origin of the term cellular
telephony, although the term is not used very much these days. Note that
although the cells are mostly shown as hexagonal, this is just for convenience
of representation. (Hexagons tessellate – that is, they completely cover a flat
surface without leaving gaps.)
Part 3 Wireless communications
120
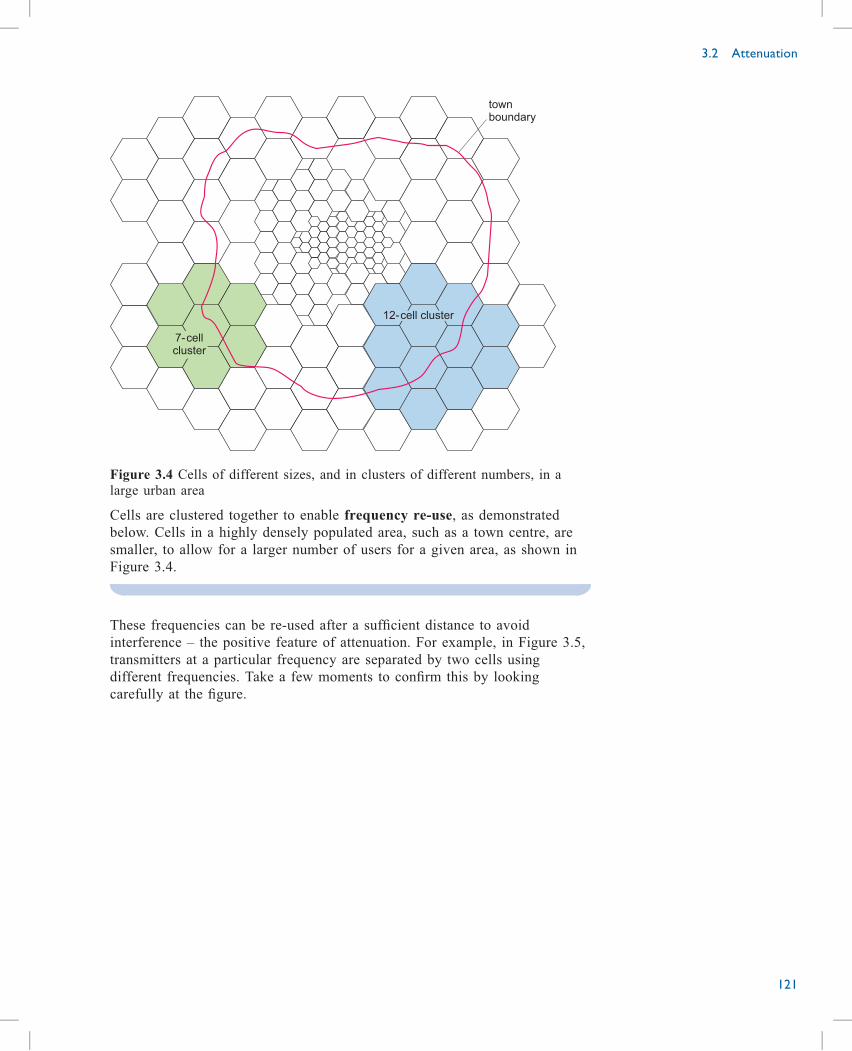
townboundary
12-cell cluster
7-cellcluster
Figure 3.4 Cells of different sizes, and in clusters of different numbers, in a
large urban area
Cells are clustered together to enable frequency re-use, as demonstrated
below. Cells in a highly densely populated area, such as a town centre, are
smaller, to allow for a larger number of users for a given area, as shown in
Figure 3.4.
These frequencies can be re-used after a sufficient distance to avoid
interference – the positive feature of attenuation. For example, in Figure 3.5,
transmitters at a particular frequency are separated by two cells using
different frequencies. Take a few moments to confirm this by looking
carefully at the figure.
3.2 Attenuation
121
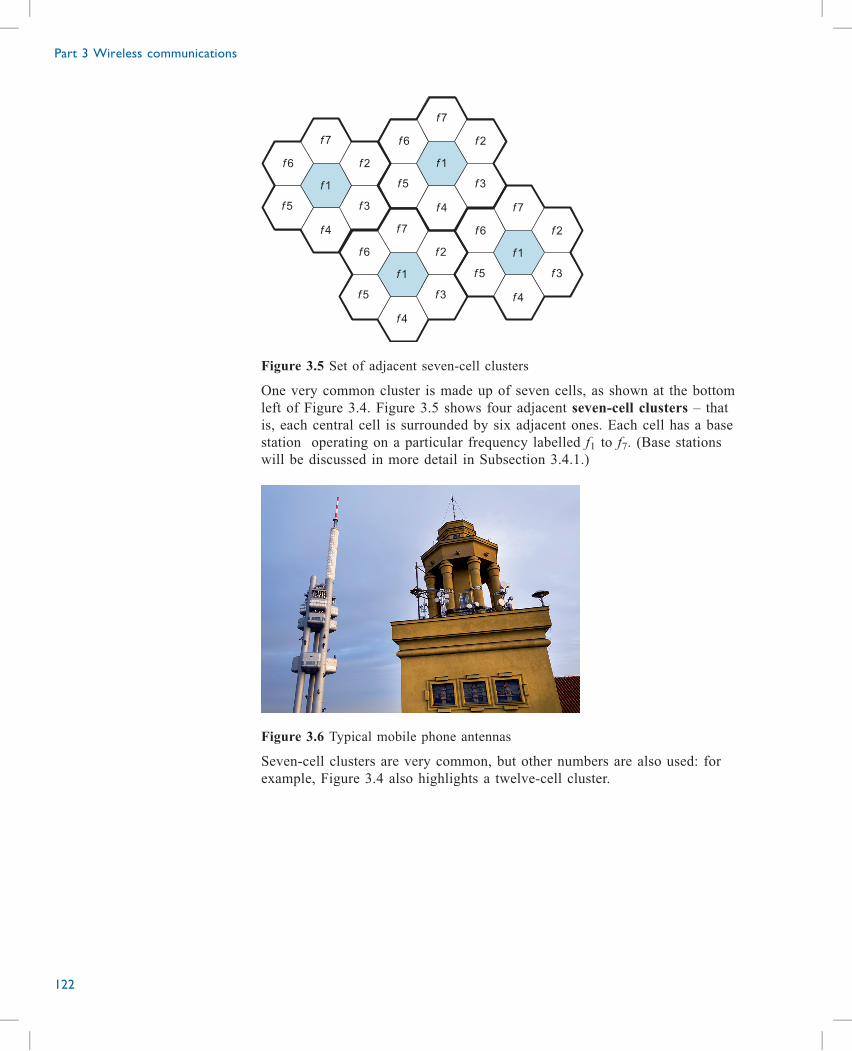
f 1
f 2
f 3
f 4
f 6
f 5
f 7
f 1
f 2
f 3
f 4
f 6
f 5
f 7
f 1
f 2
f 3
f 4
f 6
f 5
f 7
f 1
f 2
f 3
f 4
f 6
f 5
f 7
Figure 3.5 Set of adjacent seven-cell clusters
One very common cluster is made up of seven cells, as shown at the bottom
left of Figure 3.4. Figure 3.5 shows four adjacent seven-cell clusters – that
is, each central cell is surrounded by six adjacent ones. Each cell has a base
station operating on a particular frequency labelled f1 to f7. (Base stations
will be discussed in more detail in Subsection 3.4.1.)
Figure 3.6 Typical mobile phone antennas
Seven-cell clusters are very common, but other numbers are also used: for
example, Figure 3.4 also highlights a twelve-cell cluster.
Part 3 Wireless communications
122
3.2.4 ConclusionIn this section, you have been introduced to a number of models of radio
attenuation: the inverse square, cube and fourth-power models. Attenuation is
useful in cellular mobile systems as it allows frequency re-use after an
appropriate distance. Different cell sizes are employed, depending on the
density of users within the cell, and individual cells are clustered in order to
ensure optimal frequency re-use.
You have also revised and/or improved your understanding of the
mathematics involved in performing calculations with power laws, including
operating with power notation, and calculating the inverse of numbers.
3.2 Attenuation
123
Digitisation and modulation
This section covers the second and more of the third points in the list in the
introduction to this part: how to convert a binary bitstream into a form
suitable for radio transmission, and how to prevent interference between
wireless signals being transmitted simultaneously.
In Block 1 Part 3, you looked at the digital representation of audio and video
signals. In this section, we’re going to consider the digital representation of
audio in more detail. Some sources are digital by their nature, such as a
computer file or text. As you saw in Block 1, others, such as images and
sound, have to be converted to digital form before transmission.
Activity 3.9 (self-assessment)
Two main processes are used to convert an analogue audio signal into digital
form. (The term analogue is discussed in Block 1.) What are they and what
are the results of the processes?
Now, in order to represent the analogue signal sufficiently well as a string of
numbers – ultimately binary numbers – it is vital that two conditions are met.
1 The signal must be sampled sufficiently frequently in order to represent
all its significant fluctuations.
2 The samples must be coded using a sufficiently accurate and precise
number for each sample value to give a digital representation close
enough to the original analogue value.
3.3.1 SamplingFigure 3.7 shows a segment of an audio signal. The horizontal axis represents
time.
1.0
0.5
–0.5
–1.0
0.0
Figure 3.7 Audio signal
In Figure 3.8, the signal in Figure 3.7 is sampled sufficiently frequently to
fully represent the original. Imagine receiving the sample values and simply
‘joining the dots smoothly’! (However, as you might suspect, an awful lot of
electronic signal processing is needed to do this.)
Part 3 Wireless communications
124
3.3
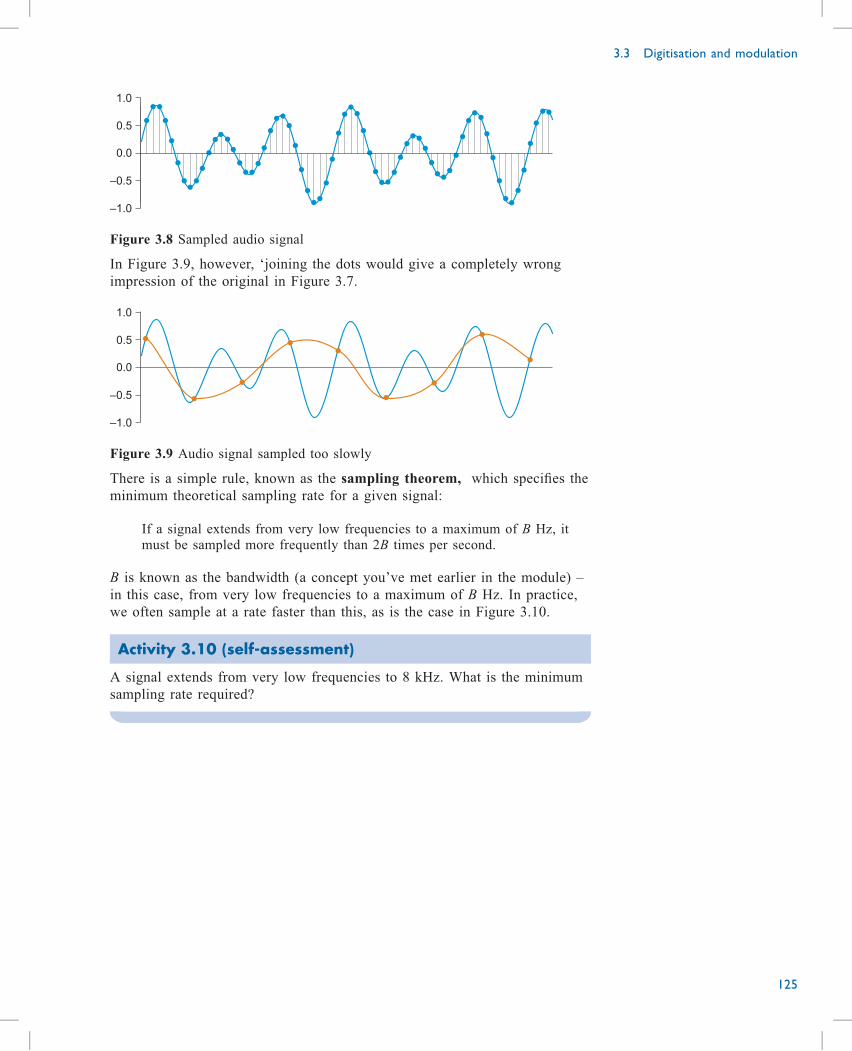
1.0
0.5
–0.5
–1.0
0.0
Figure 3.8 Sampled audio signal
In Figure 3.9, however, ‘joining the dots would give a completely wrong
impression of the original in Figure 3.7.
1.0
0.5
–0.5
–1.0
0.0
Figure 3.9 Audio signal sampled too slowly
There is a simple rule, known as the sampling theorem, which specifies the
minimum theoretical sampling rate for a given signal:
If a signal extends from very low frequencies to a maximum of B Hz, it
must be sampled more frequently than 2B times per second.
B is known as the bandwidth (a concept you’ve met earlier in the module) –
in this case, from very low frequencies to a maximum of B Hz. In practice,
we often sample at a rate faster than this, as is the case in Figure 3.10.
Activity 3.10 (self-assessment)
A signal extends from very low frequencies to 8 kHz. What is the minimum
sampling rate required?
3.3 Digitisation and modulation
125
3.3.2 QuantisationTurning to the second vital condition, look at Figure 3.10.
1.0
0.5
–0.5
–1.0
0.0
Figure 3.10 Audio signal inadequately quantised on the left, but adequately
quantised on the right
Whatever the units of amplitude are, the left half of the figure shows
quantisation intervals of 0.25 units – only nine quantisation levels cover the
full range of 2 units. Clearly, a lot of detail is lost. The right half of the
figure, on the other hand, has four times as many quantisation levels, so gives
a good representation of the original signal. Precisely how many quantisation
levels are required for a given application depends very much on the purpose.
Each coded sample in speech telephony, for example, is represented by an 8-
bit data word and so can represent 256 different levels. This is sufficient to
represent the human voice. But hi-fi music requires many more levels to
capture a wider range of tones; a common music standard (CDs and some
other digital formats) uses 16-bit words and thus 65,536 levels for each
sample!
Activity 3.11 (self-assessment)
How many bits per codeword are needed to code the levels in the two parts
of Figure 3.10?
Activity 3.12 (self-assessment)
A speech signal for voice telephony is sampled every 125 μs. (Remember
from Part 1 of this block that 1 μs is one millionth or 10–6 of a second.)
If 256 quantisation levels are needed per sample, what is the transmitted
bitrate? (Hint: how many samples per second will be taken, and how many
bits are needed to represent each sample?)
Part 3 Wireless communications
126
3.3.3 ModulationA bitstream can be represented as shown in Figure 3.11.
0
1
voltage
(V)
0
1 1 1 0 0 0 1 0 1
time
Figure 3.11. A signal using 0 V to represent binary 0 and 1 V to represent
binary 1.
A signal like this can be transmitted directly as an electrical signal along (a
moderately short) copper cable or by turning a laser on and off for long-
distance transmission over optical fibre. Note that the choice of symbol used
to represents 0s and 1s (voltage, light intensity, and so on) is arbitrary, so
long as it is agreed throughout the system: a positive voltage could just as
easily represent a binary 0 as a 1.
But for wireless transmission, the data has to be converted into a form that
can be transmitted as an electromagnetic wave. There are a number of ways
of doing this, known as modulation – that is, the data is used to vary, or
modulate, some characteristic of an electromagnetic wave that can then be
transmitted wirelessly.
Figure 3.12 shows what are perhaps the simplest modulation schemes. They
have the rather strange names on–off keying (OOK) and amplitude shift
keying (ASK), terms dating from the use of a Morse telegraphy key to
change the amplitude of the wave. As you can see, the original binary signal
simply modulates the amplitude (height) of the so-called carrier wave in
order to produce an appropriate wireless signal. In OOK, the signal is simply
represented by turning a sine wave on and off, while in ASK, two different
amplitudes are used.
3.3 Digitisation and modulation
127
0
1
voltage
(V)
–1
0
1 1 1 0 0 0 1 0 1
(a) Data
0
1
voltage
(V)
(b) Unmodulated carrier
time
–1
0
1
voltage
(V)
(c) On–off keying (OOK)
time
–1
0
1
voltage
(V)
(d) Amplitude shift keying (ASK)
time
time
Figure 3.12 (a) Digital data, (b) unmodulated carrier, (c) on–off keying, (d)
amplitude shift keying
An alternative is to modulate the frequency of the carrier instead, as shown in
Figure 3.13, where the higher frequency represents a binary 1 and the lower
one a binary 0. Unsurprisingly, this technique is known as frequency shift
keying (FSK).
1 0 0 0 1 1 0 1 0 0
–1
0
Voltage
/V
1
time
Figure 3.13 Frequency shift keying
But a more common and useful modulation scheme changes the phase of the
transmitted wave, rather than its amplitude or frequency.
Part 3 Wireless communications
128
Phase, or, more correctly, phase shift or relative phase, denotes how far a
sine wave is shifted along the horizontal axis relative to another sine wave
taken as a reference.
In the graph below, taking the blue sine wave as a reference, the purple sine
wave is shifted one quarter of a cycle to the right.
y
t0
y
t0
referencesinewave
Figure 3.14 The purple sine wave is shifted one quarter of a cycle to the right of
the reference sine wave
On the time axis of either graph, events to the right happen later than events
to the left. Thus in the purple sine wave, the first positive peak occurs to the
right of the first positive peak in the blue sine wave. The purple sine wave is
said to be delayed or lagging relative to the blue one. More exactly, it is
delayed by a quarter of a cycle relative to the blue reference sine wave.
Alternatively, the black sine wave is said to have a phase shift of minus a
quarter of a cycle relative to the blue one.
Phase is a way of expressing a relationship between two sine waves. A sine
wave cannot be said to have a particular phase except in relation to another
sine wave.
It is very common, however, to take the sine wave shown in Figure 3.15,
which reproduces the one at the top of Figure 3.14, as a reference. What
makes it suitable to be a standard reference is the way the positive part of the
cycle starts at t = 0.
y
t0
Figure 3.15 Reference sine wave
If a sine wave is described as having a phase of, for example, +45°, without
any explicitly stated reference sine wave, the reference sine wave is almost
invariably one like that shown in Figure 3.15.
The relative phase of three sine waves is illustrated in Figure 3.16.
3.3 Digitisation and modulation
129
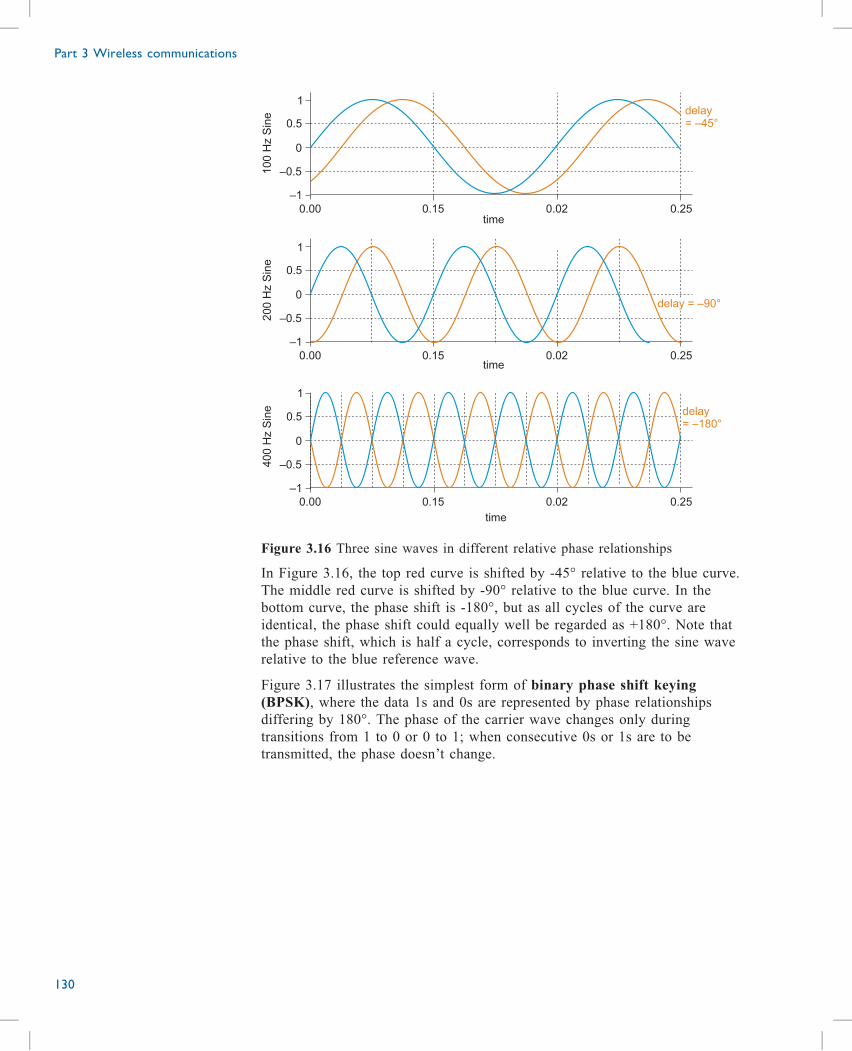
–1
0.00 0.02time
time
time
delay= –45°
–0.5
0
1
0.5
100
Hz
Sin
e
–1
0.00 0.020.15 0.25
0.15 0.25
delay = –90°
–0.5
0
1
1
0.5200
Hz
Sin
e
–1
0.00 0.020.15 0.25
delay= –180°
–0.5
0
0.5
400
Hz
Sin
e
Figure 3.16 Three sine waves in different relative phase relationships
In Figure 3.16, the top red curve is shifted by -45° relative to the blue curve.
The middle red curve is shifted by -90° relative to the blue curve. In the
bottom curve, the phase shift is -180°, but as all cycles of the curve are
identical, the phase shift could equally well be regarded as +180°. Note that
the phase shift, which is half a cycle, corresponds to inverting the sine wave
relative to the blue reference wave.
Figure 3.17 illustrates the simplest form of binary phase shift keying
(BPSK), where the data 1s and 0s are represented by phase relationships
differing by 180°. The phase of the carrier wave changes only during
transitions from 1 to 0 or 0 to 1; when consecutive 0s or 1s are to be
transmitted, the phase doesn’t change.
Part 3 Wireless communications
130
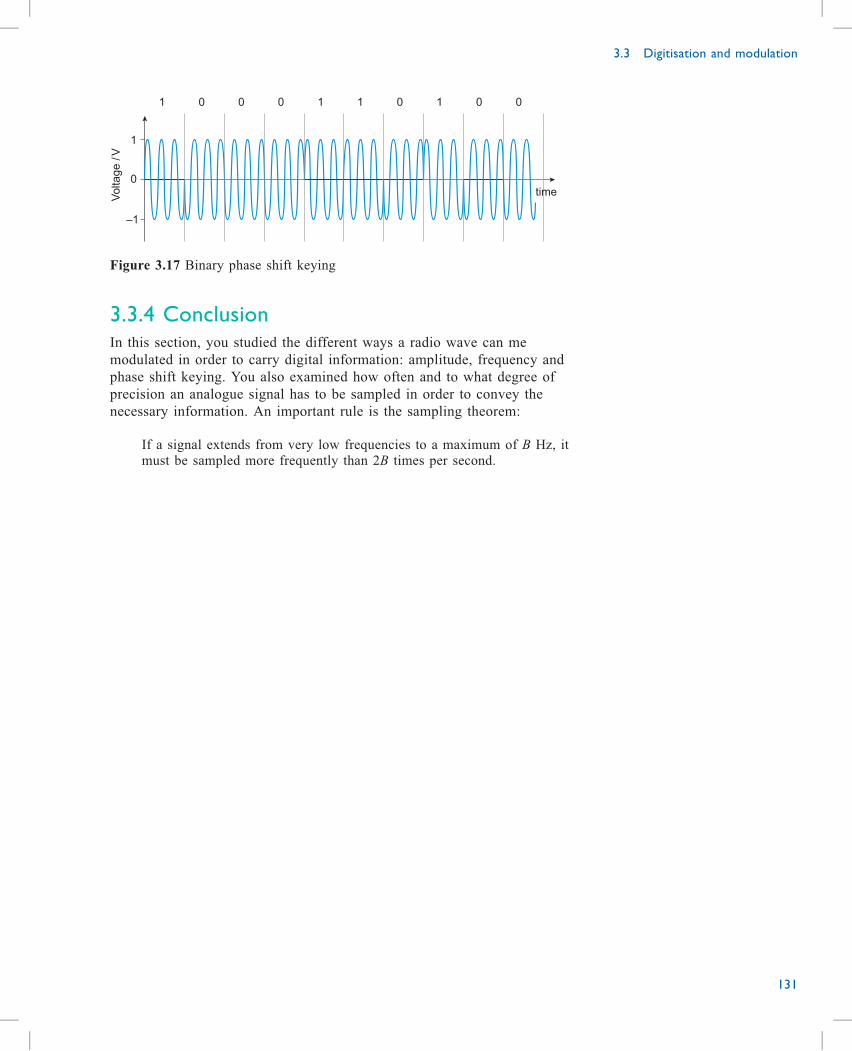
–1
0
Voltage
/V
1
time
1 0 0 0 1 1 0 1 0 0
Figure 3.17 Binary phase shift keying
3.3.4 ConclusionIn this section, you studied the different ways a radio wave can me
modulated in order to carry digital information: amplitude, frequency and
phase shift keying. You also examined how often and to what degree of
precision an analogue signal has to be sampled in order to convey the
necessary information. An important rule is the sampling theorem:
If a signal extends from very low frequencies to a maximum of B Hz, it
must be sampled more frequently than 2B times per second.
3.3 Digitisation and modulation
131
Mobile telephony technologies
This section covers the fourth item in the list in the introduction: the
structure and architecture of mobile systems.
Mobile telephony appeared in the UK in 1985 as an analogue system, now
referred to as ‘first generation’ (1G). I shall not say anything further about
this system here. The first digital system (2G) that was introduced in Europe
in 1991 is known as the GSM system, and is still widely used in Europe and
elsewhere. GSM is a standard for mobile phones that was developed during
the 1980s by the European Conference of Postal and Telecommunications
Administrations (CEPT), a body that subsequently transferred responsibility
for European telephone standards to the European Telecommunications
Standards Institute (ETSI). Without well-defined international standards,
mobile telephone systems that can work across international boundaries
would not be possible, so the work of standards is very important. We’ll look
at standardisation in more detail later.
3.4.1 GSMIn the UK, Europe and some other areas, the GSM frequency bands are either
around 900 MHz or around 1800 MHz, with the band around 1800 MHz
being considerably wider. In some European countries, including the UK,
both of the bands are available for GSM. Like other mobile telephony
systems, GSM has a cellular structure and employs frequency reuse, as
described above.
Figure 3.18 is an overview of the GSM system, but many of the principles
apply to later generations of mobile telephony. It is a rather complex
diagram, and you are not expected to understand or remember all the details.
Please note the major features, study the diagram and then attempt the
activity. In particular, note the following.
. At the lowest level are the interconnected mobiles, their cells and base
stations – here termed base transceiver stations (BTSs) (as they both
transmit and receive signals to and from individual mobiles via the air
interface).
. Above the air interface is the access network proper, which is the first
stage in connecting the mobiles into wider networks such as the public
switched telephone network (PSTN), which provides landlines and other
services. The access network basically consists of interfaces to the radio
signals, together with a number of base station controllers (BSCs) which
carry out important control functions. A BSC may have tens or even
hundreds of base stations under its control. The BSC handles the
allocation of radio channels, receives measurements from the mobile
phones, and controls most handovers from BTS to BTS as the user moves
around.
Part 3 Wireless communications
132
3.4
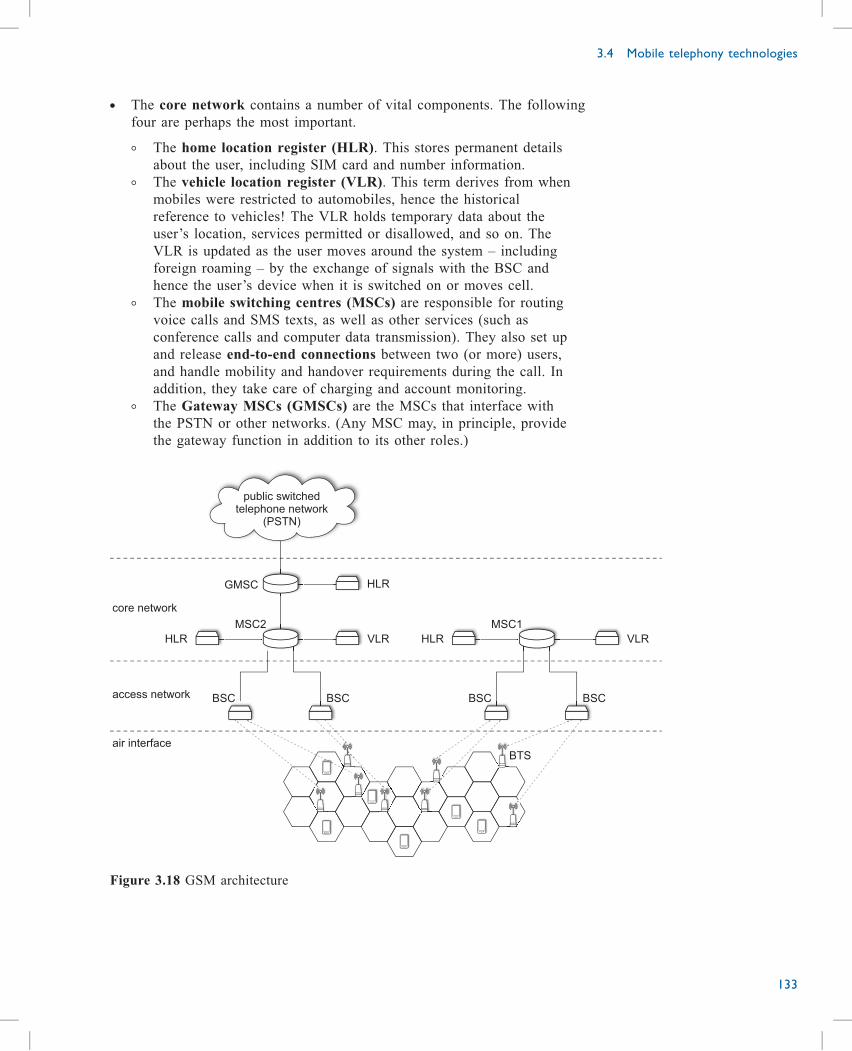
. The core network contains a number of vital components. The following
four are perhaps the most important.
◦ The home location register (HLR). This stores permanent details
about the user, including SIM card and number information.
◦ The vehicle location register (VLR). This term derives from when
mobiles were restricted to automobiles, hence the historical
reference to vehicles! The VLR holds temporary data about the
user’s location, services permitted or disallowed, and so on. The
VLR is updated as the user moves around the system – including
foreign roaming – by the exchange of signals with the BSC and
hence the user’s device when it is switched on or moves cell.
◦ The mobile switching centres (MSCs) are responsible for routing
voice calls and SMS texts, as well as other services (such as
conference calls and computer data transmission). They also set up
and release end-to-end connections between two (or more) users,
and handle mobility and handover requirements during the call. In
addition, they take care of charging and account monitoring.
◦ The Gateway MSCs (GMSCs) are the MSCs that interface with
the PSTN or other networks. (Any MSC may, in principle, provide
the gateway function in addition to its other roles.)
public switchedtelephone network
(PSTN)
GMSC HLR
MSC2
VLR VLRHLR
core network
access network
air interface
HLR
BSCBSC
MSC1
BSCBSC
BTS
Figure 3.18 GSM architecture
3.4 Mobile telephony technologies
133
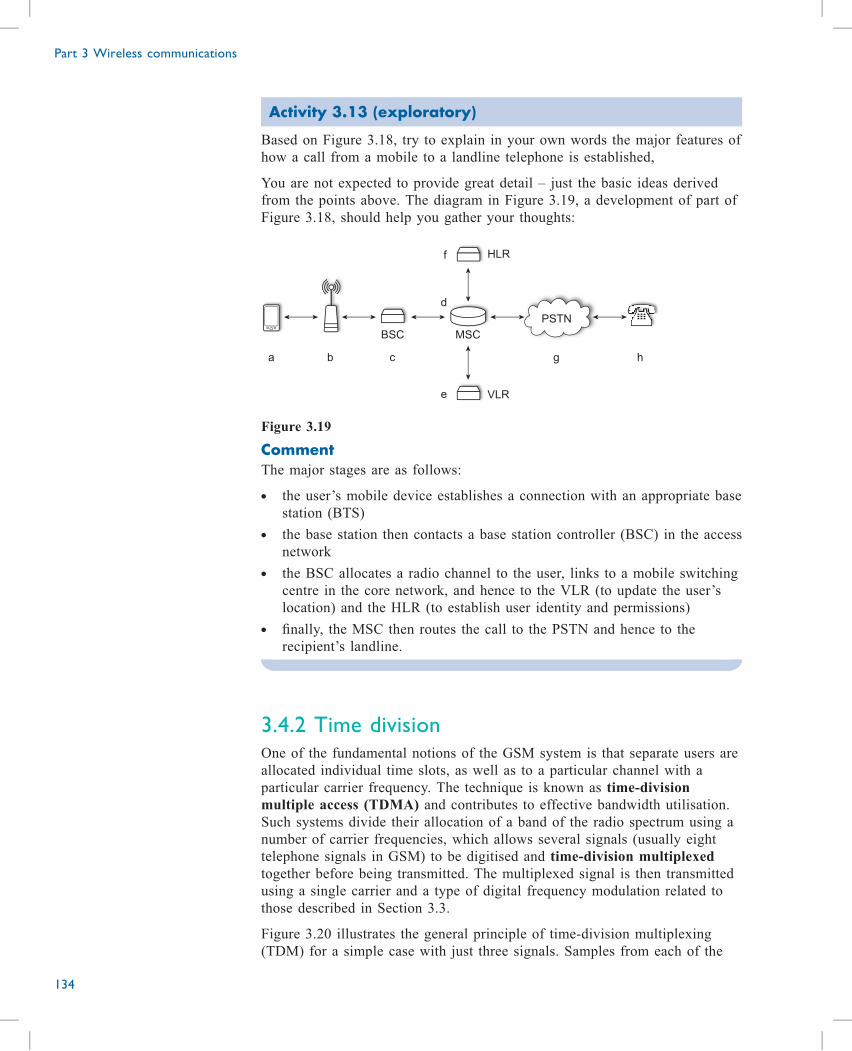
Activity 3.13 (exploratory)
Based on Figure 3.18, try to explain in your own words the major features of
how a call from a mobile to a landline telephone is established,
You are not expected to provide great detail – just the basic ideas derived
from the points above. The diagram in Figure 3.19, a development of part of
Figure 3.18, should help you gather your thoughts:
MSC
HLR
a
d
cb
e
g
f
h
PSTN
VLR
BSC
Figure 3.19
CommentThe major stages are as follows:
. the user’s mobile device establishes a connection with an appropriate base
station (BTS)
. the base station then contacts a base station controller (BSC) in the access
network
. the BSC allocates a radio channel to the user, links to a mobile switching
centre in the core network, and hence to the VLR (to update the user’s
location) and the HLR (to establish user identity and permissions)
. finally, the MSC then routes the call to the PSTN and hence to the
recipient’s landline.
3.4.2 Time divisionOne of the fundamental notions of the GSM system is that separate users are
allocated individual time slots, as well as to a particular channel with a
particular carrier frequency. The technique is known as time-division
multiple access (TDMA) and contributes to effective bandwidth utilisation.
Such systems divide their allocation of a band of the radio spectrum using a
number of carrier frequencies, which allows several signals (usually eight
telephone signals in GSM) to be digitised and time-division multiplexed
together before being transmitted. The multiplexed signal is then transmitted
using a single carrier and a type of digital frequency modulation related to
those described in Section 3.3.
Figure 3.20 illustrates the general principle of time-division multiplexing
(TDM) for a simple case with just three signals. Samples from each of the
Part 3 Wireless communications
134
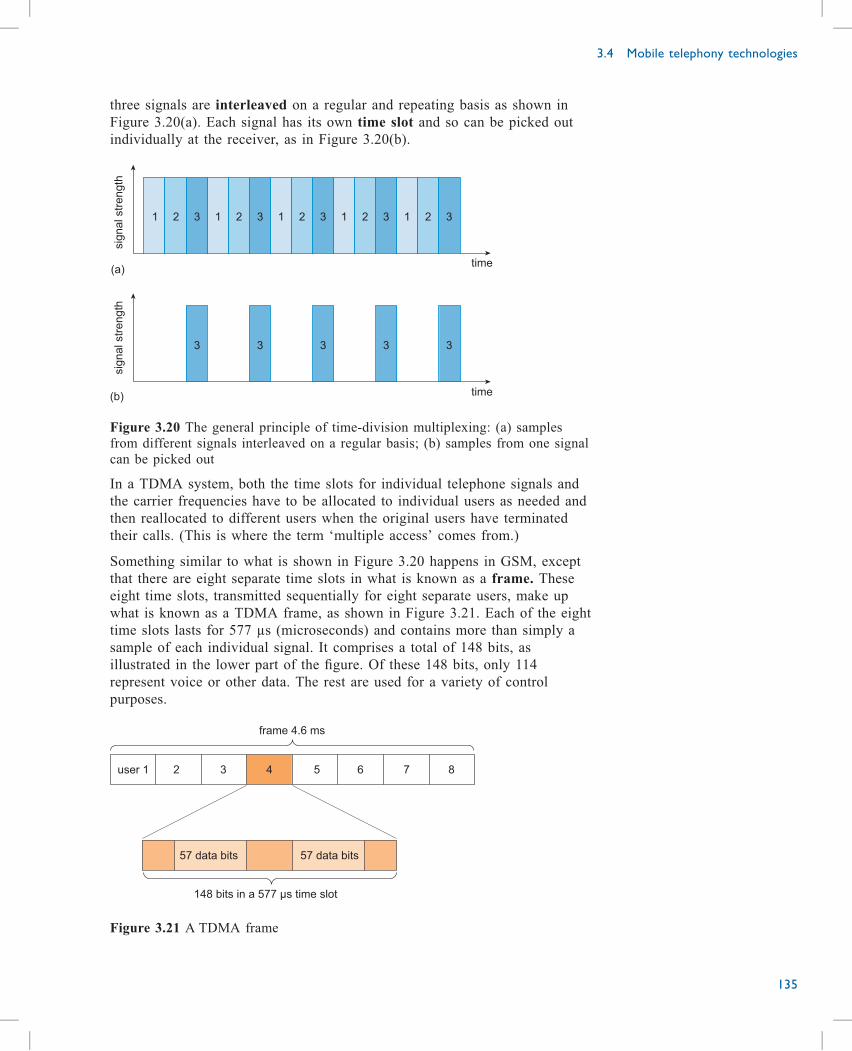
three signals are interleaved on a regular and repeating basis as shown in
Figure 3.20(a). Each signal has its own time slot and so can be picked out
individually at the receiver, as in Figure 3.20(b).
1 2 3 1 2 3 1 2 3 1 2 3 1 2 3
(a)time
3 3 3 3 3
(b) time
sig
nalstr
ength
sig
nalstr
ength
Figure 3.20 The general principle of time-division multiplexing: (a) samples
from different signals interleaved on a regular basis; (b) samples from one signal
can be picked out
In a TDMA system, both the time slots for individual telephone signals and
the carrier frequencies have to be allocated to individual users as needed and
then reallocated to different users when the original users have terminated
their calls. (This is where the term ‘multiple access’ comes from.)
Something similar to what is shown in Figure 3.20 happens in GSM, except
that there are eight separate time slots in what is known as a frame. These
eight time slots, transmitted sequentially for eight separate users, make up
what is known as a TDMA frame, as shown in Figure 3.21. Each of the eight
time slots lasts for 577 µs (microseconds) and contains more than simply a
sample of each individual signal. It comprises a total of 148 bits, as
illustrated in the lower part of the figure. Of these 148 bits, only 114
represent voice or other data. The rest are used for a variety of control
purposes.
148 bits in a 577 µs time slot
frame 4.6 ms
user 1 2 3 4 5 6 7 8
57 data bits 57 data bits
Figure 3.21 A TDMA frame
3.4 Mobile telephony technologies
135
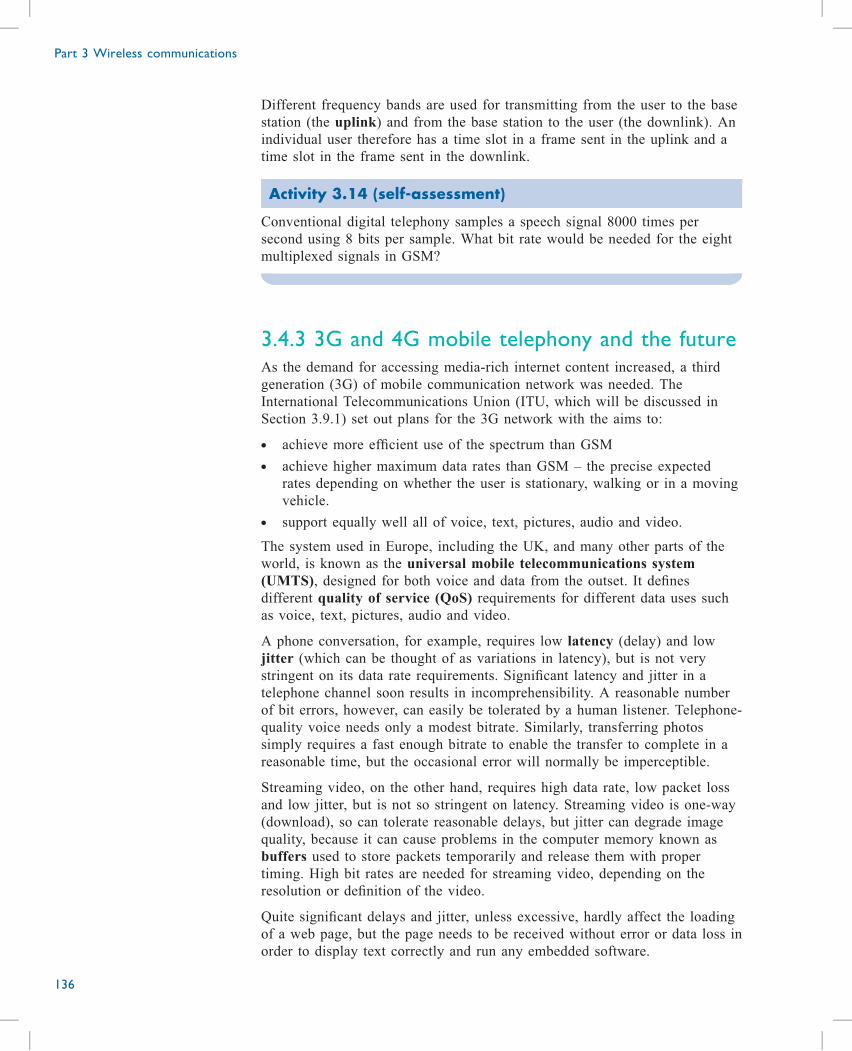
Different frequency bands are used for transmitting from the user to the base
station (the uplink) and from the base station to the user (the downlink). An
individual user therefore has a time slot in a frame sent in the uplink and a
time slot in the frame sent in the downlink.
Activity 3.14 (self-assessment)
Conventional digital telephony samples a speech signal 8000 times per
second using 8 bits per sample. What bit rate would be needed for the eight
multiplexed signals in GSM?
3.4.3 3G and 4G mobile telephony and the futureAs the demand for accessing media-rich internet content increased, a third
generation (3G) of mobile communication network was needed. The
International Telecommunications Union (ITU, which will be discussed in
Section 3.9.1) set out plans for the 3G network with the aims to:
. achieve more efficient use of the spectrum than GSM
. achieve higher maximum data rates than GSM – the precise expected
rates depending on whether the user is stationary, walking or in a moving
vehicle.
. support equally well all of voice, text, pictures, audio and video.
The system used in Europe, including the UK, and many other parts of the
world, is known as the universal mobile telecommunications system
(UMTS), designed for both voice and data from the outset. It defines
different quality of service (QoS) requirements for different data uses such
as voice, text, pictures, audio and video.
A phone conversation, for example, requires low latency (delay) and low
jitter (which can be thought of as variations in latency), but is not very
stringent on its data rate requirements. Significant latency and jitter in a
telephone channel soon results in incomprehensibility. A reasonable number
of bit errors, however, can easily be tolerated by a human listener. Telephone-
quality voice needs only a modest bitrate. Similarly, transferring photos
simply requires a fast enough bitrate to enable the transfer to complete in a
reasonable time, but the occasional error will normally be imperceptible.
Streaming video, on the other hand, requires high data rate, low packet loss
and low jitter, but is not so stringent on latency. Streaming video is one-way
(download), so can tolerate reasonable delays, but jitter can degrade image
quality, because it can cause problems in the computer memory known as
buffers used to store packets temporarily and release them with proper
timing. High bit rates are needed for streaming video, depending on the
resolution or definition of the video.
Quite significant delays and jitter, unless excessive, hardly affect the loading
of a web page, but the page needs to be received without error or data loss in
order to display text correctly and run any embedded software.
Part 3 Wireless communications
136
Activity 3.15 (self-assessment)
Fill in Table 3.2 concerning general quality of service requirements for the
application. Just use a plain-English word or phrase in each case.
Table 3.2
Bitrate Latency Jitter Error rate
Telephony
Photo upload/download
Streaming video
Downloading a web page
To achieve a more efficient use of the spectrum, UMTS has adopted
frequency bands and a bandwidth-sharing method that both differ from GSM.
The ITU initially allocated two 60 MHz bands for European UMTS: 1920–
1980 MHz for the uplink and 2110–2170 MHz for the downlink. As the
requirement for additional spectrum grew with the increased use of 3G
UMTS, more frequency allocations were agreed. Not all bands are available
in all countries, but the spectrum is managed on an international basis, to
ensure roaming.
Bandwidth sharing is achieved by a very different technique than in GSM
called code division, multiple access (CDMA). In CDMA, special codes are
used that enable separate streams of data (or voice calls) to be transmitted
simultaneously over the same frequency band, but which can then be
‘disentangled’ by signal processing at the receiver. CDMA will not be
discussed further in TM111.
Longer term, we have seen the widespread use of 4G systems, designed to
achieve:
. a high degree of commonality of the performance of systems worldwide
. capability of interworking with other systems using radio access
. higher peak data rates
. latency of just over half that of 3G
. quicker and smoother web browsing, plus new gaming and mobile
entertainment services.
Standard 4G is around five to seven times faster than 3G, offering theoretical
speeds of up to 150 Mbps – in practice, around 80 Mbps is possible – so files
can be downloaded in a correspondingly much shorter time. At the time of
writing (2016), 4G has become widely available in the UK and elsewhere,
and plans for the next generation of mobile systems, 5G, are under way. The
demand for increasing bitrate shows no sign of slowing, with ultra-high-
definition video streaming and large-scale machine-to-machine
communications, for example, bringing increasingly stringent demands.
3.4 Mobile telephony technologies
137
The current objectives of 5G include:
. providing a capacity that allows 1000 times more devices to be connected
than the current network
. having a target peak data rate of 10 Gbps for static users, 1 Gbps for low-
mobility users and no less than 100 Mbps in urban areas
. providing real-time interactive applications with no more than 1 µs
latency.
. ensuring a consistent user experience anytime and anywhere.
. greatly reducing power consumption.
However, at the time of writing, a number of distinguished
telecommunications experts have called into question the 5G project. William
Webb, for example, in the final chapter of his recent book The 5G Myth: And
Why Consistent Connectivity is a Better Future, concludes:
The key underlying rationale for previous generations and for 5G has been
to meet ever-growing user requirements for more data and faster
connectivity. Chapter 2 suggested that this trend is coming to an end.
Current mobile data speeds are more than adequate for all foreseeable uses.
Data growth is slowing and may plateau around 2027, with only around 2×
growth occurring during the 5G era. With 5G predicated predominantly on
higher speeds and also on its ability to deliver substantially enhanced data
capabilities, this suggests 5G may not be targeting the right areas.
[…]
[S]peed of data connection is now becoming less important than consistency
– the ability to be connected at a reasonable speed everywhere. Rather than
aiming for ever-faster connections it suggests that delivering enhanced
coverage in a number of known problematic locations such as trains and
rural areas would generate greater value for the economy and be preferred
by most consumers.
(Webb, 2016)
One major issue is to what extent 5G can build on progress in earlier
networks. Currently, 5G proposals would require wide-reaching changes
rather than evolution, as has been the case up to 4G. Essentially, this is a
classic socio-technological problem, involving economics, politics, and users,
and not simply developments in technology.
3.4.4 ConclusionVarious mobile telephony systems were presented: GSM, 3G, 4G, and
possible future developments. GSM architecture was described in some detail
as an example of the general principles of mobile telephony.
Time division multiplexing was introduced, and the concepts of time slots
and frames explained. The importance of quality of service parameters was
indicated in outline.
Part 3 Wireless communications
138
Wi-Fi, Bluetooth and ZigBee technologies
In this section, I’ll compare three technologies for short-range wireless data
transmission.
3.5.1 Wi-FiWi-Fi is a name given to wireless local area networking (WLAN) technology
that is compliant with the IEEE 802.11 family of standards. In other words,
Wi-Fi enables devices such as computers and printers to be wirelessly
connected together to form a local area network (LAN) – as you saw in
Subsection 3.1.1. Wi-Fi networks are also used to enable mobile devices,
such as laptop computers and mobile phones, to connect to the internet. This
application of Wi-Fi is now common in public places such as airports, cafés
and libraries, with a range of up to about 100 m. Long-distance systems are
also possible, operating over several kilometres.
In wireless LANs, nodes (laptops, mobile phones, router, switch, etc.) are
usually referred to as stations, acknowledging the fact that each
communicating device acts as a radio station with a transmitter and a
receiver. In each station, the connection to the network is provided by a
wireless network interface card (NIC). In order to connect to a Wi-Fi
network, a station needs to know the name of the network. This is also
known as the service set identifier (SSID) of the wireless LAN; the ‘service
set’ referred to here is the set of wireless devices to be served by a particular
wireless LAN. The SSID allows the nodes on a wireless LAN to distinguish
themselves from nodes on other wireless LANs that may be operating in the
same physical space. For example, in many airports, mobile phone companies
provide free wireless LAN services to their customers and use the SSID to
ensure that customers connect to the appropriate Wi-Fi network. (Note that it
is possible to hide the SSID of the network, but this is not recommended as a
security feature.)
In order to allow multiple networks to be collocated, the Wi-Fi standard
specifies 13 distinct channels (or frequency ranges) in the widely used 2.4
GHz band. Wi-Fi stations can be configured such that a particular SSID
operates on a particular channel; by making sure that the channels used by
different SSIDs are different, interference between wireless networks can be
minimised.
The SSID is typically a name that identifies the owner of the network or the
organisation responsible for it, although technically it can be anything up to
32 characters in length. For example, the Open University campus provides
Wi-Fi networks with SSIDs ‘oustaff’ and ‘The Cloud’. Connecting to
‘oustaff’ allows the wireless station to function as another node on the main
OU network. ‘The Cloud’ network, on the other hand, allows only limited
access to resources such as email and web browsing.
3.5 Wi-Fi, Bluetooth and ZigBee technologies
139
3.5
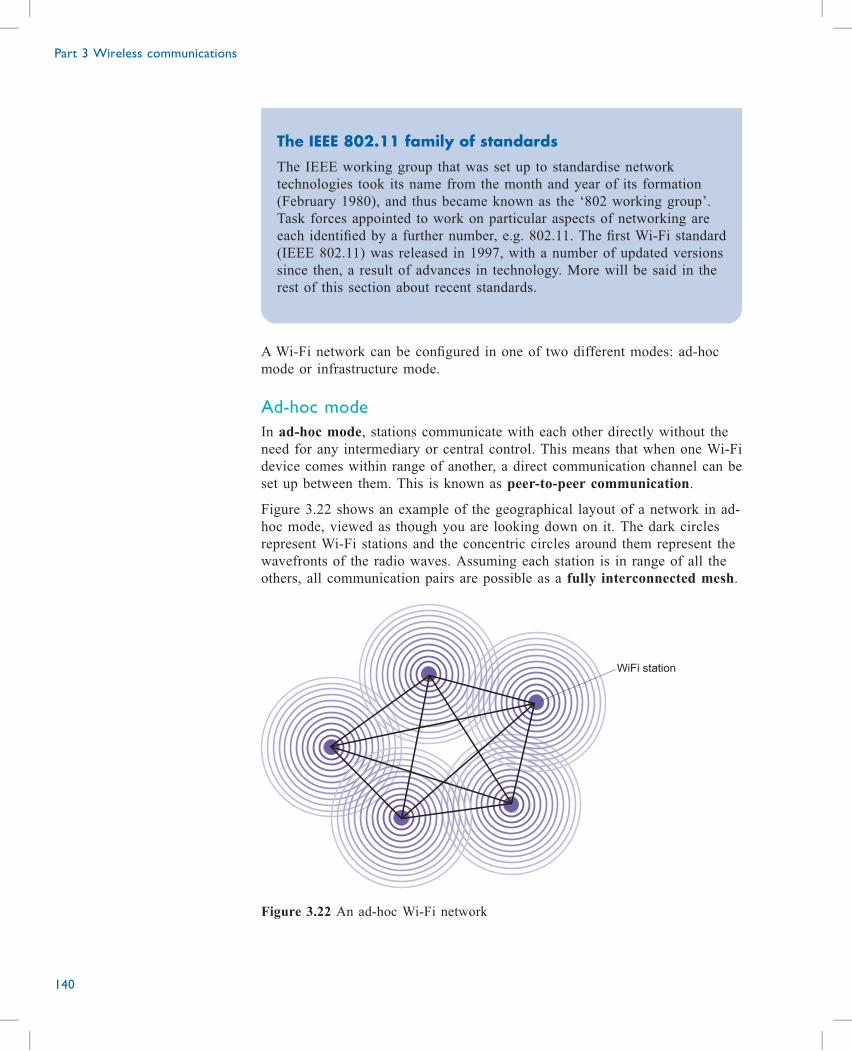
The IEEE 802.11 family of standards
The IEEE working group that was set up to standardise network
technologies took its name from the month and year of its formation
(February 1980), and thus became known as the ‘802 working group’.
Task forces appointed to work on particular aspects of networking are
each identified by a further number, e.g. 802.11. The first Wi-Fi standard
(IEEE 802.11) was released in 1997, with a number of updated versions
since then, a result of advances in technology. More will be said in the
rest of this section about recent standards.
A Wi-Fi network can be configured in one of two different modes: ad-hoc
mode or infrastructure mode.
Ad-hoc mode
In ad-hoc mode, stations communicate with each other directly without the
need for any intermediary or central control. This means that when one Wi-Fi
device comes within range of another, a direct communication channel can be
set up between them. This is known as peer-to-peer communication.
Figure 3.22 shows an example of the geographical layout of a network in ad-
hoc mode, viewed as though you are looking down on it. The dark circles
represent Wi-Fi stations and the concentric circles around them represent the
wavefronts of the radio waves. Assuming each station is in range of all the
others, all communication pairs are possible as a fully interconnected mesh.
WiFi station
Figure 3.22 An ad-hoc Wi-Fi network
Part 3 Wireless communications
140
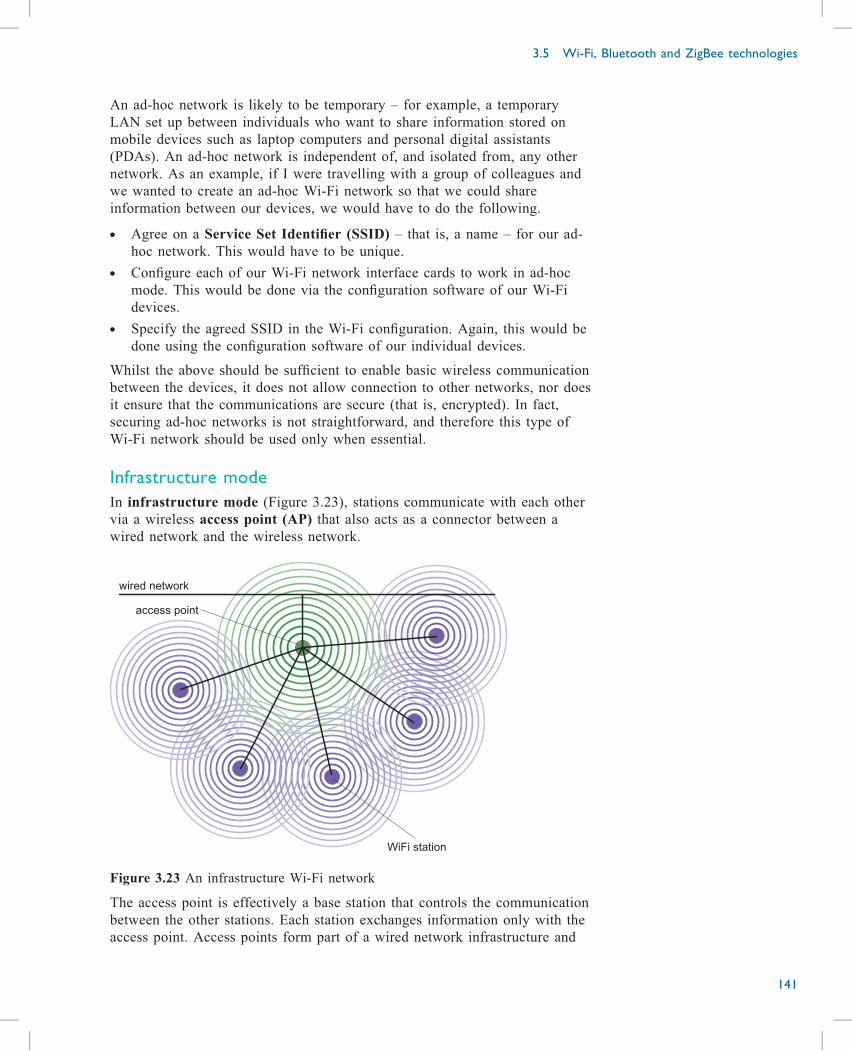
An ad-hoc network is likely to be temporary – for example, a temporary
LAN set up between individuals who want to share information stored on
mobile devices such as laptop computers and personal digital assistants
(PDAs). An ad-hoc network is independent of, and isolated from, any other
network. As an example, if I were travelling with a group of colleagues and
we wanted to create an ad-hoc Wi-Fi network so that we could share
information between our devices, we would have to do the following.
. Agree on a Service Set Identifier (SSID) – that is, a name – for our ad-
hoc network. This would have to be unique.
. Configure each of our Wi-Fi network interface cards to work in ad-hoc
mode. This would be done via the configuration software of our Wi-Fi
devices.
. Specify the agreed SSID in the Wi-Fi configuration. Again, this would be
done using the configuration software of our individual devices.
Whilst the above should be sufficient to enable basic wireless communication
between the devices, it does not allow connection to other networks, nor does
it ensure that the communications are secure (that is, encrypted). In fact,
securing ad-hoc networks is not straightforward, and therefore this type of
Wi-Fi network should be used only when essential.
Infrastructure mode
In infrastructure mode (Figure 3.23), stations communicate with each other
via a wireless access point (AP) that also acts as a connector between a
wired network and the wireless network.
WiFi station
access point
wired network
Figure 3.23 An infrastructure Wi-Fi network
The access point is effectively a base station that controls the communication
between the other stations. Each station exchanges information only with the
access point. Access points form part of a wired network infrastructure and
3.5 Wi-Fi, Bluetooth and ZigBee technologies
141
are not mobile. Infrastructure mode Wi-Fi networks are used in public spaces
such as cafés, libraries and airports to enable mobile users to connect to the
internet. They are also used in offices and homes to provide network
connectivity without the need for expensive cabling to be installed. For
example, in an office setting, a single Wi-Fi access point in a meeting room
can provide a network connection for all participants in a meeting, whereas a
single wired connection can be used easily by only one person.
Structure of messages
Earlier I explained how each Wi-Fi network has an associated SSID that
distinguishes it from other networks operating in the same physical location.
Additionally, each station needs a way of distinguishing itself from all the
others on the network, and so each station is assigned an identity number
known as its media access control (MAC) address. This can be thought of
as an address that other stations use when they want to send data to a
particular destination.
Messages between stations are not sent in one continuous stream, but are
broken up into frames, sent one at a time. No two stations can transmit at the
same time, but a station does not necessarily have sole use of the
communication channel when it wants to send a message; it may need to take
turns with other stations in sending out frames. Each frame includes some
information that enables it to be routed through the network and delivered to
the intended destination. All frames include the MAC address of both the
destination station and the sending station, as well as the mode of operation
(infrastructure or ad hoc) that the sending station is configured to use. In the
case of an infrastructure network, all communication is done through the
access point, and therefore the frame also includes the address of the access
point.
In ad-hoc wireless networks, frames are not routed specifically to the
destination station, but are broadcast to be received by every station that is
in range of the sending station; thus, each receiving station reads the
destination addresses of the different frames it receives and picks out those in
which the destination address matches its own. In both ad-hoc and
infrastructure modes, a Wi-Fi station determines whether it is in range of
another station (or access point) by broadcasting an enquiry, known as a
probe request frame. If the sending station is in infrastructure mode, then
only access points in range of this station will respond.
Data rates
Just as for wired networks, developments in technology have increased the
achievable data rates since the first Wi-Fi standard was produced. For
example, 802.11ac can achieve several Gbps, albeit under special conditions.
Attenuation and interference
Lower signal strength results in a lower data rate because the lower-strength
signal is more sensitive to interference. When interference causes errors in
the transmission, the data needs to be retransmitted, resulting in a lower
Part 3 Wireless communications
142
effective data rate. Hence, with signal attenuation, the effective data rate
reduces with distance from the access point (or, in the case of an ad-hoc
network, with distance from other stations).
Physical barriers such as partitions and walls further reduce the maximum
rate possible at a given distance from the access point. Table 3.3 shows the
typical effect of such barriers within a building. The characterisation of Wi-Fi
signal strength is simply a rough description; the actual data rate achieved
will vary according to the precise system being used and its physical
surroundings.
Table 3.3 Typical internal attenuation in a building
Location Obstacles between station and
Wi-Fi access point
Wi-Fi signal
strength
Data rate
(Mbps)
Second-floor
lobby
Several thin partition walls,
several doors
Very good 9.8
Stairwell Several thin partition walls,
concrete wall, several doors
Good 6.8
Lift Several thin partition walls,
concrete wall, several doors,
metal lift door and walls
Low 3.3
Activity 3.16 (exploratory)
If you use Wi-Fi at home, work or in a public space, investigate qualitatively
how the signal strength varies as you move around. You can do this by
simply looking at the symbols often displayed somewhere on the screen to
represent the signal strength. The symbols may look like Figure 3.24 or
Figure 3.25.
Figure 3.24
Figure 3.25
Alternatively, you can call up the Wi-Fi settings, which might give a
description or graphic to indicate the signal as ‘poor’, ‘fair’, ‘good’ or
similar. For example, on my laptop I can see Figure 3.26, with the five bars
indicating a very strong signal.
3.5 Wi-Fi, Bluetooth and ZigBee technologies
143
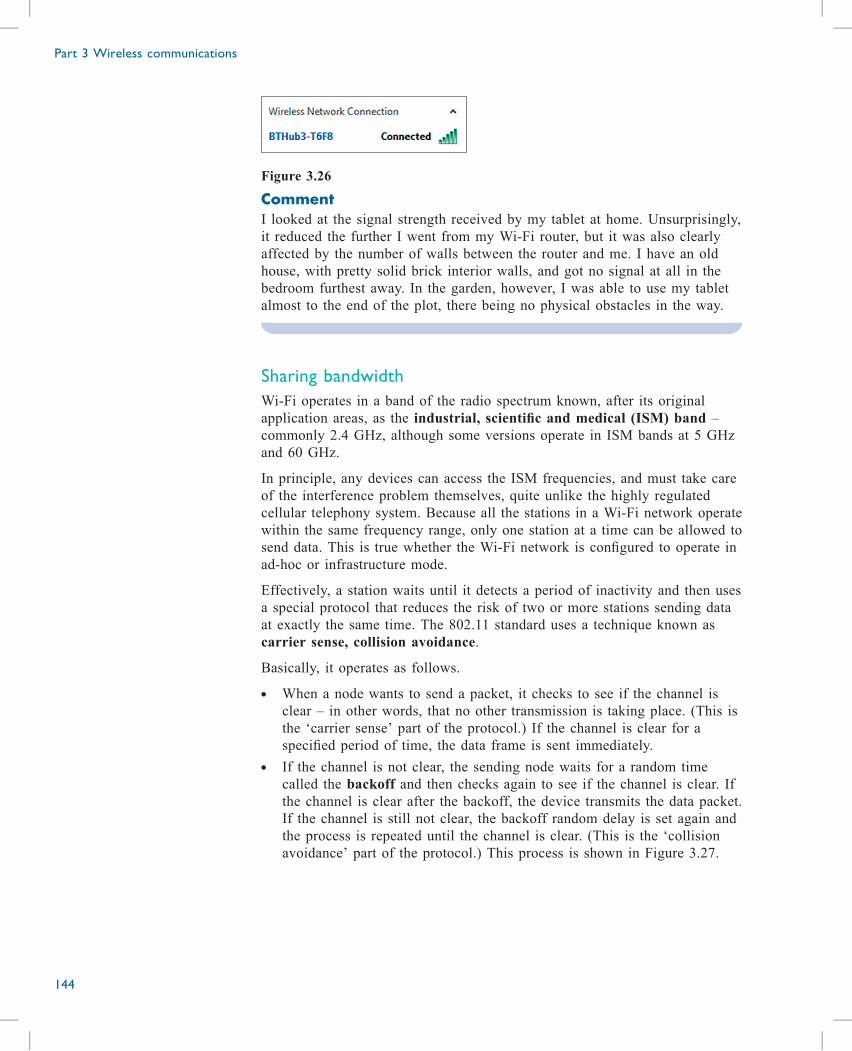
Figure 3.26
CommentI looked at the signal strength received by my tablet at home. Unsurprisingly,
it reduced the further I went from my Wi-Fi router, but it was also clearly
affected by the number of walls between the router and me. I have an old
house, with pretty solid brick interior walls, and got no signal at all in the
bedroom furthest away. In the garden, however, I was able to use my tablet
almost to the end of the plot, there being no physical obstacles in the way.
Sharing bandwidth
Wi-Fi operates in a band of the radio spectrum known, after its original
application areas, as the industrial, scientific and medical (ISM) band –
commonly 2.4 GHz, although some versions operate in ISM bands at 5 GHz
and 60 GHz.
In principle, any devices can access the ISM frequencies, and must take care
of the interference problem themselves, quite unlike the highly regulated
cellular telephony system. Because all the stations in a Wi-Fi network operate
within the same frequency range, only one station at a time can be allowed to
send data. This is true whether the Wi-Fi network is configured to operate in
ad-hoc or infrastructure mode.
Effectively, a station waits until it detects a period of inactivity and then uses
a special protocol that reduces the risk of two or more stations sending data
at exactly the same time. The 802.11 standard uses a technique known as
carrier sense, collision avoidance.
Basically, it operates as follows.
. When a node wants to send a packet, it checks to see if the channel is
clear – in other words, that no other transmission is taking place. (This is
the ‘carrier sense’ part of the protocol.) If the channel is clear for a
specified period of time, the data frame is sent immediately.
. If the channel is not clear, the sending node waits for a random time
called the backoff and then checks again to see if the channel is clear. If
the channel is clear after the backoff, the device transmits the data packet.
If the channel is still not clear, the backoff random delay is set again and
the process is repeated until the channel is clear. (This is the ‘collision
avoidance’ part of the protocol.) This process is shown in Figure 3.27.
Part 3 Wireless communications
144
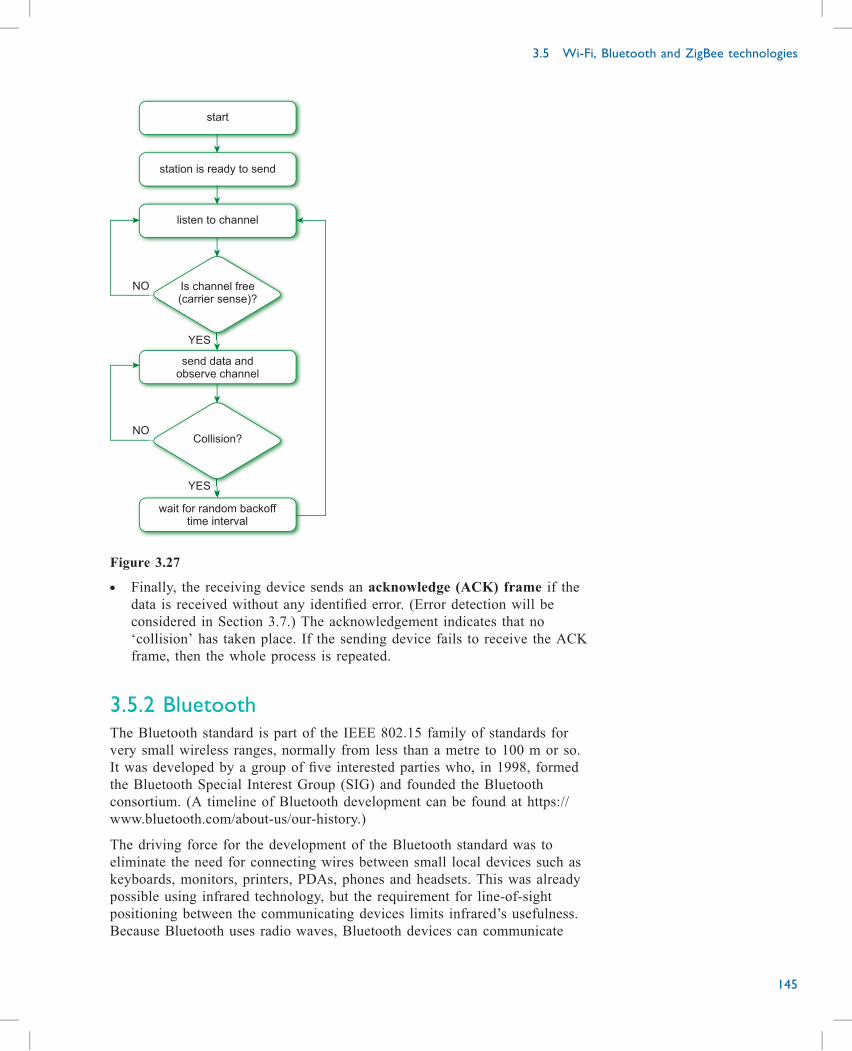
NO
NO
YES
YES
station is ready to send
listen to channel
Is channel free(carrier sense)?
wait for random backofftime interval
start
send data andobserve channel
Collision?
Figure 3.27
. Finally, the receiving device sends an acknowledge (ACK) frame if the
data is received without any identified error. (Error detection will be
considered in Section 3.7.) The acknowledgement indicates that no
‘collision’ has taken place. If the sending device fails to receive the ACK
frame, then the whole process is repeated.
3.5.2 BluetoothThe Bluetooth standard is part of the IEEE 802.15 family of standards for
very small wireless ranges, normally from less than a metre to 100 m or so.
It was developed by a group of five interested parties who, in 1998, formed
the Bluetooth Special Interest Group (SIG) and founded the Bluetooth
consortium. (A timeline of Bluetooth development can be found at https://
www.bluetooth.com/about-us/our-history.)
The driving force for the development of the Bluetooth standard was to
eliminate the need for connecting wires between small local devices such as
keyboards, monitors, printers, PDAs, phones and headsets. This was already
possible using infrared technology, but the requirement for line-of-sight
positioning between the communicating devices limits infrared’s usefulness.
Because Bluetooth uses radio waves, Bluetooth devices can communicate
3.5 Wi-Fi, Bluetooth and ZigBee technologies
145
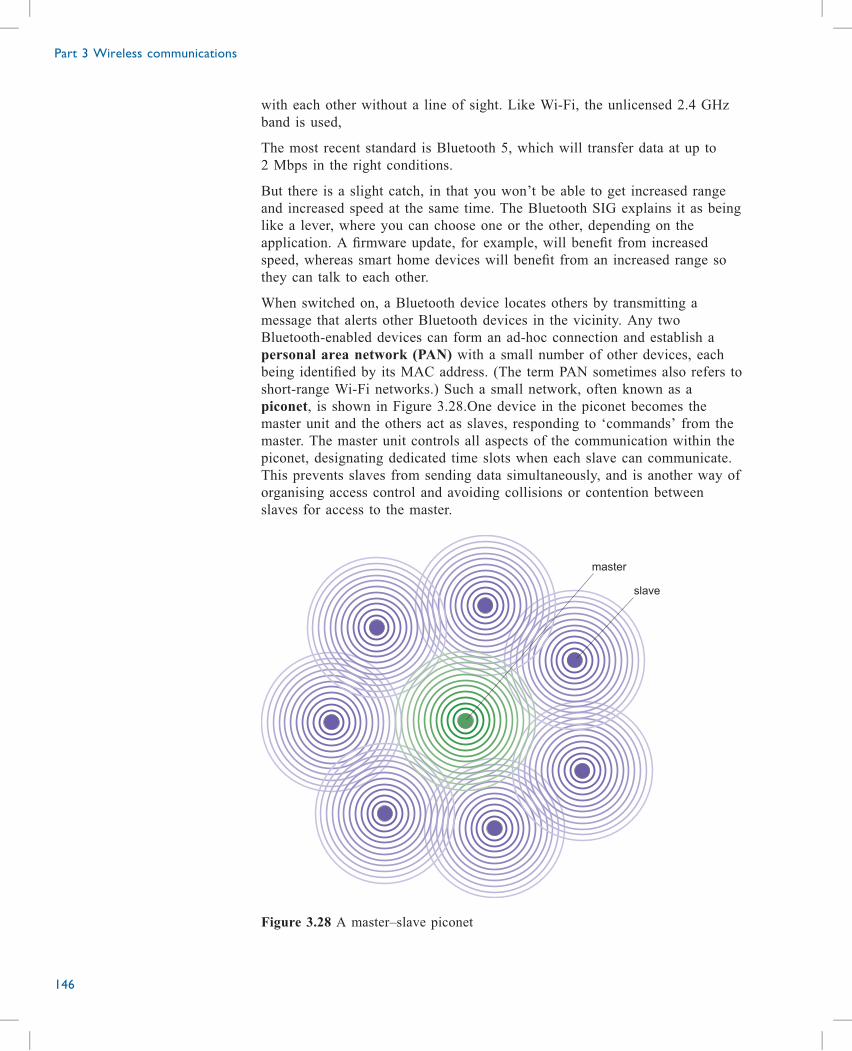
with each other without a line of sight. Like Wi-Fi, the unlicensed 2.4 GHz
band is used,
The most recent standard is Bluetooth 5, which will transfer data at up to
2 Mbps in the right conditions.
But there is a slight catch, in that you won’t be able to get increased range
and increased speed at the same time. The Bluetooth SIG explains it as being
like a lever, where you can choose one or the other, depending on the
application. A firmware update, for example, will benefit from increased
speed, whereas smart home devices will benefit from an increased range so
they can talk to each other.
When switched on, a Bluetooth device locates others by transmitting a
message that alerts other Bluetooth devices in the vicinity. Any two
Bluetooth-enabled devices can form an ad-hoc connection and establish a
personal area network (PAN) with a small number of other devices, each
being identified by its MAC address. (The term PAN sometimes also refers to
short-range Wi-Fi networks.) Such a small network, often known as a
piconet, is shown in Figure 3.28.One device in the piconet becomes the
master unit and the others act as slaves, responding to ‘commands’ from the
master. The master unit controls all aspects of the communication within the
piconet, designating dedicated time slots when each slave can communicate.
This prevents slaves from sending data simultaneously, and is another way of
organising access control and avoiding collisions or contention between
slaves for access to the master.
slave
master
Figure 3.28 A master–slave piconet
Part 3 Wireless communications
146
When there is a need for more active devices to form a network, two or more
piconets can be connected together into what is known as a scatternet. In
this arrangement, every piconet must have one master. A device could be a
slave in one piconet and a master in another, but a device cannot act as
master in more than one piconet. Information can then be passed from
piconet to piconet under the control of the piconets’ master units. Figure 3.29
shows a scatternet made up of two piconets.
slave
piconet 1
piconet 2
master
(this device is master
in piconet 1, buta
slave in piconet 2.)
master
(this device is master
in piconet 2, buta
slave in piconet 1.)
Figure 3.29 A scatternet
The power classes output of a Bluetooth device is described in terms of five
classes:
. Class 1 has a maximum output power of 100 mW, with a maximum range
of 100 m
. Class 2 has a maximum output power of 2.5 mW, with a maximum range
of 10 m
. Class 3 has a maximum output power of 1 mW, with a maximum range of
<10 m
. Class 4 has a maximum output power of <150 mW, with a maximum
range of 50 m
. Class 5 has a maximum output power of 1–100 mW, with a maximum
range depending on bitrate.
3.5 Wi-Fi, Bluetooth and ZigBee technologies
147
Bluetooth classes have a lower power output than Wi-Fi devices, which may
be well over 100 mW, although generally of the order of 20–100 mW. With
the earlier standards, as the power output decreases, the range also decreases,
so the class used will depend upon the application. Class 2 is popularly used
for mobile phones, headsets and computer peripherals. Class 1 has more
business/industry applications, but some types of devices can use different
classes.
Bluetooth communication range is limited depending on the class, but this
distance may in fact be reduced by physical obstructions and the need for
management data. The most recent, Bluetooth Class 5, can trade off bitrate
against range – up to hundreds of metres for a line-of-sight link.
Activity 3.17 (self-assessment)
State what the following abbreviations stand for. What is their purpose and/or
application area?
SSID
MAC
PAN
ACK
3.5.3 ZigBeeLet’s now turn to ZigBee, the third of the small-range systems under
consideration – again used in PANs. In the activity below, you will look at a
website that appears to give useful information about ZigBee and other
technologies. I will ask you to assess the reliability of the website.
You will need to develop skills in researching and evaluating information,
particularly at higher levels of study. You should develop the habit of
critically thinking about the reliability of websites and other documents, and
do it regularly when you are doing background reading or further research on
a topic.
So how can we decide on whether this site is reliable and authoritative? Good
questions to ask are as follows:
. Who wrote it?
. For what organisation?
. Are there any evaluations of a website?
. Is the source cited by anyone else? Who?
Part 3 Wireless communications
148
Activity 3.18 (exploratory)
This activity asks you to assess the reliability of a free online resource.
See what you can find about this site and the tutorial. Do you think it is
reliable and authoritative?
Additional support and guidance (optional)
If you would like to access Library resources that can help you to critically
evaulate websites, these can also be found on the module website.
Now read the extract below, which I have compiled from parts of the website
you looked at in the last activity. Make brief notes on the similarities and
differences between Bluetooth and ZigBee. (You are not expected to read
through any other ZigBee material on the site.)
Extract 3.1
When you hold a TV remote and wish to use it, you have to necessarily
point your control at the device. This one-way, line-of-sight, short-range
communication uses infrared (IR) sensors to enable communication and
control and it is possible to operate the TV remotely only with its
control unit. Add other home theatre modules, an air-conditioner and
remotely enabled fans and lights to your room, and you become a
juggler who has to handle not only these remotes, but also more
numbers that will accompany other home appliances you are likely to
use. Some remotes do serve to control more than one device after
‘memorizing’ access codes, but this interoperability is restricted to a set
of related equipment, like the different units of a home entertainment
system.
Now picture a home with entertainment units, security systems including
fire alarm, smoke detector and burglar alarm, air-conditioners and
kitchen appliances all within whispering distance from each other and
imagine a single unit that talks with all the devices, no longer depending
on line-of-sight, and traffic no longer being one-way. This means that
the devices and the control unit would all need a common standard to
enable intelligible communication. ZigBee is such a standard for
embedded application software and was ratified in late 2004 under
IEEE 802.15.4 Wireless Networking Standards.
ZigBee is an established set of specifications for wireless personal area
networking (WPAN) – that is, digital radio connections between
computers and related devices. This kind of network eliminates use of
physical data buses like USB and Ethernet cables. The devices could
include telephones, hand-held digital assistants, sensors and controls
located within a few meters of each other. [More recently, ZigBee has
been developed for use with the more complex sensor applications
3.5 Wi-Fi, Bluetooth and ZigBee technologies
149
found in healthcare and in the commercial and industrial automation
sectors.]
ZigBee is one of the global standards of communication protocol
formulated by the relevant task force under the IEEE 802.15 working
group. The fourth in the series, WPAN Low Rate/ZigBee is the newest
and provides specifications for devices that have low data rates,
consume very low power and are thus characterized by long battery life.
The ZigBee Alliance has been set up as an association of companies
working together to enable reliable, cost-effective, low-power, wirelessly
networked products based on an open global standard. After paying a
fee, manufacturers have access to the standard and can implement it in
their products; Philips, Motorola, Intel, HP are all members. ZigBee
technology is embedded in a wide range of products and applications
across consumer, commercial, industrial and government markets, giving
companies a standards-based wireless platform optimized for the needs
of remote monitoring and control applications, including reliability, low-
cost and low-power.
The target networks encompass a wide range of devices with low data
rates in the Industrial, Scientific and Medical (ISM) radio bands, with
building-automation controls like intruder/fire alarms, thermostats and
remote (wireless) switches, video/audio remote controls likely to be the
most popular applications. ZigBee characteristics include:
. The use of license-free bands at 2.4 GHz (worldwide), 902–928 MHz
(North America, Australia) and 865~870 MHz (Europe). The maximum
data rate possible depends on the Class.
. Low power consumption, with battery life ranging from months to
years. Considering the number of devices with remotes in use at
present, it is easy to see that more and more batteries needing to be
replaced every so often, entailing regular (as well as timely), recurring
expenditure. In the ZigBee standard, longer battery life is achievable by
either of two means: continuous network connection and slow but sure
battery drain, or intermittent connection and even slower battery drain
[including a ‘sleep’ mode].
. High throughput and low latency
. Channel access which senses other devices and avoids collisions
. 50m typical range
. Various network topologies, including star (Figure 3.30) and mesh
(Figure 3.31).
Part 3 Wireless communications
150
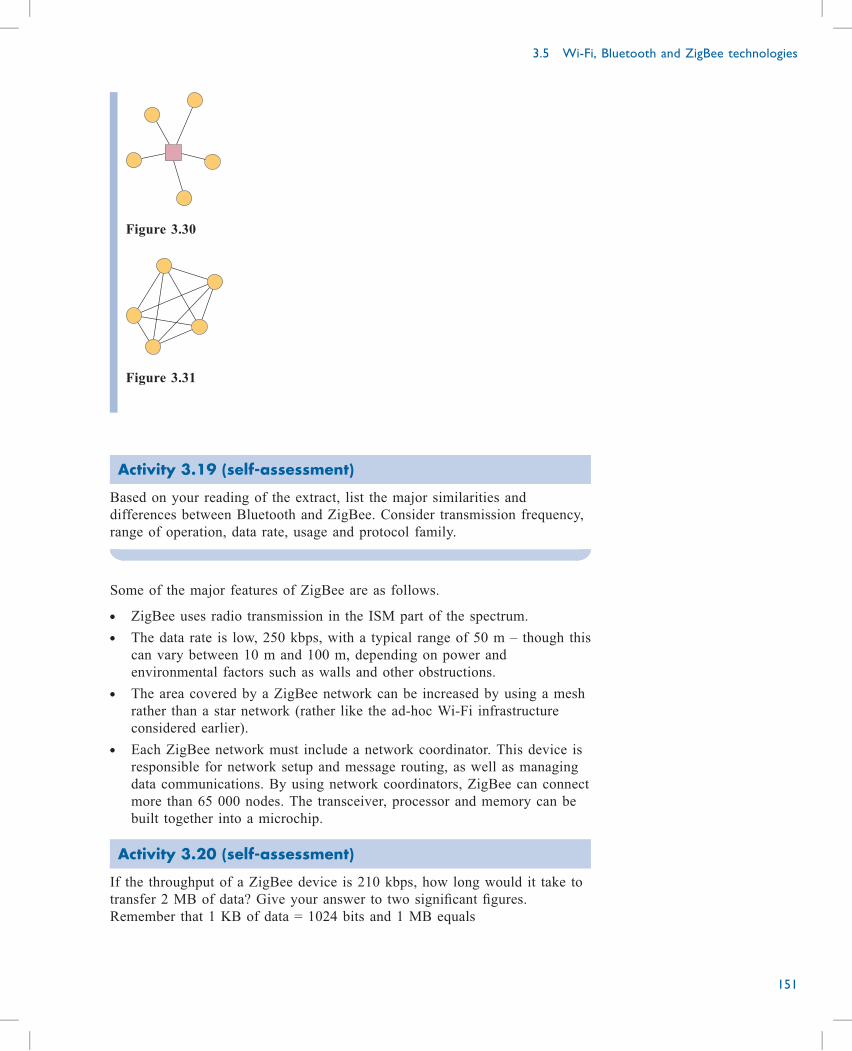
Figure 3.30
Figure 3.31
Activity 3.19 (self-assessment)
Based on your reading of the extract, list the major similarities and
differences between Bluetooth and ZigBee. Consider transmission frequency,
range of operation, data rate, usage and protocol family.
Some of the major features of ZigBee are as follows.
. ZigBee uses radio transmission in the ISM part of the spectrum.
. The data rate is low, 250 kbps, with a typical range of 50 m – though this
can vary between 10 m and 100 m, depending on power and
environmental factors such as walls and other obstructions.
. The area covered by a ZigBee network can be increased by using a mesh
rather than a star network (rather like the ad-hoc Wi-Fi infrastructure
considered earlier).
. Each ZigBee network must include a network coordinator. This device is
responsible for network setup and message routing, as well as managing
data communications. By using network coordinators, ZigBee can connect
more than 65 000 nodes. The transceiver, processor and memory can be
built together into a microchip.
Activity 3.20 (self-assessment)
If the throughput of a ZigBee device is 210 kbps, how long would it take to
transfer 2 MB of data? Give your answer to two significant figures.
Remember that 1 KB of data = 1024 bits and 1 MB equals
3.5 Wi-Fi, Bluetooth and ZigBee technologies
151
1024 × 1024 bytes. This is in contrast to lower case k (kilo) = 1000 and
M (mega) = 1000 000 used to measure bits per second.
Activity 3.21 (self-assessment)
The maximum data rate for ZigBee is specified as 250 kbps and Bluetooth’s
maximum data rate is 1 Mbps. How many times greater is Bluetooth’s
maximum data rate than ZigBee’s maximum data rate?
3.5.4 ConclusionThree technologies for short-range wireless data transmission were discussed:
Wi-Fi, Bluetooth and ZigBee. These systems typically use low power
transmission in the licence-free bands over distances from a less than a metre
to a 100 metres or so – although long-distance Wi-Fi with a range of several
kilometres is also possible.
Wi-Fi operates either in ad-hoc or infrastructure mode; the latter is the well-
known way of connecting individual stations to a larger network such as the
internet. Bluetooth connects individual stations using one or more piconets,
while ZigBee adopts a number of small-scale topologies such as star or mesh
networks.
Part 3 Wireless communications
152
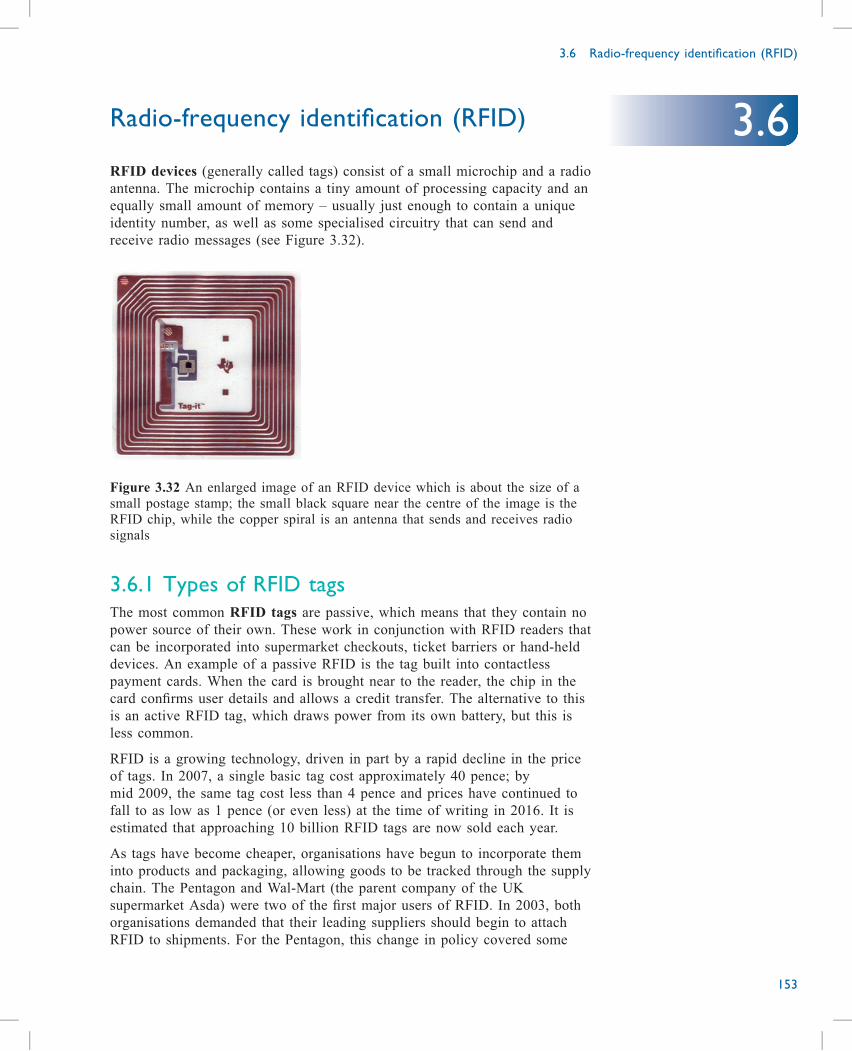
Radio-frequency identification (RFID)
RFID devices (generally called tags) consist of a small microchip and a radio
antenna. The microchip contains a tiny amount of processing capacity and an
equally small amount of memory – usually just enough to contain a unique
identity number, as well as some specialised circuitry that can send and
receive radio messages (see Figure 3.32).
Figure 3.32 An enlarged image of an RFID device which is about the size of a
small postage stamp; the small black square near the centre of the image is the
RFID chip, while the copper spiral is an antenna that sends and receives radio
signals
3.6.1 Types of RFID tagsThe most common RFID tags are passive, which means that they contain no
power source of their own. These work in conjunction with RFID readers that
can be incorporated into supermarket checkouts, ticket barriers or hand-held
devices. An example of a passive RFID is the tag built into contactless
payment cards. When the card is brought near to the reader, the chip in the
card confirms user details and allows a credit transfer. The alternative to this
is an active RFID tag, which draws power from its own battery, but this is
less common.
RFID is a growing technology, driven in part by a rapid decline in the price
of tags. In 2007, a single basic tag cost approximately 40 pence; by
mid 2009, the same tag cost less than 4 pence and prices have continued to
fall to as low as 1 pence (or even less) at the time of writing in 2016. It is
estimated that approaching 10 billion RFID tags are now sold each year.
As tags have become cheaper, organisations have begun to incorporate them
into products and packaging, allowing goods to be tracked through the supply
chain. The Pentagon and Wal-Mart (the parent company of the UK
supermarket Asda) were two of the first major users of RFID. In 2003, both
organisations demanded that their leading suppliers should begin to attach
RFID to shipments. For the Pentagon, this change in policy covered some
3.6 Radio-frequency identification (RFID)
153
3.6
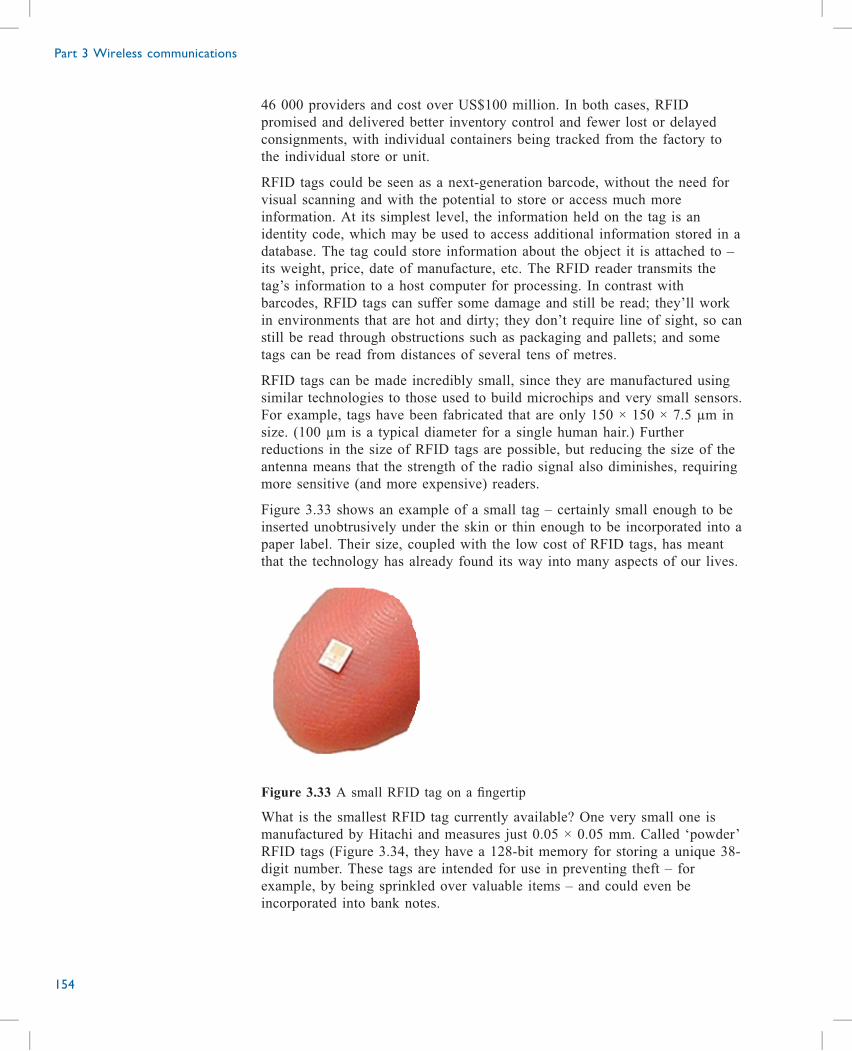
46 000 providers and cost over US$100 million. In both cases, RFID
promised and delivered better inventory control and fewer lost or delayed
consignments, with individual containers being tracked from the factory to
the individual store or unit.
RFID tags could be seen as a next-generation barcode, without the need for
visual scanning and with the potential to store or access much more
information. At its simplest level, the information held on the tag is an
identity code, which may be used to access additional information stored in a
database. The tag could store information about the object it is attached to –
its weight, price, date of manufacture, etc. The RFID reader transmits the
tag’s information to a host computer for processing. In contrast with
barcodes, RFID tags can suffer some damage and still be read; they’ll work
in environments that are hot and dirty; they don’t require line of sight, so can
still be read through obstructions such as packaging and pallets; and some
tags can be read from distances of several tens of metres.
RFID tags can be made incredibly small, since they are manufactured using
similar technologies to those used to build microchips and very small sensors.
For example, tags have been fabricated that are only 150 × 150 × 7.5 µm in
size. (100 µm is a typical diameter for a single human hair.) Further
reductions in the size of RFID tags are possible, but reducing the size of the
antenna means that the strength of the radio signal also diminishes, requiring
more sensitive (and more expensive) readers.
Figure 3.33 shows an example of a small tag – certainly small enough to be
inserted unobtrusively under the skin or thin enough to be incorporated into a
paper label. Their size, coupled with the low cost of RFID tags, has meant
that the technology has already found its way into many aspects of our lives.
Figure 3.33 A small RFID tag on a fingertip
What is the smallest RFID tag currently available? One very small one is
manufactured by Hitachi and measures just 0.05 × 0.05 mm. Called ‘powder’
RFID tags (Figure 3.34, they have a 128-bit memory for storing a unique 38-
digit number. These tags are intended for use in preventing theft – for
example, by being sprinkled over valuable items – and could even be
incorporated into bank notes.
Part 3 Wireless communications
154
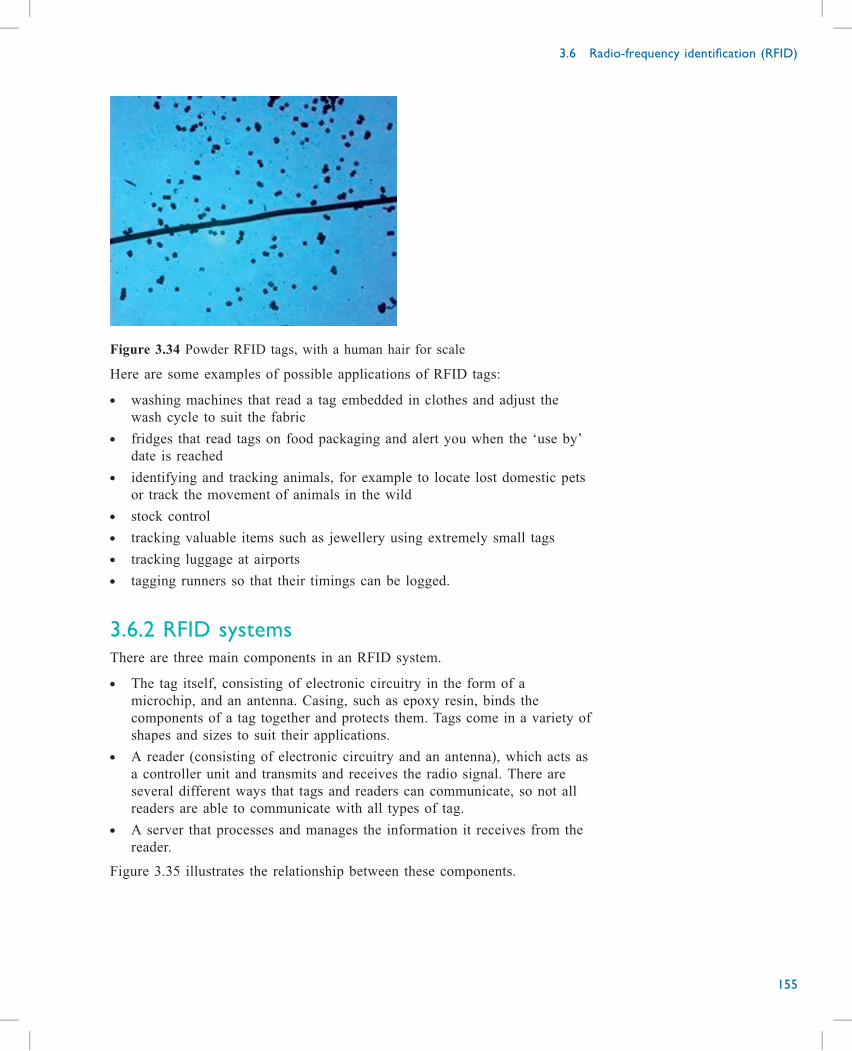
Figure 3.34 Powder RFID tags, with a human hair for scale
Here are some examples of possible applications of RFID tags:
. washing machines that read a tag embedded in clothes and adjust the
wash cycle to suit the fabric
. fridges that read tags on food packaging and alert you when the ‘use by’
date is reached
. identifying and tracking animals, for example to locate lost domestic pets
or track the movement of animals in the wild
. stock control
. tracking valuable items such as jewellery using extremely small tags
. tracking luggage at airports
. tagging runners so that their timings can be logged.
3.6.2 RFID systemsThere are three main components in an RFID system.
. The tag itself, consisting of electronic circuitry in the form of a
microchip, and an antenna. Casing, such as epoxy resin, binds the
components of a tag together and protects them. Tags come in a variety of
shapes and sizes to suit their applications.
. A reader (consisting of electronic circuitry and an antenna), which acts as
a controller unit and transmits and receives the radio signal. There are
several different ways that tags and readers can communicate, so not all
readers are able to communicate with all types of tag.
. A server that processes and manages the information it receives from the
reader.
Figure 3.35 illustrates the relationship between these components.
3.6 Radio-frequency identification (RFID)
155
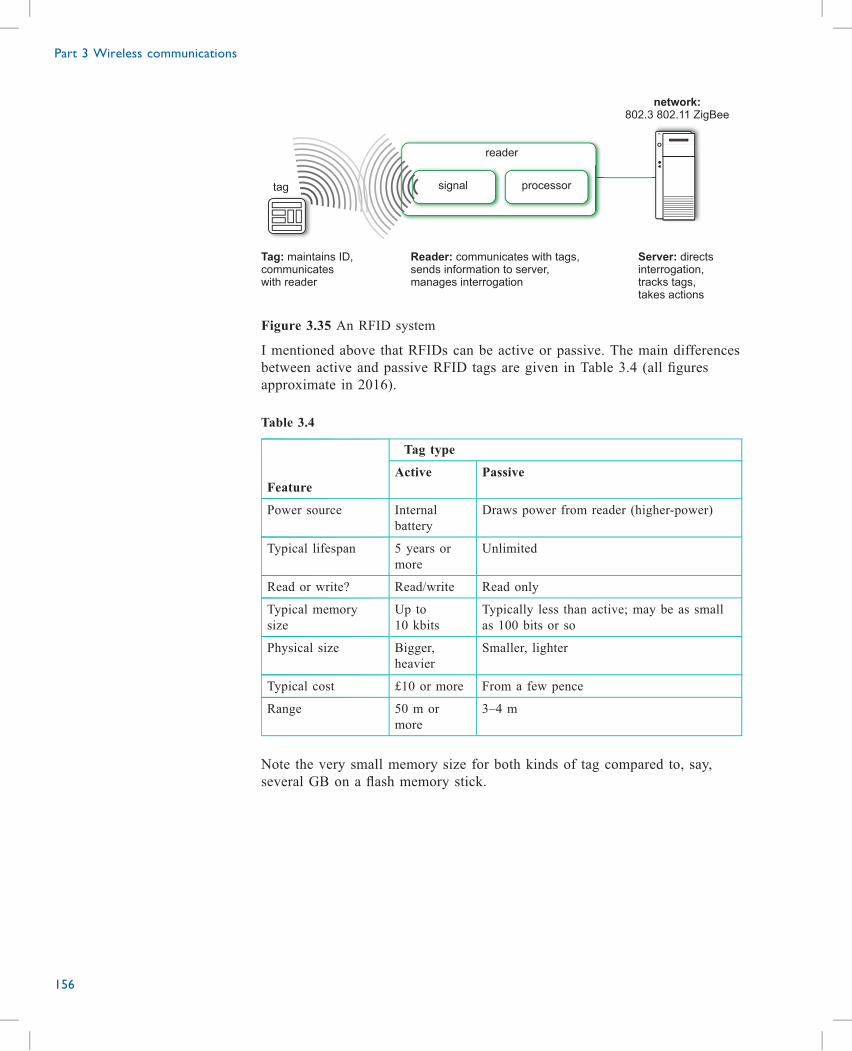
tag
Tag: maintains ID,communicateswith reader
reader
signal processor
network:802.3 802.11 ZigBee
Reader: communicates with tags,sends information to server,manages interrogation
Server: directsinterrogation,tracks tags,takes actions
Figure 3.35 An RFID system
I mentioned above that RFIDs can be active or passive. The main differences
between active and passive RFID tags are given in Table 3.4 (all figures
approximate in 2016).
Table 3.4
Feature
Tag type
Active Passive
Power source Internal
battery
Draws power from reader (higher-power)
Typical lifespan 5 years or
more
Unlimited
Read or write? Read/write Read only
Typical memory
size
Up to
10 kbits
Typically less than active; may be as small
as 100 bits or so
Physical size Bigger,
heavier
Smaller, lighter
Typical cost £10 or more From a few pence
Range 50 m or
more
3–4 m
Note the very small memory size for both kinds of tag compared to, say,
several GB on a flash memory stick.
Part 3 Wireless communications
156
3.6.3 ConclusionRFID devices (generally called tags) consist of a small microchip, a radio
antenna, plus a tiny amount of processing capacity and memory. The most
common RFID tags are passive (they contain no power source of their own).
These work in conjunction with RFID readers that emit a low-powered radio
signal that activates the chip in the tag, such as a contactless payment card.
When the card is brought near to the reader, the chip in the card confirms
user details and allows a credit transfer. The alternative to this is an active
RFID tag, which draws power from its own battery, but this is less common.
Tags can be made incredibly small; for example, devices have been fabricated
that are only 150 × 150 × 7.5 µm in size.
3.6 Radio-frequency identification (RFID)
157
Error correction
All transmitted data signals suffer from the occasional error – that is, a 1 is
misinterpreted as a 0 or vice versa. A somewhat artificial analogy of two
people trying to have a conversation in a noisy room provides a useful
illustration. You can see how the information encoded in the signal (that is,
in the voice of the person speaking) can be lost in the noise of the room. So
how could the conversation still be successful, despite some snippets of the
speaker’s voice not being heard by the listener?
One approach might be to agree that the listener should nod every time she
receives a meaningful message. If the speaker sees the nod, he knows he can
continue with the conversation. If not, he can repeat what he just said in the
hope that the listener will hear him this time. This is an automatic repeat
request (ARQ) protocol. As noted in Section 3.5.1, error correction in Wi-Fi
networks uses such a protocol in which the sender waits for an
acknowledgement frame from the receiver; if this is not received, then the
frame is retransmitted.
Another method might be for the speaker to repeat everything he says a few
times, so that there is a better chance the listener will get the message. The
listener compares what the speaker said in each repetition and picks a version
that seems most correct. Because this approach provides information to assist
the listener in correcting for errors due to transmission, it is known as a
forward error correction (FEC) code. The use of the word ‘forward’ here
emphasises the fact that this scheme needs only a one-way communication
path from sender to receiver, as opposed to the ARQ scheme that also
requires a ‘backward’ path to send the acknowledgement messages.
Repeating a message several times increases the bitrate required for a
transmission. For example, the original data
1 0 0 1 1 1 0 1
might have each individual bit transmitted three times, thus tripling the bit
rate
111 000 000 111 111 111 000 111
Then, if the sequence received is
111 100 000 101 011 111 001 110
We can assume that the italicised bits are in error, and reconstruct the
original data, using a simple ‘best of three’ algorithm.
Activity 3.22 (self-assessment)
When would the ‘best of three’ algorithm be ineffective?
Part 3 Wireless communications
158
3.7
3.7.1 Parity checksThere are many, much more efficient, ways of detecting and correcting errors.
The simplest idea in error-control coding is the parity check, which also
forms the basis of a number of more advanced techniques not covered in this
module. The principle of the parity check is that, for a given block of bits,
you add one further bit – the parity bit –, which is chosen to be a 1 or a 0 so
as to ensure that the total number of 1s in the block of bits, including the
parity bit, is an even number.
Note: All the discussions in this section assume the use of ‘even parity’,
which is the most common. However, parity checking can be done just as
well for odd parity, in which case the parity bit is chosen to ensure that the
total number of 1s in the block is odd.
Any single error in the block will now make the parity of the block of bits
odd, because an error changes either a 1 to a 0 or a 0 to a 1 – and in either
case the number of 1s in the block changes from even to odd. The receiver
can therefore just count the number of 1s in the received block of bits; if the
number is odd, it knows there has been at least one error. Notice that the
parity check will also fail if the parity bit (and only the parity bit) is in error.
Activity 3.23 (exploratory)
(a) If the number of 1s is even – that is, if the parity is correct – does that
mean there have not been any errors?
(b) I said that if the number of 1s is odd, it means there has been ‘at least’
one error. Why did I say ‘at least’?
Comment
(a) No. If there have been two errors, or any even number of errors, the
parity will still be correct.
(b) Any odd number of errors would make the parity wrong. Parity checks
alone are not fool-proof.
Generally, however, systems operate with low error rates, meaning that the
probability of there being more than one error in a block of bits is small, so a
parity check is a good way of being reasonably confident that there are no
errors.
A simple example of the use of parity checks is to add a check digit to a 7-
bit ASCII code (a binary representation of alphanumeric text, so the letter B
is coded by 1000010, for example.)
After adding the check, each symbol is represented by eight bits with even
parity.
3.7 Error correction
159
Activity 3.24 (self-assessment)
Which of the following might be valid code words using even parity?
(a) 01101010
(b) 01001100
(c) 11110010
(d) 11110110
This error detection is useful as far as it goes, but it would be good to be
able to correct errors, too. Figure 3.36 shows a simple example of one way
this can be achieved. The message digits are laid out in a rectangular block
code with parity checks (all even or odd) for each row and column. Such a
scheme can be used for FEC of a single error in a block, as shown in the
following 7 × 5 message block with even parity digits, as before.
7 x 5 message digits
1 1 1 10 0 0 0
0 0 0 11 1 1 0
1 1 0 01 0 0 1
0 1 0 00 1 1 1
1 0 0 00 0 1 0
1 1 1 00 0 1 0
parity digits
Figure 3.36
The sequences of message digits are grouped as ‘rows’, making up a fixed-
size block. A ‘horizontal’ parity-check digit is inserted at the end of each
row. Then a final row of ‘vertical’ parity checks is added: one for each
‘column’. If no more than one error occurs per block, a rectangular code can
locate and hence correct it. Any one error will cause the parity check to fail
in one row and one column. Knowing which row and which column have
failed provides the coordinates that identify the bit that is in error – and once
the location of this bit is known, it can be corrected.
Activity 3.25 (exploratory)
What needs to be done to correct a bit error?
CommentIf the bit is a 1, it should be changed to a 0; if it is a 0, it should be changed
to a 1.
Part 3 Wireless communications
160
Activity 3.26 (self-assessment)
A 7 × 5 block with even parity checks, as in the above example, is received
as
10011001
01100101
11000010
00110110
10000100
10011100
Which bit is in error?
3.7.2 ConclusionThis section has introduced one simple error detection scheme (simple parity
check) and two correction schemes: the ‘best of three’; and a double parity
check in a block of code words.
3.7 Error correction
161

Security
Wireless networks transmit data over a medium that is shared by everyone, so
anyone with a compatible receiver or transceiver is able to eavesdrop on the
radio signals being sent. The system should ensure that an eavesdropper is
not able to convert these signals into the original message being transmitted.
This is referred to as ensuring confidentiality.
Another security problem with using a shared medium for transmission is that
malicious users could interpose themselves between a sender and a receiver
and modify the messages being exchanged – or even destroy them entirely.
This is sometimes called a man-in-the-middle attack, and it compromises
the integrity of the data being transmitted across the network.
Finally, an attacker could transmit lots of random data on the frequency being
used by the wireless network, congesting the network and thus preventing
other users from sending data. This is an example of an attack on the
availability of the network.
So how do wireless networks address these potential security issues?
3.8.1 Improving security
Encryption
One commonly used security mechanism is encryption, which can help to
ensure both the confidentiality and the integrity of data. The idea of
encryption is to take the information you wish to protect – in this context,
called the plaintext message – and transform it into a different form, called
the ciphertext message, such that only the people who are supposed to
receive the information are able to reverse the transformation and recover the
plaintext.
A transformation process for converting plaintext to ciphertext is called an
encryption function or a cipher, and the reverse process is called a
decryption function. Most encryption and decryption functions take as input
both the message to be transformed and a key, which is some secret
information known only to the sender and the receiver.
Encryption has the security benefits of confidentiality, integrity and
authentication.
Confidentiality
When a message is encrypted using a particular key, it can be decrypted only
if the same key is used. This ensures that messages are confidential between
the sender and the receiver. Of course, if the attacker can guess the key, or
try every possible key until they happen on the right one, then the message
can be intercepted and read. The latter type of attack is called a brute-force
attack. So the number of possible keys that can be used by an encryption
function is an important factor that affects its strength (i.e. its ability to
Part 3 Wireless communications
162
3.8
withstand being attacked). If the number of possible keys is sufficiently large,
and the sender and receiver of the message agree on a key that is completely
random and impossible to guess, then brute-force attacks become much more
difficult.
Integrity
In addition to ensuring that messages can be read only by those people who
know the key, encryption can also prevent messages from being modified
without the receiver’s knowledge. The only way for a ‘man-in-the-middle’
attacker to modify a message is to decrypt it, make the modification and then
re-encrypt it – but this is possible only if the attacker knows the key. Any
attempt to modify the encrypted text would cause the decryption process to
produce a meaningless message, which would alert the receiver that someone
had tried to tamper with the transmission. Thus, encryption can protect the
integrity of information.
Authentication
Encryption can also contribute to authentication – that is, the process of
proving the identities of the sender and receiver. To do this, the sender and
receiver exchange some pre-defined messages that are encrypted using a key
known only to them: an exchange called a security protocol.
Activity 3.27 (self-assessment)
In your own words, explain in a single phrase what is meant by:
. man-in-the middle attack
. brute force attack
. confidentiality
. integrity
. authentication.
Since Wi-Fi was first introduced, a number of security techniques have been
used to protect Wi-Fi networks from unauthorised users and to ensure that the
data transmitted across them is secure.
One of the initial approaches to authenticating users was based on MAC
addresses, with the access point allowing only devices with pre-registered
MAC addresses to connect to the network. This was soon abandoned, because
it was very easy for a user to change the MAC address of their device to
match a pre-registered address.
Other Wi-Fi security mechanisms are based on encryption, using a key
known only to the nodes in the wireless network. The first of these
mechanisms was called Wired Equivalent Privacy (WEP), which (as the name
suggests) aimed to provide confidentiality comparable to that of a wired
network. WEP encryption could be used in both ad-hoc mode and
infrastructure mode networks. However, since 2001, a number of serious
3.8 Security
163
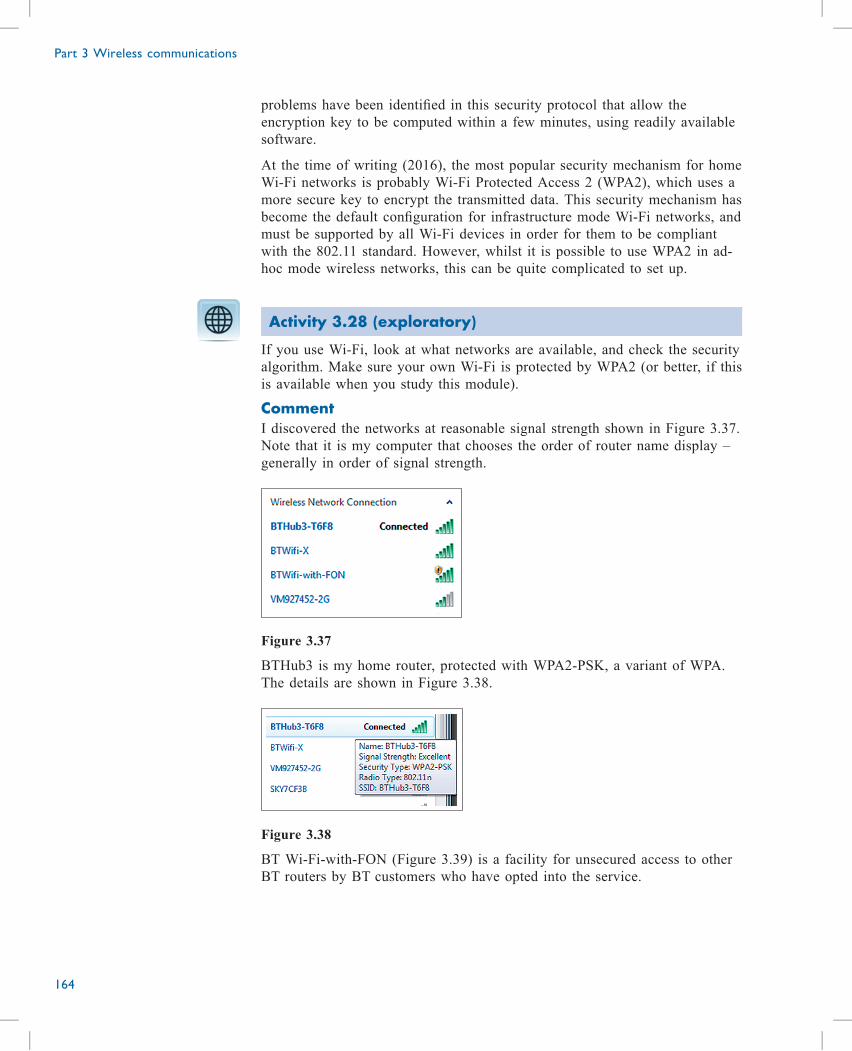
problems have been identified in this security protocol that allow the
encryption key to be computed within a few minutes, using readily available
software.
At the time of writing (2016), the most popular security mechanism for home
Wi-Fi networks is probably Wi-Fi Protected Access 2 (WPA2), which uses a
more secure key to encrypt the transmitted data. This security mechanism has
become the default configuration for infrastructure mode Wi-Fi networks, and
must be supported by all Wi-Fi devices in order for them to be compliant
with the 802.11 standard. However, whilst it is possible to use WPA2 in ad-
hoc mode wireless networks, this can be quite complicated to set up.
Activity 3.28 (exploratory)
If you use Wi-Fi, look at what networks are available, and check the security
algorithm. Make sure your own Wi-Fi is protected by WPA2 (or better, if this
is available when you study this module).
CommentI discovered the networks at reasonable signal strength shown in Figure 3.37.
Note that it is my computer that chooses the order of router name display –
generally in order of signal strength.
Figure 3.37
BTHub3 is my home router, protected with WPA2-PSK, a variant of WPA.
The details are shown in Figure 3.38.
Figure 3.38
BT Wi-Fi-with-FON (Figure 3.39) is a facility for unsecured access to other
BT routers by BT customers who have opted into the service.
Part 3 Wireless communications
164
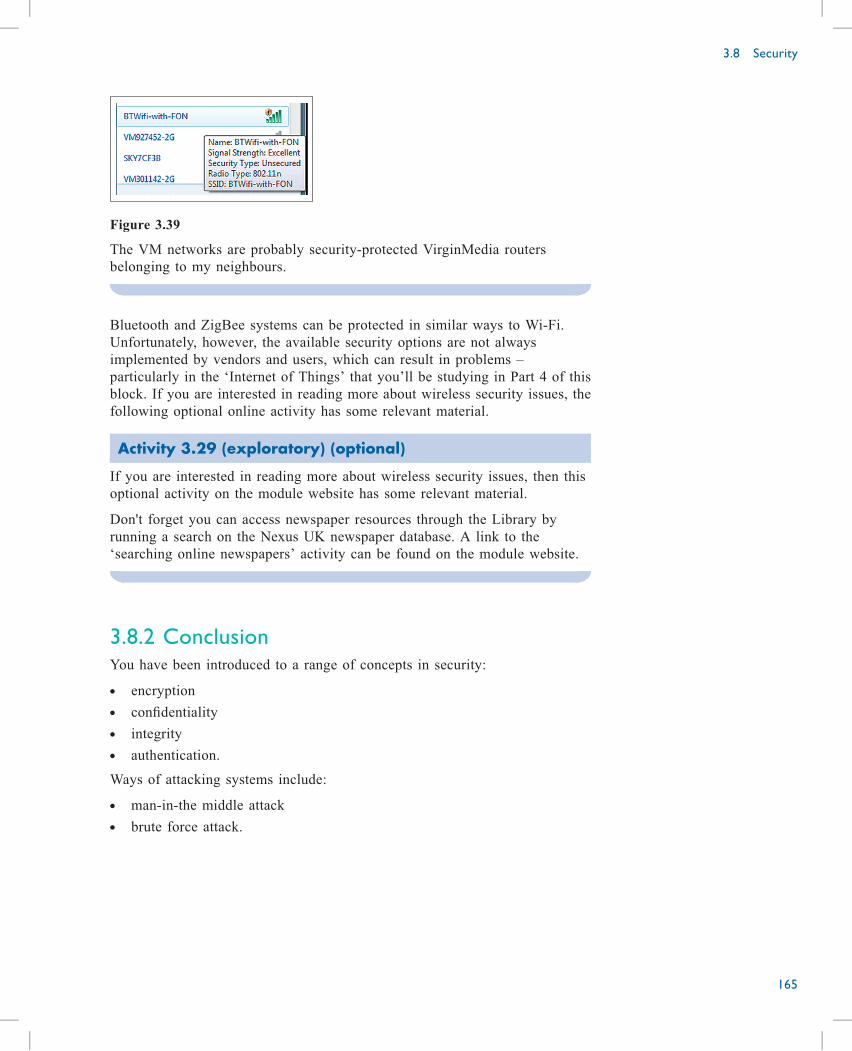
Figure 3.39
The VM networks are probably security-protected VirginMedia routers
belonging to my neighbours.
Bluetooth and ZigBee systems can be protected in similar ways to Wi-Fi.
Unfortunately, however, the available security options are not always
implemented by vendors and users, which can result in problems –
particularly in the ‘Internet of Things’ that you’ll be studying in Part 4 of this
block. If you are interested in reading more about wireless security issues, the
following optional online activity has some relevant material.
Activity 3.29 (exploratory) (optional)
If you are interested in reading more about wireless security issues, then this
optional activity on the module website has some relevant material.
Don't forget you can access newspaper resources through the Library by
running a search on the Nexus UK newspaper database. A link to the
‘searching online newspapers’ activity can be found on the module website.
3.8.2 ConclusionYou have been introduced to a range of concepts in security:
. encryption
. confidentiality
. integrity
. authentication.
Ways of attacking systems include:
. man-in-the middle attack
. brute force attack.
3.8 Security
165
Regulation and Standardisation
3.9.1 The International Telecommunications
Union (ITU)Read Extract 3.2 from the ITU’s website (http://www.itu.int/en/about/Pages/
overview.aspx) and attempt Activity 3.30.
Extract 3.2
ITU is the United Nations specialized agency for information and
communication technologies – ICTs. We allocate global radio spectrum
and satellite orbits, develop the technical standards that ensure networks
and technologies seamlessly interconnect, and strive to improve access
to ICTs to underserved communities worldwide.
ITU is committed to connecting all the world’s people – wherever they
live and whatever their means. Through our work, we protect and
support everyone’s fundamental right to communicate.
Today, ICTs underpin everything we do. They help manage and control
emergency services, water supplies, power networks and food
distribution chains. They support health care, education, government
services, financial markets, transportation systems, e-commerce
platforms and environmental management. And they allow people to
communicate with colleagues, friends and family anytime, and almost
anywhere.
With the help of our global membership, ITU brings the benefits of
modern communication technologies to people everywhere in an
efficient, safe, easy and affordable manner.
ITU membership reads like a Who’s Who of the ICT sector. We’re
unique among UN agencies in having both public and private sector
membership. So in addition to our 193 Member States, ITU membership
includes ICT regulators, many leading academic institutions and some
700 tech companies.
In an increasingly interconnected world, ITU is the single global
organization embracing all players in this dynamic and fast-growing
sector.
The main products of ITU-T (ITU-Telecommunications) are
Recommendations (ITU-T Recs) – standards defining how
telecommunication networks operate and interwork. See below list for
access. ITU-T Recs have non-mandatory status until they are adopted in
national laws. Levels of compliance are however high due to
international applicability and the high quality guaranteed by the ITU-
T’s secretariat and members from the world’s foremost ICT companies
and global administrations.
Part 3 Wireless communications
166
3.9
There are over 4000 Recommendations in force on topics from service
definition to network architecture and security, from broadband to Gbit/s
optical transmission systems to next-generation networks (NGN) and IP-
related issues, all together fundamental components of today’s
information and communication technologies (ICTs).
[…] The vast majority of all Recommendations are available in
electronic (PDF) form free of charge to all once a final editing process
is complete.
Activity 3.30 (exploratory)
Jot down a few reasons why, in your opinion, an organisation like the ITU is
needed.
CommentThere are various ways of answering this, but you should have noted most of
the following, even if your wording is different.
An organisation such as the ITU needs to:
. allocate radio spectrum so as to prevent interference
. ensure compatibility of systems for seamless intercommunication
. strive for accessibility for all potential users.
As far as telephony is concerned, users expect reliable, trouble-free
communication between wireless and fixed lines all over the world. Similarly,
computer users expect reliable, secure and error-free international data
transmission. Given the huge number of different service providers and
telephone companies, and different systems and ICT hardware in operation
within individual countries and worldwide, this is possible only with strict
standardisation with a legal basis to ensure compliance.
3.9.2 The IEEE family of standardsThe diagram in Figure 3.40 shows some of the more recent, higher-rate
standards in the IEEE 802 family. Wi-Fi is IEEE 802.11, while ZigBee is part
of 802 15.4 (not shown).
3.9 Regulation and Standardisation
167
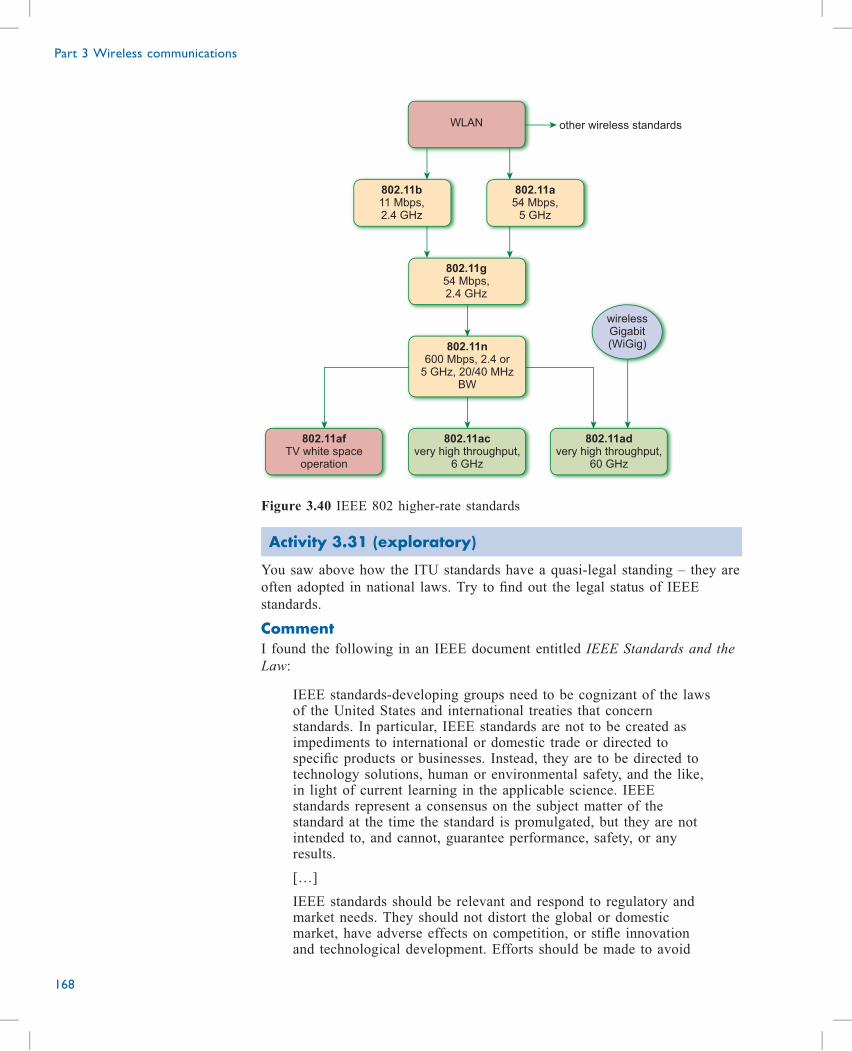
WLAN other wireless standards
wirelessGigabit(WiGig)
802.11b11 Mbps,2.4 GHz
802.11a54 Mbps,
5 GHz
802.11g54 Mbps,2.4 GHz
802.11n600 Mbps, 2.4 or
5 GHz, 20/40 MHzBW
802.11afTV white space
operation
802.11advery high throughput,
60 GHz
802.11acvery high throughput,
6 GHz
Figure 3.40 IEEE 802 higher-rate standards
Activity 3.31 (exploratory)
You saw above how the ITU standards have a quasi-legal standing – they are
often adopted in national laws. Try to find out the legal status of IEEE
standards.
CommentI found the following in an IEEE document entitled IEEE Standards and the
Law:
IEEE standards-developing groups need to be cognizant of the lawsof the United States and international treaties that concernstandards. In particular, IEEE standards are not to be created asimpediments to international or domestic trade or directed tospecific products or businesses. Instead, they are to be directed totechnology solutions, human or environmental safety, and the like,in light of current learning in the applicable science. IEEEstandards represent a consensus on the subject matter of thestandard at the time the standard is promulgated, but they are notintended to, and cannot, guarantee performance, safety, or anyresults.
[…]
IEEE standards should be relevant and respond to regulatory andmarket needs. They should not distort the global or domesticmarket, have adverse effects on competition, or stifle innovationand technological development. Efforts should be made to avoid
Part 3 Wireless communications
168
duplication or overlap with other standards. Wherever appropriate,IEEE standards-developing groups should specify standards basedon performance or function rather than design or productspecifications. Many standards for interoperability orintercompatibility, however, may require detailed specifications.IEEE standards-developing groups should assure that there are noagreements or understandings — express or implied, formal orinformal—that restrict a participant’s freedom to make independentdecisions in those matters that may affect competition.
[…]
During standards development meetings, discussions should beconfined to technical, engineering, and safety considerations.Commercial considerations are not proper factors for considerationor discussion.
https://standards.ieee.org/develop/policies/stdslaw.pdf
I take this extract to mean that although they are widely adopted, and have
effectively become standards in practice for many branches of ICT, IEEE
regulations do not have legal force in the same way as those of the ITU-T.
Nevertheless, they must comply with the law in individual countries, and
with international agreements.
3.9.3 ConclusionThis section has looked at the IEEE 802 family of standards, and the
importance of establishing a set of appropriate standards for
telecommunications. In addition to the IEEE, the ITU also plays an important
role in ensuring global operation of communication systems.
3.9 Regulation and Standardisation
169
Summary
In this part, you studied a range of major wireless technologies: Wi-Fi,
Bluetooth, ZigBee and RFID. Important techniques include the combating of
attenuation and the modulation and coding schemes used to reliable and
secure wireless transmission. You have learnt the general principles of these,
as well as how to carry out numerical calculations relating to them. Mobile
cellar system architecture was presented, and the importance of
standardisation and regulation, particularly through the IEEE and ITU,
considered.
This part has covered:
. the concept of roaming
. the use of numerical skills to carry out calculations and analyse data
. wireless technologies such as Wi-Fi, Bluetooth, ZigBee, RFID
. the concept of attenuation and inverse power laws
. the architecture of cellular (mobile) systems and the importance of
frequency re-use
. the processes of digitisation, sampling and quantisation
. a number of modulation techniques involving the variation of amplitude,
frequency and relative phase
. the use of multiplexing in wireless technologies
. the principles of error avoidance, detection and correction
. the main threats to security and how to combat them
. the importance of standardisation and regulation.
Part 3 Wireless communications
170
3.10
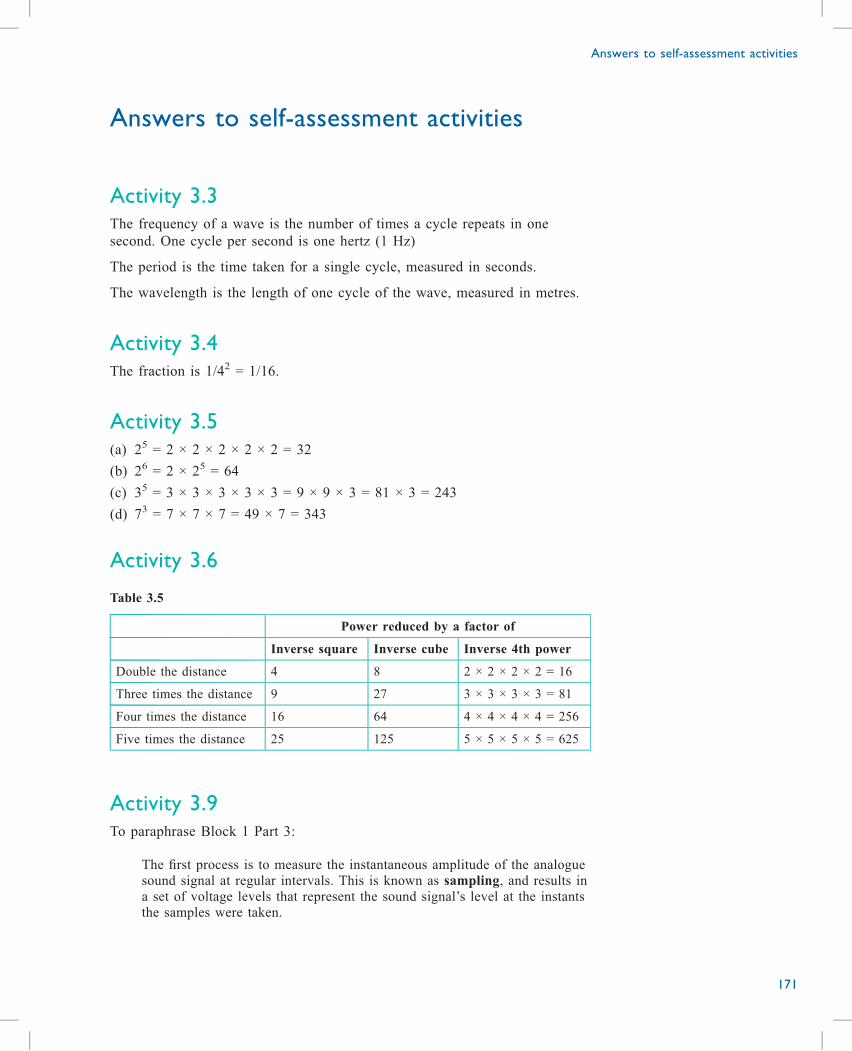
Answers to self-assessment activities
Activity 3.3The frequency of a wave is the number of times a cycle repeats in one
second. One cycle per second is one hertz (1 Hz)
The period is the time taken for a single cycle, measured in seconds.
The wavelength is the length of one cycle of the wave, measured in metres.
Activity 3.4The fraction is 1/42 = 1/16.
Activity 3.5(a) 25 = 2 × 2 × 2 × 2 × 2 = 32
(b) 26 = 2 × 25 = 64
(c) 35 = 3 × 3 × 3 × 3 × 3 = 9 × 9 × 3 = 81 × 3 = 243
(d) 73 = 7 × 7 × 7 = 49 × 7 = 343
Activity 3.6
Table 3.5
Power reduced by a factor of
Inverse square Inverse cube Inverse 4th power
Double the distance 4 8 2 × 2 × 2 × 2 = 16
Three times the distance 9 27 3 × 3 × 3 × 3 = 81
Four times the distance 16 64 4 × 4 × 4 × 4 = 256
Five times the distance 25 125 5 × 5 × 5 × 5 = 625
Activity 3.9To paraphrase Block 1 Part 3:
The first process is to measure the instantaneous amplitude of the analogue
sound signal at regular intervals. This is known as sampling, and results in
a set of voltage levels that represent the sound signal’s level at the instants
the samples were taken.
Answers to self-assessment activities
171
The second process – quantisation – divides the maximum voltage range
of the analogue sound signal into a number of discrete voltage bands. Each
band is now represented by a number, so the result is a string of numbers at
regular intervals, where each number represents a particular voltage level of
the sound signal at one instant.
Activity 3.108 kHz is 8000 Hz, so we need to sample at more than 16 000 times per
second.
Activity 3.11On the left, nine levels are needed. From Section 3.2 in Block 1 Part 3, this
would require 4-bit words. This gives sixteen levels, so some would be
unused.
On the right, 33 levels are used, which needs 6-bit words. Again, some of the
words would be unused. (5-bit words can cover, at most, only 32 levels.)
Activity 3.12If the signal is sampled every 125 μs, the sampling rate is 1/125 × 10–6
= 1000 000/125 = 8000 samples per second. From Section 3.2 of Block 1
Part 3, using 256 quantisation levels requires 8-bit words, so the bit rate is
64 000 bps = 64 kbps.
Activity 3.14This bit rate for one signal is 8000 × 8 = 64 000 bps = 64 kbps. So the eight
time-division-multiplexed signals require a bitrate eight times as great – that
is, 512 kbps.
Part 3 Wireless communications
172
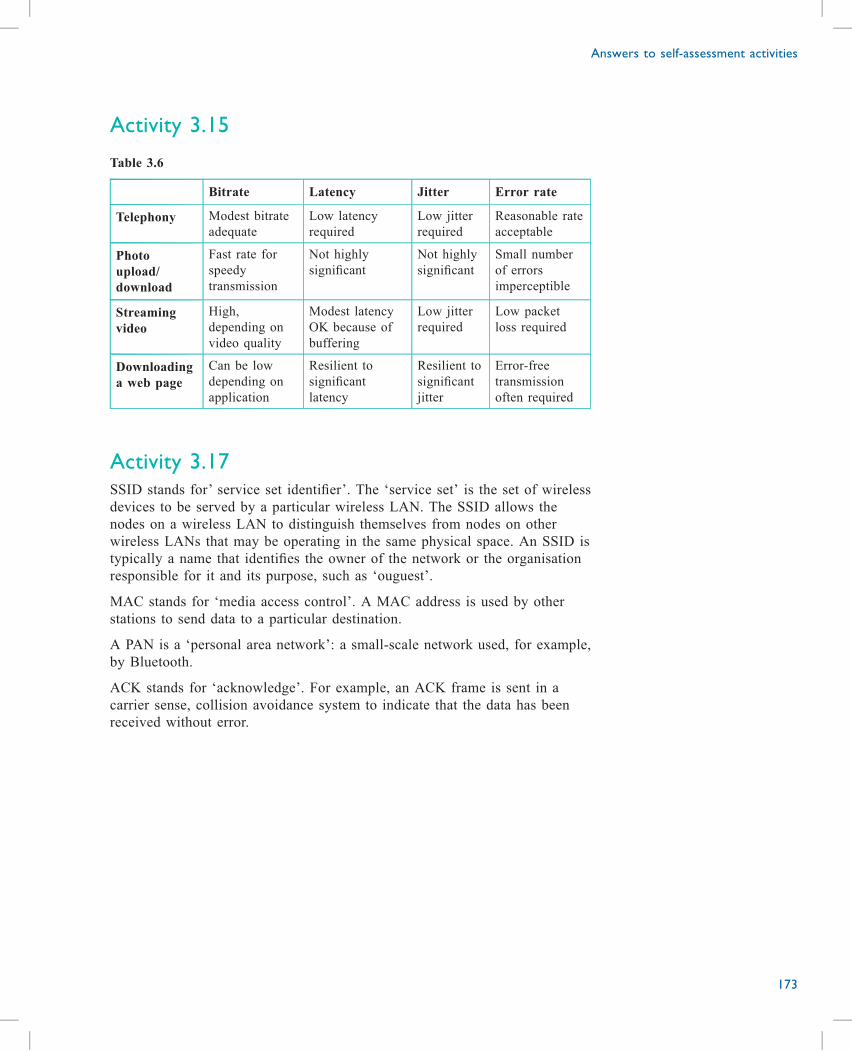
Activity 3.15
Table 3.6
Bitrate Latency Jitter Error rate
Telephony Modest bitrate
adequate
Low latency
required
Low jitter
required
Reasonable rate
acceptable
Photo
upload/
download
Fast rate for
speedy
transmission
Not highly
significant
Not highly
significant
Small number
of errors
imperceptible
Streaming
video
High,
depending on
video quality
Modest latency
OK because of
buffering
Low jitter
required
Low packet
loss required
Downloading
a web page
Can be low
depending on
application
Resilient to
significant
latency
Resilient to
significant
jitter
Error-free
transmission
often required
Activity 3.17SSID stands for’ service set identifier’. The ‘service set’ is the set of wireless
devices to be served by a particular wireless LAN. The SSID allows the
nodes on a wireless LAN to distinguish themselves from nodes on other
wireless LANs that may be operating in the same physical space. An SSID is
typically a name that identifies the owner of the network or the organisation
responsible for it and its purpose, such as ‘ouguest’.
MAC stands for ‘media access control’. A MAC address is used by other
stations to send data to a particular destination.
A PAN is a ‘personal area network’: a small-scale network used, for example,
by Bluetooth.
ACK stands for ‘acknowledge’. For example, an ACK frame is sent in a
carrier sense, collision avoidance system to indicate that the data has been
received without error.
Answers to self-assessment activities
173
Activity 3.19I thought of the following, but you may have listed more:
. both use the ISM bands
. both are parts of the IEEE 802 suite of standards
. Bluetooth has a greater range and data rate than ZigBee
. ZigBee is designed for use with very small sensors and devices; Bluetooth
is used primarily for rather larger ICT equipment
. ZigBee can operate in either star or mesh topology, whereas Bluetooth
only operates as star (with a master).
Activity 3.20First, express both figures in bits:
2 MB = 2 × 1024 × 1024 × 8 = 16 777 216 bits,
so the transfer will take:
total amount of data / data transfer rate = 16 777 216 / 210 000 = 80 s (2 sf)
Activity 3.21First, express both figures in bps:
1 Mbps = 1000 000 bps
250 kbps = 250 000 bps
Then divide Bluetooth’s maximum data rate by ZigBee’s maximum data rate:
1000 000/250 000 = 4
This means that Bluetooth’s maximum data rate is four times greater than
ZigBee’s maximum data rate.
Activity 3.22If the error rate is so great that more than one error can appear in a ‘triplet’.
Activity 3.24Code words (a) and (d) have even parity, so are potentially valid, while (b)
and (c) have odd numbers of 1s so are definitely invalid.
Part 3 Wireless communications
174
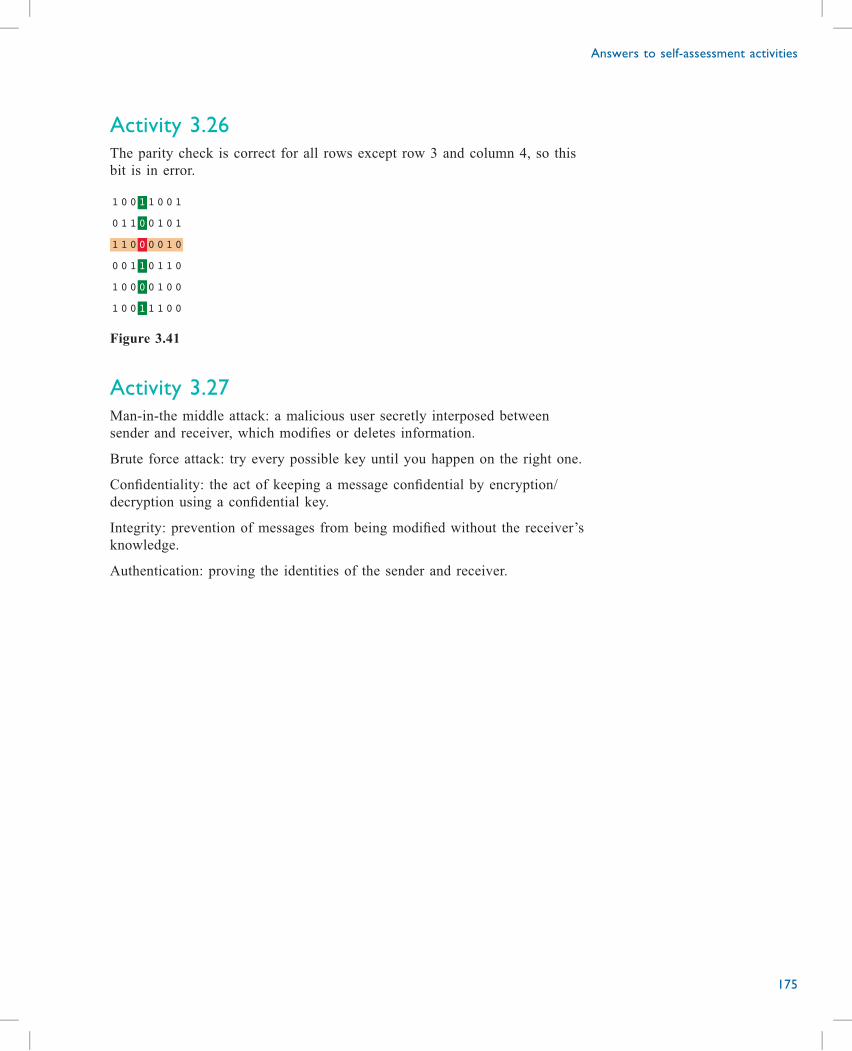
Activity 3.26The parity check is correct for all rows except row 3 and column 4, so this
bit is in error.
1 0 0 1 1 0 0 1
0 1 1 0 0 1 0 1
1 1 0 0 0 0 1 0
0 0 1 1 0 1 1 0
1 0 0 0 0 1 0 0
1 0 0 1 1 1 0 0
Figure 3.41
Activity 3.27Man-in-the middle attack: a malicious user secretly interposed between
sender and receiver, which modifies or deletes information.
Brute force attack: try every possible key until you happen on the right one.
Confidentiality: the act of keeping a message confidential by encryption/
decryption using a confidential key.
Integrity: prevention of messages from being modified without the receiver’s
knowledge.
Authentication: proving the identities of the sender and receiver.
Answers to self-assessment activities
175
References
IEEE 802 https://standards.ieee.org/develop/policies/stdslaw.pdf
ITU http://www.itu.int/en/about/Pages/overview.aspx
Webb, W. (2016) The 5G Myth: And Why Consistent Connectivity is a Better Future,
Cambridge, Webb Search Limited.
Part 3 Wireless communications
176
Acknowledgements
Grateful acknowledgement is made to the following sources:
Figure 3.6. © Josefkubes / iStock / Getty Images Plus.
Figure 3.18. Adapted from artwork Publisher Unknown.
Figure 3.32. Courtesy of SageData Solutions Inc.
Figure 3.33. Government of Canada/ https://www.ic.gc.ca/eic/site/028.nsf/eng/
00217.html.
Figure 3.34. Taken from: http://www.dossiers-sos-justice.com.
Every effort has been made to contact copyright holders. If any have been
inadvertently overlooked the publishers will be pleased to make the necessary
arrangements at the first opportunity.
Acknowledgements
177

Part 4 The Internet of Thingsby Allan Jones, with a case study by Annika Wolff

Contents
Introduction 183
4.1 Use cases 185
4.1.1 Conclusion 187
4.2 Data for the Internet of Things 188
4.2.1 How much data? 188
4.2.2 Representing data digitally 189
4.2.3 Representing wind direction 191
4.2.4 Variable-length coding 194
4.2.5 Conclusion 195
4.3 Radio communication 196
4.3.1 Problems of radio communication 196
4.3.2 Licensed and unlicensed spectrum 198
4.3.3 Data amount and rate 200
4.3.4 Sending the data 201
4.3.5 Conclusion 203
4.4 Networks for the Internet of Things 204
4.4.1 Cellular networks and Wi-Fi 204
4.4.2 The high cost of mobile communications 206
4.4.3 Low power wide area networks (LPWANs) 210
4.4.4 Conclusion 213
4.5 Home automation 214
4.5.1 Short-range wireless 214
4.5.2 Mesh networks 214
4.5.3 Energy and power consumption 218
4.5.4 Case study: Conversations with washing machines (by
Annika Wolff) 220
4.5.5 Conclusion 222
4.6 The future? 223
Summary 225
Answers to self-assessment activities 226
References 230
Acknowledgements 231

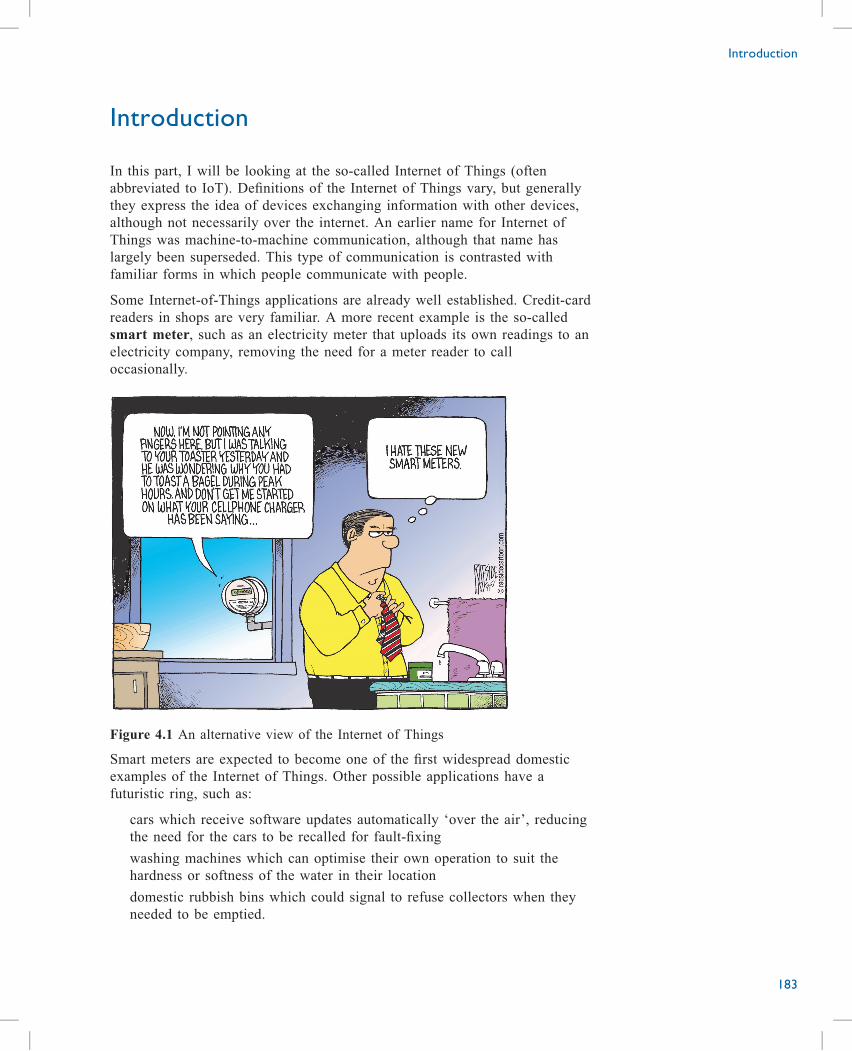
Introduction
In this part, I will be looking at the so-called Internet of Things (often
abbreviated to IoT). Definitions of the Internet of Things vary, but generally
they express the idea of devices exchanging information with other devices,
although not necessarily over the internet. An earlier name for Internet of
Things was machine-to-machine communication, although that name has
largely been superseded. This type of communication is contrasted with
familiar forms in which people communicate with people.
Some Internet-of-Things applications are already well established. Credit-card
readers in shops are very familiar. A more recent example is the so-called
smart meter, such as an electricity meter that uploads its own readings to an
electricity company, removing the need for a meter reader to call
occasionally.
Figure 4.1 An alternative view of the Internet of Things
Smart meters are expected to become one of the first widespread domestic
examples of the Internet of Things. Other possible applications have a
futuristic ring, such as:
cars which receive software updates automatically ‘over the air’, reducing
the need for the cars to be recalled for fault-fixing
washing machines which can optimise their own operation to suit the
hardness or softness of the water in their location
domestic rubbish bins which could signal to refuse collectors when they
needed to be emptied.
Introduction
183
The Internet of Things is expected to become really innovative only when it
is supported by automated, ‘intelligent’ processes, as in some of the examples
above. With the addition of automated intelligent processes, the Internet of
Things could transform manufacturing, commerce and home life – according
to some of its more zealous proponents. In fact, the term ‘Internet of Things’
is often shorthand for a new era of technological progress in which familiar
objects and services, such as household utensils and appliances, cars, public
transport, refuse collection, and so on, become ‘smart’.
Whether the Internet of Things turns out to be as transformative as is
sometimes claimed remains to be seen, but the concept of an Internet of
Things has provoked a lot of interest in the worlds of research and business.
It is clear, though, that without an underlying communications infrastructure,
there can be no Internet of Things. In this part of TM111, therefore, we will
concentrate on the communication technologies required to make an Internet
of Things possible. Specifically, we will be looking at:
. further examples of Internet-of-Things applications in industry, business
and the home
. representation of data as binary numbers
. features and problems of radio communication
. requirements of Internet-of-Things data networks (for example, cost, data
rate, transmission power and range)
. radio networks for Internet-of-Things traffic
. power and energy considerations
. home automation.
Activity 4.1 (exploratory) (optional)
Before going further, it would be a good idea to complete this activity by
watching Video 4.1on the module website. This video is 17 minutes long and
provides an introduction to the Internet of Things. Many of the terms used by
the speakers are explained later in this part.
Part 4 The Internet of Things
184
Use cases
Ideally, I would at this point give a firmer definition of the ‘Internet of
Things’. However, definitions vary so much that there is a danger of getting
sidetracked into fruitless discussions of definitions. I will instead give
examples of possible uses. I have given some examples in the Introduction,
but there are many more possibilities. The list below (based on A
Comparison of UNB and Spread Spectrum Wireless Technologies as used in
LPWA M2M Applications, Real Wireless, 2016) gives several examples. You
are not expected to remember this list. Instead, look first at the headings, and
notice the range of contexts where the Internet of Things is expected to be
used, then look at some of the possible use cases given.
. Utilities (gas, water, electricity)
◦ Smart meter: automated meter reading systems
◦ Smart supply grid
◦ Management and tracking of assets (i.e. resources and products)
. Smart cities
◦ Traffic control
◦ Parking management
◦ Lighting control
◦ Waste management
◦ Environmental monitoring
. Healthcare
◦ Fitness tracking
◦ Patient self-monitoring and remote monitoring
. Transportation and automotive
◦ Connected (i.e. networked) car
◦ Road management
◦ Tolling and speed enforcement systems
◦ Vehicle platoons and autonomous vehicles
◦ Connected trains, boats and planes
◦ Road and rail asset tracking and management
. Building services
◦ Building automation: automated and remote control of building
environment
◦ Heating, ventilation, air conditioning, lighting, security
◦Building management systems
◦ Building security, access control and CCTV
◦ Fire and emergency alarms; sprinkler systems
. Retail
◦ Goods tracking, shelf life management, inventory management
◦ Automated shelf pricing
4.1 Use cases
185
4.1
◦ Beacons and location-based services, customer browsing data
◦ Shelf compliance
◦Payment processes
◦ Vending machines, cash machines
. Consumers
◦ Wearables
◦ Home automation (heating, lighting, security, entertainment,
consumables)
. Industrial and supply chain
◦ Smart factories
◦ Industrial automation: energy tracking
◦ Supply chain management
◦ Warehouse automation
◦ Driverless vehicles
◦Wearables
◦ Security
. Security and critical national infrastructure
◦ Industrial and enterprise security
◦ Surveillance
◦ First responders: vehicles, persons and devices
◦ Monitoring critical infrastructure
◦ Asset management
. Agriculture and fishing
◦ Crop and livestock management
◦ Machinery tracking
◦ Irrigation and water quality monitoring
◦Produce tracking through supply chain
◦ Weather monitoring
. Environment
◦ Air quality monitoring
◦ Pollutant monitoring
◦ Water level monitoring and automated flood response
Many of the applications in the list above have already incorporated digital
technology, but the Internet of Things is expected to bring additional benefits.
As a further example of additional benefit that can arise from the Internet of
Things, consider the benefits of a communication-enabled electronic
mousetrap. This is not the gimmick it might appear to be at first. Such a
device was devised by a company that was contracted to keep business
premises free of rodents. The company had deployed conventional traps in
vast numbers around each site, and a large part of the company’s expenditure
was paying people to check the state of each trap every couple of days.
Mostly the traps would be found empty. The new electronic mousetrap,
however, signalled its state (triggered or untriggered) regularly to a central
office. Frequent patrols were no longer required, and when a trap needed
Part 4 The Internet of Things
186
attention, the staff member could sent straight to it. Although the new trap
was more expensive than the one it replaced, the reduction of running costs
made the additional expense worthwhile. This example also illustrates a
further feature of the Internet of Things, which is that it would typically
consist of devices or sensors distributed over a wide area from which data is
regularly collected and aggregated at a central database. Analysis of that data
reveals trends or events which can initiate beneficial actions.
Activity 4.2 (exploratory)
Which of the Internet-of-Things use cases in the list given earlier best fits the
story of the electronic mousetrap?
Comment‘Industrial and supply chain’ seems the natural category for this. I would
expect this category to include such things as checking that refrigeration is
working properly, that stocks are adequate and usable, and that whatever
other conditions are specified by regulations are not breached. It seems
sensible to me to include rodent control in this, even though it was probably
not specifically considered by the people who devised this list of use cases.
4.1.1 ConclusionThe Internet of Things (IoT) is the interconnection of sensing devices so that
data can be transferred to or from devices. Data can be collected and
analysed, and used in automatic processes. Possible applications for the
Internet of Things range across many industrial, domestic and business
sectors, such as utility companies, healthcare, transportation, retail and home
automation.
4.1 Use cases
187
Data for the Internet of Things
4.2.1 How much data?As we have seen, Internet-of-Things applications involve taking readings
from sensing devices distributed across an environment, and sending data
from these sensors periodically to a server (or computer) at a central base,
where the data is collated and analysed. Sensor information could include, for
example, readings of temperature, humidity, speed, light level, noise level,
occupancy (for example, whether a car parking space is occupied or empty)
or even the state of a mousetrap. Other information about the status of the
sensing device could include the state of the device’s battery (many devices
will be battery-powered), its location and a unique identifier for that
particular device.
Three questions present themselves:
1 How much data traffic is likely to be produced by such devices?
2 Are there special requirements for such data, such as timeliness, accuracy,
security and confidentiality?
3 Can this data traffic be accommodated in existing communication
networks, or are special networks required?
It is not possible to give general answers to these questions because of the
large and varied range of use cases. However, as we will see later, data
amounts sent by particular devices are expected to be small compared to
other sorts of common data traffic.
Activity 4.3 (exploratory)
Taking agriculture as a context, what kind of information might usefully be
gathered from sensors?
CommentFor livestock, it might be useful to know the location of each animal,
especially if the animals graze across large areas. Also, it would be useful to
know the state of health of each animal. This might be quite hard to monitor,
but it might be possible to sense body temperature, feeding behaviour and
amount of movement over, say, a 10-minute period. By themselves, these
readings might not mean much, but data gathered over days and weeks might
indicate an animal that was behaving abnormally.
For arable agriculture, it might be useful to collect data on rainfall, soil
moisture, sunshine, and temperature. This could be done over quite small
zones, possibly a few square metres, so that any part of a field that appeared
exceptional from the rest could be identified. Significant cost savings have
been reported by irrigating only the parts of a field that need it. Wind speed
and direction could also be collected if crops were prone to wind damage.
Part 4 The Internet of Things
188
4.2
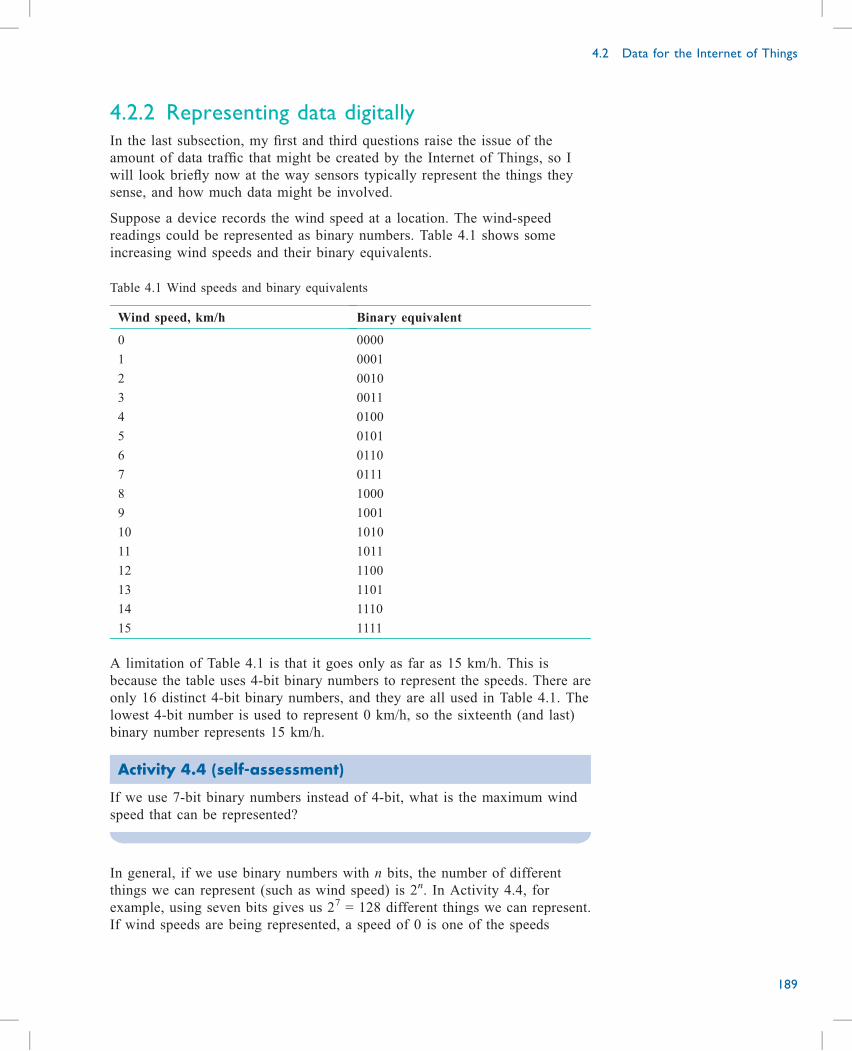
4.2.2 Representing data digitallyIn the last subsection, my first and third questions raise the issue of the
amount of data traffic that might be created by the Internet of Things, so I
will look briefly now at the way sensors typically represent the things they
sense, and how much data might be involved.
Suppose a device records the wind speed at a location. The wind-speed
readings could be represented as binary numbers. Table 4.1 shows some
increasing wind speeds and their binary equivalents.
Table 4.1 Wind speeds and binary equivalents
Wind speed, km/h Binary equivalent
0 0000
1 0001
2 0010
3 0011
4 0100
5 0101
6 0110
7 0111
8 1000
9 1001
10 1010
11 1011
12 1100
13 1101
14 1110
15 1111
A limitation of Table 4.1 is that it goes only as far as 15 km/h. This is
because the table uses 4-bit binary numbers to represent the speeds. There are
only 16 distinct 4-bit binary numbers, and they are all used in Table 4.1. The
lowest 4-bit number is used to represent 0 km/h, so the sixteenth (and last)
binary number represents 15 km/h.
Activity 4.4 (self-assessment)
If we use 7-bit binary numbers instead of 4-bit, what is the maximum wind
speed that can be represented?
In general, if we use binary numbers with n bits, the number of different
things we can represent (such as wind speed) is 2n. In Activity 4.4, for
example, using seven bits gives us 27 = 128 different things we can represent.
If wind speeds are being represented, a speed of 0 is one of the speeds
4.2 Data for the Internet of Things
189
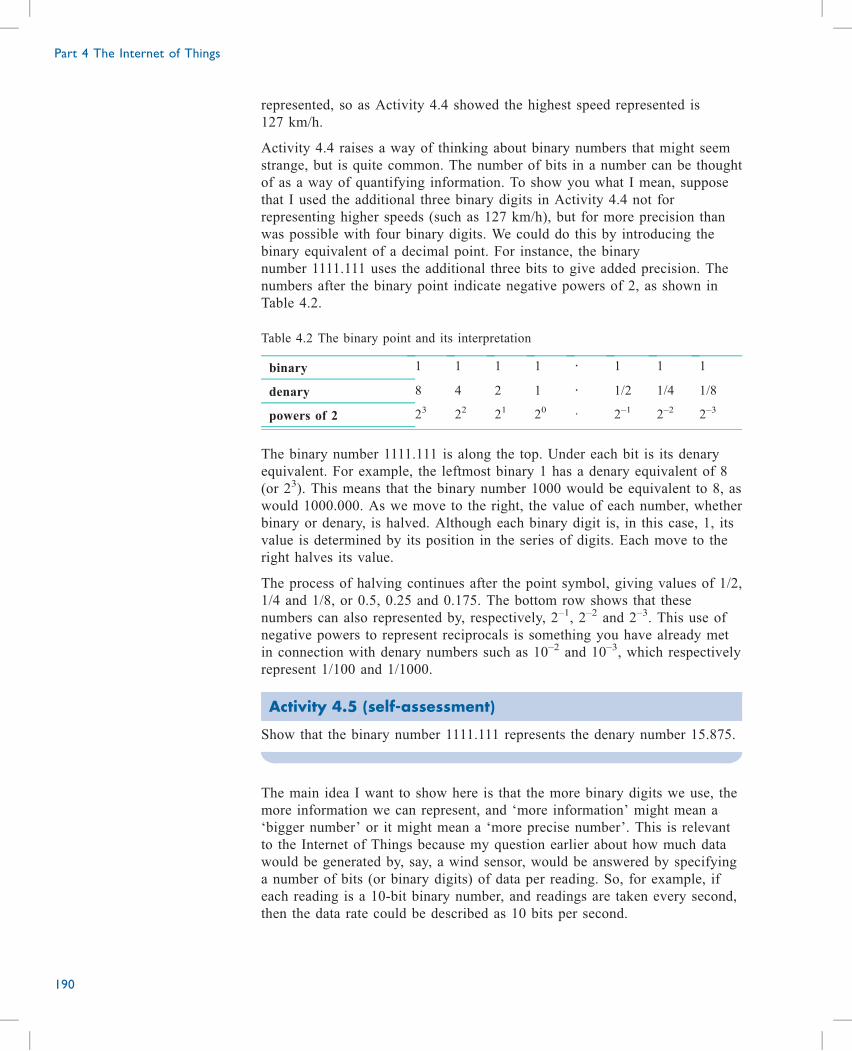
represented, so as Activity 4.4 showed the highest speed represented is
127 km/h.
Activity 4.4 raises a way of thinking about binary numbers that might seem
strange, but is quite common. The number of bits in a number can be thought
of as a way of quantifying information. To show you what I mean, suppose
that I used the additional three binary digits in Activity 4.4 not for
representing higher speeds (such as 127 km/h), but for more precision than
was possible with four binary digits. We could do this by introducing the
binary equivalent of a decimal point. For instance, the binary
number 1111.111 uses the additional three bits to give added precision. The
numbers after the binary point indicate negative powers of 2, as shown in
Table 4.2.
Table 4.2 The binary point and its interpretation
binary 1 1 1 1 · 1 1 1
denary 8 4 2 1 · 1/2 1/4 1/8
powers of 2 23 22 21 20 · 2–1 2–2 2–3
The binary number 1111.111 is along the top. Under each bit is its denary
equivalent. For example, the leftmost binary 1 has a denary equivalent of 8
(or 23). This means that the binary number 1000 would be equivalent to 8, as
would 1000.000. As we move to the right, the value of each number, whether
binary or denary, is halved. Although each binary digit is, in this case, 1, its
value is determined by its position in the series of digits. Each move to the
right halves its value.
The process of halving continues after the point symbol, giving values of 1/2,
1/4 and 1/8, or 0.5, 0.25 and 0.175. The bottom row shows that these
numbers can also represented by, respectively, 2–1, 2–2 and 2–3. This use of
negative powers to represent reciprocals is something you have already met
in connection with denary numbers such as 10–2 and 10–3, which respectively
represent 1/100 and 1/1000.
Activity 4.5 (self-assessment)
Show that the binary number 1111.111 represents the denary number 15.875.
The main idea I want to show here is that the more binary digits we use, the
more information we can represent, and ‘more information’ might mean a
‘bigger number’ or it might mean a ‘more precise number’. This is relevant
to the Internet of Things because my question earlier about how much data
would be generated by, say, a wind sensor, would be answered by specifying
a number of bits (or binary digits) of data per reading. So, for example, if
each reading is a 10-bit binary number, and readings are taken every second,
then the data rate could be described as 10 bits per second.
Part 4 The Internet of Things
190
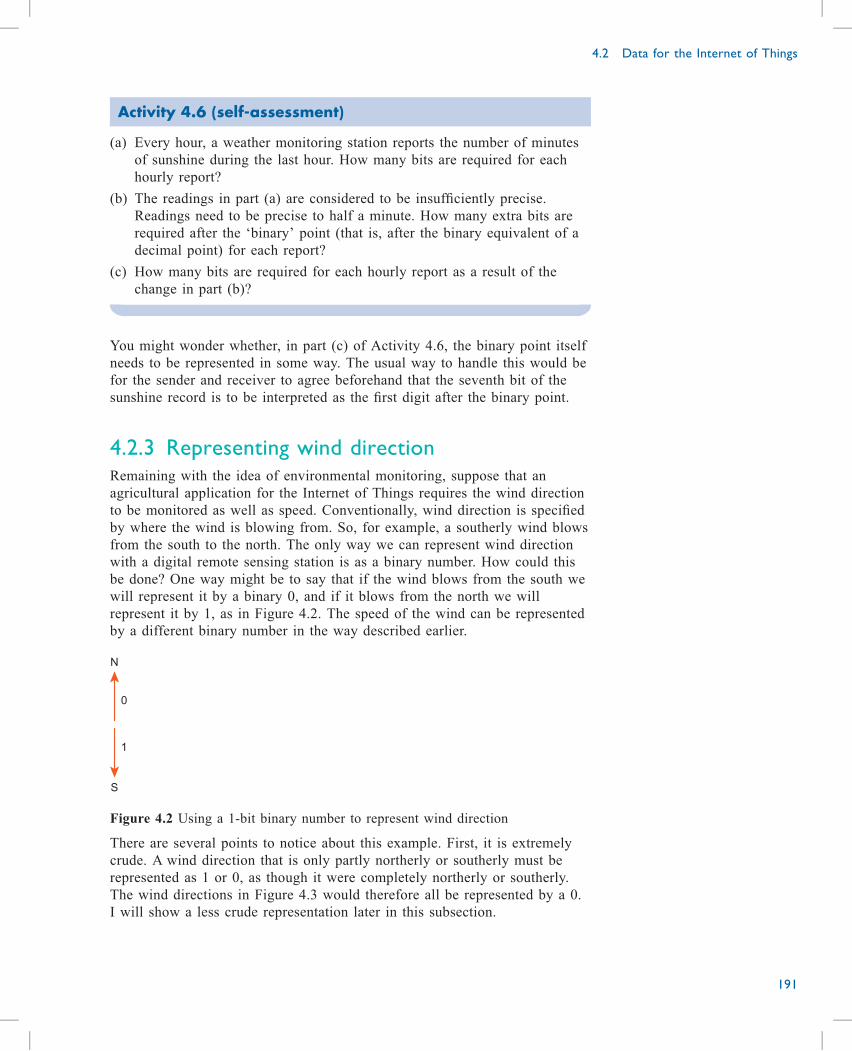
Activity 4.6 (self-assessment)
(a) Every hour, a weather monitoring station reports the number of minutes
of sunshine during the last hour. How many bits are required for each
hourly report?
(b) The readings in part (a) are considered to be insufficiently precise.
Readings need to be precise to half a minute. How many extra bits are
required after the ‘binary’ point (that is, after the binary equivalent of a
decimal point) for each report?
(c) How many bits are required for each hourly report as a result of the
change in part (b)?
You might wonder whether, in part (c) of Activity 4.6, the binary point itself
needs to be represented in some way. The usual way to handle this would be
for the sender and receiver to agree beforehand that the seventh bit of the
sunshine record is to be interpreted as the first digit after the binary point.
4.2.3 Representing wind directionRemaining with the idea of environmental monitoring, suppose that an
agricultural application for the Internet of Things requires the wind direction
to be monitored as well as speed. Conventionally, wind direction is specified
by where the wind is blowing from. So, for example, a southerly wind blows
from the south to the north. The only way we can represent wind direction
with a digital remote sensing station is as a binary number. How could this
be done? One way might be to say that if the wind blows from the south we
will represent it by a binary 0, and if it blows from the north we will
represent it by 1, as in Figure 4.2. The speed of the wind can be represented
by a different binary number in the way described earlier.
N
S
0
1
Figure 4.2 Using a 1-bit binary number to represent wind direction
There are several points to notice about this example. First, it is extremely
crude. A wind direction that is only partly northerly or southerly must be
represented as 1 or 0, as though it were completely northerly or southerly.
The wind directions in Figure 4.3 would therefore all be represented by a 0.
I will show a less crude representation later in this subsection.
4.2 Data for the Internet of Things
191
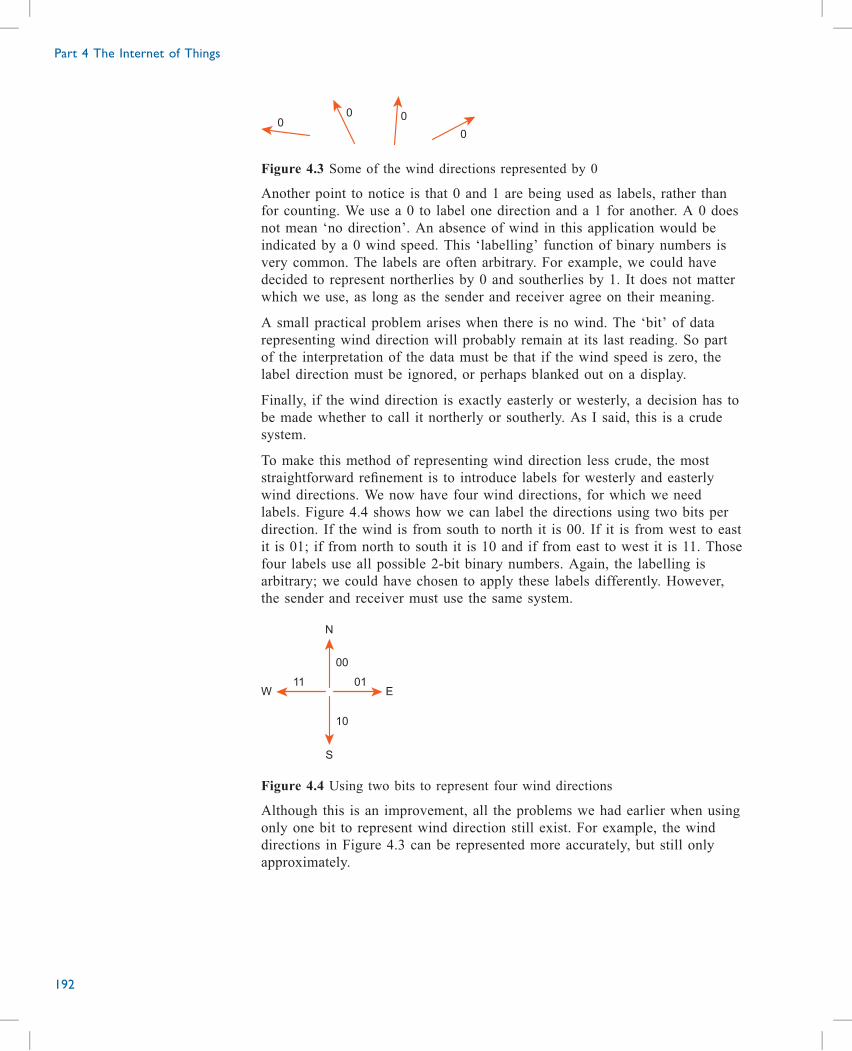
0
000
Figure 4.3 Some of the wind directions represented by 0
Another point to notice is that 0 and 1 are being used as labels, rather than
for counting. We use a 0 to label one direction and a 1 for another. A 0 does
not mean ‘no direction’. An absence of wind in this application would be
indicated by a 0 wind speed. This ‘labelling’ function of binary numbers is
very common. The labels are often arbitrary. For example, we could have
decided to represent northerlies by 0 and southerlies by 1. It does not matter
which we use, as long as the sender and receiver agree on their meaning.
A small practical problem arises when there is no wind. The ‘bit’ of data
representing wind direction will probably remain at its last reading. So part
of the interpretation of the data must be that if the wind speed is zero, the
label direction must be ignored, or perhaps blanked out on a display.
Finally, if the wind direction is exactly easterly or westerly, a decision has to
be made whether to call it northerly or southerly. As I said, this is a crude
system.
To make this method of representing wind direction less crude, the most
straightforward refinement is to introduce labels for westerly and easterly
wind directions. We now have four wind directions, for which we need
labels. Figure 4.4 shows how we can label the directions using two bits per
direction. If the wind is from south to north it is 00. If it is from west to east
it is 01; if from north to south it is 10 and if from east to west it is 11. Those
four labels use all possible 2-bit binary numbers. Again, the labelling is
arbitrary; we could have chosen to apply these labels differently. However,
the sender and receiver must use the same system.
EW0111
N
S
00
10
Figure 4.4 Using two bits to represent four wind directions
Although this is an improvement, all the problems we had earlier when using
only one bit to represent wind direction still exist. For example, the wind
directions in Figure 4.3 can be represented more accurately, but still only
approximately.
Part 4 The Internet of Things
192
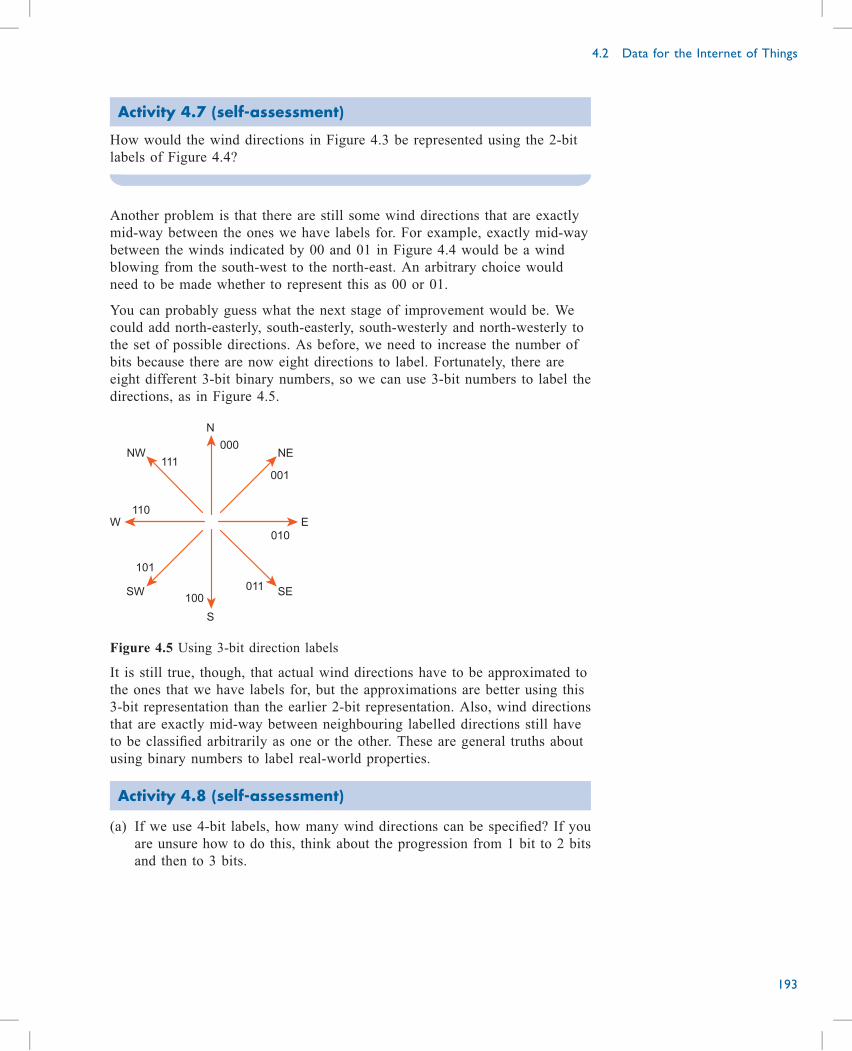
Activity 4.7 (self-assessment)
How would the wind directions in Figure 4.3 be represented using the 2-bit
labels of Figure 4.4?
Another problem is that there are still some wind directions that are exactly
mid-way between the ones we have labels for. For example, exactly mid-way
between the winds indicated by 00 and 01 in Figure 4.4 would be a wind
blowing from the south-west to the north-east. An arbitrary choice would
need to be made whether to represent this as 00 or 01.
You can probably guess what the next stage of improvement would be. We
could add north-easterly, south-easterly, south-westerly and north-westerly to
the set of possible directions. As before, we need to increase the number of
bits because there are now eight directions to label. Fortunately, there are
eight different 3-bit binary numbers, so we can use 3-bit numbers to label the
directions, as in Figure 4.5.
E
SE
NE
SW
NW
W
010
001
110
111
N
S
000
100011
101
Figure 4.5 Using 3-bit direction labels
It is still true, though, that actual wind directions have to be approximated to
the ones that we have labels for, but the approximations are better using this
3-bit representation than the earlier 2-bit representation. Also, wind directions
that are exactly mid-way between neighbouring labelled directions still have
to be classified arbitrarily as one or the other. These are general truths about
using binary numbers to label real-world properties.
Activity 4.8 (self-assessment)
(a) If we use 4-bit labels, how many wind directions can be specified? If you
are unsure how to do this, think about the progression from 1 bit to 2 bits
and then to 3 bits.
4.2 Data for the Internet of Things
193
(b) Sketch the directions and add some suitable 4-bit labels. For simplicity,
just draw one quadrant – that is, one quarter of the diagram, such as the
upper right-hand corner.
Many of the points that have emerged from this example are true for the
digital representation of other properties.
The representation is almost invariably an approximation. The more bits
there are in the binary numbers we use, the more precise the
approximation.
Binary numbers are often used for labelling, rather than for counting.
The number of labels available depends on the number of bits, which is
often represented as n. With n bits, 2n things can be assigned a unique n-
bit binary number.
The number of bits per reading, and how often they are taken, have
implications for the communication system used to convey the readings.
Activity 4.9 (self-assessment)
(a) Common values for the number of bits are 8 and 16. How many unique
binary numbers does each of these provide?
(b) There are 360 degrees in a circle. If we wish to measure wind direction
to a precision of 1 degree, how many bits are needed for each wind
direction? Your answer to part (a) might give a clue.
Note that going from 1-bit labels to 9-bit labels (in Activity 4.9) has taken us
from a representation of wind direction that was too crude to be useful to one
that is unnecessarily precise for most practical applications. Each additional
bit has doubled the number of wind directions that can be represented.
Even 1-bit representation is adequate for some purposes, however. For
instance, a proposed innovation in connection with ‘smart’ cities is a car
sensor for every car parking space. Reporting whether the space is occupied
requires only one bit, such as a 0 to indicate that the space is vacant and a 1
to indicate that it is occupied. In practice, additional data would be required –
for example, to identify the parking space and to give the data and time of
the reading.
4.2.4 Variable-length codingThroughout the wind-direction example, I have assumed that all wind-
direction readings use the same number of bits. This is called fixed-length
coding. The ‘fixed-length’ refers to the fixed number of bits in each label,
and ‘coding’ is another term for ‘labelling’. (This use of ‘code’ is different
from its use in computer programming.)
Part 4 The Internet of Things
194
An alternative to fixed-length coding is variable-length coding, in which
codes do not all have the same length. I will not say much about this, but
Table 4.3 shows a simple use of variable-length coding for representing four
possible wind directions.
Table 4.3 Variable-length coding
Wind direction Label (or code)
westerly 0
southerly 10
easterly 110
northerly 111
Variable-length coding can offer advantages over fixed-length coding if some
events are much more likely than others. For example, in the British Isles,
wind directions are predominantly from the west and south. By assigning
shorter codes to the most likely directions (as in Table 4.3), we can
sometimes gain a useful overall saving of data, even if some of the less likely
events actually require a longer code than would be required with fixed-
length codes. In Table 4.3, for example, the bottom two directions require 3-
bit codes, whereas with fixed-length codes 2-bit codes can be used for all
four directions.
Variable-length codes have to be constructed carefully. For example, in
Table 4.3, none of the shorter codes could be mistaken for the beginning of a
longer code. That is, only one code begins with a 0, and only one begins
with a 10. The receiver ‘knows’ that if the first bit of a wind-direction report
is 0, nothing else will follow; and if the first two bits are 10, nothing else
will follow. If the first two bits are 11, the receiver ‘knows’ a third digit will
follow.
4.2.5 ConclusionIn the Internet of Things, data is regularly collected from multiple sensors or
devices which indicate the status of objects, processes or conditions. The data
is sent to a central location which analyses it and (possibly) responds. Data is
sent as binary bits, and if each reading consists of n bits there can be
2n different readings.
4.2 Data for the Internet of Things
195
Radio communication
4.3.1 Problems of radio communicationRadio communication is an essential part of the Internet of Things, so in this
section I will look briefly at issues relating to radio communication that have
implications for the Internet of Things.
Radio is particularly susceptible to problems that do not affect
communication via other media such as wires or optical fibres. For example,
radio is vulnerable to interference from other radio devices, and from devices
that generate interference as a by-product of their normal working (for
example, switches, electric motors, and many digital devices). In addition,
interference arises from some natural processes such as lightning and sunspot
activity.
In digital communication, interference increases the probability of error; and
the stronger the interference, the greater the probability of error – other
things being equal. An error, or strictly speaking a bit error, is when a
transmitted 0 is interpreted by the receiver as a 1, or vice versa.
The term interference covers any unwanted intrusion on a wanted signal,
even if someone else might not regard the intrusion as unwanted. For
instance, when listening to the radio, you might occasionally hear another
radio station in the background. That other station is interference to you, but
the radio station you want to hear might be interference to someone else.
Electrical interference is often called noise.
Another potential problem with radio is blockage of the signal by obstacles.
Figure 4.6 shows radio waves being blocked by a building. Obstacles can be
much smaller than this. For example, obstacles could include a wall of a
house or items inside the house.
transmissionblocked by building
Figure 4.6 Blockage of radio signal by a building
Part 4 The Internet of Things
196
4.3
Some materials are more obstructive than others. Metal and concrete are
more obstructive to radio than wood and plaster. In some houses, the walls
are lined with thin metal foil, and although the foil is thin, it is usually much
more obstructive than the material it is applied to. In fact, foil lining can
completely block radio signals in a house.
Obstacles might weaken a signal, rather than completely block it. A
weakened signal is more likely to suffer from errors than a strong signal,
because a weakened signal is more susceptible to interference. In fact, in
digital communications, adverse conditions nearly always result in an
increased error rate, with other factors remaining the same.
Another potential problem with radio is reflection, as shown in Figure 4.7.
Here the radio signal reaches its destination by two routes, with reflection
along one of the routes.
interference betweenreflected transmissionand direct transmission
Figure 4.7 Signals reach the device directly and via reflection
The reflected path has a different length from the direct path, and probably a
different length from other reflected paths. As a result, the receiver gets two
versions of the signal, but subject to different amounts of delay. This kind of
self-interference is called multipath interference, and like other forms of
interference can cause errors.
As you know from earlier parts of Block 3, error correction and detection can
reduce the problem of errors, but there is a price to pay for their use. Error
detection and correction always increase the amount of data that has to be
transmitted (because they incorporate redundancy). They also increase the
processing needed at both at the transmitter and receiver. Processing burden
is potentially a problem because many Internet-of-Things devices are battery-
operated, and processing is a drain on the battery. I shall return to this issue
later.
Errors also have a bearing on range and data rate. To take range first, as a
receiving device travels away from a transmitter, the signal gets weaker and,
if other factors remain unchanged, the error rate increases. The limit of the
4.3 Radio communication
197
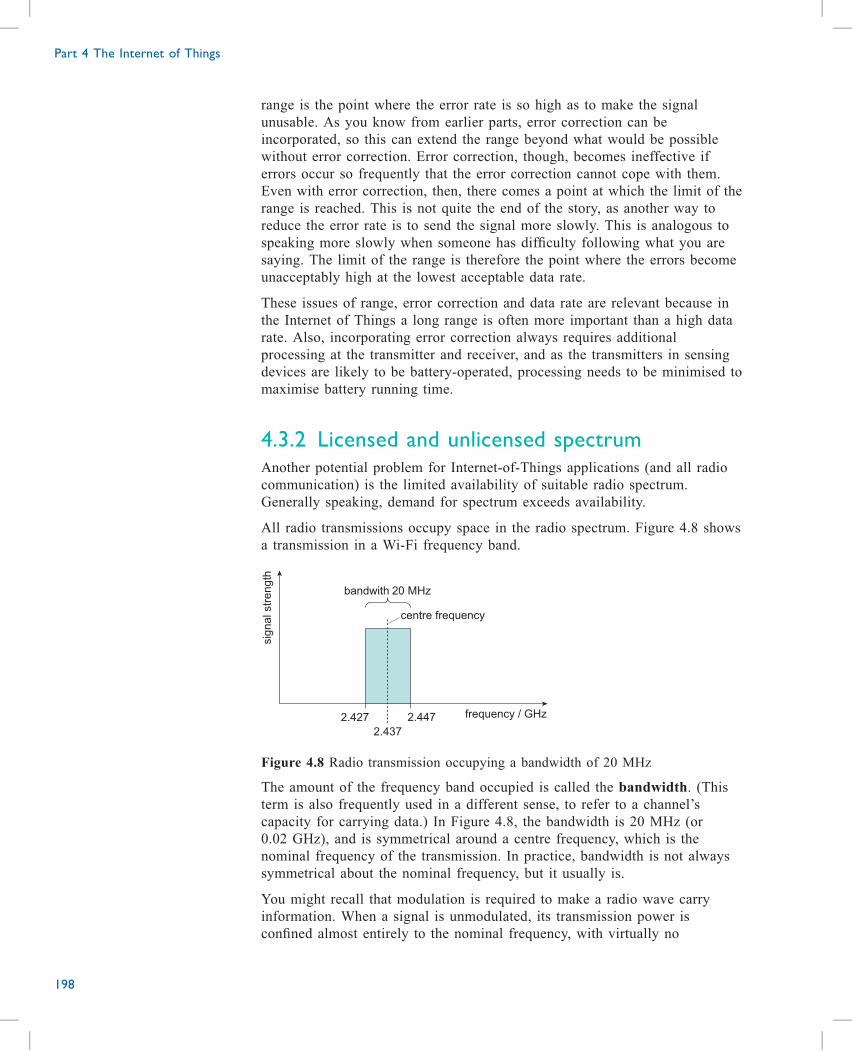
range is the point where the error rate is so high as to make the signal
unusable. As you know from earlier parts, error correction can be
incorporated, so this can extend the range beyond what would be possible
without error correction. Error correction, though, becomes ineffective if
errors occur so frequently that the error correction cannot cope with them.
Even with error correction, then, there comes a point at which the limit of the
range is reached. This is not quite the end of the story, as another way to
reduce the error rate is to send the signal more slowly. This is analogous to
speaking more slowly when someone has difficulty following what you are
saying. The limit of the range is therefore the point where the errors become
unacceptably high at the lowest acceptable data rate.
These issues of range, error correction and data rate are relevant because in
the Internet of Things a long range is often more important than a high data
rate. Also, incorporating error correction always requires additional
processing at the transmitter and receiver, and as the transmitters in sensing
devices are likely to be battery-operated, processing needs to be minimised to
maximise battery running time.
4.3.2 Licensed and unlicensed spectrumAnother potential problem for Internet-of-Things applications (and all radio
communication) is the limited availability of suitable radio spectrum.
Generally speaking, demand for spectrum exceeds availability.
All radio transmissions occupy space in the radio spectrum. Figure 4.8 shows
a transmission in a Wi-Fi frequency band.
sig
nalstr
ength
bandwith 20 MHz
centre frequency
frequency / GHz2.447
2.437
2.427
Figure 4.8 Radio transmission occupying a bandwidth of 20 MHz
The amount of the frequency band occupied is called the bandwidth. (This
term is also frequently used in a different sense, to refer to a channel’s
capacity for carrying data.) In Figure 4.8, the bandwidth is 20 MHz (or
0.02 GHz), and is symmetrical around a centre frequency, which is the
nominal frequency of the transmission. In practice, bandwidth is not always
symmetrical about the nominal frequency, but it usually is.
You might recall that modulation is required to make a radio wave carry
information. When a signal is unmodulated, its transmission power is
confined almost entirely to the nominal frequency, with virtually no
Part 4 The Internet of Things
198
significant bandwidth. Modulation, of whatever kind, causes the signal power
to be redistributed to include frequencies around the nominal frequency.
All modulated radio signals therefore have a bandwidth. The amount of
bandwidth depends on a range of factors, including the type of modulation
method used and the data rate, but the existence of bandwidth means that
there are limits to the number of radio transmissions that can be fitted into a
portion of the radio spectrum. This is analogous to the limitation on the
number of people who can be fitted into, for example, a bus or an aeroplane.
Multiple use of the same part of the frequency spectrum is possible if the
transmitters are so far apart that the signal from one is so attenuated as to be
negligible when it reaches the area served by another. This is what allows
television and radio stations in one country to use the same frequencies as
television and radio stations in another country, or mobile phone cells to
operate on the same frequency as other phone cells. The usual way to
organise transmission frequencies is to divide a transmission band into
channels of a standard width, each centred on a designated transmission
frequency. The channel width is designed to encompass the bandwidth of the
type of transmission the band is reserved for. For example, European
television bands are divided into channels 8 MHz wide.
Because of the limited capacity of radio-frequency bands, radio transmission
is highly regulated in virtually all countries. By law, radio transmission
usually requires a licence from the national radio-licensing authority.
Typically, a licence entitles the licence holder to exclusive use of a particular
channel, or portion of spectrum, within a country, and legal action can be
brought against someone who encroaches on someone else’s licensed channel.
The history of radio broadcasting is littered with examples of ‘pirate’ radio
stations operating without a licence. Examples of uses of licensed spectrum
include radio and television broadcasting, mobile telephony, military radio
and emergency-services radio. Some licence holders have to pay for their
licences – mobile phone operators being a prime example.
Small amounts of radio spectrum, in particular bands, are reserved for
unlicensed users. Anyone can use this spectrum, for any purpose, subject to
restrictions which usually specify the maximum allowed transmission power.
Wi-Fi, Bluetooth and ZigBee use unlicensed spectrum (sometimes called
licence-free spectrum).
The maximum transmission power allowed in unlicensed spectrum is
generally quite low. For example, in Europe, the maximum transmission
power allowed for Wi-Fi is 0.1 watts. This is much less than the transmission
power of a cellular (or mobile) base station, which would typically use
licensed spectrum and operate at power levels ranging from a few watts to
several tens of watts.
Because unlicensed spectrum is open to anyone, interference levels in these
bands can be high. However, although Bluetooth and Wi-Fi use the same
portion of spectrum in the 2.4 GHz licence-free bands, they co-exist well
because Bluetooth is designed not to interfere with Wi-Fi.
4.3 Radio communication
199
In relation to the Internet of Things, there is a fundamental division between
systems that use licensed spectrum and those that use unlicensed spectrum. I
will return to this division later.
Activity 4.10 (exploratory)
Write a short discussion of the potential advantages and disadvantages of
licensed and unlicensed spectrum for Internet-of-Things applications. For this,
you can draw any material you have read – not just in this section.
CommentHere is my answer.
The exclusivity associated with licensed spectrum means that devices using it
should be less susceptible to interference than devices using unlicensed
spectrum, and therefore should suffer fewer data errors. This could be
expected to have such consequences as longer battery life for battery-operated
devices and longer range for a given transmission power. A potential
drawback with using licensed spectrum, though, is that the associated
spectrum cost will have to be recouped – probably in the charges to
customers, as happens with cellular communications.
Unlicensed spectrum, being free to use, has no associated cost. However, the
relatively low maximum transmission power could limit the range, and higher
levels of interference in unlicensed spectrum could be expected to increase
the error rate.
4.3.3 Data amount and rateWhen a sensor transmits a reading, more data has to be included than is
contained in the reading itself. This is a general truth about all data
transmission – not just data in the Internet of Things.
For example, suppose a sensor transmits readings of wind speed and wind
direction, as discussed earlier. Readings might consist of a 12-bit number for
wind speed, and a 4-bit number for wind direction. Additional data could
include a 64-bit number to indicate the sensor’s location and 32 bits for date
and time. Also, we might use a 16-bit number as an identifier for the
particular device. The total number of bits per reading in this case is 128 bits,
of which the bits for the actual wind speed and direction form a small part.
Error control might be incorporated, and it is not unusual for this to double
the number of bits transmitted. The number of bits per reading now totals
256. This is quite consistent with the size of sensor readings generally, which
is usually in the range 80 to 1600 bits. As you know from earlier in this
module, whereas data rates are usually specified in bits per second (or
kilobits, megabits or gigabits per second), file sizes are usually specified in
bytes (or kilobytes, megabytes or gigabytes). Sensor readings are therefore
generally in the range 10 bytes to 200 bytes. Compared with much routine
data transmission, these are tiny amounts. For comparison, a digital
Part 4 The Internet of Things
200
photograph taken on a smartphone will be several megabytes, although
photos are sometimes given additional compression to bring them down to a
few hundred kilobytes when they are sent from a smartphone.
Activity 4.11 (self-assessment)
How much bigger is a 5 megabyte digital image than a 512-bit data file?
(Reminder: 1 kilobyte is 1024 bytes.)
The transmission of a sensor reading over the internet, which uses a paired
set of protocols known as TCP/IP, adds a lot of data overheads to the size of
a message, to the extent that 1 kilobyte is a reasonable approximation to the
typical size of a sensor’s data reading plus its overheads. Even 1 kilobyte,
though, is a small amount of data compared with much routine data traffic,
and it would be tempting to conclude that there will be no problem coping
with Internet-of-Things data. Two considerations suggest we should be
cautious about this conclusion. Firstly, although individual Internet-of-Things
applications might not produce much data, scaling them up to every
household and business might result in a flood of data. Secondly, new ways
of using the Internet of Things that we cannot yet envisage might result in
greatly increased data traffic. For example, monitoring of environmental
sensors or industrial equipment might be done in real time, with readings
transmitted continuously, or very frequently, rather than infrequently.
Rather surprisingly, the smallness of individual data transmissions for
Internet-of-Things applications presents problems if the data is carried by
third and fourth generations of the cellular phone system. This is because
these systems were optimised for users who would stay connected for
relatively long periods of time (for example several minutes or more),
whereas sending or Internet-of-Things traffic would require only a momentary
connection. An ironic consequence of early Internet-of-Things applications
was the new lease of life it gave to second generation (or 2G) cellular
communications, which was better suited to users sending small amounts of
data. For example, many credit-card readers in shops use 2G communications
to transmit card details and to receive authorisation to allow the purchase.
(Some card readers use Wi-Fi to connect to the shop’s broadband, and some
can use either method.) Since 2016, adaptations to the 4G cellular system
have been introduced which make it better able to accommodate Internet-of-
Things traffic, and we will look at these in Section 4.4.3.
4.3.4 Sending the dataWhen thinking about radio communications for Internet-of-Things
applications, it is useful to split the range of radio transmission into short,
medium and long, although these categories are not rigid.
Short range would typically be a range of metres or a few tens of metres. In
other words, short range would cover a few rooms in a building. Wi-Fi is
probably the most common example of short-range wireless. Medium range
4.3 Radio communication
201
would be several tens of metres up to a few kilometres. Long range would be
from a few kilometres upwards. Table 4.4 gives some examples for each
range.
Table 4.4 Examples of technologies using different ranges of radio communication
Short range
(metres to a few tens of
metres)
Medium range
(hundreds of metres to a
few kilometres)
Long range
(tens of kilometres to
hundreds of kilometres)
near-field communication
Bluetooth
ZigBee, (and other similar
networks for controlling
appliances e.g. Z-Wave)
Wi-Fi
cellular mobile
low-power wide area
networks (LPWANs)
cellular mobile
point-to-point fixed links
low-power wide area
networks (LPWANs)
All these ranges of radio communication, though not all the methods listed in
Table 4.4, are relevant to the Internet of Things. Short-range communication,
for example, is the obvious choice for domestic automation, in which
appliances and switches within the home are controlled wirelessly from
within the home. For such applications, ZigBee (which you met in earlier
parts of this block), Wi-Fi and Bluetooth have been used. Near-field
communication, also in the short-range category, is, strictly speaking, not a
form of radio transmission, although it is wireless. It is widely used for
contactless payment in retail, and for other applications.
(I will not say much more about near-field communication, but if you are
puzzled about how a form of communication can be wireless but not radio,
the essential point is that in radio there is continual radiation of power away
from the transmitter irrespective of whether there is a receiver present or not.
In near-field communication, by contrast, a varying magnetic field created by
the transmitter induces a current in a conducting loop in the receiver, as
happens in a transformer. This only works over a short range, and if no
receiver is present, no induction, and therefore no energy transfer, happens.
You will not be expected to know this for assignments.)
Medium- and long-range communication is suited for devices dispersed in the
environment, or for mobile applications (for example, monitoring goods
during delivery by road or rail).
Two of the forms of communication in Table 4.4 deserve special mention. A
low-power wide area network (LPWAN) is a relatively new form of radio
network envisaged solely for Internet-of-Things applications. LPWANs are
designed to overcome some of the problems the cellular mobile system has
with small amounts of data. You will learn more about LPWANs in
Subsection 4.4.3. Included in LPWANs are the modifications to 4G
mentioned above to make it better able to handle small units of data.
The point-to-point fixed links under ‘long range’ in Table 4.4 are generally
used where installation of cable or optical fibre is not practical. A classic
case is providing a communication link between an island and the mainland.
Part 4 The Internet of Things
202
Typically, a microwave dish on the island would be erected to point directly
at a similar dish on the mainland, and the microwave radio connection
between them would carry all kinds of traffic, such as telephony, data,
broadband, and so on. Internet-of-Things traffic could be included in this, but
in general point-to-point radio communication has no special role in the
Internet of Things.
Although we tend to think of radio (or wireless) communication as distinct
from wired communication, in practice the two nearly always go together. An
example is domestic Wi-Fi, which is nearly always used in conjunction with
a wired form of broadband delivered either over the telephone line or via
cable. In fact, radio communication networks such as those in Table 4.4 very
often function as an access network for reaching a trunk network (or core
network) of wired communications. The trunk network can be likened to a
network of motorways or major roads – that is, it conveys data traffic in bulk
over intensively used high-speed links. Another example of a radio access
network is the radio link in cellular mobile communications. Here, only the
part between the user’s mobile equipment and the base station is a radio
access network. Base stations themselves are usually connected to a fixed
network consisting of cables or optical fibres. So-called mobile
communication using a cellular network is actually carried mainly over fixed,
wired communication networks (in which I include optical fibre), and it is the
wired part that often plays a dominant role in determining the latency of data
traffic as experienced by the user. So, although radio networks are vital to the
Internet of Things, radio networks are themselves usually highly dependent
on fixed networks of cables and optical fibres.
4.3.5 ConclusionRadio transmission is susceptible to various kinds of interference, which
cause errors in digital transmission. Radio spectrum can be divided into
licensed and unlicensed. Underpinning much communication is a fixed
network of cables and optical fibres to which radio gives access. The amounts
of data associated with particular Internet-of-Things applications are expected
to be small, but it does not follow that Internet-of-Things data traffic poses
no problems.
4.3 Radio communication
203
Networks for the Internet of Things
4.4.1 Cellular networks and Wi-FiIt will probably be clear by now that the Internet of Things presents distinct
networking requirements, even though the amount of data traffic is typically
small. In this section, I want to look further at some of the special
requirements for the Internet of Things. I will start by thinking about indoor
locations, such as homes, offices, schools and factories, etc.
In indoor domestic and business settings, it is common to find broadband
connections used in conjunction with Wi-Fi to enable a certain amount of
untethered connectivity to devices within a short range. (‘Untethered’ here
means that there is no wire connecting the device to the network, allowing
the device to be used while moving around within range of the network. It is
contrasted with tethered connectivity, where a device has a wired data
connection.)
Now suppose that smart meters for gas, electricity and water are installed in
such a location to send meter readings back to the utility company. It would
be possible to send those readings via existing Wi-Fi and broadband available
in the premises. This would be a convenient arrangement as it would use
existing communications infrastructure, and small amounts of data are not a
problem. However, there could be problems with this approach.
Activity 4.12 (exploratory)
Imagine you work for a utility company planning to install smart meters in
your customers’ premises. The meters will use the Wi-Fi-and-broadband
network in the building to send readings to you. What difficulties might there
be with this arrangement? Think of potential business problems, technical
problems and security issues.
CommentFrom the business point of view, an immediate problem is that not everyone
has broadband and Wi-Fi, so special arrangements would be needed for those
customers. Then there is the question of reliability of connection. People
might turn their Wi-Fi off or disconnect the broadband – accidentally or
deliberately. Also, for many devices, whenever the Wi-Fi password is
changed (for example, when there is a new occupant), the devices have to be
reset to use the new password, and the same would be true of smart meters
that used home-owners’ Wi-Fi. New and easier methods of ensuring security
and authentication for Wi-Fi have been proposed, but they will probably take
a long time to become available. Also, customers could object to the energy
supplier getting its data transmitted at the customers’ expense, although any
system of meter reading is ultimately charged to the customer.
On the technical side, Wi-Fi signals are not always usable in all parts of a
building, as you have probably found yourself if you have Wi-Fi at home,
and this problem would be compounded if meters were outside the building.
Part 4 The Internet of Things
204
4.4
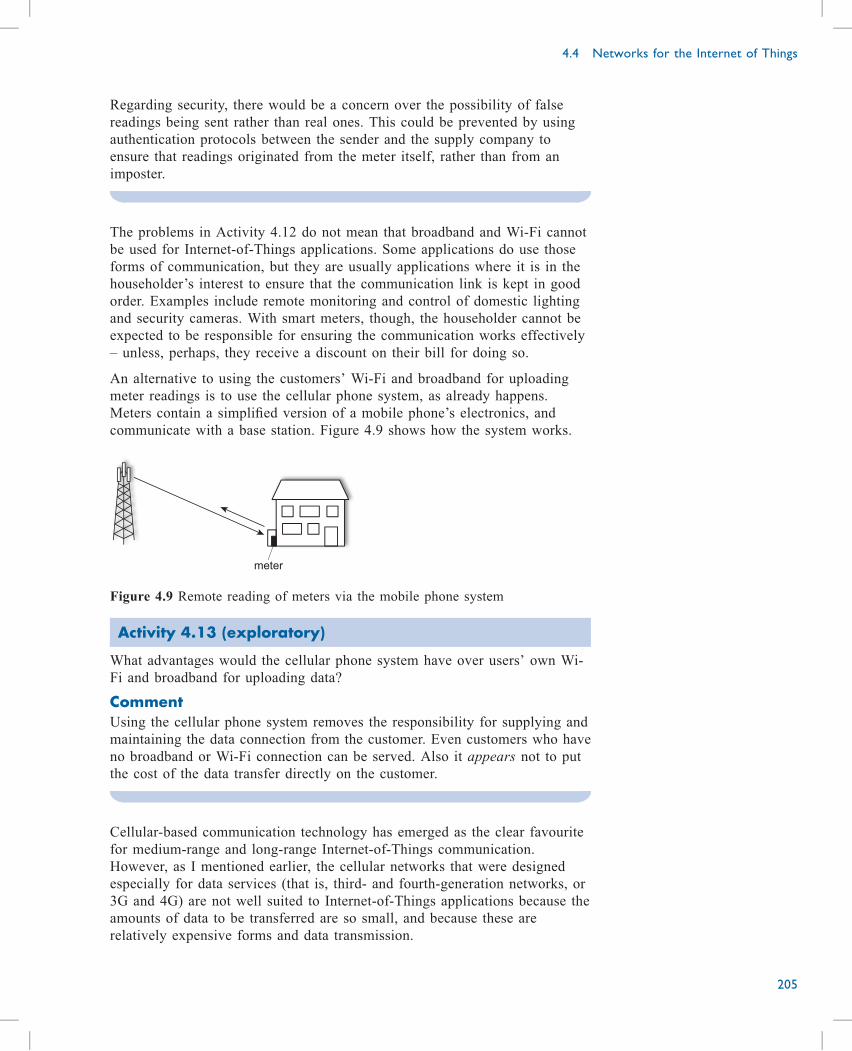
Regarding security, there would be a concern over the possibility of false
readings being sent rather than real ones. This could be prevented by using
authentication protocols between the sender and the supply company to
ensure that readings originated from the meter itself, rather than from an
imposter.
The problems in Activity 4.12 do not mean that broadband and Wi-Fi cannot
be used for Internet-of-Things applications. Some applications do use those
forms of communication, but they are usually applications where it is in the
householder’s interest to ensure that the communication link is kept in good
order. Examples include remote monitoring and control of domestic lighting
and security cameras. With smart meters, though, the householder cannot be
expected to be responsible for ensuring the communication works effectively
– unless, perhaps, they receive a discount on their bill for doing so.
An alternative to using the customers’ Wi-Fi and broadband for uploading
meter readings is to use the cellular phone system, as already happens.
Meters contain a simplified version of a mobile phone’s electronics, and
communicate with a base station. Figure 4.9 shows how the system works.
meter
Figure 4.9 Remote reading of meters via the mobile phone system
Activity 4.13 (exploratory)
What advantages would the cellular phone system have over users’ own Wi-
Fi and broadband for uploading data?
CommentUsing the cellular phone system removes the responsibility for supplying and
maintaining the data connection from the customer. Even customers who have
no broadband or Wi-Fi connection can be served. Also it appears not to put
the cost of the data transfer directly on the customer.
Cellular-based communication technology has emerged as the clear favourite
for medium-range and long-range Internet-of-Things communication.
However, as I mentioned earlier, the cellular networks that were designed
especially for data services (that is, third- and fourth-generation networks, or
3G and 4G) are not well suited to Internet-of-Things applications because the
amounts of data to be transferred are so small, and because these are
relatively expensive forms and data transmission.
4.4 Networks for the Internet of Things
205
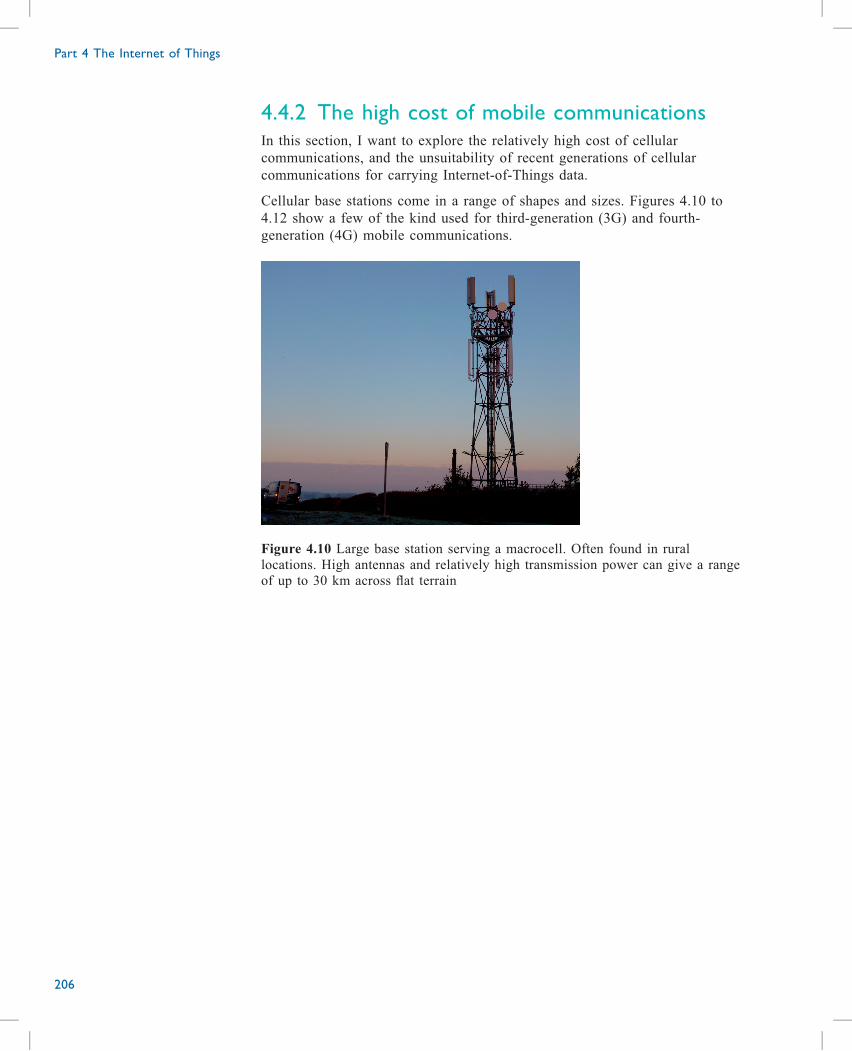
4.4.2 The high cost of mobile communicationsIn this section, I want to explore the relatively high cost of cellular
communications, and the unsuitability of recent generations of cellular
communications for carrying Internet-of-Things data.
Cellular base stations come in a range of shapes and sizes. Figures 4.10 to
4.12 show a few of the kind used for third-generation (3G) and fourth-
generation (4G) mobile communications.
Figure 4.10 Large base station serving a macrocell. Often found in rural
locations. High antennas and relatively high transmission power can give a range
of up to 30 km across flat terrain
Part 4 The Internet of Things
206
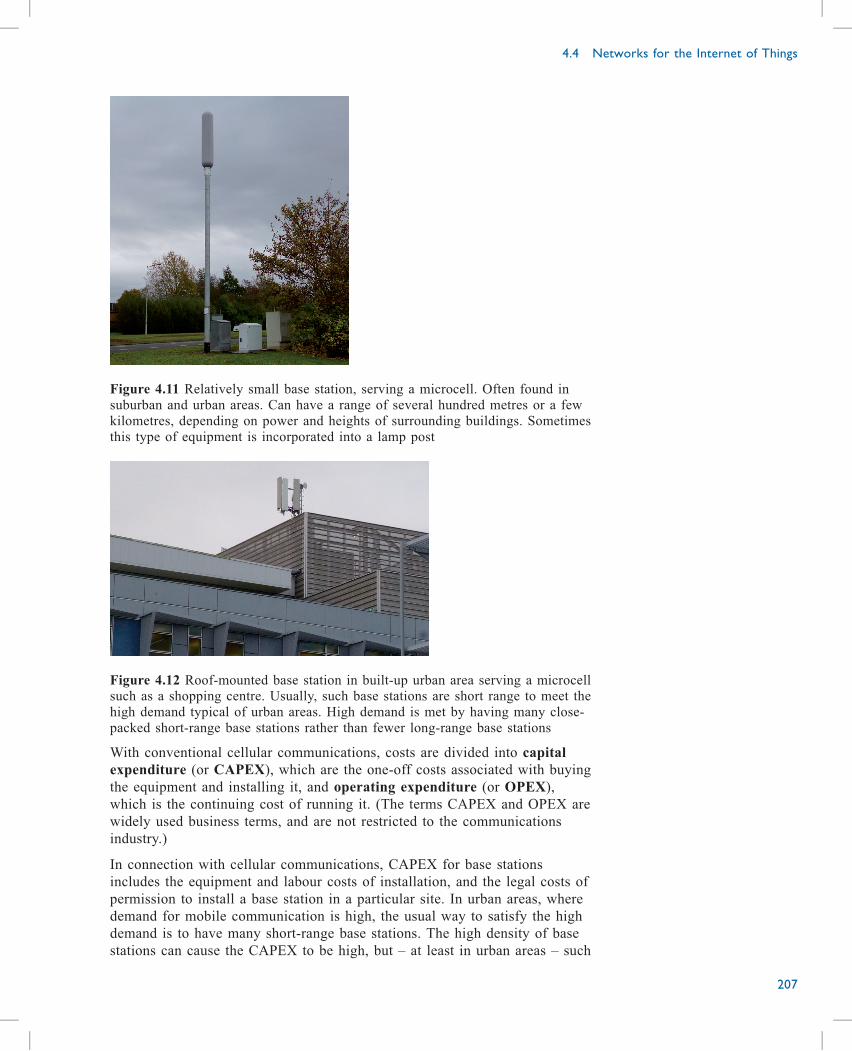
Figure 4.11 Relatively small base station, serving a microcell. Often found in
suburban and urban areas. Can have a range of several hundred metres or a few
kilometres, depending on power and heights of surrounding buildings. Sometimes
this type of equipment is incorporated into a lamp post
Figure 4.12 Roof-mounted base station in built-up urban area serving a microcell
such as a shopping centre. Usually, such base stations are short range to meet the
high demand typical of urban areas. High demand is met by having many close-
packed short-range base stations rather than fewer long-range base stations
With conventional cellular communications, costs are divided into capital
expenditure (or CAPEX), which are the one-off costs associated with buying
the equipment and installing it, and operating expenditure (or OPEX),
which is the continuing cost of running it. (The terms CAPEX and OPEX are
widely used business terms, and are not restricted to the communications
industry.)
In connection with cellular communications, CAPEX for base stations
includes the equipment and labour costs of installation, and the legal costs of
permission to install a base station in a particular site. In urban areas, where
demand for mobile communication is high, the usual way to satisfy the high
demand is to have many short-range base stations. The high density of base
stations can cause the CAPEX to be high, but – at least in urban areas – such
4.4 Networks for the Internet of Things
207
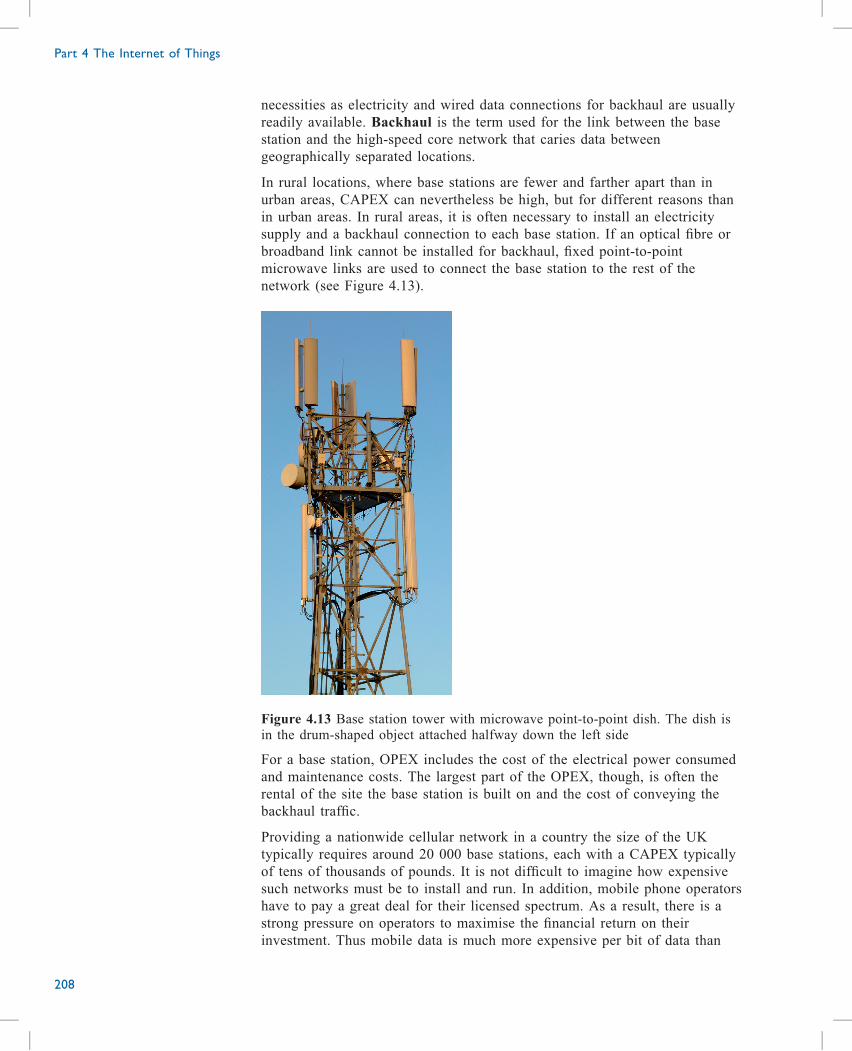
necessities as electricity and wired data connections for backhaul are usually
readily available. Backhaul is the term used for the link between the base
station and the high-speed core network that caries data between
geographically separated locations.
In rural locations, where base stations are fewer and farther apart than in
urban areas, CAPEX can nevertheless be high, but for different reasons than
in urban areas. In rural areas, it is often necessary to install an electricity
supply and a backhaul connection to each base station. If an optical fibre or
broadband link cannot be installed for backhaul, fixed point-to-point
microwave links are used to connect the base station to the rest of the
network (see Figure 4.13).
Figure 4.13 Base station tower with microwave point-to-point dish. The dish is
in the drum-shaped object attached halfway down the left side
For a base station, OPEX includes the cost of the electrical power consumed
and maintenance costs. The largest part of the OPEX, though, is often the
rental of the site the base station is built on and the cost of conveying the
backhaul traffic.
Providing a nationwide cellular network in a country the size of the UK
typically requires around 20 000 base stations, each with a CAPEX typically
of tens of thousands of pounds. It is not difficult to imagine how expensive
such networks must be to install and run. In addition, mobile phone operators
have to pay a great deal for their licensed spectrum. As a result, there is a
strong pressure on operators to maximise the financial return on their
investment. Thus mobile data is much more expensive per bit of data than
Part 4 The Internet of Things
208
data on fixed-line services such as those usually used for domestic broadband.
Additionally, the mobile devices used by customers are expensive. Part of the
reason for their high cost is the levy of an intellectual property charge on
several patented components of the phone. Eventually these patents expire
and the components then become cheaper.
Fortunately for cellular operators, customers are willing to pay relatively high
prices for data and services for the convenience of having access to them
while on the move. The Internet-of-Things market, though, serves customers
with very different priorities. The special requirements for the Internet of
Things can be summarised as: cheapness, low power/long battery life, long
range of transmission and reception, and small data transactions. I will take
these in order.
Cheapness. Networks and devices need to be cheap both to install and to run.
Mobile phones’ capabilities go well beyond what is required for the Internet
of Things, which accounts for why the innards of mobile phones are too
expensive to be incorporated into Internet-of-Things devices. (On the 2G
mobile system, many of the patents have expired, making these devices much
cheaper than later generations.) Internet-of-Things devices must be simple,
cheap and robust so that they can be deployed plentifully – often in adverse
environments – and so that loss or theft of devices will be of little concern. A
commonly quoted desirable price is 1 $US, although this is a very demanding
requirement. Figures of around 10–15 $US are quite realistic. Also, data itself
needs to be cheap.
Low power/long battery life. Many devices are expected to be battery
powered, and because they will often be located in inaccessible places, a long
battery life is required. A battery life of 10 years is frequently mentioned,
although this could exceed the shelf life of some batteries. This is a very
different level of power consumption from that associated with conventional
cellular communications, where daily recharging of the device’s battery is
often needed. Achieving the low levels of power consumption needed for
Internet-of-Things devices requires the development of new standards, or
modifications to existing standards. Such devices are expected to transmit
much more data to the base station (uplink data) than they receive from the
base station (downlink data). This is the reverse of conventional mobile data
traffic, where downlink data traffic greatly exceeds uplink traffic. In fact, in
Internet-of-Things applications, downlink traffic (from base station to device)
is expected to be minimal, and only for occasional system updates.
Long range. Devices might be in poor locations for signal propagation. For
example, meters might be located in cellars. The signal needs to be able to
get to and from these awkward locations. This requirement is usually
expressed as a need for long-range communication, although in some
environments penetration might matter more than distance covered. Long
range also makes possible nationwide coverage using many fewer base
stations than would be required for conventional mobile communications.
This would considerably reduce the cost of installing a nationwide network.
Small data transactions. The small data amounts produced by many
applications present a problem for conventional mobile communications, as
4.4 Networks for the Internet of Things
209
has been mentioned. The problem arises because conventional cellular
communications are based on units of communication capacity in each cell
which are shared dynamically among users. Usually there are not enough
units of capacity for them to be allocated to each user exclusively for the
duration of their connection. Instead, through the process of scheduling, the
amount of capacity allocated to users varies from moment to moment,
depending on their usage requirements. For example, a user who clicks on a
web link might briefly be allocated a lot of capacity so that the new page
loads quickly, but a couple of milliseconds later that capacity might be
allocated to someone else. The scheduling algorithms do not work well with
users who are connected only momentarily, as would be the case with much
Internet-of-Things traffic.
The unsuitability of conventional cellular networks for Internet-of-Things
applications has led to the development of a new class of medium-and long-
range cellular networks devised especially for Internet-of-Things applications.
These are known as Low Power Wide Area Networks (LPWANs), which you
first met in Subsection 4.3.4; we will now look at some of their features.
4.4.3 Low power wide area networks (LPWANs)LPWANs are cellular radio networks designed to satisfy the requirements
outlined in the last section. That is, they are designed to be cheap to install
and run, to use low power/enable long battery life in devices that use the
networks, to have long ranges of transmission and reception, and to be suited
to small data transactions. They can be divided into two types: those intended
for use on licensed spectrum and those intended for use on unlicensed
spectrum.
LPWANs for licensed spectrum
LPWANs for licensed spectrum are designed to overcome the shortcomings
of the conventional cellular networks for Internet-of-Things traffic, but to use
much of the same infrastructure as conventional cellular networks, such as
the base stations and fixed parts of the networks.
There are two types of LPWAN for use on cellular networks:
NB-IoT (Narrow-Band Internet of Things)
LTE Cat M1 (Long-Term Evolution – Category M1), often referred to as
LTE-M (Long-Term Evolution is the official name for 4G mobile
communications.)
NB-IoT is designed to operate in 200-kHz-wide bands of spectrum. This is a
relatively small amount, being the same amount as used for 2G radio
channels. Cellular operators can find such modest amounts of spectrum in, for
example, the gaps between existing spectrum use in 3G and 4G
communications, where bands are, respectively, 5 MHz wide and typically
20 MHz wide. (4G is more flexible in its spectrum use than 3G, and the
width of 4G bands can typically range from 10 MHz upwards.) Alternatively,
bands of spectrum formerly used for 2G could be used for NB-IoT. At the
Part 4 The Internet of Things
210
time of writing (2017), NB-IoT allows communication only in the uplink
direction (from device to network).
LTE Cat M1 is a two-way form of communication based very closely on 4G
mobile communications, and cellular operators using it would be expected to
reserve a small amount of their LTE capacity in a cell for Internet-of-Things
traffic. LTE-M1 introduces low power modes for devices and sensors by
allowing them go into an idle mode, or a dormant state, which they would
only awake from when there was data to transmit or receive. Other
modifications reduce the cost of carrying traffic on this type of network.
Activity 4.14 (self-assessment)
In view of the differences between licensed and unlicensed spectrum outlined
earlier, what advantages could NB-IoT and LTE Cat M1 be expected to have
over networks that use unlicensed spectrum?
The fact that NB-IoT and LTE Cat M1 are administered by cellular operators
brings further benefits in addition to those mentioned in the last activity,
which are not always available to the users of licence-free networks discussed
below. Prominent among these are the security and privacy features that are
built into mobile cellular networks. For example, mobile networks have
sophisticated systems for authentication of users, and for maintaining
confidentiality and integrity of communication.
LPWANs for unlicensed spectrum
Several LPWANs have been devised that are not associated with the usual
cellular networks, although these new networks are themselves cellular. They
were developed to fill a gap, because the cellular communications industry
appeared for a long time not to be interested in the Internet-of-Things market.
These LPWANs have several features in common, notably:
use of unlicensed spectrum
use of very low data rates to achieve long range and penetration
simplicity and cheapness.
Examples of this type of LPWAN include:
Sigfox
LoRaWAN
Ingenu
WAVIoT.
Figure 4.14 suggests how much simpler these LPWANs are than those
devised for cellular networks. The grey and blue boxes are ‘gateways’, which
are somewhat like base stations, for LoRaWAN networks. With the antennas
shown, they can have a range of around 5 km, and with larger antennas they
can have a longer range.
4.4 Networks for the Internet of Things
211
Figure 4.14 The grey and blue boxes are gateways for LoRaWAN networks. The
white tube on the right is an antenna. At the bottom of the grey gateway an
Ethernet port is visible, which supplies both power and connectivity. This is the
only connection the gateway needs. For connectivity, the gateway can be
connected to the Ethernet port of a broadband router
The gateways in Figure 4.14 have comparable ranges to those of the cellular
base stations shown in Figure 4.10 to 4.13, but typically cost a few hundred
pounds each. The LoRaWAN gateways also occupy very little space, and
need only power and a broadband connection. It is therefore relatively
straightforward to set up city-wide coverage for this type of LPWAN.
Gateways such as those in Figure 4.14 are simple devices compared with
cellular base stations. They collect data packets from devices in their
coverage region and forward them over the internet to the destination server
designated by the owners of the devices that are transmitting data. Packets
are encrypted at the source, but there are few of the other sophistications
associated with cellular communications. For example, conventional cellular
base stations ‘hand over’ users as they move from cell to cell. Also,
conventional base stations use the dynamic allocation of communication
capacity known as ‘scheduling’, referred to earlier. The gateways above do
none of these, nor many of the other many functions of a conventional base
station.
The maximum data rates of these LPWANs is typically very low compared
with conventional cellular communication. This is demonstrated very well by
Sigfox, a system developed in France which has a data throughput in the
region of 100 bits per second. Remarkably, a Sigfox network covers most of
France with just 1200 gateways, whereas over 50 000 conventional base
stations would be required. Sigfox achieves such a long range principally
thanks to two features. One is the extremely low data rate; the other is the
use of a very narrow transmission band which concentrates the transmission
power. Sigfox does not use conventional error detection and correction.
Instead data packets are typically sent three times, and the receiving server
makes a judgement about the correct data.
Part 4 The Internet of Things
212
It seems unlikely that all the LPWANs that use unlicensed spectrum (and
there are many more than I have mentioned in this section) can thrive, but it
is possible that there could be a mixed economy with some markets served
by an LPWAN using licensed spectrum and one or two using unlicensed
spectrum. An LPWAN using licensed spectrum could offer guaranteed
delivery of data packets, high levels of security and other guarantees of a
particular level of service, for which there would be a corresponding price to
pay. An LPWAN using licence-free spectrum could cater for a market where
levels of service could not be guaranteed but for which data and equipment
could be much cheaper.
4.4.4 ConclusionSome Internet-of-Things applications can be expected to use existing
broadband and Wi-Fi connectivity, but for applications where users cannot be
expected to provide a data connection, or for many outdoor applications, low-
power wide area networks (LPWANs) can be used. LPWANs differ
depending on whether they use licensed or unlicensed spectrum. LPWANs
that use licensed spectrum use the infrastructure of conventional cellular
communications, but are better suited to Internet-of-Things applications than
conventional cellular communications. LPWANs that use unlicensed spectrum
use new infrastructure that is simpler and cheaper than conventional cellular
infrastructure.
4.4 Networks for the Internet of Things
213
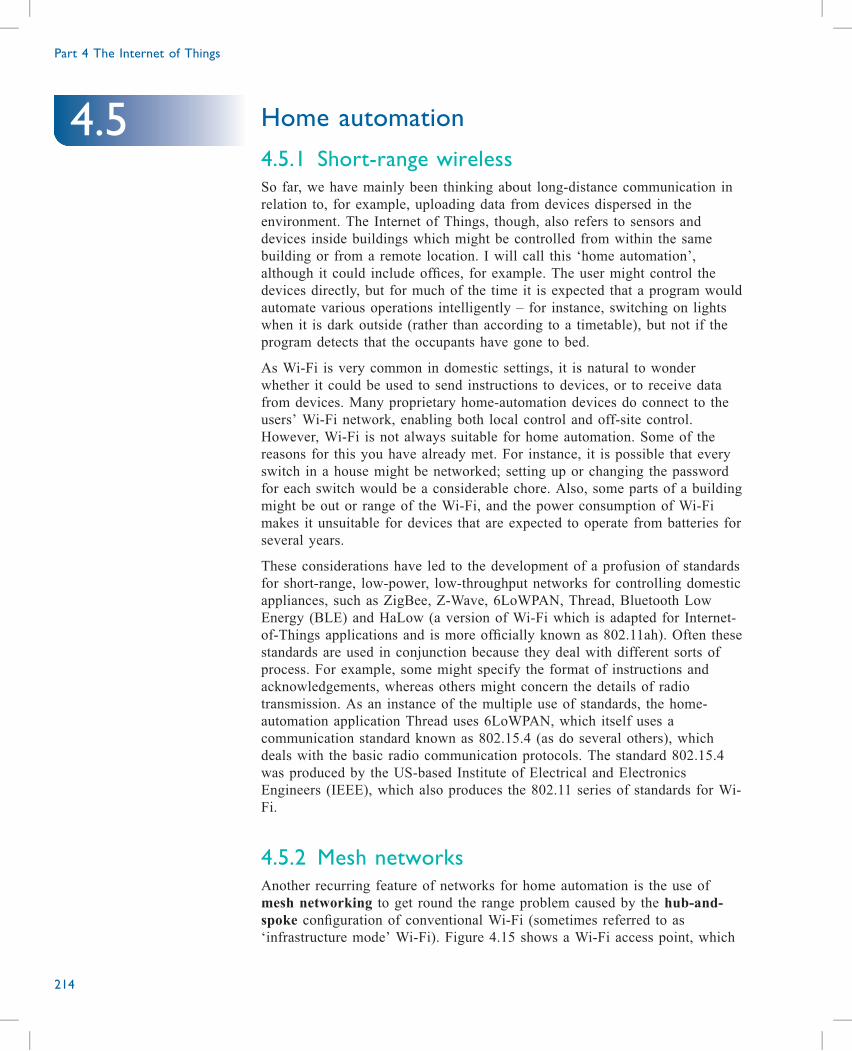
Home automation
4.5.1 Short-range wirelessSo far, we have mainly been thinking about long-distance communication in
relation to, for example, uploading data from devices dispersed in the
environment. The Internet of Things, though, also refers to sensors and
devices inside buildings which might be controlled from within the same
building or from a remote location. I will call this ‘home automation’,
although it could include offices, for example. The user might control the
devices directly, but for much of the time it is expected that a program would
automate various operations intelligently – for instance, switching on lights
when it is dark outside (rather than according to a timetable), but not if the
program detects that the occupants have gone to bed.
As Wi-Fi is very common in domestic settings, it is natural to wonder
whether it could be used to send instructions to devices, or to receive data
from devices. Many proprietary home-automation devices do connect to the
users’ Wi-Fi network, enabling both local control and off-site control.
However, Wi-Fi is not always suitable for home automation. Some of the
reasons for this you have already met. For instance, it is possible that every
switch in a house might be networked; setting up or changing the password
for each switch would be a considerable chore. Also, some parts of a building
might be out or range of the Wi-Fi, and the power consumption of Wi-Fi
makes it unsuitable for devices that are expected to operate from batteries for
several years.
These considerations have led to the development of a profusion of standards
for short-range, low-power, low-throughput networks for controlling domestic
appliances, such as ZigBee, Z-Wave, 6LoWPAN, Thread, Bluetooth Low
Energy (BLE) and HaLow (a version of Wi-Fi which is adapted for Internet-
of-Things applications and is more officially known as 802.11ah). Often these
standards are used in conjunction because they deal with different sorts of
process. For example, some might specify the format of instructions and
acknowledgements, whereas others might concern the details of radio
transmission. As an instance of the multiple use of standards, the home-
automation application Thread uses 6LoWPAN, which itself uses a
communication standard known as 802.15.4 (as do several others), which
deals with the basic radio communication protocols. The standard 802.15.4
was produced by the US-based Institute of Electrical and Electronics
Engineers (IEEE), which also produces the 802.11 series of standards for Wi-
Fi.
4.5.2 Mesh networksAnother recurring feature of networks for home automation is the use of
mesh networking to get round the range problem caused by the hub-and-
spoke configuration of conventional Wi-Fi (sometimes referred to as
‘infrastructure mode’ Wi-Fi). Figure 4.15 shows a Wi-Fi access point, which
Part 4 The Internet of Things
214
4.5
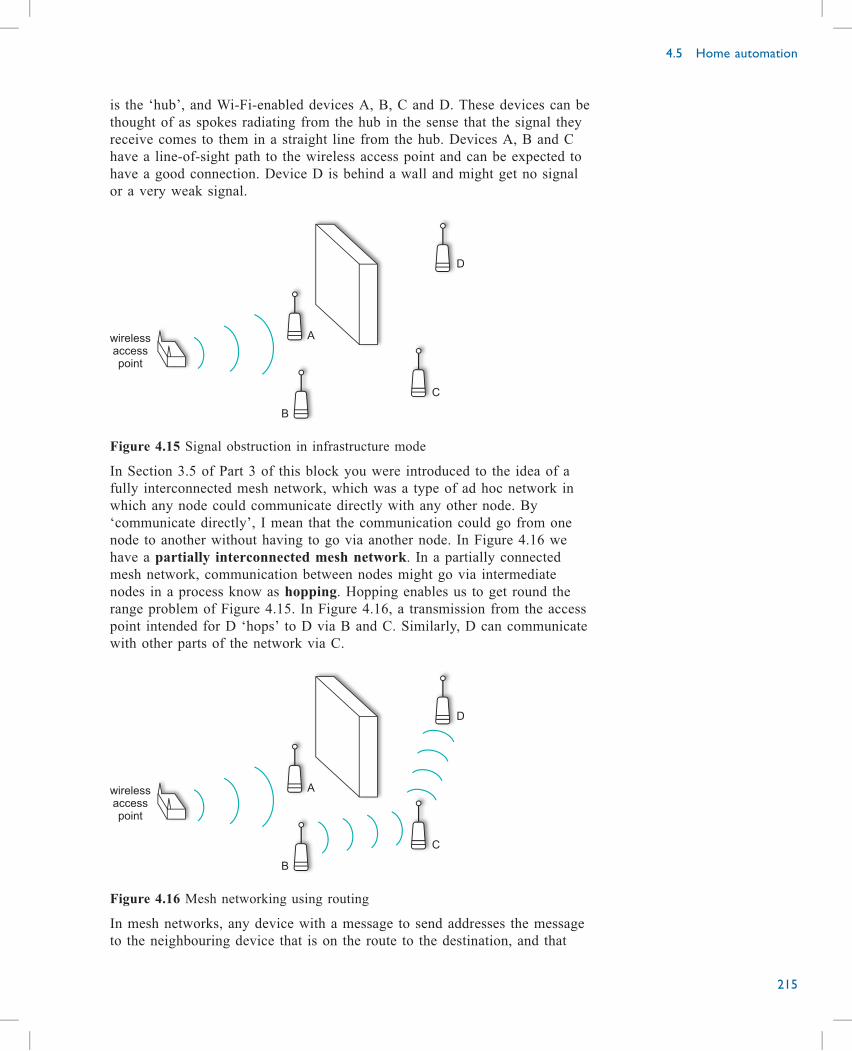
is the ‘hub’, and Wi-Fi-enabled devices A, B, C and D. These devices can be
thought of as spokes radiating from the hub in the sense that the signal they
receive comes to them in a straight line from the hub. Devices A, B and C
have a line-of-sight path to the wireless access point and can be expected to
have a good connection. Device D is behind a wall and might get no signal
or a very weak signal.
wirelessaccesspoint
A
B
C
D
Figure 4.15 Signal obstruction in infrastructure mode
In Section 3.5 of Part 3 of this block you were introduced to the idea of a
fully interconnected mesh network, which was a type of ad hoc network in
which any node could communicate directly with any other node. By
‘communicate directly’, I mean that the communication could go from one
node to another without having to go via another node. In Figure 4.16 we
have a partially interconnected mesh network. In a partially connected
mesh network, communication between nodes might go via intermediate
nodes in a process know as hopping. Hopping enables us to get round the
range problem of Figure 4.15. In Figure 4.16, a transmission from the access
point intended for D ‘hops’ to D via B and C. Similarly, D can communicate
with other parts of the network via C.
wirelessaccesspoint
A
B
C
D
Figure 4.16 Mesh networking using routing
In mesh networks, any device with a message to send addresses the message
to the neighbouring device that is on the route to the destination, and that
4.5 Home automation
215
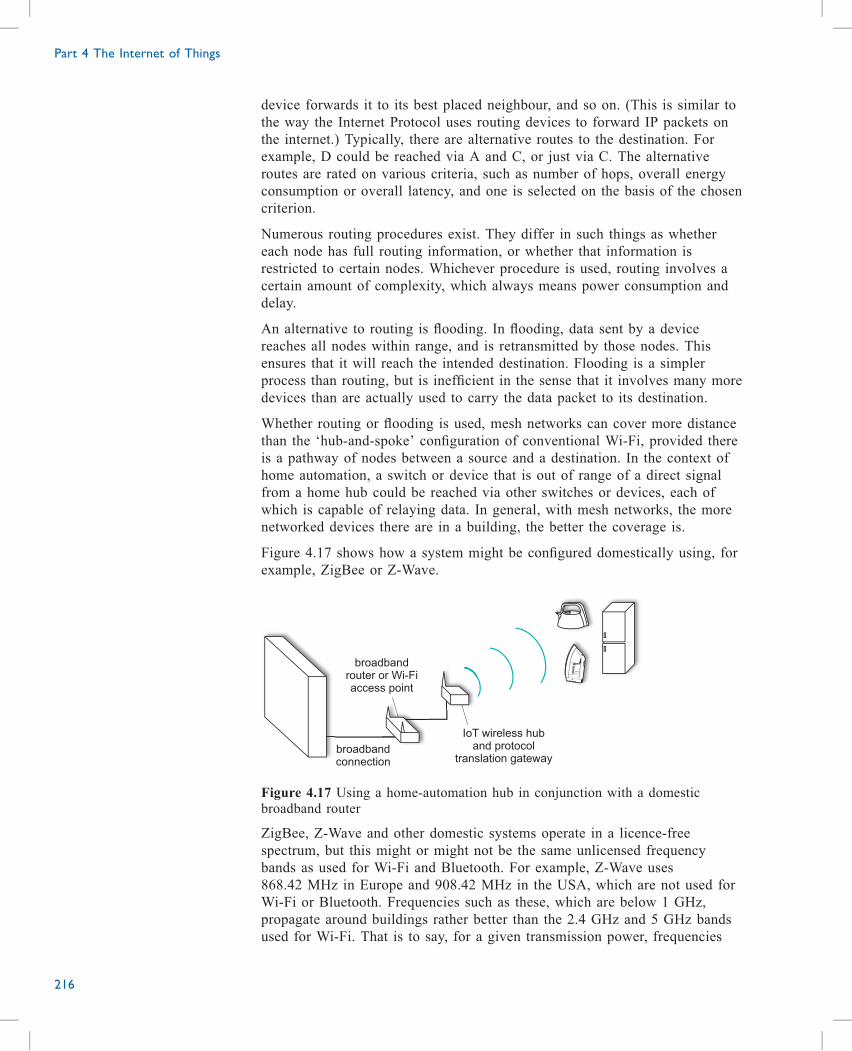
device forwards it to its best placed neighbour, and so on. (This is similar to
the way the Internet Protocol uses routing devices to forward IP packets on
the internet.) Typically, there are alternative routes to the destination. For
example, D could be reached via A and C, or just via C. The alternative
routes are rated on various criteria, such as number of hops, overall energy
consumption or overall latency, and one is selected on the basis of the chosen
criterion.
Numerous routing procedures exist. They differ in such things as whether
each node has full routing information, or whether that information is
restricted to certain nodes. Whichever procedure is used, routing involves a
certain amount of complexity, which always means power consumption and
delay.
An alternative to routing is flooding. In flooding, data sent by a device
reaches all nodes within range, and is retransmitted by those nodes. This
ensures that it will reach the intended destination. Flooding is a simpler
process than routing, but is inefficient in the sense that it involves many more
devices than are actually used to carry the data packet to its destination.
Whether routing or flooding is used, mesh networks can cover more distance
than the ‘hub-and-spoke’ configuration of conventional Wi-Fi, provided there
is a pathway of nodes between a source and a destination. In the context of
home automation, a switch or device that is out of range of a direct signal
from a home hub could be reached via other switches or devices, each of
which is capable of relaying data. In general, with mesh networks, the more
networked devices there are in a building, the better the coverage is.
Figure 4.17 shows how a system might be configured domestically using, for
example, ZigBee or Z-Wave.
broadbandconnection
broadbandrouter or Wi-Fiaccess point
IoT wireless huband protocol
translation gateway
Figure 4.17 Using a home-automation hub in conjunction with a domestic
broadband router
ZigBee, Z-Wave and other domestic systems operate in a licence-free
spectrum, but this might or might not be the same unlicensed frequency
bands as used for Wi-Fi and Bluetooth. For example, Z-Wave uses
868.42 MHz in Europe and 908.42 MHz in the USA, which are not used for
Wi-Fi or Bluetooth. Frequencies such as these, which are below 1 GHz,
propagate around buildings rather better than the 2.4 GHz and 5 GHz bands
used for Wi-Fi. That is to say, for a given transmission power, frequencies
Part 4 The Internet of Things
216
below 1 GHz travel further than frequencies above 1 GHz. In general, above
1 GHz, higher frequencies propagate less well than lower frequencies. ZigBee
can use licence-free spectrum at 868 MHz in Europe and 915 MHz in the
USA, as well as the 2.4 GHz licence-free bands used for Wi-Fi and
Bluetooth.
Whatever unlicensed band is used, non-Wi-Fi systems such as ZigBee and Z-
Wave require a separate hub or gateway from that used for Wi-Fi. Devices
are controlled via the hub, either from a remote internet-connected device
(such as a remote computer, tablet or smartphone) or from a Wi-Fi-enabled
controller in the same location as the controlled devices. The hub or gateway
is linked to the domestic broadband router/Wi-Fi access point either by a
wired connection, as shown in Figure 4.17 or wirelessly.
Activity 4.15 (exploratory)
In Figure 4.17, the hub is also labelled ‘protocol translation gateway’. Why is
protocol translation necessary?
CommentWhen a person controls the devices either from a remote location or from a
Wi-Fi-enabled controller, those instructions are conveyed via the broadband
router/Wi-Fi access point to the gateway or hub. This uses a different
protocol to communicate with devices in the home, so translation is
necessary. Similarly, messages from the devices, such, acknowledgements,
status information, or warnings, need to be translated to a different protocol
to reach the user.
In mesh networks with nodes (or devices) designed for battery operation, it is
common for nodes to go into standby mode (a low-energy mode). They need
to be woken from this mode before they can process data or act on
instructions. Because waking up always takes a certain amount of time,
standby mode contributes to the relatively long latency of low-energy mesh
networks compared with high-power hub-and-spoke networks such as
conventional Wi-Fi.
Activity 4.16 (exploratory)
Because of the latency referred to above, there could be a noticeable delay
between the transmitting of an instruction to an Internet-of-Things device and
its response. Would a delay be acceptable in a home automation context? If
so, how long a delay would be acceptable?
CommentA delay of even a second or two would not be critical for most devices.
However, if room lights responded to the presence of a person, it would be
irritating if they did not come on immediately on entering a room, or using a
4.5 Home automation
217
staircase. A more crucial issue might be the speed of switching appliances off
in cases where there was a potential hazard from (for example) hot surfaces.
4.5.3 Energy and power consumptionThroughout this part, I have mentioned issues related to power several times,
particularly where battery-powered devices are concerned. In this subsection,
I want to look at what is actually meant by ‘energy’ and ‘power’, which,
scientifically speaking, are not the same.
Work, energy and power
In science, the terms work and energy are almost interchangeable. Both
are measured in joules (symbol J), named after the nineteenth-century
British scientist James Joule. (Units named after people, such as the
joule, volt, ampere and watt, are not usually capitalised, although the
symbol usually is.)
On Earth, approximately 10 J of work would be done lifting a 1 kg
object through 1 metre. (A more precise figure for the amount of work
would be 9.81 J, but I will use the approximate figure of 10 J.) The lift
is achieved by applying a force to the object, causing it to move. Work
is done when a force’s point of application moves.
At the end of the lift, the object would be said to have gained 10 J of
energy, which it could release as work by descending through a metre
and driving a mechanism (for example, a mechanical clock). Energy,
therefore, is the capacity to do work. In the example here, it does not
matter how quickly the object is raised or falls; in each case, the work,
or energy, would be the same; nor would it matter whether the lifting
were done electrically, mechanically, pneumatically or by any other
means.
Although raising a 1 kg object through 1 metre always requires the
same work, there is clearly a difference between raising it quickly, for
example in one-tenth of a second, and raising it slowly, for example in
10 seconds. What is different is the power required for the lift. A quick
lift requires more power than a slow one. Power is the rate at which
work is done, and the unit of power is the watt (W); 1 watt is the power
required to do 1 J of work in 1 second. To say the same thing
differently, power is work ÷ time. Doing 1 J of work in one-tenth of a
second requires a power of 10 W, and doing the same amount of work
in 10 seconds requires a power of 0.1 W.
The powers of devices we use in daily life vary enormously. The
electrical power of a domestic LED bulb is typically in the range of
5 W to 15 W, replacing a filament bulb that would have consumed about
eight times as much electrical power (most of which would have been
Part 4 The Internet of Things
218
radiated as heat, rather than light). A domestic kettle is usually around
2 kW, which is relatively high for a domestic appliance, but kettles are
usually used fairly briefly and the energy consumed in a single use
would be comparable with running a 15 W device, such as an LED
electric light, for a couple of hours. A washing machine might consume
2 kW when heating the water, 250 W during washing, and 500 W
during spinning.
A continuous power consumption of 1 W by a mains-powered device
would not make much difference to your electricity bill, but a small
battery-powered 1 W device would typically exhaust its battery in hours
or a day or two. The maximum power consumption of a smartphone
would be around 3 W, but it would only operate at that power
intermittently.
Individual solar panels on roofs generally can generate around 200 W
depending on the strength of the sunlight. A typical installation consists
of several panels, depending on the size of the roof.
A base station serving a macrocell, such as Figure 4.10, could have a
transmission power of 50 W per channel, and would typically operate on
a few channels. (Not all the power consumed in a base station would be
transmission power.) A base station for a microcell might have a
transmission power of 1.5 W per channel.
It would be wrong to think of the watt as being only a unit only of
electrical power, although that is the context in which it is often met.
The watt can be used for any sort of power, such as mechanical,
hydraulic, sonic, or thermal. The maximum power of the petrol engine
in a small car, for example, would typically be around 70 kW.
Table 4.5 compares energy consumption rates for Wi-Fi, ZigBee and Green
Power (which is a low-energy adaptation of ZigBee). The second column
indicates a particular device connected to the corresponding network in the
first column. The third column indicates energy consumption by the device in
the second column per hour of use.
Table 4.5 Comparison of energy consumption rates
Technology Device Energy use per hour Comparison
Wi-Fi Laptop computer 2 kJ ?
ZigBee Hub 20 mJ ?
Green power Light switch 200 μJ ?
Source: ZigBee 3.0 – The Open, Global Standard for the Internet of Things,December 2, 2014, https://www.youtube.com/watch?v=HJlQI2Z7V-Q
The following activity is based on Table 4.5.
4.5 Home automation
219
Activity 4.17 (self-assessment)
(a) What fraction of the energy used by a laptop’s Wi-Fi in 1 hour would be
used by a ZigBee hub in 1 hour? (Your answer would replace the first
question mark in the ‘Comparison’ column of Table 4.5.)
(b) For how long, in days and hours, would a ZigBee hub have to run to
consume the same amount of energy as a laptop computer’s Wi-Fi
consumes in an hour?
(c) In light of the answer to (b), what practical problems might there be if
the ZigBee hub were to be powered by conventional batteries?
(d) On the basis of Table 4.5, what is the power consumption of the laptop’s
Wi-Fi module?
Part (d) of Activity 4.16 indicates why Wi-Fi is not suitable for home-
automation communication with battery powered devices, as those devices
would have similar power consumption to that of the laptop’s Wi-Fi in
Table 4.5.
Although we have been looking at remote operation of home-automation
networks, in practice, such systems (and many other Internet-of-Things
applications) are expected to incorporate a measure of ‘intelligence’, and to
operate autonomously, that is, with little intervention from human controllers.
The following case study gives an example of incorporation of intelligence
into a home automations system.
4.5.4 Case study: Conversations with washing
machines (by Annika Wolff)
Many houses have solar panels fitted to their roofs. However, most solar
energy is generated during the day, when the sun is shining, whereas
domestic energy consumption typically occurs in the evening, when
people have arrived home from work and school and are using
electronic items such as televisions and computers, or cooking their
meals. This gap between generation and consumption is referred to as a
domestic energy gap.
One solution would be to store the energy generated by the solar panels,
but this has both a monetary and environmental cost. An alternative
approach is for householders to shift some energy consumption to the
times of day when solar energy is at its peak. This is called demand
shifting. Not all energy consumption can be shifted, though.
One household task that can be shifted is washing clothes. To shift this
effectively, it is necessary to know which part of the day would make
Part 4 The Internet of Things
220
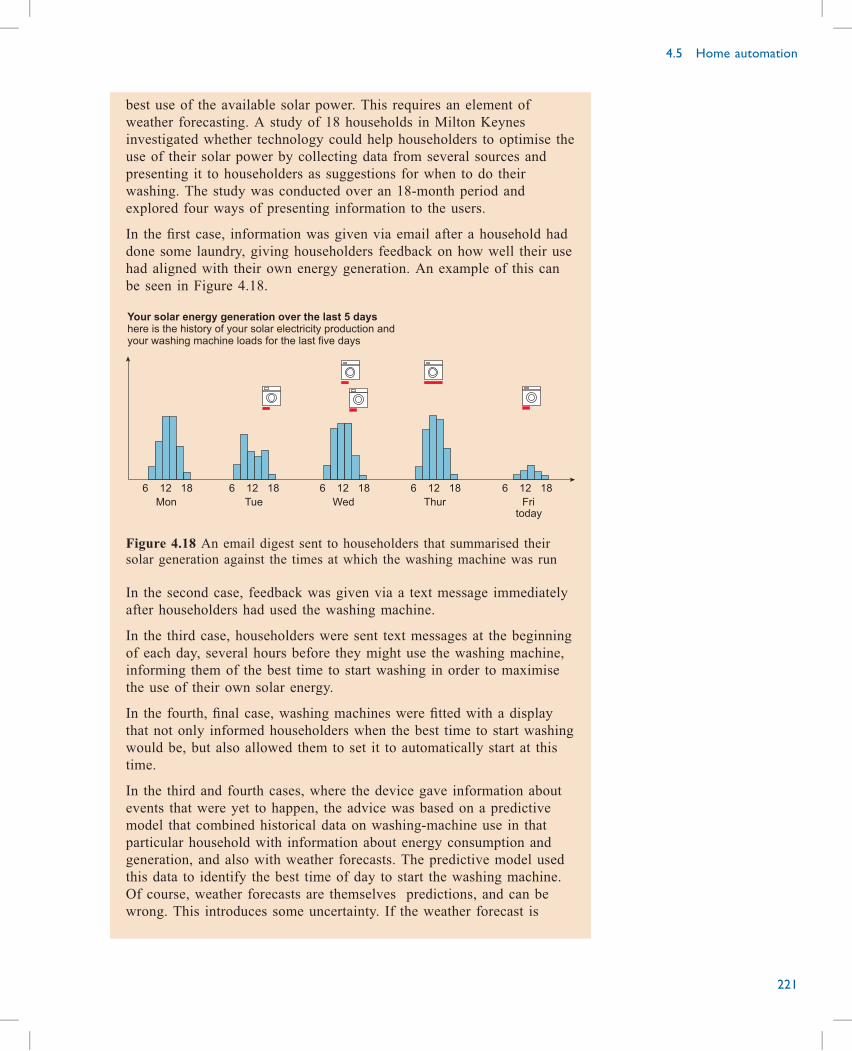
best use of the available solar power. This requires an element of
weather forecasting. A study of 18 households in Milton Keynes
investigated whether technology could help householders to optimise the
use of their solar power by collecting data from several sources and
presenting it to householders as suggestions for when to do their
washing. The study was conducted over an 18-month period and
explored four ways of presenting information to the users.
In the first case, information was given via email after a household had
done some laundry, giving householders feedback on how well their use
had aligned with their own energy generation. An example of this can
be seen in Figure 4.18.
Your solar energy generation over the last 5 dayshere is the history of your solar electricity production andyour washing machine loads for the last five days
Mon Tue Wed Thur Fri
6 12 18 6 12 18 6 12 18 6 12 18 6 12 18
today
Figure 4.18 An email digest sent to householders that summarised their
solar generation against the times at which the washing machine was run
In the second case, feedback was given via a text message immediately
after householders had used the washing machine.
In the third case, householders were sent text messages at the beginning
of each day, several hours before they might use the washing machine,
informing them of the best time to start washing in order to maximise
the use of their own solar energy.
In the fourth, final case, washing machines were fitted with a display
that not only informed householders when the best time to start washing
would be, but also allowed them to set it to automatically start at this
time.
In the third and fourth cases, where the device gave information about
events that were yet to happen, the advice was based on a predictive
model that combined historical data on washing-machine use in that
particular household with information about energy consumption and
generation, and also with weather forecasts. The predictive model used
this data to identify the best time of day to start the washing machine.
Of course, weather forecasts are themselves predictions, and can be
wrong. This introduces some uncertainty. If the weather forecast is
4.5 Home automation
221
wrong and the weather becomes cloudier than expected, the predicted
optimal time to start washing may not be so good after all.
In the study, householders began to make suggestions on how to
improve the ‘conversation’ they could have with their machine about the
best time to start a load of washing. Householders specified a ‘window’
of time during which they were happy for their machine to run, and
allowed the ‘best’ time to be updated during the day if the weather
prediction changed. In this way, the washing machine could start a little
earlier or later than predicted first thing in the morning.
The results of the study were that householders did not find much value
in the feedback offered in the first two cases, in which feedback was
given after the laundry had been completed. They much preferred the
feedback in the third and fourth cases, which incorporated ‘intelligence’
to offer a prediction rather than just reporting on what had happened.
The results of this experiment demonstrate how the Internet-of-Things
technologies that are most useful are often those that do more than just
tracking and monitoring what is happening. Instead they bring in
additional data sources and use this to predict future events that help
improve efficiency. Another example where prediction could be expected
to be useful is an Internet-of-Things application that monitors occupancy
of car parking spaces, so that drivers can be directed to a free space. Is
it more useful to know a space’s current state, or to know what it is
likely to be in half an hour when you get there? This type of application
could be made ‘intelligent’ by tracking typical patterns of occupancy in
a car park and combining it with other data sources, such as traffic that
is currently heading in the direction of the car park.
4.5.5 ConclusionHome automation networks are sometimes designed to use Wi-Fi, but can be
subject to range problems and are not suitable if devices are battery powered.
Also, password-setting is a problem if there are many devices. Mesh
networks for home automation (ZigBee, Z-Wave and others) overcome these
problems, and are designed for low power consumption. Power is the rate at
which work is done.
As with other Internet-of-Things applications, home automation is most
useful when it incorporates intelligent use of the data collected by sensors.
Part 4 The Internet of Things
222
The future?
Much of the publicity about the Internet of Things carries an air of
inevitability, as though it were part of an unstoppable process of
technological development. As you have probably realised by now, the reality
is likely to be dictated by engineering feasibility, compromise and cost. This
is not to deny there are potentially many areas where the Internet of Things
could be employed. Earlier sections have outlined some, and no doubt there
are other potential uses that are not yet known.
Whether all the conjectured uses will actually be amenable to Internet-of-
Things developments is another matter. A paper looking at machine-to-
machine communications for a working group of the 3GPP (Third Generation
Partnership Project – the body that sets standards for most of the world’s
mobile communications) begins its justification for developing this type of
communication as follows:
The provision of Machine-Type Communications (MTC) via cellular
networks is proving to be a significant opportunity for new revenue
generation for mobile operators.
(Third Generation Partnership Project, 2014)
This is a useful reminder that no innovation will succeed if it does not
generate enough revenue to cover its capital costs and operating costs, and to
yield a steady income. However, whether the Internet of Things will be a
major source of revenue is an open question. As we have seen, the sensors
and devices for Internet of Things are expected to be cheap, and cheap to
deploy and run. The data they produce must be conveyed cheaply. It is not
obvious whether this is a market that will appeal to investors and
entrepreneurs. Recent history suggests that the communications infrastructure,
though essential, is not the place to look for big dividends. When asked
‘Which companies or groups of companies will determine the shape of the
IoT ... and which are proving the most innovative?’, the British
communications expert, entrepreneur and commentator Professor William
Webb wrote:
To some degree this question is rather like asking “which companies will
shape the future of the Internet?” – to which I suspect most would answer
with Google, Facebook and perhaps Apple or Netflix. Tellingly not BT,
Vodafone or even Cisco – the underlying “plumbing” of the Internet is
assumed to be a functional platform on which innovative ideas are
implemented. We are not at that stage yet with IoT – much of the plumbing
is still to be built. And although we cannot yet predict the specific
technologies we are reasonably confident about the type of IoT networks
and capabilities that will be provided. So my guess is that, like the Internet,
it will be the innovative application providers that drive usage, which in
4.6 The future?
223
4.6
turn will cause changes in the underlying network such as capacity
enhancements.
Incisor (2016)
From Webb’s viewpoint, the big names of the future will be those that come
up with a hugely successful Internet-of-Things applications. Maybe the much-
discussed system for leading drivers to free car parking spaces could be one,
or an application which automatically makes best use of cheap power (such
as solar power). More likely, though, is that the successful applications will
be ones that no one yet sees a need for, but which, once available, will meet
a need (or a desire) that in retrospect seems obvious.
Finally, I should point out that many commentators see the Internet of Things
as part of the fifth generation of mobile communications, or 5G. The idea
here is the 5G will not be a radically new form a mobile communication, as
each preceding generation has been, but a convergence of existing forms,
such as cellular communications, Wi-Fi and the Internet of Things.
Activity 4.18 (self-assessment)
A friend has read the case study in Section 4.5.4 and asked you to explain
how it exemplifies the ‘Internet of Things’. Write a response using fewer than
300 words.
My approach to this question, and you might find it useful too, is to reflect
on ideas from this part of Block 3 and to jot down a few relevant ideas. Then
I would look for a way to join up the ideas, or some of them.
Part 4 The Internet of Things
224
Summary
The Internet of Things is a loosely defined concept, encompassing the idea of
devices associated with an application dispersed in the environment. The
devices communicate with a central location, where data from the devices is
gathered and analysed. The application of artificial intelligence to the data, to
identify trends or unusual readings, leads to automated responses.
Data associated with Internet-of-Things applications typically consists of
numerical values of readings, or numbers used as labels for non-numerical
properties such as directions or states (such as empty or full). Data amounts
are small, but this does not mean an Internet of Things is simple to
implement. Small amounts of data are problematic for conventional cellular
communications. In addition, devices and data in an Internet of Things must
be very cheap. Devices must have low power consumption, as many will be
battery-operated, and do not need the complexity of mobile phones.
For short-range indoor communication, such as home automation, Wi-Fi can
be suitable, possibly in conjunction with mesh-based system for controlling
appliances such as ZigBee or Z-Wave.
For medium- and long-range outdoor applications, a low-power wide area
network (LPWAN) is favoured. LPWANs are designed especially for Internet-
of-Things communications, and can use licensed or unlicensed spectrum.
LPWANs using licensed spectrum are adaptations for the existing cellular
communications networks. LPWANs using unlicensed spectrum are new, low-
cost, low-power, simple networks that achieve long range through low data
rates.
Power, measured in watts, is the rate of doing work, or consuming energy.
Energy is the capacity for doing work, and both are measured in joules.
After studying this part you should be able to:
. convert a binary number with a binary point into a denary number with a
decimal point
. determine the number of bits required to provide binary labels for a given
number of entities or states.
. apply binary numbers as labels for entities or states
. devise a suitable labelling scheme using binary numbers
. relate the sizes of Internet-of-Things data transactions to other common
data transactions
. write an explanation of basic aspects of the Internet of Things
. perform power and energy calculations
. discuss issues relating to communications infrastructure of the Internet of
Things.
Summary
225
Answers to self-assessment activities
Activity 4.4The maximum speed (in binary) would be 1111111 km/h. The denary
equivalent is found by taking the denary equivalent of each of the 1s in the
binary number, taking account of each 1’s position, and finding the total. That
is:
(26 + 25 + 24 + 23 + 22 + 21 +20) km/h
= (64 + 32 + 16 + 8 + 4 + 2 + 1) km/h
= 127 km/h.
Activity 4.5To find the denary equivalent of 1111.111, we find the denary equivalent of
each 1, taking account of its position, and add them together. That is:
23 + 22 + 21 + 20 + 2–1 + 2–2 + 2–3
= 8 + 4 + 2 + 1 + 0.5 + 0.25 + 0.125
= 15.875.
Activity 4.6(a) As there are 60 minutes in an hour, the maximum number of minutes of
sunshine that could be reported is 60. Reporting this amount of sunshine
could be done using 6 bits, as 26 = 64, whereas 5 bits would be
insufficient (25 = 32). So each report would have to be 6 bits long.
(b) We saw earlier that binary 0.1 is equivalent to denary 0.5. So a precision
of half a minute would require an additional bit after a binary point.
(c) The inclusion of an extra bit after the binary point means that 7 bits are
required for each of the hourly reports.
Activity 4.7In each case, we have to decide whether the direction is closest to northerly,
southerly, easterly or westerly (remembering that it’s where the wind blows
from that determines what it’s called), and apply the appropriate 2-bit label.
Figure 4.19 is the result.
Part 4 The Internet of Things
226
01
000011
Figure 4.19 Wind directions of Figure 4.3 with 2-bit representations
Activity 4.8(a) In going from 1 bit to 2 bits to 3 bits, the number of directions doubled
each time, from 2 to 4 to 8. So, continuing the pattern, 4 bits will give 16
directions.
(b) Figure 4.20 shows one quadrant,
E
ENE
NE
NNE
0101
0011
0010
0001
0000
N
Figure 4.20 A quadrant using 4 bits
Activity 4.9(a) Using 8 bits provides 28 different 8-bit numbers, which is 256. Using
16 bits provides 216 different 16-bit numbers, which is 65 536.
(b) Part (a) shows that 8 bits would be insufficient to represent 360 degrees.
Using 9 bits gives 29 = 512 different 9-bit numbers, so this would enable
each degree of wind direction to be labelled, leaving 152 numbers
unused. In this case, 9-bit numbers would have to be used.
Activity 4.11As a kilobyte is 1024 bytes, a megabyte is (1024 × 1024) bytes, or
10242 bytes. Each byte contains 8 bits. Thus a 5 megabyte image contains
5 × 10242 × 8 bits = 40 × 10242 bits.
Dividing this number by 512 gives the number of times bigger it is than 512:
(40 × 1024 × 1024) ÷ 512 = 81 920.
Thus the digital image is almost 82 000 times as big as the 512-bit data
package.
Answers to self-assessment activities
227
Activity 4.14Licensed spectrum could be expected to be freer from interference than
unlicensed spectrum. This is because spectrum licences usually grant
exclusive use of the spectrum to the licence holder within a country.
Activity 4.17(a) In 1 hour, the laptop’s Wi-Fi uses 2 kJ, which is 2 × 10³ J. In the same
time, the ZigBee hub uses 20 mJ, or 20 × 10–3 J. The fraction of the
laptop’s Wi-Fi energy used by the ZigBee hub is (20 × 10–3) J
÷ (2 × 10³) J = 10–5, or 1/100 000.
(b) The answer to part (a) indicates that a ZigBee device would need to run
for 100 000 hours to consume the same amount of energy as the laptop’s
Wi-Fi consumes in 1 hour. Converting this to years gives:
(100 000) ÷ (24 × 365) years = 11.4 years (approximately), or 11 years
and 146 days.
(c) In my experience, ordinary alkaline batteries cannot last as long as this,
and are liable to start leaking. Some more exotic (and expensive) types of
battery, however, are expected to have a shelf life of several years.
(d) In Table 4.5, the power consumption associated with the laptop’s Wi-Fi
module is 2 kJ in 1 hour. Power is work (or energy) divided by time. If
the energy is measured in joules, and time is measured in seconds, this
calculation gives power in watts. In 1 hour there are (60 × 60) s
= 3600 s. The energy consumed in this time is 2000 J (or 2 kJ), so the
power is (2000 ÷ 3600) W = 0.56 W (to two significant figures).
Activity 4.18My notes prior to answering this question were as follows:
Loose nature of definition of IoT. Idea of communication of machine to
machine. More efficient use of resources (solar power). Reduced load on
generating capacity.
Collection and analysis of data regarding weather and patterns of washing-
machine usage. Application of artificial intelligence to this data to automate
a process.
Demand shifting.
Can this be related to the list of use cases? List has ‘smart grid’ and ‘home
automation’.
William Webb’s description: ‘functional platform on which innovative ideas
are implemented’.
Power consumption of washing machine. Power generated by solar cells.
Part 4 The Internet of Things
228
Not all of the items in my notes were used in my answer, which follows:
‘Internet of Things’ is vaguely defined, but it refers to the interconnection
of devices by a communications infrastructure. In practice, though, the term
covers both the communications infrastructure and the applications and
devices that use it.
The real benefit of the Internet of Things comes when it forms part of a
system of data gathering and automation. Such a system typically consists
of connected sensing devices gathering information from the environment
and forwarding it to a central server for automated analysis and action. In
the later part of the washing-machine case study, weather forecasts and data
about the resident’s use of the washing machine were collected and
analysed. From these, a prediction was made of the best time to operate the
washing machine in relation to the solar power that would be available
during the day. The washing machine was automatically started at that time.
Applications of the Internet of Things can be both domestic and industrial.
The washing-machine case study is clearly an example of a domestic
application; but it could also be regarded as an industrial example. This is
because it is an instance of the Internet of Things making utility supplies
‘smarter’. If the demand for electricity could be shifted to times when
solar-power is maximised, the load on the electricity grid would be reduced.
A single washing machine would not significantly affect national power
generation of course, but a greatly scaled-up implementation of this case
study could have a significant effect.
Answers to self-assessment activities
229
References
Real Wireless (2016) A Comparison of UNB and Spread Spectrum Wireless
Technologies as used in LPWA M2M Applications, Real Wireless. Available
at www.realwireless.biz/resources/publications (Accessed 13 February 2017).
Third Generation Partnership Project (2014) ‘Further LTE Physical Layer
Enhancements for MTC’, Third Generation Partnership Project TSG RAN
Meeting 66, Edinburgh, 9–12 September 2014 (RP-141865). Available online
at www.3gpp.org/DynaReport/TDocExMtg–RP-66–30567.htm (Accessed 6
June 2017).
Webb, W. (2016) Incisor, August, p. 16. Available online at www.incisor.tv/
Incisormagarchive.php (Accessed 6 June 2017).
Part 4 The Internet of Things
230
Acknowledgements
Grateful acknowledgement is made to the following sources:
Figure 4.1. Adrian Raeside, raesidecartoon.com.
Figures 4.10, 4.11, 4.12, 4.13, 4.14. Allan Jones.
Figure 4.18. Adapted from: Bourgeois, J. et al. (2014) ‘Conversations with
my washing machine: an in-the-wild study of demand shifting with self-
generated energy’, Proceedings of the 2014 ACM International Joint
Conference on Pervasive and Ubiquitous Computing, September 2014.
Association for Computing Machinery ACM.
If any have been inadvertently overlooked the publishers will be pleased to
make the necessary arrangements at the first opportunity.
Acknowledgements
231

Part 5 Online communicationby Karen Kear

Contents
Introduction 237
Categories of online communication 237
5.1 Asynchronous communication 240
5.1.1 Asynchronous communication tools 240
5.1.2 Online communities 243
5.1.3 The social web: sharing what we create 247
5.1.4 Conclusion 251
5.2 Social networking 252
5.2.1 Facebook 254
5.2.2 LinkedIn 255
5.2.3 Twitter 255
5.2.4 Issues with social networking 256
5.2.5 Six degrees of separation 259
5.2.6 Conclusion 260
5.3 Synchronous communication 261
5.3.1 Synchronous text-based communication tools 262
5.3.2 Video and web conferencing 264
5.3.3 Telepresence 267
5.3.4 Conclusion 269
5.4 A sense of presence 270
5.4.1 Social presence 271
5.4.2 Awareness 273
5.4.3 Conclusion 275
5.5 Summary 276
Answers to self-assessment activities 277
References 279
Acknowledgements 280

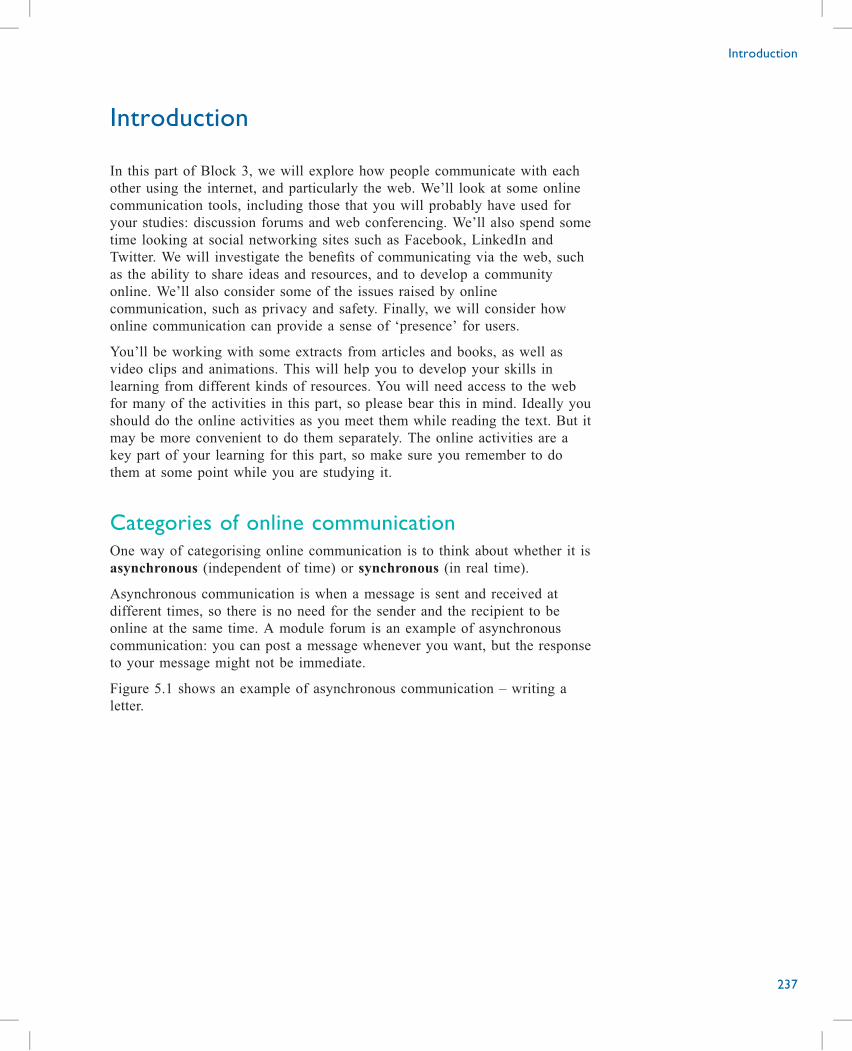
Introduction
In this part of Block 3, we will explore how people communicate with each
other using the internet, and particularly the web. We’ll look at some online
communication tools, including those that you will probably have used for
your studies: discussion forums and web conferencing. We’ll also spend some
time looking at social networking sites such as Facebook, LinkedIn and
Twitter. We will investigate the benefits of communicating via the web, such
as the ability to share ideas and resources, and to develop a community
online. We’ll also consider some of the issues raised by online
communication, such as privacy and safety. Finally, we will consider how
online communication can provide a sense of ‘presence’ for users.
You’ll be working with some extracts from articles and books, as well as
video clips and animations. This will help you to develop your skills in
learning from different kinds of resources. You will need access to the web
for many of the activities in this part, so please bear this in mind. Ideally you
should do the online activities as you meet them while reading the text. But it
may be more convenient to do them separately. The online activities are a
key part of your learning for this part, so make sure you remember to do
them at some point while you are studying it.
Categories of online communicationOne way of categorising online communication is to think about whether it is
asynchronous (independent of time) or synchronous (in real time).
Asynchronous communication is when a message is sent and received at
different times, so there is no need for the sender and the recipient to be
online at the same time. A module forum is an example of asynchronous
communication: you can post a message whenever you want, but the response
to your message might not be immediate.
Figure 5.1 shows an example of asynchronous communication – writing a
letter.
Introduction
237
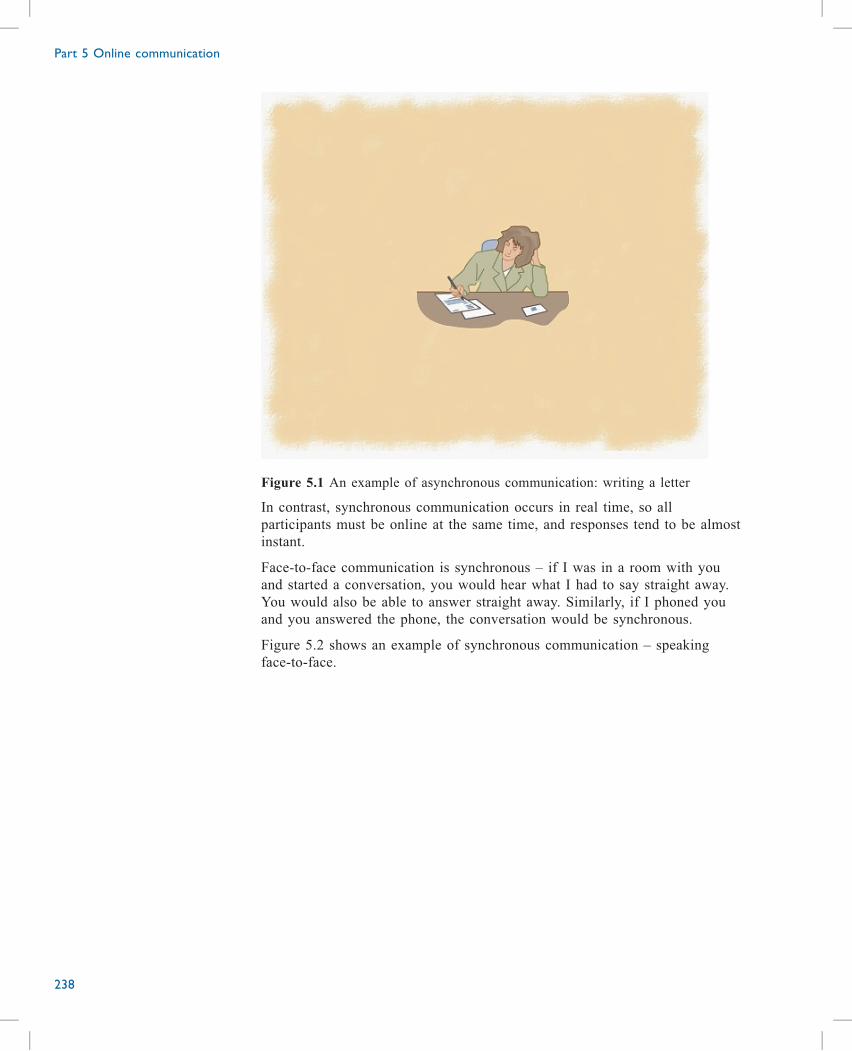
Figure 5.1 An example of asynchronous communication: writing a letter
In contrast, synchronous communication occurs in real time, so all
participants must be online at the same time, and responses tend to be almost
instant.
Face-to-face communication is synchronous – if I was in a room with you
and started a conversation, you would hear what I had to say straight away.
You would also be able to answer straight away. Similarly, if I phoned you
and you answered the phone, the conversation would be synchronous.
Figure 5.2 shows an example of synchronous communication – speaking
face-to-face.
Part 5 Online communication
238
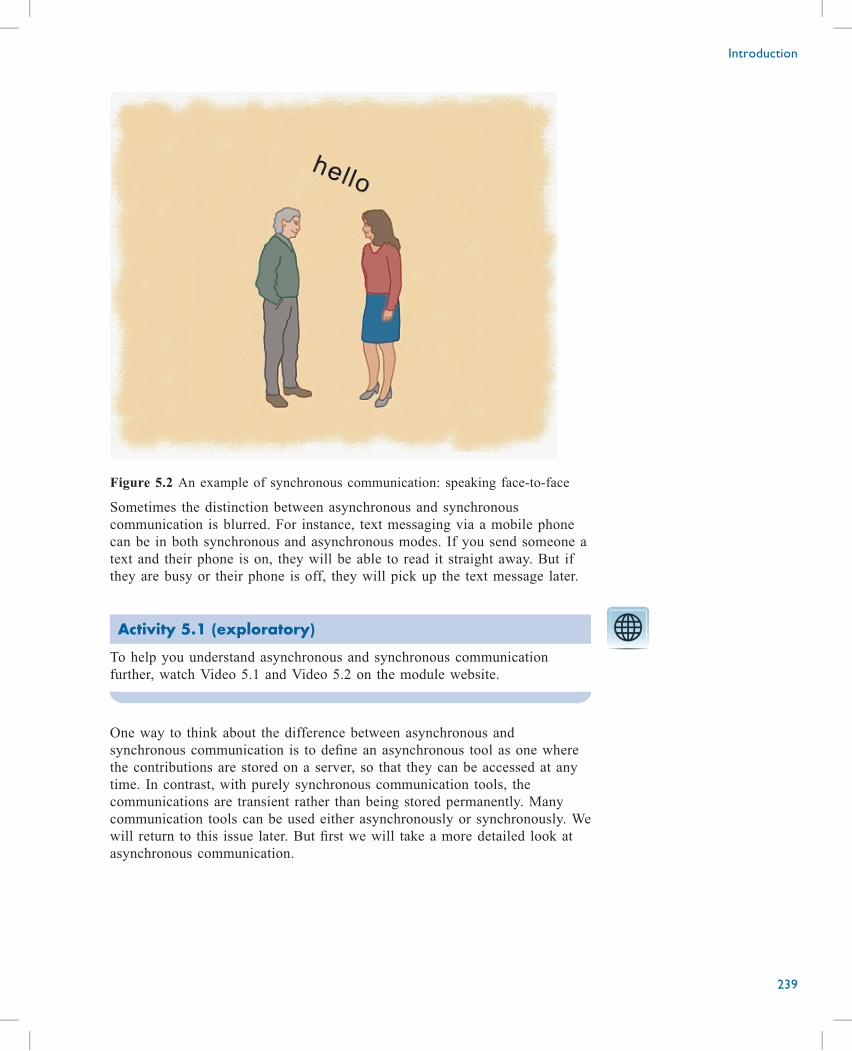
Figure 5.2 An example of synchronous communication: speaking face-to-face
Sometimes the distinction between asynchronous and synchronous
communication is blurred. For instance, text messaging via a mobile phone
can be in both synchronous and asynchronous modes. If you send someone a
text and their phone is on, they will be able to read it straight away. But if
they are busy or their phone is off, they will pick up the text message later.
Activity 5.1 (exploratory)
To help you understand asynchronous and synchronous communication
further, watch Video 5.1 and Video 5.2 on the module website.
One way to think about the difference between asynchronous and
synchronous communication is to define an asynchronous tool as one where
the contributions are stored on a server, so that they can be accessed at any
time. In contrast, with purely synchronous communication tools, the
communications are transient rather than being stored permanently. Many
communication tools can be used either asynchronously or synchronously. We
will return to this issue later. But first we will take a more detailed look at
asynchronous communication.
Introduction
239
Asynchronous communication
In this section, I will consider several forms of asynchronous communication
that groups of people might use – mailing lists, discussion forums and blogs
– and how they might be used for different purposes.
5.1.1 Asynchronous communication tools
Mailing lists
Email is an asynchronous tool that is most often used for one-to-one
communication. However, most email systems allow you to create mailing
lists or contact lists that define groups of people to whom you wish to send
certain messages. For example, your tutor could create a mailing list that
contains email addresses for all the members of your tutor group.
Each list contains the email addresses of all its members. If you subscribe to
(join) a list, your email address will be added to that list, and you will then
receive, via email, all messages sent to it. If you send a mail message to the
list, it will be forwarded to all the list members. You can unsubscribe from a
list at any time by sending an ‘unsubscribe’ message. You will then stop
receiving messages from the list and will be unable to send messages to it.
One issue with mailing lists, and email generally, is the volume of messages
that are received. This can become overwhelming, particularly in a work
context. This phenomenon is sometime described as email overload. The
following activity uses an extract from an academic research paper to look at
this issue.
Activity 5.2 (exploratory)
A research paper normally has an ‘abstract’ at the beginning, which provides
a short summary of the article. Below is the abstract of a paper about the
issue of email overload. Read through the abstract and see if you can answer
the following questions.
. How does email use relate to stress levels?
. What strategy can be used to address the problem of email overload?
Don’t worry if you don’t understand every word of the abstract – just try to
get the gist of what it is saying.
Part 5 Online communication
240
5.1
Abstract
Using email is one of the most common online activities in theworld today. Yet, very little experimental research has examinedthe effect of email on well-being. Utilizing a within-subjectsdesign, we investigated how the frequency of checking emailaffects well-being over a period of two weeks. During one week,124 adults were randomly assigned to limit checking their email tothree times a day; during the other week, participants could checktheir email an unlimited number of times per day. We found thatduring the limited email use week, participants experiencedsignificantly lower daily stress than during the unlimited email useweek. Lower stress, in turn, predicted higher well-being on adiverse range of well-being outcomes. These findings highlight thebenefits of checking email less frequently for reducingpsychological stress.
(Kushlev and Dunn, 2015)
CommentThe abstract suggests that increased use of email (checking email more
frequently) results in higher stress levels. A strategy of only checking email a
few times per day reduces this stress.
There are different approaches for dealing with email overload – you will
probably have your own preferred methods. For mailing lists, one possibility
is to subscribe to a weekly or daily digest, rather than receiving each message
separately.
Discussion forums
An alternative to a mailing list is a discussion forum. Discussion forums go
under different names, such as ‘online forum’, ‘web forum’, ‘internet forum’
or just ‘forum’. You will be familiar with using forums in your OU study so
far. You’ll find many different kinds of forums on the web, with different
user interfaces and different types of discussion and topics.
5.1 Asynchronous communication
241
Activity 5.3 (exploratory)
In this activity on the module website, you will search the web for discussion
forums about technology. See if you can find one or two that could be useful
as you progress through your studies in this area. There is no need to spend
more than 10 minutes on this activity.
Don’t forget that in Activity 2.1 in Part 2 there are supporting resources on
searching the web effectively.
Additional resource (optional)
There is an optional Library resource on group work in an online
asynchronous space, which you may also like to have a look at if you have
time, but do not spend more than 15 minutes on this.
Blogs
A somewhat different form of group communication is a blog. Blogs allow
people to share their thoughts via the web, often in a diary format, and to
direct others to interesting web items (including other blogs). Each blog
belongs to a particular person or organisation. Many blogs allow readers to
add comments to the posts, so that they can engage in a dialogue with the
blogger and with other people who read the blog.
Activity 5.4 (exploratory)
In this activity on the module website you will have the opportunity to
explore asynchronous communication in the form of blogs, including the
facility to add comments to a blog.
Increasingly, blogs are becoming more like publication media than places for
an individual to share views and resources. If you search for ‘blog’, you will
often find a website that looks like on online magazine, complete with
advertising. This reflects the increasingly blurred boundary between online
communication and online publication. It also raises issues of how online
media are funded; we will return to this issue later.
Group communication: the options
In this section, we have looked at a different ways in which groups of people
can communicate with each other asynchronously. Mailing lists, forums and
blogs can all be used for this purpose.
Part 5 Online communication
242
Activity 5.5 (exploratory)
Suppose you want to set up some shared electronic communication for a
sports club that you run. A friend who has some expertise in this area offers
to set up either (i) a forum on the club’s website or (ii) a mailing list for
members. Which option would you choose and why?
CommentThis is not an easy decision – there are pros and cons to both options.
If you chose the forum, you would be relying on members to visit the club’s
website regularly – if they didn’t, they would miss out on the discussions.
Also, if there weren’t many people taking part, then the discussions wouldn’t
be very useful or interesting. However, at least the discussions would all be
in one place. In addition, many forums have an option to send email alerts
when a new posting is made.
If you opted for the mailing list, this would mean that anyone who joined the
list would receive messages via their normal email account. So everyone who
joined the list would see the discussions, and not miss out on any important
information. On the downside, people might be annoyed if their email was
clogged up with messages from club members.
5.1.2 Online communitiesYou have seen that networks allow you to interact with people whom you
may never meet. This raises a debate about the benefits and disadvantages of
online versus face-to-face communities.
For example, using forums, you can make contact with other students whom
you may not have met face to face. Does this help you to feel part of a
community? Or is there no community element – just a way of exchanging
information with other students?
In the early 1990s, the US author Howard Rheingold coined the term virtual
community to describe online group communication. He also used the terms
‘computer conference’ (nowadays called a forum) and ‘computer-mediated
communication’ (online communication).
I’ll shortly be asking you to read an extract from his classic book The Virtual
Community: Homesteading on the Electronic Frontier (2000, 2nd edn). This
extract contains a few words which may not be familiar to you, so first I’d
like to explain some useful ways of finding definitions of a word when you
are not sure what it means.
Activity 5.6 (exploratory)
Skim through the second paragraph of the extract in Box 5.1 and pick out a
word that is unfamiliar to you, or which you would like to look up online.
5.1 Asynchronous communication
243
In this online activity you will use web search and online dictionaries to look
up definitions for your chosen word.
Box 5.1 The virtual community
How does anybody find friends? In the traditional community,we search through our pool of neighbors and professionalcolleagues, of acquaintances and acquaintances ofacquaintances, in order to find people who share our valuesand interests. We then exchange information about one another,disclose and discuss our mutual interests, and sometimes webecome friends. In a virtual community we can go directly tothe place where our favorite subjects are being discussed, thenget acquainted with people who share our passions or who usewords in a way we find attractive. In this sense, the topic isthe address: you can’t simply pick up a phone and ask to beconnected with someone who wants to talk about Islamic art orCalifornia wine, or someone with a three-year-old daughter ora forty-year-old Hudson; you can, however, join a computerconference on any of those topics, then open a public orprivate correspondence with the previously unknown peopleyou find there. Your chances of making friends are magnifiedby orders of magnitude over the old methods of finding a peergroup.
You can be fooled about people in cyberspace, behind thecloak of words. But that can be said about telephones or face-to-face communication as well; computer-mediatedcommunications provide new ways to fool people, and themost obvious identity swindles will die out only when enoughpeople learn to use the medium critically. In some ways, themedium will, by its nature, be forever biased toward certainkinds of obfuscation. It will also be a place that people oftenend up revealing themselves far more intimately than theywould be inclined to do without the intermediation of screensand pseudonyms.
(Rheingold, 2000, pp. 11–12)
Activity 5.7 (self-assessment)
Once you have read the extract in Box 5.1, answer the following questions.
(a) What does Rheingold see as the main advantage of making friends via a
virtual community?
(b) What problem does he describe?
Part 5 Online communication
244
In early 2017, Mark Zuckerberg, the founder of Facebook, wrote a
‘manifesto’ for Facebook’s future. An extract from this is below. It is striking
how similar parts of this are to articles on virtual community, such as the one
above, which were written many years earlier.
Activity 5.8 (self-assessment)
Read the extract in Box 5.2 from Zuckerberg’s manifesto. Then write a short
summary (about 100 words) of the social problems discussed in the extract,
and Zuckerberg’s view of how online communities can help address them.
5.1 Asynchronous communication
245
Box 5.2 Supportive communities
Building a global community that works for everyone starts with
the millions of smaller communities and intimate social structures
we turn to for our personal, emotional and spiritual needs.
Whether they’re churches, sports teams, unions or other local
groups, they all share important roles as social infrastructure for
our communities. They provide all of us with a sense of purpose
and hope; moral validation that we are needed and part of
something bigger than ourselves; comfort that we are not alone and
a community is looking out for us; mentorship, guidance and
personal development; a safety net; values, cultural norms and
accountability; social gatherings, rituals and a way to meet new
people; and a way to pass time.
In our society, we have personal relationships with friends and
family, and then we have institutional relationships with the
governments that set the rules. A healthy society also has many
layers of communities between us and government that take care of
our needs. When we refer to our “social fabric”, we usually mean
the many mediating groups that bring us together and reinforce our
values.
However, there has been a striking decline in the important social
infrastructure of local communities over the past few decades.
Since the 1970s, membership in some local groups has declined by
as much as one-quarter, cutting across all segments of the
population.
The decline raises deeper questions alongside surveys showing
large percentages of our population lack a sense of hope for the
future. It is possible many of our challenges are at least as much
social as they are economic – related to a lack of community and
connection to something greater than ourselves. As one pastor told
me: “People feel unsettled. A lot of what was settling in the past
doesn’t exist anymore.”
Online communities are a bright spot, and we can strengthen
existing physical communities by helping people come together
online as well as offline. In the same way connecting with friends
online strengthens real relationships, developing this infrastructure
will strengthen these communities, as well as enable completely
new ones to form.
A woman named Christina was diagnosed with a rare disorder
called Epidermolysis Bullosa – and now she’s a member of a group
that connects 2,400 people around the world so none of them have
to suffer alone. A man named Matt was raising his two sons by
himself and he started the Black Fathers group to help men share
Part 5 Online communication
246
advice and encouragement as they raise their families. In San
Diego, more than 4,000 military family members are part of a
group that helps them make friends with other spouses. These
communities don’t just interact online. They hold get-togethers,
organize dinners, and support each other in their daily lives.
We recently found that more than 100 million people on Facebook
are members of what we call “very meaningful” groups. These are
groups that upon joining, quickly become the most important part
of our social networking experience and an important part of our
physical support structure. For example, many new parents tell us
that joining a parenting group after having a child fits this purpose.
There is a real opportunity to connect more of us with groups that
will be meaningful social infrastructure in our lives.
(Wagner and Swisher 2017)
5.1.3 The social web: sharing what we createIn recent years the web has developed into an interactive and social space, as
well as a place to find and share resources. A well-known and large-scale
example is YouTube, where users can find and share videos. Another example
is Pinterest, which is based on the metaphor of a pinboard; members can
keep a record of items that they like (images of consumer items, recipes, etc.)
and share them with others.
One way in which we can add new content to the web is by uploading things
we’ve created. This is described as user-generated content. (The term is also
used more broadly to include, for example, blog comments from users.) One
example is provided by the photo-sharing service Flickr. Users can upload
photos and look at photos uploaded by others.
Activity 5.9 (exploratory)
In this online activity you will use Flickr to search for photographs of the
Open University campus at Walton Hall, Milton Keynes. You will find
instructions on the module website.
CommentYour online search results in Flickr should look something like Figure 5.3.
5.1 Asynchronous communication
247
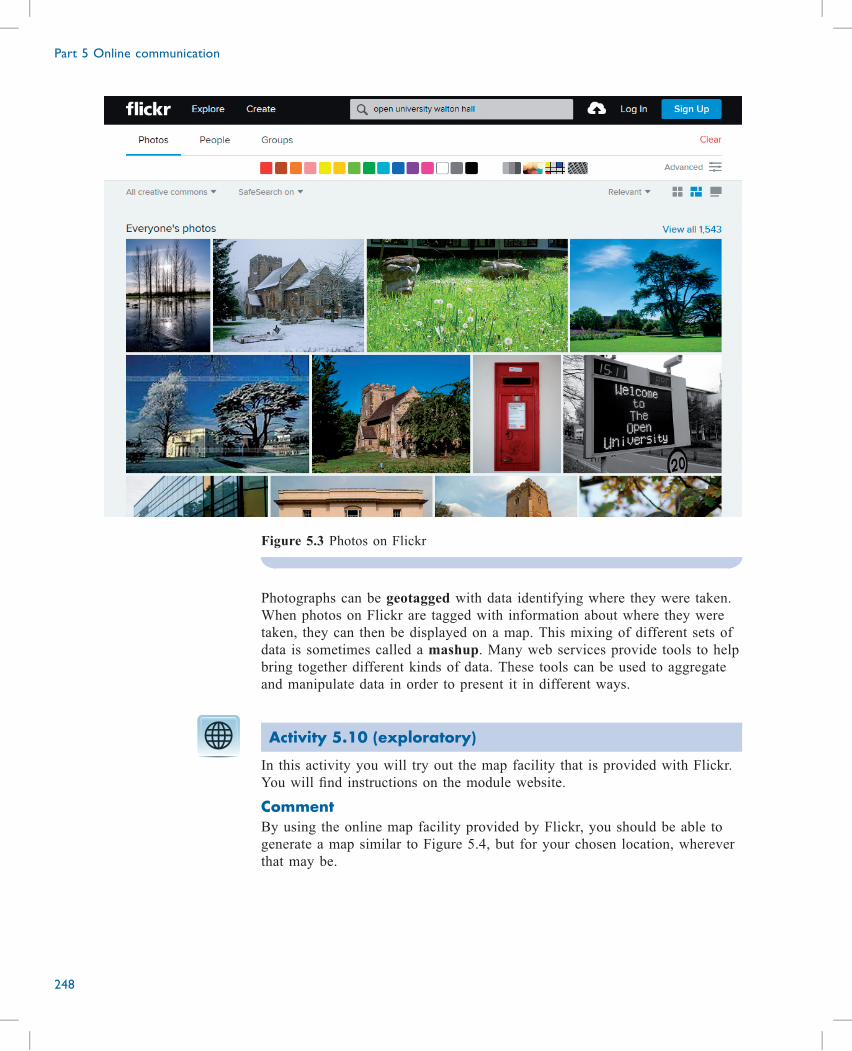
Figure 5.3 Photos on Flickr
Photographs can be geotagged with data identifying where they were taken.
When photos on Flickr are tagged with information about where they were
taken, they can then be displayed on a map. This mixing of different sets of
data is sometimes called a mashup. Many web services provide tools to help
bring together different kinds of data. These tools can be used to aggregate
and manipulate data in order to present it in different ways.
Activity 5.10 (exploratory)
In this activity you will try out the map facility that is provided with Flickr.
You will find instructions on the module website.
CommentBy using the online map facility provided by Flickr, you should be able to
generate a map similar to Figure 5.4, but for your chosen location, wherever
that may be.
Part 5 Online communication
248
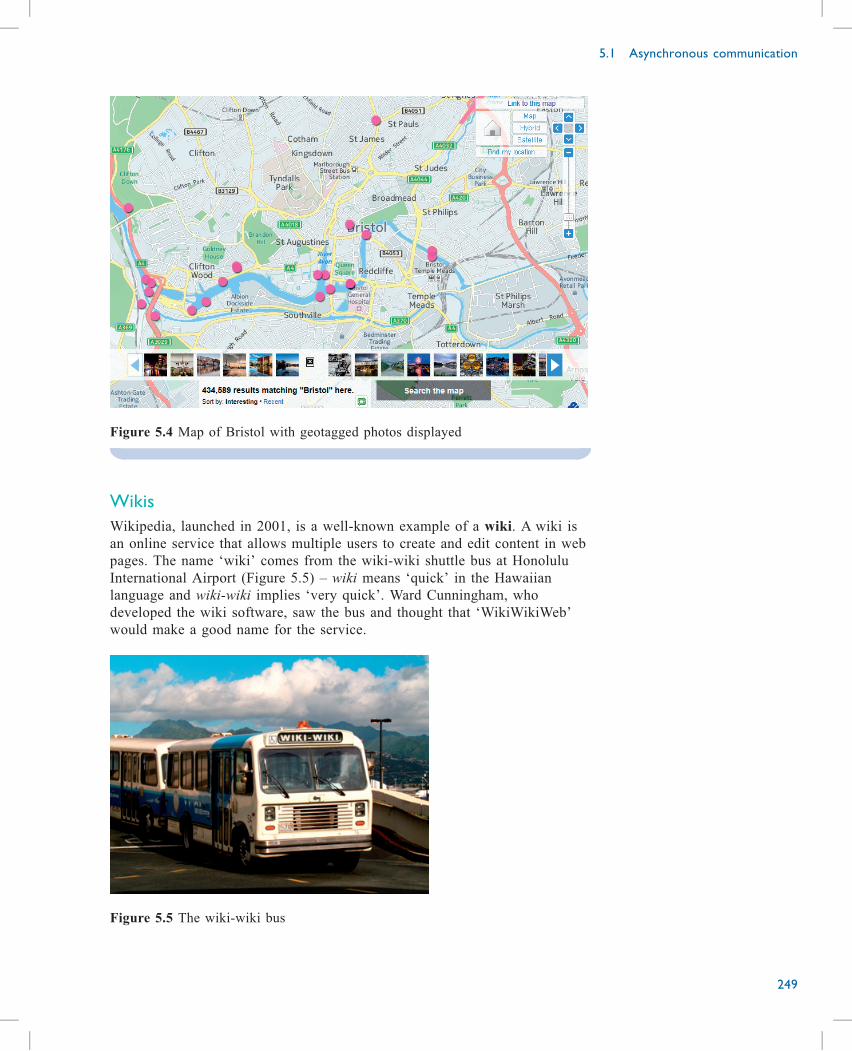
Figure 5.4 Map of Bristol with geotagged photos displayed
Wikis
Wikipedia, launched in 2001, is a well-known example of a wiki. A wiki is
an online service that allows multiple users to create and edit content in web
pages. The name ‘wiki’ comes from the wiki-wiki shuttle bus at Honolulu
International Airport (Figure 5.5) – wiki means ‘quick’ in the Hawaiian
language and wiki-wiki implies ‘very quick’. Ward Cunningham, who
developed the wiki software, saw the bus and thought that ‘WikiWikiWeb’
would make a good name for the service.
Figure 5.5 The wiki-wiki bus
5.1 Asynchronous communication
249
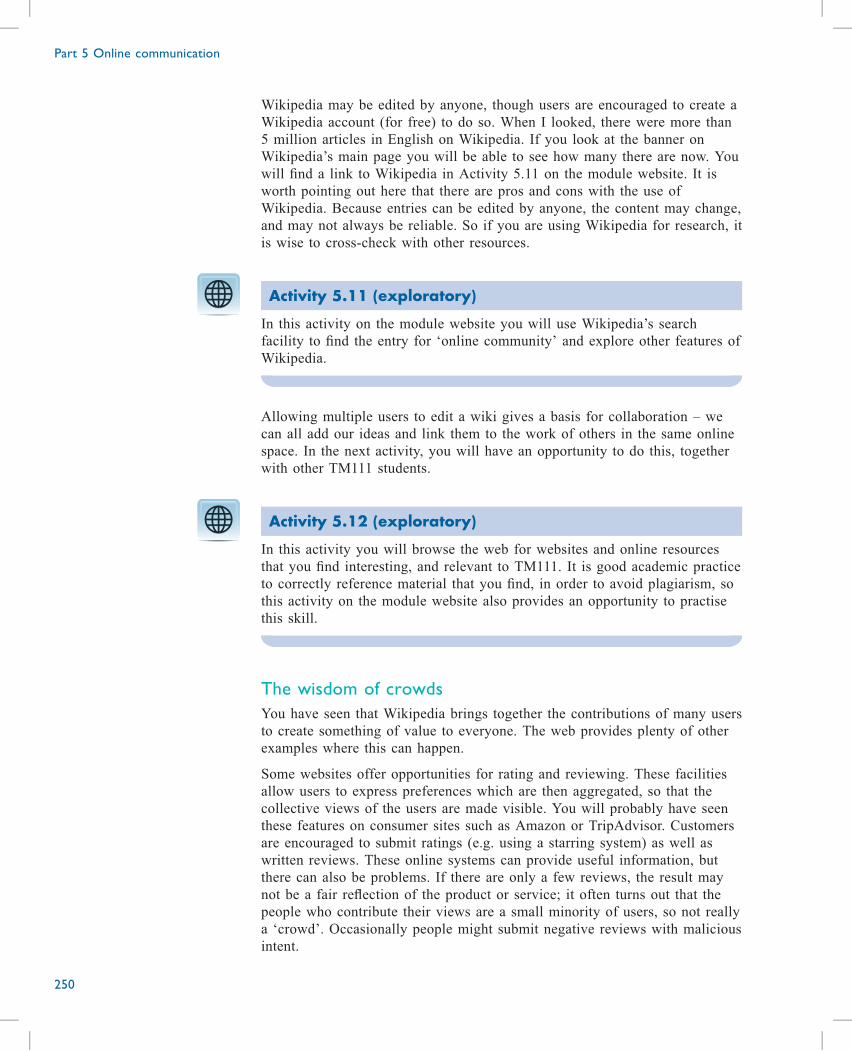
Wikipedia may be edited by anyone, though users are encouraged to create a
Wikipedia account (for free) to do so. When I looked, there were more than
5 million articles in English on Wikipedia. If you look at the banner on
Wikipedia’s main page you will be able to see how many there are now. You
will find a link to Wikipedia in Activity 5.11 on the module website. It is
worth pointing out here that there are pros and cons with the use of
Wikipedia. Because entries can be edited by anyone, the content may change,
and may not always be reliable. So if you are using Wikipedia for research, it
is wise to cross-check with other resources.
Activity 5.11 (exploratory)
In this activity on the module website you will use Wikipedia’s search
facility to find the entry for ‘online community’ and explore other features of
Wikipedia.
Allowing multiple users to edit a wiki gives a basis for collaboration – we
can all add our ideas and link them to the work of others in the same online
space. In the next activity, you will have an opportunity to do this, together
with other TM111 students.
Activity 5.12 (exploratory)
In this activity you will browse the web for websites and online resources
that you find interesting, and relevant to TM111. It is good academic practice
to correctly reference material that you find, in order to avoid plagiarism, so
this activity on the module website also provides an opportunity to practise
this skill.
The wisdom of crowds
You have seen that Wikipedia brings together the contributions of many users
to create something of value to everyone. The web provides plenty of other
examples where this can happen.
Some websites offer opportunities for rating and reviewing. These facilities
allow users to express preferences which are then aggregated, so that the
collective views of the users are made visible. You will probably have seen
these features on consumer sites such as Amazon or TripAdvisor. Customers
are encouraged to submit ratings (e.g. using a starring system) as well as
written reviews. These online systems can provide useful information, but
there can also be problems. If there are only a few reviews, the result may
not be a fair reflection of the product or service; it often turns out that the
people who contribute their views are a small minority of users, so not really
a ‘crowd’. Occasionally people might submit negative reviews with malicious
intent.
Part 5 Online communication
250
An interesting use of the scale offered by the web is crowdsourcing. This is
where input from many people is brought together to carry out a task or
provide a service. A specific example is crowdfunding, where an enterprise
is funded by relatively small investments from a large number of people. The
Kickstarter website for funding creative projects is one example:
Every project creator sets their project’s funding goal and deadline. If
people like the project, they can pledge money to make it happen …
Backing a project is more than just giving someone money. It’s supporting
their dream to create something that they want to see exist in the world.
(Kickstarter, 2017)
Activity 5.13 (exploratory)
Dr Alex Stiver carried out her PhD research on crowdfunding, in the School
of Computing and Communications at the Open University. In this activity on
the module website you will be working with a number of short extracts from
an audio interview with Alex about her research. You will need to allow
about 20 minutes for this activity.
5.1.4 ConclusionThis section focused on asynchronous communication – where people do not
need to be online at the same time as each other. We looked at a range of
tools for asynchronous communication, and how they could be used in
different ways and for different purposes.
5.1 Asynchronous communication
251
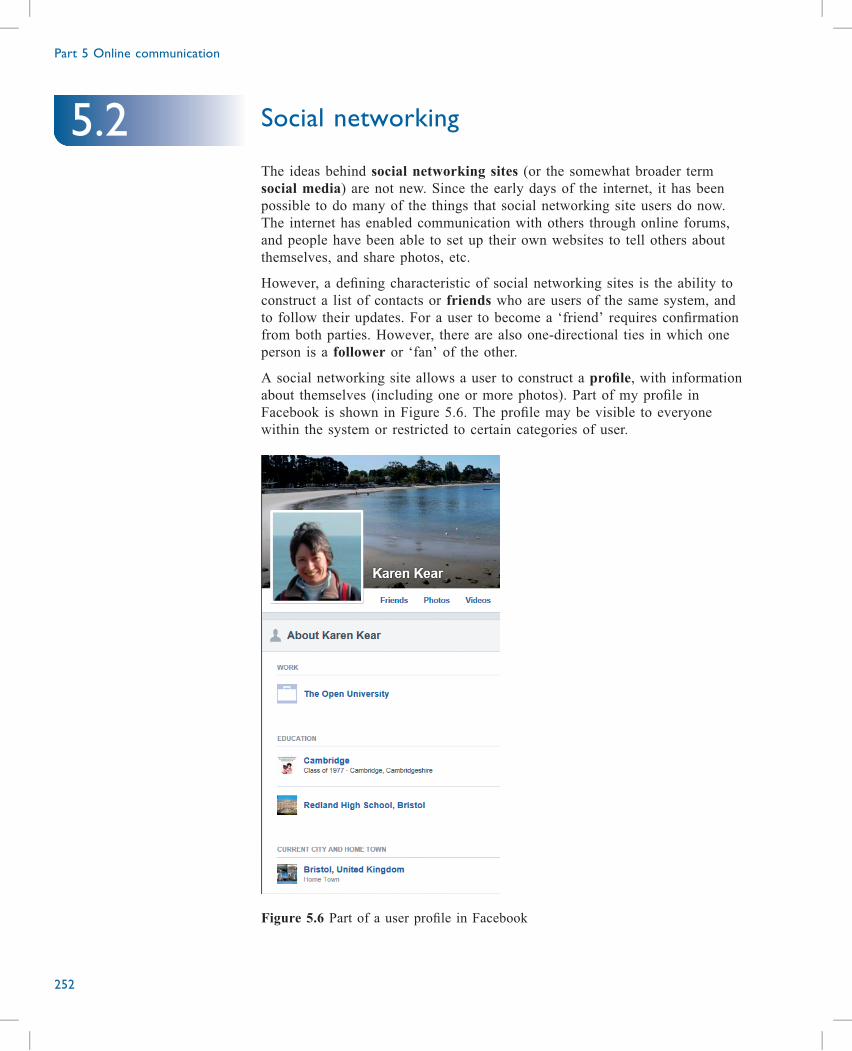
Social networking
The ideas behind social networking sites (or the somewhat broader term
social media) are not new. Since the early days of the internet, it has been
possible to do many of the things that social networking site users do now.
The internet has enabled communication with others through online forums,
and people have been able to set up their own websites to tell others about
themselves, and share photos, etc.
However, a defining characteristic of social networking sites is the ability to
construct a list of contacts or friends who are users of the same system, and
to follow their updates. For a user to become a ‘friend’ requires confirmation
from both parties. However, there are also one-directional ties in which one
person is a follower or ‘fan’ of the other.
A social networking site allows a user to construct a profile, with information
about themselves (including one or more photos). Part of my profile in
Facebook is shown in Figure 5.6. The profile may be visible to everyone
within the system or restricted to certain categories of user.
Figure 5.6 Part of a user profile in Facebook
Part 5 Online communication
252
5.2
Figure 5.7 shows a timeline of a selection of social networking sites,
including when each site started. The earliest one is Friends Reunited which
started in 2000.
2000 2001 2002 2003 2004 2005 2006 2007 2008 2009 2010 2011 2012 2013 2014 2015 2016 2017
Friends Reunited
Friendster
LinkedIn, MySpace
Facebook, Flickr
YouTube, Bebo
Tumblr
WhatsApp, Instagram
Pinterest, Google+, Snapchat
Figure 5.7 Social networking timeline
Activity 5.14 (self-assessment)
In this activity on the module website you will look at two web resources
which will give you an overview of different social networking sites.
Additional resource (optional)
If you have time available and you are interested in learning more about
social networking then there is an optional Library resource that you may like
to have a look at.
At the time of writing, Facebook is the most popular social networking site.
Other sites and apps, such as Instagram, Snapchat, Twitter and WhatsApp,
are also popular, particularly in the US and Europe.
New social networking sites can emerge, become popular, then perhaps go
out of fashion fairly quickly. Later they may close down or turn into
something else altogether. Different sites and apps are popular in different
countries – for example, Figure 5.8 shows those that are used in China at the
time of writing.
5.2 Social networking
253
Figure 5.8 Popular Chinese social networking sites
5.2.1 FacebookFacebook is a very popular social networking site, so you may be interested
in learning more about it. The following two activities will help you to do
this, using an online Facebook tutorial and a short video.
Part 5 Online communication
254
Activity 5.15 (exploratory)
In this activity on the module website you will asked to visit the
GCFLearnFree.org website to watch the ‘Getting started with Facebook’
tutorial.
Activity 5.16 (self-assessment)
In this activity on the module website you will watch Video 5.3 which
discusses why social networking, and Facebook in particular, has become so
popular. Once you have watched it, explain in a few sentences, using your
own words, how the network effect has helped Facebook to become
successful.
5.2.2 LinkedInLinkedIn is a social networking site specifically set up for career-related
purposes. It enables users to access information and build up a network of
contacts, in order to keep up to date with developments and opportunities in
their sector. For example, a contact may be able to give details about a job
vacancy and the experience required to fill the role. LinkedIn is not the place
to ask specifically for a job. But it can help you develop your career, start a
business or gain clients.
Activity 5.17 (exploratory)
In this activity on the module website you will read parts of an online guide
to LinkedIn on The Balance website, and think about what to include in a
LinkedIn professional profile or how you might improve or update an existing
profile.
5.2.3 TwitterOne of the most popular social networking sites is Twitter, which was
founded in 2006. Its original aim was to enable users to keep in touch with
friends and family via a very simple interface. The idea proved popular, and
Twitter became widely used.
Twitter is different from other forms of online communication because the
emphasis is on short updates (originally less than 140 characters – about the
length of a mobile phone text message). These updates – called tweets – are
displayed on screen in roughly chronological order. Twitter operates by users
5.2 Social networking
255
‘following’ other users, in order to receive their updates as part of a ‘stream’
of postings. The term ‘Twitter stream’ is used to describe the way that the
short messages continue to flow; you can choose to dip into the stream at any
time, either just reading the messages or adding a message yourself.
Following people or organisations on Twitter is a good way of finding
information about your field of study or work, provided you follow the right
users. If you have any doubts about a follower, then you can ‘block’ them,
which prevents them from following you or sending you any messages.
A user can direct a tweet at another user, as long as they know their
username. The message begins with ‘@theirusername’, but is still a message
that other people can view. There might be times when a Twitter private
message to another user is more appropriate than a public tweet. The message
will be sent to their Direct Message inbox within Twitter.
Activity 5.18 (self-assessment)
In this activity you will look at Twitter accounts from The Open University.
In Twitter you can use hashtags to keep track of topics or events which are
being discussed. For example, the @OpenUniversity Twitter account labels
tweets about graduation ceremonies with #ou_ceremonies. The symbol # is
known as a ‘hash’ symbol, and all hashtags must start with this so that they
can be easily found. Hashtags that are being regularly tweeted also tend to
appear in the ‘trend’ topics that can be viewed via Twitter.
Twitter can be thought to occupy a place between synchronous and
asynchronous communication. It allows rapid communication between people
who are online together. However, because the messages are stored and can
be accessed later, Twitter can also be used asynchronously.
Twitter has become one of the fastest ways of spreading information. This is
partly because users can forward (‘retweet’) information to their own
followers.
Activity 5.19 (self-assessment)
In this activity you will watch Video 5.4 which describes how Twitter came
to be seen less as a forum for inconsequential information and more as a
force for political action.
5.2.4 Issues with social networkingIt’s important to be aware of the safety and security aspects of using social
networking. Some users of social networking sites disclose sensitive personal
Part 5 Online communication
256
information about themselves on their profiles. Identity theft is a potential
problem if too much information is posted online for public viewing. For
example, personal information such as your address and date of birth can be
used to create a false identity, which might then be used to obtain a credit
card in your name.
Once criminals gain control of a person’s social networking account, they can
use the information for fraudulent purposes. For example, they may attempt
to trick the victim’s social networking contacts into sending them money. The
contacts’ email accounts may also be compromised.
Sometimes people engage in activities on social networking sites that they
wouldn’t consider in ‘real life’. One example is posting photographs and
details of a user’s personal life (either their own or another’s) that could
damage that person’s reputation. For example, employees may post material
that could be detrimental to their careers if seen by other members of staff or
customers. When recruiting new staff, some employers will look for
information online about a potential employee, so it is wise to ensure that any
publicly accessible information is as you want it to be.
Another issue is the user accepting people they don’t actually know as
‘friends’, or contacting people offline whom they don’t know well. This is
particularly problematic given that there is no means of verifying that people
are who they say they are. This is a particular issue for young people. Some
teenagers and young adults may become ‘addicted’ to social networking sites.
There are also reports of cyberbullying and trolling through social
networking sites.
Different social networking sites have different policies on younger users.
Facebook advises parents to oversee their children’s internet use and to use
internet control technology on their home computer(s). Parents are also
advised to educate their children about internet safety and how to use the
site’s privacy settings to control access.
As you have seen, all accounts in social networking sites have privacy
settings that can be changed, but not everyone has confidence in their ability
to change their account settings.
Activity 5.20 (exploratory)
In this activity you will explore how you can protect your privacy on
Facebook and Twitter.
Some critics of social networking claim that it encourages people to be
focused on fame, popularity and image. In this view, users are constantly
aiming to improve their numbers of ‘friends’, ‘likes’ etc. – they seek
approval from the online crowd, regardless of other concerns and values.
They are self-consciously ‘performing’ for other users. You will have your
own opinion as to whether this is true.
5.2 Social networking
257
A related issue is that strong opinions can be voiced, shared and quoted with
little regard for fact-checking or research. Fake news articles may be
circulated and believed, as if they were accurate news reporting. Expertise
may be ignored or devalued, in favour of populist views and unsupported
claims.
An important point to consider is how social networking sites are funded.
There are various business models for social media, and they are mainly
based around advertising. You will probably have noticed the advertisements
or promotions that are shown on social media. You may also have noticed
that some of them are uncannily related to your interests, or something about
you. The website owners can generate income from the advertisements they
show you, and also by selling information about you to other companies.
This may not seem a problem, especially as it means that the sites themselves
are free to use. But the emphasis on advertising can lead the website owners
to organise what you see in particular ways. Algorithms are used to
determine, for example, which posts you see in Facebook or Twitter, the
order in which they are displayed, and what advertising you see alongside
them. These issues are discussed in an academic paper called ‘The social
power of algorithms’in the journal Information, Communication and Society
as follows.
Here, we might wonder how algorithms shape what is encountered, or how
algorithms prioritise and make visible. This is to explore how the
predictions of algorithmic systems feed into people’s lives, shaping what
they know, who they know, what they discover, and what they experience.
The power of algorithms here is in their ability to make choices, to classify,
to sort, to order and to rank. That is, to decide what matters and to decide
what should be most visible.
(Beer, 2017, p. 6)
The author of this paper goes on to consider the filter bubble effect, where
users of social media, and the web more generally, are only exposed to views
similar to their own.
This line or argument suggests that algorithmic sorting processes are likely
to limit cultural experiences and social connections. This concerns the way
that algorithms might narrow down or close off external influences, leaving
people continually exposed to the same people, experiences, news, culture
and so on.
(Beer, 2017, p. 8)
There are concerns that the filter bubble effect is narrowing people’s
experiences, and may result in further divisions between people with different
perspectives.
Social media organisations are aware that the algorithms they use have
effects on their users, and they are investigating these effects. In 2014
Facebook carried out an experiment designed to investigate the effect on
users of seeing more positive, or more negative, comments in their newsfeed.
An algorithm was used to filter content shown to users accordingly. The
Part 5 Online communication
258
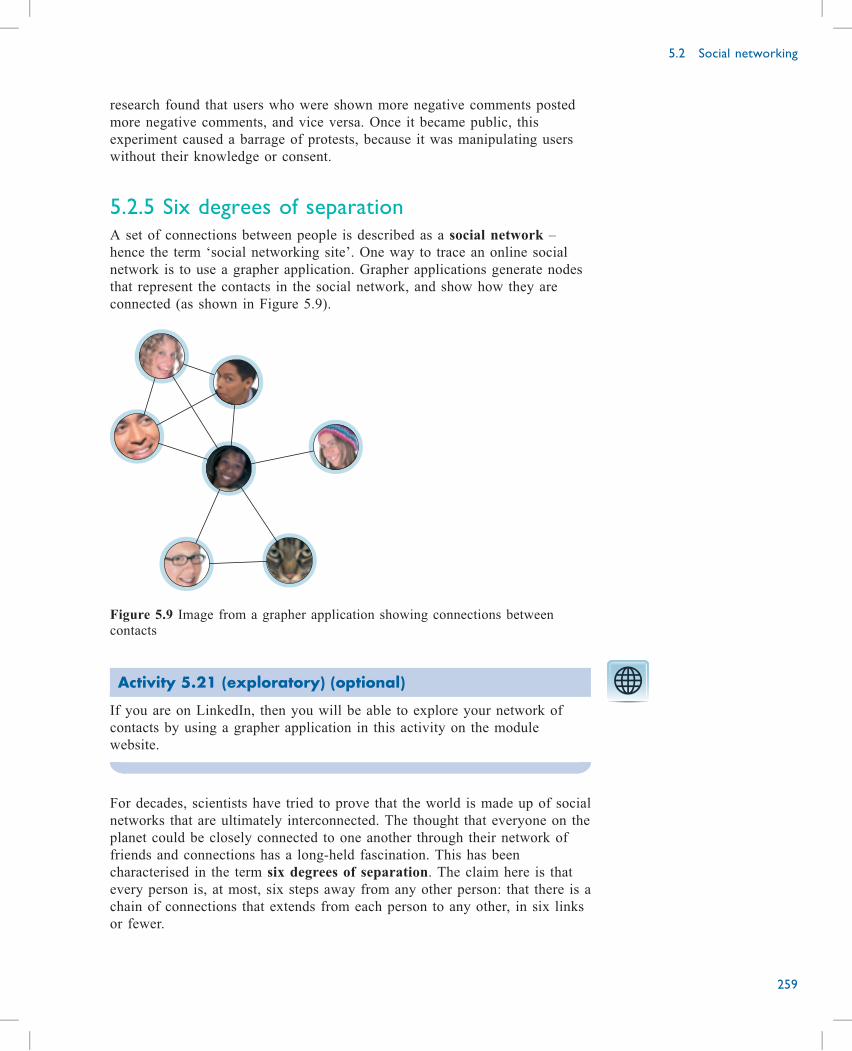
research found that users who were shown more negative comments posted
more negative comments, and vice versa. Once it became public, this
experiment caused a barrage of protests, because it was manipulating users
without their knowledge or consent.
5.2.5 Six degrees of separationA set of connections between people is described as a social network –
hence the term ‘social networking site’. One way to trace an online social
network is to use a grapher application. Grapher applications generate nodes
that represent the contacts in the social network, and show how they are
connected (as shown in Figure 5.9).
Figure 5.9 Image from a grapher application showing connections between
contacts
Activity 5.21 (exploratory) (optional)
If you are on LinkedIn, then you will be able to explore your network of
contacts by using a grapher application in this activity on the module
website.
For decades, scientists have tried to prove that the world is made up of social
networks that are ultimately interconnected. The thought that everyone on the
planet could be closely connected to one another through their network of
friends and connections has a long-held fascination. This has been
characterised in the term six degrees of separation. The claim here is that
every person is, at most, six steps away from any other person: that there is a
chain of connections that extends from each person to any other, in six links
or fewer.
5.2 Social networking
259
Activity 5.22 (exploratory) (optional)
You may like to try out a light-hearted website activity that allows you to
link US actor Kevin Bacon (or an actor of your choice) to any other actor,
via films in which both have appeared.
5.2.6 ConclusionIn this section, we looked at social networking sites, and their benefits and
problems. We looked at specific examples, such as Facebook and Twitter,
which are widely used, and we considered issues such as privacy and security
which need to be born in mind when using social networking sites.
Part 5 Online communication
260
Synchronous communication
In this section, we will be looking at synchronous communication –
communication in real time, where users are online together. You may
already have used some synchronous communication technologies – for
example, Facebook Messenger for text chat or Adobe Live for audio-visual
communication.
When discussing synchronous communication, sometimes the term real time
is used. (I used it above.) But the communication is not literally sent and
received at the same time. There is always a delay, however short. Sometimes
the delay is because of the nature of the communication tool. For example,
many ‘text chat’ tools wait for the user to press ‘Enter’ before their message
is sent. In other cases, such as videoconferencing, there may be a short lag
caused by processing and transmitting the data.
We’ll begin with a broad view of technologies for synchronous
communication. To help with this, I would like you to read Box 5.3. As you
read through the text, make some notes on the benefits and drawbacks of
synchronous technologies. This will help you to answer the questions in
Activity 5.23.
Box 5.3 Synchronous communication technologies
Synchronous technologies have the benefit of enabling users to give or
receive an immediate response. They create an awareness of presence,
knowing that recipients are actually around and able to respond
immediately to questions. This contrasts with asynchronous
communication, where users are uncertain as to whether a message will
be received, read or replied to. Synchronous technologies are more
spontaneous and can create opportunities for developing personal
relationships with fellow participants more quickly than in asynchronous
environments. They are particularly useful for discussing specific issues
that need to be addressed within a given time frame.
However, synchronous communication also has drawbacks. There are
practical issues, in that everyone wanting to participate must be online
at the same time. Messages, although spontaneous and instantaneous,
may not always be well thought out. For people who are not typing in
their first language, or people unfamiliar with the user interfaces
involved, it may be difficult to keep up with the flow of a conversation.
This can incite feelings of frustration both from the individual concerned
and fellow participants.
5.3 Synchronous communication
261
5.3
Activity 5.23 (self-assessment)
(a) Give two advantages of synchronous communication that are discussed in
Box 5.3. Which advantage do you think is more important in a work
context, and why?
(b) Give two disadvantages that are discussed in the text. Which
disadvantage do you think is more significant in a work context, and
why?
You may wish to share your opinions in your tutor group forum, and see
what other students think.
5.3.1 Synchronous text-based communication
toolsSynchronous communication is sometimes based on text only, rather than
voice or video; perhaps the simplest example is text messaging via mobile
phones. When you are using the internet instead, you can interact with other
people in real time using a chat tool. If you use an instant messaging (IM)
tool then you can also see when your contacts are online.
We’ll look at chat tools first, then move on to look at instant messaging.
However, bear in mind that the boundaries between different online
communication tools are ‘fuzzy’; different types of tool can evolve and merge
their functionality over time. I’ll return to look at this issue in relation to chat
and instant messaging tools shortly, but first I’ll consider what each involves.
Text chat
A chat tool allows users to type in messages to each other in real time. Each
person’s contribution appears on the other participants’ screens, either as it is
typed or when the writer presses ‘Enter’.
If there are a number of participants in the chat, the result can be rather
confusing. Even when chatting with just one other person, there may be
parallel threads of discussion. For example, you could ask a question and
before the other person sees it they have typed in a different question for you
to answer. Yet in spite of this, the real-time nature of the communication can
make it seem more ‘alive’ than asynchronous communication.
As mentioned earlier, it is important to consider the issues of safety and
security when communicating with others online. This is a particular concern
in some real-time chat environments, where the other people may be
unknown, and where children may be at risk. Issues that can arise include:
. impersonation (for example, an adult claiming that they are a teenager)
. grooming, where an adult tries to gain a young person’s trust for sexual
purposes
Part 5 Online communication
262
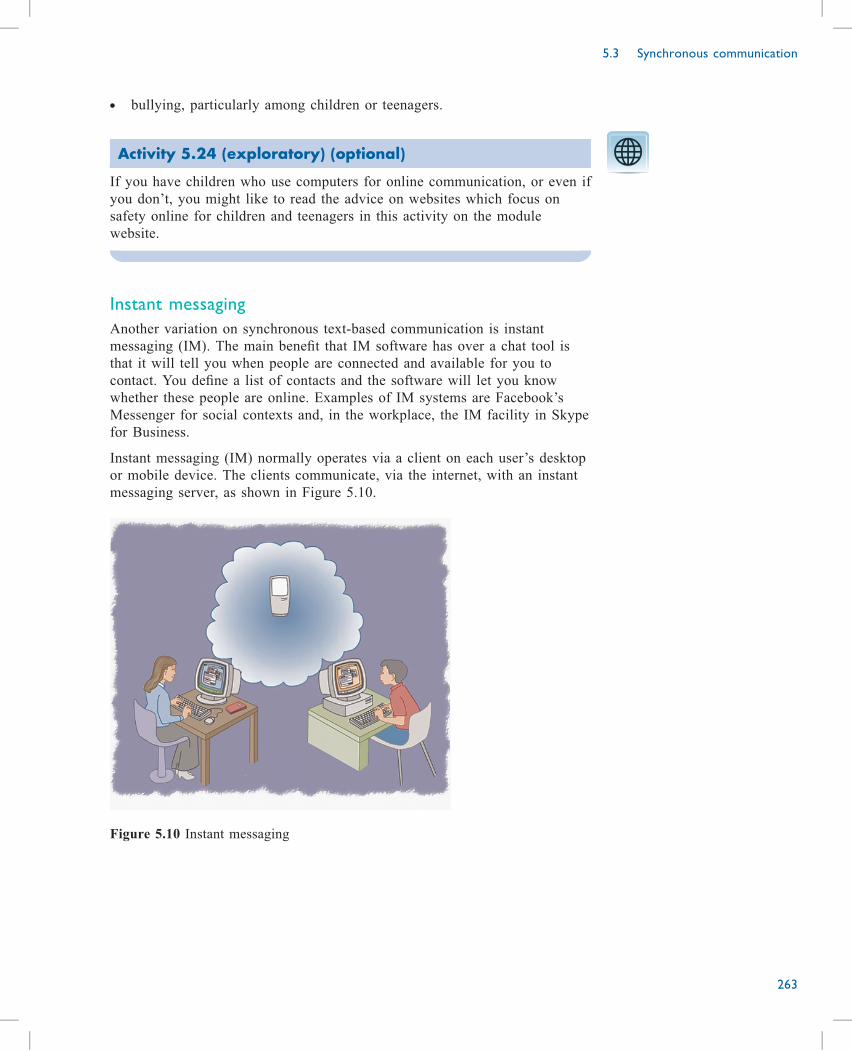
. bullying, particularly among children or teenagers.
Activity 5.24 (exploratory) (optional)
If you have children who use computers for online communication, or even if
you don’t, you might like to read the advice on websites which focus on
safety online for children and teenagers in this activity on the module
website.
Instant messaging
Another variation on synchronous text-based communication is instant
messaging (IM). The main benefit that IM software has over a chat tool is
that it will tell you when people are connected and available for you to
contact. You define a list of contacts and the software will let you know
whether these people are online. Examples of IM systems are Facebook’s
Messenger for social contexts and, in the workplace, the IM facility in Skype
for Business.
Instant messaging (IM) normally operates via a client on each user’s desktop
or mobile device. The clients communicate, via the internet, with an instant
messaging server, as shown in Figure 5.10.
Figure 5.10 Instant messaging
5.3 Synchronous communication
263
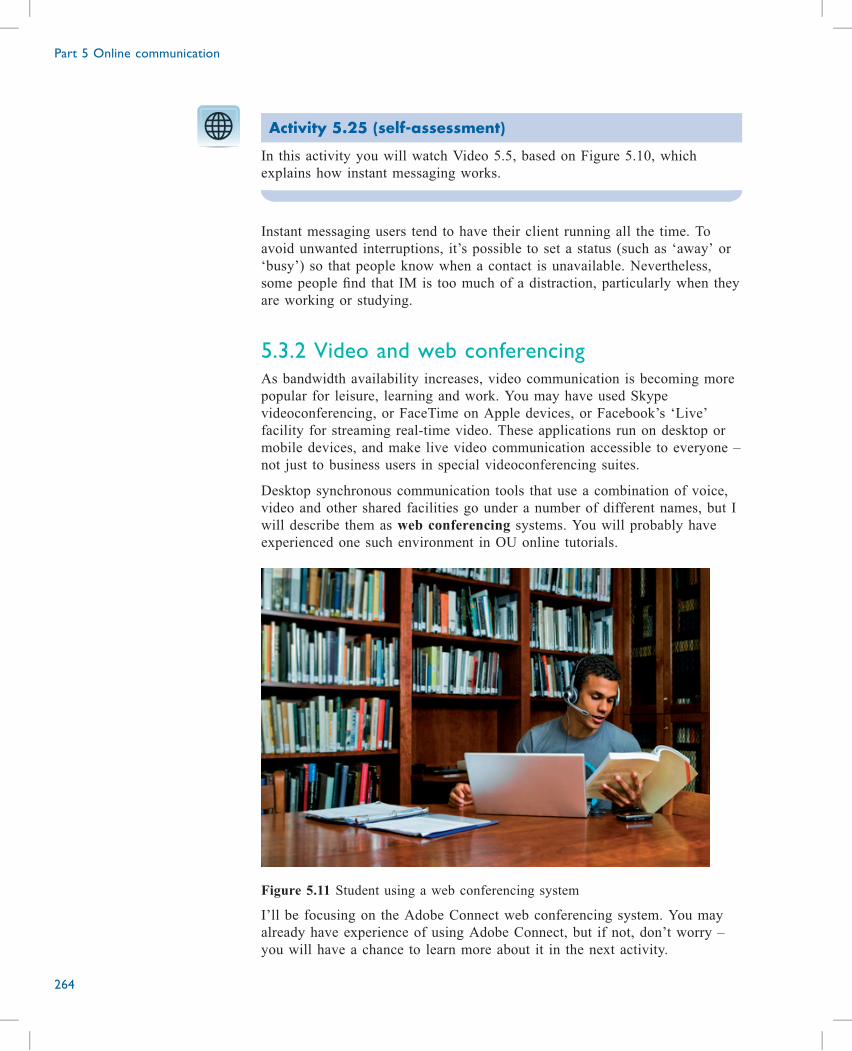
Activity 5.25 (self-assessment)
In this activity you will watch Video 5.5, based on Figure 5.10, which
explains how instant messaging works.
Instant messaging users tend to have their client running all the time. To
avoid unwanted interruptions, it’s possible to set a status (such as ‘away’ or
‘busy’) so that people know when a contact is unavailable. Nevertheless,
some people find that IM is too much of a distraction, particularly when they
are working or studying.
5.3.2 Video and web conferencingAs bandwidth availability increases, video communication is becoming more
popular for leisure, learning and work. You may have used Skype
videoconferencing, or FaceTime on Apple devices, or Facebook’s ‘Live’
facility for streaming real-time video. These applications run on desktop or
mobile devices, and make live video communication accessible to everyone –
not just to business users in special videoconferencing suites.
Desktop synchronous communication tools that use a combination of voice,
video and other shared facilities go under a number of different names, but I
will describe them as web conferencing systems. You will probably have
experienced one such environment in OU online tutorials.
Figure 5.11 Student using a web conferencing system
I’ll be focusing on the Adobe Connect web conferencing system. You may
already have experience of using Adobe Connect, but if not, don’t worry –
you will have a chance to learn more about it in the next activity.
Part 5 Online communication
264
Activity 5.26 (self-assessment)
In this activity you will be asked to visit the Adobe website to watch a video
about Adobe Connect. This should give you an idea of how web conferencing
can be used for teaching and learning.
Technology aspects
The technology of videoconferencing is, as you can imagine, quite complex.
A major principle is to achieve as high a quality of video and audio
communication as possible, within the limits of the available bandwidth.
A videoconferencing system connects two or more endpoints. These are the
hardware devices, with the required software, at each end of the
videoconferencing communication link (for example a desktop PC or perhaps
a smartphone). The video data from each endpoint consists of a series of
frames, of a certain resolution, at regular time intervals. A frame contains
data representing the colour and intensity of each pixel. Pre-processing
software removes data that would not be noticeable to the human visual
system, in order to reduce the bandwidth requirements. This is a form of
lossy compression. Some of the transmitted frames are predictions, based on
estimations of the movement from previous frames. This process further
reduces the amount of data that needs to be sent.
The endpoints in a videoconference negotiate a frame rate, to make sure each
endpoint is capable of sending/receiving at the final agreed rate. In desktop
videoconferencing, the frame rate might be 15 frames per second. In contrast,
a standalone videoconferencing system (which typically requires specialised
equipment in a specific room) might operate at 30 frames per second. The
endpoints also negotiate a data rate; if the bandwidth available to one or both
of the endpoints is low, they might need to agree on a relatively low data
rate. If a higher rate is possible, this allows for higher-quality video. As an
example of the bandwidth requirements, a Skype one-to-one video call needs
about 500 kbps in each direction.
During a videoconference, it might be necessary to vary the actual data rate
and frame rate. This is because the available bandwidth and the data transfer
requirements may change with time. Videoconferencing involves a constant
adjustment of the data requirements for video and audio, according to the
network conditions at that time.
As well as the available bandwidth affecting the quality of the
communication, there is the issue of lag (delay). If there is a significant lag
(e.g. more than 150 ms) between sending and receiving the audio/video, the
communication system becomes difficult and frustrating to use.
As noted above, in relation to desktop conferencing and web conferencing,
there seem to be a number of technical issues which are not yet fully
resolved. These can affect the audio and video quality, and therefore the
user’s experience. Hopefully this situation will improve in the future, so that
5.3 Synchronous communication
265
people can have truly effective online meetings and seminars in the
workplace and for education.
Human factors
The value of real-time conferencing for communication depends on human
factors as well as technical factors. The following activity asks you to think
about a few of these human factors.
Activity 5.27 (exploratory)
If you have used a web conferencing system during your OU studies, how
did you feel about the following aspects? (If you haven’t yet used a web
conferencing system, try to imagine what your thoughts might be on these
issues.)
(a) Dealing with parallel communication channels (video, audio, text,
whiteboard and so on).
(b) Taking turns with the microphone.
(c) Interacting online with people you didn’t know before.
(d) Using a webcam.
Comment
(a) When using web conferencing, I enjoy having multiple routes for
communication, but sometimes I forget to keep a watch on the text chat
area. I think it must be very difficult for a tutor to keep track of
everything.
(b) I find it off-putting if I need to keep switching the microphone on and
off. I would prefer to have everyone able to speak at once.
(c) I enjoy talking to people online, but often I know the other people
already. I think an online session might be more difficult for me if I
didn’t know any of the participants.
(d) I think it is a good idea to use video, but I don’t really like the idea of
people looking at a video image of me for a long period of time.
In the following activities, we’ll consider further whether video is beneficial
for online communication, or whether audio is adequate. You will be asked to
find and use an academic article, as such you will need to allocate more time
than usual for working through the activities (at least 30 minutes).
Part 5 Online communication
266
Activity 5.28 (self-assessment)
In this activity on the module website you will be looking at a page from the
website for Powwownow, which is another example of a web conferencing
environment. Its website compares audio-conferencing with
videoconferencing.
The Powwownow website lists a number of benefits of videoconferencing
over audio-conferencing, but how do we know whether these things are true,
given that this website is also promoting their product? What evidence can
we find about these issues? In the next activity, you will find an online
journal article that will help to answer some of these questions.
Activity 5.29 (exploratory)
In this activity on the module website you will use the Library to find an
academic journal article online. The article presents experimental research
about different media for online communication, and how well they enable
people to get to know each other.
It is a challenging article, but you only need to look at a few parts of it.
Follow the instructions in the online activity. You will need to allow about 30
minutes for this activity.
I wonder if you were surprised by the findings of this paper – I was. There is
still considerable debate about the issue of whether video is needed. If we
were researching the issue thoroughly, we would look for other research
papers, and then perhaps consider carrying out our own investigations too.
I will now move on to look at telepresence systems, where high-quality
video plays a major role in making the communication seem as realistic as
possible to the participants.
5.3.3 TelepresenceThe networking company Cisco developed a suite of high-performance
videoconferencing systems that it calls ‘telepresence’. Telepresence systems
feature life-size, high-resolution video, together with high-quality audio
(Figure 5.12). Using telepresence, people can feel as if they are sitting round
a table together, just as they might in a face-to-face meeting.
5.3 Synchronous communication
267
Figure 5.12 Cisco telepresence
Staff from the OU visited Cisco to learn more about telepresence and to try it
out. The next two activities contain short videos of interviews with Cisco
staff and clients.
Activity 5.30 (self-assessment)
In this activity you will need to watch Video 5.6 on the module website,
which is about the telepresence system.
Activity 5.31 (self-assessment)
In this activity you will need to watch Video 5.7 on the module website
which discusses and demonstrates some of the uses of telepresence.
In the following activity, you will use your web searching skills to investigate
how telepresence technologies have developed since these videos were made.
Activity 5.32 (exploratory)
In this activity you will do an advanced web search, using a date range, to
look for recent developments in telepresence technologies or their
applications.
Additional resource (optional)
If you are not confident about how to do an advanced web search or you
would like to refine your existing skills, you may like to try a Library
activity on the module website about targeting your Google search.
Part 5 Online communication
268
5.3.4 ConclusionThis section considered synchronous (real-time) communication, and the tools
that support this. We started with text-based tools, then moved on to look at
systems such as videoconferencing, which require a higher bandwidth (data
rate).
5.3 Synchronous communication
269
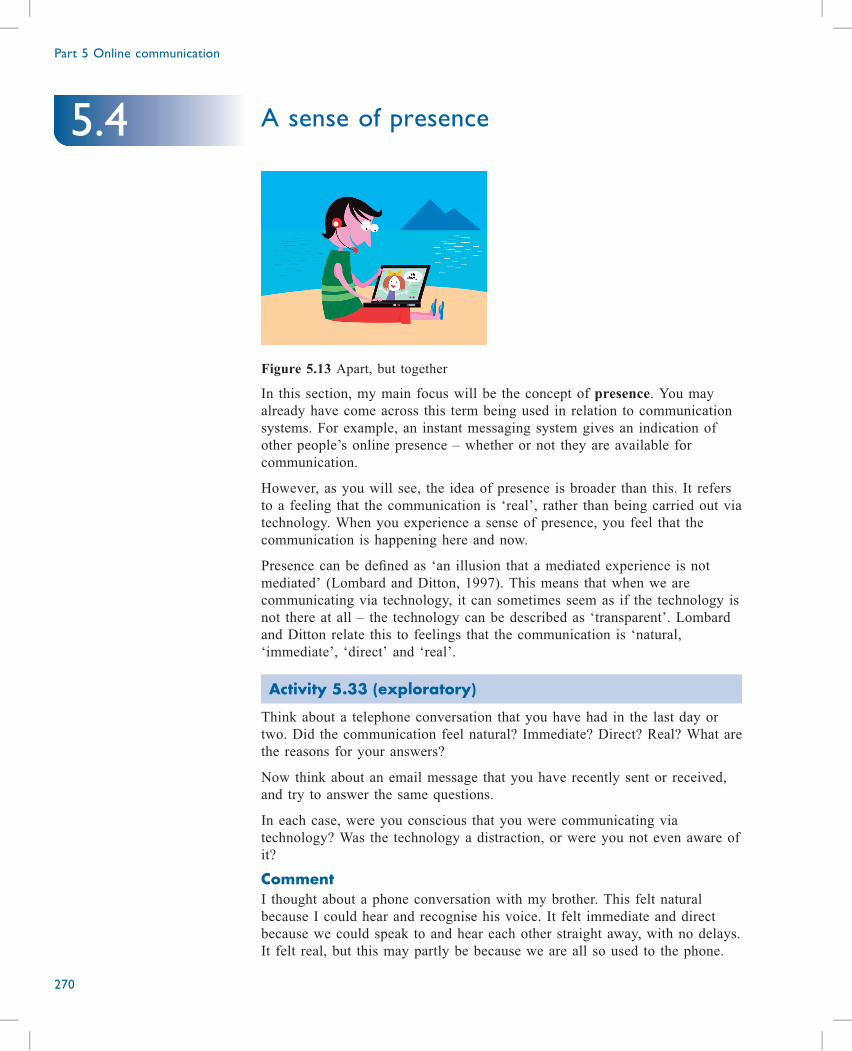
A sense of presence
Figure 5.13 Apart, but together
In this section, my main focus will be the concept of presence. You may
already have come across this term being used in relation to communication
systems. For example, an instant messaging system gives an indication of
other people’s online presence – whether or not they are available for
communication.
However, as you will see, the idea of presence is broader than this. It refers
to a feeling that the communication is ‘real’, rather than being carried out via
technology. When you experience a sense of presence, you feel that the
communication is happening here and now.
Presence can be defined as ‘an illusion that a mediated experience is not
mediated’ (Lombard and Ditton, 1997). This means that when we are
communicating via technology, it can sometimes seem as if the technology is
not there at all – the technology can be described as ‘transparent’. Lombard
and Ditton relate this to feelings that the communication is ‘natural,
‘immediate’, ‘direct’ and ‘real’.
Activity 5.33 (exploratory)
Think about a telephone conversation that you have had in the last day or
two. Did the communication feel natural? Immediate? Direct? Real? What are
the reasons for your answers?
Now think about an email message that you have recently sent or received,
and try to answer the same questions.
In each case, were you conscious that you were communicating via
technology? Was the technology a distraction, or were you not even aware of
it?
CommentI thought about a phone conversation with my brother. This felt natural
because I could hear and recognise his voice. It felt immediate and direct
because we could speak to and hear each other straight away, with no delays.
It felt real, but this may partly be because we are all so used to the phone.
Part 5 Online communication
270
5.4
Perhaps the early telephone users would have felt it was unreal, because they
could not see each other.
I then thought of an email I sent to a colleague when she had just mailed me
to say that her daughter wasn’t well. It didn’t feel very natural replying by
email, because it is difficult to express emotions such as sympathy in an
email. It felt immediate and direct, but only because I was able to answer her
message as soon as it arrived. I knew that if she was still online, the message
would get straight to her. I felt that the email conversation was real, partly
because it was about a human problem – unexpected illness.
For the phone conversation, I didn’t really think about the fact that I was
communicating via technology; for the email message, I did.
We will now move on to will look at two ideas related to the concept of
presence.
social presence, which considers the extent to which the social aspects of
communication – such as emotions – are conveyed.
awareness, which relates to what people know about the current activities of
others. For example, do they know whether others are online and what they
are doing?
5.4.1 Social presenceThe concept of social presence is about whether people relate to each other in
a human way when communicating online. One definition of social presence
is “the degree to which a person is perceived as ‘real’ in mediated
communication” (Gunawardena and Zittle, 1997, p. 8).
The concept originated in research on the social aspects of communication
via different media (Short, Williams and Christie, 1976). The researchers
were interested in how different media were used for different communication
requirements. More recently, researchers have used the term ‘social presence’
to express how ‘warm’ online communication seems to the participants.
The degree of social presence that people experience when they are
communicating online can be strongly influenced by the type of
communication medium they are using. Low social presence can be a
particular problem when using a text-based, asynchronous communication
medium such as email or a discussion forum. It is not easy to convey feelings
via text, and the delay between messages is also a problem. So some people
find this form of communication impersonal.
For example, when reading an email or forum message, typically all you have
are the words on the screen, so it can be difficult to interpret the tone of the
message. In contrast, when participating in a videoconference, you can see
other people’s body language and expressions, and you can hear their tone of
voice. These communication cues are helpful for understanding what people
mean and how they are feeling.
5.4 A sense of presence
271
Social presence is influenced by how participants use a communication
medium, as well as by the medium itself. People can ‘create’ social presence
online by behaving in ways that are perceived as warm or sociable. This can
compensate for any problems with the medium itself.
For example, when communicating using a text-based medium such as email
or instant messaging, users can take steps to increase social presence. This
requires a little thought and imagination about the style and content of your
messages. When you are sending a message, try to put yourself in the shoes
of the recipient. What can you do to make sure they receive your message in
the spirit it was sent? Careful phrasing is important, and perhaps appropriate
use of visual cues such as font, colour, or emoticons/emojis. Similarly, when
you receive a message, try to get below the surface of the words to
understand the sender’s intentions.
Activity 5.34 (exploratory)
Suppose you were a manager who employed several teleworkers who could
only come into the office once a fortnight. For each of the three requirements
below, which communication medium would you choose: a videoconference,
a phone call, an email, a letter or a face-to-face meeting? There are no ‘right
answers’ here. Think about the advantages and disadvantages of each
communication medium for each of the three requirements listed, and form
your own opinion.
You may like to share your ideas with other students in your tutor group
forum.
1 You need to tell an employee what their role will be in a project that is
about to begin.
2 You need to carry out a six-monthly career appraisal with an employee.
3 You need to tell your best employee that they have been awarded a pay
rise.
CommentI expect there was quite a variety among the answers chosen by your fellow
students. My choices would be as follows.
For telling an employee about their role in a new project, I would use the
phone or a videoconference so that we could discuss the project together.
For a career appraisal, I would generally use a face-to-face meeting. If the
employee was familiar with videoconferencing, then that would be an
alternative.
To tell an employee that they had been awarded a pay rise, I would send a
congratulatory email followed by a formal letter.
I hope you can see that the choice of a suitable medium for a given purpose
is not always easy, and sometimes a combination of different media seems a
Part 5 Online communication
272
good solution. The effectiveness of the medium will also depend on how
people use it.
5.4.2 AwarenessThe concept of awareness relates to our knowledge of other people’s
activities when we are communicating or collaborating online.
When people are working in the same office or building, they gain some
sense of who is around and what other people are doing. For example, they
can wander down the corridor to see if colleagues are at their desks. In an
open-plan office they will overhear conversations and see people’s activities.
When working collaboratively at a distance, however, it is much harder to
gain a sense of who is doing what and when. This lack of awareness of
others’ activities can make collaboration more difficult.
Some technologies can be used to help enhance awareness. One example that
you have already met is an instant messaging facility. This allows you to see
who is online, and might also tell you whether they are away from their
computer or busy on other tasks. Some IM tools allow users to leave a
message if they are away for a while. For example, they might leave a
‘virtual note’ saying ‘Gone to lunch – back at 2pm’.
More advanced solutions have also been proposed, such as a ‘telepresence
robot’ (Figure 5.14) that can move around a workplace, allowing a remote
worker to see, and interact with, those who are in the office.
5.4 A sense of presence
273
Figure 5.14 An example of a telepresence robot
The concept of awareness also applies to the shared products and documents
we develop when we are collaborating with others. For example, there are
applications, such as Google Docs, that enable co-workers to see where in a
shared document others are working and what they are doing.
Technologies that provide awareness of other people’s activities can raise
issues in relation to privacy. These concerns also apply in physical contexts
(for example, looking over a colleague’s shoulder to see what’s on their
computer screen), but they can be more prominent in relation to technology
use.
Activity 5.35 (exploratory)
Suppose you were in a job where you needed to work with others who were
not co-located with you. Would you be happy about the approaches discussed
above, or would you have concerns about your privacy? Think about each of
the technical solutions discussed above for increasing awareness:
. instant messaging
. a ‘telepresence robot ‘
. real-time shared documents.
Try to weigh up the advantages in terms of improved work against the
concerns related to privacy.
Part 5 Online communication
274
CommentI think instant messaging is very useful in a work context, and I don’t have
concerns about privacy because with IM you can control what others know
about you.
I don’t think I would be very comfortable with a telepresence robot
wandering around – I think it would feel a little like being ‘spied on’ by
someone who wasn’t actually present. But it would certainly be interesting to
see what the experience was really like.
The ability to see what was happening in a shared document ‘live’ could be
useful. But I might feel uncomfortable that colleagues were seeing what I
was typing, including all the mistakes.
5.4.3 ConclusionThis section discussed some theoretical ideas related to online
communication, focusing on the concept of ‘presence’. We looked at two
specific ideas: social presence and awareness. Both of these relate to people’s
personal experience of communicating using technology.
5.4 A sense of presence
275
Summary
You have now reached the end of Part 5, so I will briefly review what we
have covered. We have seen how online communication can be used for a
variety of purposes, using a number of different software tools and websites.
One of the key things to note is that this is an area that is constantly
changing, and the boundaries between different kinds of communication tools
are blurred.
Asynchronous communication technologies provide a convenient way of
communicating to suit people’s different schedules: users can post and read
contributions at any time that suits them. People can share resources, as well
as communicating directly. All of this has led to the idea of an online
community – where people with common interests can keep in touch
regardless of where they are.
In recent years, online communication via social networking sites and apps
has become widespread. This means that families and friends can easily keep
in touch, and issues can be shared and discussed globally. However, social
networking has also highlighted negative aspects of online communication,
such as intrusions of privacy, issues of safety (for children in particular) and
some very unpleasant online behaviour.
Synchronous (real-time) communication technologies can provide a strong
sense of presence and awareness of others – the feeling of ‘being there’ with
other people. Again, there are a range of different tools for real-time
communication, but some (such as ‘telepresence’ videoconferencing) require
high-bandwidth communication channels. Both technical factors and human
factors need to be considered when choosing what kind of communication
tool to use for a particular purpose.
I hope you have enjoyed learning about online communication in this part,
and using different resources: websites, videos, extracts from articles. In a
field which is rapidly changing, it’s helpful to develop skills in finding and
using different kinds of resources – to keep up-to-date with technological
developments and the social issues they raise.
Part 5 Online communication
276
5.5
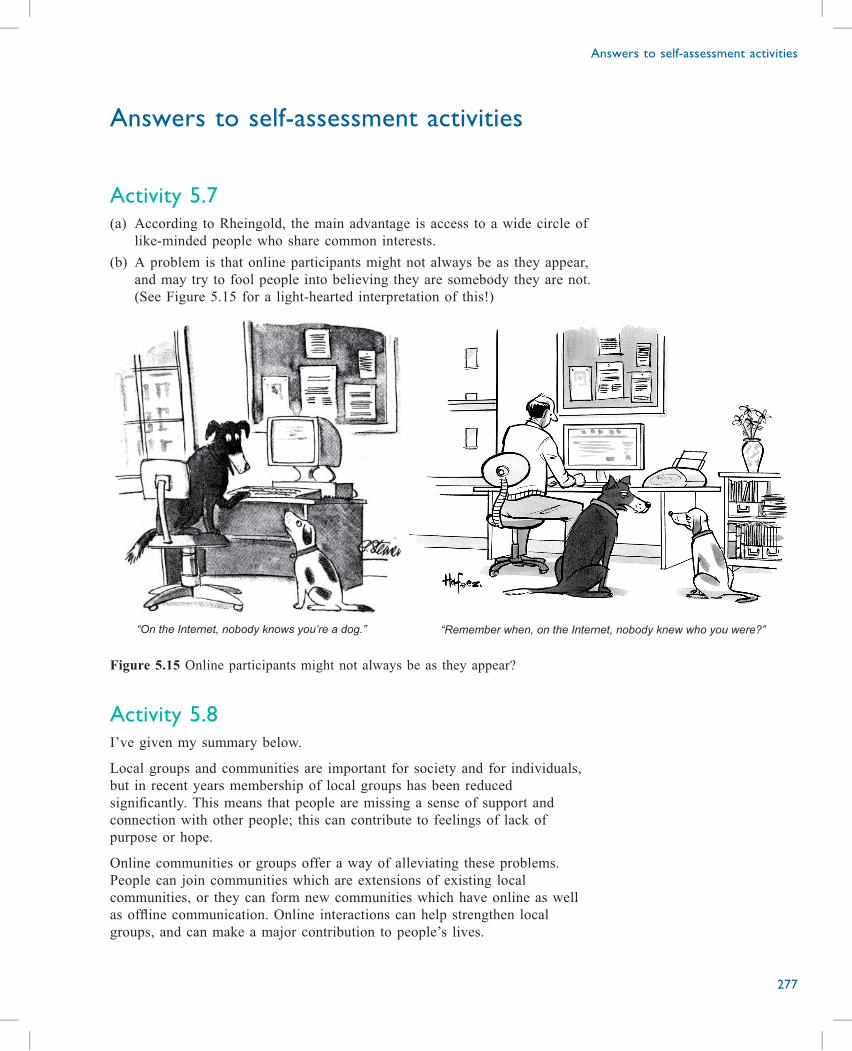
Answers to self-assessment activities
Activity 5.7(a) According to Rheingold, the main advantage is access to a wide circle of
like-minded people who share common interests.
(b) A problem is that online participants might not always be as they appear,
and may try to fool people into believing they are somebody they are not.
(See Figure 5.15 for a light-hearted interpretation of this!)
“On the Internet, nobody knows you’re a dog.” “Remember when, on the Internet, nobody knew who you were?”
Figure 5.15 Online participants might not always be as they appear?
Activity 5.8I’ve given my summary below.
Local groups and communities are important for society and for individuals,
but in recent years membership of local groups has been reduced
significantly. This means that people are missing a sense of support and
connection with other people; this can contribute to feelings of lack of
purpose or hope.
Online communities or groups offer a way of alleviating these problems.
People can join communities which are extensions of existing local
communities, or they can form new communities which have online as well
as offline communication. Online interactions can help strengthen local
groups, and can make a major contribution to people’s lives.
Answers to self-assessment activities
277
Activity 5.23(a) The advantages I identified were being able to respond immediately, and
being aware of others who are online. I think the most important
advantage in a work context is being able to respond quickly, so that
there are fewer delays in getting things done.
(b) The disadvantages I identified were that everyone must be available at a
particular time, and that there is less time to reflect on contributions. The
disadvantage that seems most significant for the work context is the need
to be online at the same time. This is a problem because people have
different work schedules and commitments (e.g. meetings).
Part 5 Online communication
278
References
Beer, D. (2017) ‘The Social Power of Algorithms’, Information,
Communication & Society, vol. 20, no. 1, p. 6.
Gunawardena, C. N. and Zittle, F. J. (1997), ‘Social presence as a predictor
of satisfaction within a computer-mediated conferencing environment’,
American Journal of Distance Education, vol. 11, no. 3, p. 8 [Online].
Available at http://www.tandfonline.com/doi/abs/10.1080/
08923649709526970?journalCode=hajd20 (Accessed 24 July 2017).
Kickstarter (2017) Pressroom [Online]. Available at https://www.kickstarter.
com/press?ref=hello (Accessed 24 July 2017).
Kushlev, K. and Dunn, E. W. (2015) ‘Checking email less frequently reduces
stress’, Computers in Human Behavior, vol. 43, pp. 220–228.
Lombard, M. and Ditton, T. (1997) ‘At the Heart of It All: The Concept of
Presence’, Journal of Computer-Mediated Communication, vol. 3, no. 2
[Online]. Available at http://onlinelibrary.wiley.com/doi/10.1111/j.1083-
6101.1997.tb00072.x/full (Accessed 24 July 2017).
Rheingold, H. (2000) The Virtual Community: Homesteading on the
Electronic Frontier, 2nd edn, Cambridge, MA, MIT Press.
Short, J., Williams, E. and Christie, B. (1976) The Social Psychology of
Telecommunications, London, Wiley.
Sprecher, S. (2014) ‘Initial interactions online-text, online-audio, online-
video, or face-to-face: Effects of modality on liking, closeness, and other
interpersonal outcomes’, Computers in Human Behavior, vol. 31, pp. 190–
197.
Wagner, K. and Swisher, K. (2017) ‘Read Mark Zuckerberg’s full 6,000-word
letter on Facebook’s global ambitions’, recode, 16 February [Online].
Available at https://www.recode.net/2017/2/16/14640460/mark-zuckerberg-
facebook-manifesto-letter (Accessed 14 December 2017).
References
279
Acknowledgements
Grateful acknowledgement is made to the following sources:
Figure 5.3, Flickr screenshot images 1, 2, 3, 4, 6 and 7 (first row, and second
row, middle). © David Phillips via Flickr. This file is licenced under the
Creative Commons Attribution-NonCommercial 2.0 Generic licence https://
creativecommons.org/licenses/by-nc/2.0/.
Figure 5.3, Flickr screenshot images 5 and 8 (second row, far left and far
right). © The Open University via Flickr. This file is licenced under the
Creative Commons Attribution-NonCommercial-NoDerivs 2.0 Generic licence
https://creativecommons.org/licenses/by-nc/2.0/.
Figure 5.4. Taken from https://www.flickr.com/map (c) OGL. Contains public
sector information licensed under the Open Government Licence v3.0. http://
www.nationalarchives.gov.uk/doc/open-government-licence/version/3/.
Figure 5.6. © Photographs taken by Allan Jones, reproduced with permission.
Figure 5.8. Reproduced courtesy of linkfluence.
Figure 5.12. © Reproduced courtesy of Cisco.
Figure 5.14 © Double Robotics, Inc.
Figure 5.15 (left). © The New Yorker Collection 1992 Peter Steiner from
cartoonbank.com. All Rights Reserved.
Figure 5.15 (right). © Kaamran Hafeez The New Yorker Collection / The
Cartoon Bank.
Every effort has been made to contact copyright holders. If any have been
inadvertently overlooked the publishers will be pleased to make the necessary
arrangements at the first opportunity.
Part 5 Online communication
280
Part 6 The networked societyby David Chapman

Contents
Introduction 285
6.1 Government, the state and society 286
6.1.1 Government services 286
6.1.2 Government data 288
6.1.3 Digital democracy 290
6.1.4 Technological determinism 292
6.1.5 Conclusion 294
6.2 Identity: biometrics 295
6.2.1 Identification and verification 295
6.2.2 Biometric data 297
6.2.3 Biometric documents 299
6.2.4 Without documents 301
6.2.5 DNA information 302
6.2.6 Matching 304
6.2.7 Conclusion 308
6.3 Networked health 309
6.3.1 Sources of health information 309
6.3.2 Electronic triage 310
6.3.3 Health records 314
6.3.4 Health monitoring 316
6.3.5 Conclusion 317
6.4 Placeless power and powerless places 318
6.4.1 Conclusion 320
6.5 Summary 321
Answers to self-assessment activities 322
References 323
Acknowledgements 324

Introduction
In this final part of the module, we will be looking at the role of digital
technologies in society. Technological advances make things possible that
were not possible before, and, as a consequence, we do things differently so
that our lives and society as a whole change. We might say that advances in
digital technologies change the way we live but, as you will see in
Subsection 6.1.4, we need to be careful when talking about how technological
developments ‘cause’ societal changes.
Many of the things that digital technologies have made possible are to do
with communication. People talk about ‘the death of distance’ and say that
‘geography is history’ because it is now easier to communicate, whether over
the internet or on mobile phones. It is much easier to work and socialise with
people far away. Businesses span the globe and we can maintain a close
relationship with friends who don’t live anywhere near us (as you saw in
Part 5). This has led to the suggestion that we now live in a networked
society – and that is the theme for this part.
Section 6.1 looks at some aspects of how the relationship between the state
and its citizens is different in a networked society. Section 6.2 focuses on one
aspect that arises from living in a networked society, which is how we prove
our identity; in particular, it addresses the use of biometric data. Section 6.3
considers how healthcare might be done differently with the availability of
network technology. Section 6.4 addresses some of the more contentious
issues that arise from the rise of networked society and explores who are the
winners and, especially, who might be losing out.
Introduction
285
6.1 Government, the state and society
The state and its citizens have many reasons to communicate: citizens need
information and resources from the state, and the state requires information
from its citizens. In recent years, successive governments have seen
developments in information and communication technologies (ICTs) as
providing the opportunity both to improve services provided by the state and
at the same time save money. Citizens, too, want better services at lower
cost, but it is not necessarily straightforward to determine if services are
‘better’ – and if they are better, is that for everyone or just for those with
access to the appropriate technology? Putting services online might make
them better for most people, but it might make them inaccessible to people
who, for one reason or another, do not have ready access to the internet.
Government services are one aspect of the relationship between citizens and
the state, but there are other aspects that might be affected by technology. It
is sometimes claimed, for example, that ICTs can improve democracy and
allow citizens to have a bigger say in how the country is run. This might
strengthen the state by making it more representative of the people. However,
it has also been argued that the ease of international communication enabled
by digital technologies has undermined the state by shifting power to
transnational organisations which are not beholden to any one country.
6.1.1 Government servicesIt is easy to make a case for why information and communication
technologies can improve services and reduce cost, and governments have
claimed significant savings from moving online.
Digital services are much more convenient because they can be accessed
whenever you want them. They are also much more efficient, saving
taxpayers’ money and the user’s time. Online transactions can be 20 times
cheaper than by phone, 30 times cheaper than face-to-face and up to
50 times cheaper than by post.
Minister for the Cabinet Office, Francis Maude, 6 November 2012(Maude, 2012)
A belief in the merits of delivering government services online has led
successive governments in the UK (and elsewhere) to develop policies to
deliver digitally as much of their business as possible. The UK has used the
tagline ‘digital by default’ for a programme to digitise services across many
different government departments.
You may have completed some transactions which were quicker and easier
because you were able to do them online instead of by post or visiting
council offices. On the other hand, you may also have experience of services
which seem to be more difficult online.
Part 6 The networked society
286
Activity 6.1 (exploratory)
Reflect on your own experience of online government services. Were they
better done online, or might they have been better done some other way?
CommentMost recently, I responded to a questionnaire about my parish council’s local
plan. I tried to do it online with the PDF form that I should have been able to
submit electronically, but something went wrong, so I ended up emailing a
word-processed document instead. That was not very satisfactory and wasted
quite a lot of time. On the other hand, renewing my TV licence a few months
ago was very straightforward online.
Activity 6.2 (exploratory)
In this activity, on the module website, you explore the services available via
the UK government websites. You should do the activity now, or when you
are next at your computer and online.
Some things still cannot be done entirely online. To renew a passport, it is
possible to complete a form and pay for it online, but, at the time of writing,
it is still necessary to print out the form, sign it, and post it together with
photographs to the passport office. This is necessary because a passport
application needs a signature.
Activity 6.3 (exploratory)
(a) Why is a signature needed on a passport application?
(b) What functions does a signature on a document serve?
Comment
(a) A signature proves that the application comes from the person signing it.
(b) As well as proving that the document comes from the person who signed
it, the presence of a signature on a document also means that the person
signing the document can’t later deny that the document came from them.
Signatures and digital signatures
The previous activity highlighted two important functions of a signature:
authentication and non-repudiation.
Authentication, in this context, means determining whether a document
actually originates from the person it purports to come from, while non-
repudiation means that the person who signed the document cannot later deny
that the document comes from them. Sometimes a signature is needed for one
function, sometimes for the other, and sometimes for both.
6.1 Government, the state and society
287
Consider the situation, for example, if I were to write out and sign a cheque
to pay a builder. When the builder presents my cheque to the bank, my
signature proves to the bank that I have agreed to pay this money to the
builder: the signature authenticates the cheque. Suppose, however, that when
I see the money taken from my account, I contact my bank and deny ever
having written the cheque. The bank can now show me the signed cheque to
prove that I did write it and I can’t repudiate it. So, on a cheque, the
signature could be used for both authentication and non-repudiation.
Both functions can be performed electronically using the techniques of
encryption. You do not need to know how encryption is done (it is explained
in the companion module, TM112), but you should know that the techniques
of encryption are used to generate something called a digital signature.
Activity 6.4 (exploratory)
The term ‘digital signature’ is sometimes used to refer to a scanned copy of a
handwritten signature, but a scanned version of a handwritten signature is not
reliable for either authentication or non-repudiation. Can you see why not?
CommentIt would be relatively easy for someone to get hold of a copy of my signature
and scan it. The scanned copy could then be pasted into a document, and
there might be no way of knowing that it was not done with my approval.
There are types of digital signature that do provide both authentication and
non-repudiation. These digital signatures are called ‘signatures’ because they
perform both these functions of conventional signatures, but they differ from
conventional signatures in one important way: conventional signatures are an
example of biometric data, whereas digital signatures are not. A digital
signature is based upon information (a password or PIN) that you keep secret,
whereas a conventional signature is based upon a ‘biological’ feature of you
– how you write your name.
6.1.2 Government dataGovernments have always held data about their citizens – apart from
anything else, they need data in order to be able to collect taxes, and without
taxes the mechanisms of state can’t exist. Information and communication
technologies have made it easier to collect, store and manipulate data, so
governments have more data than ever before. However, since the state exists
for the citizens (at least in principle), there is an argument that state-owned
data is ‘really’ owned by the people and should therefore be freely available
to everyone. Again, in an ICT-enabled networked society this is technically
possible.
With this in mind, back in 2009 the UK government set out its commitments
on access to public data in a report entitled Smarter Government. Although
Part 6 The networked society
288
things have moved on since then, and the government has changed as a result
of elections, those principles remain relevant today.
Commitments: government’s public data principles
‘Public data’ are ‘government-held non-personal data that are collected or
generated in the course of public service delivery’.
Our public data principles state that:
. Public data will be published in reusable, machine-readable form
. Public data will be available and easy to find through a single easy to
use online access point (DATA.GOV.UK)
. Public data will be published using open standards and following the
recommendations of the World Wide Web Consortium
. Any ‘raw’ dataset will be represented in linked data form [Linked data
is data with associated information that makes it easier to find other,
related information elsewhere on the web.]
. More public data will be released under an open licence which enables
free reuse, including commercial reuse
. Data underlying the Government’s own websites will be published in
reusable form for others to use
. Personal, classified, commercially sensitive and third-party data will
continue to be protected.
(HM Government, 2009, p. 26)
Activity 6.5 (exploratory)
What public data can you think of that the government – or organisations
linked to the government – might hold?
CommentThe data that I first thought about related to transport (road and rail usage),
climate (past temperature and rainfall figures) and health (life expectancy,
prevalence of various diseases and disabilities, etc.). Notice that many of
these are about people in general, but they are public rather than personal
data because they are not about individuals.
Activity 6.6 (exploratory)
The ‘single easy to use online access point’ mentioned in the extract above
went live in 2010. Activity 6.6, on the module website, asks you to explore
DATA.GOV.UK, and you should do that now, or when you are next at your
computer and online.
6.1 Government, the state and society
289
Personal data
The data made available on DATA.GOV.UK is all non-personal data, as
promised by the Smarter Government report, which said “Personal, classified,
commercially sensitive and third-party data will continue to be protected”.
Activity 6.7 (exploratory)
Can you think of examples of data held by government that is:
(a) personal
(b) classified (information that a government has an explicit reason for not
releasing to the general public – most often information that would pose
a security threat in the wrong hands)
(c) commercially sensitive?
Comment
(a) Examples of personal data (data relating to individuals) held by
governments include salary information (for tax purposes) and
information such as penalty points for driving offences (for driver and
vehicle licence purposes).
(b) Data that a government might ‘classify’ includes things such as detailed
itineraries of military movements.
(c) Commercially sensitive data might include details about government
contracts.
Government departments hold vast amounts of personal data – details about
us and our lives. Yet personal data is not only held by governments;
commercial organisations also find personal information enormously valuable.
Supermarkets, for example, compile data about individuals’ shopping habits
based on their use of loyalty cards, and social networking sites such as
Facebook have lots of personal details about all the people with accounts on
them.
There are numerous concerns about the ethics of gathering and using personal
data, such as who has access to it, what it may be used for and how securely
it is held. We will be mentioning some of these issues again in Section 6.3 in
the context of health information, but this is a very big topic which we do
not have space to address in any depth in this module.
6.1.3 Digital democracyOne of the claims made for the web is that it allows citizens more
involvement with government. This might be in terms of staying informed
about what government is doing, or in terms of more actively contributing to
government.
In the UK, the web has made it easier to find out who our elected
representatives are, and to get in contact with them. It is also easier to join in
Part 6 The networked society
290
campaigns by, for example, signing online petitions or using social media to
lobby for a cause you support. Whether these activities have any real impact
is debatable (and frequently debated), with some people arguing that online
activism is a lazy substitute for doing things that make a real difference in
the world. The disparaging term ‘slacktivism’ has been coined for activities
such as signing an online petition which can be done with very little effort.
Box 6.1 Central and local government
In many countries, government can be thought of as having a central
component and a local or regional component. In the UK, central
government is based in London, although some functions are devolved
to the Scottish Parliament in Edinburgh, the National Assembly for
Wales in Cardiff, and the Northern Ireland Assembly in Belfast. These
devolved assemblies in Scotland, Wales and Northern Ireland are
nevertheless forms of central government. Central government is
generally concerned with such things as making laws, collecting national
taxes (e.g. income tax and VAT), administering the armed services,
national transport policy, determining policy on foreign relations, health,
social security, and so on.
Local government, on the other hand, is concerned with running local
services such as schools, health centres, public libraries, refuse
collection, planning permission for buildings, etc. Funding for local
services tends to come from a mixture of local taxes (for example, the
council tax in the UK) and central government money.
Activities 6.8 and 6.9, on the module website, ask you to explore some of the
tools to aid democracy.
Activity 6.8 (exploratory)
In this activity, you will need to go to the module website to explore the
political structures of England or the country in which you live. You should
do this activity now, or as soon as you are next at your computer and online.
Activity 6.9 (exploratory)
In this activity, you will need to go to the module website to make notes
from websites of campaigning organisations that make use of electronic
communication and social media in order to spread their messages and get
support. You should do this activity now, or as soon as you are next at your
computer and online.
6.1 Government, the state and society
291
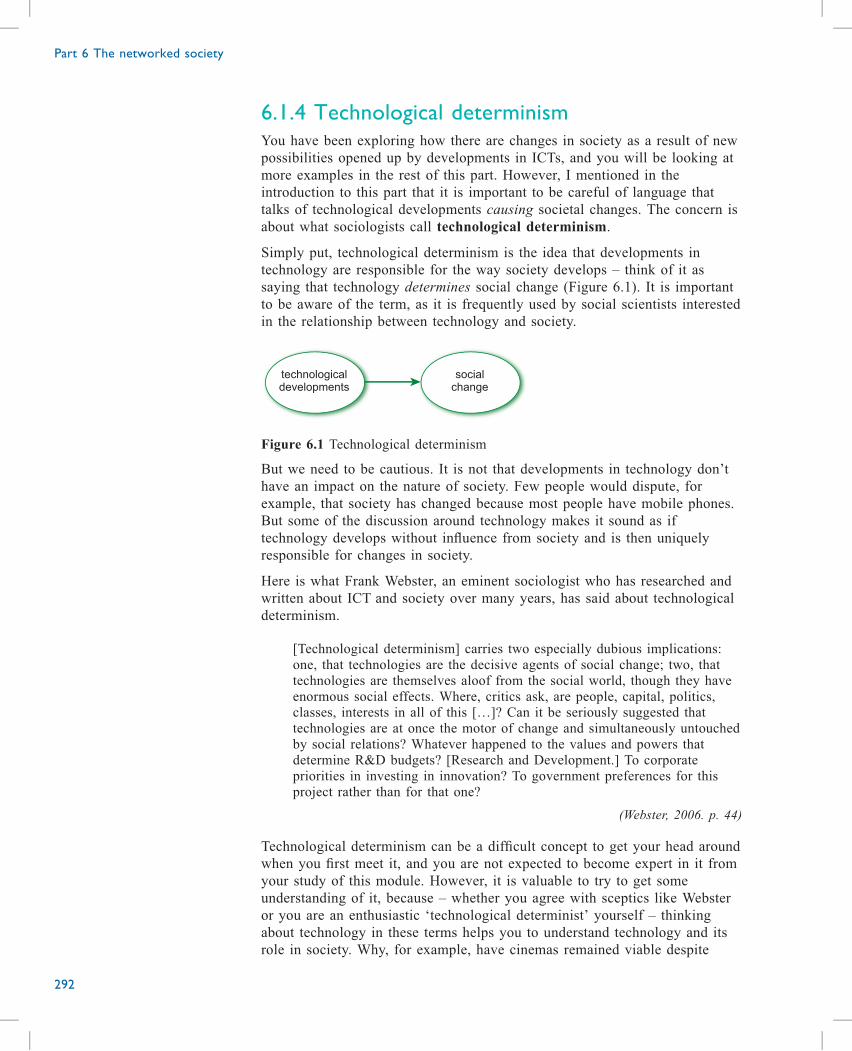
6.1.4 Technological determinismYou have been exploring how there are changes in society as a result of new
possibilities opened up by developments in ICTs, and you will be looking at
more examples in the rest of this part. However, I mentioned in the
introduction to this part that it is important to be careful of language that
talks of technological developments causing societal changes. The concern is
about what sociologists call technological determinism.
Simply put, technological determinism is the idea that developments in
technology are responsible for the way society develops – think of it as
saying that technology determines social change (Figure 6.1). It is important
to be aware of the term, as it is frequently used by social scientists interested
in the relationship between technology and society.
technologicaldevelopments
socialchange
Figure 6.1 Technological determinism
But we need to be cautious. It is not that developments in technology don’t
have an impact on the nature of society. Few people would dispute, for
example, that society has changed because most people have mobile phones.
But some of the discussion around technology makes it sound as if
technology develops without influence from society and is then uniquely
responsible for changes in society.
Here is what Frank Webster, an eminent sociologist who has researched and
written about ICT and society over many years, has said about technological
determinism.
[Technological determinism] carries two especially dubious implications:
one, that technologies are the decisive agents of social change; two, that
technologies are themselves aloof from the social world, though they have
enormous social effects. Where, critics ask, are people, capital, politics,
classes, interests in all of this […]? Can it be seriously suggested that
technologies are at once the motor of change and simultaneously untouched
by social relations? Whatever happened to the values and powers that
determine R&D budgets? [Research and Development.] To corporate
priorities in investing in innovation? To government preferences for this
project rather than for that one?
(Webster, 2006. p. 44)
Technological determinism can be a difficult concept to get your head around
when you first meet it, and you are not expected to become expert in it from
your study of this module. However, it is valuable to try to get some
understanding of it, because – whether you agree with sceptics like Webster
or you are an enthusiastic ‘technological determinist’ yourself – thinking
about technology in these terms helps you to understand technology and its
role in society. Why, for example, have cinemas remained viable despite
Part 6 The networked society
292
predictions of their decline in the face of home video? Why has the much-
touted paperless office yet to emerge, despite virtually all documentation now
being available electronically?
Implicit technological determinism
It is quite common for people to imply technological determinism in the way
they talk about technology, without making it explicit. Another writer, Daniel
Chandler, explains.
Technological determinism is often an inexplicit, taken-for-granted
assumption which is assumed to be ‘self-evident’. Persuasive writers can
make it seem like ‘natural’ common sense: it is presented as an
unproblematic ‘given’. The assumptions of technological determinism can
usually be easily spotted in frequent references to the ‘impact’ of
technological ‘revolutions’ which ‘led to’ or ‘brought about’, ‘inevitable’,
‘far-reaching’, ‘effects’, or ‘consequences’ or assertions about what ‘will
be’ happening ‘sooner than we think’ ‘whether we like it or not’. This sort
of language gives such writing an animated, visionary, prophetic tone which
many people find inspiring and convincing.
(Chandler, 1995)
Technologically deterministic language is frequently used to in order to
promote projects and initiatives, either by governments or private
organisations. Often, there will be some fashionable development that
receives widespread publicity. In recent years, for example, ‘Smart Cities’
have been widely promoted.
HyperCatCity will get businesses and cities working together to find new,
effective ways to deliver services using data and technology. … Smart cities
will not only create better services for citizens but also big export
opportunities for UK businesses.
(Innovate UK, 2015)
Africa’s cities are well-positioned to rapidly transform through the greater
use of advanced technology and data. Smart applications, revolutionising
consumer and utility services are enabling service providers to capture data
and apply powerful analytics programmes.
These tools enable cities to improve the access, reliability and resilience of
its resources and spaces, from improved traffic and transport management to
increasingly efficient provision of water, power and other key services.
(Meko, 2016)
Activity 6.10 (exploratory)
In the quotation from Daniel Chandler, you have been given some clues of
what to look out for in order to spot technological determinism.
Identify any words in the quotes above that might suggest technological
determinism. Do you think they both display it?
6.1 Government, the state and society
293
CommentIn the first quotation, the word ‘will’ in “Smart cities will not only create
better services…” suggests technological determinism.
The second quotation suggests that smart cities ‘are enabling’ things and that
the tools ‘enable’ improvements, but that does not mean that this is an
inevitable consequence of technological development. On the other hand, it
also talks about “Smart applications, revolutionising consumer and utility
services”, which hints at technological determinism.
6.1.5 ConclusionThe interaction between people and the state is increasingly mediated by
digital networked technology. States encourage the use of technology, in the
belief that it will reduce costs as well as improve services. Potentially,
technology can empower citizens by allowing better access to information
and services and through digital democracy. When reading or hearing people
talk of technological developments, however, it is important to be wary of
technological determinism and also to remember that not everyone has the
same access to technology (a topic which is addressed further in Section 6.4).
Issues around identity arise when accessing services electronically. Digital
signatures, for example, have been developed to serve the same purposes
(authentication and non-repudiation) as conventional signatures. The next
section looks at other aspects of identity in the networked digital society and
considers biometrics.
Part 6 The networked society
294
6.2 Identity: biometrics
In the previous section, you met the distinction between public data and
personal data. Personal data is data that is associated with an individual.
Examples of personal data that I gave in the last session included driver and
vehicle licence information.
Somewhere there is a database containing the names of all the people who
hold UK driving licences, together with details such as their age and the
categories of vehicle they are allowed to drive. My name is in that database.
Then there is another database containing details of all the cars registered in
the UK and the names of the people who are registered vehicle keepers. (My
name is not in that database, but my wife’s name is.)
For each database, there needs to be some link between the data in the
database and the person or car. The most obvious links come from the name
in the case of a person, and the vehicle registration mark – the number on the
number plate – in the case of a car.
There is a number plate permanently attached to a car, so in that case the link
between the information in the database and the physical object is
straightforward (ignoring for these purposes the possibility that someone
might change the number plate). The name of a person is not quite so
straightforward – for one thing, names are not unique (there are quite a few
David Chapmans) – so my driving licence also has a number. I don’t have a
number plate attached to me, but I have a driving licence and a photograph
on it that links it to me, the physical human being.
6.2.1 Identification and verification
Activity 6.11 (exploratory)
(a) Both my passport and my driving licence have a number. What is the role
of the number in each case?
(b) They both also include a photograph of me. Thinking about how driving
licences and passports are used, what is the role of the photograph in
each case?
Comment
(a) The number allows the document to be uniquely associated with me. That
number is stored and allows my driving licence or passport details to be
retrieved from the relevant system.
(b) The primary purpose of a driving licence is to prove that I am allowed to
drive. The document that is the driving licence says that the person
identified by the unique number is allowed to drive, and the photograph
proves that I am that person. If I am stopped by the police, they can look
at the photograph and match it to the person they see in front of them to
make sure they are the same. The photograph in my passport does the
6.2 Identity: biometrics
295
same thing: it allows anyone looking at the passport to know that it is
mine.
As the previous activity showed, by proving that a document such as a
driving licence or a passport is mine, a photograph allows me to do things –
drive or enter the UK – but it also allows other people to identify me. If the
police were to stop me for a driving offence (not that I would ever commit a
driving offence, of course!), they would ask who I was and ask to see my
driving licence to prove it.
It is useful at this point to distinguish between verification and identification.
If I hand my driving licence to the police and they compare the photograph
with the person they see in front of them, they are confirming that the
photograph is a picture of me. That is verification. If, knowing that a car
with a particular registration number (number plate) has been involved in an
offence, the police search the vehicle licence (DVLA) database for that
number, they are trying to identify a suspect vehicle. That is identification.
Activity 6.12 (self-assessment)
Suppose the police have the number of a driving licence and search the
DVLA system because they want to know who it belongs to. Is this
identification or verification?
Box 6.2 Terminology
You will find a variety of terminology used in this subject area – some
of it closely related. For example, you may have noticed that the
definitions I am using of authentication and verification are similar.
To see the distinction between the two, consider the use of a signature.
When a signature is used for authentication, that is done by a process of
verification: the person doing the checking verifies that the signature on
the document matches some reference signature. However, you may see
other texts that use these terms in slightly different ways, as there is not
a complete consensus as to their meanings.
Different terms may also be used slightly differently, depending on the
context. For example, the term ‘authentication’ is generally used in the
context of digital signatures, even though verification may be involved.
And I would refer to handing over my driving licence to the police as
simply ‘providing identification’, even though, as you have learned, the
licence provides for both identification and verification.
Part 6 The networked society
296
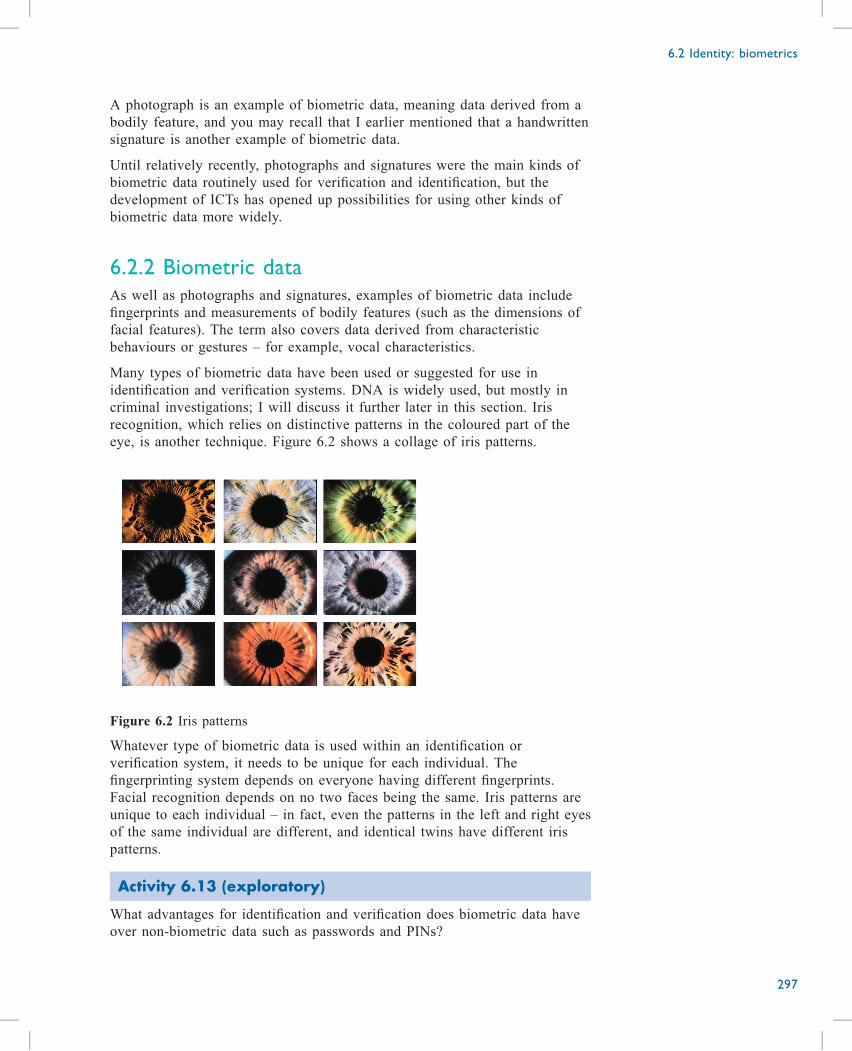
A photograph is an example of biometric data, meaning data derived from a
bodily feature, and you may recall that I earlier mentioned that a handwritten
signature is another example of biometric data.
Until relatively recently, photographs and signatures were the main kinds of
biometric data routinely used for verification and identification, but the
development of ICTs has opened up possibilities for using other kinds of
biometric data more widely.
6.2.2 Biometric dataAs well as photographs and signatures, examples of biometric data include
fingerprints and measurements of bodily features (such as the dimensions of
facial features). The term also covers data derived from characteristic
behaviours or gestures – for example, vocal characteristics.
Many types of biometric data have been used or suggested for use in
identification and verification systems. DNA is widely used, but mostly in
criminal investigations; I will discuss it further later in this section. Iris
recognition, which relies on distinctive patterns in the coloured part of the
eye, is another technique. Figure 6.2 shows a collage of iris patterns.
Figure 6.2 Iris patterns
Whatever type of biometric data is used within an identification or
verification system, it needs to be unique for each individual. The
fingerprinting system depends on everyone having different fingerprints.
Facial recognition depends on no two faces being the same. Iris patterns are
unique to each individual – in fact, even the patterns in the left and right eyes
of the same individual are different, and identical twins have different iris
patterns.
Activity 6.13 (exploratory)
What advantages for identification and verification does biometric data have
over non-biometric data such as passwords and PINs?
6.2 Identity: biometrics
297
CommentThree advantages occur to me. Everyone’s biometric data is unique, whereas
non-biometric data may not be (two people could choose the same password,
for example); biometric data is generally harder to steal than non-biometric
data; and biometric data does not need to be memorised.
Biometric data is not perfect, however. Even though the raw data (the
fingerprint, iris, DNA, etc.) is unique, the way in which it is stored and used
might make the data from two different people appear the same or very
similar. Also, biometric data is not immune to theft or forgery. There have
been cases of people making a cast of someone else’s finger and using it to
gain access to systems that use fingerprint recognition. Moreover, a
disadvantage of biometric data is the difficulty of restoring security once it
has been breached. For instance, once a user’s fingerprint has been copied, a
replacement fingerprint cannot be offered – whereas, by contrast, a
replacement password can easily be issued.
Comparing data
The use of biometric data for identification or verification involves the
comparison of one piece of data with other data. For instance, in criminal
investigations, fingerprints collected from the scene of a crime are checked
against records of fingerprints from known criminals. When I present my
passport to an immigration officer, that person checks the photo on my
passport against my face. If I am using an ePassport, my photo might not be
checked by a person, but there is still a comparison done by a computer to
check that my face matches the biometric data stored in the chip on my
passport.
For a system based on data comparison to work, there must be authoritative
samples of data from known individuals to compare with. The bank of
fingerprints held by the police is a collection of such data. Yet two specimens
of data from the same person are hardly ever identical – for instance, the
signature I write on a cheque is not identical to the one on my cheque card.
Whether or not my cheque card confirms the signature on my cheque is a
matter of judgement.
In the following discussion, I would like you to keep in mind these two
essential components of identification and verification systems:
. data known to be associated uniquely with a particular individual
(authentic data) is required for comparison
. reliable methods are required for comparing pieces of data and deciding
whether they are from the same person.
Digital biometric data
Converting biometric data to digital form results in digital biometric data.
Digital biometric data is increasingly incorporated into passports, driving
licences and other identity documents, stored as digital data on a chip
Part 6 The networked society
298
embedded in the document. In fact, references to ‘biometric data’ often
actually mean digital biometric data, rather than photographs and signatures.
With biometric data in digital form, comparison of data becomes a
mathematical operation that can be computerised, rather than requiring human
involvement. This is a distinct change from older methods of identification
and verification, which depended on a good deal of human inspection (for
instance, visual inspection of fingerprints). I can illustrate this with a highly
simplified example.
Suppose a piece of biometric data consists of a person’s numerical scores on
three different criteria (for example, in a very simple facial recognition
system, these might represent eye separation, eye size and eye colour). One
person’s data might consist of the binary equivalent of the three numbers 24,
7 and 125, where each number represents the value of a different physical
property. Another person’s data might be 26, 6 and 122. Each number in the
second set of data is close to the corresponding number in the first set. A
computer could calculate how close this second set of data is to the first by
comparing each of the three number pairs in turn. A preset threshold can be
applied such that if the two sets of data are closer than the threshold, they are
judged to be a match, whereas if they are not closer than the threshold, then
they are not a match. Note that although the comparison can be computerised,
the threshold itself is set by a human.
6.2.3 Biometric documentsYou saw in the previous subsection that digital biometric data can be stored
on a chip embedded in a document. This is what is done with biometric
passports and identity (ID) cards.
Biometric passports and ID cards
All UK passports now being issued contain biometric data stored
electronically on a chip embedded inside the passport cover. They are
referred to as ‘biometric passports’, though of course older passports did have
a photograph – so again, ‘biometric’ here specifically means digital biometric
data. Figure 6.3 is picture of the original style of UK biometric passport in
which the chip could be seen on the back page. The biometric passports
issued now still contain the chip, but it is not visible. (They still have the
symbol on the front, to show they are biometric passports.)
6.2 Identity: biometrics
299
(a) (b)
Figure 6.3 Old-style British biometric passport. (a) The front cover, with the
chip symbol at the bottom. (b) The chip holding the digital biometric data can be
seen embedded in the back page.
Some countries also have national ID cards that include (digital) biometric
data. The UK does not have a history of using national ID cards of any sort,
except for the duration of the Second World War and for a short while after.
(They were introduced in 1939 and abolished in 1952.) More recently, the
government started to introduce a scheme for biometric ID cards before the
general election in 2010. Following the change of government at the 2010
election, the scheme was significantly curtailed, leaving only a card for
certain categories of foreign nationals which is now (2017) known as the
‘biometric residence permit’ (BRP). The details of who needs a BRP have
changed over time and may change again; at the time of writing, in general
terms, a BRP is needed by anyone from outside the European Economic Area
who is in the UK for longer than 6 months.
Biometric passports and ID cards are relatively recent developments and have
only become feasible because of advances in digital technologies. There are a
number of aspects to this.
. Technology needs to be available that can store the data in the document
in a way that is robust and secure. That’s the chip that is embedded in the
document.
. There also needs to be some way of getting the data and putting it on the
chip. For example, a digital camera photographs the subject’s face or
finger (for a fingerprint), a computer processes the image and converts it
to the format in which it is to be stored, and then the data is loaded into
the chip.
. In addition, there needs to be some way of ‘reading’ the chip when the
document is being used.
Part 6 The networked society
300
. Finally, there needs to be some way of comparing the data that is read
from the document with sample data from the holder of the document.
Use of biometric documents
When I first got a biometric passport, I expected to have to provide
something extra to the passport office. I thought I would have to get my
fingerprints scanned or my irises photographed, for example. I was somewhat
surprised to find that this wasn’t necessary, and that they took all the data
they needed from the photograph I sent them. At first I wondered what the
point was, if the data was simply derived from the photograph. The point,
however, is that the digitised biometric photograph data allows checking of
the biometric data to be done automatically, and this makes it easier to use.
Instead of someone looking at my face and at the photograph to judge
whether they are the same person, a computer can make comparisons between
biometric data derived from a camera pointed at my face and the biometric
data held in the chip on the passport. This can be done quickly and without
human intervention. In fact, it can be even easier than that, for, once the
authorities have my biometric data, there may be no need to check my
passport at all. My biometric data can be taken from the security camera and
checked directly against data held in a database. At the time of writing, a
system without passports has recently been proposed for airport arrivals by
the Australian government (Dent, 2017).
6.2.4 Without documentsI have a security pass to let me enter the building where I work. On occasion,
I have forgotten to bring it with me, but if I can find someone who knows
me, then they will let me in. The point is that it’s not the document in itself
that gives me the right to enter the building. The document merely serves to
prove that I am someone who is permitted to enter. Someone recognising me
and knowing that I’m allowed in can serve just as well.
This particular alternative to the use of a document requires human
intervention – someone who recognises me. However, if the technology of
the security system held biometric information about me, and had the facility
to read corresponding biometric measurements from a person, then there
would be no need for the security pass.
A system based on this idea – identifying and verifying people directly from
their biometric data without a biometric document – is in use in some schools
in the UK. It is known as VeriCool.
6.2 Identity: biometrics
301
Activity 6.14 (exploratory)
On the module website you can watch Video 6.1. This is an extract taken
from a television news programme, which provides an introduction to the
VeriCool system.
In summary, the VeriCool system has a database of students, and in that
database is held a record of each student’s fingerprint together with a
photograph of their face. When using the system, either to pay for lunch or to
register arrival in class, the student has their finger scanned and the system
checks for a match in the database. If a match is found, the computer
displays the photograph for the operator to see. (So this system does still
need a human operator.) Instead of the fingerprint scan, the system can also
allow students a non-biometric alternative, which may be a PIN or an access
card, depending on the particular system in use.
If the student is using an access card, the photograph is important to prevent
the use of a stolen card. Similarly, for the use of a PIN, in case a student gets
to know another student’s number. There is less need for the photograph in
the case of the fingerprint, but it does confirm that there hasn’t been a
mistake in the system.
Something you are, something you have and something youknow
The three different methods of identification in the VeriCool system –
fingerprint, access card or PIN – are examples the three broad categories for
the means of identification: something you are (fingerprint), something you
have (access card) and something you know (PIN). Often, for greater
security, systems require items from two different categories, as in ‘chip
(something you have) and PIN (something you know)’ bank cards. By the
operator checking the photograph in the VeriCool system, that too uses two
means of identification, although in the case of the fingerprint they are both
in the same category (‘something you are’).
6.2.5 DNA informationDNA is potentially an excellent source for biometrics, since every person’s
DNA is different (apart from identical twins, who have identical DNA). In
principle, it would be possible to keep a record of the DNA sequence (the
genome) of every individual on the planet. (See Box 6.3 for more information
about DNA and the terminology associated with it.) Not only would this be a
unique identifier to use in cataloguing the world’s population, but the DNA
itself contains information about the individual. Ignoring any practical and
ethical issues for the moment, this has lots of attractions from the perspective
of the state.
Part 6 The networked society
302
Box 6.3 Genes, DNA, the genome and genotypes
Genes contain the information (instructions) required to build a life
form. (Here, we are interested in human genes, so think of this as the
information required to build a person.) DNA (which is short for
deoxyribonucleic acid, but you don’t need to know that!) is the chemical
from which genes are made. One gene is one individual instruction,
something like ‘use a blue pigment in the eye, rather than a green
pigment’, although the system of genetics is very complex and it is
misleading to think of individual genes in isolation.
The genome is the complete set of genes for any one individual.
Different genotypes are different variations in the genome, so in one
genotype the instruction might be to grow blue eyes, while in another
genotype the equivalent instruction might be to grow green eyes.
A difficulty with using DNA as biometric data is that it’s not yet possible to
access DNA information in a simple way. No quick method – equivalent to
fingerprint or iris scanning, for example – yet exists for reading a person’s
DNA, so DNA can’t be used for identification or verification in quite the
same way as these other biometrics. Nevertheless, there are techniques for
getting measurements from a person’s DNA, and these can be used for things
such as DNA forensics, tracing ancestry and health screening.
No country in the world has a complete database of the DNA of its entire
population, but there is a private company in Iceland, deCODE, that has
access to the DNA of a large fraction of the Icelandic population. The
company maintains a database of health and other information on the people
of Iceland, which is particularly interesting and valuable for a number of
reasons.
Activity 6.15 (exploratory)
This activity on the module website asks you to read some more about
deCODE. You should do that now or when you are next at your computer
and online.
For the reasons you saw Activity 6.15, deCODE has been able to look for
correlation between diseases and genotypes, and thereby identify specific
genes implicated in specific diseases. For example, using the database and
DNA samples, deCODE researchers took only 10 weeks to find a gene for a
disorder called familial essential tremor, and have identified a genetic
mutation that protects against Alzheimer’s disease.
6.2 Identity: biometrics
303
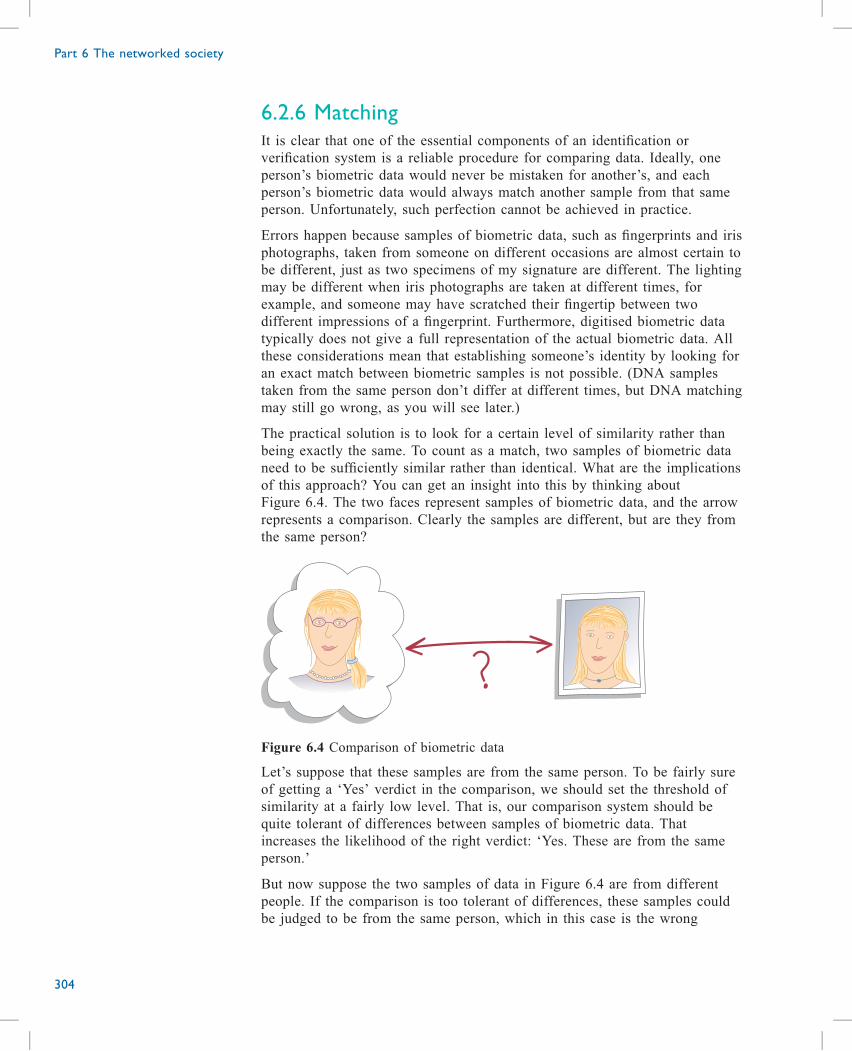
6.2.6 MatchingIt is clear that one of the essential components of an identification or
verification system is a reliable procedure for comparing data. Ideally, one
person’s biometric data would never be mistaken for another’s, and each
person’s biometric data would always match another sample from that same
person. Unfortunately, such perfection cannot be achieved in practice.
Errors happen because samples of biometric data, such as fingerprints and iris
photographs, taken from someone on different occasions are almost certain to
be different, just as two specimens of my signature are different. The lighting
may be different when iris photographs are taken at different times, for
example, and someone may have scratched their fingertip between two
different impressions of a fingerprint. Furthermore, digitised biometric data
typically does not give a full representation of the actual biometric data. All
these considerations mean that establishing someone’s identity by looking for
an exact match between biometric samples is not possible. (DNA samples
taken from the same person don’t differ at different times, but DNA matching
may still go wrong, as you will see later.)
The practical solution is to look for a certain level of similarity rather than
being exactly the same. To count as a match, two samples of biometric data
need to be sufficiently similar rather than identical. What are the implications
of this approach? You can get an insight into this by thinking about
Figure 6.4. The two faces represent samples of biometric data, and the arrow
represents a comparison. Clearly the samples are different, but are they from
the same person?
Figure 6.4 Comparison of biometric data
Let’s suppose that these samples are from the same person. To be fairly sure
of getting a ‘Yes’ verdict in the comparison, we should set the threshold of
similarity at a fairly low level. That is, our comparison system should be
quite tolerant of differences between samples of biometric data. That
increases the likelihood of the right verdict: ‘Yes. These are from the same
person.’
But now suppose the two samples of data in Figure 6.4 are from different
people. If the comparison is too tolerant of differences, these samples could
be judged to be from the same person, which in this case is the wrong
Part 6 The networked society
304
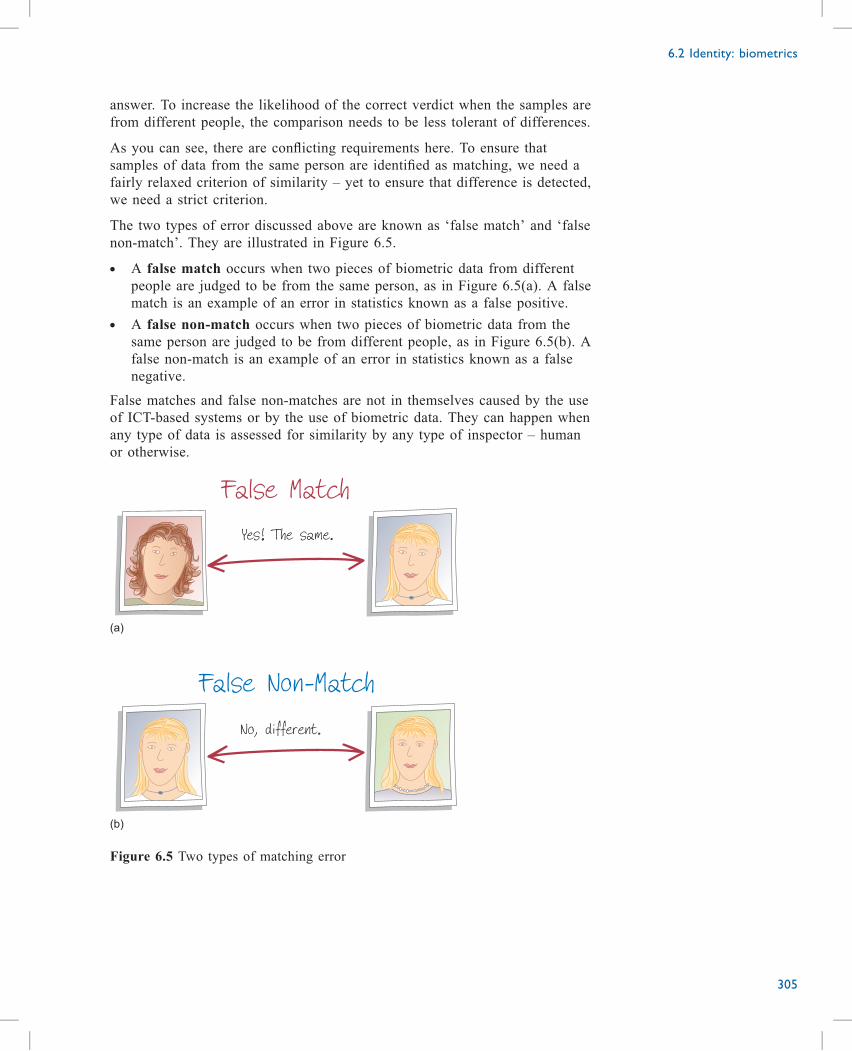
answer. To increase the likelihood of the correct verdict when the samples are
from different people, the comparison needs to be less tolerant of differences.
As you can see, there are conflicting requirements here. To ensure that
samples of data from the same person are identified as matching, we need a
fairly relaxed criterion of similarity – yet to ensure that difference is detected,
we need a strict criterion.
The two types of error discussed above are known as ‘false match’ and ‘false
non-match’. They are illustrated in Figure 6.5.
. A false match occurs when two pieces of biometric data from different
people are judged to be from the same person, as in Figure 6.5(a). A false
match is an example of an error in statistics known as a false positive.
. A false non-match occurs when two pieces of biometric data from the
same person are judged to be from different people, as in Figure 6.5(b). A
false non-match is an example of an error in statistics known as a false
negative.
False matches and false non-matches are not in themselves caused by the use
of ICT-based systems or by the use of biometric data. They can happen when
any type of data is assessed for similarity by any type of inspector – human
or otherwise.
No, different.
Yes! The same.
False Match
False Non-Match
(b)
(a)
Figure 6.5 Two types of matching error
6.2 Identity: biometrics
305
Activity 6.16 (self-assessment)
(a) Which type of error is increased by relaxing the matching criterion, and
why?
(b) Which type of error is increased by making the matching criterion
stricter, and why?
False match rate
The performance of a biometric system is gauged by various statistics,
including the false match rate and the false non-match rate. To keep things
simple, we will consider here only the false match rate.
A false match rate is expressed as a statistic such as ‘1 in 1000’. To say that
a system has a false match rate of 1 in 1000 means that if a sample of
biometric data is compared with random selections of other data, then a false
match occurs, on average, once every 1000 comparisons. False match rates
vary widely between different biometric systems. The following figures are
taken from Mansfield and Rejman-Greene (2003).
. Using good-quality fingerprints, a false match rate for single prints can be
around 1 in 100 000. This rate can be improved by using more than one
finger. Low-quality prints give worse rates.
. Face recognition gives a false match rate of around 1 in 1000.
. Single-eye iris recognition gives a false match rate of 1 in 1000 000.
Using two eyes improves the rate considerably.
These rates do not allow you to predict exactly how many false matches there
will be in any single small-scale test. For instance, when tried on a group of
10 or 100 people, a system with a false match rate of 1 in 1000 might or
might not produce false matches. The outcome is unpredictable. However,
with a large group, the result becomes more predictable. For instance, when
tried on a group of 1000 000 people, a system with a false match rate of 1 in
1000 will produce about (but probably not exactly) 1000 false matches.
Activity 6.17 (self-assessment)
The false match rate of a particular biometric system is 1 in 100. A sample
of data is compared against 1000 000 other randomly chosen pieces of data.
Approximately how many false matches can we expect?
The lesson to draw from the previous activity is that if the number of
comparisons is sufficiently large, then a lot of false matches can result, even
if the false match rate appears to be quite low. This needs to be borne in
mind when thinking about identification systems for a whole population.
Part 6 The networked society
306
Getting it wrong
A real-world example of the dangers of false matches occurred during the
investigation into the 2004 Madrid train bombing. A strong match was found
in a computer search against a print found at the site of the bombing, and
experts claimed with “absolute confidence” the match was correct. It
belonged to a lawyer in the US state of Oregon, who was arrested on the
basis of the match. However, the real culprit was later caught and the Oregon
lawyer was exonerated. The mistake came about because the database search
contained 500 million fingerprints, so even with a very low false match rate,
the chances of getting at least one false match among so many was quite
high.
Activity 6.18 (self-assessment)
Based on the information above, what appears to have been the false match
rate in this case?
This is a very low false match rate – much lower than the 1 in 100 000 that I
quoted for single fingerprint matching earlier. It may be that the investigators
had the prints from more than one finger, or perhaps there is more to the
story that we don’t know about. The point to note, though, is that there was a
false match.
Notice that a comparison against 500 million prints was possible only
because of the digital technology – so the technology in this case led to a
potential false conviction. Fortunately the man wrongly identified in the
Madrid bombing was cleared, but only after he had been arrested and
detained for more than two weeks.
DNA forensics
As you are probably aware from news reports or crime dramas on television,
DNA can also be used in criminal investigations. A very simplified
description of the procedure using DNA is as follows.
. Some tissue (hair, skin) or bodily fluids (blood, semen, saliva) are found
at the scene of a crime and analysed to identify the genetic fingerprint of
the supposed criminal.
. This is compared with the genetic fingerprint of possible suspects, and if a
match is found, then the guilty individual has been identified.
The way that this process is presented on TV, it frequently seems that the
only problem is making sure you have the genetic fingerprint of the suspect
available for comparison purposes. If you have that, DNA evidence is
foolproof. Unfortunately, however, the reality is not quite so simple.
For one thing, how do you know for certain that the sample you have taken
from the crime scene really is from the guilty party? And even if the sample
taken from the scene of the crime is from the guilty party, contamination
6.2 Identity: biometrics
307
between collection and analysis is possible unless very strict procedures are
maintained.
Assume, however, that you do have the right sample and that it hasn’t been
contaminated. Are you home and dry? The problem is that you are not; there
still remains the possibility of false matches and false non-matches.
While it is true that if you were comparing the complete genome of the
suspect against the complete genome of the known culprit, then there would
be no room for false results, this scenario is far from being likely. The human
genome is far too big and complex to work with in its entirety, so a ‘genetic
fingerprint’ is just a sample of key features that can be used for comparisons.
There isn’t space to explore this topic any further here, but you should come
away from this brief discussion with an appreciation that DNA evidence is
not an ‘exact science’. Results from DNA evidence need to be qualified
according to probabilities and assessed accordingly. It is unfortunate that not
all juries in criminal cases have appreciated these limitations. The ‘glamour’
of DNA evidence – the apparent scientific certainty – has led to undue weight
being given to it.
6.2.7 ConclusionFingerprints, irises and facial dimensions are examples of biological features
that are used by biometrics for identification and/or verification. The features
are scanned and represented digitally, then stored on computers or in the
memory of chips in passports and identity cards. The biometrics are used by
comparing the stored data with the data accessed at the point of use, such as
in the VeriCool system, where the student’s fingerprint is scanned and
compared with the stored fingerprint data. Comparisons are never perfect,
however, and the possibility of mistakes – false matches or false non-matches
– need to be considered. DNA is also a biometric, but it cannot be scanned in
the same way as fingerprints, irises and facial dimensions, so is not used for
the same purposes.
The next section also has a biological context as it looks at networked health:
how digital technologies and networks can help us stay healthy or access
medical help when we need it.
Part 6 The networked society
308
6.3 Networked health
At first sight, you might consider that health is a private affair, and hardly
something that would be changed by living in a networked society. However,
if you think about how you look after your health, you will realise that it
involves a lot of information exchange. You need access to information about
how to keep yourself healthy, about the recognition of symptoms if you are
unwell, and about what to do about it if you are unwell. Then, if a nurse or
doctor is to diagnose your illness or check your state of health, they need
access to information about you.
In this section, we will be looking at both these aspects of networking your
health: how ICTs help you access health information and how ICTs can help
medical professional to monitor your health.
6.3.1 Sources of health informationGiven the importance of health, it is not surprising that health information is
available via lots of different channels. In the past, it would have been
common for people to consult books about health, and that remains true
today. However, as new communication channels have become available, they
too have increasingly been used to deliver health information.
Broadcast radio and TV
The term ‘to broadcast’ means to send the same message to all users on a
network, so broadcasting is a good way of getting information to a lot of
people at the same time. Print media can be used for a type of ‘broadcasting’,
and certainly books and magazines are one means of distributing health
information, but broadcasting more usually refers to radio and TV.
In the UK, health-related topics are frequently covered in magazine-type TV
programmes such as the BBC’s The One Show. (A magazine programme is
one that covers a range of general-interest topics.) There are also dedicated
series with a focus on health, such as Channel 4’s Embarrassing Bodies. In
addition, most radio stations have news reports on health items from time to
time, some bringing good news (such as breakthroughs in treatments) and
others bad (such as the increasing ‘obesity epidemic’ in some developed
countries).
Radio is particularly important in some developing countries, and especially
in rural areas where fewer people have access to TV or the internet.
Telephone
As with TV and radio, in the UK and similar developed countries most
people have access to a telephone, but this is not true everywhere in the
world. The telephone can be used to talk to friends and relations who might
have medical advice, or to medical professionals such as doctors and nurses.
6.3 Networked health
309
In the latter case, the medical professions may be individuals who know your
personal case or might be at some centralised resource, such as, in England,
the non-emergency National Health Service (NHS) medical advice service
known as ‘NHS 111’
Most of the use of a telephone is for personalised, one-to-one communication
rather than broadcast, although there are also some recorded health lines used
to get a common message out to a wide number of people.
On the web
A simple search of the web can turn up vast amounts of health advice, but
knowing whether it may be trusted is clearly very important for medical
information. Information from organisations that you already know and trust
is fine, but a lot of information might come from organisations you have
never heard of or that you do know but are not entirely trustworthy .
(Wikipedia would come under that category.) With unknown sources, you
might be able to find out more about them from further searches on the web.
Even information from unknown or unreliable sources may raise questions
that you can then explore further from reliable sources.
In the UK, there is a lot of information available online from the NHS.
NHS online services
The NHS provides websites for things like:
. health information – to help you diagnose simple ailments and decide
whether your symptoms indicate something serious, so that you know
whether you should seek further help
. locations of doctors’ surgeries, hospitals, dentists, etc.
. booking medical appointments when you have been referred to hospitals.
Activity 6.19 (exploratory)
This activity on the module website shows you some NHS websites. You
should do this now or when you are next at your computer and online.
6.3.2 Electronic triageWhen you go to a hospital or other medical establishment because you have
some problem that you think needs attention, the first thing that usually
happens is that you are assessed to determine in broad terms what your
problem is and how serious it might be. This allows the establishment to
determine how urgently you need attention – to prioritise patients if there is
more than one waiting – and to decide who should deal with you or where
you should be sent in the first instance. This process is known as triage.
Part 6 The networked society
310

Systems have been developed that triage electronically. You, the patient,
answer a series of questions on a computer screen (either on your own device
or a device at the medical establishment), and a computer system makes an
assessment of your needs and reports back to you and/or the medical
establishment. The computer’s triage can be very simple, doing little more
than transferring the answers to an administrator, or can be much more
sophisticated, analysing the answers and combining that with information
about you stored on electronic health records. Advanced systems use the
techniques of artificial intelligence (AI) in order to replicate (and even,
ideally, improve upon) the judgements of a medical expert.
An application of electronic triage is in the systems for booking appointments
at General Practitioners (GP, the surgery of family doctors in the UK). In the
traditional procedure at a GP, patients book an appointment, usually over the
telephone, with a receptionist. It is the receptionist who does the basic triage.
An idea that has been gaining increasing interest is for patients to book
appointments online, and systems are now available that incorporate
electronic triage into the online booking process.
One system used by some GP practices in the UK is the eConsult system.
Figure 6.6 shows the website of a practice using eConsult (http://
docklandsmedicalcentre.com).
Figure 6.6 Website of a GP practice using eConsult
Some of the advice on the website is available to anyone (and to some extent
duplicates advice available via the national NHS websites), but the triage
6.3 Networked health
311
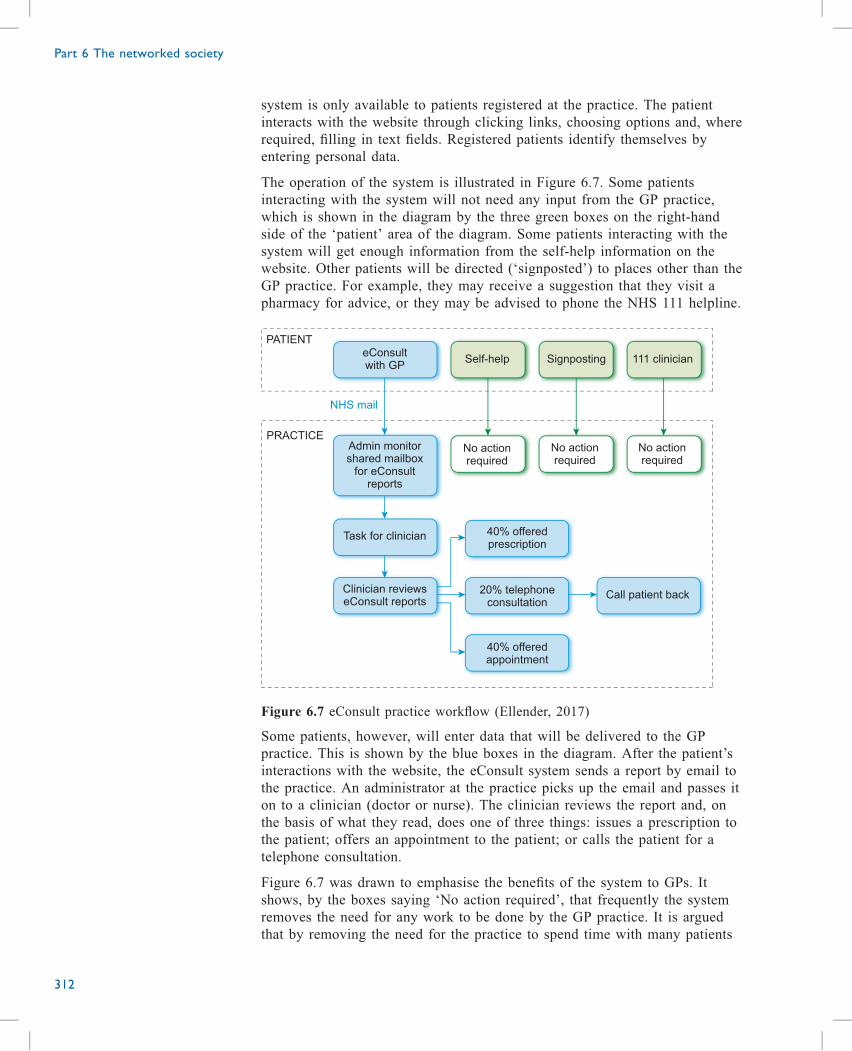
system is only available to patients registered at the practice. The patient
interacts with the website through clicking links, choosing options and, where
required, filling in text fields. Registered patients identify themselves by
entering personal data.
The operation of the system is illustrated in Figure 6.7. Some patients
interacting with the system will not need any input from the GP practice,
which is shown in the diagram by the three green boxes on the right-hand
side of the ‘patient’ area of the diagram. Some patients interacting with the
system will get enough information from the self-help information on the
website. Other patients will be directed (‘signposted’) to places other than the
GP practice. For example, they may receive a suggestion that they visit a
pharmacy for advice, or they may be advised to phone the NHS 111 helpline.
eConsultwith GP
Self-help Signposting
PATIENT
PRACTICE
111 clinician
Admin monitorshared mailbox
for eConsultreports
Task for clinician
NHS mail
40% offeredprescription
40% offeredappointment
Clinician reviewseConsult reports
20% telephoneconsultation
Call patient back
No actionrequired
No actionrequired
No actionrequired
Figure 6.7 eConsult practice workflow (Ellender, 2017)
Some patients, however, will enter data that will be delivered to the GP
practice. This is shown by the blue boxes in the diagram. After the patient’s
interactions with the website, the eConsult system sends a report by email to
the practice. An administrator at the practice picks up the email and passes it
on to a clinician (doctor or nurse). The clinician reviews the report and, on
the basis of what they read, does one of three things: issues a prescription to
the patient; offers an appointment to the patient; or calls the patient for a
telephone consultation.
Figure 6.7 was drawn to emphasise the benefits of the system to GPs. It
shows, by the boxes saying ‘No action required’, that frequently the system
removes the need for any work to be done by the GP practice. It is argued
that by removing the need for the practice to spend time with many patients
Part 6 The networked society
312
(up to 60% of patients using the system, it is claimed), it allows them to
spend more time with the patients that need more attention.
At the time of writing, there are huge pressures on the NHS, and anything
that can make it run more efficiently would be very valuable. On the other
hand, it is easy to think of risks in a system using electronic triage. A few of
the possible merits and risks are as follows.
Merits:
. Removes the need for the doctor to spend time with patients
unnecessarily. This either frees the doctor to spend longer with other
patients or saves money
. Unlike a GP reception, the system is available at any time of the day or
night. This means patients can get some advice at any time, and can enter
the information and request an appointment at any time.
. The practice can prioritise appointments by looking at several eConsult
reports at the same time and deciding which patients need to be seen
more urgently.
. Some people are known to find it easier to enter personal health
information to a website than to talk to doctor.
Risks:
. Some people do not have access the internet or cannot use the technology.
These people can still phone or visit the practice, and it is argued that by
reducing workload, the practice will have more time for these people.
However, there may be risks that patients not using the system could have
their needs neglected.
. The number of face-to-face consultations will reduce, losing some of the
merits of the GP seeing the patient, such as:
◦ a GP might spot something at a face-to-face consultation that the
patient might not be aware of
◦ it is known that patients sometimes mention something as ‘an
aside’ at a consultation, which may be important
◦ meeting face-to-face helps to develop a long-term relationship
between the patient and the GP.
Activity 6.20 (exploratory)
You may have thought of other merits and/or risks, and you are encouraged
to discuss them on the module forum. If you haven’t thought of anything
else, you should look at the module forum to see what other people are
saying. There is also a poll on the module website to survey your opinion on
the merits of electronic triage.
6.3 Networked health
313
6.3.3 Health recordsAnyone caring for the health of someone else needs access to information
about the person in their care. I am thinking here of health professionals –
doctor, nurse, dentist, etc. – although it would be true even if the carer was a
friend or relation.
Activity 6.21 (exploratory)
Jot down a few things that would typically be on a patient’s health records,
as held by a GP.
CommentI immediately thought of date of birth, any known allergies and health history
(illnesses that the patient has had in the past). I also thought that my GP
would hold details of my blood group, but in fact it seems that they would
not necessarily have that information.
In the past, a doctor’s surgery would have held this kind of information in a
paper file, but today this is invariably replaced by an electronic health
record (EHR). Historically, systems for handling electronic health records
developed piecemeal, with different GP practices, hospitals or health
authorities installing their own systems. There are many circumstances in
which it would be beneficial to share health records between different
locations, but because of the different systems this has often not been
possible.
There have been attempts to change this, and in 2002 the UK government
launched, with some fanfare, a major programme known as The National
Programme for IT (NPfIT) that was to reform the way the NHS in England
used information. In the words of a later report by the National Audit Office
(NAO):
In the past, individual NHS organisations procuring and maintaining their
own IT systems and the procurement and development of IT within the
NHS has been haphazard. The Department [of Health] did not consider this
approach to have been successful, and one of the aims of the Programme
has been to provide strong central direction of IT development, and increase
the rate of take up of advanced IT.
(NAO, 2006)
(The NAO ‘scrutinises public spending on behalf of Parliament’ in the UK.
NAO reports can be downloaded free from www.nao.org.uk and can provide
valuable insight into many aspects of state activities in the UK.)
Unfortunately, there were many difficulties with the development of the
NPfIT, and it was severely curtailed in 2010. The plans for centralising the
procurement and development of IT were reduced, but the idea for a Care
Records Service to “make relevant parts of a patient’s clinical record
available to whoever needs it to care for the patient” (NAO, 2006, p. 1)
Part 6 The networked society
314
continued in the form of the Summary Care Records (SCR). There is an
SCR for every person in the UK registered with the NHS (unless they have
chosen to opt out – see below), and this record is accessible to every
healthcare worker in the country.
From the perspective of the state, a national care records system looks very
attractive. I said at the beginning of this section that anyone caring for the
health of someone else needs access to information about the person in their
care, so there is a straightforward argument that a national care records
service that supplies this information can only be a good thing. Despite this,
there have been significant concerns expressed about the use of Summary
Care Records.
Activity 6.22 (exploratory)
Do you have any concerns about having a Summary Care Record, or can you
think why other people might have reservations about this service?
CommentThe concerns I thought of first are to do with privacy. Most people feel that
information about their health is private, and only want it revealed to people
who need to know, like their GP or medical staff in a hospital when they are
receiving treatment.
You might have had other concerns, such as about ensuring that the
information is accurate, or about security – is there any risk the system could
be hacked and my record accessed illegally?
To address privacy concerns, anyone can choose to opt out of having an
SCR. In addition, the Care Records Service only makes personal information
available to certain people – healthcare workers, for example – and even
then, a healthcare worker is required to get the patient’s permission to view
this information unless it is an emergency situation. In an emergency where it
is not possible to get permission (if the patient is unconscious, for example),
the guidelines say that healthcare workers should afterwards tell the patient
that they have used the information. Even so, there are concerns that having
the information on a national database means that it could potentially be
accessed by other people.
Activity 6.23 (exploratory)
This activity on the module website asks you to explore how ICT is used in
the NHS today. You should do this activity now, or when you are next at
your computer and online.
6.3 Networked health
315
6.3.4 Health monitoringOne aspect of keeping healthy is monitoring bodily processes. A simple
example is body temperature. We know that if the temperature of a human
body departs from a relatively small range (around 36–37 °C) then this might
indicate a problem. A standard medical health check therefore often includes
using a thermometer to check someone’s temperature. This has, until now,
required someone to be present with the patient in order to take the
measurement, but with a networked society maybe body temperature can be
monitored remotely.
Activity 6.24 (exploratory)
Blaine Price is a Professor of Computing at The Open University who has for
many years been researching the use of ICTs in medicine. In an interview
recorded for TM111, Blaine talks about the role that network technology can
take in healthcare, and describes some of the work that he has done.
Listen to this interview, available on the module website, now or when you
are next online.
After listening to this interview, write answers to the following questions.
(a) Give two reasons why you might want to share data gathered by a device
tracking your heart rate and two reasons why you might not want to
share it.
(b) Why did Blaine warn people about the risks from the systems of
electronic health records being put in place by the NHS?
Comment
(a) Two of the benefits of sharing the data are:
◦ to allow a health professional to analyse the data
◦ to help the user maintain, for example, an exercise regime.
Two risks are that:
◦ an insurance company might access it and use it to increase your
premiums or refuse to insure you
◦ you might accidentally release data of use to a criminal (such as
information about times when you are not at home).
(b) Blaine is concerned about the privacy of data in the Summary Care
Records. In particular, he is concerned about the absence of an audit
record from the SCR. The original intention was that a record of anyone
accessing the SCR would be kept with the SCR, and that the patient
should be able to access this information. This would have allowed a
patient to know who has been reading their SCR, but the audit record has
not been included in the final implementation,
Part 6 The networked society
316
6.3.5 ConclusionIt is very easy to access health information in the networked society, for
anyone with good internet access. Searching the internet returns a lot of
information on many different health topics. Knowing whether information
can be trusted is vital, and using the websites of known trusted sources is the
best way to be confident that the information is reliable.
In the UK, the NHS is a reliable source which provides information online.
As well as advice on specific health topics, the NHS websites provide
information on how and where to access health services, such as local doctors
and hospitals. It is also the case that for the NHS, as for other government
services discussed in Section 6.1, digital technologies may provide a way to
reduce costs through initiatives like electronic triage. Another emerging
aspect of digital health is personal heath monitoring, which delivers the most
benefits when networked to deliver information to medical professionals.
So far in this part, and for most of the module, we have focused on the
positive aspects of digital technologies: on what digital networked
technologies make possible. Next, in the final section of the part, we take a
more critical perspective and consider aspects of winners and losers in the
networked society. Note that we are not using the word ‘critical’ in the
everyday sense of ‘finding fault’ here. Rather, it is the process of examining
the pros and cons of something, rather than accepting it at face value. Taking
a critical perspective, in this sense, is an important academic skill.
6.3 Networked health
317
6.4 Placeless power and powerless places
The title of this section is from the work of Professor Manuel Castells.
Castells is a sociologist who has an almost cult following for his writing on
communications technology, the internet and society and what he referred to
as ‘The Network Society’. His interest focuses on globalisation and the
changing nature of political, economic and social power within society. He
has written a number of books which, while being rigorous academic works,
have nevertheless gained a very wide readership beyond the academic
community.
The phrase ‘placeless power and powerless places’ draws attention to
changing power relations in society. ‘Placeless power’ is the power that
resides in networks of people and organisations which might be difficult to
associate with any one geographic location – think, for example, of
transnational corporations with activities spread all over the world.
‘Powerless places’ are the places that have lost power due to the rise of
‘placeless power’ – such as states which are increasingly beholden to
transnational corporations.
In this section, we look at two very different contexts and ask who is
benefiting from placeless power and who remains in a powerless place. The
content of this section is based on two audio interviews which you can listen
to on the module website.
The aim of this section is not to teach you lots of facts – you will not be
expected to remember all the detailed content – but is instead intended to
encourage you to think critically of the role of technologies in a networked
society.
Interview with Dr Becky FaithBecky was awarded a PhD by The Open University in 2016. Her PhD thesis,
‘How does the use of mobile phones by 16 –24 year old socially excluded
women affect their capabilities?’ was based on interviews with young women
in Brighton.
Interview with Anna ChildsAnna was, until 2017, the Deputy Director (Academic) of the International
Development Office at The Open University. As you will hear in the
interview, Anna has had a long-term relationship with Nepal, and has
extensive experience of how ICT has been used by the people and institutions
of the country.
Part 6 The networked society
318
Activity 6.25 (exploratory)
In this activity, you will need to listen to the two interviews on the module
website. You should listen to them now, or when you are next at your
computer and online.
While listening to the interviews, bear in mind the following questions, and
then write down your answers.
(a) Among the people discussed in the interviews, which, if any, have been
empowered by access to network technology (smartphones and the
internet)? Which, if any, have suffered as a result of the emergence of
network technologies?
(b) Compare your experiences with network technologies with those of
people described in the interviews. What similarities and differences are
there, in terms of how they help or hinder your opportunities in life?
You may like to discuss your answers on the module forums.
CommentMy answers are as follows, but these questions do not have single right
answers. Your answers could be quite different from mine and still be valid.
(a) The people in the villages in Nepal that had got internet access were
empowered. Anna talked about how they were taking the initiative, both
in getting the access installed and then making use of it for things like
buying and selling locally (the so-called ‘goat eBay’) and tourism.
Becky said that one of the support workers at the drop-in centre in
Brighton was very enthusiastic about the opportunities that the
smartphones gave to the young women, connecting them to opportunities
and possibilities outside their environment, but this seemed like a
minority view. A couple of other support workers were very negative
about the impact of the phones on the women. I got the impression
overall from what Becky said that the technology was an extra
complication in the lives of people who were disadvantaged to start with,
and it didn’t empower them or oppress them any more than they would
have been anyway.
(b) Although I make very extensive use of network technologies, I don’t
know if the technologies significantly change my empowerment. There
certainly are things I can do now that I couldn’t do before the
development of network technologies (which I am old enough to
remember!). But, picking up on the phrase Becky used when talking
about capabilities, I don’t think network technologies allow me to live a
life I value more now than I was able to do before, so in that sense my
experience is similar to that of the women in Brighton. Which is not to
say that I am disadvantaged in the way that the women in Brighton were,
but the network technologies have not changed that. By contrast, from
what Anna was saying, it seemed that some of the villagers in Nepal
6.4 Placeless power and powerless places
319
have experienced significantly enhanced capabilities as a result of the
arrival of the internet.
6.4.1 ConclusionIn this section, you were encouraged to think critically about the lives of
people in a networked society, with examples from two very different
contexts: socially excluded young women in Brighton and the remote villages
of Nepal. There are a lot of issues that arise in the interviews with Anna and
Becky, but there is not enough room in this part to explore them all here.
You are encouraged to think about the issues for yourself, and maybe discuss
them in the module forums.
Part 6 The networked society
320
6.5 Summary
In this final part of TM111, you looked at ways in which society has been
changing as a result of the development of information and communication
technologies. The main fields explored were the relationship between the
state and the citizen, and the citizen’s health. As part of the study, you looked
at some specific technological challenges associated with living in a
networked society, such how you prove your identity electronically, and you
have been asked to think critically about the relationship between people,
technology and society
After studying this part, you should:
. be familiar with the services provided by the state that can delivered
online, and understand some of the problems with moving services online
. know the sort of public data that is held by the UK government and know
how to access it
. be familiar with the claims for ‘digital democracy’
. recognise technological determinism in talk about digital technologies
. understand some of the techniques and uses of biometrics, and the
associated risks
. understand the problems that arise when comparing data, and be aware of
the risks of both false matches and false non-matches
. recognise some of the controversies around gathering, storing and using
DNA data
. know about the variety of sources of health information, and about the
health information available from the NHS
. understand the idea of electronic triage, and the benefits and risks
associated with using electronic triage
. know about the implementation and use of electronic health records by
the NHS, and the benefits and risks associated with the system of
Summary Care Records
. know about the methods that can be used for personal health monitoring
and life-logging, and the benefits and risks of sharing health information
. take a critical perspective on the development of digital technologies and
be sensitive to the impact of technology on people in a wide range of
different circumstances.
6.5 Summary
321
Answers to self-assessment activities
Activity 6.12Identification. The police are using the licence number to identify the owner
of the licence in the database.
Activity 6.16(a) Relaxing the matching criterion means making the comparison more
tolerant of difference. This increases the likelihood that biometric data
from different people will be judged to be from the same person, so it
increases the chance of a false match.
(b) Making the matching criterion stricter means making the comparison less
tolerant of difference. This increases the likelihood that biometric data
from the same person will be judged to be from different people, so it
increases the chance of a false non-match.
Activity 6.17To find the answer you need to divide 1000 000 by 100, which gives 10 000.
This is approximately the number of false matches we can expect.
Activity 6.18From the description, it seems there was one false match in 500 million
comparisons, so the false match rate was 1 in 500 million.
Part 6 The networked society
322
References
Chandler, D. (1995) Technological or Media Determinism [Online], Aberystwyth,
University of Wales. Available at http://visual-memory.co.uk/daniel/Documents/tecdet/
(Accessed 9 May 2017).
Dent, S. (2017) ‘Facial recognition will replace passports in Australia’, Engadget, 23
January [Online]. Available at https://www.engadget.com/2017/01/23/facial-
recognition-will-replace-passports-in-australia/ (Accessed 15 February 2017).
Ellender, M. (2017) eConsult [Presentation to DigiHealth UK: Enhancing the
Patient’s Journey London, 2 March 2017] [Online]. Available at https://www.
slideshare.net/LuciaGarcia71/dr-murray-ellender (Accessed 26 July 2017).
HM Government (2009) Putting the frontline first: smarter government, HM
Government [Online]. Available at https://www.gov.uk/government/uploads/system/
uploads/attachment_data/file/228889/7753.pdf (Accessed 9 May 2017)
Innovate UK, (2015) ‘Launch of Smart Cities initiative’, 29 January [Online].
Available at https://www.gov.uk/government/news/launch-of-smart-cities-initiative
(Accessed 12 May 2017).
Mansfield, A., Rejman-Greene, M. (2003) Feasibility Study on the Use of Biometrics
in An Entitlement Scheme (version 3), Teddington, National Physical Laboratory.
Maude, F. (2012) ‘Whitehall closer to being ‘Digital by Default’, UK Cabinet Office,
6 November [Online]. Available at https://www.gov.uk/government/news/government-
digital-strategy-moves-whitehall-closer-to-being-digital-by-default (Accessed 9
May 2017).
Meko, W. (2016) ‘Smart cities for Africa’, Bizcommunity, 30 June [Online] Available
at http://www.bizcommunity.com/Article/410/423/147180.html (Accessed 26
July 2017).
National Audit Office (NAO) (2006) The National Programme for IT in the NHS,
London, National Audit Office, HC 1173 Session 2005–2006.
Webster, F. (2006) Theories of the Information Society, 2nd edn, Abingdon and New
York, Routledge.
References
323
Acknowledgements
Grateful acknowledgement is made to the following sources:
Figure 6.2. Courtesy of Dr. John Daugman, Cambridge University.
Figure 6.3. © Makkayak/iStock.
Figure 6.6. © Hurley Group, Docklands Medical Centre.
Figure 6.7. © Ellender, M. (2017), econsult Digihealth UK, March 2017,
econsult.net.
We gratefully acknowledge the use of some material from Open University
module T175 Networked Living, Jones, A. and Jones R. (2005) Part 4 Health,
Transport and Government.
If any have been inadvertently overlooked the publishers will be pleased to
make the necessary arrangements at the first opportunity.
Part 6 The networked society
324


