Embed Size (px)
Citation preview

ott
Research www.AJOG.org
OBSTETRICS
Blood protein profiles of infants born before 28weeks differ by pregnancy complicationThomas F. McElrath, MD, PhD; Raina Nakova Fichorova, MD, PhD; Elizabeth N. Allred, MS; Jonathan L. Hecht, MD, PhD;Mahmoud A. Ismail, MD; Huaiping Yuan, MS; Alan Leviton, MD; for the ELGAN Study Investigators
OBJECTIVE: Disorders that lead to preterm delivery influence the fetalinflammatory response.
STUDY DESIGN: We calculated odds ratios of elevated concentrationsf 25 blood proteins on the first postnatal day in 798 infants born beforehe 28th week and classified by the pregnancy disorder that lead to pre-erm delivery.
RESULTS: Concentrations of cytokines (IL-1�, IL-6, TNF�), cytokinereceptors (IL-6R, TNF-R1, TNF-R2), systemic inflammatory proteins(CRP, SAA, MPO), chemokines (IL-8, MCP-1, MCP-4, MIP-1�, RANTES,
I-TAC), adhesion molecules (ICAM-1, ICAM-3, VCAM-1, E-selectin),Obstet Gynecol 2011;204:418.e1-12.
0002-9378/$36.00 • © 2011 Mosby, Inc. All rights reserved. • doi: 10.1016
418.e1 American Journal of Obstetrics & Gynecology MAY 2011
and metalloproteinases (MMP-1, MMP-9) were elevated in children de-livered after preterm labor, membrane rupture, abruption, and cervicalinsufficiency, whereas such a pattern was not seen after preeclampsiaor fetal indication/growth restriction. Inflammatory profiles were alsoassociated with maternal vaginitis.
CONCLUSION: The patterns of blood proteins in the newborn supportthe division of pregnancy disorders that lead to preterm delivery intothose associated, and those not associated, with inflammation.
Key words: cytokines, fetal inflammation, preterm birth
Cite this article as: McElrath TF, Fichorova RN, Allred EN, et al. Blood protein profiles of infants born before 28 weeks differ by pregnancy complication. Am J
Delivery of a preterm fetus is the fi-nal common outcome following a
heterogeneous set of pregnancy compli-cations, including preterm labor (PTL),preterm premature rupture of fetalmembranes (pPROM), preeclampsia(PE), cervical insufficiency (CI), placen-tal abruption (PA), and fetal indication(FI/IUGR).1-4 We have suggested thatthese conditions might be grouped into 2common categories based on correlationwith placental histology and microbiol-ogy, one associated with intrauterine in-flammation and the other with vascularcompromise.5 In this study, we confirm
From the Department of Obstetrics and GyneYuan), Brigham & Women’s Hospital, Bostonand Dr Leviton), Children’s Hospital Boston,Hecht), Beth Israel Deaconess Hospital, BostoMedicine, Department of Obstetrics and GynChicago, IL.
Received July 9, 2010; revised Oct. 29, 2010; a
Reprints not available from the authors.
The ELGAN project was supported by the NatioNational Institutes of Health, Grant no. U01 NS 4Developmental Disabilities Research Center Gra
Dr McElrath was supported by the Women’s ReInstitutes of Child Health and Development (K12
and better characterize this 2-categorymodel by measuring markers of inflam-mation and endothelial function in theblood of infants born before the 28thweek of gestation.
Infants delivered to women with an in-flammation-related pregnancy disordermount a fetal inflammatory response(FIRS),6-9 which is manifested as ele-vated circulating inflammatory proteinsand chorionic plate vasculitis/funisitis inthe placenta. Our work expands on priorstudies of inflammation-related proteinsin amniotic fluid and in fetal blood bymeasuring a broader range of proteins,
ogy (Drs McElrath, Fichorova, and MsA; the Neuroepidemiology Unit (Ms Allred
ston, MA; the Department of Pathology (DrA; and the Division of Maternal-Fetal
logy (Dr Ismail), University of Chicago,
pted Dec. 8, 2010.
Institute of Neurologic Diseases and Stroke,069-01, and by Mental Retardation ando. 5P30HD018655-28.
ductive Health Research program, NationalO1255).
/j.ajog.2010.12.010
in a larger and less mature populationselected on the basis of gestational agerather than birthweight, and by our clas-sifying the newborn infants by the differ-ent pregnancy disorder that resulted intheir preterm birth.
MATERIALS AND METHODSPopulation and sample collectionDuring the years 2002-2004, women de-livering before 28 weeks’ gestation at 1 of14 participating institutions in 11 citiesin 5 states were asked to enroll in a studyto identify factors that increase risk forstructural and functional neurologic dis-orders in extremely low gestational agenewborns (ELGANs).10 The enrollmentand consent processes were approvedby the individual institutional reviewboards. Mothers were approached forconsent either on antenatal admission orshortly after delivery, depending on clin-ical circumstance and institutional pref-erence. In total, 1249 mothers of 1506infants consented. The details of thepopulation are described elsewhere.5,10
For this report, we limited the sample tothe 798 children for whom we had day 1blood protein measurements and whose
col, MBon, M
eco
cce
nal00nt n
proHD
placenta was evaluated histologically.

itpwtmwpzraulchgmc
stact
FgufDbatdtic
oimtuWwswttwdott(d(
cATtsptt2tofes
lwptMpGvtamdlpSmtlts2Dl(amlt
g
www.AJOG.org Obstetrics Research
Demographic and clinical variablesAfter delivery, a trained research nurseinterviewed each mother in her nativelanguage using a structured data collec-tion form and following procedures de-fined in a manual. The mother’s reportof her own characteristics and exposures,as well as the sequence of events leadingto preterm delivery were taken as truth,even when her medical record provideddiscrepant information.
The clinical circumstances that led toeach maternal admission and ultimatelyto each preterm delivery were operation-ally defined using both data from thematernal interview and data abstractedfrom the medical record.5 Each mother/nfant pair was assigned to the categoryhat described the primary reason for thereterm delivery. Preterm labor (PTL)as defined as progressive cervical dila-
ion with regular contractions and intactembranes. The diagnosis of pPROMas defined as the presence of vaginalooling with either documented nitra-ine positive testing or ferning beforeegular uterine activity. PE was defineds new onset hypertension and protein-ria of sufficient severity to warrant de-
ivery for either a maternal or fetal indi-ation. For a diagnosis of CI, a womanad to present with cervical dilation ofreater than 2 cm, in the absence ofembrane rupture and detected or per-
eived uterine activity.PA was defined as presentation with a
ignificant amount of vaginal bleeding (ei-her documented in the medical record or
postpartum hematocrit �24%) and alinical diagnosis of placental abruption inhe absence of cervical change.
Presentations under the category ofI/IUGR included severe intrauterinerowth restriction based on antepartumltrasound examination, nonreassuring
etal testing, oligohydramnious, andoppler abnormalities of umbilical cordlood flow. We allowed each center topply its local definitions of these condi-ions and record any of the above as theelivery indications if the deliveringeams cited 1 or more of these abnormal-ties in the medical record as the justifi-
ation for delivery. tThe gestational age estimates were basedn a hierarchy of the quality of available
nformation. Most desirable were esti-ates based on the dates of embryo re-
rieval or intrauterine insemination or fetalltrasound before the 14th week (62%).hen these were not available, reliance
as placed sequentially on a fetal ultra-ound at 14 or more weeks (29%), LMPithout fetal ultrasound (7%), and gesta-
ional age recorded in the log of the neona-al intensive care unit (1%). The birth-eight Z-score is the number of standardeviations the infant’s birthweight is abover below the median weight of infants athe same gestational age in a standard da-aset.11 Prepregnancy body mass indexBMI) was defined as weight in kilogramsivided by the square of height in meterskg/M2).
Blood spot collectionDrops of blood were collected on Schlei-cher and Schuell 903 filter paper (What-man International Ltd, Florham Park,NJ) on the first postnatal day (range, 0 –1days). All blood was from the remainderafter specimens were obtained for clini-cal indications.
Dried blood spots were stored at�70°C in sealed bags with desiccant un-til processed. Blood was available for 798neonates.
Blood spot elution and protein analysisFor protein elution, the frozen driedblood spots (DBS) were punched using12 mm disposable biopsy AcuPunch(Acuderm, Inc, Fort Lauderdale, FL).The punched paper specimen was sub-merged in 300 �L PBS-based bufferontaining 0.1% Triton X100 (Sigma-ldrich, St Louis, MO) and 0.03%ween-20 (Fisher, Hampton, NH) vor-
exes for 30 seconds and incubated on ahaker for 1 hour at 4°C. The punchedaper along with the buffer were thenransferred over the filter of a SpinXube (Corning Fisher), centrifuged at000�g, followed by collection of the fil-ered eluted blood. An additional washf the punch was performed in 100 �Lor a final elution volume of 400 �L. Theluted blood samples were aliquoted andtored frozen at �70°C in bar-coded air-
ight microtubes (USA Scientific, Or-MAY 2011 Americ
ando, FL). The eluted blood samplesere analyzed for cytokines and otherrotein markers of immunoinflamma-ory function in duplicate using the
eso Scale Discovery (MSD) multiplexlatform and Sector Imager 2400 (MSD,aithersburg, MD), which has been pre-
iously validated by comparisons withraditional ELISA. 12,13 MSD multiplexssays measuring up to 10 proteins si-ultaneously were optimized to allow
etection of each biomarker within theinearity range of the DBS-eluted sam-les. The MSD Discovery Workbenchoftware was used to convert relative lu-inescent units into protein concentra-
ions using interpolation from severalog calibrator curves. Split quality con-rol blood pools tested on each platehowed interassay variation of �10-0% for each individual marker. In eachBS-eluted sample, the total protein
evel was determined by BCA assayThermo Scientific, Rockford, IL) usingmultilabel Victor 2 counter (Perkin El-er, Boston, MA) and the expression
evels of each of the analytes normalizedo mg total protein.
The 25 analytes chosen for study wererouped in the following fashion:
Cytokines and their receptorsInterleukin (IL)-1�, IL-6, IL-6 receptor(R), tumor necrosis factor-alpha (TNF�),TNF-R1, TNF-R2.
Other markers of systemicinflammationC-reactive protein (CRP), serum amy-loid A (SAA), myeloperoxidase (MPO).
ChemokinesIL-8 (CXCL8), monocyte chemotacticprotein-1 (MCP-1, CCL2), MCP-4(CCL13), macrophage inflammatoryprotein (MIP)-1� (CCL4), regulated onactivation normal T-cell expressed andpresumably secreted (RANTES, CCL5),interferon-inducible T cell alpha-che-moattractant (I-TAC, CXCL11).
Adhesion moleculesIntercellular adhesion molecule-1 (ICAM-1,CD54), intercellular adhesion molecule-3(ICAM-3, CD50), vascular cell adhesionmolecule-1 (VCAM-1, CD106), E-selectin
(ESEL, CD62E).an Journal of Obstetrics & Gynecology 418.e2
J O
Research Obstetrics www.AJOG.org
MetalloproteinasesMatrix metalloproteinase-1 (MMP-1),MMP-9.
Proteins with angiogenic propertiesVascular endothelial growth factor(VEGF), VEGF-R1 (FLT1), VEGF-R2(KDR), insulin growth factor bindingprotein-1 (IGFBP-1).
Sixteen of the 25 proteins were detect-able within the assay linearity range in allsamples. For the other 9 proteins, thepercent of samples with undetectableconcentrations were MIP-1� (11%),IL-1� (11%), VEGF-R1 (6%), VEGF(5%), TNF� (3%), MCP-4 (0.4%), IL-6(0.4%), I-TAC (0.2%), and IGF-BP1(0.1%). The small percentage of unde-tectable values could not affect our anal-ysis based on quartile distribution ofprotein concentrations.
Statistical analysisBecause the distributions of many of theproteins were not normal, we catego-rized children into quartiles of eachprotein concentration. Because concen-trations of these proteins may be devel-opmentally regulated, we defined eachquartile of each protein within gesta-tional age categories (23-24, 25-26, 27weeks). We evaluated the generalizednull hypothesis that the risk of a bloodprotein concentration in the highestquartile for gestational age was not asso-ciated with the pregnancy disorder thatled to preterm delivery.
Our measure of association is the oddsratio (and 99% confidence interval) thatchildren whose mother had each preg-nancy disorder were more likely to have aprotein concentration in the top quartilethan children born to women who weredelivered because of severe PE. We se-lected PE as the referent pregnancy dis-order because our experience suggests itwould be least likely to lead to a fetal in-flammatory response.5 We selected a99% confidence interval rather than theconventional 95% confidence intervalbecause we wanted to modify our analy-ses for multiple comparisons (25 pro-teins and 6 pregnancy disorders), al-though not appreciably increasing the
risk of a type 1 (false positive) error.14418.e3 American Journal of Obstetrics & Gynecolo
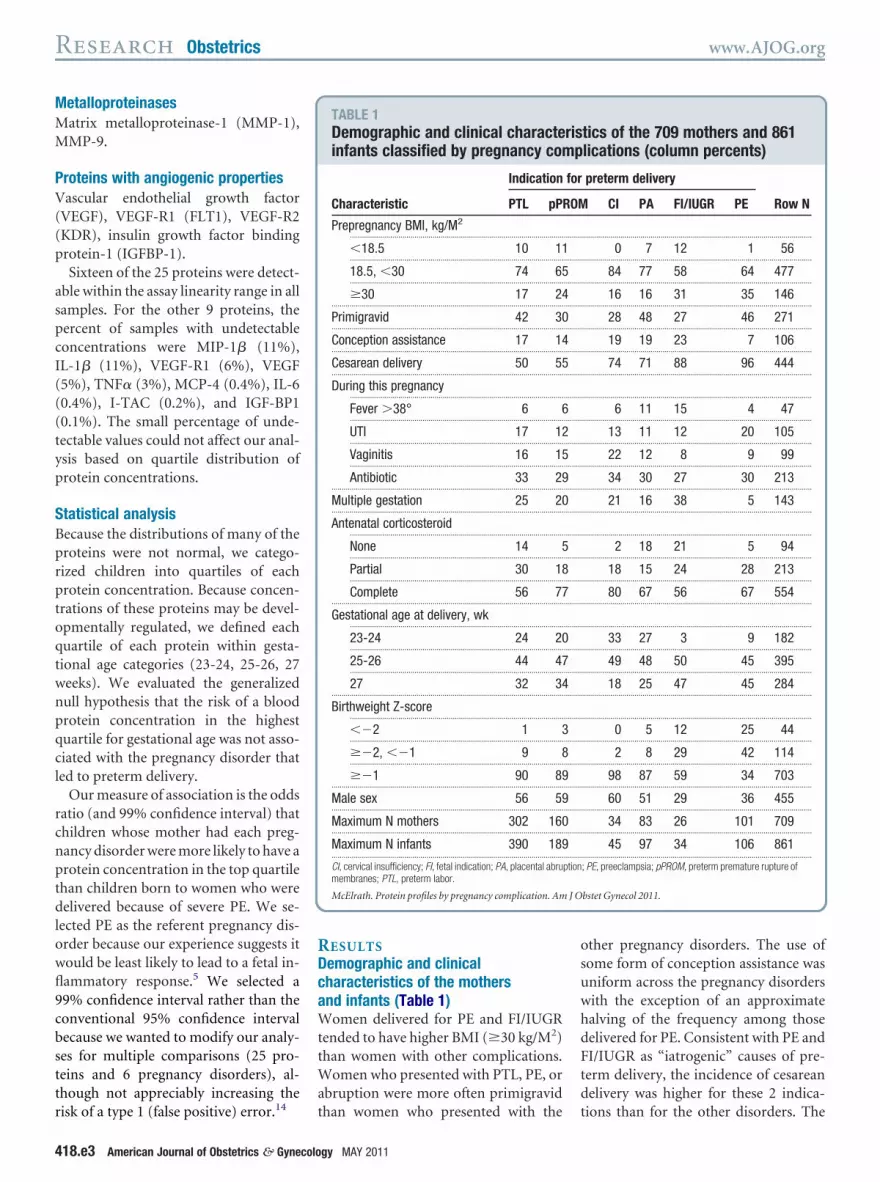
RESULTSDemographic and clinicalcharacteristics of the mothersand infants (Table 1)Women delivered for PE and FI/IUGRtended to have higher BMI (�30 kg/M2)than women with other complications.Women who presented with PTL, PE, orabruption were more often primigravid
TABLE 1Demographic and clinical characteinfants classified by pregnancy com
Indication
Characteristic PTL pP
Prepregnancy BMI, kg/M2
..........................................................................................................
�18.5 10 11..........................................................................................................
18.5, �30 74 65..........................................................................................................
�30 17 24...................................................................................................................
Primigravid 42 30...................................................................................................................
Conception assistance 17 14...................................................................................................................
Cesarean delivery 50 55...................................................................................................................
During this pregnancy..........................................................................................................
Fever �38° 6 6..........................................................................................................
UTI 17 12..........................................................................................................
Vaginitis 16 15..........................................................................................................
Antibiotic 33 29...................................................................................................................
Multiple gestation 25 20...................................................................................................................
Antenatal corticosteroid..........................................................................................................
None 14 5..........................................................................................................
Partial 30 18..........................................................................................................
Complete 56 77...................................................................................................................
Gestational age at delivery, wk..........................................................................................................
23-24 24 20..........................................................................................................
25-26 44 47..........................................................................................................
27 32 34...................................................................................................................
Birthweight Z-score..........................................................................................................
��2 1 3..........................................................................................................
��2, ��1 9 8..........................................................................................................
��1 90 89...................................................................................................................
Male sex 56 59...................................................................................................................
Maximum N mothers 302 160...................................................................................................................
Maximum N infants 390 189...................................................................................................................
CI, cervical insufficiency; FI, fetal indication; PA, placental abrumembranes; PTL, preterm labor.
McElrath. Protein profiles by pregnancy complication. Am
than women who presented with the
gy MAY 2011
other pregnancy disorders. The use ofsome form of conception assistance wasuniform across the pregnancy disorderswith the exception of an approximatehalving of the frequency among thosedelivered for PE. Consistent with PE andFI/IUGR as “iatrogenic” causes of pre-term delivery, the incidence of cesareandelivery was higher for these 2 indica-
tics of the 709 mothers and 861lications (column percents)
preterm delivery
CI PA FI/IUGR PE Row N
..................................................................................................................
0 7 12 1 56..................................................................................................................
84 77 58 64 477..................................................................................................................
16 16 31 35 146..................................................................................................................
28 48 27 46 271..................................................................................................................
19 19 23 7 106..................................................................................................................
74 71 88 96 444..................................................................................................................
..................................................................................................................
6 11 15 4 47..................................................................................................................
13 11 12 20 105..................................................................................................................
22 12 8 9 99..................................................................................................................
34 30 27 30 213..................................................................................................................
21 16 38 5 143..................................................................................................................
..................................................................................................................
2 18 21 5 94..................................................................................................................
18 15 24 28 213..................................................................................................................
80 67 56 67 554..................................................................................................................
..................................................................................................................
33 27 3 9 182..................................................................................................................
49 48 50 45 395..................................................................................................................
18 25 47 45 284..................................................................................................................
..................................................................................................................
0 5 12 25 44..................................................................................................................
2 8 29 42 114..................................................................................................................
98 87 59 34 703..................................................................................................................
60 51 29 36 455..................................................................................................................
34 83 26 101 709..................................................................................................................
45 97 34 106 861..................................................................................................................
; PE, preeclampsia; pPROM, preterm premature rupture of
bstet Gynecol 2011.
risp
for
ROM
.........
.........
.........
.........
.........
.........
.........
.........
.........
.........
.........
.........
.........
.........
.........
.........
.........
.........
.........
.........
.........
.........
.........
.........
.........
.........
.........
.........
ption
tions than for the other disorders. The

J O
www.AJOG.org Obstetrics Research
incidence of urinary tract infection(UTI) was highest among deliveries forPTL and PE, and the incidence of vagini-tis was lowest among pregnancies deliv-ered for PE and FI/IUGR. The incidenceof multiple gestations tended to behigher among deliveries caused by PTLand FI/IUGR and prominently lowestamong deliveries complicated by PE.
Infants delivered as a result of condi-tions that typically have longer latencyintervals between admission and deliv-
TABLE 2Odds ratio of analyte concentration
Category Protein
Cytokines and receptors IL-1�............................................
IL-6............................................
IL-6R............................................
TNF�............................................
TNF-R1............................................
TNF-R2...................................................................................................................
Systemic inflammation CRP............................................
SAA............................................
MPO...................................................................................................................
Chemokines IL-8 (CXCL8)............................................
MCP-1 (CCL2)............................................
MCP-4 (CCL13)............................................
MIP-1� (CCL4)............................................
RANTES (CCL5)............................................
I-TAC (CXCL11)...................................................................................................................
Adhesion molecules ICAM-1 (CD54)............................................
ICAM-3 (CD50)............................................
VCAM-1 (CD106)............................................
E-sel (CD62E)...................................................................................................................
Metallo-proteinases MMP-1............................................
MMP-9...................................................................................................................
Angiogenic proteins VEGF............................................
VEGF-R1............................................
VEGF-R2............................................
IGFBP-1...................................................................................................................
Maximum N...................................................................................................................
Odds ratios (and 99% confidence intervals) that a newborn whquartile (for gestational age category) adjusted for gestationalCI, cervical insufficiency; FI, fetal indication; IUGR, intrauterine
McElrath. Protein profiles by pregnancy complication. Am
ery (pPROM and CI) were more likely
than others to have been exposed to acomplete course of antenatal corticoste-roid. Girls were most common amonginfants delivered to preeclamptic women.Infants delivered for PE and FI/IUGRtended to weigh less and be of older gesta-tional age than those delivered for otherindications.
Neonatal blood protein concentrationsrelated to maternal characteristicsInfants born to women who had a BMI
eing in top quartile by cause of prete
Indication for preterm delivery
PTL pPROM CI
1.9 (0.9–4.0) 4.2 (2.0–9.1) 2.9 (1.........................................................................................................................
2.1 (0.95–4.6) 3.3 (1.5–7.5) 3.2 (1.........................................................................................................................
2.0 (0.9–4.4) 4.1 (1.8–9.3) 2.0 (0.........................................................................................................................
1.7 (0.9–3.6) 3.0 (1.4–6.4) 5.1 (1.........................................................................................................................
3.7 (1.5–9.1) 5.0 (1.9–13) 4.4 (1.........................................................................................................................
3.2 (1.4–7.8) 4.5 (1.8–11) 3.6 (1.........................................................................................................................
1.3 (0.6–2.6) 2.3 (1.1–4.9) 2.2 (0.........................................................................................................................
1.5 (0.7–3.0) 2.2 (1.04–4.7) 1.8 (0.........................................................................................................................
3.2 (1.4–7.8) 6.4 (2.6–16) 6.7 (2.........................................................................................................................
1.3 (0.6–2.6) 2.2 (1.1–4.7) 2.3 (0.........................................................................................................................
0.9 (0.5–1.7) 0.9 (0.5–1.9) 1.1 (0.........................................................................................................................
1.3 (0.7–2.5) 1.4 (0.7–2.9) 1.2 (0.........................................................................................................................
2.3 (1.1–5.1) 3.8 (1.7–8.7) 2.0 (0.........................................................................................................................
2.1 (0.9–4.5) 3.1 (1.4–7.1) 2.5 (0.........................................................................................................................
2.1 (0.96–4.4) 2.9 (1.3–6.5) 2.6 (0.........................................................................................................................
2.5 (1.1–5.3) 3.0 (1.3–6.9) 2.5 (0.........................................................................................................................
5.2 (1.7–16) 12 (3.9–39) 14 (3.7.........................................................................................................................
2.4 (1.1–5.2) 2.6 (1.2–5.9) 3.1 (1.........................................................................................................................
2.7 (1.2–6.3) 5.6 (2.3–13) 5.4 (1.........................................................................................................................
2.8 (1.3–6.2) 2.9 (1.3–6.8) 1.9 (0.........................................................................................................................
5.0 (1.6–16) 10 (3.3–33) 7.8 (2.........................................................................................................................
3.3 (1.3–8.2) 8.6 (3.4–22) 4.9 (1.........................................................................................................................
0.3 (0.1–0.8) 0.2 (0.1–0.4) 0.3 (0.........................................................................................................................
2.1 (0.99–4.4) 3.0 (1.4–6.6) 4.2 (1.........................................................................................................................
0.3 (0.2–0.5) 0.2 (0.1–0.5) 0.3 (0.........................................................................................................................
390 189 45.........................................................................................................................
mother had the pregnancy disorder listed at the top of the colum(23-24, 25-26, 27 weeks). The referent group is preeclampsia (nth restriction; pPROM, preterm premature rupture of membrane
bstet Gynecol 2011.
�30 were more likely than others to have
MAY 2011 Americ
an IL-6 concentration in the top quartile.Multigravidity was associated with in-creased concentrations of a systemic in-flammatory marker (CRP), adhesionmolecules (ICAM-3, E-SEL), a metallo-proteinase (MMP-9), and an angiogenicprotein (VEGF-R2). The pattern withconception assistance was mixed. Mostassociations were with reduced concen-trations (TNF-R2, CRP, SAA, ICAM-1,and MMP-9), whereas fewer were withelevated concentrations (IL-6, MCP-1
delivery
Abruption FI/IUGR
–8.3) 2.3 (0.95–5.6) 1.3 (0.3–4.5)..................................................................................................................
9.5) 2.3 (0.9–5.8) 1.0 (0.2–4.4)..................................................................................................................
6.3) 2.5 (0.98–6.3) 2.9 (0.9–9.5)..................................................................................................................
14) 2.2 (0.9–5.1) 1.6 (0.5–5.4)..................................................................................................................
15) 3.2 (1.1–9.2) 2.9 (0.8–11)..................................................................................................................
12) 3.1 (1.1–8.6) 3.1 (0.8–11)..................................................................................................................
6.2) 0.7 (0.3–1.8) 1.0 (0.3–3.7)..................................................................................................................
5.1) 0.9 (0.3–2.2) 1.3 (0.4–4.5)..................................................................................................................
21) 2.8 (1.01–7.9) 2.2 (0.6–8.7)..................................................................................................................
6.3) 1.1 (0.4–2.6) 1.7 (0.5–5.3)..................................................................................................................
3.2) 1.2 (0.5–2.7) 1.2 (0.4–3.6)..................................................................................................................
3.5) 1.5 (0.6–3.4) 0.7 (0.2–2.5)..................................................................................................................
6.3) 1.8 (0.7–4.7) 2.2 (0.6–7.5)..................................................................................................................
7.7) 2.5 (0.99–6.3) 1.9 (0.5–6.6)..................................................................................................................
7.7) 2.1 (0.8–5.2) 3.1 (0.96–9.7)..................................................................................................................
7.6) 1.4 (0.5–3.7) 1.9 (0.5–6.6)..................................................................................................................
4) 7.4 (2.2–25) 5.1 (1.1–23)..................................................................................................................
9.2) 1.7 (0.6–4.3) 2.0 (0.6–6.9)..................................................................................................................
17) 3.0 (1.1–8.0) 2.4 (0.6–8.8)..................................................................................................................
6.2) 2.0 (0.8–5.4) 2.4 (0.7–8.2)..................................................................................................................
31) 9.2 (2.7–31) 4.3 (0.9–20)..................................................................................................................
16) 4.0 (1.4–11) 2.1 (0.5–8.7)..................................................................................................................
0.9) 0.2 (0.1–0.6) 0.5 (0.2–1.3)..................................................................................................................
12) 1.8 (0.7–4.5) 1.6 (0.5–5.6)..................................................................................................................
0.8) 0.3 (0.2–0.7) 0.6 (0.2–1.7)..................................................................................................................
97 34..................................................................................................................
a concentration of the protein listed on the left in the top06), which has an odds ratio of 1.0 for all proteins.L, preterm labor.
b rm
.01......... .........
.1–......... .........
.6–......... .........
.9–......... .........
.3–......... .........
.1–......... .........
.8–......... .........
.6–......... .........
.1–......... .........
.8–......... .........
.4–......... .........
.4–......... .........
.6–......... .........
.8–......... .........
.9–......... .........
.8–......... .........
–5......... .........
.1–......... .........
.8–......... .........
.6–......... .........
.0......... .........
.5–......... .........
.1–......... .........
.5–......... .........
.1–......... .........
......... .........
ose n hadage � 1grow s; PT
and MCP-4).
an Journal of Obstetrics & Gynecology 418.e4
fovnkIm(It(rpto1aE(
J O
Research Obstetrics www.AJOG.org
Of the 3 maternal infection/inflamma-tion disorders occurring before hospitaladmission (fever �38°C, urinary tract in-ection, and vaginitis), vaginitis was thene most prominently associated with ele-ated concentrations of proteins in theewborn. Among these proteins are cyto-ines and cytokine receptors (IL-1�, IL-6,L-6R, TNF�), systemic inflammatory
arkers (CRP and SAA), a chemokineRANTES), adhesion molecules (ICAM-1,CAM-3, VCAM-1, E-SEL), a metallopro-einase (MMP-1), and angiogenic proteinsVEGF, VEGF-R2). Infants whose mothereceived an antibiotic had a somewhat lessrominent inflammation pattern with aendency to have elevated concentrationsf cytokines and cytokine receptors (IL-�, IL-6, IL-6R, TNF-R1, TNF-R2),dhesion molecules (ICAM-1, VCAM-1,-SEL), and an angiogenic proteinVEGF-R2).
Blood protein concentrationsof newborns related to thenewborns own characteristicsInfants who were not exposed to a fullcourse of antenatal corticosteroid, thosewho were in a multifetal gestation, andthose who had a low birthweightZ-score, tended to be at reduced risk ofhaving elevated concentrations of in-flammation-related proteins. Boys didnot appear to have appreciably increasedconcentrations of any inflammatoryproteins with the exception of VCAM-1.
Elevated blood protein concentrationsof newborns related to their mother’spregnancy disorder (Table 2)PE is the referent condition for this set ofanalyses. Compared with infants whosemothers had PE, all others were at in-creased risk of elevated concentrations ofcytokines and their receptors. An elevationof one or more indicators of systemic in-flammation was seen for all disorders ex-cept FI/IUGR. Similarly, FI/IUGR wasthe only disorder that did not have ele-vated concentrations of the chemokine,RANTES.All5pregnancydisordershadanelevation of 1 or more adhesion moleculesand at least 1 matrix metalloproteinase.Abruption and FI/IUGR were the onlypregnancy disorders that did not tend to
have elevated concentrations of VEGF-R2418.e5 American Journal of Obstetrics & Gynecolo
and all of the complications, except FI/IUGR, had lower levels of IGFBP-1. All ofthe disorders had significantly lower levelsof VEGF-R1 compared with PE.
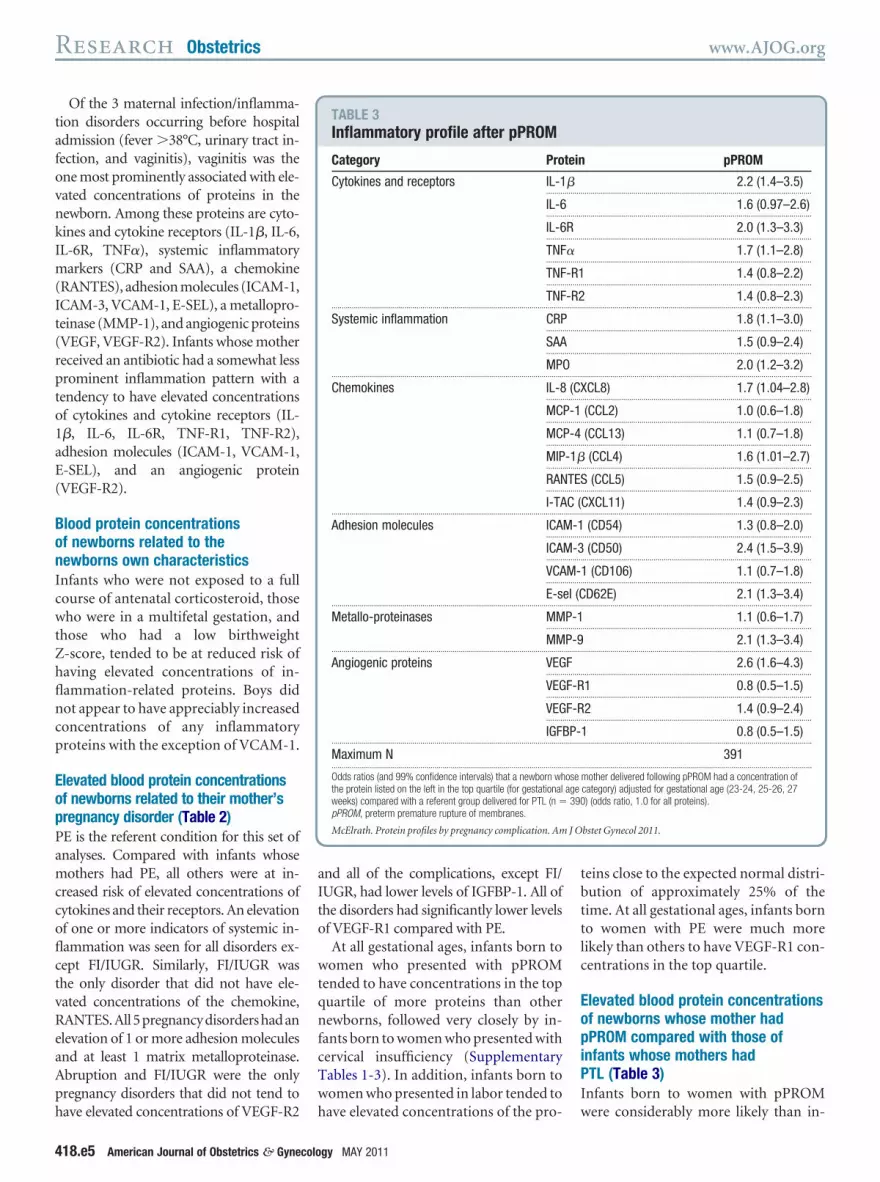
At all gestational ages, infants born towomen who presented with pPROMtended to have concentrations in the topquartile of more proteins than othernewborns, followed very closely by in-fants born to women who presented withcervical insufficiency (SupplementaryTables 1-3). In addition, infants born towomen who presented in labor tended to
TABLE 3Inflammatory profile after pPROM
Category Pro
Cytokines and receptors IL-1........
IL-6........
IL-6........
TNF........
TNF........
TNF...................................................................................................................
Systemic inflammation CRP........
SAA........
MP...................................................................................................................
Chemokines IL-8........
MC........
MC........
MIP........
RAN........
I-TA...................................................................................................................
Adhesion molecules ICA........
ICA........
VCA........
E-s...................................................................................................................
Metallo-proteinases MM........
MM...................................................................................................................
Angiogenic proteins VEG........
VEG........
VEG........
IGF...................................................................................................................
Maximum N...................................................................................................................
Odds ratios (and 99% confidence intervals) that a newborn whthe protein listed on the left in the top quartile (for gestationalweeks) compared with a referent group delivered for PTL (n �pPROM, preterm premature rupture of membranes.
McElrath. Protein profiles by pregnancy complication. Am
have elevated concentrations of the pro-
gy MAY 2011
teins close to the expected normal distri-bution of approximately 25% of thetime. At all gestational ages, infants bornto women with PE were much morelikely than others to have VEGF-R1 con-centrations in the top quartile.
Elevated blood protein concentrationsof newborns whose mother hadpPROM compared with those ofinfants whose mothers hadPTL (Table 3)Infants born to women with pPROM
pPROM
2.2 (1.4–3.5)..................................................................................................................
1.6 (0.97–2.6)..................................................................................................................
2.0 (1.3–3.3)..................................................................................................................
1.7 (1.1–2.8)..................................................................................................................
1.4 (0.8–2.2)..................................................................................................................
1.4 (0.8–2.3)..................................................................................................................
1.8 (1.1–3.0)..................................................................................................................
1.5 (0.9–2.4)..................................................................................................................
2.0 (1.2–3.2)..................................................................................................................
CL8) 1.7 (1.04–2.8)..................................................................................................................
(CCL2) 1.0 (0.6–1.8)..................................................................................................................
(CCL13) 1.1 (0.7–1.8)..................................................................................................................
(CCL4) 1.6 (1.01–2.7)..................................................................................................................
(CCL5) 1.5 (0.9–2.5)..................................................................................................................
CXCL11) 1.4 (0.9–2.3)..................................................................................................................
(CD54) 1.3 (0.8–2.0)..................................................................................................................
(CD50) 2.4 (1.5–3.9)..................................................................................................................
1 (CD106) 1.1 (0.7–1.8)..................................................................................................................
D62E) 2.1 (1.3–3.4)..................................................................................................................
1.1 (0.6–1.7)..................................................................................................................
2.1 (1.3–3.4)..................................................................................................................
2.6 (1.6–4.3)..................................................................................................................
1 0.8 (0.5–1.5)..................................................................................................................
2 1.4 (0.9–2.4)..................................................................................................................
1 0.8 (0.5–1.5)..................................................................................................................
391..................................................................................................................
mother delivered following pPROM had a concentration ofcategory) adjusted for gestational age (23-24, 25-26, 27) (odds ratio, 1.0 for all proteins).
bstet Gynecol 2011.
tein
�.........
.........
R.........
�.........
-R1.........
-R2.........
.........
.........
O.........
(CX.........
P-1.........
P-4.........
-1�.........
TES.........
C (.........
M-1.........
M-3.........
M-.........
el (C.........
P-1.........
P-9.........
F.........
F-R.........
F-R.........
BP-.........
.........
oseage390
were considerably more likely than in-

M
J O
www.AJOG.org Obstetrics Research
fants whose mothers presented in PTL tohave elevated concentrations of 11 of the25 inflammation-related proteins (IL-1�, IL-6R, TNF�, CRP, MPO, IL-8,
IP-1�, ICAM-3, E-SEL, MMP-9, andVEGF).
A visual summary of the statisticallysignificant associations inTable 2 (Table 4)The pregnancy disorders leading to de-livery much before term can be dividedinto those with and without a strong in-flammation signal. Because PE is the ref-
TABLE 4Analyte concentrations relative to p
In
Category Protein P
Cytokines andreceptors
IL-1�........................................................
IL-6........................................................
IL-6R........................................................
TNF�........................................................
TNF-R1 �........................................................
TNF-R2 �...................................................................................................................
Systemicinflammation
CRP........................................................
SAA........................................................
MPO �...................................................................................................................
Chemokines IL-8 (CXCL8)........................................................
MCP-1 (CCL2)........................................................
MCP-4 (CCL13)........................................................
MIP-1� (CCL4) �........................................................
RANTES (CCL5)........................................................
I-TAC (CXCL11)...................................................................................................................
Adhesionmolecules
ICAM-1 (CD54) �........................................................
ICAM-3 (CD50) �........................................................
VCAM-1 (CD106) �........................................................
E-sel (CD62E) �...................................................................................................................
Metalloproteinases MMP-1 �........................................................
MMP-9 �...................................................................................................................
Angiogenicproteins
VEGF �........................................................
VEGF-R1 –........................................................
VEGF-R2........................................................
IGFBP-1 –...................................................................................................................
� indicates increased risk and – indicates decreased risk relCI, cervical insufficiency; FI, fetal indication; IUGR, intrauterimembranes; PTL, preterm labor.
McElrath. Protein profiles by pregnancy complication. Am
erent group for the analyses in this Table
(ie, the disorder with the least evidenceof fetal inflammation), it can be viewedas contributing even less to fetal inflam-mation than the disorder we classify as(FI/IUGR). Our prior work indicatesthat the causes of preterm delivery can begrouped as those associated with intra-uterine inflammation (PTL, pPROM,PA, CI) and those with aberrant placen-tation (PE, FI/IUGR).5
Box and whiskers displays of theconcentrations of 6 proteinsWe provide information about the cen-
eclampsia
mmatory pattern by delivery cause
pPROM CI Abruption FI/IUGR
� �..................................................................................................................
� �..................................................................................................................
�..................................................................................................................
� �..................................................................................................................
� � �..................................................................................................................
� � �..................................................................................................................
�..................................................................................................................
�..................................................................................................................
� � �..................................................................................................................
�..................................................................................................................
..................................................................................................................
..................................................................................................................
�..................................................................................................................
�..................................................................................................................
�..................................................................................................................
�..................................................................................................................
� � � �..................................................................................................................
� �..................................................................................................................
� � �..................................................................................................................
�..................................................................................................................
� � �..................................................................................................................
� � �..................................................................................................................
– – –..................................................................................................................
� �..................................................................................................................
– – –..................................................................................................................
to that disorder.rowth restriction; pPROM, preterm premature rupture of
bstet Gynecol 2011.
tral tendency and dispersion of the con-
MAY 2011 Americ
centrations of 6 proteins (TNF-R1, TNF-R2, ICAM-3, MMP9, VEGF, VEGF-R1).The right end of each box indicates theconcentration that separates the thirdand fourth quartiles (Figure). In general,the concentrations diminish with gesta-tional age in the narrow gestational agerange of this sample. Although the con-centrations of some of the proteins tendto be highest among children born towomen who presented with pPROM,MMP-9 concentrations do not followthis pattern. Infants whose mothers pre-sented with PE tended to have low VEGFconcentrations, and high concentrationsof VEGF-R1.
COMMENTOur major finding is that infants bornbefore the 28th week of gestation towomen who delivered because of a preg-nancy disorder associated with intra-uterine inflammation (PTL, pPROM,PA, CI) are much more likely than theirpeers to have elevated concentrations ofinflammation-associated proteins intheir blood on the first postnatal day.
Classification of disorders thatlead to delivery before the28th week of gestationWe found that elevated concentrationsof inflammation-associated proteins areleast common in the setting of PE andFI/IUGR, more common in the setting ofPTL and abruption, and most commonin the setting of pPROM and CI. Theseobservations suggest that PTL, abrup-tion, pPROM and CI are characterizedby a fetal inflammatory response.
In prior work based on maternal clin-ical characteristics, placental microbiol-ogy, and placental histology, we pro-posed that the causes of preterm birthcould be classified into 2 larger “super-categories”: one associated with intra-uterine inflammation and the othernot.5 Our present findings support thisclassification.5
The pregnancy disorders we classify asinflammation and noninflammationdiffer from one another in subtle ways.So do the disorders in each of thesegroups.
Children born after PE and FI/IUGR
re
fla
TL
.........
.........
.........
.........
.........
.........
.........
.........
.........
.........
.........
.........
.........
.........
.........
.........
.........
.........
.........
.........
.........
.........
.........
.........
.........
ativene g
were less likely than others to have ele-
an Journal of Obstetrics & Gynecology 418.e6

Research Obstetrics www.AJOG.org
FIGURERelative concentration by delivery cause
0 50 100 150
TNF-R1
27wk
25-26wk
23-24wk
PEFI/IUGR
AbruptCI
pPROMPTL
PEFI/IUGR
AbruptCI
pPROMPTL
PEFI/IUGR
AbruptCI
pPROMPTL
0 50 100 150
TNF-R2
27wk
25-26wk
23-24wk
PEFI/IUGR
AbruptCI
pPROMPTL
PEFI/IUGR
AbruptCI
pPROMPTL
PEFI/IUGR
AbruptCI
pPROMPTL
0 500 1,000 1,500
MMP-9/100
27wk
25-26wk
23-24wk
PEFI/IUGR
AbruptCI
pPROMPTL
PEFI/IUGR
AbruptCI
pPROMPTL
PEFI/IUGR
AbruptCI
pPROMPTL
0 50 100 150 200
ICAM-3
27wk
25-26wk
23-24wk
PEFI/IUGR
AbruptCI
pPROMPTL
PEFI/IUGR
AbruptCI
pPROMPTL
PEFI/IUGR
AbruptCI
pPROMPTL
0 100 200 300 400 500
VEGF x 10
27wk
25-26wk
23-24wk
PEFI/IUGR
AbruptCI
pPROMPTL
PEFI/IUGR
AbruptCI
pPROMPTL
PEFI/IUGR
AbruptCI
pPROMPTL
0 100 200 300 400 500VEGF-R1 x 10
27wk
25-26wk
23-24wk
PEFI/IUGR
AbruptCI
pPROMPTL
PEFI/IUGR
AbruptCI
pPROMPTL
PEFI/IUGR
AbruptCI
pPROMPTL
McElrath. Protein profiles by pregnancy complication. Am J Obstet Gynecol 2011.
418.e7 American Journal of Obstetrics & Gynecology MAY 2011

mpfln
lisrocg
fspcvrbeobis
www.AJOG.org Obstetrics Research
vated concentrations of cytokine/recep-tors (IL-6R, TNF-R1 and TNF-R2), anadhesion molecule (ICAM-3), a matrixmetalloproteinase (MMP1) and an an-giogenic protein (VEGF-R1). Elevatedconcentrations of the angiogenic proteinVEGF-R1 have been found in the amni-otic fluid, cord blood, and blood ofwomen with PE.15-18 We are unaware ofprevious reports of elevated concentra-tions in the newborn’s blood.
CI has not traditionally been a preg-nancy complication included in large ep-idemiologic studies. Nevertheless, ourinterest in this disorder prompted us toclassify it as a separate entity that can leadto preterm delivery. Women were con-sidered to have CI if they presented withcervical dilation of greater than 2 cm inthe absence of membrane rupture anduterine activity. Some of these pregnan-cies were complicated by later amnior-rhexis, whereas others were not. Addi-tionally, given the enrollment of womenvery near the time of delivery, we are notable to determine how many of the pa-tients presenting with pPROM had un-diagnosed CI. Despite the likely overlapof some pPROM and CI, the unques-tioned CI identified in some of thewomen enrolled in this study representsa distinct clinical presentation that im-plies a set of specific clinical responses,19
allowing us to evaluate it as a uniquecontributor to preterm delivery.
Our CI findings are compatible withan inflammatory stimulus within the in-trauterine environment before amnior-rhexis. Support for our view comes fromdocumentation of microbes in amnioticfluid before membrane rupture,20 and ofmicrobial DNA in the meconium of in-fants born preterm.21
Breadth of inflammationPrevious work on fetal inflammation inhumans has tended to focus on 1, or atmost a very small group of proteins.22-33
Although prescient, this work underesti-mated the breadth of the response. We,however, found elevated concentrationsof many different types of inflammation-related proteins, including cytokines,cytokine receptors, acute phase reac-tants (reflecting hepatic involvement),
chemokines, adhesion molecules, andmetalloproteinases among selectedgroups of children born before the 28thweek of gestation. The most prominentcorrelate of elevated concentrations islow gestational age.34,35 This involve-
ent of so many different types ofroteins supports the view that fetal in-ammation is a broad and diffuse phe-omenon in some preterm newborns.
Presence on the first postnatal dayThe elevated concentrations of manyinflammation-related proteins in theblood of the newborn on the first post-natal day support 2 interpretationsabout fetal involvement. One interpreta-tion is that a maternal inflammatory re-sponse is so intense that some of the pro-teins can cross the placenta to enter thefetal circulation.36,37 The other is thatwhat we found reflects fetal inflamma-tion. Because the maternal inflammatoryresponse, or the stimuli that promote it,probably contributed to a fetal response,it is unlikely examples will be found of afetal response preceded/unaccompaniedby maternal inflammation. Even whenfound, however, the maternal inflamma-tory response might have dissipated be-fore the fetal response is identified.
Relationship between vaginitisand inflammation-relatedpregnancy disordersA body of older literature documentedthat women who have lower genital tractinflammation during pregnancy are atincreased risk of having intrauterine in-flammation.38,39 The mothers of thechildren in our study were interviewedvery close to the time of delivery andasked about pregnancy characteristicsand exposures, including vaginitis. Theinfants born to women who reportedvaginitis were more likely than theirpeers to have elevated concentrations ofmultiple categories of inflammation-re-lated proteins. This suggests that vagini-tis places a woman at increased risk of anascending infection leading to intrauter-ine inflammation, which in turn mightpromote a fetal inflammatory response(data not shown).
The weaknesses of our study are thoseof all observational studies. We are un-
able to distinguish between causationMAY 2011 Americ
and association as explanations for whatwe found.
Our study also has several strengths.First, we included a large number of in-fants, making it unlikely that we havemissed important associations due tolack of statistical power. Second, we se-lected infants based on gestational age,not birthweight, to minimize confound-ing due to factors related to fetal growthrestriction.40 Third, the data were col-ected prospectively at multiple tertiarynstitutions. Finally, this cohort was as-embled under conditions of contempo-ary obstetric practice further increasingur ability to examine the less commonauses of preterm birth before 28 weeks’estation.In summary, we demonstrate that the
etal/early newborn inflammatory re-ponse is broad and encompasses multi-le components of the inflammatoryascade. In addition, the patterns of ele-ated concentrations of inflammation-elated proteins in newborns classifiedy the disorder that led to preterm deliv-ry support our view that pregnancy dis-rders that lead to preterm delivery cane divided into those characterized by
nflammation and those without suchtrong evidence of inflammation. f
REFERENCES1. Savitz DA, Blackmore CA, Thorp JM. Epide-miologic characteristics of preterm delivery: eti-ologic heterogeneity. Am J Obstet Gynecol1991;164:467-71.2. Ananth CV, Savitz DA, Luther ER, Bowes WAJr. Preeclampsia and preterm birth subtypes inNova Scotia, 1986 to 1992. Am J Perinatol1997;14:17-23.3. Goldenberg RL, Culhane JF, Iams JD, Ro-mero R. Epidemiology and causes of pretermbirth. Lancet 2008;371:75-84.4. Berkowitz GS, Blackmore-Prince C, LapinskiRH, Savitz DA. Risk factors for preterm birthsubtypes. Epidemiology 1998;9:279-85.5. McElrath TF, Hecht JL, Dammann O, et al.Pregnancy disorders that lead to delivery beforethe 28th week of gestation: an epidemiologicapproach to classification. Am J Epidemiol2008;168:980-89.6. Romero R, Gotsch F, Pineles B, KusanovicJP. Inflammation in pregnancy: its roles in re-productive physiology, obstetrical complica-tions, and fetal injury. Nutr Rev 2007;65:S194-202.7. Buhimschi CS, Bhandari V, Han YW, et al.
Using proteomics in perinatal and neonatal sep-an Journal of Obstetrics & Gynecology 418.e8

Research Obstetrics www.AJOG.org
sis: hopes and challenges for the future. CurrOpin Infect Dis 2009;22:235-43.8. Goldenberg RL, Culhane JF, Johnson DC.Maternal infection and adverse fetal and neona-tal outcomes. Clin Perinatol 2005;32:523-59.9. Goldenberg RL, Hauth JC, Andrews WW. In-trauterine infection and preterm delivery. N EnglJ Med 2000;342:1500-7.10. O’Shea TM, Allred EN, Dammann O, et al.The ELGAN study of the brain and related dis-orders in extremely low gestational age new-borns. Early Hum Dev 2009;85:719-25.11. Yudkin PL, Aboualfa M, Eyre JA, RedmanCW, Wilkinson AR. New birthweight and headcircumference centiles for gestational ages 24to 42 weeks. Early Hum Dev 1987;15:45-52.12. Fichorova RN, Richardson-Harman N, Al-fano M, et al. Biological and technical variablesaffecting immunoassay recovery of cytokinesfrom human serum and simulated vaginal fluid:a multicenter study. Anal Chem 2008;80:4741-51.13. Fichorova RN, Trifonova RT, Gilbert RO, etal. Trichomonas vaginalis lipophosphoglycantriggers a selective upregulation of cytokines byhuman female reproductive tract epithelial cells.Infect Immun 2006;74:5773-9.14. Rothman KJ. No adjustments are neededfor multiple comparisons. Epidemiology 1990;1:43-6.15. Maynard SE, Min J-Y, Merchan J, et al.Excess placental soluble fms-like tyrosine ki-nase 1 (sFlt1) may contribute to endothelial dys-function, hypertension, and proteinuria in pre-eclampsia. J Clin Invest 2003;111:649-58.16. Levine RJ, Maynard SE, Qian C, et al. Cir-culating angiogenic factors and the risk of pre-eclampsia. N Engl J Med 2004;350:672-83.17. Staff AC, Braekke K, Harsem NK, Lyberg T,Holthe MR. Circulating concentrations of sFlt1(soluble fms-like tyrosine kinase 1) in fetal andmaternal serum during pre-eclampsia. Eur JObstet Gynecol Reprod Biol 2005;122:33-9.18. Wang CN, Chang SD, Peng HH, et al.Change in amniotic fluid levels of multiple anti-angiogenic proteins before development of pre-eclampsia and intrauterine growth restriction.J Clin Endocrinol Metab 2010;95:1431-41.19. Iams JD. Cervical insufficiency. In: CreasyRK, Resnik R, Iams JD, Lockwood CJ, Moore
TR, eds. Creasy and Resnik’s maternal fetal418.e9 American Journal of Obstetrics & Gynecolo
medicine: principles and practice. Philadelphia:Saunders Elsevier; 2009.20. Romero R, Schaudinn C, Kusanovic JP, etal. Detection of a microbial biofilm in intraamni-otic infection. Am J Obstet Gynecol 2008;198:135.e1-5.21. Mshvildadze M, Neu J, Shuster J, Theri-aque D, Li N, Mai V. Intestinal microbial ecologyin premature infants assessed with non-culturebased techniques. J Pediatr 2010;156:20-5.22. Gomez R, Romero R, Ghezzi F, Yoon BH,Mazor M, Berry SM. The fetal inflammatory re-sponse syndrome. Am J Obstet Gynecol1998;179:194-202.23. Romero R, Gomez R, Ghezzi F, et al. A fetalsystemic inflammatory response is followed bythe spontaneous onset of preterm parturition.Am J Obstet Gynecol 1998;179:186-93.24. Chaiworapongsa T, Romero R, Kim JC, etal. Evidence for fetal involvement in the patho-logic process of clinical chorioamnionitis. Am JObstet Gynecol 2002;186:1178-82.25. Witt A, Berger A, Gruber CJ, Petricevic L,Apfalter P, Husslein P. IL-8 concentrations inmaternal serum, amniotic fluid and cord bloodin relation to different pathogens within the am-niotic cavity. J Perinat Med 2005;33:22-6.26. Yoon BH, Romero R, Kim KS, et al. A sys-temic fetal inflammatory response and the de-velopment of bronchopulmonary dysplasia.Am J Obstet Gynecol 1999;181:773-9.27. Pacora P, Chaiworapongsa T, Maymon E,et al. Funisitis and chorionic vasculitis: the his-tological counterpart of the fetal inflammatoryresponse syndrome. J Matern Fetal NeonatalMed 2002;11:18-25.28. Yoon BH, Romero R, Jun JK, et al. An in-crease in fetal plasma cortisol but not dehydro-epiandrosterone sulfate is followed by the onsetof preterm labor in patients with preterm prema-ture rupture of the membranes. Am J ObstetGynecol 1998;179:1107-14.29. Romero R, Chaiworapongsa T, Espinoza J,et al. Fetal plasma MMP-9 concentrations areelevated in preterm premature rupture of themembranes. Am J Obstet Gynecol 2002;187:1125-30.30. Yoon BH, Romero R, Moon J, et al. Differ-ences in the fetal interleukin-6 response to mi-
crobial invasion of the amniotic cavity betweengy MAY 2011
term and preterm gestation. J Matern FetalNeonatal Med 2003;13:32-8.31. Romero R, Maymon E, Pacora P, et al. Fur-ther observations on the fetal inflammatory re-sponse syndrome: a potential homeostatic rolefor the soluble receptors of tumor necrosisfactor alpha. Am J Obstet Gynecol 2000;183:1070-7.32. Yoon BH, Romero R, Shim JY, Shim SS,Kim CJ, Jun JK. C-reactive protein in umbilicalcord blood: a simple and widely available clini-cal method to assess the risk of amniotic fluidinfection and funisitis. J Matern Fetal NeonatalMed 2003;14:85-90.33. Atici A, Satar M, Alparslan N. Serum inter-leukin-1 beta in neonatal sepsis. Acta Paediatr1996;85:371-4.34. Matoba N, Yu Y, Mestan K, et al. Differentialpatterns of 27 cord blood immune biomarkersacross gestational age. Pediatrics 2009;123:1320-8.35. Leviton A, Fichorova R, Yamamoto Y, et al.Inflammation-related proteins in the blood of ex-tremely low gestational age newborns: the con-tribution of inflammation to the appearance ofdevelopmental regulation. Cytokine 2011;53:66-73.36. Romero R, Erez O, Espinoza J. Intrauterineinfection, preterm labor, and cytokines. J SocGynecol Investig 2005;12:463-5.37. Gravett MG, Novy MJ. Endocrine-immuneinteractions in pregnant non-human primateswith intrauterine infection. Infect Dis Obstet Gy-necol 1997;5:142-53.38. Hillier SL, Witkin SS, Krohn MA, Watts DH,Kiviat NB, Eschenbach DA. The relationship ofamniotic fluid cytokines and preterm delivery,amniotic fluid infection, histologic chorioamnio-nitis, and chorioamnion infection. Obstet Gyne-col 1993;81:941-8.39. Hillier SL, Martius J, Krohn M, Kiviat N, Hol-mes KK, Eschenbach DA. A case-control studyof chorioamnionic infection and histologic cho-rioamnionitis in prematurity. N Engl J Med1988;319:972-8.40. Arnold CC, Kramer MS, Hobbs CA,McLean FH, Usher RH. Very low birth weight: aproblematic cohort for epidemiologic studies ofvery small or immature neonates. Am J Epide-
miol 1991;134:604-13.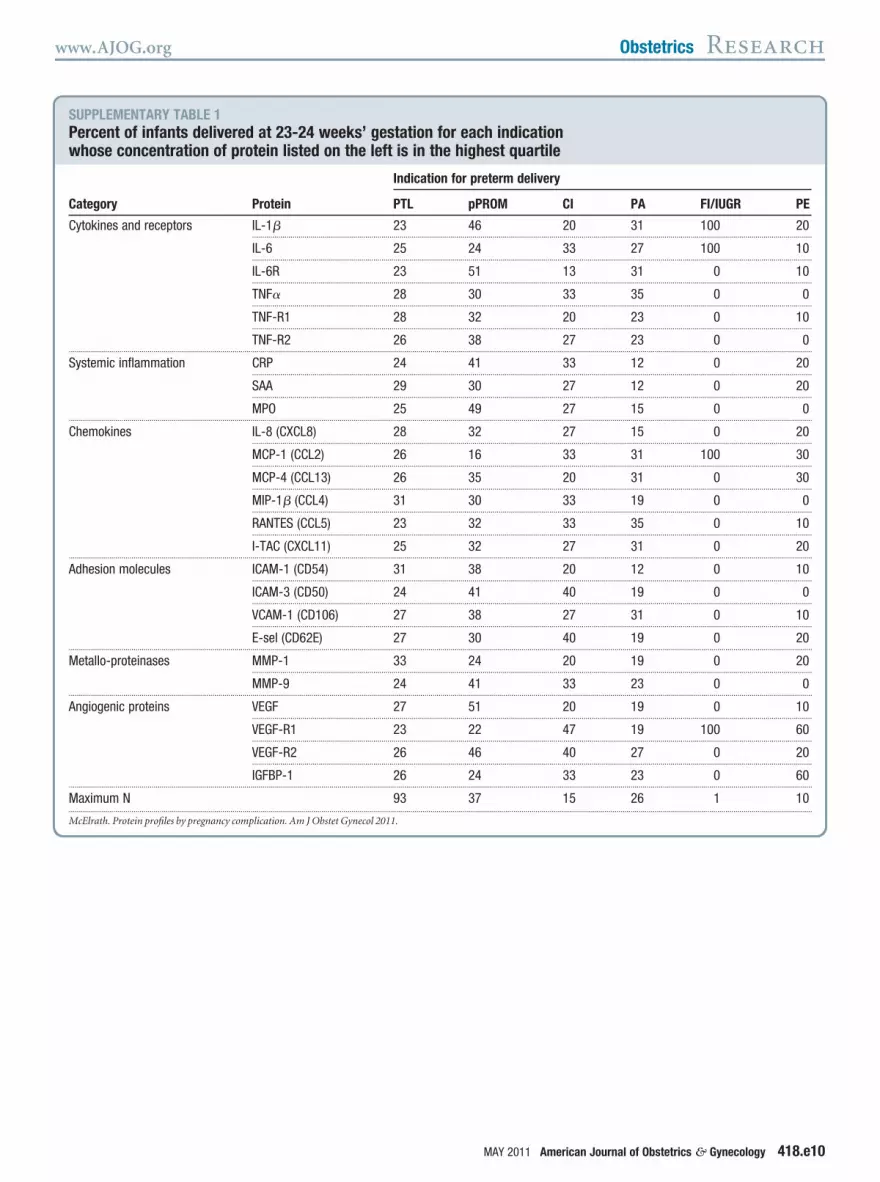
J Obstet Gynecol 2011.
www.AJOG.org Obstetrics Research
SUPPLEMENTARY TABLE 1Percent of infants delivered at 23-2whose concentration of protein list
Category Protein
Cytokines and receptors IL-1�........................
IL-6........................
IL-6R........................
TNF�........................
TNF-R1........................
TNF-R2...................................................................................................................
Systemic inflammation CRP........................
SAA........................
MPO...................................................................................................................
Chemokines IL-8 (CXC........................
MCP-1 (C........................
MCP-4 (C........................
MIP-1� (C........................
RANTES (........................
I-TAC (CX...................................................................................................................
Adhesion molecules ICAM-1 (C........................
ICAM-3 (C........................
VCAM-1 (........................
E-sel (CD...................................................................................................................
Metallo-proteinases MMP-1........................
MMP-9...................................................................................................................
Angiogenic proteins VEGF........................
VEGF-R1........................
VEGF-R2........................
IGFBP-1...................................................................................................................
Maximum N...................................................................................................................
McElrath. Protein profiles by pregnancy complication. Am
4 weeks’ gestation for each indicationed on the left is in the highest quartile
Indication for preterm delivery
PTL pPROM CI PA FI/IUGR PE
23 46 20 31 100 20.............................................................................................................................................................................................................................................................
25 24 33 27 100 10.............................................................................................................................................................................................................................................................
23 51 13 31 0 10.............................................................................................................................................................................................................................................................
28 30 33 35 0 0.............................................................................................................................................................................................................................................................
28 32 20 23 0 10.............................................................................................................................................................................................................................................................
26 38 27 23 0 0.............................................................................................................................................................................................................................................................
24 41 33 12 0 20.............................................................................................................................................................................................................................................................
29 30 27 12 0 20.............................................................................................................................................................................................................................................................
25 49 27 15 0 0.............................................................................................................................................................................................................................................................
L8) 28 32 27 15 0 20.............................................................................................................................................................................................................................................................
CL2) 26 16 33 31 100 30.............................................................................................................................................................................................................................................................
CL13) 26 35 20 31 0 30.............................................................................................................................................................................................................................................................
CL4) 31 30 33 19 0 0.............................................................................................................................................................................................................................................................
CCL5) 23 32 33 35 0 10.............................................................................................................................................................................................................................................................
CL11) 25 32 27 31 0 20.............................................................................................................................................................................................................................................................
D54) 31 38 20 12 0 10.............................................................................................................................................................................................................................................................
D50) 24 41 40 19 0 0.............................................................................................................................................................................................................................................................
CD106) 27 38 27 31 0 10.............................................................................................................................................................................................................................................................
62E) 27 30 40 19 0 20.............................................................................................................................................................................................................................................................
33 24 20 19 0 20.............................................................................................................................................................................................................................................................
24 41 33 23 0 0.............................................................................................................................................................................................................................................................
27 51 20 19 0 10.............................................................................................................................................................................................................................................................
23 22 47 19 100 60.............................................................................................................................................................................................................................................................
26 46 40 27 0 20.............................................................................................................................................................................................................................................................
26 24 33 23 0 60.............................................................................................................................................................................................................................................................
93 37 15 26 1 10.............................................................................................................................................................................................................................................................
MAY 2011 American Journal of Obstetrics & Gynecology 418.e10

J Obstet Gynecol 2011.
Research Obstetrics www.AJOG.org
SUPPLEMENTARY TABLE 2Percent of infants delivered at 25-2whose concentration of protein list
Category Protein
Cytokines and receptors IL-1�..........................
IL-6..........................
IL-6R..........................
TNF�..........................
TNF-R1..........................
TNF-R2...................................................................................................................
Systemic inflammation CRP..........................
SAA..........................
MPO...................................................................................................................
Chemokines IL-8 (CXCL..........................
MCP-1 (CC..........................
MCP-4 (CC..........................
MIP-1� (C..........................
RANTES (C..........................
I-TAC (CXC...................................................................................................................
Adhesion molecules ICAM-1 (C..........................
ICAM-3 (C..........................
VCAM-1 (C..........................
E-sel (CD6...................................................................................................................
Metallo-proteinases MMP-1..........................
MMP-9...................................................................................................................
Angiogenic proteins VEGF..........................
VEGF-R1..........................
VEGF-R2..........................
IGFBP-1...................................................................................................................
Maximum N...................................................................................................................
McElrath. Protein profiles by pregnancy complication. Am
6 weeks’ gestation for each indicationed on the left is in the highest quartile
Indication for preterm delivery
PTL pPROM CI PA FI/IUGR PE
26 45 55 34 12 13.............................................................................................................................................................................................................................................................
28 35 36 28 6 6.............................................................................................................................................................................................................................................................
26 36 23 28 29 15.............................................................................................................................................................................................................................................................
28 36 68 34 24 8.............................................................................................................................................................................................................................................................
28 33 36 32 12 4.............................................................................................................................................................................................................................................................
27 31 27 32 24 6.............................................................................................................................................................................................................................................................
24 35 36 21 12 17.............................................................................................................................................................................................................................................................
25 35 27 26 24 10.............................................................................................................................................................................................................................................................
25 39 45 36 29 6.............................................................................................................................................................................................................................................................
8) 23 38 45 28 29 8.............................................................................................................................................................................................................................................................
L2) 25 24 32 28 18 27.............................................................................................................................................................................................................................................................
L13) 29 23 23 36 0 29.............................................................................................................................................................................................................................................................
CL4) 29 39 18 28 29 8.............................................................................................................................................................................................................................................................
CL5) 26 32 23 28 18 19.............................................................................................................................................................................................................................................................
L11) 28 30 27 32 35 17.............................................................................................................................................................................................................................................................
D54) 28 33 32 28 18 6.............................................................................................................................................................................................................................................................
D50) 20 42 41 40 18 6.............................................................................................................................................................................................................................................................
D106) 30 27 41 23 18 19.............................................................................................................................................................................................................................................................
2E) 24 44 36 38 18 6.............................................................................................................................................................................................................................................................
28 39 18 26 12 10.............................................................................................................................................................................................................................................................
20 36 23 49 24 6.............................................................................................................................................................................................................................................................
22 50 36 40 18 2.............................................................................................................................................................................................................................................................
25 23 18 25 35 54.............................................................................................................................................................................................................................................................
28 35 45 30 24 15.............................................................................................................................................................................................................................................................
25 19 18 28 35 46.............................................................................................................................................................................................................................................................
173 88 22 47 17 48.............................................................................................................................................................................................................................................................
418.e11 American Journal of Obstetrics & Gynecology MAY 2011

J Obstet Gynecol 2011.
www.AJOG.org Obstetrics Research
SUPPLEMENTARY TABLE 3Percent of infants delivered at 27 wwhose concentration of protein list
Category Protein
Cytokines and receptors IL-1�..........................
IL-6..........................
IL-6R..........................
TNF�..........................
TNF-R1..........................
TNF-R2...................................................................................................................
Systemic inflammation CRP..........................
SAA..........................
MPO...................................................................................................................
Chemokines IL-8 (CXCL..........................
MCP-1 (CC..........................
MCP-4 (CC..........................
MIP-1� (C..........................
RANTES (C..........................
I-TAC (CXC...................................................................................................................
Adhesion molecules ICAM-1 (C..........................
ICAM-3 (C..........................
VCAM-1 (C..........................
E-sel (CD6...................................................................................................................
Metallo-proteinases MMP-1..........................
MMP-9...................................................................................................................
Angiogenic proteins VEGF..........................
VEGF-R1..........................
VEGF-R2..........................
IGFBP-1...................................................................................................................
Maximum N...................................................................................................................
McElrath. Protein profiles by pregnancy complication. Am
eeks’ gestation for each indicationed on the left is in the highest quartile
Indication for preterm delivery
PTL pPROM CI PA FI/IUGR PE
33 45 13 25 25 21.............................................................................................................................................................................................................................................................
22 41 25 25 19 23.............................................................................................................................................................................................................................................................
25 39 50 29 38 15.............................................................................................................................................................................................................................................................
24 47 38 21 31 31.............................................................................................................................................................................................................................................................
26 36 38 13 38 15.............................................................................................................................................................................................................................................................
27 36 38 17 31 17.............................................................................................................................................................................................................................................................
23 36 38 4 31 23.............................................................................................................................................................................................................................................................
24 34 38 4 25 27.............................................................................................................................................................................................................................................................
31 42 63 8 13 17.............................................................................................................................................................................................................................................................
8) 23 34 25 13 31 31.............................................................................................................................................................................................................................................................
L2) 21 31 13 33 38 25.............................................................................................................................................................................................................................................................
L13) 27 38 50 21 38 17.............................................................................................................................................................................................................................................................
CL4) 23 44 25 17 25 23.............................................................................................................................................................................................................................................................
CL5) 26 38 38 25 31 10.............................................................................................................................................................................................................................................................
L11) 26 41 50 13 38 13.............................................................................................................................................................................................................................................................
D54) 28 31 38 8 31 23.............................................................................................................................................................................................................................................................
D50) 27 42 63 21 31 6.............................................................................................................................................................................................................................................................
D106) 32 34 38 13 38 13.............................................................................................................................................................................................................................................................
2E) 26 44 50 13 31 15.............................................................................................................................................................................................................................................................
29 23 38 25 44 15.............................................................................................................................................................................................................................................................
27 39 50 21 19 6.............................................................................................................................................................................................................................................................
29 41 50 17 19 17.............................................................................................................................................................................................................................................................
23 17 25 25 31 54.............................................................................................................................................................................................................................................................
31 33 50 17 25 17.............................................................................................................................................................................................................................................................
17 17 25 29 44 54.............................................................................................................................................................................................................................................................
124 64 8 24 16 48.............................................................................................................................................................................................................................................................
MAY 2011 American Journal of Obstetrics & Gynecology 418.e12


