Embed Size (px)
Citation preview
Board of TrusteesMeeting of September 24, 2021
0(|RF.OKLAHOMA MUNICIPAL
RETIREMENT FUND
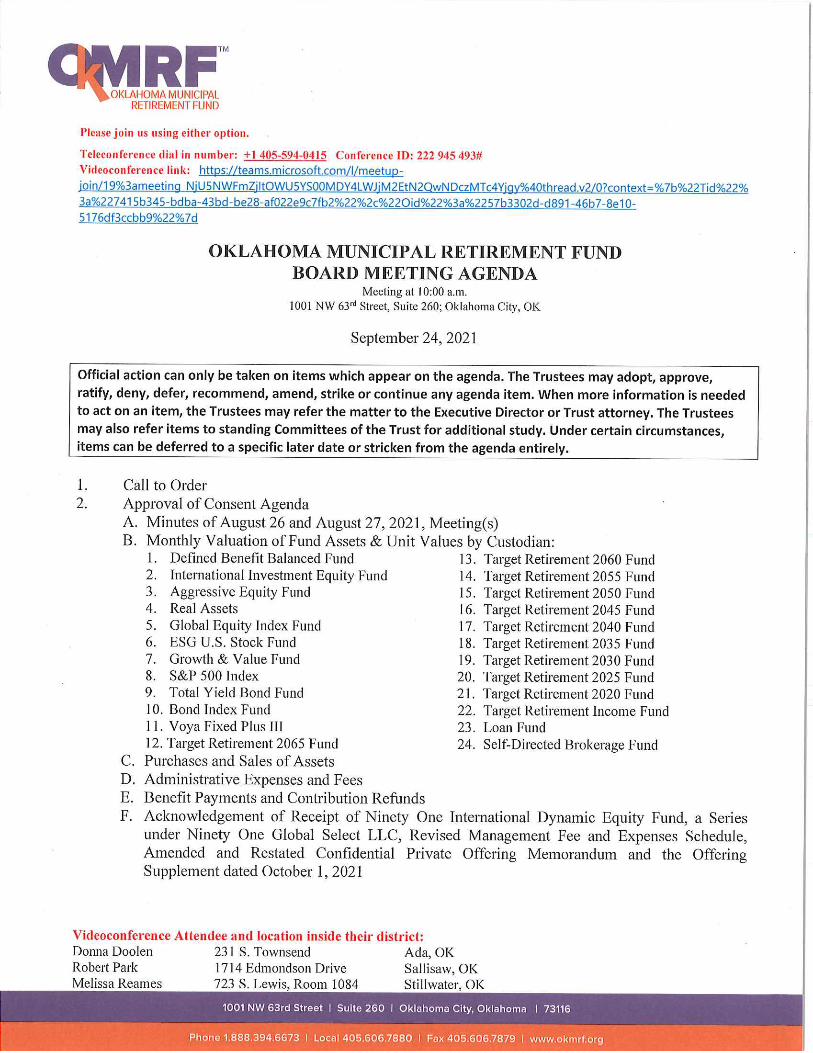
Please join us using either option.
Teleconference dial in number: +1 405-594-0415 Conference ID: 222 945 493H
Virleoconference link: https://teams.microsoft,com/l/meetup-
loin/19%3ameeting NiU5NWFmZiltOWU5YSOOMDY4LWJiM2EtN2QwNDczMTc4Yiav%40thread.v2/0?context=%7b%22Tid%22%3a%227415b345-bdba-43bd-be28-af022e9c7fb2%22%2c%220id%22%3a%2257b3302d-d891-46b7-8e10-
5176df3ccbb9%22%7d
OKLAHOMA MUNICIPAL RETIREMENT FUNDBOARD MEETING AGENDA
Meeting at 10:00 a.m.
1001 NW 63rd Street, Suite 260; Oklahoma City, OK
September 24, 2021
Official action can only be taken on items which appear on the agenda. The Trustees may adopt/ approve,
ratify, deny/ defer/ recommend/ amend, strike or continue any agenda item. When more information is needed
to act on an item, the Trustees may refer the matter to the Executive Director or Trust attorney. The Trustees
may also refer items to standing Committees of the Trust for additional study. Under certain circumstances/
items can be deferred to a specific later date or stricken from the agenda entirely.
1. Call to Order
2. Approval of Consent Agenda
A. Minutes of August 26 and August 27, 2021, Meeting(s)B. Monthly Valuation of Fund Assets & Unit Values by Custodian:
1. Defined Benefit Balanced Fund2. International Investment Equity Fund
3. Aggressive Equity Fund4. Real Assets
5. Global Equity Index Fund6. ESG U.S. Stock Fund
7. Growth & Value Fund8. S&P 500 Index9. Total Yield Bond Fund10. Bond Index Fund11. Voya Fixed Plus III12. Target Retirement 2065 Fund
C. Purchases and Sales of Assets
D. Administrative Expenses and FeesE. Benefit Payments and Contribution Refunds
F. Acknowledgement of Receipt of Ninety One International Dynamic Equity Fund, a Series
under Ninety One Global Select LLC, Revised Management Fee and Expenses Schedule,
Amended and Restated Confidential Private Offering Memorandum and the OfferingSupplement dated October 1, 2021
13. Target Retirement 2060 Fund14. Target Retirement 2055 Fund15. Target Retirement 2050 Fund16. Target Retirement 2045 Fund17. Target Retirement 2040 Fund18. Target Retirement 2035 Fund19. Target Retirement 2030 Fund20. Target Retirement 2025 Fund21. Target Retirement 2020 Fund22. Target Retirement Income Fund
23. Loan Fund
24. Self-Directed Brokerage Fund
Videoconference Attendee and location inside their district:Donna Doolen 231 S. Townsend Ada, OK
Robert Park 1714 Edmondson Drive Sallisaw, OKMelissa Reames 723 S. Lewis, Room 1084 Stillwater, OK
1001 NW 63rd Street I Suite 260 I Oklahoma City, Oklahoma I 73116
Phone1.888.394.6G73 I Local405.606.7880 I Fax405.606.7879 I www.okmrf.org
QdII.OKLAHOMA MUNICIPALRETIREMENT FUND
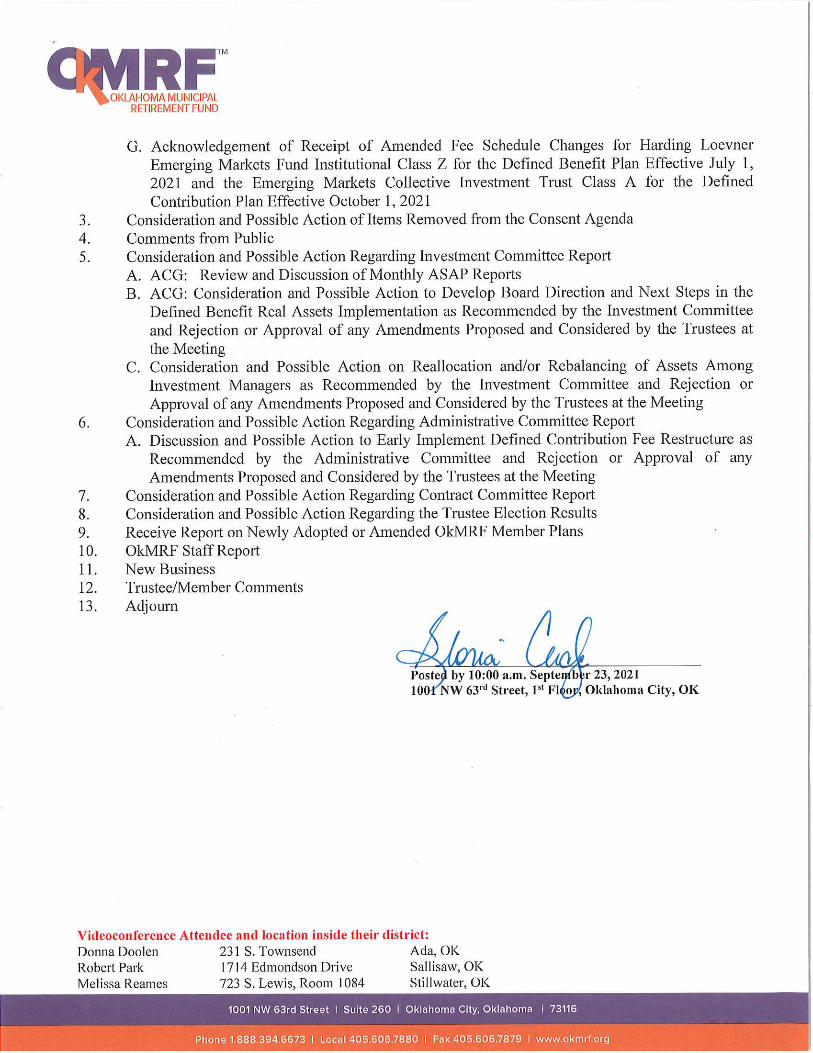
G. Acknowledgement of Receipt of Amended Fee Schedule Changes for Harding Loevner
Emerging Markets Fund Institutional Class Z for the Defined Benefit Plan Effective July 1,2021 and the Emerging Markets Collective Investment Trust Class A for the DefinedContribution Plan Effective October 1 , 2021
3. Consideration and Possible Action of Items Removed from the Consent Agenda4. Comments from Public
5. Consideration and Possible Action Regarding Investment Committee Report
A. ACG: Review and Discussion of Monthly ASAP ReportsB. ACG: Consideration and Possible Action to Develop Board Direction and Next Steps in the
Defined Benefit Real Assets Implementation as Recommended by the Investment Committeeand Rejection or Approval of any Amendments Proposed and Considered by the Trustees at
the MeetingC. Consideration and Possible Action on Reallocation and/or Rebalancing of Assets Among
Investment Managers as Recommended by the Investnent Committee and Rejection or
Approval of any Amendments Proposed and Considered by the Trustees at the Meeting
6. Consideration and Possible Action Regarding Administrative Committee ReportA. Discussion and Possible Action to Early Implement Defined Contribution Fee Restructure as
Recommended by the Administrative Committee and Rejection or Approval of any
Amendments Proposed and Considered by the Trustees at the Meeting
7. Consideration and Possible Action Regarding Contract Committee Report8. Consideration and Possible Action Regarding the Trustee Election Results
9. Receive Report on Newly Adopted or Amended OkMRF Member Plans10. OkMRF Staff Report11. New Business
12. Trustee/Member Comments
13. Adjourn
(m^ u^Posteii by 10:00 a.m. Septei^^r 23,2021lOft^NW 63rd Street, 1st Fl^oj^ Oklahoma City, OK
Videoconfercnce Attendee and location inside their district:
Donna Doolen 231 S. Townsend Ada, OKRobert Park 1714 Edmondson Drive Sallisaw, OKMelissa Reames 723 S. Lewis, Room 1084 Stillwater, OK
1001 NW 63rd Street I Suite 260 i Oklahoma City, Oklahoma t 73116
Phone 1.888.394.6673 I Local 405.606.7880 I Fax 405.606.7879 I www.okmrf.org
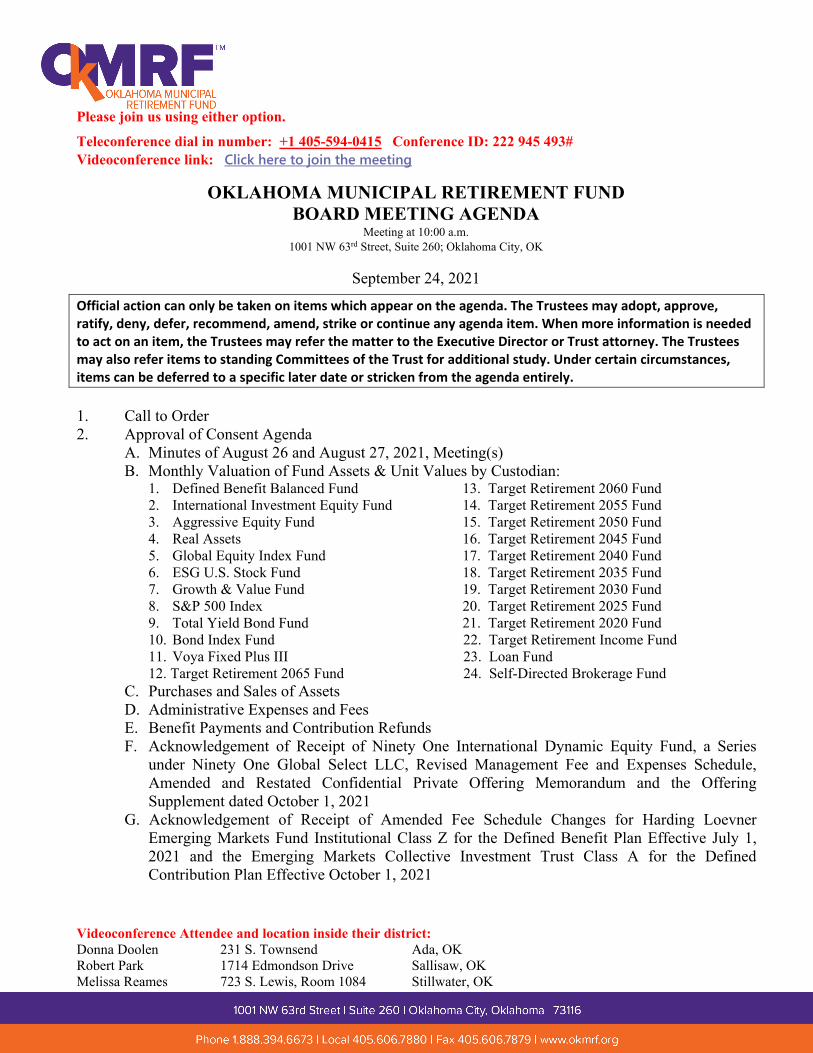
Please join us using either option.
Teleconference dial in number: +1 405-594-0415 Conference ID: 222 945 493# Videoconference link: Click here to join the meeting
Videoconference Attendee and location inside their district: Donna Doolen 231 S. Townsend Ada, OK Robert Park 1714 Edmondson Drive Sallisaw, OK Melissa Reames 723 S. Lewis, Room 1084 Stillwater, OK
OKLAHOMA MUNICIPAL RETIREMENT FUND BOARD MEETING AGENDA
Meeting at 10:00 a.m. 1001 NW 63rd Street, Suite 260; Oklahoma City, OK
September 24, 2021
Official action can only be taken on items which appear on the agenda. The Trustees may adopt, approve, ratify, deny, defer, recommend, amend, strike or continue any agenda item. When more information is needed to act on an item, the Trustees may refer the matter to the Executive Director or Trust attorney. The Trustees may also refer items to standing Committees of the Trust for additional study. Under certain circumstances, items can be deferred to a specific later date or stricken from the agenda entirely.
1. Call to Order2. Approval of Consent Agenda
A. Minutes of August 26 and August 27, 2021, Meeting(s)B. Monthly Valuation of Fund Assets & Unit Values by Custodian:
1. Defined Benefit Balanced Fund2. International Investment Equity Fund3. Aggressive Equity Fund
4. Real Assets5. Global Equity Index Fund6. ESG U.S. Stock Fund7. Growth & Value Fund8. S&P 500 Index9. Total Yield Bond Fund
13. Target Retirement 2060 Fund14. Target Retirement 2055 Fund15. Target Retirement 2050 Fund16. Target Retirement 2045 Fund17. Target Retirement 2040 Fund18. Target Retirement 2035 Fund19. Target Retirement 2030 Fund20. Target Retirement 2025 Fund21. Target Retirement 2020 Fund
10. Bond Index Fund 22. Target Retirement Income Fund11. Voya Fixed Plus III 23. Loan Fund12. Target Retirement 2065 Fund 24. Self-Directed Brokerage Fund
C. Purchases and Sales of AssetsD. Administrative Expenses and FeesE. Benefit Payments and Contribution RefundsF. Acknowledgement of Receipt of Ninety One International Dynamic Equity Fund, a Series
under Ninety One Global Select LLC, Revised Management Fee and Expenses Schedule,Amended and Restated Confidential Private Offering Memorandum and the OfferingSupplement dated October 1, 2021
G. Acknowledgement of Receipt of Amended Fee Schedule Changes for Harding LoevnerEmerging Markets Fund Institutional Class Z for the Defined Benefit Plan Effective July 1,2021 and the Emerging Markets Collective Investment Trust Class A for the DefinedContribution Plan Effective October 1, 2021
Videoconference Attendee and location inside their district:
Donna Doolen 231 S. Townsend Ada, OK Robert Park 1714 Edmondson Drive Sallisaw, OK Melissa Reames 723 S. Lewis, Room 1084 Stillwater, OK
3. Consideration and Possible Action of Items Removed from the Consent Agenda4. Comments from Public5. Consideration and Possible Action Regarding Investment Committee Report
A. ACG: Review and Discussion of Monthly ASAP ReportsB. ACG: Consideration and Possible Action to Develop Board Direction and Next Steps in the
Defined Benefit Real Assets Implementation as Recommended by the Investment Committeeand Rejection or Approval of any Amendments Proposed and Considered by the Trustees atthe Meeting
C. Consideration and Possible Action on Reallocation and/or Rebalancing of Assets AmongInvestment Managers as Recommended by the Investment Committee and Rejection orApproval of any Amendments Proposed and Considered by the Trustees at the Meeting
6. Consideration and Possible Action Regarding Administrative Committee ReportA. Discussion and Possible Action to Early Implement Defined Contribution Fee Restructure as
Recommended by the Administrative Committee and Rejection or Approval of anyAmendments Proposed and Considered by the Trustees at the Meeting
7. Consideration and Possible Action Regarding Contract Committee Report8. Consideration and Possible Action Regarding the Trustee Election Results9. Receive Report on Newly Adopted or Amended OkMRF Member Plans10. OkMRF Staff Report11. New Business12. Trustee/Member Comments13. Adjourn
________________________________________ Posted by 10:00 a.m. September 23, 2021 1001 NW 63rd Street, 1st Floor, Oklahoma City, OK
Updated 9/20/2021
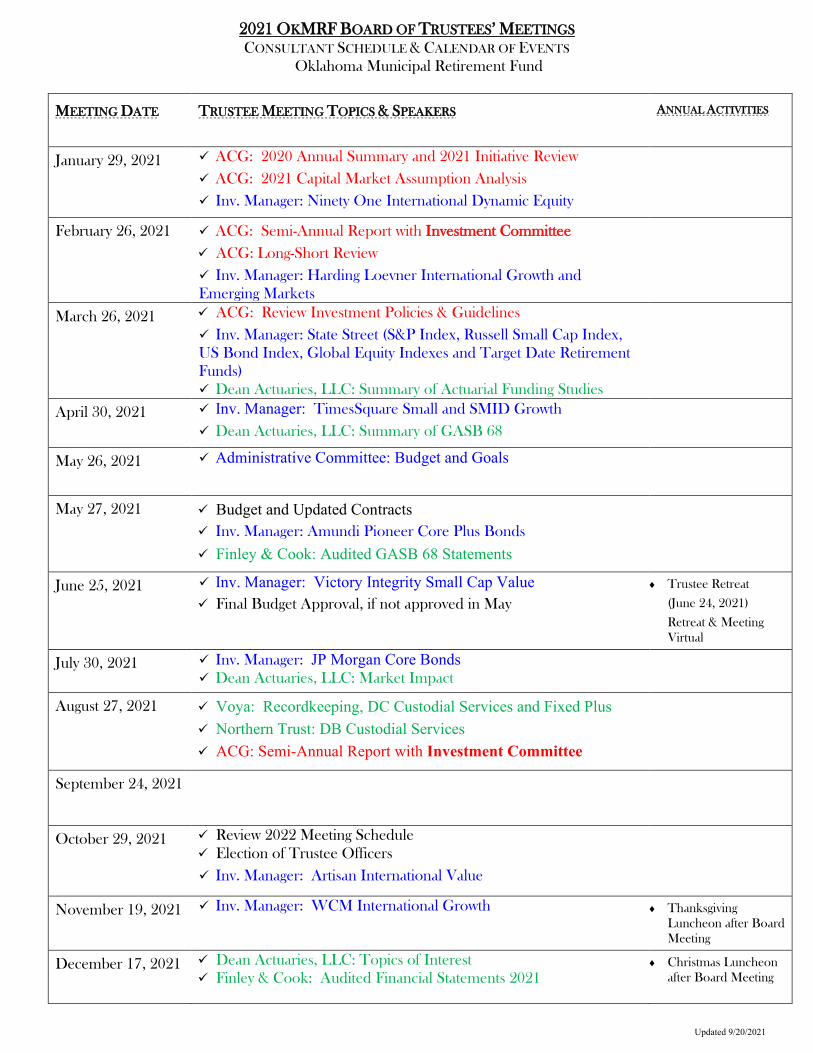
2021 OKMRF BOARD OF TRUSTEES’ MEETINGS CONSULTANT SCHEDULE & CALENDAR OF EVENTS
Oklahoma Municipal Retirement Fund
MEETING DATE TRUSTEE MEETING TOPICS & SPEAKERS ANNUAL ACTIVITIES
January 29, 2021
ACG: 2020 Annual Summary and 2021 Initiative Review ACG: 2021 Capital Market Assumption Analysis Inv. Manager: Ninety One International Dynamic Equity
February 26, 2021 ACG: Semi-Annual Report with Investment Committee ACG: Long-Short Review Inv. Manager: Harding Loevner International Growth and Emerging Markets
March 26, 2021 ACG: Review Investment Policies & Guidelines Inv. Manager: State Street (S&P Index, Russell Small Cap Index, US Bond Index, Global Equity Indexes and Target Date Retirement Funds) Dean Actuaries, LLC: Summary of Actuarial Funding Studies
April 30, 2021 Inv. Manager: TimesSquare Small and SMID Growth Dean Actuaries, LLC: Summary of GASB 68
May 26, 2021 Administrative Committee: Budget and Goals
May 27, 2021 Budget and Updated Contracts Inv. Manager: Amundi Pioneer Core Plus Bonds
Finley & Cook: Audited GASB 68 Statements
June 25, 2021 Inv. Manager: Victory Integrity Small Cap Value Final Budget Approval, if not approved in May
♦ Trustee Retreat
(June 24, 2021)
Retreat & Meeting Virtual
July 30, 2021 Inv. Manager: JP Morgan Core Bonds Dean Actuaries, LLC: Market Impact
August 27, 2021 Voya: Recordkeeping, DC Custodial Services and Fixed Plus Northern Trust: DB Custodial Services ACG: Semi-Annual Report with Investment Committee
September 24, 2021
October 29, 2021 Review 2022 Meeting Schedule Election of Trustee Officers Inv. Manager: Artisan International Value
November 19, 2021 Inv. Manager: WCM International Growth ♦ Thanksgiving Luncheon after Board Meeting
December 17, 2021 Dean Actuaries, LLC: Topics of Interest Finley & Cook: Audited Financial Statements 2021
♦ Christmas Luncheon after Board Meeting
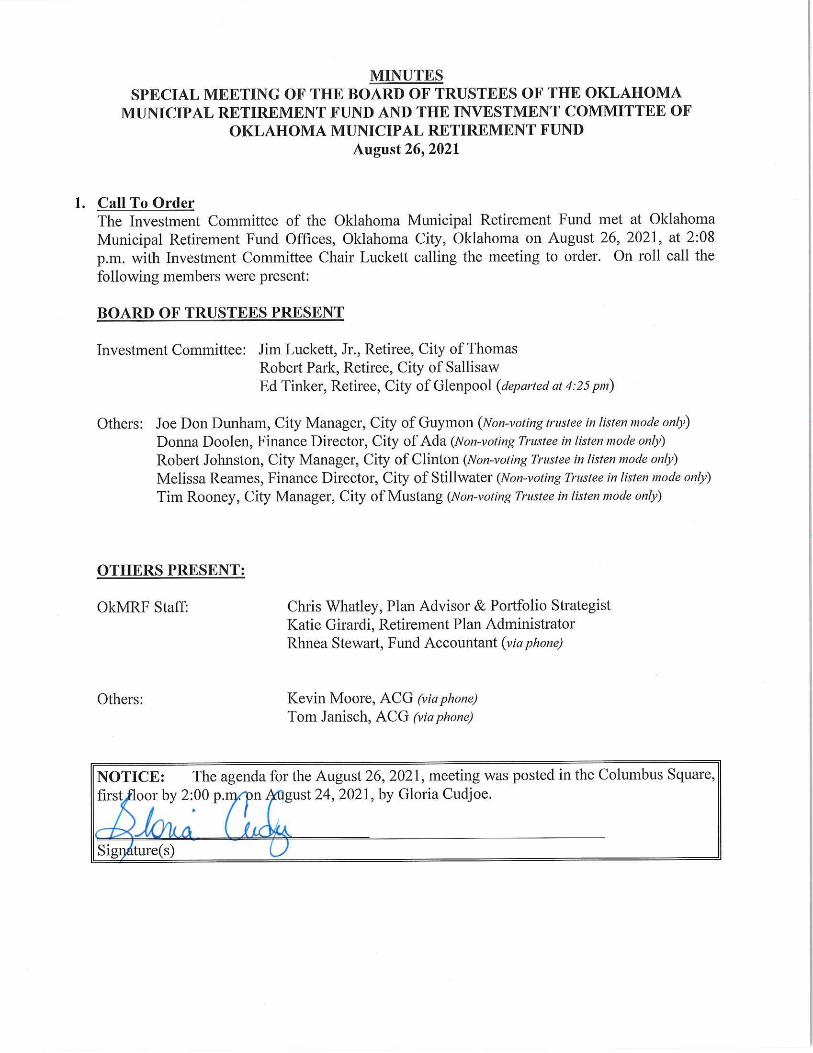
MINUTESSPECIAL MEETING OF THE BOARD OF TRUSTEES OF THE OKLAHOMA
MUNICIPAL RETIREMENT FUND AND THE INVESTMENT COMMITTEE OFOKLAHOMA MUNICIPAL RETIREMENT FUND
August 26,2021
1. Call To OrderThe Investment Committee of the Oklahoma Municipal Retirement Fund met at Oklahoma
Municipal Retirement Fund Offices, Oklahoma City, Oklahoma on August 26, 2021, at 2:08p.m. with Investment Committee Chair Luckett calling the meeting to order. On roll call the
following members were present:
BOARD OF TRUSTEESPRESENT
Investment Committee: Jim Luckett, Jr., Retiree, City of ThomasRobert Park, Retiree, City ofSallisaw
Ed Tinker, Retiree, City ofGlenpool {departed at 4:25 pm}
Others: Joe Don Dunham, City Manager, City ofGuymon (Non-votmg trustee in listen mode only}Donna Doolen, Finance Director, City of Ada (Non-vofwg Trustee m listen mode only)
Robert Johnston, City Manager, City of Clinton (Non-vofmg Trustee in listen moc/e only)Melissa Reames, Finance Director, City of Stillwater {Non-votmg Trustee in listen mode only)
Tim Rooney, City Manager, City of Mustang (Non-votmg Trustee m listen mode only)
OTHERS PRESENT:
OkMRF Staff: Chris Whatley, Plan Advisor & Portfolio StrategistKatie Girardi, Retirement Plan Administrator
Rhnea Stewart, Fund Accountant (via phone)
Others: Kevin Moore, ACG (via phone)Tom Janisch, ACG (via phone)
NOTICE:first^loor by
^^•\Sigi)^ture(s)
2:
A
The:00p
agenda
m
M
for^
V
the;ust
August 26, 2021, meeting was
24, 2021, by Gloria Cudjoe.posted in the Columbus Square,
Page 2OkMRF 1C Minutes
August 26, 2021
Investment Committee Chair, Luckett, extended a welcome to all in attendance and presided
over the meeting.
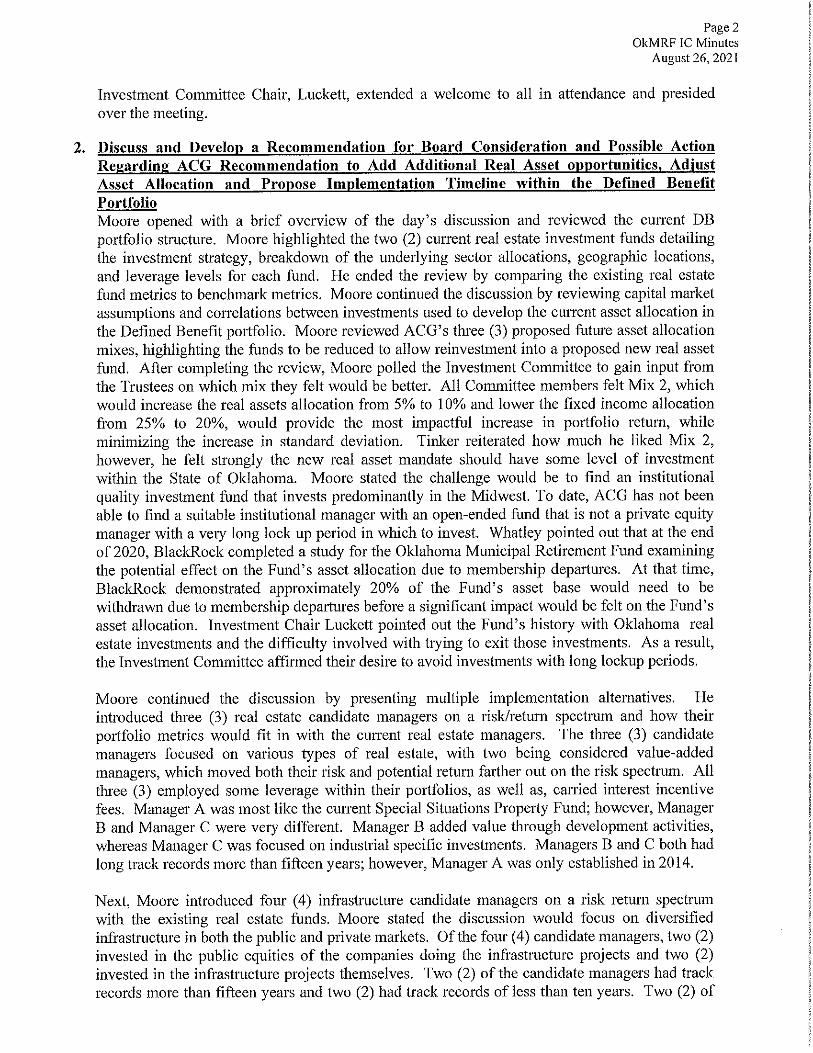
2. Discuss and Develop a Recommendation for Board Consideration and Possible Action
Regarding ACG Recommendation to Add Additional Real Asset opportunities, AdiystAsset Allocation and Propose Implementation Timeline within the Defined Benefit
PortfolioMoore opened with a brief overview of the day's discussion and reviewed the current DB
portfolio structure. Moore highlighted the two (2) current real estate investment funds detailingthe investment strategy, breakdown of the underlying sector allocations, geographic locations,
and leverage levels for each fund. He ended the review by comparing the existing real estatefund metrics to benchmark metrics. Moore continued the discussion by reviewing capital market
assumptions and correlations between investments used to develop the current asset allocation inthe Defined Benefit portfolio. Moore reviewed ACG's three (3) proposed future asset allocation
mixes, highlighting the funds to be reduced to allow reinvestment into a proposed new real assetfund. After completing the review, Moore polled the Investment Committee to gain input from
the Trustees on which mix they felt would be better. All Committee members felt Mix 2, whichwould increase the real assets allocation from 5% to 10% and lower the fixed income allocation
from 25% to 20%, would provide the most impactful increase in portfolio return, while
minimizing the increase in standard deviation. Tinker reiterated how much he liked Mix 2,
however, he felt strongly the new real asset mandate should have some level of investment
within the State of Oklahoma. Moore stated the challenge would be to find an institutionalquality investment fund that invests predominantly in the Midwest. To date, ACG has not been
able to find a suitable institutional manager with an open-ended fund that is not a private equity
manager with a veiy long lock up period in which to invest. Whatley pointed out that at the end
of 2020, BlackRock completed a study for the Oklahoma Municipal Retirement Fund examiningthe potential effect on the Fund's asset allocation due to membership departures. At that time,BlackRock demonstrated approximately 20% of the Fund's asset base would need to be
withdrawn due to membership departures before a significant impact would be felt on the Fund's
asset allocation. Investment Chair Luckett pointed out the Fund's history with Oklahoma realestate investments and the difficulty involved with trying to exit those investments. As a result,
the Investment Committee affirmed their desire to avoid investments with long lookup periods.
Moore continued the discussion by presenting multiple implementation alternatives. Heintroduced three (3) real estate candidate managers on a risk/return spectrum and how their
portfolio metrics would fit in with the current real estate managers. The three (3) candidate
managers focused on various types of real estate, with two being considered value-addedmanagers, which moved both their risk and potential return farther out on the risk spectrum. All
three (3) employed some leverage within their portfolios, as well as, carried interest incentivefees. Manager A was most like the current Special Situations Property Fund; however, ManagerB and Manager C were very different. Manager B added value through development activities,
whereas Manager C was focused on industrial specific investments. Managers B and C both had
long track records more than fifteen years; however, Manager A was only established in 2014.
Next, Moore introduced four (4) infrastructure candidate managers on a risk return spectrumwith the existing real estate funds. Moore stated the discussion would focus on diversified
infrastructure in both the public and private markets. Of the four (4) candidate managers, two (2)invested in the public equities of the companies doing the infrastructure projects and two (2)invested in the infrastructure projects themselves. Two (2) of the candidate managers had trackrecords more than fifteen years and two (2) had track records of less than ten years. Two (2) of
Page 3OkMRF 1C Minutes
August 26, 2021
the managers were easily accessed through exchange traded funds or mutual funds, while the
remaining managers were private commingled open-end funds. Moore concluded the discussionwith ACG's proposed next steps.
The Investment Committee stated they would like to proceed with discussions and proposal from
ACG regarding investing either in infrastructure or value-add real estate options.
Motion by Park, seconded by Tinker to recommend to the Oklahoma Municipal Retirement Fund
Board of Trustees to gravitate the asset allocation towards the proposed Mix 2, increasing thereal assets allocation from 5% to 10% and lowering the fixed income allocation from 25% to
20%, in a timely fashion.
Luckett: Yes Park: Yes Tinker: Yes
3. Discussion, Education and Update on Lone/Shorf Portfolio
Janisch reviewed how ACG constructs the Long/Short portfolio using a core/satellite/emergin^
manager approach with the objective of maximizing on upside participation with downsideprotection over the long-term horizons. The Long/Short portfolio is diversified between
long/short managers who hold differing company stocks based on market cap size, industry,
sector, region, country, etc. The portfolio currently has eleven (11) managers with a net exposureof 75% as of June 30, 2021. Janisch reviewed portfolio statistics, highlighting individualmanager's long and short exposures, geographic sectors, market cap, and sector positioningcompared to the HFRI Index. Over the last five (5) years, the Long/Short portfolio returned10.33% compared to the HFRI Strategic Index of 7.07%. Furthermore, using the Sharpe ratio,
the portfolio has provided more return per unit of risk over the same time horizon measured
when compared to both the HFRI Strategic Index and the ACWI Index.
4. Conduct Semi-AnnuaI Investment Performance Review and Receive Quarterly
Performance Report for June 30, 2021 as Presented by Asset Consulting GroupMoore reviewed the June 30, 2021, quarterly performance report emphasizing the risk/return
metrics of the DB portfolio. All risk and return metrics exceeded the policy index over the lastfive (5) and ten (10) year horizons. In addition, peer group rankings with other DB public plansaround the nation placed the OkMRF portfolio in the top quintile of performers over the lastthree (3), five (5) and ten (10) year periods.
In the DC plan, Moore highlighted the five (5) and ten (10) year performance numbers for theactively managed fund options. In all cases, except the Aggressive Equity Fund, Moore notedthe strong performance of the fund options versus both the benchmark and the peer group. Even
though the Aggressive Equity fund has not been as strong, the white-label fund continues to rank
in the top 30 percentile versus both U.S. Mid-Cap Core Equity universe and the U.S. Small-CapCore Equity universe over a five (5) year horizon and top 50 percentile versus U.S. Mid-Cap
Core Equity universe and the U.S. Small-Cap Core Equity universe over a ten (10) year horizon.
5. New Business
None.
6. AdjournWith no further discussion, meeting adjourned at 4:34 p.m.
\... - ^ /--/ Y i f
Jim Luckettt Jr., Investment Chair Dcffma Doolen/^hair
Page 4OkMRF 1C Minutes
August 26,2021
Respectfully submitted by:
M^"t^/^f^ ^ ^=<i -»^-» A T-:z=
^AT'....*.;-"'<^''<,6kL(^'y
r/""^l'^^^'
MINUTES
SPECIAL MEETING OF THE BOARD OF TRUSTEES OF THE OKLAHOMA MUNICIPAL RETIREMENT FUND AND THE INVESTMENT COMMITTEE OF
OKLAHOMA MUNICIPAL RETIREMENT FUND August 26, 2021
1. Call To Order
The Investment Committee of the Oklahoma Municipal Retirement Fund met at Oklahoma Municipal Retirement Fund Offices, Oklahoma City, Oklahoma on August 26, 2021, at 2:08 p.m. with Investment Committee Chair Luckett calling the meeting to order. On roll call the following members were present: BOARD OF TRUSTEES PRESENT Investment Committee: Jim Luckett, Jr., Retiree, City of Thomas Robert Park, Retiree, City of Sallisaw Ed Tinker, Retiree, City of Glenpool (departed at 4:25 pm) Others: Joe Don Dunham, City Manager, City of Guymon (Non-voting trustee in listen mode only) Donna Doolen, Finance Director, City of Ada (Non-voting Trustee in listen mode only) Robert Johnston, City Manager, City of Clinton (Non-voting Trustee in listen mode only) Melissa Reames, Finance Director, City of Stillwater (Non-voting Trustee in listen mode only) Tim Rooney, City Manager, City of Mustang (Non-voting Trustee in listen mode only)
OTHERS PRESENT: OkMRF Staff: Chris Whatley, Plan Advisor & Portfolio Strategist Katie Girardi, Retirement Plan Administrator Rhnea Stewart, Fund Accountant (via phone) Others: Kevin Moore, ACG (via phone) Tom Janisch, ACG (via phone) NOTICE: The agenda for the August 26, 2021, meeting was posted in the Columbus Square, first floor by 2:00 p.m. on August 24, 2021, by Gloria Cudjoe. ________________________________________________________________ Signature(s)
Page 2 OkMRF IC Minutes
August 26, 2021 Investment Committee Chair, Luckett, extended a welcome to all in attendance and presided over the meeting.
2. Discuss and Develop a Recommendation for Board Consideration and Possible Action Regarding ACG Recommendation to Add Additional Real Asset opportunities, Adjust Asset Allocation and Propose Implementation Timeline within the Defined Benefit Portfolio Moore opened with a brief overview of the day’s discussion and reviewed the current DB portfolio structure. Moore highlighted the two (2) current real estate investment funds detailing the investment strategy, breakdown of the underlying sector allocations, geographic locations, and leverage levels for each fund. He ended the review by comparing the existing real estate fund metrics to benchmark metrics. Moore continued the discussion by reviewing capital market assumptions and correlations between investments used to develop the current asset allocation in the Defined Benefit portfolio. Moore reviewed ACG’s three (3) proposed future asset allocation mixes, highlighting the funds to be reduced to allow reinvestment into a proposed new real asset fund. After completing the review, Moore polled the Investment Committee to gain input from the Trustees on which mix they felt would be better. All Committee members felt Mix 2, which would increase the real assets allocation from 5% to 10% and lower the fixed income allocation from 25% to 20%, would provide the most impactful increase in portfolio return, while minimizing the increase in standard deviation. Tinker reiterated how much he liked Mix 2, however, he felt strongly the new real asset mandate should have some level of investment within the State of Oklahoma. Moore stated the challenge would be to find an institutional quality investment fund that invests predominantly in the Midwest. To date, ACG has not been able to find a suitable institutional manager with an open-ended fund that is not a private equity manager with a very long lock up period in which to invest. Whatley pointed out that at the end of 2020, BlackRock completed a study for the Oklahoma Municipal Retirement Fund examining the potential effect on the Fund’s asset allocation due to membership departures. At that time, BlackRock demonstrated approximately 20% of the Fund’s asset base would need to be withdrawn due to membership departures before a significant impact would be felt on the Fund’s asset allocation. Investment Chair Luckett pointed out the Fund’s history with Oklahoma real estate investments and the difficulty involved with trying to exit those investments. As a result, the Investment Committee affirmed their desire to avoid investments with long lockup periods. Moore continued the discussion by presenting multiple implementation alternatives. He introduced three (3) real estate candidate managers on a risk/return spectrum and how their portfolio metrics would fit in with the current real estate managers. The three (3) candidate managers focused on various types of real estate, with two being considered value-added managers, which moved both their risk and potential return farther out on the risk spectrum. All three (3) employed some leverage within their portfolios, as well as, carried interest incentive fees. Manager A was most like the current Special Situations Property Fund; however, Manager B and Manager C were very different. Manager B added value through development activities, whereas Manager C was focused on industrial specific investments. Managers B and C both had long track records more than fifteen years; however, Manager A was only established in 2014. Next, Moore introduced four (4) infrastructure candidate managers on a risk return spectrum with the existing real estate funds. Moore stated the discussion would focus on diversified infrastructure in both the public and private markets. Of the four (4) candidate managers, two (2) invested in the public equities of the companies doing the infrastructure projects and two (2) invested in the infrastructure projects themselves. Two (2) of the candidate managers had track records more than fifteen years and two (2) had track records of less than ten years. Two (2) of
Page 3 OkMRF IC Minutes
August 26, 2021 the managers were easily accessed through exchange traded funds or mutual funds, while the remaining managers were private commingled open-end funds. Moore concluded the discussion with ACG’s proposed next steps. The Investment Committee stated they would like to proceed with discussions and proposal from ACG regarding investing either in infrastructure or value-add real estate options. Motion by Park, seconded by Tinker to recommend to the Oklahoma Municipal Retirement Fund Board of Trustees to gravitate the asset allocation towards the proposed Mix 2, increasing the real assets allocation from 5% to 10% and lowering the fixed income allocation from 25% to 20%, in a timely fashion. Luckett: Yes Park: Yes Tinker: Yes
3. Discussion, Education and Update on Long/Short Portfolio Janisch reviewed how ACG constructs the Long/Short portfolio using a core/satellite/emerging manager approach with the objective of maximizing on upside participation with downside protection over the long-term horizons. The Long/Short portfolio is diversified between long/short managers who hold differing company stocks based on market cap size, industry, sector, region, country, etc. The portfolio currently has eleven (11) managers with a net exposure of 75% as of June 30, 2021. Janisch reviewed portfolio statistics, highlighting individual manager’s long and short exposures, geographic sectors, market cap, and sector positioning compared to the HFRI Index. Over the last five (5) years, the Long/Short portfolio returned 10.33% compared to the HFRI Strategic Index of 7.07%. Furthermore, using the Sharpe ratio, the portfolio has provided more return per unit of risk over the same time horizon measured when compared to both the HFRI Strategic Index and the ACWI Index.
4. Conduct Semi-Annual Investment Performance Review and Receive Quarterly Performance Report for June 30, 2021 as Presented by Asset Consulting Group Moore reviewed the June 30, 2021, quarterly performance report emphasizing the risk/return metrics of the DB portfolio. All risk and return metrics exceeded the policy index over the last five (5) and ten (10) year horizons. In addition, peer group rankings with other DB public plans around the nation placed the OkMRF portfolio in the top quintile of performers over the last three (3), five (5) and ten (10) year periods. In the DC plan, Moore highlighted the five (5) and ten (10) year performance numbers for the actively managed fund options. In all cases, except the Aggressive Equity Fund, Moore noted the strong performance of the fund options versus both the benchmark and the peer group. Even though the Aggressive Equity fund has not been as strong, the white-label fund continues to rank in the top 30 percentile versus both U.S. Mid-Cap Core Equity universe and the U.S. Small-Cap Core Equity universe over a five (5) year horizon and top 50 percentile versus U.S. Mid-Cap Core Equity universe and the U.S. Small-Cap Core Equity universe over a ten (10) year horizon.
5. New Business None.
6. Adjourn With no further discussion, meeting adjourned at 4:34 p.m.
Page 4 OkMRF IC Minutes
August 26, 2021
Jim Luckett, Jr., Investment Chair Donna Doolen, Chair
Respectfully submitted by:
Chris Whatley
MINUTESBOARD OF TRUSTEES
OKLAHOMA MUNICIPAL RETIREMENT FUNDAugust 27, 2021
1. Call To OrderThe BoEird of die Oklahoma Municipal Retirement Fund met at Oklahoma Municipal Retirement
Fund Offices, Oklahoma City, Oklahoma, on August 27, 2021, at 10:00 a.m. with Chair Doolenpresiding. On roll call, the following members were present:
BOARD OF TRUSTEESChair: Donna Doolen, Finance Director, City of Ada
Vicc-Chair: Robertjohnston, City Managei:, City of ClintonTreasurer: Jim Luckett,Jr., Retiree, City of Thomas
Sectctaiy: Robert Patk, Retiree, City of Salllsaw
Members: Joe Don Dunhaffl, City Manager, City ofGuymon
Melissa Reames, Deputy City Manager & Chief Financial Officer, City ofStiUwater (via video)
Tim Rooney, City Manager, City of MustangEd Tinket, Retiree, City of Glenpool
OTHERS PRESENT:
OkMRF Staff: Jodi Cox, CEO & Director (via video)Chris Whadey, Plan Advisor & Portfolio StrategistRlinea Stewart, Fund Accountant (via telephone)
Katie Girardi, Pkn Administrator
Otheis: Kevin Moore, ACG (mi video)Patricia SomervUle-Koulouris, Notthern. Trust (via video)
Deltra Haycs, Voya (via video)Jane Spatola, Voya (via video)Peter Wintetbottom, Voya (via video)
Scott Darcy, Voya (via video)Troy Bi-adley, Midwest City (via phone)Gar Chung, FIN News (via video]
Whatley opened the mcetmgwith prayer andjohnston led the Pledge of Allegiance.
Doolen welcomed everyone and called the meeting to order.
NOTICE: The agenda for the August 27, 2021 meeting was posted in Columbus Squ£ii:c,
Old^Aioma City, Oklal)0pa,/6y Gloria Cudjoe by 10:00 a.m. on August 26,2021.
toILO^_Signature (s)
2. Apptoval of Consent Agenda
The foUowing items were presented under the consent agenda.
A. Minutes of July 30. 2021 Meeting(s)
B. Monthly Valuation of Fund Assets & Unit Values by Custodian
Page 2OkMRF MinutesAugust 27,2021
Op>ti0n---r;',7:-\:'%^-'^-.^ ':....^;';.:'.^.:^"/1::'
Defined Benefit
International Investment Equity
Aggressive Equity
Real Assets Fund
ESG US Stock Fund
Global Equity
Growth and Value Equity
S & P 500 Index
Target Retirement 2065
Target Redremenfc 2060
Target Retirement 2055
Target Retirement 2050
Target Retirement 2045
Target Retirement 2040
Target Retkement 2035
Target Retirement 2030
Ttitget Retirement 2025
Target Retirement 2020
Target Retirement Income
Total Yield Bond Fund
Bond Index
Voya Fixed Plus III
Loan PortfoUo
Self Directed Brokerage
Total Assets
.;.. ~^^:.".^.""" ;-<:VaHle'%r'3?im^
$ 754,311,507.52
$ 10,235,533.27
$ 22,517,976.94
$ 753,322.94
^ 1,485,055.60
$ 11,369,771.47
$ 28,328,829.22
$ 38,745,667.21
$ 150,765.45
$ 5,546,851.21
$ 7,491,999.03
$ 12,566,078.96
$ 16,186,070.90
$ 21,552,995.16
$ 28,988,852.38
^ 33,102,509.97
$ 45,991,108.97
$ 36,000,673.29
$ 22,737,785.67
% 6,868,950.32
$ 16,968,975.91
$ 41,750,200.73
^ 8,138,985.59
^ 315,908.36
$ 1,172,106,376.07
Page 3OkMRF MinutesAugust 27, 2021
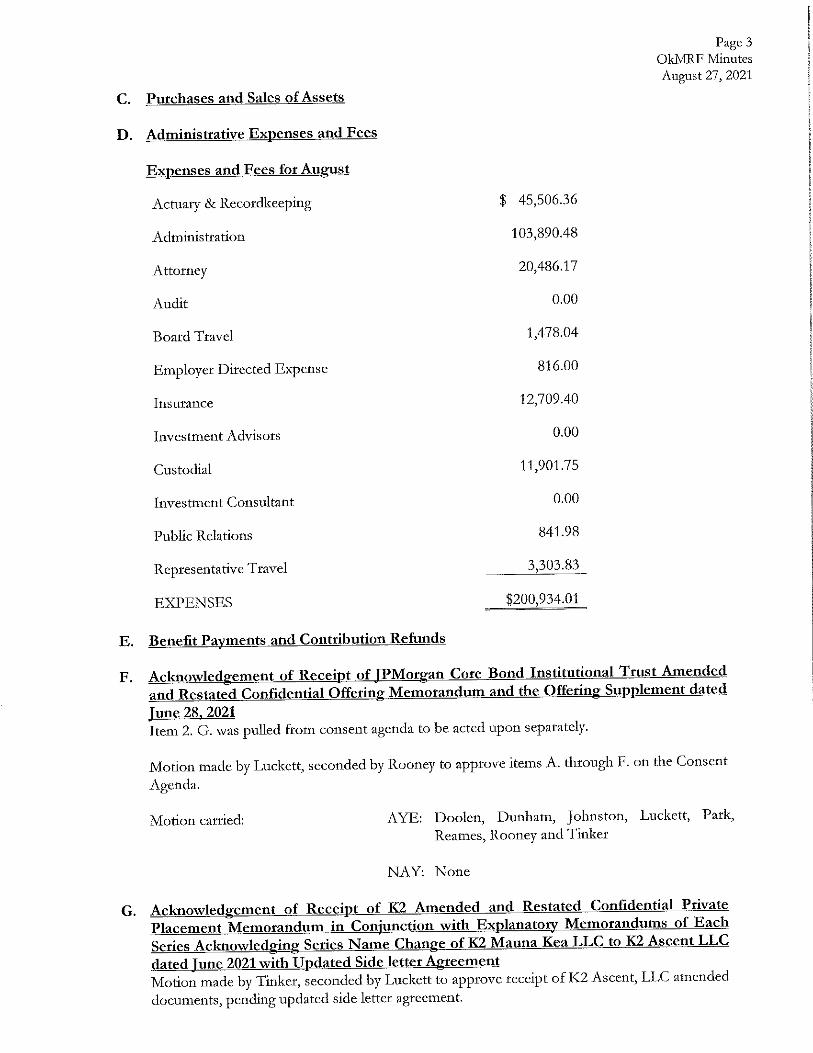
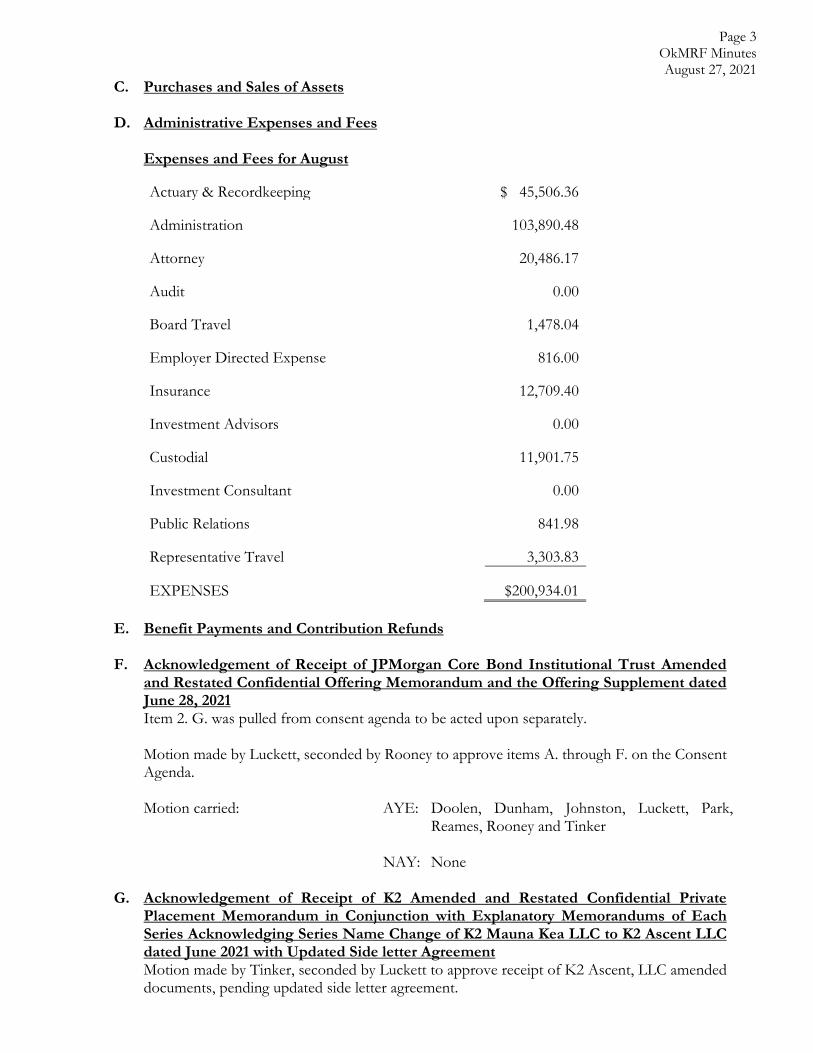
C. Purchases and Sales of Assets
D. Administmtive Expenses and Fees
Expenses and Fees fot August
Actuaiy & Recordkeeping $ 45,506.36
Admimsfcradoti 103,890.48
Attorney 20,486.17
Audit 0.00
Boatd Travel 1,478.04
Employer Directed Expense 816.00
Insurance 12,709.40
Investment Advisors 0.00
Custodial 11,901.75
Investment Consultant 0.00
Public Relations 841.98
Representative Travel 3,303.83
EXPENSES $200,934.01
E. Benefit Payments and Contribution Refunds
F. Acknowledgement of Receipt of JPMorgan Cote Bond Institutional Trust Amendedand Restated Confidential Offering Memotaadum and the Offering Supplement dated
June 28.2021Item 2. G. was puUed from consent agenda to be acted upon separately.
Motion made by Luckctt, seconded by Rooney to approve items A. thtough F. on the Consent
Agenda.
Motion carried: AYE: Doolea, Dunham, Johnston, Luckett, Piitk,
Reatnes, Rooney and Tinker
NAY: None
G. Acknowledgement of Receipt of K2 Amended and Restated Confidential PrivatePlacement Memotandum in Conjunction with Explanatory Memotandums of EachSeries Acknowledging Series Name Change of K2 Mauna Kea LLC to K2 Ascent LLC
dated June 2021 with Updated Side letter AgteementMotion made by Tinker, seconded by Luckett to approve receipt ofK2 Ascent, L3^C amended
documents, pending updated side letter agrecm.ent.
Page 4OkMRF MinutesAugust 27, 2021
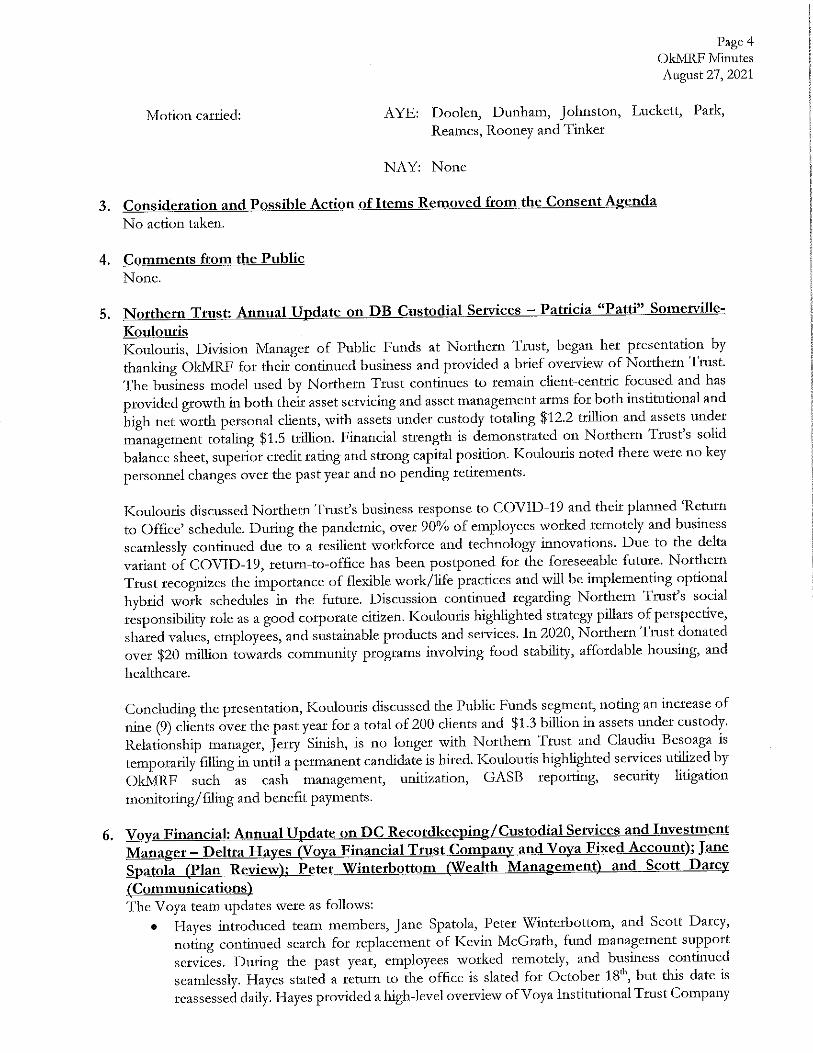
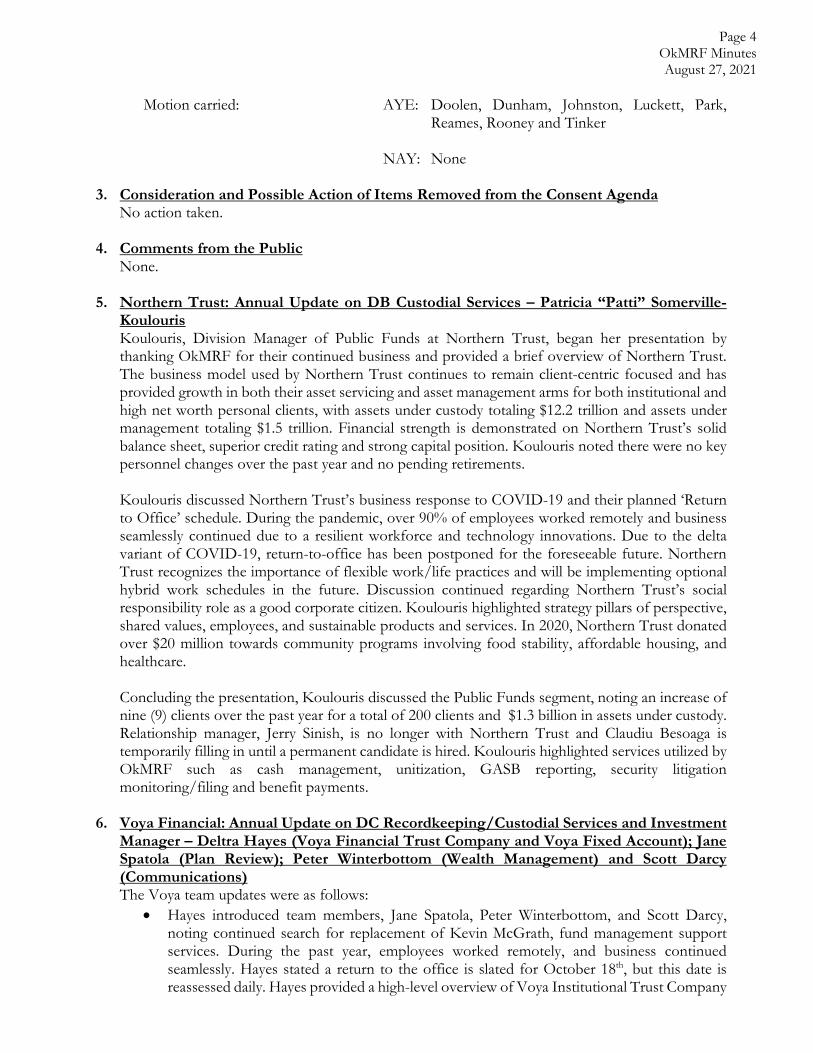
Motion carried: AYE: Doolen, Dunham, Johnston, Luckett, Park,
Reames, Rooney and Tinker
NAY: None
3. Consideration and Possible Action of Items Removed from the Consent AgendaNo action taken.
4. Comments from the Public
None.
5. Northern Trust: Annual Update on DB Custodial Services - Patricia "Patti" SomcrviUe-Koulouris
Koulouris, Division Manager of Public Funds at Northern Trust, began het presentation by
thanking OkMRF for theii: continued business and ptovided a brief overview of Northern Trust.
The business model used by Northern Trust continues to remain client-cen-tric focused and has
provided growth in both their asset servicing and asset management amis for both institudoml and
high net worth pctsonal clients, with assets under custody totaling $12.2 tclUion and assets under
management totaling $1.5 u-iUion. Financial strength is demon strated on Notdiern Trust's solid
balance sheet, superior credit rating and strong capital position. Koulouris noted there wete no key
personnel changes over the past year and no pending redtements.
Koulouiis discussed Northern Trust's business response to COVID-19 and their planned Return
to Office' schedule. During the pandemic, ovet 90% of employees worked retnotely and business
seamlessly continued due to a resilient workforce and technology innovations. Due to the delta
variant of COVID-19, tetum-to -office has been postponed for the foreseeable future. Northern
Trust recognizes die importance of flexible work/life practices and will be irnplementmg optionalhybrid work schedules in the future. Discussion continued regatding Northern Trust's social
responsibility role as a good corporate citizen. Koulouris highlighted sfa-ategy pillars of perspective,shared values, employees, and sustainable products and services. In 2020, Nofdiern Trust donated
over $20 tnilUon towards community progmms iavolv.tng food stability, affordable housing, and
healthcare.
Concluding the presentation, Koulouris discussed the Public Funds segment, noting an inct'ease of
nine (9) clients over the past year fot a total of 200 clients and $1.3 billion m assets under custody.
Relationship managef, JeiTy Sinish, is no longet with Northern Trust and Claudiu Besoaga istemporarily filling in until a permanent candidate is hked. Koulouris lughUghted services utilized byOkMRF such as cash management, unitixation, GASB reporting, security lidgationmonitoring/ filing and benefit payments.
6. Voya Financial: Annual Update on DC Recotdkeeping/Custodial Semces and InvestmentManager ^Delt£aJHayesJVoy(L?matK;ial Tnist Company and Voya Fixed Account); JaneSpatola (Plan Review); Peter Winterbottom (Wealth Management) and Scott Datcy(Communications)The Voya team updates were as follows:
» Hayes mtt'oduced team meinbers, Jane Spatola, Peter Wmterbottom, an-d Scott Darcy,
noting continued search for feplacemen.fc of Kevin McGrath, fund management support
services. During the past yeat, employees worked remotely, and business continued
seamlessly. PIaycs stated a return to tlie office is slated for October 18 , but this date is
ixassessed daily. Hayes provided a 1-dgh-level oveiview ofVoya Institutional Ti-ust Company
Page 5OkMRF MinutesAugust 27, 2021
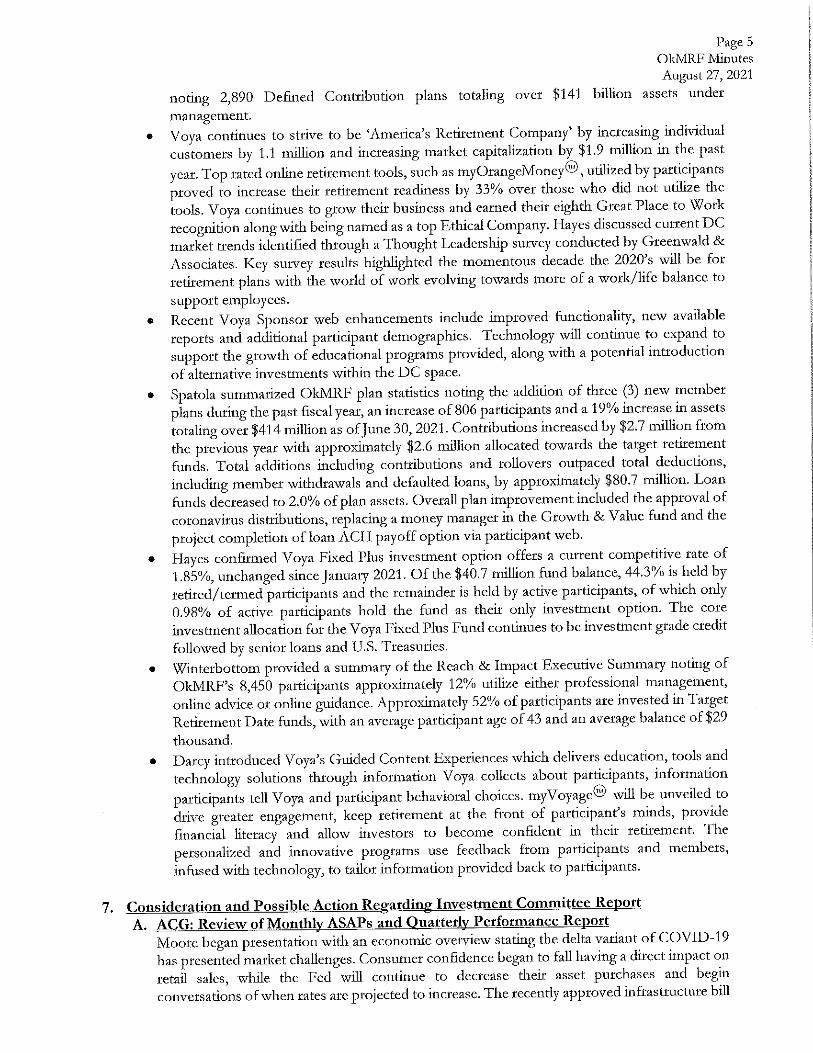
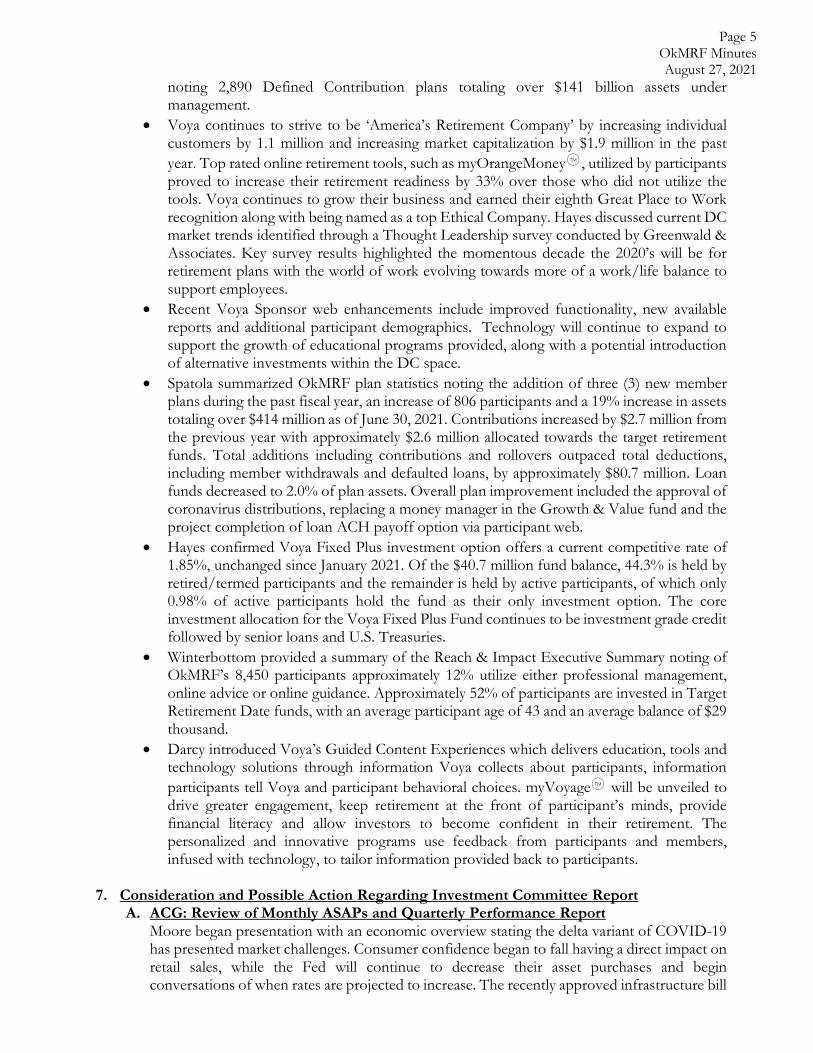
noting 2,890 Defined Contribudoti plans totaling ovet $141 billion assets undermanagement.
• Voya continues to strive to be 'America s Retirement Company" by increasing individual
customeirs by 1.1 n-uUion and increasmg market capitalization by $1.9 million in the past
yeat. Top rated online retUL'ement tools, such as tnyOrangeMoney^, utilized by paj:ddpants
proved to increase then retirement teadiness by 33% over those who did not utilize the
tools. Voya continues to grow their business and earned their eighth Great Place to Work
recognition along with being named as a top Ethical Company. Hayes discussed cut'rent DC
market trends identified through a Thought Leadership survey conducted by Gteenwald &Associates. Key survey results highlighted the momentous decade the 2020:>s will be for
redtcment plans with the world of work evolving towards more of a work/life balance to
support employees.
• Recent Voya Sponsor web enhancements include improved functionality, new available
reports and additional participant demographies. Technology will cotitinue to expand tosupport the growth of educational pfograms provided, along with a potential introduction
of alternative investments within the DC space.
• Spatola summarized OkMRF plan statistics noting the addition of three (3) new memberplans during the past fiscal year, an increase of 806 parddpants and a 19% increase in assets
totaling over $414 million as of June 30, 2021. Contributions increased by ^2.7 miUion faomthe previous year with approximately |2.6 million allocated towards the target retirement
funds. Total additions including contiibudons and tollovets outpaced total deductions,
including member withdrawals and defaulted loans;, by approximately $80.7 caiUion. Loan
funds decreased to 2.0% of plan assets. OveraU- plan improvement included the approval of
coronavims distributions, teplacing a money manager in the Gtowth & Value fiind and the
project completion of loan ACH payoff opdon via paiticipant web.
• Hayes confirmed Voya Fixed Plus investment option offers a current compeddve rate of
1.85%, unchanged since January 2021. Of the $40.7 miUion fund balance, 44.3% is held byretired/termed participants and the remamder is held by active participants, of which only0.98% of active patticipants hold the fund as their only investment option. The coreinvestment allocation for the Voya Fixed Plus Fund continues to be investment grade credit
fotlowed by senior loans and U.S. Treasuries.
• Wmtetbottom provided a summaiy of the Reach & Impact Executive Summaty noting of
OldVIRF^s 8,450 piirticipants appt-oxitnately 12% utilise eithet professional management,online advice of online guidance. Approximately 52% ofpatticipants ate invested m TatgetRetirement Date funds, with an average participant age of 43 and an average balance of $29
thousand.
• Dfitcy inttoduced Voya;'s Guided Content ExpejL-lences which delivers educiition, tools and
technology solutions through information Voya coUects about participants, information
pardcipants tell Voya and participant behavioral choices. myVoyagew \viU be unveiled todrive greater engagement, keep retk-ement at the front of participant's minds, ptovide
financial literacy and allow investors to become confident in dieit retirement. The
personalized and innovative programs use feedback fcom pardcipan-ts and members,
infused with technology, to tailor informadon provided back to patdcipants.
7. Consideration and Possible Action Regarding Investment Committee RepottA. ACG: Review of Monthly ASAPs and Ouattetly Petfoimance Report
Moore began presentation with an economic overview stating the delto variant of COVID-19
has presented market challenges. Consumer confidence began to fatt having a direct impact on
retail sales, while the Fed will continue to decrease their asset purchases and begin
conversations of when rates arc projected to increase. The tccently approved mfrastmcture bill
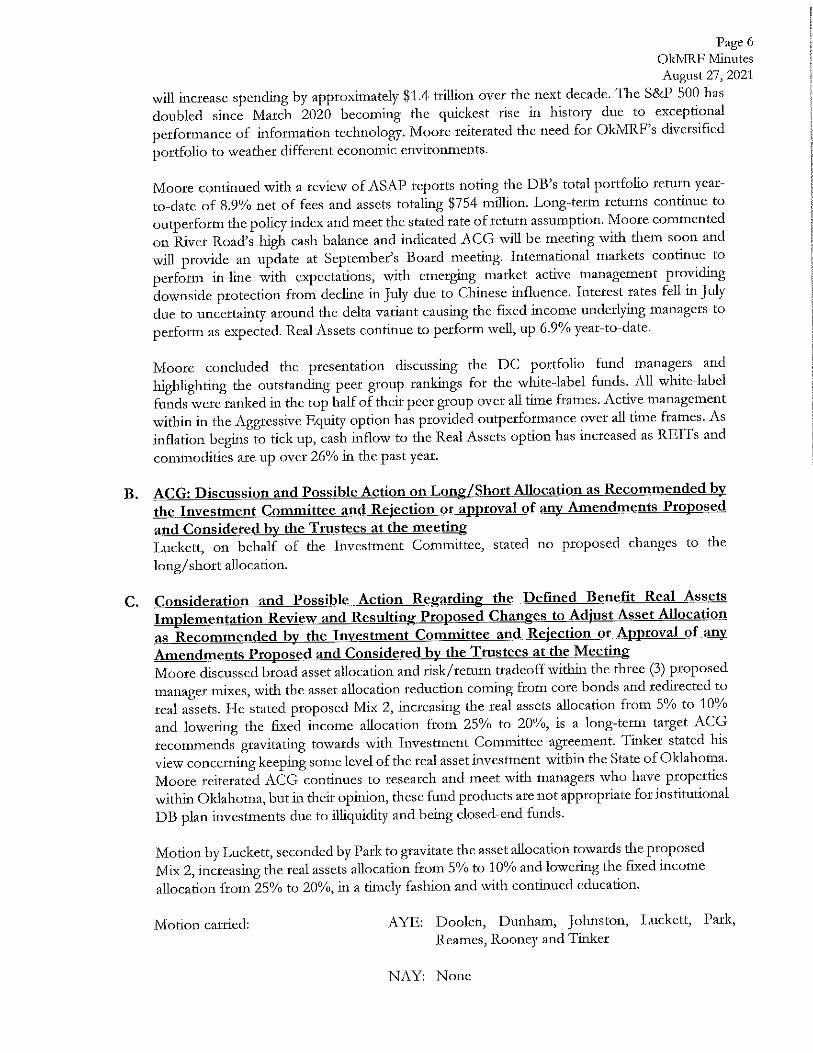
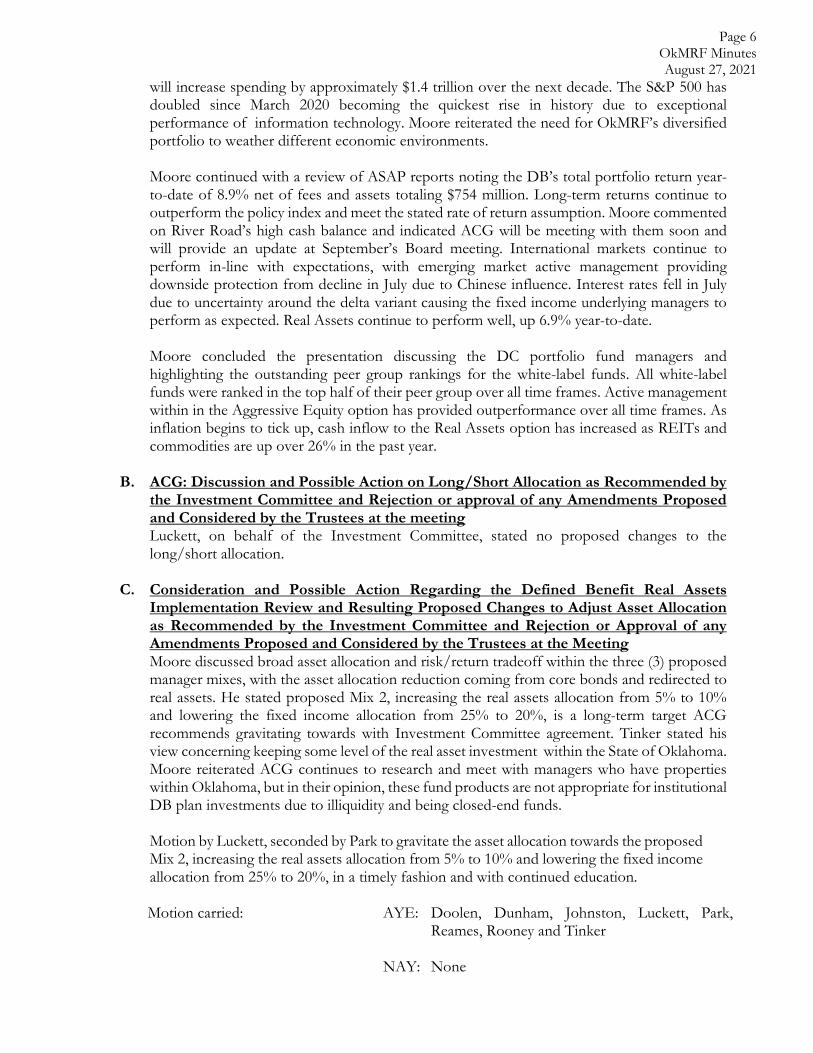
Page 6OkMRP MinutesAugust 27, 2021
will increase spending by approximately til.4 tL-iUion over the next decade. The S&P 500 hasdoubled since Match 2020 becoming the quickest rise in histoiy due to exceptionalpetfortnance of information technology. Moore reiterated the need for OkMRF^s diversified
portfoUo to weather different econotnic envii'onrnents.
Moore continued with a review of ASAP repotts noting the DB s total portfolio t-etum year-
to-date of 8.9% net of fees and assets totaling $754 miUion. Long-term teturns condnue to
outperfoftn the policy index and meet the stated rate of return assumption. Moore commented
on River RoacFs high cash balance and indicated ACG will be meeting with them soon and
will provide an update at September's Board m-eeting. International markets continue to
perform in-line with expectations, with emerging market active management providing
downside protection from decline in July due to Chinese influence, Interest rates feU in July
due to uncertainty around the delta valiant causing the fixed income underlying managers to
perform as expected. Real Assets continue to perform well, up 6.9% year-to-date.
Moote concluded the presentation discussing the DC potfcfolio fund managers and
highlighting the outstanding peer group rankings for the white-label funds. AU white-labelfunds were ranked in the top half of their peer group over aU time frames. Active mansigement
within in the Aggressive Equity option has provided outperfottmnce ovei: aU time frames. As
inflation begins to tick up, cash inflow to die Real Assets option has incteased as REITs andcommodides are up over 26% in the past year.
B. ACG: Discussion and Possible Action on Long/Short Allocation as Recommended by
the Investment Committee and Rejection ot approval of any Amendments Proposedand Considered by the Trustees at the^neetin^Luckett, on behalf of the Investment Committee, stated no proposed changes to the
long/shorfc aUocadon.
C. ConsJdemtion and Possible Action Regafding the Defined Benefit Real Assets
Implementation Review and Resulting Ptoposed Changes to Adjust Asset Allocationas Recommended by the Investment Committee and Rejection or Approval of any
Amendments Proposed and Considered by the Trustees at the MeetingMoore discussed broad asset allocation- and risk/rctum tradeoff within the three (3) proposedmanager mixes, with the asset aUocadon reduction coming from core bonds and tedirected to
real assets. He stated proposed Mix 2, increasing the real assets atLocation from 5% to 10%
and lowering the fixed income aU-ocation fi'om 25% to 20%, is a long-term target ACG
recommends gravitating towards with Investment Committee agreement. Tinker stated his
view concerning keeping some level of the real asset investment within the State of Oklahoma.
Moore reiterated ACG continues to t-esearch and meet with managers who have properties
within Oklahoma, but in their opinion, these fund products are not appropriate for institutionalDB plan investments due to illiquidtty and being closed-end funds.
Motion by Luckett, seconded by Park to gravitate the asset allocation towards die proposed
Mbc 2, increasing the reiil assets aUocadon ftom 5% to 10% and lowering the fixed mcome
aU.ocation from 25% to 20%, in a timely fashion and with condnued education.
Motion carried: AYE: Doolcn, Dunham, Jolmston, I.uckett, Park,
Reames, Rooney and Tinker
NAY: None
Page 7OkMRP MinutesAugust 27,2021
D. Considefation and Possible Action on Reallocation and/or Rebalancinff of AssetsAmons^ Investtnent Managers as Recommended by the Investment Cofflmittec and
Rejection or approval of any Amendments Proposed and Considered by the Trusteesat the Meeting
No action taken.
8. Considetation and Possible Action Regatding Admimsttative Committee ReportNo action taken.
9. Consideration and Possible Action Regarding Conttact Committee RepottNo action taken.
10. Receive Report on Newly Adopted or Amended OkMRF Member PlansWhatley reported on plan changes for the OkMRF members.
11. OkMRF Staff RepottCox reported on the following items:
)> At next month's meeting:
• Board to discuss early implementation of die fout-tier DC fee resbt'uctute
• Harding Locvner fee reduction will be put before the Board for approval^ Cox presented Shannon Couch, Sulphur City Clei-'k, with the 2021 George Wilkmson award
at Sulphurs August meeting. Couch was tmly honoted and huinbled.
^ The Annual OML conference is less than two (2) weeks away. Exhibit haU events ate
scheduled for September 8th and 9 . Folders have been provided with conference
information including wotk schedules and daily attite. Cox thanked Giratdi and Porter forcootdinadng this year's exhibit hall activides. Keep Oklahoma Beautiful wiU be the recipient
of raffle ticket sales this year. Speak with Gitatdi to purchase tickets for the cause and
chance to win prizes.
5> The Mail of Fame banquet wiU be held on the evening of the 9 . Attendees noted for thebanquet Parik, Dunham, Rooney and Johnston. Hall of Fame mductees for die Class of
2021 ate Daniel Bradley, Sand Springs; James Crosby, Yukon; IVlichael Doublehead,Tahlequah and Randall Ross, Choctaw. All well-deserying.
^ Public Funds Tmstce Education Conference will be held Septembet 29 through Octobe):
1 at Shangri-La Resort. Virtual attendees registered: Doolen, Johnstoti, Luckett and
Rooney. In-person attendees tegistered: Park, Johtison, Dunham, Reamcs and Tinker.
Inform Cox by August 31 , If any Ttustee wishes to change their fl.ttendan.ce to virtual.
^ Updates on District Elections: DisU-ict 6: Received six (6) votes fot the incumbent, TimRooney, two (2) votes for Leroy Alsup, two (2) votes for Troy Bradley, one (1) vote forCindi Shivers, one (I) vote for Chris Lally and one (1) vote for Jason Orr. Votes will beaccepted through Monday, August 30 .
> Girardi attended tlie CMAO Summer Conference. CMAO and OMMS held an excellent
summer conference in Enid.
5-' The annual audit has started. Fii-iley & Cook has selected numerous confirmation- samples
and Staff to tnail out the letters shordy.
^ Linda Ruckman, Recordkeeping Assistant, hfis accepted another position within a different
organisation. Ruckman will be grciidy missed and OkMRF thanks her for her dedicadon to
the Fund. The position for recordkeeping assistant has been posted. If Trustees have any
qualified candidates, speak with Cox.
12. New Business
None.
13. Trustec/Membcir Comments
None.
14. AdjoutnWith no futthcr business to conduct meeting adjowned.
<J -L yi _CA^Ro^tt Pflt'k, Scct'ctai-y
0 ^ Wl^^ e^ &o^, Pa/^
^uyi""///^^p^t^
\^z
^_\^<->''': )*• -.••.r^s;^y
Page8OkMRF MinutesAugust 27,2021
MINUTES
BOARD OF TRUSTEES OKLAHOMA MUNICIPAL RETIREMENT FUND
August 27, 2021
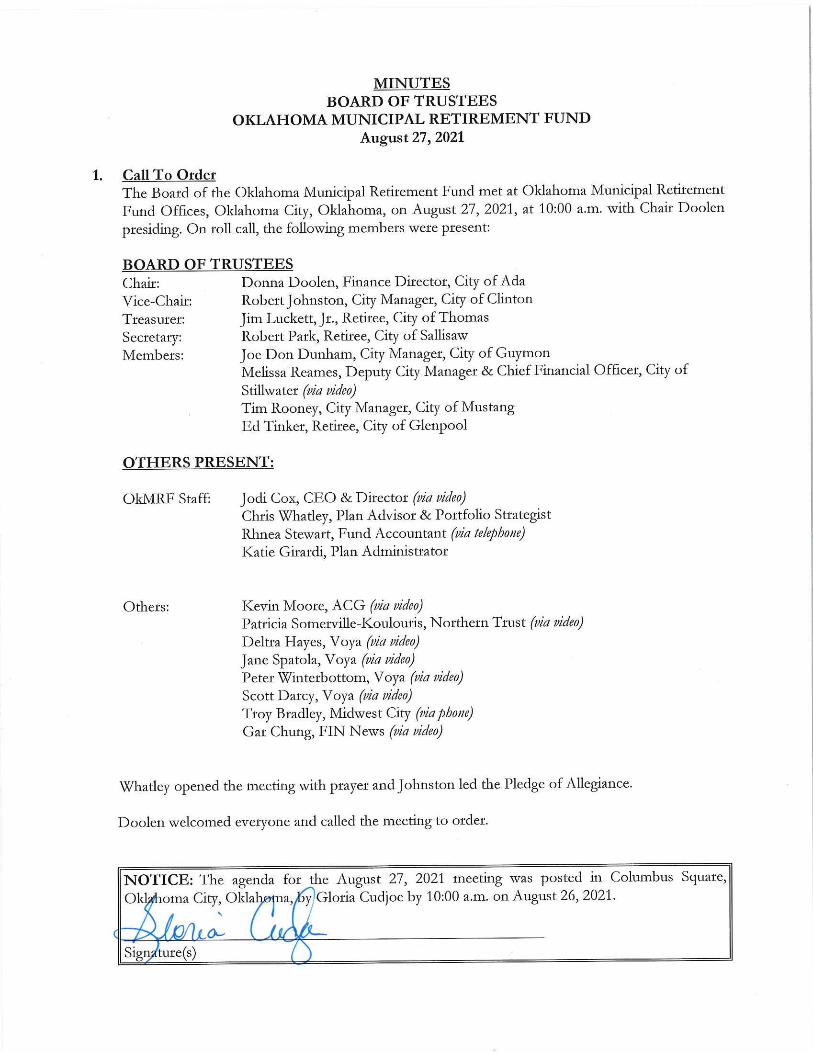
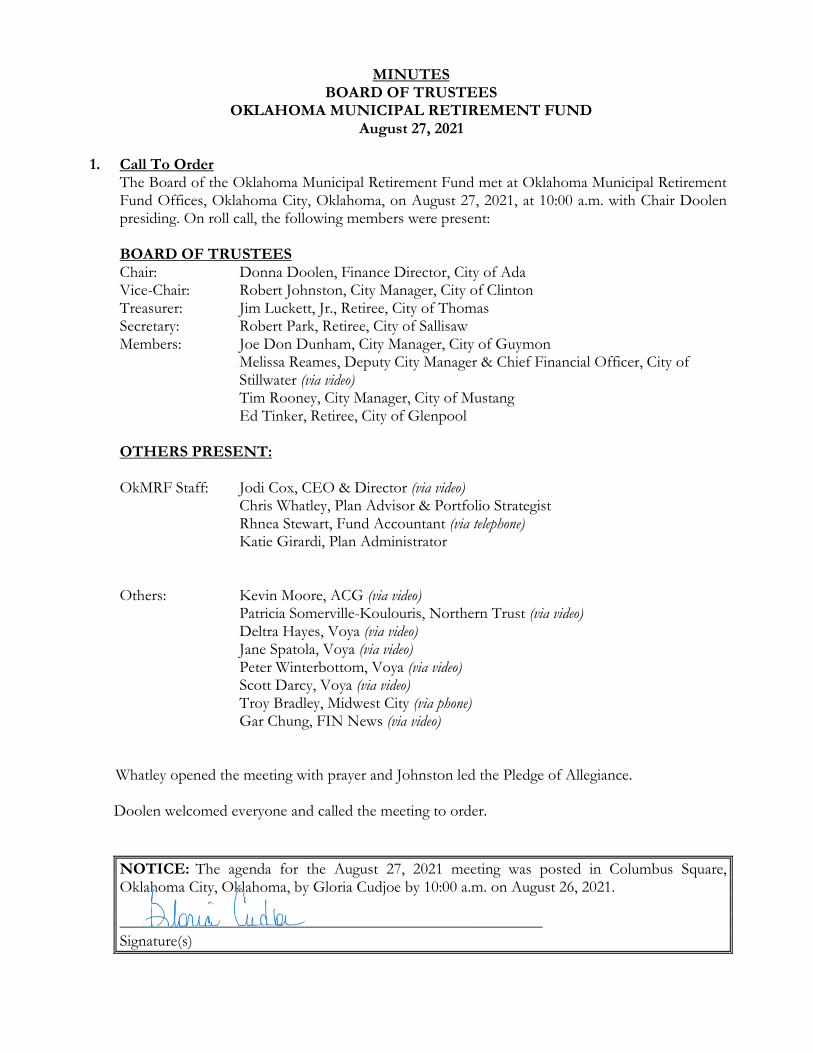
1. Call To Order The Board of the Oklahoma Municipal Retirement Fund met at Oklahoma Municipal Retirement Fund Offices, Oklahoma City, Oklahoma, on August 27, 2021, at 10:00 a.m. with Chair Doolen presiding. On roll call, the following members were present:
BOARD OF TRUSTEES Chair: Donna Doolen, Finance Director, City of Ada Vice-Chair: Robert Johnston, City Manager, City of Clinton Treasurer: Jim Luckett, Jr., Retiree, City of Thomas Secretary: Robert Park, Retiree, City of Sallisaw Members: Joe Don Dunham, City Manager, City of Guymon
Melissa Reames, Deputy City Manager & Chief Financial Officer, City of Stillwater (via video) Tim Rooney, City Manager, City of Mustang Ed Tinker, Retiree, City of Glenpool
OTHERS PRESENT: OkMRF Staff: Jodi Cox, CEO & Director (via video) Chris Whatley, Plan Advisor & Portfolio Strategist Rhnea Stewart, Fund Accountant (via telephone) Katie Girardi, Plan Administrator
Others: Kevin Moore, ACG (via video) Patricia Somerville-Koulouris, Northern Trust (via video) Deltra Hayes, Voya (via video) Jane Spatola, Voya (via video) Peter Winterbottom, Voya (via video) Scott Darcy, Voya (via video) Troy Bradley, Midwest City (via phone) Gar Chung, FIN News (via video) Whatley opened the meeting with prayer and Johnston led the Pledge of Allegiance. Doolen welcomed everyone and called the meeting to order.
NOTICE: The agenda for the August 27, 2021 meeting was posted in Columbus Square, Oklahoma City, Oklahoma, by Gloria Cudjoe by 10:00 a.m. on August 26, 2021. _____________________________________________________ Signature(s)
Page 2 OkMRF Minutes August 27, 2021
2. Approval of Consent Agenda
The following items were presented under the consent agenda.
A. Minutes of July 30, 2021 Meeting(s)
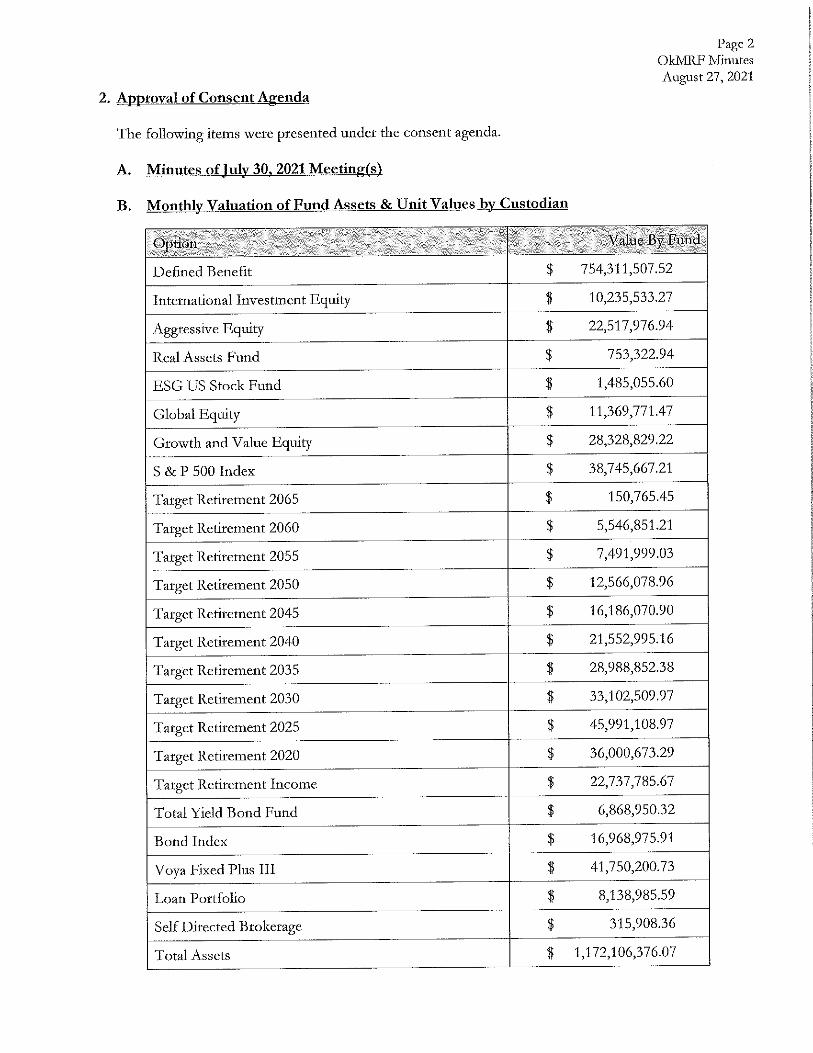
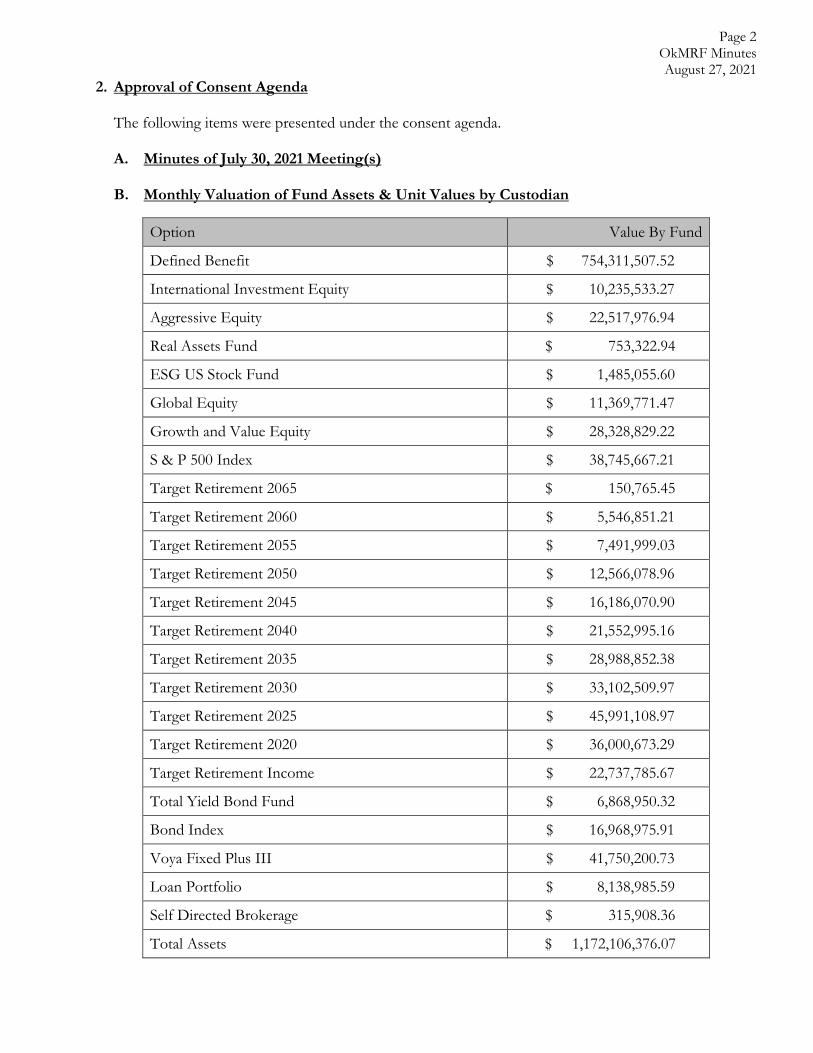
B. Monthly Valuation of Fund Assets & Unit Values by Custodian
Option Value By Fund
Defined Benefit $ 754,311,507.52
International Investment Equity $ 10,235,533.27
Aggressive Equity $ 22,517,976.94
Real Assets Fund $ 753,322.94
ESG US Stock Fund $ 1,485,055.60
Global Equity $ 11,369,771.47
Growth and Value Equity $ 28,328,829.22
S & P 500 Index $ 38,745,667.21
Target Retirement 2065 $ 150,765.45
Target Retirement 2060 $ 5,546,851.21
Target Retirement 2055 $ 7,491,999.03
Target Retirement 2050 $ 12,566,078.96
Target Retirement 2045 $ 16,186,070.90
Target Retirement 2040 $ 21,552,995.16
Target Retirement 2035 $ 28,988,852.38
Target Retirement 2030 $ 33,102,509.97
Target Retirement 2025 $ 45,991,108.97
Target Retirement 2020 $ 36,000,673.29
Target Retirement Income $ 22,737,785.67
Total Yield Bond Fund $ 6,868,950.32
Bond Index $ 16,968,975.91
Voya Fixed Plus III $ 41,750,200.73
Loan Portfolio $ 8,138,985.59
Self Directed Brokerage $ 315,908.36
Total Assets $ 1,172,106,376.07
Page 3 OkMRF Minutes August 27, 2021
C. Purchases and Sales of Assets
D. Administrative Expenses and Fees Expenses and Fees for August
Actuary & Recordkeeping $ 45,506.36
Administration 103,890.48
Attorney 20,486.17
Audit 0.00
Board Travel 1,478.04
Employer Directed Expense 816.00
Insurance 12,709.40
Investment Advisors 0.00
Custodial 11,901.75
Investment Consultant 0.00
Public Relations 841.98
Representative Travel 3,303.83
EXPENSES $200,934.01
E. Benefit Payments and Contribution Refunds F. Acknowledgement of Receipt of JPMorgan Core Bond Institutional Trust Amended
and Restated Confidential Offering Memorandum and the Offering Supplement dated June 28, 2021 Item 2. G. was pulled from consent agenda to be acted upon separately. Motion made by Luckett, seconded by Rooney to approve items A. through F. on the Consent Agenda. Motion carried: AYE: Doolen, Dunham, Johnston, Luckett, Park,
Reames, Rooney and Tinker NAY: None
G. Acknowledgement of Receipt of K2 Amended and Restated Confidential Private
Placement Memorandum in Conjunction with Explanatory Memorandums of Each Series Acknowledging Series Name Change of K2 Mauna Kea LLC to K2 Ascent LLC dated June 2021 with Updated Side letter Agreement Motion made by Tinker, seconded by Luckett to approve receipt of K2 Ascent, LLC amended documents, pending updated side letter agreement.
Page 4 OkMRF Minutes August 27, 2021
Motion carried: AYE: Doolen, Dunham, Johnston, Luckett, Park,
Reames, Rooney and Tinker NAY: None
3. Consideration and Possible Action of Items Removed from the Consent Agenda
No action taken.
4. Comments from the Public None.
5. Northern Trust: Annual Update on DB Custodial Services – Patricia “Patti” Somerville-Koulouris Koulouris, Division Manager of Public Funds at Northern Trust, began her presentation by thanking OkMRF for their continued business and provided a brief overview of Northern Trust. The business model used by Northern Trust continues to remain client-centric focused and has provided growth in both their asset servicing and asset management arms for both institutional and high net worth personal clients, with assets under custody totaling $12.2 trillion and assets under management totaling $1.5 trillion. Financial strength is demonstrated on Northern Trust’s solid balance sheet, superior credit rating and strong capital position. Koulouris noted there were no key personnel changes over the past year and no pending retirements. Koulouris discussed Northern Trust’s business response to COVID-19 and their planned ‘Return to Office’ schedule. During the pandemic, over 90% of employees worked remotely and business seamlessly continued due to a resilient workforce and technology innovations. Due to the delta variant of COVID-19, return-to-office has been postponed for the foreseeable future. Northern Trust recognizes the importance of flexible work/life practices and will be implementing optional hybrid work schedules in the future. Discussion continued regarding Northern Trust’s social responsibility role as a good corporate citizen. Koulouris highlighted strategy pillars of perspective, shared values, employees, and sustainable products and services. In 2020, Northern Trust donated over $20 million towards community programs involving food stability, affordable housing, and healthcare. Concluding the presentation, Koulouris discussed the Public Funds segment, noting an increase of nine (9) clients over the past year for a total of 200 clients and $1.3 billion in assets under custody. Relationship manager, Jerry Sinish, is no longer with Northern Trust and Claudiu Besoaga is temporarily filling in until a permanent candidate is hired. Koulouris highlighted services utilized by OkMRF such as cash management, unitization, GASB reporting, security litigation monitoring/filing and benefit payments.
6. Voya Financial: Annual Update on DC Recordkeeping/Custodial Services and Investment
Manager – Deltra Hayes (Voya Financial Trust Company and Voya Fixed Account); Jane Spatola (Plan Review); Peter Winterbottom (Wealth Management) and Scott Darcy (Communications) The Voya team updates were as follows:
• Hayes introduced team members, Jane Spatola, Peter Winterbottom, and Scott Darcy, noting continued search for replacement of Kevin McGrath, fund management support services. During the past year, employees worked remotely, and business continued seamlessly. Hayes stated a return to the office is slated for October 18th, but this date is reassessed daily. Hayes provided a high-level overview of Voya Institutional Trust Company
Page 5 OkMRF Minutes August 27, 2021
noting 2,890 Defined Contribution plans totaling over $141 billion assets under management.
• Voya continues to strive to be ‘America’s Retirement Company’ by increasing individual customers by 1.1 million and increasing market capitalization by $1.9 million in the past year. Top rated online retirement tools, such as myOrangeMoney , utilized by participants proved to increase their retirement readiness by 33% over those who did not utilize the tools. Voya continues to grow their business and earned their eighth Great Place to Work recognition along with being named as a top Ethical Company. Hayes discussed current DC market trends identified through a Thought Leadership survey conducted by Greenwald & Associates. Key survey results highlighted the momentous decade the 2020’s will be for retirement plans with the world of work evolving towards more of a work/life balance to support employees.
• Recent Voya Sponsor web enhancements include improved functionality, new available reports and additional participant demographics. Technology will continue to expand to support the growth of educational programs provided, along with a potential introduction of alternative investments within the DC space.
• Spatola summarized OkMRF plan statistics noting the addition of three (3) new member plans during the past fiscal year, an increase of 806 participants and a 19% increase in assets totaling over $414 million as of June 30, 2021. Contributions increased by $2.7 million from the previous year with approximately $2.6 million allocated towards the target retirement funds. Total additions including contributions and rollovers outpaced total deductions, including member withdrawals and defaulted loans, by approximately $80.7 million. Loan funds decreased to 2.0% of plan assets. Overall plan improvement included the approval of coronavirus distributions, replacing a money manager in the Growth & Value fund and the project completion of loan ACH payoff option via participant web.
• Hayes confirmed Voya Fixed Plus investment option offers a current competitive rate of 1.85%, unchanged since January 2021. Of the $40.7 million fund balance, 44.3% is held by retired/termed participants and the remainder is held by active participants, of which only 0.98% of active participants hold the fund as their only investment option. The core investment allocation for the Voya Fixed Plus Fund continues to be investment grade credit followed by senior loans and U.S. Treasuries.
• Winterbottom provided a summary of the Reach & Impact Executive Summary noting of OkMRF’s 8,450 participants approximately 12% utilize either professional management, online advice or online guidance. Approximately 52% of participants are invested in Target Retirement Date funds, with an average participant age of 43 and an average balance of $29 thousand.
• Darcy introduced Voya’s Guided Content Experiences which delivers education, tools and technology solutions through information Voya collects about participants, information participants tell Voya and participant behavioral choices. myVoyage will be unveiled to drive greater engagement, keep retirement at the front of participant’s minds, provide financial literacy and allow investors to become confident in their retirement. The personalized and innovative programs use feedback from participants and members, infused with technology, to tailor information provided back to participants.
7. Consideration and Possible Action Regarding Investment Committee Report
A. ACG: Review of Monthly ASAPs and Quarterly Performance Report Moore began presentation with an economic overview stating the delta variant of COVID-19 has presented market challenges. Consumer confidence began to fall having a direct impact on retail sales, while the Fed will continue to decrease their asset purchases and begin conversations of when rates are projected to increase. The recently approved infrastructure bill
Page 6 OkMRF Minutes August 27, 2021
will increase spending by approximately $1.4 trillion over the next decade. The S&P 500 has doubled since March 2020 becoming the quickest rise in history due to exceptional performance of information technology. Moore reiterated the need for OkMRF’s diversified portfolio to weather different economic environments. Moore continued with a review of ASAP reports noting the DB’s total portfolio return year-to-date of 8.9% net of fees and assets totaling $754 million. Long-term returns continue to outperform the policy index and meet the stated rate of return assumption. Moore commented on River Road’s high cash balance and indicated ACG will be meeting with them soon and will provide an update at September’s Board meeting. International markets continue to perform in-line with expectations, with emerging market active management providing downside protection from decline in July due to Chinese influence. Interest rates fell in July due to uncertainty around the delta variant causing the fixed income underlying managers to perform as expected. Real Assets continue to perform well, up 6.9% year-to-date. Moore concluded the presentation discussing the DC portfolio fund managers and highlighting the outstanding peer group rankings for the white-label funds. All white-label funds were ranked in the top half of their peer group over all time frames. Active management within in the Aggressive Equity option has provided outperformance over all time frames. As inflation begins to tick up, cash inflow to the Real Assets option has increased as REITs and commodities are up over 26% in the past year.
B. ACG: Discussion and Possible Action on Long/Short Allocation as Recommended by
the Investment Committee and Rejection or approval of any Amendments Proposed and Considered by the Trustees at the meeting Luckett, on behalf of the Investment Committee, stated no proposed changes to the long/short allocation.
C. Consideration and Possible Action Regarding the Defined Benefit Real Assets Implementation Review and Resulting Proposed Changes to Adjust Asset Allocation as Recommended by the Investment Committee and Rejection or Approval of any Amendments Proposed and Considered by the Trustees at the Meeting Moore discussed broad asset allocation and risk/return tradeoff within the three (3) proposed manager mixes, with the asset allocation reduction coming from core bonds and redirected to real assets. He stated proposed Mix 2, increasing the real assets allocation from 5% to 10% and lowering the fixed income allocation from 25% to 20%, is a long-term target ACG recommends gravitating towards with Investment Committee agreement. Tinker stated his view concerning keeping some level of the real asset investment within the State of Oklahoma. Moore reiterated ACG continues to research and meet with managers who have properties within Oklahoma, but in their opinion, these fund products are not appropriate for institutional DB plan investments due to illiquidity and being closed-end funds. Motion by Luckett, seconded by Park to gravitate the asset allocation towards the proposed Mix 2, increasing the real assets allocation from 5% to 10% and lowering the fixed income allocation from 25% to 20%, in a timely fashion and with continued education.
Motion carried: AYE: Doolen, Dunham, Johnston, Luckett, Park, Reames, Rooney and Tinker
NAY: None
Page 7 OkMRF Minutes August 27, 2021
D. Consideration and Possible Action on Reallocation and/or Rebalancing of Assets Among Investment Managers as Recommended by the Investment Committee and Rejection or approval of any Amendments Proposed and Considered by the Trustees at the Meeting No action taken.
8. Consideration and Possible Action Regarding Administrative Committee Report No action taken.
9. Consideration and Possible Action Regarding Contract Committee Report No action taken.
10. Receive Report on Newly Adopted or Amended OkMRF Member Plans Whatley reported on plan changes for the OkMRF members.
11. OkMRF Staff Report
Cox reported on the following items: At next month’s meeting:
• Board to discuss early implementation of the four-tier DC fee restructure • Harding Loevner fee reduction will be put before the Board for approval
Cox presented Shannon Couch, Sulphur City Clerk, with the 2021 George Wilkinson award at Sulphur’s August meeting. Couch was truly honored and humbled.
The Annual OML conference is less than two (2) weeks away. Exhibit hall events are scheduled for September 8th and 9th. Folders have been provided with conference information including work schedules and daily attire. Cox thanked Girardi and Porter for coordinating this year’s exhibit hall activities. Keep Oklahoma Beautiful will be the recipient of raffle ticket sales this year. Speak with Girardi to purchase tickets for the cause and chance to win prizes.
The Hall of Fame banquet will be held on the evening of the 9th. Attendees noted for the banquet: Park, Dunham, Rooney and Johnston. Hall of Fame inductees for the Class of 2021 are Daniel Bradley, Sand Springs; James Crosby, Yukon; Michael Doublehead, Tahlequah and Randall Ross, Choctaw. All well-deserving.
Public Funds Trustee Education Conference will be held September 29th through October 1st at Shangri-La Resort. Virtual attendees registered: Doolen, Johnston, Luckett and Rooney. In-person attendees registered: Park, Johnson, Dunham, Reames and Tinker. Inform Cox by August 31st, if any Trustee wishes to change their attendance to virtual.
Updates on District Elections: District 6: Received six (6) votes for the incumbent, Tim Rooney, two (2) votes for Leroy Alsup, two (2) votes for Troy Bradley, one (1) vote for Cindi Shivers, one (1) vote for Chris Lally and one (1) vote for Jason Orr. Votes will be accepted through Monday, August 30th.
Girardi attended the CMAO Summer Conference. CMAO and OMMS held an excellent summer conference in Enid.
The annual audit has started. Finley & Cook has selected numerous confirmation samples and Staff to mail out the letters shortly.
Linda Ruckman, Recordkeeping Assistant, has accepted another position within a different organization. Ruckman will be greatly missed and OkMRF thanks her for her dedication to the Fund. The position for recordkeeping assistant has been posted. If Trustees have any qualified candidates, speak with Cox.
12. New Business
None.
Page 8 OkMRF Minutes August 27, 2021
13. Trustee/Member Comments
None.
14. Adjourn With no further business to conduct meeting adjourned.
_________________________________ _____________________________________ Robert Park, Secretary Donna Doolen, Chair
Respectfully submitted by: _________________________________ Katie Girardi
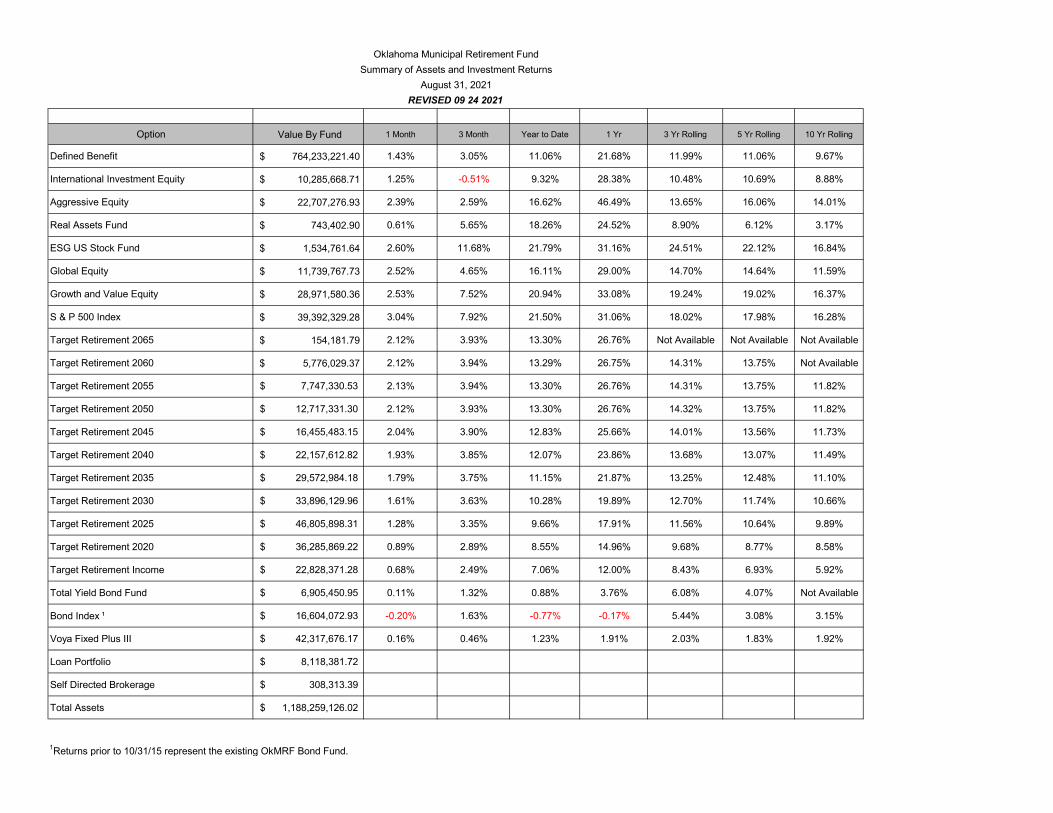
Option Value By Fund 1 Month 3 Month Year to Date 1 Yr 3 Yr Rolling 5 Yr Rolling 10 Yr Rolling
Defined Benefit $ 764,233,221.40 1.43% 3.05% 11.06% 21.68% 11.99% 11.06% 9.67%
International Investment Equity $ 10,285,668.71 1.25% -0.51% 9.32% 28.38% 10.48% 10.69% 8.88%
Aggressive Equity $ 22,707,276.93 2.39% 2.59% 16.62% 46.49% 13.65% 16.06% 14.01%
Real Assets Fund $ 743,402.90 0.61% 5.65% 18.26% 24.52% 8.90% 6.12% 3.17%
ESG US Stock Fund $ 1,534,761.64 2.60% 11.68% 21.79% 31.16% 24.51% 22.12% 16.84%
Global Equity $ 11,739,767.73 2.52% 4.65% 16.11% 29.00% 14.70% 14.64% 11.59%
Growth and Value Equity $ 28,971,580.36 2.53% 7.52% 20.94% 33.08% 19.24% 19.02% 16.37%
S & P 500 Index $ 39,392,329.28 3.04% 7.92% 21.50% 31.06% 18.02% 17.98% 16.28%
Target Retirement 2065 $ 154,181.79 2.12% 3.93% 13.30% 26.76% Not Available Not Available Not Available
Target Retirement 2060 $ 5,776,029.37 2.12% 3.94% 13.29% 26.75% 14.31% 13.75% Not Available
Target Retirement 2055 7,747,330.53$ 2.13% 3.94% 13.30% 26.76% 14.31% 13.75% 11.82%
Target Retirement 2050 12,717,331.30$ 2.12% 3.93% 13.30% 26.76% 14.32% 13.75% 11.82%
Target Retirement 2045 16,455,483.15$ 2.04% 3.90% 12.83% 25.66% 14.01% 13.56% 11.73%
Target Retirement 2040 22,157,612.82$ 1.93% 3.85% 12.07% 23.86% 13.68% 13.07% 11.49%
Target Retirement 2035 29,572,984.18$ 1.79% 3.75% 11.15% 21.87% 13.25% 12.48% 11.10%
Target Retirement 2030 33,896,129.96$ 1.61% 3.63% 10.28% 19.89% 12.70% 11.74% 10.66%
Target Retirement 2025 46,805,898.31$ 1.28% 3.35% 9.66% 17.91% 11.56% 10.64% 9.89%
Target Retirement 2020 36,285,869.22$ 0.89% 2.89% 8.55% 14.96% 9.68% 8.77% 8.58%
Target Retirement Income 22,828,371.28$ 0.68% 2.49% 7.06% 12.00% 8.43% 6.93% 5.92%
Total Yield Bond Fund 6,905,450.95$ 0.11% 1.32% 0.88% 3.76% 6.08% 4.07% Not Available
Bond Index ¹ 16,604,072.93$ -0.20% 1.63% -0.77% -0.17% 5.44% 3.08% 3.15%
Voya Fixed Plus III 42,317,676.17$ 0.16% 0.46% 1.23% 1.91% 2.03% 1.83% 1.92%
Loan Portfolio 8,118,381.72$
Self Directed Brokerage 308,313.39$
Total Assets 1,188,259,126.02$
1Returns prior to 10/31/15 represent the existing OkMRF Bond Fund.
Oklahoma Municipal Retirement FundSummary of Assets and Investment Returns
August 31, 2021REVISED 09 24 2021
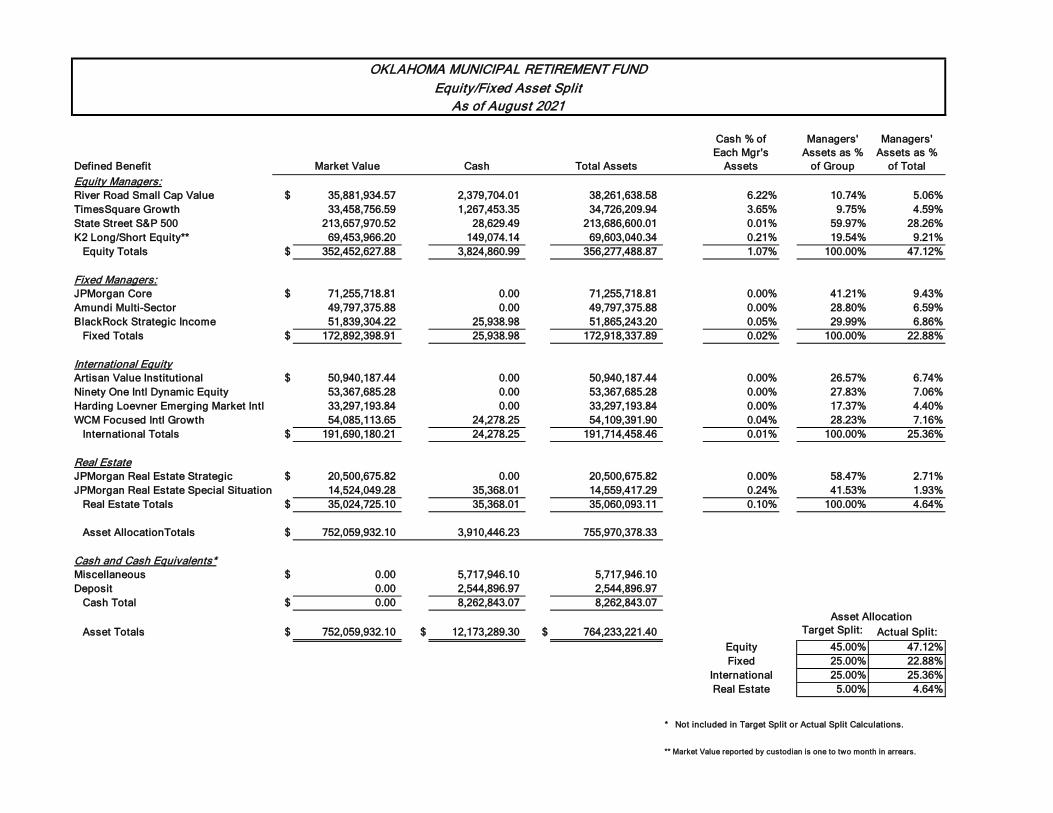
OKLAHOMA MUNICIPAL RETIREMENT FUNDEquity/Fixed Asset Split
As of August 2021
Defined Benefit Market Value Cash Total Assets
Cash % of Each Mgr's
Assets
Managers' Assets as %
of Group
Managers' Assets as %
of TotalEquity Managers:River Road Small Cap Value $ 35,881,934.57 2,379,704.01 38,261,638.58 6.22% 10.74% 5.06%TimesSquare Growth 33,458,756.59 1,267,453.35 34,726,209.94 3.65% 9.75% 4.59%State Street S&P 500 213,657,970.52 28,629.49 213,686,600.01 0.01% 59.97% 28.26%K2 Long/Short Equity** 69,453,966.20 149,074.14 69,603,040.34 0.21% 19.54% 9.21% Equity Totals $ 352,452,627.88 3,824,860.99 356,277,488.87 1.07% 100.00% 47.12%
Fixed Managers:JPMorgan Core $ 71,255,718.81 0.00 71,255,718.81 0.00% 41.21% 9.43%Amundi Multi-Sector 49,797,375.88 0.00 49,797,375.88 0.00% 28.80% 6.59%BlackRock Strategic Income 51,839,304.22 25,938.98 51,865,243.20 0.05% 29.99% 6.86% Fixed Totals $ 172,892,398.91 25,938.98 172,918,337.89 0.02% 100.00% 22.88%
International EquityArtisan Value Institutional $ 50,940,187.44 0.00 50,940,187.44 0.00% 26.57% 6.74%Ninety One Intl Dynamic Equity 53,367,685.28 0.00 53,367,685.28 0.00% 27.83% 7.06%Harding Loevner Emerging Market Intl 33,297,193.84 0.00 33,297,193.84 0.00% 17.37% 4.40%WCM Focused Intl Growth 54,085,113.65 24,278.25 54,109,391.90 0.04% 28.23% 7.16% International Totals $ 191,690,180.21 24,278.25 191,714,458.46 0.01% 100.00% 25.36%
Real EstateJPMorgan Real Estate Strategic $ 20,500,675.82 0.00 20,500,675.82 0.00% 58.47% 2.71%JPMorgan Real Estate Special Situation 14,524,049.28 35,368.01 14,559,417.29 0.24% 41.53% 1.93% Real Estate Totals $ 35,024,725.10 35,368.01 35,060,093.11 0.10% 100.00% 4.64%
Asset AllocationTotals $ 752,059,932.10 3,910,446.23 755,970,378.33
Cash and Cash Equivalents*Miscellaneous $ 0.00 5,717,946.10 5,717,946.10Deposit 0.00 2,544,896.97 2,544,896.97 Cash Total $ 0.00 8,262,843.07 8,262,843.07
Asset Totals $ 752,059,932.10 $ 12,173,289.30 $ 764,233,221.40 Target Split: Actual Split:
Equity 45.00% 47.12%Fixed 25.00% 22.88%
International 25.00% 25.36%Real Estate 5.00% 4.64%
Asset Allocation
* Not included in Target Split or Actual Split Calculations.
** Market Value reported by custodian is one to two month in arrears.
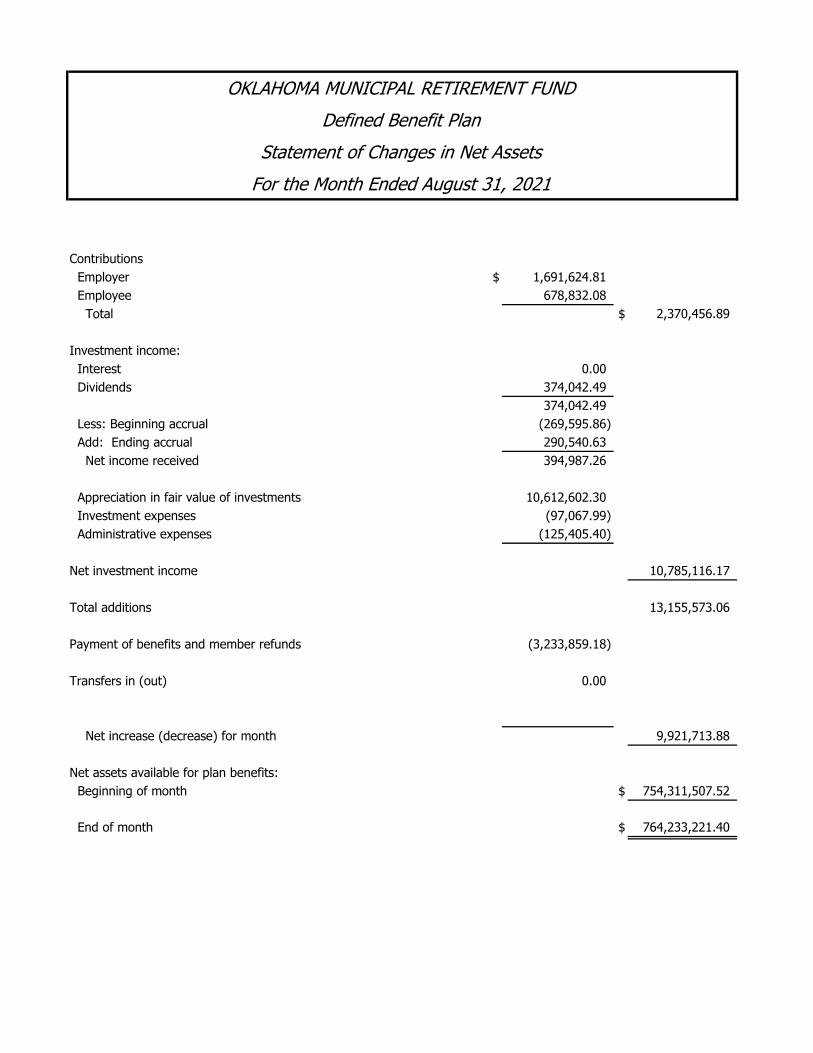
OKLAHOMA MUNICIPAL RETIREMENT FUNDDefined Benefit Plan
Statement of Changes in Net AssetsFor the Month Ended August 31, 2021
Contributions Employer $ 1,691,624.81 Employee 678,832.08 Total $ 2,370,456.89
Investment income: Interest 0.00 Dividends 374,042.49
374,042.49 Less: Beginning accrual (269,595.86) Add: Ending accrual 290,540.63 Net income received 394,987.26
Appreciation in fair value of investments 10,612,602.30 Investment expenses (97,067.99) Administrative expenses (125,405.40)
Net investment income 10,785,116.17
Total additions 13,155,573.06
Payment of benefits and member refunds (3,233,859.18)
Transfers in (out) 0.00
Net increase (decrease) for month 9,921,713.88
Net assets available for plan benefits: Beginning of month $ 754,311,507.52
End of month $ 764,233,221.40
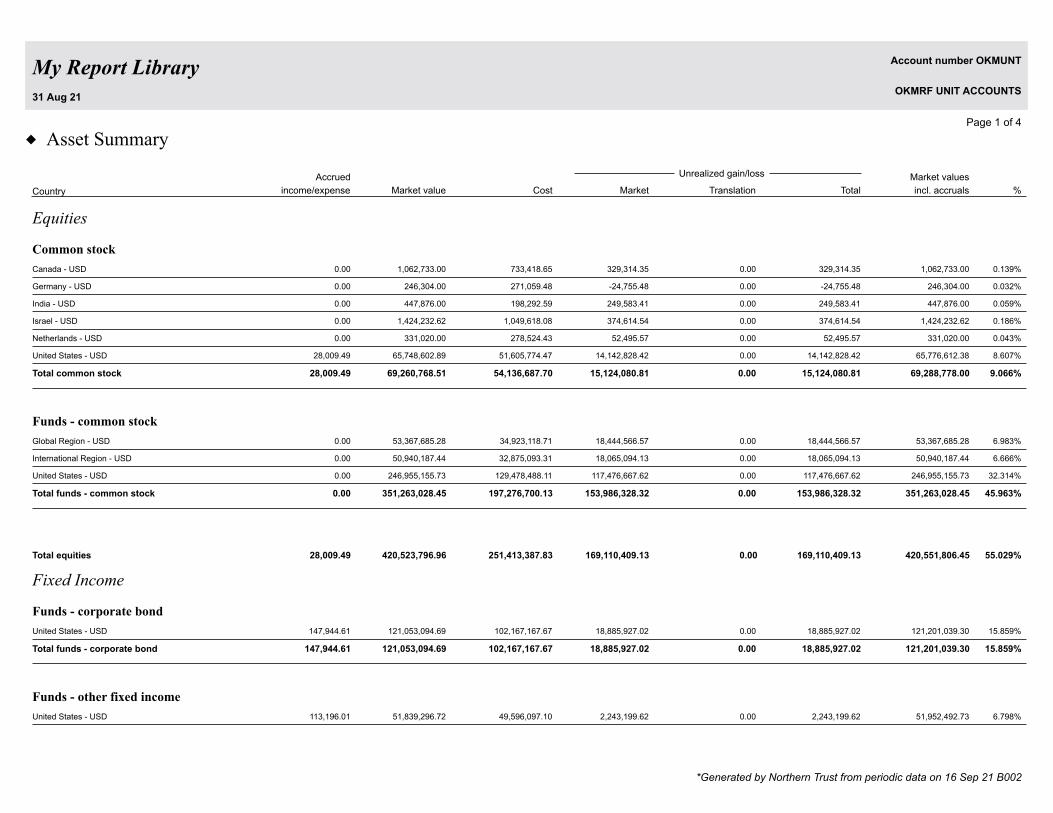
My Report Library
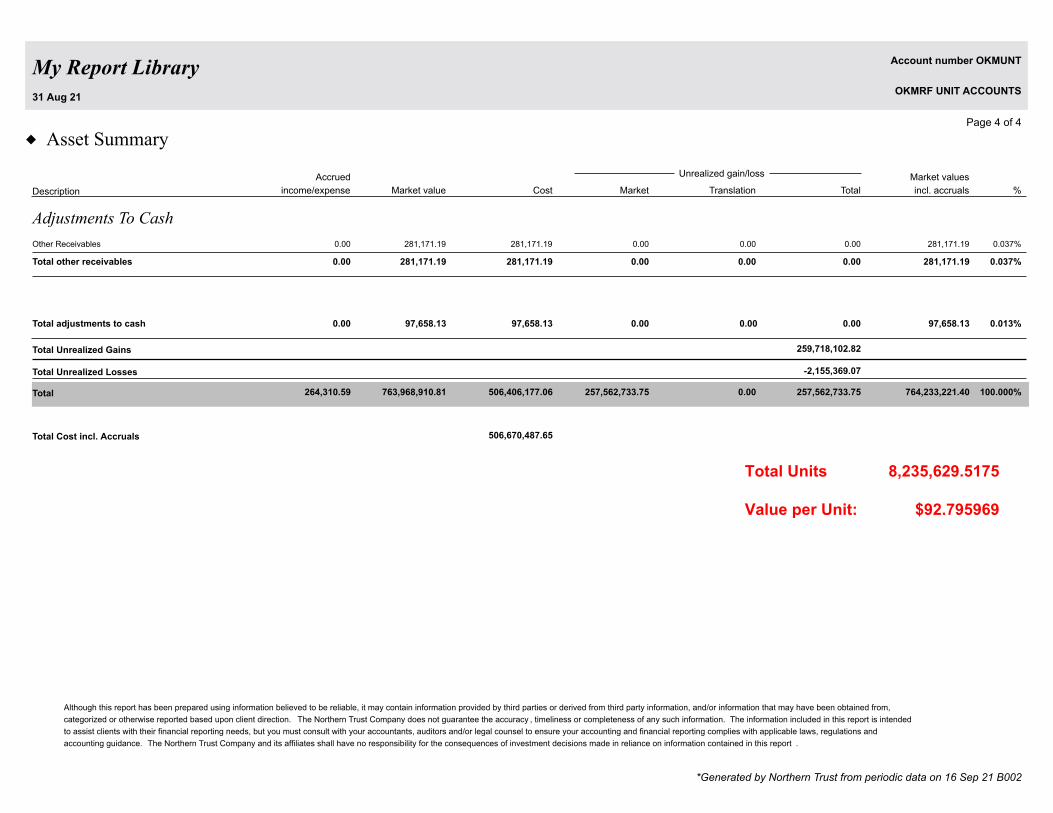
u Asset Summary
Market value Cost
Page 1 of 4
Market Total
Unrealized gain/loss
%
Market values
incl. accruals
Accrued
income/expenseCountry Translation
31 Aug 21
Account number OKMUNT
OKMRF UNIT ACCOUNTS
Equities
Common stock
Canada - USD 0.00 1,062,733.00 733,418.65 329,314.35 0.00 329,314.35 1,062,733.00 0.139%
Germany - USD 0.00 246,304.00 271,059.48 -24,755.48 0.00 -24,755.48 246,304.00 0.032%
India - USD 0.00 447,876.00 198,292.59 249,583.41 0.00 249,583.41 447,876.00 0.059%
Israel - USD 0.00 1,424,232.62 1,049,618.08 374,614.54 0.00 374,614.54 1,424,232.62 0.186%
Netherlands - USD 0.00 331,020.00 278,524.43 52,495.57 0.00 52,495.57 331,020.00 0.043%
United States - USD 28,009.49 65,748,602.89 51,605,774.47 14,142,828.42 0.00 14,142,828.42 65,776,612.38 8.607%
28,009.49 69,260,768.51 54,136,687.70 15,124,080.81 0.00 15,124,080.81 69,288,778.00 9.066%Total common stock
Funds - common stock
Global Region - USD 0.00 53,367,685.28 34,923,118.71 18,444,566.57 0.00 18,444,566.57 53,367,685.28 6.983%
International Region - USD 0.00 50,940,187.44 32,875,093.31 18,065,094.13 0.00 18,065,094.13 50,940,187.44 6.666%
United States - USD 0.00 246,955,155.73 129,478,488.11 117,476,667.62 0.00 117,476,667.62 246,955,155.73 32.314%
0.00 351,263,028.45 197,276,700.13 153,986,328.32 0.00 153,986,328.32 351,263,028.45 45.963%Total funds - common stock
Total equities 55.029%28,009.49 420,523,796.96 251,413,387.83 169,110,409.13 0.00 169,110,409.13 420,551,806.45
Fixed Income
Funds - corporate bond
United States - USD 147,944.61 121,053,094.69 102,167,167.67 18,885,927.02 0.00 18,885,927.02 121,201,039.30 15.859%
147,944.61 121,053,094.69 102,167,167.67 18,885,927.02 0.00 18,885,927.02 121,201,039.30 15.859%Total funds - corporate bond
Funds - other fixed income
United States - USD 113,196.01 51,839,296.72 49,596,097.10 2,243,199.62 0.00 2,243,199.62 51,952,492.73 6.798%
*Generated by Northern Trust from periodic data on 16 Sep 21 B002
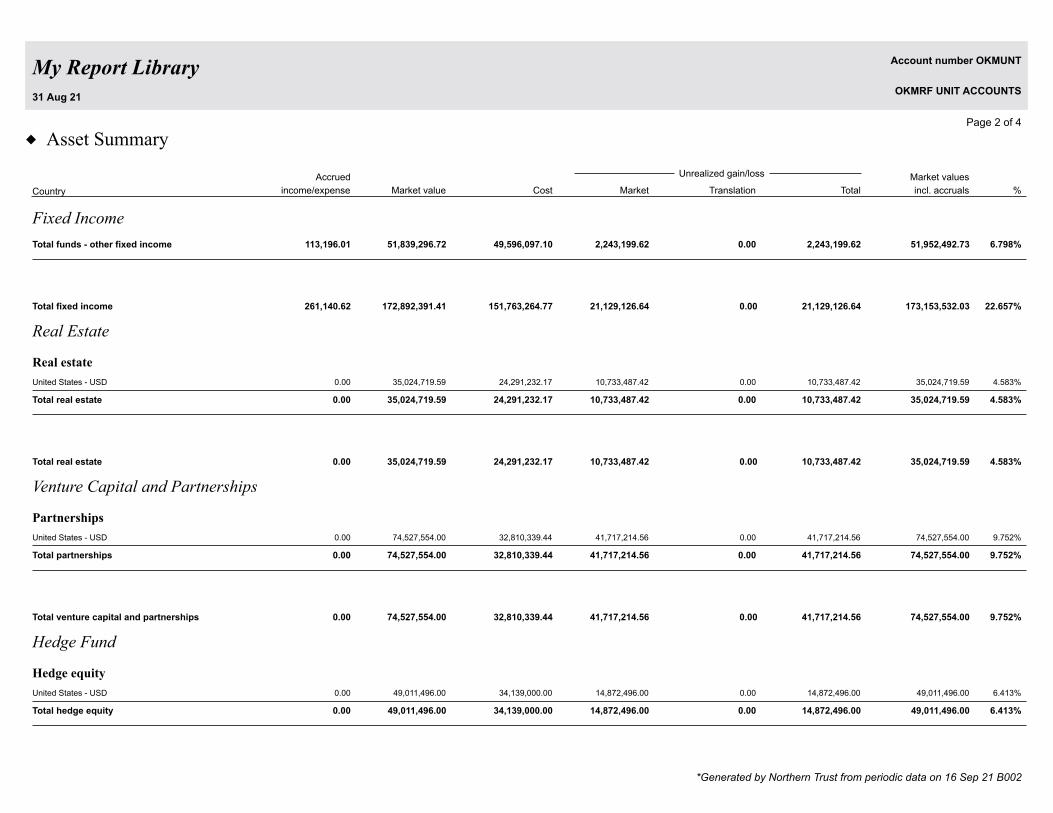
My Report Library
u Asset Summary
Market value Cost
Page 2 of 4
Market Total
Unrealized gain/loss
%
Market values
incl. accruals
Accrued
income/expenseCountry Translation
31 Aug 21
Account number OKMUNT
OKMRF UNIT ACCOUNTS
Fixed Income
113,196.01 51,839,296.72 49,596,097.10 2,243,199.62 0.00 2,243,199.62 51,952,492.73 6.798%Total funds - other fixed income
Total fixed income 22.657%261,140.62 172,892,391.41 151,763,264.77 21,129,126.64 0.00 21,129,126.64 173,153,532.03
Real Estate
Real estate
United States - USD 0.00 35,024,719.59 24,291,232.17 10,733,487.42 0.00 10,733,487.42 35,024,719.59 4.583%
0.00 35,024,719.59 24,291,232.17 10,733,487.42 0.00 10,733,487.42 35,024,719.59 4.583%Total real estate
Total real estate 4.583%0.00 35,024,719.59 24,291,232.17 10,733,487.42 0.00 10,733,487.42 35,024,719.59
Venture Capital and Partnerships
Partnerships
United States - USD 0.00 74,527,554.00 32,810,339.44 41,717,214.56 0.00 41,717,214.56 74,527,554.00 9.752%
0.00 74,527,554.00 32,810,339.44 41,717,214.56 0.00 41,717,214.56 74,527,554.00 9.752%Total partnerships
Total venture capital and partnerships 9.752%0.00 74,527,554.00 32,810,339.44 41,717,214.56 0.00 41,717,214.56 74,527,554.00
Hedge Fund
Hedge equity
United States - USD 0.00 49,011,496.00 34,139,000.00 14,872,496.00 0.00 14,872,496.00 49,011,496.00 6.413%
0.00 49,011,496.00 34,139,000.00 14,872,496.00 0.00 14,872,496.00 49,011,496.00 6.413%Total hedge equity
*Generated by Northern Trust from periodic data on 16 Sep 21 B002
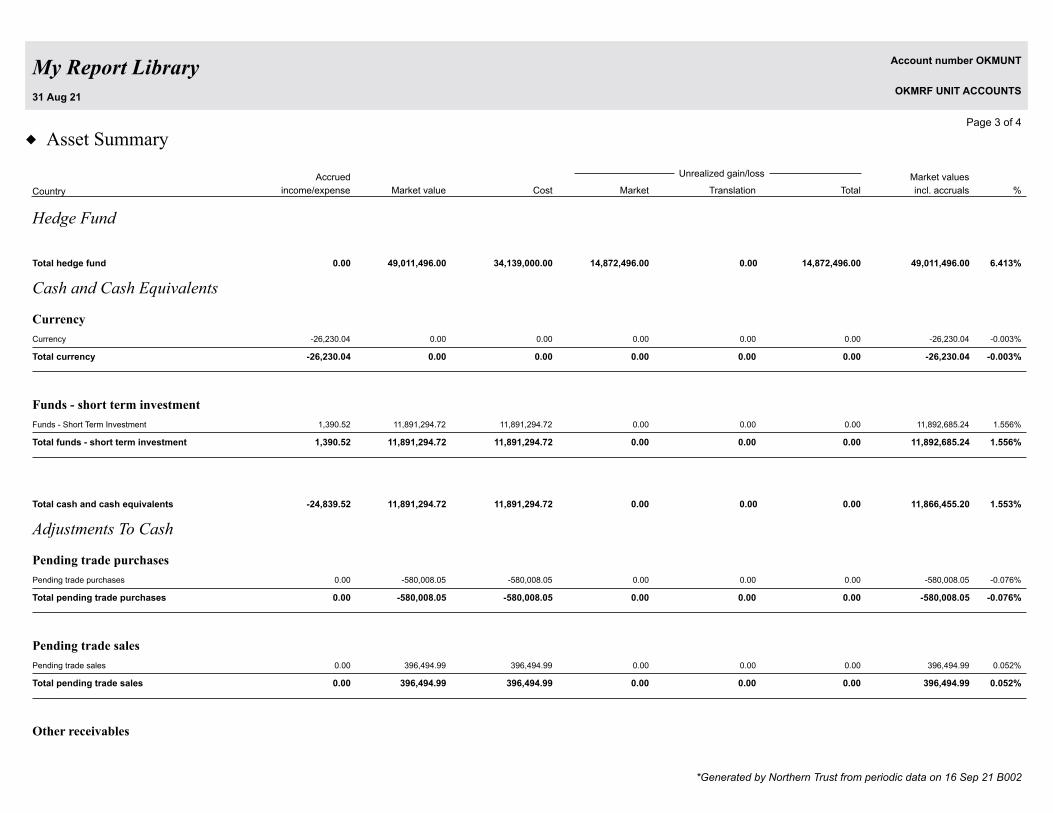
My Report Library
u Asset Summary
Market value Cost
Page 3 of 4
Market Total
Unrealized gain/loss
%
Market values
incl. accruals
Accrued
income/expenseCountry Translation
31 Aug 21
Account number OKMUNT
OKMRF UNIT ACCOUNTS
Hedge Fund
Total hedge fund 6.413%0.00 49,011,496.00 34,139,000.00 14,872,496.00 0.00 14,872,496.00 49,011,496.00
Cash and Cash Equivalents
Currency
Currency -26,230.04 0.00 0.00 0.00 0.00 0.00 -26,230.04 -0.003%
-26,230.04 0.00 0.00 0.00 0.00 0.00 -26,230.04 -0.003%Total currency
Funds - short term investment
Funds - Short Term Investment 1,390.52 11,891,294.72 11,891,294.72 0.00 0.00 0.00 11,892,685.24 1.556%
1,390.52 11,891,294.72 11,891,294.72 0.00 0.00 0.00 11,892,685.24 1.556%Total funds - short term investment
Total cash and cash equivalents 1.553%-24,839.52 11,891,294.72 11,891,294.72 0.00 0.00 0.00 11,866,455.20
Adjustments To Cash
Pending trade purchases
Pending trade purchases 0.00 -580,008.05 -580,008.05 0.00 0.00 0.00 -580,008.05 -0.076%
0.00 -580,008.05 -580,008.05 0.00 0.00 0.00 -580,008.05 -0.076%Total pending trade purchases
Pending trade sales
Pending trade sales 0.00 396,494.99 396,494.99 0.00 0.00 0.00 396,494.99 0.052%
0.00 396,494.99 396,494.99 0.00 0.00 0.00 396,494.99 0.052%Total pending trade sales
Other receivables
*Generated by Northern Trust from periodic data on 16 Sep 21 B002
My Report Library
u Asset Summary
Market value Cost
Page 4 of 4
Market Total
Unrealized gain/loss
%
Market values
incl. accruals
Accrued
income/expenseDescription Translation
31 Aug 21
Account number OKMUNT
OKMRF UNIT ACCOUNTS
Adjustments To Cash
Other Receivables 0.00 281,171.19 281,171.19 0.00 0.00 0.00 281,171.19 0.037%
0.00 281,171.19 281,171.19 0.00 0.00 0.00 281,171.19 0.037%Total other receivables
Total adjustments to cash 0.013%0.00 97,658.13 97,658.13 0.00 0.00 0.00 97,658.13
Total Unrealized Gains
Total Unrealized Losses
Total 100.000%
259,718,102.82
-2,155,369.07
264,310.59 763,968,910.81 506,406,177.06 257,562,733.75 0.00 257,562,733.75 764,233,221.40
Total Cost incl. Accruals 506,670,487.65
Although this report has been prepared using information believed to be reliable, it may contain information provided by third parties or derived from third party information, and/or information that may have been obtained from,
categorized or otherwise reported based upon client direction. The Northern Trust Company does not guarantee the accuracy , timeliness or completeness of any such information. The information included in this report is intended
to assist clients with their financial reporting needs, but you must consult with your accountants, auditors and/or legal counsel to ensure your accounting and financial reporting complies with applicable laws, regulations and
accounting guidance. The Northern Trust Company and its affiliates shall have no responsibility for the consequences of investment decisions made in reliance on information contained in this report .
*Generated by Northern Trust from periodic data on 16 Sep 21 B002
Total Units 8,235,629.5175
Value per Unit: $92.795969
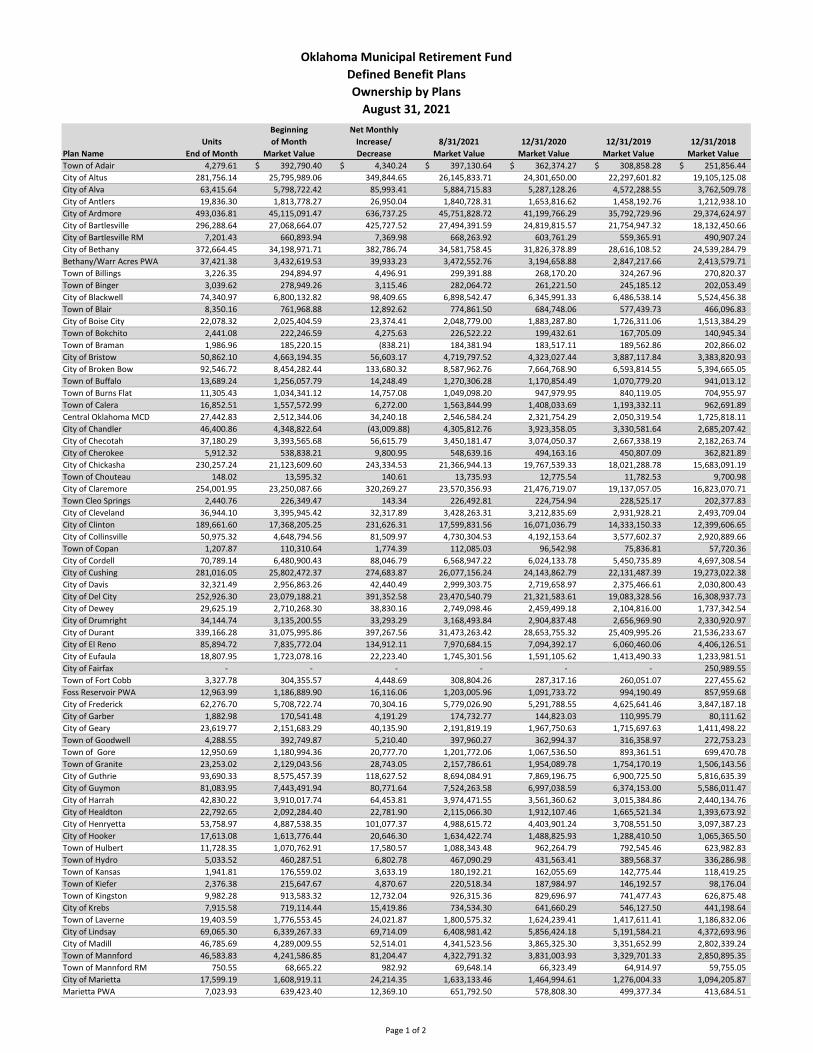
Oklahoma Municipal Retirement FundDefined Benefit PlansOwnership by Plans
August 31, 2021Beginning Net Monthly
Units of Month Increase/ 8/31/2021 12/31/2020 12/31/2019 12/31/2018Plan Name End of Month Market Value Decrease Market Value Market Value Market Value Market ValueTown of Adair 4,279.61 392,790.40$ 4,340.24$ 397,130.64$ 362,374.27$ 308,858.28$ 251,856.44$ City of Altus 281,756.14 25,795,989.06 349,844.65 26,145,833.71 24,301,650.00 22,297,601.82 19,105,125.08 City of Alva 63,415.64 5,798,722.42 85,993.41 5,884,715.83 5,287,128.26 4,572,288.55 3,762,509.78 City of Antlers 19,836.30 1,813,778.27 26,950.04 1,840,728.31 1,653,816.62 1,458,192.76 1,212,938.10 City of Ardmore 493,036.81 45,115,091.47 636,737.25 45,751,828.72 41,199,766.29 35,792,729.96 29,374,624.97 City of Bartlesville 296,288.64 27,068,664.07 425,727.52 27,494,391.59 24,819,815.57 21,754,947.32 18,132,450.66 City of Bartlesville RM 7,201.43 660,893.94 7,369.98 668,263.92 603,761.29 559,365.91 490,907.24 City of Bethany 372,664.45 34,198,971.71 382,786.74 34,581,758.45 31,826,378.89 28,616,108.52 24,539,284.79 Bethany/Warr Acres PWA 37,421.38 3,432,619.53 39,933.23 3,472,552.76 3,194,658.88 2,847,217.66 2,413,579.71 Town of Billings 3,226.35 294,894.97 4,496.91 299,391.88 268,170.20 324,267.96 270,820.37 Town of Binger 3,039.62 278,949.26 3,115.46 282,064.72 261,221.50 245,185.12 202,053.49 City of Blackwell 74,340.97 6,800,132.82 98,409.65 6,898,542.47 6,345,991.33 6,486,538.14 5,524,456.38 Town of Blair 8,350.16 761,968.88 12,892.62 774,861.50 684,748.06 577,439.73 466,096.83 City of Boise City 22,078.32 2,025,404.59 23,374.41 2,048,779.00 1,883,287.80 1,726,311.06 1,513,384.29 Town of Bokchito 2,441.08 222,246.59 4,275.63 226,522.22 199,432.61 167,705.09 140,945.34 Town of Braman 1,986.96 185,220.15 (838.21) 184,381.94 183,517.11 189,562.86 202,866.02 City of Bristow 50,862.10 4,663,194.35 56,603.17 4,719,797.52 4,323,027.44 3,887,117.84 3,383,820.93 City of Broken Bow 92,546.72 8,454,282.44 133,680.32 8,587,962.76 7,664,768.90 6,593,814.55 5,394,665.05 Town of Buffalo 13,689.24 1,256,057.79 14,248.49 1,270,306.28 1,170,854.49 1,070,779.20 941,013.12 Town of Burns Flat 11,305.43 1,034,341.12 14,757.08 1,049,098.20 947,979.95 840,119.05 704,955.97 Town of Calera 16,852.51 1,557,572.99 6,272.00 1,563,844.99 1,408,033.69 1,193,332.11 962,691.89 Central Oklahoma MCD 27,442.83 2,512,344.06 34,240.18 2,546,584.24 2,321,754.29 2,050,319.54 1,725,818.11 City of Chandler 46,400.86 4,348,822.64 (43,009.88) 4,305,812.76 3,923,358.05 3,330,581.64 2,685,207.42 City of Checotah 37,180.29 3,393,565.68 56,615.79 3,450,181.47 3,074,050.37 2,667,338.19 2,182,263.74 City of Cherokee 5,912.32 538,838.21 9,800.95 548,639.16 494,163.16 450,807.09 362,821.89 City of Chickasha 230,257.24 21,123,609.60 243,334.53 21,366,944.13 19,767,539.33 18,021,288.78 15,683,091.19 Town of Chouteau 148.02 13,595.32 140.61 13,735.93 12,775.54 11,782.53 9,700.98 City of Claremore 254,001.95 23,250,087.66 320,269.27 23,570,356.93 21,476,719.07 19,137,057.05 16,823,070.71 Town Cleo Springs 2,440.76 226,349.47 143.34 226,492.81 224,754.94 228,525.17 202,377.83 City of Cleveland 36,944.10 3,395,945.42 32,317.89 3,428,263.31 3,212,835.69 2,931,928.21 2,493,709.04 City of Clinton 189,661.60 17,368,205.25 231,626.31 17,599,831.56 16,071,036.79 14,333,150.33 12,399,606.65 City of Collinsville 50,975.32 4,648,794.56 81,509.97 4,730,304.53 4,192,153.64 3,577,602.37 2,920,889.66 Town of Copan 1,207.87 110,310.64 1,774.39 112,085.03 96,542.98 75,836.81 57,720.36 City of Cordell 70,789.14 6,480,900.43 88,046.79 6,568,947.22 6,024,133.78 5,450,735.89 4,697,308.54 City of Cushing 281,016.05 25,802,472.37 274,683.87 26,077,156.24 24,143,862.79 22,131,487.39 19,273,022.38 City of Davis 32,321.49 2,956,863.26 42,440.49 2,999,303.75 2,719,658.97 2,375,466.61 2,030,800.43 City of Del City 252,926.30 23,079,188.21 391,352.58 23,470,540.79 21,321,583.61 19,083,328.56 16,308,937.73 City of Dewey 29,625.19 2,710,268.30 38,830.16 2,749,098.46 2,459,499.18 2,104,816.00 1,737,342.54 City of Drumright 34,144.74 3,135,200.55 33,293.29 3,168,493.84 2,904,837.48 2,656,969.90 2,330,920.97 City of Durant 339,166.28 31,075,995.86 397,267.56 31,473,263.42 28,653,755.32 25,409,995.26 21,536,233.67 City of El Reno 85,894.72 7,835,772.04 134,912.11 7,970,684.15 7,094,392.17 6,060,460.06 4,406,126.51 City of Eufaula 18,807.95 1,723,078.16 22,223.40 1,745,301.56 1,591,105.62 1,413,490.33 1,233,981.51 City of Fairfax - - - - - - 250,989.55 Town of Fort Cobb 3,327.78 304,355.57 4,448.69 308,804.26 287,317.16 260,051.07 227,455.62 Foss Reservoir PWA 12,963.99 1,186,889.90 16,116.06 1,203,005.96 1,091,733.72 994,190.49 857,959.68 City of Frederick 62,276.70 5,708,722.74 70,304.16 5,779,026.90 5,291,788.55 4,625,641.46 3,847,187.18 City of Garber 1,882.98 170,541.48 4,191.29 174,732.77 144,823.03 110,995.79 80,111.62 City of Geary 23,619.77 2,151,683.29 40,135.90 2,191,819.19 1,967,750.63 1,715,697.63 1,411,498.22 Town of Goodwell 4,288.55 392,749.87 5,210.40 397,960.27 362,994.37 316,358.97 272,753.23 Town of Gore 12,950.69 1,180,994.36 20,777.70 1,201,772.06 1,067,536.50 893,361.51 699,470.78 Town of Granite 23,253.02 2,129,043.56 28,743.05 2,157,786.61 1,954,089.78 1,754,170.19 1,506,143.56 City of Guthrie 93,690.33 8,575,457.39 118,627.52 8,694,084.91 7,869,196.75 6,900,725.50 5,816,635.39 City of Guymon 81,083.95 7,443,491.94 80,771.64 7,524,263.58 6,997,038.59 6,374,153.00 5,586,011.47 City of Harrah 42,830.22 3,910,017.74 64,453.81 3,974,471.55 3,561,360.62 3,015,384.86 2,440,134.76 City of Healdton 22,792.65 2,092,284.40 22,781.90 2,115,066.30 1,912,107.46 1,665,521.34 1,393,673.92 City of Henryetta 53,758.97 4,887,538.35 101,077.37 4,988,615.72 4,403,901.24 3,708,551.50 3,097,387.23 City of Hooker 17,613.08 1,613,776.44 20,646.30 1,634,422.74 1,488,825.93 1,288,410.50 1,065,365.50 Town of Hulbert 11,728.35 1,070,762.91 17,580.57 1,088,343.48 962,264.79 792,545.46 623,982.83 Town of Hydro 5,033.52 460,287.51 6,802.78 467,090.29 431,563.41 389,568.37 336,286.98 Town of Kansas 1,941.81 176,559.02 3,633.19 180,192.21 162,055.69 142,775.44 118,419.25 Town of Kiefer 2,376.38 215,647.67 4,870.67 220,518.34 187,984.97 146,192.57 98,176.04 Town of Kingston 9,982.28 913,583.32 12,732.04 926,315.36 829,696.97 741,477.43 626,875.48 City of Krebs 7,915.58 719,114.44 15,419.86 734,534.30 641,660.29 546,127.50 441,198.64 Town of Laverne 19,403.59 1,776,553.45 24,021.87 1,800,575.32 1,624,239.41 1,417,611.41 1,186,832.06 City of Lindsay 69,065.30 6,339,267.33 69,714.09 6,408,981.42 5,856,424.18 5,191,584.21 4,372,693.96 City of Madill 46,785.69 4,289,009.55 52,514.01 4,341,523.56 3,865,325.30 3,351,652.99 2,802,339.24 Town of Mannford 46,583.83 4,241,586.85 81,204.47 4,322,791.32 3,831,003.93 3,329,701.33 2,850,895.35 Town of Mannford RM 750.55 68,665.22 982.92 69,648.14 66,323.49 64,914.97 59,755.05 City of Marietta 17,599.19 1,608,919.11 24,214.35 1,633,133.46 1,464,994.61 1,276,004.33 1,094,205.87 Marietta PWA 7,023.93 639,423.40 12,369.10 651,792.50 578,808.30 499,377.34 413,684.51
Page 1 of 2
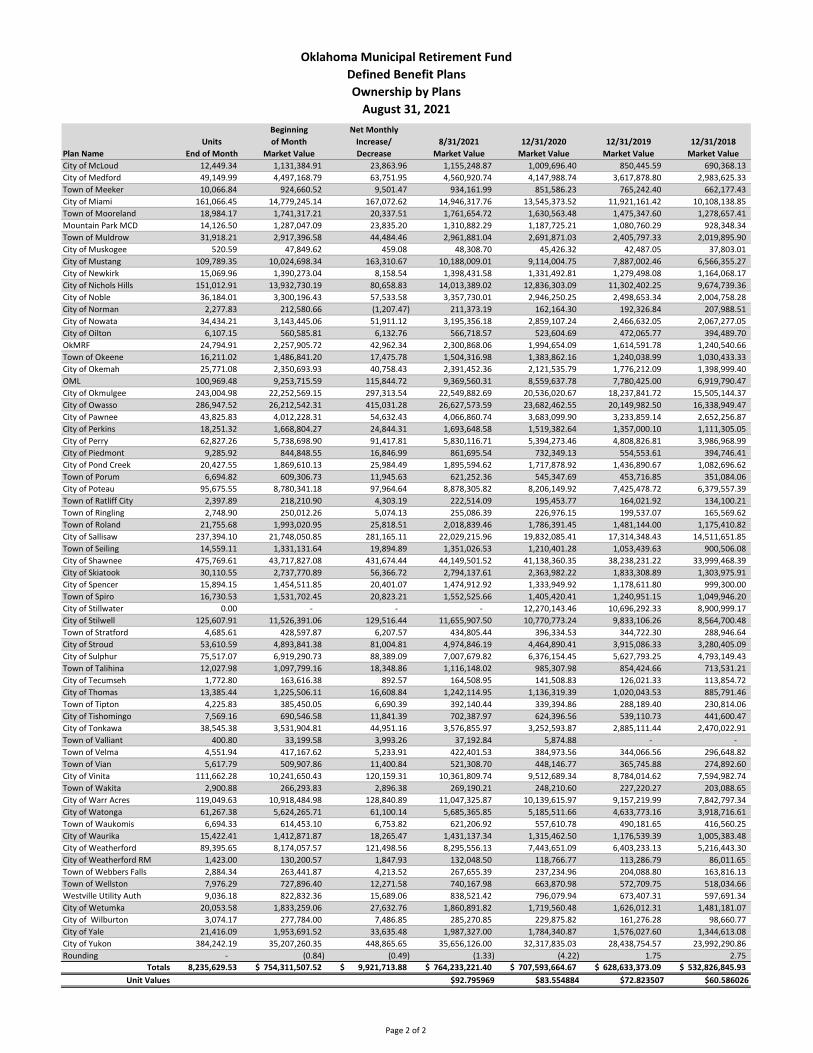
Oklahoma Municipal Retirement FundDefined Benefit PlansOwnership by Plans
August 31, 2021Beginning Net Monthly
Units of Month Increase/ 8/31/2021 12/31/2020 12/31/2019 12/31/2018Plan Name End of Month Market Value Decrease Market Value Market Value Market Value Market ValueCity of McLoud 12,449.34 1,131,384.91 23,863.96 1,155,248.87 1,009,696.40 850,445.59 690,368.13 City of Medford 49,149.99 4,497,168.79 63,751.95 4,560,920.74 4,147,988.74 3,617,878.80 2,983,625.33 Town of Meeker 10,066.84 924,660.52 9,501.47 934,161.99 851,586.23 765,242.40 662,177.43 City of Miami 161,066.45 14,779,245.14 167,072.62 14,946,317.76 13,545,373.52 11,921,161.42 10,108,138.85 Town of Mooreland 18,984.17 1,741,317.21 20,337.51 1,761,654.72 1,630,563.48 1,475,347.60 1,278,657.41 Mountain Park MCD 14,126.50 1,287,047.09 23,835.20 1,310,882.29 1,187,725.21 1,080,760.29 928,348.34 Town of Muldrow 31,918.21 2,917,396.58 44,484.46 2,961,881.04 2,691,871.03 2,405,797.33 2,019,895.90 City of Muskogee 520.59 47,849.62 459.08 48,308.70 45,426.32 42,487.05 37,803.01 City of Mustang 109,789.35 10,024,698.34 163,310.67 10,188,009.01 9,114,004.75 7,887,002.46 6,566,355.27 City of Newkirk 15,069.96 1,390,273.04 8,158.54 1,398,431.58 1,331,492.81 1,279,498.08 1,164,068.17 City of Nichols Hills 151,012.91 13,932,730.19 80,658.83 14,013,389.02 12,836,303.09 11,302,402.25 9,674,739.36 City of Noble 36,184.01 3,300,196.43 57,533.58 3,357,730.01 2,946,250.25 2,498,653.34 2,004,758.28 City of Norman 2,277.83 212,580.66 (1,207.47) 211,373.19 162,164.30 192,326.84 207,988.51 City of Nowata 34,434.21 3,143,445.06 51,911.12 3,195,356.18 2,859,107.24 2,466,632.05 2,067,277.05 City of Oilton 6,107.15 560,585.81 6,132.76 566,718.57 523,604.69 472,065.77 394,489.70 OkMRF 24,794.91 2,257,905.72 42,962.34 2,300,868.06 1,994,654.09 1,614,591.78 1,240,540.66 Town of Okeene 16,211.02 1,486,841.20 17,475.78 1,504,316.98 1,383,862.16 1,240,038.99 1,030,433.33 City of Okemah 25,771.08 2,350,693.93 40,758.43 2,391,452.36 2,121,535.79 1,776,212.09 1,398,999.40 OML 100,969.48 9,253,715.59 115,844.72 9,369,560.31 8,559,637.78 7,780,425.00 6,919,790.47 City of Okmulgee 243,004.98 22,252,569.15 297,313.54 22,549,882.69 20,536,020.67 18,237,841.72 15,505,144.37 City of Owasso 286,947.52 26,212,542.31 415,031.28 26,627,573.59 23,682,462.55 20,149,982.50 16,338,949.47 City of Pawnee 43,825.83 4,012,228.31 54,632.43 4,066,860.74 3,683,099.90 3,233,859.14 2,652,256.87 City of Perkins 18,251.32 1,668,804.27 24,844.31 1,693,648.58 1,519,382.64 1,357,000.10 1,111,305.05 City of Perry 62,827.26 5,738,698.90 91,417.81 5,830,116.71 5,394,273.46 4,808,826.81 3,986,968.99 City of Piedmont 9,285.92 844,848.55 16,846.99 861,695.54 732,349.13 554,553.61 394,746.41 City of Pond Creek 20,427.55 1,869,610.13 25,984.49 1,895,594.62 1,717,878.92 1,436,890.67 1,082,696.62 Town of Porum 6,694.82 609,306.73 11,945.63 621,252.36 545,347.69 453,716.85 351,084.06 City of Poteau 95,675.55 8,780,341.18 97,964.64 8,878,305.82 8,206,149.92 7,425,478.72 6,379,557.39 Town of Ratliff City 2,397.89 218,210.90 4,303.19 222,514.09 195,453.77 164,021.92 134,100.21 Town of Ringling 2,748.90 250,012.26 5,074.13 255,086.39 226,976.15 199,537.07 165,569.62 Town of Roland 21,755.68 1,993,020.95 25,818.51 2,018,839.46 1,786,391.45 1,481,144.00 1,175,410.82 City of Sallisaw 237,394.10 21,748,050.85 281,165.11 22,029,215.96 19,832,085.41 17,314,348.43 14,511,651.85 Town of Seiling 14,559.11 1,331,131.64 19,894.89 1,351,026.53 1,210,401.28 1,053,439.63 900,506.08 City of Shawnee 475,769.61 43,717,827.08 431,674.44 44,149,501.52 41,138,360.35 38,238,231.22 33,999,468.39 City of Skiatook 30,110.55 2,737,770.89 56,366.72 2,794,137.61 2,363,982.22 1,833,308.89 1,303,975.91 City of Spencer 15,894.15 1,454,511.85 20,401.07 1,474,912.92 1,333,949.92 1,178,611.80 999,300.00 Town of Spiro 16,730.53 1,531,702.45 20,823.21 1,552,525.66 1,405,420.41 1,240,951.15 1,049,946.20 City of Stillwater 0.00 - - - 12,270,143.46 10,696,292.33 8,900,999.17 City of Stilwell 125,607.91 11,526,391.06 129,516.44 11,655,907.50 10,770,773.24 9,833,106.26 8,564,700.48 Town of Stratford 4,685.61 428,597.87 6,207.57 434,805.44 396,334.53 344,722.30 288,946.64 City of Stroud 53,610.59 4,893,841.38 81,004.81 4,974,846.19 4,464,890.41 3,915,086.33 3,280,405.09 City of Sulphur 75,517.07 6,919,290.73 88,389.09 7,007,679.82 6,376,154.45 5,627,793.25 4,793,149.43 Town of Talihina 12,027.98 1,097,799.16 18,348.86 1,116,148.02 985,307.98 854,424.66 713,531.21 City of Tecumseh 1,772.80 163,616.38 892.57 164,508.95 141,508.83 126,021.33 113,854.72 City of Thomas 13,385.44 1,225,506.11 16,608.84 1,242,114.95 1,136,319.39 1,020,043.53 885,791.46 Town of Tipton 4,225.83 385,450.05 6,690.39 392,140.44 339,394.86 288,189.40 230,814.06 City of Tishomingo 7,569.16 690,546.58 11,841.39 702,387.97 624,396.56 539,110.73 441,600.47 City of Tonkawa 38,545.38 3,531,904.81 44,951.16 3,576,855.97 3,252,593.87 2,885,111.44 2,470,022.91 Town of Valliant 400.80 33,199.58 3,993.26 37,192.84 5,874.88 - - Town of Velma 4,551.94 417,167.62 5,233.91 422,401.53 384,973.56 344,066.56 296,648.82 Town of Vian 5,617.79 509,907.86 11,400.84 521,308.70 448,146.77 365,745.88 274,892.60 City of Vinita 111,662.28 10,241,650.43 120,159.31 10,361,809.74 9,512,689.34 8,784,014.62 7,594,982.74 Town of Wakita 2,900.88 266,293.83 2,896.38 269,190.21 248,210.60 227,220.27 203,088.65 City of Warr Acres 119,049.63 10,918,484.98 128,840.89 11,047,325.87 10,139,615.97 9,157,219.99 7,842,797.34 City of Watonga 61,267.38 5,624,265.71 61,100.14 5,685,365.85 5,185,511.66 4,633,773.16 3,918,716.61 Town of Waukomis 6,694.33 614,453.10 6,753.82 621,206.92 557,610.78 490,181.65 416,560.25 City of Waurika 15,422.41 1,412,871.87 18,265.47 1,431,137.34 1,315,462.50 1,176,539.39 1,005,383.48 City of Weatherford 89,395.65 8,174,057.57 121,498.56 8,295,556.13 7,443,651.09 6,403,233.13 5,216,443.30 City of Weatherford RM 1,423.00 130,200.57 1,847.93 132,048.50 118,766.77 113,286.79 86,011.65 Town of Webbers Falls 2,884.34 263,441.87 4,213.52 267,655.39 237,234.96 204,088.80 163,816.13 Town of Wellston 7,976.29 727,896.40 12,271.58 740,167.98 663,870.98 572,709.75 518,034.66 Westville Utility Auth 9,036.18 822,832.36 15,689.06 838,521.42 796,079.94 673,407.31 597,691.34 City of Wetumka 20,053.58 1,833,259.06 27,632.76 1,860,891.82 1,719,560.48 1,626,012.31 1,481,181.07 City of Wilburton 3,074.17 277,784.00 7,486.85 285,270.85 229,875.82 161,276.28 98,660.77 City of Yale 21,416.09 1,953,691.52 33,635.48 1,987,327.00 1,784,340.87 1,576,027.60 1,344,613.08 City of Yukon 384,242.19 35,207,260.35 448,865.65 35,656,126.00 32,317,835.03 28,438,754.57 23,992,290.86 Rounding - (0.84) (0.49) (1.33) (4.22) 1.75 2.75
Totals 8,235,629.53 754,311,507.52$ 9,921,713.88$ 764,233,221.40$ 707,593,664.67$ 628,633,373.09$ 532,826,845.93$ Unit Values $92.795969 $83.554884 $72.823507 $60.586026
Page 2 of 2
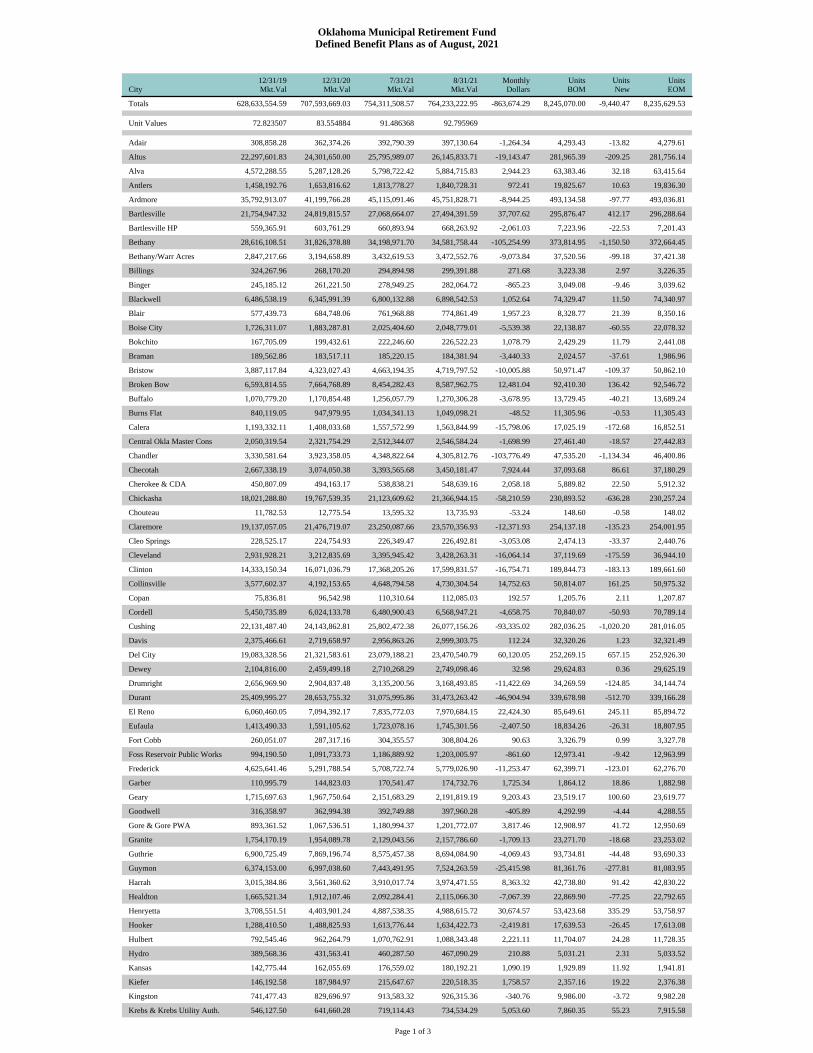
Page 1 of 3
Oklahoma Municipal Retirement FundDefined Benefit Plans as of August, 2021
City12/31/19Mkt.Val
12/31/20Mkt.Val
7/31/21Mkt.Val
8/31/21Mkt.Val
MonthlyDollars
UnitsBOM
UnitsNew
UnitsEOM
Totals 628,633,554.59 707,593,669.03 754,311,508.57 764,233,222.95 -863,674.29 8,245,070.00 -9,440.47 8,235,629.53
Unit Values 72.823507 83.554884 91.486368 92.795969
Adair 308,858.28 362,374.26 392,790.39 397,130.64 -1,264.34 4,293.43 -13.82 4,279.61
Altus 22,297,601.83 24,301,650.00 25,795,989.07 26,145,833.71 -19,143.47 281,965.39 -209.25 281,756.14
Alva 4,572,288.55 5,287,128.26 5,798,722.42 5,884,715.83 2,944.23 63,383.46 32.18 63,415.64
Antlers 1,458,192.76 1,653,816.62 1,813,778.27 1,840,728.31 972.41 19,825.67 10.63 19,836.30
Ardmore 35,792,913.07 41,199,766.28 45,115,091.46 45,751,828.71 -8,944.25 493,134.58 -97.77 493,036.81
Bartlesville 21,754,947.32 24,819,815.57 27,068,664.07 27,494,391.59 37,707.62 295,876.47 412.17 296,288.64
Bartlesville HP 559,365.91 603,761.29 660,893.94 668,263.92 -2,061.03 7,223.96 -22.53 7,201.43
Bethany 28,616,108.51 31,826,378.88 34,198,971.70 34,581,758.44 -105,254.99 373,814.95 -1,150.50 372,664.45
Bethany/Warr Acres 2,847,217.66 3,194,658.89 3,432,619.53 3,472,552.76 -9,073.84 37,520.56 -99.18 37,421.38
Billings 324,267.96 268,170.20 294,894.98 299,391.88 271.68 3,223.38 2.97 3,226.35
Binger 245,185.12 261,221.50 278,949.25 282,064.72 -865.23 3,049.08 -9.46 3,039.62
Blackwell 6,486,538.19 6,345,991.39 6,800,132.88 6,898,542.53 1,052.64 74,329.47 11.50 74,340.97
Blair 577,439.73 684,748.06 761,968.88 774,861.49 1,957.23 8,328.77 21.39 8,350.16
Boise City 1,726,311.07 1,883,287.81 2,025,404.60 2,048,779.01 -5,539.38 22,138.87 -60.55 22,078.32
Bokchito 167,705.09 199,432.61 222,246.60 226,522.23 1,078.79 2,429.29 11.79 2,441.08
Braman 189,562.86 183,517.11 185,220.15 184,381.94 -3,440.33 2,024.57 -37.61 1,986.96
Bristow 3,887,117.84 4,323,027.43 4,663,194.35 4,719,797.52 -10,005.88 50,971.47 -109.37 50,862.10
Broken Bow 6,593,814.55 7,664,768.89 8,454,282.43 8,587,962.75 12,481.04 92,410.30 136.42 92,546.72
Buffalo 1,070,779.20 1,170,854.48 1,256,057.79 1,270,306.28 -3,678.95 13,729.45 -40.21 13,689.24
Burns Flat 840,119.05 947,979.95 1,034,341.13 1,049,098.21 -48.52 11,305.96 -0.53 11,305.43
Calera 1,193,332.11 1,408,033.68 1,557,572.99 1,563,844.99 -15,798.06 17,025.19 -172.68 16,852.51
Central Okla Master Cons 2,050,319.54 2,321,754.29 2,512,344.07 2,546,584.24 -1,698.99 27,461.40 -18.57 27,442.83
Chandler 3,330,581.64 3,923,358.05 4,348,822.64 4,305,812.76 -103,776.49 47,535.20 -1,134.34 46,400.86
Checotah 2,667,338.19 3,074,050.38 3,393,565.68 3,450,181.47 7,924.44 37,093.68 86.61 37,180.29
Cherokee & CDA 450,807.09 494,163.17 538,838.21 548,639.16 2,058.18 5,889.82 22.50 5,912.32
Chickasha 18,021,288.80 19,767,539.35 21,123,609.62 21,366,944.15 -58,210.59 230,893.52 -636.28 230,257.24
Chouteau 11,782.53 12,775.54 13,595.32 13,735.93 -53.24 148.60 -0.58 148.02
Claremore 19,137,057.05 21,476,719.07 23,250,087.66 23,570,356.93 -12,371.93 254,137.18 -135.23 254,001.95
Cleo Springs 228,525.17 224,754.93 226,349.47 226,492.81 -3,053.08 2,474.13 -33.37 2,440.76
Cleveland 2,931,928.21 3,212,835.69 3,395,945.42 3,428,263.31 -16,064.14 37,119.69 -175.59 36,944.10
Clinton 14,333,150.34 16,071,036.79 17,368,205.26 17,599,831.57 -16,754.71 189,844.73 -183.13 189,661.60
Collinsville 3,577,602.37 4,192,153.65 4,648,794.58 4,730,304.54 14,752.63 50,814.07 161.25 50,975.32
Copan 75,836.81 96,542.98 110,310.64 112,085.03 192.57 1,205.76 2.11 1,207.87
Cordell 5,450,735.89 6,024,133.78 6,480,900.43 6,568,947.21 -4,658.75 70,840.07 -50.93 70,789.14
Cushing 22,131,487.40 24,143,862.81 25,802,472.38 26,077,156.26 -93,335.02 282,036.25 -1,020.20 281,016.05
Davis 2,375,466.61 2,719,658.97 2,956,863.26 2,999,303.75 112.24 32,320.26 1.23 32,321.49
Del City 19,083,328.56 21,321,583.61 23,079,188.21 23,470,540.79 60,120.05 252,269.15 657.15 252,926.30
Dewey 2,104,816.00 2,459,499.18 2,710,268.29 2,749,098.46 32.98 29,624.83 0.36 29,625.19
Drumright 2,656,969.90 2,904,837.48 3,135,200.56 3,168,493.85 -11,422.69 34,269.59 -124.85 34,144.74
Durant 25,409,995.27 28,653,755.32 31,075,995.86 31,473,263.42 -46,904.94 339,678.98 -512.70 339,166.28
El Reno 6,060,460.05 7,094,392.17 7,835,772.03 7,970,684.15 22,424.30 85,649.61 245.11 85,894.72
Eufaula 1,413,490.33 1,591,105.62 1,723,078.16 1,745,301.56 -2,407.50 18,834.26 -26.31 18,807.95
Fort Cobb 260,051.07 287,317.16 304,355.57 308,804.26 90.63 3,326.79 0.99 3,327.78
Foss Reservoir Public Works 994,190.50 1,091,733.73 1,186,889.92 1,203,005.97 -861.60 12,973.41 -9.42 12,963.99
Frederick 4,625,641.46 5,291,788.54 5,708,722.74 5,779,026.90 -11,253.47 62,399.71 -123.01 62,276.70
Garber 110,995.79 144,823.03 170,541.47 174,732.76 1,725.34 1,864.12 18.86 1,882.98
Geary 1,715,697.63 1,967,750.64 2,151,683.29 2,191,819.19 9,203.43 23,519.17 100.60 23,619.77
Goodwell 316,358.97 362,994.38 392,749.88 397,960.28 -405.89 4,292.99 -4.44 4,288.55
Gore & Gore PWA 893,361.52 1,067,536.51 1,180,994.37 1,201,772.07 3,817.46 12,908.97 41.72 12,950.69
Granite 1,754,170.19 1,954,089.78 2,129,043.56 2,157,786.60 -1,709.13 23,271.70 -18.68 23,253.02
Guthrie 6,900,725.49 7,869,196.74 8,575,457.38 8,694,084.90 -4,069.43 93,734.81 -44.48 93,690.33
Guymon 6,374,153.00 6,997,038.60 7,443,491.95 7,524,263.59 -25,415.98 81,361.76 -277.81 81,083.95
Harrah 3,015,384.86 3,561,360.62 3,910,017.74 3,974,471.55 8,363.32 42,738.80 91.42 42,830.22
Healdton 1,665,521.34 1,912,107.46 2,092,284.41 2,115,066.30 -7,067.39 22,869.90 -77.25 22,792.65
Henryetta 3,708,551.51 4,403,901.24 4,887,538.35 4,988,615.72 30,674.57 53,423.68 335.29 53,758.97
Hooker 1,288,410.50 1,488,825.93 1,613,776.44 1,634,422.73 -2,419.81 17,639.53 -26.45 17,613.08
Hulbert 792,545.46 962,264.79 1,070,762.91 1,088,343.48 2,221.11 11,704.07 24.28 11,728.35
Hydro 389,568.36 431,563.41 460,287.50 467,090.29 210.88 5,031.21 2.31 5,033.52
Kansas 142,775.44 162,055.69 176,559.02 180,192.21 1,090.19 1,929.89 11.92 1,941.81
Kiefer 146,192.58 187,984.97 215,647.67 220,518.35 1,758.57 2,357.16 19.22 2,376.38
Kingston 741,477.43 829,696.97 913,583.32 926,315.36 -340.76 9,986.00 -3.72 9,982.28
Krebs & Krebs Utility Auth. 546,127.50 641,660.28 719,114.43 734,534.29 5,053.60 7,860.35 55.23 7,915.58
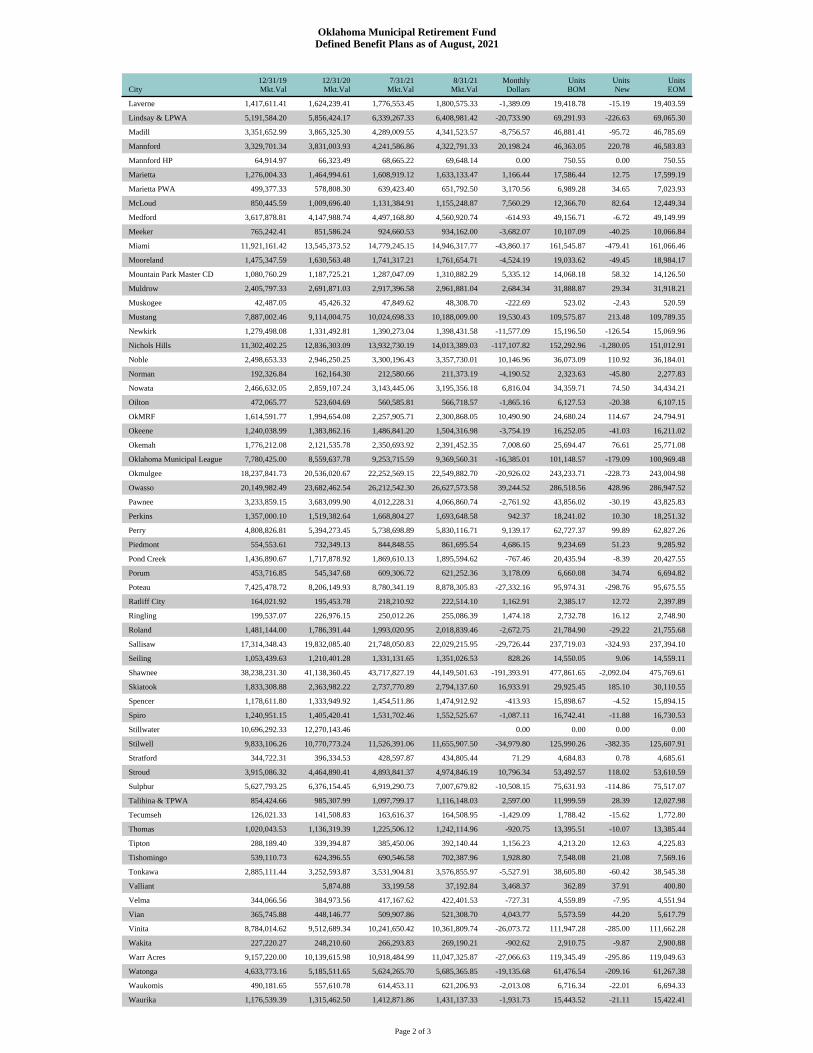
Page 2 of 3
Oklahoma Municipal Retirement FundDefined Benefit Plans as of August, 2021
City12/31/19Mkt.Val
12/31/20Mkt.Val
7/31/21Mkt.Val
8/31/21Mkt.Val
MonthlyDollars
UnitsBOM
UnitsNew
UnitsEOM
Laverne 1,417,611.41 1,624,239.41 1,776,553.45 1,800,575.33 -1,389.09 19,418.78 -15.19 19,403.59
Lindsay & LPWA 5,191,584.20 5,856,424.17 6,339,267.33 6,408,981.42 -20,733.90 69,291.93 -226.63 69,065.30
Madill 3,351,652.99 3,865,325.30 4,289,009.55 4,341,523.57 -8,756.57 46,881.41 -95.72 46,785.69
Mannford 3,329,701.34 3,831,003.93 4,241,586.86 4,322,791.33 20,198.24 46,363.05 220.78 46,583.83
Mannford HP 64,914.97 66,323.49 68,665.22 69,648.14 0.00 750.55 0.00 750.55
Marietta 1,276,004.33 1,464,994.61 1,608,919.12 1,633,133.47 1,166.44 17,586.44 12.75 17,599.19
Marietta PWA 499,377.33 578,808.30 639,423.40 651,792.50 3,170.56 6,989.28 34.65 7,023.93
McLoud 850,445.59 1,009,696.40 1,131,384.91 1,155,248.87 7,560.29 12,366.70 82.64 12,449.34
Medford 3,617,878.81 4,147,988.74 4,497,168.80 4,560,920.74 -614.93 49,156.71 -6.72 49,149.99
Meeker 765,242.41 851,586.24 924,660.53 934,162.00 -3,682.07 10,107.09 -40.25 10,066.84
Miami 11,921,161.42 13,545,373.52 14,779,245.15 14,946,317.77 -43,860.17 161,545.87 -479.41 161,066.46
Mooreland 1,475,347.59 1,630,563.48 1,741,317.21 1,761,654.71 -4,524.19 19,033.62 -49.45 18,984.17
Mountain Park Master CD 1,080,760.29 1,187,725.21 1,287,047.09 1,310,882.29 5,335.12 14,068.18 58.32 14,126.50
Muldrow 2,405,797.33 2,691,871.03 2,917,396.58 2,961,881.04 2,684.34 31,888.87 29.34 31,918.21
Muskogee 42,487.05 45,426.32 47,849.62 48,308.70 -222.69 523.02 -2.43 520.59
Mustang 7,887,002.46 9,114,004.75 10,024,698.33 10,188,009.00 19,530.43 109,575.87 213.48 109,789.35
Newkirk 1,279,498.08 1,331,492.81 1,390,273.04 1,398,431.58 -11,577.09 15,196.50 -126.54 15,069.96
Nichols Hills 11,302,402.25 12,836,303.09 13,932,730.19 14,013,389.03 -117,107.82 152,292.96 -1,280.05 151,012.91
Noble 2,498,653.33 2,946,250.25 3,300,196.43 3,357,730.01 10,146.96 36,073.09 110.92 36,184.01
Norman 192,326.84 162,164.30 212,580.66 211,373.19 -4,190.52 2,323.63 -45.80 2,277.83
Nowata 2,466,632.05 2,859,107.24 3,143,445.06 3,195,356.18 6,816.04 34,359.71 74.50 34,434.21
Oilton 472,065.77 523,604.69 560,585.81 566,718.57 -1,865.16 6,127.53 -20.38 6,107.15
OkMRF 1,614,591.77 1,994,654.08 2,257,905.71 2,300,868.05 10,490.90 24,680.24 114.67 24,794.91
Okeene 1,240,038.99 1,383,862.16 1,486,841.20 1,504,316.98 -3,754.19 16,252.05 -41.03 16,211.02
Okemah 1,776,212.08 2,121,535.78 2,350,693.92 2,391,452.35 7,008.60 25,694.47 76.61 25,771.08
Oklahoma Municipal League 7,780,425.00 8,559,637.78 9,253,715.59 9,369,560.31 -16,385.01 101,148.57 -179.09 100,969.48
Okmulgee 18,237,841.73 20,536,020.67 22,252,569.15 22,549,882.70 -20,926.02 243,233.71 -228.73 243,004.98
Owasso 20,149,982.49 23,682,462.54 26,212,542.30 26,627,573.58 39,244.52 286,518.56 428.96 286,947.52
Pawnee 3,233,859.15 3,683,099.90 4,012,228.31 4,066,860.74 -2,761.92 43,856.02 -30.19 43,825.83
Perkins 1,357,000.10 1,519,382.64 1,668,804.27 1,693,648.58 942.37 18,241.02 10.30 18,251.32
Perry 4,808,826.81 5,394,273.45 5,738,698.89 5,830,116.71 9,139.17 62,727.37 99.89 62,827.26
Piedmont 554,553.61 732,349.13 844,848.55 861,695.54 4,686.15 9,234.69 51.23 9,285.92
Pond Creek 1,436,890.67 1,717,878.92 1,869,610.13 1,895,594.62 -767.46 20,435.94 -8.39 20,427.55
Porum 453,716.85 545,347.68 609,306.72 621,252.36 3,178.09 6,660.08 34.74 6,694.82
Poteau 7,425,478.72 8,206,149.93 8,780,341.19 8,878,305.83 -27,332.16 95,974.31 -298.76 95,675.55
Ratliff City 164,021.92 195,453.78 218,210.92 222,514.10 1,162.91 2,385.17 12.72 2,397.89
Ringling 199,537.07 226,976.15 250,012.26 255,086.39 1,474.18 2,732.78 16.12 2,748.90
Roland 1,481,144.00 1,786,391.44 1,993,020.95 2,018,839.46 -2,672.75 21,784.90 -29.22 21,755.68
Sallisaw 17,314,348.43 19,832,085.40 21,748,050.83 22,029,215.95 -29,726.44 237,719.03 -324.93 237,394.10
Seiling 1,053,439.63 1,210,401.28 1,331,131.65 1,351,026.53 828.26 14,550.05 9.06 14,559.11
Shawnee 38,238,231.30 41,138,360.45 43,717,827.19 44,149,501.63 -191,393.91 477,861.65 -2,092.04 475,769.61
Skiatook 1,833,308.88 2,363,982.22 2,737,770.89 2,794,137.60 16,933.91 29,925.45 185.10 30,110.55
Spencer 1,178,611.80 1,333,949.92 1,454,511.86 1,474,912.92 -413.93 15,898.67 -4.52 15,894.15
Spiro 1,240,951.15 1,405,420.41 1,531,702.46 1,552,525.67 -1,087.11 16,742.41 -11.88 16,730.53
Stillwater 10,696,292.33 12,270,143.46 0.00 0.00 0.00 0.00
Stilwell 9,833,106.26 10,770,773.24 11,526,391.06 11,655,907.50 -34,979.80 125,990.26 -382.35 125,607.91
Stratford 344,722.31 396,334.53 428,597.87 434,805.44 71.29 4,684.83 0.78 4,685.61
Stroud 3,915,086.32 4,464,890.41 4,893,841.37 4,974,846.19 10,796.34 53,492.57 118.02 53,610.59
Sulphur 5,627,793.25 6,376,154.45 6,919,290.73 7,007,679.82 -10,508.15 75,631.93 -114.86 75,517.07
Talihina & TPWA 854,424.66 985,307.99 1,097,799.17 1,116,148.03 2,597.00 11,999.59 28.39 12,027.98
Tecumseh 126,021.33 141,508.83 163,616.37 164,508.95 -1,429.09 1,788.42 -15.62 1,772.80
Thomas 1,020,043.53 1,136,319.39 1,225,506.12 1,242,114.96 -920.75 13,395.51 -10.07 13,385.44
Tipton 288,189.40 339,394.87 385,450.06 392,140.44 1,156.23 4,213.20 12.63 4,225.83
Tishomingo 539,110.73 624,396.55 690,546.58 702,387.96 1,928.80 7,548.08 21.08 7,569.16
Tonkawa 2,885,111.44 3,252,593.87 3,531,904.81 3,576,855.97 -5,527.91 38,605.80 -60.42 38,545.38
Valliant 5,874.88 33,199.58 37,192.84 3,468.37 362.89 37.91 400.80
Velma 344,066.56 384,973.56 417,167.62 422,401.53 -727.31 4,559.89 -7.95 4,551.94
Vian 365,745.88 448,146.77 509,907.86 521,308.70 4,043.77 5,573.59 44.20 5,617.79
Vinita 8,784,014.62 9,512,689.34 10,241,650.42 10,361,809.74 -26,073.72 111,947.28 -285.00 111,662.28
Wakita 227,220.27 248,210.60 266,293.83 269,190.21 -902.62 2,910.75 -9.87 2,900.88
Warr Acres 9,157,220.00 10,139,615.98 10,918,484.99 11,047,325.87 -27,066.63 119,345.49 -295.86 119,049.63
Watonga 4,633,773.16 5,185,511.65 5,624,265.70 5,685,365.85 -19,135.68 61,476.54 -209.16 61,267.38
Waukomis 490,181.65 557,610.78 614,453.11 621,206.93 -2,013.08 6,716.34 -22.01 6,694.33
Waurika 1,176,539.39 1,315,462.50 1,412,871.86 1,431,137.33 -1,931.73 15,443.52 -21.11 15,422.41
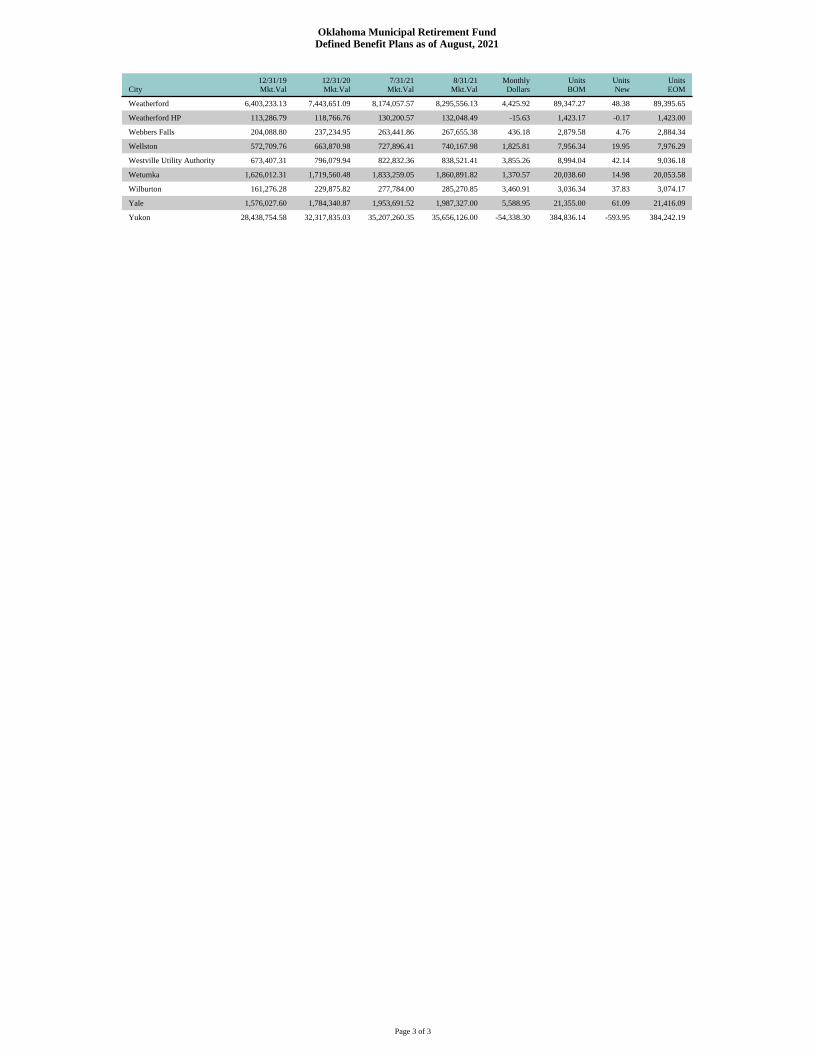
Page 3 of 3
Oklahoma Municipal Retirement FundDefined Benefit Plans as of August, 2021
City12/31/19Mkt.Val
12/31/20Mkt.Val
7/31/21Mkt.Val
8/31/21Mkt.Val
MonthlyDollars
UnitsBOM
UnitsNew
UnitsEOM
Weatherford 6,403,233.13 7,443,651.09 8,174,057.57 8,295,556.13 4,425.92 89,347.27 48.38 89,395.65
Weatherford HP 113,286.79 118,766.76 130,200.57 132,048.49 -15.63 1,423.17 -0.17 1,423.00
Webbers Falls 204,088.80 237,234.95 263,441.86 267,655.38 436.18 2,879.58 4.76 2,884.34
Wellston 572,709.76 663,870.98 727,896.41 740,167.98 1,825.81 7,956.34 19.95 7,976.29
Westville Utility Authority 673,407.31 796,079.94 822,832.36 838,521.41 3,855.26 8,994.04 42.14 9,036.18
Wetumka 1,626,012.31 1,719,560.48 1,833,259.05 1,860,891.82 1,370.57 20,038.60 14.98 20,053.58
Wilburton 161,276.28 229,875.82 277,784.00 285,270.85 3,460.91 3,036.34 37.83 3,074.17
Yale 1,576,027.60 1,784,340.87 1,953,691.52 1,987,327.00 5,588.95 21,355.00 61.09 21,416.09
Yukon 28,438,754.58 32,317,835.03 35,207,260.35 35,656,126.00 -54,338.30 384,836.14 -593.95 384,242.19
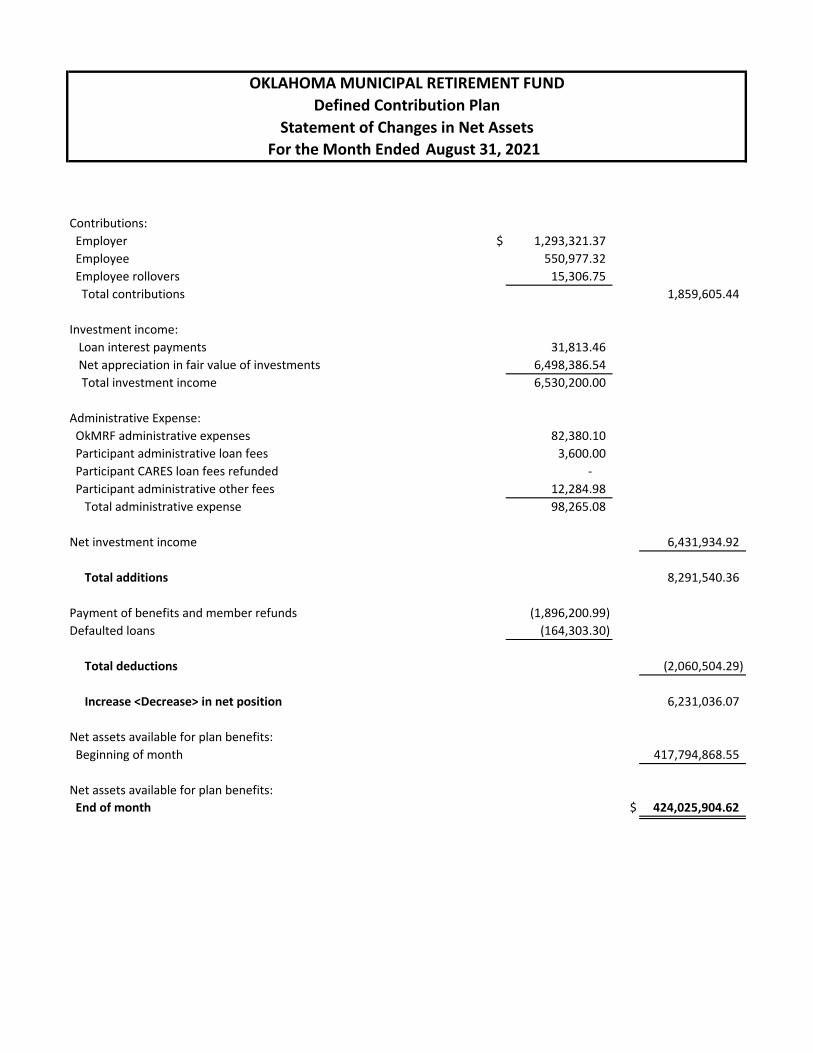
OKLAHOMA MUNICIPAL RETIREMENT FUNDDefined Contribution Plan
Statement of Changes in Net Assets
Contributions: Employer $ 1,293,321.37 Employee 550,977.32 Employee rollovers 15,306.75 Total contributions 1,859,605.44
Investment income: Loan interest payments 31,813.46 Net appreciation in fair value of investments 6,498,386.54 Total investment income 6,530,200.00
Administrative Expense: OkMRF administrative expenses 82,380.10 Participant administrative loan fees 3,600.00 Participant CARES loan fees refunded - Participant administrative other fees 12,284.98 Total administrative expense 98,265.08 Net investment income 6,431,934.92
Total additions 8,291,540.36
Payment of benefits and member refunds (1,896,200.99) Defaulted loans (164,303.30) Total deductions (2,060,504.29)
Increase <Decrease> in net position 6,231,036.07
Net assets available for plan benefits: Beginning of month 417,794,868.55
Net assets available for plan benefits: End of month $ 424,025,904.62
For the Month Ended August 31, 2021
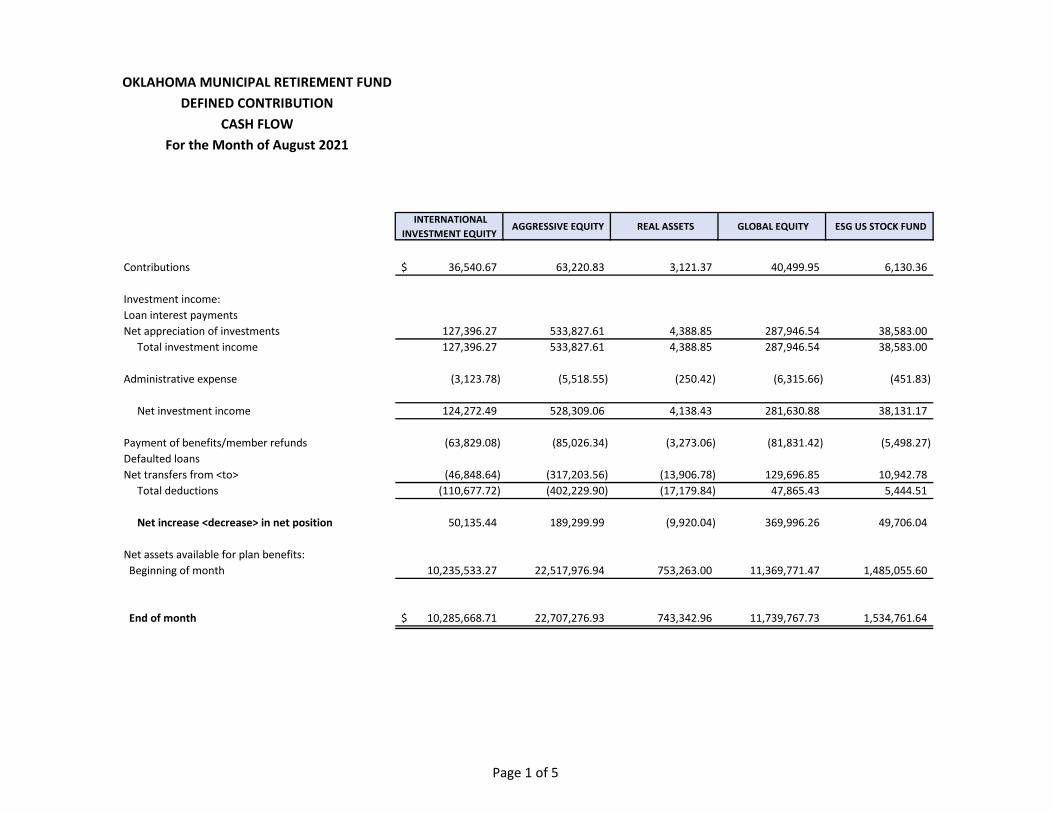
OKLAHOMA MUNICIPAL RETIREMENT FUNDDEFINED CONTRIBUTION
CASH FLOWFor the Month of August 2021
INTERNATIONAL INVESTMENT EQUITY
AGGRESSIVE EQUITY REAL ASSETS GLOBAL EQUITY ESG US STOCK FUND
Contributions 36,540.67$ 63,220.83 3,121.37 40,499.95 6,130.36
Investment income:Loan interest paymentsNet appreciation of investments 127,396.27 533,827.61 4,388.85 287,946.54 38,583.00 Total investment income 127,396.27 533,827.61 4,388.85 287,946.54 38,583.00
Administrative expense (3,123.78) (5,518.55) (250.42) (6,315.66) (451.83)
Net investment income 124,272.49 528,309.06 4,138.43 281,630.88 38,131.17
Payment of benefits/member refunds (63,829.08) (85,026.34) (3,273.06) (81,831.42) (5,498.27) Defaulted loansNet transfers from <to> (46,848.64) (317,203.56) (13,906.78) 129,696.85 10,942.78 Total deductions (110,677.72) (402,229.90) (17,179.84) 47,865.43 5,444.51
Net increase <decrease> in net position 50,135.44 189,299.99 (9,920.04) 369,996.26 49,706.04
Net assets available for plan benefits: Beginning of month 10,235,533.27 22,517,976.94 753,263.00 11,369,771.47 1,485,055.60
End of month 10,285,668.71$ 22,707,276.93 743,342.96 11,739,767.73 1,534,761.64
Page 1 of 5
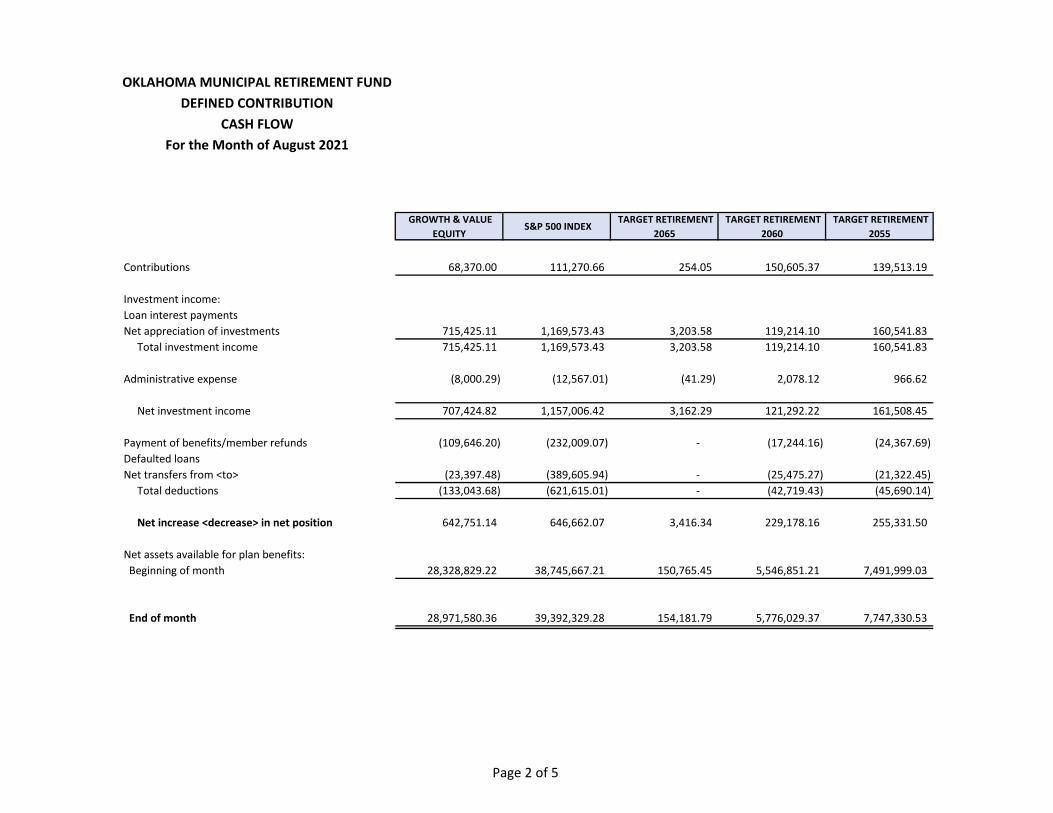
OKLAHOMA MUNICIPAL RETIREMENT FUNDDEFINED CONTRIBUTION
CASH FLOWFor the Month of August 2021
Contributions
Investment income:Loan interest paymentsNet appreciation of investments Total investment income
Administrative expense
Net investment income
Payment of benefits/member refundsDefaulted loansNet transfers from <to> Total deductions
Net increase <decrease> in net position
Net assets available for plan benefits: Beginning of month
End of month
GROWTH & VALUE EQUITY
S&P 500 INDEX TARGET RETIREMENT
2065 TARGET RETIREMENT
2060 TARGET RETIREMENT
2055
68,370.00 111,270.66 254.05 150,605.37 139,513.19
715,425.11 1,169,573.43 3,203.58 119,214.10 160,541.83 715,425.11 1,169,573.43 3,203.58 119,214.10 160,541.83
(8,000.29) (12,567.01) (41.29) 2,078.12 966.62
707,424.82 1,157,006.42 3,162.29 121,292.22 161,508.45
(109,646.20) (232,009.07) - (17,244.16) (24,367.69)
(23,397.48) (389,605.94) - (25,475.27) (21,322.45) (133,043.68) (621,615.01) - (42,719.43) (45,690.14)
642,751.14 646,662.07 3,416.34 229,178.16 255,331.50
28,328,829.22 38,745,667.21 150,765.45 5,546,851.21 7,491,999.03
28,971,580.36 39,392,329.28 154,181.79 5,776,029.37 7,747,330.53
Page 2 of 5
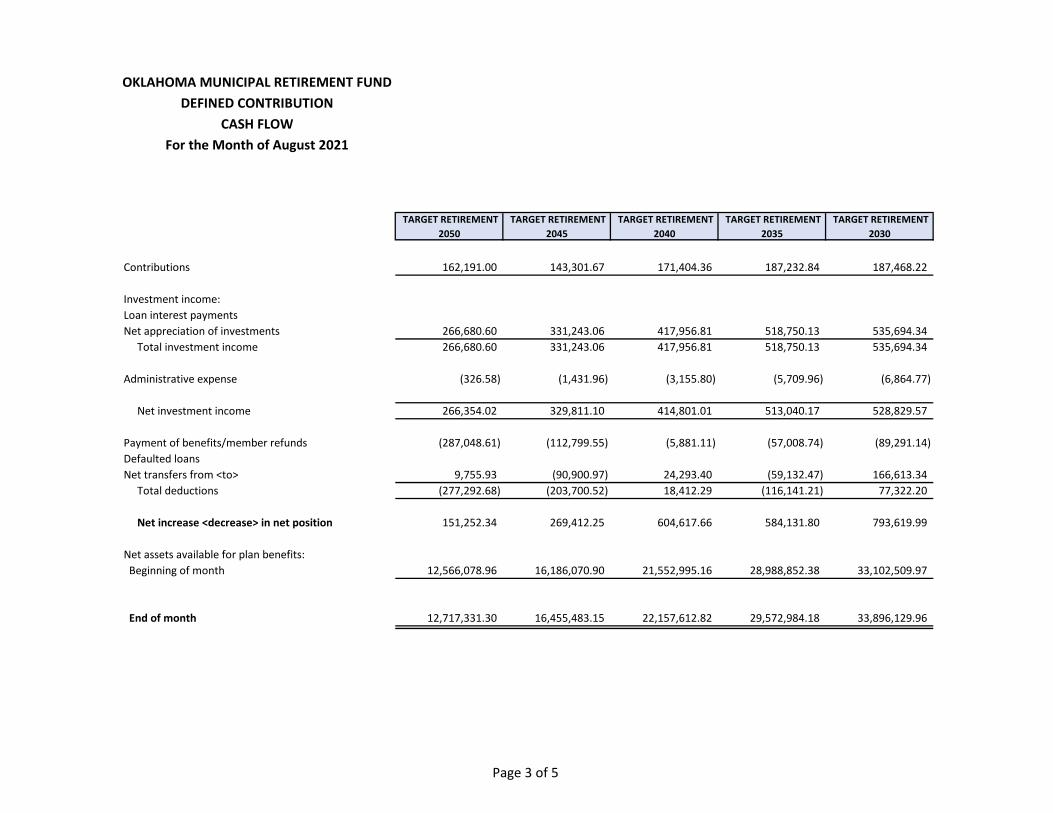
OKLAHOMA MUNICIPAL RETIREMENT FUNDDEFINED CONTRIBUTION
CASH FLOWFor the Month of August 2021
Contributions
Investment income:Loan interest paymentsNet appreciation of investments Total investment income
Administrative expense
Net investment income
Payment of benefits/member refundsDefaulted loansNet transfers from <to> Total deductions
Net increase <decrease> in net position
Net assets available for plan benefits: Beginning of month
End of month
TARGET RETIREMENT 2050
TARGET RETIREMENT 2045
TARGET RETIREMENT 2040
TARGET RETIREMENT 2035
TARGET RETIREMENT 2030
162,191.00 143,301.67 171,404.36 187,232.84 187,468.22
266,680.60 331,243.06 417,956.81 518,750.13 535,694.34 266,680.60 331,243.06 417,956.81 518,750.13 535,694.34
(326.58) (1,431.96) (3,155.80) (5,709.96) (6,864.77)
266,354.02 329,811.10 414,801.01 513,040.17 528,829.57
(287,048.61) (112,799.55) (5,881.11) (57,008.74) (89,291.14)
9,755.93 (90,900.97) 24,293.40 (59,132.47) 166,613.34 (277,292.68) (203,700.52) 18,412.29 (116,141.21) 77,322.20
151,252.34 269,412.25 604,617.66 584,131.80 793,619.99
12,566,078.96 16,186,070.90 21,552,995.16 28,988,852.38 33,102,509.97
12,717,331.30 16,455,483.15 22,157,612.82 29,572,984.18 33,896,129.96
Page 3 of 5

OKLAHOMA MUNICIPAL RETIREMENT FUNDDEFINED CONTRIBUTION
CASH FLOWFor the Month of August 2021
Contributions
Investment income:Loan interest paymentsNet appreciation of investments Total investment income
Administrative expense
Net investment income
Payment of benefits/member refundsDefaulted loansNet transfers from <to> Total deductions
Net increase <decrease> in net position
Net assets available for plan benefits: Beginning of month
End of month
TARGET RETIREMENT 2025
TARGET RETIREMENT 2020
TARGET RETIREMENT INCOME
TOTAL YIELD BOND BOND INDEX
158,243.60 98,211.09 35,877.67 18,863.72 46,770.11
592,291.43 320,417.37 153,626.41 7,196.90 (32,004.19) 592,291.43 320,417.37 153,626.41 7,196.90 (32,004.19)
(11,816.82) (9,821.83) (5,185.55) (2,047.07) (6,925.00)
580,474.61 310,595.54 148,440.86 5,149.83 (38,929.19)
(211,962.38) (136,497.76) (97,742.75) (36,810.48) (77,517.54)
288,033.51 12,887.06 4,009.83 49,297.56 (295,226.36) 76,071.13 (123,610.70) (93,732.92) 12,487.08 (372,743.90)
814,789.34 285,195.93 90,585.61 36,500.63 (364,902.98)
45,991,108.97 36,000,673.29 22,737,785.67 6,868,950.32 16,968,975.91
46,805,898.31 36,285,869.22 22,828,371.28 6,905,450.95 16,604,072.93
Page 4 of 5
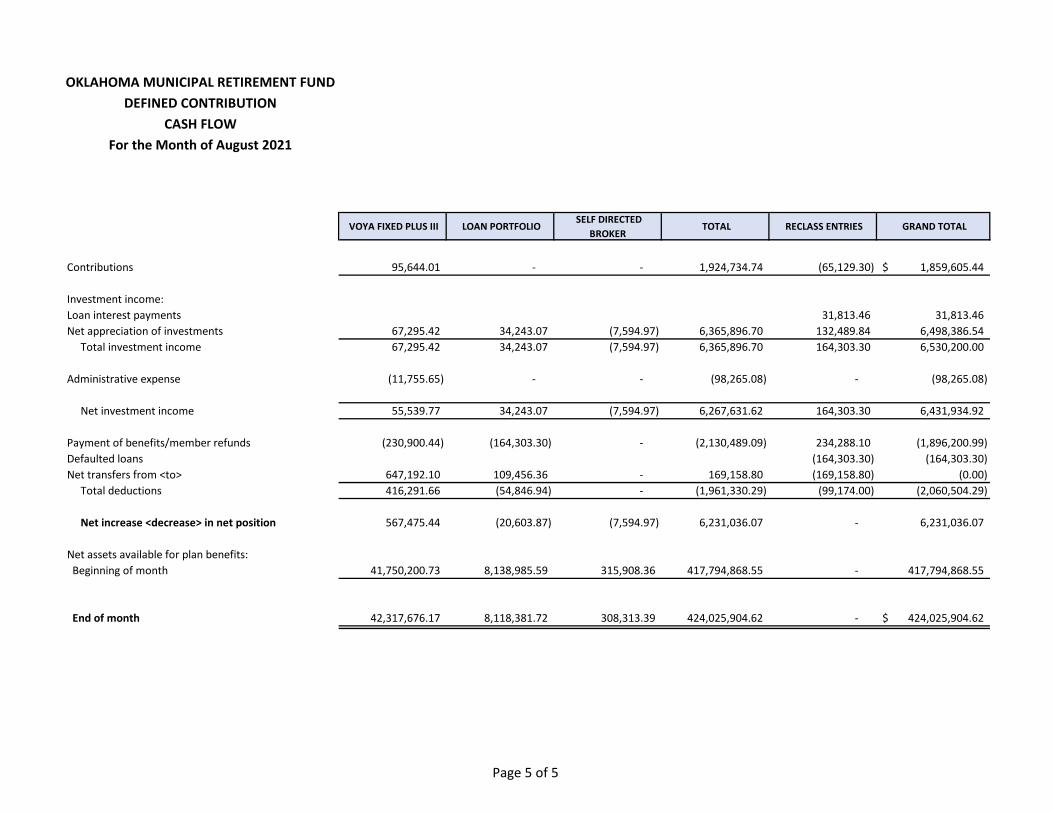
OKLAHOMA MUNICIPAL RETIREMENT FUNDDEFINED CONTRIBUTION
CASH FLOWFor the Month of August 2021
Contributions
Investment income:Loan interest paymentsNet appreciation of investments Total investment income
Administrative expense
Net investment income
Payment of benefits/member refundsDefaulted loansNet transfers from <to> Total deductions
Net increase <decrease> in net position
Net assets available for plan benefits: Beginning of month
End of month
VOYA FIXED PLUS III LOAN PORTFOLIO SELF DIRECTED
BROKER TOTAL RECLASS ENTRIES GRAND TOTAL
95,644.01 - - 1,924,734.74 (65,129.30) 1,859,605.44$
31,813.46 31,813.46 67,295.42 34,243.07 (7,594.97) 6,365,896.70 132,489.84 6,498,386.54 67,295.42 34,243.07 (7,594.97) 6,365,896.70 164,303.30 6,530,200.00
(11,755.65) - - (98,265.08) - (98,265.08)
55,539.77 34,243.07 (7,594.97) 6,267,631.62 164,303.30 6,431,934.92
(230,900.44) (164,303.30) - (2,130,489.09) 234,288.10 (1,896,200.99)
(164,303.30) (164,303.30) 647,192.10 109,456.36 - 169,158.80 (169,158.80) (0.00) 416,291.66 (54,846.94) - (1,961,330.29) (99,174.00) (2,060,504.29)
567,475.44 (20,603.87) (7,594.97) 6,231,036.07 - 6,231,036.07
41,750,200.73 8,138,985.59 315,908.36 417,794,868.55 - 417,794,868.55
42,317,676.17 8,118,381.72 308,313.39 424,025,904.62 - 424,025,904.62$
Page 5 of 5
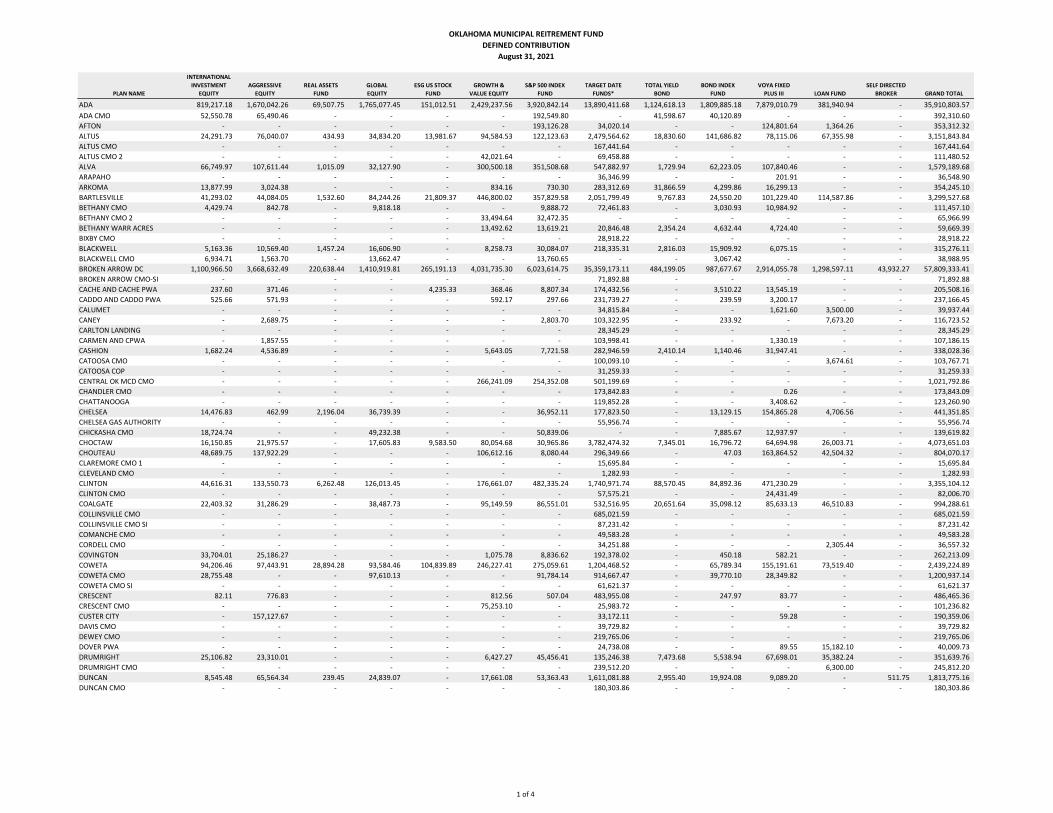
PLAN NAME
INTERNATIONAL INVESTMENT
EQUITY AGGRESSIVE
EQUITY REAL ASSETS
FUND GLOBAL EQUITY
ESG US STOCK FUND
GROWTH & VALUE EQUITY
S&P 500 INDEX FUND
TARGET DATE FUNDS*
TOTAL YIELD BOND
BOND INDEX FUND
VOYA FIXED PLUS III LOAN FUND
SELF DIRECTED BROKER GRAND TOTAL
ADA 819,217.18 1,670,042.26 69,507.75 1,765,077.45 151,012.51 2,429,237.56 3,920,842.14 13,890,411.68 1,124,618.13 1,809,885.18 7,879,010.79 381,940.94 - 35,910,803.57 ADA CMO 52,550.78 65,490.46 - - - - 192,549.80 - 41,598.67 40,120.89 - - - 392,310.60 AFTON - - - - - - 193,126.28 34,020.14 - - 124,801.64 1,364.26 - 353,312.32 ALTUS 24,291.73 76,040.07 434.93 34,834.20 13,981.67 94,584.53 122,123.63 2,479,564.62 18,830.60 141,686.82 78,115.06 67,355.98 - 3,151,843.84 ALTUS CMO - - - - - - - 167,441.64 - - - - - 167,441.64 ALTUS CMO 2 - - - - - 42,021.64 - 69,458.88 - - - - - 111,480.52 ALVA 66,749.97 107,611.44 1,015.09 32,127.90 - 300,500.18 351,508.68 547,882.97 1,729.94 62,223.05 107,840.46 - - 1,579,189.68 ARAPAHO - - - - - - - 36,346.99 - - 201.91 - - 36,548.90 ARKOMA 13,877.99 3,024.38 - - - 834.16 730.30 283,312.69 31,866.59 4,299.86 16,299.13 - - 354,245.10 BARTLESVILLE 41,293.02 44,084.05 1,532.60 84,244.26 21,809.37 446,800.02 357,829.58 2,051,799.49 9,767.83 24,550.20 101,229.40 114,587.86 - 3,299,527.68 BETHANY CMO 4,429.74 842.78 - 9,818.18 - - 9,888.72 72,461.83 - 3,030.93 10,984.92 - - 111,457.10 BETHANY CMO 2 - - - - - 33,494.64 32,472.35 - - - - - - 65,966.99 BETHANY WARR ACRES - - - - - 13,492.62 13,619.21 20,846.48 2,354.24 4,632.44 4,724.40 - - 59,669.39 BIXBY CMO - - - - - - - 28,918.22 - - - - - 28,918.22 BLACKWELL 5,163.36 10,569.40 1,457.24 16,606.90 - 8,258.73 30,084.07 218,335.31 2,816.03 15,909.92 6,075.15 - - 315,276.11 BLACKWELL CMO 6,934.71 1,563.70 - 13,662.47 - - 13,760.65 - - 3,067.42 - - - 38,988.95 BROKEN ARROW DC 1,100,966.50 3,668,632.49 220,638.44 1,410,919.81 265,191.13 4,031,735.30 6,023,614.75 35,359,173.11 484,199.05 987,677.67 2,914,055.78 1,298,597.11 43,932.27 57,809,333.41 BROKEN ARROW CMO-SI - - - - - - - 71,892.88 - - - - - 71,892.88 CACHE AND CACHE PWA 237.60 371.46 - - 4,235.33 368.46 8,807.34 174,432.56 - 3,510.22 13,545.19 - - 205,508.16 CADDO AND CADDO PWA 525.66 571.93 - - - 592.17 297.66 231,739.27 - 239.59 3,200.17 - - 237,166.45 CALUMET - - - - - - - 34,815.84 - - 1,621.60 3,500.00 - 39,937.44 CANEY - 2,689.75 - - - - 2,803.70 103,322.95 - 233.92 - 7,673.20 - 116,723.52 CARLTON LANDING - - - - - - - 28,345.29 - - - - - 28,345.29 CARMEN AND CPWA - 1,857.55 - - - - - 103,998.41 - - 1,330.19 - - 107,186.15 CASHION 1,682.24 4,536.89 - - - 5,643.05 7,721.58 282,946.59 2,410.14 1,140.46 31,947.41 - - 338,028.36 CATOOSA CMO - - - - - - - 100,093.10 - - - 3,674.61 - 103,767.71 CATOOSA COP - - - - - - - 31,259.33 - - - - - 31,259.33 CENTRAL OK MCD CMO - - - - - 266,241.09 254,352.08 501,199.69 - - - - - 1,021,792.86 CHANDLER CMO - - - - - - - 173,842.83 - - 0.26 - - 173,843.09 CHATTANOOGA - - - - - - - 119,852.28 - - 3,408.62 - - 123,260.90 CHELSEA 14,476.83 462.99 2,196.04 36,739.39 - - 36,952.11 177,823.50 - 13,129.15 154,865.28 4,706.56 - 441,351.85 CHELSEA GAS AUTHORITY - - - - - - - 55,956.74 - - - - - 55,956.74 CHICKASHA CMO 18,724.74 - - 49,232.38 - - 50,839.06 - - 7,885.67 12,937.97 - - 139,619.82 CHOCTAW 16,150.85 21,975.57 - 17,605.83 9,583.50 80,054.68 30,965.86 3,782,474.32 7,345.01 16,796.72 64,694.98 26,003.71 - 4,073,651.03 CHOUTEAU 48,689.75 137,922.29 - - - 106,612.16 8,080.44 296,349.66 - 47.03 163,864.52 42,504.32 - 804,070.17 CLAREMORE CMO 1 - - - - - - - 15,695.84 - - - - - 15,695.84 CLEVELAND CMO - - - - - - - 1,282.93 - - - - - 1,282.93 CLINTON 44,616.31 133,550.73 6,262.48 126,013.45 - 176,661.07 482,335.24 1,740,971.74 88,570.45 84,892.36 471,230.29 - - 3,355,104.12 CLINTON CMO - - - - - - - 57,575.21 - - 24,431.49 - - 82,006.70 COALGATE 22,403.32 31,286.29 - 38,487.73 - 95,149.59 86,551.01 532,516.95 20,651.64 35,098.12 85,633.13 46,510.83 - 994,288.61 COLLINSVILLE CMO - - - - - - - 685,021.59 - - - - - 685,021.59 COLLINSVILLE CMO SI - - - - - - - 87,231.42 - - - - - 87,231.42 COMANCHE CMO - - - - - - - 49,583.28 - - - - - 49,583.28 CORDELL CMO - - - - - - - 34,251.88 - - - 2,305.44 - 36,557.32 COVINGTON 33,704.01 25,186.27 - - - 1,075.78 8,836.62 192,378.02 - 450.18 582.21 - - 262,213.09 COWETA 94,206.46 97,443.91 28,894.28 93,584.46 104,839.89 246,227.41 275,059.61 1,204,468.52 - 65,789.34 155,191.61 73,519.40 - 2,439,224.89 COWETA CMO 28,755.48 - - 97,610.13 - - 91,784.14 914,667.47 - 39,770.10 28,349.82 - - 1,200,937.14 COWETA CMO SI - - - - - - - 61,621.37 - - - - - 61,621.37 CRESCENT 82.11 776.83 - - - 812.56 507.04 483,955.08 - 247.97 83.77 - - 486,465.36 CRESCENT CMO - - - - - 75,253.10 - 25,983.72 - - - - - 101,236.82 CUSTER CITY - 157,127.67 - - - - - 33,172.11 - - 59.28 - - 190,359.06 DAVIS CMO - - - - - - - 39,729.82 - - - - - 39,729.82 DEWEY CMO - - - - - - - 219,765.06 - - - - - 219,765.06 DOVER PWA - - - - - - - 24,738.08 - - 89.55 15,182.10 - 40,009.73 DRUMRIGHT 25,106.82 23,310.01 - - - 6,427.27 45,456.41 135,246.38 7,473.68 5,538.94 67,698.01 35,382.24 - 351,639.76 DRUMRIGHT CMO - - - - - - - 239,512.20 - - - 6,300.00 - 245,812.20 DUNCAN 8,545.48 65,564.34 239.45 24,839.07 - 17,661.08 53,363.43 1,611,081.88 2,955.40 19,924.08 9,089.20 - 511.75 1,813,775.16 DUNCAN CMO - - - - - - - 180,303.86 - - - - - 180,303.86
OKLAHOMA MUNICIPAL REITREMENT FUNDDEFINED CONTRIBUTION
August 31, 2021
1 of 4
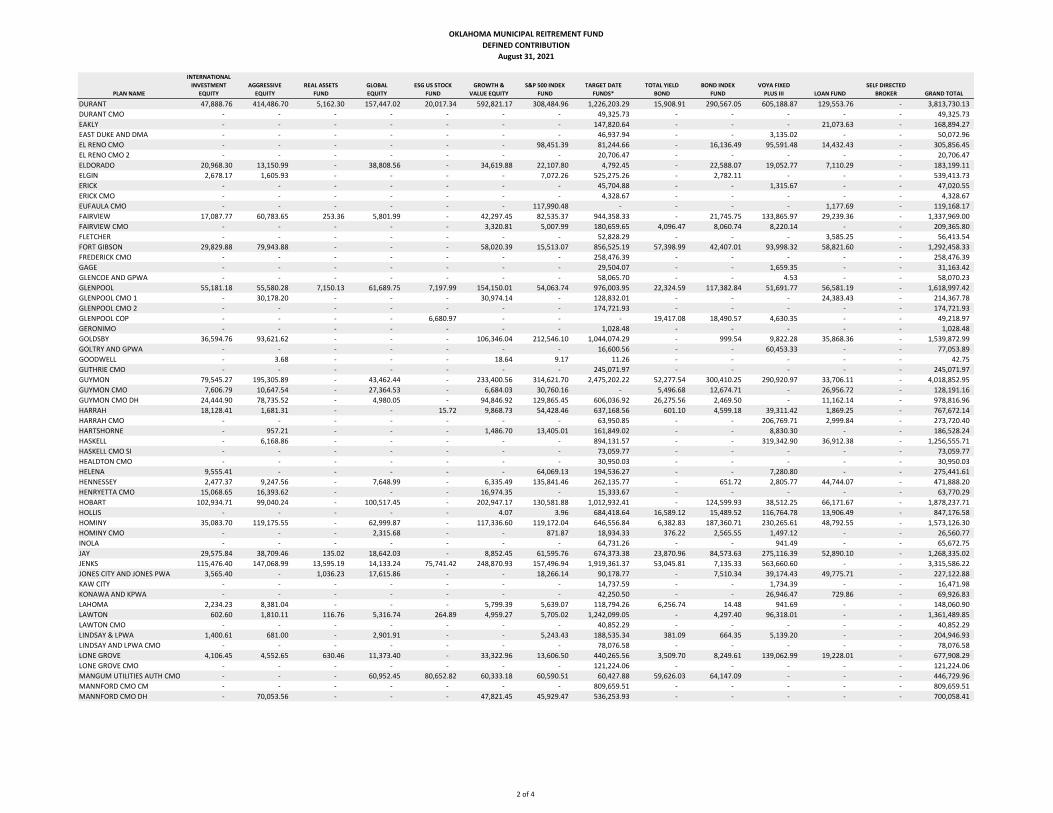
PLAN NAME
INTERNATIONAL INVESTMENT
EQUITY AGGRESSIVE
EQUITY REAL ASSETS
FUND GLOBAL EQUITY
ESG US STOCK FUND
GROWTH & VALUE EQUITY
S&P 500 INDEX FUND
TARGET DATE FUNDS*
TOTAL YIELD BOND
BOND INDEX FUND
VOYA FIXED PLUS III LOAN FUND
SELF DIRECTED BROKER GRAND TOTAL
OKLAHOMA MUNICIPAL REITREMENT FUNDDEFINED CONTRIBUTION
August 31, 2021
DURANT 47,888.76 414,486.70 5,162.30 157,447.02 20,017.34 592,821.17 308,484.96 1,226,203.29 15,908.91 290,567.05 605,188.87 129,553.76 - 3,813,730.13 DURANT CMO - - - - - - - 49,325.73 - - - - - 49,325.73 EAKLY - - - - - - - 147,820.64 - - - 21,073.63 - 168,894.27 EAST DUKE AND DMA - - - - - - - 46,937.94 - - 3,135.02 - - 50,072.96 EL RENO CMO - - - - - - 98,451.39 81,244.66 - 16,136.49 95,591.48 14,432.43 - 305,856.45 EL RENO CMO 2 - - - - - - - 20,706.47 - - - - - 20,706.47 ELDORADO 20,968.30 13,150.99 - 38,808.56 - 34,619.88 22,107.80 4,792.45 - 22,588.07 19,052.77 7,110.29 - 183,199.11 ELGIN 2,678.17 1,605.93 - - - - 7,072.26 525,275.26 - 2,782.11 - - - 539,413.73 ERICK - - - - - - - 45,704.88 - - 1,315.67 - - 47,020.55 ERICK CMO - - - - - - - 4,328.67 - - - - - 4,328.67 EUFAULA CMO - - - - - - 117,990.48 - - - - 1,177.69 - 119,168.17 FAIRVIEW 17,087.77 60,783.65 253.36 5,801.99 - 42,297.45 82,535.37 944,358.33 - 21,745.75 133,865.97 29,239.36 - 1,337,969.00 FAIRVIEW CMO - - - - - 3,320.81 5,007.99 180,659.65 4,096.47 8,060.74 8,220.14 - - 209,365.80 FLETCHER - - - - - - - 52,828.29 - - - 3,585.25 - 56,413.54 FORT GIBSON 29,829.88 79,943.88 - - - 58,020.39 15,513.07 856,525.19 57,398.99 42,407.01 93,998.32 58,821.60 - 1,292,458.33 FREDERICK CMO - - - - - - - 258,476.39 - - - - - 258,476.39 GAGE - - - - - - - 29,504.07 - - 1,659.35 - - 31,163.42 GLENCOE AND GPWA - - - - - - - 58,065.70 - - 4.53 - - 58,070.23 GLENPOOL 55,181.18 55,580.28 7,150.13 61,689.75 7,197.99 154,150.01 54,063.74 976,003.95 22,324.59 117,382.84 51,691.77 56,581.19 - 1,618,997.42 GLENPOOL CMO 1 - 30,178.20 - - - 30,974.14 - 128,832.01 - - - 24,383.43 - 214,367.78 GLENPOOL CMO 2 - - - - - - - 174,721.93 - - - - - 174,721.93 GLENPOOL COP - - - - 6,680.97 - - - 19,417.08 18,490.57 4,630.35 - - 49,218.97 GERONIMO - - - - - - - 1,028.48 - - - - - 1,028.48 GOLDSBY 36,594.76 93,621.62 - - - 106,346.04 212,546.10 1,044,074.29 - 999.54 9,822.28 35,868.36 - 1,539,872.99 GOLTRY AND GPWA - - - - - - - 16,600.56 - - 60,453.33 - - 77,053.89 GOODWELL - 3.68 - - - 18.64 9.17 11.26 - - - - - 42.75 GUTHRIE CMO - - - - - - - 245,071.97 - - - - - 245,071.97 GUYMON 79,545.27 195,305.89 - 43,462.44 - 233,400.56 314,621.70 2,475,202.22 52,277.54 300,410.25 290,920.97 33,706.11 - 4,018,852.95 GUYMON CMO 7,606.79 10,647.54 - 27,364.53 - 6,684.03 30,760.16 - 5,496.68 12,674.71 - 26,956.72 - 128,191.16 GUYMON CMO DH 24,444.90 78,735.52 - 4,980.05 - 94,846.92 129,865.45 606,036.92 26,275.56 2,469.50 - 11,162.14 - 978,816.96 HARRAH 18,128.41 1,681.31 - - 15.72 9,868.73 54,428.46 637,168.56 601.10 4,599.18 39,311.42 1,869.25 - 767,672.14 HARRAH CMO - - - - - - - 63,950.85 - - 206,769.71 2,999.84 - 273,720.40 HARTSHORNE - 957.21 - - - 1,486.70 13,405.01 161,849.02 - - 8,830.30 - - 186,528.24 HASKELL - 6,168.86 - - - - - 894,131.57 - - 319,342.90 36,912.38 - 1,256,555.71 HASKELL CMO SI - - - - - - - 73,059.77 - - - - - 73,059.77 HEALDTON CMO - - - - - - - 30,950.03 - - - - - 30,950.03 HELENA 9,555.41 - - - - - 64,069.13 194,536.27 - - 7,280.80 - - 275,441.61 HENNESSEY 2,477.37 9,247.56 - 7,648.99 - 6,335.49 135,841.46 262,135.77 - 651.72 2,805.77 44,744.07 - 471,888.20 HENRYETTA CMO 15,068.65 16,393.62 - - - 16,974.35 - 15,333.67 - - - - - 63,770.29 HOBART 102,934.71 99,040.24 - 100,517.45 - 202,947.17 130,581.88 1,012,932.41 - 124,599.93 38,512.25 66,171.67 - 1,878,237.71 HOLLIS - - - - - 4.07 3.96 684,418.64 16,589.12 15,489.52 116,764.78 13,906.49 - 847,176.58 HOMINY 35,083.70 119,175.55 - 62,999.87 - 117,336.60 119,172.04 646,556.84 6,382.83 187,360.71 230,265.61 48,792.55 - 1,573,126.30 HOMINY CMO - - - 2,315.68 - - 871.87 18,934.33 376.22 2,565.55 1,497.12 - - 26,560.77 INOLA - - - - - - - 64,731.26 - - 941.49 - - 65,672.75 JAY 29,575.84 38,709.46 135.02 18,642.03 - 8,852.45 61,595.76 674,373.38 23,870.96 84,573.63 275,116.39 52,890.10 - 1,268,335.02 JENKS 115,476.40 147,068.99 13,595.19 14,133.24 75,741.42 248,870.93 157,496.94 1,919,361.37 53,045.81 7,135.33 563,660.60 - - 3,315,586.22 JONES CITY AND JONES PWA 3,565.40 - 1,036.23 17,615.86 - - 18,266.14 90,178.77 - 7,510.34 39,174.43 49,775.71 - 227,122.88 KAW CITY - - - - - - - 14,737.59 - - 1,734.39 - - 16,471.98 KONAWA AND KPWA - - - - - - - 42,250.50 - - 26,946.47 729.86 - 69,926.83 LAHOMA 2,234.23 8,381.04 - - - 5,799.39 5,639.07 118,794.26 6,256.74 14.48 941.69 - - 148,060.90 LAWTON 602.60 1,810.11 116.76 5,316.74 264.89 4,959.27 5,705.02 1,242,099.05 - 4,297.40 96,318.01 - - 1,361,489.85 LAWTON CMO - - - - - - - 40,852.29 - - - - - 40,852.29 LINDSAY & LPWA 1,400.61 681.00 - 2,901.91 - - 5,243.43 188,535.34 381.09 664.35 5,139.20 - - 204,946.93 LINDSAY AND LPWA CMO - - - - - - - 78,076.58 - - - - - 78,076.58 LONE GROVE 4,106.45 4,552.65 630.46 11,373.40 - 33,322.96 13,606.50 440,265.56 3,509.70 8,249.61 139,062.99 19,228.01 - 677,908.29 LONE GROVE CMO - - - - - - - 121,224.06 - - - - - 121,224.06 MANGUM UTILITIES AUTH CMO - - - 60,952.45 80,652.82 60,333.18 60,590.51 60,427.88 59,626.03 64,147.09 - - - 446,729.96 MANNFORD CMO CM - - - - - - - 809,659.51 - - - - - 809,659.51 MANNFORD CMO DH - 70,053.56 - - - 47,821.45 45,929.47 536,253.93 - - - - - 700,058.41
2 of 4
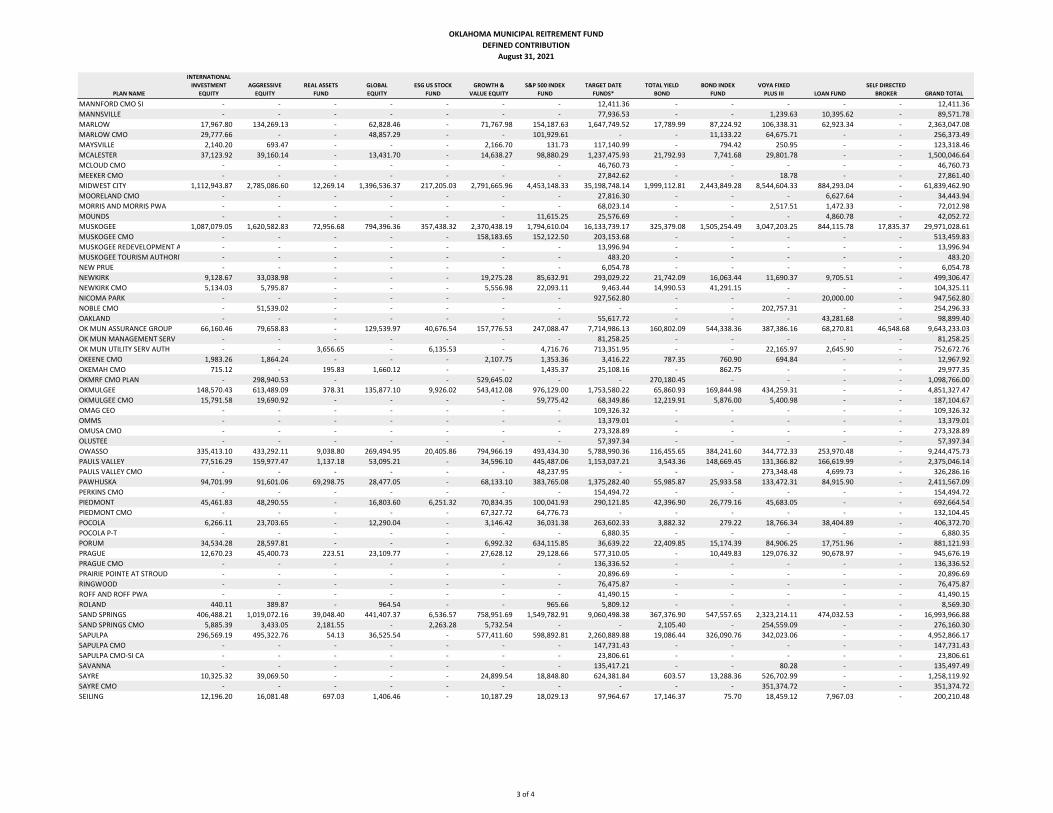
PLAN NAME
INTERNATIONAL INVESTMENT
EQUITY AGGRESSIVE
EQUITY REAL ASSETS
FUND GLOBAL EQUITY
ESG US STOCK FUND
GROWTH & VALUE EQUITY
S&P 500 INDEX FUND
TARGET DATE FUNDS*
TOTAL YIELD BOND
BOND INDEX FUND
VOYA FIXED PLUS III LOAN FUND
SELF DIRECTED BROKER GRAND TOTAL
OKLAHOMA MUNICIPAL REITREMENT FUNDDEFINED CONTRIBUTION
August 31, 2021
MANNFORD CMO SI - - - - - - - 12,411.36 - - - - - 12,411.36 MANNSVILLE - - - - - - - 77,936.53 - - 1,239.63 10,395.62 - 89,571.78 MARLOW 17,967.80 134,269.13 - 62,828.46 - 71,767.98 154,187.63 1,647,749.52 17,789.99 87,224.92 106,338.31 62,923.34 - 2,363,047.08 MARLOW CMO 29,777.66 - - 48,857.29 - - 101,929.61 - - 11,133.22 64,675.71 - - 256,373.49 MAYSVILLE 2,140.20 693.47 - - - 2,166.70 131.73 117,140.99 - 794.42 250.95 - - 123,318.46 MCALESTER 37,123.92 39,160.14 - 13,431.70 - 14,638.27 98,880.29 1,237,475.93 21,792.93 7,741.68 29,801.78 - - 1,500,046.64 MCLOUD CMO - - - - - - - 46,760.73 - - - - - 46,760.73 MEEKER CMO - - - - - - - 27,842.62 - - 18.78 - - 27,861.40 MIDWEST CITY 1,112,943.87 2,785,086.60 12,269.14 1,396,536.37 217,205.03 2,791,665.96 4,453,148.33 35,198,748.14 1,999,112.81 2,443,849.28 8,544,604.33 884,293.04 - 61,839,462.90 MOORELAND CMO - - - - - - - 27,816.30 - - - 6,627.64 - 34,443.94 MORRIS AND MORRIS PWA - - - - - - - 68,023.14 - - 2,517.51 1,472.33 - 72,012.98 MOUNDS - - - - - - 11,615.25 25,576.69 - - - 4,860.78 - 42,052.72 MUSKOGEE 1,087,079.05 1,620,582.83 72,956.68 794,396.36 357,438.32 2,370,438.19 1,794,610.04 16,133,739.17 325,379.08 1,505,254.49 3,047,203.25 844,115.78 17,835.37 29,971,028.61 MUSKOGEE CMO - - - - - 158,183.65 152,122.50 203,153.68 - - - - - 513,459.83 MUSKOGEE REDEVELOPMENT A - - - - - - - 13,996.94 - - - - - 13,996.94 MUSKOGEE TOURISM AUTHORIT - - - - - - - 483.20 - - - - - 483.20 NEW PRUE - - - - - - - 6,054.78 - - - - - 6,054.78 NEWKIRK 9,128.67 33,038.98 - - - 19,275.28 85,632.91 293,029.22 21,742.09 16,063.44 11,690.37 9,705.51 - 499,306.47 NEWKIRK CMO 5,134.03 5,795.87 - - - 5,556.98 22,093.11 9,463.44 14,990.53 41,291.15 - - - 104,325.11 NICOMA PARK - - - - - - - 927,562.80 - - - 20,000.00 - 947,562.80 NOBLE CMO - 51,539.02 - - - - - - - - 202,757.31 - - 254,296.33 OAKLAND - - - - - - - 55,617.72 - - - 43,281.68 - 98,899.40 OK MUN ASSURANCE GROUP 66,160.46 79,658.83 - 129,539.97 40,676.54 157,776.53 247,088.47 7,714,986.13 160,802.09 544,338.36 387,386.16 68,270.81 46,548.68 9,643,233.03 OK MUN MANAGEMENT SERV - - - - - - - 81,258.25 - - - - - 81,258.25 OK MUN UTILITY SERV AUTH - - 3,656.65 - 6,135.53 - 4,716.76 713,351.95 - - 22,165.97 2,645.90 - 752,672.76 OKEENE CMO 1,983.26 1,864.24 - - - 2,107.75 1,353.36 3,416.22 787.35 760.90 694.84 - - 12,967.92 OKEMAH CMO 715.12 - 195.83 1,660.12 - - 1,435.37 25,108.16 - 862.75 - - - 29,977.35 OKMRF CMO PLAN - 298,940.53 - - - 529,645.02 - - 270,180.45 - - - - 1,098,766.00 OKMULGEE 148,570.43 613,489.09 378.31 135,877.10 9,926.02 543,412.08 976,129.00 1,753,580.22 65,860.93 169,844.98 434,259.31 - - 4,851,327.47 OKMULGEE CMO 15,791.58 19,690.92 - - - - 59,775.42 68,349.86 12,219.91 5,876.00 5,400.98 - - 187,104.67 OMAG CEO - - - - - - - 109,326.32 - - - - - 109,326.32 OMMS - - - - - - - 13,379.01 - - - - - 13,379.01 OMUSA CMO - - - - - - - 273,328.89 - - - - - 273,328.89 OLUSTEE - - - - - - - 57,397.34 - - - - - 57,397.34 OWASSO 335,413.10 433,292.11 9,038.80 269,494.95 20,405.86 794,966.19 493,434.30 5,788,990.36 116,455.65 384,241.60 344,772.33 253,970.48 - 9,244,475.73 PAULS VALLEY 77,516.29 159,977.47 1,137.18 53,095.21 - 34,596.10 445,487.06 1,153,037.21 3,543.36 148,669.45 131,366.82 166,619.99 - 2,375,046.14 PAULS VALLEY CMO - - - - - - 48,237.95 - - - 273,348.48 4,699.73 - 326,286.16 PAWHUSKA 94,701.99 91,601.06 69,298.75 28,477.05 - 68,133.10 383,765.08 1,375,282.40 55,985.87 25,933.58 133,472.31 84,915.90 - 2,411,567.09 PERKINS CMO - - - - - - - 154,494.72 - - - - - 154,494.72 PIEDMONT 45,461.83 48,290.55 - 16,803.60 6,251.32 70,834.35 100,041.93 290,121.85 42,396.90 26,779.16 45,683.05 - - 692,664.54 PIEDMONT CMO - - - - - 67,327.72 64,776.73 - - - - - - 132,104.45 POCOLA 6,266.11 23,703.65 - 12,290.04 - 3,146.42 36,031.38 263,602.33 3,882.32 279.22 18,766.34 38,404.89 - 406,372.70 POCOLA P-T - - - - - - - 6,880.35 - - - - - 6,880.35 PORUM 34,534.28 28,597.81 - - - 6,992.32 634,115.85 36,639.22 22,409.85 15,174.39 84,906.25 17,751.96 - 881,121.93 PRAGUE 12,670.23 45,400.73 223.51 23,109.77 - 27,628.12 29,128.66 577,310.05 - 10,449.83 129,076.32 90,678.97 - 945,676.19 PRAGUE CMO - - - - - - - 136,336.52 - - - - - 136,336.52 PRAIRIE POINTE AT STROUD - - - - - - - 20,896.69 - - - - - 20,896.69 RINGWOOD - - - - - - - 76,475.87 - - - - - 76,475.87 ROFF AND ROFF PWA - - - - - - - 41,490.15 - - - - - 41,490.15 ROLAND 440.11 389.87 - 964.54 - - 965.66 5,809.12 - - - - - 8,569.30 SAND SPRINGS 406,488.21 1,019,072.16 39,048.40 441,407.37 6,536.57 758,951.69 1,549,782.91 9,060,498.38 367,376.90 547,557.65 2,323,214.11 474,032.53 - 16,993,966.88 SAND SPRINGS CMO 5,885.39 3,433.05 2,181.55 - 2,263.28 5,732.54 - - 2,105.40 - 254,559.09 - - 276,160.30 SAPULPA 296,569.19 495,322.76 54.13 36,525.54 - 577,411.60 598,892.81 2,260,889.88 19,086.44 326,090.76 342,023.06 - - 4,952,866.17 SAPULPA CMO - - - - - - - 147,731.43 - - - - - 147,731.43 SAPULPA CMO-SI CA - - - - - - - 23,806.61 - - - - - 23,806.61 SAVANNA - - - - - - - 135,417.21 - - 80.28 - - 135,497.49 SAYRE 10,325.32 39,069.50 - - - 24,899.54 18,848.80 624,381.84 603.57 13,288.36 526,702.99 - - 1,258,119.92 SAYRE CMO - - - - - - - - - - 351,374.72 - - 351,374.72 SEILING 12,196.20 16,081.48 697.03 1,406.46 - 10,187.29 18,029.13 97,964.67 17,146.37 75.70 18,459.12 7,967.03 - 200,210.48
3 of 4
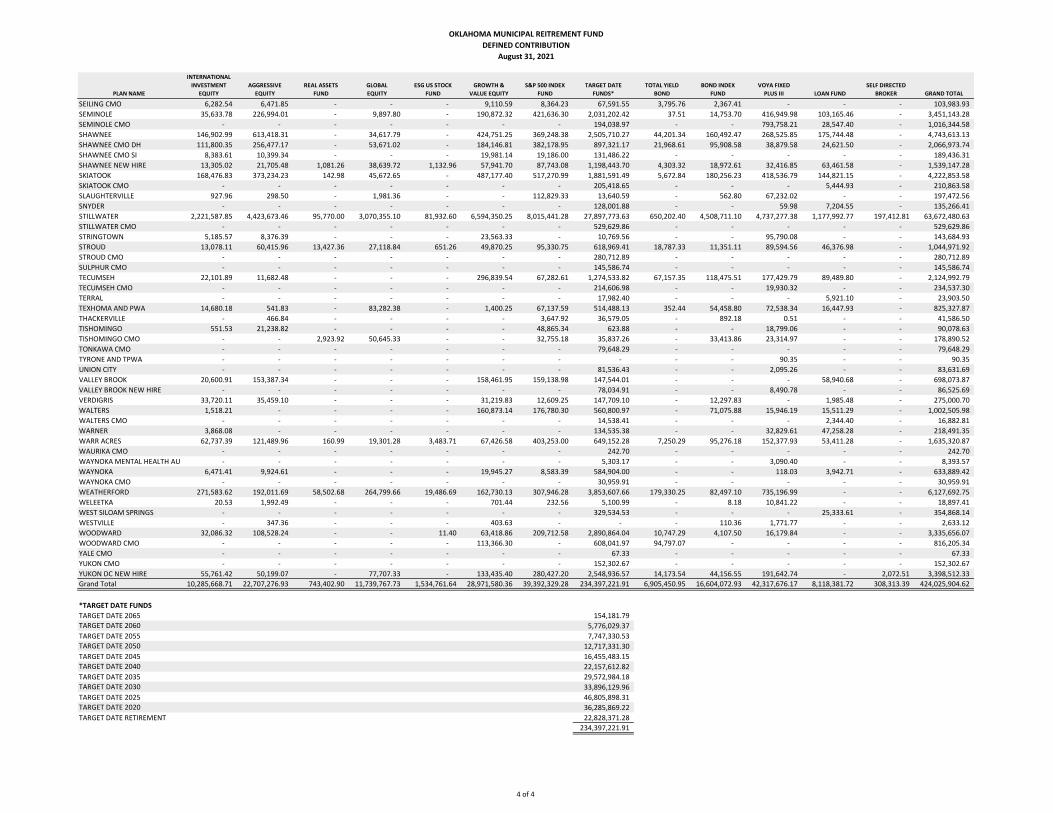
PLAN NAME
INTERNATIONAL INVESTMENT
EQUITY AGGRESSIVE
EQUITY REAL ASSETS
FUND GLOBAL EQUITY
ESG US STOCK FUND
GROWTH & VALUE EQUITY
S&P 500 INDEX FUND
TARGET DATE FUNDS*
TOTAL YIELD BOND
BOND INDEX FUND
VOYA FIXED PLUS III LOAN FUND
SELF DIRECTED BROKER GRAND TOTAL
OKLAHOMA MUNICIPAL REITREMENT FUNDDEFINED CONTRIBUTION
August 31, 2021
SEILING CMO 6,282.54 6,471.85 - - - 9,110.59 8,364.23 67,591.55 3,795.76 2,367.41 - - - 103,983.93 SEMINOLE 35,633.78 226,994.01 - 9,897.80 - 190,872.32 421,636.30 2,031,202.42 37.51 14,753.70 416,949.98 103,165.46 - 3,451,143.28 SEMINOLE CMO - - - - - - - 194,038.97 - - 793,758.21 28,547.40 - 1,016,344.58 SHAWNEE 146,902.99 613,418.31 - 34,617.79 - 424,751.25 369,248.38 2,505,710.27 44,201.34 160,492.47 268,525.85 175,744.48 - 4,743,613.13 SHAWNEE CMO DH 111,800.35 256,477.17 - 53,671.02 - 184,146.81 382,178.95 897,321.17 21,968.61 95,908.58 38,879.58 24,621.50 - 2,066,973.74 SHAWNEE CMO SI 8,383.61 10,399.34 - - - 19,981.14 19,186.00 131,486.22 - - - - - 189,436.31 SHAWNEE NEW HIRE 13,305.02 21,705.48 1,081.26 38,639.72 1,132.96 57,941.70 87,743.08 1,198,443.70 4,303.32 18,972.61 32,416.85 63,461.58 - 1,539,147.28 SKIATOOK 168,476.83 373,234.23 142.98 45,672.65 - 487,177.40 517,270.99 1,881,591.49 5,672.84 180,256.23 418,536.79 144,821.15 - 4,222,853.58 SKIATOOK CMO - - - - - - - 205,418.65 - - - 5,444.93 - 210,863.58 SLAUGHTERVILLE 927.96 298.50 - 1,981.36 - - 112,829.33 13,640.59 - 562.80 67,232.02 - - 197,472.56 SNYDER - - - - - - - 128,001.88 - - 59.98 7,204.55 - 135,266.41 STILLWATER 2,221,587.85 4,423,673.46 95,770.00 3,070,355.10 81,932.60 6,594,350.25 8,015,441.28 27,897,773.63 650,202.40 4,508,711.10 4,737,277.38 1,177,992.77 197,412.81 63,672,480.63 STILLWATER CMO - - - - - - - 529,629.86 - - - - - 529,629.86 STRINGTOWN 5,185.57 8,376.39 - - - 23,563.33 - 10,769.56 - - 95,790.08 - - 143,684.93 STROUD 13,078.11 60,415.96 13,427.36 27,118.84 651.26 49,870.25 95,330.75 618,969.41 18,787.33 11,351.11 89,594.56 46,376.98 - 1,044,971.92 STROUD CMO - - - - - - - 280,712.89 - - - - - 280,712.89 SULPHUR CMO - - - - - - - 145,586.74 - - - - - 145,586.74 TECUMSEH 22,101.89 11,682.48 - - - 296,839.54 67,282.61 1,274,533.82 67,157.35 118,475.51 177,429.79 89,489.80 - 2,124,992.79 TECUMSEH CMO - - - - - - - 214,606.98 - - 19,930.32 - - 234,537.30 TERRAL - - - - - - - 17,982.40 - - - 5,921.10 - 23,903.50 TEXHOMA AND PWA 14,680.18 541.83 - 83,282.38 - 1,400.25 67,137.59 514,488.13 352.44 54,458.80 72,538.34 16,447.93 - 825,327.87 THACKERVILLE - 466.84 - - - - 3,647.92 36,579.05 - 892.18 0.51 - - 41,586.50 TISHOMINGO 551.53 21,238.82 - - - - 48,865.34 623.88 - - 18,799.06 - - 90,078.63 TISHOMINGO CMO - - 2,923.92 50,645.33 - - 32,755.18 35,837.26 - 33,413.86 23,314.97 - - 178,890.52 TONKAWA CMO - - - - - - - 79,648.29 - - - - - 79,648.29 TYRONE AND TPWA - - - - - - - - - - 90.35 - - 90.35 UNION CITY - - - - - - - 81,536.43 - - 2,095.26 - - 83,631.69 VALLEY BROOK 20,600.91 153,387.34 - - - 158,461.95 159,138.98 147,544.01 - - - 58,940.68 - 698,073.87 VALLEY BROOK NEW HIRE - - - - - - - 78,034.91 - - 8,490.78 - - 86,525.69 VERDIGRIS 33,720.11 35,459.10 - - - 31,219.83 12,609.25 147,709.10 - 12,297.83 - 1,985.48 - 275,000.70 WALTERS 1,518.21 - - - - 160,873.14 176,780.30 560,800.97 - 71,075.88 15,946.19 15,511.29 - 1,002,505.98 WALTERS CMO - - - - - - - 14,538.41 - - - 2,344.40 - 16,882.81 WARNER 3,868.08 - - - - - - 134,535.38 - - 32,829.61 47,258.28 - 218,491.35 WARR ACRES 62,737.39 121,489.96 160.99 19,301.28 3,483.71 67,426.58 403,253.00 649,152.28 7,250.29 95,276.18 152,377.93 53,411.28 - 1,635,320.87 WAURIKA CMO - - - - - - - 242.70 - - - - - 242.70 WAYNOKA MENTAL HEALTH AU - - - - - - - 5,303.17 - - 3,090.40 - - 8,393.57 WAYNOKA 6,471.41 9,924.61 - - - 19,945.27 8,583.39 584,904.00 - - 118.03 3,942.71 - 633,889.42 WAYNOKA CMO - - - - - - - 30,959.91 - - - - - 30,959.91 WEATHERFORD 271,583.62 192,011.69 58,502.68 264,799.66 19,486.69 162,730.13 307,946.28 3,853,607.66 179,330.25 82,497.10 735,196.99 - - 6,127,692.75 WELEETKA 20.53 1,992.49 - - - 701.44 232.56 5,100.99 - 8.18 10,841.22 - - 18,897.41 WEST SILOAM SPRINGS - - - - - - - 329,534.53 - - - 25,333.61 - 354,868.14 WESTVILLE - 347.36 - - - 403.63 - - - 110.36 1,771.77 - - 2,633.12 WOODWARD 32,086.32 108,528.24 - - 11.40 63,418.86 209,712.58 2,890,864.04 10,747.29 4,107.50 16,179.84 - - 3,335,656.07 WOODWARD CMO - - - - - 113,366.30 - 608,041.97 94,797.07 - - - - 816,205.34 YALE CMO - - - - - - - 67.33 - - - - - 67.33 YUKON CMO - - - - - - - 152,302.67 - - - - - 152,302.67 YUKON DC NEW HIRE 55,761.42 50,199.07 - 77,707.33 - 133,435.40 280,427.20 2,548,936.57 14,173.54 44,156.55 191,642.74 - 2,072.51 3,398,512.33 Grand Total 10,285,668.71 22,707,276.93 743,402.90 11,739,767.73 1,534,761.64 28,971,580.36 39,392,329.28 234,397,221.91 6,905,450.95 16,604,072.93 42,317,676.17 8,118,381.72 308,313.39 424,025,904.62
TARGET DATE 2065 154,181.79 TARGET DATE 2060 5,776,029.37 TARGET DATE 2055 7,747,330.53 TARGET DATE 2050 12,717,331.30 TARGET DATE 2045 16,455,483.15 TARGET DATE 2040 22,157,612.82 TARGET DATE 2035 29,572,984.18 TARGET DATE 2030 33,896,129.96 TARGET DATE 2025 46,805,898.31 TARGET DATE 2020 36,285,869.22 TARGET DATE RETIREMENT 22,828,371.28
234,397,221.91
*TARGET DATE FUNDS
4 of 4
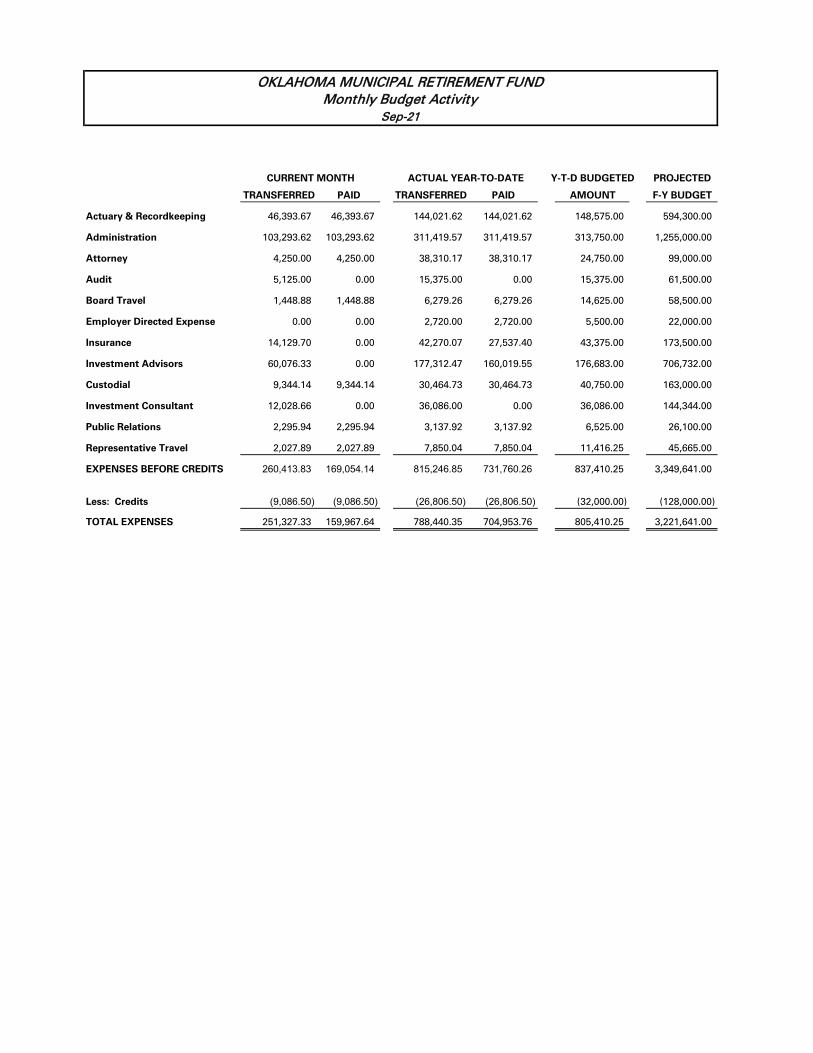
Y-T-D BUDGETED PROJECTED
TRANSFERRED PAID TRANSFERRED PAID AMOUNT F-Y BUDGET
Actuary & Recordkeeping 46,393.67 46,393.67 144,021.62 144,021.62 148,575.00 594,300.00
Administration 103,293.62 103,293.62 311,419.57 311,419.57 313,750.00 1,255,000.00
Attorney 4,250.00 4,250.00 38,310.17 38,310.17 24,750.00 99,000.00
Audit 5,125.00 0.00 15,375.00 0.00 15,375.00 61,500.00
Board Travel 1,448.88 1,448.88 6,279.26 6,279.26 14,625.00 58,500.00
Employer Directed Expense 0.00 0.00 2,720.00 2,720.00 5,500.00 22,000.00
Insurance 14,129.70 0.00 42,270.07 27,537.40 43,375.00 173,500.00
Investment Advisors 60,076.33 0.00 177,312.47 160,019.55 176,683.00 706,732.00
Custodial 9,344.14 9,344.14 30,464.73 30,464.73 40,750.00 163,000.00
Investment Consultant 12,028.66 0.00 36,086.00 0.00 36,086.00 144,344.00
Public Relations 2,295.94 2,295.94 3,137.92 3,137.92 6,525.00 26,100.00
Representative Travel 2,027.89 2,027.89 7,850.04 7,850.04 11,416.25 45,665.00
EXPENSES BEFORE CREDITS 260,413.83 169,054.14 815,246.85 731,760.26 837,410.25 3,349,641.00
Less: Credits (9,086.50) (9,086.50) (26,806.50) (26,806.50) (32,000.00) (128,000.00)
TOTAL EXPENSES 251,327.33 159,967.64 788,440.35 704,953.76 805,410.25 3,221,641.00
Sep-21Monthly Budget Activity
OKLAHOMA MUNICIPAL RETIREMENT FUND
ACTUAL YEAR-TO-DATECURRENT MONTH
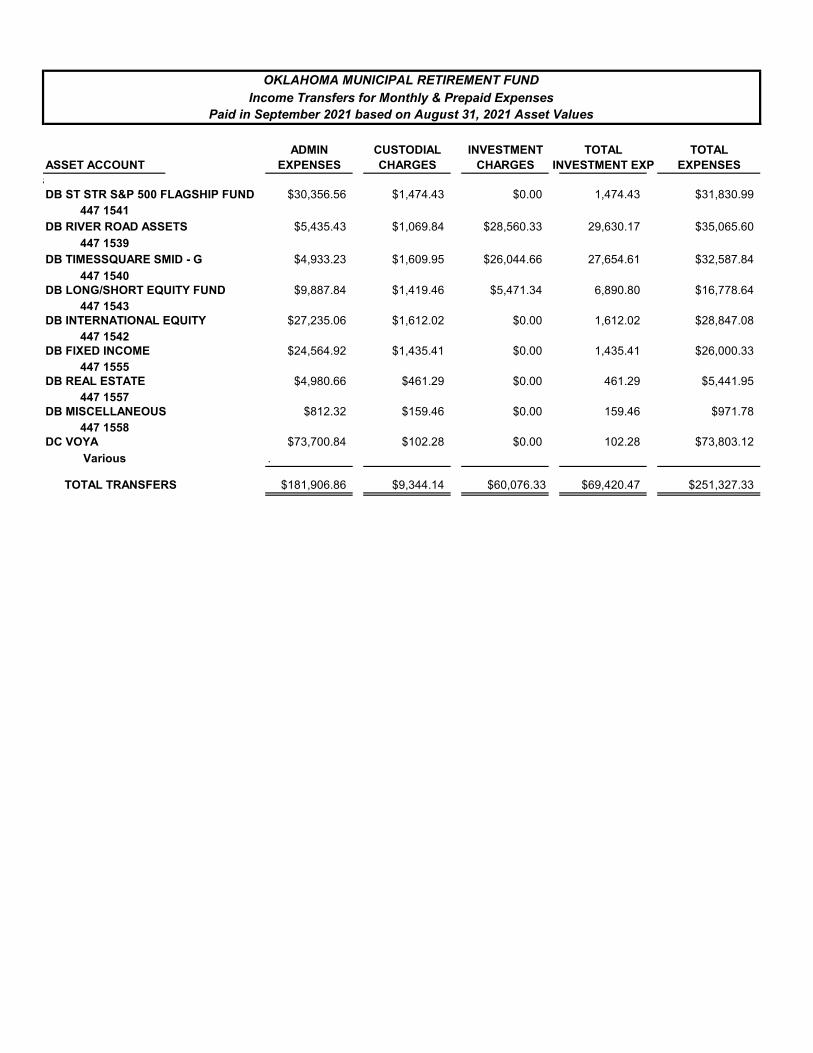
ADMIN CUSTODIAL INVESTMENT TOTAL TOTALASSET ACCOUNT EXPENSES CHARGES CHARGES INVESTMENT EXP EXPENSES
sDB ST STR S&P 500 FLAGSHIP FUND $30,356.56 $1,474.43 $0.00 1,474.43 $31,830.99
447 1541DB RIVER ROAD ASSETS $5,435.43 $1,069.84 $28,560.33 29,630.17 $35,065.60
447 1539DB TIMESSQUARE SMID - G $4,933.23 $1,609.95 $26,044.66 27,654.61 $32,587.84
447 1540DB LONG/SHORT EQUITY FUND $9,887.84 $1,419.46 $5,471.34 6,890.80 $16,778.64
447 1543DB INTERNATIONAL EQUITY $27,235.06 $1,612.02 $0.00 1,612.02 $28,847.08
447 1542DB FIXED INCOME $24,564.92 $1,435.41 $0.00 1,435.41 $26,000.33
447 1555DB REAL ESTATE $4,980.66 $461.29 $0.00 461.29 $5,441.95
447 1557DB MISCELLANEOUS $812.32 $159.46 $0.00 159.46 $971.78
447 1558DC VOYA $73,700.84 $102.28 $0.00 102.28 $73,803.12
Various .
TOTAL TRANSFERS $181,906.86 $9,344.14 $60,076.33 $69,420.47 $251,327.33
OKLAHOMA MUNICIPAL RETIREMENT FUNDIncome Transfers for Monthly & Prepaid Expenses
Paid in September 2021 based on August 31, 2021 Asset Values
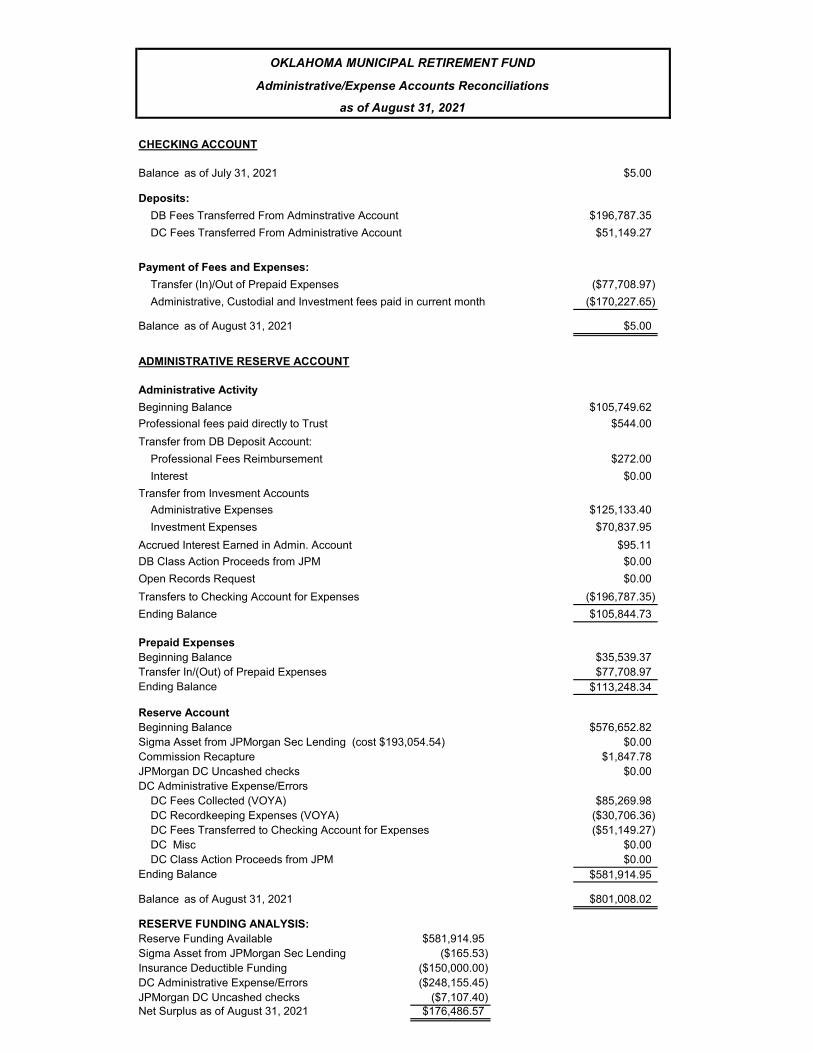
OKLAHOMA MUNICIPAL RETIREMENT FUND
Administrative/Expense Accounts Reconciliations
as of August 31, 2021
CHECKING ACCOUNT
Balance as of July 31, 2021 $5.00
Deposits: DB Fees Transferred From Adminstrative Account $196,787.35 DC Fees Transferred From Administrative Account $51,149.27
Payment of Fees and Expenses: Transfer (In)/Out of Prepaid Expenses ($77,708.97) Administrative, Custodial and Investment fees paid in current month ($170,227.65)
Balance as of August 31, 2021 $5.00
ADMINISTRATIVE RESERVE ACCOUNT
Administrative ActivityBeginning Balance $105,749.62Professional fees paid directly to Trust $544.00Transfer from DB Deposit Account: Professional Fees Reimbursement $272.00 Interest $0.00Transfer from Invesment Accounts Administrative Expenses $125,133.40 Investment Expenses $70,837.95Accrued Interest Earned in Admin. Account $95.11DB Class Action Proceeds from JPM $0.00Open Records Request $0.00Transfers to Checking Account for Expenses ($196,787.35)Ending Balance $105,844.73
Prepaid ExpensesBeginning Balance $35,539.37Transfer In/(Out) of Prepaid Expenses $77,708.97Ending Balance $113,248.34
Reserve AccountBeginning Balance $576,652.82Sigma Asset from JPMorgan Sec Lending (cost $193,054.54) $0.00Commission Recapture $1,847.78JPMorgan DC Uncashed checks $0.00DC Administrative Expense/Errors DC Fees Collected (VOYA) $85,269.98 DC Recordkeeping Expenses (VOYA) ($30,706.36) DC Fees Transferred to Checking Account for Expenses ($51,149.27) DC Misc $0.00 DC Class Action Proceeds from JPM $0.00Ending Balance $581,914.95
Balance as of August 31, 2021 $801,008.02
RESERVE FUNDING ANALYSIS:Reserve Funding Available $581,914.95Sigma Asset from JPMorgan Sec Lending ($165.53)Insurance Deductible Funding ($150,000.00)DC Administrative Expense/Errors ($248,155.45)JPMorgan DC Uncashed checks ($7,107.40)Net Surplus as of August 31, 2021 $176,486.57
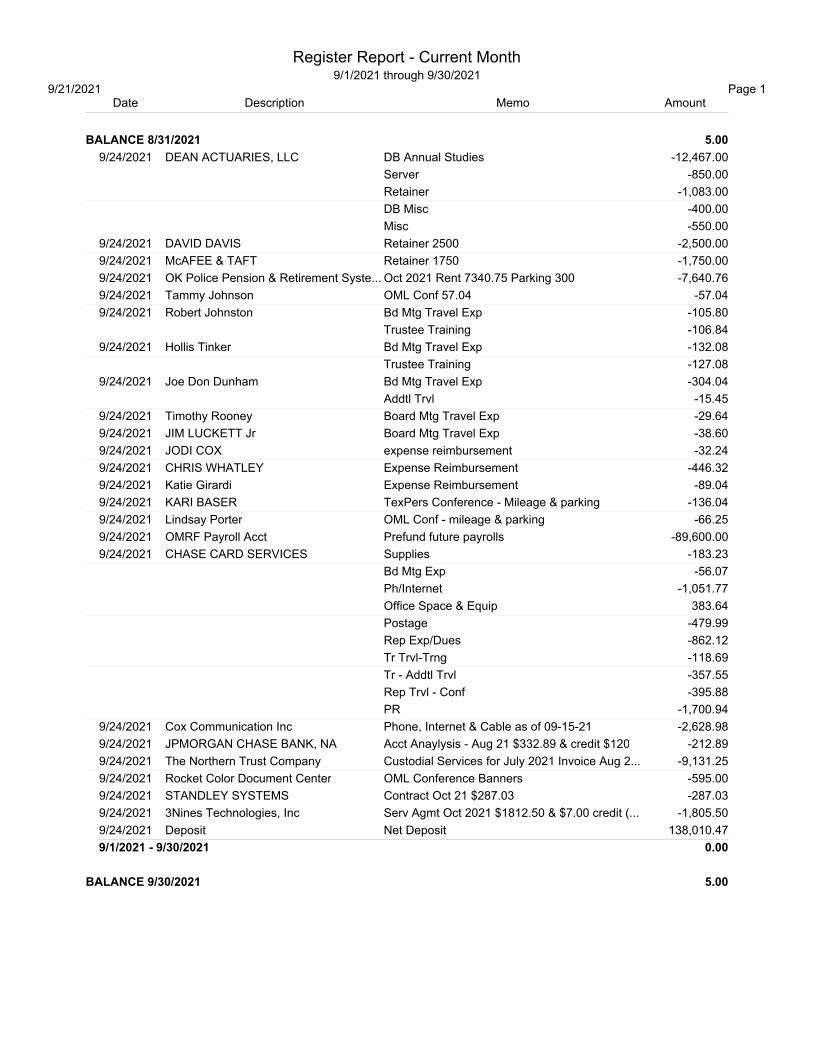
Date Description Memo Amount
BALANCE 8/31/2021 5.00
9/24/2021 DEAN ACTUARIES, LLC DB Annual Studies -12,467.00
Server -850.00
Retainer -1,083.00
DB Misc -400.00
Misc -550.00
9/24/2021 DAVID DAVIS Retainer 2500 -2,500.00
9/24/2021 McAFEE & TAFT Retainer 1750 -1,750.00
9/24/2021 OK Police Pension & Retirement Syste... Oct 2021 Rent 7340.75 Parking 300 -7,640.76
9/24/2021 Tammy Johnson OML Conf 57.04 -57.04
9/24/2021 Robert Johnston Bd Mtg Travel Exp -105.80
Trustee Training -106.84
9/24/2021 Hollis Tinker Bd Mtg Travel Exp -132.08
Trustee Training -127.08
9/24/2021 Joe Don Dunham Bd Mtg Travel Exp -304.04
Addtl Trvl -15.45
9/24/2021 Timothy Rooney Board Mtg Travel Exp -29.64
9/24/2021 JIM LUCKETT Jr Board Mtg Travel Exp -38.60
9/24/2021 JODI COX expense reimbursement -32.24
9/24/2021 CHRIS WHATLEY Expense Reimbursement -446.32
9/24/2021 Katie Girardi Expense Reimbursement -89.04
9/24/2021 KARI BASER TexPers Conference - Mileage & parking -136.04
9/24/2021 Lindsay Porter OML Conf - mileage & parking -66.25
9/24/2021 OMRF Payroll Acct Prefund future payrolls -89,600.00
9/24/2021 CHASE CARD SERVICES Supplies -183.23
Bd Mtg Exp -56.07
Ph/Internet -1,051.77
Office Space & Equip 383.64
Postage -479.99
Rep Exp/Dues -862.12
Tr Trvl-Trng -118.69
Tr - Addtl Trvl -357.55
Rep Trvl - Conf -395.88
PR -1,700.94
9/24/2021 Cox Communication Inc Phone, Internet & Cable as of 09-15-21 -2,628.98
9/24/2021 JPMORGAN CHASE BANK, NA Acct Anaylysis - Aug 21 $332.89 & credit $120 -212.89
9/24/2021 The Northern Trust Company Custodial Services for July 2021 Invoice Aug 2... -9,131.25
9/24/2021 Rocket Color Document Center OML Conference Banners -595.00
9/24/2021 STANDLEY SYSTEMS Contract Oct 21 $287.03 -287.03
9/24/2021 3Nines Technologies, Inc Serv Agmt Oct 2021 $1812.50 & $7.00 credit (... -1,805.50
9/24/2021 Deposit Net Deposit 138,010.47
9/1/2021 - 9/30/2021 0.00
BALANCE 9/30/2021 5.00
Register Report - Current Month9/1/2021 through 9/30/2021
9/21/2021 Page 1
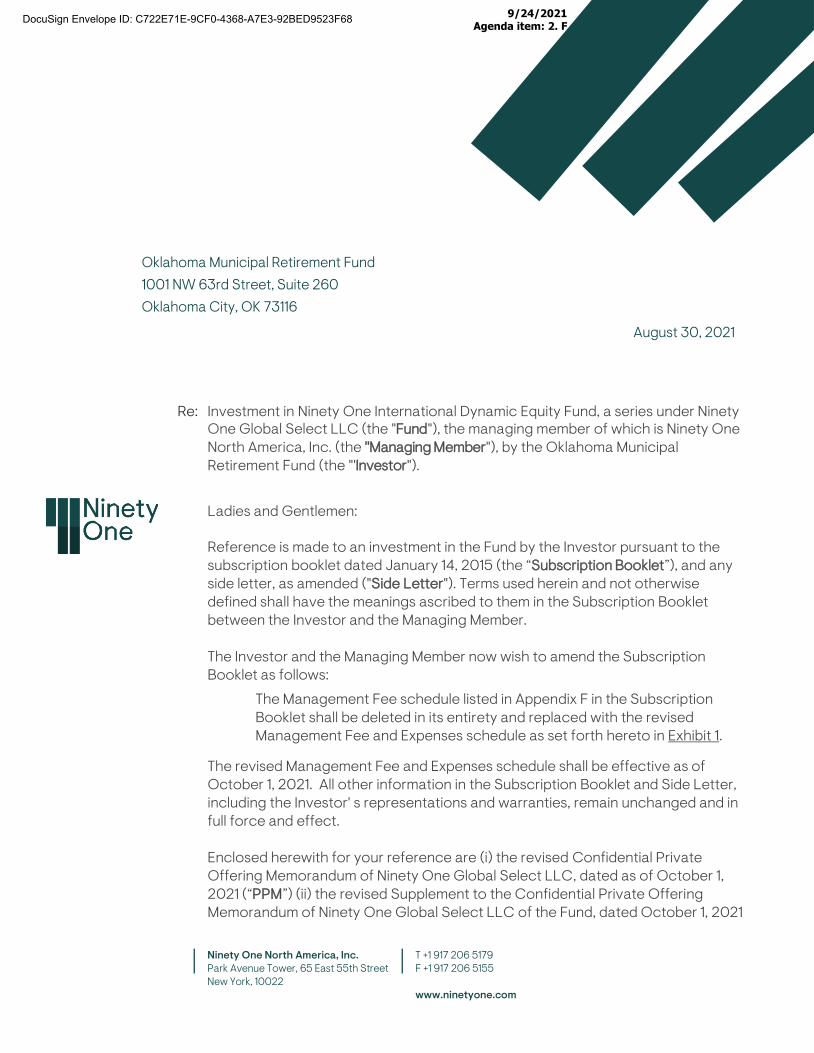
Ninety One North America, Inc. Park Avenue Tower, 65 East 55th Street New York, 10022
T +1 917 206 5179 F +1 917 206 5155
www.ninetyone.com
91N
A
Oklahoma Municipal Retirement Fund 1001 NW 63rd Street, Suite 260 Oklahoma City, OK 73116
August 30, 2021
Re: Investment in Ninety One International Dynamic Equity Fund, a series under Ninety One Global Select LLC (the "Fund"), the managing member of which is Ninety One North America, Inc. (the ''Managing Member"), by the Oklahoma Municipal Retirement Fund (the "'Investor").
Ladies and Gentlemen:
Reference is made to an investment in the Fund by the Investor pursuant to the subscription booklet dated January 14, 2015 (the “Subscription Booklet”), and any side letter, as amended ("Side Letter"). Terms used herein and not otherwise defined shall have the meanings ascribed to them in the Subscription Booklet between the Investor and the Managing Member.
The Investor and the Managing Member now wish to amend the Subscription Booklet as follows:
The Management Fee schedule listed in Appendix F in the Subscription Booklet shall be deleted in its entirety and replaced with the revised Management Fee and Expenses schedule as set forth hereto in Exhibit 1.
The revised Management Fee and Expenses schedule shall be effective as of October 1, 2021. All other information in the Subscription Booklet and Side Letter, including the Investor' s representations and warranties, remain unchanged and in full force and effect.
Enclosed herewith for your reference are (i) the revised Confidential Private Offering Memorandum of Ninety One Global Select LLC, dated as of October 1, 2021 (“PPM”) (ii) the revised Supplement to the Confidential Private Offering Memorandum of Ninety One Global Select LLC of the Fund, dated October 1, 2021
DocuSign Envelope ID: C722E71E-9CF0-4368-A7E3-92BED9523F68 9/24/2021Agenda item: 2. F
(“PPM Supplement”) and (iii) a comparison for each against the most recent version of the PPM and PPM Supplement, respectively. The changes therein reflect the revisions to the Fund’s Expenses, as well as other applicable revisions.
If the foregoing correctly reflects your understanding of these matters, please indicate your agreement to the terms of this letter agreement by signing and dating where indicated below.
Best regards,
NINETY ONE NORTH AMERICA, INC., ITS MANAGING MEMBER:
By: __________________________________ Dana Troetel CCO & Head of Legal, Americas
By:
By:
__________________________________ André van Heerden Business Manager – North America Client Group
Accepted by:
OKLAHOMA MUNICIPAL RETIREMENT FUND
__________________________________ Name Donna DoolenTitle OkMRF Board ChairDate 9/24/2021
DocuSign Envelope ID: C722E71E-9CF0-4368-A7E3-92BED9523F68
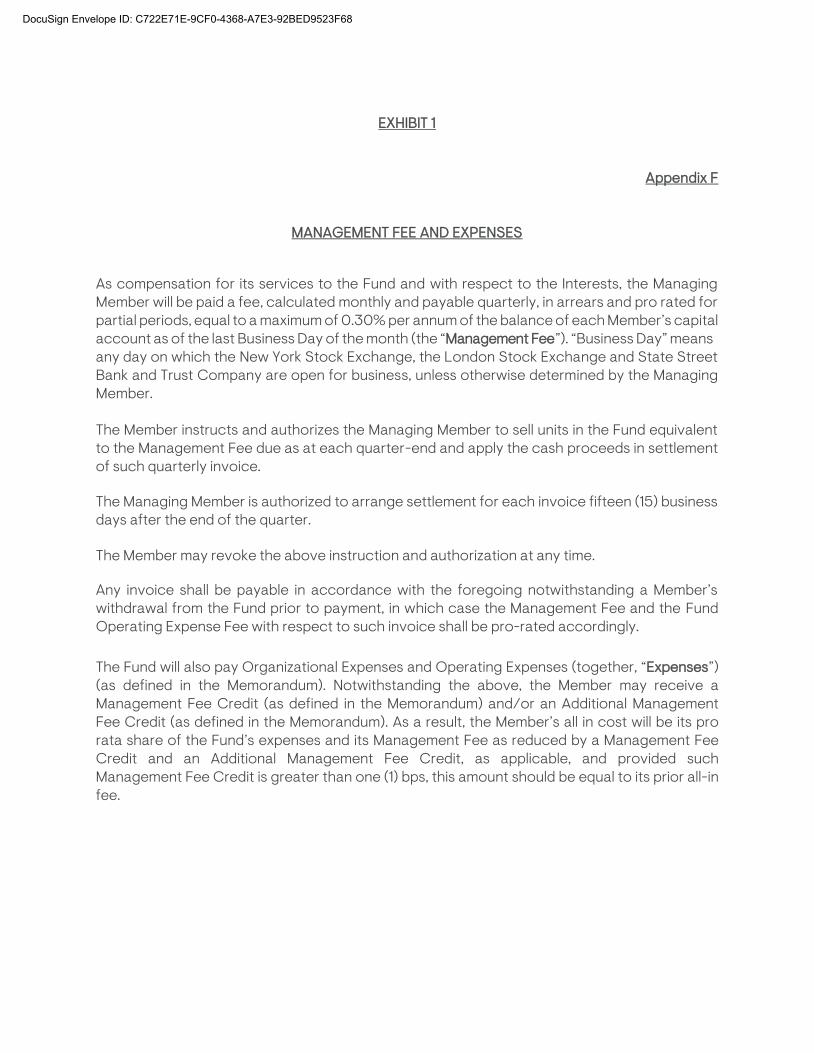
EXHIBIT 1
Appendix F
MANAGEMENT FEE AND EXPENSES
As compensation for its services to the Fund and with respect to the Interests, the Managing Member will be paid a fee, calculated monthly and payable quarterly, in arrears and pro rated for partial periods, equal to a maximum of 0.30% per annum of the balance of each Member’s capital account as of the last Business Day of the month (the “Management Fee”). “Business Day” means any day on which the New York Stock Exchange, the London Stock Exchange and State Street Bank and Trust Company are open for business, unless otherwise determined by the Managing Member.
The Member instructs and authorizes the Managing Member to sell units in the Fund equivalent to the Management Fee due as at each quarter-end and apply the cash proceeds in settlement of such quarterly invoice.
The Managing Member is authorized to arrange settlement for each invoice fifteen (15) business days after the end of the quarter.
The Member may revoke the above instruction and authorization at any time.
Any invoice shall be payable in accordance with the foregoing notwithstanding a Member’s withdrawal from the Fund prior to payment, in which case the Management Fee and the Fund Operating Expense Fee with respect to such invoice shall be pro-rated accordingly.
The Fund will also pay Organizational Expenses and Operating Expenses (together, “Expenses”) (as defined in the Memorandum). Notwithstanding the above, the Member may receive a Management Fee Credit (as defined in the Memorandum) and/or an Additional Management Fee Credit (as defined in the Memorandum). As a result, the Member’s all in cost will be its pro rata share of the Fund’s expenses and its Management Fee as reduced by a Management Fee Credit and an Additional Management Fee Credit, as applicable, and provided such Management Fee Credit is greater than one (1) bps, this amount should be equal to its prior all-in fee.
DocuSign Envelope ID: C722E71E-9CF0-4368-A7E3-92BED9523F68
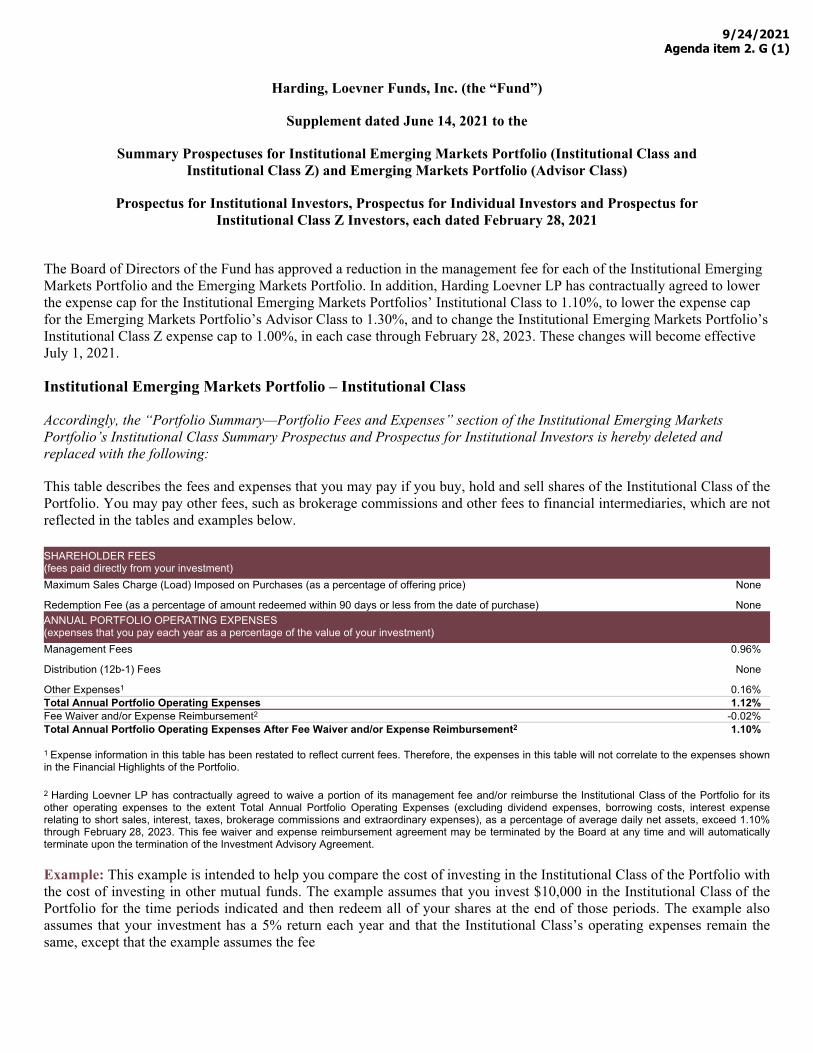
Harding, Loevner Funds, Inc. (the “Fund”)
Supplement dated June 14, 2021 to the
Summary Prospectuses for Institutional Emerging Markets Portfolio (Institutional Class and
Institutional Class Z) and Emerging Markets Portfolio (Advisor Class)
Prospectus for Institutional Investors, Prospectus for Individual Investors and Prospectus for
Institutional Class Z Investors, each dated February 28, 2021
The Board of Directors of the Fund has approved a reduction in the management fee for each of the Institutional Emerging
Markets Portfolio and the Emerging Markets Portfolio. In addition, Harding Loevner LP has contractually agreed to lower
the expense cap for the Institutional Emerging Markets Portfolios’ Institutional Class to 1.10%, to lower the expense cap
for the Emerging Markets Portfolio’s Advisor Class to 1.30%, and to change the Institutional Emerging Markets Portfolio’s
Institutional Class Z expense cap to 1.00%, in each case through February 28, 2023. These changes will become effective
July 1, 2021.
Institutional Emerging Markets Portfolio – Institutional Class
Accordingly, the “Portfolio Summary—Portfolio Fees and Expenses” section of the Institutional Emerging Markets
Portfolio’s Institutional Class Summary Prospectus and Prospectus for Institutional Investors is hereby deleted and
replaced with the following:
This table describes the fees and expenses that you may pay if you buy, hold and sell shares of the Institutional Class of the
Portfolio. You may pay other fees, such as brokerage commissions and other fees to financial intermediaries, which are not
reflected in the tables and examples below.
SHAREHOLDER FEES
(fees paid directly from your investment)
Maximum Sales Charge (Load) Imposed on Purchases (as a percentage of offering price) None
Redemption Fee (as a percentage of amount redeemed within 90 days or less from the date of purchase) None
ANNUAL PORTFOLIO OPERATING EXPENSES
(expenses that you pay each year as a percentage of the value of your investment)
Management Fees 0.96%
Distribution (12b-1) Fees None
Other Expenses1 0.16%
Total Annual Portfolio Operating Expenses 1.12%
Fee Waiver and/or Expense Reimbursement2 -0.02%
Total Annual Portfolio Operating Expenses After Fee Waiver and/or Expense Reimbursement2 1.10%
1 Expense information in this table has been restated to reflect current fees. Therefore, the expenses in this table will not correlate to the expenses shown
in the Financial Highlights of the Portfolio.
2 Harding Loevner LP has contractually agreed to waive a portion of its management fee and/or reimburse the Institutional Class of the Portfolio for its
other operating expenses to the extent Total Annual Portfolio Operating Expenses (excluding dividend expenses, borrowing costs, interest expense
relating to short sales, interest, taxes, brokerage commissions and extraordinary expenses), as a percentage of average daily net assets, exceed 1.10%
through February 28, 2023. This fee waiver and expense reimbursement agreement may be terminated by the Board at any time and will automatically
terminate upon the termination of the Investment Advisory Agreement.
Example: This example is intended to help you compare the cost of investing in the Institutional Class of the Portfolio with
the cost of investing in other mutual funds. The example assumes that you invest $10,000 in the Institutional Class of the
Portfolio for the time periods indicated and then redeem all of your shares at the end of those periods. The example also
assumes that your investment has a 5% return each year and that the Institutional Class’s operating expenses remain the
same, except that the example assumes the fee
9/24/2021Agenda item 2. G (1)

waiver and expense reimbursement agreement pertains only through February 28, 2023. The example does not take into
account brokerage commissions that you may pay on your purchases and sales of Institutional Class shares of the Portfolio.
Although your actual costs may be higher or lower, based on these assumptions your costs would be:
1 YEAR 3 YEARS 5 YEARS 10 YEARS
$112 $352 $613 $1359
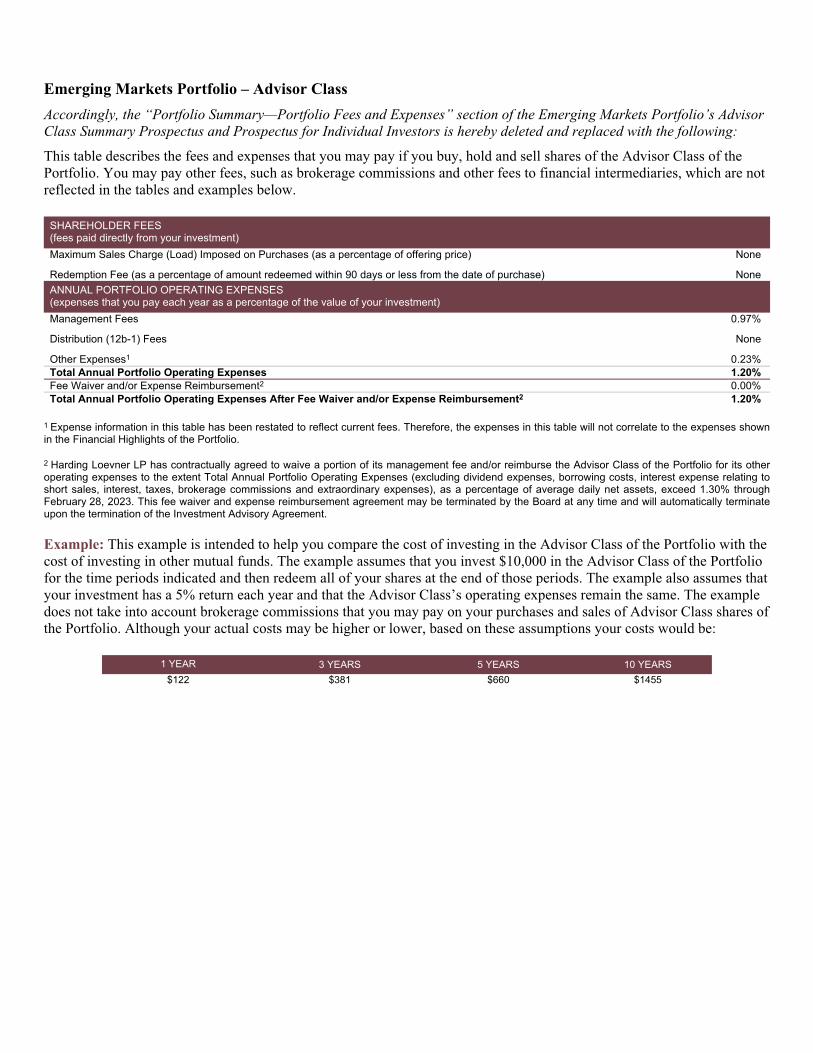
Emerging Markets Portfolio – Advisor Class
Accordingly, the “Portfolio Summary—Portfolio Fees and Expenses” section of the Emerging Markets Portfolio’s Advisor
Class Summary Prospectus and Prospectus for Individual Investors is hereby deleted and replaced with the following:
This table describes the fees and expenses that you may pay if you buy, hold and sell shares of the Advisor Class of the
Portfolio. You may pay other fees, such as brokerage commissions and other fees to financial intermediaries, which are not
reflected in the tables and examples below.
SHAREHOLDER FEES
(fees paid directly from your investment)
Maximum Sales Charge (Load) Imposed on Purchases (as a percentage of offering price) None
Redemption Fee (as a percentage of amount redeemed within 90 days or less from the date of purchase) None
ANNUAL PORTFOLIO OPERATING EXPENSES
(expenses that you pay each year as a percentage of the value of your investment)
Management Fees 0.97%
Distribution (12b-1) Fees None
Other Expenses1 0.23%
Total Annual Portfolio Operating Expenses 1.20%
Fee Waiver and/or Expense Reimbursement2 0.00%
Total Annual Portfolio Operating Expenses After Fee Waiver and/or Expense Reimbursement2 1.20%
1 Expense information in this table has been restated to reflect current fees. Therefore, the expenses in this table will not correlate to the expenses shown
in the Financial Highlights of the Portfolio.
2 Harding Loevner LP has contractually agreed to waive a portion of its management fee and/or reimburse the Advisor Class of the Portfolio for its other
operating expenses to the extent Total Annual Portfolio Operating Expenses (excluding dividend expenses, borrowing costs, interest expense relating to
short sales, interest, taxes, brokerage commissions and extraordinary expenses), as a percentage of average daily net assets, exceed 1.30% through
February 28, 2023. This fee waiver and expense reimbursement agreement may be terminated by the Board at any time and will automatically terminate
upon the termination of the Investment Advisory Agreement.
Example: This example is intended to help you compare the cost of investing in the Advisor Class of the Portfolio with the
cost of investing in other mutual funds. The example assumes that you invest $10,000 in the Advisor Class of the Portfolio
for the time periods indicated and then redeem all of your shares at the end of those periods. The example also assumes that
your investment has a 5% return each year and that the Advisor Class’s operating expenses remain the same. The example
does not take into account brokerage commissions that you may pay on your purchases and sales of Advisor Class shares of
the Portfolio. Although your actual costs may be higher or lower, based on these assumptions your costs would be:
1 YEAR 3 YEARS 5 YEARS 10 YEARS
$122 $381 $660 $1455
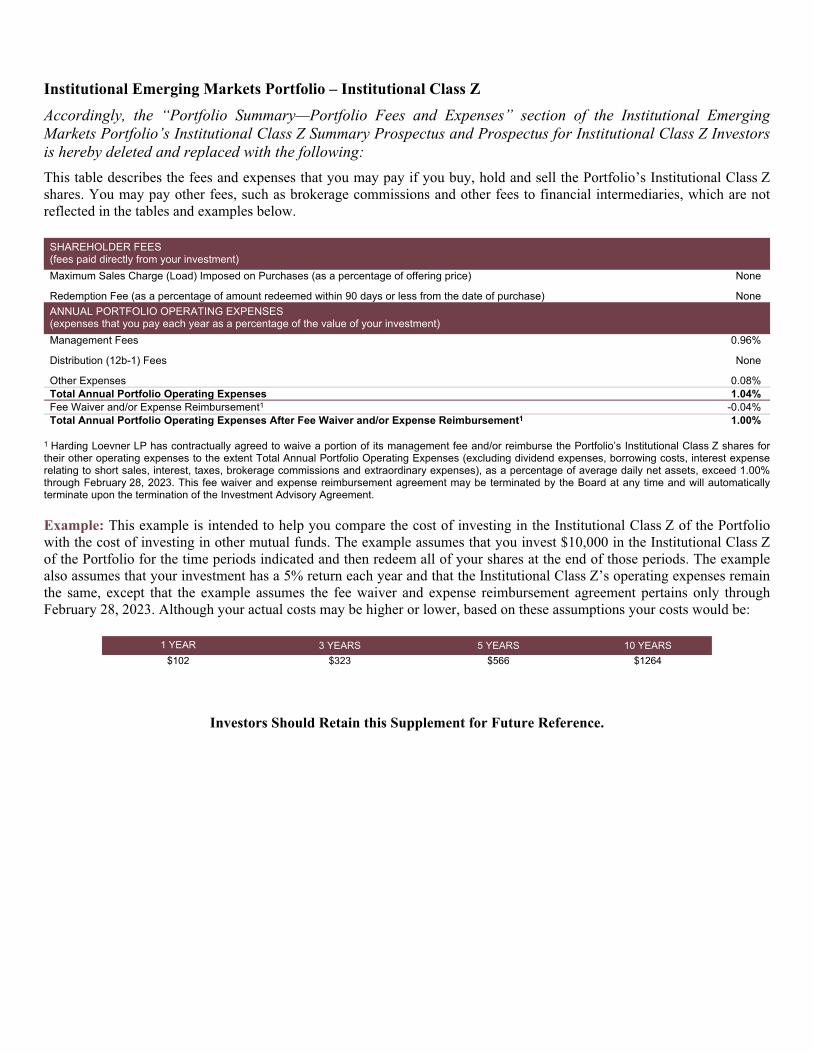
Institutional Emerging Markets Portfolio – Institutional Class Z
Accordingly, the “Portfolio Summary—Portfolio Fees and Expenses” section of the Institutional Emerging
Markets Portfolio’s Institutional Class Z Summary Prospectus and Prospectus for Institutional Class Z Investors
is hereby deleted and replaced with the following:
This table describes the fees and expenses that you may pay if you buy, hold and sell the Portfolio’s Institutional Class Z
shares. You may pay other fees, such as brokerage commissions and other fees to financial intermediaries, which are not
reflected in the tables and examples below.
SHAREHOLDER FEES
(fees paid directly from your investment)
Maximum Sales Charge (Load) Imposed on Purchases (as a percentage of offering price) None
Redemption Fee (as a percentage of amount redeemed within 90 days or less from the date of purchase) None
ANNUAL PORTFOLIO OPERATING EXPENSES
(expenses that you pay each year as a percentage of the value of your investment)
Management Fees 0.96%
Distribution (12b-1) Fees None
Other Expenses 0.08%
Total Annual Portfolio Operating Expenses 1.04%
Fee Waiver and/or Expense Reimbursement1 -0.04%
Total Annual Portfolio Operating Expenses After Fee Waiver and/or Expense Reimbursement1 1.00%
1 Harding Loevner LP has contractually agreed to waive a portion of its management fee and/or reimburse the Portfolio’s Institutional Class Z shares for
their other operating expenses to the extent Total Annual Portfolio Operating Expenses (excluding dividend expenses, borrowing costs, interest expense
relating to short sales, interest, taxes, brokerage commissions and extraordinary expenses), as a percentage of average daily net assets, exceed 1.00%
through February 28, 2023. This fee waiver and expense reimbursement agreement may be terminated by the Board at any time and will automatically
terminate upon the termination of the Investment Advisory Agreement.
Example: This example is intended to help you compare the cost of investing in the Institutional Class Z of the Portfolio
with the cost of investing in other mutual funds. The example assumes that you invest $10,000 in the Institutional Class Z
of the Portfolio for the time periods indicated and then redeem all of your shares at the end of those periods. The example
also assumes that your investment has a 5% return each year and that the Institutional Class Z’s operating expenses remain
the same, except that the example assumes the fee waiver and expense reimbursement agreement pertains only through
February 28, 2023. Although your actual costs may be higher or lower, based on these assumptions your costs would be:
1 YEAR 3 YEARS 5 YEARS 10 YEARS
$102 $323 $566 $1264
Investors Should Retain this Supplement for Future Reference.
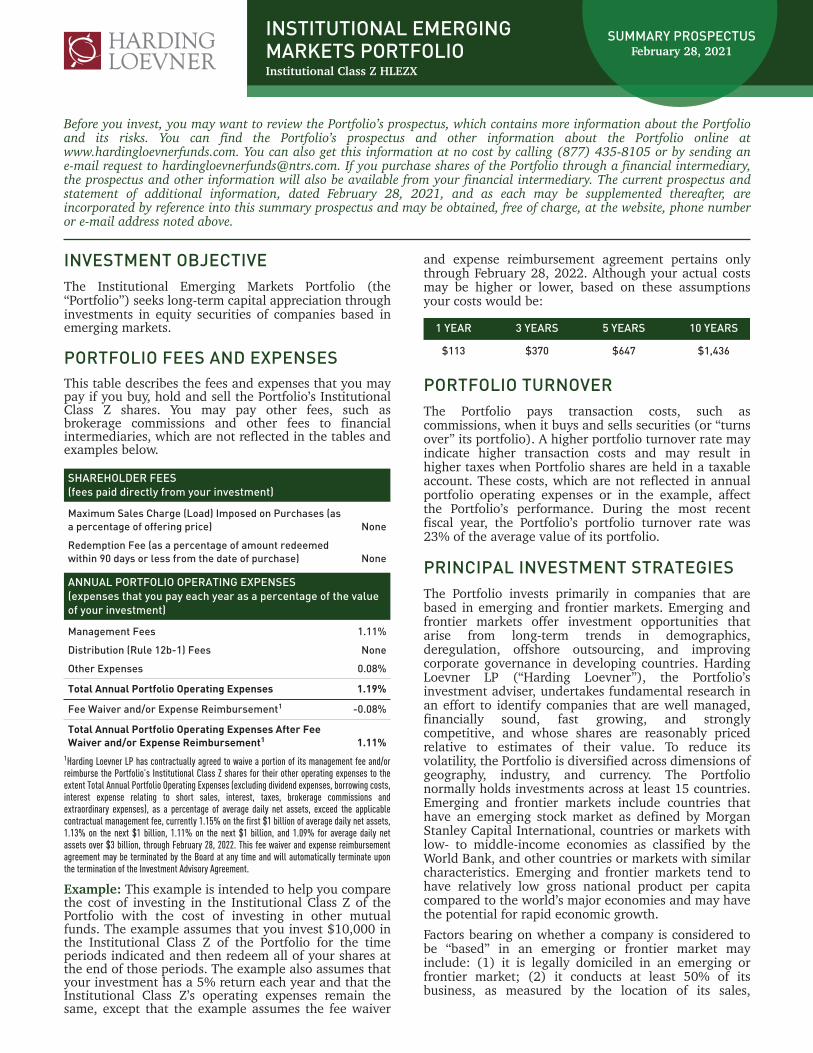
Before you invest, you may want to review the Portfolio’s prospectus, which contains more information about the Portfolioand its risks. You can find the Portfolio’s prospectus and other information about the Portfolio online atwww.hardingloevnerfunds.com. You can also get this information at no cost by calling (877) 435-8105 or by sending ane-mail request to [email protected]. If you purchase shares of the Portfolio through a financial intermediary,the prospectus and other information will also be available from your financial intermediary. The current prospectus andstatement of additional information, dated February 28, 2021, and as each may be supplemented thereafter, areincorporated by reference into this summary prospectus and may be obtained, free of charge, at the website, phone numberor e-mail address noted above.
INVESTMENT OBJECTIVEThe Institutional Emerging Markets Portfolio (the“Portfolio”) seeks long-term capital appreciation throughinvestments in equity securities of companies based inemerging markets.
PORTFOLIO FEES AND EXPENSESThis table describes the fees and expenses that you maypay if you buy, hold and sell the Portfolio’s InstitutionalClass Z shares. You may pay other fees, such asbrokerage commissions and other fees to financialintermediaries, which are not reflected in the tables andexamples below.
SHAREHOLDER FEES(fees paid directly from your investment)
Maximum Sales Charge (Load) Imposed on Purchases (asa percentage of offering price) None
Redemption Fee (as a percentage of amount redeemedwithin 90 days or less from the date of purchase) None
ANNUAL PORTFOLIO OPERATING EXPENSES(expenses that you pay each year as a percentage of the valueof your investment)
Management Fees 1.11%
Distribution (Rule 12b-1) Fees None
Other Expenses 0.08%
Total Annual Portfolio Operating Expenses 1.19%
Fee Waiver and/or Expense Reimbursement1 -0.08%
Total Annual Portfolio Operating Expenses After FeeWaiver and/or Expense Reimbursement1 1.11%
1Harding Loevner LP has contractually agreed to waive a portion of its management fee and/orreimburse the Portfolio’s Institutional Class Z shares for their other operating expenses to theextent Total Annual Portfolio Operating Expenses (excluding dividend expenses, borrowing costs,interest expense relating to short sales, interest, taxes, brokerage commissions andextraordinary expenses), as a percentage of average daily net assets, exceed the applicablecontractual management fee, currently 1.15% on the first $1 billion of average daily net assets,1.13% on the next $1 billion, 1.11% on the next $1 billion, and 1.09% for average daily netassets over $3 billion, through February 28, 2022. This fee waiver and expense reimbursementagreement may be terminated by the Board at any time and will automatically terminate uponthe termination of the Investment Advisory Agreement.
Example: This example is intended to help you comparethe cost of investing in the Institutional Class Z of thePortfolio with the cost of investing in other mutualfunds. The example assumes that you invest $10,000 inthe Institutional Class Z of the Portfolio for the timeperiods indicated and then redeem all of your shares atthe end of those periods. The example also assumes thatyour investment has a 5% return each year and that theInstitutional Class Z’s operating expenses remain thesame, except that the example assumes the fee waiver
and expense reimbursement agreement pertains onlythrough February 28, 2022. Although your actual costsmay be higher or lower, based on these assumptionsyour costs would be:
1 YEAR 3 YEARS 5 YEARS 10 YEARS
$113 $370 $647 $1,436
PORTFOLIO TURNOVERThe Portfolio pays transaction costs, such ascommissions, when it buys and sells securities (or “turnsover” its portfolio). A higher portfolio turnover rate mayindicate higher transaction costs and may result inhigher taxes when Portfolio shares are held in a taxableaccount. These costs, which are not reflected in annualportfolio operating expenses or in the example, affectthe Portfolio’s performance. During the most recentfiscal year, the Portfolio’s portfolio turnover rate was23% of the average value of its portfolio.
PRINCIPAL INVESTMENT STRATEGIESThe Portfolio invests primarily in companies that arebased in emerging and frontier markets. Emerging andfrontier markets offer investment opportunities thatarise from long-term trends in demographics,deregulation, offshore outsourcing, and improvingcorporate governance in developing countries. HardingLoevner LP (“Harding Loevner”), the Portfolio’sinvestment adviser, undertakes fundamental research inan effort to identify companies that are well managed,financially sound, fast growing, and stronglycompetitive, and whose shares are reasonably pricedrelative to estimates of their value. To reduce itsvolatility, the Portfolio is diversified across dimensions ofgeography, industry, and currency. The Portfolionormally holds investments across at least 15 countries.Emerging and frontier markets include countries thathave an emerging stock market as defined by MorganStanley Capital International, countries or markets withlow- to middle-income economies as classified by theWorld Bank, and other countries or markets with similarcharacteristics. Emerging and frontier markets tend tohave relatively low gross national product per capitacompared to the world’s major economies and may havethe potential for rapid economic growth.
Factors bearing on whether a company is considered tobe “based” in an emerging or frontier market mayinclude: (1) it is legally domiciled in an emerging orfrontier market; (2) it conducts at least 50% of itsbusiness, as measured by the location of its sales,
INSTITUTIONAL EMERGINGMARKETS PORTFOLIOInstitutional Class Z HLEZX
SUMMARY PROSPECTUSFebruary 28, 2021
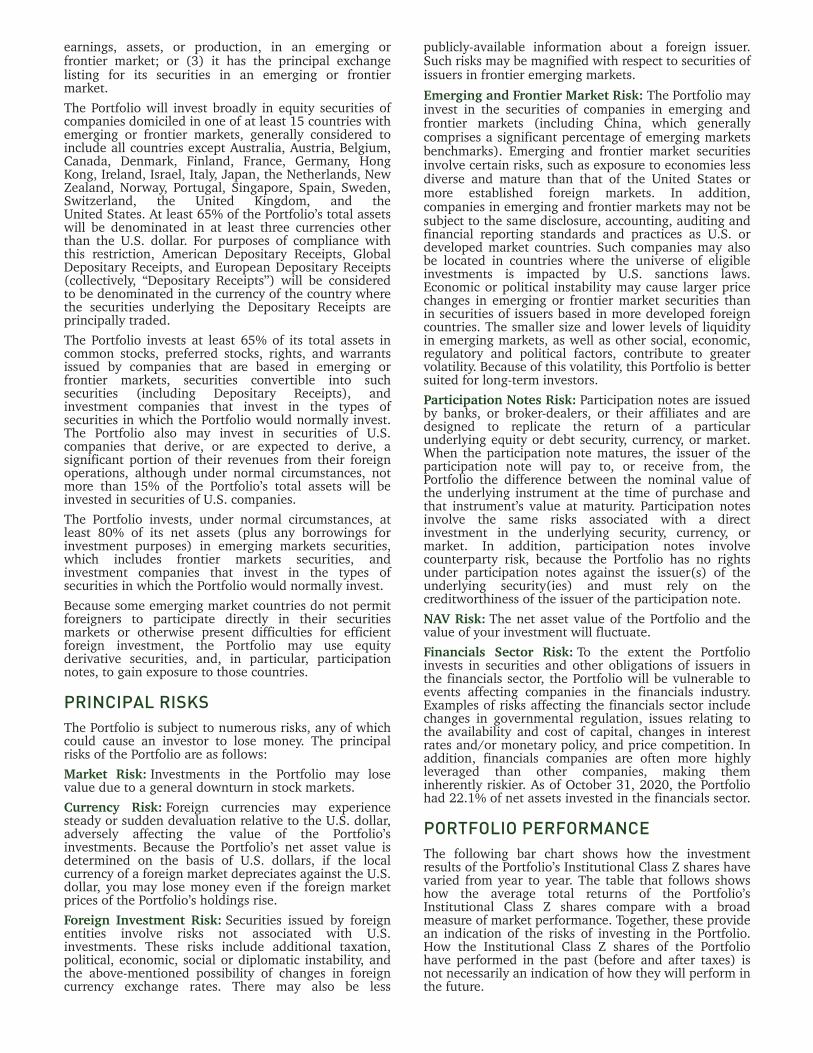
earnings, assets, or production, in an emerging orfrontier market; or (3) it has the principal exchangelisting for its securities in an emerging or frontiermarket.
The Portfolio will invest broadly in equity securities ofcompanies domiciled in one of at least 15 countries withemerging or frontier markets, generally considered toinclude all countries except Australia, Austria, Belgium,Canada, Denmark, Finland, France, Germany, HongKong, Ireland, Israel, Italy, Japan, the Netherlands, NewZealand, Norway, Portugal, Singapore, Spain, Sweden,Switzerland, the United Kingdom, and theUnited States. At least 65% of the Portfolio’s total assetswill be denominated in at least three currencies otherthan the U.S. dollar. For purposes of compliance withthis restriction, American Depositary Receipts, GlobalDepositary Receipts, and European Depositary Receipts(collectively, “Depositary Receipts”) will be consideredto be denominated in the currency of the country wherethe securities underlying the Depositary Receipts areprincipally traded.
The Portfolio invests at least 65% of its total assets incommon stocks, preferred stocks, rights, and warrantsissued by companies that are based in emerging orfrontier markets, securities convertible into suchsecurities (including Depositary Receipts), andinvestment companies that invest in the types ofsecurities in which the Portfolio would normally invest.The Portfolio also may invest in securities of U.S.companies that derive, or are expected to derive, asignificant portion of their revenues from their foreignoperations, although under normal circumstances, notmore than 15% of the Portfolio’s total assets will beinvested in securities of U.S. companies.
The Portfolio invests, under normal circumstances, atleast 80% of its net assets (plus any borrowings forinvestment purposes) in emerging markets securities,which includes frontier markets securities, andinvestment companies that invest in the types ofsecurities in which the Portfolio would normally invest.
Because some emerging market countries do not permitforeigners to participate directly in their securitiesmarkets or otherwise present difficulties for efficientforeign investment, the Portfolio may use equityderivative securities, and, in particular, participationnotes, to gain exposure to those countries.
PRINCIPAL RISKSThe Portfolio is subject to numerous risks, any of whichcould cause an investor to lose money. The principalrisks of the Portfolio are as follows:
Market Risk: Investments in the Portfolio may losevalue due to a general downturn in stock markets.
Currency Risk: Foreign currencies may experiencesteady or sudden devaluation relative to the U.S. dollar,adversely affecting the value of the Portfolio’sinvestments. Because the Portfolio’s net asset value isdetermined on the basis of U.S. dollars, if the localcurrency of a foreign market depreciates against the U.S.dollar, you may lose money even if the foreign marketprices of the Portfolio’s holdings rise.
Foreign Investment Risk: Securities issued by foreignentities involve risks not associated with U.S.investments. These risks include additional taxation,political, economic, social or diplomatic instability, andthe above-mentioned possibility of changes in foreigncurrency exchange rates. There may also be less
publicly-available information about a foreign issuer.Such risks may be magnified with respect to securities ofissuers in frontier emerging markets.
Emerging and Frontier Market Risk: The Portfolio mayinvest in the securities of companies in emerging andfrontier markets (including China, which generallycomprises a significant percentage of emerging marketsbenchmarks). Emerging and frontier market securitiesinvolve certain risks, such as exposure to economies lessdiverse and mature than that of the United States ormore established foreign markets. In addition,companies in emerging and frontier markets may not besubject to the same disclosure, accounting, auditing andfinancial reporting standards and practices as U.S. ordeveloped market countries. Such companies may alsobe located in countries where the universe of eligibleinvestments is impacted by U.S. sanctions laws.Economic or political instability may cause larger pricechanges in emerging or frontier market securities thanin securities of issuers based in more developed foreigncountries. The smaller size and lower levels of liquidityin emerging markets, as well as other social, economic,regulatory and political factors, contribute to greatervolatility. Because of this volatility, this Portfolio is bettersuited for long-term investors.
Participation Notes Risk: Participation notes are issuedby banks, or broker-dealers, or their affiliates and aredesigned to replicate the return of a particularunderlying equity or debt security, currency, or market.When the participation note matures, the issuer of theparticipation note will pay to, or receive from, thePortfolio the difference between the nominal value ofthe underlying instrument at the time of purchase andthat instrument’s value at maturity. Participation notesinvolve the same risks associated with a directinvestment in the underlying security, currency, ormarket. In addition, participation notes involvecounterparty risk, because the Portfolio has no rightsunder participation notes against the issuer(s) of theunderlying security(ies) and must rely on thecreditworthiness of the issuer of the participation note.
NAV Risk: The net asset value of the Portfolio and thevalue of your investment will fluctuate.
Financials Sector Risk: To the extent the Portfolioinvests in securities and other obligations of issuers inthe financials sector, the Portfolio will be vulnerable toevents affecting companies in the financials industry.Examples of risks affecting the financials sector includechanges in governmental regulation, issues relating tothe availability and cost of capital, changes in interestrates and/or monetary policy, and price competition. Inaddition, financials companies are often more highlyleveraged than other companies, making theminherently riskier. As of October 31, 2020, the Portfoliohad 22.1% of net assets invested in the financials sector.
PORTFOLIO PERFORMANCEThe following bar chart shows how the investmentresults of the Portfolio’s Institutional Class Z shares havevaried from year to year. The table that follows showshow the average total returns of the Portfolio’sInstitutional Class Z shares compare with a broadmeasure of market performance. Together, these providean indication of the risks of investing in the Portfolio.How the Institutional Class Z shares of the Portfoliohave performed in the past (before and after taxes) isnot necessarily an indication of how they will perform inthe future.
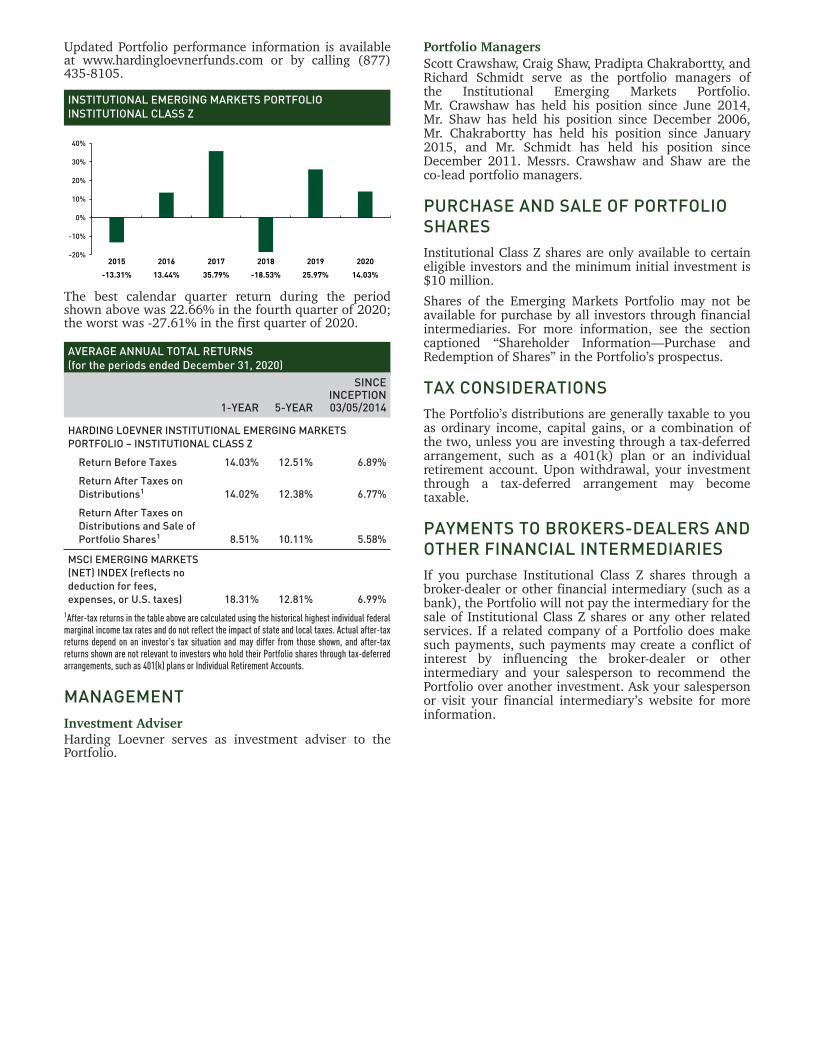
Updated Portfolio performance information is availableat www.hardingloevnerfunds.com or by calling (877)435-8105.
INSTITUTIONAL EMERGING MARKETS PORTFOLIOINSTITUTIONAL CLASS Z
0%
10%
20%
30%
40%
-10%
-20%
-13.31%
2015
13.44%
2016
35.79%
2017
-18.53%
2018
25.97%
2019
14.03%
2020
The best calendar quarter return during the periodshown above was 22.66% in the fourth quarter of 2020;the worst was -27.61% in the first quarter of 2020.
AVERAGE ANNUAL TOTAL RETURNS(for the periods ended December 31, 2020)
1-YEAR 5-YEAR
SINCEINCEPTION03/05/2014
HARDING LOEVNER INSTITUTIONAL EMERGING MARKETSPORTFOLIO – INSTITUTIONAL CLASS Z
Return Before Taxes 14.03% 12.51% 6.89%
Return After Taxes onDistributions1 14.02% 12.38% 6.77%
Return After Taxes onDistributions and Sale ofPortfolio Shares1 8.51% 10.11% 5.58%
MSCI EMERGING MARKETS(NET) INDEX (reflects nodeduction for fees,expenses, or U.S. taxes) 18.31% 12.81% 6.99%
1After-tax returns in the table above are calculated using the historical highest individual federalmarginal income tax rates and do not reflect the impact of state and local taxes. Actual after-taxreturns depend on an investor’s tax situation and may differ from those shown, and after-taxreturns shown are not relevant to investors who hold their Portfolio shares through tax-deferredarrangements, such as 401(k) plans or Individual Retirement Accounts.
MANAGEMENTInvestment AdviserHarding Loevner serves as investment adviser to thePortfolio.
Portfolio ManagersScott Crawshaw, Craig Shaw, Pradipta Chakrabortty, andRichard Schmidt serve as the portfolio managers ofthe Institutional Emerging Markets Portfolio.Mr. Crawshaw has held his position since June 2014,Mr. Shaw has held his position since December 2006,Mr. Chakrabortty has held his position since January2015, and Mr. Schmidt has held his position sinceDecember 2011. Messrs. Crawshaw and Shaw are theco-lead portfolio managers.
PURCHASE AND SALE OF PORTFOLIOSHARESInstitutional Class Z shares are only available to certaineligible investors and the minimum initial investment is$10 million.
Shares of the Emerging Markets Portfolio may not beavailable for purchase by all investors through financialintermediaries. For more information, see the sectioncaptioned “Shareholder Information—Purchase andRedemption of Shares” in the Portfolio’s prospectus.
TAX CONSIDERATIONSThe Portfolio’s distributions are generally taxable to youas ordinary income, capital gains, or a combination ofthe two, unless you are investing through a tax-deferredarrangement, such as a 401(k) plan or an individualretirement account. Upon withdrawal, your investmentthrough a tax-deferred arrangement may becometaxable.
PAYMENTS TO BROKERS-DEALERS ANDOTHER FINANCIAL INTERMEDIARIESIf you purchase Institutional Class Z shares through abroker-dealer or other financial intermediary (such as abank), the Portfolio will not pay the intermediary for thesale of Institutional Class Z shares or any other relatedservices. If a related company of a Portfolio does makesuch payments, such payments may create a conflict ofinterest by influencing the broker-dealer or otherintermediary and your salesperson to recommend thePortfolio over another investment. Ask your salespersonor visit your financial intermediary’s website for moreinformation.

HARDING, LOEVNER FUNDS, INC.c/o Northern TrustAttn: Funds Center, Floor 38333 South Wabash AvenueChicago, IL 60604
(877) 435-8105www.hardingloevnerfunds.com
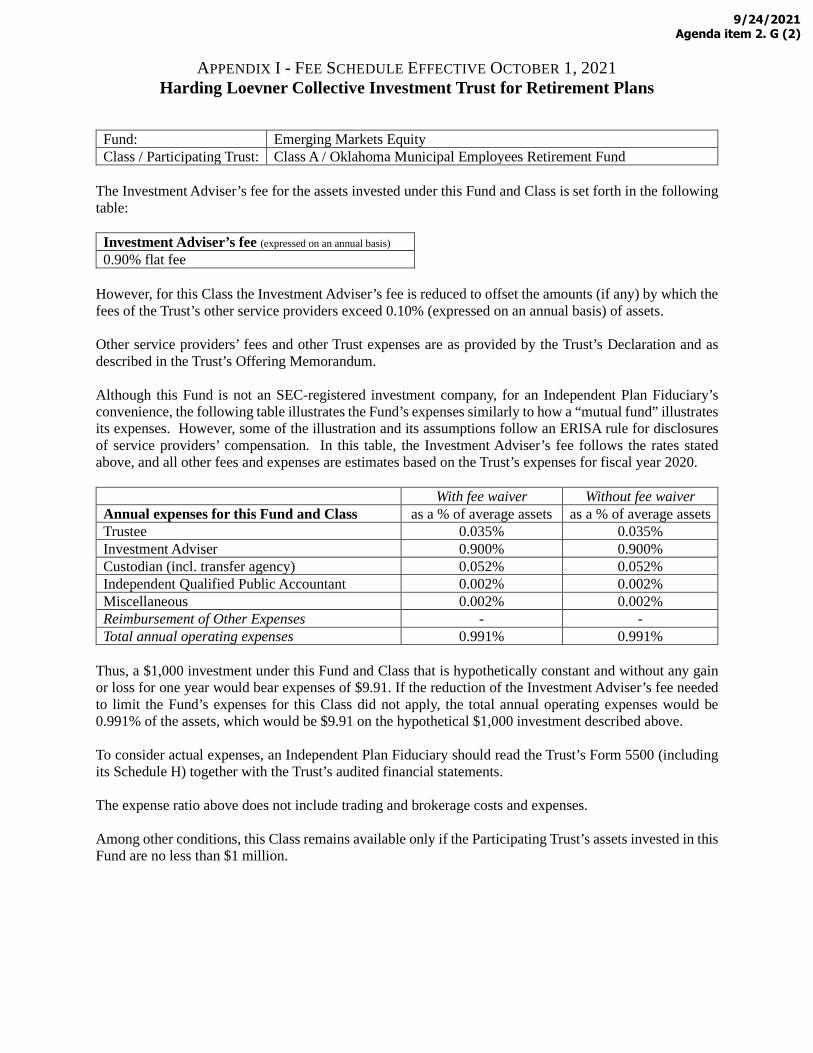
APPENDIX I - FEE SCHEDULE EFFECTIVE OCTOBER 1, 2021 Harding Loevner Collective Investment Trust for Retirement Plans
Fund: Emerging Markets Equity Class / Participating Trust: Class A / Oklahoma Municipal Employees Retirement Fund
The Investment Adviser’s fee for the assets invested under this Fund and Class is set forth in the following table:
Investment Adviser’s fee (expressed on an annual basis) 0.90% flat fee
However, for this Class the Investment Adviser’s fee is reduced to offset the amounts (if any) by which the fees of the Trust’s other service providers exceed 0.10% (expressed on an annual basis) of assets.
Other service providers’ fees and other Trust expenses are as provided by the Trust’s Declaration and as described in the Trust’s Offering Memorandum.
Although this Fund is not an SEC-registered investment company, for an Independent Plan Fiduciary’s convenience, the following table illustrates the Fund’s expenses similarly to how a “mutual fund” illustrates its expenses. However, some of the illustration and its assumptions follow an ERISA rule for disclosures of service providers’ compensation. In this table, the Investment Adviser’s fee follows the rates stated above, and all other fees and expenses are estimates based on the Trust’s expenses for fiscal year 2020.
With fee waiver Without fee waiver Annual expenses for this Fund and Class as a % of average assets as a % of average assets Trustee 0.035% 0.035% Investment Adviser 0.900% 0.900% Custodian (incl. transfer agency) 0.052% 0.052% Independent Qualified Public Accountant 0.002% 0.002% Miscellaneous 0.002% 0.002% Reimbursement of Other Expenses - - Total annual operating expenses 0.991% 0.991%
Thus, a $1,000 investment under this Fund and Class that is hypothetically constant and without any gain or loss for one year would bear expenses of $9.91. If the reduction of the Investment Adviser’s fee needed to limit the Fund’s expenses for this Class did not apply, the total annual operating expenses would be 0.991% of the assets, which would be $9.91 on the hypothetical $1,000 investment described above.
To consider actual expenses, an Independent Plan Fiduciary should read the Trust’s Form 5500 (including its Schedule H) together with the Trust’s audited financial statements.
The expense ratio above does not include trading and brokerage costs and expenses.
Among other conditions, this Class remains available only if the Participating Trust’s assets invested in this Fund are no less than $1 million.
9/24/2021Agenda item 2. G (2)
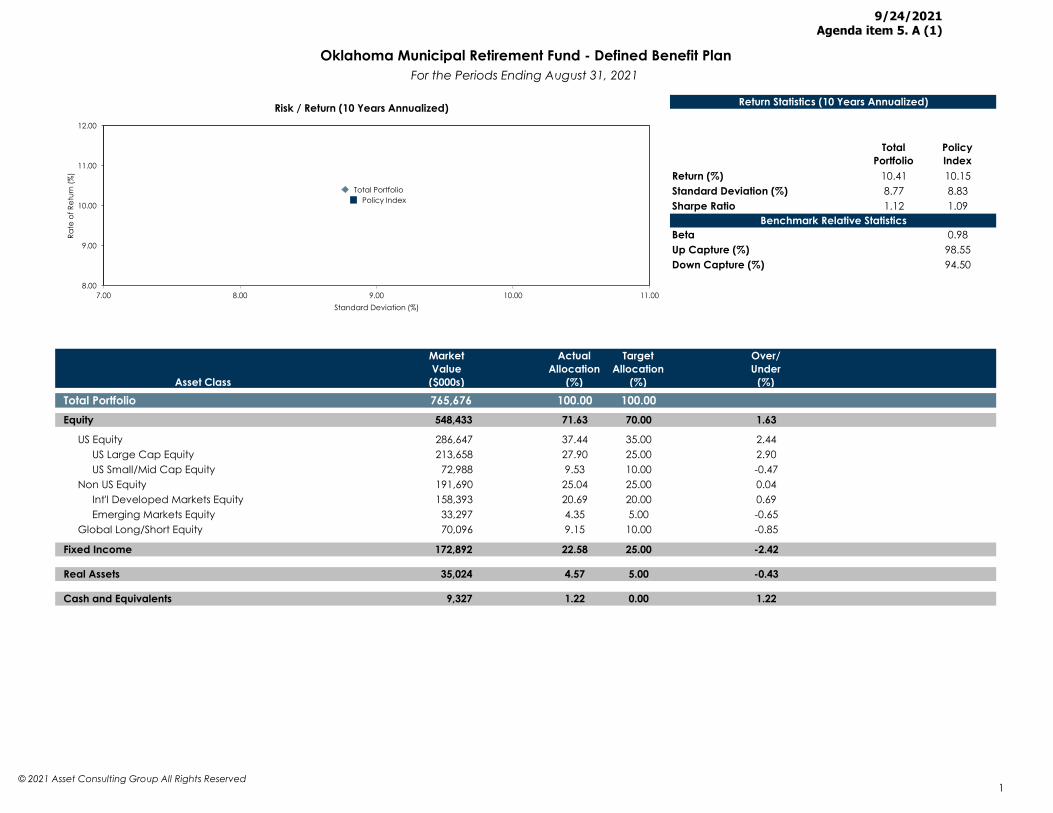
Return (%) 10.41 10.15Standard Deviation (%) 8.77 8.83Sharpe Ratio 1.12 1.09
Beta 0.98Up Capture (%) 98.55Down Capture (%) 94.50
Asset Class
MarketValue
($000s)
ActualAllocation
(%)
TargetAllocation
(%)
Over/Under
(%)Total Portfolio 765,676 100.00 100.00Equity 548,433 71.63 70.00 1.63
US Equity 286,647 37.44 35.00 2.44 US Large Cap Equity 213,658 27.90 25.00 2.90 US Small/Mid Cap Equity 72,988 9.53 10.00 -0.47 Non US Equity 191,690 25.04 25.00 0.04 Int'l Developed Markets Equity 158,393 20.69 20.00 0.69 Emerging Markets Equity 33,297 4.35 5.00 -0.65 Global Long/Short Equity 70,096 9.15 10.00 -0.85
Fixed Income 172,892 22.58 25.00 -2.42
Real Assets 35,024 4.57 5.00 -0.43
Cash and Equivalents 9,327 1.22 0.00 1.22
Oklahoma Municipal Retirement Fund - Defined Benefit PlanFor the Periods Ending August 31, 2021
Return Statistics (10 Years Annualized)
Benchmark Relative Statistics
Total Portfolio
Policy Index
Total PortfolioPolicy Index
8.00
9.00
10.00
11.00
12.00
7.00 8.00 9.00 10.00 11.00
Rate
of R
etur
n (%
)
Standard Deviation (%)
Risk / Return (10 Years Annualized)
© 2021 Asset Consulting Group All Rights Reserved1
99/24/2021Agenda item 5. A (1)
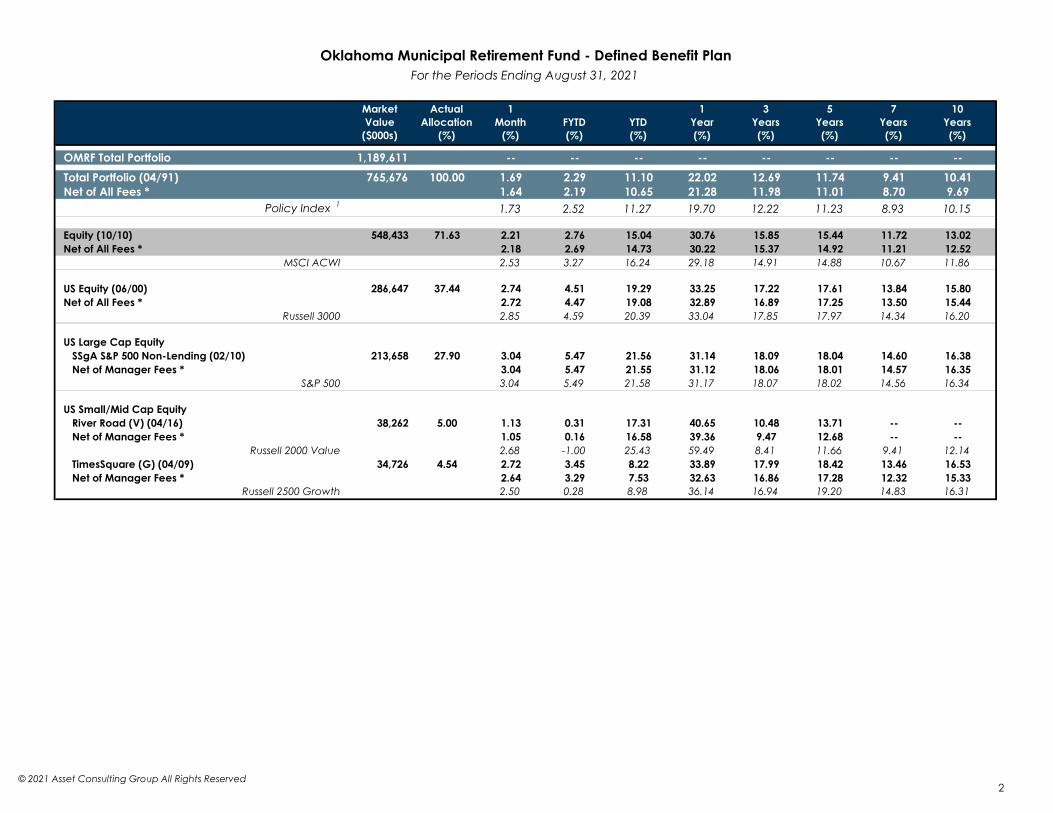
MarketValue
($000s)
ActualAllocation
(%)
1Month
(%)FYTD(%)
YTD(%)
1Year(%)
3Years(%)
5Years(%)
7Years(%)
10Years(%)
OMRF Total Portfolio 1,189,611 -- -- -- -- -- -- -- --Total Portfolio (04/91) 765,676 100.00 1.69 2.29 11.10 22.02 12.69 11.74 9.41 10.41Net of All Fees * 1.64 2.19 10.65 21.28 11.98 11.01 8.70 9.69
Policy Index 1 1.73 2.52 11.27 19.70 12.22 11.23 8.93 10.15
Equity (10/10) 548,433 71.63 2.21 2.76 15.04 30.76 15.85 15.44 11.72 13.02Net of All Fees * 2.18 2.69 14.73 30.22 15.37 14.92 11.21 12.52
MSCI ACWI 2.53 3.27 16.24 29.18 14.91 14.88 10.67 11.86
US Equity (06/00) 286,647 37.44 2.74 4.51 19.29 33.25 17.22 17.61 13.84 15.80Net of All Fees * 2.72 4.47 19.08 32.89 16.89 17.25 13.50 15.44
Russell 3000 2.85 4.59 20.39 33.04 17.85 17.97 14.34 16.20
US Large Cap Equity SSgA S&P 500 Non-Lending (02/10) 213,658 27.90 3.04 5.47 21.56 31.14 18.09 18.04 14.60 16.38 Net of Manager Fees * 3.04 5.47 21.55 31.12 18.06 18.01 14.57 16.35
S&P 500 3.04 5.49 21.58 31.17 18.07 18.02 14.56 16.34
US Small/Mid Cap Equity River Road (V) (04/16) 38,262 5.00 1.13 0.31 17.31 40.65 10.48 13.71 -- -- Net of Manager Fees * 1.05 0.16 16.58 39.36 9.47 12.68 -- --
Russell 2000 Value 2.68 -1.00 25.43 59.49 8.41 11.66 9.41 12.14 TimesSquare (G) (04/09) 34,726 4.54 2.72 3.45 8.22 33.89 17.99 18.42 13.46 16.53 Net of Manager Fees * 2.64 3.29 7.53 32.63 16.86 17.28 12.32 15.33
Russell 2500 Growth 2.50 0.28 8.98 36.14 16.94 19.20 14.83 16.31
Oklahoma Municipal Retirement Fund - Defined Benefit PlanFor the Periods Ending August 31, 2021
© 2021 Asset Consulting Group All Rights Reserved2
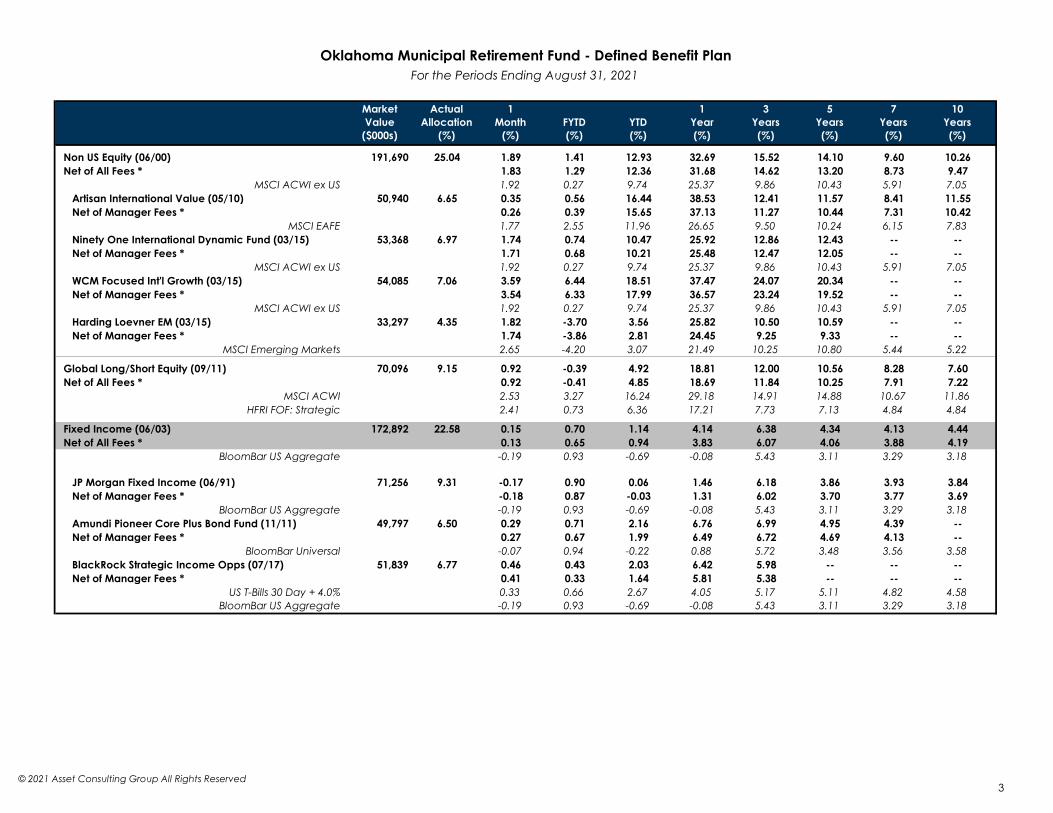
MarketValue
($000s)
ActualAllocation
(%)
1Month
(%)FYTD(%)
YTD(%)
1Year(%)
3Years(%)
5Years(%)
7Years(%)
10Years(%)
Non US Equity (06/00) 191,690 25.04 1.89 1.41 12.93 32.69 15.52 14.10 9.60 10.26Net of All Fees * 1.83 1.29 12.36 31.68 14.62 13.20 8.73 9.47
MSCI ACWI ex US 1.92 0.27 9.74 25.37 9.86 10.43 5.91 7.05 Artisan International Value (05/10) 50,940 6.65 0.35 0.56 16.44 38.53 12.41 11.57 8.41 11.55 Net of Manager Fees * 0.26 0.39 15.65 37.13 11.27 10.44 7.31 10.42
MSCI EAFE 1.77 2.55 11.96 26.65 9.50 10.24 6.15 7.83 Ninety One International Dynamic Fund (03/15) 53,368 6.97 1.74 0.74 10.47 25.92 12.86 12.43 -- -- Net of Manager Fees * 1.71 0.68 10.21 25.48 12.47 12.05 -- --
MSCI ACWI ex US 1.92 0.27 9.74 25.37 9.86 10.43 5.91 7.05 WCM Focused Int'l Growth (03/15) 54,085 7.06 3.59 6.44 18.51 37.47 24.07 20.34 -- -- Net of Manager Fees * 3.54 6.33 17.99 36.57 23.24 19.52 -- --
MSCI ACWI ex US 1.92 0.27 9.74 25.37 9.86 10.43 5.91 7.05 Harding Loevner EM (03/15) 33,297 4.35 1.82 -3.70 3.56 25.82 10.50 10.59 -- -- Net of Manager Fees * 1.74 -3.86 2.81 24.45 9.25 9.33 -- --
MSCI Emerging Markets 2.65 -4.20 3.07 21.49 10.25 10.80 5.44 5.22
Global Long/Short Equity (09/11) 70,096 9.15 0.92 -0.39 4.92 18.81 12.00 10.56 8.28 7.60Net of All Fees * 0.92 -0.41 4.85 18.69 11.84 10.25 7.91 7.22
MSCI ACWI 2.53 3.27 16.24 29.18 14.91 14.88 10.67 11.86HFRI FOF: Strategic 2.41 0.73 6.36 17.21 7.73 7.13 4.84 4.84
Fixed Income (06/03) 172,892 22.58 0.15 0.70 1.14 4.14 6.38 4.34 4.13 4.44Net of All Fees * 0.13 0.65 0.94 3.83 6.07 4.06 3.88 4.19
BloomBar US Aggregate -0.19 0.93 -0.69 -0.08 5.43 3.11 3.29 3.18
JP Morgan Fixed Income (06/91) 71,256 9.31 -0.17 0.90 0.06 1.46 6.18 3.86 3.93 3.84 Net of Manager Fees * -0.18 0.87 -0.03 1.31 6.02 3.70 3.77 3.69
BloomBar US Aggregate -0.19 0.93 -0.69 -0.08 5.43 3.11 3.29 3.18 Amundi Pioneer Core Plus Bond Fund (11/11) 49,797 6.50 0.29 0.71 2.16 6.76 6.99 4.95 4.39 -- Net of Manager Fees * 0.27 0.67 1.99 6.49 6.72 4.69 4.13 --
BloomBar Universal -0.07 0.94 -0.22 0.88 5.72 3.48 3.56 3.58 BlackRock Strategic Income Opps (07/17) 51,839 6.77 0.46 0.43 2.03 6.42 5.98 -- -- -- Net of Manager Fees * 0.41 0.33 1.64 5.81 5.38 -- -- --
US T-Bills 30 Day + 4.0% 0.33 0.66 2.67 4.05 5.17 5.11 4.82 4.58BloomBar US Aggregate -0.19 0.93 -0.69 -0.08 5.43 3.11 3.29 3.18
Oklahoma Municipal Retirement Fund - Defined Benefit PlanFor the Periods Ending August 31, 2021
© 2021 Asset Consulting Group All Rights Reserved3
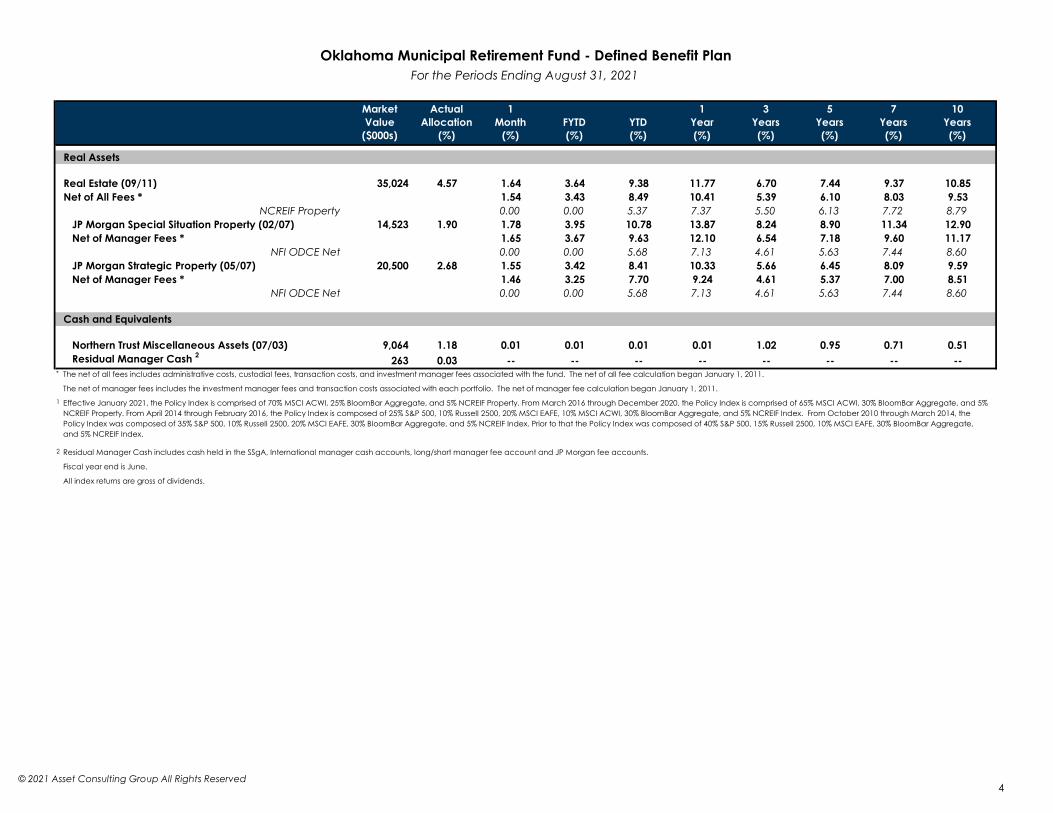
MarketValue
($000s)
ActualAllocation
(%)
1Month
(%)FYTD(%)
YTD(%)
1Year(%)
3Years(%)
5Years(%)
7Years(%)
10Years(%)
Real Assets
Real Estate (09/11) 35,024 4.57 1.64 3.64 9.38 11.77 6.70 7.44 9.37 10.85Net of All Fees * 1.54 3.43 8.49 10.41 5.39 6.10 8.03 9.53
NCREIF Property 0.00 0.00 5.37 7.37 5.50 6.13 7.72 8.79 JP Morgan Special Situation Property (02/07) 14,523 1.90 1.78 3.95 10.78 13.87 8.24 8.90 11.34 12.90 Net of Manager Fees * 1.65 3.67 9.63 12.10 6.54 7.18 9.60 11.17
NFI ODCE Net 0.00 0.00 5.68 7.13 4.61 5.63 7.44 8.60 JP Morgan Strategic Property (05/07) 20,500 2.68 1.55 3.42 8.41 10.33 5.66 6.45 8.09 9.59 Net of Manager Fees * 1.46 3.25 7.70 9.24 4.61 5.37 7.00 8.51
NFI ODCE Net 0.00 0.00 5.68 7.13 4.61 5.63 7.44 8.60
Cash and Equivalents
Northern Trust Miscellaneous Assets (07/03) 9,064 1.18 0.01 0.01 0.01 0.01 1.02 0.95 0.71 0.51 Residual Manager Cash 2 263 0.03 -- -- -- -- -- -- -- --
*
1
2
All index returns are gross of dividends.
Oklahoma Municipal Retirement Fund - Defined Benefit PlanFor the Periods Ending August 31, 2021
The net of all fees includes administrative costs, custodial fees, transaction costs, and investment manager fees associated with the fund. The net of all fee calculation began January 1, 2011.
The net of manager fees includes the investment manager fees and transaction costs associated with each portfolio. The net of manager fee calculation began January 1, 2011.
Effective January 2021, the Policy Index is comprised of 70% MSCI ACWI, 25% BloomBar Aggregate, and 5% NCREIF Property. From March 2016 through December 2020, the Policy Index is comprised of 65% MSCI ACWI, 30% BloomBar Aggregate, and 5% NCREIF Property. From April 2014 through February 2016, the Policy Index is composed of 25% S&P 500, 10% Russell 2500, 20% MSCI EAFE, 10% MSCI ACWI, 30% BloomBar Aggregate, and 5% NCREIF Index. From October 2010 through March 2014, the Policy Index was composed of 35% S&P 500, 10% Russell 2500, 20% MSCI EAFE, 30% BloomBar Aggregate, and 5% NCREIF Index. Prior to that the Policy Index was composed of 40% S&P 500, 15% Russell 2500, 10% MSCI EAFE, 30% BloomBar Aggregate, and 5% NCREIF Index.
Residual Manager Cash includes cash held in the SSgA, International manager cash accounts, long/short manager fee account and JP Morgan fee accounts.
Fiscal year end is June.
© 2021 Asset Consulting Group All Rights Reserved4
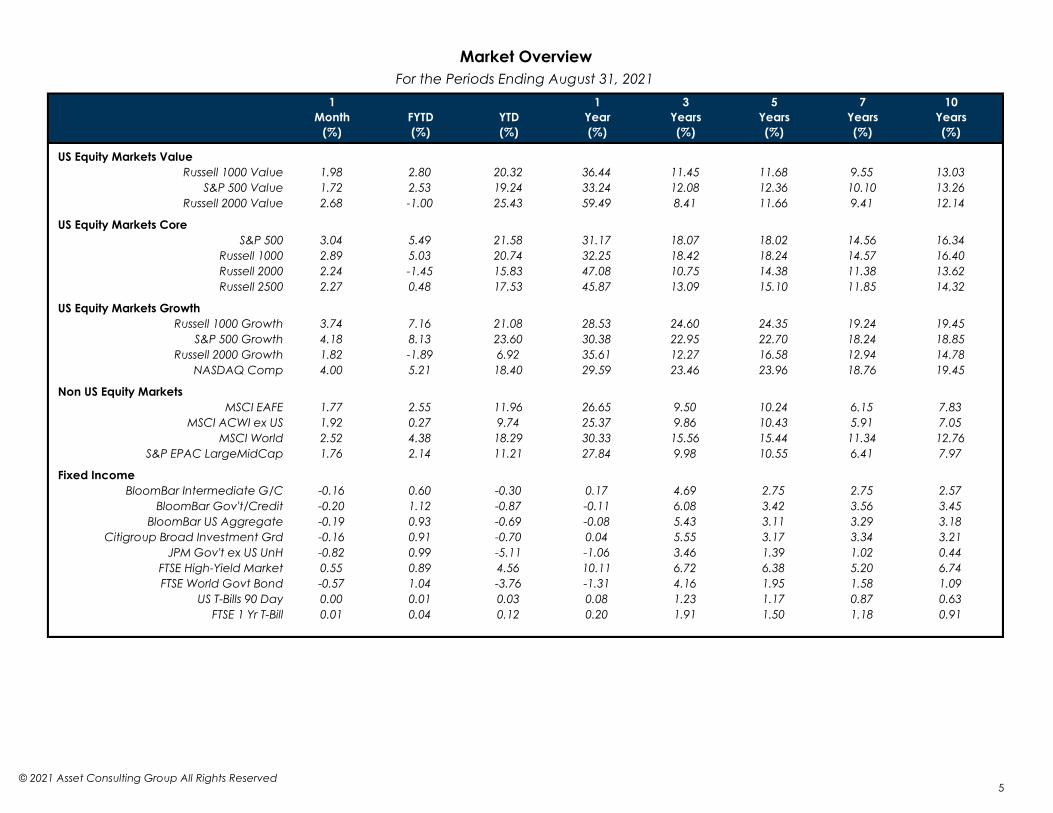
1Month
(%)FYTD(%)
YTD(%)
1Year(%)
3Years(%)
5Years(%)
7Years(%)
10Years(%)
US Equity Markets ValueRussell 1000 Value 1.98 2.80 20.32 36.44 11.45 11.68 9.55 13.03
S&P 500 Value 1.72 2.53 19.24 33.24 12.08 12.36 10.10 13.26Russell 2000 Value 2.68 -1.00 25.43 59.49 8.41 11.66 9.41 12.14
US Equity Markets CoreS&P 500 3.04 5.49 21.58 31.17 18.07 18.02 14.56 16.34
Russell 1000 2.89 5.03 20.74 32.25 18.42 18.24 14.57 16.40Russell 2000 2.24 -1.45 15.83 47.08 10.75 14.38 11.38 13.62Russell 2500 2.27 0.48 17.53 45.87 13.09 15.10 11.85 14.32
US Equity Markets GrowthRussell 1000 Growth 3.74 7.16 21.08 28.53 24.60 24.35 19.24 19.45
S&P 500 Growth 4.18 8.13 23.60 30.38 22.95 22.70 18.24 18.85Russell 2000 Growth 1.82 -1.89 6.92 35.61 12.27 16.58 12.94 14.78
NASDAQ Comp 4.00 5.21 18.40 29.59 23.46 23.96 18.76 19.45
Non US Equity MarketsMSCI EAFE 1.77 2.55 11.96 26.65 9.50 10.24 6.15 7.83
MSCI ACWI ex US 1.92 0.27 9.74 25.37 9.86 10.43 5.91 7.05MSCI World 2.52 4.38 18.29 30.33 15.56 15.44 11.34 12.76
S&P EPAC LargeMidCap 1.76 2.14 11.21 27.84 9.98 10.55 6.41 7.97
Fixed IncomeBloomBar Intermediate G/C -0.16 0.60 -0.30 0.17 4.69 2.75 2.75 2.57
BloomBar Gov't/Credit -0.20 1.12 -0.87 -0.11 6.08 3.42 3.56 3.45BloomBar US Aggregate -0.19 0.93 -0.69 -0.08 5.43 3.11 3.29 3.18
Citigroup Broad Investment Grd -0.16 0.91 -0.70 0.04 5.55 3.17 3.34 3.21JPM Gov't ex US UnH -0.82 0.99 -5.11 -1.06 3.46 1.39 1.02 0.44
FTSE High-Yield Market 0.55 0.89 4.56 10.11 6.72 6.38 5.20 6.74FTSE World Govt Bond -0.57 1.04 -3.76 -1.31 4.16 1.95 1.58 1.09
US T-Bills 90 Day 0.00 0.01 0.03 0.08 1.23 1.17 0.87 0.63FTSE 1 Yr T-Bill 0.01 0.04 0.12 0.20 1.91 1.50 1.18 0.91
Market OverviewFor the Periods Ending August 31, 2021
© 2021 Asset Consulting Group All Rights Reserved5

This report was prepared by ACG using information from sources that may include the following: client’s custodian(s); client’s investment manager(s); ACG Investment Manager Database and Client ReportingTool; third party data vendors; and other outside sources as may be directed by the client. Index Characteristics utilized in this report are obtained from third party data providers and may be different than indexcharacteristics reported by investment managers/funds due to varied calculation methodologies and data sources. Although the information presented herein has been obtained from and is based uponsources ACG believes to be reliable, no representation or warranty, express or implied, is made as to the accuracy or completeness of that information. Accordingly, ACG does not itself endorse or guarantee,and does not itself assume liability whatsoever for, the accuracy or reliability of any third party data or the financial information contained herein.
The information presented herein is for informational purposes only and is not intended as an offer to sell or the solicitation of an offer to purchase a security.
This report is provided as a management tool for the client’s internal use only. Information contained in this report does not constitute a recommendation by ACG.
This report may contain confidential or proprietary information and may not be copied or redistributed to any party not legally entitled to receive it.
Past performance is not indicative of future results. Any comparison to an index is for comparative purposes only. An investment cannot be made directly into an index. Indices are unmanaged and do notreflect the deduction of advisory fees.
This report is distributed with the understanding that it is not rendering accounting, legal or tax advice. Please consult your legal or tax advisor concerning such matters. No assurance can be given that theinvestment objectives described herein will be achieved and investment results may vary substantially on a quarterly, annual or other periodic basis. There is no representation or warranty as to the currentaccuracy of, nor liability for, decisions based on such information.
© 2021 Asset Consulting Group. All Rights Reserved. Asset Consulting Group is the sole owner of all rights, title, and interest to the materials, methodologies, techniques, and processes set forth herein, including any and all intellectual property rights. No part of this document may be reproduced, stored, or transmitted by any means without the express written consent of Asset Consulting Group.
Disclosures and Legal Notice
6
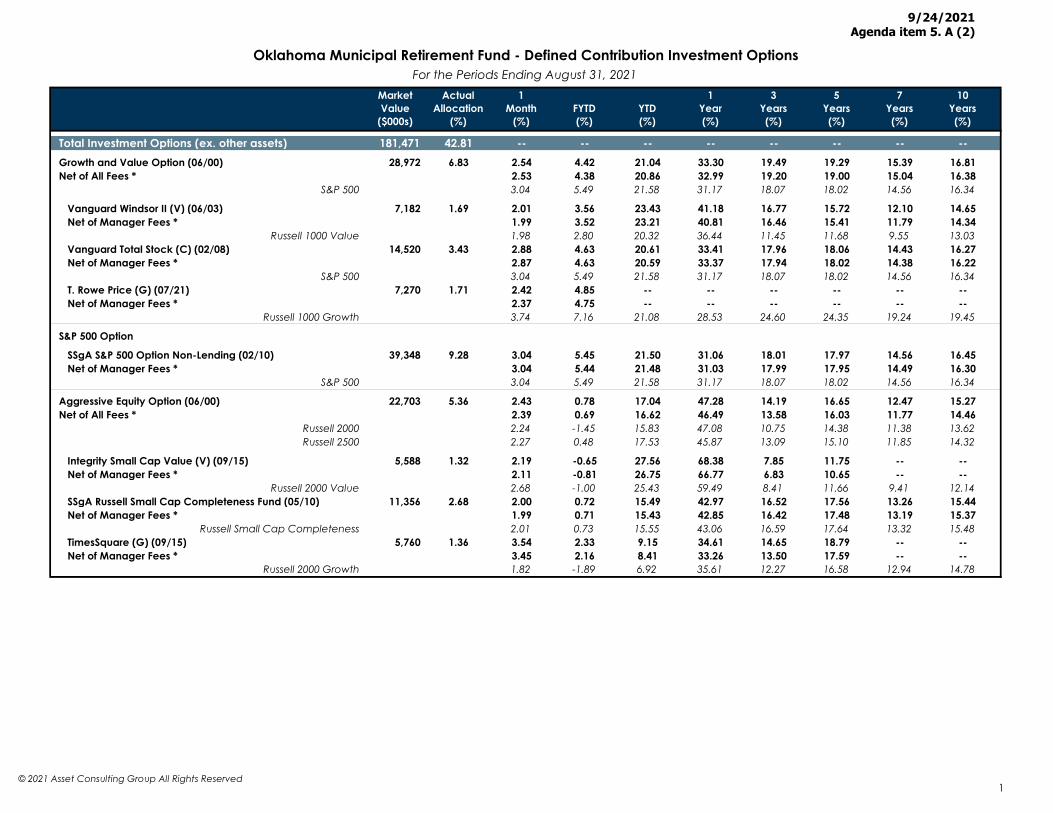
MarketValue
($000s)
ActualAllocation
(%)
1Month
(%)FYTD(%)
YTD(%)
1Year(%)
3Years(%)
5Years(%)
7Years(%)
10Years(%)
Total Investment Options (ex. other assets) 181,471 42.81 -- -- -- -- -- -- -- --Growth and Value Option (06/00) 28,972 6.83 2.54 4.42 21.04 33.30 19.49 19.29 15.39 16.81Net of All Fees * 2.53 4.38 20.86 32.99 19.20 19.00 15.04 16.38
S&P 500 3.04 5.49 21.58 31.17 18.07 18.02 14.56 16.34
Vanguard Windsor II (V) (06/03) 7,182 1.69 2.01 3.56 23.43 41.18 16.77 15.72 12.10 14.65 Net of Manager Fees * 1.99 3.52 23.21 40.81 16.46 15.41 11.79 14.34
Russell 1000 Value 1.98 2.80 20.32 36.44 11.45 11.68 9.55 13.03 Vanguard Total Stock (C) (02/08) 14,520 3.43 2.88 4.63 20.61 33.41 17.96 18.06 14.43 16.27 Net of Manager Fees * 2.87 4.63 20.59 33.37 17.94 18.02 14.38 16.22
S&P 500 3.04 5.49 21.58 31.17 18.07 18.02 14.56 16.34T. Rowe Price (G) (07/21) 7,270 1.71 2.42 4.85 -- -- -- -- -- --Net of Manager Fees * 2.37 4.75 -- -- -- -- -- --
Russell 1000 Growth 3.74 7.16 21.08 28.53 24.60 24.35 19.24 19.45
S&P 500 Option
SSgA S&P 500 Option Non-Lending (02/10) 39,348 9.28 3.04 5.45 21.50 31.06 18.01 17.97 14.56 16.45 Net of Manager Fees * 3.04 5.44 21.48 31.03 17.99 17.95 14.49 16.30
S&P 500 3.04 5.49 21.58 31.17 18.07 18.02 14.56 16.34
Aggressive Equity Option (06/00) 22,703 5.36 2.43 0.78 17.04 47.28 14.19 16.65 12.47 15.27Net of All Fees * 2.39 0.69 16.62 46.49 13.58 16.03 11.77 14.46
Russell 2000 2.24 -1.45 15.83 47.08 10.75 14.38 11.38 13.62Russell 2500 2.27 0.48 17.53 45.87 13.09 15.10 11.85 14.32
Integrity Small Cap Value (V) (09/15) 5,588 1.32 2.19 -0.65 27.56 68.38 7.85 11.75 -- -- Net of Manager Fees * 2.11 -0.81 26.75 66.77 6.83 10.65 -- --
Russell 2000 Value 2.68 -1.00 25.43 59.49 8.41 11.66 9.41 12.14 SSgA Russell Small Cap Completeness Fund (05/10) 11,356 2.68 2.00 0.72 15.49 42.97 16.52 17.56 13.26 15.44 Net of Manager Fees * 1.99 0.71 15.43 42.85 16.42 17.48 13.19 15.37
Russell Small Cap Completeness 2.01 0.73 15.55 43.06 16.59 17.64 13.32 15.48 TimesSquare (G) (09/15) 5,760 1.36 3.54 2.33 9.15 34.61 14.65 18.79 -- -- Net of Manager Fees * 3.45 2.16 8.41 33.26 13.50 17.59 -- --
Russell 2000 Growth 1.82 -1.89 6.92 35.61 12.27 16.58 12.94 14.78
Oklahoma Municipal Retirement Fund - Defined Contribution Investment OptionsFor the Periods Ending August 31, 2021
© 2021 Asset Consulting Group All Rights Reserved1
9/24/2021Agenda item 5. A (2)
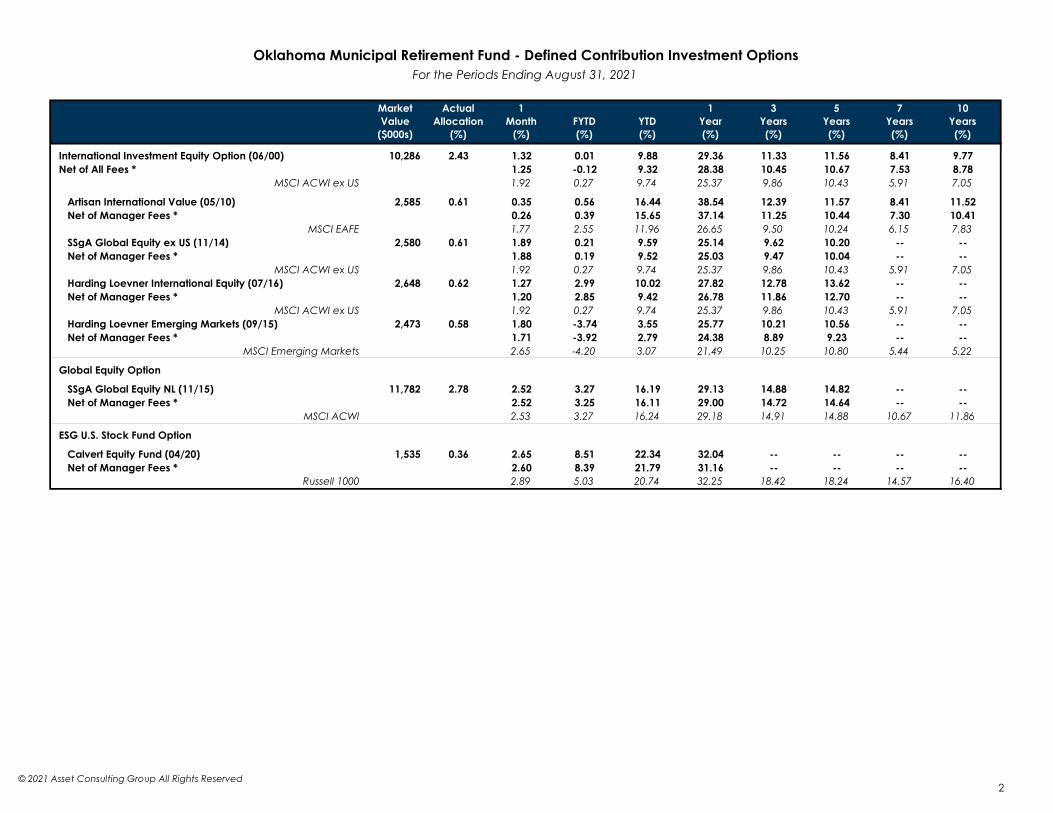
MarketValue
($000s)
ActualAllocation
(%)
1Month
(%)FYTD(%)
YTD(%)
1Year(%)
3Years(%)
5Years(%)
7Years(%)
10Years(%)
International Investment Equity Option (06/00) 10,286 2.43 1.32 0.01 9.88 29.36 11.33 11.56 8.41 9.77Net of All Fees * 1.25 -0.12 9.32 28.38 10.45 10.67 7.53 8.78
MSCI ACWI ex US 1.92 0.27 9.74 25.37 9.86 10.43 5.91 7.05
Artisan International Value (05/10) 2,585 0.61 0.35 0.56 16.44 38.54 12.39 11.57 8.41 11.52 Net of Manager Fees * 0.26 0.39 15.65 37.14 11.25 10.44 7.30 10.41
MSCI EAFE 1.77 2.55 11.96 26.65 9.50 10.24 6.15 7.83 SSgA Global Equity ex US (11/14) 2,580 0.61 1.89 0.21 9.59 25.14 9.62 10.20 -- -- Net of Manager Fees * 1.88 0.19 9.52 25.03 9.47 10.04 -- --
MSCI ACWI ex US 1.92 0.27 9.74 25.37 9.86 10.43 5.91 7.05 Harding Loevner International Equity (07/16) 2,648 0.62 1.27 2.99 10.02 27.82 12.78 13.62 -- -- Net of Manager Fees * 1.20 2.85 9.42 26.78 11.86 12.70 -- --
MSCI ACWI ex US 1.92 0.27 9.74 25.37 9.86 10.43 5.91 7.05 Harding Loevner Emerging Markets (09/15) 2,473 0.58 1.80 -3.74 3.55 25.77 10.21 10.56 -- -- Net of Manager Fees * 1.71 -3.92 2.79 24.38 8.89 9.23 -- --
MSCI Emerging Markets 2.65 -4.20 3.07 21.49 10.25 10.80 5.44 5.22
Global Equity Option
SSgA Global Equity NL (11/15) 11,782 2.78 2.52 3.27 16.19 29.13 14.88 14.82 -- -- Net of Manager Fees * 2.52 3.25 16.11 29.00 14.72 14.64 -- --
MSCI ACWI 2.53 3.27 16.24 29.18 14.91 14.88 10.67 11.86
ESG U.S. Stock Fund Option
Calvert Equity Fund (04/20) 1,535 0.36 2.65 8.51 22.34 32.04 -- -- -- -- Net of Manager Fees * 2.60 8.39 21.79 31.16 -- -- -- --
Russell 1000 2.89 5.03 20.74 32.25 18.42 18.24 14.57 16.40
Oklahoma Municipal Retirement Fund - Defined Contribution Investment OptionsFor the Periods Ending August 31, 2021
© 2021 Asset Consulting Group All Rights Reserved2
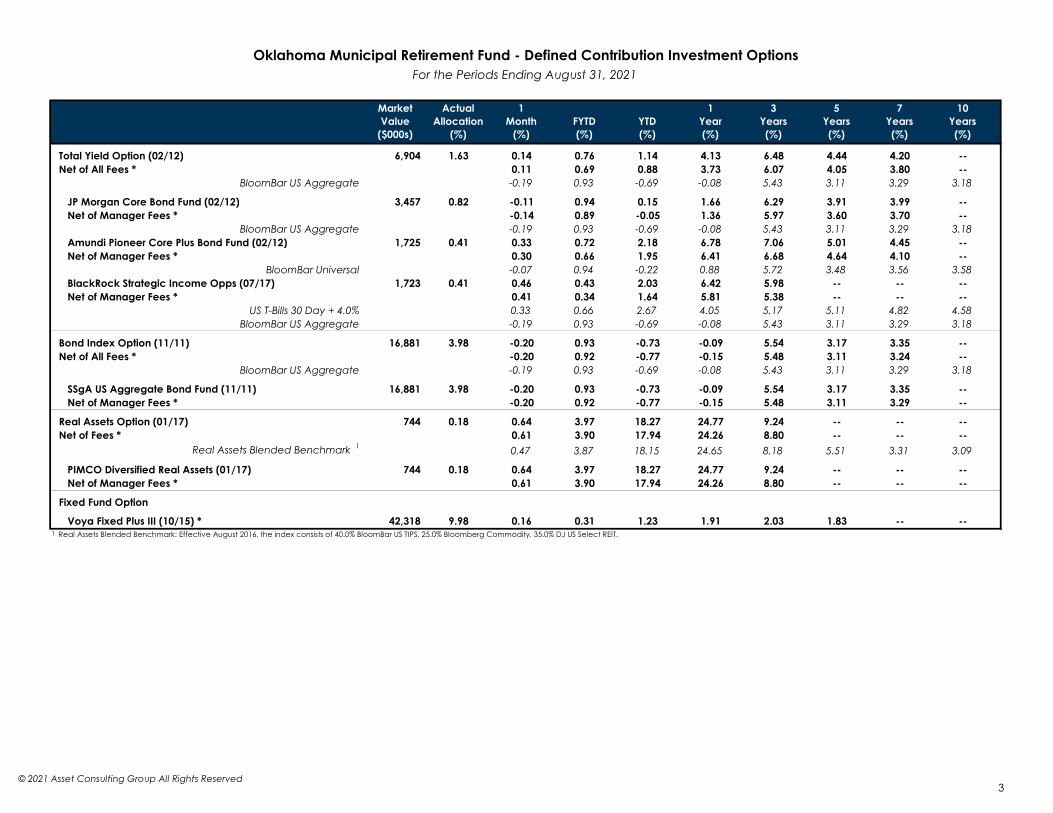
MarketValue
($000s)
ActualAllocation
(%)
1Month
(%)FYTD(%)
YTD(%)
1Year(%)
3Years(%)
5Years(%)
7Years(%)
10Years(%)
Total Yield Option (02/12) 6,904 1.63 0.14 0.76 1.14 4.13 6.48 4.44 4.20 --Net of All Fees * 0.11 0.69 0.88 3.73 6.07 4.05 3.80 --
BloomBar US Aggregate -0.19 0.93 -0.69 -0.08 5.43 3.11 3.29 3.18
JP Morgan Core Bond Fund (02/12) 3,457 0.82 -0.11 0.94 0.15 1.66 6.29 3.91 3.99 -- Net of Manager Fees * -0.14 0.89 -0.05 1.36 5.97 3.60 3.70 --
BloomBar US Aggregate -0.19 0.93 -0.69 -0.08 5.43 3.11 3.29 3.18 Amundi Pioneer Core Plus Bond Fund (02/12) 1,725 0.41 0.33 0.72 2.18 6.78 7.06 5.01 4.45 -- Net of Manager Fees * 0.30 0.66 1.95 6.41 6.68 4.64 4.10 --
BloomBar Universal -0.07 0.94 -0.22 0.88 5.72 3.48 3.56 3.58 BlackRock Strategic Income Opps (07/17) 1,723 0.41 0.46 0.43 2.03 6.42 5.98 -- -- -- Net of Manager Fees * 0.41 0.34 1.64 5.81 5.38 -- -- --
US T-Bills 30 Day + 4.0% 0.33 0.66 2.67 4.05 5.17 5.11 4.82 4.58BloomBar US Aggregate -0.19 0.93 -0.69 -0.08 5.43 3.11 3.29 3.18
Bond Index Option (11/11) 16,881 3.98 -0.20 0.93 -0.73 -0.09 5.54 3.17 3.35 --Net of All Fees * -0.20 0.92 -0.77 -0.15 5.48 3.11 3.24 --
BloomBar US Aggregate -0.19 0.93 -0.69 -0.08 5.43 3.11 3.29 3.18
SSgA US Aggregate Bond Fund (11/11) 16,881 3.98 -0.20 0.93 -0.73 -0.09 5.54 3.17 3.35 -- Net of Manager Fees * -0.20 0.92 -0.77 -0.15 5.48 3.11 3.29 --
Real Assets Option (01/17) 744 0.18 0.64 3.97 18.27 24.77 9.24 -- -- --Net of Fees * 0.61 3.90 17.94 24.26 8.80 -- -- --
Real Assets Blended Benchmark 1 0.47 3.87 18.15 24.65 8.18 5.51 3.31 3.09
PIMCO Diversified Real Assets (01/17) 744 0.18 0.64 3.97 18.27 24.77 9.24 -- -- -- Net of Manager Fees * 0.61 3.90 17.94 24.26 8.80 -- -- --
Fixed Fund Option
Voya Fixed Plus III (10/15) * 42,318 9.98 0.16 0.31 1.23 1.91 2.03 1.83 -- --1
For the Periods Ending August 31, 2021Oklahoma Municipal Retirement Fund - Defined Contribution Investment Options
Real Assets Blended Benchmark: Effective August 2016, the index consists of 40.0% BloomBar US TIPS, 25.0% Bloomberg Commodity, 35.0% DJ US Select REIT.
© 2021 Asset Consulting Group All Rights Reserved3
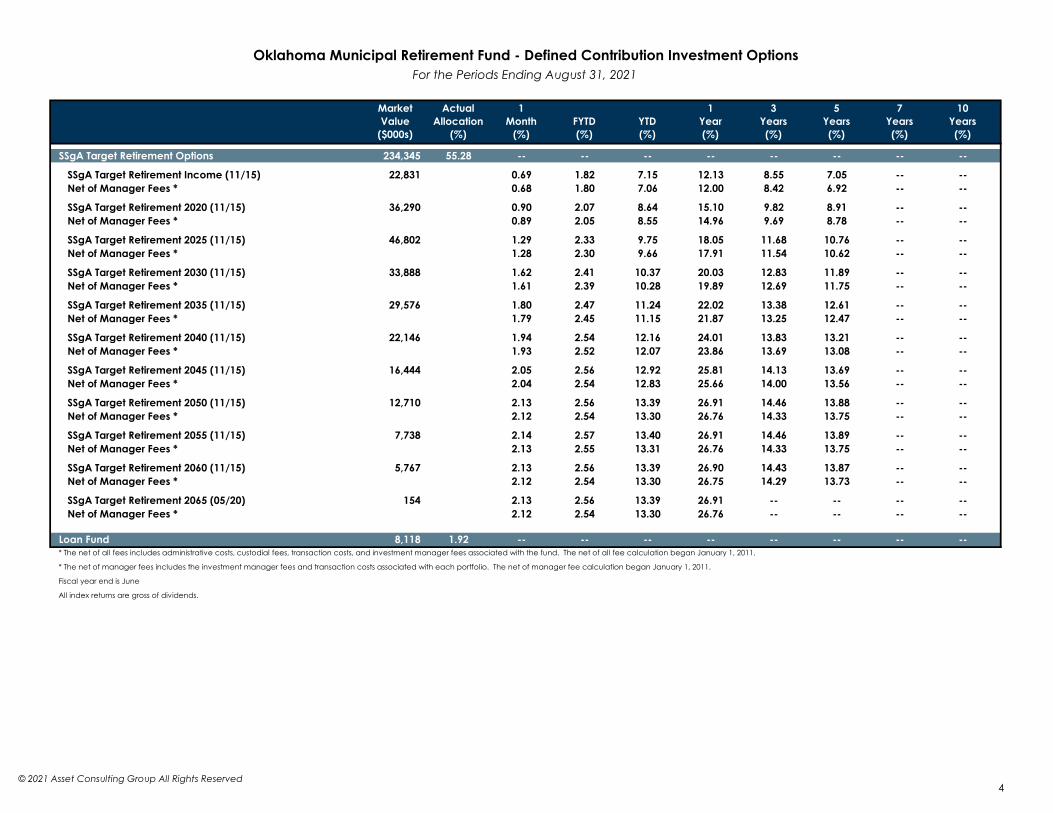
MarketValue
($000s)
ActualAllocation
(%)
1Month
(%)FYTD(%)
YTD(%)
1Year(%)
3Years(%)
5Years(%)
7Years(%)
10Years(%)
SSgA Target Retirement Options 234,345 55.28 -- -- -- -- -- -- -- --
SSgA Target Retirement Income (11/15) 22,831 0.69 1.82 7.15 12.13 8.55 7.05 -- -- Net of Manager Fees * 0.68 1.80 7.06 12.00 8.42 6.92 -- --
SSgA Target Retirement 2020 (11/15) 36,290 0.90 2.07 8.64 15.10 9.82 8.91 -- -- Net of Manager Fees * 0.89 2.05 8.55 14.96 9.69 8.78 -- --
SSgA Target Retirement 2025 (11/15) 46,802 1.29 2.33 9.75 18.05 11.68 10.76 -- -- Net of Manager Fees * 1.28 2.30 9.66 17.91 11.54 10.62 -- --
SSgA Target Retirement 2030 (11/15) 33,888 1.62 2.41 10.37 20.03 12.83 11.89 -- -- Net of Manager Fees * 1.61 2.39 10.28 19.89 12.69 11.75 -- --
SSgA Target Retirement 2035 (11/15) 29,576 1.80 2.47 11.24 22.02 13.38 12.61 -- -- Net of Manager Fees * 1.79 2.45 11.15 21.87 13.25 12.47 -- --
SSgA Target Retirement 2040 (11/15) 22,146 1.94 2.54 12.16 24.01 13.83 13.21 -- -- Net of Manager Fees * 1.93 2.52 12.07 23.86 13.69 13.08 -- --
SSgA Target Retirement 2045 (11/15) 16,444 2.05 2.56 12.92 25.81 14.13 13.69 -- -- Net of Manager Fees * 2.04 2.54 12.83 25.66 14.00 13.56 -- --
SSgA Target Retirement 2050 (11/15) 12,710 2.13 2.56 13.39 26.91 14.46 13.88 -- -- Net of Manager Fees * 2.12 2.54 13.30 26.76 14.33 13.75 -- --
SSgA Target Retirement 2055 (11/15) 7,738 2.14 2.57 13.40 26.91 14.46 13.89 -- -- Net of Manager Fees * 2.13 2.55 13.31 26.76 14.33 13.75 -- --
SSgA Target Retirement 2060 (11/15) 5,767 2.13 2.56 13.39 26.90 14.43 13.87 -- -- Net of Manager Fees * 2.12 2.54 13.30 26.75 14.29 13.73 -- --
SSgA Target Retirement 2065 (05/20) 154 2.13 2.56 13.39 26.91 -- -- -- -- Net of Manager Fees * 2.12 2.54 13.30 26.76 -- -- -- --
Loan Fund 8,118 1.92 -- -- -- -- -- -- -- --
All index returns are gross of dividends.
Oklahoma Municipal Retirement Fund - Defined Contribution Investment OptionsFor the Periods Ending August 31, 2021
* The net of all fees includes administrative costs, custodial fees, transaction costs, and investment manager fees associated with the fund. The net of all fee calculation began January 1, 2011.
* The net of manager fees includes the investment manager fees and transaction costs associated with each portfolio. The net of manager fee calculation began January 1, 2011.
Fiscal year end is June
© 2021 Asset Consulting Group All Rights Reserved4
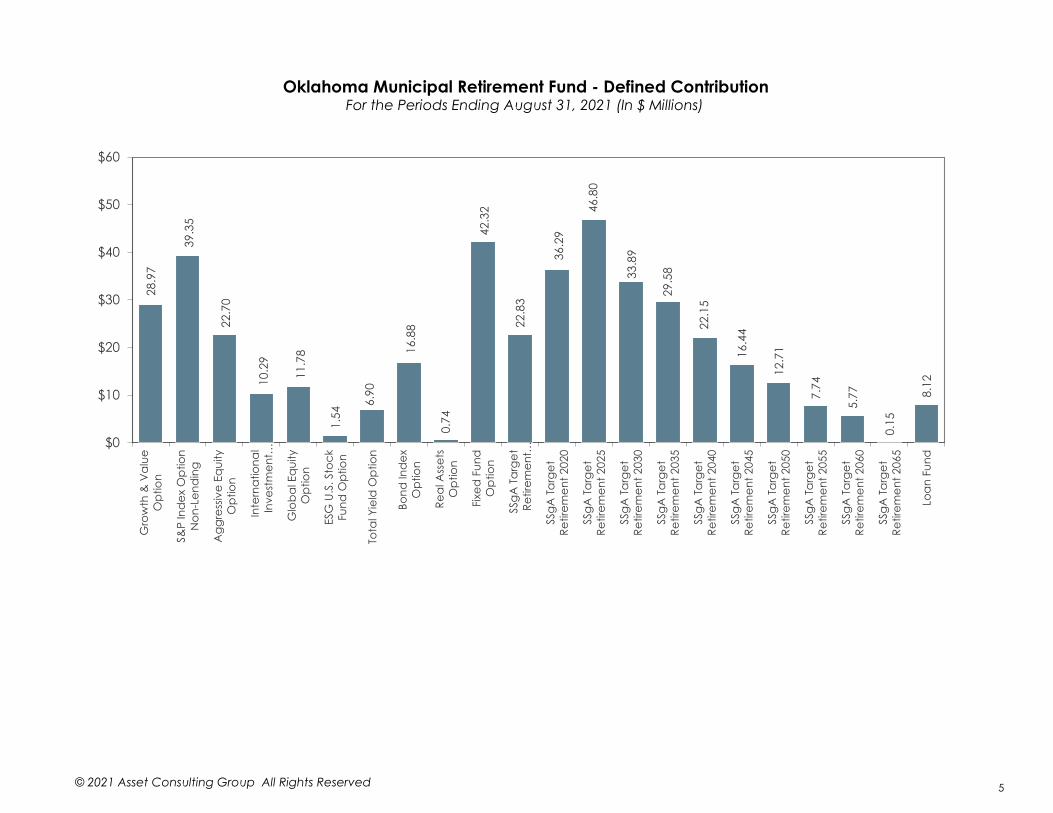
Oklahoma Municipal Retirement Fund - Defined ContributionFor the Periods Ending August 31, 2021 (In $ Millions)
28.9
7
39.3
5
22.7
0
10.2
9
11.7
8
1.54
6.90
16.8
8
0.74
42.3
2
22.8
3
36.2
9
46.8
0
33.8
9
29.5
8
22.1
5
16.4
4
12.7
1
7.74
5.77
0.15
8.12
$0
$10
$20
$30
$40
$50
$60G
row
th &
Va
lue
Op
tion
S&P
Ind
ex O
ptio
nN
on-L
end
ing
Agg
ress
ive
Equi
tyO
ptio
n
Inte
rna
tiona
lIn
vest
men
t…
Glo
ba
l Eq
uity
Op
tion
ESG
U.S
. Sto
ckFu
nd O
ptio
n
Tota
l Yie
ld O
ptio
n
Bond
Ind
exO
ptio
n
Rea
l Ass
ets
Op
tion
Fixe
d F
und
Op
tion
SSgA
Ta
rget
Retir
emen
t…
SSgA
Ta
rget
Retir
emen
t 202
0
SSgA
Ta
rget
Retir
emen
t 202
5
SSgA
Ta
rget
Retir
emen
t 203
0
SSgA
Ta
rget
Retir
emen
t 203
5
SSgA
Ta
rget
Retir
emen
t 204
0
SSgA
Ta
rget
Retir
emen
t 204
5
SSgA
Ta
rget
Retir
emen
t 205
0
SSgA
Ta
rget
Retir
emen
t 205
5
SSgA
Ta
rget
Retir
emen
t 206
0
SSgA
Ta
rget
Retir
emen
t 206
5
Loa
n Fu
nd
© 2021 Asset Consulting Group All Rights Reserved 5

1Month
(%)FYTD(%)
YTD(%)
1Year(%)
3Years(%)
5Years(%)
7Years(%)
10Years(%)
US Equity Markets ValueRussell 1000 Value 1.98 2.80 20.32 36.44 11.45 11.68 9.55 13.03
S&P 500 Value 1.72 2.53 19.24 33.24 12.08 12.36 10.10 13.26Russell 2000 Value 2.68 -1.00 25.43 59.49 8.41 11.66 9.41 12.14
US Equity Markets CoreS&P 500 3.04 5.49 21.58 31.17 18.07 18.02 14.56 16.34
Russell 1000 2.89 5.03 20.74 32.25 18.42 18.24 14.57 16.40Russell 2000 2.24 -1.45 15.83 47.08 10.75 14.38 11.38 13.62Russell 2500 2.27 0.48 17.53 45.87 13.09 15.10 11.85 14.32
US Equity Markets GrowthRussell 1000 Growth 3.74 7.16 21.08 28.53 24.60 24.35 19.24 19.45
S&P 500 Growth 4.18 8.13 23.60 30.38 22.95 22.70 18.24 18.85Russell 2000 Growth 1.82 -1.89 6.92 35.61 12.27 16.58 12.94 14.78
NASDAQ Comp 4.00 5.21 18.40 29.59 23.46 23.96 18.76 19.45
Non US Equity MarketsMSCI EAFE 1.77 2.55 11.96 26.65 9.50 10.24 6.15 7.83
MSCI ACWI ex US 1.92 0.27 9.74 25.37 9.86 10.43 5.91 7.05MSCI World 2.52 4.38 18.29 30.33 15.56 15.44 11.34 12.76
S&P EPAC LargeMidCap 1.76 2.14 11.21 27.84 9.98 10.55 6.41 7.97
Fixed IncomeBloomBar Intermediate G/C -0.16 0.60 -0.30 0.17 4.69 2.75 2.75 2.57
BloomBar Gov't/Credit -0.20 1.12 -0.87 -0.11 6.08 3.42 3.56 3.45BloomBar US Aggregate -0.19 0.93 -0.69 -0.08 5.43 3.11 3.29 3.18
Citigroup Broad Investment Grd -0.16 0.91 -0.70 0.04 5.55 3.17 3.34 3.21JPM Gov't ex US UnH -0.82 0.99 -5.11 -1.06 3.46 1.39 1.02 0.44
FTSE High-Yield Market 0.55 0.89 4.56 10.11 6.72 6.38 5.20 6.74FTSE World Govt Bond -0.57 1.04 -3.76 -1.31 4.16 1.95 1.58 1.09
US T-Bills 90 Day 0.00 0.01 0.03 0.08 1.23 1.17 0.87 0.63FTSE 1 Yr T-Bill 0.01 0.04 0.12 0.20 1.91 1.50 1.18 0.91
Market OverviewFor the Periods Ending August 31, 2021
© 2021 Asset Consulting Group All Rights Reserved6
This report was prepared by ACG using information from sources that may include the following: client’s custodian(s); client’s investment manager(s); ACG Investment Manager Database and Client ReportingTool; third party data vendors; and other outside sources as may be directed by the client. Index Characteristics utilized in this report are obtained from third party data providers and may be different than indexcharacteristics reported by investment managers/funds due to varied calculation methodologies and data sources. Although the information presented herein has been obtained from and is based uponsources ACG believes to be reliable, no representation or warranty, express or implied, is made as to the accuracy or completeness of that information. Accordingly, ACG does not itself endorse or guarantee,and does not itself assume liability whatsoever for, the accuracy or reliability of any third party data or the financial information contained herein.
The information presented herein is for informational purposes only and is not intended as an offer to sell or the solicitation of an offer to purchase a security.
This report is provided as a management tool for the client’s internal use only. Information contained in this report does not constitute a recommendation by ACG.
This report may contain confidential or proprietary information and may not be copied or redistributed to any party not legally entitled to receive it.
Past performance is not indicative of future results. Any comparison to an index is for comparative purposes only. An investment cannot be made directly into an index. Indices are unmanaged and do notreflect the deduction of advisory fees.
This report is distributed with the understanding that it is not rendering accounting, legal or tax advice. Please consult your legal or tax advisor concerning such matters. No assurance can be given that theinvestment objectives described herein will be achieved and investment results may vary substantially on a quarterly, annual or other periodic basis. There is no representation or warranty as to the currentaccuracy of, nor liability for, decisions based on such information.
© 2021 Asset Consulting Group. All Rights Reserved. Asset Consulting Group is the sole owner of all rights, title, and interest to the materials, methodologies, techniques, and processes set forth herein, including any and all intellectual property rights. No part of this document may be reproduced, stored, or transmitted by any means without the express written consent of Asset Consulting Group.
Disclosures and Legal Notice
7
Oklahoma Municipal Retirement FundReal Assets Discussion
September 24, 2021
231 South Bemiston Avenue ♦ 14th Floor ♦ Saint Louis, Missouri 63105 ♦ www.acgnet.com ♦ 314.862.4848
9/24/2021Agenda item 5. B
We are proud to announce that ACG has again been named a Greenwich Associates QualityLeader – recognized as one of the top consultants in the industry. This award is based on anumber of factors, and a culmination of extensive nationwide interviews with institutionalinvestors. We are grateful to have received this honor for three consecutive years.
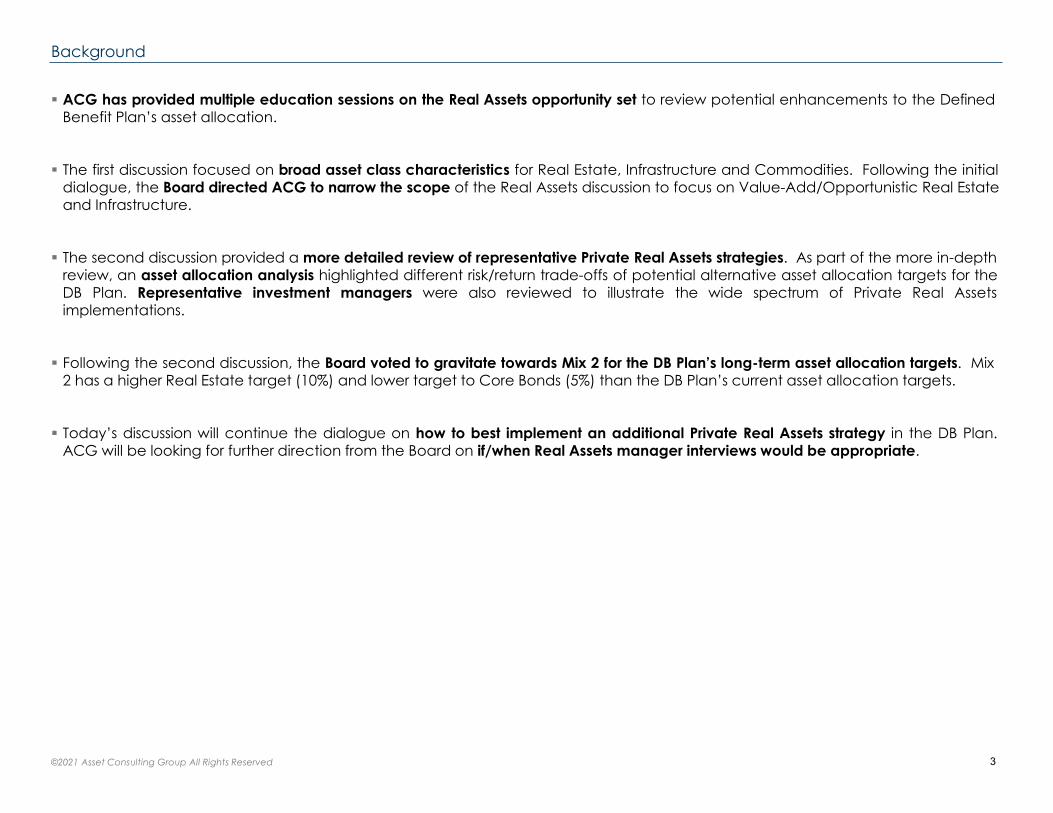
ACG has provided multiple education sessions on the Real Assets opportunity set to review potential enhancements to the DefinedBenefit Plan’s asset allocation.
The first discussion focused on broad asset class characteristics for Real Estate, Infrastructure and Commodities. Following the initialdialogue, the Board directed ACG to narrow the scope of the Real Assets discussion to focus on Value-Add/Opportunistic Real Estateand Infrastructure.
The second discussion provided a more detailed review of representative Private Real Assets strategies. As part of the more in-depthreview, an asset allocation analysis highlighted different risk/return trade-offs of potential alternative asset allocation targets for theDB Plan. Representative investment managers were also reviewed to illustrate the wide spectrum of Private Real Assetsimplementations.
Following the second discussion, the Board voted to gravitate towards Mix 2 for the DB Plan’s long-term asset allocation targets. Mix2 has a higher Real Estate target (10%) and lower target to Core Bonds (5%) than the DB Plan’s current asset allocation targets.
Today’s discussion will continue the dialogue on how to best implement an additional Private Real Assets strategy in the DB Plan.ACG will be looking for further direction from the Board on if/when Real Assets manager interviews would be appropriate.
Background
©2021 Asset Consulting Group All Rights Reserved 3
Oklahoma Municipal Retirement Fund
Asset Allocation Analysis
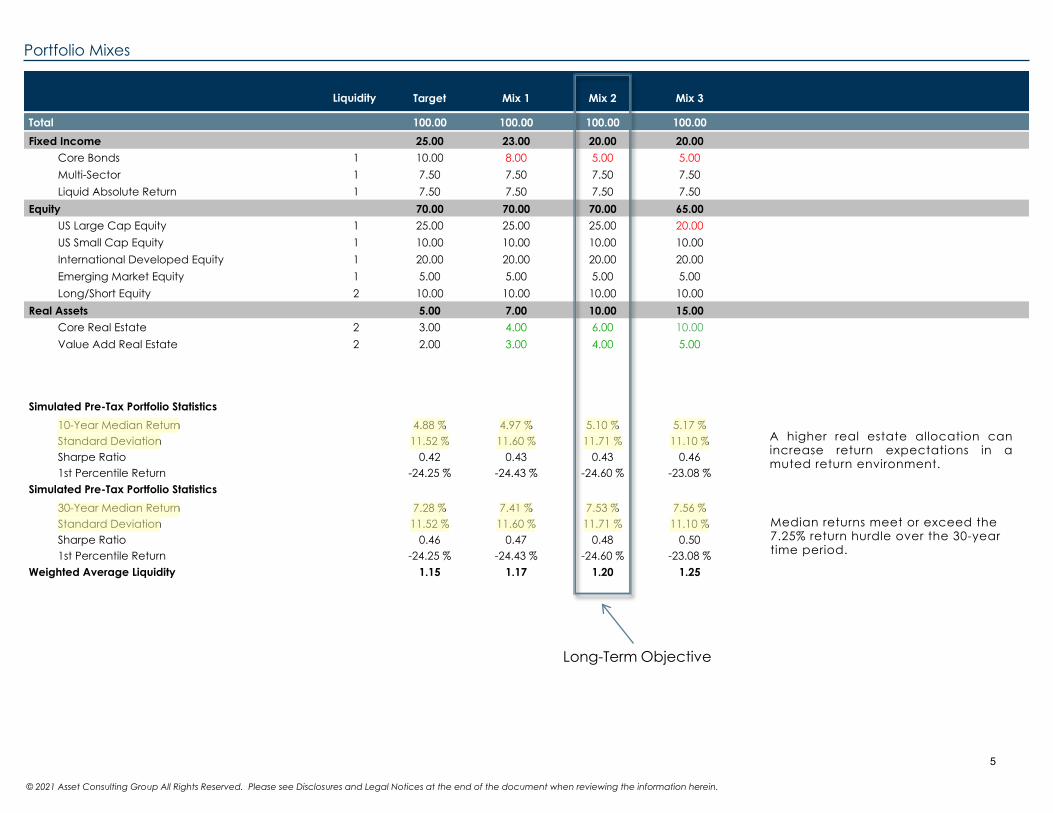
Portfolio Mixes
Mix 3Mix 2Mix 1TargetLiquidity
Total 100.00 100.00 100.00 100.00
Fixed Income 25.00 23.00 20.00 20.00
Core Bonds 10.00 1 8.00 5.00 5.00Multi-Sector 7.50 1 7.50 7.50 7.50Liquid Absolute Return 7.50 1 7.50 7.50 7.50
Equity 70.00 70.00 70.00 65.00
US Large Cap Equity 25.00 1 25.00 25.00 20.00US Small Cap Equity 10.00 1 10.00 10.00 10.00International Developed Equity 20.00 1 20.00 20.00 20.00Emerging Market Equity 5.00 1 5.00 5.00 5.00Long/Short Equity 10.00 2 10.00 10.00 10.00
Real Assets 5.00 7.00 10.00 15.00
Core Real Estate 3.00 2 4.00 6.00 10.00Value Add Real Estate 2.00 2 3.00 4.00 5.00
Simulated Pre-Tax Portfolio Statistics
10-Year Median Return 4.88 % 5.10 % 5.17 %4.97 %Standard Deviation 11.52 % 11.71 % 11.10 %11.60 %Sharpe Ratio 0.42 0.43 0.460.431st Percentile Return -24.25 % -24.60 % -23.08 %-24.43 %
Simulated Pre-Tax Portfolio Statistics
30-Year Median Return 7.28 % 7.53 % 7.56 %7.41 %Standard Deviation 11.52 % 11.71 % 11.10 %11.60 %Sharpe Ratio 0.46 0.48 0.500.471st Percentile Return -24.25 % -24.60 % -23.08 %-24.43 %
Weighted Average Liquidity 1.15 1.20 1.251.17
© 2021 Asset Consulting Group All Rights Reserved. Please see Disclosures and Legal Notices at the end of the document when reviewing the information herein.
A higher real estate allocation can increase return expectations in a muted return environment.
Median returns meet or exceed the 7.25% return hurdle over the 30-year time period.
Long-Term Objective
5
Oklahoma Municipal Retirement Fund
Open-End Private Real Estate & Infrastructure
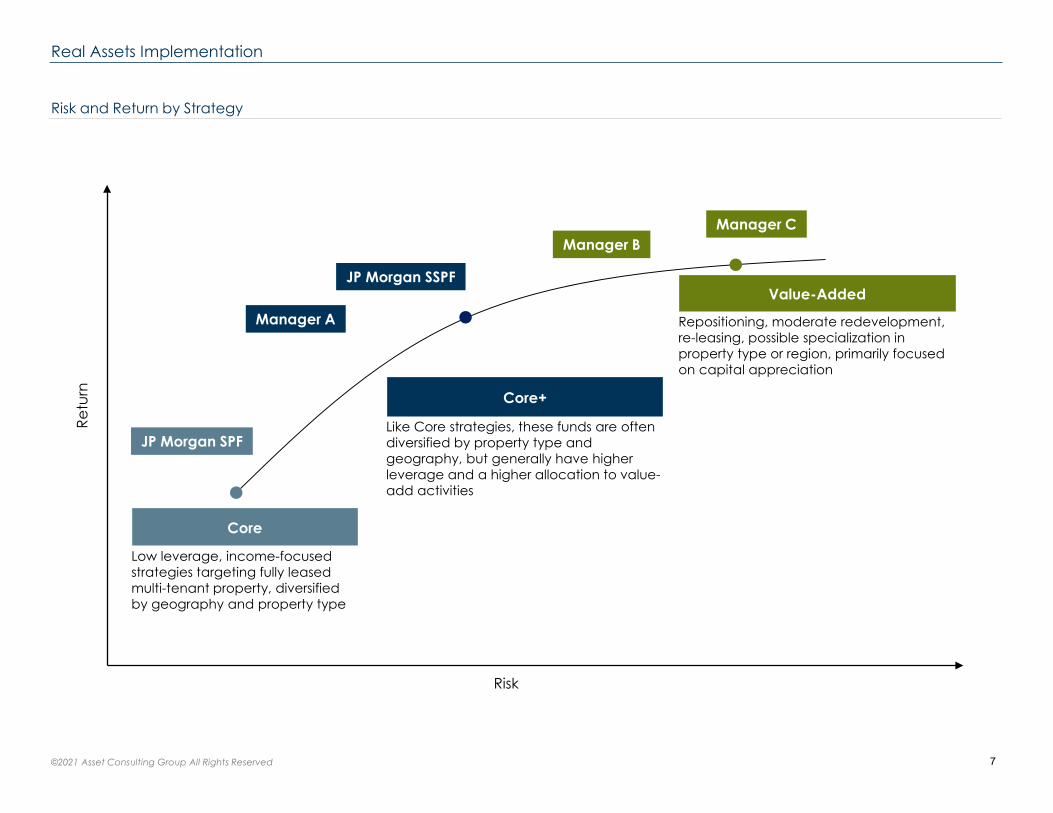
Risk and Return by Strategy
Real Assets Implementation
Value-Added
Repositioning, moderate redevelopment, re-leasing, possible specialization in property type or region, primarily focused on capital appreciation
Core
Low leverage, income-focused strategies targeting fully leased multi-tenant property, diversified by geography and property type
Core+
Like Core strategies, these funds are often diversified by property type and geography, but generally have higher leverage and a higher allocation to value-add activities
Retu
rn
Risk
©2021 Asset Consulting Group All Rights Reserved
Manager A
JP Morgan SPF
JP Morgan SSPF
Manager BManager C
7
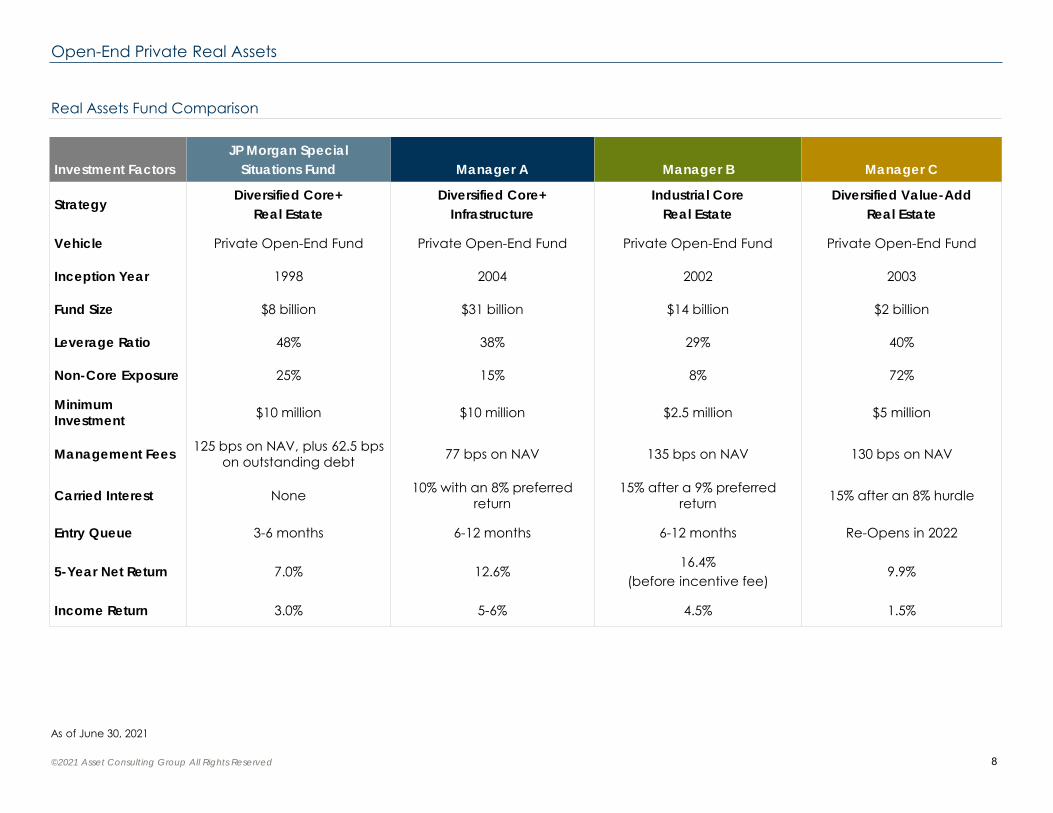
Real Assets Fund Comparison
Open-End Private Real Assets
Investment FactorsJP Morgan Special
Situations Fund Manager A Manager B Manager C
StrategyDiversified Core+
Real EstateDiversified Core+
InfrastructureIndustrial Core
Real EstateDiversified Value-Add
Real Estate
Vehicle Private Open-End Fund Private Open-End Fund Private Open-End Fund Private Open-End Fund
Inception Year 1998 2004 2002 2003
Fund Size $8 billion $31 billion $14 billion $2 billion
Leverage Ratio 48% 38% 29% 40%
Non-Core Exposure 25% 15% 8% 72%
Minimum Investment $10 million $10 million $2.5 million $5 million
Management Fees 125 bps on NAV, plus 62.5 bps on outstanding debt 77 bps on NAV 135 bps on NAV 130 bps on NAV
Carried Interest None 10% with an 8% preferred return
15% after a 9% preferred return 15% after an 8% hurdle
Entry Queue 3-6 months 6-12 months 6-12 months Re-Opens in 2022
5-Year Net Return 7.0% 12.6%16.4%
(before incentive fee)9.9%
Income Return 3.0% 5-6% 4.5% 1.5%
©2021 Asset Consulting Group All Rights Reserved
As of June 30, 2021
8
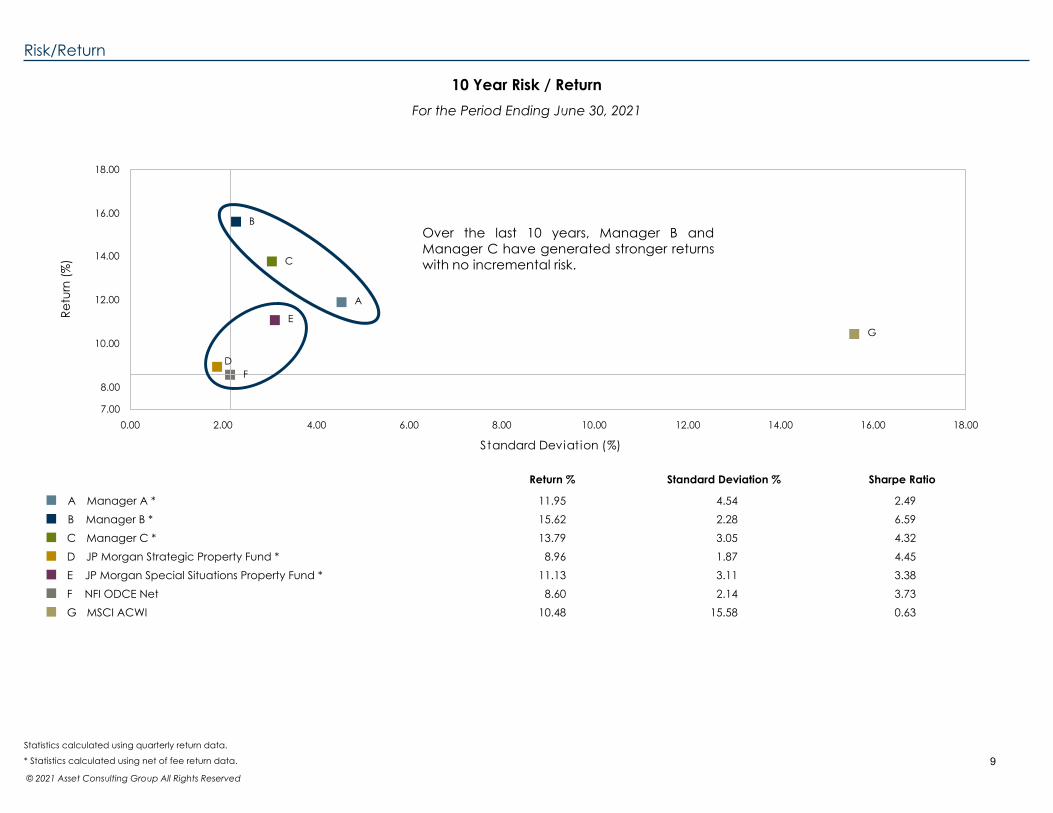
10 Year Risk / Return
Risk/Return
For the Period Ending June 30, 2021
0.00 2.00 4.00 6.00 8.00 10.00 12.00 14.00 16.00 18.007.00
8.00
10.00
12.00
14.00
16.00
18.00
A
B
C
D
E
F
G
Standard Deviation (%)
Retu
rn (%
)
Return % Standard Deviation % Sharpe Ratio
11.95 4.54 2.49 15.62 2.28 6.59 13.79 3.05 4.32
8.96 1.87 4.45 11.13 3.11 3.38
8.60 2.14 3.73 10.48 15.58 0.63
A Manager A * B Manager B *C Manager C *D JP Morgan Strategic Property Fund *E JP Morgan Special Situations Property Fund * F NFI ODCE NetG MSCI ACWI
© 2021 Asset Consulting Group All Rights Reserved
Statistics calculated using quarterly return data.
* Statistics calculated using net of fee return data.
Over the last 10 years, Manager B andManager C have generated stronger returnswith no incremental risk.
9
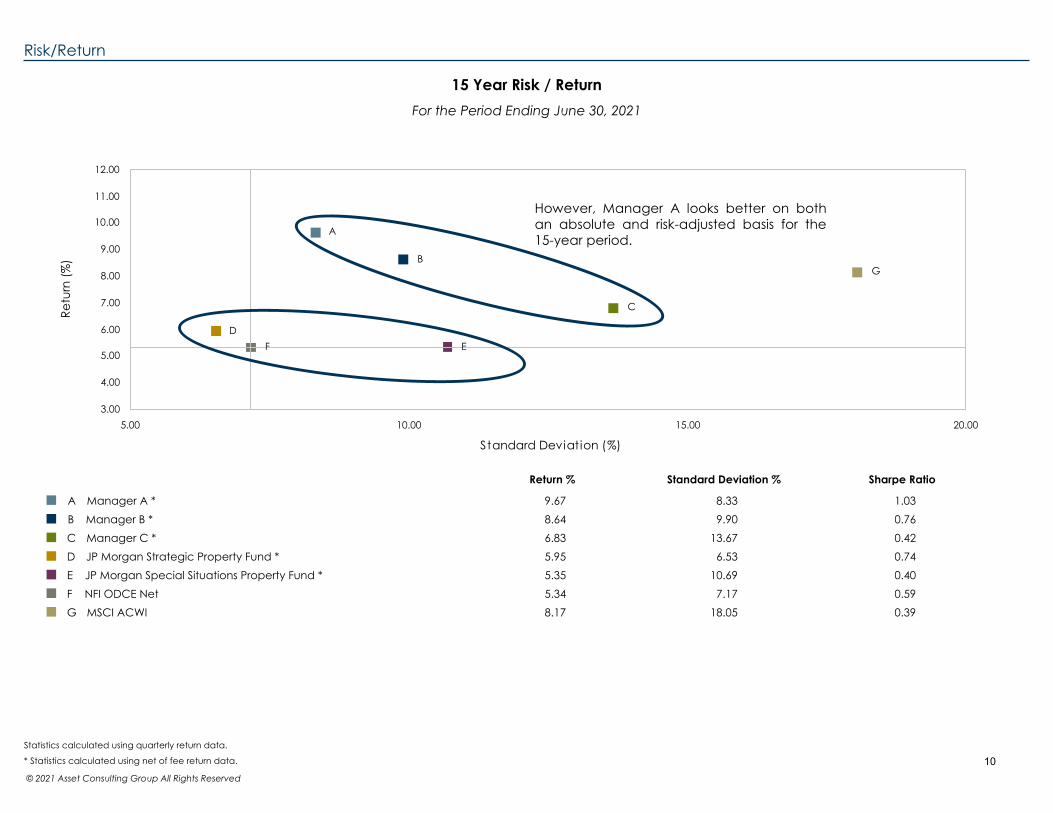
15 Year Risk / Return
Risk/Return
For the Period Ending June 30, 2021
5.00 10.00 15.00 20.003.00
4.00
5.00
6.00
7.00
8.00
9.00
10.00
11.00
12.00
A
B
C
DEF
G
Standard Deviation (%)
Retu
rn (%
)
Return % Standard Deviation % Sharpe Ratio
9.67 8.33 1.03 8.64 9.90 0.76 6.83 13.67 0.42 5.95 6.53 0.74 5.35 10.69 0.40 5.34 7.17 0.59 8.17 18.05 0.39
A Manager A * B Manager B *C Manager C *D JP Morgan Strategic Property Fund *E JP Morgan Special Situations Property Fund * F NFI ODCE NetG MSCI ACWI
© 2021 Asset Consulting Group All Rights Reserved
Statistics calculated using quarterly return data.
* Statistics calculated using net of fee return data.
However, Manager A looks better on bothan absolute and risk-adjusted basis for the15-year period.
10
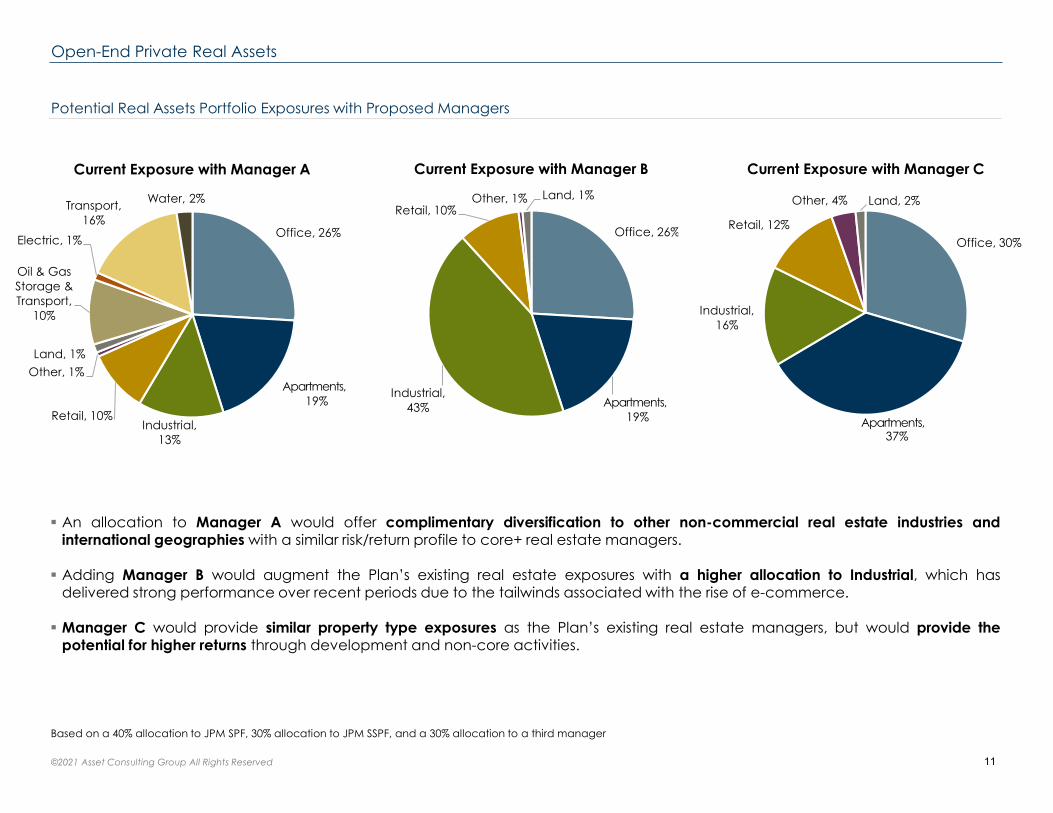
Potential Real Assets Portfolio Exposures with Proposed Managers
©2021 Asset Consulting Group All Rights Reserved
Office, 26%
Apartments,19%
Industrial, 43%
Retail, 10%Other, 1% Land, 1%
Current Exposure with Manager B
Office, 26%
Apartments,19%
Industrial, 13%
Retail, 10%
Other, 1%Land, 1%
Oil & Gas Storage & Transport,
10%
Electric, 1%
Transport, 16%
Water, 2%
Current Exposure with Manager A
Based on a 40% allocation to JPM SPF, 30% allocation to JPM SSPF, and a 30% allocation to a third manager
An allocation to Manager A would offer complimentary diversification to other non-commercial real estate industries andinternational geographies with a similar risk/return profile to core+ real estate managers.
Adding Manager B would augment the Plan’s existing real estate exposures with a higher allocation to Industrial, which hasdelivered strong performance over recent periods due to the tailwinds associated with the rise of e-commerce.
Manager C would provide similar property type exposures as the Plan’s existing real estate managers, but would provide thepotential for higher returns through development and non-core activities.
Office, 30%
Apartments,37%
Industrial, 16%
Retail, 12%
Other, 4% Land, 2%
Current Exposure with Manager C
Open-End Private Real Assets
11
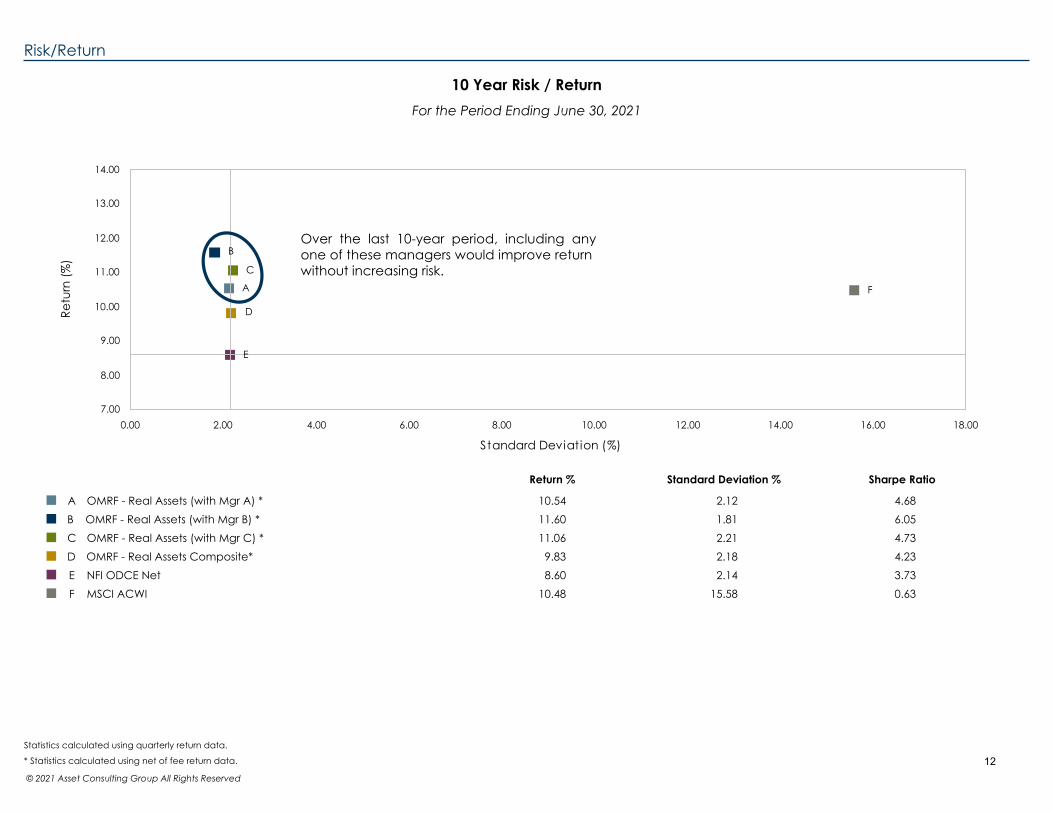
10 Year Risk / Return
Risk/Return
For the Period Ending June 30, 2021
0.00 2.00 4.00 6.00 8.00 10.00 12.00 14.00 16.00 18.007.00
8.00
9.00
10.00
11.00
12.00
13.00
14.00
A
B
C
D
E
F
Standard Deviation (%)
Retu
rn (%
)
Return % Standard Deviation % Sharpe Ratio
10.54 2.12 4.68 11.60 1.81 6.05 11.06 2.21 4.73
9.83 2.18 4.23 8.60 2.14 3.73
10.48 15.58 0.63
A OMRF - Real Assets (with Mgr A) *B OMRF - Real Assets (with Mgr B) * C OMRF - Real Assets (with Mgr C) * D OMRF - Real Assets Composite*E NFI ODCE NetF MSCI ACWI
© 2021 Asset Consulting Group All Rights Reserved
Statistics calculated using quarterly return data.
* Statistics calculated using net of fee return data.
Over the last 10-year period, including any one of these managers would improve return without increasing risk.
12
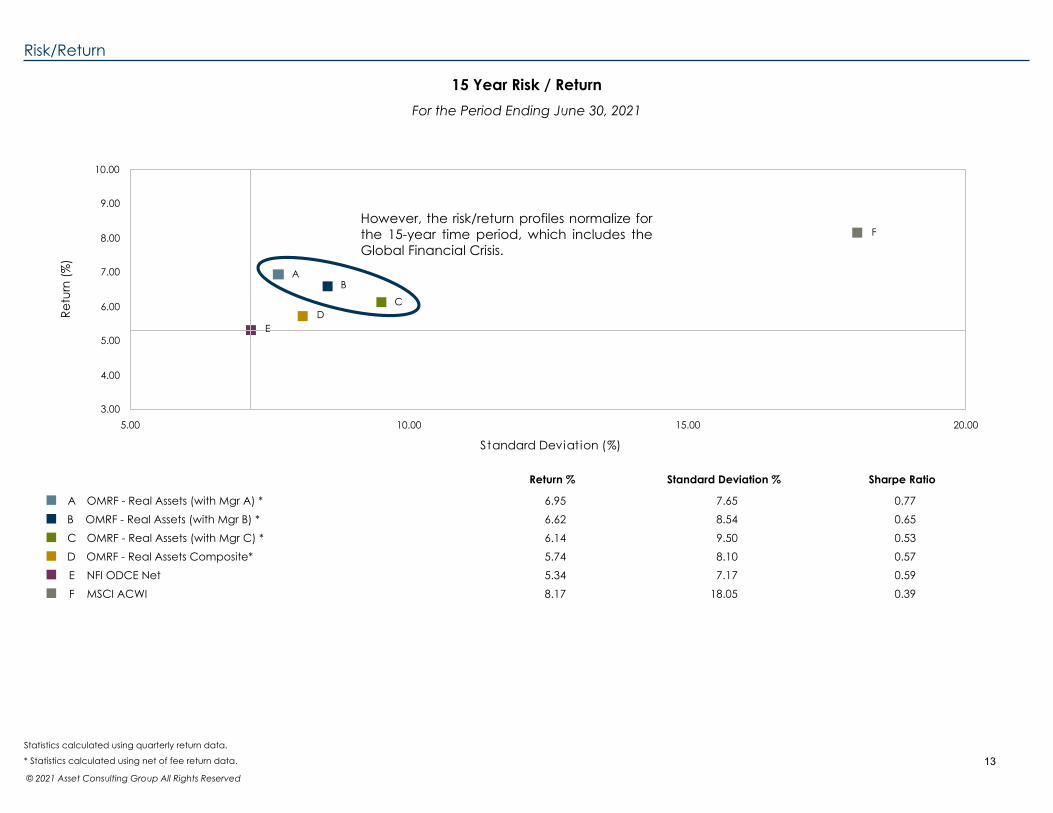
15 Year Risk / Return
Risk/Return
For the Period Ending June 30, 2021
5.00 10.00 15.00 20.003.00
4.00
5.00
6.00
7.00
8.00
9.00
10.00
AB
CD
E
F
Standard Deviation (%)
Retu
rn (%
)
Return % Standard Deviation % Sharpe Ratio
6.95 7.65 0.77 6.62 8.54 0.65 6.14 9.50 0.53 5.74 8.10 0.57 5.34 7.17 0.59 8.17 18.05 0.39
A OMRF - Real Assets (with Mgr A) *B OMRF - Real Assets (with Mgr B) * C OMRF - Real Assets (with Mgr C) * D OMRF - Real Assets Composite*E NFI ODCE NetF MSCI ACWI
© 2021 Asset Consulting Group All Rights Reserved
Statistics calculated using quarterly return data.
* Statistics calculated using net of fee return data.
However, the risk/return profiles normalize forthe 15-year time period, which includes theGlobal Financial Crisis.
13
Oklahoma Municipal Retirement Fund
Appendix
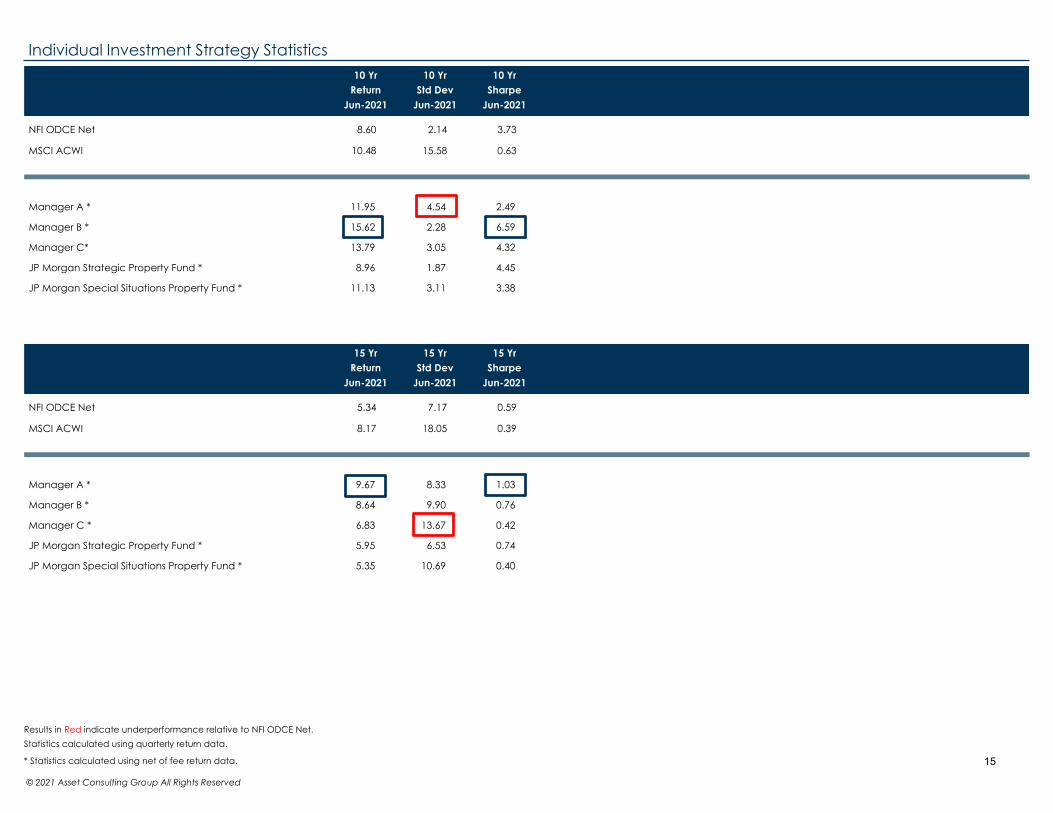
10 Yr
Return
Jun-2021
10 Yr 10 Yr
Std Dev Sharpe
Jun-2021 Jun-2021
8.60 2.14 3.73NFI ODCE Net
10.48 15.58 0.63MSCI ACWI
11.95 4.54 2.49
15.62 2.28 6.59
13.79 3.05 4.32
8.96 1.87 4.45
Manager A *
Manager B *
Manager C*
JP Morgan Strategic Property Fund *
JP Morgan Special Situations Property Fund * 11.13 3.11 3.38
15 Yr
Return
Jun-2021
15 Yr 15 Yr
Std Dev Sharpe
Jun-2021 Jun-2021
5.34 7.17 0.59NFI ODCE Net
8.17 18.05 0.39MSCI ACWI
9.67 8.33 1.03
8.64 9.90 0.76
6.83 13.67 0.42
5.95 6.53 0.74
Manager A *
Manager B *
Manager C *
JP Morgan Strategic Property Fund *
JP Morgan Special Situations Property Fund * 5.35 10.69 0.40
© 2021 Asset Consulting Group All Rights Reserved
Statistics calculated using quarterly return data.
Results in Red indicate underperformance relative to NFI ODCE Net.
* Statistics calculated using net of fee return data.
Individual Investment Strategy Statistics
15
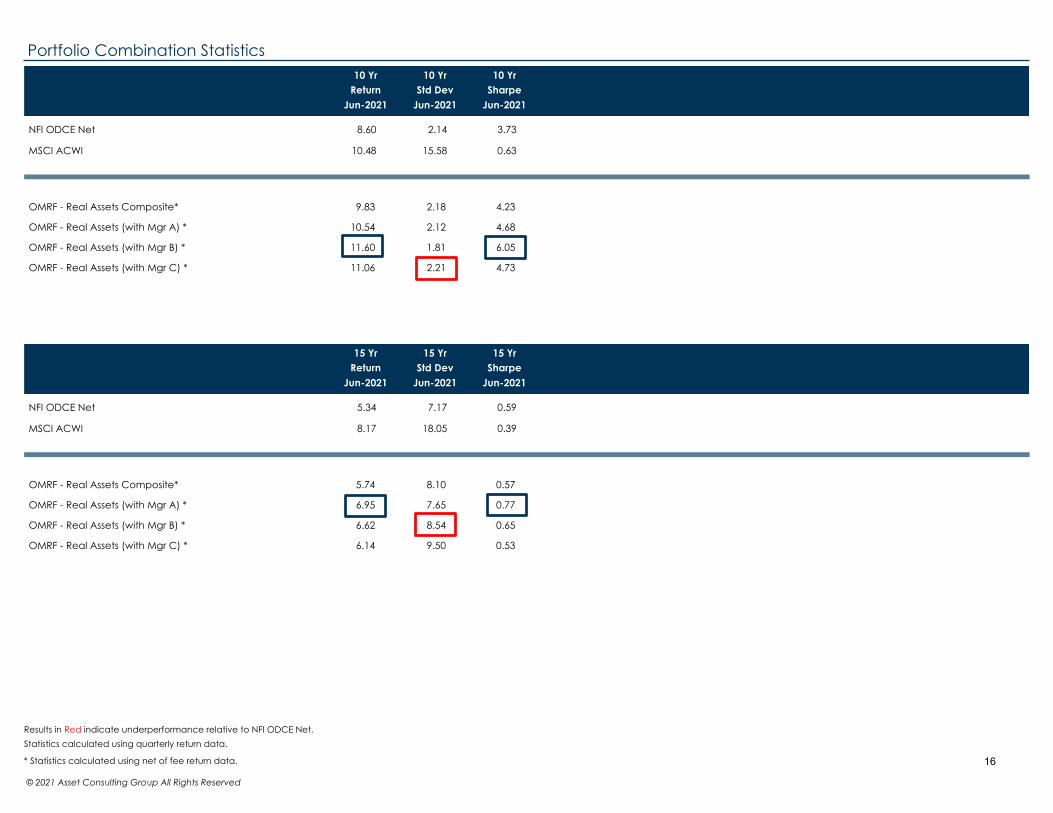
10 Yr
Return
Jun-2021
10 Yr 10 Yr
Std Dev Sharpe
Jun-2021 Jun-2021
8.60 2.14 3.73NFI ODCE Net
10.48 15.58 0.63MSCI ACWI
9.83 2.18 4.23
10.54 2.12 4.68
11.60 1.81 6.05
OMRF - Real Assets Composite*
OMRF - Real Assets (with Mgr A) *
OMRF - Real Assets (with Mgr B) *
OMRF - Real Assets (with Mgr C) * 11.06 2.21 4.73
15 Yr
Return
Jun-2021
15 Yr 15 Yr
Std Dev Sharpe
Jun-2021 Jun-2021
5.34 7.17 0.59NFI ODCE Net
8.17 18.05 0.39MSCI ACWI
5.74 8.10 0.57
6.95 7.65 0.77
6.62 8.54 0.65
OMRF - Real Assets Composite*
OMRF - Real Assets (with Mgr A) *
OMRF - Real Assets (with Mgr B) *
OMRF - Real Assets (with Mgr C) * 6.14 9.50 0.53
© 2021 Asset Consulting Group All Rights Reserved
Statistics calculated using quarterly return data.
Results in Red indicate underperformance relative to NFI ODCE Net.
* Statistics calculated using net of fee return data.
Portfolio Combination Statistics
16
The views expressed herein are those of Asset Consulting Group (ACG). They are subject to change at any time. These views do not necessarily reflect the opinions of any other firm.
This report was prepared by ACG for you at your request. Although the information presented herein has been obtained from and is based upon sources ACG believes to be reliable, no representation orwarranty, express or implied, is made as to the accuracy or completeness of that information. Accordingly, ACG does not itself endorse or guarantee, and does not itself assume liability whatsoever for, theaccuracy or reliability of any third party data or the financial information contained herein.
Certain information herein constitutes forward-looking statements, which can be identified by the use of terms such as “may”, “will”, “expect”, “anticipate”, “project”, “estimate”, or any variations thereof. As aresult of various uncertainties and actual events, including those discussed herein, actual results or performance of a particular investment strategy may differ materially from those reflected or contemplated insuch forward-looking statements. As a result, you should not rely on such forward-looking statements in making investment decisions. ACG has no duty to update or amend such forward-looking statements.
The information presented herein is for informational purposes only and is not intended as an offer to sell or the solicitation of an offer to purchase a security.
Please be aware that there are inherent limitations to all financial models, including Monte Carlo Simulations. Monte Carlo Simulations are a tool used to analyze a range of possible outcomes and assist in makingeducated asset allocation decisions. Monte Carlo Simulations cannot predict the future or eliminate investment risk. The output of the Monte Carlo Simulation is based on ACG’s capital market assumptions thatare derived from proprietary models based upon well-recognized financial principles and reasonable estimates about relevant future market conditions. Capital market assumptions based on other models ordifferent estimates may yield different results. ACG expressly disclaims any responsibility for (i) the accuracy of the simulated probability distributions or the assumptions used in deriving the probability distributions,(ii) any errors or omissions in computing or disseminating the probability distributions and (iii) and any reliance on or uses to which the probability distributions are put.
The projections or other information generated by ACG regarding the likelihood of various investment outcomes are hypothetical in nature, do not reflect actual investment results and are not guarantees offuture results. Judgments and approximations are a necessary and integral part of constructing projected returns. Any estimate of what could have been an investment strategy’s performance is likely to differfrom what the strategy would actually have yielded had it been in existence during the relevant period. The source and use of data and the arithmetic operations used for calculating projected returns may beincorrect, inappropriate, flawed or otherwise deficient.
Past performance is not indicative of future results. Given the inherent volatility of the securities markets, you should not assume that your investments will experience returns comparable to those shown in theanalysis contained in this report. For example, market and economic conditions may change in the future producing materially different results than those shown included in the analysis contained in this report.Any comparison to an index is for comparative purposes only. An investment cannot be made directly into an index. Indices are unmanaged and do not reflect the deduction of advisory fees.
This report is distributed with the understanding that it is not rendering accounting, legal or tax advice. Please consult your legal or tax advisor concerning such matters. No assurance can be given that theinvestment objectives described herein will be achieved and investment results may vary substantially on a quarterly, annual or other periodic basis. There is no representation or warranty as to the currentaccuracy of, nor liability for, decisions based on such information.
© 2021 Asset Consulting Group. All Rights Reserved. Asset Consulting Group is the sole owner of all rights, title, and interest to the materials, methodologies, techniques, and processes set forth herein, includingany and all intellectual property rights. No part of this document may be reproduced, stored, or transmitted by any means without the express written consent of Asset Consulting Group.
Disclosures and Legal Notice
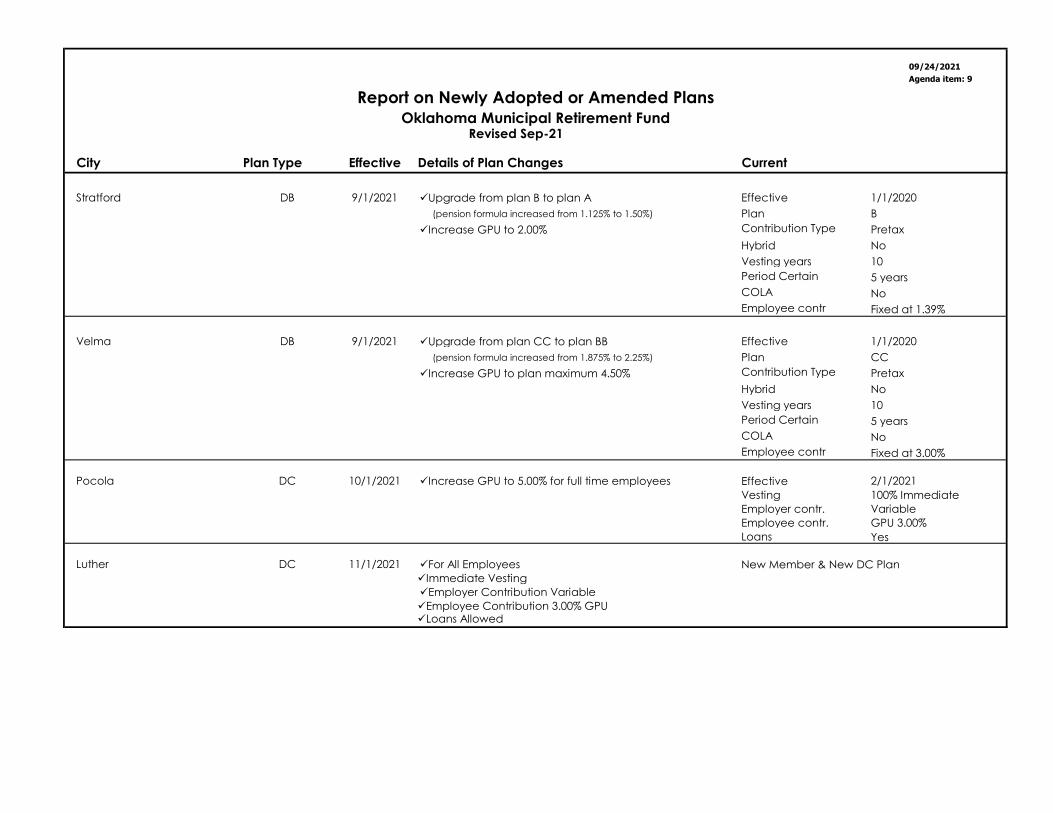
09/24/2021
Agenda item: 9
City Plan Type Current
Stratford DB 9/1/2021 ✓Upgrade from plan B to plan A Effective 1/1/2020
(pension formula increased from 1.125% to 1.50%) Plan B
✓Increase GPU to 2.00% Contribution Type Pretax
Hybrid No
Vesting years 10
Period Certain 5 years
COLA No
Employee contr Fixed at 1.39%
Velma DB 9/1/2021 ✓Upgrade from plan CC to plan BB Effective 1/1/2020
(pension formula increased from 1.875% to 2.25%) Plan CC
✓Increase GPU to plan maximum 4.50% Contribution Type Pretax
Hybrid No
Vesting years 10
Period Certain 5 years
COLA No
Employee contr Fixed at 3.00%
Pocola DC 10/1/2021 ✓Increase GPU to 5.00% for full time employees Effective 2/1/2021
Vesting 100% Immediate
Employer contr. Variable
Employee contr. GPU 3.00%
Loans Yes
Luther DC 11/1/2021 ✓For All Employees New Member & New DC Plan
✓Immediate Vesting
✓Employer Contribution Variable
✓Employee Contribution 3.00% GPU✓Loans Allowed
Report on Newly Adopted or Amended Plans
Oklahoma Municipal Retirement FundRevised Sep-21
Effective Details of Plan Changes