Embed Size (px)
Citation preview
Assessment and further development of amanagement scheme for a UDDT based sanitation system
in Arbieto (Valle Alto de Cochabamba, Bolivia)
Internship Report
(10.02-10.06.2016)
Eva Reynaert
Executive summary
The present report illustrates the importance of adequate planning for the provision ofa sanitation service in a periurban zone of Cochabamba, Bolivia, and presents selectedscenarios how a new service could be implemented in the future.
Context
District 4 of the Municipality of Arbieto (Valle Alto de Cochabamba), located south ofthe Municipality of Cochabamba, has recently experienced a strong population growth as aconsequence of the city’s rapid development attracting migrants from all over the country(Section 3.1). In 2014, an international non-governmental organization (NGO) built 500urine-diverting dry toilets (UDDTs) in seven neighbourhoods (so-called OTBs) of the Dis-trict, along with a composting plant for the faeces. As a result of poor planning, the NGOabandoned the project before a collection service for the faeces and urine was implemented(Section 3.2).
Working methodology
As specific documentation or official information about the zone of interest is inexistent,new data was gathered using semi-structured interviews and surveys. The data collectionwas organized in three steps (Section 3.3):
1. Interviews with the engineers in charge of sanitation in the Municipality of Arbietoand first field visit as a base to develop the questionnaires for the OTB representativesand the households.
2. Interviews with the OTB representatives (Presidents and Water Committees) to getan overview of the water and sanitation situation in the OTBs and refine the householdsurveys.
3. Household surveys to collect information about the current use of the UDDTs and theperception of the water and sanitation situation (108 households that own a UDDT and10 households that don’t), along with a direct observation of the toilets.
i
Executive summary
Evaluation of the current situation
The project area faces serious challenges regarding water provision, solid waste managementand the use of the UDDTs (Section 3.4).
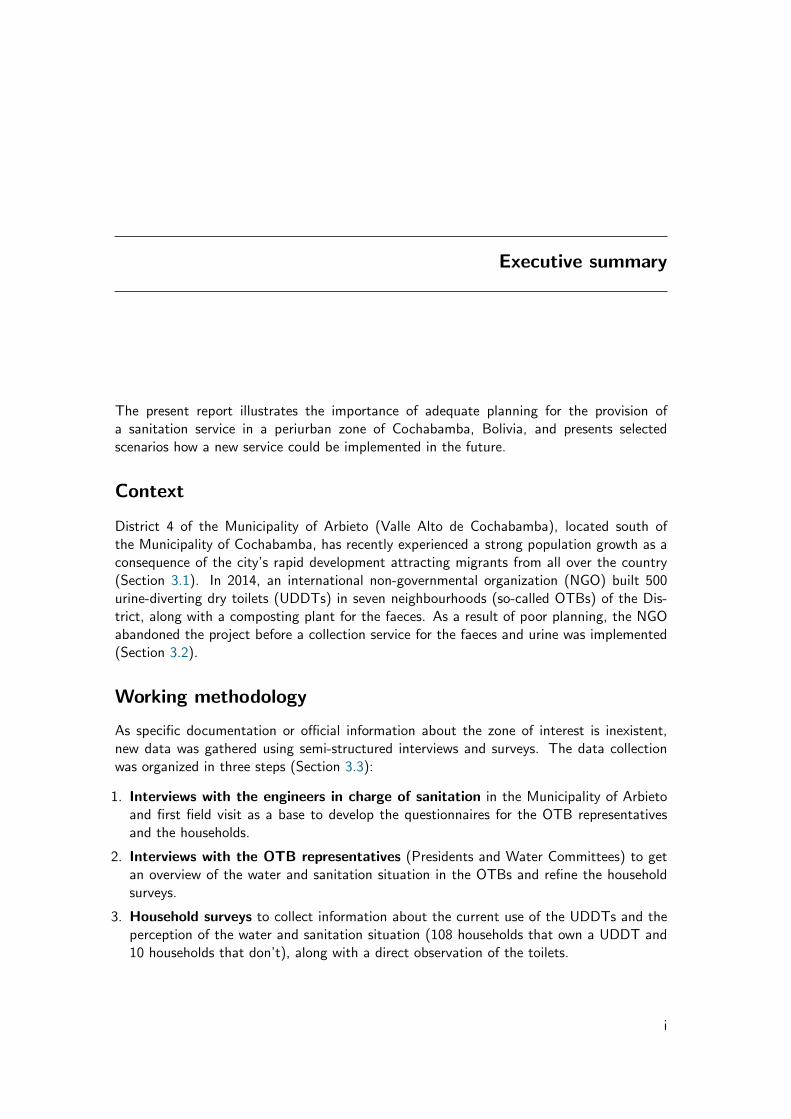
With the help of the same NGO, a water supply network was implemented in the sevenOTBs. As a result of poor administration and the dessication of the water source, thewater supply currently doesn’t work in the majority of the OTBs, as presented in the tablebelow. Many inhabitants depend on water from water trucks, however, this water provisionservice is expensive, irregular, and doesn’t guarantee the water to be safe for consumption.There are various conflicts about the distribution of the water between the OTBs, alongwith disagreements about the financing between the residents and the Water Committeesresponsible of the water provision.
OTB Days with piped water Tariff piped water Tariff water truck
20 de Mayo 0 f: 15 Bs./month v: 30-35 Bs./m3
Cristal Mayu 0 - v: 40 Bs./m3
Florida 0-1 days/week f: 15 Bs./month v: 35 Bs./m3
Fortaleza 7 days/week f: 20 Bs./month v: 35 Bs./m3
Llave Mayu 1-2 days/week f: 20 Bs./month v: 35-40 Bs./m3
Villa Montes 7 days/week v: 22.50 Bs./m3 -Yuraj Jallpa 7 days/week v: 20 Bs./m3, f: 10 Bs./month -
There is no solid waste collection service in any of the OTBs and a majority of the residentsburns its waste on-site. Even without receiving any type of service, they pay a tax for wastemanagement with the electricity bill. As a consequence of a territorial conflict between theMunicipalities of Arbieto and Cochabamba, however, this tax goes to Cochabamba ratherthan to Arbieto.
Since the implementation of the project, the number of UDDT users has constantly de-creased (graph below, left). Initially, not all households finished the construction of thelatrines. Many stopped using their toilets after a few weeks, when they realised no collectionservice would come. Others lost their motivation as a consequence of bad smells or flies inthe toilet, or because they had to bury the faeces or eliminate them otherwise. Currently,only a third of the population indicate that they use their UDDT (graph below, right).
ii
Executive summary
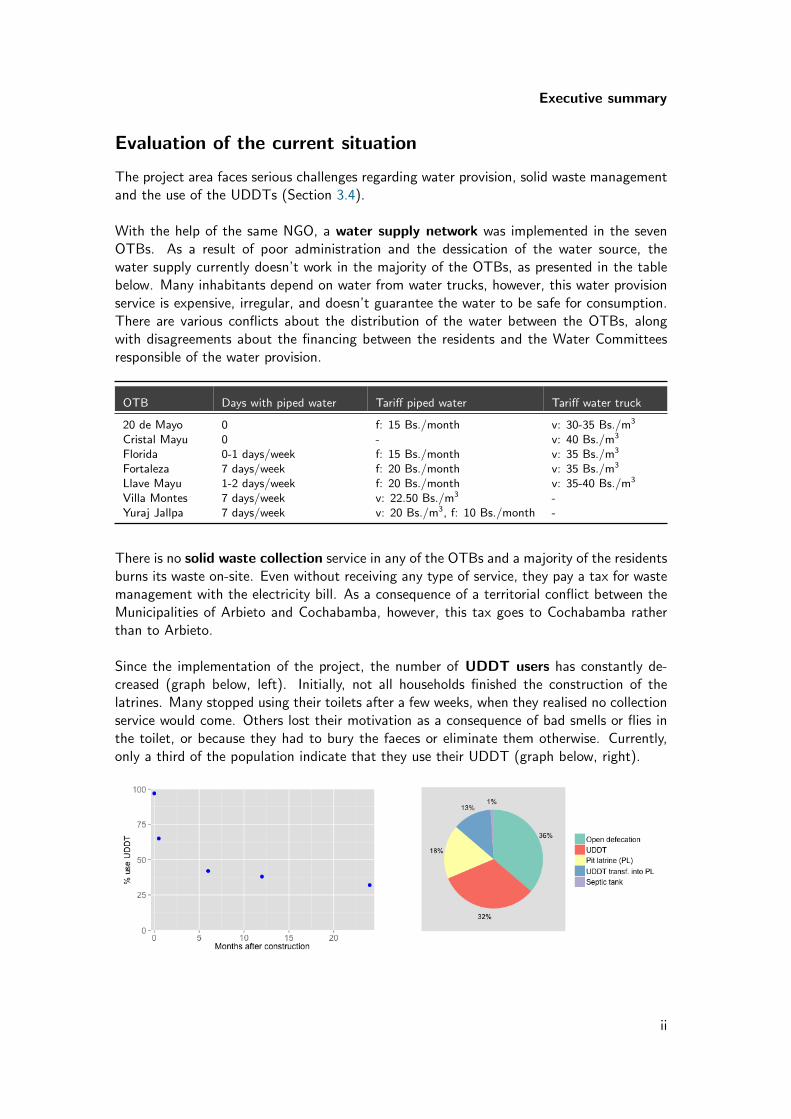
The motives for building the UDDTs can beclassified in two types: intrinsic (own a toi-let, protection of health and environment)or extrinsic (toilet for free, publicity by theimplementing NGO, pressure from the OTBleaders). The graph on the right shows thatthe initial motive significantly influencesthe current use (Chapter 4). This is strongevidence that putting pressure on the resi-dents works only at short term; for a sanita-tion service to be sustainable, it is crucial that there is a real demand from the population.
The Mayor of Arbieto explicitly mandated the upstart of the faeces treatment plant (Section3.5) and the Municipality’s Annual Operational Plan specifically reserves 40’000 Bs. forthe project (Section 3.6). However, increasing the access to water and sanitation doesn’tgenerally seem priority for at municipal level, as the planned investments for the developmentand promotion of sports are almost four times larger.
Service scenarios
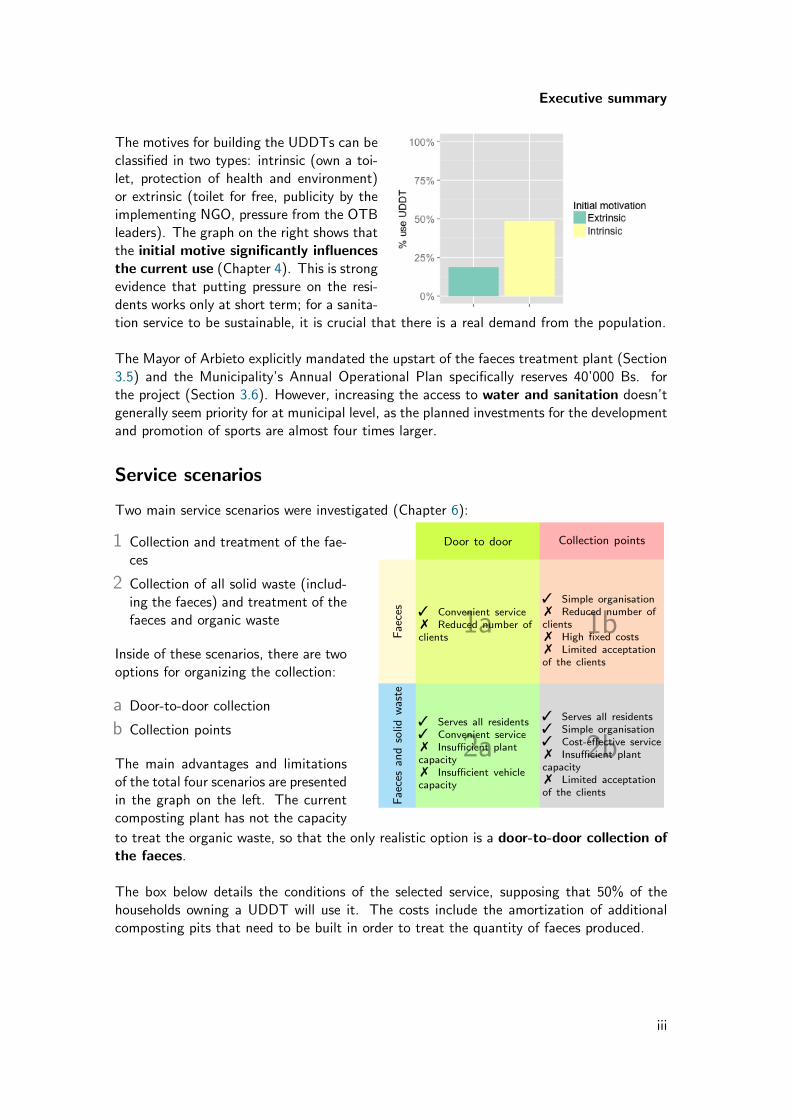
Two main service scenarios were investigated (Chapter 6):
1 Collection and treatment of the fae-ces
2 Collection of all solid waste (includ-ing the faeces) and treatment of thefaeces and organic waste
Inside of these scenarios, there are twooptions for organizing the collection:
a Door-to-door collection
b Collection points
The main advantages and limitationsof the total four scenarios are presentedin the graph on the left. The currentcomposting plant has not the capacity
Door to door Collection points
Fae
ces
1a 1b
Fae
ces
and
solid
was
te
2a 2b
3 Convenient service7 Reduced number ofclients
3 Simple organisation7 Reduced number ofclients7 High fixed costs7 Limited acceptationof the clients
3 Serves all residents3 Convenient service7 Insufficient plantcapacity7 Insufficient vehiclecapacity
3 Serves all residents3 Simple organisation3 Cost-effective service7 Insufficient plantcapacity7 Limited acceptationof the clients
to treat the organic waste, so that the only realistic option is a door-to-door collection ofthe faeces.
The box below details the conditions of the selected service, supposing that 50% of thehouseholds owning a UDDT will use it. The costs include the amortization of additionalcomposting pits that need to be built in order to treat the quantity of faeces produced.
iii
Executive summary
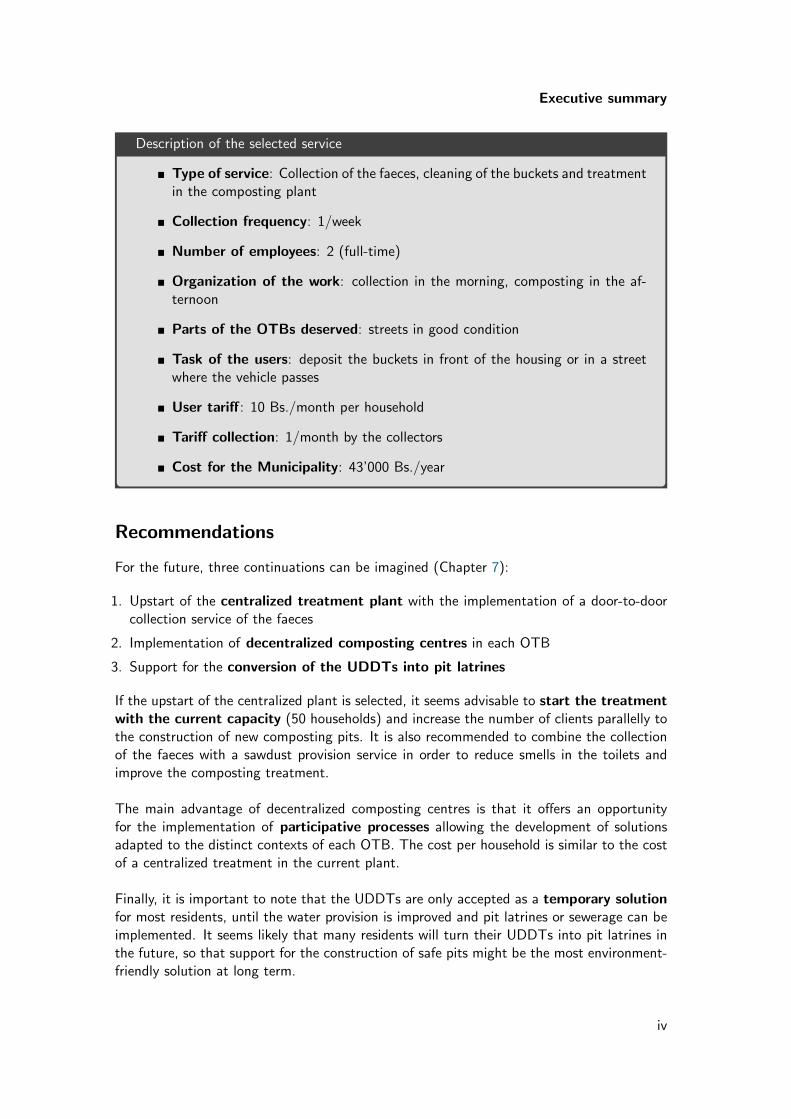
Description of the selected service
� Type of service: Collection of the faeces, cleaning of the buckets and treatmentin the composting plant
� Collection frequency: 1/week
� Number of employees: 2 (full-time)
� Organization of the work: collection in the morning, composting in the af-ternoon
� Parts of the OTBs deserved: streets in good condition
� Task of the users: deposit the buckets in front of the housing or in a streetwhere the vehicle passes
� User tariff: 10 Bs./month per household
� Tariff collection: 1/month by the collectors
� Cost for the Municipality: 43’000 Bs./year
Recommendations
For the future, three continuations can be imagined (Chapter 7):
1. Upstart of the centralized treatment plant with the implementation of a door-to-doorcollection service of the faeces
2. Implementation of decentralized composting centres in each OTB
3. Support for the conversion of the UDDTs into pit latrines
If the upstart of the centralized plant is selected, it seems advisable to start the treatmentwith the current capacity (50 households) and increase the number of clients parallelly tothe construction of new composting pits. It is also recommended to combine the collectionof the faeces with a sawdust provision service in order to reduce smells in the toilets andimprove the composting treatment.
The main advantage of decentralized composting centres is that it offers an opportunityfor the implementation of participative processes allowing the development of solutionsadapted to the distinct contexts of each OTB. The cost per household is similar to the costof a centralized treatment in the current plant.
Finally, it is important to note that the UDDTs are only accepted as a temporary solutionfor most residents, until the water provision is improved and pit latrines or sewerage can beimplemented. It seems likely that many residents will turn their UDDTs into pit latrines inthe future, so that support for the construction of safe pits might be the most environment-friendly solution at long term.
iv
Acknowledgements
The present report would not have been possible without the support and collaboration ofvarious people and institutions. I would particularly like to express my thanks and apprecia-tion to the following people:
� To Philippe Reymond from Eawag/Sandec for his constant support and suggestionsat distance and in the field, as well as for the time spent together in Cochabamba.
� To Pascal Blunier from the GAM Project for the organization of my internship and hisavailability in case of difficulties.
� To the entire team in Cochabamba for their warm welcome, especially to Joaquın Tapiaand Gustavo Heredia from the Fundacion Aguatuya and Lourdes Valenzuela from theGAM Project for the successful collaboration in the project.
� To Carlos Suntura from the Fundacion Sumaj Huasi, Henry Morales and Jorge Navafrom the SNV, Denis Sanchez from the Municipality of Tiquipaya and Carola Ortunofrom Swisscontact for the inspiring discussions and the data provided.
� To Valerie Cavin from Helvetas Swiss Intercooperation and Anna Gama from Eawag/ESSfor their support in the application of element of the RANAS methodology and Caro-line Jennings Saul from Eawag/ESS for her help in the elaboration and presentationof organizational models.
� To Grover Flores Encinas and Emilia Choque from the Municipality of Arbieto forthe facilitation of the first contact with the OTB representatives and the amicablecollaboration.
� To all OTB Presidents and members of the Water Committees for their availabilityand concern for the improvement of the living conditions of the population.
v
Contents
1 Introduction 11.1 Context and objectives . . . . . . . . . . . . . . . . . . . . . . . . . . . . 11.2 About the report . . . . . . . . . . . . . . . . . . . . . . . . . . . . . . . . 2
2 Drinking water provision and sanitation in Bolivia 32.1 Short overview of past actions . . . . . . . . . . . . . . . . . . . . . . . . 32.2 Legal and regulatory framework in Bolivia . . . . . . . . . . . . . . . . . . 4
2.2.1 Legal structures in charge of basic sanitation . . . . . . . . . . . . 52.2.2 Law enforcement . . . . . . . . . . . . . . . . . . . . . . . . . . . 72.2.3 Failure factors for the implementation of sanitation systems . . . . 82.2.4 Success factors for the implementation of sanitation systems . . . . 10
3 Detailed assessment of the current situation 123.1 Geographic context . . . . . . . . . . . . . . . . . . . . . . . . . . . . . . 123.2 Synthesis of ADRA’s UDDT project . . . . . . . . . . . . . . . . . . . . . 143.3 Data acquisition . . . . . . . . . . . . . . . . . . . . . . . . . . . . . . . . 173.4 Water and sanitation services in the project area . . . . . . . . . . . . . . . 18
3.4.1 Water supply . . . . . . . . . . . . . . . . . . . . . . . . . . . . . 193.4.2 Solid waste management . . . . . . . . . . . . . . . . . . . . . . . 233.4.3 Use of the UDDTs . . . . . . . . . . . . . . . . . . . . . . . . . . 25
3.5 Stakeholder analysis . . . . . . . . . . . . . . . . . . . . . . . . . . . . . . 283.5.1 Characteristics of the key stakeholders . . . . . . . . . . . . . . . . 283.5.2 Relations between the key stakeholders . . . . . . . . . . . . . . . . 32
3.6 Analisis of the enabling environment . . . . . . . . . . . . . . . . . . . . . 343.6.1 Government support . . . . . . . . . . . . . . . . . . . . . . . . . . 343.6.2 Legal and regulatory framework . . . . . . . . . . . . . . . . . . . . 363.6.3 Institutional arrangements . . . . . . . . . . . . . . . . . . . . . . 373.6.4 Skills and capacity . . . . . . . . . . . . . . . . . . . . . . . . . . . 373.6.5 Financial agreements . . . . . . . . . . . . . . . . . . . . . . . . . 383.6.6 Socio-cultural acceptance . . . . . . . . . . . . . . . . . . . . . . . 403.6.7 Global evaluation of the enabling environment . . . . . . . . . . . . 41
vi
Contents
4 User perception of the UDDTs and the service options 424.1 Factors influencing the current use of the UDDTs . . . . . . . . . . . . . . 434.2 Reasons for stopping the use of the UDDTs . . . . . . . . . . . . . . . . . 464.3 Opinion about the type of service and tariff system . . . . . . . . . . . . . 474.4 Perception of the current situation and establishment of priorities . . . . . 49
5 Lessons learnt from other projects 515.1 Composting plant in Tiquipaya . . . . . . . . . . . . . . . . . . . . . . . . 515.2 UDDT projects implemented by the Fundacion Aguatuya in Cochabamba . 535.3 UDDT project implemented by the Fundacion Sumaj Huasi in El Alto . . . 55
6 Service chain scenarios 576.1 Working hypotheses . . . . . . . . . . . . . . . . . . . . . . . . . . . . . . 586.2 Cost calculations . . . . . . . . . . . . . . . . . . . . . . . . . . . . . . . . 616.3 Verification of the capacity . . . . . . . . . . . . . . . . . . . . . . . . . . 636.4 Tariff system . . . . . . . . . . . . . . . . . . . . . . . . . . . . . . . . . . 666.5 Sensitivity analysis . . . . . . . . . . . . . . . . . . . . . . . . . . . . . . . 67
7 Recommendations 717.1 Option 1: Start-up of the centralized treatment plant . . . . . . . . . . . . 717.2 Option 2: Composting centre in each OTB . . . . . . . . . . . . . . . . . 737.3 Option 3: Support for the construction of pit latrines . . . . . . . . . . . . 75
8 Conclusions 778.1 Follow-up of the report . . . . . . . . . . . . . . . . . . . . . . . . . . . . 778.2 Implementation of UDDTs in periurban zones in Bolivia . . . . . . . . . . . 788.3 Application of CLUES in periurban zones in Bolivia . . . . . . . . . . . . . 79
Abbreviations 81
Bibliography 83
A Cuestionarios 86
B Mapa de las OTBs 106
C Caracteristicas de los actores principales 108
D Tratamiento de datos y pruebas estadısticas 110
E Sistemas de saneamiento evaluados 113
F Opciones de cadenas de servicio, mantenimiento y tarifa 115
G Modelos organizacionales 118
H Recorridos del recojo de puerta a puerta 123
I Ubicacion de los puntos de acopio 128
J Parametros del calculo de costos 133
vii
List of Figures
2.1 Evolution of two sanitation indicators between 2001 and 2012 (INE): accessto a toilet and to piped water. . . . . . . . . . . . . . . . . . . . . . . . . 4
3.1 Location of the Municipality of Arbieto in the South-east of Cochabamba(UDAPE) . . . . . . . . . . . . . . . . . . . . . . . . . . . . . . . . . . . 12
3.2 Location of District 4 neighbouring the city of Cochabamba (PDTA) . . . . 133.3 Photo of District 4 of Arbieto, a periurban zone neighbouring the city of
Cochabamba. . . . . . . . . . . . . . . . . . . . . . . . . . . . . . . . . . 143.4 Location of the 7 concerned OTBs, directly at the limit between the munic-
ipalities of Arbieto and Cochabamba. The points represent the UDDTs. . . 153.5 Schematic of a UDDT from [22]. . . . . . . . . . . . . . . . . . . . . . . . 153.6 Clockwise: Exterior of a UDDTs built by ADRA, chamber for the faeces
bucket and urine jerrycan, faeces treatment plant in Llave Mayu. . . . . . . 163.7 Access to basic services in the Municipality of Arbieto (INE, 2001) . . . . . 183.8 Disposal of solid waste in the Municipality of Arbieto (INE, 2012). . . . . . 193.9 Percentage of the inhabitants that have piped water in the housing (column)
and main water source (colour). . . . . . . . . . . . . . . . . . . . . . . . 193.10 Consequence of the conflict between a resident and the water committee:
unmounted water meter in the OTB Llave Mayu. . . . . . . . . . . . . . . 203.11 Water tank in the OTB Yuraj Jallpa (filled by water trucks). . . . . . . . . 203.12 Organization of the water tariff collection. . . . . . . . . . . . . . . . . . . 213.13 Private water tanks . . . . . . . . . . . . . . . . . . . . . . . . . . . . . . 223.14 Disposal of greywater based on the auto-declaration of the respondents. . . 233.15 Solid waste disposal based on the auto-declaration of the respondents. . . . 233.16 Examples of solid waste disposal. . . . . . . . . . . . . . . . . . . . . . . . 243.17 Electricity bill with tax for waste management services (tasa de aseo). . . . 243.18 Separation and use of of organic waste based on the auto-declaration of the
surveyed residents. . . . . . . . . . . . . . . . . . . . . . . . . . . . . . . . 243.19 Type of toilet used based on the auto-declaration of the surveyed residents. 253.20 Percentage of households using the UDDTs based on the auto-declaration of
the surveyed residents. . . . . . . . . . . . . . . . . . . . . . . . . . . . . 253.21 Examples of house or property owners not living permanently in the OTBs. 26
viii
Chapter List of Figures
3.22 Frequent maintenance problems and change of design. . . . . . . . . . . . 263.23 Use of drying materials based on the auto-declaration of the households
currently using the UDDTs. . . . . . . . . . . . . . . . . . . . . . . . . . . 273.24 Disposal of the faeces based on the auto-declaration of the households cur-
rently using the UDDTs. . . . . . . . . . . . . . . . . . . . . . . . . . . . 273.25 Disposal of the urine based on the auto-declaration of the households cur-
rently using the UDDTs. . . . . . . . . . . . . . . . . . . . . . . . . . . . 273.26 Presentation of the agenda for the monthly reunion in the OTB Yuraj Jallpa. 293.27 Preparation of a day of community work to fix the piped water network in
the OTB Llave Mayu. . . . . . . . . . . . . . . . . . . . . . . . . . . . . . 29a Origin . . . . . . . . . . . . . . . . . . . . . . . . . . . . . . . . . 30b Occupation . . . . . . . . . . . . . . . . . . . . . . . . . . . . . . 30c Level of education . . . . . . . . . . . . . . . . . . . . . . . . . . . 30
3.28 Characterization of the residents: origin, occupation and level of education. 303.29 Characterization of the residents: work place. . . . . . . . . . . . . . . . . 313.30 Relations between key stakeholders. . . . . . . . . . . . . . . . . . . . . . 333.31 Six elements of an enabling environment [11]. . . . . . . . . . . . . . . . . 343.32 Distribution of the investments 2015-2019 in the sanitation sector by topic
(based on the investments presented in the POA). . . . . . . . . . . . . . . 383.33 Investments 2015-2019 in the drinking water and sanitation sector by district
(based on the investments presented in the PDTA). . . . . . . . . . . . . . 39
4.1 Motive for building a UDDT, based on the auto-declaration of the surveyedresidents. . . . . . . . . . . . . . . . . . . . . . . . . . . . . . . . . . . . . 43
4.2 Current use of the UDDTs by type of initial motive: intrinsic (own a toilet,protect environment and health) or extrinsic (toilet for free, publicity byADRA, pressure from the OTB). . . . . . . . . . . . . . . . . . . . . . . . 44
4.3 Differences between households using a toilet (UDDT or pit latrine) andhouseholds practising open defecation (p<0.05, Kruskal-Wallis test). Scalefrom 1 to 5. . . . . . . . . . . . . . . . . . . . . . . . . . . . . . . . . . . 45
4.4 Differences betwen households using UDDTs and households using simple pitlatrines or practising open defecation (p<0.05, Kruskal-Wallis test). Scalefrom 1 to 5 (left) resp. number of people (right). . . . . . . . . . . . . . . 45
4.5 Reasons for ceasing the use of the UDDTs based on the auto-declaration ofthe surveyed. . . . . . . . . . . . . . . . . . . . . . . . . . . . . . . . . . . 46
4.6 Change in the percentage of UDDT users over time. . . . . . . . . . . . . 464.7 Disgust and physical effort linked to the handling of the faeces and urine, on
a scale from 1 (low) to 5 (high). . . . . . . . . . . . . . . . . . . . . . . . 474.8 Preferred type of service: on demand or regular (possibility to chose both
options). . . . . . . . . . . . . . . . . . . . . . . . . . . . . . . . . . . . . 474.9 Willingness to use and to pay for a collection service and maximum tariff. . 484.10 Average satisfaction with the current situation: water provision, solid waste
management and toilets, scale from 1 to 5. . . . . . . . . . . . . . . . . . 494.11 Satisfaction with current situation: water provision, solid waste management
and toilets, on a scale from 1 (low) to 5 (high) (boxplot). . . . . . . . . . . 504.12 Priority: water provision, solid waste management or toilets. . . . . . . . . 50
5.1 Composting technologies in the plant of Tiquipaya . . . . . . . . . . . . . 52
ix
Chapter List of Figures
5.2 Accumulation of organic matter after the shredder broke down. . . . . . . . 525.3 Design of the bathrooms in the OTB Higuerani: UDDT (back) and shower
(front), foto taken by the Fundacion Aguatuya. . . . . . . . . . . . . . . . 535.4 Design of the UDDTs in the OTB 22 de Febrero. . . . . . . . . . . . . . . 545.5 Sumaj Huasi’s working zone: peri-urban zone in El Alto (District 7). . . . . 555.6 Interior of one of Sumaj Huasi’s UDDTs. . . . . . . . . . . . . . . . . . . . 555.7 Urine treatment and use of the compost in Sumaj Huasi’s UDDT project. . 56
6.1 Sanitation system for scenario 1a (door-to-door collection of the faeces). . 586.2 Costs per household for four service scenarios as a function of the percentage
of user for a collection frequency of once a week. 1a: Door-to-door collectionof the faeces. 1b: Collection of the faeces in collection points. 2a: Door-to-door collection of the faeces and solid waste. 2b: Collection of the faecesand solid waste in collection points. . . . . . . . . . . . . . . . . . . . . . 62
6.3 Costs per treated volume (faeces and organics) for four service scenarios as afunction of the percentage of user for a collection frequency of once a week.1a: Door-to-door collection of the faeces. 1b: Collection of the faeces incollection points. 2a: Door-to-door collection of the faeces and solid waste.2b: Collection of the faeces and solid waste in collection points. . . . . . . 62
6.4 Average filling of the vehicle as a function of the percentage of user fora collection frequency of once a week. 1a: Door-to-door collection of thefaeces. 1b: Collection of the faeces in collection points. 2a: Door-to-doorcollection of the faeces and solid waste. 2b: Collection of the faeces andsolid waste in collection points. . . . . . . . . . . . . . . . . . . . . . . . . 63
6.5 Average filling of the vehicle as a function of the percentage of user for acollection frequency of once a week (scenario 1) respectively twice a week(scenario 2). 1a: Door-to-door collection of the faeces. 1b: Collection ofthe faeces in collection points. 2a: Door-to-door collection of the faeces andsolid waste. 2b: Collection of the faeces and solid waste in collection points. 64
6.6 Costs per household for four service scenarios as a function of the percentageof user for a collection frequency of once a week. 1a: Door-to-door collectionof the faeces. 1b: Collection of the faeces in collection points. 2a: Door-to-door collection of the faeces and solid waste. 2b: Collection of the faecesand solid waste in collection points. . . . . . . . . . . . . . . . . . . . . . 64
6.7 Comparison of the required surface for the construction of new compostingpits and the available surface. 1: Collection of the faeces. 2: Collection ofthe faeces and solid waste. . . . . . . . . . . . . . . . . . . . . . . . . . . 65
6.8 Summary of the main advantages and limitations of the four service scenarios. 656.9 Door-to-door collection of the faeces: total annual costs for the Municipality
as a function of the number of users and the tariff they pay. . . . . . . . . 666.10 Door-to-door collection of the faeces: repartition of the annual costs between
users and Municipality. . . . . . . . . . . . . . . . . . . . . . . . . . . . . 676.11 Reparticion de los costos de un servicio de recojo de las heces de puerta a
puerta para un porcentaje de usuarios de 50 %. . . . . . . . . . . . . . . . 676.12 Sensitivity analysis varying the following parameters: users percentage (40%
to 60% of the total population); unitary working time (75% to 125% ofestimated values); filling time of the faeces buckets (0.5 to 1.5 months);composting time (3 to 9 months). . . . . . . . . . . . . . . . . . . . . . . 69
x
List of Figures
6.13 Door-to-door collection and treatment of the faeces: comparison of the realcost per household and OPEX only. . . . . . . . . . . . . . . . . . . . . . 70
7.1 Monthly costs per households during the start-up of the treatment plant(with one or two employees). . . . . . . . . . . . . . . . . . . . . . . . . . 72
7.2 Separated solid waste collection in front of the school in Llave Mayu. . . . 747.3 Green point (textitpunto verde) by the NGO Swisscontact in the OTB Sivin-
gani (Cochabamba). Source of the picture: Swisscontact Cochabamba. . . 747.4 Construction of a permeable pit latrine in the OTB Florida. . . . . . . . . . 75
xi
List of Tables
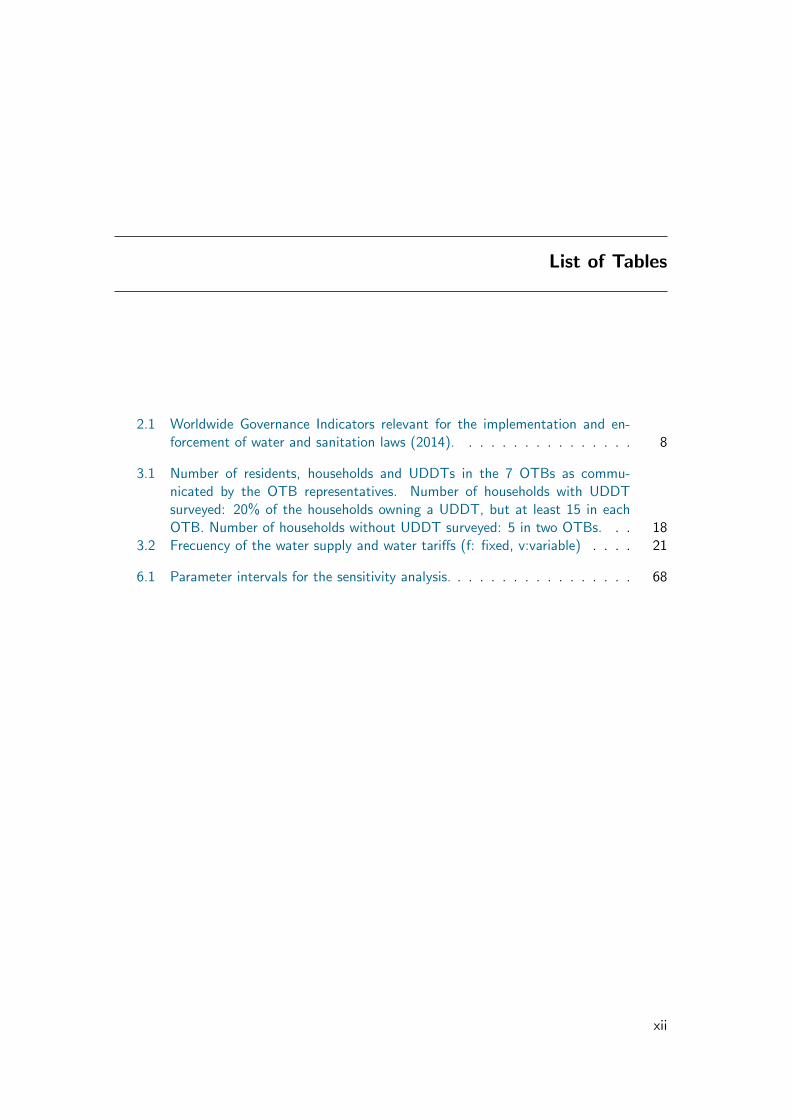
2.1 Worldwide Governance Indicators relevant for the implementation and en-forcement of water and sanitation laws (2014). . . . . . . . . . . . . . . . 8
3.1 Number of residents, households and UDDTs in the 7 OTBs as commu-nicated by the OTB representatives. Number of households with UDDTsurveyed: 20% of the households owning a UDDT, but at least 15 in eachOTB. Number of households without UDDT surveyed: 5 in two OTBs. . . 18
3.2 Frecuency of the water supply and water tariffs (f: fixed, v:variable) . . . . 21
6.1 Parameter intervals for the sensitivity analysis. . . . . . . . . . . . . . . . . 68
xii
CHAPTER 1
Introduction
1.1 Context and objectives
Mandated by the Swiss Agency for Development and Cooperation (SDC), an alliance formedby Helvetas Swiss Intercooperation, CSD Engineers and the Fundacion Aguatuya is respon-sible for the implementation of the Project Gestion ambiental municipal (GAM). The projectaims at solid waste management and wastewater treatment in small and medium-size cities.Eawag/Sandec’s contribution to the project lies in the adaptation and validation of environ-mental sanitation planning tools to the context of medium-sized Bolivian cities.
A region targeted by the project is the Valle Alto de Cochabamba. One of the municipalitiescovered in the region is Arbieto, located south-easterly of the city of Cochabamba. Dis-trict 4 of Arbieto is situated directly at the limits between Arbieto and Cochabamba, butdoesn’t benefit of the same level of water and basic sanitation services as in the city. In2014, an NGO constructed 500 urine-diverting dry toilets (UDDTs) as well as a treatmentplant for the faeces, but abandoned the project before a recollection service was implemented.
The present report summarises the main results from an internship completed in the frame-work of the GAM Project with the Fundacion Aguatuya in Cochabamba from 10.02-10.06.2016.The aim was to assess and further develop a development scheme for the UDDT-based san-itation system in District 4 of Arbieto.
The four main objectives of the internship were:
1. Review the available literature and perform an stakeholder analysis
2. Evaluate the perception of the users towards the UDDTs
3. Study the intended management plan
4. Formulate recommendations for the start-up of the treatment plant and alternatives
1
Chapter 1 Introduction
1.2 About the report
The present report is to a large extent traduced from the Spanish report Evaluacion ydesarrollo ulterior de un sistema de saneamiento basado en banos ecologicos secos en Arbieto(Valle Alto de Cochabamba, Bolivia). It is divided into seven main parts:
� Chapter 2 gives an overview of the drinking water provision and sanitation situationin Bolivia, with special attention on the legal and regulatory framework.
� A detailed assessment of the current situation in the project zone can be found inChapter 3. It includes in particular an evaluation of the drinking water and sanitationconditions, a stakeholder analysis and an assessment of the enabling environment.
� The perception of the residents towards the UDDTs is presented in Chapter 4.
� Chapter 5 summarises the lessons learnt from other composting and UDDT projectsin Bolivia.
� Chapter 6 presents the costs and feasibility of four service scenarios, as well as aproposition for a tariff system.
� Recommendations for the start-up of the treatment plant are given in Chapter 7 alongwith alternatives to the centralized treatment.
� Finally, Chapter 8 aims at putting the case of Arbieto in a more general context,assessing the adequateness of UDDTs as a sanitation technology in periurban zones.
The Appendices were not translated and correspond to the original Spanish version.
2
CHAPTER 2
Drinking water provision and sanitation in Bolivia
The present chapter gives a brief overview of past actions in the sanitation and drinkingwater sector on the national level and introduces the legal structures in charge. It lists themost common failure factors for sanitation projects, and, based on a case study, factors thatseem essential for the successful implementation of such a project.
2.1 Short overview of past actions
Until the mid 1990s, the Bolivian government’s focus in the water supply and sanitationsector lay primarily on infrastructure projects. The common perception was that importantinfrastructure investments (including the construction of dams, aqueducts and bulk waterfacilities) would improve the access to water and sanitation. At the same time, the countrylacked a coherent sector policy and regulation, and most of these investments did not sub-stantially improve the poor service delivery. The inadequate management performances ofmost water utilities in terms of operative efficiency and maintenance, financial sustainabilityand user satisfaction made the government and donors realize that major sector reformswere necessary [24].
Under the pressure of the World Bank, the state-run water utility of La Paz and El Altowas privatized in 1997. The utility of Cochabamba followed three years later. Parallelly, aregulatory authority for the water sector was created. However, capacity development stillmainly consisted of short-term technical assistance and law enforcement remained weak.A period of major civil unrest caused by the increase of water tariffs, culminating in theso-called Water War in Cochabamba in 2000, finally forced the government to back out ofits privatization strategy [24].
In the following years, aiming to fulfill the Millenium Development Goals (MDG) in waterand sanitation, the government established a water supply and sanitation plan that includedfirst principles of capacity development and the promotion of social participation [24].
When Evo Morales was elected president in 2006, he put a strong emphasis on the water and
3
Chapter 2 Drinking water provision and sanitation in Bolivia
sanitation sector, declaring the access to safe water and basic sanitation a human right inthe new constitution from 2009 (Art. 20 CPE). The new National Plan for Basic Sanitationinsisted on the importance of community participation and set the focus on the underdevel-oped rural areas [13]. In the first years after his election, the ministries and units responsiblefor the developement and implementation of these new principles were restructured multipletimes, resulting in the framework described in Section 2.2.1. This restructuring was accom-panied by a decentralization process, giving increased responsibility to lower administrativelevels [9].
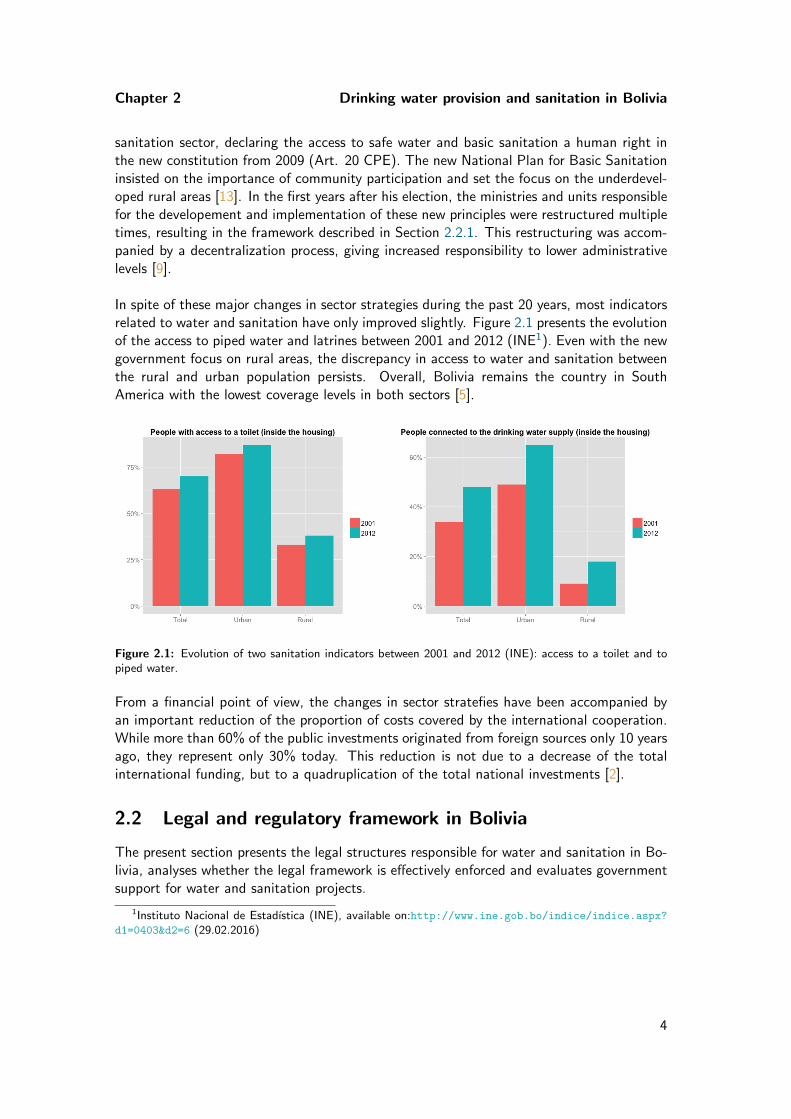
In spite of these major changes in sector strategies during the past 20 years, most indicatorsrelated to water and sanitation have only improved slightly. Figure 2.1 presents the evolutionof the access to piped water and latrines between 2001 and 2012 (INE1). Even with the newgovernment focus on rural areas, the discrepancy in access to water and sanitation betweenthe rural and urban population persists. Overall, Bolivia remains the country in SouthAmerica with the lowest coverage levels in both sectors [5].
Figure 2.1: Evolution of two sanitation indicators between 2001 and 2012 (INE): access to a toilet and topiped water.
From a financial point of view, the changes in sector stratefies have been accompanied byan important reduction of the proportion of costs covered by the international cooperation.While more than 60% of the public investments originated from foreign sources only 10 yearsago, they represent only 30% today. This reduction is not due to a decrease of the totalinternational funding, but to a quadruplication of the total national investments [2].
2.2 Legal and regulatory framework in Bolivia
The present section presents the legal structures responsible for water and sanitation in Bo-livia, analyses whether the legal framework is effectively enforced and evaluates governmentsupport for water and sanitation projects.
1Instituto Nacional de Estadıstica (INE), available on:http://www.ine.gob.bo/indice/indice.aspx?d1=0403&d2=6 (29.02.2016)
4
Chapter 2 Drinking water provision and sanitation in Bolivia
2.2.1 Legal structures in charge of basic sanitation
There are four levels of administrative division in Bolivia: Department, Province, Municipalityand Canton. The National government, the Municipalities and, to a lesser extent, theDepartments are all involved in the sanitation sector. Basic sanitation includes drinkingwater supply, sewerage, disposal of excreta and solid waste and stormwater discharge.At the national level, the sanitation sector is under the responsibility of the Vice-Ministryof Drinking Water and Basic Sanitation (VAPSB2) that is part of the Ministry of Envi-ronment and Water (MMAyA). The VAPSB is divided into three units with the followingresponsibilities (according to [7]):
� The Authority for Financial and Social Control of Drinking Water and Basic Sanitation(AAPS) controls, supervises and regulates activities related to the water and sanitationsector.
� The Executing Agency for Environment and Water (EMAGUA) executes, monitorsand evaluates the projects initiated by the MMAyA.
� The main role of the National Support Service for the Sustainability of Basic Sanita-tion (SENASBA) is to strengthen institutions and community development, notablythrough capacity building.
This subdivision is defined in the Supreme Decree DS 29894 (2009), that emended the Law2066 from 2001.3 Closely related to the Law 2066, the National Plan for Basic Sanitation(PNSB) was promulgated in 2008 (with adaptations in 2009). It is an instrument of theNational Development Plan (PND) and forms the base for the cooperation between thenational, departmental and municipal governments. Finally, the Sectorial Development Planfor Basic Sanitation (PSD-SB), published in 2011, is an actualization and complement ofthe PNSB.
The importance of the departments in the sanitation sector is limited, as their main roleis the coordination between National and Municipal governments. They also establish De-partmental Development Plans for water and sanitation and are responsible for the qualitycontrol of publicly funded services [3].
The municipalities are, directly or through a Public Social Enterprise for Drinking Waterand Sewerage (EPSA4), responsible for the administration and operation of the services. Incoordination with the departments, they establish Municipal Development Plans [4]. Themunicipalities participate in the design and the funding of sanitation projects, where theirfinancial share is established according to the Mechanism for Investments for the Coveragein the Drinking Water and Sanitation Sector (MICSA) [7].
The Bolivian legal framework differentiates between privative, exclusive, concurrent andshared competences. These four types of competences define which domain is under theresponsibility of which governmental level (national, departmental, municipal or AIOC).
2All abbreviations are listed in the Chapter Abbreviations at the end of this document.3Ley 2066 de Servicios de Agua Potable y Alcantarillado Sanitario4EPSA are public, social, cooperative or communitarian entities responsible for the service delivery in the
water and sanitation sector [7].
5
Chapter 2 Drinking water provision and sanitation in Bolivia
� Privative competences: all three competences, legislative, regulatory and executory,fall into the domain of the national government
� Exclusive competences: one governmental level holds the responsibility for all threelegislative, regulatory and executory competences
� Concurrent competences: the national government holds the legislative compe-tences, and the regulatory and executory competences are shared among the depart-mental and municipal governments.
� Shared competences: The national government defines a basic legal framework andthe regulation and execution is under the responsibility of the AIOC
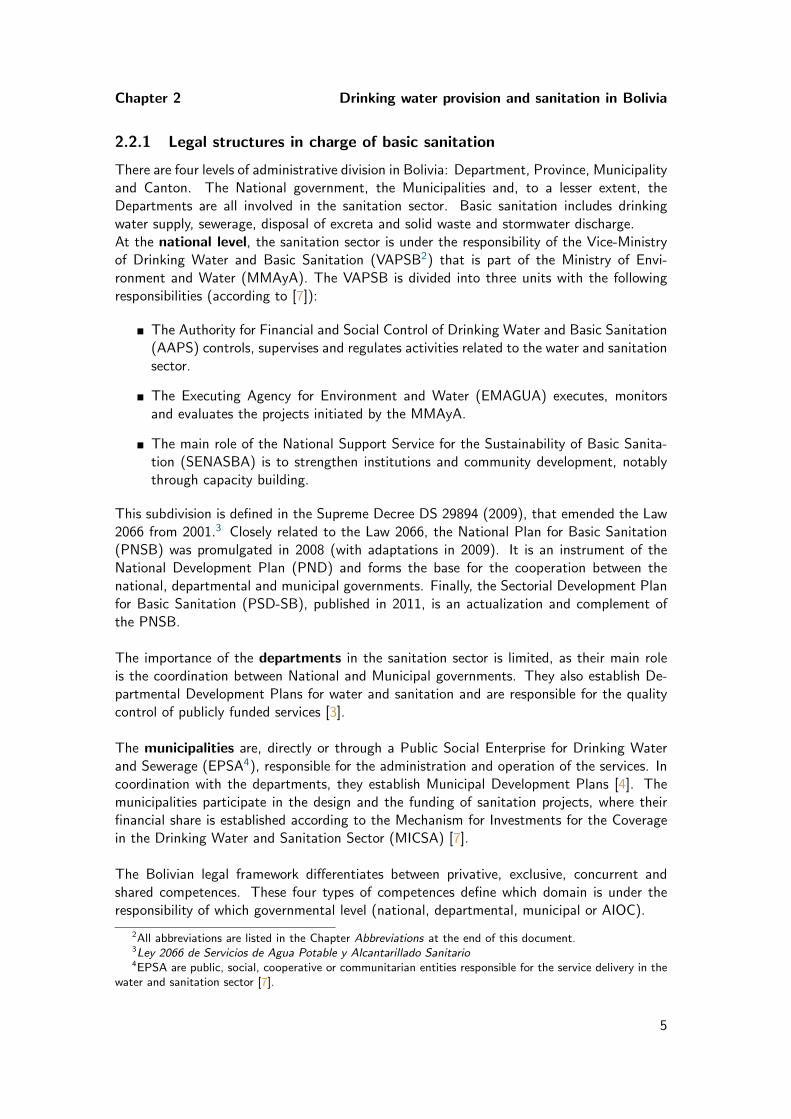
The following boxes detail the different responsibilities of the national, departmental andmunicipal governments in the drinking water and sanitation sector as defined in the Law2066 [10].
1. National competences
� Define policies, norms and regulations related to drinking water and sewerage
� Issue concessions and regulate drinking water and sewerage providers
2. Departmental competences
� Establish departmental plans and programs for the expansion of drinking waterand sewerage services
� Coordinate the national and the municipal governments
� Control the execution and quality of drinking water and sewerage infrastructurefinanced with public funds
� Promote the association of inhabitants to form interest groups for drinkingwater and sewerage
� Inform the national government about ONG and other organizations imple-menting drinking water and sewerage services
� Provide technical assistance to the EPSA
3. Municipal competences
� Guarantee drinking water and sewerage services, directly or through an EPSA
� Establish municipal development plans for the expansion of drinking water andsewerage services
� Consider the requests for expropriation related to water and sanitation projectspresented by the national government
� Assist the evaluation and monitoring of the EPSA working in the municipalityand communicate the results to the national government
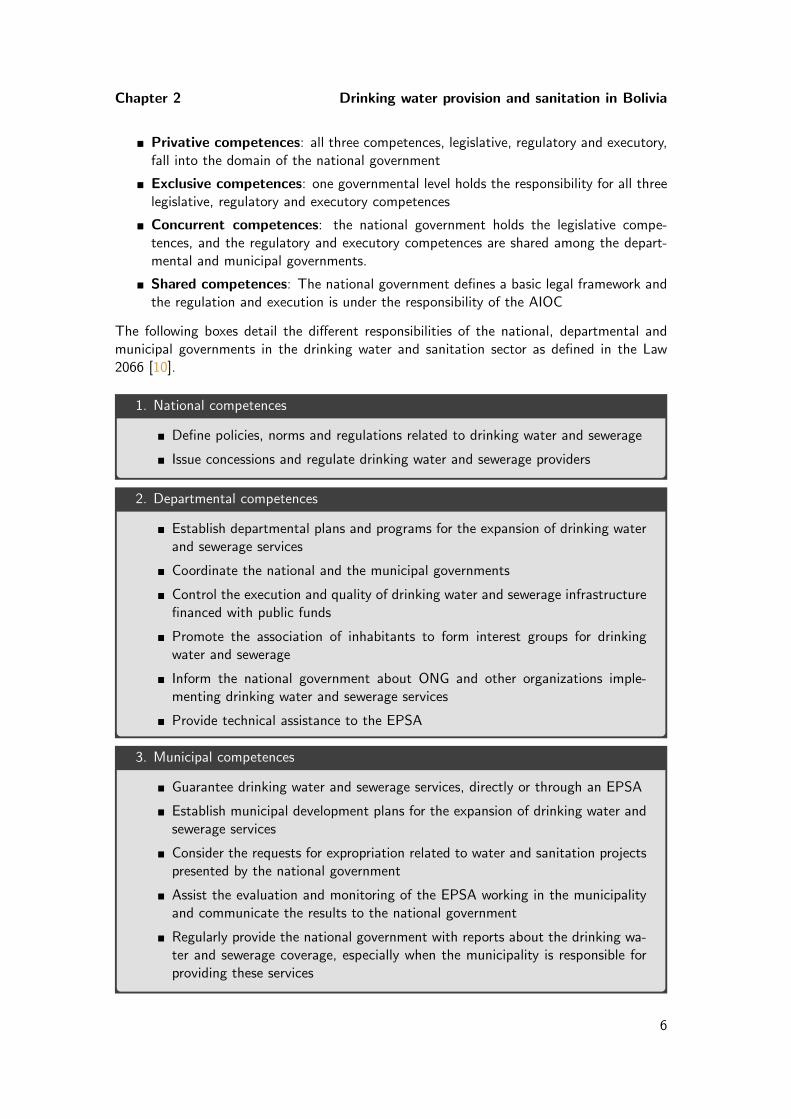
� Regularly provide the national government with reports about the drinking wa-ter and sewerage coverage, especially when the municipality is responsible forproviding these services
6
Chapter 2 Drinking water provision and sanitation in Bolivia
� Collect the service fees if the drinking water and sewerage services are provideddirectly
� Ensure that other infrastructure projects or activities do not affect the sustain-ability and quality of drinking water and sewerage services
� Inform the national government about ONG and other organizations imple-menting drinking water and sewerage services on municipal territory
� In consultation with the habitants (popular participation), emit a technicallyfunded report to the national government for the approbation of calls of pro-posals and planned tariffs.
2.2.2 Law enforcement
Most water and sanitation laws and plans were established less than ten years ago. It is thusrelatively early to assess the relevance of these new water and sanitation frameworks, andonly limited literature on the topic is available. Moreover, the legislation does not includeany quantifiable targets that would allow an easy assessment of its actual implementation.
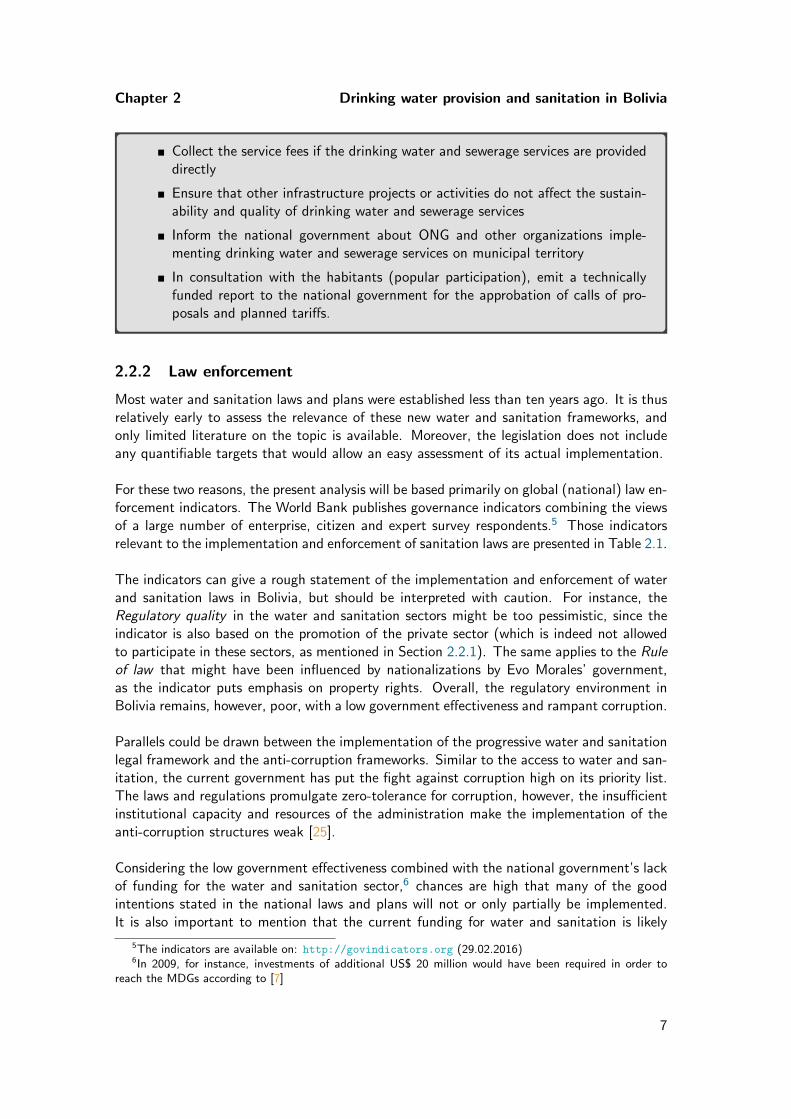
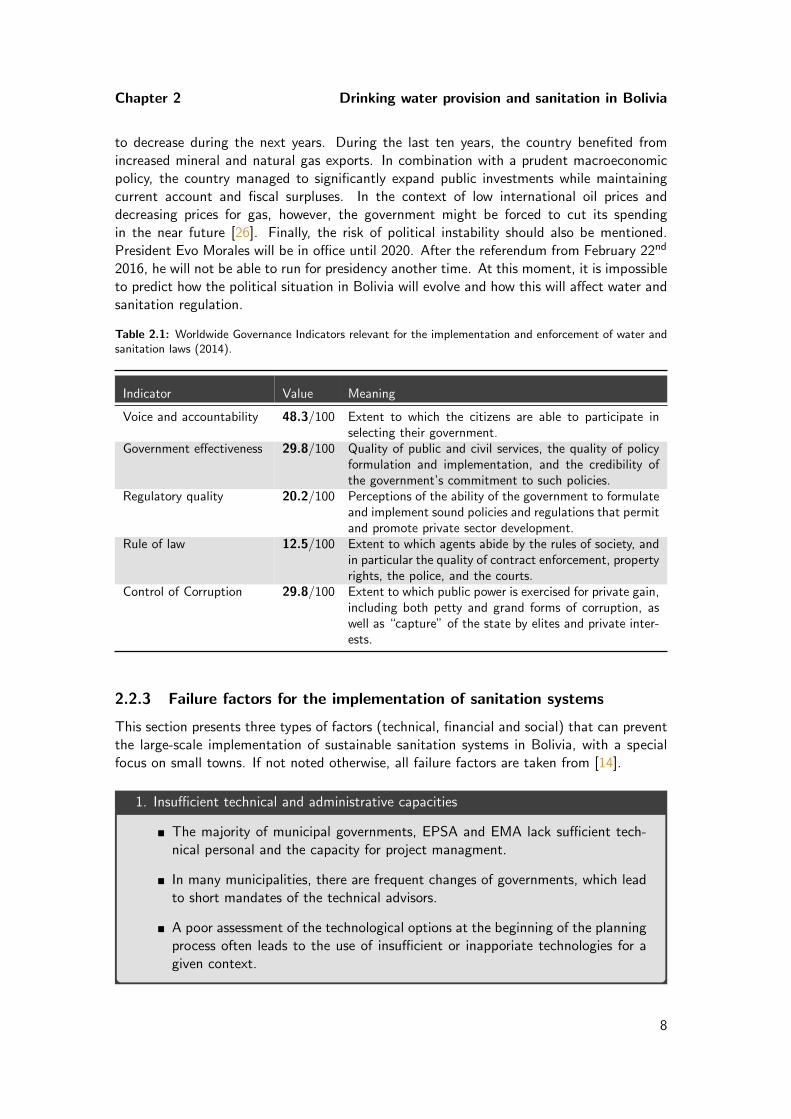
For these two reasons, the present analysis will be based primarily on global (national) law en-forcement indicators. The World Bank publishes governance indicators combining the viewsof a large number of enterprise, citizen and expert survey respondents.5 Those indicatorsrelevant to the implementation and enforcement of sanitation laws are presented in Table 2.1.
The indicators can give a rough statement of the implementation and enforcement of waterand sanitation laws in Bolivia, but should be interpreted with caution. For instance, theRegulatory quality in the water and sanitation sectors might be too pessimistic, since theindicator is also based on the promotion of the private sector (which is indeed not allowedto participate in these sectors, as mentioned in Section 2.2.1). The same applies to the Ruleof law that might have been influenced by nationalizations by Evo Morales’ government,as the indicator puts emphasis on property rights. Overall, the regulatory environment inBolivia remains, however, poor, with a low government effectiveness and rampant corruption.
Parallels could be drawn between the implementation of the progressive water and sanitationlegal framework and the anti-corruption frameworks. Similar to the access to water and san-itation, the current government has put the fight against corruption high on its priority list.The laws and regulations promulgate zero-tolerance for corruption, however, the insufficientinstitutional capacity and resources of the administration make the implementation of theanti-corruption structures weak [25].
Considering the low government effectiveness combined with the national government’s lackof funding for the water and sanitation sector,6 chances are high that many of the goodintentions stated in the national laws and plans will not or only partially be implemented.It is also important to mention that the current funding for water and sanitation is likely
5The indicators are available on: http://govindicators.org (29.02.2016)6In 2009, for instance, investments of additional US$ 20 million would have been required in order to
reach the MDGs according to [7]
7
Chapter 2 Drinking water provision and sanitation in Bolivia
to decrease during the next years. During the last ten years, the country benefited fromincreased mineral and natural gas exports. In combination with a prudent macroeconomicpolicy, the country managed to significantly expand public investments while maintainingcurrent account and fiscal surpluses. In the context of low international oil prices anddecreasing prices for gas, however, the government might be forced to cut its spendingin the near future [26]. Finally, the risk of political instability should also be mentioned.President Evo Morales will be in office until 2020. After the referendum from February 22nd
2016, he will not be able to run for presidency another time. At this moment, it is impossibleto predict how the political situation in Bolivia will evolve and how this will affect water andsanitation regulation.
Table 2.1: Worldwide Governance Indicators relevant for the implementation and enforcement of water andsanitation laws (2014).
Indicator Value Meaning
Voice and accountability 48.3/100 Extent to which the citizens are able to participate inselecting their government.
Government effectiveness 29.8/100 Quality of public and civil services, the quality of policyformulation and implementation, and the credibility ofthe government’s commitment to such policies.
Regulatory quality 20.2/100 Perceptions of the ability of the government to formulateand implement sound policies and regulations that permitand promote private sector development.
Rule of law 12.5/100 Extent to which agents abide by the rules of society, andin particular the quality of contract enforcement, propertyrights, the police, and the courts.
Control of Corruption 29.8/100 Extent to which public power is exercised for private gain,including both petty and grand forms of corruption, aswell as “capture” of the state by elites and private inter-ests.
2.2.3 Failure factors for the implementation of sanitation systems
This section presents three types of factors (technical, financial and social) that can preventthe large-scale implementation of sustainable sanitation systems in Bolivia, with a specialfocus on small towns. If not noted otherwise, all failure factors are taken from [14].
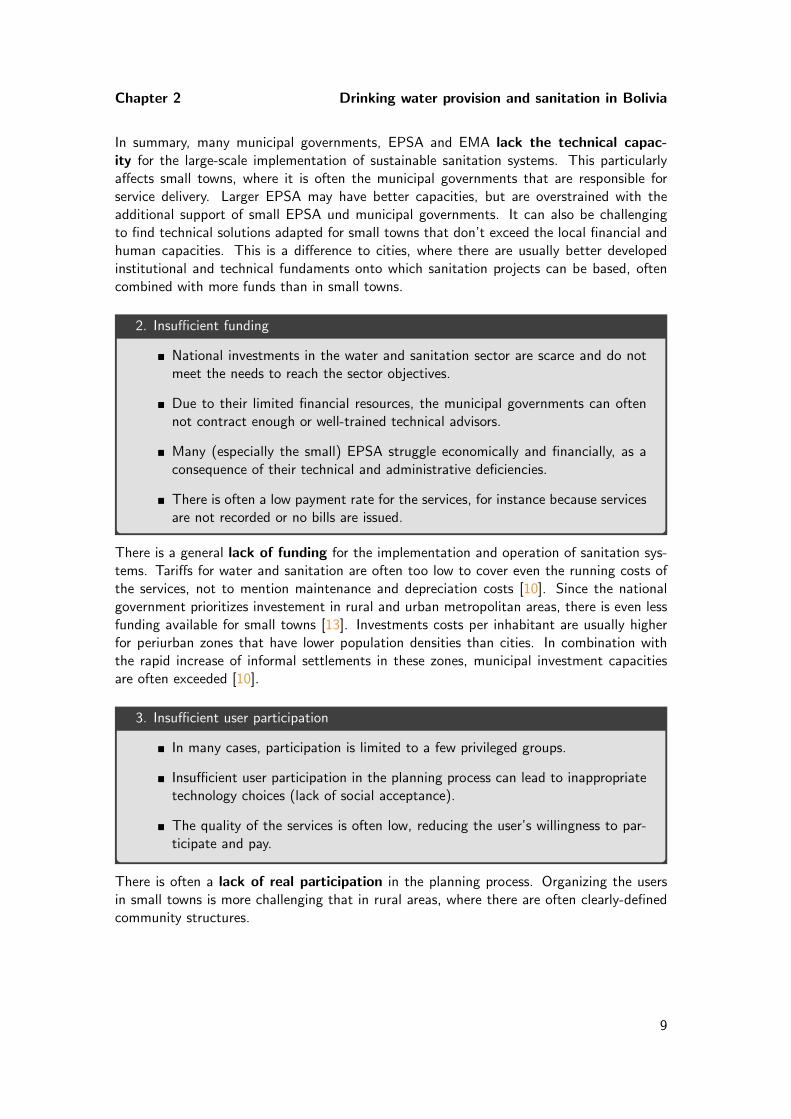
1. Insufficient technical and administrative capacities
� The majority of municipal governments, EPSA and EMA lack sufficient tech-nical personal and the capacity for project managment.
� In many municipalities, there are frequent changes of governments, which leadto short mandates of the technical advisors.
� A poor assessment of the technological options at the beginning of the planningprocess often leads to the use of insufficient or inapporiate technologies for agiven context.
8
Chapter 2 Drinking water provision and sanitation in Bolivia
In summary, many municipal governments, EPSA and EMA lack the technical capac-ity for the large-scale implementation of sustainable sanitation systems. This particularlyaffects small towns, where it is often the municipal governments that are responsible forservice delivery. Larger EPSA may have better capacities, but are overstrained with theadditional support of small EPSA und municipal governments. It can also be challengingto find technical solutions adapted for small towns that don’t exceed the local financial andhuman capacities. This is a difference to cities, where there are usually better developedinstitutional and technical fundaments onto which sanitation projects can be based, oftencombined with more funds than in small towns.
2. Insufficient funding
� National investments in the water and sanitation sector are scarce and do notmeet the needs to reach the sector objectives.
� Due to their limited financial resources, the municipal governments can oftennot contract enough or well-trained technical advisors.
� Many (especially the small) EPSA struggle economically and financially, as aconsequence of their technical and administrative deficiencies.
� There is often a low payment rate for the services, for instance because servicesare not recorded or no bills are issued.
There is a general lack of funding for the implementation and operation of sanitation sys-tems. Tariffs for water and sanitation are often too low to cover even the running costs ofthe services, not to mention maintenance and depreciation costs [10]. Since the nationalgovernment prioritizes investement in rural and urban metropolitan areas, there is even lessfunding available for small towns [13]. Investments costs per inhabitant are usually higherfor periurban zones that have lower population densities than cities. In combination withthe rapid increase of informal settlements in these zones, municipal investment capacitiesare often exceeded [10].
3. Insufficient user participation
� In many cases, participation is limited to a few privileged groups.
� Insufficient user participation in the planning process can lead to inappropriatetechnology choices (lack of social acceptance).
� The quality of the services is often low, reducing the user’s willingness to par-ticipate and pay.
There is often a lack of real participation in the planning process. Organizing the usersin small towns is more challenging that in rural areas, where there are often clearly-definedcommunity structures.
9
Chapter 2 Drinking water provision and sanitation in Bolivia
2.2.4 Success factors for the implementation of sanitation systems
After this short overview of the factors that can lead to the failure of the large-scale imple-mentation of sanitation systems in small towns, it is interesting to look at a few cases wherethe implementation succeeded.
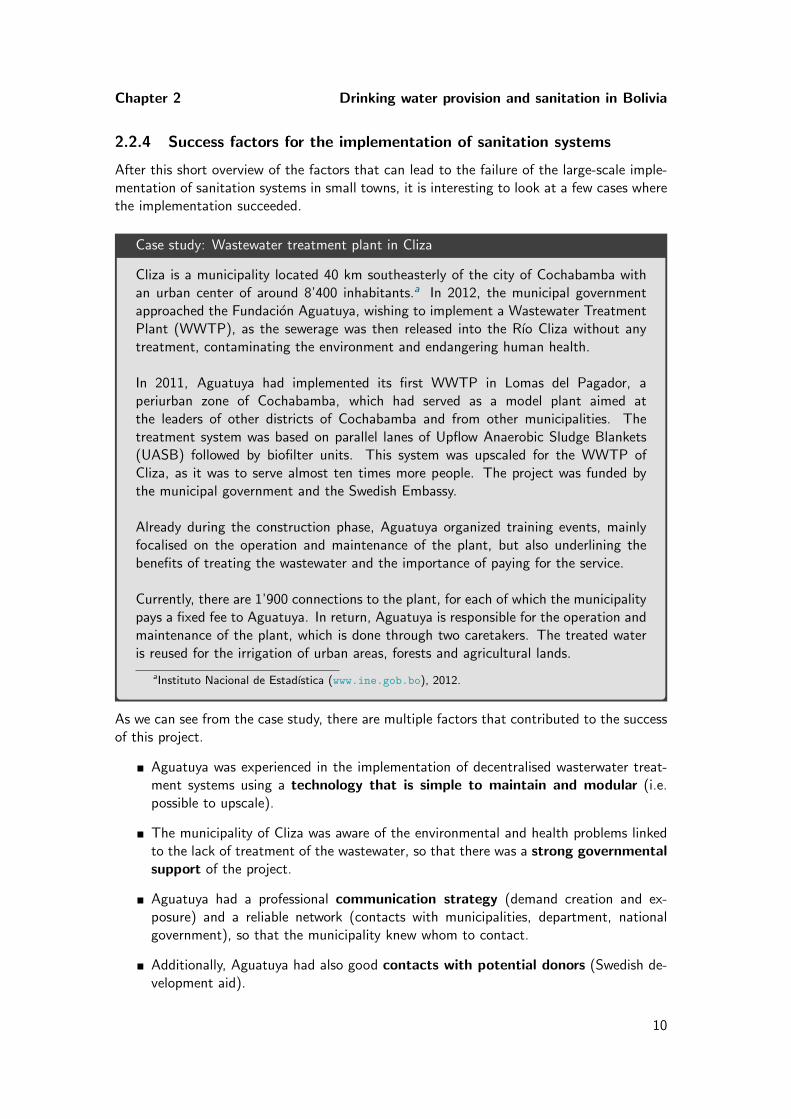
Case study: Wastewater treatment plant in Cliza
Cliza is a municipality located 40 km southeasterly of the city of Cochabamba withan urban center of around 8’400 inhabitants.a In 2012, the municipal governmentapproached the Fundacion Aguatuya, wishing to implement a Wastewater TreatmentPlant (WWTP), as the sewerage was then released into the Rıo Cliza without anytreatment, contaminating the environment and endangering human health.
In 2011, Aguatuya had implemented its first WWTP in Lomas del Pagador, aperiurban zone of Cochabamba, which had served as a model plant aimed atthe leaders of other districts of Cochabamba and from other municipalities. Thetreatment system was based on parallel lanes of Upflow Anaerobic Sludge Blankets(UASB) followed by biofilter units. This system was upscaled for the WWTP ofCliza, as it was to serve almost ten times more people. The project was funded bythe municipal government and the Swedish Embassy.
Already during the construction phase, Aguatuya organized training events, mainlyfocalised on the operation and maintenance of the plant, but also underlining thebenefits of treating the wastewater and the importance of paying for the service.
Currently, there are 1’900 connections to the plant, for each of which the municipalitypays a fixed fee to Aguatuya. In return, Aguatuya is responsible for the operation andmaintenance of the plant, which is done through two caretakers. The treated wateris reused for the irrigation of urban areas, forests and agricultural lands.
aInstituto Nacional de Estadıstica (www.ine.gob.bo), 2012.
As we can see from the case study, there are multiple factors that contributed to the successof this project.
� Aguatuya was experienced in the implementation of decentralised wasterwater treat-ment systems using a technology that is simple to maintain and modular (i.e.possible to upscale).
� The municipality of Cliza was aware of the environmental and health problems linkedto the lack of treatment of the wastewater, so that there was a strong governmentalsupport of the project.
� Aguatuya had a professional communication strategy (demand creation and ex-posure) and a reliable network (contacts with municipalities, department, nationalgovernment), so that the municipality knew whom to contact.
� Additionally, Aguatuya had also good contacts with potential donors (Swedish de-velopment aid).
10
Chapter 2 Drinking water provision and sanitation in Bolivia
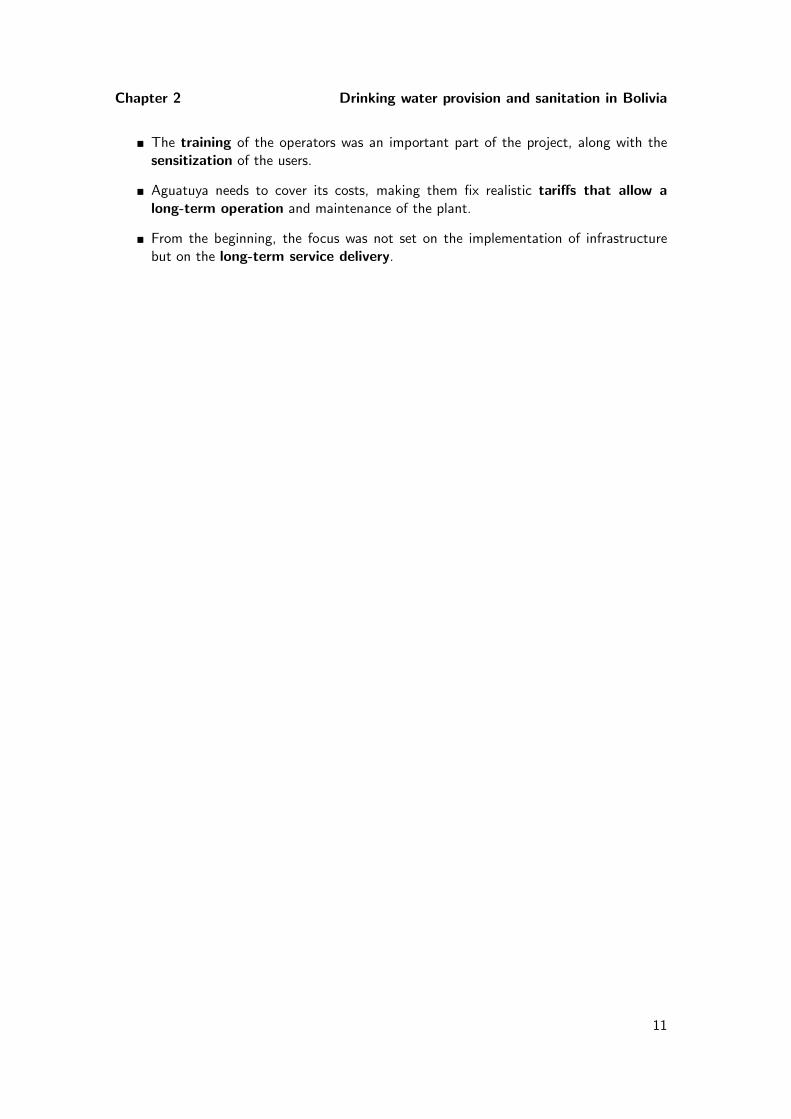
� The training of the operators was an important part of the project, along with thesensitization of the users.
� Aguatuya needs to cover its costs, making them fix realistic tariffs that allow along-term operation and maintenance of the plant.
� From the beginning, the focus was not set on the implementation of infrastructurebut on the long-term service delivery.
11
CHAPTER 3
Detailed assessment of the current situation
This chapter briefly presents the Municipality of Arbieto and introduces the UDDT projectthat will be the focus of the present report. The strategy used for data acquisition is de-scribed. Based on the collected data, the current drinking water and sanitation situation inthe project zone are analysed. The stakeholder analysis summarises the main characteristicsof the municipal authorities, civil society and ONGs present in the zone. Finally, the assess-ment of the enabling environment reviews the conditions for the implementation of a newsanitation service.
3.1 Geographic context
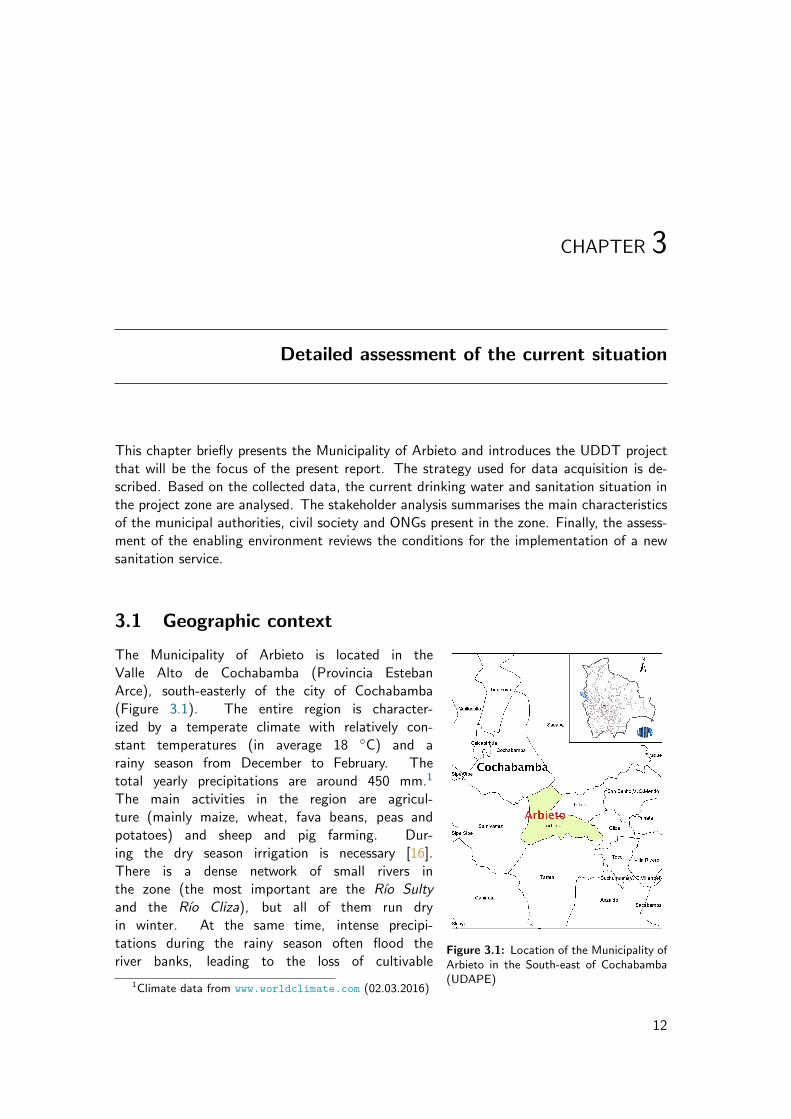
Figure 3.1: Location of the Municipality ofArbieto in the South-east of Cochabamba(UDAPE)
The Municipality of Arbieto is located in theValle Alto de Cochabamba (Provincia EstebanArce), south-easterly of the city of Cochabamba(Figure 3.1). The entire region is character-ized by a temperate climate with relatively con-stant temperatures (in average 18 ◦C) and arainy season from December to February. Thetotal yearly precipitations are around 450 mm.1
The main activities in the region are agricul-ture (mainly maize, wheat, fava beans, peas andpotatoes) and sheep and pig farming. Dur-ing the dry season irrigation is necessary [16].There is a dense network of small rivers inthe zone (the most important are the Rıo Sultyand the Rıo Cliza), but all of them run dryin winter. At the same time, intense precipi-tations during the rainy season often flood theriver banks, leading to the loss of cultivable
1Climate data from www.worldclimate.com (02.03.2016)
12
Chapter 3 Detailed assessment of the current situation
soils.
According to the national census of 2012 (Instituto Nacional de Estadıstica, INE), the mu-nicipality had just over 17’400 inhabitants, of which 5’400 lived in the urban centre. Theremaining 12’000 inhabitants lived in areas classified as rural.2
Arbieto politically consists of 57 so-called social organizations (Sindicatos Agrarios, OTBs3
and Urbanizaciones4) that are grouped in five Distritos and seven Subcentrales [17].
PLAN DE DESARROLLO TERRITORIAL AUTONOMO DE ARBIETO 15
1.5. DESCRIPCIÓN FISIOGRÁFICA
1.5.1 ALTIMETRIA y RELIEVE
En Arbieto se encuentran tres pisos altitudinales a saber:
Llanuras Aluviales comprendidas entre los 2.600 y 2.800 msnm que comprenden las
comunidades de la parte central. Estas tierras son de inundación meándrica de
los ríos Cliza y Sulty, presenta una dinámica actual de geoformas caracterizadas por
desbordamientos escasos y de corta duración, dentro de esta unidad se encuentran algunos
diques, que en algunos sectores son muy marcados y claramente diferenciados,
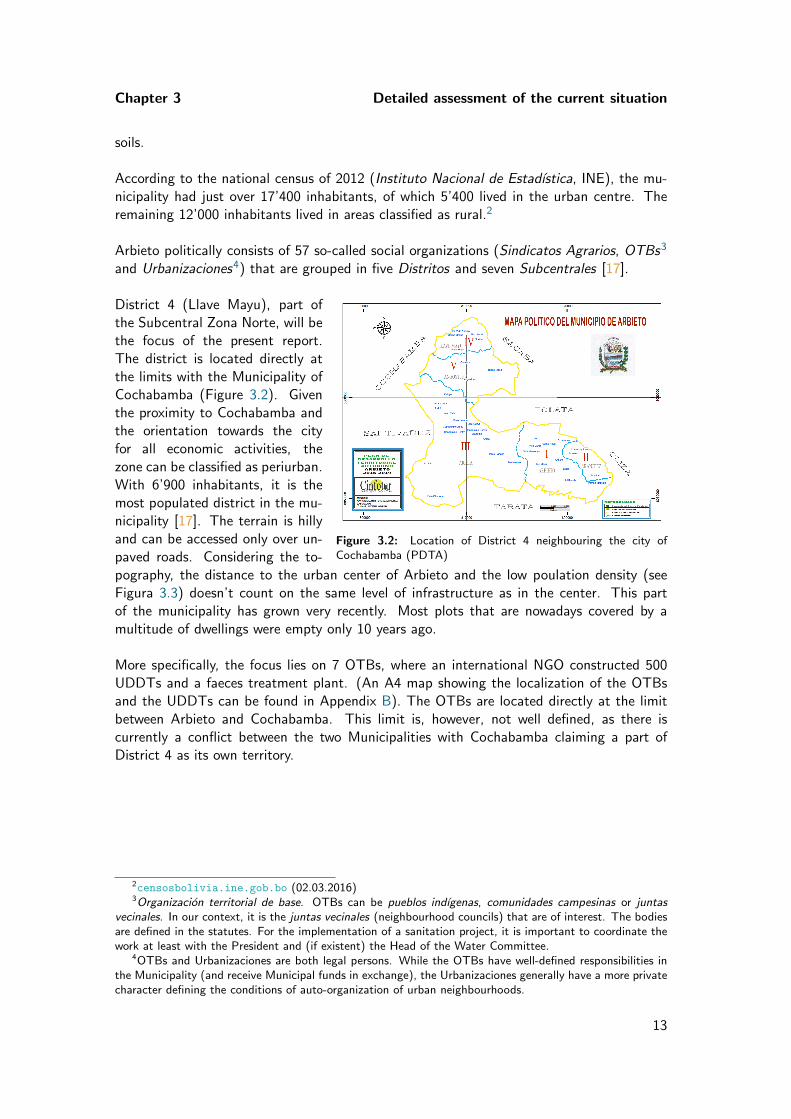
Figure 3.2: Location of District 4 neighbouring the city ofCochabamba (PDTA)
District 4 (Llave Mayu), part ofthe Subcentral Zona Norte, will bethe focus of the present report.The district is located directly atthe limits with the Municipality ofCochabamba (Figure 3.2). Giventhe proximity to Cochabamba andthe orientation towards the cityfor all economic activities, thezone can be classified as periurban.With 6’900 inhabitants, it is themost populated district in the mu-nicipality [17]. The terrain is hillyand can be accessed only over un-paved roads. Considering the to-pography, the distance to the urban center of Arbieto and the low poulation density (seeFigura 3.3) doesn’t count on the same level of infrastructure as in the center. This partof the municipality has grown very recently. Most plots that are nowadays covered by amultitude of dwellings were empty only 10 years ago.
More specifically, the focus lies on 7 OTBs, where an international NGO constructed 500UDDTs and a faeces treatment plant. (An A4 map showing the localization of the OTBsand the UDDTs can be found in Appendix B). The OTBs are located directly at the limitbetween Arbieto and Cochabamba. This limit is, however, not well defined, as there iscurrently a conflict between the two Municipalities with Cochabamba claiming a part ofDistrict 4 as its own territory.
2censosbolivia.ine.gob.bo (02.03.2016)3Organizacion territorial de base. OTBs can be pueblos indıgenas, comunidades campesinas or juntas
vecinales. In our context, it is the juntas vecinales (neighbourhood councils) that are of interest. The bodiesare defined in the statutes. For the implementation of a sanitation project, it is important to coordinate thework at least with the President and (if existent) the Head of the Water Committee.
4OTBs and Urbanizaciones are both legal persons. While the OTBs have well-defined responsibilities inthe Municipality (and receive Municipal funds in exchange), the Urbanizaciones generally have a more privatecharacter defining the conditions of auto-organization of urban neighbourhoods.
13
Chapter 3 Detailed assessment of the current situation
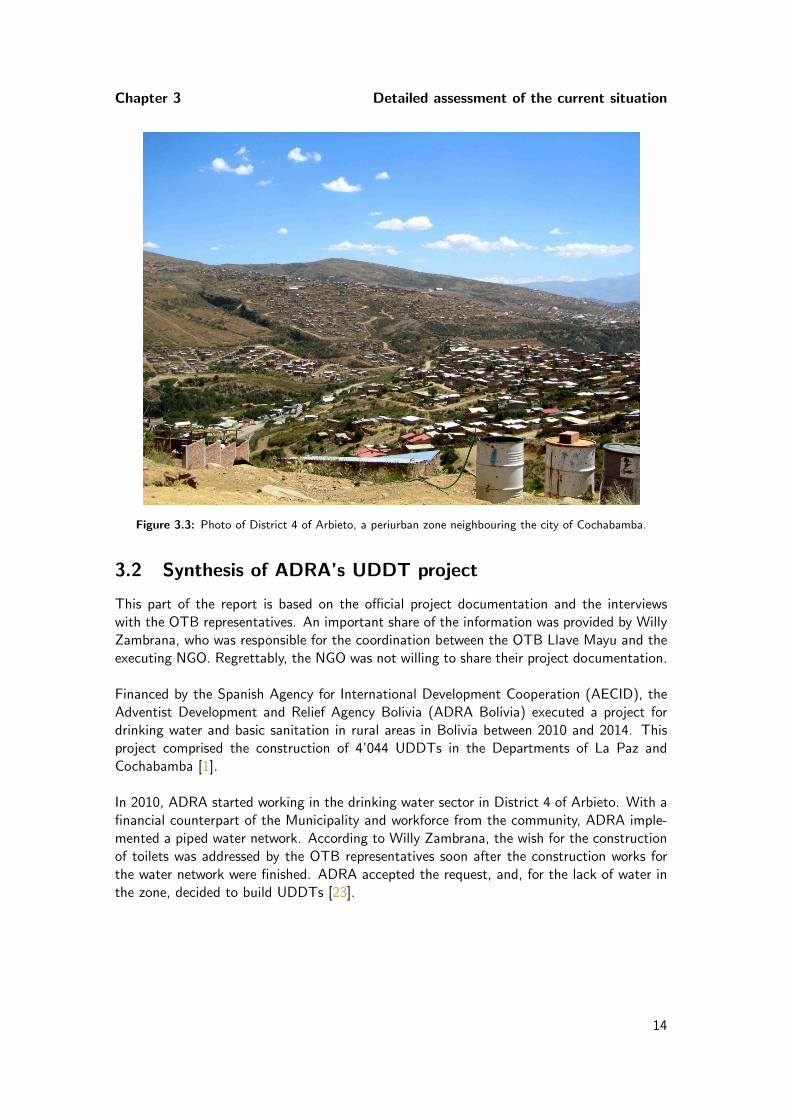
Figure 3.3: Photo of District 4 of Arbieto, a periurban zone neighbouring the city of Cochabamba.
3.2 Synthesis of ADRA’s UDDT project
This part of the report is based on the official project documentation and the interviewswith the OTB representatives. An important share of the information was provided by WillyZambrana, who was responsible for the coordination between the OTB Llave Mayu and theexecuting NGO. Regrettably, the NGO was not willing to share their project documentation.
Financed by the Spanish Agency for International Development Cooperation (AECID), theAdventist Development and Relief Agency Bolivia (ADRA Bolivia) executed a project fordrinking water and basic sanitation in rural areas in Bolivia between 2010 and 2014. Thisproject comprised the construction of 4’044 UDDTs in the Departments of La Paz andCochabamba [1].
In 2010, ADRA started working in the drinking water sector in District 4 of Arbieto. With afinancial counterpart of the Municipality and workforce from the community, ADRA imple-mented a piped water network. According to Willy Zambrana, the wish for the constructionof toilets was addressed by the OTB representatives soon after the construction works forthe water network were finished. ADRA accepted the request, and, for the lack of water inthe zone, decided to build UDDTs [23].
14
Chapter 3 Detailed assessment of the current situation
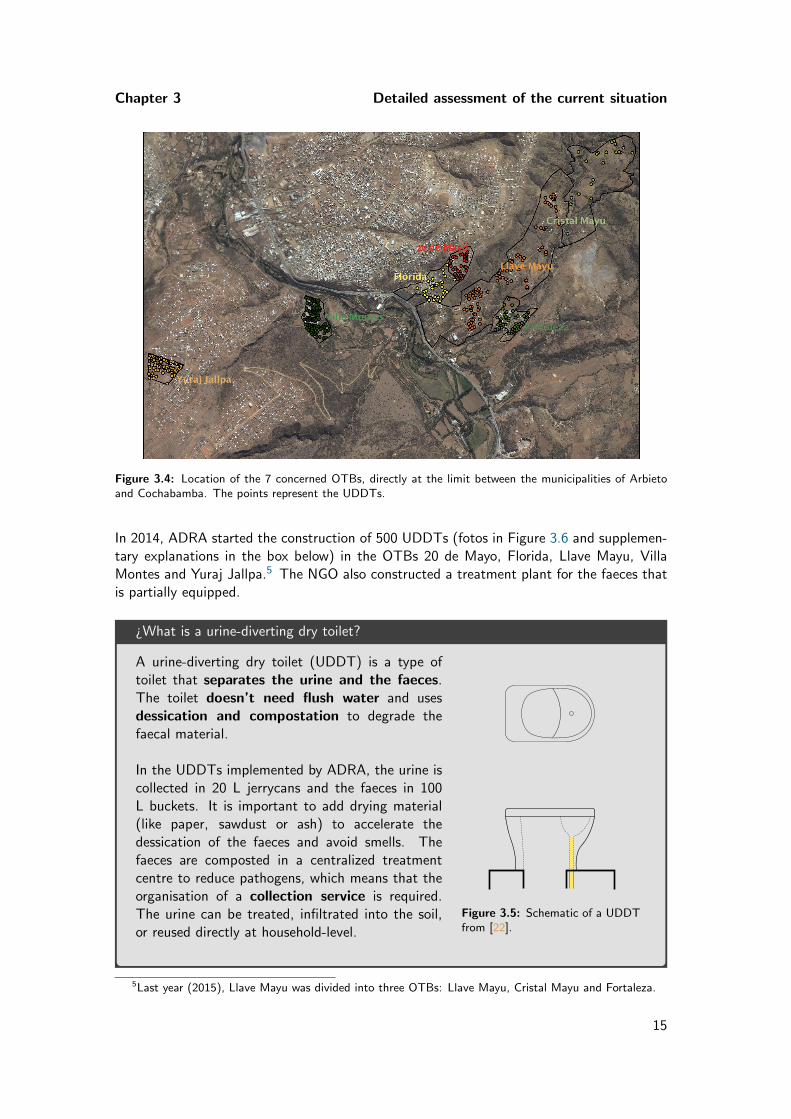
Figure 3.4: Location of the 7 concerned OTBs, directly at the limit between the municipalities of Arbietoand Cochabamba. The points represent the UDDTs.
In 2014, ADRA started the construction of 500 UDDTs (fotos in Figure 3.6 and supplemen-tary explanations in the box below) in the OTBs 20 de Mayo, Florida, Llave Mayu, VillaMontes and Yuraj Jallpa.5 The NGO also constructed a treatment plant for the faeces thatis partially equipped.
¿What is a urine-diverting dry toilet?
A urine-diverting dry toilet (UDDT) is a type oftoilet that separates the urine and the faeces.The toilet doesn’t need flush water and usesdessication and compostation to degrade thefaecal material.
In the UDDTs implemented by ADRA, the urine iscollected in 20 L jerrycans and the faeces in 100L buckets. It is important to add drying material(like paper, sawdust or ash) to accelerate thedessication of the faeces and avoid smells. Thefaeces are composted in a centralized treatmentcentre to reduce pathogens, which means that theorganisation of a collection service is required.The urine can be treated, infiltrated into the soil,or reused directly at household-level.
Com
pen
diu
m o
f San
itatio
n Sy
stem
s an
d T
echn
olog
ies
Func
tiona
l Gro
up U
: Use
r In
terf
ace
46
Urine-Diverting Dry Toilet (UDDT)
Inputs: Faeces Urine( Anal Cleansing Water)( Dry Cleansing Materials)
Outputs: Faeces (+ Dry Cleansing Materials) Urine ( Anal Cleansing Water)U2: URINE DIVERTING DRY TOILET (UDDT)
option 2option 1 urine
for wipers for washers
urine option 3 urineanal cleansing water
Applicable to:System 4
A urine-diverting dry toilet (UDDT) is a toilet that operates without water and has a divider so that the user, with little effort, can divert the urine away from the faeces.
The UDDT is built such that urine is collected and drained from the front area of the toilet, while faeces fall through a large chute (hole) in the back. Depending on the Collection and Storage/Treatment technology that follows, drying material such as lime, ash or earth should be added into the same hole after defecating.
Design Considerations It is important that the two sections of the toilet are well separated to ensure that a) faeces do not fall into and clog the urine collection area in the front, and that b) urine does not splash down into the dry area of the toilet.There are also 3-hole separating toilets that allow anal cleansing water to go into a third, dedicated basin sepa-rate from the urine drain and faeces collection. Both a pedestal and a squat slab can be used to sepa-rate urine from faeces depending on user preference.Urine tends to rust most metals; therefore, metals should be avoided in the construction and piping of the
UDDT. To limit scaling, all connections (pipes) to stor-age tanks should be kept as short as possible; whenever they exist, pipes should be installed with at least a 1% slope, and sharp angles (90°) should be avoided. A pipe diameter of 50 mm is sufficient for steep slopes and where maintenance is easy. Larger diameter pipes (> 75 mm) should be used elsewhere, especially for minimum slopes, and where access is difficult.To prevent odours from coming back up the pipe, an odour seal should be installed at the urine drain.
Appropriateness The UDDT is simple to design and build, using such materials as concrete and wire mesh or plastic. The UDDT design can be altered to suit the needs of specific populations (i.e., smaller for children, people who prefer to squat, etc.).
Health Aspects/Acceptance The UDDT is not intuitive or immediately obvious to some users. At first, users may be hesitant about using it, and mistakes made (e.g., faeces in the urine bowl) may deter others from accepting this type of toilet as well. Demonstra-tion projects and training are essential to achieve good acceptance with users. For better acceptance of the
U.2
Figure 3.5: Schematic of a UDDTfrom [22].
5Last year (2015), Llave Mayu was divided into three OTBs: Llave Mayu, Cristal Mayu and Fortaleza.
15
Chapter 3 Detailed assessment of the current situation
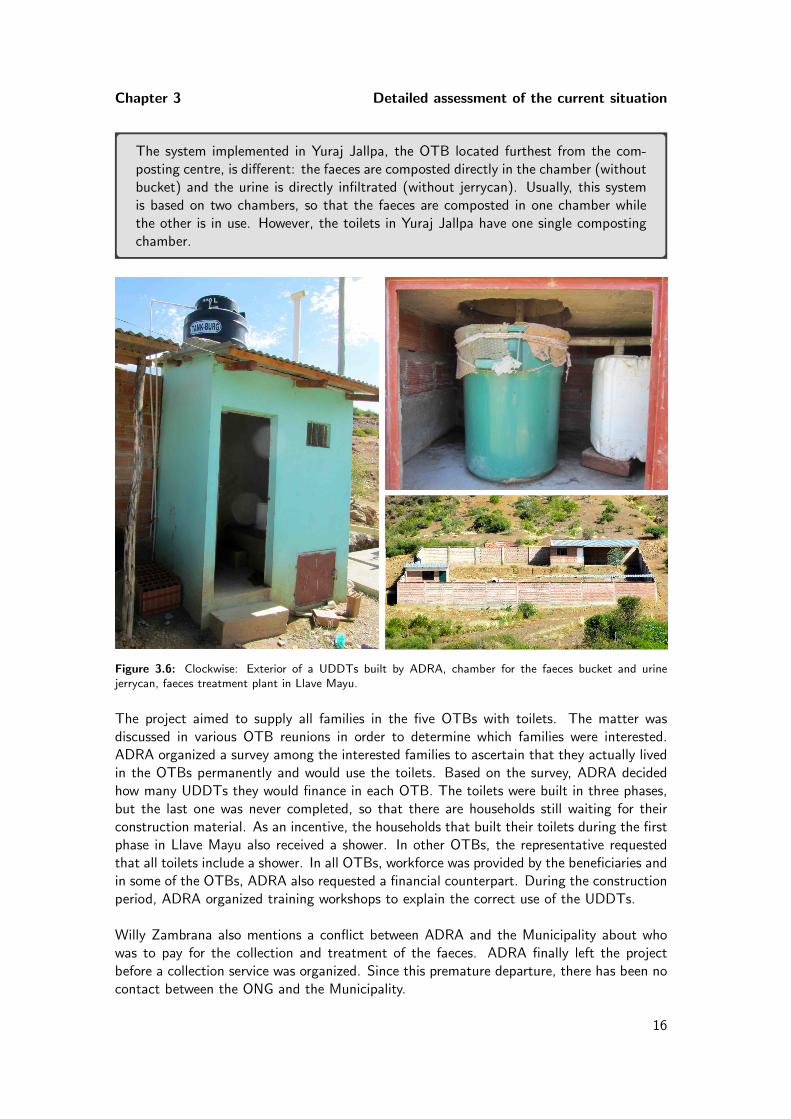
The system implemented in Yuraj Jallpa, the OTB located furthest from the com-posting centre, is different: the faeces are composted directly in the chamber (withoutbucket) and the urine is directly infiltrated (without jerrycan). Usually, this systemis based on two chambers, so that the faeces are composted in one chamber whilethe other is in use. However, the toilets in Yuraj Jallpa have one single compostingchamber.
Figure 3.6: Clockwise: Exterior of a UDDTs built by ADRA, chamber for the faeces bucket and urinejerrycan, faeces treatment plant in Llave Mayu.
The project aimed to supply all families in the five OTBs with toilets. The matter wasdiscussed in various OTB reunions in order to determine which families were interested.ADRA organized a survey among the interested families to ascertain that they actually livedin the OTBs permanently and would use the toilets. Based on the survey, ADRA decidedhow many UDDTs they would finance in each OTB. The toilets were built in three phases,but the last one was never completed, so that there are households still waiting for theirconstruction material. As an incentive, the households that built their toilets during the firstphase in Llave Mayu also received a shower. In other OTBs, the representative requestedthat all toilets include a shower. In all OTBs, workforce was provided by the beneficiaries andin some of the OTBs, ADRA also requested a financial counterpart. During the constructionperiod, ADRA organized training workshops to explain the correct use of the UDDTs.
Willy Zambrana also mentions a conflict between ADRA and the Municipality about whowas to pay for the collection and treatment of the faeces. ADRA finally left the projectbefore a collection service was organized. Since this premature departure, there has been nocontact between the ONG and the Municipality.
16
Chapter 3 Detailed assessment of the current situation
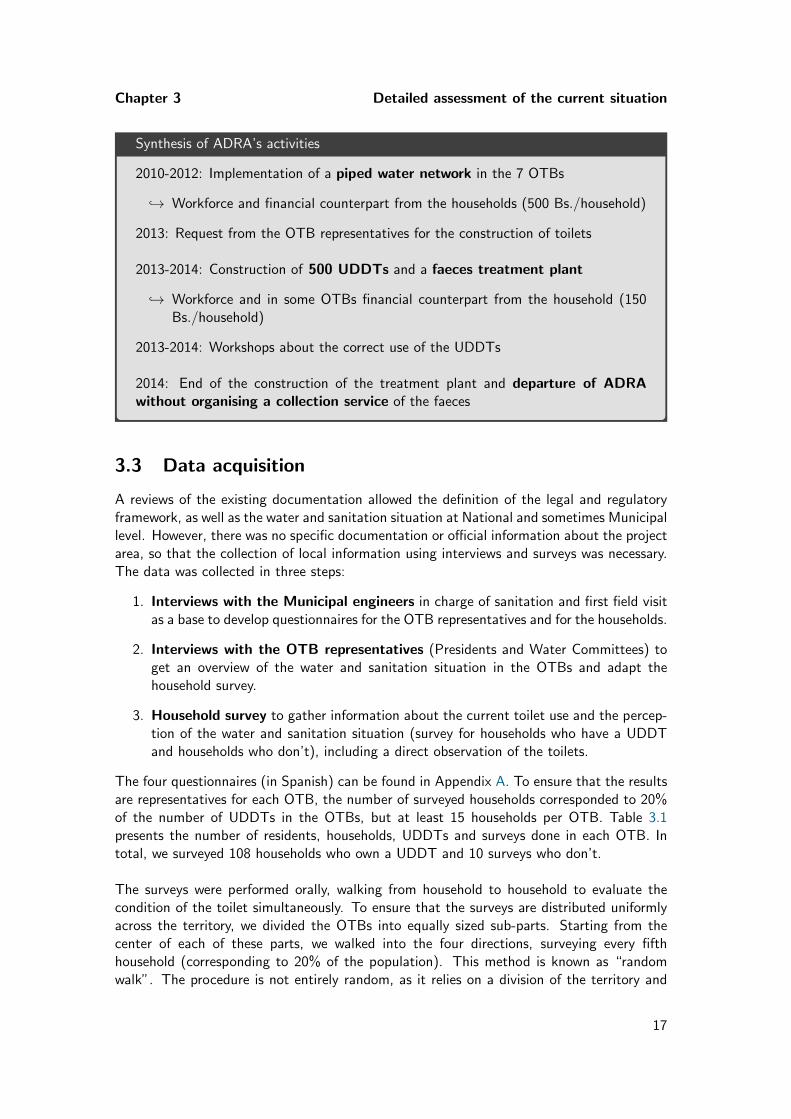
Synthesis of ADRA’s activities
2010-2012: Implementation of a piped water network in the 7 OTBs
↪→ Workforce and financial counterpart from the households (500 Bs./household)
2013: Request from the OTB representatives for the construction of toilets
2013-2014: Construction of 500 UDDTs and a faeces treatment plant
↪→ Workforce and in some OTBs financial counterpart from the household (150Bs./household)
2013-2014: Workshops about the correct use of the UDDTs
2014: End of the construction of the treatment plant and departure of ADRAwithout organising a collection service of the faeces
3.3 Data acquisition
A reviews of the existing documentation allowed the definition of the legal and regulatoryframework, as well as the water and sanitation situation at National and sometimes Municipallevel. However, there was no specific documentation or official information about the projectarea, so that the collection of local information using interviews and surveys was necessary.The data was collected in three steps:
1. Interviews with the Municipal engineers in charge of sanitation and first field visitas a base to develop questionnaires for the OTB representatives and for the households.
2. Interviews with the OTB representatives (Presidents and Water Committees) toget an overview of the water and sanitation situation in the OTBs and adapt thehousehold survey.
3. Household survey to gather information about the current toilet use and the percep-tion of the water and sanitation situation (survey for households who have a UDDTand households who don’t), including a direct observation of the toilets.
The four questionnaires (in Spanish) can be found in Appendix A. To ensure that the resultsare representatives for each OTB, the number of surveyed households corresponded to 20%of the number of UDDTs in the OTBs, but at least 15 households per OTB. Table 3.1presents the number of residents, households, UDDTs and surveys done in each OTB. Intotal, we surveyed 108 households who own a UDDT and 10 surveys who don’t.
The surveys were performed orally, walking from household to household to evaluate thecondition of the toilet simultaneously. To ensure that the surveys are distributed uniformlyacross the territory, we divided the OTBs into equally sized sub-parts. Starting from thecenter of each of these parts, we walked into the four directions, surveying every fifthhousehold (corresponding to 20% of the population). This method is known as “randomwalk”. The procedure is not entirely random, as it relies on a division of the territory and
17
Chapter 3 Detailed assessment of the current situation
a selection of departure points depending on the interviewer. It is, however, a compromisebetween its simplicity and a simple random sample, where we’d have randomly selected20% of the households from a complete list of the residents. As some families were notpermanently present in the zone, it was not always possible to survey exactly every fifthhouseholds, which might distort some of the results.
Table 3.1: Number of residents, households and UDDTs in the 7 OTBs as communicated by the OTBrepresentatives. Number of households with UDDT surveyed: 20% of the households owning a UDDT, butat least 15 in each OTB. Number of households without UDDT surveyed: 5 in two OTBs.
OTB Residentsa Households b UDDTsc # of surveyswith UDDT
# of sur-veys withoutUDDT
20 de Mayo 500 74 48 15 0Cristal Mayu 500 130 13 0d 0Florida 500 133 40 15 0Fortaleza 350 87 50 15 5Llave Mayu 1500 250 120 24 5Villa Montes 400 135 117 23 0Yuraj Jallpa 500 104 80 16 0
aEstimated by the OTB representatives, as no official information exists.bThe number of households corresponds to the number of OTB members (socios). However, not all OTB
members live permanently in the area.cThe number of UDDTs is overestimated, as some households received construction materials from ADRA
without building the toilets.dWe could not survey any household in the OTB Cristal Mayu, as there were no people present during
the survey campaign. However, there are only 13 UDDTs in the OTB.
3.4 Water and sanitation services in the project area
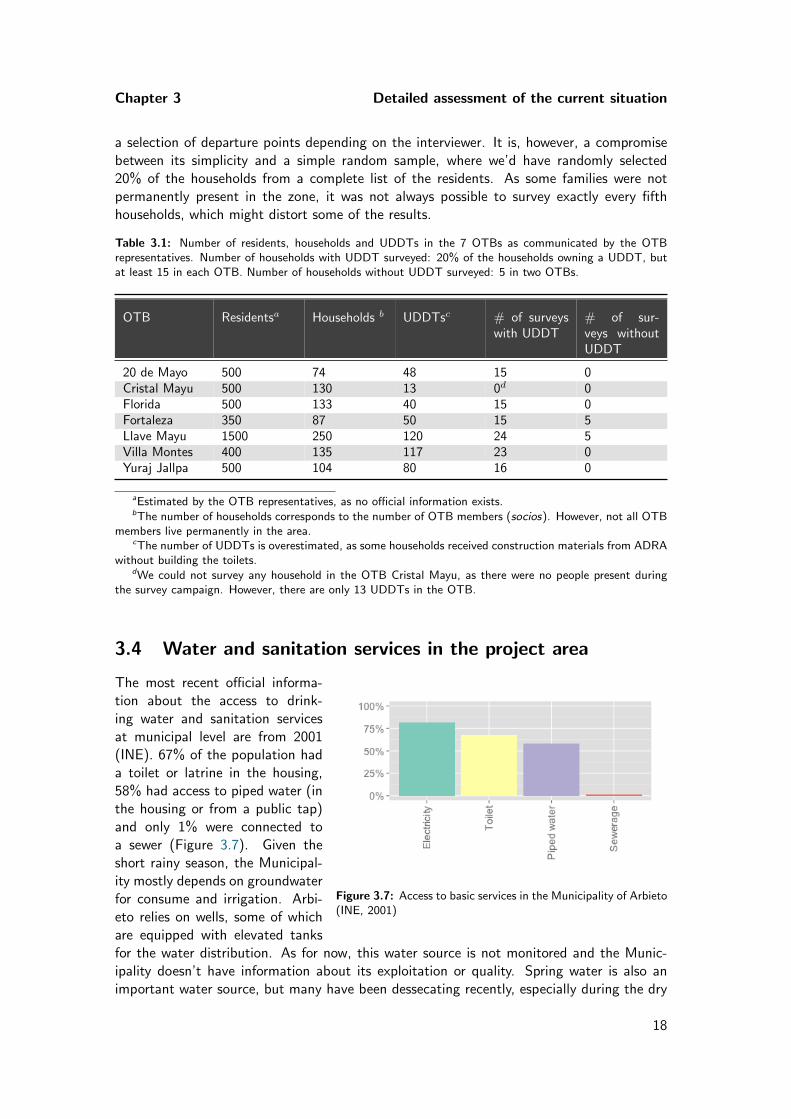
Figure 3.7: Access to basic services in the Municipality of Arbieto(INE, 2001)
The most recent official informa-tion about the access to drink-ing water and sanitation servicesat municipal level are from 2001(INE). 67% of the population hada toilet or latrine in the housing,58% had access to piped water (inthe housing or from a public tap)and only 1% were connected toa sewer (Figure 3.7). Given theshort rainy season, the Municipal-ity mostly depends on groundwaterfor consume and irrigation. Arbi-eto relies on wells, some of whichare equipped with elevated tanksfor the water distribution. As for now, this water source is not monitored and the Munic-ipality doesn’t have information about its exploitation or quality. Spring water is also animportant water source, but many have been dessecating recently, especially during the dry
18
Chapter 3 Detailed assessment of the current situation
season [17].
Figure 3.8: Disposal of solid waste in the Municipality of Arbieto(INE, 2012).
The INE published indexes aboutthe disposal of solid waste in 2012,when only 5% of the inhabitantsdeposited their waste in public con-tainers or used a public collectionservice. In contrast, 14% dumpedit into the rivers and 71% burntit (Figure 3.8). There’s no sani-tary landfill in the Municipality, sothat all collected waste ends up ina dump [17]. According to a di-agnostic by the GAM Project, therecollection service only serves 4%of the population, which is the low-est coverage among all municipal-ities in the Valle Alto [8]. Moreover, the collection system is not viable, as all costs arecovered exclusively by the Municipal government [17].
The Municipality does not have indexes related to water and sanitation services per districtor per OTB, so that all information presented in the following sections is based on theinterviews with the OTB representatives and the household surveys.
3.4.1 Water supply
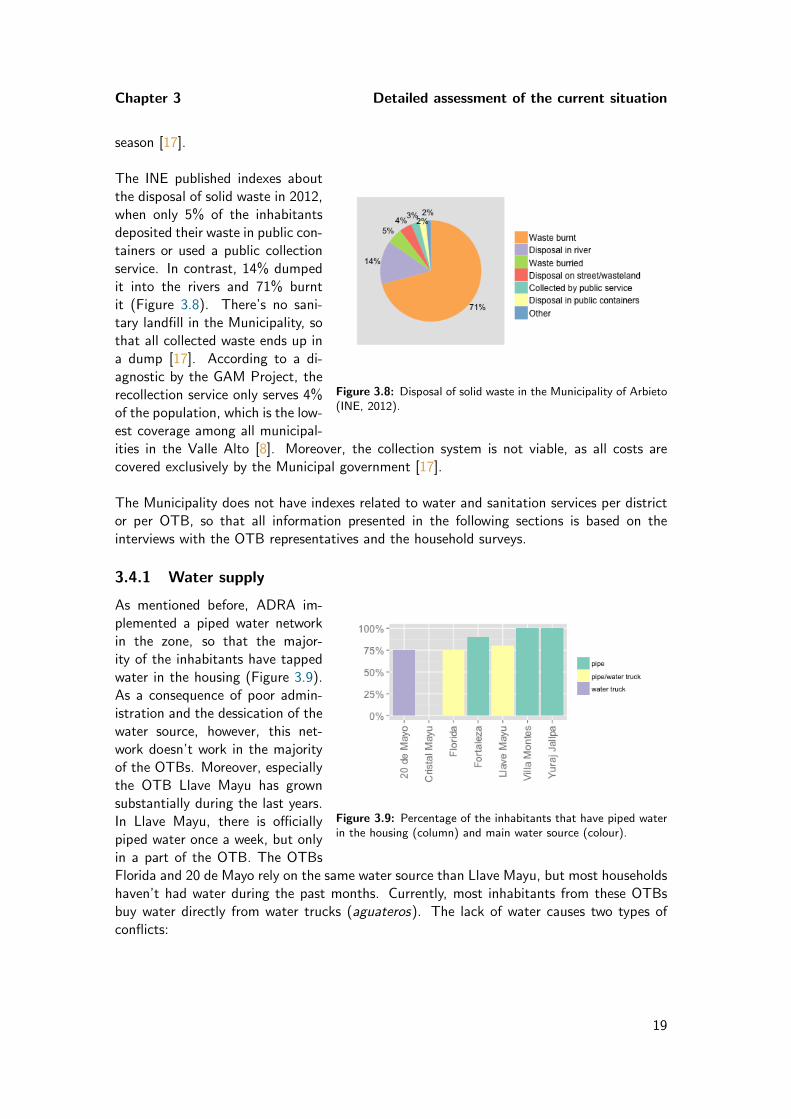
Figure 3.9: Percentage of the inhabitants that have piped waterin the housing (column) and main water source (colour).
As mentioned before, ADRA im-plemented a piped water networkin the zone, so that the major-ity of the inhabitants have tappedwater in the housing (Figure 3.9).As a consequence of poor admin-istration and the dessication of thewater source, however, this net-work doesn’t work in the majorityof the OTBs. Moreover, especiallythe OTB Llave Mayu has grownsubstantially during the last years.In Llave Mayu, there is officiallypiped water once a week, but onlyin a part of the OTB. The OTBsFlorida and 20 de Mayo rely on the same water source than Llave Mayu, but most householdshaven’t had water during the past months. Currently, most inhabitants from these OTBsbuy water directly from water trucks (aguateros). The lack of water causes two types ofconflicts:
19
Chapter 3 Detailed assessment of the current situation
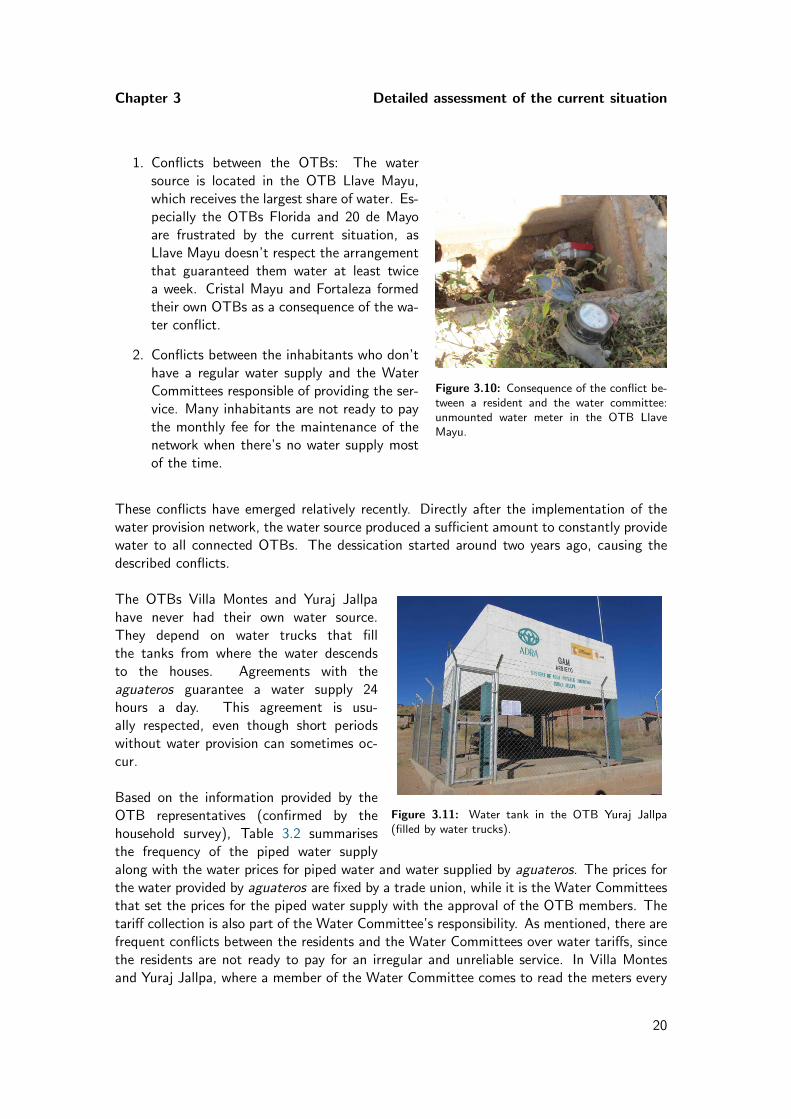
1. Conflicts between the OTBs: The watersource is located in the OTB Llave Mayu,which receives the largest share of water. Es-pecially the OTBs Florida and 20 de Mayoare frustrated by the current situation, asLlave Mayu doesn’t respect the arrangementthat guaranteed them water at least twicea week. Cristal Mayu and Fortaleza formedtheir own OTBs as a consequence of the wa-ter conflict.
2. Conflicts between the inhabitants who don’thave a regular water supply and the WaterCommittees responsible of providing the ser-vice. Many inhabitants are not ready to paythe monthly fee for the maintenance of thenetwork when there’s no water supply mostof the time.
Figure 3.10: Consequence of the conflict be-tween a resident and the water committee:unmounted water meter in the OTB LlaveMayu.
These conflicts have emerged relatively recently. Directly after the implementation of thewater provision network, the water source produced a sufficient amount to constantly providewater to all connected OTBs. The dessication started around two years ago, causing thedescribed conflicts.
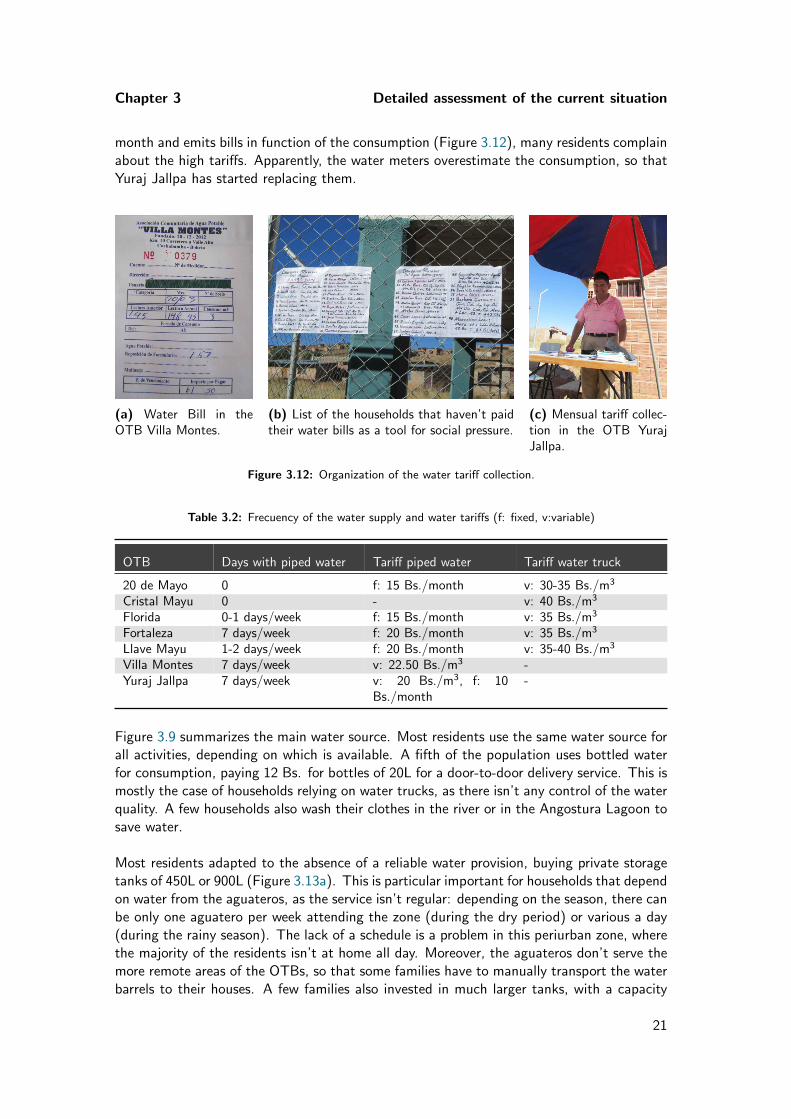
Figure 3.11: Water tank in the OTB Yuraj Jallpa(filled by water trucks).
The OTBs Villa Montes and Yuraj Jallpahave never had their own water source.They depend on water trucks that fillthe tanks from where the water descendsto the houses. Agreements with theaguateros guarantee a water supply 24hours a day. This agreement is usu-ally respected, even though short periodswithout water provision can sometimes oc-cur.
Based on the information provided by theOTB representatives (confirmed by thehousehold survey), Table 3.2 summarisesthe frequency of the piped water supplyalong with the water prices for piped water and water supplied by aguateros. The prices forthe water provided by aguateros are fixed by a trade union, while it is the Water Committeesthat set the prices for the piped water supply with the approval of the OTB members. Thetariff collection is also part of the Water Committee’s responsibility. As mentioned, there arefrequent conflicts between the residents and the Water Committees over water tariffs, sincethe residents are not ready to pay for an irregular and unreliable service. In Villa Montesand Yuraj Jallpa, where a member of the Water Committee comes to read the meters every
20
Chapter 3 Detailed assessment of the current situation
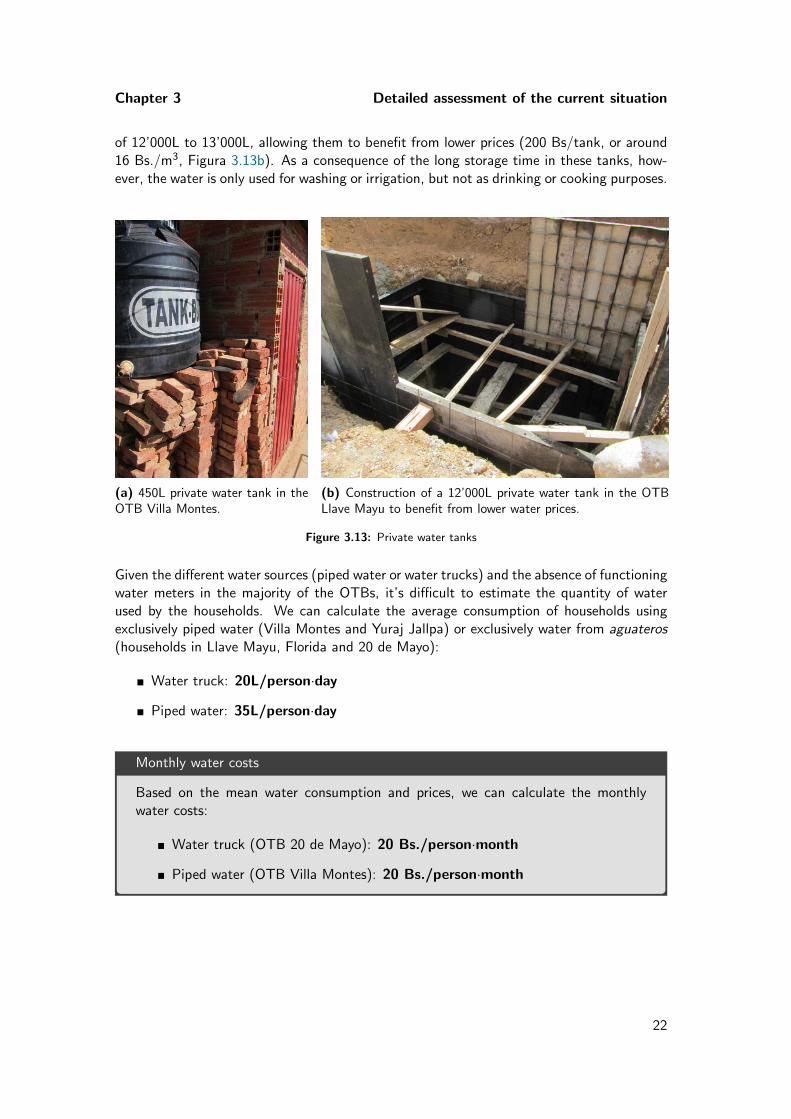
month and emits bills in function of the consumption (Figure 3.12), many residents complainabout the high tariffs. Apparently, the water meters overestimate the consumption, so thatYuraj Jallpa has started replacing them.
(a) Water Bill in theOTB Villa Montes.
(b) List of the households that haven’t paidtheir water bills as a tool for social pressure.
(c) Mensual tariff collec-tion in the OTB YurajJallpa.
Figure 3.12: Organization of the water tariff collection.
Table 3.2: Frecuency of the water supply and water tariffs (f: fixed, v:variable)
OTB Days with piped water Tariff piped water Tariff water truck
20 de Mayo 0 f: 15 Bs./month v: 30-35 Bs./m3
Cristal Mayu 0 - v: 40 Bs./m3
Florida 0-1 days/week f: 15 Bs./month v: 35 Bs./m3
Fortaleza 7 days/week f: 20 Bs./month v: 35 Bs./m3
Llave Mayu 1-2 days/week f: 20 Bs./month v: 35-40 Bs./m3
Villa Montes 7 days/week v: 22.50 Bs./m3 -Yuraj Jallpa 7 days/week v: 20 Bs./m3, f: 10
Bs./month-
Figure 3.9 summarizes the main water source. Most residents use the same water source forall activities, depending on which is available. A fifth of the population uses bottled waterfor consumption, paying 12 Bs. for bottles of 20L for a door-to-door delivery service. This ismostly the case of households relying on water trucks, as there isn’t any control of the waterquality. A few households also wash their clothes in the river or in the Angostura Lagoon tosave water.
Most residents adapted to the absence of a reliable water provision, buying private storagetanks of 450L or 900L (Figure 3.13a). This is particular important for households that dependon water from the aguateros, as the service isn’t regular: depending on the season, there canbe only one aguatero per week attending the zone (during the dry period) or various a day(during the rainy season). The lack of a schedule is a problem in this periurban zone, wherethe majority of the residents isn’t at home all day. Moreover, the aguateros don’t serve themore remote areas of the OTBs, so that some families have to manually transport the waterbarrels to their houses. A few families also invested in much larger tanks, with a capacity
21
Chapter 3 Detailed assessment of the current situation
of 12’000L to 13’000L, allowing them to benefit from lower prices (200 Bs/tank, or around16 Bs./m3, Figura 3.13b). As a consequence of the long storage time in these tanks, how-ever, the water is only used for washing or irrigation, but not as drinking or cooking purposes.
(a) 450L private water tank in theOTB Villa Montes.
(b) Construction of a 12’000L private water tank in the OTBLlave Mayu to benefit from lower water prices.
Figure 3.13: Private water tanks
Given the different water sources (piped water or water trucks) and the absence of functioningwater meters in the majority of the OTBs, it’s difficult to estimate the quantity of waterused by the households. We can calculate the average consumption of households usingexclusively piped water (Villa Montes and Yuraj Jallpa) or exclusively water from aguateros(households in Llave Mayu, Florida and 20 de Mayo):
� Water truck: 20L/person·day
� Piped water: 35L/person·day
Monthly water costs
Based on the mean water consumption and prices, we can calculate the monthlywater costs:
� Water truck (OTB 20 de Mayo): 20 Bs./person·month
� Piped water (OTB Villa Montes): 20 Bs./person·month
22
Chapter 3 Detailed assessment of the current situation
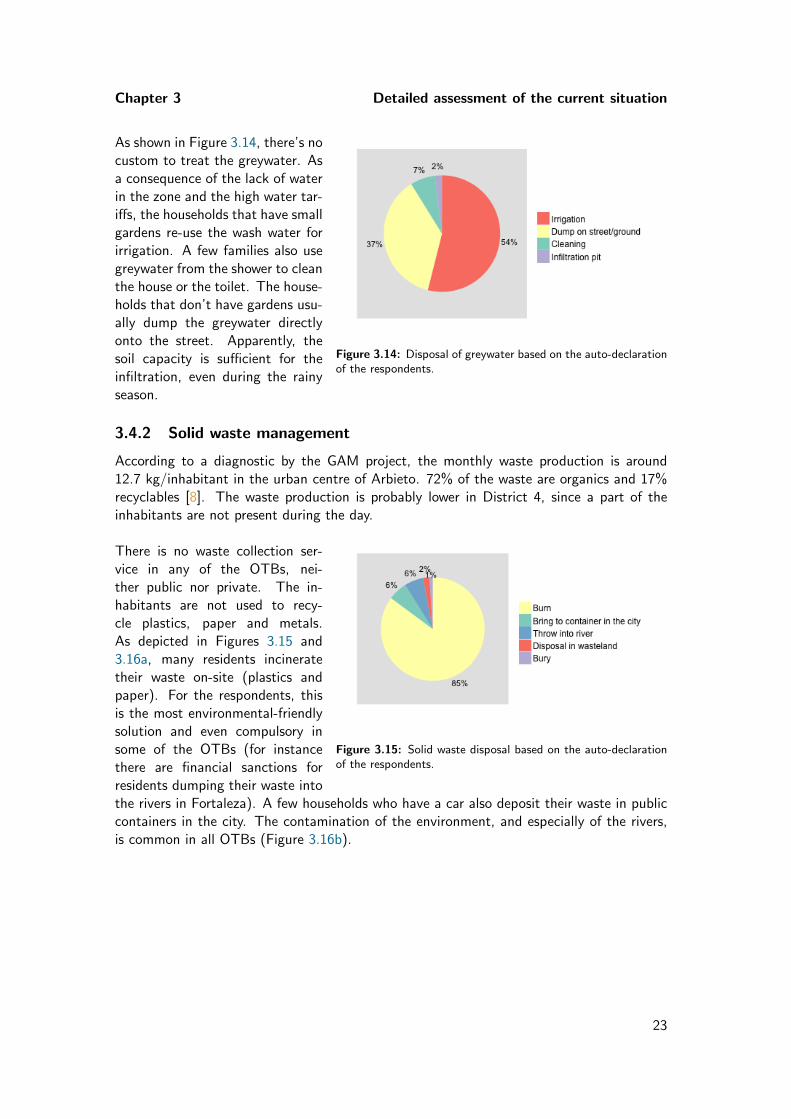
Figure 3.14: Disposal of greywater based on the auto-declarationof the respondents.
As shown in Figure 3.14, there’s nocustom to treat the greywater. Asa consequence of the lack of waterin the zone and the high water tar-iffs, the households that have smallgardens re-use the wash water forirrigation. A few families also usegreywater from the shower to cleanthe house or the toilet. The house-holds that don’t have gardens usu-ally dump the greywater directlyonto the street. Apparently, thesoil capacity is sufficient for theinfiltration, even during the rainyseason.
3.4.2 Solid waste management
According to a diagnostic by the GAM project, the monthly waste production is around12.7 kg/inhabitant in the urban centre of Arbieto. 72% of the waste are organics and 17%recyclables [8]. The waste production is probably lower in District 4, since a part of theinhabitants are not present during the day.
Figure 3.15: Solid waste disposal based on the auto-declarationof the respondents.
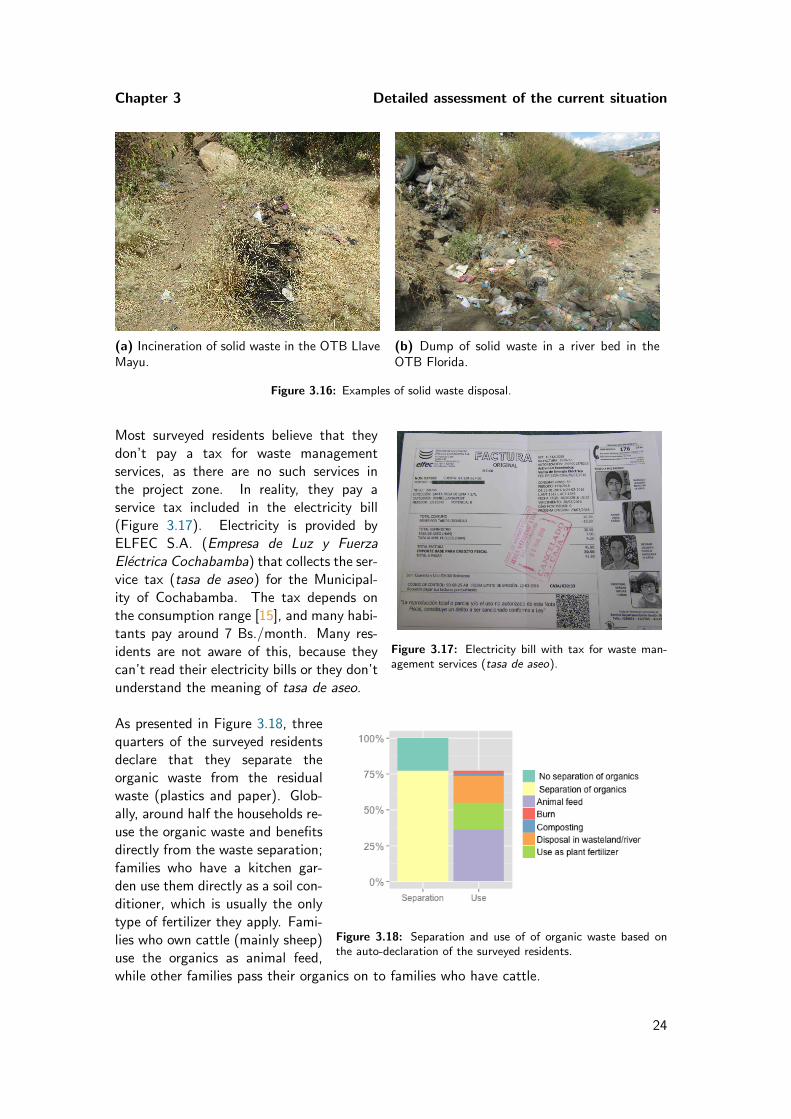
There is no waste collection ser-vice in any of the OTBs, nei-ther public nor private. The in-habitants are not used to recy-cle plastics, paper and metals.As depicted in Figures 3.15 and3.16a, many residents incineratetheir waste on-site (plastics andpaper). For the respondents, thisis the most environmental-friendlysolution and even compulsory insome of the OTBs (for instancethere are financial sanctions forresidents dumping their waste intothe rivers in Fortaleza). A few households who have a car also deposit their waste in publiccontainers in the city. The contamination of the environment, and especially of the rivers,is common in all OTBs (Figure 3.16b).
23
Chapter 3 Detailed assessment of the current situation
(a) Incineration of solid waste in the OTB LlaveMayu.
(b) Dump of solid waste in a river bed in theOTB Florida.
Figure 3.16: Examples of solid waste disposal.
Figure 3.17: Electricity bill with tax for waste man-agement services (tasa de aseo).
Most surveyed residents believe that theydon’t pay a tax for waste managementservices, as there are no such services inthe project zone. In reality, they pay aservice tax included in the electricity bill(Figure 3.17). Electricity is provided byELFEC S.A. (Empresa de Luz y FuerzaElectrica Cochabamba) that collects the ser-vice tax (tasa de aseo) for the Municipal-ity of Cochabamba. The tax depends onthe consumption range [15], and many habi-tants pay around 7 Bs./month. Many res-idents are not aware of this, because theycan’t read their electricity bills or they don’tunderstand the meaning of tasa de aseo.
Figure 3.18: Separation and use of of organic waste based onthe auto-declaration of the surveyed residents.
As presented in Figure 3.18, threequarters of the surveyed residentsdeclare that they separate theorganic waste from the residualwaste (plastics and paper). Glob-ally, around half the households re-use the organic waste and benefitsdirectly from the waste separation;families who have a kitchen gar-den use them directly as a soil con-ditioner, which is usually the onlytype of fertilizer they apply. Fami-lies who own cattle (mainly sheep)use the organics as animal feed,while other families pass their organics on to families who have cattle.
24
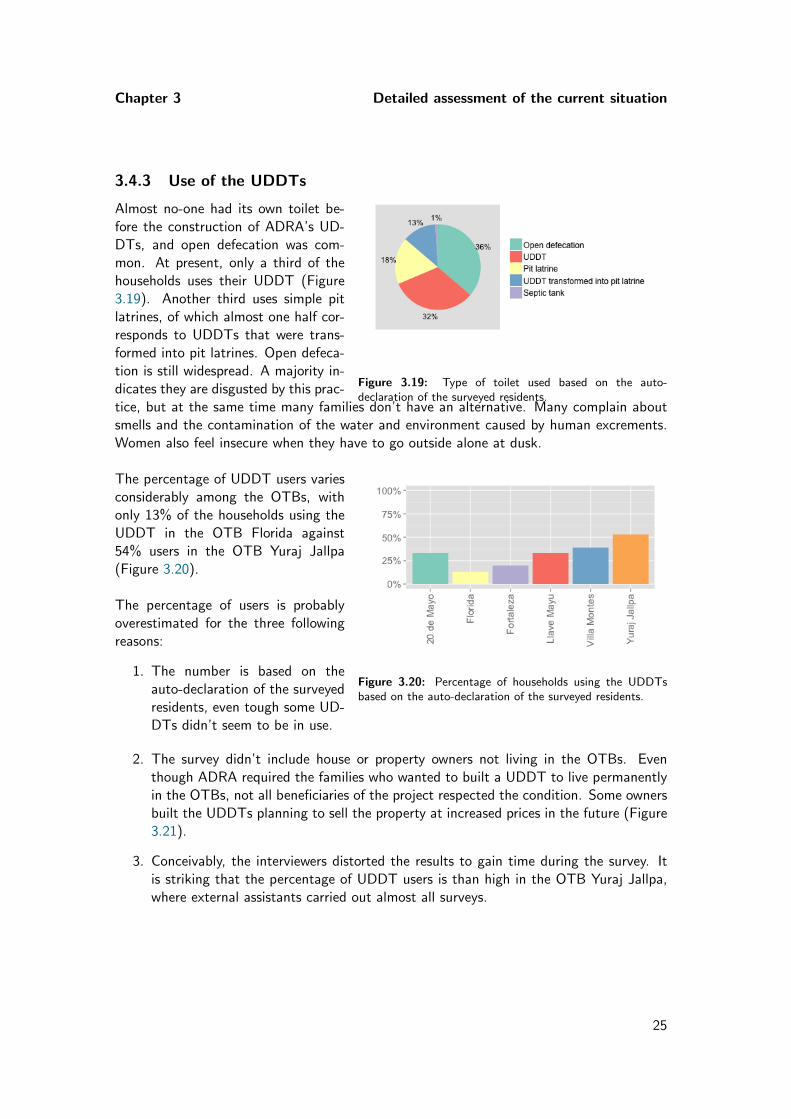
Chapter 3 Detailed assessment of the current situation
3.4.3 Use of the UDDTs
Figure 3.19: Type of toilet used based on the auto-declaration of the surveyed residents.
Almost no-one had its own toilet be-fore the construction of ADRA’s UD-DTs, and open defecation was com-mon. At present, only a third of thehouseholds uses their UDDT (Figure3.19). Another third uses simple pitlatrines, of which almost one half cor-responds to UDDTs that were trans-formed into pit latrines. Open defeca-tion is still widespread. A majority in-dicates they are disgusted by this prac-tice, but at the same time many families don’t have an alternative. Many complain aboutsmells and the contamination of the water and environment caused by human excrements.Women also feel insecure when they have to go outside alone at dusk.
Figure 3.20: Percentage of households using the UDDTsbased on the auto-declaration of the surveyed residents.
The percentage of UDDT users variesconsiderably among the OTBs, withonly 13% of the households using theUDDT in the OTB Florida against54% users in the OTB Yuraj Jallpa(Figure 3.20).
The percentage of users is probablyoverestimated for the three followingreasons:
1. The number is based on theauto-declaration of the surveyedresidents, even tough some UD-DTs didn’t seem to be in use.
2. The survey didn’t include house or property owners not living in the OTBs. Eventhough ADRA required the families who wanted to built a UDDT to live permanentlyin the OTBs, not all beneficiaries of the project respected the condition. Some ownersbuilt the UDDTs planning to sell the property at increased prices in the future (Figure3.21).
3. Conceivably, the interviewers distorted the results to gain time during the survey. Itis striking that the percentage of UDDT users is than high in the OTB Yuraj Jallpa,where external assistants carried out almost all surveys.
25
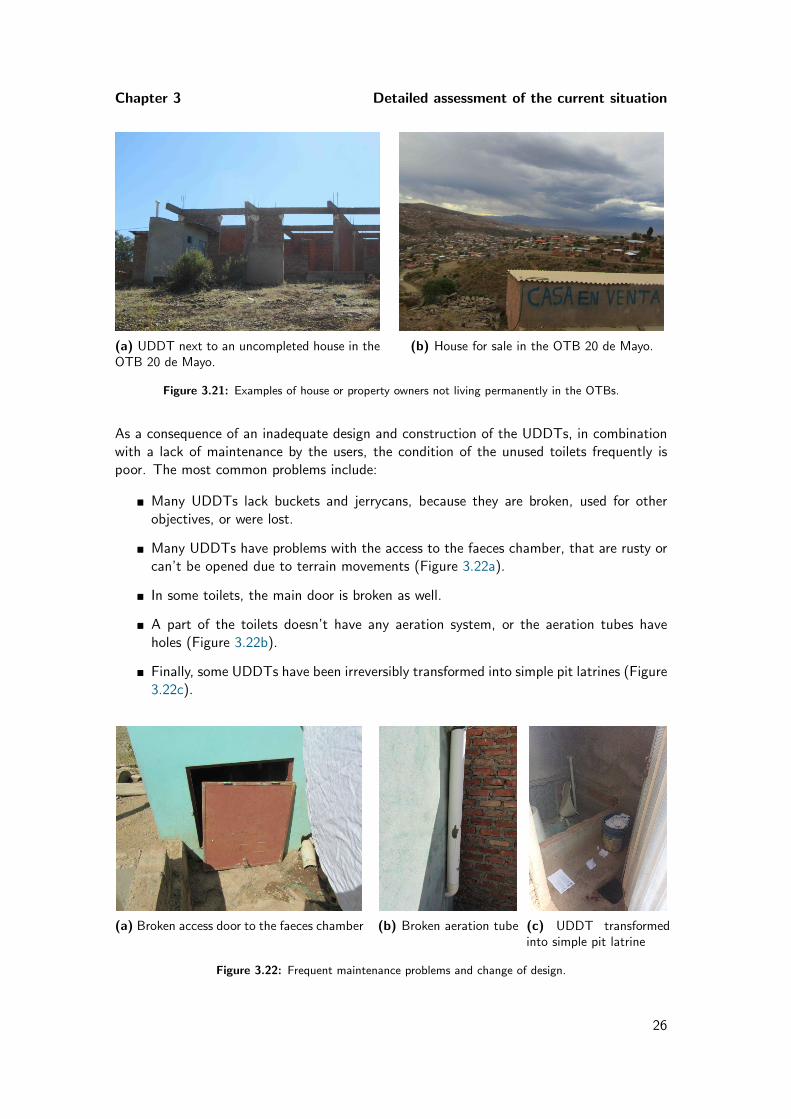
Chapter 3 Detailed assessment of the current situation
(a) UDDT next to an uncompleted house in theOTB 20 de Mayo.
(b) House for sale in the OTB 20 de Mayo.
Figure 3.21: Examples of house or property owners not living permanently in the OTBs.
As a consequence of an inadequate design and construction of the UDDTs, in combinationwith a lack of maintenance by the users, the condition of the unused toilets frequently ispoor. The most common problems include:
� Many UDDTs lack buckets and jerrycans, because they are broken, used for otherobjectives, or were lost.
� Many UDDTs have problems with the access to the faeces chamber, that are rusty orcan’t be opened due to terrain movements (Figure 3.22a).
� In some toilets, the main door is broken as well.
� A part of the toilets doesn’t have any aeration system, or the aeration tubes haveholes (Figure 3.22b).
� Finally, some UDDTs have been irreversibly transformed into simple pit latrines (Figure3.22c).
(a) Broken access door to the faeces chamber (b) Broken aeration tube (c) UDDT transformedinto simple pit latrine
Figure 3.22: Frequent maintenance problems and change of design.
26
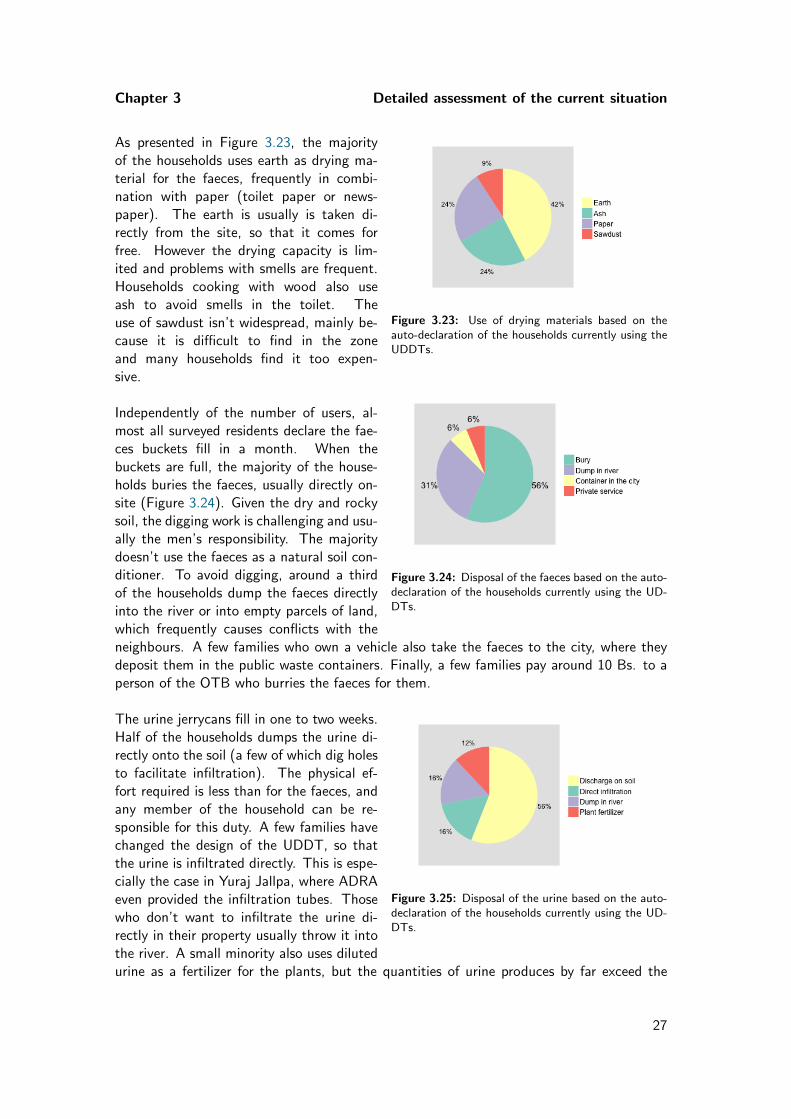
Chapter 3 Detailed assessment of the current situation
Figure 3.23: Use of drying materials based on theauto-declaration of the households currently using theUDDTs.
As presented in Figure 3.23, the majorityof the households uses earth as drying ma-terial for the faeces, frequently in combi-nation with paper (toilet paper or news-paper). The earth is usually is taken di-rectly from the site, so that it comes forfree. However the drying capacity is lim-ited and problems with smells are frequent.Households cooking with wood also useash to avoid smells in the toilet. Theuse of sawdust isn’t widespread, mainly be-cause it is difficult to find in the zoneand many households find it too expen-sive.
Figure 3.24: Disposal of the faeces based on the auto-declaration of the households currently using the UD-DTs.
Independently of the number of users, al-most all surveyed residents declare the fae-ces buckets fill in a month. When thebuckets are full, the majority of the house-holds buries the faeces, usually directly on-site (Figure 3.24). Given the dry and rockysoil, the digging work is challenging and usu-ally the men’s responsibility. The majoritydoesn’t use the faeces as a natural soil con-ditioner. To avoid digging, around a thirdof the households dump the faeces directlyinto the river or into empty parcels of land,which frequently causes conflicts with theneighbours. A few families who own a vehicle also take the faeces to the city, where theydeposit them in the public waste containers. Finally, a few families pay around 10 Bs. to aperson of the OTB who burries the faeces for them.
Figure 3.25: Disposal of the urine based on the auto-declaration of the households currently using the UD-DTs.
The urine jerrycans fill in one to two weeks.Half of the households dumps the urine di-rectly onto the soil (a few of which dig holesto facilitate infiltration). The physical ef-fort required is less than for the faeces, andany member of the household can be re-sponsible for this duty. A few families havechanged the design of the UDDT, so thatthe urine is infiltrated directly. This is espe-cially the case in Yuraj Jallpa, where ADRAeven provided the infiltration tubes. Thosewho don’t want to infiltrate the urine di-rectly in their property usually throw it intothe river. A small minority also uses dilutedurine as a fertilizer for the plants, but the quantities of urine produces by far exceed the
27
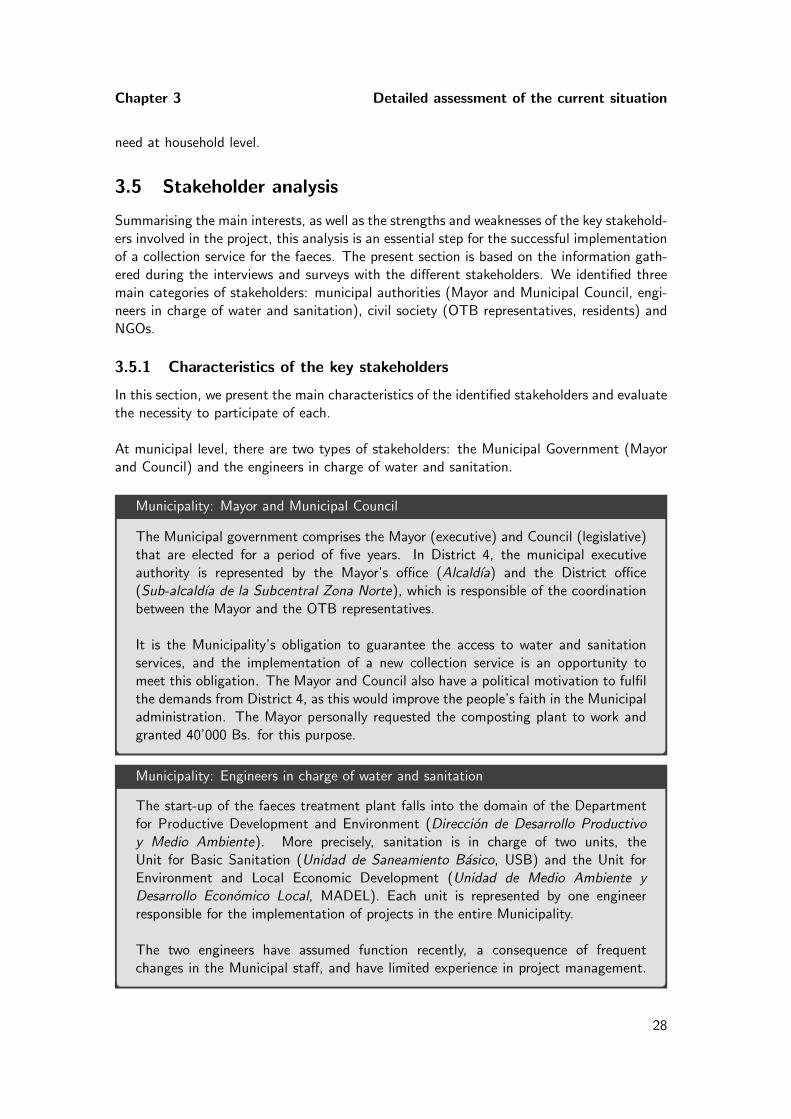
Chapter 3 Detailed assessment of the current situation
need at household level.
3.5 Stakeholder analysis
Summarising the main interests, as well as the strengths and weaknesses of the key stakehold-ers involved in the project, this analysis is an essential step for the successful implementationof a collection service for the faeces. The present section is based on the information gath-ered during the interviews and surveys with the different stakeholders. We identified threemain categories of stakeholders: municipal authorities (Mayor and Municipal Council, engi-neers in charge of water and sanitation), civil society (OTB representatives, residents) andNGOs.
3.5.1 Characteristics of the key stakeholders
In this section, we present the main characteristics of the identified stakeholders and evaluatethe necessity to participate of each.
At municipal level, there are two types of stakeholders: the Municipal Government (Mayorand Council) and the engineers in charge of water and sanitation.
Municipality: Mayor and Municipal Council
The Municipal government comprises the Mayor (executive) and Council (legislative)that are elected for a period of five years. In District 4, the municipal executiveauthority is represented by the Mayor’s office (Alcaldıa) and the District office(Sub-alcaldıa de la Subcentral Zona Norte), which is responsible of the coordinationbetween the Mayor and the OTB representatives.
It is the Municipality’s obligation to guarantee the access to water and sanitationservices, and the implementation of a new collection service is an opportunity tomeet this obligation. The Mayor and Council also have a political motivation to fulfilthe demands from District 4, as this would improve the people’s faith in the Municipaladministration. The Mayor personally requested the composting plant to work andgranted 40’000 Bs. for this purpose.
Municipality: Engineers in charge of water and sanitation
The start-up of the faeces treatment plant falls into the domain of the Departmentfor Productive Development and Environment (Direccion de Desarrollo Productivoy Medio Ambiente). More precisely, sanitation is in charge of two units, theUnit for Basic Sanitation (Unidad de Saneamiento Basico, USB) and the Unit forEnvironment and Local Economic Development (Unidad de Medio Ambiente yDesarrollo Economico Local, MADEL). Each unit is represented by one engineerresponsible for the implementation of projects in the entire Municipality.
The two engineers have assumed function recently, a consequence of frequentchanges in the Municipal staff, and have limited experience in project management.
28
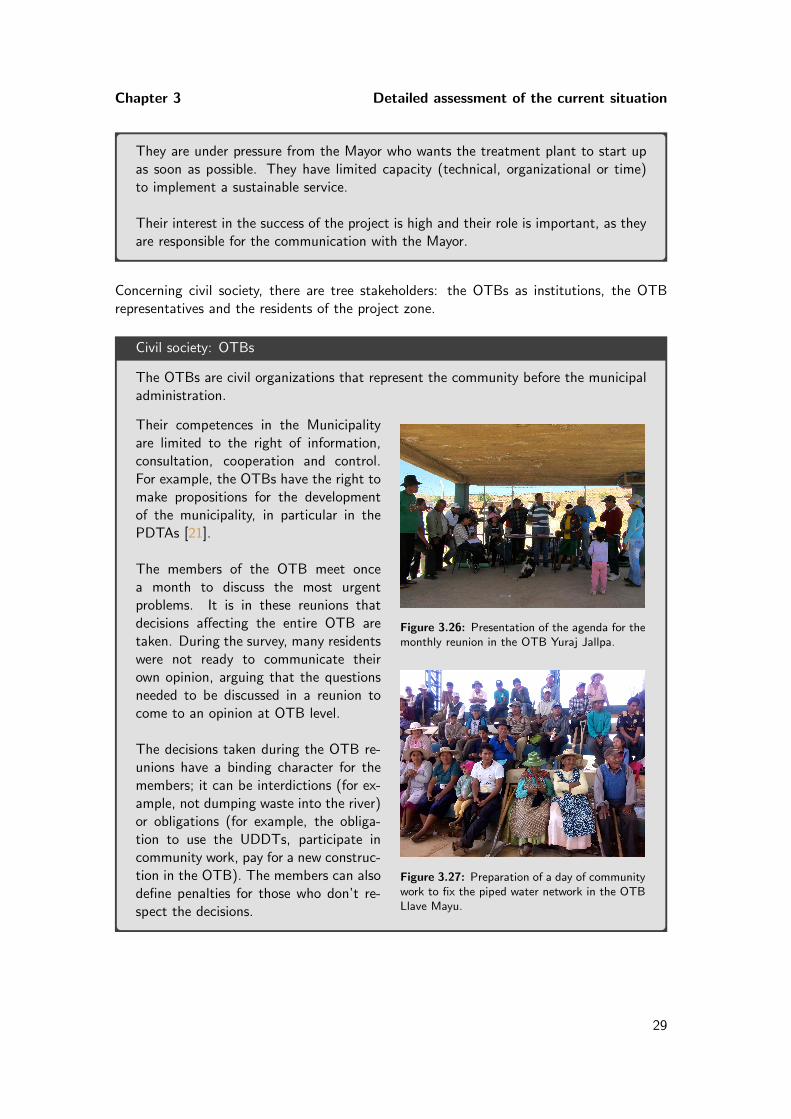
Chapter 3 Detailed assessment of the current situation
They are under pressure from the Mayor who wants the treatment plant to start upas soon as possible. They have limited capacity (technical, organizational or time)to implement a sustainable service.
Their interest in the success of the project is high and their role is important, as theyare responsible for the communication with the Mayor.
Concerning civil society, there are tree stakeholders: the OTBs as institutions, the OTBrepresentatives and the residents of the project zone.
Civil society: OTBs
The OTBs are civil organizations that represent the community before the municipaladministration.
Their competences in the Municipalityare limited to the right of information,consultation, cooperation and control.For example, the OTBs have the right tomake propositions for the developmentof the municipality, in particular in thePDTAs [21].
The members of the OTB meet oncea month to discuss the most urgentproblems. It is in these reunions thatdecisions affecting the entire OTB aretaken. During the survey, many residentswere not ready to communicate theirown opinion, arguing that the questionsneeded to be discussed in a reunion tocome to an opinion at OTB level.
The decisions taken during the OTB re-unions have a binding character for themembers; it can be interdictions (for ex-ample, not dumping waste into the river)or obligations (for example, the obliga-tion to use the UDDTs, participate incommunity work, pay for a new construc-tion in the OTB). The members can alsodefine penalties for those who don’t re-spect the decisions.
Figure 3.26: Presentation of the agenda for themonthly reunion in the OTB Yuraj Jallpa.
Figure 3.27: Preparation of a day of communitywork to fix the piped water network in the OTBLlave Mayu.
29
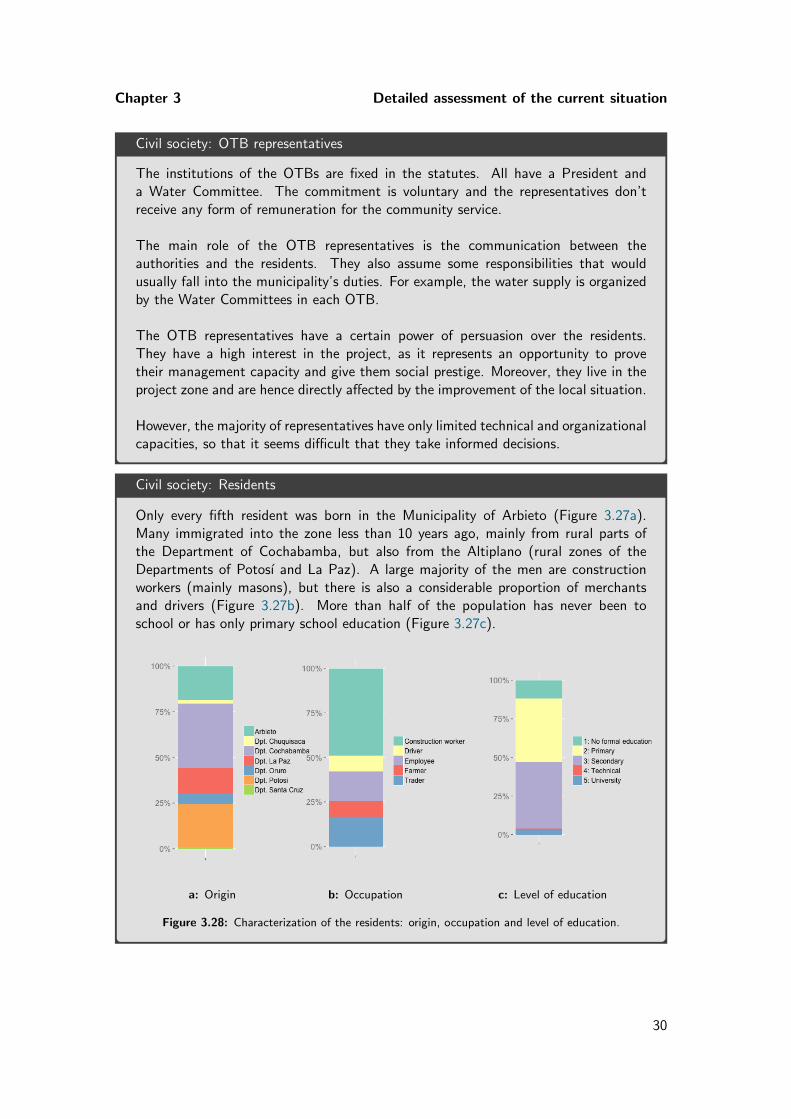
Chapter 3 Detailed assessment of the current situation
Civil society: OTB representatives
The institutions of the OTBs are fixed in the statutes. All have a President anda Water Committee. The commitment is voluntary and the representatives don’treceive any form of remuneration for the community service.
The main role of the OTB representatives is the communication between theauthorities and the residents. They also assume some responsibilities that wouldusually fall into the municipality’s duties. For example, the water supply is organizedby the Water Committees in each OTB.
The OTB representatives have a certain power of persuasion over the residents.They have a high interest in the project, as it represents an opportunity to provetheir management capacity and give them social prestige. Moreover, they live in theproject zone and are hence directly affected by the improvement of the local situation.
However, the majority of representatives have only limited technical and organizationalcapacities, so that it seems difficult that they take informed decisions.
Civil society: Residents
Only every fifth resident was born in the Municipality of Arbieto (Figure 3.27a).Many immigrated into the zone less than 10 years ago, mainly from rural parts ofthe Department of Cochabamba, but also from the Altiplano (rural zones of theDepartments of Potosı and La Paz). A large majority of the men are constructionworkers (mainly masons), but there is also a considerable proportion of merchantsand drivers (Figure 3.27b). More than half of the population has never been toschool or has only primary school education (Figure 3.27c).
a: Origin b: Occupation c: Level of education
Figure 3.28: Characterization of the residents: origin, occupation and level of education.
30
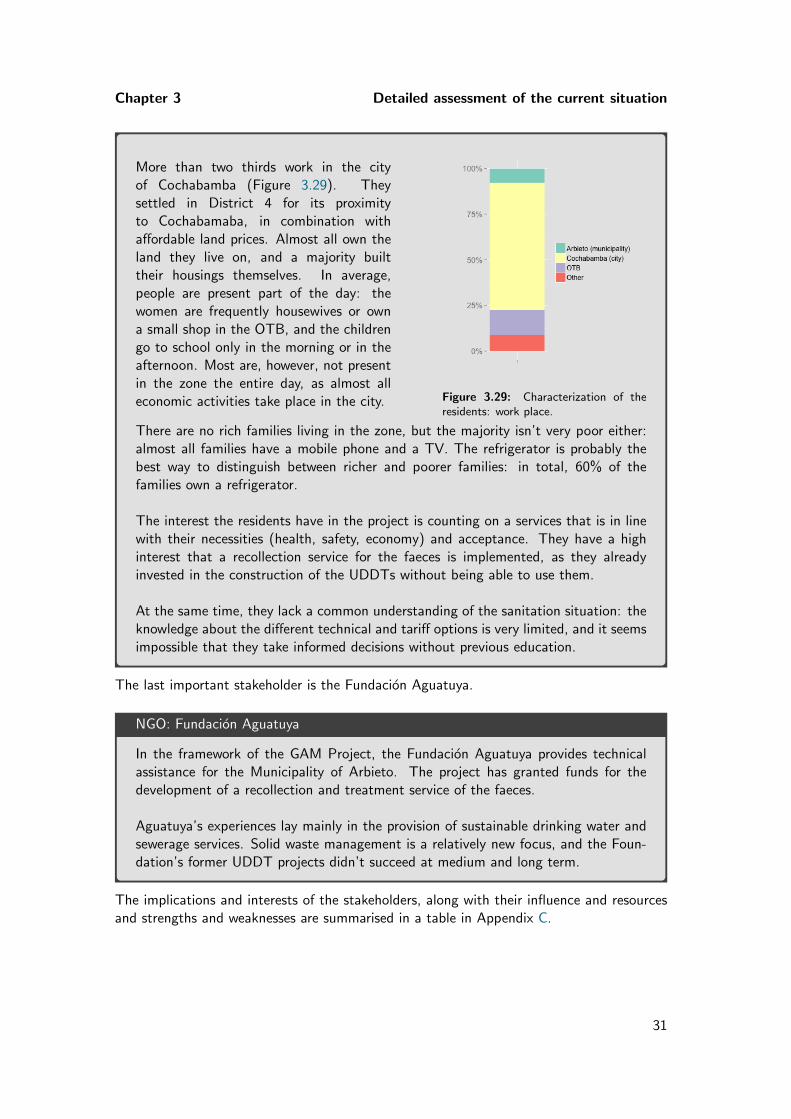
Chapter 3 Detailed assessment of the current situation
More than two thirds work in the cityof Cochabamba (Figure 3.29). Theysettled in District 4 for its proximityto Cochabamaba, in combination withaffordable land prices. Almost all own theland they live on, and a majority builttheir housings themselves. In average,people are present part of the day: thewomen are frequently housewives or owna small shop in the OTB, and the childrengo to school only in the morning or in theafternoon. Most are, however, not presentin the zone the entire day, as almost alleconomic activities take place in the city. Figure 3.29: Characterization of the
residents: work place.
There are no rich families living in the zone, but the majority isn’t very poor either:almost all families have a mobile phone and a TV. The refrigerator is probably thebest way to distinguish between richer and poorer families: in total, 60% of thefamilies own a refrigerator.
The interest the residents have in the project is counting on a services that is in linewith their necessities (health, safety, economy) and acceptance. They have a highinterest that a recollection service for the faeces is implemented, as they alreadyinvested in the construction of the UDDTs without being able to use them.
At the same time, they lack a common understanding of the sanitation situation: theknowledge about the different technical and tariff options is very limited, and it seemsimpossible that they take informed decisions without previous education.
The last important stakeholder is the Fundacion Aguatuya.
NGO: Fundacion Aguatuya
In the framework of the GAM Project, the Fundacion Aguatuya provides technicalassistance for the Municipality of Arbieto. The project has granted funds for thedevelopment of a recollection and treatment service of the faeces.
Aguatuya’s experiences lay mainly in the provision of sustainable drinking water andsewerage services. Solid waste management is a relatively new focus, and the Foun-dation’s former UDDT projects didn’t succeed at medium and long term.
The implications and interests of the stakeholders, along with their influence and resourcesand strengths and weaknesses are summarised in a table in Appendix C.
31
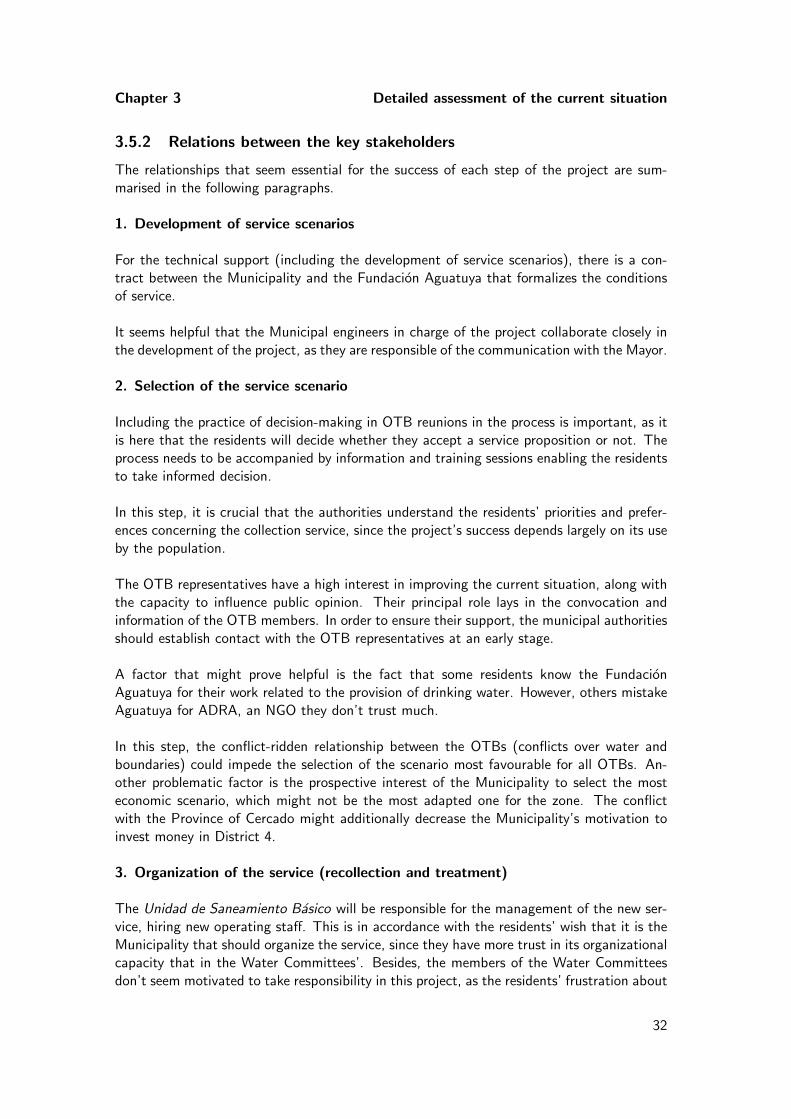
Chapter 3 Detailed assessment of the current situation
3.5.2 Relations between the key stakeholders
The relationships that seem essential for the success of each step of the project are sum-marised in the following paragraphs.
1. Development of service scenarios
For the technical support (including the development of service scenarios), there is a con-tract between the Municipality and the Fundacion Aguatuya that formalizes the conditionsof service.
It seems helpful that the Municipal engineers in charge of the project collaborate closely inthe development of the project, as they are responsible of the communication with the Mayor.
2. Selection of the service scenario
Including the practice of decision-making in OTB reunions in the process is important, as itis here that the residents will decide whether they accept a service proposition or not. Theprocess needs to be accompanied by information and training sessions enabling the residentsto take informed decision.
In this step, it is crucial that the authorities understand the residents’ priorities and prefer-ences concerning the collection service, since the project’s success depends largely on its useby the population.
The OTB representatives have a high interest in improving the current situation, along withthe capacity to influence public opinion. Their principal role lays in the convocation andinformation of the OTB members. In order to ensure their support, the municipal authoritiesshould establish contact with the OTB representatives at an early stage.
A factor that might prove helpful is the fact that some residents know the FundacionAguatuya for their work related to the provision of drinking water. However, others mistakeAguatuya for ADRA, an NGO they don’t trust much.
In this step, the conflict-ridden relationship between the OTBs (conflicts over water andboundaries) could impede the selection of the scenario most favourable for all OTBs. An-other problematic factor is the prospective interest of the Municipality to select the mosteconomic scenario, which might not be the most adapted one for the zone. The conflictwith the Province of Cercado might additionally decrease the Municipality’s motivation toinvest money in District 4.
3. Organization of the service (recollection and treatment)
The Unidad de Saneamiento Basico will be responsible for the management of the new ser-vice, hiring new operating staff. This is in accordance with the residents’ wish that it is theMunicipality that should organize the service, since they have more trust in its organizationalcapacity that in the Water Committees’. Besides, the members of the Water Committeesdon’t seem motivated to take responsibility in this project, as the residents’ frustration about
32
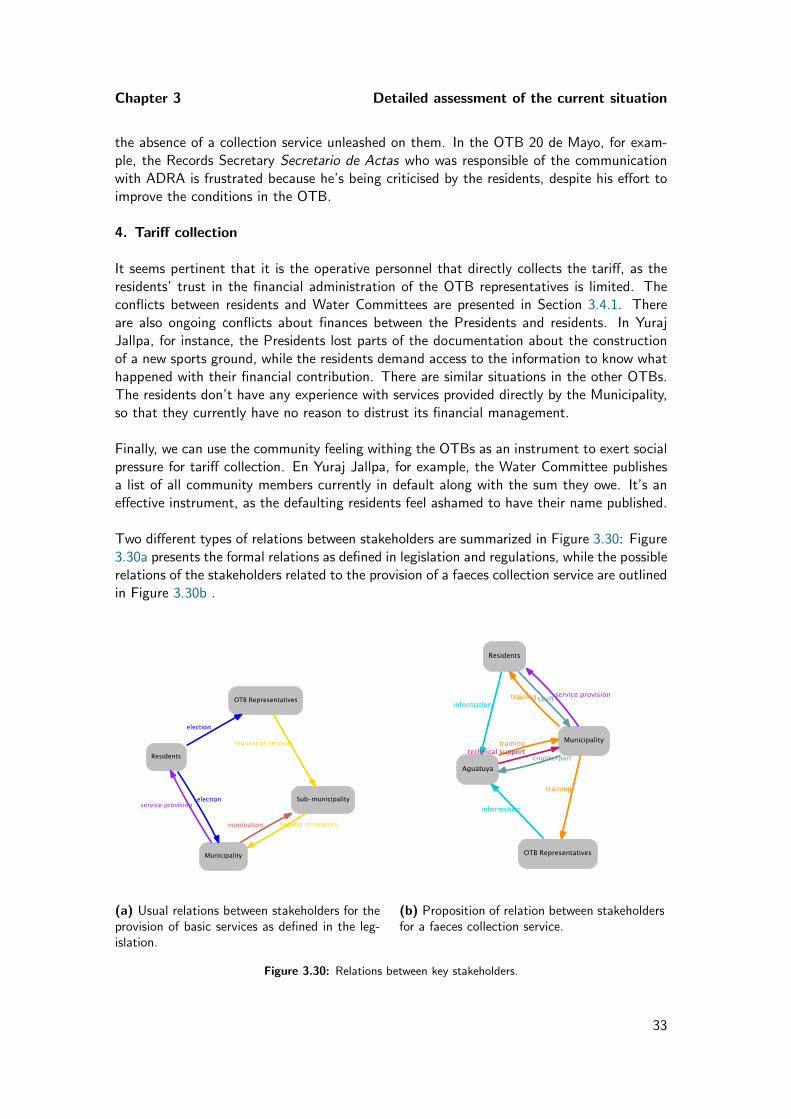
Chapter 3 Detailed assessment of the current situation
the absence of a collection service unleashed on them. In the OTB 20 de Mayo, for exam-ple, the Records Secretary Secretario de Actas who was responsible of the communicationwith ADRA is frustrated because he’s being criticised by the residents, despite his effort toimprove the conditions in the OTB.
4. Tariff collection
It seems pertinent that it is the operative personnel that directly collects the tariff, as theresidents’ trust in the financial administration of the OTB representatives is limited. Theconflicts between residents and Water Committees are presented in Section 3.4.1. Thereare also ongoing conflicts about finances between the Presidents and residents. In YurajJallpa, for instance, the Presidents lost parts of the documentation about the constructionof a new sports ground, while the residents demand access to the information to know whathappened with their financial contribution. There are similar situations in the other OTBs.The residents don’t have any experience with services provided directly by the Municipality,so that they currently have no reason to distrust its financial management.
Finally, we can use the community feeling withing the OTBs as an instrument to exert socialpressure for tariff collection. En Yuraj Jallpa, for example, the Water Committee publishesa list of all community members currently in default along with the sum they owe. It’s aneffective instrument, as the defaulting residents feel ashamed to have their name published.
Two different types of relations between stakeholders are summarized in Figure 3.30: Figure3.30a presents the formal relations as defined in legislation and regulations, while the possiblerelations of the stakeholders related to the provision of a faeces collection service are outlinedin Figure 3.30b .
Municipality
Sub-municipality
nomination
Residents
service provision
request of services
OTB Representatives
request of services
election
election
(a) Usual relations between stakeholders for theprovision of basic services as defined in the leg-islation.
Municipality
OTB Representatives
training
Residents
training service provision
Aguatuyacounterpart
information
tariffinformation
trainingtechnical support
(b) Proposition of relation between stakeholdersfor a faeces collection service.
Figure 3.30: Relations between key stakeholders.
33
Chapter 3 Detailed assessment of the current situation
3.6 Analisis of the enabling environment
Com
mun
ity-L
ed U
rban
Env
ironm
enta
l San
itatio
n Pl
anni
ng
In step 5 the planning team, in consultation with environmental sanitation experts and key stakeholders, uses an informed choice approach to identify one or two environmental sanitation system options that are feasible for the intervention area and can be studied in greater detail. The community and the local authorities reach agreement based on an understanding of the management and financial implica-tions of the selected systems. (page 33)
In step 6 stakeholders develop local area action plans for the implementation of the environmental sanitation options selected in step 5. The action plans must be implementable by the community, the local authorities and the private sector. The main output of step 6 is a costed and funded action plan that follows time sensitive, output-based targets. Every action plan must contain an operation and maintenance management plan to ensure the correct functioning of the sanitation system.(page 39)
As the goal of step 7 is to implement the CLUES action plan developed in step 6, this last step is not strictly speaking part of the planning process. Stakeholders translate the action plan into work packages which ultimately become contracts for imple-menting the service improvements. The final stage of step 7 is the implementation of the O&M management plan. (page 43)
There are 3 cross-cutting tasks which are relevant throughout the entire planning process: (page 17)
1. Awareness Raising and Communication are key to creating demand and raising people’s abilities to make informed choices about the most appropriate systems and technologies. 2. Capacity Development aims to strengthen skills for process management and collaborative planning and skills like engineering, construction, operation and maintenance.3. Process Monitoring and Evaluation allows one to identify and correct mistakes or imbalances or even to change the shape and direction of the project before it is too late.
The enabling environment and how it is understood is a key determinant for successful project inter-ventions. The six elements that define an enabling environment need to be nurtured and pro-actively fostered to provide favourable conditions for environmental sanitation planning in challenging urban environments. (page 49)
Socio-cultural Acceptance
Legal and Regulatory Framework
Institutional Arrangements
CLUES Planning
Financial Arrangements
Government Support
Skills and Capacity
Figure 3.31: Six elements of an enabling environment[11].
The enabling environment is the set of con-ditions that can impact the potential tobring about sustainable and effective change[11]. The planning guideline CLUES iden-tifies six interrelated elements of an en-abling environment: government support,legal and regulatory framework, institutionalarrangements, skills and capacity, financialarrangements and socio-cultural acceptance(Figure 3.31). The following sections eval-uate each of the elements of the local envi-ronment.
3.6.1 Government support
It is important that there is explicit government support for participatory processes and thatthe project is in line with the government’s socio-economic development policies.
As presented in Chapter 2, improving the access to sanitation services is a priority at Nationallevel.
Cornerstones of the National Plan for Basic Sanitation 2008-2015 [13]
� El acceso a los servicios de agua y saneamiento es un Derecho Humano funda-mental.
� El agua y el saneamiento no son objeto de concesion ni privatizacion.
� El Estado es responsable, en todos sus niveles de gobierno, de la provision delos servicios basicos a traves de la prestacion directa, o de empresas publicas,cooperativas, comunitarias o mixtas.
� La provision de servicios debe responder a los criterios de universalidad, sosteni-bilidad, responsabilidad, accesibilidad, continuidad, calidad, eficiencia, eficacia,tarifas equitativas y cobertura necesaria con participacion y control social; ve-lando la equidad social y de genero.
The assessment of the governmental support follows the critical questions defined in CLUES[11].
Critical questions regarding governmental supports from CLUES [11]
� Is increased access to safe water and sanitation for all recognized by the gov-ernment as important for socio-economic development?
X The PSD-SB underlines the importance of water as the most important resource
34
Chapter 3 Detailed assessment of the current situation
for ecosystems, and hence for all related ecosystem services. The plan explicitlymentions the access to water and sanitation as a decisive component of thesocio-economic development of the country [14].
� Is there a general decentralization movement underway? Does the governmentpromote decentralization of environmental sanitation service delivery functions,including the participation of the private sector?
≈ As explained above, the municipalities have an important role in the sanitationsector. Service delivery through the EPSA might also be regarded as a decen-tralization process promoted by the government. However, the participation ofprofit-oriented private businesses in the water and sanitation sector is explicitlyexcluded [13].
� Is there a policy which promotes affordable service provision to unserved areas?
X Art. 20 CPE promulgates the access to drinking water and basic sanitationas a human right, and the government is responsible to guarantee this right.The necessity of establishing tariff structures and prices that are accessible (i.e.affordable) is also recognized [14]. The MICSA prioritizes poor regions withless service coverage.
� Do existing policies promote community participation in activities related toenvironmental protection and service provision?
X In the PNSB, the national government emphasizes the importance of commu-nity participation in service provision. By improving social participation, thePNSB means primarily the reinforcement of “community sytems” and coop-eratives and the recognition of uses and customs [13]. The PSD-SB moreexplicitly promotes the participation of the users, but does not detail how thisparticipation is to be achieved [14].
In summary, most of the critical questions from CLUES are affirmed.
1. From a regulatory point of view, the access to water and sanitation for all is a priorityfor the Bolivian government.
2. There is a commitment to decentralization, however, with strict conditions on who isallowed to participate in the water and sanitation sector.
3. Social participation in the drinking water and sanitation sector is one of the pillars ofthe regulatory framework, but it is not clear how the participation of the users is tobe included in the development and maintenance of sanitation services.
As mentioned in Section 2.2.2 this recorded governmental support might, however, not al-ways be sufficient, as the National government may not be capable to implement or enforcethese principles.
At Municipal level, the Mayor explicitly commissioned one of the engineers to organize theup-start of the treatment plant. His main motivation is probably the fact the the plantalready exists, so that the Municipality should benefit of the investment they made in the
35
Chapter 3 Detailed assessment of the current situation
past. However, there’s a lack of sensiblization with respect to the challenges of implementinga sustainable collection service.
As a consequence of the geographic distance to the urban centre of Arbieto (where thedecision are taken) and the territorial conflict between Arbieto and Cochabamba, District4 doesn’t seem to be a geographic focus of the Municipality. Their might be a reducedwillingness to invest funds into an area that might not be part of its territory in future.Moreover, expanding the access to sanitation for all isn’t really a priority for the Municipal-ity, and investments in the sector are very limited, as presented in Section 3.6.5.
Government support
3 Increasing the coverage of sanitation services is a priority at National level.
3 The mayor commissioned the up-start of the faeces treatment plant at soonest.
≈ There is a lack of awareness about the time and means required for the imple-mentation of a sustainable service.
3.6.2 Legal and regulatory framework
The legal and regulatory framework at National level are presented in Chapter 2.
The Municipality is responsible for the provision of drinking water and basic sanitation ser-vices. They are used to coordinate their work with the OTB representatives. Moreover, theOTBs have the possibility to independently manage the drinking water supply (includingoperation and maintenance, as well as tariff collection and management) through WaterCommittees. However, the Municipality of Arbieto hasn’t yet elaborated a detailed regu-latory framework defining the responsibilities and conditions for the provision of sanitationservices currently, there are no laws or regulations that might influence the selection of acollection and treatment system or the financing.
Legal and regulatory framework
3 It is possible for local strucures (OTBs) to manage basic services (which is forinstance the case for the water supply).
≈ There are no laws or regulations influencing the type of collection and treatmentservice or tariff.
7 Currently, there are no regulations defining waste collection tariffs (the wastecollection service is free in the urban centre).
7 There is an ongoing conflict about territorial limits between the Municipalitiesof Arbieto and Cochabamba.
36
Chapter 3 Detailed assessment of the current situation
3.6.3 Institutional arrangements
The relations between key stakeholders are summarised in Section 3.5.2, and more specifi-cally in Figure 3.30. Formally, there is a specific agreement between the Municipality andthe GAM Project defining the responsibilities of both. Finally, we recall that the residentspay a tax for waste management services without receiving any service as a consequence ofthe territorial conflict between Arbieto and Cochabamba.
Institutional arrangements
3 The municipality is willing and has the practice to coordinate its work withthe OTB representatives.
3 The Presidents of the OTBs assume the communication between the residentsand the Municipality.
≈ The Water Committees are in charge of managing the water supply (withmore or less success, depending on the OTB).
3 The residents meet every month to take decision at OTB-level.
3.6.4 Skills and capacity
At Municipal level, the engineers in charge of sanitation are technically well trained, buthave little experience in project management, since they were appointed only a few monthsago. They are becoming more and more familiar with the legal and regulatory frameworks,but haven’t acquired a detailed knowledge of the subjects yet.
The OTB representatives have only limited skills and capacities relative to sanitation.Many are labourers without experience in planning processes or knowledge about realistictechnical options.
The majority of the residents has little formal education. ADRA organized workshops toexplain the correct use of the UDDTs, but they didn’t raise awareness about the costs of thecollection and treatment of the faeces or maintenance requirements for the latrines. Mostresidents lack understanding about the technical, economic and environmental implicationsof the different sanitation options.
Aguatuya has ample experience in the provision of drinking water and the treatment of wastewater, but solid waste management is a relatively novel area. The foundation constructedUDDTs in the past (see Section 5.2), but failed to provide a collection and treatment service.
Skills and capacity
Municipality
≈ Few staff for the implementation of projects
Community-based organisations
37
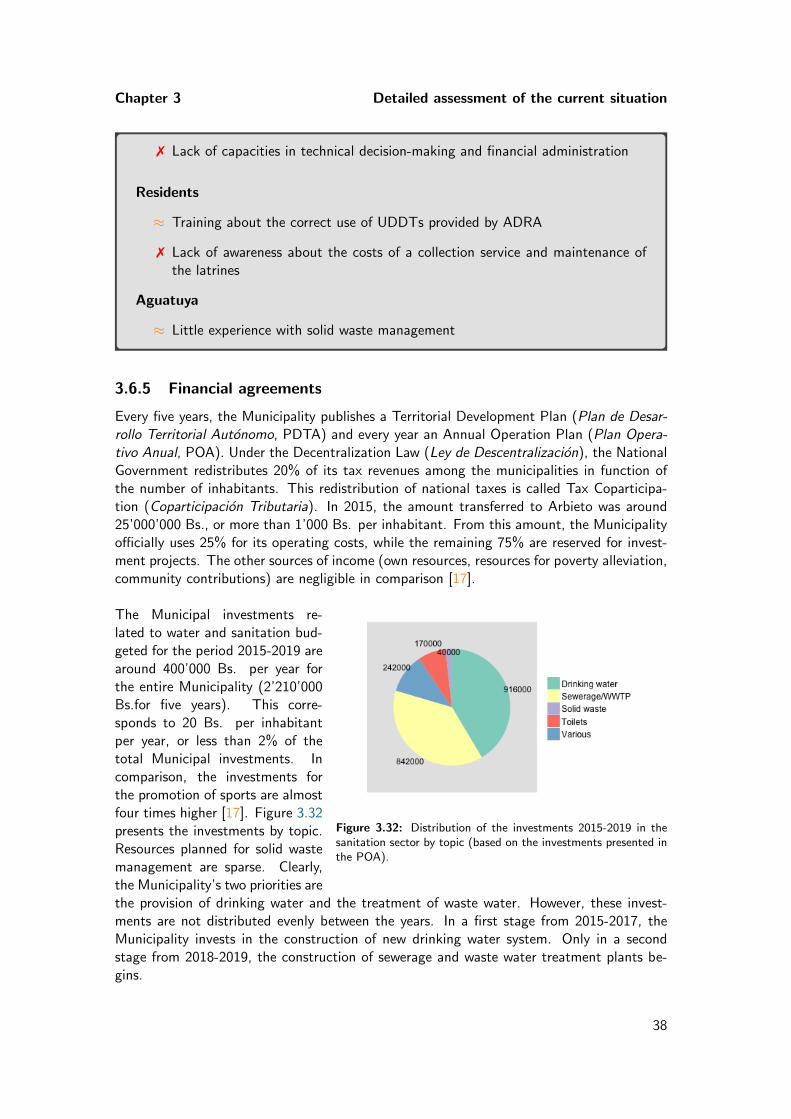
Chapter 3 Detailed assessment of the current situation
7 Lack of capacities in technical decision-making and financial administration
Residents
≈ Training about the correct use of UDDTs provided by ADRA
7 Lack of awareness about the costs of a collection service and maintenance ofthe latrines
Aguatuya
≈ Little experience with solid waste management
3.6.5 Financial agreements
Every five years, the Municipality publishes a Territorial Development Plan (Plan de Desar-rollo Territorial Autonomo, PDTA) and every year an Annual Operation Plan (Plan Opera-tivo Anual, POA). Under the Decentralization Law (Ley de Descentralizacion), the NationalGovernment redistributes 20% of its tax revenues among the municipalities in function ofthe number of inhabitants. This redistribution of national taxes is called Tax Coparticipa-tion (Coparticipacion Tributaria). In 2015, the amount transferred to Arbieto was around25’000’000 Bs., or more than 1’000 Bs. per inhabitant. From this amount, the Municipalityofficially uses 25% for its operating costs, while the remaining 75% are reserved for invest-ment projects. The other sources of income (own resources, resources for poverty alleviation,community contributions) are negligible in comparison [17].
Figure 3.32: Distribution of the investments 2015-2019 in thesanitation sector by topic (based on the investments presented inthe POA).
The Municipal investments re-lated to water and sanitation bud-geted for the period 2015-2019 arearound 400’000 Bs. per year forthe entire Municipality (2’210’000Bs.for five years). This corre-sponds to 20 Bs. per inhabitantper year, or less than 2% of thetotal Municipal investments. Incomparison, the investments forthe promotion of sports are almostfour times higher [17]. Figure 3.32presents the investments by topic.Resources planned for solid wastemanagement are sparse. Clearly,the Municipality’s two priorities arethe provision of drinking water and the treatment of waste water. However, these invest-ments are not distributed evenly between the years. In a first stage from 2015-2017, theMunicipality invests in the construction of new drinking water system. Only in a secondstage from 2018-2019, the construction of sewerage and waste water treatment plants be-gins.
38
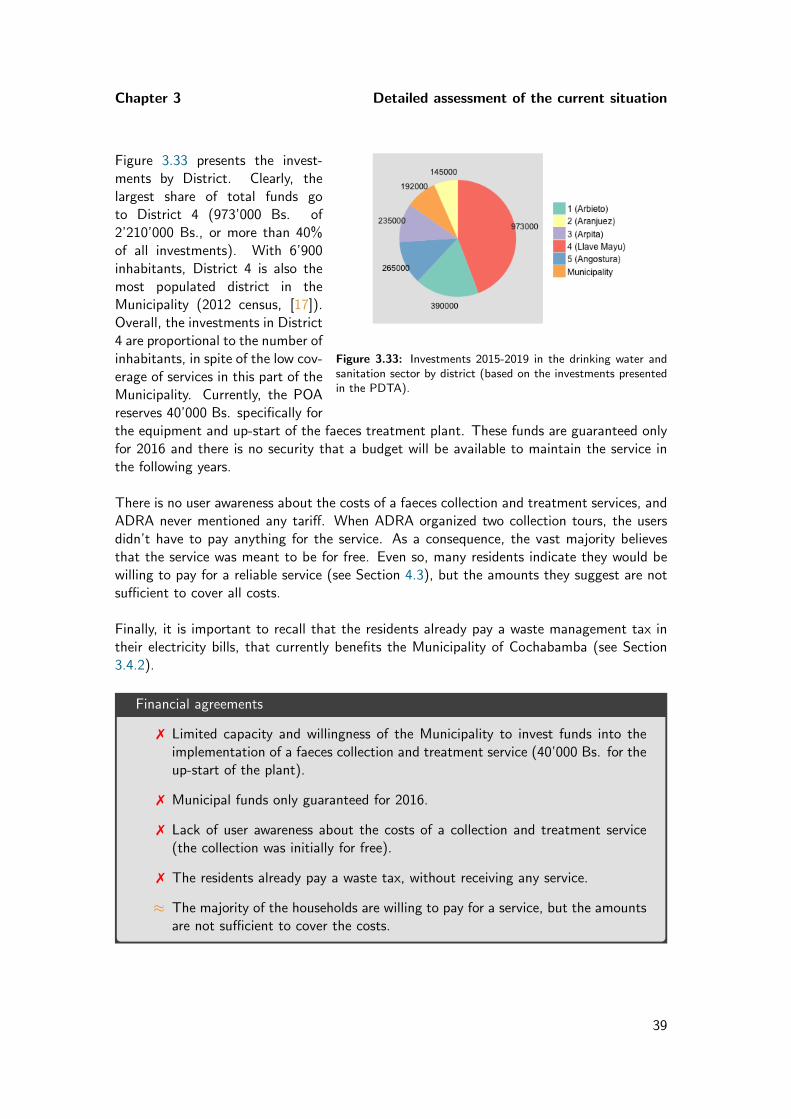
Chapter 3 Detailed assessment of the current situation
Figure 3.33: Investments 2015-2019 in the drinking water andsanitation sector by district (based on the investments presentedin the PDTA).
Figure 3.33 presents the invest-ments by District. Clearly, thelargest share of total funds goto District 4 (973’000 Bs. of2’210’000 Bs., or more than 40%of all investments). With 6’900inhabitants, District 4 is also themost populated district in theMunicipality (2012 census, [17]).Overall, the investments in District4 are proportional to the number ofinhabitants, in spite of the low cov-erage of services in this part of theMunicipality. Currently, the POAreserves 40’000 Bs. specifically forthe equipment and up-start of the faeces treatment plant. These funds are guaranteed onlyfor 2016 and there is no security that a budget will be available to maintain the service inthe following years.
There is no user awareness about the costs of a faeces collection and treatment services, andADRA never mentioned any tariff. When ADRA organized two collection tours, the usersdidn’t have to pay anything for the service. As a consequence, the vast majority believesthat the service was meant to be for free. Even so, many residents indicate they would bewilling to pay for a reliable service (see Section 4.3), but the amounts they suggest are notsufficient to cover all costs.
Finally, it is important to recall that the residents already pay a waste management tax intheir electricity bills, that currently benefits the Municipality of Cochabamba (see Section3.4.2).
Financial agreements
7 Limited capacity and willingness of the Municipality to invest funds into theimplementation of a faeces collection and treatment service (40’000 Bs. for theup-start of the plant).
7 Municipal funds only guaranteed for 2016.
7 Lack of user awareness about the costs of a collection and treatment service(the collection was initially for free).
7 The residents already pay a waste tax, without receiving any service.
≈ The majority of the households are willing to pay for a service, but the amountsare not sufficient to cover the costs.
39
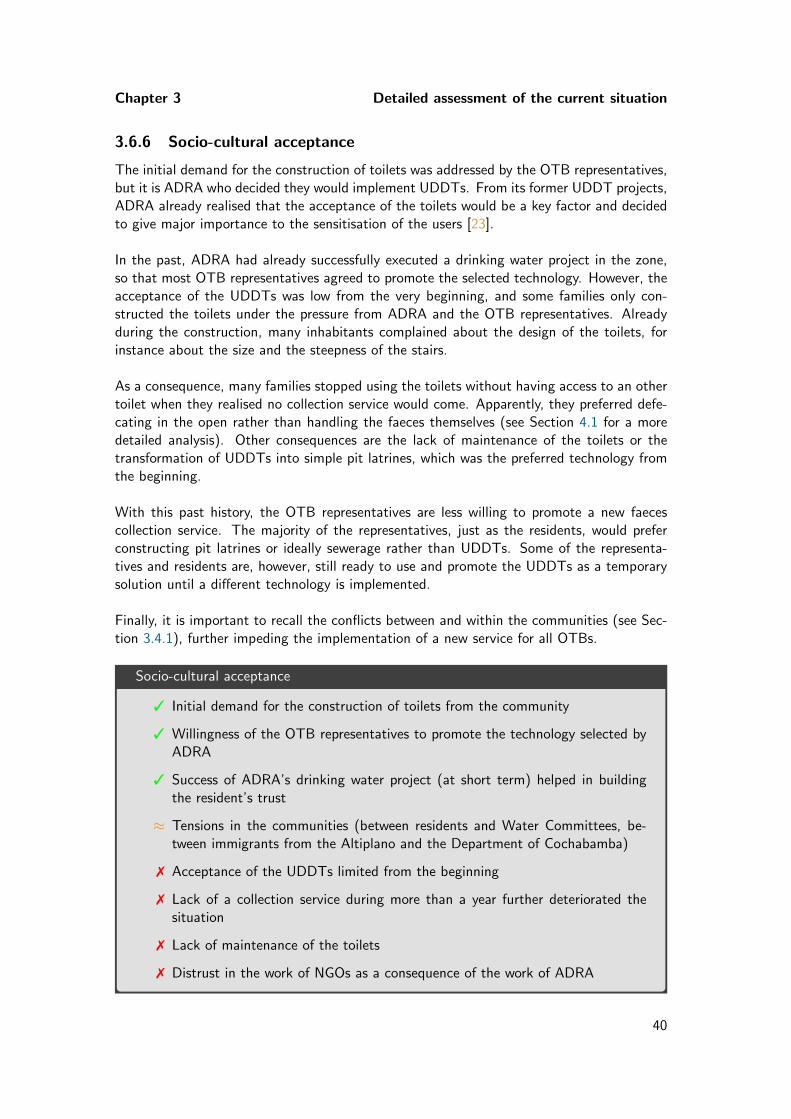
Chapter 3 Detailed assessment of the current situation
3.6.6 Socio-cultural acceptance
The initial demand for the construction of toilets was addressed by the OTB representatives,but it is ADRA who decided they would implement UDDTs. From its former UDDT projects,ADRA already realised that the acceptance of the toilets would be a key factor and decidedto give major importance to the sensitisation of the users [23].
In the past, ADRA had already successfully executed a drinking water project in the zone,so that most OTB representatives agreed to promote the selected technology. However, theacceptance of the UDDTs was low from the very beginning, and some families only con-structed the toilets under the pressure from ADRA and the OTB representatives. Alreadyduring the construction, many inhabitants complained about the design of the toilets, forinstance about the size and the steepness of the stairs.
As a consequence, many families stopped using the toilets without having access to an othertoilet when they realised no collection service would come. Apparently, they preferred defe-cating in the open rather than handling the faeces themselves (see Section 4.1 for a moredetailed analysis). Other consequences are the lack of maintenance of the toilets or thetransformation of UDDTs into simple pit latrines, which was the preferred technology fromthe beginning.
With this past history, the OTB representatives are less willing to promote a new faecescollection service. The majority of the representatives, just as the residents, would preferconstructing pit latrines or ideally sewerage rather than UDDTs. Some of the representa-tives and residents are, however, still ready to use and promote the UDDTs as a temporarysolution until a different technology is implemented.
Finally, it is important to recall the conflicts between and within the communities (see Sec-tion 3.4.1), further impeding the implementation of a new service for all OTBs.
Socio-cultural acceptance
3 Initial demand for the construction of toilets from the community
3 Willingness of the OTB representatives to promote the technology selected byADRA
3 Success of ADRA’s drinking water project (at short term) helped in buildingthe resident’s trust
≈ Tensions in the communities (between residents and Water Committees, be-tween immigrants from the Altiplano and the Department of Cochabamba)
7 Acceptance of the UDDTs limited from the beginning
7 Lack of a collection service during more than a year further deteriorated thesituation
7 Lack of maintenance of the toilets
7 Distrust in the work of NGOs as a consequence of the work of ADRA
40
Chapter 3 Detailed assessment of the current situation
3.6.7 Global evaluation of the enabling environment
Overall, the situation seemed favourable at the moment of construction of the UDDTs, witha demand for the construction of toilets coming from the community and support from theOTB representatives for the selected technology. As a consequence of ADRA’s poor plan-ning and the lack of active participation of the population during the process, the situationis more difficult now. Especially the limited funds and the low acceptance of the UDDTsare challenges for the implementation of a new faeces collection and treatment system.
At the same time, there is an explicit demand from the Mayor for the up-start of the treat-ment plant. Funds are limited, but reserved for the project. Moreover, the deterioration ofthe UDDTs is still reversible in many case.
Even though not all elements are favourable now, it might be the last opportunity to imple-ment a collection service and start the treatment.
41
CHAPTER 4
User perception of the UDDTs and the service options
Before drafting out possible service chains, it is important to summarise all factors thatmight influence the service options.
The key question we must answer to understand the perception of the residents towards theUDDTs and their service preferences are the following:
1. What were the motives to build the UDDTs and the factors that influence the currentuse?
2. What were the reasons to stop using the UDDTs?
3. What are the factors that influence the preferred type of collection service and thetariff system?
4. What are the priorities of the population with respect to drinking water and basicsanitation?
The analysis is based on the household surveys. In Section 3.3, we presented the data ac-quisition strategy. The questionnaires can be found in Appendix A and the data treatmentand statistical methods (boxplot, Kruskal-Wallis test of significance, Pearson correlation)are presented in Appendix D.
Many questions don’t include only two possible answers (yes or no), but offer answers on ascale from 1 to 5. The goal of this type of questions is to understand the perception of thesituation and the factors influencing the current use in more depth. The way the questionsare formulated is inspired by the RANAS approach (see Appendix A for a short introduction).
42
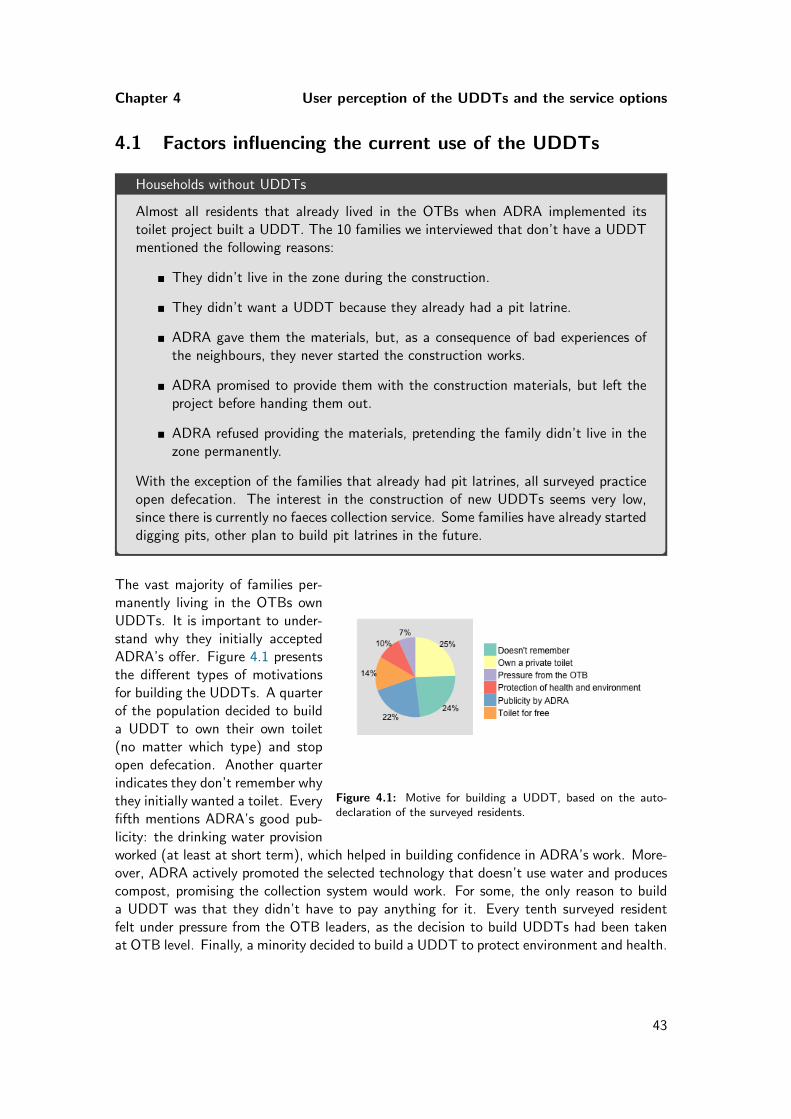
Chapter 4 User perception of the UDDTs and the service options
4.1 Factors influencing the current use of the UDDTs
Households without UDDTs
Almost all residents that already lived in the OTBs when ADRA implemented itstoilet project built a UDDT. The 10 families we interviewed that don’t have a UDDTmentioned the following reasons:
� They didn’t live in the zone during the construction.
� They didn’t want a UDDT because they already had a pit latrine.
� ADRA gave them the materials, but, as a consequence of bad experiences ofthe neighbours, they never started the construction works.
� ADRA promised to provide them with the construction materials, but left theproject before handing them out.
� ADRA refused providing the materials, pretending the family didn’t live in thezone permanently.
With the exception of the families that already had pit latrines, all surveyed practiceopen defecation. The interest in the construction of new UDDTs seems very low,since there is currently no faeces collection service. Some families have already starteddigging pits, other plan to build pit latrines in the future.
Figure 4.1: Motive for building a UDDT, based on the auto-declaration of the surveyed residents.
The vast majority of families per-manently living in the OTBs ownUDDTs. It is important to under-stand why they initially acceptedADRA’s offer. Figure 4.1 presentsthe different types of motivationsfor building the UDDTs. A quarterof the population decided to builda UDDT to own their own toilet(no matter which type) and stopopen defecation. Another quarterindicates they don’t remember whythey initially wanted a toilet. Everyfifth mentions ADRA’s good pub-licity: the drinking water provisionworked (at least at short term), which helped in building confidence in ADRA’s work. More-over, ADRA actively promoted the selected technology that doesn’t use water and producescompost, promising the collection system would work. For some, the only reason to builda UDDT was that they didn’t have to pay anything for it. Every tenth surveyed residentfelt under pressure from the OTB leaders, as the decision to build UDDTs had been takenat OTB level. Finally, a minority decided to build a UDDT to protect environment and health.
43
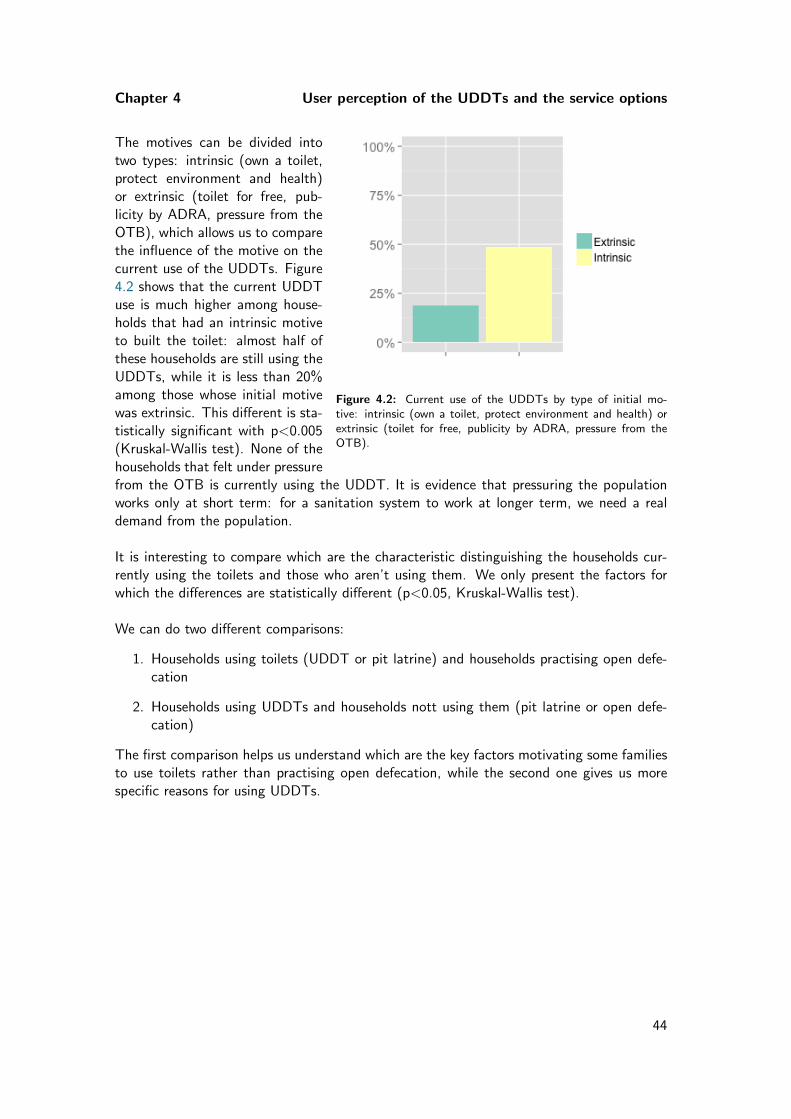
Chapter 4 User perception of the UDDTs and the service options
Figure 4.2: Current use of the UDDTs by type of initial mo-tive: intrinsic (own a toilet, protect environment and health) orextrinsic (toilet for free, publicity by ADRA, pressure from theOTB).
The motives can be divided intotwo types: intrinsic (own a toilet,protect environment and health)or extrinsic (toilet for free, pub-licity by ADRA, pressure from theOTB), which allows us to comparethe influence of the motive on thecurrent use of the UDDTs. Figure4.2 shows that the current UDDTuse is much higher among house-holds that had an intrinsic motiveto built the toilet: almost half ofthese households are still using theUDDTs, while it is less than 20%among those whose initial motivewas extrinsic. This different is sta-tistically significant with p<0.005(Kruskal-Wallis test). None of thehouseholds that felt under pressurefrom the OTB is currently using the UDDT. It is evidence that pressuring the populationworks only at short term: for a sanitation system to work at longer term, we need a realdemand from the population.
It is interesting to compare which are the characteristic distinguishing the households cur-rently using the toilets and those who aren’t using them. We only present the factors forwhich the differences are statistically different (p<0.05, Kruskal-Wallis test).
We can do two different comparisons:
1. Households using toilets (UDDT or pit latrine) and households practising open defe-cation
2. Households using UDDTs and households nott using them (pit latrine or open defe-cation)
The first comparison helps us understand which are the key factors motivating some familiesto use toilets rather than practising open defecation, while the second one gives us morespecific reasons for using UDDTs.
44
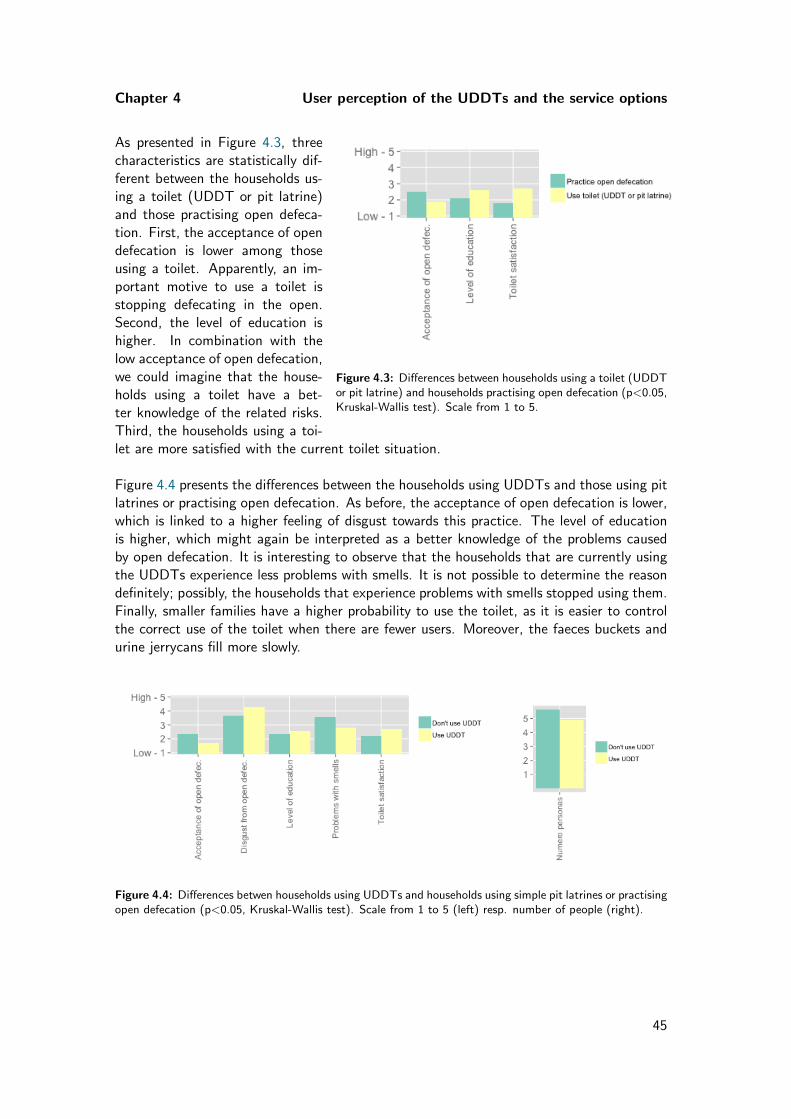
Chapter 4 User perception of the UDDTs and the service options
Figure 4.3: Differences between households using a toilet (UDDTor pit latrine) and households practising open defecation (p<0.05,Kruskal-Wallis test). Scale from 1 to 5.
As presented in Figure 4.3, threecharacteristics are statistically dif-ferent between the households us-ing a toilet (UDDT or pit latrine)and those practising open defeca-tion. First, the acceptance of opendefecation is lower among thoseusing a toilet. Apparently, an im-portant motive to use a toilet isstopping defecating in the open.Second, the level of education ishigher. In combination with thelow acceptance of open defecation,we could imagine that the house-holds using a toilet have a bet-ter knowledge of the related risks.Third, the households using a toi-let are more satisfied with the current toilet situation.
Figure 4.4 presents the differences between the households using UDDTs and those using pitlatrines or practising open defecation. As before, the acceptance of open defecation is lower,which is linked to a higher feeling of disgust towards this practice. The level of educationis higher, which might again be interpreted as a better knowledge of the problems causedby open defecation. It is interesting to observe that the households that are currently usingthe UDDTs experience less problems with smells. It is not possible to determine the reasondefinitely; possibly, the households that experience problems with smells stopped using them.Finally, smaller families have a higher probability to use the toilet, as it is easier to controlthe correct use of the toilet when there are fewer users. Moreover, the faeces buckets andurine jerrycans fill more slowly.
Figure 4.4: Differences betwen households using UDDTs and households using simple pit latrines or practisingopen defecation (p<0.05, Kruskal-Wallis test). Scale from 1 to 5 (left) resp. number of people (right).
45
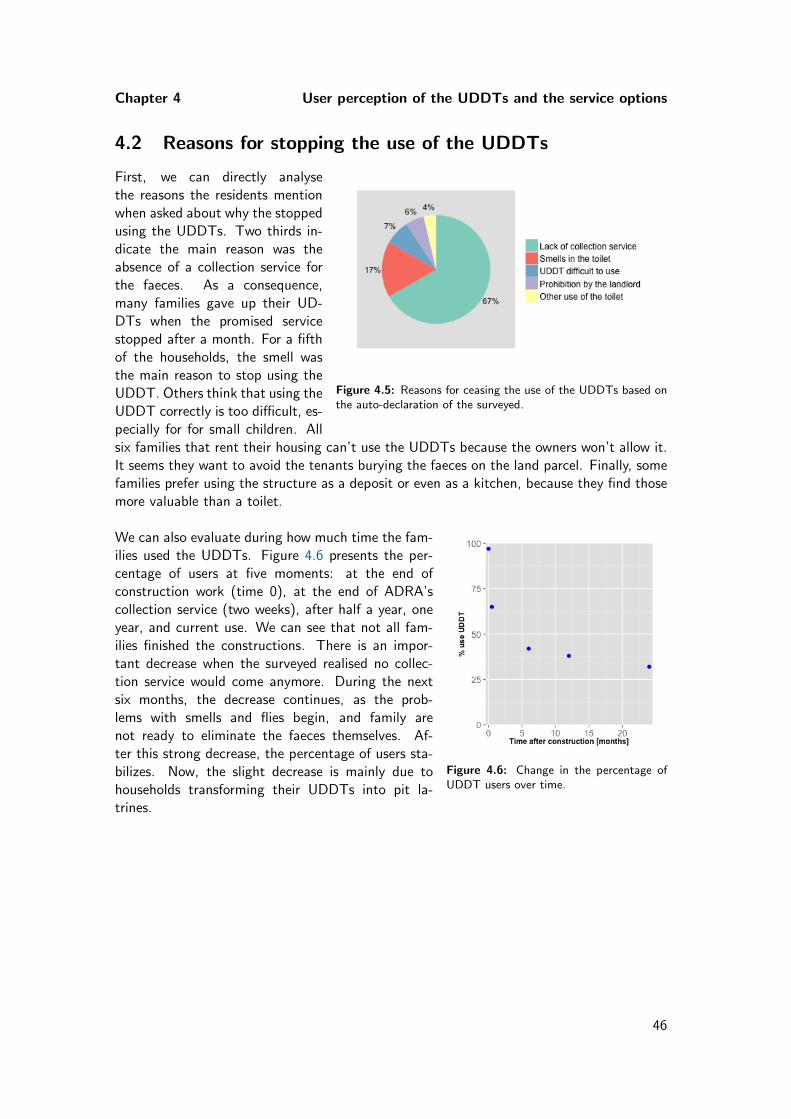
Chapter 4 User perception of the UDDTs and the service options
4.2 Reasons for stopping the use of the UDDTs
Figure 4.5: Reasons for ceasing the use of the UDDTs based onthe auto-declaration of the surveyed.
First, we can directly analysethe reasons the residents mentionwhen asked about why the stoppedusing the UDDTs. Two thirds in-dicate the main reason was theabsence of a collection service forthe faeces. As a consequence,many families gave up their UD-DTs when the promised servicestopped after a month. For a fifthof the households, the smell wasthe main reason to stop using theUDDT. Others think that using theUDDT correctly is too difficult, es-pecially for for small children. Allsix families that rent their housing can’t use the UDDTs because the owners won’t allow it.It seems they want to avoid the tenants burying the faeces on the land parcel. Finally, somefamilies prefer using the structure as a deposit or even as a kitchen, because they find thosemore valuable than a toilet.
Figure 4.6: Change in the percentage ofUDDT users over time.
We can also evaluate during how much time the fam-ilies used the UDDTs. Figure 4.6 presents the per-centage of users at five moments: at the end ofconstruction work (time 0), at the end of ADRA’scollection service (two weeks), after half a year, oneyear, and current use. We can see that not all fam-ilies finished the constructions. There is an impor-tant decrease when the surveyed realised no collec-tion service would come anymore. During the nextsix months, the decrease continues, as the prob-lems with smells and flies begin, and family arenot ready to eliminate the faeces themselves. Af-ter this strong decrease, the percentage of users sta-bilizes. Now, the slight decrease is mainly due tohouseholds transforming their UDDTs into pit la-trines.
46
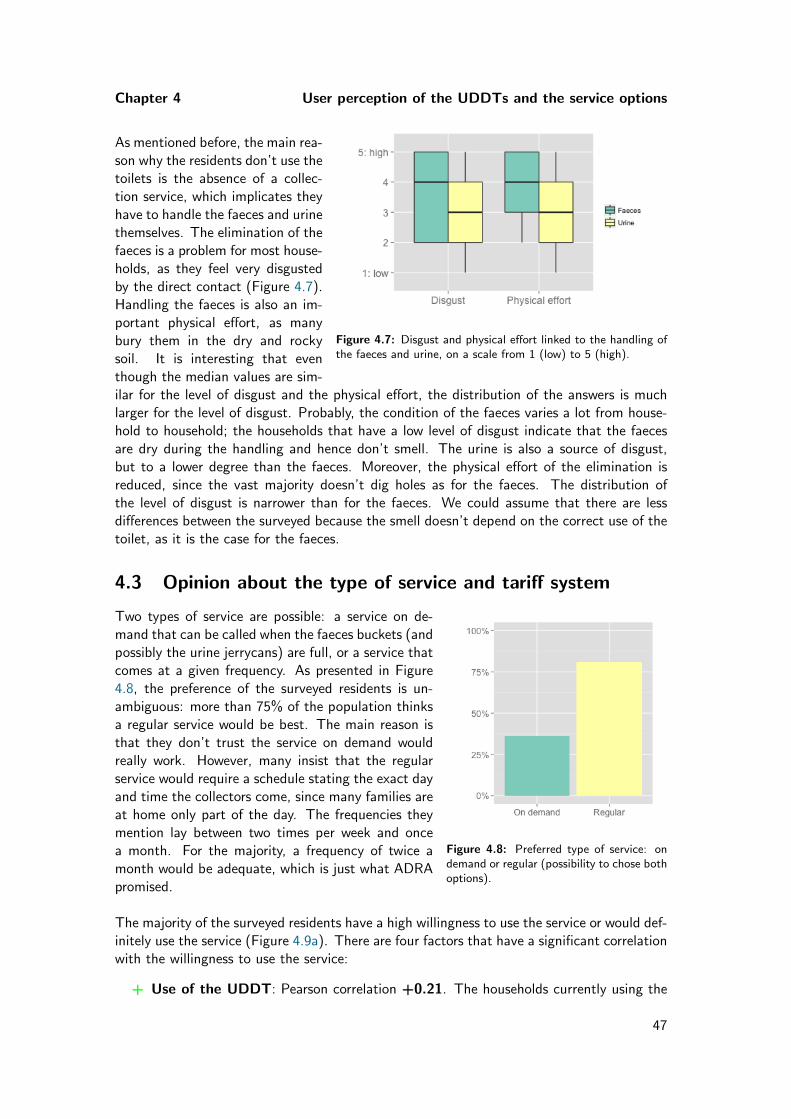
Chapter 4 User perception of the UDDTs and the service options
Figure 4.7: Disgust and physical effort linked to the handling ofthe faeces and urine, on a scale from 1 (low) to 5 (high).
As mentioned before, the main rea-son why the residents don’t use thetoilets is the absence of a collec-tion service, which implicates theyhave to handle the faeces and urinethemselves. The elimination of thefaeces is a problem for most house-holds, as they feel very disgustedby the direct contact (Figure 4.7).Handling the faeces is also an im-portant physical effort, as manybury them in the dry and rockysoil. It is interesting that eventhough the median values are sim-ilar for the level of disgust and the physical effort, the distribution of the answers is muchlarger for the level of disgust. Probably, the condition of the faeces varies a lot from house-hold to household; the households that have a low level of disgust indicate that the faecesare dry during the handling and hence don’t smell. The urine is also a source of disgust,but to a lower degree than the faeces. Moreover, the physical effort of the elimination isreduced, since the vast majority doesn’t dig holes as for the faeces. The distribution ofthe level of disgust is narrower than for the faeces. We could assume that there are lessdifferences between the surveyed because the smell doesn’t depend on the correct use of thetoilet, as it is the case for the faeces.
4.3 Opinion about the type of service and tariff system
Figure 4.8: Preferred type of service: ondemand or regular (possibility to chose bothoptions).
Two types of service are possible: a service on de-mand that can be called when the faeces buckets (andpossibly the urine jerrycans) are full, or a service thatcomes at a given frequency. As presented in Figure4.8, the preference of the surveyed residents is un-ambiguous: more than 75% of the population thinksa regular service would be best. The main reason isthat they don’t trust the service on demand wouldreally work. However, many insist that the regularservice would require a schedule stating the exact dayand time the collectors come, since many families areat home only part of the day. The frequencies theymention lay between two times per week and oncea month. For the majority, a frequency of twice amonth would be adequate, which is just what ADRApromised.
The majority of the surveyed residents have a high willingness to use the service or would def-initely use the service (Figure 4.9a). There are four factors that have a significant correlationwith the willingness to use the service:
+ Use of the UDDT: Pearson correlation +0.21. The households currently using the
47
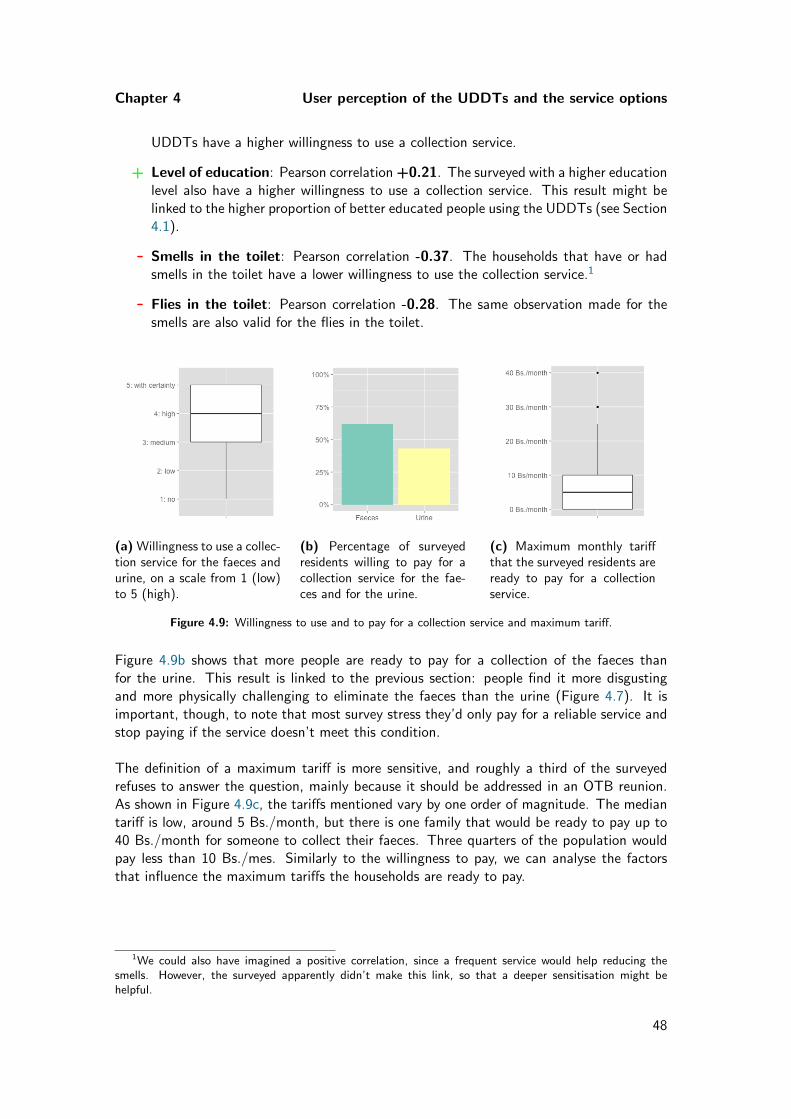
Chapter 4 User perception of the UDDTs and the service options
UDDTs have a higher willingness to use a collection service.
+ Level of education: Pearson correlation +0.21. The surveyed with a higher educationlevel also have a higher willingness to use a collection service. This result might belinked to the higher proportion of better educated people using the UDDTs (see Section4.1).
- Smells in the toilet: Pearson correlation -0.37. The households that have or hadsmells in the toilet have a lower willingness to use the collection service.1
- Flies in the toilet: Pearson correlation -0.28. The same observation made for thesmells are also valid for the flies in the toilet.
(a) Willingness to use a collec-tion service for the faeces andurine, on a scale from 1 (low)to 5 (high).
(b) Percentage of surveyedresidents willing to pay for acollection service for the fae-ces and for the urine.
(c) Maximum monthly tariffthat the surveyed residents areready to pay for a collectionservice.
Figure 4.9: Willingness to use and to pay for a collection service and maximum tariff.
Figure 4.9b shows that more people are ready to pay for a collection of the faeces thanfor the urine. This result is linked to the previous section: people find it more disgustingand more physically challenging to eliminate the faeces than the urine (Figure 4.7). It isimportant, though, to note that most survey stress they’d only pay for a reliable service andstop paying if the service doesn’t meet this condition.
The definition of a maximum tariff is more sensitive, and roughly a third of the surveyedrefuses to answer the question, mainly because it should be addressed in an OTB reunion.As shown in Figure 4.9c, the tariffs mentioned vary by one order of magnitude. The mediantariff is low, around 5 Bs./month, but there is one family that would be ready to pay up to40 Bs./month for someone to collect their faeces. Three quarters of the population wouldpay less than 10 Bs./mes. Similarly to the willingness to pay, we can analyse the factorsthat influence the maximum tariffs the households are ready to pay.
1We could also have imagined a positive correlation, since a frequent service would help reducing thesmells. However, the surveyed apparently didn’t make this link, so that a deeper sensitisation might behelpful.
48
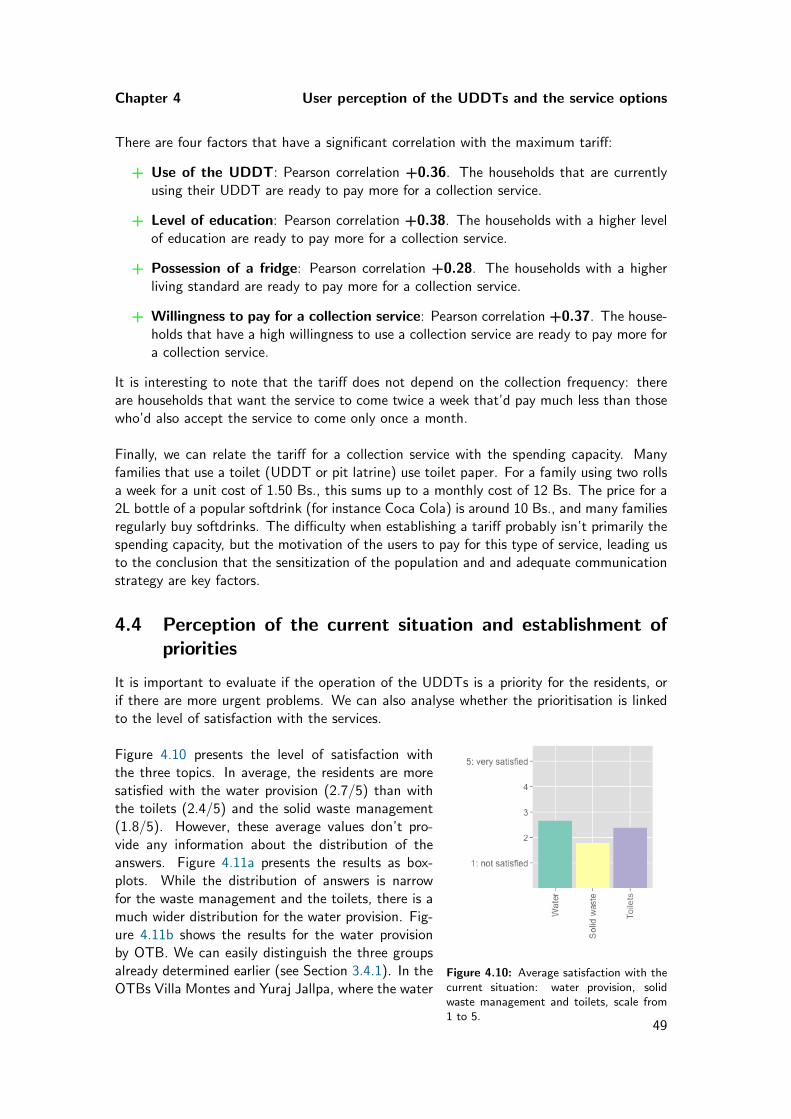
Chapter 4 User perception of the UDDTs and the service options
There are four factors that have a significant correlation with the maximum tariff:
+ Use of the UDDT: Pearson correlation +0.36. The households that are currentlyusing their UDDT are ready to pay more for a collection service.
+ Level of education: Pearson correlation +0.38. The households with a higher levelof education are ready to pay more for a collection service.
+ Possession of a fridge: Pearson correlation +0.28. The households with a higherliving standard are ready to pay more for a collection service.
+ Willingness to pay for a collection service: Pearson correlation +0.37. The house-holds that have a high willingness to use a collection service are ready to pay more fora collection service.
It is interesting to note that the tariff does not depend on the collection frequency: thereare households that want the service to come twice a week that’d pay much less than thosewho’d also accept the service to come only once a month.
Finally, we can relate the tariff for a collection service with the spending capacity. Manyfamilies that use a toilet (UDDT or pit latrine) use toilet paper. For a family using two rollsa week for a unit cost of 1.50 Bs., this sums up to a monthly cost of 12 Bs. The price for a2L bottle of a popular softdrink (for instance Coca Cola) is around 10 Bs., and many familiesregularly buy softdrinks. The difficulty when establishing a tariff probably isn’t primarily thespending capacity, but the motivation of the users to pay for this type of service, leading usto the conclusion that the sensitization of the population and and adequate communicationstrategy are key factors.
4.4 Perception of the current situation and establishment ofpriorities
It is important to evaluate if the operation of the UDDTs is a priority for the residents, orif there are more urgent problems. We can also analyse whether the prioritisation is linkedto the level of satisfaction with the services.
Figure 4.10: Average satisfaction with thecurrent situation: water provision, solidwaste management and toilets, scale from1 to 5.
Figure 4.10 presents the level of satisfaction withthe three topics. In average, the residents are moresatisfied with the water provision (2.7/5) than withthe toilets (2.4/5) and the solid waste management(1.8/5). However, these average values don’t pro-vide any information about the distribution of theanswers. Figure 4.11a presents the results as box-plots. While the distribution of answers is narrowfor the waste management and the toilets, there is amuch wider distribution for the water provision. Fig-ure 4.11b shows the results for the water provisionby OTB. We can easily distinguish the three groupsalready determined earlier (see Section 3.4.1). In theOTBs Villa Montes and Yuraj Jallpa, where the water
49
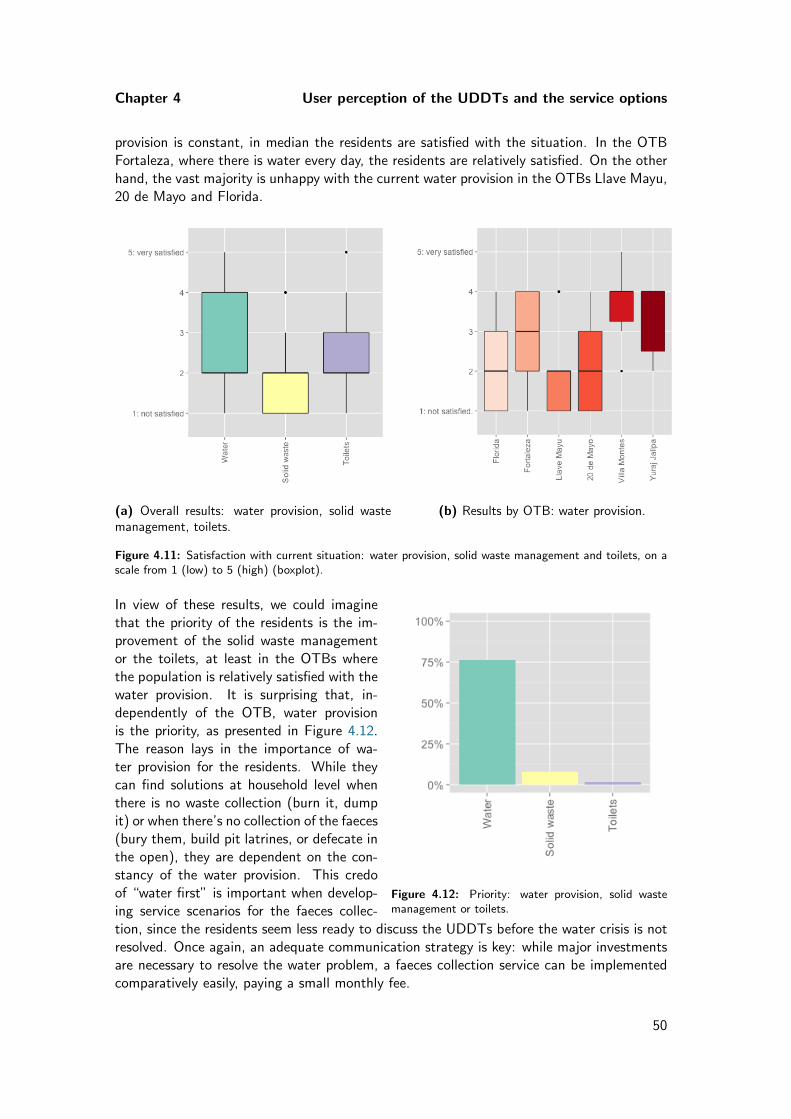
Chapter 4 User perception of the UDDTs and the service options
provision is constant, in median the residents are satisfied with the situation. In the OTBFortaleza, where there is water every day, the residents are relatively satisfied. On the otherhand, the vast majority is unhappy with the current water provision in the OTBs Llave Mayu,20 de Mayo and Florida.
(a) Overall results: water provision, solid wastemanagement, toilets.
(b) Results by OTB: water provision.
Figure 4.11: Satisfaction with current situation: water provision, solid waste management and toilets, on ascale from 1 (low) to 5 (high) (boxplot).
Figure 4.12: Priority: water provision, solid wastemanagement or toilets.
In view of these results, we could imaginethat the priority of the residents is the im-provement of the solid waste managementor the toilets, at least in the OTBs wherethe population is relatively satisfied with thewater provision. It is surprising that, in-dependently of the OTB, water provisionis the priority, as presented in Figure 4.12.The reason lays in the importance of wa-ter provision for the residents. While theycan find solutions at household level whenthere is no waste collection (burn it, dumpit) or when there’s no collection of the faeces(bury them, build pit latrines, or defecate inthe open), they are dependent on the con-stancy of the water provision. This credoof “water first” is important when develop-ing service scenarios for the faeces collec-tion, since the residents seem less ready to discuss the UDDTs before the water crisis is notresolved. Once again, an adequate communication strategy is key: while major investmentsare necessary to resolve the water problem, a faeces collection service can be implementedcomparatively easily, paying a small monthly fee.
50
CHAPTER 5
Lessons learnt from other projects
In this chapter, we present the parallels between the case of Arbieto and other projects thatcould serve as models, or, on the contrary, allow us to avoid committing the same errors:
� Composting plant in Tiquipaya
� UDDT projects implemented by the Fundacion Aguatuya in Cochabamba
� UDDT project implemented by the Fundacion Sumaj Huasi in El Alto
5.1 Composting plant in Tiquipaya
The visit was accompanied by Denis Sanchez, who is in charge of the composting plant inTiquipaya.
The Municipality of Tiquipaya, situated directly to the west of the Municipality of Cochabamba,has a population of around 54’000 inhabitants (INE, 2012) and is part of the city’s agglomer-ation. Solid waste management is under the responsibility of the Unidad de Gestion Integralde Residuos Solidos (GIRS, Unit for the Integral Management of Solid Waste). As in Ar-bieto, there is no sanitary landfill and the main motivation to build the composting plantin 2006 was the reduction of the quantities of solid waste needed to be disposed off. Theplant was modified and modernized with the help of the Diputacion de Barcelona (Provinceof Barcelona) who invested more than 440’000 Bs. in equipment in 2015.
The plant has a capacity of up to 8 tons of organic waste a day, using thermo-compostingwith forced aeration (Figure 5.1a). They also have an area for lombriculture, but the goal ofthis type of treatment is mainly educational (Figure 5.1b). In total, there are nine employeesworking in the plant, four of which part-time. The composting plant currently treats around3.5 tons of organics per day, that provide principally from the Municipality and the markets.Since the beginning of 2016, there is also a door-to-door collection of the organic wastein one of the Municipality’s district. This service has been accompanied by an educationcampaign explaining the correct separation of the waste. The acceptance of the service is
51
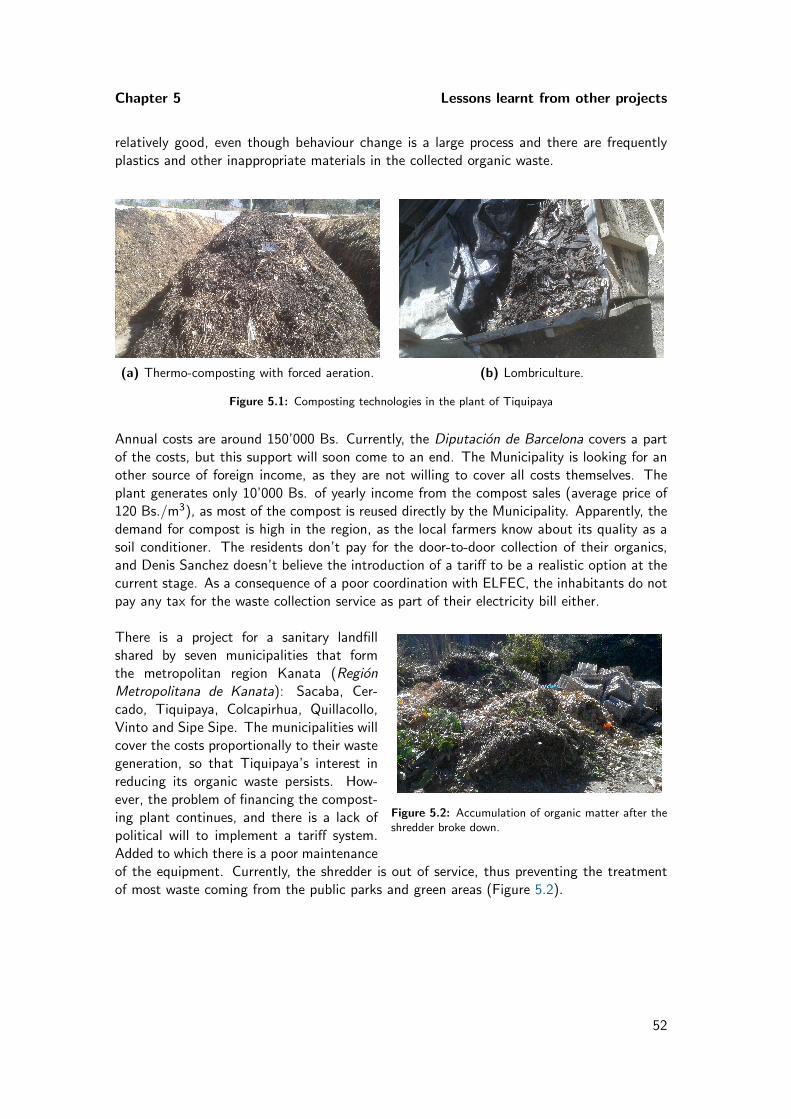
Chapter 5 Lessons learnt from other projects
relatively good, even though behaviour change is a large process and there are frequentlyplastics and other inappropriate materials in the collected organic waste.
(a) Thermo-composting with forced aeration. (b) Lombriculture.
Figure 5.1: Composting technologies in the plant of Tiquipaya
Annual costs are around 150’000 Bs. Currently, the Diputacion de Barcelona covers a partof the costs, but this support will soon come to an end. The Municipality is looking for another source of foreign income, as they are not willing to cover all costs themselves. Theplant generates only 10’000 Bs. of yearly income from the compost sales (average price of120 Bs./m3), as most of the compost is reused directly by the Municipality. Apparently, thedemand for compost is high in the region, as the local farmers know about its quality as asoil conditioner. The residents don’t pay for the door-to-door collection of their organics,and Denis Sanchez doesn’t believe the introduction of a tariff to be a realistic option at thecurrent stage. As a consequence of a poor coordination with ELFEC, the inhabitants do notpay any tax for the waste collection service as part of their electricity bill either.
Figure 5.2: Accumulation of organic matter after theshredder broke down.
There is a project for a sanitary landfillshared by seven municipalities that formthe metropolitan region Kanata (RegionMetropolitana de Kanata): Sacaba, Cer-cado, Tiquipaya, Colcapirhua, Quillacollo,Vinto and Sipe Sipe. The municipalities willcover the costs proportionally to their wastegeneration, so that Tiquipaya’s interest inreducing its organic waste persists. How-ever, the problem of financing the compost-ing plant continues, and there is a lack ofpolitical will to implement a tariff system.Added to which there is a poor maintenanceof the equipment. Currently, the shredder is out of service, thus preventing the treatmentof most waste coming from the public parks and green areas (Figure 5.2).
52
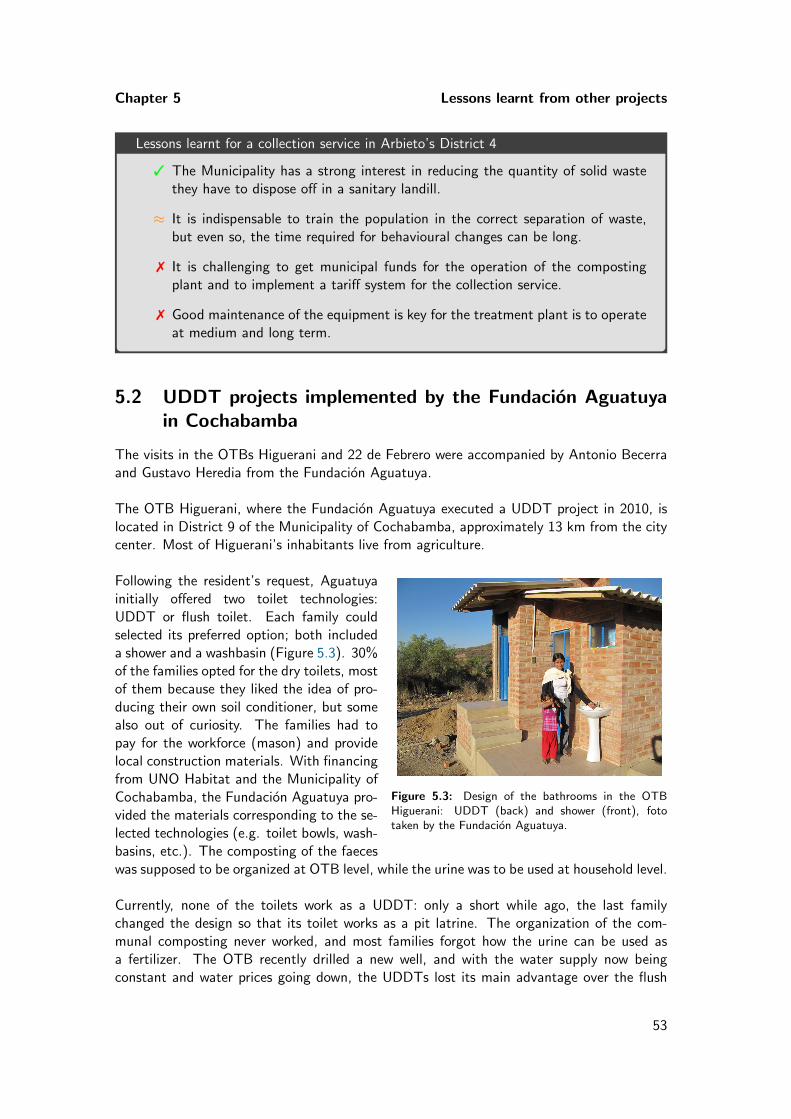
Chapter 5 Lessons learnt from other projects
Lessons learnt for a collection service in Arbieto’s District 4
3 The Municipality has a strong interest in reducing the quantity of solid wastethey have to dispose off in a sanitary landill.
≈ It is indispensable to train the population in the correct separation of waste,but even so, the time required for behavioural changes can be long.
7 It is challenging to get municipal funds for the operation of the compostingplant and to implement a tariff system for the collection service.
7 Good maintenance of the equipment is key for the treatment plant is to operateat medium and long term.
5.2 UDDT projects implemented by the Fundacion Aguatuyain Cochabamba
The visits in the OTBs Higuerani and 22 de Febrero were accompanied by Antonio Becerraand Gustavo Heredia from the Fundacion Aguatuya.
The OTB Higuerani, where the Fundacion Aguatuya executed a UDDT project in 2010, islocated in District 9 of the Municipality of Cochabamba, approximately 13 km from the citycenter. Most of Higuerani’s inhabitants live from agriculture.
Figure 5.3: Design of the bathrooms in the OTBHiguerani: UDDT (back) and shower (front), fototaken by the Fundacion Aguatuya.
Following the resident’s request, Aguatuyainitially offered two toilet technologies:UDDT or flush toilet. Each family couldselected its preferred option; both includeda shower and a washbasin (Figure 5.3). 30%of the families opted for the dry toilets, mostof them because they liked the idea of pro-ducing their own soil conditioner, but somealso out of curiosity. The families had topay for the workforce (mason) and providelocal construction materials. With financingfrom UNO Habitat and the Municipality ofCochabamba, the Fundacion Aguatuya pro-vided the materials corresponding to the se-lected technologies (e.g. toilet bowls, wash-basins, etc.). The composting of the faeceswas supposed to be organized at OTB level, while the urine was to be used at household level.
Currently, none of the toilets work as a UDDT: only a short while ago, the last familychanged the design so that its toilet works as a pit latrine. The organization of the com-munal composting never worked, and most families forgot how the urine can be used asa fertilizer. The OTB recently drilled a new well, and with the water supply now beingconstant and water prices going down, the UDDTs lost its main advantage over the flush
53
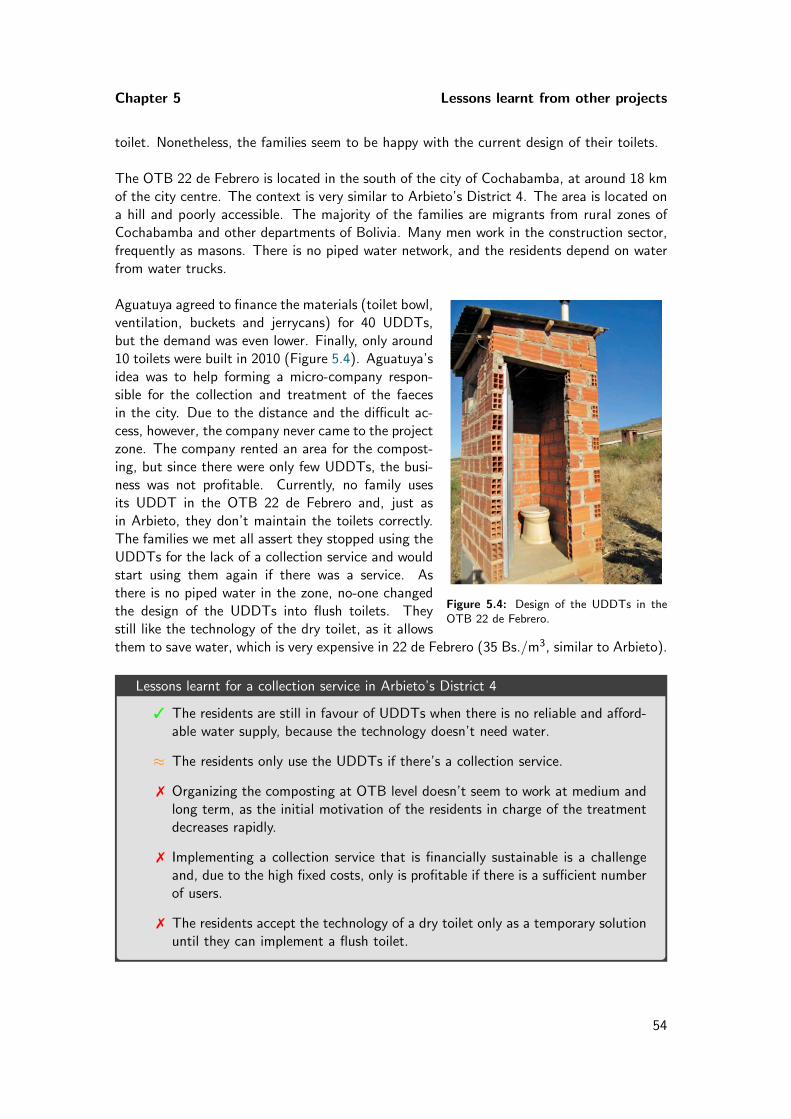
Chapter 5 Lessons learnt from other projects
toilet. Nonetheless, the families seem to be happy with the current design of their toilets.
The OTB 22 de Febrero is located in the south of the city of Cochabamba, at around 18 kmof the city centre. The context is very similar to Arbieto’s District 4. The area is located ona hill and poorly accessible. The majority of the families are migrants from rural zones ofCochabamba and other departments of Bolivia. Many men work in the construction sector,frequently as masons. There is no piped water network, and the residents depend on waterfrom water trucks.
!"#$%&#'(%'(%)*+(*'(%',*'-.+/*'0%$1+*,'
!" #$%&'()*" +'" ,-." %*/-." '#-,01&#-." .'#-.2" +'" *#$'(+-" *" ,-." 3,*4-."56"+7*.2" 3*(*" ,-" #$*," .'"
',*%-(*(7*"$4"#(-4-1(*8*"#-4.'4.$*+-"+'"#-4.)($##&04"+'",-."%*/-.9":.&8&.8-2" +'%7*4" +
;('*"3*(*",*"&83,'8'4)*#&04"+'"$4*"#-83-.)'(*"+'",-."('.&+$-.".0,&+-."
('.&+$-.2",*"<=>"+'%7*"4'1-#&*("#-4"'.*"&4.)*4#&*"',"#-.)-"+',".'(?&#&-9
,*"#-4.)($##&04"+'"@6"%*/-."'#-,01&#-.".'#-.2"#-4"$4"8-4)-"8;A&8-"
8*)'(&*,'.B
C4"&4-+-(-"'#-,01&#-".'#-"DE<F:G"
C4*")*3*"!"*.&'4)-"3*(*"',"&4-+-(-"
C4"$(&4*(&-"+'"H-8%('.
C4",*?*8*4-."#-4"3'+'.)*,
E-83$'()*"8');,&#*"3*(*",-."#-4)'4'+-('.
2324
Figure 5.4: Design of the UDDTs in theOTB 22 de Febrero.
Aguatuya agreed to finance the materials (toilet bowl,ventilation, buckets and jerrycans) for 40 UDDTs,but the demand was even lower. Finally, only around10 toilets were built in 2010 (Figure 5.4). Aguatuya’sidea was to help forming a micro-company respon-sible for the collection and treatment of the faecesin the city. Due to the distance and the difficult ac-cess, however, the company never came to the projectzone. The company rented an area for the compost-ing, but since there were only few UDDTs, the busi-ness was not profitable. Currently, no family usesits UDDT in the OTB 22 de Febrero and, just asin Arbieto, they don’t maintain the toilets correctly.The families we met all assert they stopped using theUDDTs for the lack of a collection service and wouldstart using them again if there was a service. Asthere is no piped water in the zone, no-one changedthe design of the UDDTs into flush toilets. Theystill like the technology of the dry toilet, as it allowsthem to save water, which is very expensive in 22 de Febrero (35 Bs./m3, similar to Arbieto).
Lessons learnt for a collection service in Arbieto’s District 4
3 The residents are still in favour of UDDTs when there is no reliable and afford-able water supply, because the technology doesn’t need water.
≈ The residents only use the UDDTs if there’s a collection service.
7 Organizing the composting at OTB level doesn’t seem to work at medium andlong term, as the initial motivation of the residents in charge of the treatmentdecreases rapidly.
7 Implementing a collection service that is financially sustainable is a challengeand, due to the high fixed costs, only is profitable if there is a sufficient numberof users.
7 The residents accept the technology of a dry toilet only as a temporary solutionuntil they can implement a flush toilet.
54
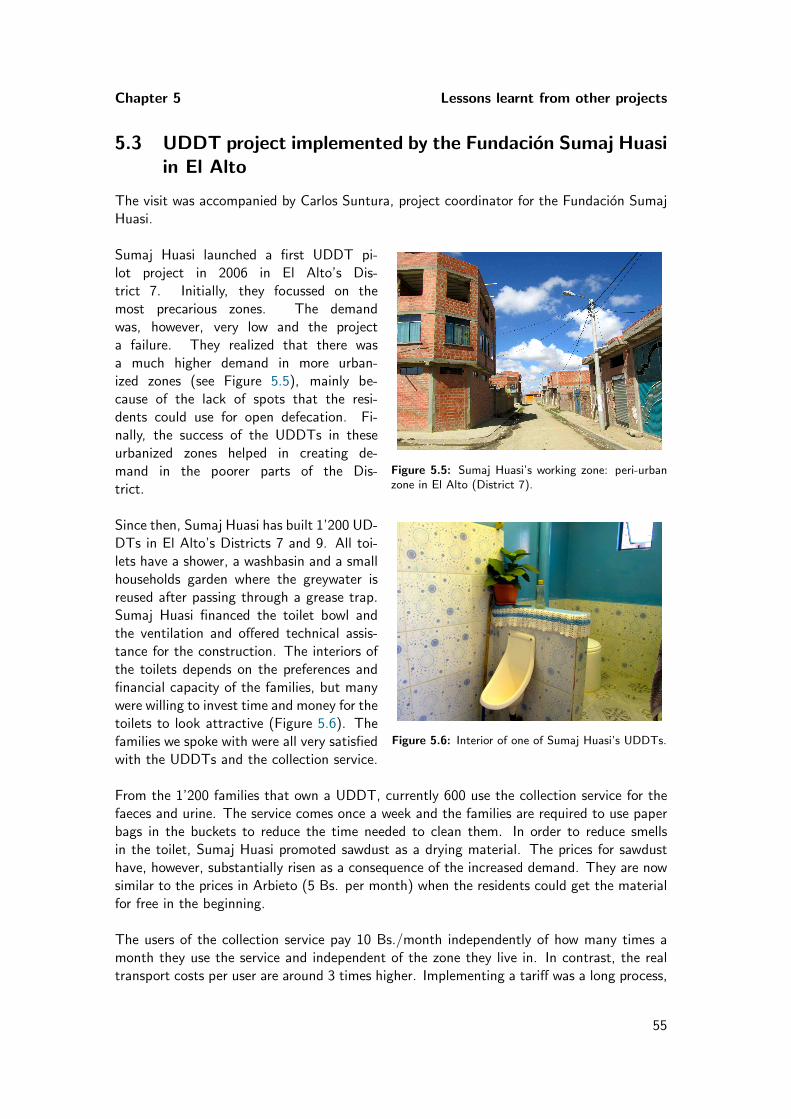
Chapter 5 Lessons learnt from other projects
5.3 UDDT project implemented by the Fundacion Sumaj Huasiin El Alto
The visit was accompanied by Carlos Suntura, project coordinator for the Fundacion SumajHuasi.
Figure 5.5: Sumaj Huasi’s working zone: peri-urbanzone in El Alto (District 7).
Sumaj Huasi launched a first UDDT pi-lot project in 2006 in El Alto’s Dis-trict 7. Initially, they focussed on themost precarious zones. The demandwas, however, very low and the projecta failure. They realized that there wasa much higher demand in more urban-ized zones (see Figure 5.5), mainly be-cause of the lack of spots that the resi-dents could use for open defecation. Fi-nally, the success of the UDDTs in theseurbanized zones helped in creating de-mand in the poorer parts of the Dis-trict.
Figure 5.6: Interior of one of Sumaj Huasi’s UDDTs.
Since then, Sumaj Huasi has built 1’200 UD-DTs in El Alto’s Districts 7 and 9. All toi-lets have a shower, a washbasin and a smallhouseholds garden where the greywater isreused after passing through a grease trap.Sumaj Huasi financed the toilet bowl andthe ventilation and offered technical assis-tance for the construction. The interiors ofthe toilets depends on the preferences andfinancial capacity of the families, but manywere willing to invest time and money for thetoilets to look attractive (Figure 5.6). Thefamilies we spoke with were all very satisfiedwith the UDDTs and the collection service.
From the 1’200 families that own a UDDT, currently 600 use the collection service for thefaeces and urine. The service comes once a week and the families are required to use paperbags in the buckets to reduce the time needed to clean them. In order to reduce smellsin the toilet, Sumaj Huasi promoted sawdust as a drying material. The prices for sawdusthave, however, substantially risen as a consequence of the increased demand. They are nowsimilar to the prices in Arbieto (5 Bs. per month) when the residents could get the materialfor free in the beginning.
The users of the collection service pay 10 Bs./month independently of how many times amonth they use the service and independent of the zone they live in. In contrast, the realtransport costs per user are around 3 times higher. Implementing a tariff was a long process,
55
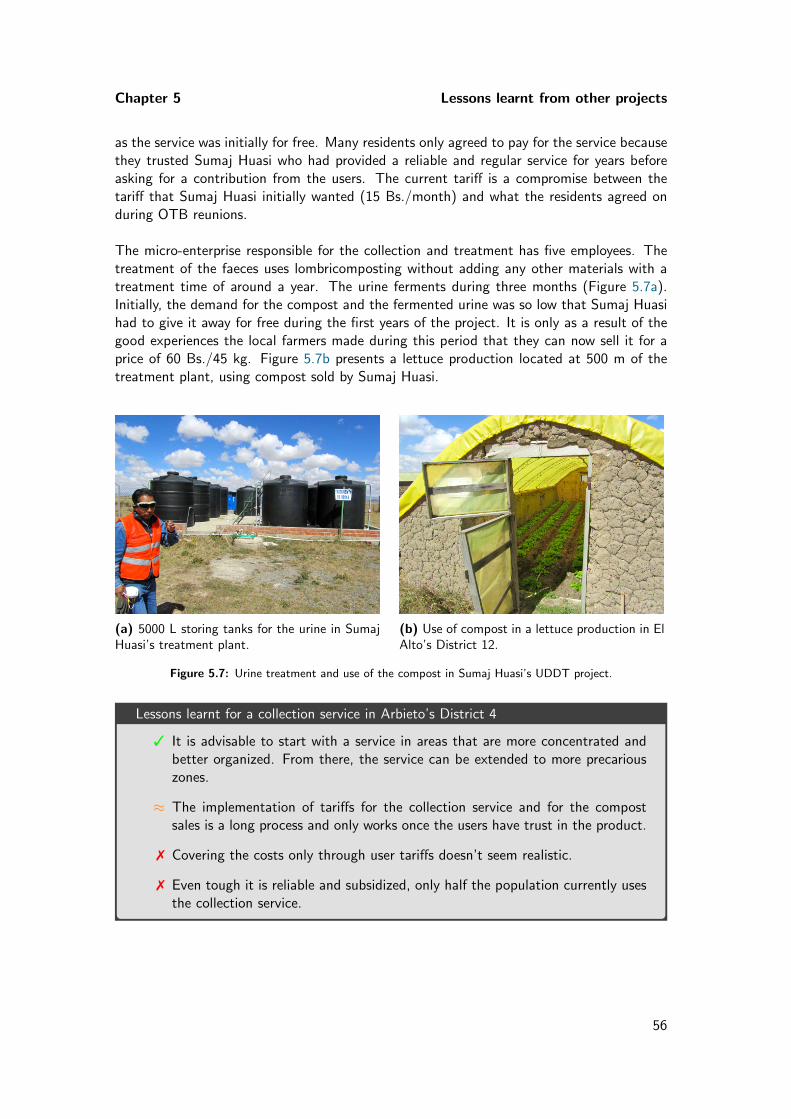
Chapter 5 Lessons learnt from other projects
as the service was initially for free. Many residents only agreed to pay for the service becausethey trusted Sumaj Huasi who had provided a reliable and regular service for years beforeasking for a contribution from the users. The current tariff is a compromise between thetariff that Sumaj Huasi initially wanted (15 Bs./month) and what the residents agreed onduring OTB reunions.
The micro-enterprise responsible for the collection and treatment has five employees. Thetreatment of the faeces uses lombricomposting without adding any other materials with atreatment time of around a year. The urine ferments during three months (Figure 5.7a).Initially, the demand for the compost and the fermented urine was so low that Sumaj Huasihad to give it away for free during the first years of the project. It is only as a result of thegood experiences the local farmers made during this period that they can now sell it for aprice of 60 Bs./45 kg. Figure 5.7b presents a lettuce production located at 500 m of thetreatment plant, using compost sold by Sumaj Huasi.
(a) 5000 L storing tanks for the urine in SumajHuasi’s treatment plant.
(b) Use of compost in a lettuce production in ElAlto’s District 12.
Figure 5.7: Urine treatment and use of the compost in Sumaj Huasi’s UDDT project.
Lessons learnt for a collection service in Arbieto’s District 4
3 It is advisable to start with a service in areas that are more concentrated andbetter organized. From there, the service can be extended to more precariouszones.
≈ The implementation of tariffs for the collection service and for the compostsales is a long process and only works once the users have trust in the product.
7 Covering the costs only through user tariffs doesn’t seem realistic.
7 Even tough it is reliable and subsidized, only half the population currently usesthe collection service.
56
CHAPTER 6
Service chain scenarios
Based on the results from the survey, where we identified the absence of a solid wastecollection service, we developed two main service scenarios:
1 Collection of the faeces
2 Collection of all solid waste1
Besides the improvement of environmental conditions, there are practical reasons why itmight be advisable to include the collection of all solid waste:
� It is politically difficult to provide a service that only serves part of the population, asit is the case of a faeces collection service
� The fixed costs of the service can be distributed among more users, so that the costsper user are lower
� The co-composting of the faeces and the organic waste produces better quality com-post
At this stage of the project, the collection of the urine is not included for the followingreasons:
� The quantity of urine produced requiring a high collection frequency, thus considerablyadding to the costs
� The investment required for buying storage tanks for the urine (or another type oftreatment)
� The low willingness to pay for this type of service as a consequence of a lower levelof disgust and less physical effort required for the elimination of the urine
1In this report, the term solid waste includes organic waste, recyclables (plastics, glass, paper, metal), notusable residues, as well as the faeces.
57
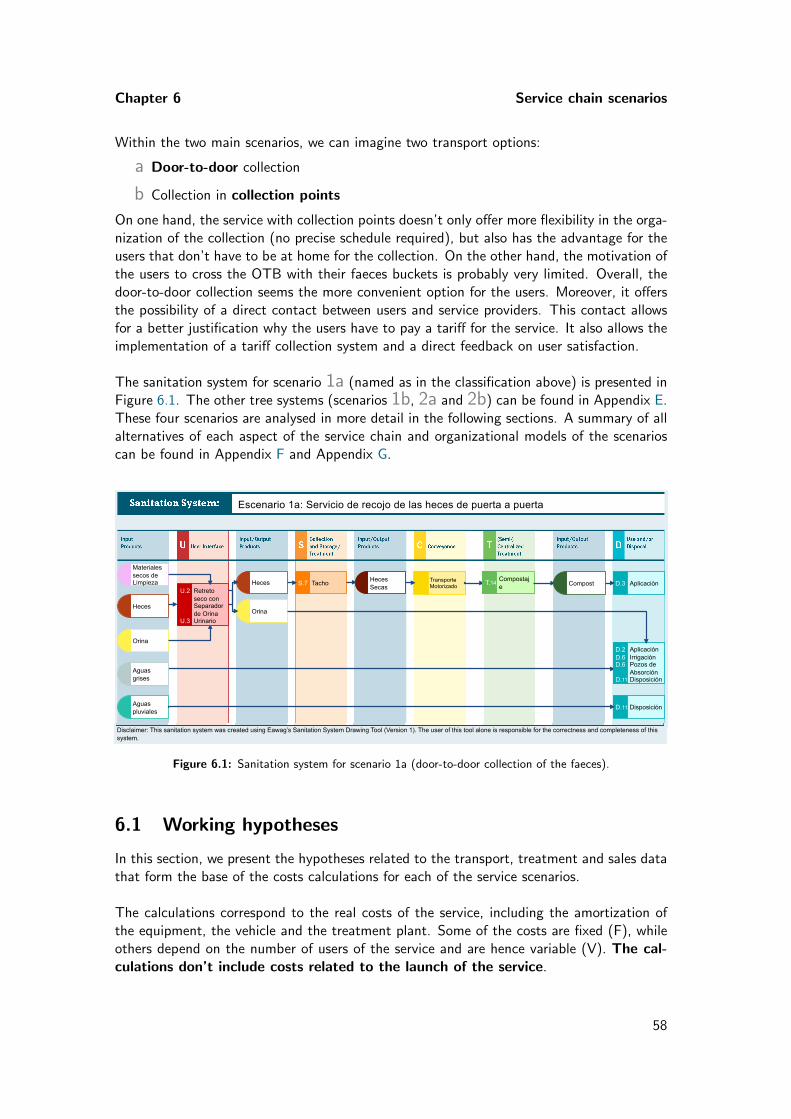
Chapter 6 Service chain scenarios
Within the two main scenarios, we can imagine two transport options:
a Door-to-door collection
b Collection in collection points
On one hand, the service with collection points doesn’t only offer more flexibility in the orga-nization of the collection (no precise schedule required), but also has the advantage for theusers that don’t have to be at home for the collection. On the other hand, the motivation ofthe users to cross the OTB with their faeces buckets is probably very limited. Overall, thedoor-to-door collection seems the more convenient option for the users. Moreover, it offersthe possibility of a direct contact between users and service providers. This contact allowsfor a better justification why the users have to pay a tariff for the service. It also allows theimplementation of a tariff collection system and a direct feedback on user satisfaction.
The sanitation system for scenario 1a (named as in the classification above) is presented inFigure 6.1. The other tree systems (scenarios 1b, 2a and 2b) can be found in Appendix E.These four scenarios are analysed in more detail in the following sections. A summary of allalternatives of each aspect of the service chain and organizational models of the scenarioscan be found in Appendix F and Appendix G.
Disclaimer: This sanitation system was created using Eawag’s Sanitation System Drawing Tool (Version 1). The user of this tool alone is responsible for the correctness and completeness of this system.
Disclaimer: This sanitation system was created using Eawag’s Sanitation System Drawing Tool (Version 1). The user of this tool alone is responsible for the correctness and completeness of this system.
Heces
Orina
Escenario 1a: Servicio de recojo de las heces de puerta a puerta
Materiales secos de Limpieza
Aguas grises
Aguas pluviales
D.3 Aplicación
D.2 D.6 D.6
D.11
Aplicación Irrigación Pozos de Absorción Disposición
D.11 Disposición
Transporte Motorizado
Retreto seco con Separador de Orina Urinario
U.2
U.3
Heces
Orina
Tacho S.7 Heces Secas
T.14 Compostaje Compost
Figure 6.1: Sanitation system for scenario 1a (door-to-door collection of the faeces).
6.1 Working hypotheses
In this section, we present the hypotheses related to the transport, treatment and sales datathat form the base of the costs calculations for each of the service scenarios.
The calculations correspond to the real costs of the service, including the amortization ofthe equipment, the vehicle and the treatment plant. Some of the costs are fixed (F), whileothers depend on the number of users of the service and are hence variable (V). The cal-culations don’t include costs related to the launch of the service.
58
Chapter 6 Service chain scenarios
Costs not included: launch of the service
� Initial equipment of the treatment plant (water and electricity connection, ac-quisition of additional buckets)
� Reparation of toilets, implementation of direct infiltration of the urine, changeof the design of the toilets in the OTB Yuraj Jallpaa (see Section 3.2)
� Coordination with the OTBs to choose the most adequate service option
� Sensitization of the users about the service and the tariff system
� External support for the upstart of the lombricomposting
aCurrently, some families use the toilets with buckets, but they lack a door for an easy access tothe faeces chamber.
The baseline data includes the number of residents and UDDTs, the production of solidwaste (including faeces) and the salary data.
Baseline data
� The number of residents is based on the number of members of each OTB,multiplied with the average number of members per family (5.4, result fromthe survey). This number is most probably overestimated, as not all membersof the OTBs live permanently in the zone (see Section 3.4.3).
� The number of UDDTs corresponds to the number for which ADRA providedthe materials. However, not all families actually finished the construction (Sec-tion 3.4.3).
� The quantity and composition of the solid waste is based on a study for theurban center of Arbieto. We could imagine that the waste production is lowerin District 4, as many residents aren’t at home during the day.
� The salaries correspond to the minimum salary in Bolivia (2016). They includea (compulsory) bonus called aguinaldo and the social security contributions(aportes sociales patronalesa). We assume that the operators are employed onlyfor the working time for which they are actually required. If the Municipalityprefers employing them full-time, they would have to take on other public tasks.
aIncludes AFP Riesgo Profesional, Aporte Vivienda, Fondo Solidario, Caja Nacional
Transport costs depend principally on the transport and collection distances. They are com-posed of vehicle and personal costs. In Scenario a (door-to-door collection), the vehicle onlypasses the roads that are in a good state. The collection is organized in five tours (jointtours for 20 de Mayo/Florida and Cristal Mayu/Fortaleza). In Scenario b, the number ofcollection points was chosen in order to ensure that each family is located at less than 200m from the nearest point. Based on this criterion, we need 20 collection points that can beemptied in 14 tours. The maps of the five collection tours can be found in Appendix H and
59
Chapter 6 Service chain scenarios
the localization of the collection points in Appendix I.
Transport costs
Vehicle costs
F Amortization, maintenance and vehicle insurance
V Consumables (gasoline, motor oil, tyres) depending on the transport distance
Personal costs
V Working hours for the transport, depending on the transport distance
V Working hours for the collection, cleaning of the faeces buckets and adminis-tration (tariff collection), depending on the number of users
V Costs for working clothes and protection gear depending on the number ofemployees
To this, we have to add the costs for the water required to clean the buckets.
The treatment costs include costs related to the treatment plant and to the employees.
Treatment costs
Costs related to the treatment plant
F Amortization and maintenance of the plant
F Electricity
Costs related to the employees
V Working hours for the treatment depending on the quantity of waste (faeces,organics) treated and the composting time
V Costs for working clothes, protection gear and tools depending on the numberof employees
To this, we have to add the cost for the water required to humidify the compost.
The current composting pits aren’t sufficient to treat the faeces and the organic waste, sothat the construction of additional pits is necessary. The construction costs are transformedinto amortization costs.
Amortization costs for the composting pits
V Amortization of the additional composting pits depending on the number ofusers and the treatment time
60
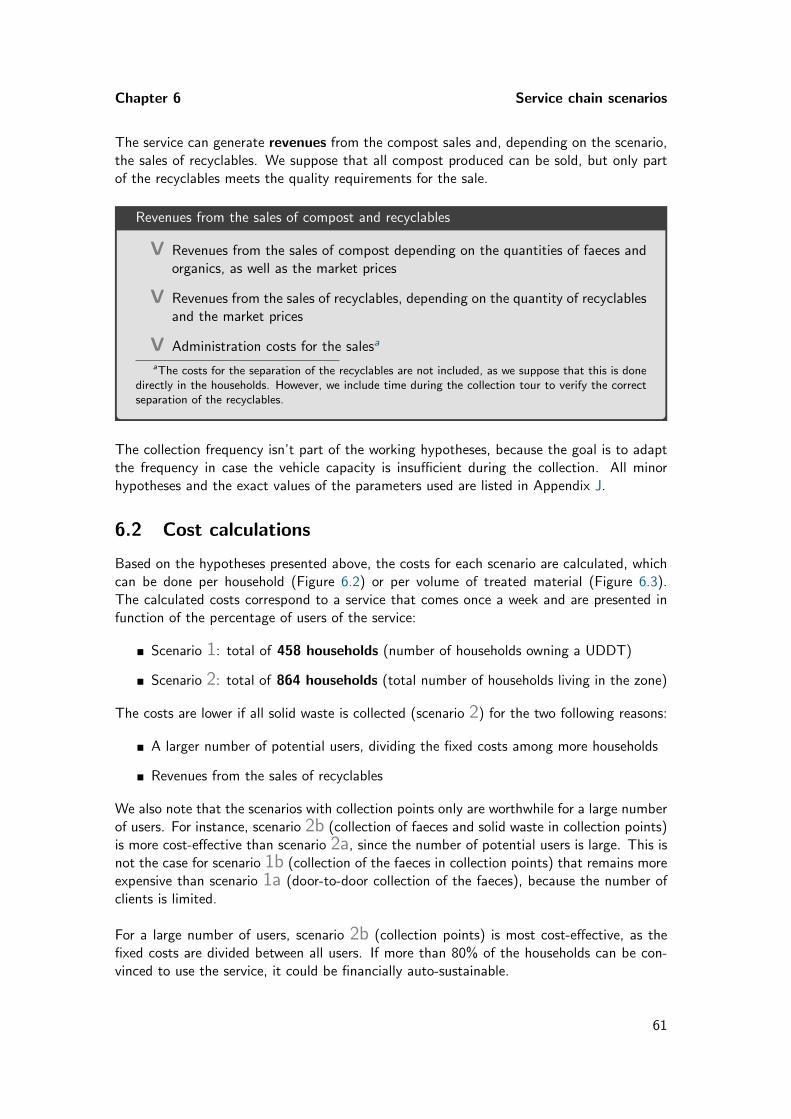
Chapter 6 Service chain scenarios
The service can generate revenues from the compost sales and, depending on the scenario,the sales of recyclables. We suppose that all compost produced can be sold, but only partof the recyclables meets the quality requirements for the sale.
Revenues from the sales of compost and recyclables
V Revenues from the sales of compost depending on the quantities of faeces andorganics, as well as the market prices
V Revenues from the sales of recyclables, depending on the quantity of recyclablesand the market prices
V Administration costs for the salesa
aThe costs for the separation of the recyclables are not included, as we suppose that this is donedirectly in the households. However, we include time during the collection tour to verify the correctseparation of the recyclables.
The collection frequency isn’t part of the working hypotheses, because the goal is to adaptthe frequency in case the vehicle capacity is insufficient during the collection. All minorhypotheses and the exact values of the parameters used are listed in Appendix J.
6.2 Cost calculations
Based on the hypotheses presented above, the costs for each scenario are calculated, whichcan be done per household (Figure 6.2) or per volume of treated material (Figure 6.3).The calculated costs correspond to a service that comes once a week and are presented infunction of the percentage of users of the service:
� Scenario 1: total of 458 households (number of households owning a UDDT)
� Scenario 2: total of 864 households (total number of households living in the zone)
The costs are lower if all solid waste is collected (scenario 2) for the two following reasons:
� A larger number of potential users, dividing the fixed costs among more households
� Revenues from the sales of recyclables
We also note that the scenarios with collection points only are worthwhile for a large numberof users. For instance, scenario 2b (collection of faeces and solid waste in collection points)is more cost-effective than scenario 2a, since the number of potential users is large. This isnot the case for scenario 1b (collection of the faeces in collection points) that remains moreexpensive than scenario 1a (door-to-door collection of the faeces), because the number ofclients is limited.
For a large number of users, scenario 2b (collection points) is most cost-effective, as thefixed costs are divided between all users. If more than 80% of the households can be con-vinced to use the service, it could be financially auto-sustainable.
61
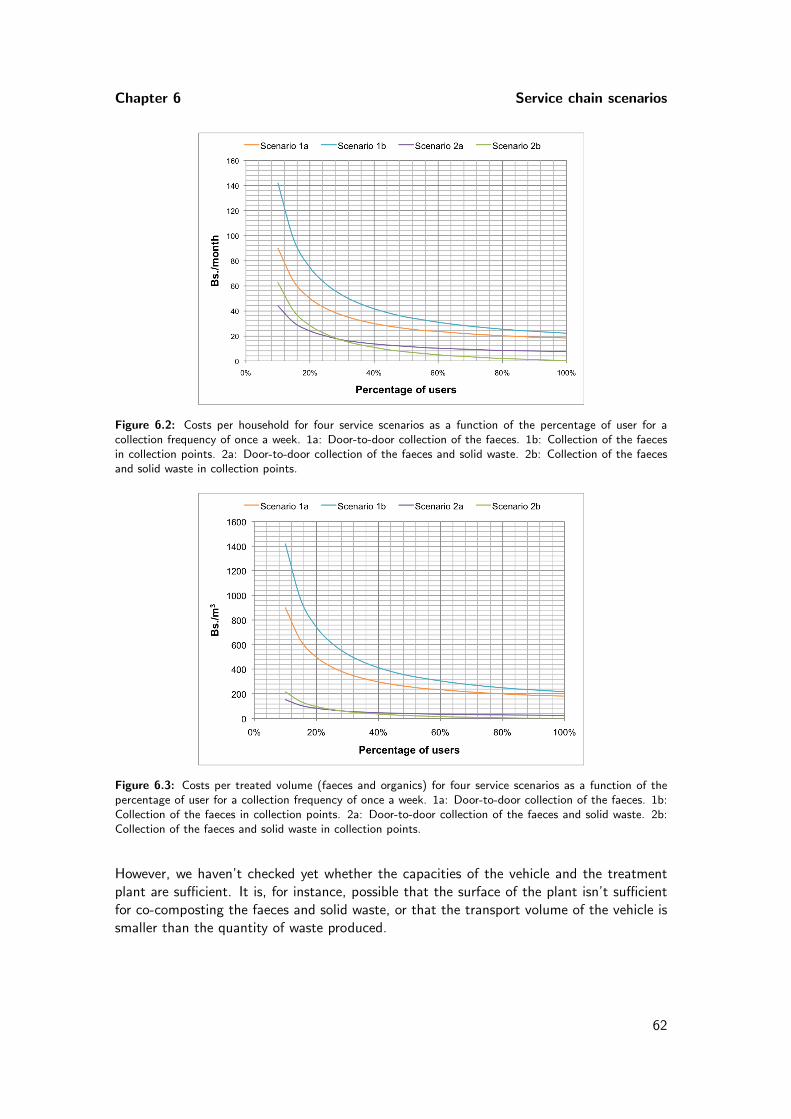
Chapter 6 Service chain scenarios
Figure 6.2: Costs per household for four service scenarios as a function of the percentage of user for acollection frequency of once a week. 1a: Door-to-door collection of the faeces. 1b: Collection of the faecesin collection points. 2a: Door-to-door collection of the faeces and solid waste. 2b: Collection of the faecesand solid waste in collection points.
Figure 6.3: Costs per treated volume (faeces and organics) for four service scenarios as a function of thepercentage of user for a collection frequency of once a week. 1a: Door-to-door collection of the faeces. 1b:Collection of the faeces in collection points. 2a: Door-to-door collection of the faeces and solid waste. 2b:Collection of the faeces and solid waste in collection points.
However, we haven’t checked yet whether the capacities of the vehicle and the treatmentplant are sufficient. It is, for instance, possible that the surface of the plant isn’t sufficientfor co-composting the faeces and solid waste, or that the transport volume of the vehicle issmaller than the quantity of waste produced.
62
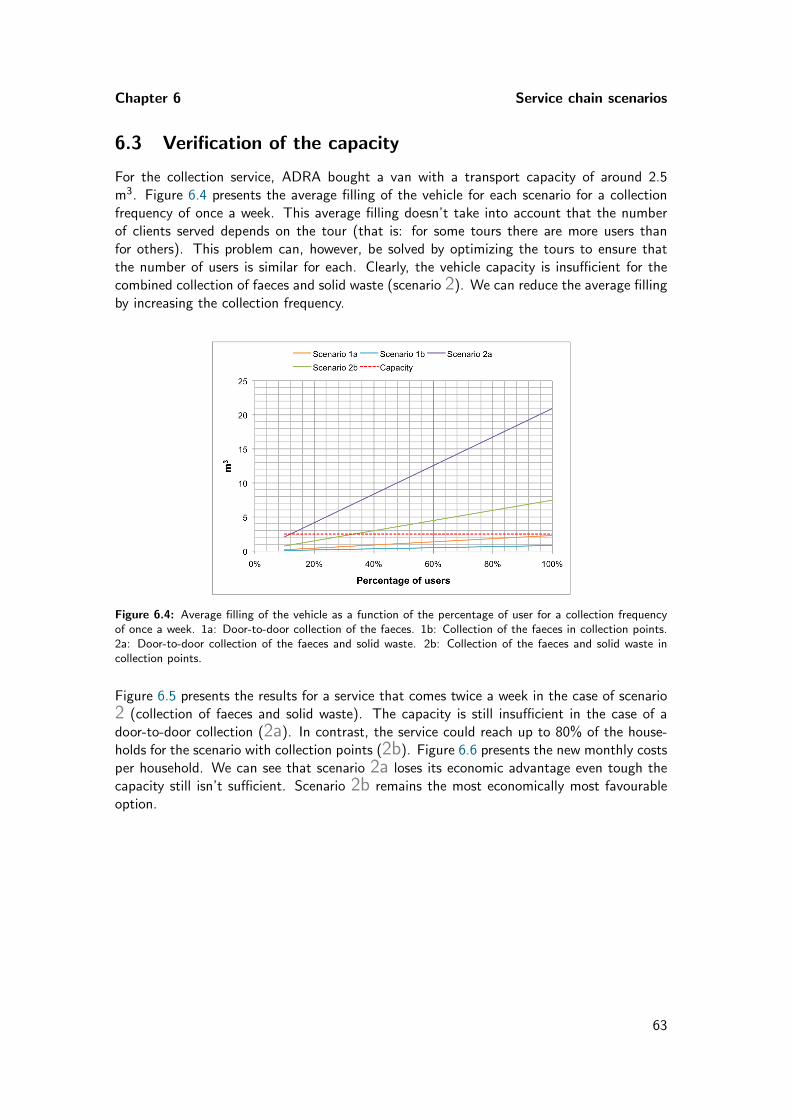
Chapter 6 Service chain scenarios
6.3 Verification of the capacity
For the collection service, ADRA bought a van with a transport capacity of around 2.5m3. Figure 6.4 presents the average filling of the vehicle for each scenario for a collectionfrequency of once a week. This average filling doesn’t take into account that the numberof clients served depends on the tour (that is: for some tours there are more users thanfor others). This problem can, however, be solved by optimizing the tours to ensure thatthe number of users is similar for each. Clearly, the vehicle capacity is insufficient for thecombined collection of faeces and solid waste (scenario 2). We can reduce the average fillingby increasing the collection frequency.
Figure 6.4: Average filling of the vehicle as a function of the percentage of user for a collection frequencyof once a week. 1a: Door-to-door collection of the faeces. 1b: Collection of the faeces in collection points.2a: Door-to-door collection of the faeces and solid waste. 2b: Collection of the faeces and solid waste incollection points.
Figure 6.5 presents the results for a service that comes twice a week in the case of scenario2 (collection of faeces and solid waste). The capacity is still insufficient in the case of adoor-to-door collection (2a). In contrast, the service could reach up to 80% of the house-holds for the scenario with collection points (2b). Figure 6.6 presents the new monthly costsper household. We can see that scenario 2a loses its economic advantage even tough thecapacity still isn’t sufficient. Scenario 2b remains the most economically most favourableoption.
63
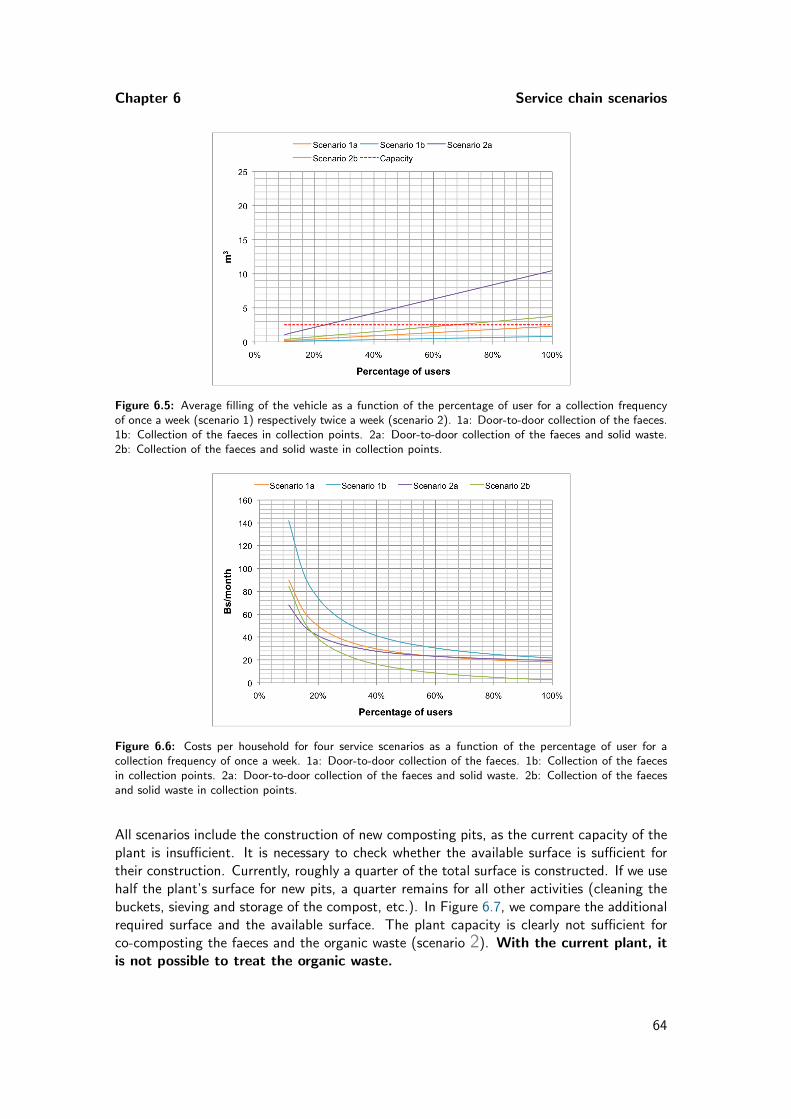
Chapter 6 Service chain scenarios
Figure 6.5: Average filling of the vehicle as a function of the percentage of user for a collection frequencyof once a week (scenario 1) respectively twice a week (scenario 2). 1a: Door-to-door collection of the faeces.1b: Collection of the faeces in collection points. 2a: Door-to-door collection of the faeces and solid waste.2b: Collection of the faeces and solid waste in collection points.
Figure 6.6: Costs per household for four service scenarios as a function of the percentage of user for acollection frequency of once a week. 1a: Door-to-door collection of the faeces. 1b: Collection of the faecesin collection points. 2a: Door-to-door collection of the faeces and solid waste. 2b: Collection of the faecesand solid waste in collection points.
All scenarios include the construction of new composting pits, as the current capacity of theplant is insufficient. It is necessary to check whether the available surface is sufficient fortheir construction. Currently, roughly a quarter of the total surface is constructed. If we usehalf the plant’s surface for new pits, a quarter remains for all other activities (cleaning thebuckets, sieving and storage of the compost, etc.). In Figure 6.7, we compare the additionalrequired surface and the available surface. The plant capacity is clearly not sufficient forco-composting the faeces and the organic waste (scenario 2). With the current plant, itis not possible to treat the organic waste.
64
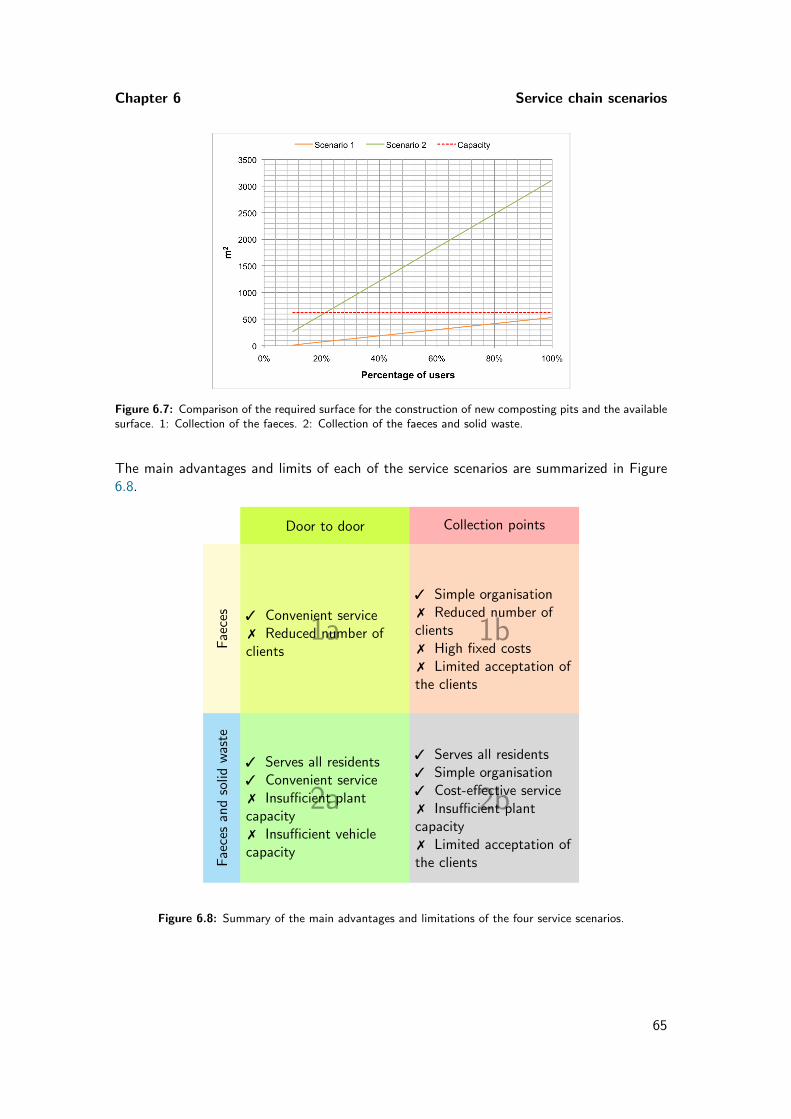
Chapter 6 Service chain scenarios
Figure 6.7: Comparison of the required surface for the construction of new composting pits and the availablesurface. 1: Collection of the faeces. 2: Collection of the faeces and solid waste.
The main advantages and limits of each of the service scenarios are summarized in Figure6.8.
Door to door Collection points
Fae
ces
1a 1b
Fae
ces
and
solid
was
te
2a 2b
3 Convenient service7 Reduced number ofclients
3 Simple organisation7 Reduced number ofclients7 High fixed costs7 Limited acceptation ofthe clients
3 Serves all residents3 Convenient service7 Insufficient plantcapacity7 Insufficient vehiclecapacity
3 Serves all residents3 Simple organisation3 Cost-effective service7 Insufficient plantcapacity7 Limited acceptation ofthe clients
Figure 6.8: Summary of the main advantages and limitations of the four service scenarios.
65
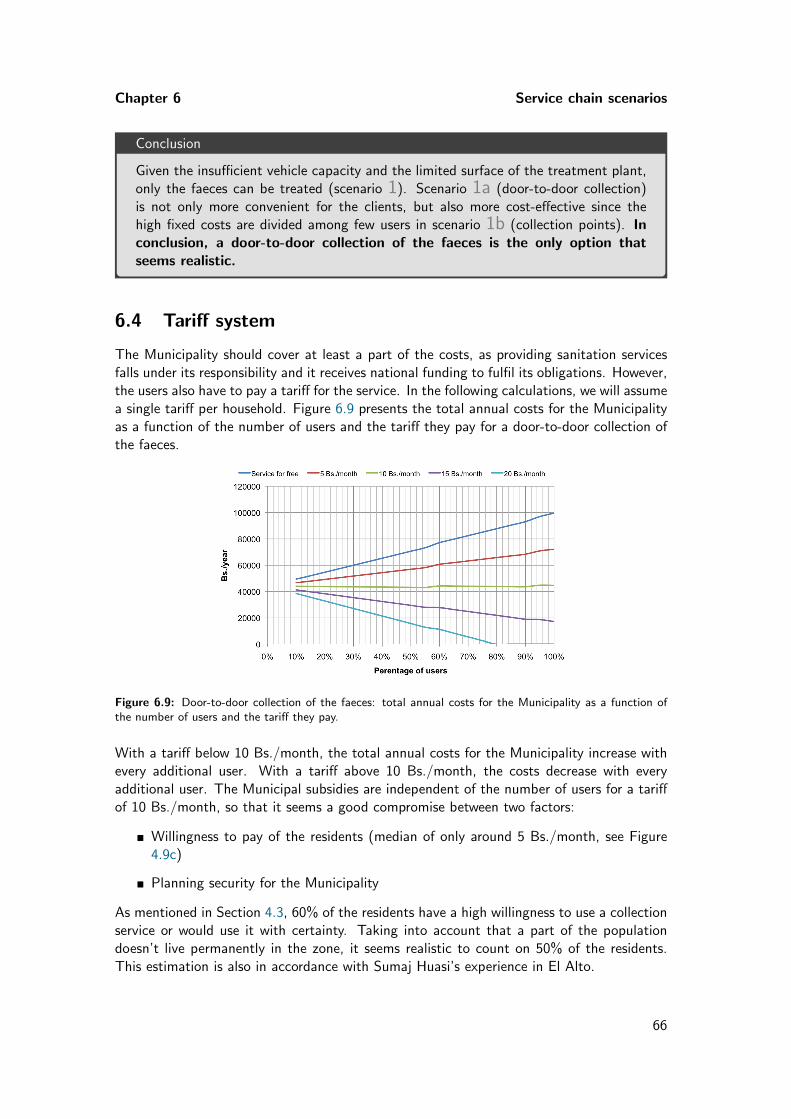
Chapter 6 Service chain scenarios
Conclusion
Given the insufficient vehicle capacity and the limited surface of the treatment plant,only the faeces can be treated (scenario 1). Scenario 1a (door-to-door collection)is not only more convenient for the clients, but also more cost-effective since thehigh fixed costs are divided among few users in scenario 1b (collection points). Inconclusion, a door-to-door collection of the faeces is the only option thatseems realistic.
6.4 Tariff system
The Municipality should cover at least a part of the costs, as providing sanitation servicesfalls under its responsibility and it receives national funding to fulfil its obligations. However,the users also have to pay a tariff for the service. In the following calculations, we will assumea single tariff per household. Figure 6.9 presents the total annual costs for the Municipalityas a function of the number of users and the tariff they pay for a door-to-door collection ofthe faeces.
Figure 6.9: Door-to-door collection of the faeces: total annual costs for the Municipality as a function ofthe number of users and the tariff they pay.
With a tariff below 10 Bs./month, the total annual costs for the Municipality increase withevery additional user. With a tariff above 10 Bs./month, the costs decrease with everyadditional user. The Municipal subsidies are independent of the number of users for a tariffof 10 Bs./month, so that it seems a good compromise between two factors:
� Willingness to pay of the residents (median of only around 5 Bs./month, see Figure4.9c)
� Planning security for the Municipality
As mentioned in Section 4.3, 60% of the residents have a high willingness to use a collectionservice or would use it with certainty. Taking into account that a part of the populationdoesn’t live permanently in the zone, it seems realistic to count on 50% of the residents.This estimation is also in accordance with Sumaj Huasi’s experience in El Alto.
66
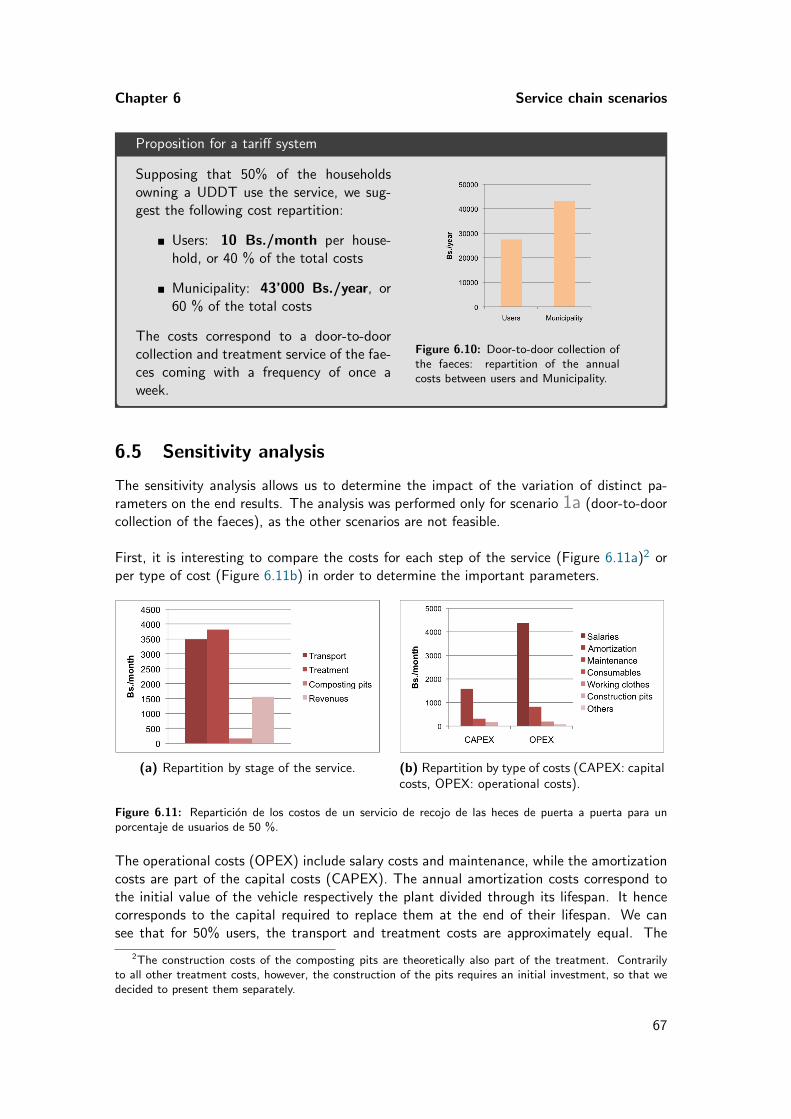
Chapter 6 Service chain scenarios
Proposition for a tariff system
Supposing that 50% of the householdsowning a UDDT use the service, we sug-gest the following cost repartition:
� Users: 10 Bs./month per house-hold, or 40 % of the total costs
� Municipality: 43’000 Bs./year, or60 % of the total costs
The costs correspond to a door-to-doorcollection and treatment service of the fae-ces coming with a frequency of once aweek.
Figure 6.10: Door-to-door collection ofthe faeces: repartition of the annualcosts between users and Municipality.
6.5 Sensitivity analysis
The sensitivity analysis allows us to determine the impact of the variation of distinct pa-rameters on the end results. The analysis was performed only for scenario 1a (door-to-doorcollection of the faeces), as the other scenarios are not feasible.
First, it is interesting to compare the costs for each step of the service (Figure 6.11a)2 orper type of cost (Figure 6.11b) in order to determine the important parameters.
(a) Repartition by stage of the service. (b) Repartition by type of costs (CAPEX: capitalcosts, OPEX: operational costs).
Figure 6.11: Reparticion de los costos de un servicio de recojo de las heces de puerta a puerta para unporcentaje de usuarios de 50 %.
The operational costs (OPEX) include salary costs and maintenance, while the amortizationcosts are part of the capital costs (CAPEX). The annual amortization costs correspond tothe initial value of the vehicle respectively the plant divided through its lifespan. It hencecorresponds to the capital required to replace them at the end of their lifespan. We cansee that for 50% users, the transport and treatment costs are approximately equal. The
2The construction costs of the composting pits are theoretically also part of the treatment. Contrarilyto all other treatment costs, however, the construction of the pits requires an initial investment, so that wedecided to present them separately.
67
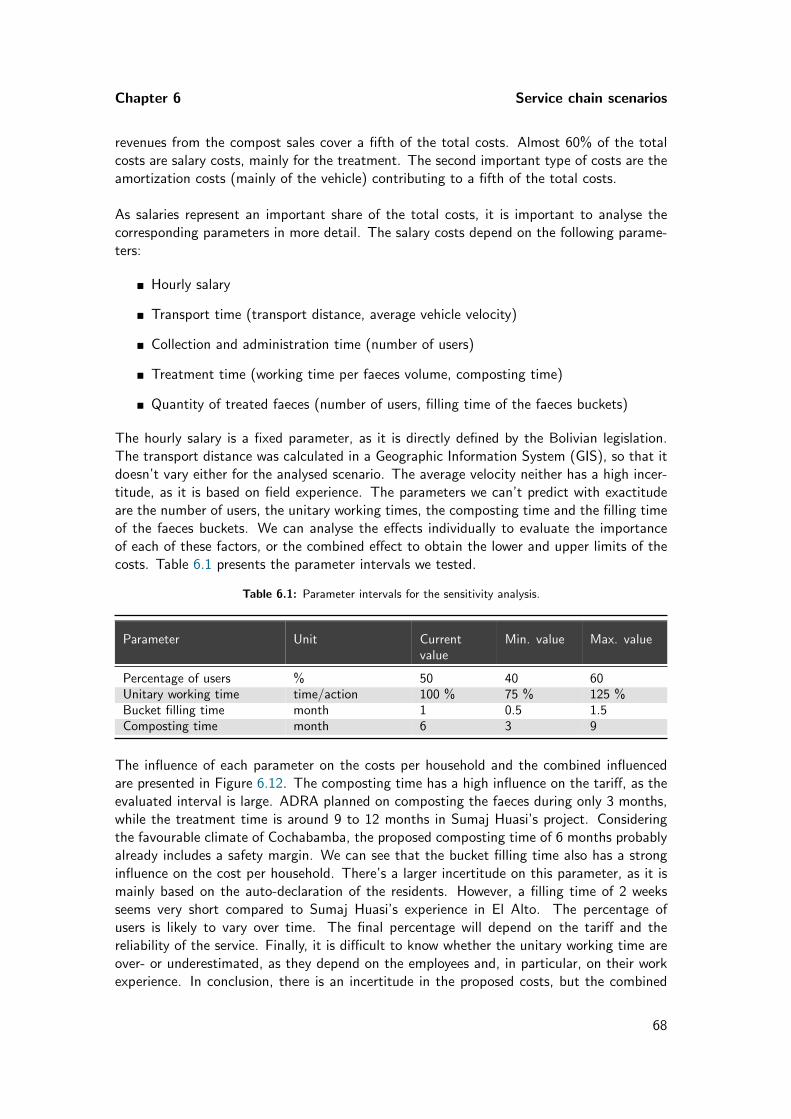
Chapter 6 Service chain scenarios
revenues from the compost sales cover a fifth of the total costs. Almost 60% of the totalcosts are salary costs, mainly for the treatment. The second important type of costs are theamortization costs (mainly of the vehicle) contributing to a fifth of the total costs.
As salaries represent an important share of the total costs, it is important to analyse thecorresponding parameters in more detail. The salary costs depend on the following parame-ters:
� Hourly salary
� Transport time (transport distance, average vehicle velocity)
� Collection and administration time (number of users)
� Treatment time (working time per faeces volume, composting time)
� Quantity of treated faeces (number of users, filling time of the faeces buckets)
The hourly salary is a fixed parameter, as it is directly defined by the Bolivian legislation.The transport distance was calculated in a Geographic Information System (GIS), so that itdoesn’t vary either for the analysed scenario. The average velocity neither has a high incer-titude, as it is based on field experience. The parameters we can’t predict with exactitudeare the number of users, the unitary working times, the composting time and the filling timeof the faeces buckets. We can analyse the effects individually to evaluate the importanceof each of these factors, or the combined effect to obtain the lower and upper limits of thecosts. Table 6.1 presents the parameter intervals we tested.
Table 6.1: Parameter intervals for the sensitivity analysis.
Parameter Unit Currentvalue
Min. value Max. value
Percentage of users % 50 40 60Unitary working time time/action 100 % 75 % 125 %Bucket filling time month 1 0.5 1.5Composting time month 6 3 9
The influence of each parameter on the costs per household and the combined influencedare presented in Figure 6.12. The composting time has a high influence on the tariff, as theevaluated interval is large. ADRA planned on composting the faeces during only 3 months,while the treatment time is around 9 to 12 months in Sumaj Huasi’s project. Consideringthe favourable climate of Cochabamba, the proposed composting time of 6 months probablyalready includes a safety margin. We can see that the bucket filling time also has a stronginfluence on the cost per household. There’s a larger incertitude on this parameter, as it ismainly based on the auto-declaration of the residents. However, a filling time of 2 weeksseems very short compared to Sumaj Huasi’s experience in El Alto. The percentage ofusers is likely to vary over time. The final percentage will depend on the tariff and thereliability of the service. Finally, it is difficult to know whether the unitary working time areover- or underestimated, as they depend on the employees and, in particular, on their workexperience. In conclusion, there is an incertitude in the proposed costs, but the combined
68
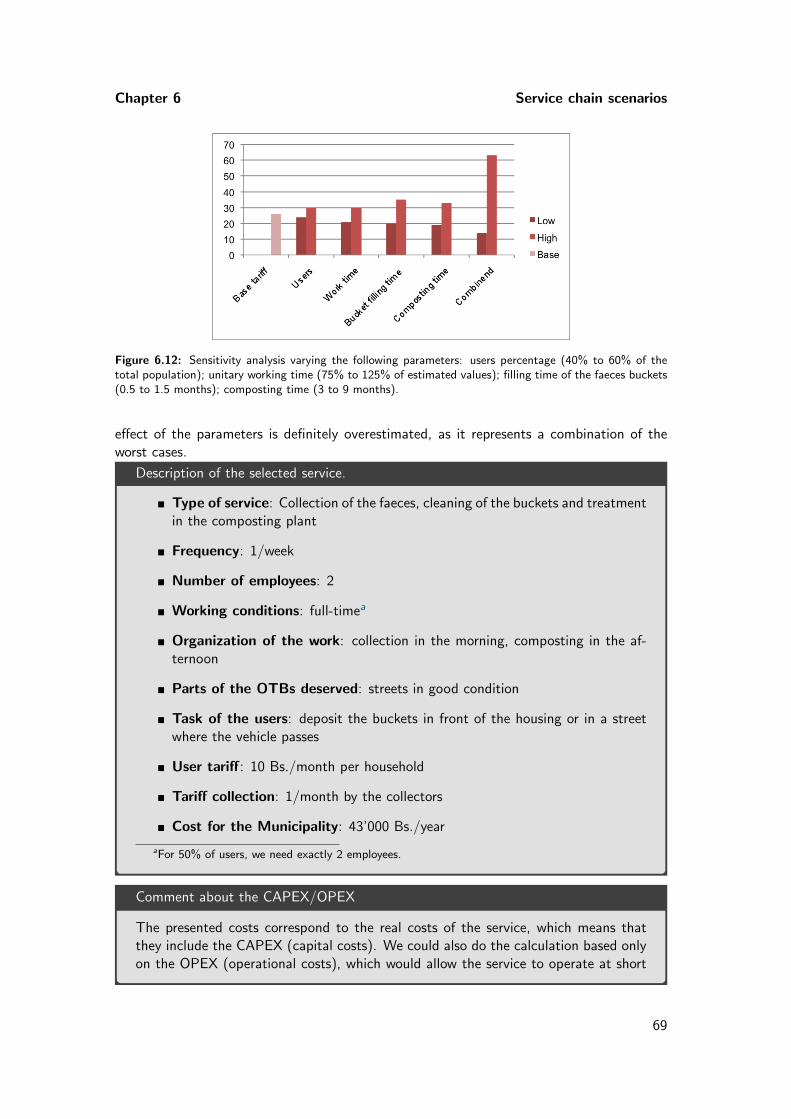
Chapter 6 Service chain scenarios
Figure 6.12: Sensitivity analysis varying the following parameters: users percentage (40% to 60% of thetotal population); unitary working time (75% to 125% of estimated values); filling time of the faeces buckets(0.5 to 1.5 months); composting time (3 to 9 months).
effect of the parameters is definitely overestimated, as it represents a combination of theworst cases.
Description of the selected service.
� Type of service: Collection of the faeces, cleaning of the buckets and treatmentin the composting plant
� Frequency: 1/week
� Number of employees: 2
� Working conditions: full-timea
� Organization of the work: collection in the morning, composting in the af-ternoon
� Parts of the OTBs deserved: streets in good condition
� Task of the users: deposit the buckets in front of the housing or in a streetwhere the vehicle passes
� User tariff: 10 Bs./month per household
� Tariff collection: 1/month by the collectors
� Cost for the Municipality: 43’000 Bs./year
aFor 50% of users, we need exactly 2 employees.
Comment about the CAPEX/OPEX
The presented costs correspond to the real costs of the service, which means thatthey include the CAPEX (capital costs). We could also do the calculation based onlyon the OPEX (operational costs), which would allow the service to operate at short
69
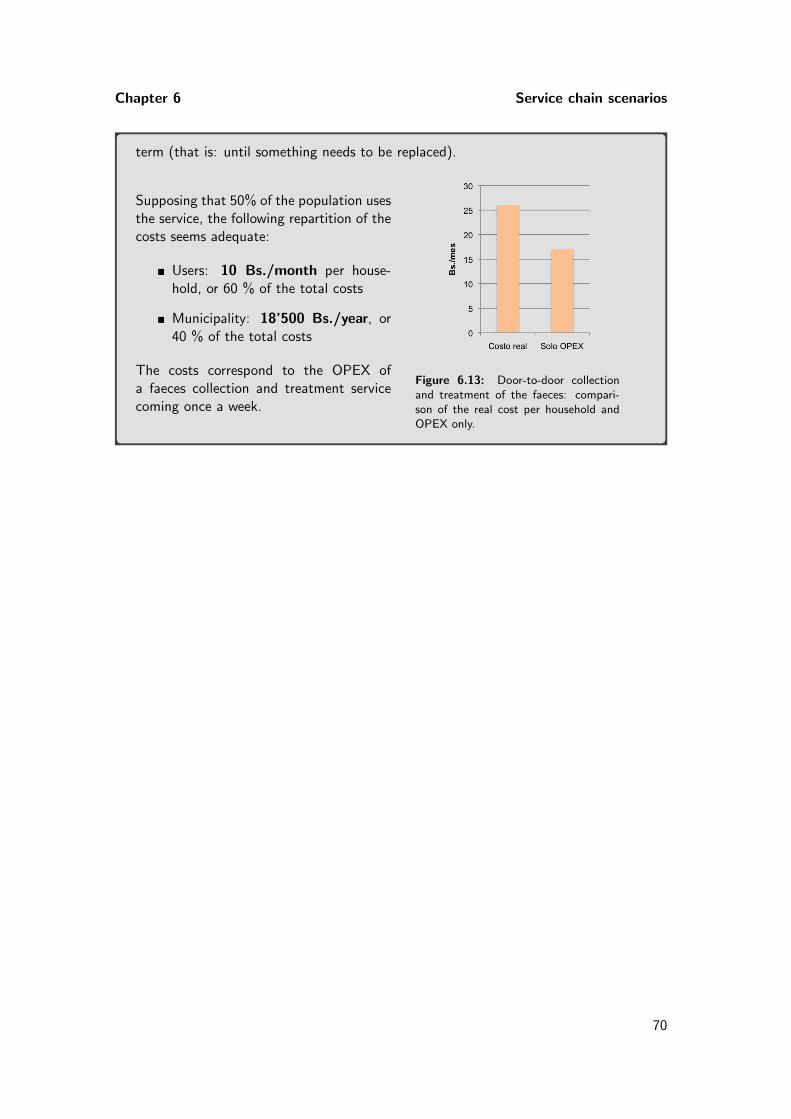
Chapter 6 Service chain scenarios
term (that is: until something needs to be replaced).
Supposing that 50% of the population usesthe service, the following repartition of thecosts seems adequate:
� Users: 10 Bs./month per house-hold, or 60 % of the total costs
� Municipality: 18’500 Bs./year, or40 % of the total costs
The costs correspond to the OPEX ofa faeces collection and treatment servicecoming once a week.
Figure 6.13: Door-to-door collectionand treatment of the faeces: compari-son of the real cost per household andOPEX only.
70
CHAPTER 7
Recommendations
None of the service scenarios presented in the previous Chapter questioned the adequate-ness of a sanitation system based on UDDTs in the zone nor the central treatment in thecomposting plant in Llave Mayu. For the future, three options are possible:
� Start-up of the central treatment plant with the implementation of the collectionservice presented in Section 6.3
� Composting centre in each OTB
� Support for the construction of pit latrines
The main advantages and drawbacks of each option are summarized in the following sections.
7.1 Option 1: Start-up of the centralized treatment plant
The first option is to work out the details of the door-to-door collection of the faeces witha centralized treatment in the plant in Llave Mayu. As mentioned in the previous chapter,the current plant is underdimensioned, as the capacity is sufficient for only 50 households.The construction of new composting pits is necessary, which might require a considerableamount of time.
It seems convenient to start the service as soon as possible with only a part of the population.This strategy has three main advantages:
� Given the small quantities of faeces to be treated in the beginning, the processes caneasily be adapted and optimized
� The hypotheses about the quantity of faeces produced, the percentage of users andthe treatment time can be checked, allowing an adjustment of the number of newcomposting pits
� Providing a reliable and regular service is good publicity for the expansion of the serviceto other OTBs
71
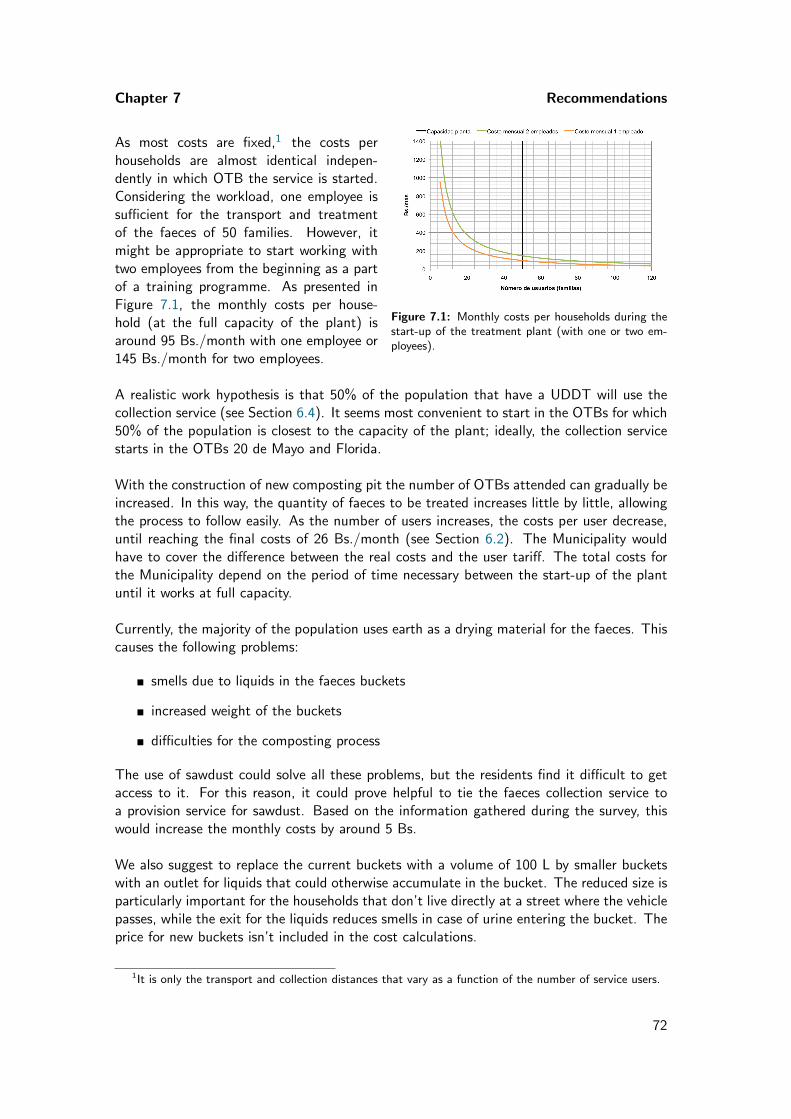
Chapter 7 Recommendations
Figure 7.1: Monthly costs per households during thestart-up of the treatment plant (with one or two em-ployees).
As most costs are fixed,1 the costs perhouseholds are almost identical indepen-dently in which OTB the service is started.Considering the workload, one employee issufficient for the transport and treatmentof the faeces of 50 families. However, itmight be appropriate to start working withtwo employees from the beginning as a partof a training programme. As presented inFigure 7.1, the monthly costs per house-hold (at the full capacity of the plant) isaround 95 Bs./month with one employee or145 Bs./month for two employees.
A realistic work hypothesis is that 50% of the population that have a UDDT will use thecollection service (see Section 6.4). It seems most convenient to start in the OTBs for which50% of the population is closest to the capacity of the plant; ideally, the collection servicestarts in the OTBs 20 de Mayo and Florida.
With the construction of new composting pit the number of OTBs attended can gradually beincreased. In this way, the quantity of faeces to be treated increases little by little, allowingthe process to follow easily. As the number of users increases, the costs per user decrease,until reaching the final costs of 26 Bs./month (see Section 6.2). The Municipality wouldhave to cover the difference between the real costs and the user tariff. The total costs forthe Municipality depend on the period of time necessary between the start-up of the plantuntil it works at full capacity.
Currently, the majority of the population uses earth as a drying material for the faeces. Thiscauses the following problems:
� smells due to liquids in the faeces buckets
� increased weight of the buckets
� difficulties for the composting process
The use of sawdust could solve all these problems, but the residents find it difficult to getaccess to it. For this reason, it could prove helpful to tie the faeces collection service toa provision service for sawdust. Based on the information gathered during the survey, thiswould increase the monthly costs by around 5 Bs.
We also suggest to replace the current buckets with a volume of 100 L by smaller bucketswith an outlet for liquids that could otherwise accumulate in the bucket. The reduced size isparticularly important for the households that don’t live directly at a street where the vehiclepasses, while the exit for the liquids reduces smells in case of urine entering the bucket. Theprice for new buckets isn’t included in the cost calculations.
1It is only the transport and collection distances that vary as a function of the number of service users.
72
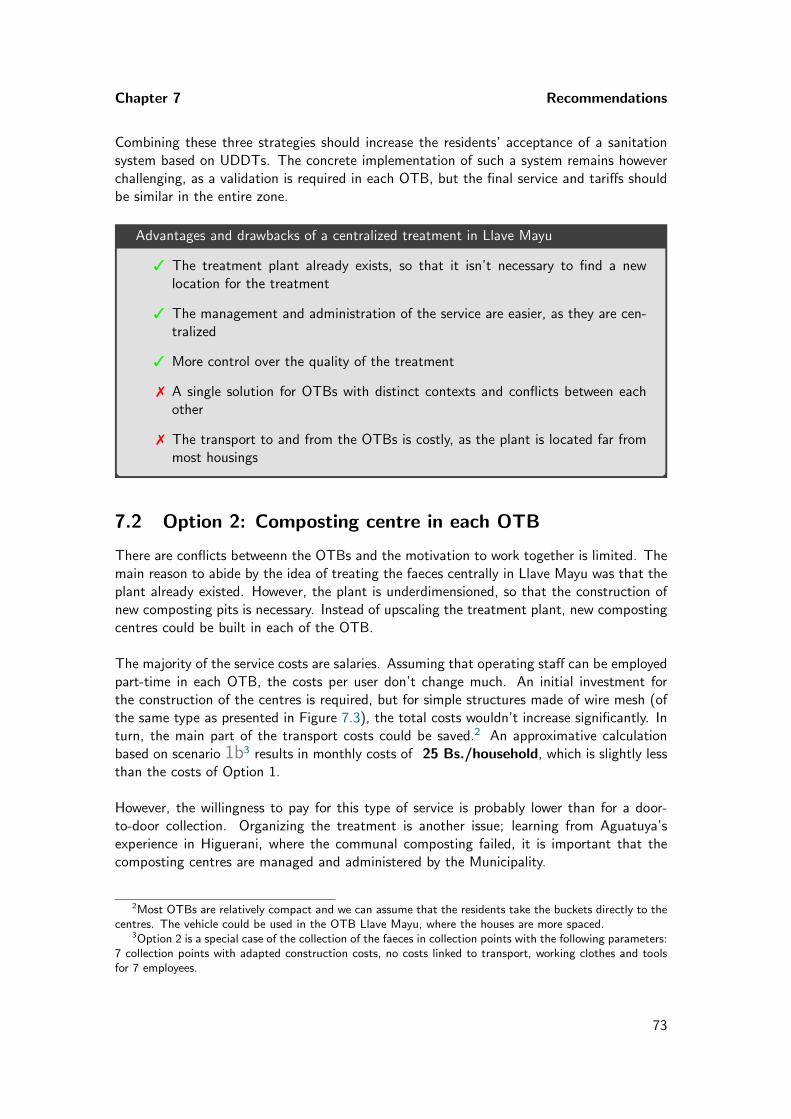
Chapter 7 Recommendations
Combining these three strategies should increase the residents’ acceptance of a sanitationsystem based on UDDTs. The concrete implementation of such a system remains howeverchallenging, as a validation is required in each OTB, but the final service and tariffs shouldbe similar in the entire zone.
Advantages and drawbacks of a centralized treatment in Llave Mayu
3 The treatment plant already exists, so that it isn’t necessary to find a newlocation for the treatment
3 The management and administration of the service are easier, as they are cen-tralized
3 More control over the quality of the treatment
7 A single solution for OTBs with distinct contexts and conflicts between eachother
7 The transport to and from the OTBs is costly, as the plant is located far frommost housings
7.2 Option 2: Composting centre in each OTB
There are conflicts betweenn the OTBs and the motivation to work together is limited. Themain reason to abide by the idea of treating the faeces centrally in Llave Mayu was that theplant already existed. However, the plant is underdimensioned, so that the construction ofnew composting pits is necessary. Instead of upscaling the treatment plant, new compostingcentres could be built in each of the OTB.
The majority of the service costs are salaries. Assuming that operating staff can be employedpart-time in each OTB, the costs per user don’t change much. An initial investment forthe construction of the centres is required, but for simple structures made of wire mesh (ofthe same type as presented in Figure 7.3), the total costs wouldn’t increase significantly. Inturn, the main part of the transport costs could be saved.2 An approximative calculationbased on scenario 1b3 results in monthly costs of 25 Bs./household, which is slightly lessthan the costs of Option 1.
However, the willingness to pay for this type of service is probably lower than for a door-to-door collection. Organizing the treatment is another issue; learning from Aguatuya’sexperience in Higuerani, where the communal composting failed, it is important that thecomposting centres are managed and administered by the Municipality.
2Most OTBs are relatively compact and we can assume that the residents take the buckets directly to thecentres. The vehicle could be used in the OTB Llave Mayu, where the houses are more spaced.
3Option 2 is a special case of the collection of the faeces in collection points with the following parameters:7 collection points with adapted construction costs, no costs linked to transport, working clothes and toolsfor 7 employees.
73
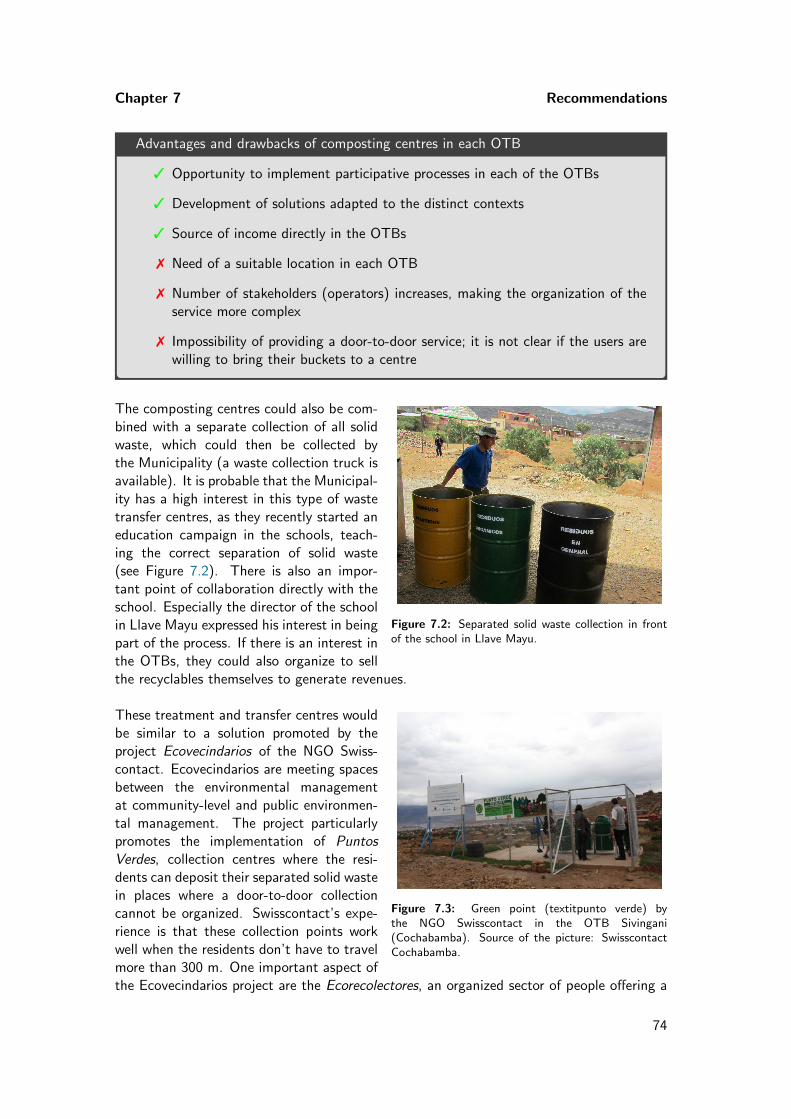
Chapter 7 Recommendations
Advantages and drawbacks of composting centres in each OTB
3 Opportunity to implement participative processes in each of the OTBs
3 Development of solutions adapted to the distinct contexts
3 Source of income directly in the OTBs
7 Need of a suitable location in each OTB
7 Number of stakeholders (operators) increases, making the organization of theservice more complex
7 Impossibility of providing a door-to-door service; it is not clear if the users arewilling to bring their buckets to a centre
Figure 7.2: Separated solid waste collection in frontof the school in Llave Mayu.
The composting centres could also be com-bined with a separate collection of all solidwaste, which could then be collected bythe Municipality (a waste collection truck isavailable). It is probable that the Municipal-ity has a high interest in this type of wastetransfer centres, as they recently started aneducation campaign in the schools, teach-ing the correct separation of solid waste(see Figure 7.2). There is also an impor-tant point of collaboration directly with theschool. Especially the director of the schoolin Llave Mayu expressed his interest in beingpart of the process. If there is an interest inthe OTBs, they could also organize to sellthe recyclables themselves to generate revenues.
Figure 7.3: Green point (textitpunto verde) bythe NGO Swisscontact in the OTB Sivingani(Cochabamba). Source of the picture: SwisscontactCochabamba.
These treatment and transfer centres wouldbe similar to a solution promoted by theproject Ecovecindarios of the NGO Swiss-contact. Ecovecindarios are meeting spacesbetween the environmental managementat community-level and public environmen-tal management. The project particularlypromotes the implementation of PuntosVerdes, collection centres where the resi-dents can deposit their separated solid wastein places where a door-to-door collectioncannot be organized. Swisscontact’s expe-rience is that these collection points workwell when the residents don’t have to travelmore than 300 m. One important aspect ofthe Ecovecindarios project are the Ecorecolectores, an organized sector of people offering a
74
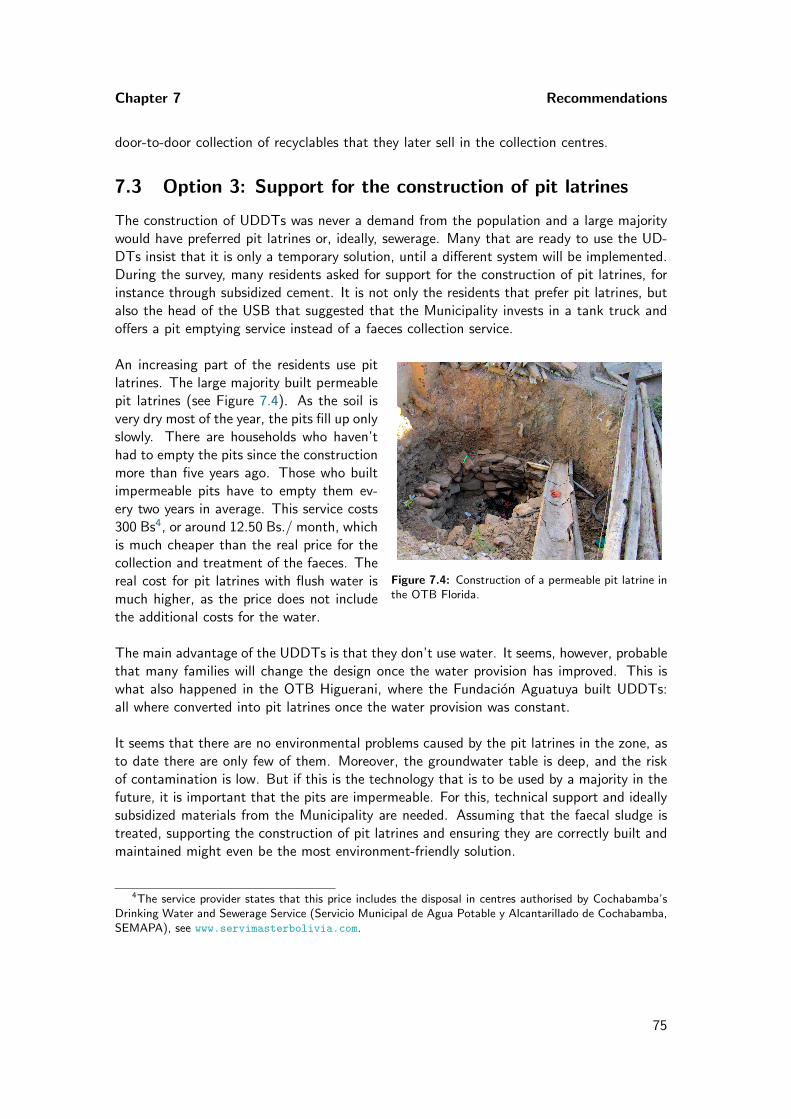
Chapter 7 Recommendations
door-to-door collection of recyclables that they later sell in the collection centres.
7.3 Option 3: Support for the construction of pit latrines
The construction of UDDTs was never a demand from the population and a large majoritywould have preferred pit latrines or, ideally, sewerage. Many that are ready to use the UD-DTs insist that it is only a temporary solution, until a different system will be implemented.During the survey, many residents asked for support for the construction of pit latrines, forinstance through subsidized cement. It is not only the residents that prefer pit latrines, butalso the head of the USB that suggested that the Municipality invests in a tank truck andoffers a pit emptying service instead of a faeces collection service.
Figure 7.4: Construction of a permeable pit latrine inthe OTB Florida.
An increasing part of the residents use pitlatrines. The large majority built permeablepit latrines (see Figure 7.4). As the soil isvery dry most of the year, the pits fill up onlyslowly. There are households who haven’thad to empty the pits since the constructionmore than five years ago. Those who builtimpermeable pits have to empty them ev-ery two years in average. This service costs300 Bs4, or around 12.50 Bs./ month, whichis much cheaper than the real price for thecollection and treatment of the faeces. Thereal cost for pit latrines with flush water ismuch higher, as the price does not includethe additional costs for the water.
The main advantage of the UDDTs is that they don’t use water. It seems, however, probablethat many families will change the design once the water provision has improved. This iswhat also happened in the OTB Higuerani, where the Fundacion Aguatuya built UDDTs:all where converted into pit latrines once the water provision was constant.
It seems that there are no environmental problems caused by the pit latrines in the zone, asto date there are only few of them. Moreover, the groundwater table is deep, and the riskof contamination is low. But if this is the technology that is to be used by a majority in thefuture, it is important that the pits are impermeable. For this, technical support and ideallysubsidized materials from the Municipality are needed. Assuming that the faecal sludge istreated, supporting the construction of pit latrines and ensuring they are correctly built andmaintained might even be the most environment-friendly solution.
4The service provider states that this price includes the disposal in centres authorised by Cochabamba’sDrinking Water and Sewerage Service (Servicio Municipal de Agua Potable y Alcantarillado de Cochabamba,SEMAPA), see www.servimasterbolivia.com.
75
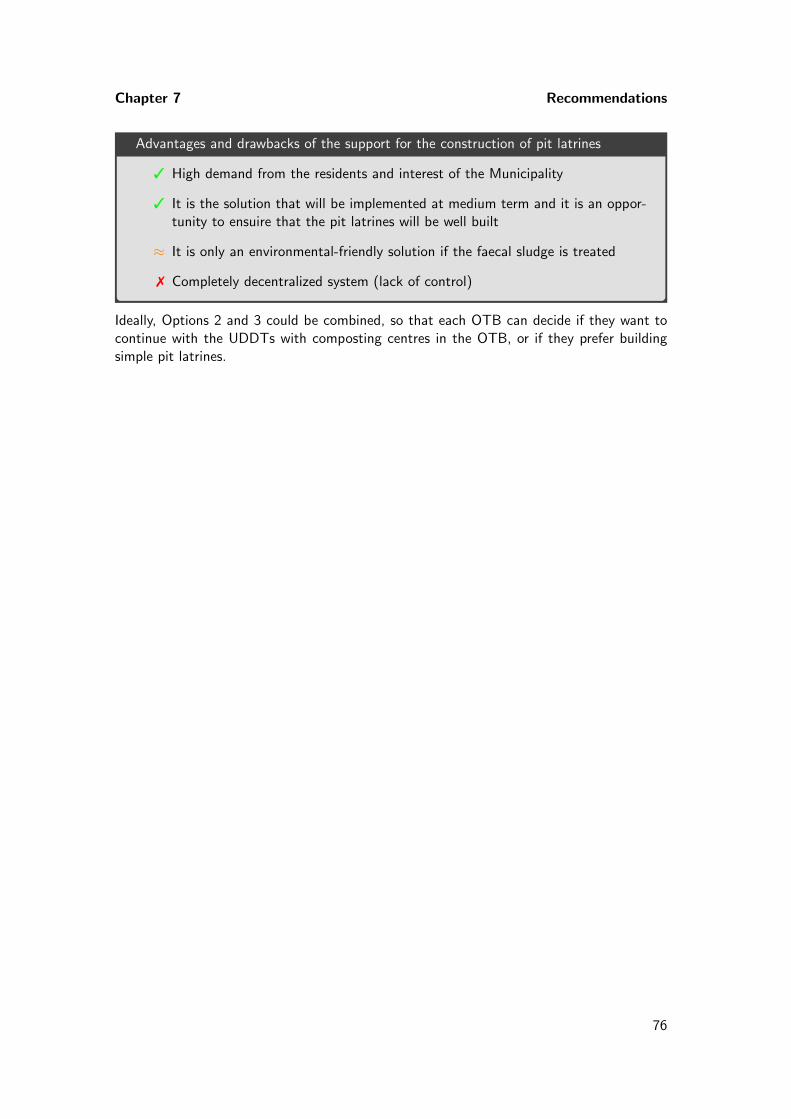
Chapter 7 Recommendations
Advantages and drawbacks of the support for the construction of pit latrines
3 High demand from the residents and interest of the Municipality
3 It is the solution that will be implemented at medium term and it is an oppor-tunity to ensuire that the pit latrines will be well built
≈ It is only an environmental-friendly solution if the faecal sludge is treated
7 Completely decentralized system (lack of control)
Ideally, Options 2 and 3 could be combined, so that each OTB can decide if they want tocontinue with the UDDTs with composting centres in the OTB, or if they prefer buildingsimple pit latrines.
76
CHAPTER 8
Conclusions
After listing the main lines of further investigation necessary in the case of Arbieto, this lastchapter aims at putting the case of Arbieto in a more general context. The adequateness ofUDDTs in periurban zones in Bolivia is assessed and the main factors of success are given.Finally, the applicability of a participatory planning framework like CLUES in the presenceof distinct communities is evaluated.
8.1 Follow-up of the report
The present report offers a comprehensive analysis of the perception towards their toilets ofhouseholds owning a UDDT. It could be insightful to do a more detailed analysis about thereasons why some households that lived in the project area during the construction of theUDDTs decided not to build such a toilet.
The presented cost calculations for the four main service scenarios are precise enough to com-pare the scenarios. If the decision-makers decide to actually implement the recommendedscenario (door-to-door collection of the faeces), more detailed calculations are required, par-ticularly with respect to the start-up of the plant (equipment of the plant, further trainingof the users) as the proposed costs include only the operation of the service.
We realized that the capacity of the plant is insufficient for the treatment of the faecesfrom all UDDTs and that the plant needs to be upscaled. This led to the conclusion that itmight be more advantageous to quit the idea of a centralized treatment in the compostingplant in Llave Mayu. Two alternatives (composting centres at OTB level, support for theconstruction of pit latrines) have been developed, with very rough cost estimates. If oneof the alternatives were considered conceivable, it would be important to calculate moredetailed costs for both options in order to take an informed decision.
Finally, the fact that the capacity of the treatment plant is not sufficient might be an incentiveto re-think the situation from the beginning. The motivation to support the construction ofpit latrines is proposed as the lesser of two evils. It would be interesting to evaluate whether
77
Chapter 8 Conclusions
there is a more advisable solution for the zone. For instance, condominial pit latrines (onetank for various households) might be a solution where conventional sewerage is technicallyand economically not feasible. Such a semi-decentralized system would ensure a qualitycontrol that is not possible in the case of individual pit latrines.
8.2 Implementation of UDDTs in periurban zones in Bolivia
The case of District 4 in Arbieto is not an isolated phenomenon. There are numerous ex-amples of NGOs building single-vault UDDTs in periurban zones in Bolivia and leaving theprojects without organizing a faeces and urine collection service. While such infrastructureprojects may be an important financial investment for the donors, the real challenge in anyUDDT project is the provision of a reliable, sustainable and affordable service.
From a technical and organizational point of view, a UDDT-based sanitation system is notadapted to all types of contexts. For the collection service to be practicable, the project areaneeds to be easily accessible (topography, condition of the streets), the dwellings reasonablywell organized, and the population density intermediate. It is also necessary that a conve-niently located area for the treatment of the urine and faeces is available for the project, andthere should be a local demand for the products (compost, urine), for instance from localfarmers or from the municipality. These conditions are not met in District 4 of Arbieto.
It is also important that the design of the UDDT anticipates the type of collection service.For instance, the opening to the faeces chambers should allow the collector to access thebucket without entering the housing, if a door-to-door collection is planned. The type andvolume of the faeces buckets and urine jerrycans should also be selected according to theplanned type of transport and collection frequency. The design choices made by ADRA didnot consider the collection, as the openings are located inside the housing and the faecesbuckets are not adapted for the transport.
From a social point of view, it is essential that there is an initial demand from the popula-tion. Our results show clearly that the initial motive for the construction of the UDDTs isa decisive factor for the use of the toilet in the medium and long term. Starting in areaswhere the demand for UDDTs is high and provide a reliable collection service also helpscreating demand in other areas. An effective way to filter households that do not have anintrinsic motive for building the UDDTs and increase the owner’s motivation to actually usethe toilet is to ask for a financial counterpart for the construction. In the case of Arbieto,many households built the UDDTs only because they got them for free.
It is also important to integrate the users’ preferences; especially in the design of the toiletsmall changes can substantially influence the user satisfaction. For instance, many house-holds in District 4 complain about the UDDTs’ small size or the steep access, which couldeasily have been adapted.
UDDTs are a relatively new concept for many users, and a training before the constructionis not sufficient. It is important to continue the effort during even after the implementationof the infrastructure [20].
78
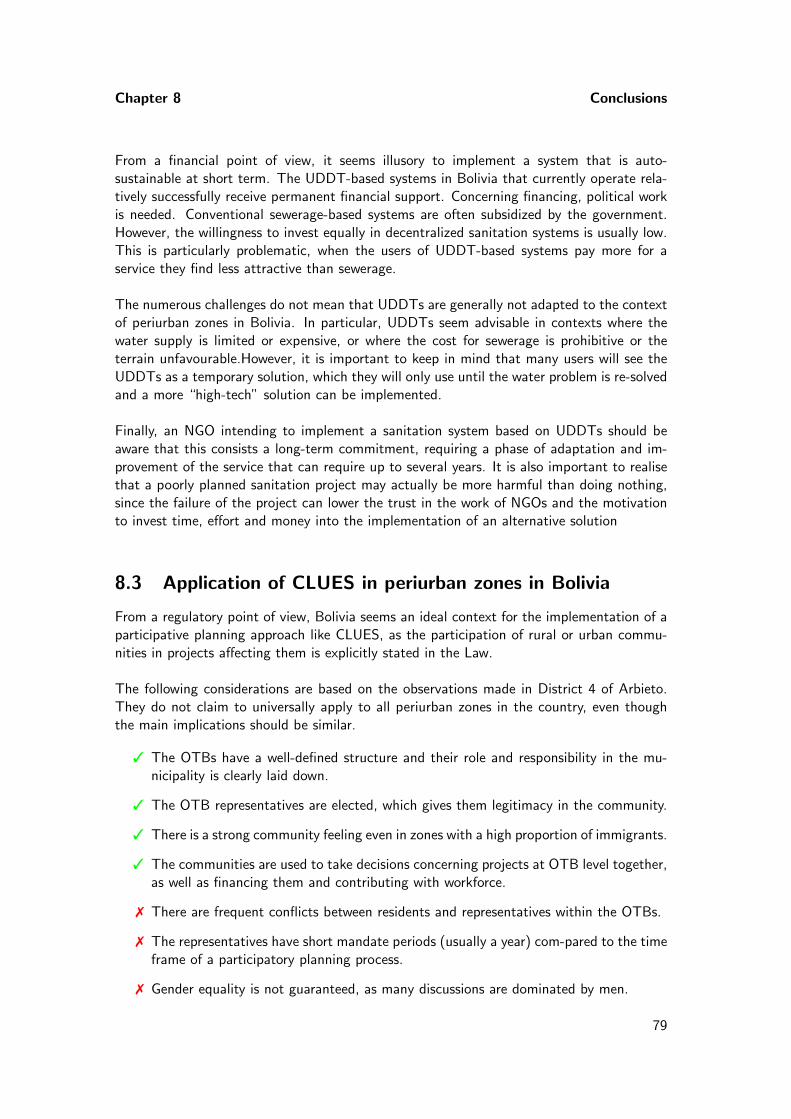
Chapter 8 Conclusions
From a financial point of view, it seems illusory to implement a system that is auto-sustainable at short term. The UDDT-based systems in Bolivia that currently operate rela-tively successfully receive permanent financial support. Concerning financing, political workis needed. Conventional sewerage-based systems are often subsidized by the government.However, the willingness to invest equally in decentralized sanitation systems is usually low.This is particularly problematic, when the users of UDDT-based systems pay more for aservice they find less attractive than sewerage.
The numerous challenges do not mean that UDDTs are generally not adapted to the contextof periurban zones in Bolivia. In particular, UDDTs seem advisable in contexts where thewater supply is limited or expensive, or where the cost for sewerage is prohibitive or theterrain unfavourable.However, it is important to keep in mind that many users will see theUDDTs as a temporary solution, which they will only use until the water problem is re-solvedand a more “high-tech” solution can be implemented.
Finally, an NGO intending to implement a sanitation system based on UDDTs should beaware that this consists a long-term commitment, requiring a phase of adaptation and im-provement of the service that can require up to several years. It is also important to realisethat a poorly planned sanitation project may actually be more harmful than doing nothing,since the failure of the project can lower the trust in the work of NGOs and the motivationto invest time, effort and money into the implementation of an alternative solution
8.3 Application of CLUES in periurban zones in Bolivia
From a regulatory point of view, Bolivia seems an ideal context for the implementation of aparticipative planning approach like CLUES, as the participation of rural or urban commu-nities in projects affecting them is explicitly stated in the Law.
The following considerations are based on the observations made in District 4 of Arbieto.They do not claim to universally apply to all periurban zones in the country, even thoughthe main implications should be similar.
3 The OTBs have a well-defined structure and their role and responsibility in the mu-nicipality is clearly laid down.
3 The OTB representatives are elected, which gives them legitimacy in the community.
3 There is a strong community feeling even in zones with a high proportion of immigrants.
3 The communities are used to take decisions concerning projects at OTB level together,as well as financing them and contributing with workforce.
7 There are frequent conflicts between residents and representatives within the OTBs.
7 The representatives have short mandate periods (usually a year) com-pared to the timeframe of a participatory planning process.
7 Gender equality is not guaranteed, as many discussions are dominated by men.
79
Chapter 8 Conclusions
7 Formal education is often low in Bolivia, and it seems difficult that the resi-dents takeinformed decision without prior empowerment and training.
In the context of the UDDTs in District 4 of Arbieto, the direct application of the CLUESframework is not possible, as the project affects seven communities with distinct contexts.Moreover, funds are already extremely limited and there is pressure from the residents as wellas from the mayor for a rapid start-up of the treatment plant. It seems challenging to jus-tify the increased cost and time of a participatory process without funds coming from outside.
80
Abbreviations
AAPS Autoridad de Fiscalizacion y Control Social de Agua Potable y Saneamiento Basico
ACI Alianza Cooperativa Internacional
ADRA Agencia Adventista para el Desarrollo y Recursos Asistenciales
AECID Agencia Espanola de Cooperacion
AIOC Autonomıa indıgena originario campesina
CLUES Community-Led Urban Environmental Sanitation Planning
CPE Constitucion Polıtica del Estado (febrero 2009)
CTRL Comision Tecnica de Registros y Licencias
COSUDE Cooperacion Suiza
DESCOM Desarrollo Comunitario
DS Decreto Supremo
Eawag Instituto Federal Suizo de Ciencia y Tecnologıa Acuaticas
EMA Empresa Municipal de Agua
EMAGUA Entidad Ejecutora de Medio Ambiente y Agua
EPSA Entidades Operadoras de Agua Potable y Alcantarillado Sanitario
GAM Gestion Ambiental Municipal
IARIS Identificador de Areas de Inversion en Saneamiento Basico
INE Instituto Nacional de Estadıstica
MDG Millennium Development Goal
MICSA Mecanismo de Inversion para Coberturas en el Sector de Agua Potable y Saneamiento
MMAyA Ministerio de Medio Ambiente y Agua
NGO Non-Governmental Organization
OTB Organizacion Territorial de Base
PND Plan Nacional de Desarrollo
PNSB Plan Nacional de Saneamiento Basico
81
Chapter 8 Conclusions
POA Plan Operativo Anual
PDTA Plan de Desarrollo Territorial Autonomo Arbieto
PTAR Planta de Tratamiento de Aguas Residuales
PSD-SB Plan Sectorial de Desarrollo de Saneamiento Basico
Sandec Sanitation, Water and Solid Waste for Development
SENASBA Servicio Nacional de Apoyo a la Sostenibilidad en Sanemiento Basico
UASB Upflow Anaerobic Sludge Blanket
UDDT Urine-Diverting Dry Toilets
VAPSB Viceministerio de Agua Potable y Saneamiento Basico
WWTP Wastewater treatment plant
82
Bibliography
[1] Agencia Espanola de Cooperacion (2014). Nuevo sistema de agua potable ysaneamiento basico inaugurado en Bolivia con el apoyo de la Cooperacion Espanola.http://www.aecid.es/ES/Paginas/Sala%20de%20Prensa/Noticias/2014/2014_
07/07-09-agua-bolivia.aspx (23.03.2016).
[2] Agencia Suiza para el Desarrollo y la Cooperacion (COSUDE). (2013). Estrategia deCooperacioon para Bolivia 2013 - 2016.
[3] Arteaga, M. C., Fundacion Aguatuya. (2011). Conformacion de la EPSA: Curso deGestion Administrativa y Tecnica de Pequenas EPSA.
[4] Banco Interamericano de Desarolly and Gobierno de Bolivia. (2009). Planes EstraegicosPara el Sector de Agua Potable y Saneamiento. IUCN The World Conservation Union.
[5] Chavez, F. (2011). Bolivia: Cochabamba still thirsty. Tierramerica: Environment andDevelopment, La Paz.
[6] Damyetto, M. (2014). Centro de Procesamiento de Residuos Solidos y Lıquidos BanosEcologicos Secos - Llave Mayu - Arbieto - Valle Alto - Cochabamba: Plan de Manejoacondicionamiento y puesta en marche del Centro de Procesamiento, Asistencia Tecnicay Capacitacion al Personal Tecnico del Municipio de Arbieto, Valle Alto, Cochabamba.ADRA Bolivia.
[7] Fernandez, I. (2011). El mercado de agua y saneamiento en Bolivia. Oficina Economicay Comercial de la Embajada de Espana en La Paz.
[8] Gestion Ambiental Municipal - PRODOC (2015). Anexo 7: Diagnostico y lıneas deaccion Valle Alto de Cochabamba. Cooperacion Suiza en Bolivia.
[9] Gomez Wichtendahl, C. (2008). Improved Understanding of Payment for EcosystemServices: Bolivia Country Assessment. IUCN: The World Conservation Union.
[10] Gomez, J., Madrtınez, L.E. (2014). Analisis competencial y normativo del sector desaneamiento basico y saneamiento sostenible descentralizado en Bolivia. NODO deSaneamiento Sostenible Descentralizado como Plataforma de Conocimiento y Generacionde Impacto en Soluciones Sostenibles, La Paz.
83
Chapter 8 Bibliography
[11] Luthi, C., Morel, A., Tilley, E., Ulrich, L. (2011). Planificacion de Saneamiento Am-biental Urbano liderado por la Comunidad: CLUES. Guıa completa para tomadores dedecisiones con 30 herramientos. Instituto Federal Suizo de Ciencia y Tecnologıa Acuaticas(Eawag), Consejo Colaborativo de Abastacimiento de Agua y Saneamiento (WSSCC) yONU-Habitat.
[12] Ministerio de Autonomıas. (2013). Agenda Patriotica 2025: Participacion en la Con-struccion Institucional de la Bolivia Digna y Soberana con Autonomıas.
[13] Ministerio del Medio Ambiente y Agua. (2009). Plan Nacional de Saneamiento Basico2008-2015 (Actualizado entre agosto y noviembre de 2009).
[14] Ministerio del Medio Ambiente y Agua. (2011). Plan Sectorial de Desarrollo deSaneamiento Basico 2011-2015.
[15] Ministerio del Medio Ambiente y Agua. (2011). Diagnostico de la gestion de los residuossolidos en el departamento de Cochabamba.
[16] Municipio de Arbieto. (2005). Plan Municipal de Arbieto 2005-2009.
[17] Municipio de Arbieto. (2015). Plan Territorial Autonomo Arbieto 2015-2019. Cinfotur:Consultora Integral de Proyectos y Servicios.
[18] Reymond, P. (2014). Chapter 14: Assessment of the Initial Situation. In: Strande, L.,Ronteltap, M. and Brdjanovic, D. Faecal Sludge Management: Systems Approach forImplementation and Operation. IWA Publishing.
[19] Reymond, P. (2014). Chapter 15: Stakeholder Analysis. In: Strande, L., Ronteltap, M.and Brdjanovic, D. Faecal Sludge Management: Systems Approach for Implementationand Operation. IWA Publishing.
[20] Rieck, C., von Munch, E., Hoffmann, H. (2012). Technology review of urine-divertingdry toilets (UDDTs) - Overview on design, management, mainte-nance and costs.Deutsche Gesellschaft fur Internationale Zusammenarbeit (GIZ) GmbH, Eschborn, Ger-many.
[21] Strobele-Gregor, J. (1999). Ley de Participacion Popular y movimiento popular enBolivia. En: Hengstberg, P., Kohut, K., Maihold, G. Sociedad civil en America Latina:Representacion de intereses y gobernabilidad. Nueva Sociedad, Caracas.
[22] Tilley, E., Ulrich, L. Luthi, C., Reymond, Ph., Zurbrugg, C. (2014). Compendium ofsanitation systems and technologies - (2nd Revised Edition). Swiss Federal Institute ofAquatic Science and Technology (Eawag).
[23] VALVDIVIA & Asociados: Consultorıa en planificacion y evaluacion. (2013). InformeFinal: Evaluacion de Seguimiento Convenio 10-CO1-038. Acceso al agua potable,saneamiento basico, capacitacion en habitos saludables y fortalecimiento comunitarioen comunidades rurales de Bolivia. Agencia Adventista para el Desarrollo y RecursosAsistenciales.
[24] Wehringer, M., Rojas, F. (2005). Bolivia: New approach in the WSS sector fostersCapacity Development at national and subnational levels. KfW Entwicklungsback andDeutsche Gesellschaft fur Technische Zusammenarbeit (GTZ)
84
Bibliography
[25] Wickberg, S. (2012). Overview of corruption and anti-corruption in Bolivia. U4 Anti-Corruption Resource Center, Transparency International and Chr. Michelsen Institute.
[26] The World Bank. (2015). Bolivia: Overview. Available on: http://www.worldbank.
org/en/country/bolivia/overview#1 (01.03.2016).
85
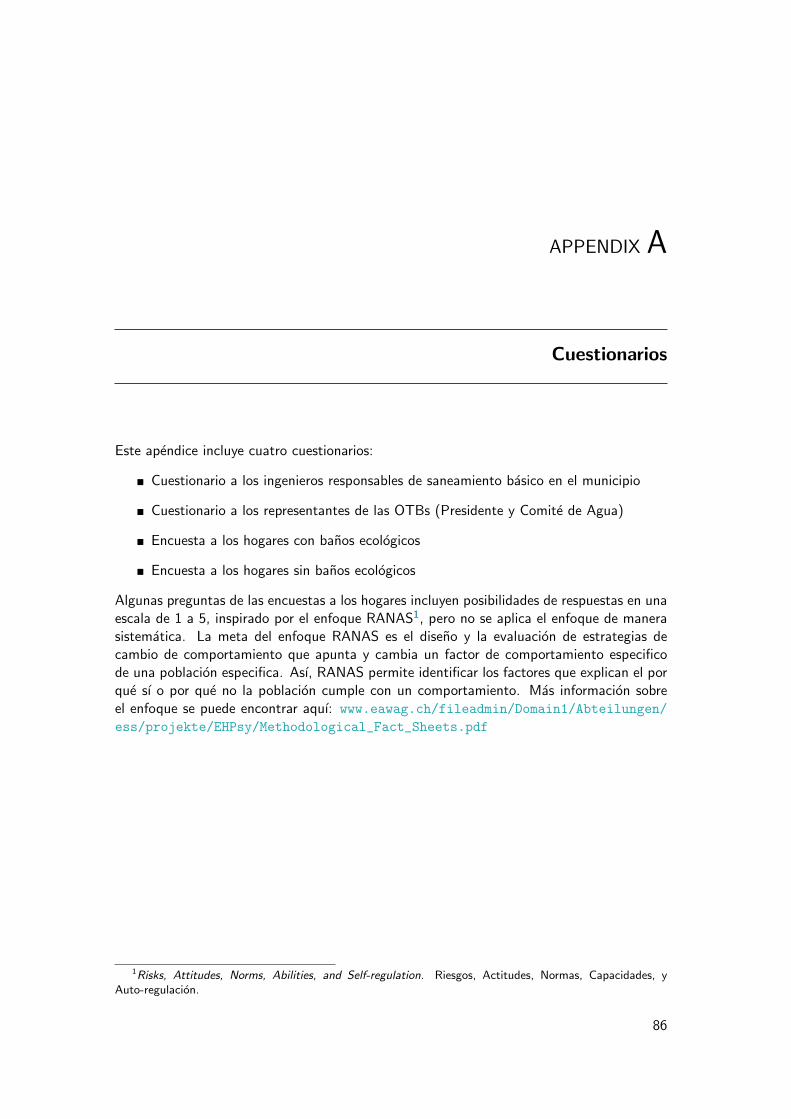
APPENDIX A
Cuestionarios
Este apendice incluye cuatro cuestionarios:
� Cuestionario a los ingenieros responsables de saneamiento basico en el municipio
� Cuestionario a los representantes de las OTBs (Presidente y Comite de Agua)
� Encuesta a los hogares con banos ecologicos
� Encuesta a los hogares sin banos ecologicos
Algunas preguntas de las encuestas a los hogares incluyen posibilidades de respuestas en unaescala de 1 a 5, inspirado por el enfoque RANAS1, pero no se aplica el enfoque de manerasistematica. La meta del enfoque RANAS es el diseno y la evaluacion de estrategias decambio de comportamiento que apunta y cambia un factor de comportamiento especificode una poblacion especifica. Ası, RANAS permite identificar los factores que explican el porque sı o por que no la poblacion cumple con un comportamiento. Mas informacion sobreel enfoque se puede encontrar aquı: www.eawag.ch/fileadmin/Domain1/Abteilungen/
ess/projekte/EHPsy/Methodological_Fact_Sheets.pdf
1Risks, Attitudes, Norms, Abilities, and Self-regulation. Riesgos, Actitudes, Normas, Capacidades, yAuto-regulacion.
86
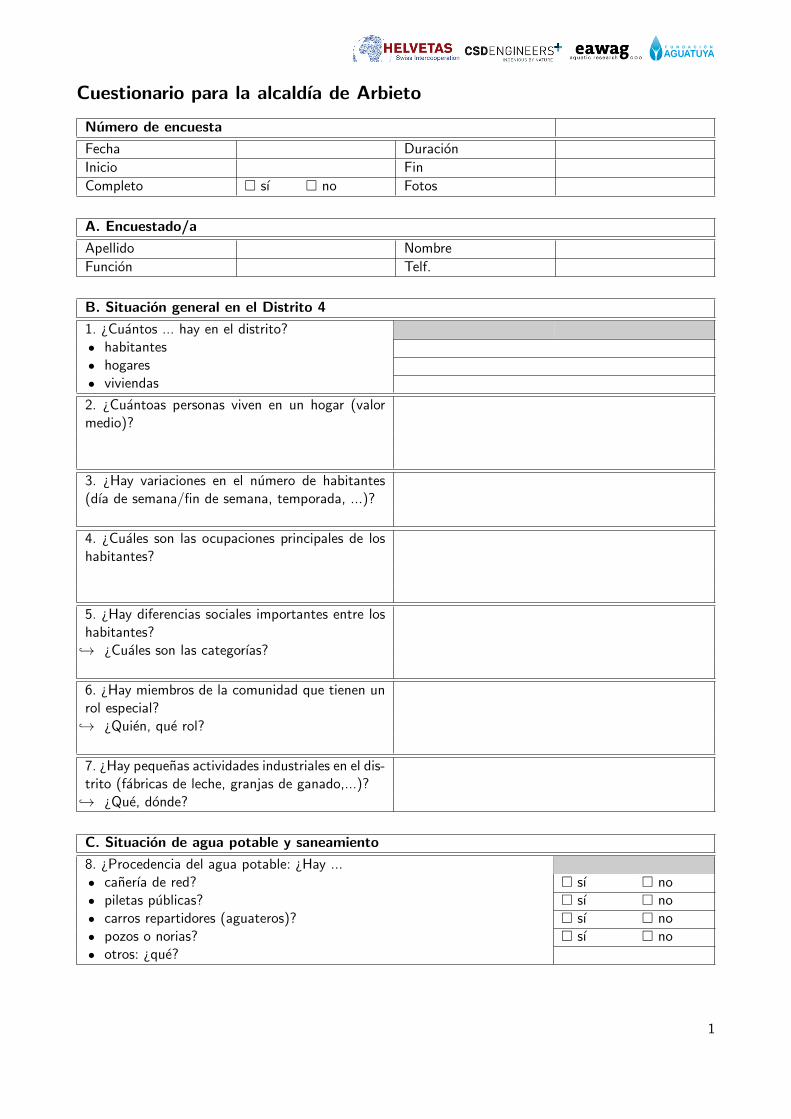
!"#$%&'
())*+,+()-(
Cuestionario para la alcaldıa de Arbieto
Numero de encuesta
Fecha Duracion
Inicio Fin
Completo � sı � no Fotos
A. Encuestado/a
Apellido Nombre
Funcion Telf.
B. Situacion general en el Distrito 4
1. ¿Cuantos ... hay en el distrito?• habitantes• hogares• viviendas
2. ¿Cuantoas personas viven en un hogar (valormedio)?
3. ¿Hay variaciones en el numero de habitantes(dıa de semana/fin de semana, temporada, ...)?
4. ¿Cuales son las ocupaciones principales de loshabitantes?
5. ¿Hay diferencias sociales importantes entre loshabitantes?↪→ ¿Cuales son las categorıas?
6. ¿Hay miembros de la comunidad que tienen unrol especial?↪→ ¿Quien, que rol?
7. ¿Hay pequenas actividades industriales en el dis-trito (fabricas de leche, granjas de ganado,...)?↪→ ¿Que, donde?
C. Situacion de agua potable y saneamiento
8. ¿Procedencia del agua potable: ¿Hay ...• canerıa de red? � sı � no• piletas publicas? � sı � no• carros repartidores (aguateros)? � sı � no• pozos o norias? � sı � no• otros: ¿que?
1
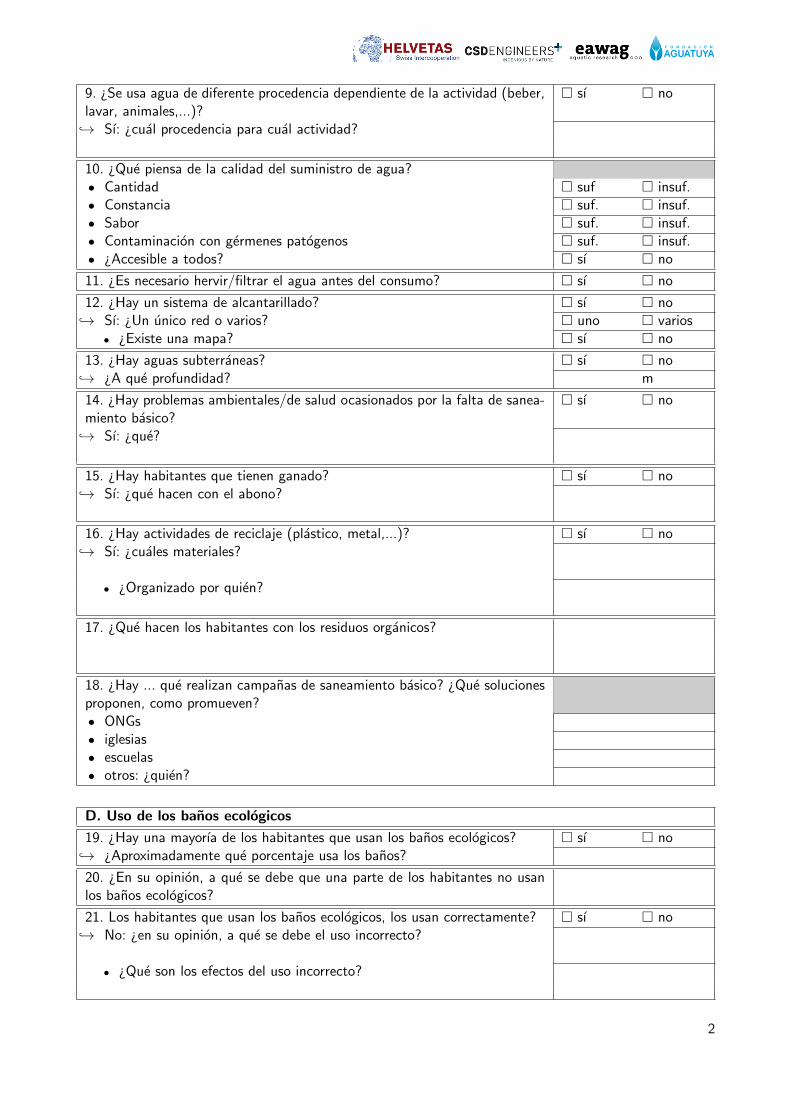
!"#$%&'
())*+,+()-(
9. ¿Se usa agua de diferente procedencia dependiente de la actividad (beber,lavar, animales,...)?
� sı � no
↪→ Sı: ¿cual procedencia para cual actividad?
10. ¿Que piensa de la calidad del suministro de agua?• Cantidad � suf � insuf.• Constancia � suf. � insuf.• Sabor � suf. � insuf.• Contaminacion con germenes patogenos � suf. � insuf.• ¿Accesible a todos? � sı � no
11. ¿Es necesario hervir/filtrar el agua antes del consumo? � sı � no
12. ¿Hay un sistema de alcantarillado? � sı � no↪→ Sı: ¿Un unico red o varios? � uno � varios
• ¿Existe una mapa? � sı � no
13. ¿Hay aguas subterraneas? � sı � no↪→ ¿A que profundidad? m
14. ¿Hay problemas ambientales/de salud ocasionados por la falta de sanea-miento basico?
� sı � no
↪→ Sı: ¿que?
15. ¿Hay habitantes que tienen ganado? � sı � no↪→ Sı: ¿que hacen con el abono?
16. ¿Hay actividades de reciclaje (plastico, metal,...)? � sı � no↪→ Sı: ¿cuales materiales?
• ¿Organizado por quien?
17. ¿Que hacen los habitantes con los residuos organicos?
18. ¿Hay ... que realizan campanas de saneamiento basico? ¿Que solucionesproponen, como promueven?• ONGs• iglesias• escuelas• otros: ¿quien?
D. Uso de los banos ecologicos
19. ¿Hay una mayorıa de los habitantes que usan los banos ecologicos? � sı � no↪→ ¿Aproximadamente que porcentaje usa los banos?
20. ¿En su opinion, a que se debe que una parte de los habitantes no usanlos banos ecologicos?
21. Los habitantes que usan los banos ecologicos, los usan correctamente? � sı � no↪→ No: ¿en su opinion, a que se debe el uso incorrecto?
• ¿Que son los efectos del uso incorrecto?
2
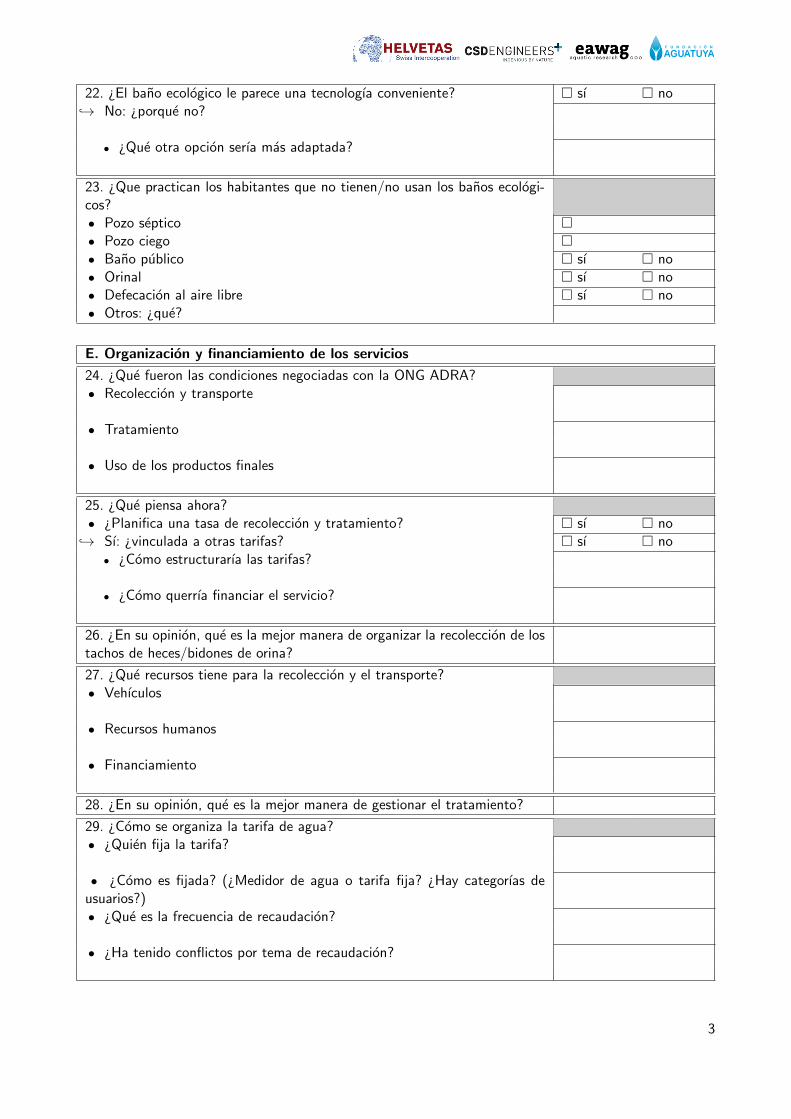
!"#$%&'
())*+,+()-(
22. ¿El bano ecologico le parece una tecnologıa conveniente? � sı � no↪→ No: ¿porque no?
• ¿Que otra opcion serıa mas adaptada?
23. ¿Que practican los habitantes que no tienen/no usan los banos ecologi-cos?• Pozo septico �• Pozo ciego �• Bano publico � sı � no• Orinal � sı � no• Defecacion al aire libre � sı � no• Otros: ¿que?
E. Organizacion y financiamiento de los servicios
24. ¿Que fueron las condiciones negociadas con la ONG ADRA?• Recoleccion y transporte
• Tratamiento
• Uso de los productos finales
25. ¿Que piensa ahora?• ¿Planifica una tasa de recoleccion y tratamiento? � sı � no
↪→ Sı: ¿vinculada a otras tarifas? � sı � no• ¿Como estructurarıa las tarifas?
• ¿Como querrıa financiar el servicio?
26. ¿En su opinion, que es la mejor manera de organizar la recoleccion de lostachos de heces/bidones de orina?
27. ¿Que recursos tiene para la recoleccion y el transporte?• Vehıculos
• Recursos humanos
• Financiamiento
28. ¿En su opinion, que es la mejor manera de gestionar el tratamiento?
29. ¿Como se organiza la tarifa de agua?• ¿Quien fija la tarifa?
• ¿Como es fijada? (¿Medidor de agua o tarifa fija? ¿Hay categorıas deusuarios?)• ¿Que es la frecuencia de recaudacion?
• ¿Ha tenido conflictos por tema de recaudacion?
3
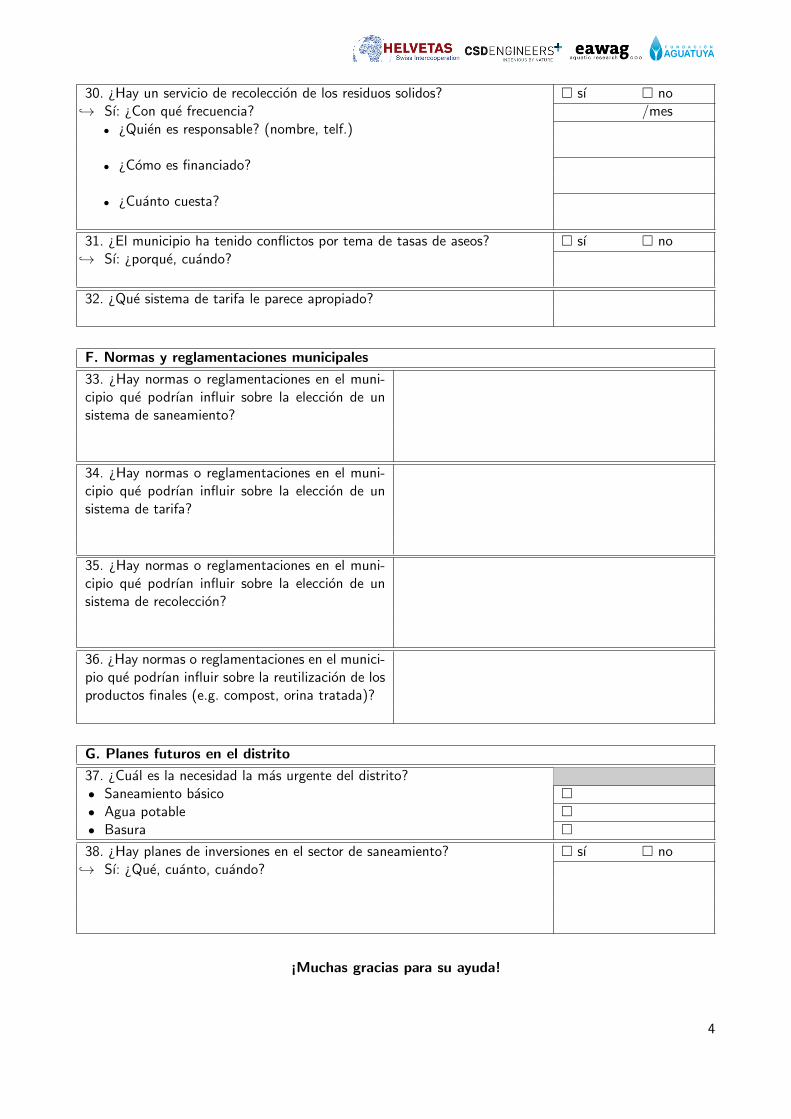
!"#$%&'
())*+,+()-(
30. ¿Hay un servicio de recoleccion de los residuos solidos? � sı � no↪→ Sı: ¿Con que frecuencia? /mes
• ¿Quien es responsable? (nombre, telf.)
• ¿Como es financiado?
• ¿Cuanto cuesta?
31. ¿El municipio ha tenido conflictos por tema de tasas de aseos? � sı � no↪→ Sı: ¿porque, cuando?
32. ¿Que sistema de tarifa le parece apropiado?
F. Normas y reglamentaciones municipales
33. ¿Hay normas o reglamentaciones en el muni-cipio que podrıan influir sobre la eleccion de unsistema de saneamiento?
34. ¿Hay normas o reglamentaciones en el muni-cipio que podrıan influir sobre la eleccion de unsistema de tarifa?
35. ¿Hay normas o reglamentaciones en el muni-cipio que podrıan influir sobre la eleccion de unsistema de recoleccion?
36. ¿Hay normas o reglamentaciones en el munici-pio que podrıan influir sobre la reutilizacion de losproductos finales (e.g. compost, orina tratada)?
G. Planes futuros en el distrito
37. ¿Cual es la necesidad la mas urgente del distrito?• Saneamiento basico �• Agua potable �• Basura �38. ¿Hay planes de inversiones en el sector de saneamiento? � sı � no↪→ Sı: ¿Que, cuanto, cuando?
¡Muchas gracias para su ayuda!
4
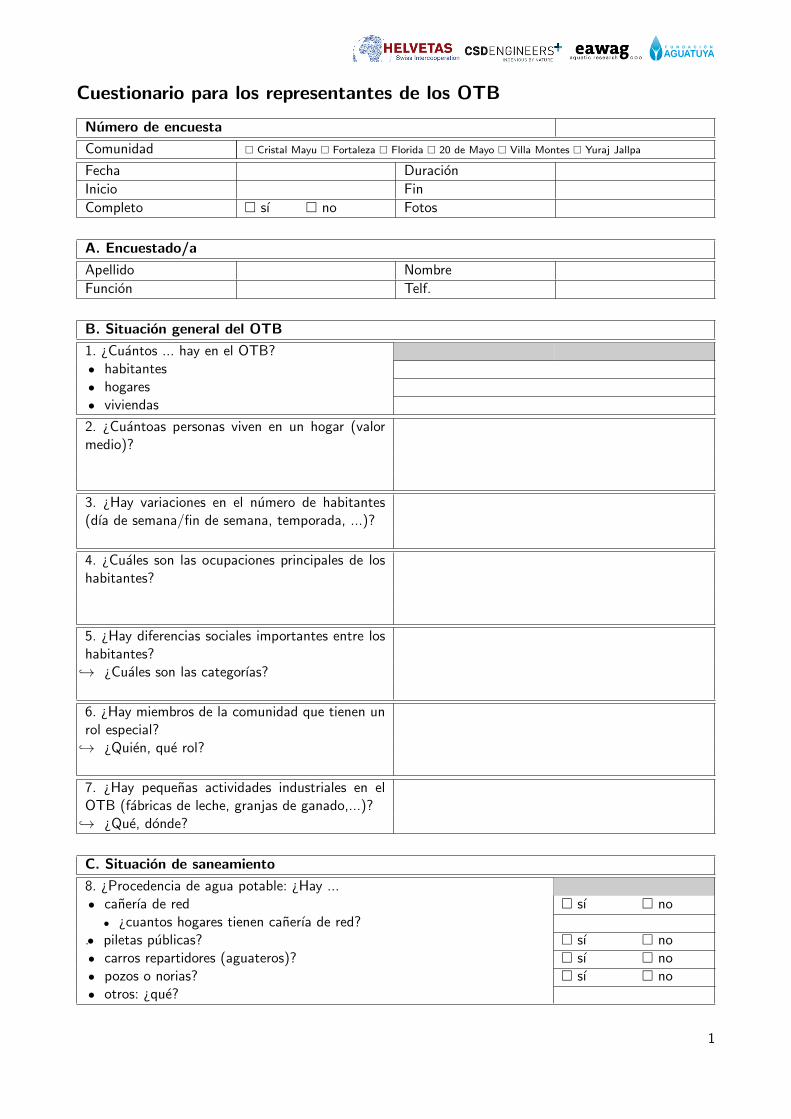
!"#$%&'
())*+,+()-(
Cuestionario para los representantes de los OTB
Numero de encuesta
Comunidad � Cristal Mayu � Fortaleza � Florida � 20 de Mayo � Villa Montes � Yuraj Jallpa
Fecha Duracion
Inicio Fin
Completo � sı � no Fotos
A. Encuestado/a
Apellido Nombre
Funcion Telf.
B. Situacion general del OTB
1. ¿Cuantos ... hay en el OTB?• habitantes• hogares• viviendas
2. ¿Cuantoas personas viven en un hogar (valormedio)?
3. ¿Hay variaciones en el numero de habitantes(dıa de semana/fin de semana, temporada, ...)?
4. ¿Cuales son las ocupaciones principales de loshabitantes?
5. ¿Hay diferencias sociales importantes entre loshabitantes?↪→ ¿Cuales son las categorıas?
6. ¿Hay miembros de la comunidad que tienen unrol especial?↪→ ¿Quien, que rol?
7. ¿Hay pequenas actividades industriales en elOTB (fabricas de leche, granjas de ganado,...)?↪→ ¿Que, donde?
C. Situacion de saneamiento
8. ¿Procedencia de agua potable: ¿Hay ...• canerıa de red � sı � no
• ¿cuantos hogares tienen canerıa de red?.• piletas publicas? � sı � no• carros repartidores (aguateros)? � sı � no• pozos o norias? � sı � no• otros: ¿que?
1
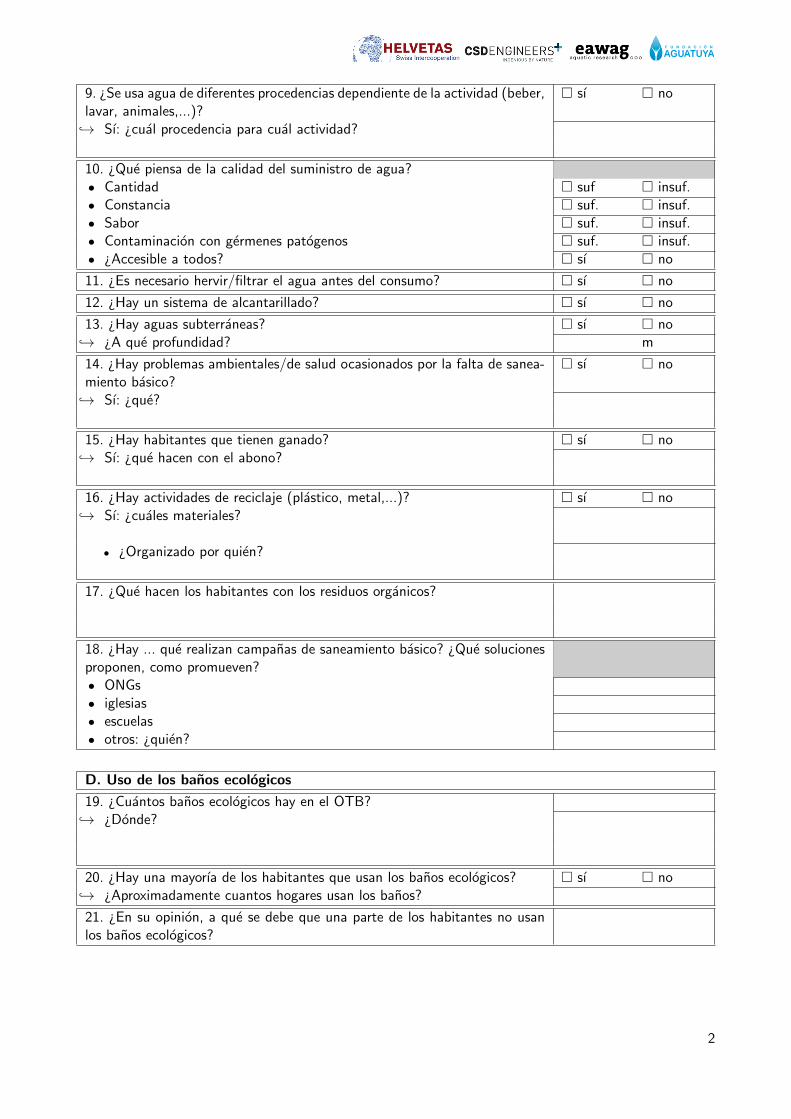
!"#$%&'
())*+,+()-(
9. ¿Se usa agua de diferentes procedencias dependiente de la actividad (beber,lavar, animales,...)?
� sı � no
↪→ Sı: ¿cual procedencia para cual actividad?
10. ¿Que piensa de la calidad del suministro de agua?• Cantidad � suf � insuf.• Constancia � suf. � insuf.• Sabor � suf. � insuf.• Contaminacion con germenes patogenos � suf. � insuf.• ¿Accesible a todos? � sı � no
11. ¿Es necesario hervir/filtrar el agua antes del consumo? � sı � no
12. ¿Hay un sistema de alcantarillado? � sı � no
13. ¿Hay aguas subterraneas? � sı � no↪→ ¿A que profundidad? m
14. ¿Hay problemas ambientales/de salud ocasionados por la falta de sanea-miento basico?
� sı � no
↪→ Sı: ¿que?
15. ¿Hay habitantes que tienen ganado? � sı � no↪→ Sı: ¿que hacen con el abono?
16. ¿Hay actividades de reciclaje (plastico, metal,...)? � sı � no↪→ Sı: ¿cuales materiales?
• ¿Organizado por quien?
17. ¿Que hacen los habitantes con los residuos organicos?
18. ¿Hay ... que realizan campanas de saneamiento basico? ¿Que solucionesproponen, como promueven?• ONGs• iglesias• escuelas• otros: ¿quien?
D. Uso de los banos ecologicos
19. ¿Cuantos banos ecologicos hay en el OTB?↪→ ¿Donde?
20. ¿Hay una mayorıa de los habitantes que usan los banos ecologicos? � sı � no↪→ ¿Aproximadamente cuantos hogares usan los banos?
21. ¿En su opinion, a que se debe que una parte de los habitantes no usanlos banos ecologicos?
2
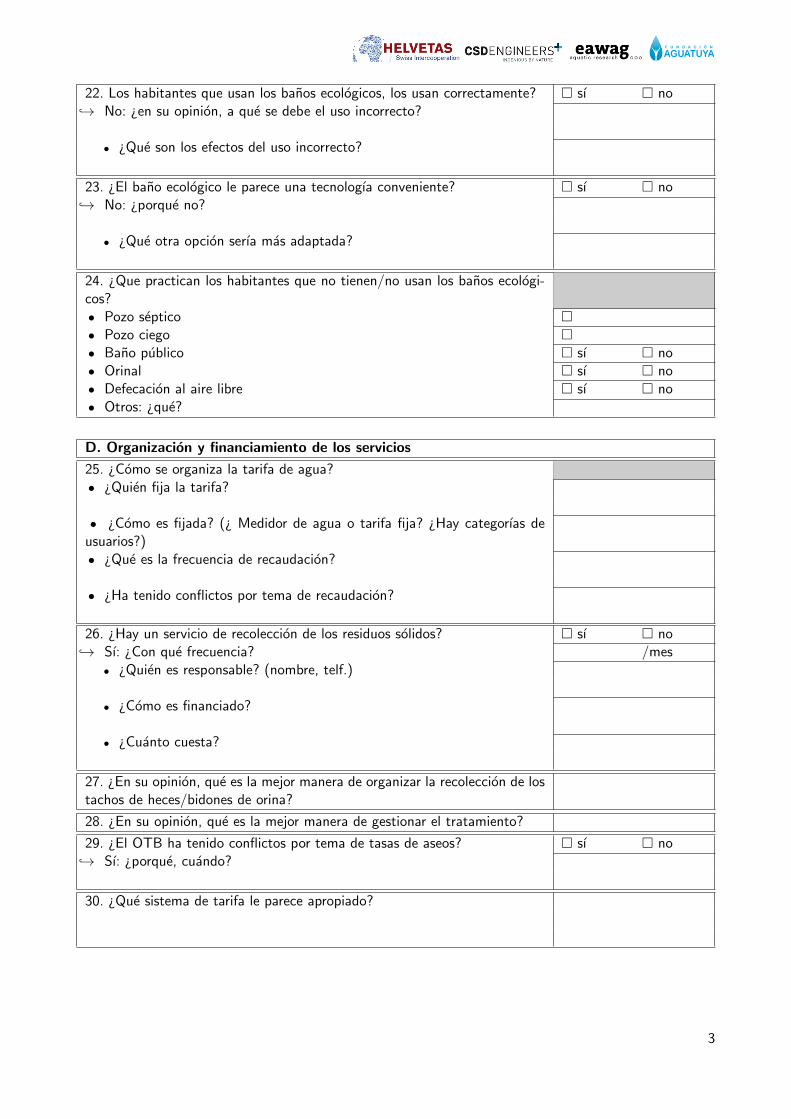
!"#$%&'
())*+,+()-(
22. Los habitantes que usan los banos ecologicos, los usan correctamente? � sı � no↪→ No: ¿en su opinion, a que se debe el uso incorrecto?
• ¿Que son los efectos del uso incorrecto?
23. ¿El bano ecologico le parece una tecnologıa conveniente? � sı � no↪→ No: ¿porque no?
• ¿Que otra opcion serıa mas adaptada?
24. ¿Que practican los habitantes que no tienen/no usan los banos ecologi-cos?• Pozo septico �• Pozo ciego �• Bano publico � sı � no• Orinal � sı � no• Defecacion al aire libre � sı � no• Otros: ¿que?
D. Organizacion y financiamiento de los servicios
25. ¿Como se organiza la tarifa de agua?• ¿Quien fija la tarifa?
• ¿Como es fijada? (¿ Medidor de agua o tarifa fija? ¿Hay categorıas deusuarios?)• ¿Que es la frecuencia de recaudacion?
• ¿Ha tenido conflictos por tema de recaudacion?
26. ¿Hay un servicio de recoleccion de los residuos solidos? � sı � no↪→ Sı: ¿Con que frecuencia? /mes
• ¿Quien es responsable? (nombre, telf.)
• ¿Como es financiado?
• ¿Cuanto cuesta?
27. ¿En su opinion, que es la mejor manera de organizar la recoleccion de lostachos de heces/bidones de orina?
28. ¿En su opinion, que es la mejor manera de gestionar el tratamiento?
29. ¿El OTB ha tenido conflictos por tema de tasas de aseos? � sı � no↪→ Sı: ¿porque, cuando?
30. ¿Que sistema de tarifa le parece apropiado?
3
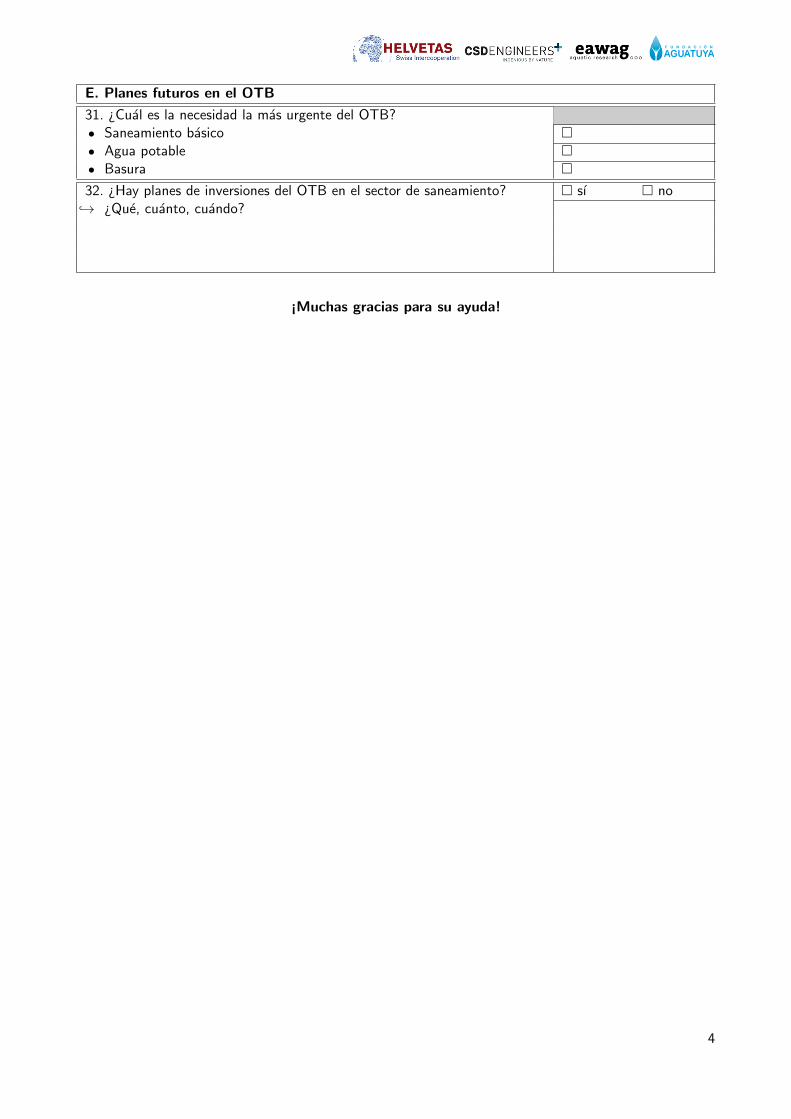
!"#$%&'
())*+,+()-(
E. Planes futuros en el OTB
31. ¿Cual es la necesidad la mas urgente del OTB?• Saneamiento basico �• Agua potable �• Basura �32. ¿Hay planes de inversiones del OTB en el sector de saneamiento? � sı � no↪→ ¿Que, cuanto, cuando?
¡Muchas gracias para su ayuda!
4
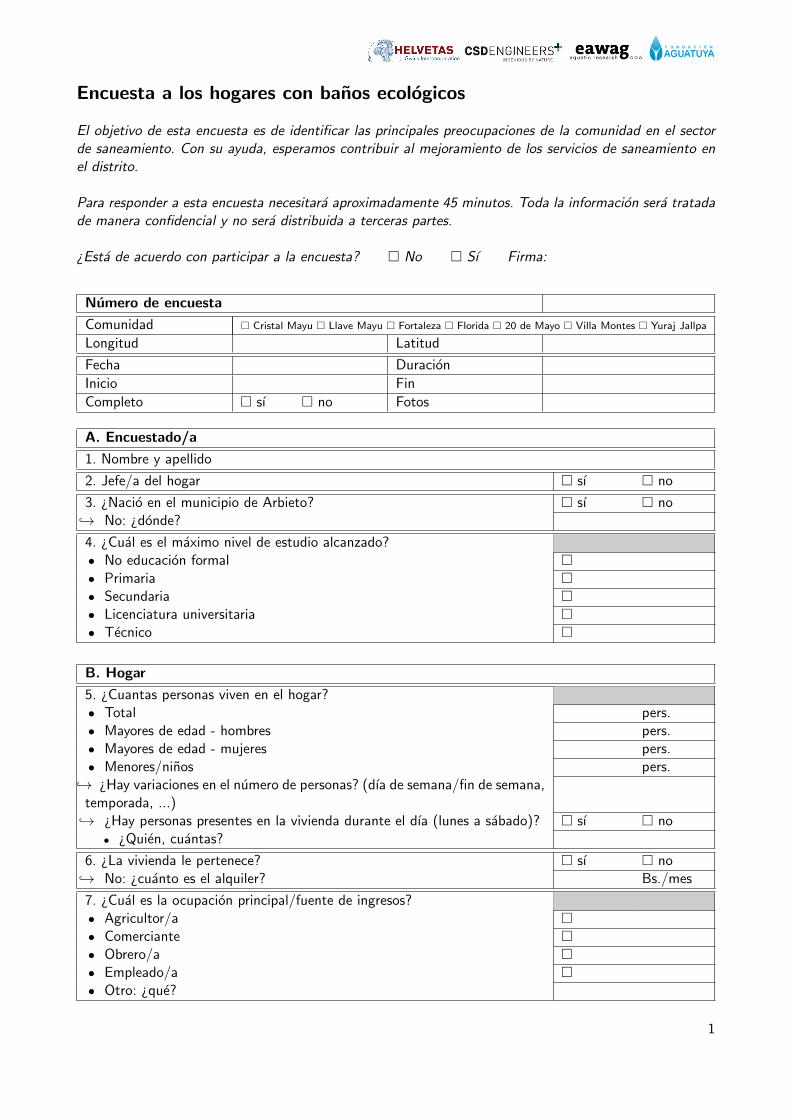
!"#$%&'
())*+,+()-(
Encuesta a los hogares con banos ecologicos
El objetivo de esta encuesta es de identificar las principales preocupaciones de la comunidad en el sectorde saneamiento. Con su ayuda, esperamos contribuir al mejoramiento de los servicios de saneamiento enel distrito.
Para responder a esta encuesta necesitara aproximadamente 45 minutos. Toda la informacion sera tratadade manera confidencial y no sera distribuida a terceras partes.
¿Esta de acuerdo con participar a la encuesta? � No � Sı Firma:
Numero de encuesta
Comunidad � Cristal Mayu � Llave Mayu � Fortaleza � Florida � 20 de Mayo � Villa Montes � Yuraj Jallpa
Longitud Latitud
Fecha Duracion
Inicio Fin
Completo � sı � no Fotos
A. Encuestado/a
1. Nombre y apellido
2. Jefe/a del hogar � sı � no
3. ¿Nacio en el municipio de Arbieto? � sı � no↪→ No: ¿donde?
4. ¿Cual es el maximo nivel de estudio alcanzado?• No educacion formal �• Primaria �• Secundaria �• Licenciatura universitaria �• Tecnico �
B. Hogar
5. ¿Cuantas personas viven en el hogar?• Total pers.• Mayores de edad - hombres pers.• Mayores de edad - mujeres pers.• Menores/ninos pers.
↪→ ¿Hay variaciones en el numero de personas? (dıa de semana/fin de semana,temporada, ...)↪→ ¿Hay personas presentes en la vivienda durante el dıa (lunes a sabado)? � sı � no
• ¿Quien, cuantas?
6. ¿La vivienda le pertenece? � sı � no↪→ No: ¿cuanto es el alquiler? Bs./mes
7. ¿Cual es la ocupacion principal/fuente de ingresos?• Agricultor/a �• Comerciante �• Obrero/a �• Empleado/a �• Otro: ¿que?
1
!"#$%&'
())*+,+()-(
8. ¿Donde trabaja?• OTB �• Arbieto (municipio) �• Cochabamba (ciudad) �• Otro: ¿donde?
9. ¿Tiene electricidad? � sı � no↪→ Sı: ¿que electrodomesticos tiene en su hogar?
• Celular �• Televisor �• Refrigerador �• Lavadora �• Otros: ¿que?
C. Suministro de agua y saneamiento
10. ¿Cual es la procedencia principal del agua?• Canerıa de red �• Pileta publica �• Carro repartidor (aguatero) �• Pozo o noria �• Lluvia, rıo, vertiente, acequia �• Otros: ¿que?
11. ¿Para las siguientes actividades, cual es la procedencia del agua?• Beber• Cocinar• Lavar la vajilla• Ducharse/banarse• Lavar la ropa
12. ¿Que hace con el agua residual de las siguientes actividades?• Lavar la vajilla• Ducharse/banarse• Lavar la ropa• Si usa pozo de drenaje: ¿hay problemas de infiltracion? � sı � no
13. ¿Sabe cuanto agua se usa en el hogar? � sı � no↪→ Sı: ¿cuanto?
14. ¿Paga por el suministro de agua � sı � no↪→ Sı: ¿cuanto? Bs./mes
• ¿Como se calcula el pago por agua?• Medidor de agua �• Tarifa fija �• Otro: ¿que?
15. ¿Que piensa de la calidad del suministro de agua?• Cantidad: � mucho � suficiente � poco � muy poco � nada• Constancia: � siempre � frecuentemente � regularmente � rara vez � nunca• Sabor: � muy bueno � bueno � normal � malo � muy malo• Presion (si hay canerıa): � muy alta � alta � normal � baja � muy baja
16. ¿Hierve/filtra el agua antes del consumo?� siempre � frecuentem. � regularmente � rara vez � nunca
2
!"#$%&'
())*+,+()-(
17. ¿Hay un servicio de recoleccion de los residuos solidos? � sı � no↪→ Sı: ¿con que frecuencia? vez/sem.
• ¿Paga por el servicio? � sı � no• Sı: ¿cuanto cuesta? Bs./vez
↪→ No: ¿que hace con la basura?
18. ¿Cuanta gente en la OTB cree que defeca al aire libre?� casi todos � muchos � algunos � pocos � nadie↪→ ¿Cual es su percepcion la defecacion al aire libre?• ¿Le parece aceptable esta practica? � completamente � mayormente � pasable � poco � no• ¿Le da asco esta practica? � mucho asco � asco � poco asco � indeciso � no• ¿Cuales cree que son los problemas principales de la defecacion al aire
libre?
D. Experiencia con ADRA
19. ¿Porque quiso un bano ecologico de ADRA?
20. ¿ADRA exigio alguna contraparte para la implementacion del bano? � sı � no↪→ Sı: ¿que?
21. ¿ADRA le explico...↪→ como se usa el bano? � sı � no↪→ como funcionaria el servicio de recoleccion? � sı � no
• Sı: ¿como?↪→ cuanto costarıa el servicio de recoleccion � sı � no
• Sı: ¿cuanto?
E. Bano ecologico
22. ¿El bano ecologico es el bano principal que usa? � sı � no↪→ Sı ⇒ F.1↪→ No ⇒ F.2
F.1 Bano ecologico - en uso
23. ¿Piensa que usar el bano ecologico es importante para la salud?� muy imp. � imp. � relativamente imp. � poco imp. � no imp.
24. ¿El bano ecologico le parece una tecnologıa higienica?� muy hig. � hig. � relativamente hig. � poco hig. � no hig.
25. ¿Piensa que usar el bano ecologico es economico?� muy econ. � econ. � relativamente econ. � no econ. � caro
26. ¿El bano ecologico aumento su sentimiento de seguridad?� muchısimo � mucho � relativamente � poco � no
27. ¿Le gusta la posibilidad de reutilizar los productos (orina, compost)?� gusta mucho � gusta � gusta relativamente � indiferente � no gusta
28. ¿Con que frecuencia usa el bano ecologico?� siempre � frecuentemente � regularmente � rara vez � casi nada
3
!"#$%&'
())*+,+()-(
29. ¿Tiene problemas con el bano? � sı � no↪→ Sı: ¿que tipo?
• Olor: � siempre � frecuentemente � regularmente � rara vez � casi nada• Moscas: � siempre � frecuentemente � regularmente � rara vez � casi nada• Atascamiento con las heces: � siempre � frecuentem. � regularmente � rara vez � casi nada• Otros: ¿que?
30. ¿Usa el bano ecologico correctamente?� siempre � frecuentemente � regularmente� rara vez � casi nada• ¿Que significa “usar el bano correctamente”?
31. ¿Usa material secante? � sı � no↪→ Sı: ¿que tipo, cuanto cuesta?
• Papel � Bs.• Ceniza � Bs.• Tierra � Bs.• Aserrin � Bs.• Otros: ¿que?
32. ¿Con que frecuencia se llenan ...• los bidones de orina? /semana• el tacho de heces? /mes
33. ¿Usa un servicio de recoleccion de las heces? � sı � no↪→ Sı: ¿organizado por quien?
• ¿Cuanto cuesta? Bs./vez↪→ No: ¿que hace con las heces?
• ¿Quien es responsable de la eliminacion de las heces en la familia?• ¿Como maneja las heces?• ¿Como se siente manejar las heces? � muchısimo asco � mucho as. � as. � poco as. � no as.• ¿Es un esfuerzo manejar las heces? � muchısimo � mucho � relativamente � poco � no• ¿Donde deja las heces?
34. ¿Usa un servicio de recoleccion de la orina? � sı � no↪→ Sı: ¿organizado por quien?
• ¿Cuanto cuesta? Bs./vez↪→ No: ¿que hace con las orina?
• ¿Quien es responsable de la eliminacion de las orina en la familia?• ¿Como maneja las orina?• ¿Como se siente manejar la orina? � muchısimo asco � mucho as. � as. � poco as. � no as.• ¿Es un esfuerzo manejar la orina? � muchısimo � mucho � relativamente � poco � no• ¿Donde deja la orina?
35. ¿Como hacıa sus necesidades antes de la construccion del bano ecologico?• Pozo septico �• Pozo ciego �• Bano publico �• Orinal �• Defecacion al aire libre �• Otros: ¿que?
36. ¿Ha cambiado el diseno del bano? � sı � no↪→ Sı: ¿porque?
• ¿Como?
37. ¿Tiene otro bano? � sı � no↪→ Sı: ¿que tipo?
• Lo prefieres al bano ecologico? ¿Porque?
4
!"#$%&'
())*+,+()-(
F.2 Bano ecologico - no usado
38. ¿Como hace sus necesidades?• Pozo septico �• Pozo ciego �• Bano publico �• Orinal �• Defecacion al aire libre �• Otros: ¿que?
39. ¿Usaba el bano despues de la construccion? � sı � no↪→ Sı: ¿por cuanto tiempo?
• ¿Porque dejo de usar el bano ecologico?
40. ¿El bano ecologico le parecıa una tecnologıa insalubre?� muy insalubre � insalubre � relativamente insalubre � poco insalubre � salubre
41. ¿Tenıa algunos de los problemas siguientes?• Olor: � siempre � frecuentem. � regularmente � rara vez � casi nada• Moscas: � siempre � frecuentem. � regularmente � rara vez � casi nada• Atascamiento con las heces: � siempre � frecuentem. � regularmente � rara vez � casi nada
42. ¿Sabe como se usa el bano ecologico correctamente?� muy bien � bien � relativamente bien � no realmente � no• ¿Si tuviese un taller de capacitacion, usarıa el bano?� con seguridad � alta � media � baja � no
43. ¿Si tendrıa un servicio de recoleccion, usarıa el bano ecologico?� con seguridad � alta � media � baja � no
G. Produccion y uso de compost
44. ¿Separa la basura organica? � sı � no↪→ Sı: ¿que hace con los residuos organicos?
• Compostaje �• Alimentacion de animales �• Botado en el predio de la casa �• Aplicacion directa a la tierra �• Otros: ¿que?
45. ¿Tiene tierra agrıcola/huerto? � sı � no↪→ Sı: ¿usa fertilizante quımico? �
• ¿Usa abono? �• ¿Usa orina? �• ¿Usa compost? �
46. ¿Tiene animales? � sı � no↪→ Sı: ¿cuales, cuantos?
• Ganado ovino/caprino �• Ganado vacuno �• Gallinas �• Otros: ¿que?• ¿Que hace con el abono?
5
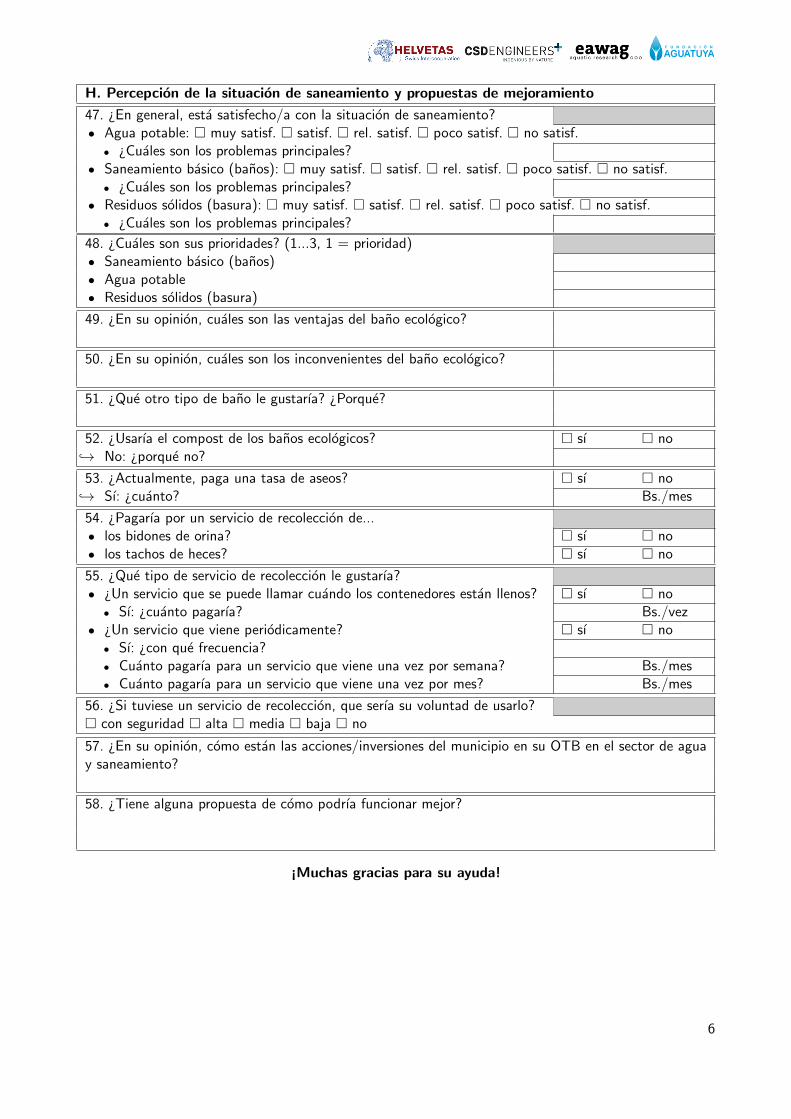
!"#$%&'
())*+,+()-(
H. Percepcion de la situacion de saneamiento y propuestas de mejoramiento
47. ¿En general, esta satisfecho/a con la situacion de saneamiento?• Agua potable: � muy satisf. � satisf. � rel. satisf. � poco satisf. � no satisf.
• ¿Cuales son los problemas principales?• Saneamiento basico (banos): � muy satisf. � satisf. � rel. satisf. � poco satisf. � no satisf.
• ¿Cuales son los problemas principales?• Residuos solidos (basura): � muy satisf. � satisf. � rel. satisf. � poco satisf. � no satisf.
• ¿Cuales son los problemas principales?
48. ¿Cuales son sus prioridades? (1...3, 1 = prioridad)• Saneamiento basico (banos)• Agua potable• Residuos solidos (basura)
49. ¿En su opinion, cuales son las ventajas del bano ecologico?
50. ¿En su opinion, cuales son los inconvenientes del bano ecologico?
51. ¿Que otro tipo de bano le gustarıa? ¿Porque?
52. ¿Usarıa el compost de los banos ecologicos? � sı � no↪→ No: ¿porque no?
53. ¿Actualmente, paga una tasa de aseos? � sı � no↪→ Sı: ¿cuanto? Bs./mes
54. ¿Pagarıa por un servicio de recoleccion de...• los bidones de orina? � sı � no• los tachos de heces? � sı � no
55. ¿Que tipo de servicio de recoleccion le gustarıa?• ¿Un servicio que se puede llamar cuando los contenedores estan llenos? � sı � no
• Sı: ¿cuanto pagarıa? Bs./vez• ¿Un servicio que viene periodicamente? � sı � no
• Sı: ¿con que frecuencia?• Cuanto pagarıa para un servicio que viene una vez por semana? Bs./mes• Cuanto pagarıa para un servicio que viene una vez por mes? Bs./mes
56. ¿Si tuviese un servicio de recoleccion, que serıa su voluntad de usarlo?� con seguridad � alta � media � baja � no
57. ¿En su opinion, como estan las acciones/inversiones del municipio en su OTB en el sector de aguay saneamiento?
58. ¿Tiene alguna propuesta de como podrıa funcionar mejor?
¡Muchas gracias para su ayuda!
6
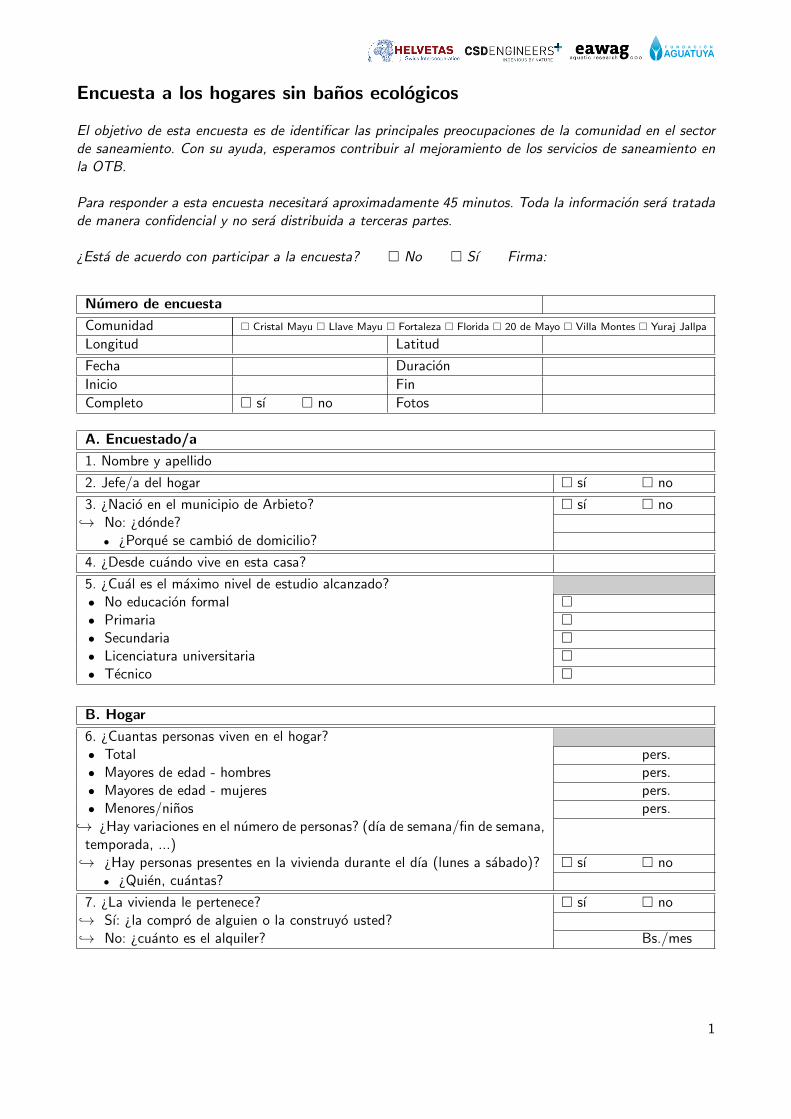
!"#$%&'
())*+,+()-(
Encuesta a los hogares sin banos ecologicos
El objetivo de esta encuesta es de identificar las principales preocupaciones de la comunidad en el sectorde saneamiento. Con su ayuda, esperamos contribuir al mejoramiento de los servicios de saneamiento enla OTB.
Para responder a esta encuesta necesitara aproximadamente 45 minutos. Toda la informacion sera tratadade manera confidencial y no sera distribuida a terceras partes.
¿Esta de acuerdo con participar a la encuesta? � No � Sı Firma:
Numero de encuesta
Comunidad � Cristal Mayu � Llave Mayu � Fortaleza � Florida � 20 de Mayo � Villa Montes � Yuraj Jallpa
Longitud Latitud
Fecha Duracion
Inicio Fin
Completo � sı � no Fotos
A. Encuestado/a
1. Nombre y apellido
2. Jefe/a del hogar � sı � no
3. ¿Nacio en el municipio de Arbieto? � sı � no↪→ No: ¿donde?
• ¿Porque se cambio de domicilio?
4. ¿Desde cuando vive en esta casa?
5. ¿Cual es el maximo nivel de estudio alcanzado?• No educacion formal �• Primaria �• Secundaria �• Licenciatura universitaria �• Tecnico �
B. Hogar
6. ¿Cuantas personas viven en el hogar?• Total pers.• Mayores de edad - hombres pers.• Mayores de edad - mujeres pers.• Menores/ninos pers.
↪→ ¿Hay variaciones en el numero de personas? (dıa de semana/fin de semana,temporada, ...)↪→ ¿Hay personas presentes en la vivienda durante el dıa (lunes a sabado)? � sı � no
• ¿Quien, cuantas?
7. ¿La vivienda le pertenece? � sı � no↪→ Sı: ¿la compro de alguien o la construyo usted?↪→ No: ¿cuanto es el alquiler? Bs./mes
1
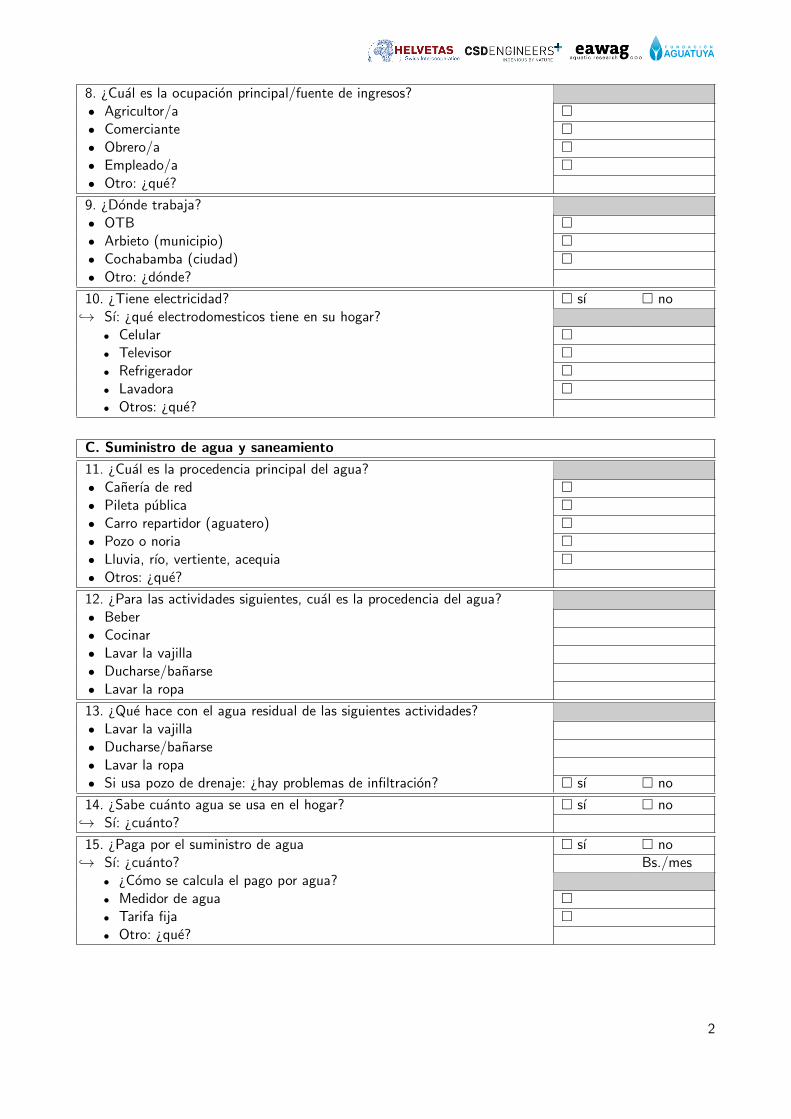
!"#$%&'
())*+,+()-(
8. ¿Cual es la ocupacion principal/fuente de ingresos?• Agricultor/a �• Comerciante �• Obrero/a �• Empleado/a �• Otro: ¿que?
9. ¿Donde trabaja?• OTB �• Arbieto (municipio) �• Cochabamba (ciudad) �• Otro: ¿donde?
10. ¿Tiene electricidad? � sı � no↪→ Sı: ¿que electrodomesticos tiene en su hogar?
• Celular �• Televisor �• Refrigerador �• Lavadora �• Otros: ¿que?
C. Suministro de agua y saneamiento
11. ¿Cual es la procedencia principal del agua?• Canerıa de red �• Pileta publica �• Carro repartidor (aguatero) �• Pozo o noria �• Lluvia, rıo, vertiente, acequia �• Otros: ¿que?
12. ¿Para las actividades siguientes, cual es la procedencia del agua?• Beber• Cocinar• Lavar la vajilla• Ducharse/banarse• Lavar la ropa
13. ¿Que hace con el agua residual de las siguientes actividades?• Lavar la vajilla• Ducharse/banarse• Lavar la ropa• Si usa pozo de drenaje: ¿hay problemas de infiltracion? � sı � no
14. ¿Sabe cuanto agua se usa en el hogar? � sı � no↪→ Sı: ¿cuanto?
15. ¿Paga por el suministro de agua � sı � no↪→ Sı: ¿cuanto? Bs./mes
• ¿Como se calcula el pago por agua?• Medidor de agua �• Tarifa fija �• Otro: ¿que?
2
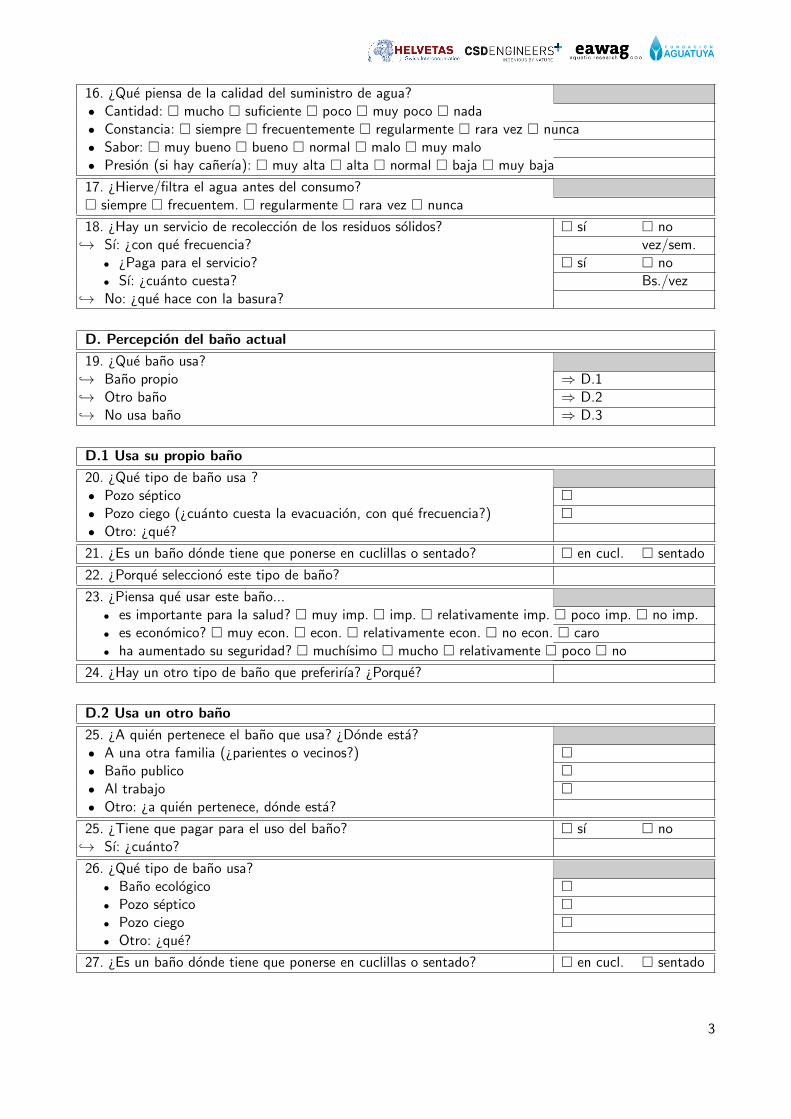
!"#$%&'
())*+,+()-(
16. ¿Que piensa de la calidad del suministro de agua?• Cantidad: � mucho � suficiente � poco � muy poco � nada• Constancia: � siempre � frecuentemente � regularmente � rara vez � nunca• Sabor: � muy bueno � bueno � normal � malo � muy malo• Presion (si hay canerıa): � muy alta � alta � normal � baja � muy baja
17. ¿Hierve/filtra el agua antes del consumo?� siempre � frecuentem. � regularmente � rara vez � nunca
18. ¿Hay un servicio de recoleccion de los residuos solidos? � sı � no↪→ Sı: ¿con que frecuencia? vez/sem.
• ¿Paga para el servicio? � sı � no• Sı: ¿cuanto cuesta? Bs./vez
↪→ No: ¿que hace con la basura?
D. Percepcion del bano actual
19. ¿Que bano usa?↪→ Bano propio ⇒ D.1↪→ Otro bano ⇒ D.2↪→ No usa bano ⇒ D.3
D.1 Usa su propio bano
20. ¿Que tipo de bano usa ?• Pozo septico �• Pozo ciego (¿cuanto cuesta la evacuacion, con que frecuencia?) �• Otro: ¿que?
21. ¿Es un bano donde tiene que ponerse en cuclillas o sentado? � en cucl. � sentado
22. ¿Porque selecciono este tipo de bano?
23. ¿Piensa que usar este bano...• es importante para la salud? � muy imp. � imp. � relativamente imp. � poco imp. � no imp.• es economico? � muy econ. � econ. � relativamente econ. � no econ. � caro• ha aumentado su seguridad? � muchısimo � mucho � relativamente � poco � no
24. ¿Hay un otro tipo de bano que preferirıa? ¿Porque?
D.2 Usa un otro bano
25. ¿A quien pertenece el bano que usa? ¿Donde esta?• A una otra familia (¿parientes o vecinos?) �• Bano publico �• Al trabajo �• Otro: ¿a quien pertenece, donde esta?
25. ¿Tiene que pagar para el uso del bano? � sı � no↪→ Sı: ¿cuanto?
26. ¿Que tipo de bano usa?• Bano ecologico �• Pozo septico �• Pozo ciego �• Otro: ¿que?
27. ¿Es un bano donde tiene que ponerse en cuclillas o sentado? � en cucl. � sentado
3
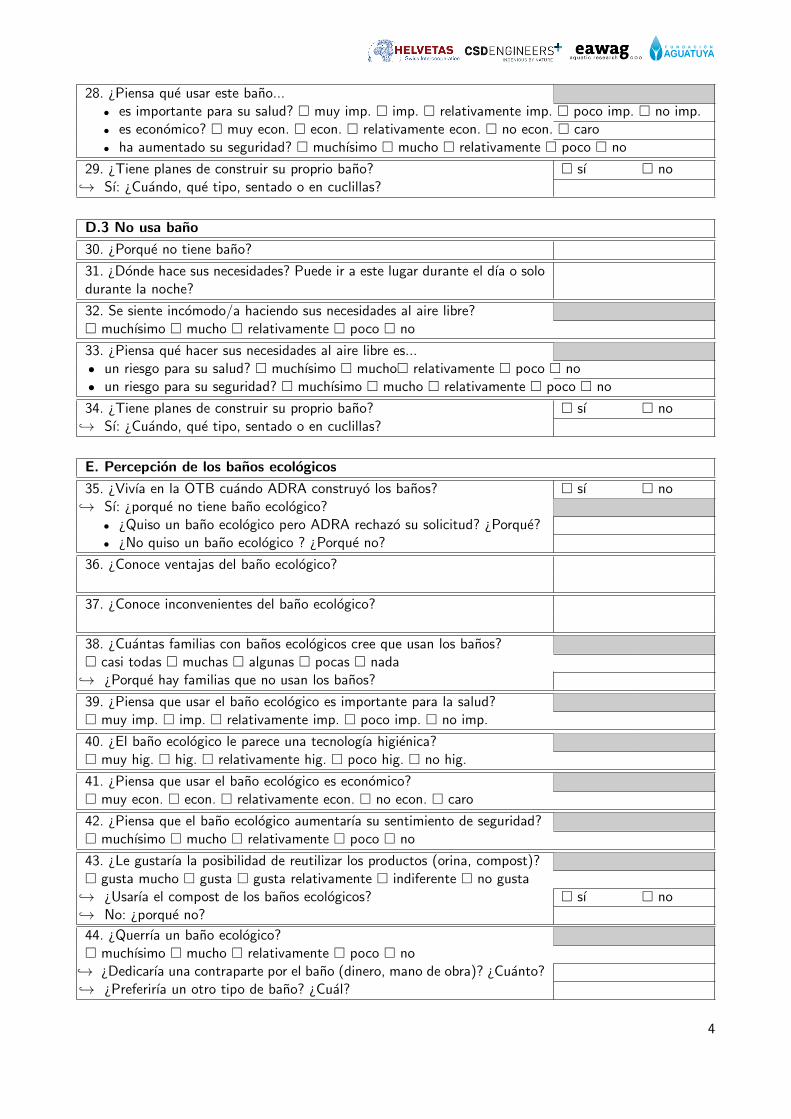
!"#$%&'
())*+,+()-(
28. ¿Piensa que usar este bano...• es importante para su salud? � muy imp. � imp. � relativamente imp. � poco imp. � no imp.• es economico? � muy econ. � econ. � relativamente econ. � no econ. � caro• ha aumentado su seguridad? � muchısimo � mucho � relativamente � poco � no
29. ¿Tiene planes de construir su proprio bano? � sı � no↪→ Sı: ¿Cuando, que tipo, sentado o en cuclillas?
D.3 No usa bano
30. ¿Porque no tiene bano?
31. ¿Donde hace sus necesidades? Puede ir a este lugar durante el dıa o solodurante la noche?
32. Se siente incomodo/a haciendo sus necesidades al aire libre?� muchısimo � mucho � relativamente � poco � no
33. ¿Piensa que hacer sus necesidades al aire libre es...• un riesgo para su salud? � muchısimo � mucho� relativamente � poco � no• un riesgo para su seguridad? � muchısimo � mucho � relativamente � poco � no
34. ¿Tiene planes de construir su proprio bano? � sı � no↪→ Sı: ¿Cuando, que tipo, sentado o en cuclillas?
E. Percepcion de los banos ecologicos
35. ¿Vivıa en la OTB cuando ADRA construyo los banos? � sı � no↪→ Sı: ¿porque no tiene bano ecologico?
• ¿Quiso un bano ecologico pero ADRA rechazo su solicitud? ¿Porque?• ¿No quiso un bano ecologico ? ¿Porque no?
36. ¿Conoce ventajas del bano ecologico?
37. ¿Conoce inconvenientes del bano ecologico?
38. ¿Cuantas familias con banos ecologicos cree que usan los banos?� casi todas � muchas � algunas � pocas � nada↪→ ¿Porque hay familias que no usan los banos?
39. ¿Piensa que usar el bano ecologico es importante para la salud?� muy imp. � imp. � relativamente imp. � poco imp. � no imp.
40. ¿El bano ecologico le parece una tecnologıa higienica?� muy hig. � hig. � relativamente hig. � poco hig. � no hig.
41. ¿Piensa que usar el bano ecologico es economico?� muy econ. � econ. � relativamente econ. � no econ. � caro
42. ¿Piensa que el bano ecologico aumentarıa su sentimiento de seguridad?� muchısimo � mucho � relativamente � poco � no
43. ¿Le gustarıa la posibilidad de reutilizar los productos (orina, compost)?� gusta mucho � gusta � gusta relativamente � indiferente � no gusta↪→ ¿Usarıa el compost de los banos ecologicos? � sı � no↪→ No: ¿porque no?
44. ¿Querrıa un bano ecologico?� muchısimo � mucho � relativamente � poco � no
↪→ ¿Dedicarıa una contraparte por el bano (dinero, mano de obra)? ¿Cuanto?↪→ ¿Preferirıa un otro tipo de bano? ¿Cual?
4
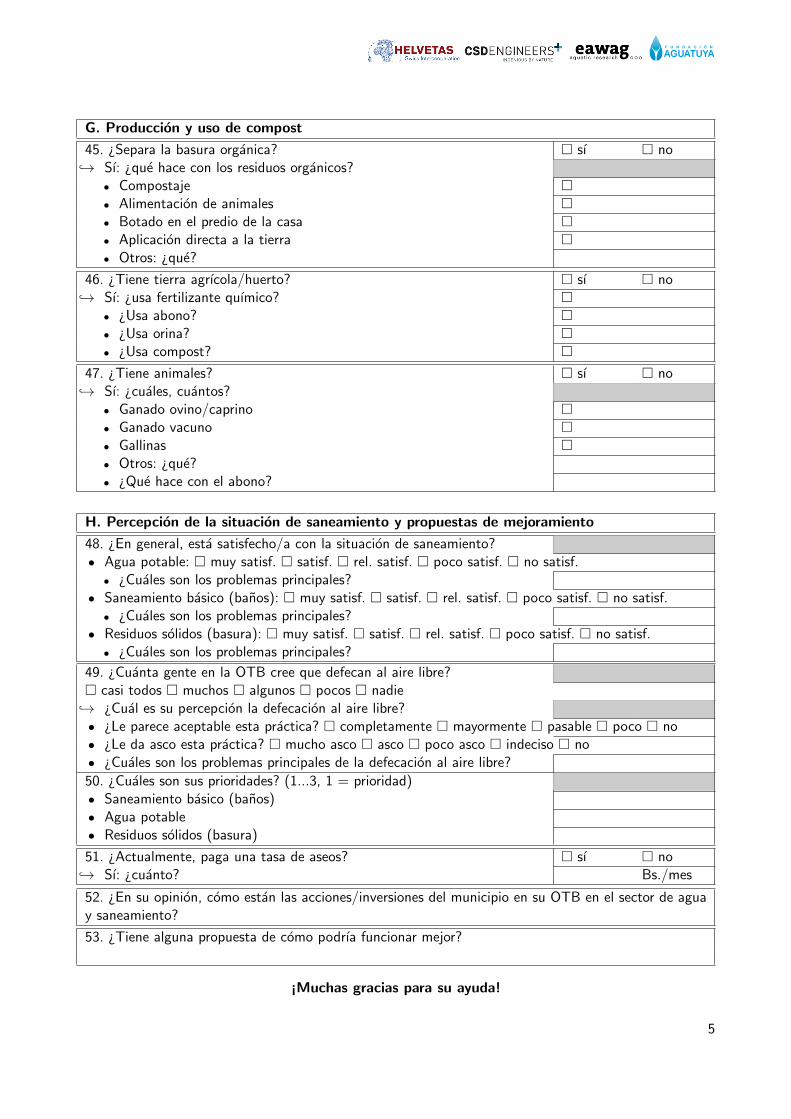
!"#$%&'
())*+,+()-(
G. Produccion y uso de compost
45. ¿Separa la basura organica? � sı � no↪→ Sı: ¿que hace con los residuos organicos?
• Compostaje �• Alimentacion de animales �• Botado en el predio de la casa �• Aplicacion directa a la tierra �• Otros: ¿que?
46. ¿Tiene tierra agrıcola/huerto? � sı � no↪→ Sı: ¿usa fertilizante quımico? �
• ¿Usa abono? �• ¿Usa orina? �• ¿Usa compost? �
47. ¿Tiene animales? � sı � no↪→ Sı: ¿cuales, cuantos?
• Ganado ovino/caprino �• Ganado vacuno �• Gallinas �• Otros: ¿que?• ¿Que hace con el abono?
H. Percepcion de la situacion de saneamiento y propuestas de mejoramiento
48. ¿En general, esta satisfecho/a con la situacion de saneamiento?• Agua potable: � muy satisf. � satisf. � rel. satisf. � poco satisf. � no satisf.
• ¿Cuales son los problemas principales?• Saneamiento basico (banos): � muy satisf. � satisf. � rel. satisf. � poco satisf. � no satisf.
• ¿Cuales son los problemas principales?• Residuos solidos (basura): � muy satisf. � satisf. � rel. satisf. � poco satisf. � no satisf.
• ¿Cuales son los problemas principales?
49. ¿Cuanta gente en la OTB cree que defecan al aire libre?� casi todos � muchos � algunos � pocos � nadie↪→ ¿Cual es su percepcion la defecacion al aire libre?• ¿Le parece aceptable esta practica? � completamente � mayormente � pasable � poco � no• ¿Le da asco esta practica? � mucho asco � asco � poco asco � indeciso � no• ¿Cuales son los problemas principales de la defecacion al aire libre?
50. ¿Cuales son sus prioridades? (1...3, 1 = prioridad)• Saneamiento basico (banos)• Agua potable• Residuos solidos (basura)
51. ¿Actualmente, paga una tasa de aseos? � sı � no↪→ Sı: ¿cuanto? Bs./mes
52. ¿En su opinion, como estan las acciones/inversiones del municipio en su OTB en el sector de aguay saneamiento?
53. ¿Tiene alguna propuesta de como podrıa funcionar mejor?
¡Muchas gracias para su ayuda!
5
APPENDIX B
Mapa de las OTBs
El mapa en la proxima pagina presenta la ubicacion de los banos en las 7 OTBs segun unlevantamiento en el terreno. No incluye los banos no completados. Tampoco se pudieroncontar los banos que estan adentro de las casas. Los limites entre OTBs son solo indicativas:no corresponden a los limites oficiales, ya que no existen mapas oficiales y que hay conflictosde terreno entre las OTBs.
106
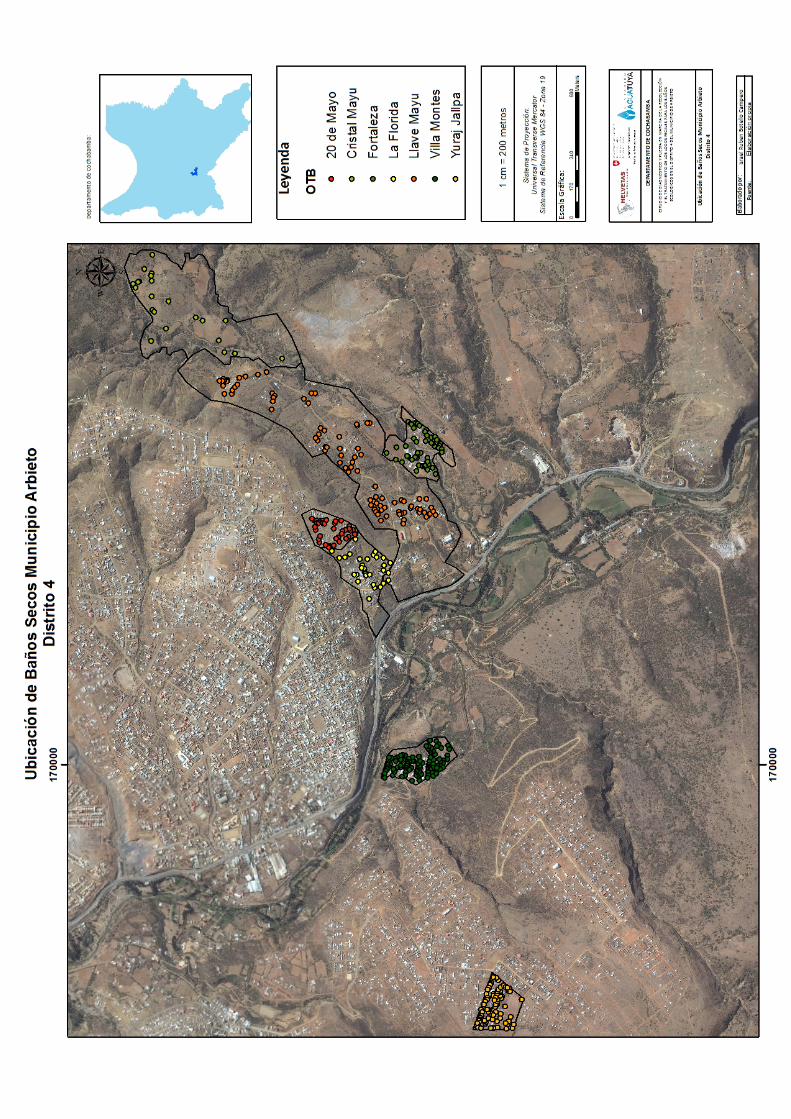
APPENDIX C
Caracteristicas de los actores principales
Para cada actor clave, se resumen (adaptado de [19]):
� el implicacion: el rol del actor
� los intereses: la motivacion del actor para participar en el proyecto
� los fortalezas: caracterısticas del actor beneficiaras al exito del proyecto
� los debilidades: caracterısticas del actor potencialmente danables al exito del proyecto
� los oportunidades: perspectivas positivas del proyecto para el actor1
� los amenazas: perspectivas negativas del proyecto para el actor
� el impacto: el tipo de influencia que el proyecto puede tener sobre el actor
1En [19], se refiere a las oportunidades para el proyecto. Sin obstante, en nuestro caso es mas interesanteidentificar las oportunidades para el actor; las oportunidades para el proyecto (si hay) estan parte de lasfortalezas. El mismo comentario se aplica a las amenazas.
108
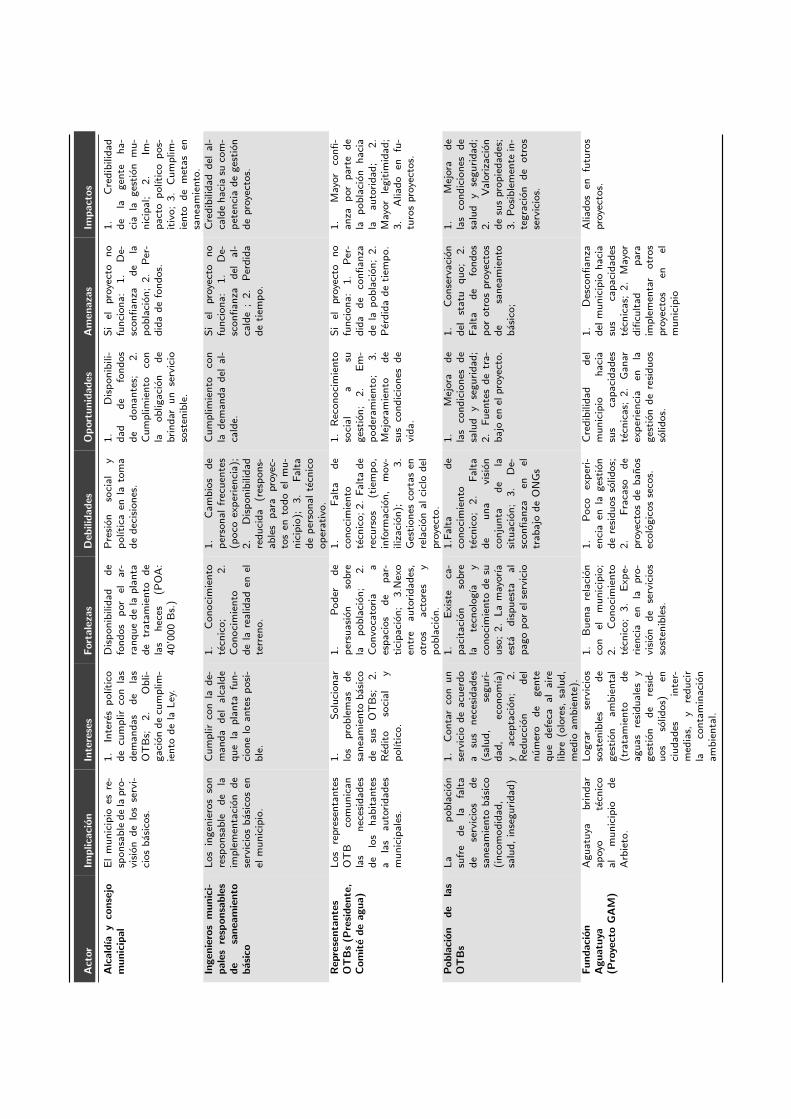
Act
or
Imp
lica
cio
nIn
tere
ses
Fo
rta
leza
sD
ebili
da
des
Op
ort
un
ida
des
Am
ena
zas
Imp
act
os
Alc
ald
ıay
con
sejo
mu
nic
ipa
lE
lm
un
icip
ioes
re-
spo
nsa
ble
de
lap
ro-
visi
on
de
los
serv
i-ci
os
ba
sico
s.
1.
Inte
res
po
lıti
cod
ecu
mp
lir
con
las
dem
an
da
sd
ela
sO
TB
s;2
.O
bli-
ga
cio
nd
ecu
mp
lim
-ie
nto
de
laL
ey.
Dis
po
nib
ilid
ad
de
fon
do
sp
orel
ar-
ran
qu
ed
ela
pla
nta
de
tra
tam
ien
tod
ela
sh
eces
(PO
A:
40
’00
0B
s.)
Pre
sio
nso
cia
ly
po
lıti
caen
lato
ma
de
dec
isio
nes
.
1.
Dis
po
nib
ili-
da
dd
efo
nd
os
de
do
na
nte
s;2
.C
um
plim
ien
toco
nla
ob
lig
aci
on
de
bri
nd
aru
nse
rvic
ioso
sten
ible
.
Si
elp
roye
cto
no
fun
cio
na
:1
.D
e-sc
on
fia
nza
de
lap
ob
laci
on
;2
.P
er-
did
ad
efo
nd
os.
1.
Cre
dib
ilid
ad
de
lag
ente
ha
-ci
ala
ges
tio
nm
u-
nic
ipa
l;2
.Im
-p
act
op
olı
tico
po
s-it
ivo
;3
.C
um
plim
-ie
nto
de
met
as
ensa
nea
mie
nto
.In
gen
iero
sm
un
ici-
pa
les
resp
on
sab
les
de
san
eam
ien
tob
asi
co
Lo
sin
gen
iero
sso
nre
spo
nsa
ble
de
laim
ple
men
taci
on
de
serv
icio
sb
asi
cos
enel
mu
nic
ipio
.
Cu
mp
lir
con
lad
e-m
an
da
del
alc
ald
eq
ue
lap
lan
tafu
n-
cio
ne
loa
nte
sp
osi
-b
le.
1.
Co
no
cim
ien
tote
cnic
o;
2.
Co
no
cim
ien
tod
ela
rea
lid
ad
enel
terr
eno
.
1.
Ca
mb
ios
de
per
son
al
frec
uen
tes
(po
coex
per
ien
cia
);2
.D
isp
on
ibilid
ad
red
uci
da
(res
po
ns-
ab
les
par
ap
roye
c-to
sen
tod
oel
mu
-n
icip
io);
3.
Fa
lta
de
per
son
al
tecn
ico
op
era
tivo
.
Cu
mp
lim
ien
toco
nla
dem
an
da
del
al-
cald
e.
Si
elp
roye
cto
no
fun
cio
na
:1
.D
e-sc
on
fia
nza
del
al-
cald
e;
2.
Per
did
ad
eti
emp
o.
Cre
dib
ilid
ad
del
al-
cald
eh
aci
asu
com
-p
eten
cia
de
ges
tio
nd
ep
roye
cto
s.
Rep
rese
nta
nte
sO
TB
s(P
resi
den
te,
Co
mit
ed
ea
gu
a)
Lo
sre
pre
sen
tan
tes
OT
Bco
mu
nic
an
las
nec
esid
ad
esd
elo
sh
ab
ita
nte
sa
las
au
tori
da
des
mu
nic
ipa
les.
1.
So
luci
on
arlo
sp
rob
lem
as
de
san
eam
ien
tob
asi
cod
esu
sO
TB
s;2
.R
edit
oso
cia
ly
po
lıti
co.
1.
Po
der
de
per
sua
sio
nso
bre
lap
ob
laci
on
;2
.C
on
voca
tori
aa
esp
aci
os
de
par
-ti
cip
aci
on
;3
.Nex
oen
tre
au
tori
da
des
,o
tro
sa
ctor
esy
po
bla
cio
n.
1.
Fa
lta
de
con
oci
mie
nto
tecn
ico
;2
.F
alt
ad
ere
curs
os
(tie
mp
o,
info
rma
cio
n,
mo
v-iliz
aci
on
);3
.G
esti
on
esco
rta
sen
rela
cio
na
lci
clo
del
pro
yect
o.
1.
Rec
on
oci
mie
nto
soci
al
asu
ges
tio
n;
2.
Em
-p
od
era
mie
nto
;3
.M
ejor
am
ien
tod
esu
sco
nd
icio
nes
de
vid
a.
Si
elp
roye
cto
no
fun
cio
na
:1
.P
er-
did
ad
eco
nfi
an
zad
ela
po
bla
cio
n;
2.
Per
did
ad
eti
emp
o.
1.
May
orco
nfi
-a
nza
por
par
ted
ela
po
bla
cio
nh
aci
ala
au
tori
da
d;
2.
May
orle
git
imid
ad
;3
.A
lia
do
enfu
-tu
ros
pro
yect
os.
Po
bla
cio
nd
ela
sO
TB
sL
ap
ob
laci
on
sufr
ed
ela
falt
ad
ese
rvic
ios
de
san
eam
ien
tob
asi
co(i
nco
mo
did
ad
,sa
lud
,in
seg
uri
da
d)
1.
Co
nta
rco
nu
nse
rvic
iod
ea
cuer
do
asu
sn
eces
ida
des
(sa
lud
,se
gu
ri-
da
d,
eco
no
mıa
)y
ace
pta
cio
n;
2.
Red
ucc
ion
del
nu
mer
od
eg
ente
qu
ed
efec
aa
la
ire
lib
re(o
lore
s,sa
lud
,m
edio
am
bie
nte
).
1.
Exi
ste
ca-
pa
cita
cio
nso
bre
late
cno
log
ıay
con
oci
mie
nto
de
suu
so;
2.
La
may
orıa
esta
dis
pu
esta
al
pa
go
por
else
rvic
io
1.F
alt
ad
eco
no
cim
ien
tote
cnic
o;
2.
Fa
lta
de
un
avi
sio
nco
nju
nta
de
lasi
tua
cio
n;
3.
De-
sco
nfi
an
zaen
eltr
ab
ajo
de
ON
Gs
1.
Mej
ora
de
las
con
dic
ion
esd
esa
lud
yse
gu
rid
ad
;2
.F
uen
tes
de
tra
-b
ajo
enel
pro
yect
o.
1.
Co
nse
rva
cio
nd
elst
atu
qu
o;
2.
Fa
lta
de
fon
do
sp
oro
tro
sp
roye
cto
sd
esa
nea
mie
nto
ba
sico
;
1.
Mej
ora
de
las
con
dic
ion
esd
esa
lud
yse
gu
rid
ad
;2
.V
alo
riza
cio
nd
esu
sp
rop
ied
ad
es;
3.
Po
sib
lem
ente
in-
teg
raci
on
de
otr
os
serv
icio
s.
Fu
nd
aci
on
Ag
ua
tuya
(Pro
yect
oG
AM
)
Ag
ua
tuya
bri
nd
ara
poy
ote
cnic
oa
lm
un
icip
iod
eA
rbie
to.
Lo
gra
rse
rvic
ios
sost
enib
les
de
ges
tio
na
mb
ien
tal
(tra
tam
ien
tod
ea
gu
as
resi
du
ale
sy
ges
tio
nd
ere
sid
-u
os
solid
os)
enci
ud
ad
esin
ter-
med
ias,
yre
du
cir
laco
nta
min
aci
on
am
bie
nta
l.
1.
Bu
ena
rela
cio
nco
nel
mu
nic
ipio
;2
.C
on
oci
mie
nto
tecn
ico
;3
.E
xpe-
rien
cia
enla
pro
-vi
sio
nd
ese
rvic
ios
sost
enib
les.
1.
Po
coex
per
i-en
cia
enla
ges
tio
nd
ere
sid
uo
sso
lid
os;
2.
Fra
caso
de
pro
yect
os
de
ba
no
sec
olo
gic
os
seco
s.
Cre
dib
ilid
ad
del
mu
nic
ipio
ha
cia
sus
cap
aci
da
des
tecn
ica
s;2
.G
an
arex
per
ien
cia
enla
ges
tio
nd
ere
sid
uo
sso
lid
os.
1.
Des
con
fia
nza
del
mu
nic
ipio
ha
cia
sus
cap
aci
da
des
tecn
ica
s;2
.M
ayor
difi
cult
ad
par
aim
ple
men
tar
otr
os
pro
yect
os
enel
mu
nic
ipio
Alia
do
sen
futu
ros
pro
yect
os.
APPENDIXD
Tratamiento de datos y pruebas estadısticas
En este apendice, se presentan algunas explicaciones sobre el tratamiento de datos y losmetodos estadısticos utilizados (diagramas de caja, prueba de significacion de Kruskal-Wallis,correlacion de Pearson).
1. Tratamiento de datos
� Se corrigieron las respuestas donde los interrogadores manifiestamente se equivocaroncuando hicieron la cruz (por ejemplo marcaron que el encuestado no sabe cuanto aguase usa en el hogar, pero dieron un valor de consumo).
� Tambien se corrigieron las respuestas donde los interrogadores manifiestamente mecomprendieronlas respuestas. Por ejemplo, en Fortaleza, muchos encuestados respondieron que sufuente de agua es un pozo (pozo de la OTB) y los interrogadores marcaron pozo(privado).
� No se corrigieron las respuestas para las cuales los encuestados posiblemente mecomprendieronlas preguntas. Algunas respuestas no tienen sentido a primera vista, pero a veces hayuna explicacion concluyente. Por ejemplo, un encuestado estaba muy satisfecho dela situacion de agua y muy insatisfecho de la situacion de banos y de basura. Sinobstante, su prioridad de intervencion era el suministro de agua, porque estaba satis-fecho del suministro en su caso personal (tenıa un tanque de 12’000L), pero a nivelde la OTB le parecıa el problema el mas urgente.
� Para algunas preguntas abiertas (por ejemplo las razones para dejar de usar el banos),la respuestas posteriormente se clasificaron en diferentes categorıas
110
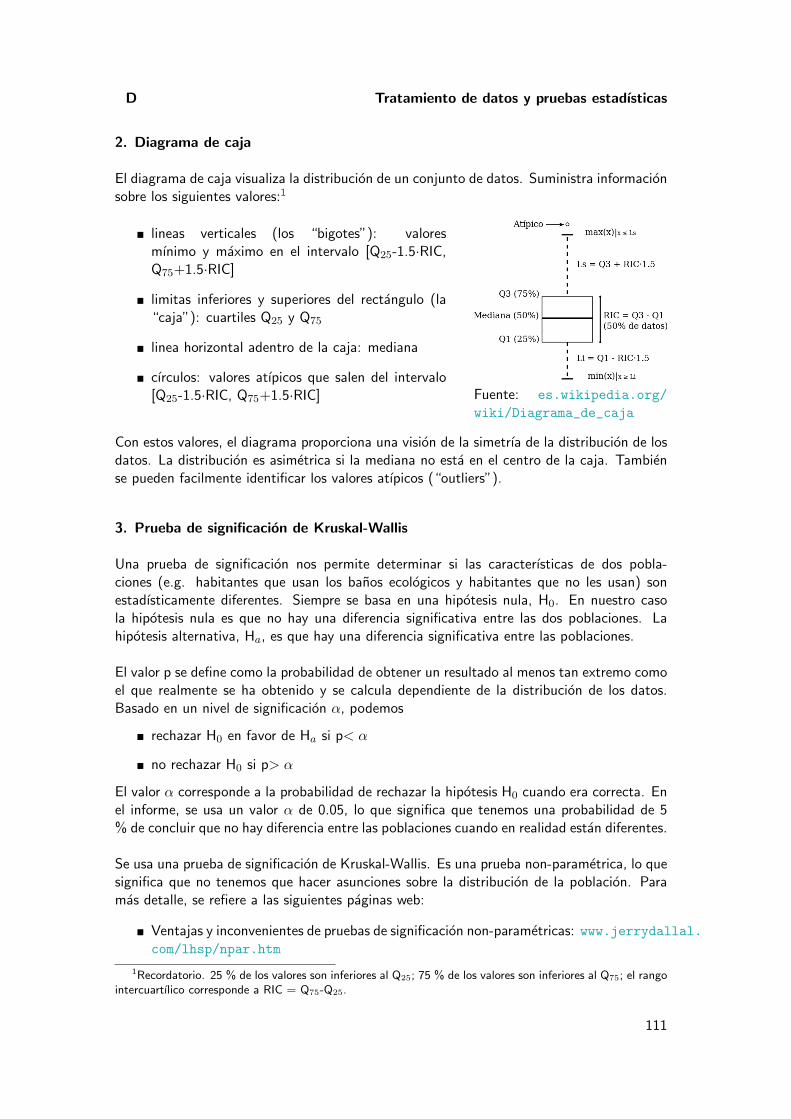
D Tratamiento de datos y pruebas estadısticas
2. Diagrama de caja
El diagrama de caja visualiza la distribucion de un conjunto de datos. Suministra informacionsobre los siguientes valores:1
� lineas verticales (los “bigotes”): valoresmınimo y maximo en el intervalo [Q25-1.5·RIC,Q75+1.5·RIC]
� limitas inferiores y superiores del rectangulo (la“caja”): cuartiles Q25 y Q75
� linea horizontal adentro de la caja: mediana
� cırculos: valores atıpicos que salen del intervalo[Q25-1.5·RIC, Q75+1.5·RIC] Fuente: es.wikipedia.org/
wiki/Diagrama_de_caja
Con estos valores, el diagrama proporciona una vision de la simetrıa de la distribucion de losdatos. La distribucion es asimetrica si la mediana no esta en el centro de la caja. Tambiense pueden facilmente identificar los valores atıpicos (“outliers”).
3. Prueba de significacion de Kruskal-Wallis
Una prueba de significacion nos permite determinar si las caracterısticas de dos pobla-ciones (e.g. habitantes que usan los banos ecologicos y habitantes que no les usan) sonestadısticamente diferentes. Siempre se basa en una hipotesis nula, H0. En nuestro casola hipotesis nula es que no hay una diferencia significativa entre las dos poblaciones. Lahipotesis alternativa, Ha, es que hay una diferencia significativa entre las poblaciones.
El valor p se define como la probabilidad de obtener un resultado al menos tan extremo comoel que realmente se ha obtenido y se calcula dependiente de la distribucion de los datos.Basado en un nivel de significacion α, podemos
� rechazar H0 en favor de Ha si p< α
� no rechazar H0 si p> α
El valor α corresponde a la probabilidad de rechazar la hipotesis H0 cuando era correcta. Enel informe, se usa un valor α de 0.05, lo que significa que tenemos una probabilidad de 5% de concluir que no hay diferencia entre las poblaciones cuando en realidad estan diferentes.
Se usa una prueba de significacion de Kruskal-Wallis. Es una prueba non-parametrica, lo quesignifica que no tenemos que hacer asunciones sobre la distribucion de la poblacion. Paramas detalle, se refiere a las siguientes paginas web:
� Ventajas y inconvenientes de pruebas de significacion non-parametricas: www.jerrydallal.com/lhsp/npar.htm
1Recordatorio. 25 % de los valores son inferiores al Q25; 75 % de los valores son inferiores al Q75; el rangointercuartılico corresponde a RIC = Q75-Q25.
111
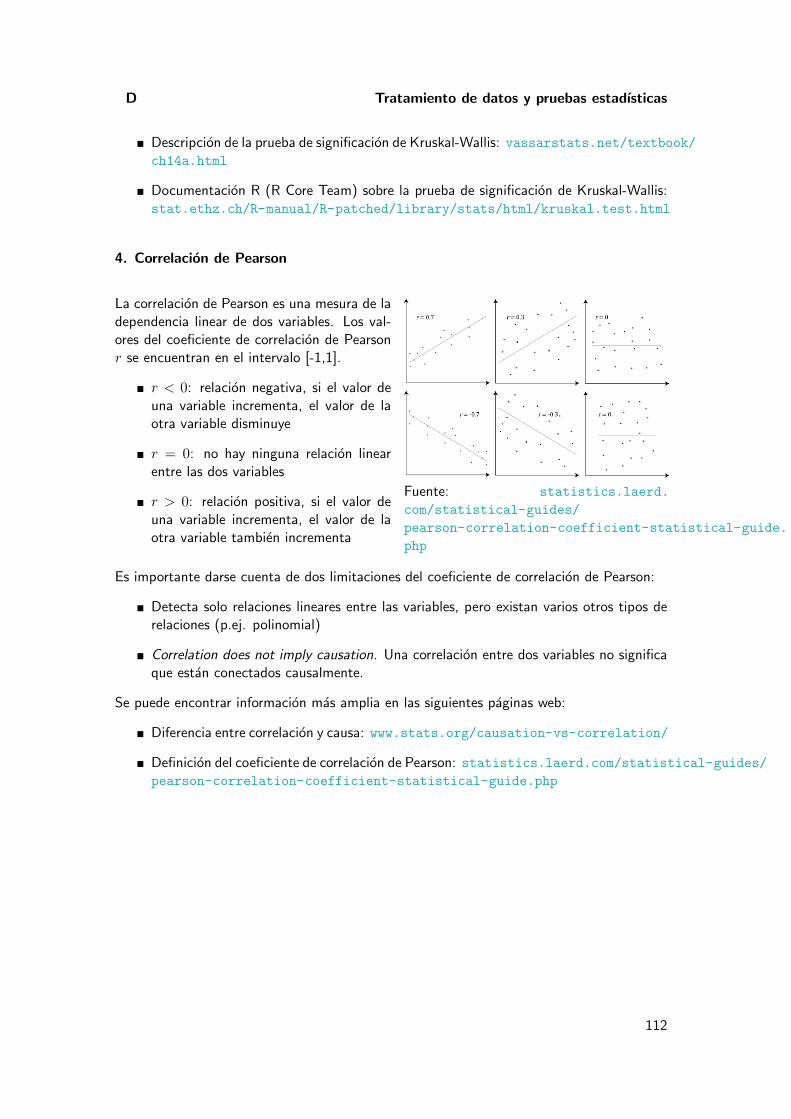
D Tratamiento de datos y pruebas estadısticas
� Descripcion de la prueba de significacion de Kruskal-Wallis: vassarstats.net/textbook/ch14a.html
� Documentacion R (R Core Team) sobre la prueba de significacion de Kruskal-Wallis:stat.ethz.ch/R-manual/R-patched/library/stats/html/kruskal.test.html
4. Correlacion de Pearson
La correlacion de Pearson es una mesura de ladependencia linear de dos variables. Los val-ores del coeficiente de correlacion de Pearsonr se encuentran en el intervalo [-1,1].
� r < 0: relacion negativa, si el valor deuna variable incrementa, el valor de laotra variable disminuye
� r = 0: no hay ninguna relacion linearentre las dos variables
� r > 0: relacion positiva, si el valor deuna variable incrementa, el valor de laotra variable tambien incrementa
Fuente: statistics.laerd.
com/statistical-guides/
pearson-correlation-coefficient-statistical-guide.
php
Es importante darse cuenta de dos limitaciones del coeficiente de correlacion de Pearson:
� Detecta solo relaciones lineares entre las variables, pero existan varios otros tipos derelaciones (p.ej. polinomial)
� Correlation does not imply causation. Una correlacion entre dos variables no significaque estan conectados causalmente.
Se puede encontrar informacion mas amplia en las siguientes paginas web:
� Diferencia entre correlacion y causa: www.stats.org/causation-vs-correlation/
� Definicion del coeficiente de correlacion de Pearson: statistics.laerd.com/statistical-guides/pearson-correlation-coefficient-statistical-guide.php
112
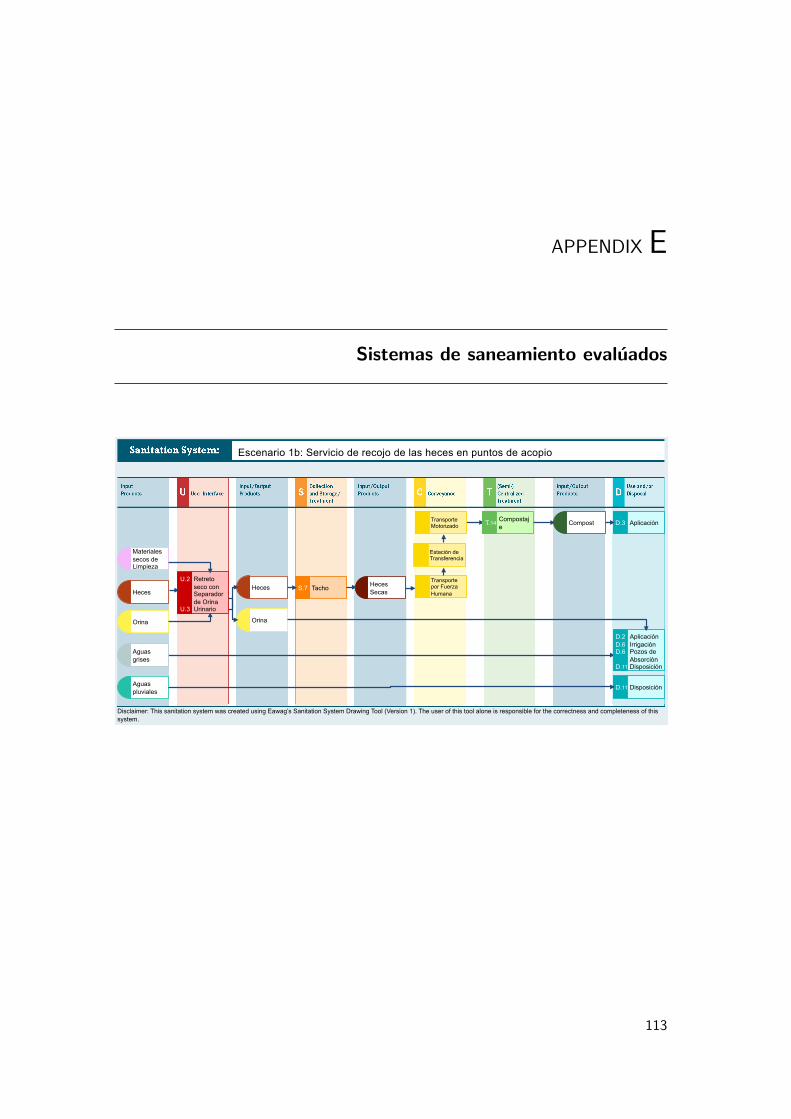
APPENDIX E
Sistemas de saneamiento evaluados
Disclaimer: This sanitation system was created using Eawag’s Sanitation System Drawing Tool (Version 1). The user of this tool alone is responsible for the correctness and completeness of this system.
Disclaimer: This sanitation system was created using Eawag’s Sanitation System Drawing Tool (Version 1). The user of this tool alone is responsible for the correctness and completeness of this system.
Heces
Orina
Escenario 1b: Servicio de recojo de las heces en puntos de acopio
Materiales secos de Limpieza
Aguas grises
Aguas pluviales
D.3 Aplicación
D.2 D.6 D.6
D.11
Aplicación Irrigación Pozos de Absorción Disposición
D.11 Disposición
Estación de Transferencia
Retreto seco con Separador de Orina Urinario
U.2
U.3
Heces
Orina
Tacho S.7 Heces Secas
T.14 Compostaje Compost
Transporte por Fuerza Humana
Transporte Motorizado
113
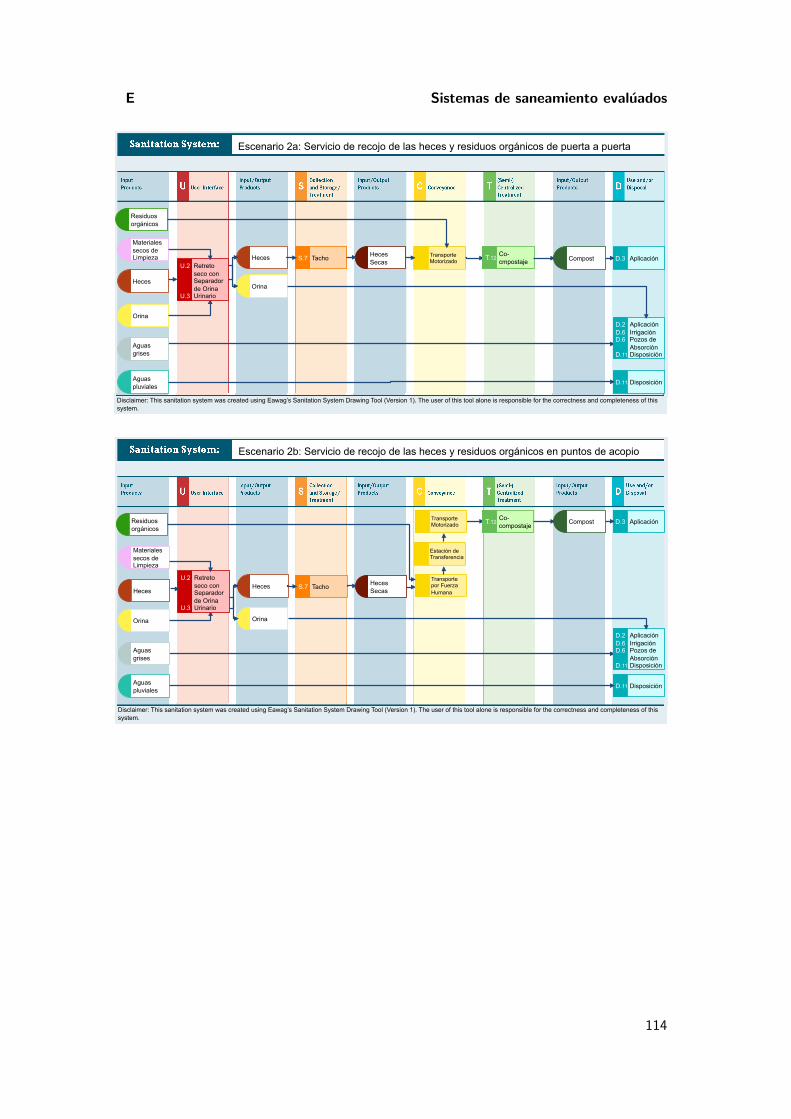
E Sistemas de saneamiento evaluados
Disclaimer: This sanitation system was created using Eawag’s Sanitation System Drawing Tool (Version 1). The user of this tool alone is responsible for the correctness and completeness of this system.
Disclaimer: This sanitation system was created using Eawag’s Sanitation System Drawing Tool (Version 1). The user of this tool alone is responsible for the correctness and completeness of this system.
Heces
Orina
Escenario 2a: Servicio de recojo de las heces y residuos orgánicos de puerta a puerta
Materiales secos de Limpieza
Aguas grises
Aguas pluviales
D.3 Aplicación
D.2 D.6 D.6
D.11
Aplicación Irrigación Pozos de Absorción Disposición
D.11 Disposición
Transporte Motorizado
Retreto seco con Separador de Orina Urinario
U.2
U.3
Heces
Orina
Tacho S.7 Heces Secas
T.12 Co-cmpostaje Compost
Residuos orgánicos
Disclaimer: This sanitation system was created using Eawag’s Sanitation System Drawing Tool (Version 1). The user of this tool alone is responsible for the correctness and completeness of this system.
Disclaimer: This sanitation system was created using Eawag’s Sanitation System Drawing Tool (Version 1). The user of this tool alone is responsible for the correctness and completeness of this system.
Heces
Orina
Escenario 2b: Servicio de recojo de las heces y residuos orgánicos en puntos de acopio
Materiales secos de Limpieza
Aguas grises
Aguas pluviales
D.3 Aplicación
D.2 D.6 D.6
D.11
Aplicación Irrigación Pozos de Absorción Disposición
D.11 Disposición
Estación de Transferencia
Retreto seco con Separador de Orina Urinario
U.2
U.3
Heces
Orina
Tacho S.7 Heces Secas
T.12 Co-compostaje Compost
Transporte por Fuerza Humana
Transporte Motorizado Residuos
orgánicos
114
APPENDIX F
Opciones de cadenas de servicio, mantenimiento y tarifa
El documento resume todas las alternativas de las siguientes dimensiones del servicio:
1. Cadena de servicios
2. Mantenimiento
3. Tarifa
El documento sirvo de base para el desarrollo de los escenarios de servicio estudiados.Tambien es util para afinar los escenarios.
115
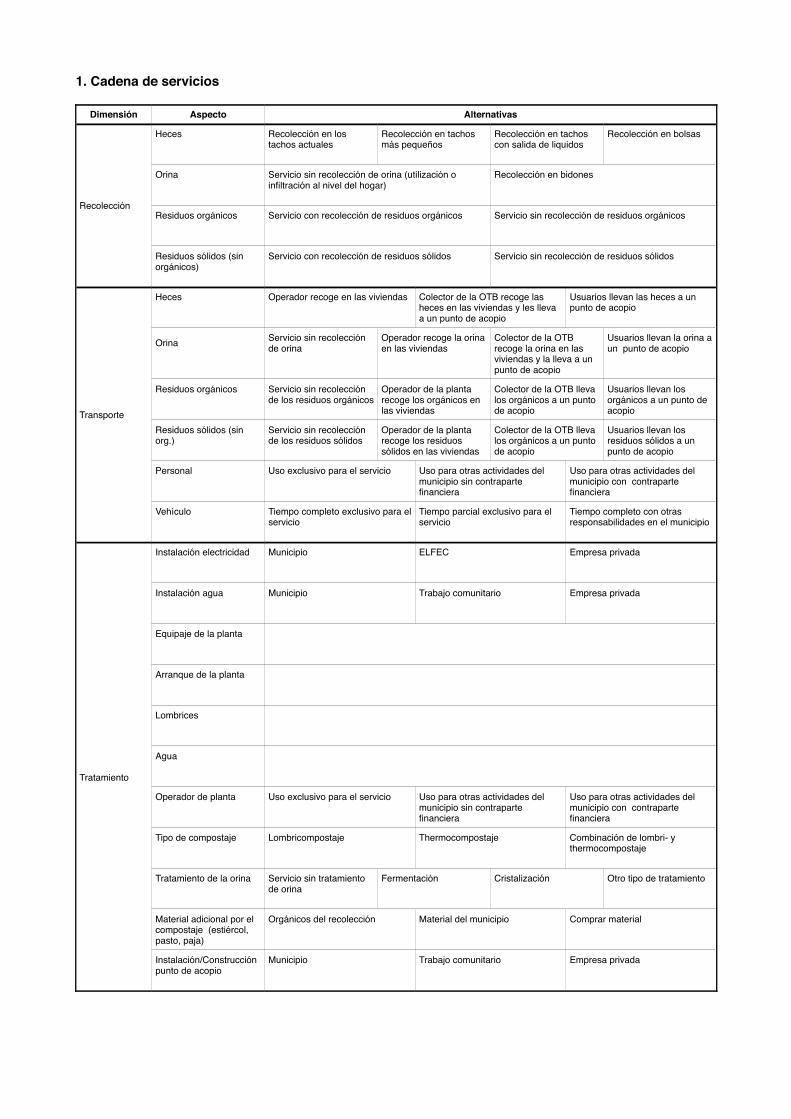
1. Cadena de servicios
Dimensión Aspecto Alternativas
Recolección
Heces Recolección en los tachos actuales
Recolección en tachos más pequeños
Recolección en tachos con salida de liquidos
Recolección en bolsas
Orina Servicio sin recolección de orina (utilización o infiltración al nivel del hogar)
Recolección en bidones
Residuos orgánicos Servicio con recolección de residuos orgánicos Servicio sin recolección de residuos orgánicos
Residuos sólidos (sin orgánicos)
Servicio con recolección de residuos sólidos Servicio sin recolección de residuos sólidos
Transporte
Heces Operador recoge en las viviendas Colector de la OTB recoge las heces en las viviendas y les lleva a un punto de acopio
Usuarios llevan las heces a un punto de acopio
Orina Servicio sin recolección de orina
Operador recoge la orina en las viviendas
Colector de la OTB recoge la orina en las viviendas y la lleva a un punto de acopio
Usuarios llevan la orina a un punto de acopio
Residuos orgánicos Servicio sin recolección de los residuos orgánicos
Operador de la planta recoge los orgánicos en las viviendas
Colector de la OTB lleva los orgánicos a un punto de acopio
Usuarios llevan los orgánicos a un punto de acopio
Residuos sólidos (sin org.)
Servicio sin recolección de los residuos sólidos
Operador de la planta recoge los residuos sólidos en las viviendas
Colector de la OTB lleva los orgánicos a un punto de acopio
Usuarios llevan los residuos sólidos a un punto de acopio
Personal Uso exclusivo para el servicio Uso para otras actividades del municipio sin contraparte financiera
Uso para otras actividades del municipio con contraparte financiera
Vehículo Tiempo completo exclusivo para el servicio
Tiempo parcial exclusivo para el servicio
Tiempo completo con otras responsabilidades en el municipio
Tratamiento
Instalación electricidad Municipio ELFEC Empresa privada
Instalación agua Municipio Trabajo comunitario Empresa privada
Equipaje de la planta
Arranque de la planta
Lombrices
Agua
Operador de planta Uso exclusivo para el servicio Uso para otras actividades del municipio sin contraparte financiera
Uso para otras actividades del municipio con contraparte financiera
Tipo de compostaje Lombricompostaje Thermocompostaje Combinación de lombri- y thermocompostaje
Tratamiento de la orina Servicio sin tratamiento de orina
Fermentación Cristalización Otro tipo de tratamiento
Material adicional por el compostaje (estiércol, pasto, paja)
Orgánicos del recolección Material del municipio Comprar material
Instalación/Construcción punto de acopio
Municipio Trabajo comunitario Empresa privada
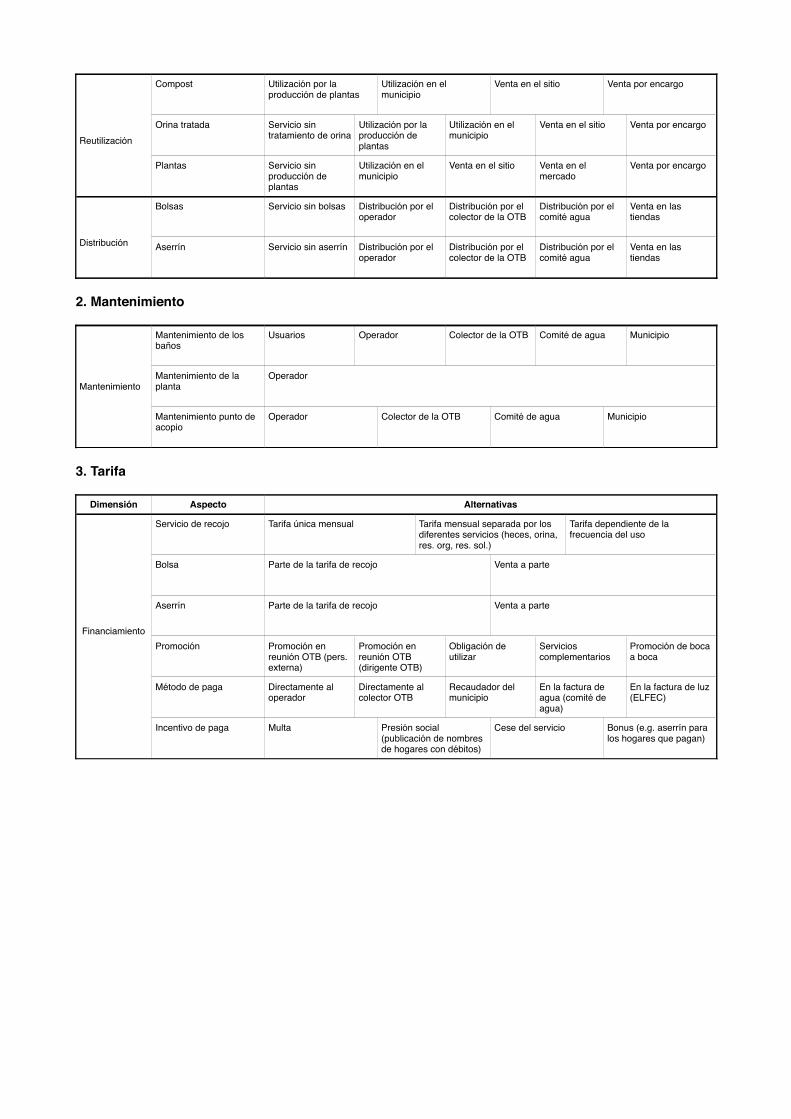
Reutilización
Compost Utilización por la producción de plantas
Utilización en el municipio
Venta en el sitio Venta por encargo
Orina tratada Servicio sin tratamiento de orina
Utilización por la producción de plantas
Utilización en el municipio
Venta en el sitio Venta por encargo
Plantas Servicio sin producción de plantas
Utilización en el municipio
Venta en el sitio Venta en el mercado
Venta por encargo
Distribución
Bolsas Servicio sin bolsas Distribución por el operador
Distribución por el colector de la OTB
Distribución por el comité agua
Venta en las tiendas
Aserrín Servicio sin aserrín Distribución por el operador
Distribución por el colector de la OTB
Distribución por el comité agua
Venta en las tiendas
2. Mantenimiento
Mantenimiento
Mantenimiento de los baños
Usuarios Operador Colector de la OTB Comité de agua Municipio
Mantenimiento de la planta
Operador
Mantenimiento punto de acopio
Operador Colector de la OTB Comité de agua Municipio
3. Tarifa
Dimensión Aspecto Alternativas
Financiamiento
Servicio de recojo Tarifa única mensual Tarifa mensual separada por los diferentes servicios (heces, orina, res. org, res. sol.)
Tarifa dependiente de la frecuencia del uso
Bolsa Parte de la tarifa de recojo Venta a parte
Aserrín Parte de la tarifa de recojo Venta a parte
Promoción Promoción en reunión OTB (pers. externa)
Promoción en reunión OTB (dirigente OTB)
Obligación de utilizar
Servicios complementarios
Promoción de boca a boca
Método de paga Directamente al operador
Directamente al colector OTB
Recaudador del municipio
En la factura de agua (comité de agua)
En la factura de luz (ELFEC)
Incentivo de paga Multa Presión social (publicación de nombres de hogares con débitos)
Cese del servicio Bonus (e.g. aserrín para los hogares que pagan)
APPENDIX G
Modelos organizacionales
Los modelos organizacionales resumen como planificamos servir a nuestros clientes. Lespresentamos desde el punto de visto del proveedor de servicios, que en nuestro caso es laUnidad de Saneamiento Basico (USB) del Municipio de Arbieto. Es un buen ejercicio paraverificar que el servicio propuesto realmente tiene un valor para cada segmento de clientes.Por ejemplo, contemplamos proveer un servicio de recojo de los residuos organicos, pero nosdamos cuenta que no tenıa una propuesta de valor para los hogares, ya que la disposicionde los organicos no realmente es una preocupacion de la poblacion (es principalmente ladisposicion de los plasticos y papeles que resulta problematica).
118
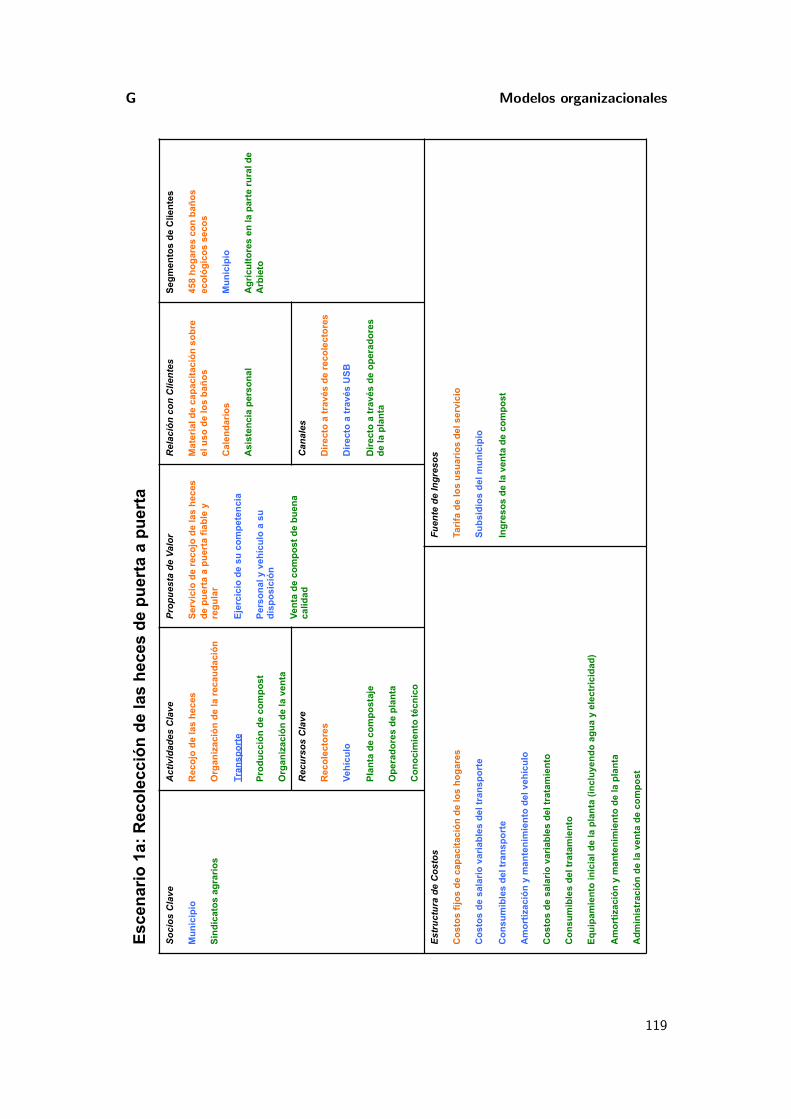
G Modelos organizacionales
Soc
ios
Cla
ve
Mun
icip
io
Sind
icat
os a
grar
ios
Act
ivid
ades
Cla
ve
Rec
ojo
de la
s he
ces
Org
aniz
ació
n de
la re
caud
ació
n
Tran
spor
te
Prod
ucci
ón d
e co
mpo
st
Org
aniz
ació
n de
la v
enta
Pro
pues
ta d
e V
alor
Serv
icio
de
reco
jo d
e la
s he
ces
de p
uert
a a
puer
ta fi
able
y
regu
lar
Ejer
cici
o de
su
com
pete
ncia
Pers
onal
y v
ehíc
ulo
a su
di
spos
ició
n
Vent
a de
com
post
de
buen
a ca
lidad
Rel
ació
n co
n C
lient
es
Mat
eria
l de
capa
cita
ción
sob
re
el u
so d
e lo
s ba
ños
Cal
enda
rios
Asi
sten
cia
pers
onal
Segm
ento
s de
Clie
ntes
458
hoga
res
con
baño
s ec
ológ
icos
sec
os
Mun
icip
io
Agr
icul
tore
s en
la p
arte
rura
l de
Arb
ieto
Rec
urso
s C
lave
Rec
olec
tore
s
Vehí
culo
Plan
ta d
e co
mpo
staj
e
Ope
rado
res
de p
lant
a
Con
ocim
ient
o té
cnic
o
Can
ales
Dire
cto
a tr
avés
de
reco
lect
ores
Dire
cto
a tr
avés
USB
Dire
cto
a tr
avés
de
oper
ador
es
de la
pla
nta
Est
ruct
ura
de C
osto
s
Cos
tos
fijos
de
capa
cita
ción
de
los
hoga
res
Cos
tos
de s
alar
io v
aria
bles
del
tran
spor
te
Con
sum
ible
s de
l tra
nspo
rte
Am
ortiz
ació
n y
man
teni
mie
nto
del v
ehíc
ulo
Cos
tos
de s
alar
io v
aria
bles
del
trat
amie
nto
Con
sum
ible
s de
l tra
tam
ient
o
Equi
pam
ient
o in
icia
l de
la p
lant
a (in
cluy
endo
agu
a y
elec
tric
idad
)
Am
ortiz
ació
n y
man
teni
mie
nto
de la
pla
nta
Adm
inis
trac
ión
de la
ven
ta d
e co
mpo
st
Fuen
te d
e In
gres
os
Tarif
a de
los
usua
rios
del s
ervi
cio
Subs
idio
s de
l mun
icip
io
Ingr
esos
de
la v
enta
de
com
post
Esce
nario
1a:
Rec
olec
ción
de
las
hece
s de
pue
rta
a pu
erta
119
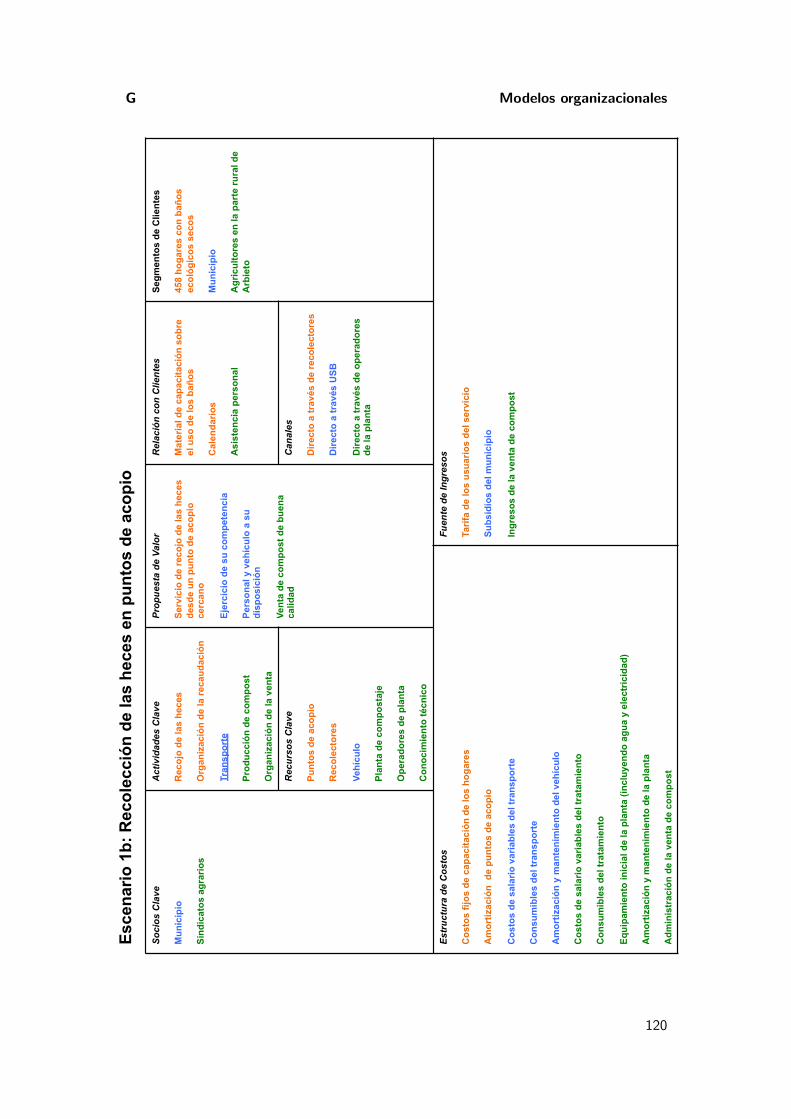
G Modelos organizacionales
Soc
ios
Cla
ve
Mun
icip
io
Sind
icat
os a
grar
ios
Act
ivid
ades
Cla
ve
Rec
ojo
de la
s he
ces
Org
aniz
ació
n de
la re
caud
ació
n
Tran
spor
te
Prod
ucci
ón d
e co
mpo
st
Org
aniz
ació
n de
la v
enta
Pro
pues
ta d
e V
alor
Serv
icio
de
reco
jo d
e la
s he
ces
desd
e un
pun
to d
e ac
opio
ce
rcan
o
Ejer
cici
o de
su
com
pete
ncia
Pers
onal
y v
ehíc
ulo
a su
di
spos
ició
n
Vent
a de
com
post
de
buen
a ca
lidad
Rel
ació
n co
n C
lient
es
Mat
eria
l de
capa
cita
ción
sob
re
el u
so d
e lo
s ba
ños
Cal
enda
rios
Asi
sten
cia
pers
onal
Segm
ento
s de
Clie
ntes
458
hoga
res
con
baño
s ec
ológ
icos
sec
os
Mun
icip
io
Agr
icul
tore
s en
la p
arte
rura
l de
Arb
ieto
Rec
urso
s C
lave
Punt
os d
e ac
opio
Rec
olec
tore
s
Vehí
culo
Plan
ta d
e co
mpo
staj
e
Ope
rado
res
de p
lant
a
Con
ocim
ient
o té
cnic
o
Can
ales
Dire
cto
a tr
avés
de
reco
lect
ores
Dire
cto
a tr
avés
USB
Dire
cto
a tr
avés
de
oper
ador
es
de la
pla
nta
Est
ruct
ura
de C
osto
s
Cos
tos
fijos
de
capa
cita
ción
de
los
hoga
res
Am
ortiz
ació
n d
e pu
ntos
de
acop
io
Cos
tos
de s
alar
io v
aria
bles
del
tran
spor
te
Con
sum
ible
s de
l tra
nspo
rte
Am
ortiz
ació
n y
man
teni
mie
nto
del v
ehíc
ulo
Cos
tos
de s
alar
io v
aria
bles
del
trat
amie
nto
Con
sum
ible
s de
l tra
tam
ient
o
Equi
pam
ient
o in
icia
l de
la p
lant
a (in
cluy
endo
agu
a y
elec
tric
idad
)
Am
ortiz
ació
n y
man
teni
mie
nto
de la
pla
nta
Adm
inis
trac
ión
de la
ven
ta d
e co
mpo
st
Fuen
te d
e In
gres
os
Tarif
a de
los
usua
rios
del s
ervi
cio
Subs
idio
s de
l mun
icip
io
Ingr
esos
de
la v
enta
de
com
post
Esce
nario
1b:
Rec
olec
ción
de
las
hece
s en
pun
tos
de a
copi
o
120
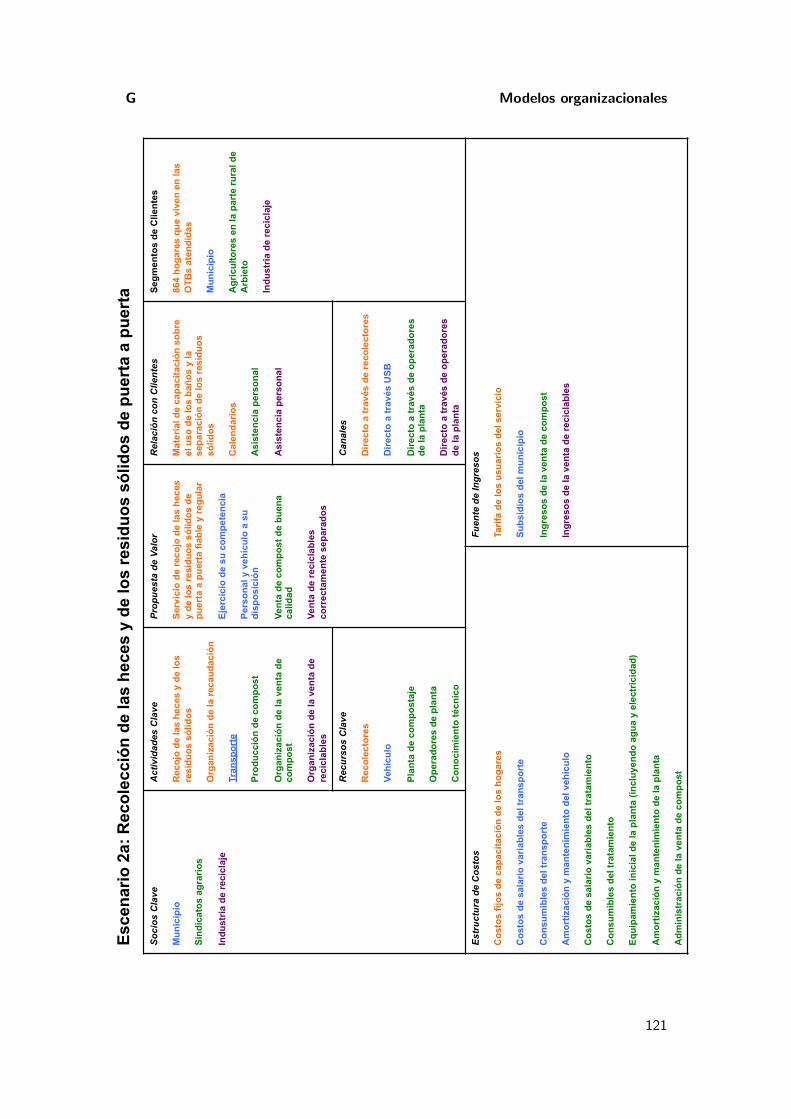
G Modelos organizacionales
Soc
ios
Cla
ve
Mun
icip
io
Sind
icat
os a
grar
ios
Indu
stria
de
reci
claj
e
Act
ivid
ades
Cla
ve
Rec
ojo
de la
s he
ces
y de
los
resi
duos
sól
idos
Org
aniz
ació
n de
la re
caud
ació
n
Tran
spor
te
Prod
ucci
ón d
e co
mpo
st
Org
aniz
ació
n de
la v
enta
de
com
post
Org
aniz
ació
n de
la v
enta
de
reci
clab
les
Pro
pues
ta d
e V
alor
Serv
icio
de
reco
jo d
e la
s he
ces
y de
los
resi
duos
sól
idos
de
puer
ta a
pue
rta
fiabl
e y
regu
lar
Ejer
cici
o de
su
com
pete
ncia
Pers
onal
y v
ehíc
ulo
a su
di
spos
ició
n
Vent
a de
com
post
de
buen
a ca
lidad
Vent
a de
reci
clab
les
corr
ecta
men
te s
epar
ados
Rel
ació
n co
n C
lient
es
Mat
eria
l de
capa
cita
ción
sob
re
el u
so d
e lo
s ba
ños
y la
se
para
ción
de
los
resi
duos
só
lidos
Cal
enda
rios
Asi
sten
cia
pers
onal
Asi
sten
cia
pers
onal
Segm
ento
s de
Clie
ntes
864
hoga
res
que
vive
n en
las
OTB
s at
endi
das
Mun
icip
io
Agr
icul
tore
s en
la p
arte
rura
l de
Arb
ieto
Indu
stria
de
reci
claj
e
Rec
urso
s C
lave
Rec
olec
tore
s
Vehí
culo
Plan
ta d
e co
mpo
staj
e
Ope
rado
res
de p
lant
a
Con
ocim
ient
o té
cnic
o
Can
ales
Dire
cto
a tr
avés
de
reco
lect
ores
Dire
cto
a tr
avés
USB
Dire
cto
a tr
avés
de
oper
ador
es
de la
pla
nta
Dire
cto
a tr
avés
de
oper
ador
es
de la
pla
nta
Est
ruct
ura
de C
osto
s
Cos
tos
fijos
de
capa
cita
ción
de
los
hoga
res
Cos
tos
de s
alar
io v
aria
bles
del
tran
spor
te
Con
sum
ible
s de
l tra
nspo
rte
Am
ortiz
ació
n y
man
teni
mie
nto
del v
ehíc
ulo
Cos
tos
de s
alar
io v
aria
bles
del
trat
amie
nto
Con
sum
ible
s de
l tra
tam
ient
o
Equi
pam
ient
o in
icia
l de
la p
lant
a (in
cluy
endo
agu
a y
elec
tric
idad
)
Am
ortiz
ació
n y
man
teni
mie
nto
de la
pla
nta
Adm
inis
trac
ión
de la
ven
ta d
e co
mpo
st
Fuen
te d
e In
gres
os
Tarif
a de
los
usua
rios
del s
ervi
cio
Subs
idio
s de
l mun
icip
io
Ingr
esos
de
la v
enta
de
com
post
Ingr
esos
de
la v
enta
de
reci
clab
les
Esce
nario
2a:
Rec
olec
ción
de
las
hece
s y
de lo
s re
sidu
os s
ólid
os d
e pu
erta
a p
uert
a
121
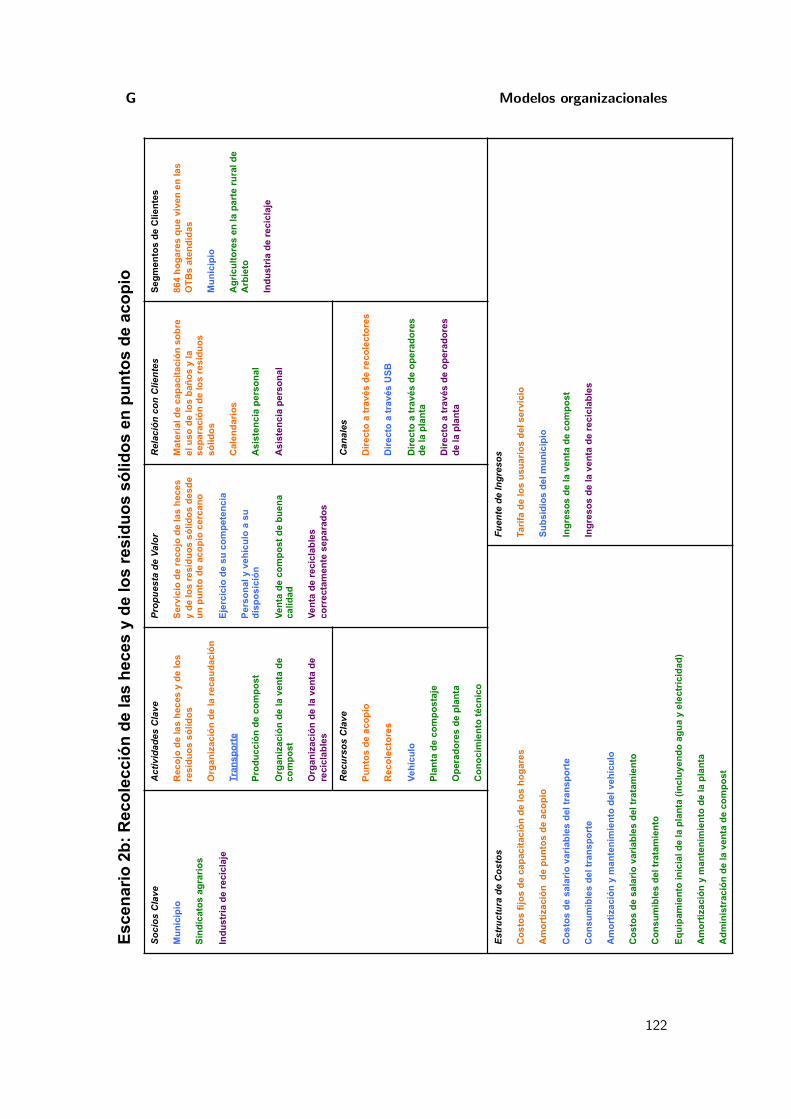
G Modelos organizacionales
Soc
ios
Cla
ve
Mun
icip
io
Sind
icat
os a
grar
ios
Indu
stria
de
reci
claj
e
Act
ivid
ades
Cla
ve
Rec
ojo
de la
s he
ces
y de
los
resi
duos
sól
idos
Org
aniz
ació
n de
la re
caud
ació
n
Tran
spor
te
Prod
ucci
ón d
e co
mpo
st
Org
aniz
ació
n de
la v
enta
de
com
post
Org
aniz
ació
n de
la v
enta
de
reci
clab
les
Pro
pues
ta d
e V
alor
Serv
icio
de
reco
jo d
e la
s he
ces
y de
los
resi
duos
sól
idos
des
de
un p
unto
de
acop
io c
erca
no
Ejer
cici
o de
su
com
pete
ncia
Pers
onal
y v
ehíc
ulo
a su
di
spos
ició
n
Vent
a de
com
post
de
buen
a ca
lidad
Vent
a de
reci
clab
les
corr
ecta
men
te s
epar
ados
Rel
ació
n co
n C
lient
es
Mat
eria
l de
capa
cita
ción
sob
re
el u
so d
e lo
s ba
ños
y la
se
para
ción
de
los
resi
duos
só
lidos
Cal
enda
rios
Asi
sten
cia
pers
onal
Asi
sten
cia
pers
onal
Segm
ento
s de
Clie
ntes
864
hoga
res
que
vive
n en
las
OTB
s at
endi
das
Mun
icip
io
Agr
icul
tore
s en
la p
arte
rura
l de
Arb
ieto
Indu
stria
de
reci
claj
e
Rec
urso
s C
lave
Punt
os d
e ac
opio
Rec
olec
tore
s
Vehí
culo
Plan
ta d
e co
mpo
staj
e
Ope
rado
res
de p
lant
a
Con
ocim
ient
o té
cnic
o
Can
ales
Dire
cto
a tr
avés
de
reco
lect
ores
Dire
cto
a tr
avés
USB
Dire
cto
a tr
avés
de
oper
ador
es
de la
pla
nta
Dire
cto
a tr
avés
de
oper
ador
es
de la
pla
nta
Est
ruct
ura
de C
osto
s
Cos
tos
fijos
de
capa
cita
ción
de
los
hoga
res
Am
ortiz
ació
n d
e pu
ntos
de
acop
io
Cos
tos
de s
alar
io v
aria
bles
del
tran
spor
te
Con
sum
ible
s de
l tra
nspo
rte
Am
ortiz
ació
n y
man
teni
mie
nto
del v
ehíc
ulo
Cos
tos
de s
alar
io v
aria
bles
del
trat
amie
nto
Con
sum
ible
s de
l tra
tam
ient
o
Equi
pam
ient
o in
icia
l de
la p
lant
a (in
cluy
endo
agu
a y
elec
tric
idad
)
Am
ortiz
ació
n y
man
teni
mie
nto
de la
pla
nta
Adm
inis
trac
ión
de la
ven
ta d
e co
mpo
st
Fuen
te d
e In
gres
os
Tarif
a de
los
usua
rios
del s
ervi
cio
Subs
idio
s de
l mun
icip
io
Ingr
esos
de
la v
enta
de
com
post
Ingr
esos
de
la v
enta
de
reci
clab
les
Esce
nario
2b:
Rec
olec
ción
de
las
hece
s y
de lo
s re
sidu
os s
ólid
os e
n pu
ntos
de
acop
io
122
APPENDIXH
Recorridos del recojo de puerta a puerta
En los siguientes mapas, se presentan los recorridos en cada OTB. Los recorridos son selec-cionados de manera que el vehıculo pasa solo por los caminos en buen estado. Ya que haysolo pocos caminos en buen estado, la seleccion de los recorrido se hizo a mano. En casode contextos mas complicados, serıa mejor calcularlo con una herramienta de Sistema deInformacion Geografica (SIG).
123
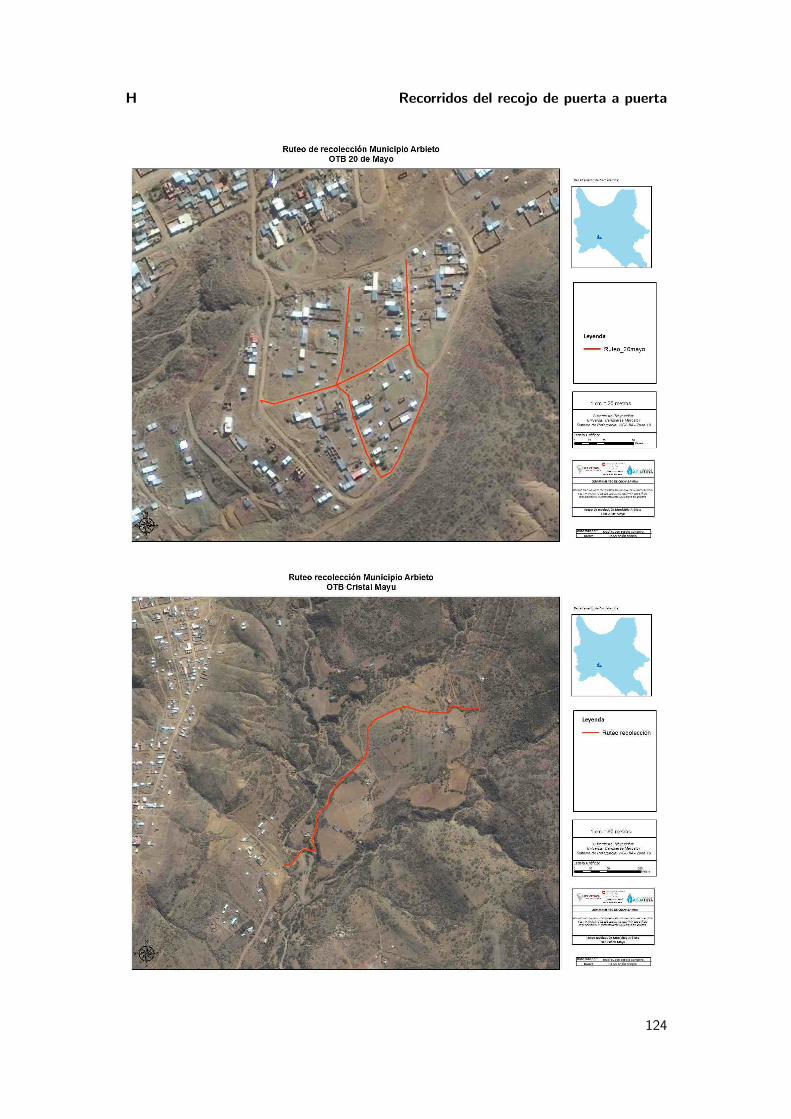
H Recorridos del recojo de puerta a puerta
124
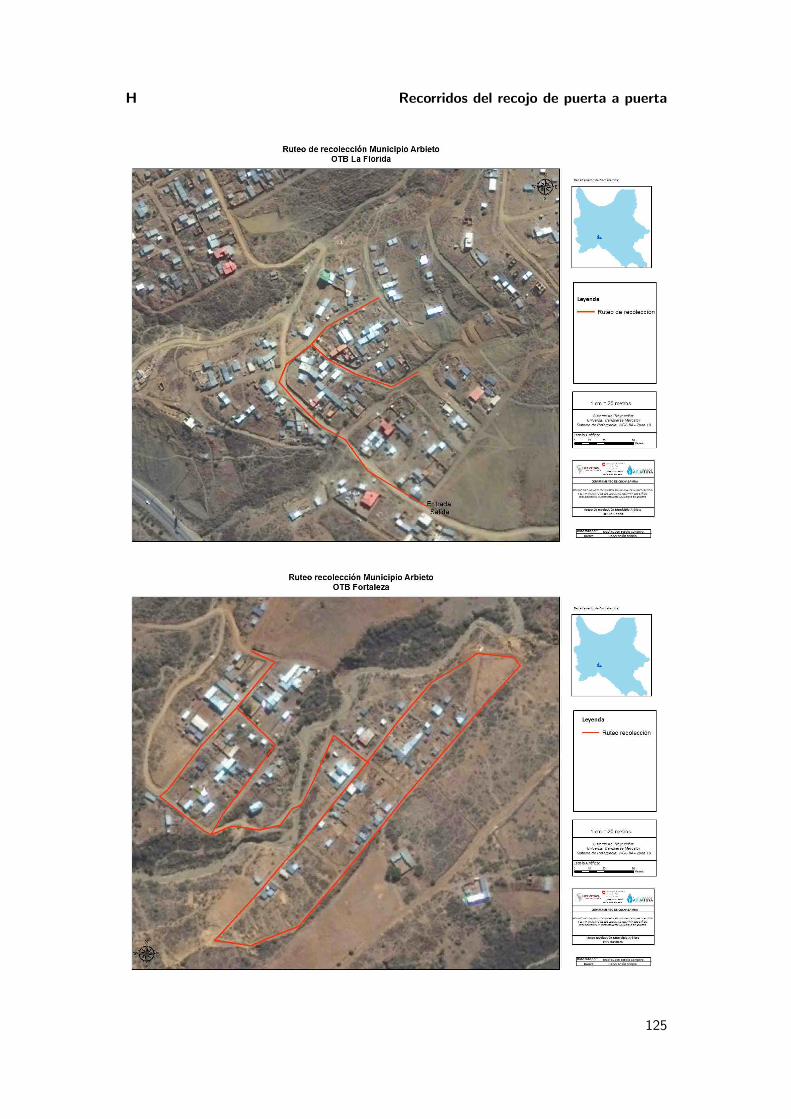
H Recorridos del recojo de puerta a puerta
125
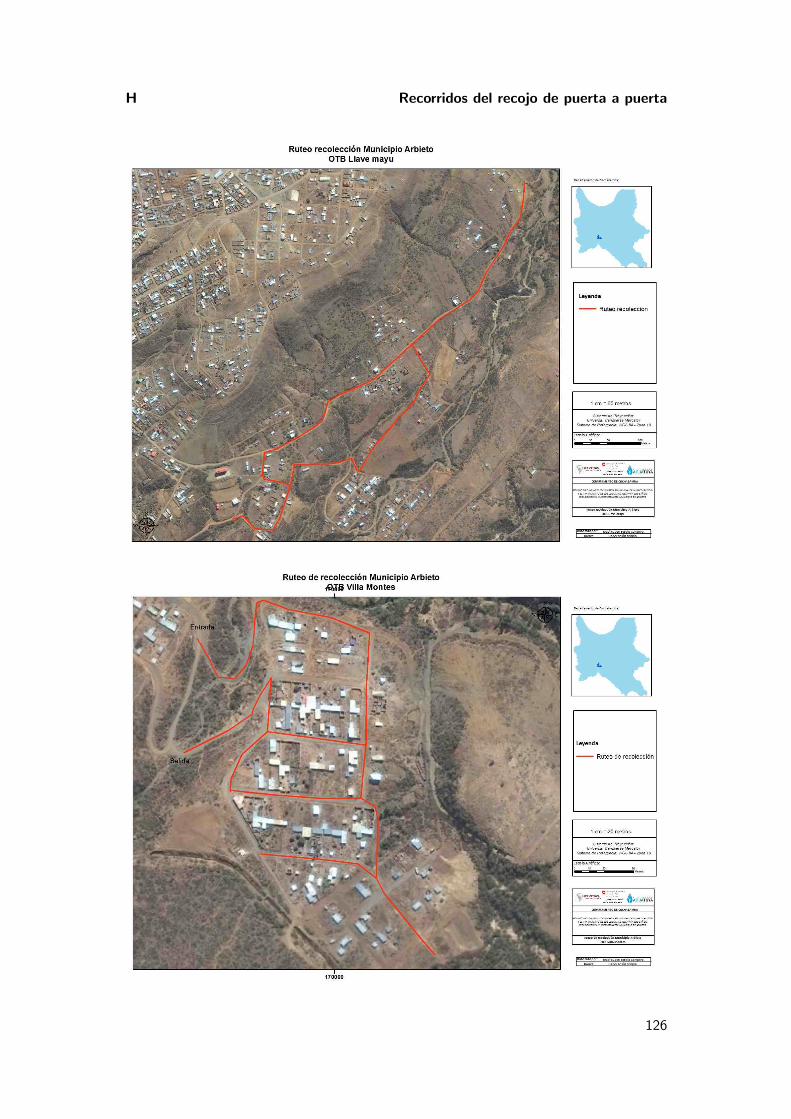
H Recorridos del recojo de puerta a puerta
126
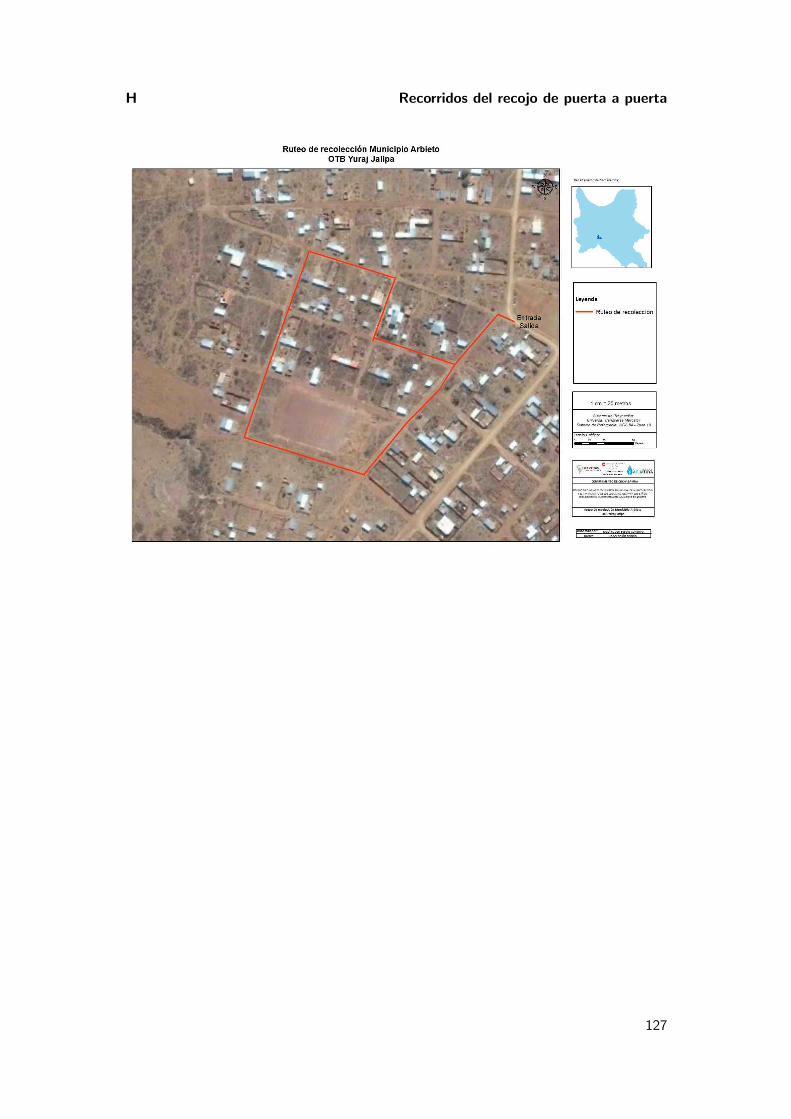
H Recorridos del recojo de puerta a puerta
127
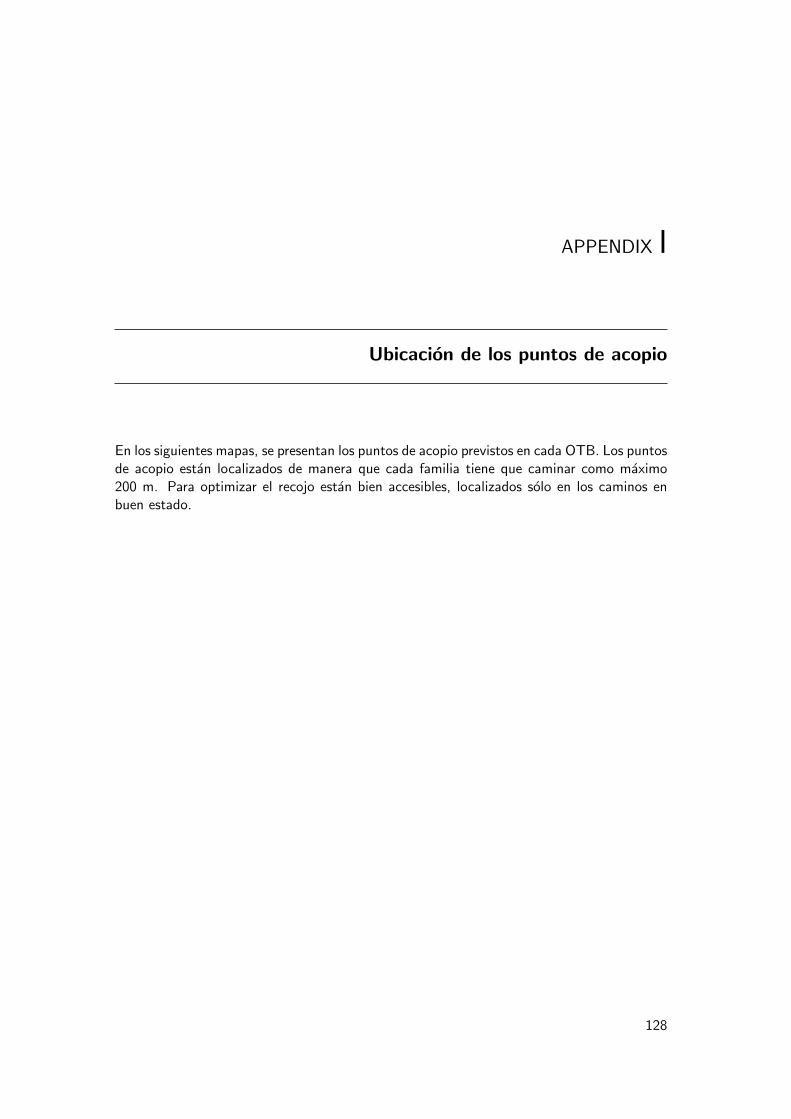
APPENDIX I
Ubicacion de los puntos de acopio
En los siguientes mapas, se presentan los puntos de acopio previstos en cada OTB. Los puntosde acopio estan localizados de manera que cada familia tiene que caminar como maximo200 m. Para optimizar el recojo estan bien accesibles, localizados solo en los caminos enbuen estado.
128
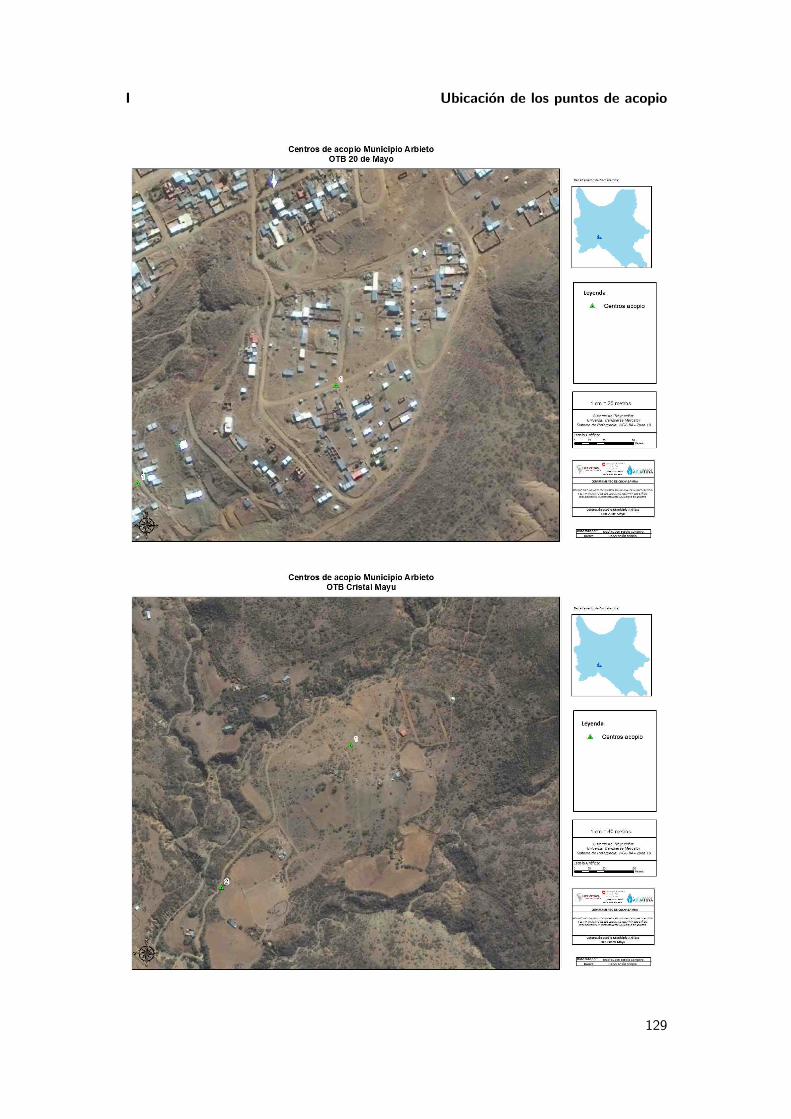
I Ubicacion de los puntos de acopio
129
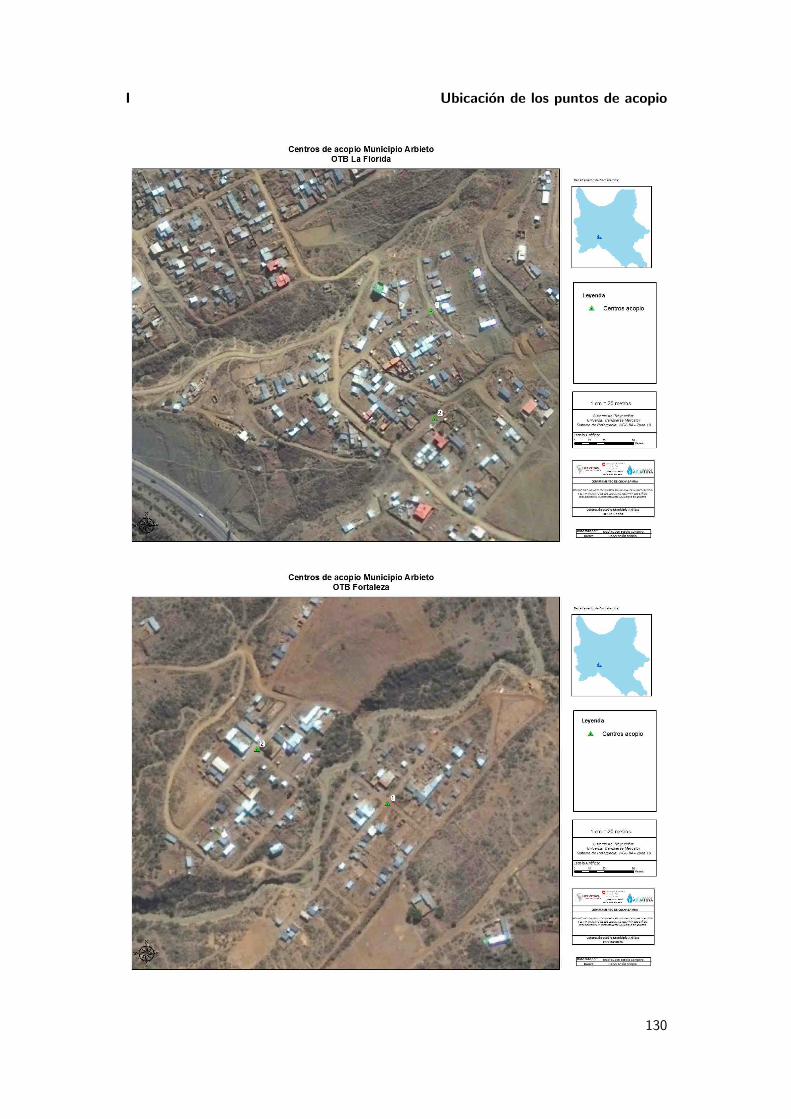
I Ubicacion de los puntos de acopio
130
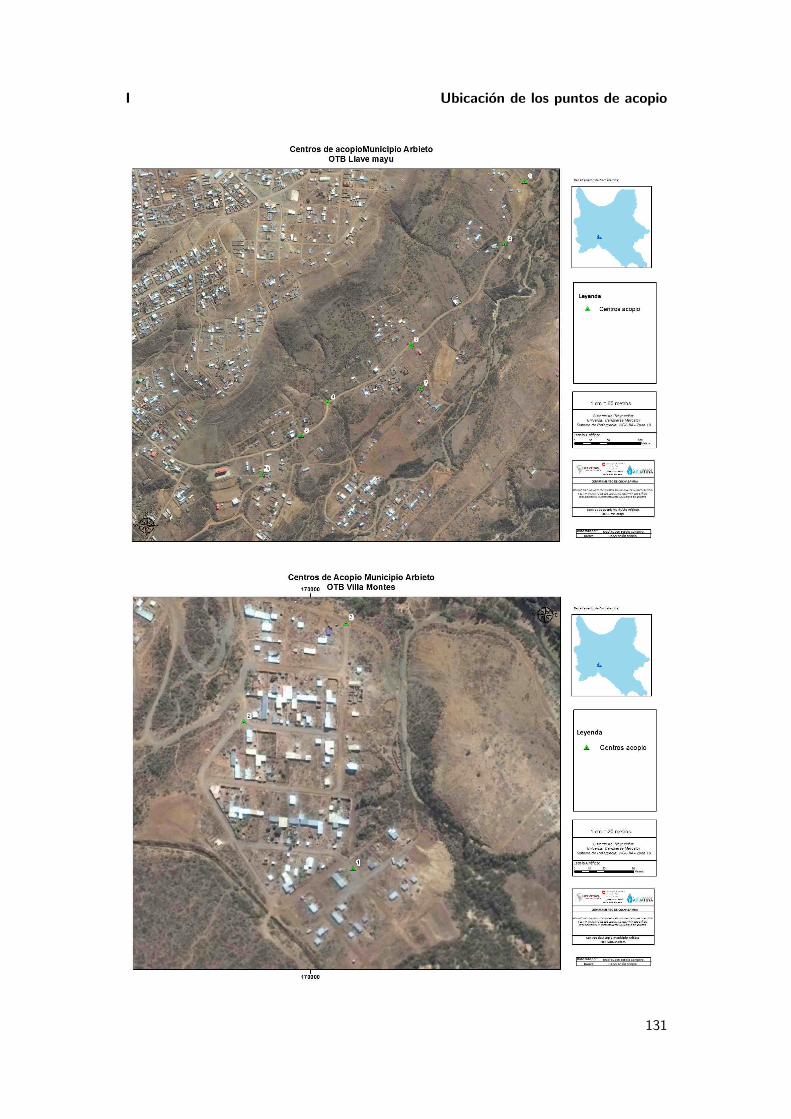
I Ubicacion de los puntos de acopio
131
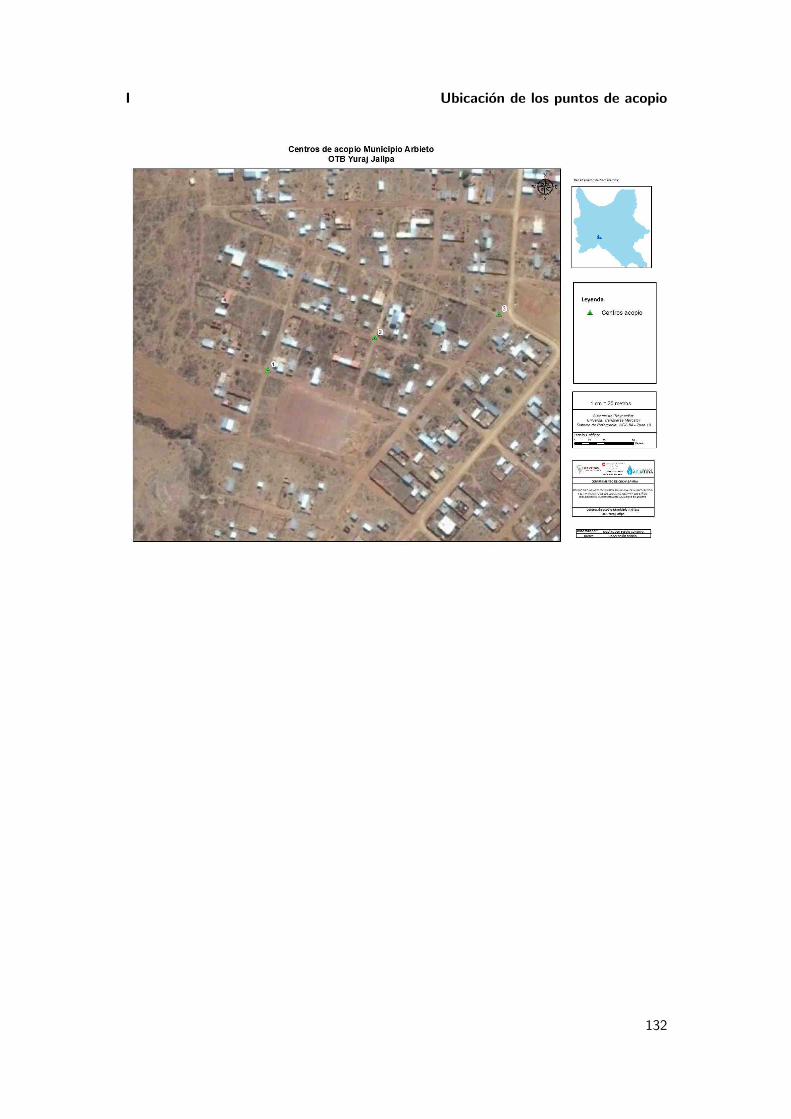
I Ubicacion de los puntos de acopio
132
APPENDIX J
Parametros del calculo de costos
Se resumen los parametros del calculo de costos relacionados a los siguientes temas:
1. Datos de base
2. Transporte
3. Tratamiento
4. Ingresos
133
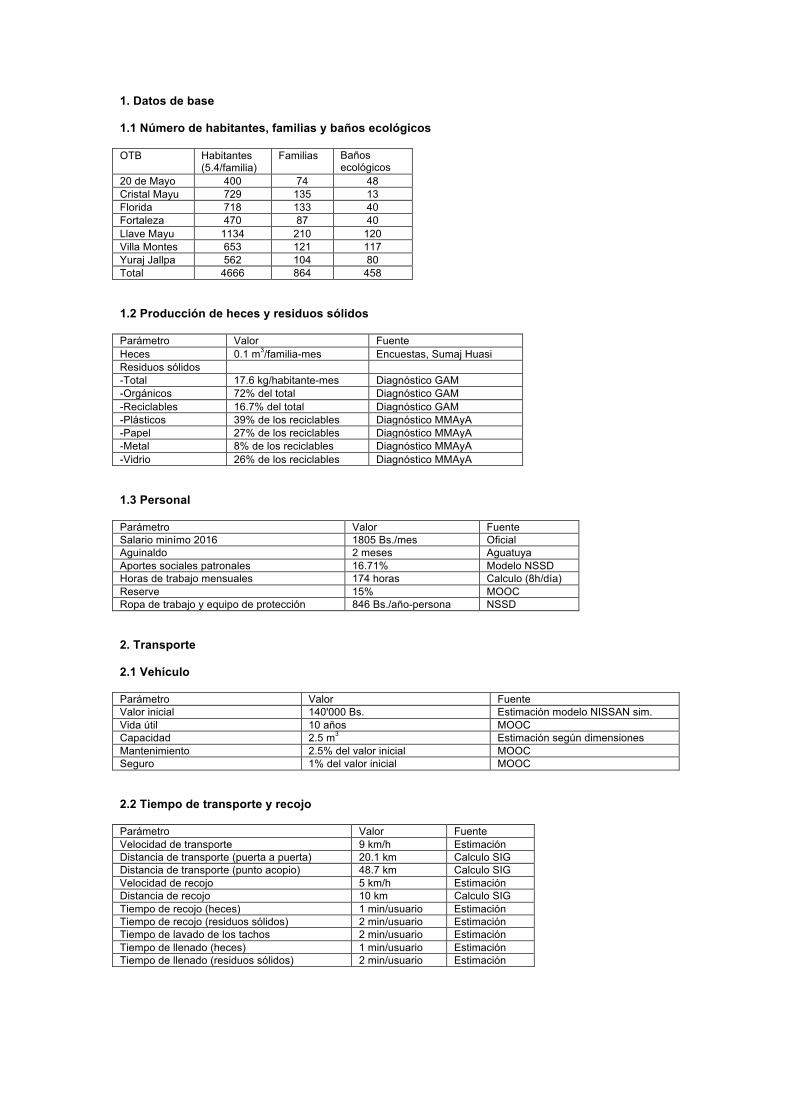
1. Datos de base
1.1 Número de habitantes, familias y baños ecológicos
OTB Habitantes (5.4/familia)
Familias Baños ecológicos
20 de Mayo 400 74 48 Cristal Mayu 729 135 13 Florida 718 133 40 Fortaleza 470 87 40 Llave Mayu 1134 210 120 Villa Montes 653 121 117 Yuraj Jallpa 562 104 80 Total 4666 864 458
1.2 Producción de heces y residuos sólidos
Parámetro Valor Fuente Heces 0.1 m3/familia-mes Encuestas, Sumaj Huasi Residuos sólidos -Total 17.6 kg/habitante-mes Diagnóstico GAM -Orgánicos 72% del total Diagnóstico GAM -Reciclables 16.7% del total Diagnóstico GAM -Plásticos 39% de los reciclables Diagnóstico MMAyA -Papel 27% de los reciclables Diagnóstico MMAyA -Metal 8% de los reciclables Diagnóstico MMAyA -Vidrio 26% de los reciclables Diagnóstico MMAyA
1.3 Personal
Parámetro Valor Fuente Salario minímo 2016 1805 Bs./mes Oficial Aguinaldo 2 meses Aguatuya Aportes sociales patronales 16.71% Modelo NSSD Horas de trabajo mensuales 174 horas Calculo (8h/día) Reserve 15% MOOC Ropa de trabajo y equipo de protección 846 Bs./año-persona NSSD
2. Transporte
2.1 Vehículo
Parámetro Valor Fuente Valor inicial 140'000 Bs. Estimación modelo NISSAN sim. Vida útil 10 años MOOC Capacidad 2.5 m3 Estimación según dimensiones Mantenimiento 2.5% del valor inicial MOOC Seguro 1% del valor inicial MOOC
2.2 Tiempo de transporte y recojo
Parámetro Valor Fuente Velocidad de transporte 9 km/h Estimación Distancia de transporte (puerta a puerta) 20.1 km Calculo SIG Distancia de transporte (punto acopio) 48.7 km Calculo SIG Velocidad de recojo 5 km/h Estimación Distancia de recojo 10 km Calculo SIG Tiempo de recojo (heces) 1 min/usuario Estimación Tiempo de recojo (residuos sólidos) 2 min/usuario Estimación Tiempo de lavado de los tachos 2 min/usuario Estimación Tiempo de llenado (heces) 1 min/usuario Estimación Tiempo de llenado (residuos sólidos) 2 min/usuario Estimación
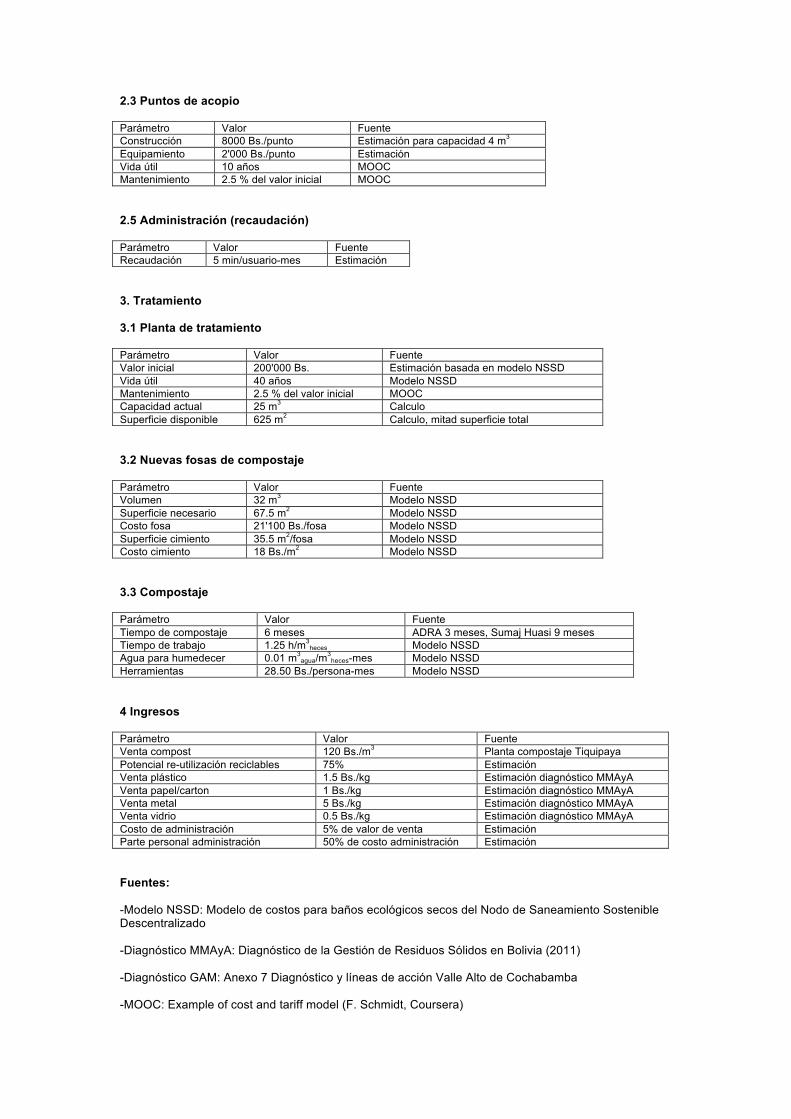
2.3 Puntos de acopio
Parámetro Valor Fuente Construcción 8000 Bs./punto Estimación para capacidad 4 m3 Equipamiento 2'000 Bs./punto Estimación Vida útil 10 años MOOC Mantenimiento 2.5 % del valor inicial MOOC
2.5 Administración (recaudación)
Parámetro Valor Fuente Recaudación 5 min/usuario-mes Estimación
3. Tratamiento
3.1 Planta de tratamiento
Parámetro Valor Fuente Valor inicial 200'000 Bs. Estimación basada en modelo NSSD Vida útil 40 años Modelo NSSD Mantenimiento 2.5 % del valor inicial MOOC Capacidad actual 25 m3 Calculo Superficie disponible 625 m2 Calculo, mitad superficie total
3.2 Nuevas fosas de compostaje
Parámetro Valor Fuente Volumen 32 m3 Modelo NSSD Superficie necesario 67.5 m2 Modelo NSSD Costo fosa 21'100 Bs./fosa Modelo NSSD Superficie cimiento 35.5 m2/fosa Modelo NSSD Costo cimiento 18 Bs./m2 Modelo NSSD
3.3 Compostaje
Parámetro Valor Fuente Tiempo de compostaje 6 meses ADRA 3 meses, Sumaj Huasi 9 meses Tiempo de trabajo 1.25 h/m3
heces Modelo NSSD Agua para humedecer 0.01 m3
agua/m3heces-mes Modelo NSSD
Herramientas 28.50 Bs./persona-mes Modelo NSSD
4 Ingresos
Parámetro Valor Fuente Venta compost 120 Bs./m3 Planta compostaje Tiquipaya Potencial re-utilización reciclables 75% Estimación Venta plástico 1.5 Bs./kg Estimación diagnóstico MMAyA Venta papel/carton 1 Bs./kg Estimación diagnóstico MMAyA Venta metal 5 Bs./kg Estimación diagnóstico MMAyA Venta vidrio 0.5 Bs./kg Estimación diagnóstico MMAyA Costo de administración 5% de valor de venta Estimación Parte personal administración 50% de costo administración Estimación
Fuentes:
-Modelo NSSD: Modelo de costos para baños ecológicos secos del Nodo de Saneamiento Sostenible Descentralizado
-Diagnóstico MMAyA: Diagnóstico de la Gestión de Residuos Sólidos en Bolivia (2011)
-Diagnóstico GAM: Anexo 7 Diagnóstico y líneas de acción Valle Alto de Cochabamba
-MOOC: Example of cost and tariff model (F. Schmidt, Coursera)


