Embed Size (px)
Citation preview
Bonding of Histidine to Cerium OxideNataliya Tsud,*,† Robert G. Acres,‡ Marianna Iakhnenko,§ Daniel Mazur,† Kevin C. Prince,‡,∥
and Vladimír Matolín†
†Charles University, Faculty of Mathematics and Physics, Department of Surface and Plasma Science, V Holesovickach 2, Prague,18000, Czech Republic‡Elettra-Sincrotrone Trieste S.C.p.A., in Area Science Park, Strada Statale 14, km 163.5, Basovizza (Trieste), 34149, Italy§Taras Shevchenko National University of Kyiv, Faculty of Physics, Department of Experimental Physics, 64, Volodymyrs’ka St.,01601 Kyiv, Ukraine∥CNR-IOM Laboratorio TASC, Basovizza (Trieste), 34149, Italy
*S Supporting Information
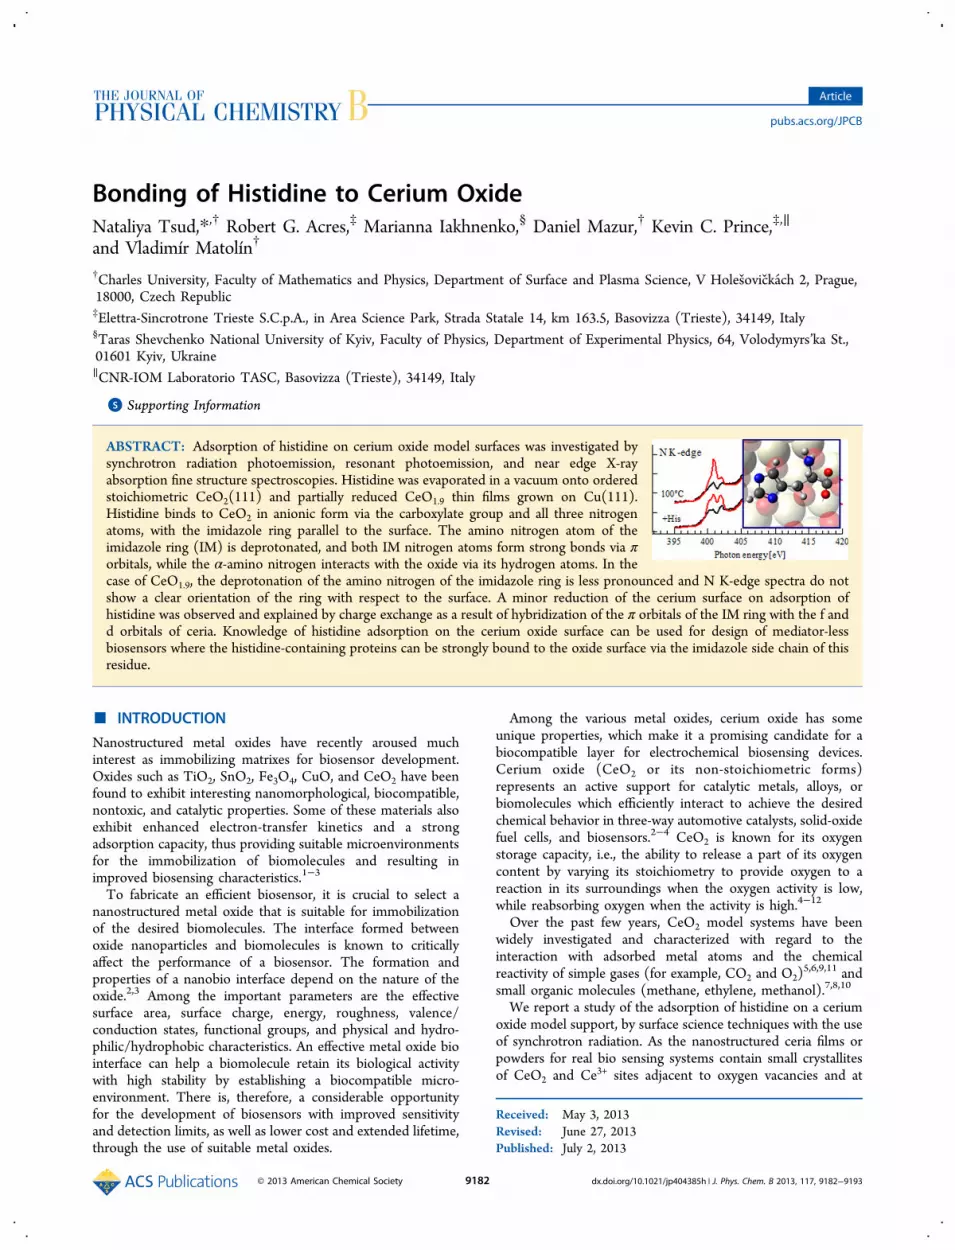
ABSTRACT: Adsorption of histidine on cerium oxide model surfaces was investigated bysynchrotron radiation photoemission, resonant photoemission, and near edge X-rayabsorption fine structure spectroscopies. Histidine was evaporated in a vacuum onto orderedstoichiometric CeO2(111) and partially reduced CeO1.9 thin films grown on Cu(111).Histidine binds to CeO2 in anionic form via the carboxylate group and all three nitrogenatoms, with the imidazole ring parallel to the surface. The amino nitrogen atom of theimidazole ring (IM) is deprotonated, and both IM nitrogen atoms form strong bonds via πorbitals, while the α-amino nitrogen interacts with the oxide via its hydrogen atoms. In thecase of CeO1.9, the deprotonation of the amino nitrogen of the imidazole ring is less pronounced and N K-edge spectra do notshow a clear orientation of the ring with respect to the surface. A minor reduction of the cerium surface on adsorption ofhistidine was observed and explained by charge exchange as a result of hybridization of the π orbitals of the IM ring with the f andd orbitals of ceria. Knowledge of histidine adsorption on the cerium oxide surface can be used for design of mediator-lessbiosensors where the histidine-containing proteins can be strongly bound to the oxide surface via the imidazole side chain of thisresidue.
■ INTRODUCTION
Nanostructured metal oxides have recently aroused muchinterest as immobilizing matrixes for biosensor development.Oxides such as TiO2, SnO2, Fe3O4, CuO, and CeO2 have beenfound to exhibit interesting nanomorphological, biocompatible,nontoxic, and catalytic properties. Some of these materials alsoexhibit enhanced electron-transfer kinetics and a strongadsorption capacity, thus providing suitable microenvironmentsfor the immobilization of biomolecules and resulting inimproved biosensing characteristics.1−3
To fabricate an efficient biosensor, it is crucial to select ananostructured metal oxide that is suitable for immobilizationof the desired biomolecules. The interface formed betweenoxide nanoparticles and biomolecules is known to criticallyaffect the performance of a biosensor. The formation andproperties of a nanobio interface depend on the nature of theoxide.2,3 Among the important parameters are the effectivesurface area, surface charge, energy, roughness, valence/conduction states, functional groups, and physical and hydro-philic/hydrophobic characteristics. An effective metal oxide biointerface can help a biomolecule retain its biological activitywith high stability by establishing a biocompatible micro-environment. There is, therefore, a considerable opportunityfor the development of biosensors with improved sensitivityand detection limits, as well as lower cost and extended lifetime,through the use of suitable metal oxides.
Among the various metal oxides, cerium oxide has someunique properties, which make it a promising candidate for abiocompatible layer for electrochemical biosensing devices.Cerium oxide (CeO2 or its non-stoichiometric forms)represents an active support for catalytic metals, alloys, orbiomolecules which efficiently interact to achieve the desiredchemical behavior in three-way automotive catalysts, solid-oxidefuel cells, and biosensors.2−4 CeO2 is known for its oxygenstorage capacity, i.e., the ability to release a part of its oxygencontent by varying its stoichiometry to provide oxygen to areaction in its surroundings when the oxygen activity is low,while reabsorbing oxygen when the activity is high.4−12
Over the past few years, CeO2 model systems have beenwidely investigated and characterized with regard to theinteraction with adsorbed metal atoms and the chemicalreactivity of simple gases (for example, CO2 and O2)
5,6,9,11 andsmall organic molecules (methane, ethylene, methanol).7,8,10
We report a study of the adsorption of histidine on a ceriumoxide model support, by surface science techniques with the useof synchrotron radiation. As the nanostructured ceria films orpowders for real bio sensing systems contain small crystallitesof CeO2 and Ce3+ sites adjacent to oxygen vacancies and at
Received: May 3, 2013Revised: June 27, 2013Published: July 2, 2013
Article
pubs.acs.org/JPCB
© 2013 American Chemical Society 9182 dx.doi.org/10.1021/jp404385h | J. Phys. Chem. B 2013, 117, 9182−9193

grain edges and other defects, ordered stoichiometric andpartially reduced cerium oxide thin films were chosen as modelsupports. Histidine molecules were deposited on CeO2(111)and CeO2−x grown on Cu(111) by Ce evaporation in anoxygen atmosphere. The chemical state, coverage, and bondingof the molecules were studied by synchrotron radiationphotoelectron spectroscopy (SRPES) and resonant photo-electron spectroscopy (RPES); molecular orientation wasexamined by near edge X-ray absorption fine structurespectroscopy (NEXAFS). In view of the importance ofnanostructured cerium oxide in various biological and recentlyalso pharmacological applications,13−17 the primary objective ofthis work is to investigate the basic properties of cerium oxidefilms in their bonding with the amino acid histidine.Histidine was chosen because of its importance in various
biological processes,18 with the aim to model the bonding ofproteins and other complex biomolecules with the cerium oxidesurface. The structure of the histidine molecule is shown inFigure 1, and it has three important chemical groups: carboxylicacid, α-amino, and imidazole.
A related model system is histidine adsorbed on metalsurfaces.19−23 For vacuum evaporation and deposition from aneutral solution of histidine on Au(111), an anionic adlayer ofmolecules was formed and bound to the surface via carboxylateand imidazole groups without α-amino group participation.19
Histidine deposited from acidic solution on Au(111) andAu(110) results in the formation of a disordered adlayerbecause of the presence of the neutral carboxylic acid grouptogether with the strongly interacting carboxylate groupCOO−.21 In all cases, the imidazole ring was found to beoriented at a shallow angle to the surface interacting via theimino nitrogen, with the α-amino group roughly perpendicularto the surface. These findings were recently confirmed by amolecular dynamics study of Xu et al.22 Strong ionic−covalentbonding accompanied by a positive charge transfer to thesubstrate was found by Zubavichus et al. for histidineevaporated on polycrystalline gold foils.23
Another model substrate is a Cu(110) single crystal. At sub-monolayer coverage, histidine interacts with Cu(110) via thecarboxylate group and imino nitrogen of the imidazole ring.18,20
Annealing to 150 °C or preadsorption of oxygen inducesadditional histidine bonding with the copper surface viadehydrogenated amino nitrogen atoms of the ring and theamino side group.20
To our knowledge, there is no publication on histidineadsorption on well-defined bulk oxide surfaces. Many studies
have been devoted to adsorption of other amino acids (proline,glycine, L-cysteine, etc.) on stoichiometric and reduced titaniumdioxide surfaces.24−26 It was shown that proline and glycineadsorb on TiO2 surfaces via deprotonated carboxylate groupswith a considerable contribution of zwitterionic species.24,25
The proline zwitterionic concentration increases as the surfaceoxygen atom concentration decreases, i.e., on the reducedsurface. Moreover, the reduced surface was shown to bepartially reoxidized upon adsorption of proline.24 Theadsorption of alanine on the nonpolar ZnO(10−10) singlecrystal surface was studied by Gao et al.27 A deprotonatedalanine adlayer was observed at 25 °C bound to the surface viathe carboxylate group. The thermal treatment of this adlayerwas accompanied by decomposition and/or reaction on thesurface. It was shown that the COO− carboxylate grouppreferentially reacts with the surface at elevated temperature.These studies explored the reaction of amino acids with
relatively unreactive side chains, namely, hydrogen (glycine),methyl (alanine), and pyrrolidine (proline). In histidine, theimidazole side chain is more reactive, with important biologicalconsequences, and in particular, it is polar and basic. This posesthe question of whether the adsorption behavior is stronglyinfluenced by these chemical differences in the side chain.
■ EXPERIMENTAL SECTIONThe experiments were performed at the Materials ScienceBeamline at the Elettra synchrotron light source in Trieste,Italy. The beamline is based on a plane grating monochromatorproviding narrow band synchrotron light in the energy range21−1000 eV. The experimental station is equipped with a SpecsPhoibos 150 hemispherical electron energy analyzer, lowenergy electron diffraction (LEED) optics, a dual-anode Mg/Al X-ray source, an ion gun, a gas inlet system, a Ce evaporator,and a sample manipulator with a K-type thermocouple attachedto the rear side of the sample. The base pressure in the chamberwas below 3 × 10⁻¹⁰ mbar.The epitaxial cerium oxide thin film was grown on a Cu(111)
single crystal substrate. Cerium (Goodfellow, 99.99%) wasevaporated in an oxygen atmosphere (5 × 10⁻⁷ mbar) ontoCu(111) at 250 °C, followed by annealing of the film at 250 °Cin an oxygen atmosphere at the same pressure for 10 min. Thisprocedure yields a stoichiometric (1.5 × 1.5) CeO2/Cu(111)film. The oxide thickness was calculated from the attenuation ofthe Cu 2p3/2 core level intensity and was 15−18 Å,corresponding to 5−6 O−Ce−O layers of cerium oxide.7,8
According to scanning tunneling microscopy studies, flatCeO2(111) terraces are separated by steps with a minoramount of Ce3+ centers on the step edges.12 The Cu(111)crystal (MaTecK GmbH, 8 mm diameter, 2 mm thickness,99.999%) was cleaned by several cycles of Ar ion sputtering andannealing to 450 °C. The surface cleanliness was checked bymonitoring C 1s and O 1s photoelectron signals; no impuritieswere detected on the Cu(111) surface with sharp (1 × 1)LEED pattern before oxide deposition.Partially reduced ceria film (CeO2−x) was prepared by
depositing 0.7 ML Ce metal on the stoichiometric CeO2(111)film at 250 °C, followed by flashing to 300 °C in a vacuum. Theprocedure yields a CeO2 film covered by extended patches ofthe reduced CeO2−x.
28 The index x was estimated on the baseof analysis and fitting of the Ce 3d core level9 and found to be0.10.
L-Histidine C6H9N3O2 (≥99.5%) was supplied by Sigma-Aldrich and used without further purification. The evaporator
Figure 1. Schematic structure of histidine (C6H9N3O2).
The Journal of Physical Chemistry B Article
dx.doi.org/10.1021/jp404385h | J. Phys. Chem. B 2013, 117, 9182−91939183

was inserted in a separate preparation chamber with a basepressure below 1 × 10⁻⁹ mbar (mainly water). Histidine wasdeposited by evaporation from a homemade Knudsen cell in avacuum. Before deposition, the histidine powder in the cruciblewas degassed in a vacuum at 120 °C and then dosed at 135−140 °C onto the substrate at 25 °C. The deposition rate wasabout 1 monolayer (ML) per 300 s, determined from analysisof the photoemission data. The local pressure during depositionwas about 3 × 10⁻⁸ mbar. The CeO2−x/Cu(111) with x = 0, 0.1or Cu(111) substrates, after preparation in the experimentalchamber, were transferred to the preparation chamber formolecular deposition.The C 1s, N 1s, and O 1s core levels were acquired with a
photon energy of 410, 475, and 630 eV and a total resolution of350, 500, and 700 meV, respectively. The valence band spectrawere recorded at 43 (corresponding to the highest cross sectionfor the adsorbate molecular orbitals), 115, 121.4, and 124.8 eV(to monitor Ce 4d → 4f resonances in Ce ions), with a totalresolution of 190 meV measured as the width of the Fermiedge. The valence band spectrum measured at a photon energyof 115 eV corresponds to off resonance for the Ce3+ and Ce4+
states and was used as a reference for intensity subtractionbetween the corresponding features on- and off-resonance.Valence band spectra measured at 121.4 and 124.8 eVcorrespond to the D(Ce3+) and D(Ce4+) resonant enhance-ments in Ce3+ ion (emission from Ce 4f states located at abinding energy of about 1.4 eV) and Ce4+ ion (emission fromhybridized oxygen cerium states at about 4.0 eV), respectively.The D(Ce3+)/D(Ce4+) resonant enhancement ratio (RER)gives direct information about the oxidation state of surfacecerium ions.7,8,10 Al Kα radiation (1486.6 eV) was used tomeasure the core levels of C 1s, N 1s, O 1s, Ce 3d, and Cu2p3/2, with a total resolution of 1 eV. The emission angle for thephotoelectrons was 0 and 20° with respect to the samplenormal for synchrotron light and the X-ray source, respectively.The intensity of the photoelectron spectra measured withsynchrotron radiation was normalized to the incident photonflux. The core level spectra were fitted with Voigt or Gaussianprofiles after Shirley background subtraction. The precision ofthe photon energy settings was verified by measuring the Fermiedge. All photoemission data were processed using the KolXPDfitting software.29
Checks for radiation damage were done by monitoring the C1s core level spectra. No spectral changes were observed duringone experimental step, i.e., stable signal for about 30 min. Forthe next experimental step, the analyzed point was changed onthe sample surface. The homogeneity of the O 1s signal waschecked before adsorption of histidine. Thus, the molecularadlayers were stable under our experimental conditions.The NEXAFS spectra were taken at the C and N K-edges
using the carbon and nitrogen KVV Auger yield, at normal (NI,90°) and grazing (GI, 10°) incidence of the photon beam withrespect to the surface. The energy resolution for the C and NK-edge NEXAFS spectra was estimated to be 0.23 and 0.38 eV,respectively. The polarization of light from the beamline has
not been measured but is believed to be between 80 and 90%linear, as the source is a bending magnet. The raw NEXAFSspectra were normalized to the intensity of the photon beam,measured for the N K-edge by means of a high transmissiongold mesh (simultaneously with the sample measurement) andfor the C K-edge on a Au foil as the Au 4f intensity scannedafter the sample (the gold sample was used because ofinterference of the carbon contamination on the gold mesh inthe reference photon intensity spectrum). Then, the corre-sponding background spectra of the clean sample recordedunder identical conditions were subtracted.The coverage of histidine was estimated using the para-
metrized inelastic mean free path for organic materials:30
λ = +E E49/ 0.11 mg/mm k2
k1/2 2
(1)
where Ek is the kinetic energy of photoelectrons. The λm valuewas converted to distances by dividing by the density ofhistidine powder31 (1.42 × 10⁹ mg/m3). The inelastic meanfree path for Cu 2p3/2 (excited by 1486.6 eV photons)photoelectrons passing through the histidine adlayer was foundto be 18.2 Å. Using this value, the effective thickness ofhistidine on different substrates was calculated from theequation
λ= −I I dexp( / )d 0 m (2)
where Id and I0 are the attenuated and clean surface intensity ofthe photoelectron signal and d is the thickness of the molecularadlayer. The effective thickness d is calculated within acontinuum model of the molecular film, and it has onlyqualitative character, as the actual morphology is not known.
■ RESULTS AND DISCUSSION1. Molecular Adlayer Thickness Estimation and
Sample Definition. The Cu 2p3/2 core level was used todetermine adlayer thickness by measuring the attenuation ofthe signal after deposition. Three classes of samples wereexamined, namely, epitaxial stoichiometric CeO2(111)/Cu-(111), reduced CeO1.9/Cu(111), and Cu(111). Histidine wasdeposited onto substrates at 25 °C, and then, the thermalstability of the adlayer was investigated from 100 to 300 °C in50 °C steps. The values of thickness were calculated using eqs 1and 2 and are shown in Table 1. For the first two substrates, wefound multilayer coverage: about 4 ML for the sampledesignated (1) CeO2 (evaporation at 140 °C for 15 min)and about 2 ML for sample (2) CeO2 (135 °C, 10 min) whichwere stable against flashing to 100 and 150 °C. The number ofmonolayers has only qualitative character as a unit, and wasdetermined under the assumption of layer by layer growth fromthe effective thickness of the layer. As monolayer coverage, weconsider a saturated coverage of molecules adsorbed on thesurface under certain experimental conditions without traces ofthe zwitterionic phase formation. Without knowledge of theorientation of the molecule, it is not a precise unit. However,below we will present data which sheds some light on theorientation, and allows the monolayer to be defined more
Table 1. Histidine Adlayer Thickness for As-Deposited Samples (25 °C) and after Flashing to 100 °C
temp (1) CeO2 (2) CeO2 (3) CeO2 CeO1.9 Cu
Cu 2p3/2 25 °C 24.0 Å 9.8 Å 1.5 Å 5.0 Å(1486.6 eV) 100 °C 20.0 Å 7.4 Å 1.6 Å 4.4 Å 4.2 Åsample name 4 ML 2 ML 1 ML 1 ML 1 ML
His/CeO2 His/CeO2 His/CeO2 His/CeO1.9 His/Cu
The Journal of Physical Chemistry B Article
dx.doi.org/10.1021/jp404385h | J. Phys. Chem. B 2013, 117, 9182−91939184

precisely. For (3) CeO2, CeO1.9, and Cu substrates (135 °C, 5min), the calculated values were found to correspond to 1 MLhistidine coverage (see further discussion). The thickness of 1ML histidine is 4.40 Å on CeO1.9 and 4.16 Å on Cu(111), andthese are reasonable values considering the size of the molecule(the cube root of the molecular volume of histidine is 5.7 Å19).A much smaller number, 1.65 Å, was found for the (3)CeO2(111) substrate which points to a different morphologyupon histidine adsorption.It is worth noting that by flashing to 150 °C the multilayer
coverage, i.e., desorption of weakly bonded molecules, we didnot get 1 ML coverage. Apparently, in the case of 2 or 4 MLhistidine adlayers on the CeO2 surface, heating to 100 or 150°C results in the formation of a stable multilayer molecular filmowing to strong intermolecular bonds.The C 1s and N 1s core level spectra for 1, 2, and 4 ML of
histidine on the CeO2/Cu(111) substrate are shown in Figure2. The kinetic energy of photoelectrons was 124 and 75 eV for
C 1s and N 1s, respectively, corresponding to extremely surfacesensitive conditions. This fact can explain the lower thanexpected absolute intensity for the 4 ML histidine adlayer onthe ceria surface. Two well-separated peaks A and B in the C 1score level spectrum were found with a shift to lower bindingenergy (BE) by 0.4 eV between data for 4 and 1 ML histidinecoverage. The component B was assigned to carbon in thecarboxylate COO− group with a possible contribution of theneutral carboxylic group for coverage higher than 1 ML.21
Component A accounts for the five other carbons ofhistidine.19−21,23 The intensity ratio of B:A was found to be1:(5.40 ± 0.15), which is in reasonably good agreement withthe theoretical 1:5 value and other experimental work.19,20 Thecarbon component ratio demonstrates that the structure of thehistidine molecule is intact. The C 1s components’ shift tolower binding energy by 0.4 eV as the coverage decreases is inline with previously published work on related systems.19,20,23
The N 1s core level spectra have different shapes for 1, 2, and4 ML histidine coverage. Three components C, D, and E can be
distinguished which were assigned to the imino and aminonitrogen atoms and nitrogen of the zwitterion histidine species,respectively.19−21,23 The presence of the zwitterion phase is atypical feature for the multilayer coverage. Because of strongbonding with the cerium oxide surface at 1 ML coverage, theD:C components’ intensity ratio does not correspond to theexpected 2:1 for histidine but has a value of 1:(2.30 ± 0.10)after histidine adsorption. The components of the C 1s and N1s spectra and their positions will be further discussed in detailbelow.The integrity of the histidine molecules after evaporation in a
vacuum and adsorption on the surface was checked again forthe highest coverage, 4 ML His/CeO2, i.e., the sample withstrong signals of C 1s, N 1s, and O 1s, measured with 1486.6eV photon energy. All signals were found to be stable. The ratioof peak intensity C:N:O divided by the correspondingphotoionization cross sections was found to be (3.20 ±0.10):(1.54 ± 0.10):1, in good agreement with the theoreticalvalue 3:1.5:1.The Ce 3d core level spectra of clean ceria substrates are
shown in Figure 3a. The spectral structure corresponds well tostoichiometric and partially reduced cerium oxide: threedoublets V−U, V″−U″, and V‴−U‴ for Ce4+ ions in CeO2and two additional doublets V0−U0 and V′−U′ (five in total)appear for Ce3+ ions in CeO1.9.
7,8,10 The electronic structure of
Figure 2. C 1s and N 1s core level spectra of histidine adlayers on theCeO2/Cu(111) substrate after flashing to 100 °C. Photon energy 410eV (C 1s) and 475 eV (N 1s).
Figure 3. (a) Ce 3d core level spectra of the stoichiometric CeO2/Cu(111) and reduced CeO1.9/Cu(111) oxide, photon energy 1486.6eV; (b) D(Ce3+) intensity; (c) resonance enhanced ratio D(Ce3+)/D(Ce4+) versus annealing temperature of histidine adlayers on ceriumoxides. Values at 0 °C correspond to clean surfaces. The Ce 3dspectrum for CeO1.9 is shifted by 0.5 eV to the low BE side.
The Journal of Physical Chemistry B Article
dx.doi.org/10.1021/jp404385h | J. Phys. Chem. B 2013, 117, 9182−91939185

CeO2 is characterized by unoccupied 4f states of Ce4+ cations
(4f0), while Ce2O3 consists of Ce3+ cations with (4f1)
configuration. The Ce 3d doublets represent different 4f
configurations in the photoemission final state due to Ce 4f
occupation in the initial and final states.
Except for a decrease of intensity, no change in the Ce 3dcore levels on histidine adsorption was observed because of thelow resolution and large information depth for photoelectronsexcited by Al Kα radiation. An example of the Ce 3d core levelspectra of the stoichiometric CeO2/Cu(111) oxide before andafter histidine adsorption and subsequent annealing is given in
Figure 4. N K-edge (a) and C K-edge (b) NEXAFS spectra at temperatures indicated, at grazing (GI) and normal incidence (NI).
Table 2. NEXAFS Spectral Features in the π* Resonance Range and Their Assignment
N K-edge C K-edge
E (eV) A (A′) (eV) B (eV) F (eV) G (eV)
assignment 1s → π* 1s → π* 1s → π* 1s → π* 1s → π*IM imino N IM amino N IM ring COO−
1 ML His/CeO2
+His 400.8 (400.2) 402.0 287.0 288.5100 °C 400.9 402.0 287.0 288.5200 °C 399.2 400.8 286.8 288.4
1 ML His/CeO1.9
100 °C 399.2 (400.2) 401.9 286.9 288.5200 °C 399.2 400.4 286.8 288.5
1 ML His/Cu100 °C 400.6 401.8 286.8 288.5
2 ML His/CeO2
100 °C 400.7 (400.2) 401.8 286.9 288.5200 °C 399.0 400.8 402.0 286.9 288.5
1 ML His/Cu(110)20
25 °C 399.5 401.2150 °C 400.0 401.2
0.4 ML His/O−Cu(110)20 400.2 401.21 ML His/Au(111)19 399.9 401.35His/Au(111) (110) acidic solution21 400.1 401.5His, powder32 399.8 401.3 286.8 288.6His, ab initio33 288.72 292.12
288.82289.16
His, thin film35 286.5 288.7287.0
solid state IM34 400.4 401.8 286.5
The Journal of Physical Chemistry B Article
dx.doi.org/10.1021/jp404385h | J. Phys. Chem. B 2013, 117, 9182−91939186

the Supporting Information. Therefore, the surface oxidation/reduction character was tracked by following the behavior ofthe valence band resonances connected with Ce3+ and Ce4+
states. The RER resonance ratio was about 0 for CeO2 and 1.4for CeO1.9 before histidine adsorption (Figure 3c). A slightincrease of the RER ratio with temperature was observed forboth types of oxide, i.e., stoichiometric and reduced (see Figure3c).Because of the bulk nature of the Ce4+ cations, the associated
resonance peak is attenuated by histidine more than that of theCe3+ peak, which originates from Ce3+ ions on the surface, sowe focus attention on the D(Ce3+) dependence alone. Thealmost identical D(Ce3+) behavior for histidine adlayers onCeO2 and CeO1.9 indicates an increase of the Ce3+ ionconcentration independent of the initial degree of surfacereduction. The increase of Ce3+ concentration can betentatively attributed to charge transfer from the molecule tothe substrate rather than oxygen desorption which requiresmuch higher temperature treatment (675 °C).12 Thishypothesis will be further discussed in the text.For the reduced oxide surface, a rigid shift of ceria and
histidine photoemission peaks of 0.35 ± 0.15 eV to highbinding energy was observed. We explain this shift by adifference in the Fermi level pinning between the stoichio-metric and reduced cerium oxide, and it is not related toelectronic structure changes of the interface with the molecules.To compensate for this change of reference level, and allowspectra from different surfaces to be compared, all spectrameasured on the reduced surface were adjusted by the valuesindicated in the figures, which moves them to lower bindingenergy.2. NEXAFS Spectroscopy. The NEXAFS spectra of the
histidine adlayers on CeO2, CeO1.9, and Cu(111) substratesmeasured at the indicated temperatures and geometries areshown in Figure 4.Four prominent features were found in the N K-edge spectra
marked A, B, C, and D (see Figure 4a). The sharp peaks A andB in the range 399−402 eV correspond to excitations of N 1selectrons of the IM ring transition to the lowest unoccupiedmolecular orbitals (LUMOs) with π* character, i.e., 1s → π*transitions for imino N2 (A) and amino N3 (B). The broadfeatures C and D at 407.0 and 413.0 eV, respectively, wereattributed to resonances of all three histidine nitrogen atoms ofcharacter 1s → σ* (N−C). Such structured absorption spectrawith π* and σ* resonance ranges are a common feature for theadlayers of molecules with unsaturated bonds.19,20,32 For C K-edge spectra, the region of 1s → π* transitions has richstructure with strong contributions of the feature F at 286.9 eVfrom the IM ring carbons and G at 288.4 eV from thecarboxylate carbon.32−34 In this case, the C 1s→ σ* resonancesH and K are located at 293 and 298.7 eV. The energies of theobserved π* resonances in the N and C K-edge spectra andtheir assignment compared to the published data on the relatedsubstrates are shown in Table 2.The N K-edge spectra of the 1 ML histidine adlayer on CeO2
gave the best contrast between the two geometries, and thisindicates molecular ordering on the surface. The ratio of π* toσ* resonance intensity is higher at GI geometry, which showsthat the IM ring is almost parallel to the surface. The dipolemoment of the π* orbitals is oriented perpendicular to the IMring, and when the molecule is adsorbed parallel to the surface,this feature has strong intensity (relative to σ* resonances) atGI geometry. At NI geometry, the electric vector is parallel to
the surface and induces transitions within the surface plane; i.e.,the π* resonances vanish for ideally parallel molecularadsorption. For the normal incidence spectra, the degree ofpolarization is not important because the electric vector isalways parallel to the surface. Our conclusion is based on theobservation that the π* resonances do not disappear in thisgeometry, and hence the molecular plane is not perfectlyparallel to the surface. At grazing incidence, it is true thatelliptical light has a component parallel to the surface, but thisdoes not excite the resonance.This flat geometry explains the low value of the histidine
thickness on CeO2 (1.65 A, see Table 1). It can be seen that thestructure of the π* resonances changes with temperature. Rightafter deposition, three components were distinguished in the NK-edge 1s → π* transitions region: A, A′, and B at photonenergies of 400.8, 400.2, and 402.0 eV (see Table 2). Theenergy of the A, B, C, and D features is about 0.7−0.9 eVhigher than in the case of histidine powder32 and adlayers onAu(111) and Cu(110) surfaces.19,20 The energy separationbetween A and B is 1.2 eV with about equal intensity right afterhistidine deposition. The closely related resonances A and A′were attributed to the adsorption of the imidazole ring in twodifferent environments with imino nitrogen strongly chem-isorbed (A) and more weakly bound to the surface (A′).20Flashing to 100 °C considerably reduces the intensity of the A′and B resonances, and is accompanied by significant growth ofcomponent A. The shift of A′ by 0.6 eV to higher energiesindicates stronger bonding of the IM ring with the cerium oxidesurface; a similar effect was observed for histidine adlayers onthe Cu(110) surface.20 Thus, the thermal treatment causes thestrong chemisorption of the IM ring to the surface via imino Nand deprotonation of the amino N together with possibledesorption of weakly bound histidine molecules. Flashing tohigher temperature reduces again the B resonances’ intensitywith significant growth of the A component. In other words,the IM ring binds to the cerium oxide surface via its twonitrogen atoms, imino N and deprotonated amino N; the ringis roughly parallel to the surface.C K-edge NEXAFS spectra give similar results. The energy
positions of peaks are equal within 0.4 eV to published data ofpolycrystalline histidine powder32 and solid state imidazole.34 C1s → π* resonances corresponding to the IM ring (componentF) have very different intensity at GI and NI geometries. Thechanges with angle for the component G are less prominentand in the opposite direction; i.e., the ratio of π* to σ*resonances is higher at NI. We conclude that, for as-depositedhistidine and histidine adlayers after flashing to 100 °C, the IMring is lying close to the surface with the carboxylate group at asteep angle. Flashing to 200 °C increases the differencebetween π* resonances for component F, while other featuresremain unchanged when comparing the two geometries. Thisconfirms the previous conclusion that the IM ring is at ashallow angle to the oxide surface.The N K-edge NEXAFS spectra of 1 ML histidine on the
CeO1.9 oxide differ substantially in both the shape of πresonances and their angular dependence. The absence of astrong angular dependence of the π*/σ* intensity ratioindicates random geometry of the IM ring, which is in linewith the estimated thickness of 4.40 Å for ML histidinecoverage on CeO1.9. In general, the same four main resonancesA, B, C, and D were found. The well-resolved features A′ and Bwith a small shoulder E were observed after flashing to 100 °C.With respect to the stoichiometric surface, shifts of the
The Journal of Physical Chemistry B Article
dx.doi.org/10.1021/jp404385h | J. Phys. Chem. B 2013, 117, 9182−91939187

component A to lower energy by 0.7 and 0.4 eV after flashes to100 and 200 °C, respectively, were observed. Component Bremained almost at the same energy and vanished above 200°C, the same behavior as that for 1 ML histidine on CeO2.Similarities in C 1s and N 1s spectra (see next section) maylead us to expect similar NEXAFS data, but for CeO1.9, wedefinitely have the new feature E at low photon energy, at 399.2eV; it is more pronounced at NI geometry. We speculate thatthe component E may be due to the α-amino nitrogeninteracting with the oxide surface via a hydrogen bond. Tracesof the component E can be found even for 1 ML histidine onCeO2 (related to a low concentration of Ce3+ centers). After wehave presented the photoemission spectra, this argument willbe developed further in the discussion section.The C K-edge spectra of 1 ML histidine on CeO1.9 are very
similar to those measured on CeO2, pointing to partialorientation with the IM ring close to parallel to the surface,and the carboxylate group at a steep angle. The C K-edgefeature at 285.8 eV which is more pronounced at NI geometrycan be tentatively attributed to the C2 carbon, the carbonwhich is bound to N1.The 2 ML histidine on the CeO2 sample is characterized by
absorption spectra similar to 1 ML coverage: well-separatedfeatures A and B after 100 °C flash and mainly component Aafter flashing to 200 °C. No clear angular dependence wasobserved in the N and C K-edge NEXAFS spectra, indicatingthat the molecules are randomly oriented.The absorption spectra of 1 ML histidine on Cu(111) after
flashing to 100 °C have the strong features A and B in the N K-edge spectra, attributed to imino and amino nitrogen atoms ofthe IM ring, and F and G in the C K-edge due to carbon atomsof the IM ring and COO− group, respectively. The A and Bresonances are shifted to lower energy by 0.2 eV with respect tothe oxide surface, and have the same energy separation of 1.2eV. No change in the spectra with angle of incidence of thelight was observed, indicating random histidine orientation onCu(111), which is consistent with the ML thickness value of4.16 Å.3. Photoemission Spectroscopy. The O 1s spectra
(Figure 5) of the oxide substrates are dominated by a peak at529.6 eV, which is associated with the O2− anions located nearCe4+ centers on CeO2. An additional small peak at 532 eV isassigned to O2−(Ce3+) anions on CeO1.9 with some
contribution of adsorbed OH groups. The lattice oxygen peakis attenuated after histidine adsorption and a small newcomponent appears at about 532.1 eV assigned to carboxylateoxygen. For reference, on Cu(111), the carboxylate oxygen wasfound at 531.80 eV. These values are in good agreement withthe published values for the COO− group of alanine on ZnO(531.7 eV),27 proline on TiO2(110) (532.3 eV),24 and bi-isonicotinic acid on TiO2(110) (531.7 eV).36 No O 1s signalwas observed at 533 eV or higher binding energy, which is thesignature of the protonated COOH group.36 Moreover,considering the C 1s core level spectra, see further discussion,the presence of the carboxylic COOH oxygen can be excluded.The single COO− component is clearly visible on CeO2 andCu(111). On CeO1.9, it contributes to the original O2−(Ce3+)peak as a shoulder at high BE. The single adsorbate componentindicates the same chemical state for two carboxylate oxygens,i.e., anionic bonding of histidine via the COO− group accordingto the equation
+ → +−His(COOH) O His(COO ) (OH)g s a s (3)
where the indices g and a stand for gaseous and adsorbedhistidine. The dissociated proton binds to a surface oxygen Os,forming a surface hydroxyl group (OH)s. Because of the lowintensity and the similar O 1s binding energy of the adsorbedhydroxyl group on cerium oxide (531.0−532.0 eV37), wecannot distinguish it from COO− in the peak at 532 eV.The N 1s core level spectra of the 1 ML histidine adlayer on
CeO2, CeO1.9, and Cu and 2 ML on CeO2 are shown in Figure6. N 1s spectra were fitted with 2 or 3 Gaussian componentswith equal width and BE values shown in Table 3. As alreadymentioned in section 1, the components C, D, and E wereassigned to the imino and amino nitrogen atoms and nitrogenof the zwitterion histidine species. The neutral histidinemolecule has 1 imino nitrogen (N2) and two amino nitrogenatoms (N1 and N3), which have similar binding energies. Thus,we expect for the neutral molecule the ratio of N 1scomponents to be 2:1. Instead, for 1 ML histidine on CeO2(25 °C), CeO1.9 (25 °C), and Cu (100 °C) substrates, wemeasured D:C = 1:(2.20 ± 0.10), corresponding to one aminoand two imino-like nitrogen atoms. We recall the NEXAFS datafrom the previous section, where we have shown that there areπ* resonances from two different nitrogen atoms (imino andamino) of the IM ring of histidine on all substrates. Thus, in N1s photoemission spectra, we expect to distinguish them verywell and component D has been assigned mainly to the aminonitrogen of the IM ring (N3). Component C thereforeaccounts for two other nitrogen atoms, originally the iminoN2 atom and amino N1 atom, with N1 shifted to lower BE dueto interaction with the substrate. Most likely N1 aminonitrogen binds with O2−(Ce3+) anions via hydrogen; see furtherdiscussion. Such an effect of an amino group bonding viahydrogen atoms was observed on glycyl−glycine adsorption onCu(110) and was confirmed by theoretical calculations.38 Itwould seem to be unfavorable for the N1 atom to lose both ofits protons and then interact with the substrate. Acid−basebonding will also affect the binding energy of the C2 and C3atoms. The imino N2 atoms that are weakly and stronglybound to the CeO2 surface (which correspond to A and A′components in NEXAFS spectra) apparently have similarbinding energies, and we are not able to resolve them.With increasing temperature, the intensity of component D
gradually decreases, contributing to component C. The shift ofintensity from D to C is interpreted as deprotonation of the
Figure 5. O 1s core level spectra, photon energy 630 eV. Black lines,signal from clean substrates; dashed blue lines, signals from 1 MLhistidine overlayer on the corresponding substrate. The data forCeO1.9 is shifted by 0.33 eV to lower BE.
The Journal of Physical Chemistry B Article
dx.doi.org/10.1021/jp404385h | J. Phys. Chem. B 2013, 117, 9182−91939188

amino N3 nitrogen atom following eq 4, which is in line withthe NEXAFS results.
+ →
→ +
−
− −
His(C H N )(COO ) O temperature
His(C H N )(COO ) (OH)3 3 2 a s
3 2 2 a s (4)
where C3H2N2− is an imidazole ring with deprotonated amino
nitrogen atom. Again, the dissociated proton binds to a surfaceoxygen Os, forming a surface hydroxyl group (OH)s.Thermal treatment therefore induces stronger bonding of
histidine in the anionic form His2− with the cerium oxidesurface via the IM ring N3 atom, and is accompanied by theformation of surface OH groups. Comparison of changes in theD component area indicates N3 deprotonation is slower on thereduced oxide, implying the process is connected either withCe4+ or O2−(Ce4+) centers on the surface, the concentration ofwhich is lower for CeO1.9.We have shown that histidine binds to the cerium oxide
surface via the imino N2 and α-amino N1 atoms immediatelyafter adsorption at room temperature. Annealing of thehistidine adlayer induces additional interaction via deprotona-tion of the N3 atom, which is enhanced on the stoichiometricoxide.Similar behavior was observed for the 2 ML histidine adlayer
on CeO2 (see Figure 6d). Heating to 100 °C results indesorption of weakly bound zwitterionic species (component Ein the N 1s spectrum). The C component corresponding toimino nitrogen atoms always dominates, while the componentD again vanishes with increasing temperature. We concludethat the interfacial layer of histidine has the same nature(macroscopic qualities) for 1 and 2 ML coverage.
For 1 ML of histidine on Cu(111) after flashing to 100 °C,the new component F was found at binding energy 398.6 eVand was assigned to N−Cu strong bond formation.20,21 Theratio of the other two components is similar to previous cases.Heating of histidine overlayers on the cerium oxide and
Cu(111) surfaces resulted in molecular decomposition andpartial desorption starting from 200 °C. The N 1s peakintensity significantly decreased above 150 °C especially for theCu(111) substrate (see Figure 7). Thus, the molecular stabilityof histidine on the oxide is much higher than that on the coppersurface.
The C 1s core level spectra are shown in Figure 8. They werefitted with 4 Gaussian components with equal width, and BEvalues shown in Table 4. The total C 1s intensity (a) and theintensity of each single component for 1 ML His/CeO2 (b) and1 ML His/CeO1.9 (c) versus annealing temperature are shownin Figure 9. The ratio of peak intensities of p4 to (p1+p2+p3)was found to be 1:(5.05 ± 0.25) for all samples after depositionand flashing to 100 °C, so we conclude that the moleculeadsorbs intact with all six carbons. We are not aware of any gasphase measurements of histidine, but we can estimate thedifference in 1s binding energy between the carboxylic acidcarbon and the other carbon atoms in the following manner.Zhang et al.39 have measured the spectra of a number of relatedaromatic amino acids, and the carboxylic acid C 1s bindingenergy is between 294.6 and 294.85 eV. Wickrama Arachchilageet al.40 have measured the photoemission spectrum of a
Figure 6. N 1s core level spectra, photon energy 475 eV: (a) 1 ML His/CeO2; (b) 1 ML His/CeO1.9; (c) 1 ML His/Cu(111); (d) 2 ML His/CeO2.The data for CeO1.9 is shifted by 0.25 eV to lower BE.
Table 3. Binding Energies (eV) of N 1s Core LevelComponents Compared with Published Data
D C F
amino N imino N N-metal
2 ML His CeO2, 100 °C 401.00 399.691 ML His CeO2, 100 °C 401.03 399.521 ML His CeO1.9, 100 °C 401.06 399.521 ML His Cu(111), 100 °C 400.91 399.70 398.581 ML His gold23 400.9 399.51 ML His Cu(110)20 400.55 399.60 398.601 ML His Au(111)21 400.67 399.47 398.77
Figure 7. N 1s total intensity versus annealing temperature.
The Journal of Physical Chemistry B Article
dx.doi.org/10.1021/jp404385h | J. Phys. Chem. B 2013, 117, 9182−91939189
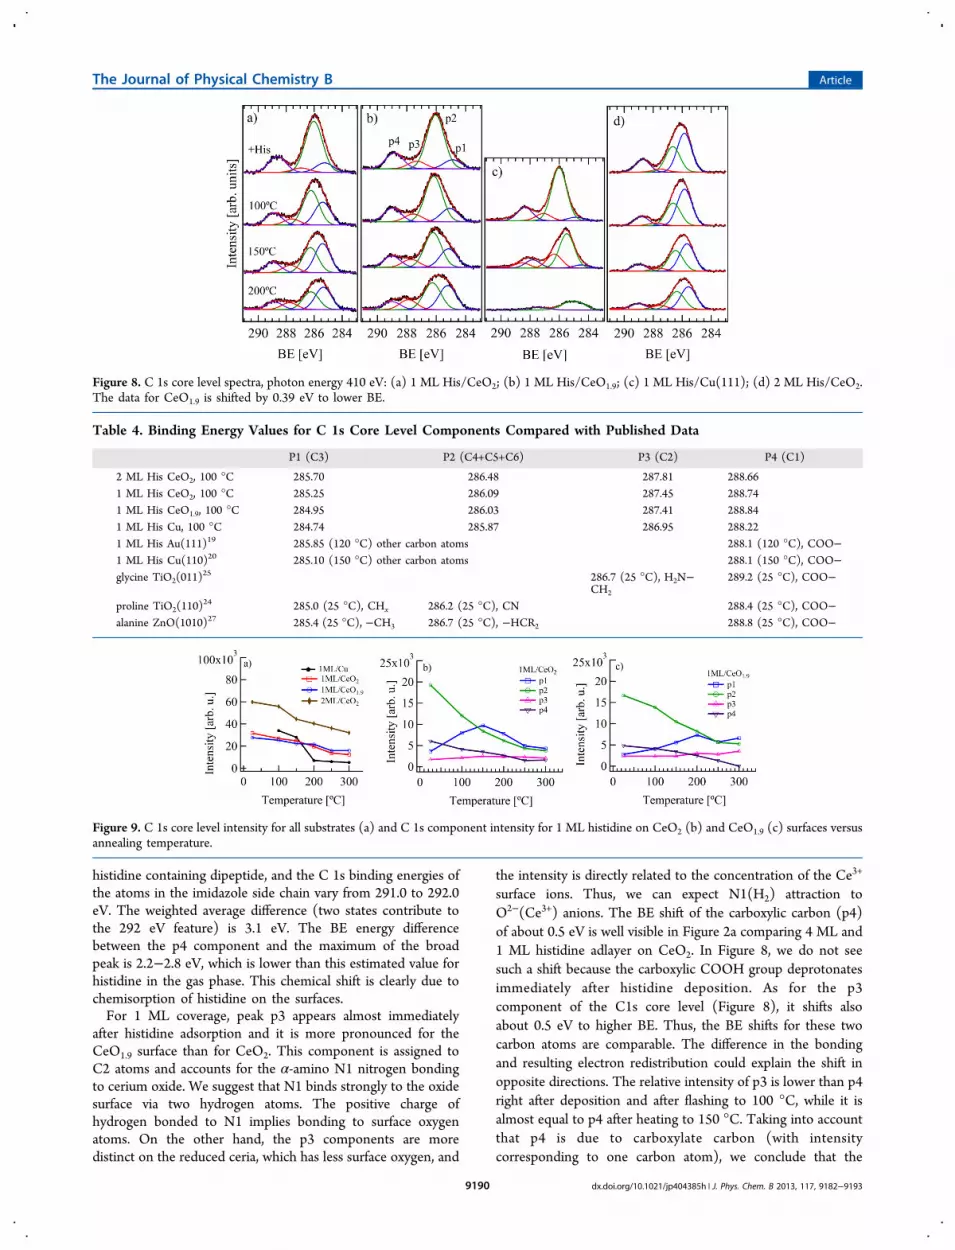
histidine containing dipeptide, and the C 1s binding energies ofthe atoms in the imidazole side chain vary from 291.0 to 292.0eV. The weighted average difference (two states contribute tothe 292 eV feature) is 3.1 eV. The BE energy differencebetween the p4 component and the maximum of the broadpeak is 2.2−2.8 eV, which is lower than this estimated value forhistidine in the gas phase. This chemical shift is clearly due tochemisorption of histidine on the surfaces.For 1 ML coverage, peak p3 appears almost immediately
after histidine adsorption and it is more pronounced for theCeO1.9 surface than for CeO2. This component is assigned toC2 atoms and accounts for the α-amino N1 nitrogen bondingto cerium oxide. We suggest that N1 binds strongly to the oxidesurface via two hydrogen atoms. The positive charge ofhydrogen bonded to N1 implies bonding to surface oxygenatoms. On the other hand, the p3 components are moredistinct on the reduced ceria, which has less surface oxygen, and
the intensity is directly related to the concentration of the Ce3+
surface ions. Thus, we can expect N1(H2) attraction toO2−(Ce3+) anions. The BE shift of the carboxylic carbon (p4)of about 0.5 eV is well visible in Figure 2a comparing 4 ML and1 ML histidine adlayer on CeO2. In Figure 8, we do not seesuch a shift because the carboxylic COOH group deprotonatesimmediately after histidine deposition. As for the p3component of the C1s core level (Figure 8), it shifts alsoabout 0.5 eV to higher BE. Thus, the BE shifts for these twocarbon atoms are comparable. The difference in the bondingand resulting electron redistribution could explain the shift inopposite directions. The relative intensity of p3 is lower than p4right after deposition and after flashing to 100 °C, while it isalmost equal to p4 after heating to 150 °C. Taking into accountthat p4 is due to carboxylate carbon (with intensitycorresponding to one carbon atom), we conclude that the
Figure 8. C 1s core level spectra, photon energy 410 eV: (a) 1 ML His/CeO2; (b) 1 ML His/CeO1.9; (c) 1 ML His/Cu(111); (d) 2 ML His/CeO2.The data for CeO1.9 is shifted by 0.39 eV to lower BE.
Table 4. Binding Energy Values for C 1s Core Level Components Compared with Published Data
P1 (C3) P2 (C4+C5+C6) P3 (C2) P4 (C1)
2 ML His CeO2, 100 °C 285.70 286.48 287.81 288.661 ML His CeO2, 100 °C 285.25 286.09 287.45 288.741 ML His CeO1.9, 100 °C 284.95 286.03 287.41 288.841 ML His Cu, 100 °C 284.74 285.87 286.95 288.221 ML His Au(111)19 285.85 (120 °C) other carbon atoms 288.1 (120 °C), COO−1 ML His Cu(110)20 285.10 (150 °C) other carbon atoms 288.1 (150 °C), COO−glycine TiO2(011)
25 286.7 (25 °C), H2N−CH2
289.2 (25 °C), COO−
proline TiO2(110)24 285.0 (25 °C), CHx 286.2 (25 °C), CN 288.4 (25 °C), COO−
alanine ZnO(1010)27 285.4 (25 °C), −CH3 286.7 (25 °C), −HCR2 288.8 (25 °C), COO−
Figure 9. C 1s core level intensity for all substrates (a) and C 1s component intensity for 1 ML histidine on CeO2 (b) and CeO1.9 (c) surfaces versusannealing temperature.
The Journal of Physical Chemistry B Article
dx.doi.org/10.1021/jp404385h | J. Phys. Chem. B 2013, 117, 9182−91939190

N1(H2)−O2−(Ce3+) bonding develops with temperature andmost likely depends on the Ce3+ cation surface concentration.Two components were distinguished in the broad main peak
centered at about 286 eV. According to the literature, p1corresponds to C bonded only to C and H and is assigned tothe C3 atom. p2 can be attributed to carbon atoms bonded toN in the IM ring. With increasing temperature, there is clearintensity redistribution between p1 and p2 (see Figure 9). Thep1 component grows faster on the CeO2 surface where theNEXAFS data showed the most parallel geometry for thehistidine IM ring and bonding of both nitrogen atoms to theoxide. For the partially reduced CeO1.9 surface, the growth ofp1 is slow and can be connected with the reducedconcentration of oxygen on the surface. We explain thisobservation as a mutual charge transfer between the histidinemolecule and the oxide; i.e., some charge from π orbitals of theIM ring goes to unoccupied 4f0 orbitals of the Ce4+ cations, andit is compensated by the Ce 5d electron donation to the πorbitals of the IM ring as a result of orbital hybridization, as wassuggested for water interaction with the cerium oxide surface inref 41. It is directly connected with the increase of the Ce3+
centers (4f1 configuration) on the surface and can explain thegradual development of the p3 component for 1 ML His/CeO2. The CeO1.9 surface has higher Ce
3+ initial concentration,and the N1(H2)−O2−(Ce3+) bonds form more readily. Thecharge transfer is in line with the amino N3 atomdeprotonation (decreasing intensity of the component D inthe N 1s spectra, together with vanishing of the component Bin the N K-edge absorption spectra). The CeO1.9 surfacepartially covered with Ce3+ ions is not so reactive. In this case,the deprotonation is suppressed and results in a smaller chargeexchange.We conclude that for CeO2 all three N atoms are involved in
the histidine bonding, with the IM ring parallel to the surface(which is confirmed by N K-edge NEXAFS spectra). Theamino nitrogen atom of the IM ring is deprotonated and bothIM nitrogen atoms form strong bonds via π orbitals, while theα-amino nitrogen interacts with the oxide via its hydrogenatoms. In the case of partially reduced CeO1.9, thedeprotonation of the amino N of the IM ring is lesspronounced and N K-edge NEXAFS spectra do not showsuch clear dependence on the angle.Valence band difference spectra (adsorbate-covered minus
clean surface spectra) of samples after flashing to 100 °C arepresented in Figure 10; the original spectra are shown in theSupporting Information. The spectra were measured with 43eV photon energy, corresponding to the high cross section ofthe histidine molecular orbitals. Feature A was assigned tononbonding molecular orbitals localized on the α-amino groupN1 and imino nitrogen N2 as well as oxygen lone pairs. Peaks Band C are related to the molecular orbitals of π and σsymmetry, respectively, which are strongly delocalized in theIM ring plane.20 For 1 ML histidine on CeO2 and CeO1.9, wedo not see the features assigned to π and σ orbitals due to theirlow intensity or delocalization. Two ML histidine coverage ischaracterized by a similar interface with the oxide surface withthe σ orbital feature shifted to lower BE with respect to 4 MLcoverage. The small feature at 2.4 eV can be assigned to the 4forbitals of cerium oxide filled by partial charge transfer fromhistidine, as was suggested for water interaction with the ceriumoxide surface.41 This feature is more pronounced for 1 MLhistidine on CeO2 and partially attenuated for 2 ML coverage.Apparently, interaction between π orbitals of the IM ring and f
and d orbitals of ceria results in mutual charge exchange,leading to occupation of the Ce 4f1(Ce3+) states. This process iscompensated by Ce 5d electron donation to histidine π orbitalsdue to their hybridization. The higher binding energy of 2.4 eVcompared to 1.4 eV for normal Ce 4f15d16s2 (Ce3+) states wasexplained by the less efficient screening of the f electrons in theCe 4f15d06s2 configuration.41
The results described above can be combined to construct amodel for the adsorption of histidine on the cerium oxide. Wepropose a model for the stoichiometric ordered CeO2 film inFigure 11. As observed with NEXAFS spectra, the IM ring
binds to the cerium oxide surface via its two nitrogen atoms,imino N and deprotonated amino N, and with the carboxylategroup; the ring is roughly parallel to the surface. Thephotoemission results are in good agreement with theseconclusions and provide further details on the histidineadsorption geometry. The N 1s core level with a singledominant component for 1 ML His/CeO2 after flashing to 150°C (Figure 6a) confirms the fact that all three nitrogen areinvolved in the strong bonding with the oxide. It was shownthat the N1 α-amino nitrogen interacts with O2−(Ce3+) anionsvia hydrogen atoms. The IM ring π orbitals hybridized with thef and d orbitals of ceria and charge exchange takes place leading
Figure 10. Valence band difference spectra of samples after flashing to100 °C, 43 eV photon energy. The data for CeO1.9 is shifted by 0.40eV to lower BE.
Figure 11. Adsorption model of histidine on the CeO2 surface: (a) topview; (b) side view.
The Journal of Physical Chemistry B Article
dx.doi.org/10.1021/jp404385h | J. Phys. Chem. B 2013, 117, 9182−91939191

to occupation of the Ce 4f1(Ce3+) states and explaining theslight reduction of the cerium oxide.We did not consider the dehydrogenation of the α-amino
group of adsorbed histidine on the cerium oxide and furtherreaction of hydrogen with OH groups on the cerium oxide,which results in water formation and its desorption, but itcannot be completely ruled out. Water molecules partiallydissociate on defects or step edge sites of cerium oxide at −110°C, so only a limited amount of adsorbed OH groups areexpected at room temperature on the reduced surface.37
Indeed, they contribute to the O 1s component at 532 eV onCeO1.9, while no intensity in this region was found on CeO2.Additional OH groups appear as a result of histidinedeprotonation and bonding in the His2− anionic form. Thus,the effect of OH groups would be much more pronounced onthe partially reduced CeO1.9 surface, where their concentrationis higher. Because of the low intensity, it was difficult to trackthe changes in the O 1s component at 532 eV with temperatureincrease. An alternative measure of the Ce3+ concentration isD(Ce3+), the resonant intensity of the valence states (Figure3b). The D(Ce3+) increase, i.e., the ceria reduction, wasobserved to be similar for CeO2 and CeO1.9 substrates, so thiseffect depends neither on the initial Ce3+ ion nor on the OHgroup surface concentration, and most likely, it is connectedwith the histidine−ceria bonding. Moreover, the slope of thelinear fit of the D(Ce3+) data is lower for the reduced surface,demonstrating that reduction is less in this case. It worthmentioning that no decrease in D(Ce4+) intensity was observedduring thermal treatment, so we can exclude oxygen loss fromthe surface in any form. This is in agreement with ourconclusion on mutual charge exchange between IM ringorbitals and Ce valence orbitals which is more pronounced onthe stoichiometric CeO2 surface.
■ CONCLUSIONSHistidine adlayers on the ordered stoichiometric CeO2(111)and reduced CeO1.9 thin films were investigated. The chemicalstate, coverage, and bonding of the molecules were studied bysynchrotron radiation photoelectron spectroscopy and resonantphotoelectron spectroscopy. Molecular orientation was exam-ined by near edge X-ray absorption fine structure spectroscopy.Cu(111) was used as a reference sample for the histidineadsorption. It was shown that histidine binds to CeO2 inanionic form His2−. Three functional groups contribute to thestrong bond formation: the carboxylate group, the imidazolering, and the α-amino group. The imino nitrogen atom of theIM ring, carboxylic oxygen atoms, and α-amino nitrogeninteract with the cerium oxide surface right after deposition.The deprotonation of the IM amino nitrogen was shown todepend on the concentration of the Ce4+ cations on the surfaceand was thermally induced. For 1 ML His/CeO2, the imidazolering was shown to be almost parallel to the surface. Mutualcharge transfer between the histidine molecule and the oxidewas observed, which was connected with the increase of theCe3+ centers on the CeO2 surface.The effect of surface defects on the histidine adsorption was
followed on the partially reduced ceria surface. Apart fromdisordered histidine overlayer formation, only a small differencein the deprotonation of the amino nitrogen of the imidazolering was observed.Heating of histidine overlayers on the cerium oxide or on
Cu(111) surfaces results in molecular decomposition andpartial desorption starting from 200 °C. It was shown that the
stability of histidine on the oxide is much higher than that onthe copper surface.
■ ASSOCIATED CONTENT*S Supporting InformationAn example of the Ce 3d core level spectra of thestoichiometric CeO2/Cu(111) oxide before and after histidineadsorption and subsequent annealing is given in Figure S1. Theoriginal valence band spectra of samples after flashing to 100 °Care shown in Figure S2. This material is available free of chargevia the Internet at http://pubs.acs.org.
■ AUTHOR INFORMATIONNotesThe authors declare no competing financial interest.
■ ACKNOWLEDGMENTSThe Materials Science Beamline is supported by the Ministry ofEducation of Czech Republic under Grant No. LG12003. Wegratefully acknowledge the assistance of our colleagues atElettra for providing good quality synchrotron light. The authorD.M. acknowledges the support from the UNiversity researchCEntre (UNCE) project no. 204023 of the Charles Universityin Prague. We thank V. Feyer and Y. Lykhach for helpfuldiscussions and T. Skala for technical assistance.
■ REFERENCES(1) El-Ansary, A.; Faddah, L. M. Nanoparticles as BiochemicalSensors. Nanotechnol., Sci. Appl. 2010, 3, 65−76.(2) Solanki, P. R.; Kaushik, A.; Agrawal, V. V.; Malholta, B. D.Nanostructured Metal Oxide-Based Biosensors. NPG Asia Mater.2011, 3, 17−24.(3) Rahman, M. M.; Ahammad, A. J. S.; Jin, J.-H.; Ahn, S. J.; Lee, J.-J.A Comprehensive Review of Glucose Biosensors Based on Nano-structured Metal-Oxides. Sensors 2010, 10, 4855−4886.(4) Trovarelli, A. Catalysis by Ceria and Related Materials; ImperialCollege Press: London, 2002.(5) Vayssilov, G. N.; Lykhach, Y.; Migani, A.; Staudt, T.; Petrova, G.P.; Tsud, N.; Skala, T.; Bruix, A.; Illas, F.; Prince, K. C.; et al. SupportNanostructure Boosts Oxygen Transfer to Catalytically ActivePlatinum Nanoparticles. Nat. Mater. 2011, 10, 310−315.(6) Tsud, N.; Skala, T.; Masek, K.; Hanys, P.; Takahashi, M.; Suga,H.; Mori, T.; Yoshikawa, H.; Yoshitake, M.; Kobayashi, K.; et al.Photoemission Study of the Tin Doped Cerium Oxide Thin FilmsPrepared by RF Magnetron Sputtering. Thin Solid Films 2010, 518,2206−2209.(7) Lykhach, Y.; Staudt, T.; Tsud, N.; Skala, T.; Prince, K. C.;Matolín, V.; Libuda, J. Enhanced Reactivity of Pt NanoparticlesSupported on Ceria Thin Films During Ethylene Dehydrogenation.Phys. Chem. Chem. Phys. 2011, 13, 253−261.(8) Lykhach, Y.; Staudt, T.; Lorenz, M. P. A.; Streber, R.; Bayer, A.;Steinruck, H.-P.; Libuda, J. Microscopic Insights into MethaneActivation and Related Processes on Pt/Ceria Model Catalysts.ChemPhysChem 2010, 11, 1496−1504.(9) Staudt, T.; Lykhach, Y.; Tsud, N.; Skala, T.; Prince, K. C.;Matolín, V.; Libuda, J. Ceria Reoxidation by CO2: a Model Study. J.Catal. 2010, 275, 181−185.(10) Matolín, V.; Johanek, V.; Skoda, M.; Tsud, N.; Prince, K. C.;Skala, T.; Matolínova, I. Methanol Adsorption and Decomposition onPt/CeO2(111)/Cu(111) Thin Film Model Catalyst. Langmuir 2010,26, 13333−13341.(11) Skala, T.; Tsud, N.; Prince, K. C.; Matolín, V. Formation ofAlumina−Ceria Mixed Oxide in Model Systems. Appl. Surf. Sci. 2011,257, 3682−3687.(12) Dvorak, F.; Stetsovych, O.; Steger, M.; Cherradi, E.; Matolínova,I.; Tsud, N.; Skoda, M.; Skala, T.; Myslivecek, J.; Matolín, V. Adjusting
The Journal of Physical Chemistry B Article
dx.doi.org/10.1021/jp404385h | J. Phys. Chem. B 2013, 117, 9182−91939192

Morphology and Surface Reduction of CeO2(111) Thin Films onCu(111). J. Phys. Chem. C 2011, 115, 7496−7503.(13) Mani, G.; Johnson, D. M.; Marton, D.; Feldman, M. D.; Patel,D.; Ayon, A. A.; Agrawal, C. M. Drug Delivery from Gold andTitanium Surfaces Using Self-Assembled Monolayers. Biomaterials2008, 29, 4561−4573.(14) Hirst, S. M.; Karakoti, A.; Singh, S.; Self, W.; Tyler, R.; Seal, S.;Reilly, C. M. Bio-Distribution and in vivo Antioxidant Effects ofCerium Oxide Nanoparticles in Mice. Environ. Toxicol. 2013, 28, 107−118.(15) Hirst, S. M.; Karakoti, A. S.; Tyler, R. D.; Sriranganathan, N.;Seal, S.; Reilly, C. M. Anti-Inflammatory Properties of Cerium OxideNanoparticles. Small 2009, 5, 2848−2856.(16) Celardo, I.; Pedersen, J. Z.; Traversa, E.; Ghibelli, L.Pharmacological Potential of Cerium Oxide Nanoparticles. Nanoscale2011, 3, 1411−1420.(17) Celardo, I.; De Nicola, M.; Mandoli, C.; Pedersen, J. Z.;Traversa, E.; Ghibelli, L. Ce3+ Ions Determine Redox-Dependent Anti-Apoptotic Effect of Cerium Oxide Nanoparticles. ACS Nano 2011, 5,4537−4549.(18) Marti, E. M.; Methivier, Ch.; Dubot, P.; Pradier, C. M.Adsorption of (S)-Histidine on Cu(110) and Oxygen-CoveredCu(110), a Combined Fourier Transform Reflection AbsorptionInfrared Spectroscopy and Force Field Calculation Study. J. Phys.Chem. B 2003, 107, 10785−10792.(19) Feyer, V.; Plekan, O.; Tsud, N.; Chab, V.; Matolín, V.; Prince, K.C. Adsorption of Histidine and Histidine-Containing Peptides onAu(111). Langmuir 2010, 26, 8606−8613.(20) Feyer, V.; Plekan, O.; Skala, T.; Chab, V.; Matolín, V.; Prince, K.C. The Electronic Structure and Adsorption Geometry of L-Histidineon Cu(110). J. Phys. Chem. B 2008, 112, 13655−13660.(21) Feyer, V.; Plekan, O.; Ptasin ska, S.; Iakhnenko, M.; Tsud, N.;Prince, K. C. Adsorption of Histidine and a Histidine Tripeptide onAu(111) and Au(110) from Acidic Solution. J. Phys. Chem. C 2012,116, 22960−22966.(22) Xu, Z.; Yuan, S.-L.; Yan, H.; Liu, C.-B. Adsorption of Histidineand Histidine-Containing Peptides on Au(111): a MolecularDynamics Study. Colloids Surf., A 2011, 380, 135−142.(23) Zubavichus, Y.; Zharnikov, M.; Yang, Y.; Fuchs, O.; Heske, C.;Umbach, E.; Tzvetkov, G.; Netzer, F. P.; Grunze, M. SurfaceChemistry of Ultrathin Films of Histidine on Gold as Probed byHigh-Resolution Synchrotron Photoemission. J. Phys. Chem. B 2005,109, 884−891.(24) Fleming, G. J.; Adib, K.; Rodriguez, J. A.; Barteau, M. A.; White,J. M.; Idriss, H. The Adsorption and Reactions of the Amino AcidProline on Rutile TiO2(110) Surfaces. Surf. Sci. 2008, 602, 2029−2038.(25) Wilson, J. N.; Dowler, R. M.; Idriss, H. Adsorption and Reactionof Glycine on the Rutile TiO2(011) Single Crystal Surface. Surf. Sci.2011, 605, 206−213.(26) Ataman, E.; Isvoranu, C.; Knudsen, J.; Schulte, K.; Andersen, J.N.; Schnadt, J. Adsorption of L-Cysteine on Rutile TiO2(110). Surf.Sci. 2011, 605, 179−186.(27) Gao, Y. K.; Traeger, F.; Shekhah, O.; Idriss, H.; Woll, C.Probing the Interaction of the Amino Acid Alanine with the Surface ofZnO(10−10). J. Colloid Interface Sci. 2009, 338, 16−21.(28) Stetsovych, V.; Pagliuca, F.; Dvorak, F.; Duchon, T.; Vorokhta,M.; Aulicka, M.; Lachnitt, J.; Schernich, S.; Matolínova, I.; Veltruska,K.; et al. Epitaxial Cubic Ce2O3 Films via Ce−CeO2 InterfacialReaction. J. Phys. Chem. Lett. 2013, 4, 866−871.(29) http://www.kolibrik.net/science/kolxpd/.(30) Briggs, D.; Seah, M. P. Practical Surface Analysis, 2nd ed.; JohnWiley & Sons Ltd: 1990; Vol. 1, Auger and X-ray PhotoelectronSpectroscopy.(31) http://www.chemspider.com.(32) Zubavichus, Y.; Shaporenko, A.; Grunze, M.; Zharnikov, M.Innershell Absorption Spectroscopy of Amino Acids at All RelevantAbsorption Edges. J. Phys. Chem. A 2005, 109, 6998−7000.
(33) Carravetta, V.; Plashkevych, O.; Ågren, H. A Theoretical Studyof the Near-Edge X-ray Absorption Spectra of Some Larger AminoAcids. J. Chem. Phys. 1998, 109, 1456−1464.(34) Apen, E.; Hitchcock, A. P.; Gland, J. L. Experimental Studies ofthe Core Excitation of Imidazole, 4,5-Dicyanoimidazole, and s-Triazine. J. Phys. Chem. 1993, 97, 6859−6866.(35) Kaznacheyev, K.; Osanna, A.; Jacobsen, C.; Plashkevych, O.;Vahtras, O.; Ågren, H.; Carravetta, V.; Hitchcock, A. P. InnershellAbsorption Spectroscopy of Amino Acids. J. Phys. Chem. A 2002, 106,3153−3168.(36) Taylor, J. B.; Mayor, L. C.; Swarbrick, J. C.; O’Shea, J. N.;Schnadt, J. Charge-Transfer Dynamics at Model Metal-Organic SolarCell Surfaces. J. Phys. Chem. C 2007, 111, 16646−16655.(37) Lykhach, Y.; Johanek, V.; Aleksandrov, H. A.; Kozlov, S. M.;Happel, M.; Skala, T.; Petkov, P., St.; Tsud, N.; Vayssilov, G. N.;Prince, K. C.; et al. Water Chemistry on Model Ceria and Pt/CeriaCatalysts. J. Phys. Chem. C 2012, 116, 12103−12113.(38) Feyer, V.; Plekan, O.; Tsud, N.; Lyamayev, V.; Chab, V.;Matolín, V.; Prince, K. C; Carravetta, V. Adsorption Structure ofGlycyl-Glycine on Cu(110). J. Phys. Chem. C 2010, 114, 10922−10931.(39) Zhang, W.; Carravetta, V.; Plekan, O.; Feyer, V.; Richter, R.;Coreno, M.; Prince, K. C. Electronic Structure of Aromatic AminoAcids Studied by Soft X-ray Spectroscopy. J. Chem. Phys. 2009, 131,35103−35114.(40) Wickrama Arachchilage, A. P.; Wang, F.; Feyer, V.; Plekan, O.;Prince, K. C. Photoelectron Spectra and Structures of Three CyclicDipeptides: PhePhe, TyrPro, and HisGly. J. Chem. Phys. 2012, 136,124301−124309.(41) Matolín, V.; Matolínova, I.; Dvorak, F.; Johanek, V.; Myslivecek,J.; Prince, K. C.; Skala, T.; Stetsovych, O.; Tsud, N.; Vaclavu, M.; et al.Water Interaction with CeO2(111)/Cu(111) Model Catalyst Surface.Catal. Today 2012, 181, 124−132.
The Journal of Physical Chemistry B Article
dx.doi.org/10.1021/jp404385h | J. Phys. Chem. B 2013, 117, 9182−91939193