Embed Size (px)
Citation preview

JOURNAL OF BONE AND MINERAL RESEARCHVolume 24, Number 3, 2009Published online on May 19, 2008; doi: 10.1359/JBMR.080505� 2009 American Society for Bone and Mineral Research
Bone Disease in Thalassemia: A Frequent and StillUnresolved Problem
Maria G Vogiatzi,1 Eric A Macklin,2 Ellen B Fung,3 Angela M Cheung,4 Elliot Vichinsky,3 Nancy Olivieri,4
Melanie Kirby,5 Janet L Kwiatkowski,6 Melody Cunningham,7 Ingrid A Holm,7 Joseph Lane,8 Robert Schneider,8
Martin Fleisher,9 Robert W Grady,1 Charles C Peterson,10 and Patricia J Giardina1 for the Thalassemia ClinicalResearch Network
ABSTRACT: Adults with b thalassemia major frequently have low BMD, fractures, and bone pain. Thepurpose of this study was to determine the prevalence of low BMD, fractures, and bone pain in all thalassemiasyndromes in childhood, adolescence, and adulthood, associations of BMD with fractures and bone pain, andetiology of bone disease in thalassemia. Patients of all thalassemia syndromes in the Thalassemia ClinicalResearch Network, $6 yr of age, with no preexisting medical condition affecting bone mass or requiringsteroids, participated. We measured spine and femur BMD and whole body BMC by DXA and assessedvertebral abnormalities by morphometric X-ray absorptiometry (MXA). Medical history by interview andreview of medical records, physical examinations, and blood and urine collections were performed. Threehundred sixty-one subjects, 49% male, with a mean age of 23.2 yr (range, 6.1–75 yr), were studied. Spine andfemur BMD Z-scores < 22 occurred in 46% and 25% of participants, respectively. Greater age, lower weight,hypogonadism, and increased bone turnover were strong independent predictors of low bone mass regardlessof thalassemia syndrome. Peak bone mass was suboptimal. Thirty-six percent of patients had a history offractures, and 34% reported bone pain. BMD was negatively associated with fractures but not with bone pain.Nine percent of participants had uniformly decreased height of several vertebrae by MXA, which was asso-ciated with the use of iron chelator deferoxamine before 6 yr of age. In patients with thalassemia, lowBMD and fractures occur frequently and independently of the particular syndrome. Peak bone mass issuboptimal. Low BMD is associated with hypogonadism, increased bone turnover, and an increased risk forfractures.J Bone Miner Res 2009;24:543–557. Published online on May 19, 2008; doi: 10.1359/JBMR.080505
Key words: DXA, BMD, fractures, vertebral morphometry, thalassemia
INTRODUCTION
THE THALASSEMIA SYNDROMES are a group of congenitalhemolytic anemias characterized by the reduced or ab-
sent synthesis of one or more globin chains of hemoglo-bin.(1) The two most common forms are the a and b thal-assemias. b Thalassemias include b thalassemia major (b
TM), b thalassemia intermedia (b TI), and E-b thalassemia(E-b), and result from >200 mutations affecting the b glo-bin gene cluster. The a thalassemia syndromes include he-moglobin H disease (HbH, or three gene a thalassemia),the co-inheritance of HbH disease with hemoglobin Con-stant Spring (HbH/CS) or other nondeletional a-globin mu-tations, and homozygous a thalassemia (Hz a).
The hallmark of thalassemia is an imbalance in a to b
globin production, with the severity of anemia related tothe degree of this imbalance. The variable phenotypic ex-pression within and among the thalassemia syndromes re-sults in a wide spectrum of anemia, which may require pe-riodic or regular transfusions to sustain life.(1) Typically,patients with b TM, Hz a, and HbH/CS and some with E-brequire regular transfusions, whereas b TI and HbH aretransfused sporadically, if at all. Because there is no physi-ologic means of excreting iron, transfusion therapy leads toprogressive iron overload and ultimately multiple endocri-nopathies, and potentially, lethal hepatic and/or cardiaccomplications. Iron chelation therapy with deferoxamine(DFO), introduced in the mid-1960s, has changed thecourse of transfusional iron overload, reducing iron excessand dramatically prolonging survival.(2,3)
Historically, b TM was associated with marked osseouschanges, and in particular, facial and limb deformities that
1Department of Pediatrics, Weill Medical College of Cornell, New York, New York, USA; 2New England Research Institutes,Watertown, Massachusetts, USA; 3Children’s Hospital Oakland, Oakland, California, USA; 4Department of Medicine, University HealthNetwork and Mount Sinai Hospital, Toronto, Canada; 5Toronto Hospital for Sick Children, Toronto, Canada; 6Division of Hematology,Children’s Hospital of Philadelphia and Department of Pediatrics, University of Pennsylvania School of Medicine, Philadelphia, Penn-sylvania, USA; 7Division of Hematology & Oncology, Children’s Hospital Boston, Boston, Massachusetts, USA; 8Hospital for SpecialSurgery, New York, New York, USA; 9Memorial Sloan-Kettering Cancer Cancer, New York, New York, USA; 10National Heart, Lung,and Blood Institute, NIH, Bethesda, Maryland, USA.
The authors state that they have no conflicts of interest.
543

were attributed to bone marrow expansion and corticalthinning caused by massive ineffective erythropoiesis.(4,5)
The introduction of regular transfusion therapy in the mid-1960s to maintain a near-normal hemoglobin level resultedin diminution or prevention of bone deformities.(6) There-fore, the detection of low bone mass in many regularlytransfused and well-chelated b TM patients over the lastdecade was quite unexpected.(7,8) There is now a growingawareness that many transfusion-dependent adult patientswith b TM and b TI suffer from long-standing bone painand low bone mass.(9,10) The presence of low bone mass,fractures, and bone pain (referred to collectively in thispaper as bone disease) in patients with other thalassemiasyndromes is unclear. Little is known about the prevalenceof low bone mass in children and adolescents with thalas-semia or the current rate of fractures and associations withbone mass and bone pain. Furthermore, the etiology ofbone disease in thalassemia is poorly understood. A num-ber of studies have examined the effect of various condi-tions on the pathogenesis of bone disease, including inef-fective erythropoiesis, iron overload, treatment with DFO,vitamin D concentrations, the influence of endocrinopa-thies, such as hypogonadism and growth hormone defi-ciency, and the thalassemia genotype.(11–17) The resultshave frequently been contradictory, and the studies havebeen hindered by small sample size and variable practiceregimens.
The Thalassemia Clinical Research Network (TCRN)consists of five thalassemia centers in North America andtheir associated satellite sites with access to patients havingboth a and b thalassemia syndromes. The TCRN per-formed a cross-sectional study of BMD, fracture, and bonepain histories and vertebral morphology among its patientsto better understand the severity of bone disease in thalas-semia and its etiology. The purpose of the study was todetermine the prevalence of low bone mass, fractures, andbone pain across all ages and thalassemia syndromes and todescribe associations between bone mass and fractures. Weevaluated the associations of anemia, transfusion and che-lation management, iron burden and related endocrinopa-thies, and environmental and genetic factors with bonemass, fractures, and pain. We also sought to identifychanges in bone turnover that are involved in the develop-ment of bone disease in thalassemia. From these results, wehope to develop future preventative strategies and moreeffective treatment regimens.
MATERIALS AND METHODS
Study protocol
TCRN patients of all thalassemia genotypes, $6 yr ofage, were eligible for this study. Exclusion criteria includedpregnancy, any known preexisting medical conditionknown to affect bone mass, and chronic systemic adminis-tration of steroids. The protocol was approved by theTCRN Data and Safety Monitoring Board and by the ethi-cal review boards of all TCRN institutions. All participantsprovided signed informed consent.
Study participants underwent a complete physical exami-
nation and measurement of BMD and vertebral morphom-etry by DXA. A medical history was obtained by interviewand review of medical records. Dietary calcium intake wasestimated from a 46-item, self-completed food frequencyquestionnaire. Physical activity was reported as very light,light, moderate, active, or very active using a standard-ized questionnaire. A fasting morning blood sample wasobtained for measurement of N-telopeptides (NTX),C-telopeptides (CTX), bone-specific alkaline phosphatase(BSALP), free thyroxine and thyroid-stimulating hormone(TSH), IGF1, IGF binding protein 3 (IGFBP3), serum go-nadotropins (luteinizing hormone [LH] and follicle-stimu-lating hormone [FSH]), testosterone (males), 25-hydrox-yvitamin D (25 vit D), 1,25-dihydroxyvitamin D (1,25 vit D),intact PTH, serum calcium, phosphorus, ferritin, and trans-ferrin receptor concentrations. A second morning void wascollected for measurement of urinary NTX and deoxypyr-idinoline cross-links (D-Pyr). A 24-h urine collection wasperformed for measurement of calcium excretion. Bone agewas determined from X-rays of the left hand and wrist ofparticipants <20 yr of age and read locally according to themethod of Greulich and Pyle.(18)
Procedures
BMD and morphometry: BMD of the lumbar spine (L1–L4; spine) and left proximal femur (femur), a lateral lumbarscan (lat spine) for calculation of volumetric lumbar BMD,and whole body BMC were measured by Hologic QDR4500 scanners with Delphi software upgrades. The precisionof spine and femur BMD measurements was determined byduplicate measurement of 140 and 138 subjects, respec-tively. The root mean square errors (RMSEs) of spineand femur BMD were 0.022 (CV = 4.6%) and 0.009 g/cm2
(CV = 1.3%), respectively. Except for assessing precision,only the first of the two duplicate scans was used for statis-tical analysis. The unanalyzed BMD images were processedand analyzed by a single, blinded technologist and radiolo-gist at a central processing center (Hospital for Special Sur-gery, New York, NY, USA). BMD results were analyzed ata distinct Data Coordinating Center (DCC).
The presence of vertebral fractures and deformities wasassessed by morphometric X-ray absorptiometry (MXA)using Hologic Instant Vertebral Assessment (IVA). Find-ings from T10 to L4 were analyzed by a single senior radi-ologist (RS). The severity of deformities was graded usingthe Genant method(19): grade I, 20–25% reduction in ante-rior, posterior, or midvertebral height; grade II, 25–40%reduction; grade III, >40% reduction.
Laboratory assays: Urine and serum samples from eachparticipant were stored at –808C and analyzed as a batch ata central facility. Serum NTX and CTX and urine NTXwere measured by a competitive inhibition, enzyme-linkedimmunoabsorbent assay, D-Pyr by a solid-phase, enzyme-labeled chemiluminescent immunometric assay, IGF1,IGFBP3, and BSALP by a solid-phase, enzyme-linkedimmunoassay (ELISA), 25 vit D by competitive radioim-munoassay after extraction, 1,25 vit D by column chroma-tography and radioimmunoassay, intact PTH by immu-nochemiluminometric assay, and free T4, LH, FSH, andTSH by high sensitivity heterogeneous sandwich separation
544 VOGIATZI ET AL.

assay. Testosterone was measured by a solid-phase, com-petitive radioimmunoassay. Serum ferritin levels were de-termined by a radioimmunoassay (RIA, T-14; RamcoLaboratories, Houston, TX, USA). Serum transferrin re-ceptor concentrations were measured by an enzyme immu-noassay (EIA; T-94; Ramco Laboratories).
Statistical analysis
Calculated variables: Patients with b thalassemia wereclassified as having TM if they had received eight or moretransfusions during the 12 mo before entering the study oras TI if less.
Body mass index (BMI) was calculated as kilograms permeters squared. Anthropometric Z-scores were calculatedrelative to age- and sex-specific norms for whites producedby the CDC from NHANES III data. Midparental heightswere calculated as the average parental height ± 6.5 cm forboys and girls, respectively. BMD Z-scores were calculatedrelative to age-, sex-, and race-specific norms provided byHologic. Asian and Middle Eastern individuals were com-pared with white norms. Bone age–adjusted BMD Z-scoreswere calculated for participants <20 yr old using each par-ticipant’s estimated bone age for selecting the appropriatenorm.
Right skewed blood and urine assay results were log-transformed to reduce the influence of highly leveragedpoints to better conform to the distributional assumptionsof the models applied. Vitamin D deficiency was defined asa 25 vit D concentration <11 ng/ml and insufficiency as aconcentration between 11 and 30 ng/ml. The presence ofhypogonadism, growth hormone deficiency, hypothyroid-ism, hypoparathyroidism, or diabetes mellitus was definedas having an identified clinical history or prescribed treat-ment. In addition, hypoparathyroidism was defined as anintact PTH level below normal range for our assay in thepresence of albumin-adjusted hypocalcemia (serum calcium< 8.5 mg/dl). Among females, hypogonadism was defined aslack of spontaneous menses after the age of 16, having ahistory of using hormone replacement therapy (HRT) forfailure to proceed through puberty or loss of menses beforeage 40, or current use of HRT. Hypogonadism in males wasdetermined by the prescription of HRT (testosterone orHCG) or by having a serum testosterone concentrationlower than established norms for age. Inadequate gonadalsteroid replacement in hypogonadal males was confirmedby having a serum testosterone concentration lower thanestablished norms for age despite prescribed HRT. Fastinghyperglycemia (blood glucose > 126 mg/dl), having a historyof fasting hyperglycemia or of an abnormal glucose re-sponse to oral glucose tolerance test (blood glucose > 126mg/dl at 0 min or >200 mg/dl at 120 min), having a historyof prescribed therapy with oral hypoglycemics or insulin, orcurrent therapy with oral hypoglycemics or insulin was usedto determine the presence of diabetes. The diagnosis ofgrowth hormone deficiency in children with growth failurewas made after endocrine referral at each participating siteand appropriate testing.
Self-reported bone and joint pain during the 30 days be-fore the study interview was classified as an ordinal painseverity index according to the participant’s use of pain
medications as follows: no reported pain, reported pain notrequiring use of medications, pain treated with over-the-counter medications, and pain treated with prescriptionpain killers.
Analyses: Continuous variables were summarized asmeans, SDs, and ranges. Categorical variables were sum-marized as simple percentages. Analyses of DXA resultsand bone turnover markers were analyzed in general linearmodels controlling for age as a covariate using partial-linearsplines with either one node at age 20 yr for DXA results ortwo nodes at ages 11 and 20 yr for bone turnover markers.These intervals are the outer range of initiation andcompletion of puberty across both sexes and matchedbreakpoints in the distribution of the data. In addition toage, analyses of whole body BMC included sex and race(Asian, white, and other race) as covariates in all models.Pairwise comparisons among least-square means of cat-egorical predictors were adjusted for multiple comparisonsby the Tukey-Kramer method. Ages of peak bone masswere estimated by locally linear generalized additive mod-els,(20) with bias-corrected and accelerated bootstrapCIs.(21) Age-dependent incidence of fractures was analyzedin proportional means models,(22) with age at study entryincluded as a covariate in all models. Pain severity wasanalyzed by ordinal logistic regression, with age and sexincluded as covariates. Presence of vertebral fractures anddeformities identified by MXA were analyzed by binarylogistic regression with age as a covariate. Wald p valuesand profile likelihood CIs are reported from proportionalmeans and logistic regression models. Multiple regressionmodels were selected from all analysis variables by stepwiseregression with final variable selection by the Bayesian in-formation criterion.
Analyses were generally exploratory, with the aim of de-scribing observed patterns in the data. Multiple comparisoncorrections for the large number of models and outcomemeasures analyzed were not made. All inferences werebased on two-tailed tests with a threshold of a = 0.05 fordeclaring significance. Analyses were conducted using SAS(version 9.1.3; SAS Institute, Cary, NC, USA) and S-Plus(version 7.0; Insightful, Seattle, WA, USA).
RESULTS
Participant characteristics
A total of 386 individuals consented to the study, and 372completed the protocol, of whom 9 were excluded becauseof prior stem cell transplantation, chronic use of systemicsteroids, or incomplete data. In addition, only two partici-pants had Hz a and were not included in our analysis be-cause their sample size precluded meaningful interpretationof their data.
Characteristics of the 361 eligible participants who com-pleted DXA scanning and had b, E-b, or common a thal-assemias are presented in Table 1. Mean height and weightwere within 2 SDs of the general population mean for allthalassemia syndromes. However, 95 participants (27% of352 with height measurements) had significant growth fail-ure, with height Z-scores below 22 SD. The mean bone age
LOW BONE MASS AND FRACTURES IN THALASSEMIA 545

TA
BL
E1
.C
HA
RA
CT
ER
IST
ICS
OF
ST
UD
YP
AR
TIC
IPA
NT
S*
Ch
ara
cter
isti
cA
llp
art
icip
an
ts(n
=3
61
)B
eta
TM
(n=
23
6)
Bet
aT
I(n
=4
3)
E/b
eta
(n=
43
)H
bH
dis
ease
(n=
19
)H
bH
/CS
(n=
20
)
Dem
ogr
aph
ics
Age
atti
me
of
DX
A
scan
(yrs
)
23.2
±12
.1(6
.1–7
5.4)
24.4
±11
.6(6
.1–5
3.2)
26.3
±16
.2(6
.1–7
5.4)
19.5
±9.
3(7
.0–4
8.2)
15.1
±8.
7(6
.9–3
9.6)
17.1
±10
.0(6
.2–5
1.2)
06–1
0yr
69(1
9.1%
)34
(14.
4%)
10(2
3.3%
)11
(25.
6%)
8(4
2.1%
)6
(30.
0%)
11–1
9yr
94(2
6.0%
)55
(23.
3%)
9(2
0.9%
)12
(27.
9%)
8(4
2.1%
)10
(50.
0%)
20yr
or
old
er19
8(5
4.8%
)14
7(6
2.3%
)24
(55.
8%)
20(4
6.5%
)3
(15.
8%)
4(2
0.0%
)
Sex
Mal
e17
6/36
1(4
8.8%
)11
6/23
6(4
9.2%
)20
/43
(46.
5%)
20/4
3(4
6.5%
)7/
19(3
6.8%
)13
/20
(65.
0%)
Rac
eA
sian
152
(42.
1%)
78(3
3.1%
)6
(14.
0%)
40(9
3.0%
)10
(52.
6%)
18(9
0.0%
)
Wh
ite
186
(51.
5%)
154
(65.
3%)
30(6
9.8%
)1
(2.3
%)
1(5
.3%
)0
(0.0
%)
Oth
er23
(6.4
%)
4(1
.7%
)7
(16.
3%)
2(4
.7%
)8
(42.
1%)
2(1
0.0%
)
An
thro
po
met
rics
Hei
ght
Z-s
core
21.
26±
1.17
(25.
08–1
.81)
21.
38±
1.17
(25.
08–1
.56)
20.
52±
0.95
(22.
17–1
.81)
21.
54±
1.18
(24.
12–0
.57)
20.
91±
1.11
(23.
10–1
.24)
21.
29±
0.99
(23.
21–0
.30)
Wei
ght
Z-s
core
20.
80±
1.23
(24.
57–2
.78)
20.
73±
1.26
(24.
57–2
.78)
20.
51±
0.92
(22.
80–1
.20)
21.
38±
1.22
(24.
03–0
.96)
20.
76±
1.59
(23.
72–2
.06)
21.
15±
0.85
(22.
94–0
.32)
BM
IZ
-sco
re2
0.17
±1.
09(2
4.52
–2.7
1)2
0.04
±1.
09(2
4.51
–2.7
1)2
0.28
±0.
89(2
3.08
–1.2
2)2
0.52
±0.
91(2
2.89
–1.2
3)2
0.48
±1.
77(2
4.52
–1.9
3)2
0.51
±0.
94(2
3.21
–0.8
8)
Bo
ne
age
(yrs
,o
nly
if
<20
yr)
11.5
±4.
7(4
.5–2
0.0)
11.7
±4.
6(5
.0–2
0.0)
10.2
±4.
7(5
.0–2
0.0)
10.8
±4.
1(5
.8–1
8.0)
12.3
±4.
3(7
.8–2
0.0)
13.1
±7.
9(4
.5–2
0.0)
Ch
ron
olo
gic
age
2b
on
e
age
(yr,
on
lyif
<20
yr)
0.60
±1.
51(2
4.44
–4.5
4)0.
59±
1.46
(22.
73–4
.54)
0.88
±1.
12(2
0.87
–3.4
9)1.
17±
1.39
(21.
27–4
.05)
20.
40±
1.58
(24.
00–1
.69)
20.
00±
2.66
(24.
44–1
.82)
Hei
ght
Z-s
core
2
mid
par
enta
lh
eigh
t
Z-s
core
,o
nly
if>
20yr
20.
73±
1.24
(24.
82–2
.63)
20.
98±
1.22
(24.
82–2
.63)
0.04
±0.
85(2
1.26
–2.0
1)2
0.01
±1.
19(2
3.58
–1.2
3)0.
57±
0.70
(0.0
8–1.
07)
0.31
±0.
67(2
0.46
–0.7
0)
Tra
nsf
usi
on
san
dch
elat
ion
Hem
ogl
ob
in(g
/dL
)9.
7±
1.4
(6.0
–14.
7)10
.1±
1.1
(7.3
–14.
7)9.
1±
1.8
(6.0
–13.
6)8.
7±
1.7
(6.2
–12.
1)9.
5±
0.9
(7.9
–11.
3)9.
2±
1.7
(6.8
–12.
4)
Tra
nsf
erri
nre
cep
tor
(mg/
ml)
26.1
±17
.6(2
.5–1
15.9
)20
.0±
11.4
(2.5
–66.
3)42
.6±
18.1
(14.
6–82
.2)
39.1
±24
.1(6
.7–1
15.9
)16
.3±
5.8
(8.0
–28.
8)44
.7±
17.8
(6.3
–66.
8)
Tra
nsf
usi
on
rate
(ml/
kg/
mo
)
9.8
±6.
9(0
.0–3
1.1)
13.2
±4.
4(0
.9–3
1.1)
2.5
±5.
6(0
.0–2
5.0)
6.5
±7.
1(0
.0–2
5.3)
N/A
2.5
±6.
4(0
.0–2
1.3)
Age
star
ted
8±
tran
sfu
sio
ns/
yr
(yr)
3.1
±6.
5(0
.0–4
5.0)
2.6
±6.
4(0
.0–4
5.0)
10.5
±10
.2(0
.0–2
7.0)
4.7
±4.
4(0
.0–1
7.0)
N/A
2.6
±3.
7(0
.0–8
.0)
Yea
rso
n8
±
tran
sfu
sio
ns/
yr
17.8
±10
.9(0
.0–4
4.0)
19.5
±10
.7(1
.0–4
4.0)
3.8
±2.
7(0
.0–7
.0)
10.5
±6.
4(0
.0–2
5.0)
N/A
3.0
±0.
0(3
.0–3
.0)
Fer
riti
n(n
g/m
l)16
62±
1741
(10–
1228
0)19
92±
1668
(94–
1199
5)73
6±
865
(17–
3865
)18
98±
2454
(14–
1228
0)92
±78
(10–
311)
680
±10
38(6
7–39
40)
Iro
nch
elat
ion
Un
chel
ated
95(2
6.4%
)8
(3.4
%)
28(6
5.1%
)23
(54.
8%)
19(1
00.0
%)
17(8
5.0%
)
DF
O24
1(6
6.9%
)20
7(8
7.7%
)14
(32.
6%)
19(4
5.2%
)0
(0.0
%)
11(5
.0%
)
ICL
21(5
.8%
)18
(7.6
%)
11(2
.3%
)0
(0.0
%)
0(0
.0%
)2
(10.
0%)
DF
P3
(0.8
%)
3(1
.3%
)0
(0.0
%)
0(0
.0%
)0
(0.0
%)
0(0
.0%
)
Age
star
ted
DF
Oth
erap
y9.
0±
9.2
(0.0
–51.
0)7.
6±
7.6
(0.0
–46.
0)21
.7±
12.3
(6.0
–51.
0)13
.2±
11.1
(0.0
–43.
0)N
/A14
.3±
20.7
(2.0
–45.
0)
Yea
rso
nD
FO
13.4
±8.
3(2
1.0–
30.0
)14
.5±
8.1
(0.0
–30.
0)7.
7±
8.2
(21.
0–22
.0)
7.1
±6.
2(0
.0–2
4.0)
N/A
2.0
±1.
7(1
.0–4
.0)
Pre
scri
bed
DF
Od
ose
(mg/
kg/
d)
32.2
±11
.5(3
.7–6
2.5)
32.2
±11
.5(3
.7–6
2.5)
27.7
±11
.2(5
.4–4
4.4)
37.5
±8.
8(2
2.5–
56.9
)N
/A13
.2(N
=1)
546 VOGIATZI ET AL.

of children and adolescents was close to their chronologicalage. Hypogonadism was the most frequent endocrinopathy,affecting 34% of females and 38% of males. Vitamin Ddeficiency (25 vit D < 11 ng/ml) and insufficiency (25 vitD = 11–30 ng/ml) were found in 12% and 70% of partici-pants, respectively. Growth hormone deficiency was pres-ent in 9.6%, diabetes mellitus in 9.2%, hypothyroidism in8.7%, and hypoparathyroidism in 1.4% of study partici-pants. Twenty-nine adults were treated with a bisphospho-nate.
Bone mass
Demographic profile: Spine, femur, and whole bodyBMD were close to age norms at age 6 yr. A strong negativeassociation between bone mass and age, which was moremarked in the age group 11–19 years of age was observed(20.84 SD/5 yr; 95% CI, 21.10 to 20.59 SD; p < 0.001 forwhole body BMD among participants < 20 yr of age; Figs. 1and 2). The rates of spine BMD Z-scores less than –2 in-creased from 8.7% among participants 6–10 yr old to 44%in those 11–19 yr old and 61% in patients >20 yr old. Aboveage 20 yr, the association between spine BMD and age wasnearly constant relative to age norms (20.008 SD/5 yr; 95%CI, 20.08–0.07 SD; p = 0.25; Figs. 1 and 2). Similar patternsof BMD Z-scores versus age were observed for the femur.Sex or race did not account for the differences in the spineand femur BMD Z-scores. Norms for adult male wholebody BMD were not available, but among females, wholebody BMD Z-scores increased modestly but insignificantly(p = 0.15) above age 20 yr, perhaps reflecting a survivalbias. Peak bone mass, estimated as the age with maximumwhole body BMC, occurred at 22.4 (95% CI, 19.0–31.8) and29.8 yr (95% CI, 23.5–34.0) among females and males, re-spectively (Fig. 1C). Among participants 20–29 yr of age,86% (75/87) had spine BMD Z-scores less than 21 SD,indicating suboptimal peak bone mass.
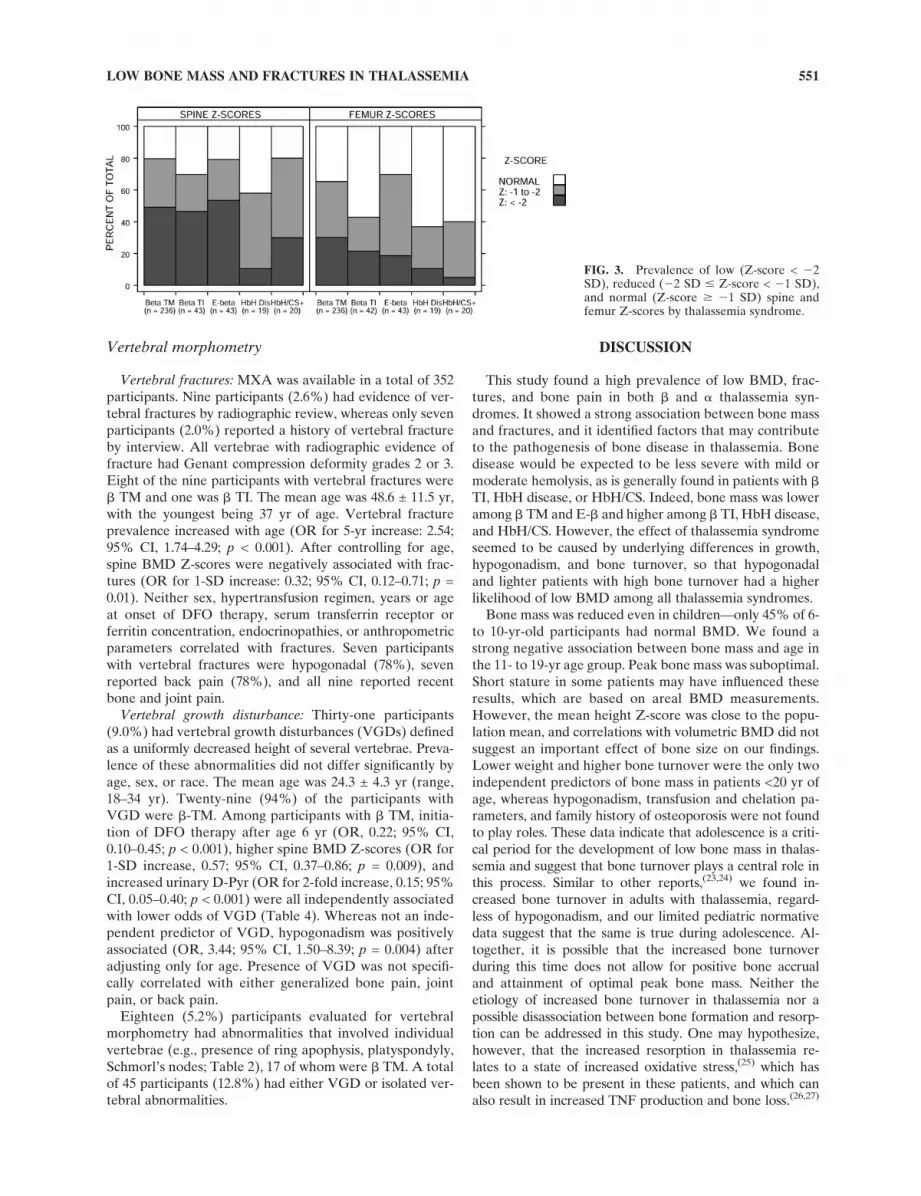
Thalassemia syndromes: Low spine and femur BMD(Table 2; Fig. 3) and whole body BMD were prevalentamong all thalassemia syndromes. Frequencies of BMD Z-scores below 21 SD ranged from 58% to 80% for spine andfrom 37% to 70% for femur. Whole body BMD normativedata were available only for children and adolescents andadult females. Among children and adolescents, prevalenceof whole body BMD Z-scores below –1 SD was similarlyhigh across all thalassemia syndromes, ranging from 50% to74%.
Estimated mean spine BMD Z-scores of a 20 yr oldranged from 21.64 to 22.37 SD (mean [95% CI]: b TM,22.37 [22.64,22.11]; b TI, 22.15 [22.56,21.75]; E-b, 22.34[22.74,21.95]; HbH Dis, 21.64 [22.16,21.11]; HbH/CS, 22.00[22.52,21.49]), controlling for sex and race. Age-, sex-, andrace-adjusted BMD Z-scores and whole body BMC werelower among b TM and E-b participants and higher amongb TI, HbH disease, and HbH/CS participants (spine, p =0.062; femur, p = 0.028; whole body BMC, p = 0.025; Fig.3), although individual pairwise comparisons were not sig-nificant after controlling for multiple comparisons. SpineBMD Z-scores of b TM and TI participants did not differsignificantly (p = 0.74).
Spine BMD was lower than femur BMD relative to their
TA
BL
E1
.C
ON
TIN
UE
D
Ch
ara
cter
isti
cA
llp
art
icip
an
ts(n
=3
61
)B
eta
TM
(n=
23
6)
Bet
aT
I(n
=4
3)
E/b
eta
(n=
43
)H
bH
dis
ease
(n=
19
)H
bH
/CS
(n=
20
)
Th
alas
sem
iaco
mp
lica
tio
ns
Hyp
ogo
nad
ism
No
rmal
207
(58.
5%)
101
(43.
9%)
35(8
1.4%
)33
(78.
6%)
18(9
4.7%
)20
(100
.0%
)
Del
ayed
pu
ber
ty19
(8.2
%)
11(9
.3%
)4
(10.
3%)
3(8
.1%
)11
(5.3
%)
0(0
.0%
)
Hyp
ogo
nad
al12
8(3
6.2%
)11
8(5
1.3%
)4
(9.3
%)
6(1
4.3%
)0
(0.0
%)
0(0
.0%
)
Gro
wth
ho
rmo
ne
defi
cien
cy33
/344
(9.6
%)
29/2
23(1
3.0%
)2/
42(4
.8%
)2/
42(4
.8%
)0/
18(0
.0%
)0/
19(0
.0%
)
Hyp
oth
yro
idis
m31
/358
(8.7
%)
28/2
34(1
2.0%
)2/
43(4
.7%
)0/
42(0
.0%
)0/
19(0
.0%
)1/
20(5
.0%
)
Hyp
op
arat
hyr
oid
ism
5/35
8(1
.4%
)5/
234
(2.1
%)
0/42
(0.0
%)
0/43
(0.0
%)
0/19
(0.0
%)
0/20
(0.0
%)
Dia
bet
esm
elli
tus
33/3
58(9
.2%
)33
/234
(14.
1%)
0/43
(0.0
%)
0/42
(0.0
%)
0/19
(0.0
%)
0/20
(0.0
%)
25(O
H)
vita
min
D
<11
ng/
ml
42(1
2.0%
)27
(11.
7%)
5(1
2.2%
)6
(14.
3%)
0(0
.0%
)4
(20.
0%)
11–3
0n
g/m
l24
5(6
9.8%
)14
9(6
4.8%
)31
(75.
6%)
35(8
3.3%
)15
(83.
3%)
15(7
5.0%
)
$30
ng/
ml
64(1
8.2%
)54
(23.
5%)
5(1
2.2%
)11
(2.4
%)
3(1
6.7%
)11
(5.0
%)
Med
icat
edh
eart
dis
ease
20/3
59(5
.6%
)20
/235
(8.5
%)
0/43
(0.0
%)
0/42
(0.0
%)
0/19
(0.0
%)
0/20
(0.0
%)
Cir
rho
sis
13/3
52(3
.7%
)12
/231
(5.2
%)
1/42
(2.4
%)
0/40
(0.0
%)
0/19
(0.0
%)
0/20
(0.0
%)
Hep
atit
isC
84/3
59(2
3.4%
)75
/235
(31.
9%)
3/43
(7.0
%)
6/42
(14.
3%)
0/19
(0.0
%)
0/20
(0.0
%)
*V
alu
es
for
con
tin
uo
us
vari
ab
les
are
mean
±S
D(r
an
ge).
Valu
es
for
cate
go
rica
lvari
ab
les
are
N/t
ota
l(%
).T
ota
lsfo
rso
me
measu
res
are
less
than
the
tota
ln
um
ber
of
part
icip
an
tsb
eca
use
of
mis
sin
gd
ata
.
DF
O,
defe
roxam
ine;
ICL
,d
efe
rasi
rox
(ora
lir
on
chela
tor)
;D
FP
,d
efe
rip
ron
e(o
ral
iro
nch
ela
tor)
;B
MI,
bo
dy
mass
ind
ex;
N/A
,n
ot
ap
pli
cab
le.
LOW BONE MASS AND FRACTURES IN THALASSEMIA 547

norms (0.67 SD; 95% CI, 0.59–0.76 SD; p < 0.001). Thedifference between spine and femur BMD Z-scores in-creased significantly across adolescence (p < 0.001) and wasgreater among males than females (0.25 SD; 95% CI, 0.08–0.42 SD; p = 0.004) but was not associated with race orthalassemia syndrome.
Associations: Results of analyses of spine and femurBMD Z-scores controlling for age, and whole body BMCcontrolling for age, sex, and race are presented in Table 3.These include associations with demographic, genetic, an-thropometric, and environmental factors, transfusion andchelation parameters, thalassemia-related endocrinopathies
and co-morbidities, markers of bone turnover, serum IGF1and IGFBP3 concentrations, serum chemistry including Caand P, and 25 vit D concentrations. A number of positiveassociations were observed (Table 3). Although hypogo-nadism was negatively associated with BMD (Table 3), hy-pogonadal participants who were on gonadal steroid re-placement had the same BMD as untreated hypogondalsubjects. Participants with vitamin D deficiency had signifi-cantly lower BMD (Table 3). The relationship between 25vit D and BMD Z-score (adjusted for age) was not linear,reaching a plateau at 25 vit D concentrations >15 ng/ml.Finally, no analysis identified any association betweentreatment with bisphosphonates and bone mass.
Multiple regression analysis: Many of the important pre-dictors of bone mass identified above covary. In multipleregression models, age, weight Z-score, hypogonadism, andmarkers of bone turnover were consistently strong and in-dependent predictors of spine and femur BMD Z-scoresand whole body BMC (Table 4). Spine and femur Z-scoreshad a strong negative association with age during adoles-cence, were higher in heavier participants, and were lowerin hypogonadal participants and those with elevated uri-nary D-Pyr (p < 0.001 for all). Whole body BMC resultswere similar except that BSALP was a stronger indepen-dent predictor than D-Pyr. In addition to these parameters,25 vit D was an independent positive predictor of spineBMD Z-scores; family history of osteoporosis was a nega-tive predictor of femur BMD, whereas serum FSH concen-trations were a positive predictor of both femur and wholebody BMC (Table 4).
Further analysis focused on participants <20 yr of age tobetter understand the factors that may affect BMD duringadolescence. Among participants <20 yr old, age, weightZ-score, and bone turnover rate continued to be strong,independent predictors of bone mass, but hypogonadism,family history of osteoporosis, and 25 vit D were no longersignificant. Sex, race, BSALP, and FSH remained signifi-cant, independent predictors of whole body BMC.
Calendar age versus bone age: Spine BMD Z-scores inchildren and adolescents were also analyzed after calculat-ing a bone age-adjusted Z-score (BA Z-score) to controlfor slow maturation of participants with growth-associatedendocrinopathies. This minimally reduced the percentageof children and adolescents with spine and femur BMDZ-scores below 21 SD from 65% to 59% and from 48% to42%, respectively. Bone age–adjusted spine Z-scores con-tinued to be strongly associated with anthropometric pa-rameters, but significant associations found in this agegroup between hypogonadism, growth hormone deficiency,IGF-1 levels, and bone turnover markers and calendar agespine BMD Z-scores were not found with bone age–adjusted spine BMD Z-scores.
Volumetric BMD: Areal spine BMD using an anterior-posterior (AP) projection may underestimate true BMD insmall and growing individuals. Volumetric spine BMD, cal-culated by combining AP and lateral lumbar projections,may provide a more accurate assessment of BMD in suchindividuals. Because norms for volumetric BMD were onlyavailable for adult women, we studied possible bias in APestimates by testing for height dependence in the relationship
FIG. 1. Bone mass vs. age. (A and B) Spine BMD (g/cm2) withage-dependent reference norms for whites (solid line) and ±2 SD(dashed lines) for males (A) and females (B). (C) Whole bodyBMC (kg) with locally weighted regressions for males (solid line)and females (dashed line). One individual age 75 yr is omitted(symbols: male, u; female, s).
548 VOGIATZI ET AL.

between AP and volumetric BMD. For a given AP BMD,volumetric BMD is greater when height Z-scores are lower(p = 0.001); however, the magnitude of difference is small(0.005 g/cm3/SD; 95% CI, 0.002–0.008 g/cm3/SD) and doesnot suggest an important effect of size on our findings.
Bone turnover markers
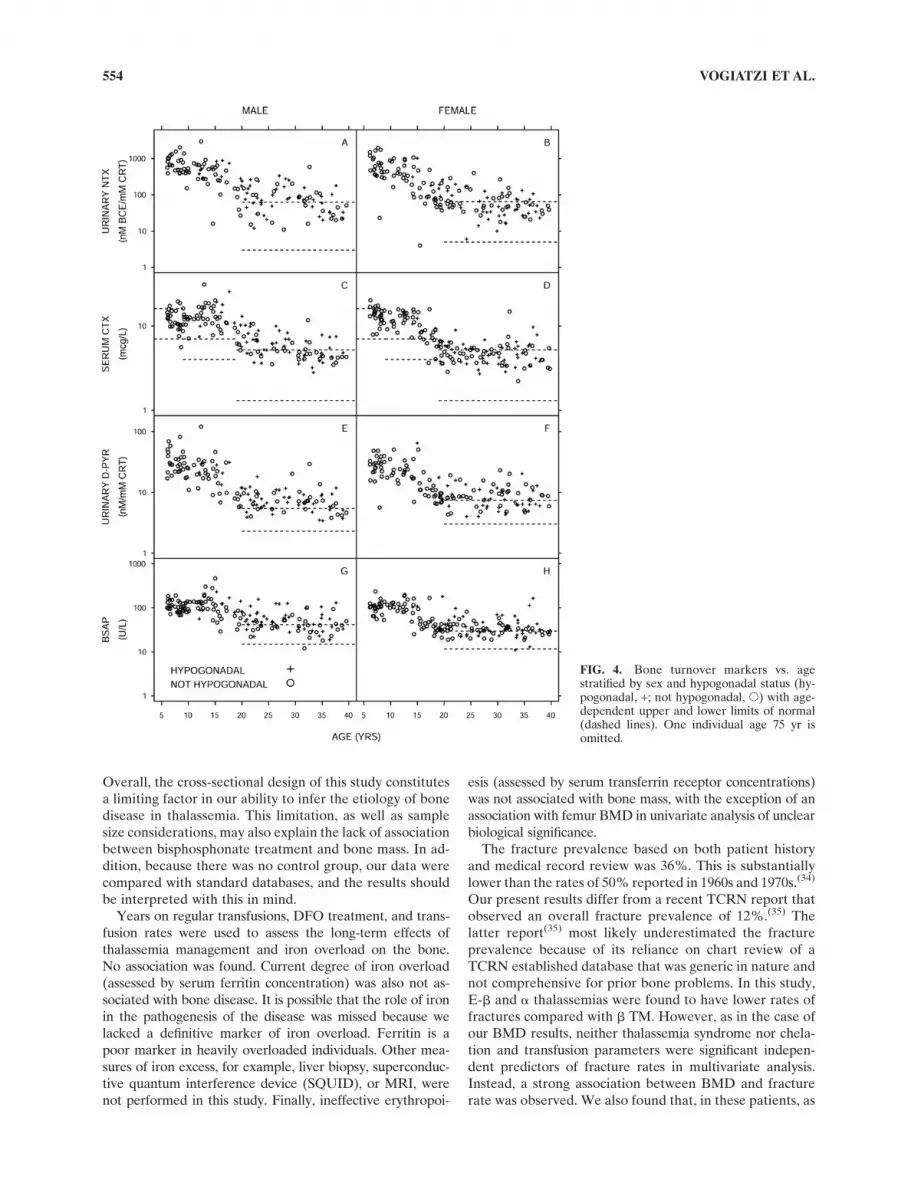
Serum and urinary concentrations of bone turnovermarkers were plotted for all ages (Fig. 4), overlaying avail-able normative data. Limited pediatric normative data areavailable. Bone turnover is high during childhood and ado-lescence compared with adults, reflecting rapid bone devel-opment. Adults, regardless of the presence or absence ofhypogonadism, had substantially elevated levels of bothbone resorption and formation markers, indicating elevatedbone turnover.
Self-reported fractures
By participant self-reporting and review of medical rec-ords, fractures occurred in 36% of participants, with 8.9%reporting three or more lifetime fractures (Table 2). Ex-tremity fractures were most common at 33%, followed byback and hip fractures at 3.6%. The cumulative risk forfractures increased almost linearly with age (p < 0.001).Overall, no sex difference was seen; however, among par-ticipants <20 yr of age, males were more likely to fracturecompared with females (mean ratio, 2.5; 95% CI, 1.1–5.6;p = 0.026). Asian participants reported lower fracture ratesthan whites (p = 0.025).
The fracture incidence rate varied significantly amongthe thalassemia syndromes (p = 0.014), with E-b and a
thalassemia participants having lower fractures rates com-pared with b TM participants (mean ratio [95% C1]: E-b,0.40 [0.20,0.81]; HbH/CS, 0.10 [0.01,0.70]). The prevalenceof a history of fractures among adults was 55% in TM and71% in TI (Fig. 5); this difference was not significant. Theeffect of thalassemia syndrome was lost in multivariateanalysis.
Spine and femur BMD Z-score and total body BMCwere negatively associated with fracture rate. For a 1-SDdecrease in spine or femur BMD Z-score, the mean fracture
rate increased by 37% or 47%, respectively (p < 0.001 forboth). After controlling for age, higher D-Pyr concentra-tions, hypogonadism, histories of medicated heart disease,and hepatitis C were associated with higher fracture rates.Other bone turnover markers, other endocrinopathies,transfusion and chelation histories, and childhood activitywere not significantly associated with fracture rate. In amultiple regression model selected by stepwise regression,increased fracture rates were independently associated withlower spine BMD Z-score, greater relative weight, and his-tory of hepatitis C (Table 4).
Bone and joint pain
Thirty-four percent of participants reported having boneor joint pain during the 30 days before enrollment (Fig. 5).Six percent required prescription pain medications and anadditional 12.2% used over-the-counter analgesics (Table2). Age, sex, and thalassemia syndrome were all indepen-dent predictors of the presence and severity of bone andjoint pain (Table 4). The odds of more severe pain in-creased 47% for each 5-yr age increment. Forty percent offemales but only 28% of males complained of recent pain.Bone pain was reported more frequently among b TM par-ticipants (40%) compared with b TI and E-b participants(16% and 19%, respectively) (Fig. 5). Reported bone andjoint pain was not associated with bone mass or fractures.Age at starting transfusion or chelation, units of bloodtransfused, and ferritin and transferrin receptor concentra-tions did not correlate with the presence or severity of bonepain, indicating that iron overload and transfusion-relatedparameters did not explain the higher frequency of bonepain among TM participants. Participants with GH defi-ciency reported more severe bone pain (OR, 2.33; 95% CI,1.11–4.76; p = 0.022), as did those with histories of medi-cated heart disease, cirrhosis, or hepatitis C, but these werenot independent of age, sex, and thalassemia syndrome.Hypogonadism, other endocrinopathies, serum vitamin Dconcentrations, total calcium intake, and weight and heightmeasurements were not associated with bone pain. Partici-pants who reported being more active at the time of thestudy reported less pain, but this likely reflects the fact thatpeople in pain are usually less active, not the converse.
FIG. 2. Spine, femur, and total body BMDZ-scores with a partial-linear spline (solidline) and 95% CI (dashed lines). Individuals>40 yr of age are omitted.
LOW BONE MASS AND FRACTURES IN THALASSEMIA 549

TA
BL
E2
.B
ON
ED
ISE
AS
EA
MO
NG
TH
AL
AS
SE
MIA
SY
ND
RO
ME
S*
Ch
ara
cter
isti
cA
llp
art
icip
an
ts(n
=361)
bT
M(n
=2
36
)b
TI
(n=
43
)E
/b(n
=4
3)
Hb
Hd
isea
se(n
=1
9)
Hb
H/C
S(n
=2
0)
BM
D
Sp
ine
BM
DZ
-sco
re(a
llag
es)
21.
90±
1.17
(24.
95–1
.18)
22.
02±
1.19
(24.
95–1
.18)
21.
70±
1.20
(24.
50–0
.91)
21.
97±
1.11
(23.
76–0
.61)
20.
97±
0.82
(22.
42–0
.71)
21.
54±
0.83
(23.
46to
20.
08)
06–1
0yr
Z<
22
SD
6(8
.7%
)3
(8.8
%)
0(0
.0%
)1
(9.1
%)
1(1
2.5%
)1
(16.
7%)
22
#Z
<
21
SD
32(4
6.4%
)18
(52.
9%)
3(3
0.0%
)5
(45.
5%)
3(3
7.5%
)3
(50.
0%)
Z$
21
SD
31(4
4.9%
)13
(38.
2%)
7(7
0.0%
)5
(45.
5%)
4(5
0.0%
)2
(33.
3%)
11–1
9yr
Z<
22
SD
41(4
3.6%
)24
(43.
6%)
4(4
4.4%
)7
(58.
3%)
1(1
2.5%
)5
(50.
0%)
22
#Z
<
21
SD
27(2
8.7%
)14
(25.
5%)
1(1
1.1%
)4
(33.
3%)
4(5
0.0%
)4
(40.
0%)
Z$
21
SD
26(2
7.7%
)17
(30.
9%)
4(4
4.4%
)1
(8.3
%)
3(3
7.5%
)1
(10.
0%)
20yr
or
old
erZ
<2
2S
D12
0(6
0.6%
)89
(60.
5%)
16(6
6.7%
)15
(75.
0%)
0(0
.0%
)0
(0.0
%)
22
#Z
<
21
SD
53(2
6.8%
)40
(27.
2%)
6(2
5.0%
)2
(10.
0%)
2(6
6.7%
)3
(75.
0%)
Z$
21
SD
25(1
2.6%
)18
(12.
2%)
2(8
.3%
)3
(15.
0%)
11(3
3.3%
)11
(25.
0%)
Bo
ne-
age
adju
sted
spin
e
BM
DZ
-sco
re(o
nly
if
<20
yr)
21.
15±
1.07
(24.
17–1
.70)
21.
21±
1.09
(24.
17–1
.70)
20.
72±
1.28
(23.
11–1
.34)
21.
25±
0.98
(22.
62–1
.25)
20.
87±
0.64
(22.
39to
20.
15)
21.
82±
1.07
(23.
18to
20.
53)
Sp
ine
BM
DT
-sco
re(o
nly
if$
20yr
)
22.
41±
1.12
(24.
95–1
.18)
22.
44±
1.17
(24.
95–1
.18)
22.
44±
0.86
(24.
54to
20.
11)
22.
42±
1.17
(24.
00–0
.25)
21.
54±
0.44
(21.
89to
21.
04)
21.
72±
0.55
(22.
10to
20.
92)
Fem
ur
BM
DZ
-sco
re(a
ll
ages
)
21.
22±
1.14
(24.
71–2
.31)
21.
39±
1.13
(24.
71–2
.31)
20.
86±
1.22
(23.
43–1
.90)
21.
20±
1.07
(23.
38–1
.58)
20.
53±
1.10
(22.
20–1
.35)
20.
70±
0.74
(22.
13–0
.50)
Fem
ur
BM
DT
-sco
re(o
nly
if$
20yr
)
21.
58±
1.08
(24.
16–2
.23)
21.
73±
1.03
(24.
16–2
.23)
21.
15±
1.09
(23.
49–0
.69)
21.
28±
1.23
(22.
91–1
.54)
20.
56±
0.67
(21.
28–0
.04)
20.
58±
0.55
(20.
91–0
.24)
Wh
ole
bo
dy
BM
C(k
g,o
nly
if$
20yr
)
1.74
±0.
38(0
.95–
3.11
)1.
72±
0.38
(0.9
5–3.
11)
1.87
±0.
36(1
.28–
2.60
)1.
70±
0.45
(1.2
1–2.
86)
1.70
±0.
21(1
.58–
1.94
)1.
95±
0.42
(1.5
7–2.
51)
Fra
ctu
res
and
bo
ne
pai
n
Fra
ctu
res
Zer
o23
0(6
4.2%
)13
9(5
9.1%
)21
(50.
0%)
34(8
1.0%
)17
(89.
5%)
19(9
5.0%
)
1–2
96(2
6.8%
)70
(29.
8%)
16(3
8.1%
)8
(19.
0%)
11(5
.3%
)11
(5.0
%)
3o
rm
ore
32(8
.9%
)26
(11.
1%)
5(1
1.9%
)0
(0.0
%)
11(5
.3%
)0
(0.0
%)
Pai
nse
veri
tyN
op
ain
237
(65.
8%)
142
(60.
2%)
36(8
3.7%
)34
(81.
0%)
12(6
3.2%
)13
(65.
0%)
No
med
s57
(15.
8%)
41(1
7.4%
)2
(4.7
%)
5(1
1.9%
)5
(26.
3%)
4(2
0.0%
)
OC
med
s44
(12.
2%)
35(1
4.8%
)2
(4.7
%)
3(7
.1%
)11
(5.3
%)
3(1
5.0%
)
Rx
med
s22
(6.1
%)
18(7
.6%
)3
(7.0
%)
0(0
.0%
)11
(5.3
%)
0(0
.0%
)
Bac
ko
rh
ipp
ain
95/3
60(2
6.4%
)76
/236
(32.
2%)
5/43
(11.
6%)
4/42
(9.5
%)
4/19
(21.
1%)
6/20
(30.
0%)
Ver
teb
ral
mo
rph
om
etry
Rad
iogr
aph
icfr
actu
res
9/34
4(2
.6%
)8/
224
(3.6
%)
1/42
(2.4
%)
0/40
(0.0
%)
0/18
(0.0
%)
0/20
(0.0
%)
Gen
eral
gro
wth
dis
turb
ance
31/3
44(9
.0%
)29
/224
(12.
9%)
0/42
(0.0
%)
2/40
(5.0
%)
0/18
(0.0
%)
0/20
(0.0
%)
Iso
late
dve
rteb
ral
def
orm
ity
18/3
44(5
.2%
)17
/224
(7.6
%)
0/42
(0.0
%)
0/40
(0.0
%)
0/18
(0.0
%)
1/20
(5.0
%)
*V
alu
es
for
con
tin
uo
us
vari
ab
les
are
mean
±S
D(r
an
ge).
Valu
es
for
cate
go
rica
lvari
ab
les
are
N/t
ota
l(%
).T
ota
lsfo
rso
me
measu
res
are
less
than
the
tota
ln
um
ber
of
part
icip
an
tsb
eau
seo
fm
issi
ng
data
.
OC
med
s,o
ver
the
cou
nte
rm
ed
s;R
xm
ed
s,p
resc
rip
tio
nm
ed
icati
on
s.
550 VOGIATZI ET AL.
Vertebral morphometry
Vertebral fractures: MXA was available in a total of 352participants. Nine participants (2.6%) had evidence of ver-tebral fractures by radiographic review, whereas only sevenparticipants (2.0%) reported a history of vertebral fractureby interview. All vertebrae with radiographic evidence offracture had Genant compression deformity grades 2 or 3.Eight of the nine participants with vertebral fractures wereb TM and one was b TI. The mean age was 48.6 ± 11.5 yr,with the youngest being 37 yr of age. Vertebral fractureprevalence increased with age (OR for 5-yr increase: 2.54;95% CI, 1.74–4.29; p < 0.001). After controlling for age,spine BMD Z-scores were negatively associated with frac-tures (OR for 1-SD increase: 0.32; 95% CI, 0.12–0.71; p =0.01). Neither sex, hypertransfusion regimen, years or ageat onset of DFO therapy, serum transferrin receptor orferritin concentration, endocrinopathies, or anthropometricparameters correlated with fractures. Seven participantswith vertebral fractures were hypogonadal (78%), sevenreported back pain (78%), and all nine reported recentbone and joint pain.
Vertebral growth disturbance: Thirty-one participants(9.0%) had vertebral growth disturbances (VGDs) definedas a uniformly decreased height of several vertebrae. Preva-lence of these abnormalities did not differ significantly byage, sex, or race. The mean age was 24.3 ± 4.3 yr (range,18–34 yr). Twenty-nine (94%) of the participants withVGD were b-TM. Among participants with b TM, initia-tion of DFO therapy after age 6 yr (OR, 0.22; 95% CI,0.10–0.45; p < 0.001), higher spine BMD Z-scores (OR for1-SD increase, 0.57; 95% CI, 0.37–0.86; p = 0.009), andincreased urinary D-Pyr (OR for 2-fold increase, 0.15; 95%CI, 0.05–0.40; p < 0.001) were all independently associatedwith lower odds of VGD (Table 4). Whereas not an inde-pendent predictor of VGD, hypogonadism was positivelyassociated (OR, 3.44; 95% CI, 1.50–8.39; p = 0.004) afteradjusting only for age. Presence of VGD was not specifi-cally correlated with either generalized bone pain, jointpain, or back pain.
Eighteen (5.2%) participants evaluated for vertebralmorphometry had abnormalities that involved individualvertebrae (e.g., presence of ring apophysis, platyspondyly,Schmorl’s nodes; Table 2), 17 of whom were b TM. A totalof 45 participants (12.8%) had either VGD or isolated ver-tebral abnormalities.
DISCUSSION
This study found a high prevalence of low BMD, frac-tures, and bone pain in both b and a thalassemia syn-dromes. It showed a strong association between bone massand fractures, and it identified factors that may contributeto the pathogenesis of bone disease in thalassemia. Bonedisease would be expected to be less severe with mild ormoderate hemolysis, as is generally found in patients with b
TI, HbH disease, or HbH/CS. Indeed, bone mass was loweramong b TM and E-b and higher among b TI, HbH disease,and HbH/CS. However, the effect of thalassemia syndromeseemed to be caused by underlying differences in growth,hypogonadism, and bone turnover, so that hypogonadaland lighter patients with high bone turnover had a higherlikelihood of low BMD among all thalassemia syndromes.
Bone mass was reduced even in children—only 45% of 6-to 10-yr-old participants had normal BMD. We found astrong negative association between bone mass and age inthe 11- to 19-yr age group. Peak bone mass was suboptimal.Short stature in some patients may have influenced theseresults, which are based on areal BMD measurements.However, the mean height Z-score was close to the popu-lation mean, and correlations with volumetric BMD did notsuggest an important effect of bone size on our findings.Lower weight and higher bone turnover were the only twoindependent predictors of bone mass in patients <20 yr ofage, whereas hypogonadism, transfusion and chelation pa-rameters, and family history of osteoporosis were not foundto play roles. These data indicate that adolescence is a criti-cal period for the development of low bone mass in thalas-semia and suggest that bone turnover plays a central role inthis process. Similar to other reports,(23,24) we found in-creased bone turnover in adults with thalassemia, regard-less of hypogonadism, and our limited pediatric normativedata suggest that the same is true during adolescence. Al-together, it is possible that the increased bone turnoverduring this time does not allow for positive bone accrualand attainment of optimal peak bone mass. Neither theetiology of increased bone turnover in thalassemia nor apossible disassociation between bone formation and resorp-tion can be addressed in this study. One may hypothesize,however, that the increased resorption in thalassemia re-lates to a state of increased oxidative stress,(25) which hasbeen shown to be present in these patients, and which canalso result in increased TNF production and bone loss.(26,27)
FIG. 3. Prevalence of low (Z-score < 22SD), reduced (22 SD # Z-score < 21 SD),and normal (Z-score $ 21 SD) spine andfemur Z-scores by thalassemia syndrome.
LOW BONE MASS AND FRACTURES IN THALASSEMIA 551
Because current chelation and transfusion regimens haveremained largely unchanged in this cohort over the last 20yr, it seems that current thalassemia therapies do not pre-vent or retard the development of low bone mass.
Hypogonadism was a strong independent predictor oflow bone mass. Surprisingly, we did not find higher BMDamong hypogonadal subjects who received gonadal steroidreplacement compared with those untreated. It is possiblethat this is related to the cross-sectional design of the study,the delayed or inadequate replacement with gonadal ste-roids, or intermittent compliance with the prescribed treat-ment. Gonadal steroid replacement schemes in females ofthis study were frequently similar to the regimens used in
postmenopausal women, which may be inadequate for op-timal bone accrual.(28) Nonetheless, the potential beneficialeffect of gonadal steroid replacement in thalassemia shouldnot be dismissed based on this study. An improvement ofBMD in thalassemia with gonadal steroid replacement hasbeen reported in some studies but not others.(11,29–31) Thus,this subject needs to be rigorously evaluated by longitudinalrandomized studies testing various types of gonadal re-placement. Further longitudinal studies are also needed todetermine the optimal serum 25 vit D concentrations fornormal bone mass accrual and maintenance in thalasse-mia,(32,33) because we found high rates of vitamin D defi-ciency and insufficiency, as well as a negative and nonlinear
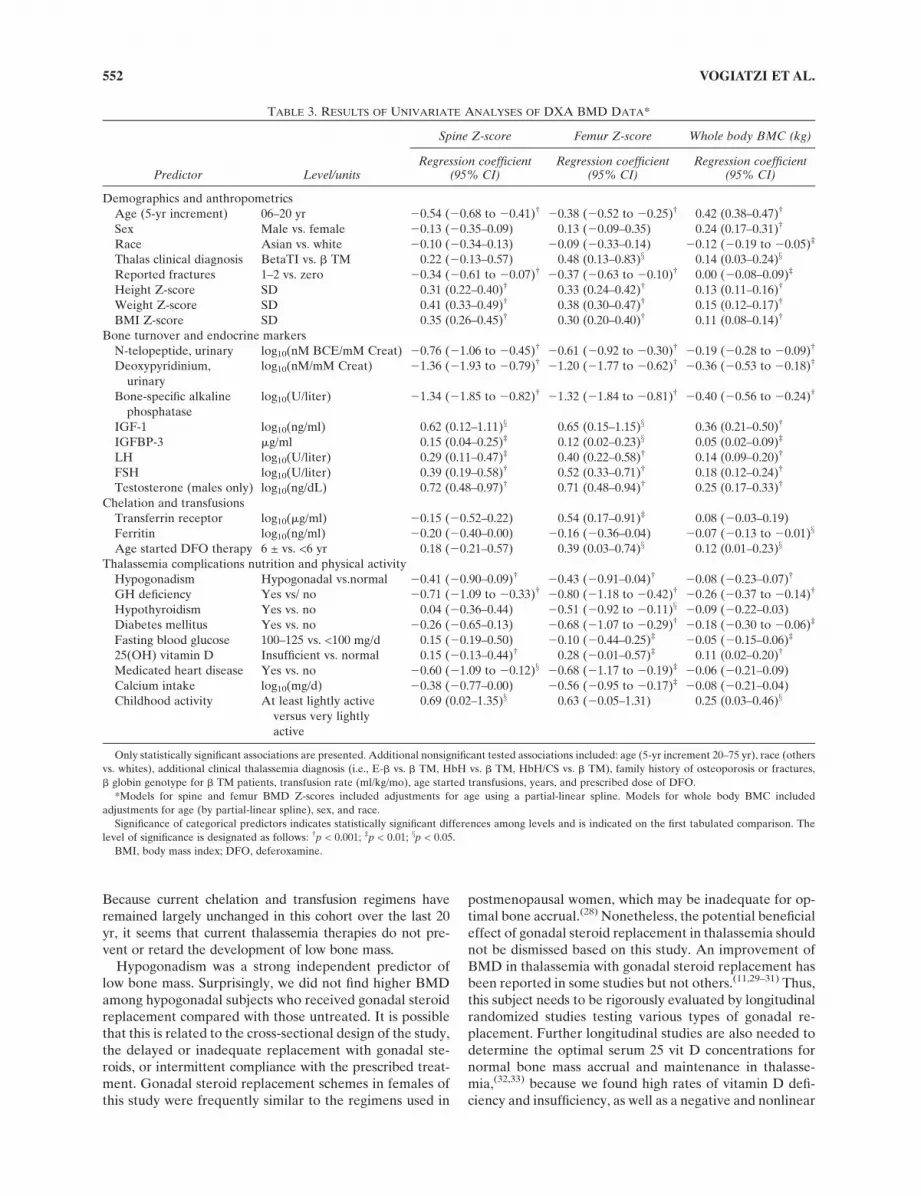
TABLE 3. RESULTS OF UNIVARIATE ANALYSES OF DXA BMD DATA*
Predictor Level/units
Spine Z-score Femur Z-score Whole body BMC (kg)
Regression coefficient(95% CI)
Regression coefficient(95% CI)
Regression coefficient(95% CI)
Demographics and anthropometrics
Age (5-yr increment) 06–20 yr 20.54 (20.68 to 20.41)† 20.38 (20.52 to 20.25)† 0.42 (0.38–0.47)†
Sex Male vs. female 20.13 (20.35–0.09) 0.13 (20.09–0.35) 0.24 (0.17–0.31)†
Race Asian vs. white 20.10 (20.34–0.13) 20.09 (20.33–0.14) 20.12 (20.19 to 20.05)‡
Thalas clinical diagnosis BetaTI vs. b TM 0.22 (20.13–0.57) 0.48 (0.13–0.83)x 0.14 (0.03–0.24)x
Reported fractures 1–2 vs. zero 20.34 (20.61 to 20.07)† 20.37 (20.63 to 20.10)† 0.00 (20.08–0.09)‡
Height Z-score SD 0.31 (0.22–0.40)† 0.33 (0.24–0.42)† 0.13 (0.11–0.16)†
Weight Z-score SD 0.41 (0.33–0.49)† 0.38 (0.30–0.47)† 0.15 (0.12–0.17)†
BMI Z-score SD 0.35 (0.26–0.45)† 0.30 (0.20–0.40)† 0.11 (0.08–0.14)†
Bone turnover and endocrine markers
N-telopeptide, urinary log10(nM BCE/mM Creat) 20.76 (21.06 to 20.45)† 20.61 (20.92 to 20.30)† 20.19 (20.28 to 20.09)†
Deoxypyridinium,
urinary
log10(nM/mM Creat) 21.36 (21.93 to 20.79)† 21.20 (21.77 to 20.62)† 20.36 (20.53 to 20.18)†
Bone-specific alkaline
phosphatase
log10(U/liter) 21.34 (21.85 to 20.82)† 21.32 (21.84 to 20.81)† 20.40 (20.56 to 20.24)†
IGF-1 log10(ng/ml) 0.62 (0.12–1.11)x 0.65 (0.15–1.15)x 0.36 (0.21–0.50)†
IGFBP-3 mg/ml 0.15 (0.04–0.25)‡ 0.12 (0.02–0.23)x 0.05 (0.02–0.09)‡
LH log10(U/liter) 0.29 (0.11–0.47)‡ 0.40 (0.22–0.58)† 0.14 (0.09–0.20)†
FSH log10(U/liter) 0.39 (0.19–0.58)† 0.52 (0.33–0.71)† 0.18 (0.12–0.24)†
Testosterone (males only) log10(ng/dL) 0.72 (0.48–0.97)† 0.71 (0.48–0.94)† 0.25 (0.17–0.33)†
Chelation and transfusions
Transferrin receptor log10(mg/ml) 20.15 (20.52–0.22) 0.54 (0.17–0.91)‡ 0.08 (20.03–0.19)
Ferritin log10(ng/ml) 20.20 (20.40–0.00) 20.16 (20.36–0.04) 20.07 (20.13 to 20.01)x
Age started DFO therapy 6 ± vs. <6 yr 0.18 (20.21–0.57) 0.39 (0.03–0.74)x 0.12 (0.01–0.23)x
Thalassemia complications nutrition and physical activity
Hypogonadism Hypogonadal vs.normal 20.41 (20.90–0.09)† 20.43 (20.91–0.04)† 20.08 (20.23–0.07)†
GH deficiency Yes vs/ no 20.71 (21.09 to 20.33)† 20.80 (21.18 to 20.42)† 20.26 (20.37 to 20.14)†
Hypothyroidism Yes vs. no 0.04 (20.36–0.44) 20.51 (20.92 to 20.11)x 20.09 (20.22–0.03)
Diabetes mellitus Yes vs. no 20.26 (20.65–0.13) 20.68 (21.07 to 20.29)† 20.18 (20.30 to 20.06)‡
Fasting blood glucose 100–125 vs. <100 mg/d 0.15 (20.19–0.50) 20.10 (20.44–0.25)‡ 20.05 (20.15–0.06)‡
25(OH) vitamin D Insufficient vs. normal 0.15 (20.13–0.44)† 0.28 (20.01–0.57)‡ 0.11 (0.02–0.20)†
Medicated heart disease Yes vs. no 20.60 (21.09 to 20.12)x 20.68 (21.17 to 20.19)‡ 20.06 (20.21–0.09)
Calcium intake log10(mg/d) 20.38 (20.77–0.00) 20.56 (20.95 to 20.17)‡ 20.08 (20.21–0.04)
Childhood activity At least lightly active
versus very lightly
active
0.69 (0.02–1.35)x 0.63 (20.05–1.31) 0.25 (0.03–0.46)x
Only statistically significant associations are presented. Additional nonsignificant tested associations included: age (5-yr increment 20–75 yr), race (others
vs. whites), additional clinical thalassemia diagnosis (i.e., E-b vs. b TM, HbH vs. b TM, HbH/CS vs. b TM), family history of osteoporosis or fractures,
b globin genotype for b TM patients, transfusion rate (ml/kg/mo), age started transfusions, years, and prescribed dose of DFO.
*Models for spine and femur BMD Z-scores included adjustments for age using a partial-linear spline. Models for whole body BMC included
adjustments for age (by partial-linear spline), sex, and race.
Significance of categorical predictors indicates statistically significant differences among levels and is indicated on the first tabulated comparison. The
level of significance is designated as follows: †p < 0.001; ‡p < 0.01; xp < 0.05.
BMI, body mass index; DFO, deferoxamine.
552 VOGIATZI ET AL.

relationship between spine BMD and 25 vit D concentrations.These findings may have significant clinical implications be-cause both screening and therapy of vitamin D deficiency
are easy, affordable, and beneficial. Information about fluc-tuations in 25 vit D concentrations over the course of yearsand their effect on the bone is not available in this study.
TABLE 4. RESULTS OF MULTIVARIATE ANALYSES OF SPINE BMD Z-SCORES, FEMUR BMD Z-SCORES, WHOLE BODY BMC,FRACTURE RATE, PAIN SEVERITY, AND VERTEBRAL GROWTH DISTURBANCE
Predictor Comparison Parameter estimate* 95% CI p
Spine BMD Z-score
Age <0.0001
6–20 yr 1-yr increment 20.120 (20.156, 20.084)
20–75 yr 1-yr increment 20.008 (20.021, 0.005)
Weight Z 1-SD increment 0.394 (0.315, 0.472) <0.0001
Hypogonadism <0.0001
Delayed puberty vs. normal 20.210 (20.648, 0.229)
Hypogonadal vs. normal 20.601 (20.839, 20.363)
Deoxypyridinium, Ux 10-fold increase 21.090 (21.583, 20.597) <0.0001
25(OH) vitamin D 10-fold increase 0.571 (0.112, 1.030) 0.0150
Femur BMD Z-scores
Age <0.0001
6–20 yr 1-yr increment 20.103 (20.138, 20.068)
20–75 yr 1-yr increment 20.012 (20.026, 0.002)
Weight Z 1-SD increment 0.352 (0.274, 0.430) <0.0001
Hypogonadism 0.0003
Delayed puberty vs. normal 20.332 (20.766, 0.101)
Hypogonadal vs. normal 20.563 (20.836, 20.291)
Deoxypyridinium, Ux 10-fold increase 21.206 (21.687, 20.726) <0.0001
FSH 10-fold increase 0.238 (0.038, 0.438) 0.0197
Fasting BG 10-mg/dl increase 20.330 (20.560, 20.100) 0.0051
F.H. of osteoporosis Yes vs. no 20.298 (20.530, 20.065) 0.0123
Whole body BMC (kg)
Age <0.0001
6–20 yr 1-yr increment 0.085 (0.076, 0.094)
20–75 yr 1-yr increment 20.010 (20.013, 20.006)
Sex Male vs. female 20.284 (20.339, 20.229) <0.0001
Race 0.0031
Asian vs. white 20.097 (20.156, 20.038)
Other race vs. white 0.004 (20.109, 0.117)
Weight Z 1-SD increment 0.133 (0.111, 0.155) <0.0001
Hypogonadism <0.0001
Delayed puberty vs. normal 0.033 (20.083, 0.149)
Hypogonadal vs. normal 20.157 (20.230, 20.084)
BSALP 10-fold increase 20.208 (20.334, 20.082) 0.0013
FSH 10-fold increase 0.110 (0.057, 0.163) <0.0001
Serum creatinine 1-mg/dl increase 0.217 (0.085, 0.349) 0.0014
Fracture incidence rate
Spine BMD Z 1-SD increment 0.66 (0.559, 0.780) <0.0001
Weight Z 1-SD increment 1.31 (1.106, 1.551) 0.0017
Hepatitis C Yes vs. no 1.582 (1.091, 2.293) 0.0156
Pain severity
Age 5-yr increment 1.468 (1.313, 1.655) <0.0001
Sex Male vs. female 0.513 (0.312, 0.834) 0.0077
Thalassemia diagnosis 0.0006
b TI vs. b TM 0.47 (0.187, 1.069)
E-b vs. b TM 1.643 (0.735, 3.603)
HbH or HbH/CS vs. b TM 0.17 (0.060, 0.422)
Vertebral growth disturbance (among b TM only)
Spine BMD Z 1-SD increment 0.571 (0.367, 0.857) 0.0091
Deoxypyridinium, Ux 2-fold increase 0.146 (0.047, 0.401) 0.0004
Age started DFO After age 6 vs. before age 6 0.224 (0.096, 0.450) 0.0001
*Parameters for spine BMD Z-scores, femur BMD Z-scores, and whole body BMC are regression coefficients from general linear models. Parameters
for fracture incidence rate are mean ratios from a proportional means model. Parameters for pain severity and vertebral growth disturbance are ORs from
ordinal and binary logistic regression models, respectively.
AP, anterior-posterior; Ux, urinary; F.H., family history; BG, blood glucose; BSALP, bone-specific alkaline phosphatase; DFO, deferoxamine.
LOW BONE MASS AND FRACTURES IN THALASSEMIA 553
Overall, the cross-sectional design of this study constitutesa limiting factor in our ability to infer the etiology of bonedisease in thalassemia. This limitation, as well as samplesize considerations, may also explain the lack of associationbetween bisphosphonate treatment and bone mass. In ad-dition, because there was no control group, our data werecompared with standard databases, and the results shouldbe interpreted with this in mind.
Years on regular transfusions, DFO treatment, and trans-fusion rates were used to assess the long-term effects ofthalassemia management and iron overload on the bone.No association was found. Current degree of iron overload(assessed by serum ferritin concentration) was also not as-sociated with bone disease. It is possible that the role of ironin the pathogenesis of the disease was missed because welacked a definitive marker of iron overload. Ferritin is apoor marker in heavily overloaded individuals. Other mea-sures of iron excess, for example, liver biopsy, superconduc-tive quantum interference device (SQUID), or MRI, werenot performed in this study. Finally, ineffective erythropoi-
esis (assessed by serum transferrin receptor concentrations)was not associated with bone mass, with the exception of anassociation with femur BMD in univariate analysis of unclearbiological significance.
The fracture prevalence based on both patient historyand medical record review was 36%. This is substantiallylower than the rates of 50% reported in 1960s and 1970s.(34)
Our present results differ from a recent TCRN report thatobserved an overall fracture prevalence of 12%.(35) Thelatter report(35) most likely underestimated the fractureprevalence because of its reliance on chart review of aTCRN established database that was generic in nature andnot comprehensive for prior bone problems. In this study,E-b and a thalassemias were found to have lower rates offractures compared with b TM. However, as in the case ofour BMD results, neither thalassemia syndrome nor chela-tion and transfusion parameters were significant indepen-dent predictors of fracture rates in multivariate analysis.Instead, a strong association between BMD and fracturerate was observed. We also found that, in these patients, as
FIG. 4. Bone turnover markers vs. agestratified by sex and hypogonadal status (hy-pogonadal, +; not hypogonadal, s) with age-dependent upper and lower limits of normal(dashed lines). One individual age 75 yr isomitted.
554 VOGIATZI ET AL.

in osteoporotic patients, the cumulative risk for fracturesincreased with age in an almost linear fashion. A bimodalfracture distribution with one peak related to sports activi-ties among adolescent males and a second rise related toosteoporosis among postmenopausal females has been de-scribed in the general population.(36–38) Such a bimodalfracture risk was not observed among our patients. Similarto the previous retrospective TCRN study,(35) children andadolescents did not seem to be at increased risk for frac-tures. This finding may be related to the cross-sectionaldesign of our study or to the decreased level of physicalactivity in this patient population.
Whereas long bone metaphyseal irregularities and abnor-mal vertebral bodies resembling bone dysplasias have beendescribed in b TM and attributed to DFO toxicity,(39) thepresence and etiology of these abnormalities given today’sstandard of care are largely unknown. This is the first studyin thalassemia to use vertebral morphometry to evaluate alarge number of patients for such abnormalities. Indeed, alarge number of deformities were found, mostly VGDscharacterized by decreased height of multiple vertebrae.VGD occurred exclusively in regularly transfused and che-lated patients with b TM and E-b, were associated withearly use of DFO (before age 6), and occurred regardless ofage, with the youngest affected patient being 18 yr old. Arather small number of vertebral fractures were docu-mented, found primarily in patients with b TM. Vertebralfractures increased with age and were related to low bonemass and hypogonadism. These data suggest different eti-ologies between vertebral fractures and deformities, and inparticular, the role of early treatment with DFO in thedevelopment of vertebral deformities in thalassemia.
Despite its high prevalence, the etiology of bone pain inour patients remains obscure. There was no correlationwith history of fractures or vertebral deformities, except inthose with documented vertebral fractures by morphom-etry, who almost always reported bone pain. Bone painincreased with age and was more frequent among females,despite fractures rates similar to those of males. Patientswith b TM also reported bone pain more frequently thanthose with other thalassemia syndromes, although we wereunable to establish any transfusion or chelation related pa-rameter as a possible contributor to pain. Neither endocri-
nopathy, other thalassemia complications, nor vitamin Ddeficiency were independent predictors of bone pain. Whyfemales with b TM are more prone to bone pain remainsuncertain.
In summary, in this large cohort of patients across allthalassemia syndromes, we observed a high prevalence offractures and a strong association between bone mass andfractures. Therefore, strategies to improve BMD are veryimportant in thalassemia management. We showed thatbone disease in thalassemia is an adolescent problem withadult manifestations. Current transfusion and chelationpractices seem insufficient to prevent the development oflow bone mass. Our data highlight the need for randomizedtrials to determine the appropriate form of gonadal steroidreplacement and vitamin D supplementation as well as ad-ditional strategies to optimize bone accrual in this disease.Further longitudinal studies are needed to address changesof bone mass during puberty. Finally, changes in bone turn-over seem to be involved in the development of bone dis-ease, although the factors that lead to increased bone re-sorption in thalassemia remain unclear and warrant furtherstudy.
ACKNOWLEDGMENTS
This work was supported by a cooperative agreementwith the National Heart, Lung, and Blood Institute, Na-tional Institutes of Health (U01-HL-65232 to Children’sHospital of Philadelphia, U01-HL-65233 to UniversityHealth Network Toronto General Hospital, U01-HL-65239to Children’s Hospital and Research Center at Oakland,U01-HL-65244 to Weill Medical College of Cornell Uni-versity, U01-HL-65260 to Children’s Hospital Boston, andU01-HL-65238 to New England Research Institutes). Thestudy was also supported, in part, at Weill Medical Collegeof Cornell University by Grant K08 HL088231 awarded toMGV, at Children’s Hospital of Philadelphia by NIH-NCRR Grant UL1-RR024134, and by Children’s HospitalBoston by NIH-NCRR Grant M01-RR02172 and NIHGrant 5K24HL004184-08 to EN.
REFERENCES
1. Weatherall DJ 2001 Phenotype-genotype relationship inmonogenic disease: Lessons from the thalassemias. Nat Rev2:245–255.
2. Calleja E, Shen JY, Lesser M, Grady RW, New MI, GiardinaPJ 1998 Survival and Morbidity in Transfusion DependentThalassemia Patients on Subcutaneous Desferrioxamine Che-lation: Nearly Two Decades of Experience. NY Acad Sci850:469–470.
3. Ehlers KH, Giardina PJ, Lesser ML, Engle MA, HilgartnerMW 1991 Prolonged survival in patients with beta-thalassemiamajor treated with deferoxamine. J Pediatr 118:540–545.
4. Cooley TB, Lee P 1925 A series of cases of splenomegaly inchildren with anemia and peculiar bone changes. Trans AmPediatr Soc 37:29–30.
5. Wolman IJ, Ortalani M 1969 Some clinical features of Cooley’sanemia patients as related to transfusion schedules. Ann NYAcad Sci 105:407.
6. Piomelli S 1995 The management of patients with Cooley’sanemia: Transfusions and splenectomy. Sem Hematol 32:262–268.
7. Jensen CE, Tuck SM, Agnew JE, Koneru S, Morris RW,
FIG. 5. Prevalence of history of fracture (A) and recent bone orjoint pain (B) by thalassemia syndrome, stratified by age group(6–10 yr, s; 11–19 yr, d; 20 or more yrs, d). Point estimates andexact 95% confidence intervals are indicated.
LOW BONE MASS AND FRACTURES IN THALASSEMIA 555

Yardumian A, Prescott E, Hoffbrand AV, Wonke B 1998 Highincidence of osteoporosis in Thalassemia major. J Pediatr En-docrinol Metab 11(Suppl 3):975–977.
8. Giardina PJ, Schneider R, Lesser M, Simmons B, Rodriguez A,Gertner J, New M, Hilgartner MW 1995 Abnormal Bone Me-tabolism in Thalassemia. Endocrine Disorders in Thalassemia.Springer, Berlin, Germany.
9. Origa R, Fiumana E, Gamberini MR, Armari S, Mottes M,Sangalli A, Paglietti E, Galanello R, Borgna-Pignatti C 2005Osteoporosis I b-thalassemia: Clinical and genetic aspects. NYAcad Sci 1054:451–456.
10. Dresner Pollack R, Rachmilewitz E, Blumenfeld A, Idelson M,Goldfarb AW 2000 Bone mineral metabolism in adults withb-thalassemia major and intermedia. Br J Haematol 111:902–907.
11. Carmina E, Di Fede G, Napoli N, Renda G, Vitale G, Lo PintoC, Bruno D, Malizia R, Rini GB 2004 Hypogonadism andhormone replacement therapy on bone mass of adult womenwith Thalassemia major. Calcif Tissue Int 74:68–71.
12. DiStefano M, Chiabotto P, Roggia C, Garofalo F, Lala R, PigaA, Isaia GC 2004 Bone mass and metabolism in thalassemicchildren and adolescents with different iron cheating drugs. JBone Miner Metab 22:53–57.
13. Leung TF, Hung ECW, Lam CWK, Li CK, Chu Y, Chik KW,Shing MMK, Lee V, Yuen PMP 2005 Bone mineral density inchildren with thalassemia major: Determining factors and ef-fects of bone marrow transplantation. Bone Marrow Trans-plant 36:331–336.
14. Mahachoklertwattana P, Pootrakul P, Chuansumrit A,Choubtum L, Sriphrapradang A, Sirisriro R, Rajatanavin R2006 Association between bone mineral density and erythro-poiesis in Thai achildren and adolescents with thalassemia syn-dromes. J Bone Miner Metab 24:146–152.
15. Perrotta S, Cappellini MD, Bertoldo F, Servedio V, IolasconG, D’Agruma L, Gasparini P, Siciliani MC, Iolascon A 2000Osteoporosis in b-thalassemia major patients: Analysis of thegenetic background. Br J Haematol 111:461–466.
16. Lasco A, Morabito N, Gaudio A, Buemi M, Wasniewska M,Frisina N 2001 Effects of hormonal replacement therapy onbone metabolism in young adults with beta-thalassemia major.Osteoporos Int 12:570–575.
17. Bielinski BK, Darbyshire PJ, Mathers L, Crabtree NJ, KirkJMW, Stirling HF, Shaw NJ 2003 Impact of disordered pubertyon bone density in beta-thalassemia major. Br J Haematol120:353–358.
18. Greulich WW, Pyle SI 1959 Radiographic Atlas of SkeletalDevelopment of the Hand and Wrist, 2nd ed. Stanford Uni-versity Press, Stanford, California, USA.
19. Genant HK, Wu CY, Van Kuijk C, Nevitt M 1993 Vertebralfracture assessment using a semiquantitative technique. J BoneMiner Res 8:1137–1148.
20. Hastie T, Tibshirani R 1990 Generalized Additive Models.Chapman and Hall, London, UK.
21. Efron B, Tibshirani RJ 1993 An Introduction to the Bootstrap.Chapman & Hall, London, UK.
22. Lin DY, Wei LJ, Yang I, Ying Z 2000 Semiparametric regres-sion for the mean and rate functions of recurrent events. J RStat Soc B 62:711–730.
23. Salama OS, Al-Tonbary YA, Shahin RA, Eldeen OA 2006Unbalanced bone turnover in children with beta thalassemia.Hematology (Am Soc Hematol Educ Program) 11:197–202.
24. Angelopoulos NG, Goula A, Katounda E, Rombopoulos G,Kaltsidou V, Kaltsas D, Mulaktari S, Athanasiadou V, Tolis G2007 Circulating osteoprotegerin and receptor activator of NF-kappaB ligand system in patients with beta-thalassemia major.J Bone Miner Metab 25:60–67.
25. Gambacciani M, Monteleone P, Ciaponi M, Sacco A, GenazzaniAR 2004 Effects of oral contraceptives on bone mineral density.Treat Endocrinol 2:191–196.
26. Mundy GR 2007 Osteoporosis and inflammation. Nutr Rev65:S147–S151.
27. Grassi F, Tell G, Robbie-Ryan M, Gao Y, Terauchi M, YangX, Romanello M, Jones DP, Weitzmann MN, Pacifici R 2007
Oxidative stress causes bone loss in estrogen-deficient micethrough enhanced bone marrow dendritic cell activation. ProcNatl Acad Sci USA 104:15087–15092.
28. Cighetti G, Duca L, Bortone L, Sala S, Nava I, Fiorelli G,Cappellini MD 2002 Oxidative status and malondialdehyde inb-thalassemia patients. Eur J Clin Invest 32(Supp 1)b55–60.
29. Anapliotou MLG, Kastanias IT, Psara P, Evangelou EA, Lip-iraki M, Dimitriou P 1995 The contribution of hypogonadism tothe development of osteoporosis in thalassemia major: Newtherapeutic approaches. Clin Endocrinol (Oxf) 42:279–287.
30. Molyvda-Athanasopoulou E, Sioundas A, Karatzas N, Aggel-laki M, Pazaitou K, Vainas I 1999 Bone mineral density ofpatients with thalassemia major. Calcif Tissue Int 64:481–484.
31. Lasco A, Morabito N, Gaudio A, Buemi M, Wasniewska M,Frisina N 2001 Effects of hormonal replacement therapy onbone metabolism in young adults with beta-thalassemia major.Osteoporos Int 12:570–575.
32. Napoli N, Carmina E, Bucchieri S, Sferrazza C, Rini GB, DiFede G 2006 Low serum levels of 25-hydroxyvitamin D inadults affected by thalassemia major or intermedia. Bone38:888–892.
33. Domrongkitchaiporn S, Sirikulchayanonta V, AngchaisuksiriP, Stitchantrakul W, Kanokkantopong C, Rajatanavin R 2003Abnormalities in bone mineral density and bone histology inthalassemia. J Bone Miner Res 18:1682–1686.
34. Dines DM, Canale VC, Arnold WD 1976 Fractures in thalas-semia. J Bone Joint Surg Am 58:662–666.
35. Vogiatzi MG, Macklin EA, Fung EB, Vichinsky E, Olivieri N,Kwiatkowski J, Cohen A, Neufeld E, Giardina PJ 2006 Preva-lence of fractures among the thalassemia syndromes in NorthAmerica. Bone 38:571–575.
36. Johansen A, Evans RJ, Stone MD, Richmond PW, Lo SV,Woodhouse KW 1997 Fracture Incidence in England andWhales: A study based on population of Cardiff. Injury 28:655–660.
37. Jones IE, Williams SM, Dow N, Goulding A 2002 How manychildren remain fracture free during growth? A longitudinalstudy of children and adolescents participating in the DunedinMultidisciplinary Health and development study OsteoporosInt 13:990–995.
38. Melton LJ, III, Kan SH, Frye MA, Wahner HW, O’Fallon WM,Riggs BL 1989 Epidemiology of vertebral fractures in women.Am J Epidemiol 129:1000–1011.
39. Brill PW, Winchester P, Giardina PJ, Cunningham-Rundles S1991 Desferoxamine-induced bone dysplasia in patients withthalassemia major. Am J Radiol 156:561–565.
Address reprint requests to:Maria G Vogiatzi, MD
Division of Pediatric EndocrinologyNew York Presbyterian Hospital/Weill Medical College of
Cornell University525 E. 68th Street, Box 103
New York, NY 10065, USA
E mail: [email protected]
Received in original form September 6, 2007; revised form May 12,2008; accepted May 13, 2008.
APPENDIX 1
This is Publication 6 of the Thalassemia Clinical Research Net-work (TCRN).This work was performed through the TCRN. Theauthors thank the patients who volunteered their time to partici-pate in this study. The following TCRN sites and investigatorsalso contributed to the study (listed in alphabetical order): Chil-drens Hospital, Boston: Ellis Neufeld, MD, PhD, Principal Inves-tigator, Melody Cunningham, MD, Co-Principal Investigator;Childrens Hospital of Philadelphia: Alan R Cohen, MD, PrincipalInvestigator, Janet L Kwiatkowski, MD, Co-Principal Investigator,
556 VOGIATZI ET AL.

Catherine S Manno, MD, Coinvestigator, Marie Martin, RN, NurseCoordinator, Debra Hillman, Regulatory Affairs Coordinator, GailM Jackson, CDT, Nutrition Assessment Program Coordinator,Maria J Henwood-Storto, DO, Endocrinologist; Shannon HFourtner, MD, Endocrinologist; Childrens Hospital & ResearchCenter Oakland: Elliott Vichinsky, MD, Principal Investigator, DruFoote, NP, Study Coordinator, Eun-Ha Pang, Study Coordinator,Zahra Pakbaz, MD, CCD, Certified Clinical Densitometrist,Selma Holden, Study Coordinator; Toronto General Hospital:Nancy Olivieri, MD, Principal Investigator; U.T. SouthwesternMedical Center: Charles T Quinn, MD, Assistant Professor of
Pediatrics, Elizabeth Shull, BSN, RN, Clinical Research Associ-ate; Weill Medical College of Cornell University: Patricia J Giardina,MD, Principal Investigator, Robert W Grady, PhD, Co-Investigator,Jeffrey E Mait and Dorothy Kleinert, NP, MPH, MA, Study Coor-dinators, Irina Chaikhoutdinov and Gladys Cintron, Data Coordi-nators, Sylvia Hom, DXA Technician, Hospital for Special Surgery;National Heart, Lung, and Blood Institute: Charles Peterson, MD,Project Officer; Data Coordinating Center, New England ResearchInstitutes: Sonja McKinlay, PhD, Principal Investigator, FeliciaTrachtenberg, PhD, Statistician, Haddy Jallow, MS, MPH, ProjectCoordinator.
LOW BONE MASS AND FRACTURES IN THALASSEMIA 557


