Embed Size (px)
Citation preview
A N N U A L R E P O R T 1 9 9 8
Contents
3 The New World of Borealis
4 Key Figures and Ratios
6 1998 in Review
8 Letter from the CEO
10 Report of the Board of Directors
14 Financial Review
18 Research & Development
22 Borstar Technology for PE and PP
24 Preparing for Year 2000
26 Business Unit Reviews
32 Health, Safety and Environment
37 Accounts for 1998
38 Accounting Principles
40 Signatures to the Accounts
41 Consolidated Income Statement
42 Consolidated Balance Sheet
44 Consolidated Cash Flow Statement
45 Income Statement – Borealis A/S
46 Balance Sheet – Borealis A/S
48 Notes to the Accounts
60 Addresses
62 Board and Management
This is an expanded version of the statutory
Danish-language annual report, which was
approved on March 12, 1999, and will be filed
with the Danish Commerce and Companies
Agency.
TH
E N
EW
W
OR
LD
O
F B
OR
EA
LIS
3
The New World of Borealis
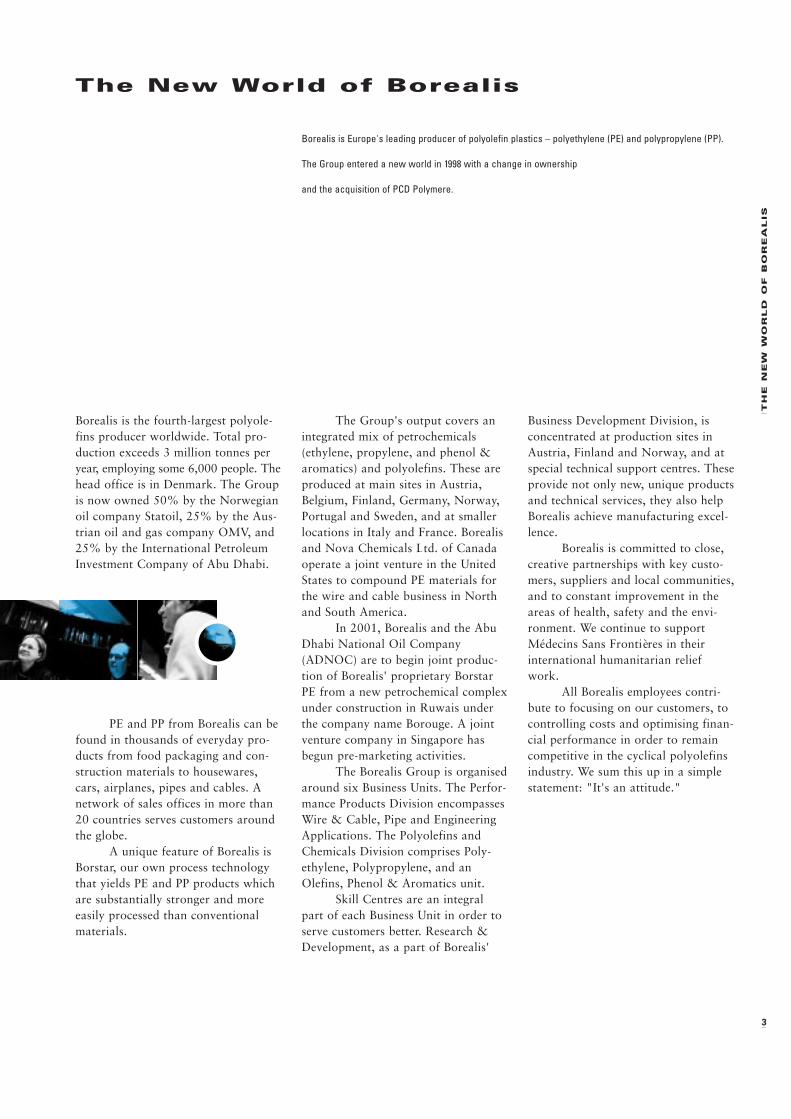
Borealis is the fourth-largest polyole-
fins producer worldwide. Total pro-
duction exceeds 3 million tonnes per
year, employing some 6,000 people. The
head office is in Denmark. The Group
is now owned 50% by the Norwegian
oil company Statoil, 25% by the Aus-
trian oil and gas company OMV, and
25% by the International Petroleum
Investment Company of Abu Dhabi.
PE and PP from Borealis can be
found in thousands of everyday pro-
ducts from food packaging and con-
struction materials to housewares,
cars, airplanes, pipes and cables. A
network of sales offices in more than
20 countries serves customers around
the globe.
A unique feature of Borealis is
Borstar, our own process technology
that yields PE and PP products which
are substantially stronger and more
easily processed than conventional
materials.
The Group's output covers an
integrated mix of petrochemicals
(ethylene, propylene, and phenol &
aromatics) and polyolefins. These are
produced at main sites in Austria,
Belgium, Finland, Germany, Norway,
Portugal and Sweden, and at smaller
locations in Italy and France. Borealis
and Nova Chemicals Ltd. of Canada
operate a joint venture in the United
States to compound PE materials for
the wire and cable business in North
and South America.
In 2001, Borealis and the Abu
Dhabi National Oil Company
(ADNOC) are to begin joint produc-
tion of Borealis' proprietary Borstar
PE from a new petrochemical complex
under construction in Ruwais under
the company name Borouge. A joint
venture company in Singapore has
begun pre-marketing activities.
The Borealis Group is organised
around six Business Units. The Perfor-
mance Products Division encompasses
Wire & Cable, Pipe and Engineering
Applications. The Polyolefins and
Chemicals Division comprises Poly-
ethylene, Polypropylene, and an
Olefins, Phenol & Aromatics unit.
Skill Centres are an integral
part of each Business Unit in order to
serve customers better. Research &
Development, as a part of Borealis'
Business Development Division, is
concentrated at production sites in
Austria, Finland and Norway, and at
special technical support centres. These
provide not only new, unique products
and technical services, they also help
Borealis achieve manufacturing excel-
lence.
Borealis is committed to close,
creative partnerships with key custo-
mers, suppliers and local communities,
and to constant improvement in the
areas of health, safety and the envi-
ronment. We continue to support
Médecins Sans Frontières in their
international humanitarian relief
work.
All Borealis employees contri-
bute to focusing on our customers, to
controlling costs and optimising finan-
cial performance in order to remain
competitive in the cyclical polyolefins
industry. We sum this up in a simple
statement: "It's an attitude."
Borealis is Europe's leading producer of polyolefin plastics – polyethylene (PE) and polypropylene (PP).
The Group entered a new world in 1998 with a change in ownership
and the acquisition of PCD Polymere.
4
KE
Y F
IG
UR
ES
A
ND
R
AT
IO
S
Key Figures and Ratios
DEFINITIONS
Capital employed
Total assets less non-interest-bearing debt,
exclusive of payable dividend
Return on capital employed
Operating profit, profit and loss from sale of
operations plus interest income, after tax,
divided by average capital employed
Solvency ratio
Equity plus negative goodwill plus subordinated
loans divided by total assets
Gearing
Interest-bearing debt less cash at bank and in
hand divided by equity
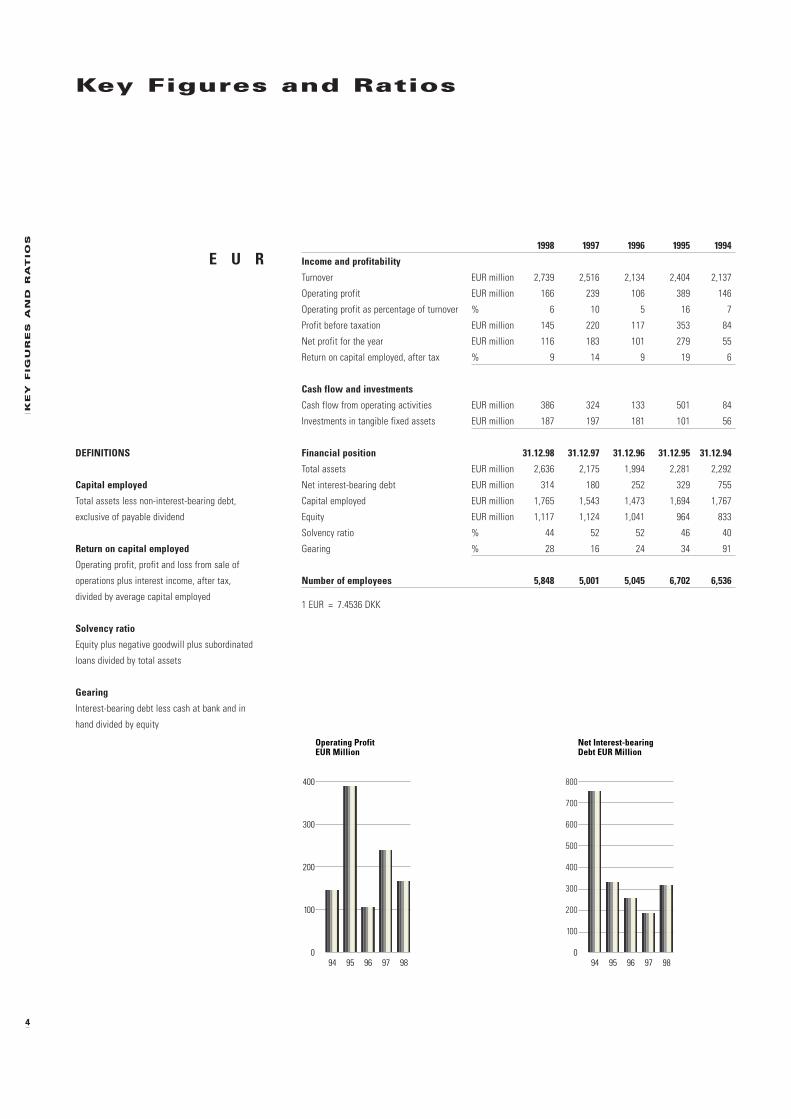
1998 1997 1996 1995 1994
Income and profitability
Turnover EUR million 2,739 2,516 2,134 2,404 2,137
Operating profit EUR million 166 239 106 389 146
Operating profit as percentage of turnover % 6 10 5 16 7
Profit before taxation EUR million 145 220 117 353 84
Net profit for the year EUR million 116 183 101 279 55
Return on capital employed, after tax % 9 14 9 19 6
Cash flow and investments
Cash flow from operating activities EUR million 386 324 133 501 84
Investments in tangible fixed assets EUR million 187 197 181 101 56
Financial position 31.12.98 31.12.97 31.12.96 31.12.95 31.12.94
Total assets EUR million 2,636 2,175 1,994 2,281 2,292
Net interest-bearing debt EUR million 314 180 252 329 755
Capital employed EUR million 1,765 1,543 1,473 1,694 1,767
Equity EUR million 1,117 1,124 1,041 964 833
Solvency ratio % 44 52 52 46 40
Gearing % 28 16 24 34 91
Number of employees 5,848 5,001 5,045 6,702 6,536
1 EUR = 7.4536 DKK
E U R
9594 96 97 98
Operating ProfitEUR Million
0
100
200
300
400
9594 96 97 98
Net Interest-bearingDebt EUR Million
0
100
200
300
400
500
600
700
800
KE
Y F
IG
UR
ES
A
ND
R
AT
IO
S
5
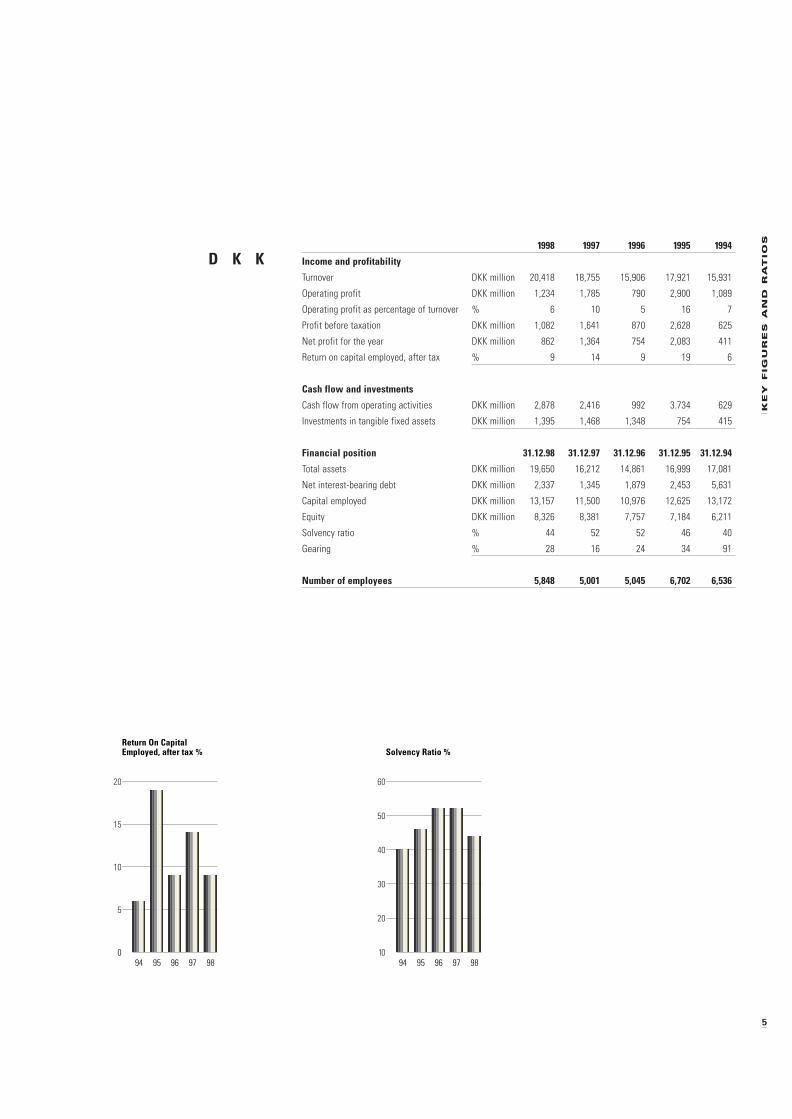
1998 1997 1996 1995 1994
Income and profitability
Turnover DKK million 20,418 18,755 15,906 17,921 15,931
Operating profit DKK million 1,234 1,785 790 2,900 1,089
Operating profit as percentage of turnover % 6 10 5 16 7
Profit before taxation DKK million 1,082 1,641 870 2,628 625
Net profit for the year DKK million 862 1,364 754 2,083 411
Return on capital employed, after tax % 9 14 9 19 6
Cash flow and investments
Cash flow from operating activities DKK million 2,878 2,416 992 3.734 629
Investments in tangible fixed assets DKK million 1,395 1,468 1,348 754 415
Financial position 31.12.98 31.12.97 31.12.96 31.12.95 31.12.94
Total assets DKK million 19,650 16,212 14,861 16,999 17,081
Net interest-bearing debt DKK million 2,337 1,345 1,879 2,453 5,631
Capital employed DKK million 13,157 11,500 10,976 12,625 13,172
Equity DKK million 8,326 8,381 7,757 7,184 6,211
Solvency ratio % 44 52 52 46 40
Gearing % 28 16 24 34 91
Number of employees 5,848 5,001 5,045 6,702 6,536
D K K
9594 96 97 98
Return On CapitalEmployed, after tax %
0
5
10
15
20
9594 96 97 98
Solvency Ratio %
10
20
30
40
50
60
6
19
98
IN
R
EV
IE
W
1998 in Review
January
One of the low pressure PE
plants at Stenungsund, Sweden, marks
10 years with no lost time accidents.
March
Borealis announces plans to
upgrade one of its low pressure PE
plants at Stenungsund with proprie-
tary, state-of-the-art Borstar tech-
nology. The new plant is to go on
stream by autumn 2000.
April
The Abu Dhabi National Oil
Company (ADNOC) and Borealis sign
the final agreement to build and oper-
ate a petrochemical complex in Abu
Dhabi, and to establish a marketing
company in Singapore. The joint ven-
ture is named Borouge.
May
Borealis and Norsk Hydro close
the waste recovery operations of
Retroplast AS in Norway due to weak
market response. Borealis remains
active in plastic waste recovery and
recycling.
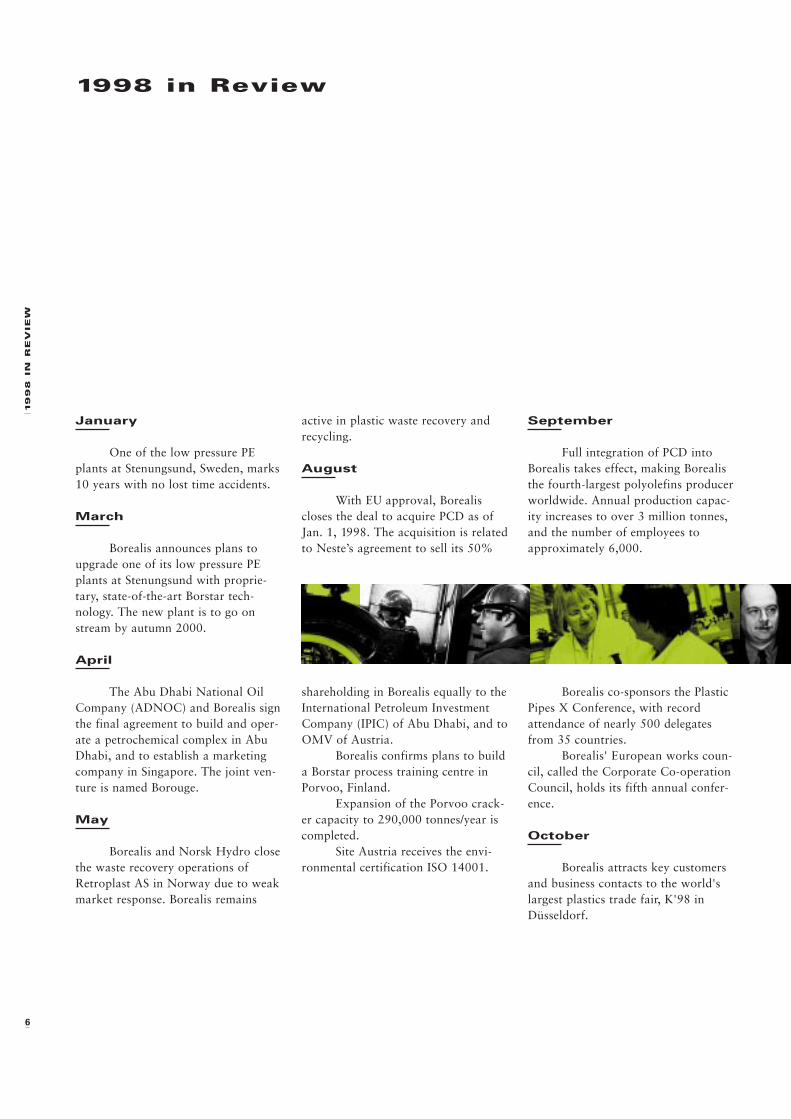
August
With EU approval, Borealis
closes the deal to acquire PCD as of
Jan. 1, 1998. The acquisition is related
to Neste’s agreement to sell its 50%
shareholding in Borealis equally to the
International Petroleum Investment
Company (IPIC) of Abu Dhabi, and to
OMV of Austria.
Borealis confirms plans to build
a Borstar process training centre in
Porvoo, Finland.
Expansion of the Porvoo crack-
er capacity to 290,000 tonnes/year is
completed.
Site Austria receives the envi-
ronmental certification ISO 14001.
September
Full integration of PCD into
Borealis takes effect, making Borealis
the fourth-largest polyolefins producer
worldwide. Annual production capac-
ity increases to over 3 million tonnes,
and the number of employees to
approximately 6,000.
Borealis co-sponsors the Plastic
Pipes X Conference, with record
attendance of nearly 500 delegates
from 35 countries.
Borealis' European works coun-
cil, called the Corporate Co-operation
Council, holds its fifth annual confer-
ence.
October
Borealis attracts key customers
and business contacts to the world's
largest plastics trade fair, K'98 in
Düsseldorf.
19
98
IN
R
EV
IE
W
7
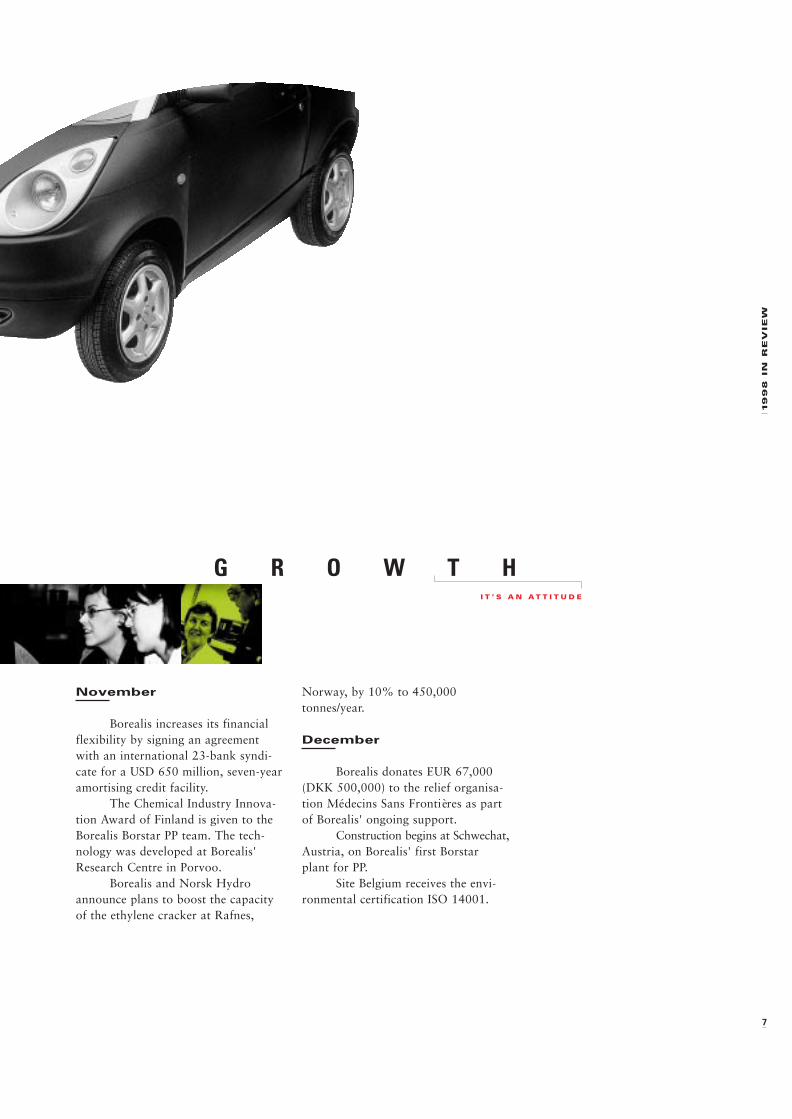
I T ’ S A N A T T I T U D E
G R O W T H
November
Borealis increases its financial
flexibility by signing an agreement
with an international 23-bank syndi-
cate for a USD 650 million, seven-year
amortising credit facility.
The Chemical Industry Innova-
tion Award of Finland is given to the
Borealis Borstar PP team. The tech-
nology was developed at Borealis'
Research Centre in Porvoo.
Borealis and Norsk Hydro
announce plans to boost the capacity
of the ethylene cracker at Rafnes,
Norway, by 10% to 450,000
tonnes/year.
December
Borealis donates EUR 67,000
(DKK 500,000) to the relief organisa-
tion Médecins Sans Frontières as part
of Borealis' ongoing support.
Construction begins at Schwechat,
Austria, on Borealis' first Borstar
plant for PP.
Site Belgium receives the envi-
ronmental certification ISO 14001.
8
LE
TT
ER
F
RO
M T
HE
C
EO
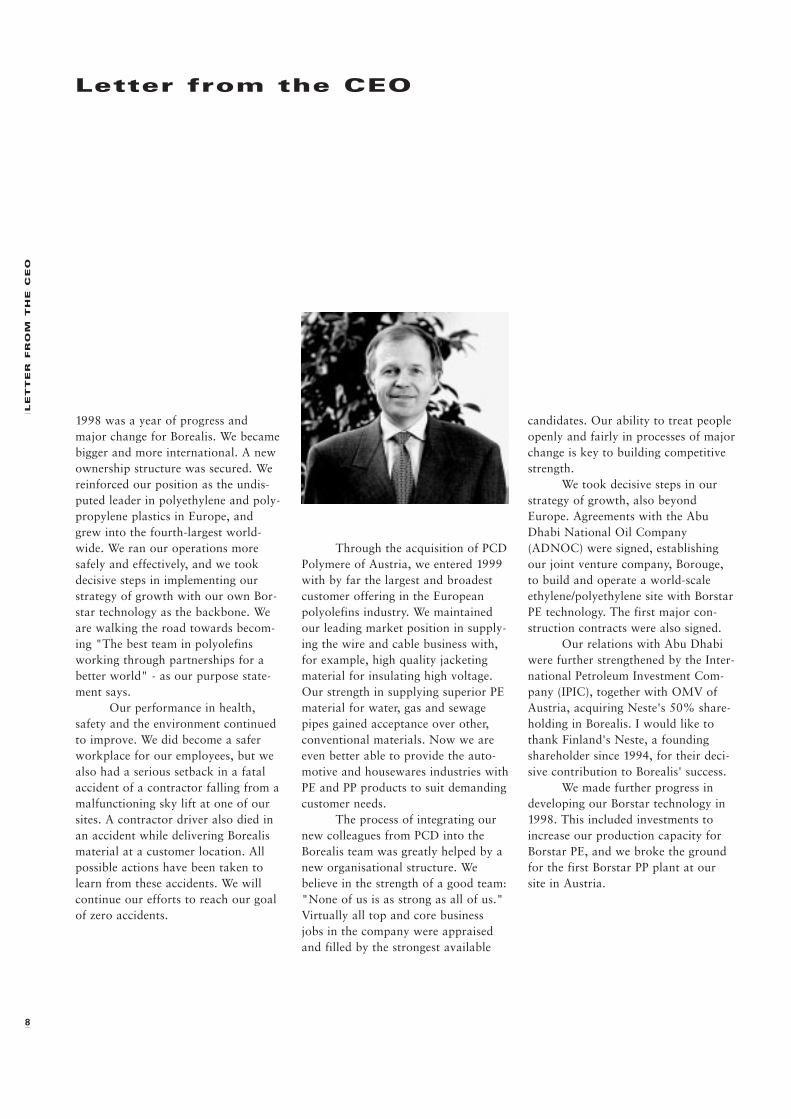
Letter from the CEO
1998 was a year of progress and
major change for Borealis. We became
bigger and more international. A new
ownership structure was secured. We
reinforced our position as the undis-
puted leader in polyethylene and poly-
propylene plastics in Europe, and
grew into the fourth-largest world-
wide. We ran our operations more
safely and effectively, and we took
decisive steps in implementing our
strategy of growth with our own Bor-
star technology as the backbone. We
are walking the road towards becom-
ing "The best team in polyolefins
working through partnerships for a
better world" - as our purpose state-
ment says.
Our performance in health,
safety and the environment continued
to improve. We did become a safer
workplace for our employees, but we
also had a serious setback in a fatal
accident of a contractor falling from a
malfunctioning sky lift at one of our
sites. A contractor driver also died in
an accident while delivering Borealis
material at a customer location. All
possible actions have been taken to
learn from these accidents. We will
continue our efforts to reach our goal
of zero accidents.
Through the acquisition of PCD
Polymere of Austria, we entered 1999
with by far the largest and broadest
customer offering in the European
polyolefins industry. We maintained
our leading market position in supply-
ing the wire and cable business with,
for example, high quality jacketing
material for insulating high voltage.
Our strength in supplying superior PE
material for water, gas and sewage
pipes gained acceptance over other,
conventional materials. Now we are
even better able to provide the auto-
motive and housewares industries with
PE and PP products to suit demanding
customer needs.
The process of integrating our
new colleagues from PCD into the
Borealis team was greatly helped by a
new organisational structure. We
believe in the strength of a good team:
"None of us is as strong as all of us."
Virtually all top and core business
jobs in the company were appraised
and filled by the strongest available
candidates. Our ability to treat people
openly and fairly in processes of major
change is key to building competitive
strength.
We took decisive steps in our
strategy of growth, also beyond
Europe. Agreements with the Abu
Dhabi National Oil Company
(ADNOC) were signed, establishing
our joint venture company, Borouge,
to build and operate a world-scale
ethylene/polyethylene site with Borstar
PE technology. The first major con-
struction contracts were also signed.
Our relations with Abu Dhabi
were further strengthened by the Inter-
national Petroleum Investment Com-
pany (IPIC), together with OMV of
Austria, acquiring Neste's 50% share-
holding in Borealis. I would like to
thank Finland's Neste, a founding
shareholder since 1994, for their deci-
sive contribution to Borealis' success.
We made further progress in
developing our Borstar technology in
1998. This included investments to
increase our production capacity for
Borstar PE, and we broke the ground
for the first Borstar PP plant at our
site in Austria.
LE
TT
ER
F
RO
M T
HE
C
EO
9
As the polyolefins industry
moves into a period of weaker mar-
kets and prices, the drive for improved
cost effectiveness takes on increasing
importance. Borealis is in the middle
of major restructuring and cutting
back on fixed and variable costs. We
are reducing the number of employees
significantly, while at the same time
enabling individuals to take on broad-
er responsibilities.
I travelled extensively in the
world of Borealis in 1998. Everywhere
I went, I was struck by the power of
our diversity and the commitment of
our team members. Nurturing and
strengthening this commitment will
remain a key success factor.
Yes, we did make progress in
1998. We plan and need further, sig-
nificant improvements in the years to
come. It is a question of taking full
advantage of our asset base and
responding effectively to customer and
market needs. It is about further
building our position as a product and
technology leader. And it is about
developing our platform for further
growth.
Svein Rennemo
Chief Executive Officer
Borealis A/S
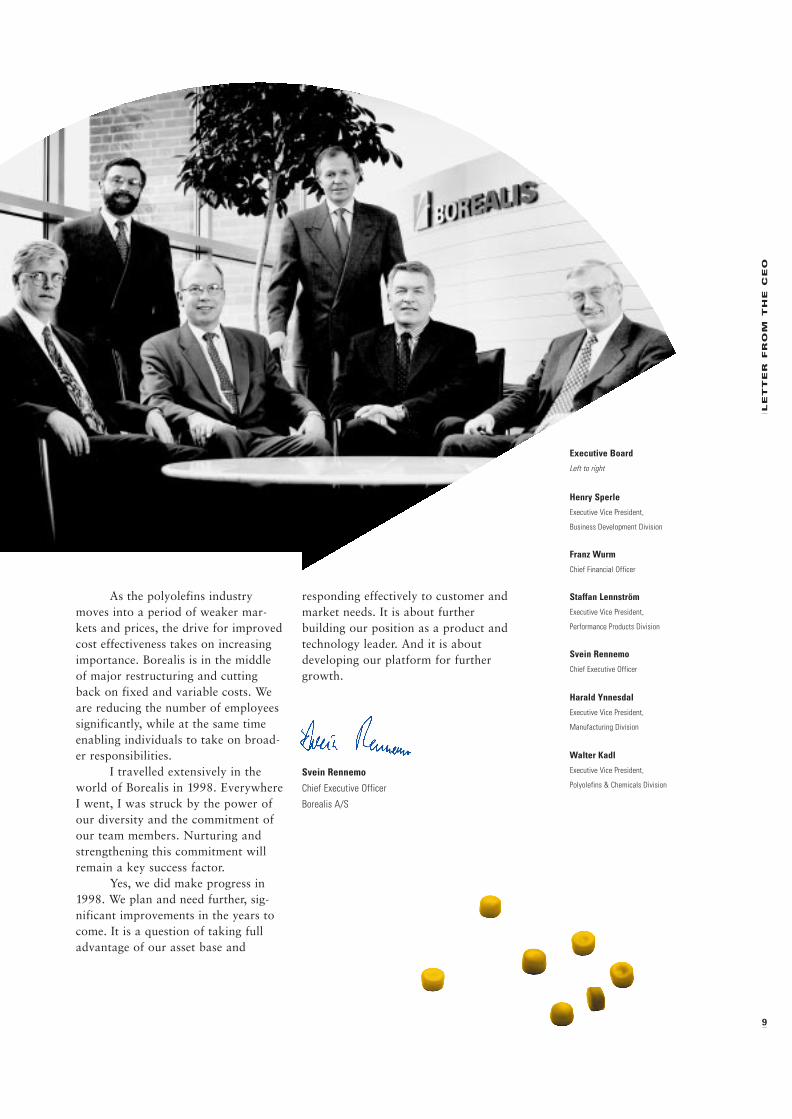
Executive Board
Left to right
Henry Sperle
Executive Vice President,
Business Development Division
Franz Wurm
Chief Financial Officer
Staffan Lennström
Executive Vice President,
Performance Products Division
Svein Rennemo
Chief Executive Officer
Harald Ynnesdal
Executive Vice President,
Manufacturing Division
Walter Kadl
Executive Vice President,
Polyolefins & Chemicals Division
10
RE
PO
RT
O
F T
HE
B
OA
RD
O
F D
IR
EC
TO
RS
Report of the Board of Directors
As of Aug. 4, 1998, the Finnish com-
pany Neste sold its 50% shareholding
in Borealis to IOB Holdings A/S,
which is owned equally by the Aus-
trian oil and gas company OMV and
the International Petroleum Invest-
ment Company (IPIC) of Abu Dhabi.
Thus, the Borealis Group is now
owned 25% by OMV, 25% by IPIC
and 50% by the Norwegian oil com-
pany Statoil. Two new members were
appointed to the Board of Directors in
accordance with this change.
The new Board wishes to thank
Neste for its contribution to Borealis'
growth and development since before
the company was founded in March
1994.
A year of growth
The Borealis Group emerged
from its fifth year of operations con-
siderably larger and more internation-
al due to the acquisition of PCD Poly-
mere of Austria and the new joint ven-
ture with the Abu Dhabi National Oil
Company (ADNOC).
Financial performance in 1998
was weaker than in 1997. This reflects
the weakened global market for poly-
olefins, and restructuring charges
related mainly to the acceleration of
Borealis' Site Development Pro-
gramme. Borealis continues to focus
on reducing costs, improving customer
satisfaction, taking advantage of the
new synergies from former PCD and
making its proprietary Borstar tech-
nology a commercial success.
The acquisition of PCD added
1,000 new colleagues of various
nationalities and boosted the Group's
annual polyolefins production capacity
by some 900,000 tonnes to over 3.3
million tonnes. Thus, Borealis has
grown into the largest producer by far
in Europe, and the fourth-largest
worldwide. The integration of former
PCD has been successful.
At the same time, Borealis and
ADNOC proceeded with their joint
venture, Borouge, to build and operate
a world scale petrochemical complex
in Abu Dhabi. A Borouge sales and
marketing company has been estab-
lished in Singapore.
Borealis saw continued
improvement in health, safety and
environmental performance in 1998.
However, a contractor died of injuries
in a lift accident, and this was the first
workplace fatality for Borealis. It
underlines the need to intensify efforts
to meet the ambitious targets set for
2000.
A major structural reorganisa-
tion of the Borealis Group took effect
on Sept. 1. It gives clearer roles and
responsibilities in core business areas,
plus a sharper focus on Borealis' cus-
tomers and markets.
Financial performance
The 1998 figures include former
PCD from Jan. 1, 1998.
The Borealis Group delivered a
weakened financial result in 1998
compared to 1997. Excluding restruc-
turing charges, the year ended with an
operating profit of EUR 220 million
(DKK 1,639 million), which is a 18%
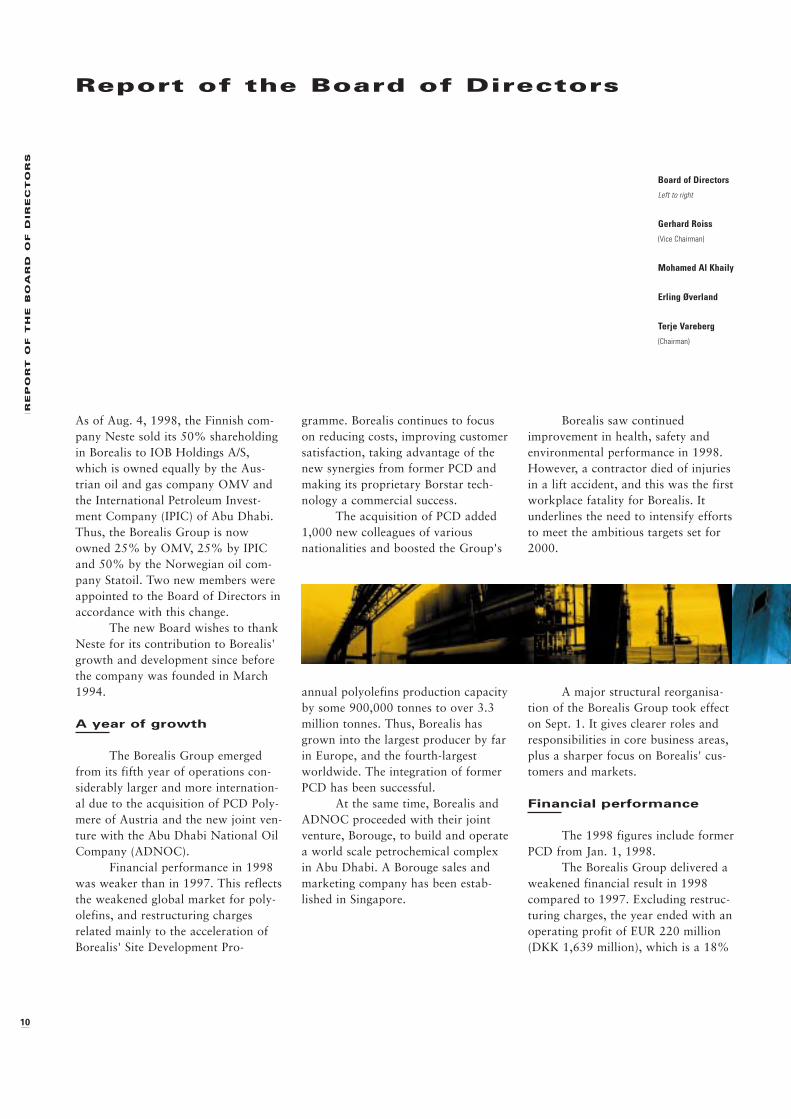
Board of Directors
Left to right
Gerhard Roiss
(Vice Chairman)
Mohamed Al Khaily
Erling Øverland
Terje Vareberg
(Chairman)
RE
PO
RT
O
F T
HE
B
OA
RD
O
F D
IR
EC
TO
RS
11
decrease from the EUR 268 million
(DKK 1,995 million) earned in 1997.
This is due mainly to decreased levels
of margins and sales, although there
were considerably higher volumes
resulting from the acquisition of PCD.
Including restructuring charges, the
operating profit for 1998 was EUR
166 million (DKK 1,234 million),
down 31% from EUR 239 million
(DKK 1,785 million) in 1997.
Net profit amounted to EUR
116 million (DKK 862 million) com-
pared with EUR 183 million (DKK
1,364 million) in 1997. Return on
capital employed (ROCE) decreased to
9% after tax, down from 14% in
1997. The Board proposes that EUR
79 million (DKK 591 million) be dis-
tributed as dividends.
The 1998 accounts include EUR
54 million (DKK 405 million) in addi-
tional restructuring costs linked main-
ly to the acceleration of the Site Devel-
opment Programme. The number of
employees is on the decline, also main-
ly due to this programme, but at the
same time Borealis is building up com-
petence for its future growth.
Total capital expenditure was
EUR 247 million (DKK 1,841 mil-
lion), which is an increase of 18%
compared to 1997.
Cash flow from operations
increased to EUR 386 million (DKK
2,878 million) in 1998 from EUR 324
million (DKK 2,416 million) in 1997.
With a solvency ratio of 44% and an
average, after-tax ROCE of 12% since
start-up, the company is on par with
the financial targets set when Borealis
was established in 1994.
I T ’ S A N A T T I T U D E
P A R T N E R S H I P
12
RE
PO
RT
O
F T
HE
B
OA
RD
O
F D
IR
EC
TO
RS
Markets and customers
Average polyolefin prices
declined 14% in 1998 from levels in
1997. Especially during the last quar-
ter of 1998, pressure on the market
increased, leading to price reductions
and lower sales volumes.
However, Borealis' price pre-
miums compared to general-purpose
polyolefins improved, driven by an
increased portion of high value-added
products.
The acquisition of PCD
strengthened Borealis' competence,
especially in polypropylene (PP), and
positioned it better for polyolefins
markets in central and eastern Europe.
There was little overlap of customers.
Health, safetyand environmentalperformance
The Group made continued
progress in the area of health, safety
and the environment (HSE) but this
improvement was marred by the
contractor fatality in November at the
Borealis site in Porvoo, Finland.
This accident points to the need
for further improvements in safety.
Lost time accidents for Borealis' own
employees continued to decline in
1998, and now stand near the average
for the European chemical industry.
Total recordable injuries fell by more
than 30% compared to 1997, to 10.2
cases per million working hours. Total
plant emissions were also lower than
in 1997 but Borealis needs to improve
its performance further.
The Group's sick leave percent-
age was the only parameter that
increased during the year, to 3.0%
from 2.8% in 1997.
In 1998, Borealis invested EUR
16 million (DKK 120 million) in pro-
jects where HSE considerations were
the sole or dominant issues.
Operation and production
Total output in 1998 was 3,107
tonnes polyolefins and 1,850 tonnes
olefins. Operational regularity and
quality performance improved com-
pared to 1997.
Proprietary technology
Borealis' proprietary technology,
Borstar, is a prerequisite for the
company's growth ambitions and per-
formance product profile.
Customers' acceptance of Bor-
star PE products in all applications
has been very positive. The Borstar PP
project is progressing according to
schedule, including the development of
a first-phase product portfolio.
Borealis has established a number of
contacts with potential licensees for
this technology.
In the meantime, Borealis con-
tinues its strategic management of
intellectual rights. The Group filed
some 40 new patent applications in
1998.
RE
PO
RT
O
F T
HE
B
OA
RD
O
F D
IR
EC
TO
RS
13
Philips Délice coffeemaker
Philips and Borealis began working together early in developing the Philips Délice coffeemaker.
The challenge for the modern kitchen appliances industry is to ensure a continuous
improvement in costs, features and design. Clearly, partnership pays.
Future prospects
Growth in total demand and
average prices for polyolefins weak-
ened as Borealis entered 1999. These
pressures are expected to continue in
the months ahead. The economic
downturn in Asia, Russia and Latin
America, combined with the unsatis-
factory market situation for commod-
ity plastics, appears likely to accelerate
the trend towards further industry
consolidation.
Facing these challenges, Borealis
has strengthened its focus on improv-
ing cost and operational performance
through its Site Development Pro-
gramme, through further cost reduc-
tions mainly in corporate overhead,
and by taking full advantage of the
new organisation and synergies linked
to the PCD acquisition.
At the same time, the Group's
PE and PP capacity will be upgraded
through Borstar technology. Key Bor-
star projects in Abu Dhabi, Sweden
and Austria will be realised according
to schedule.
Borealis continues to work to
ensure that the company will operate
safely and conduct business before,
during and after the rollover to Jan.1,
2000. The Group's Year 2000 Pro-
gramme covers all Borealis sites and
offices, and includes all activities per-
taining to own assets, feedstocks, raw
materials, utilities, services and cus-
tomers.
The Borealis Group began phas-
ing in the euro from Jan.1, 1999. The
key figures for 1998 are already ex-
pressed in the new European currency
unit.
This report was approved by the Board of Directors
in Copenhagen on Feb. 23, 1999.
Financial Review
Research and development costs
amounted to approximately EUR 36
million (DKK 270 million), compared
to EUR 25 million (DKK 190 million)
in 1997.
Restructuring costs
A provision for restructuring
was increased with EUR 52 million
(DKK 385 million) in 1998 and
includes costs for early retirement and
voluntary severance programmes in
connection with the ongoing Site
Development Programme.
These measures are based on
formal management decisions, estab-
lishment of agreements with employees'
representatives, as well as public
announcement of the plan. The per-
sonnel reductions of the Site Develop-
ment Programme will be completed by
the end of 2000. At year-end 1998,
the total provision for restructuring
amounted to EUR 69 million (DKK
516 million) compared to EUR 28
million (DKK 210 million) in 1997.
14
FIN
AN
CIA
L R
EV
IE
W
Market Developments
Polyolefins market prices
decreased during the year. Compared
to 1997, average polyolefins prices
were 14% lower.
The average price of naphtha,
the main feedstock, also fell, resulting
in a significant net feedstock cost
reduction for a standard naphtha
cracker. The integrated margin fell by
6%.
Review of Results
Sales
Sales and production volumes
were significantly increased through
the acquisition of the PCD Polymere
business. Polyolefin sales volumes
totalled 2.9 million tonnes compared
to 2.2 million tonnes in 1997.
Sales increased by EUR 223 mil-
lion (DKK 1,663 million).
Cost development
Fixed costs, excluding PCD and
restructuring costs, were on par with
1997. Reductions resulting from the
accelerated Site Development Pro-
gramme are expected in 1999.
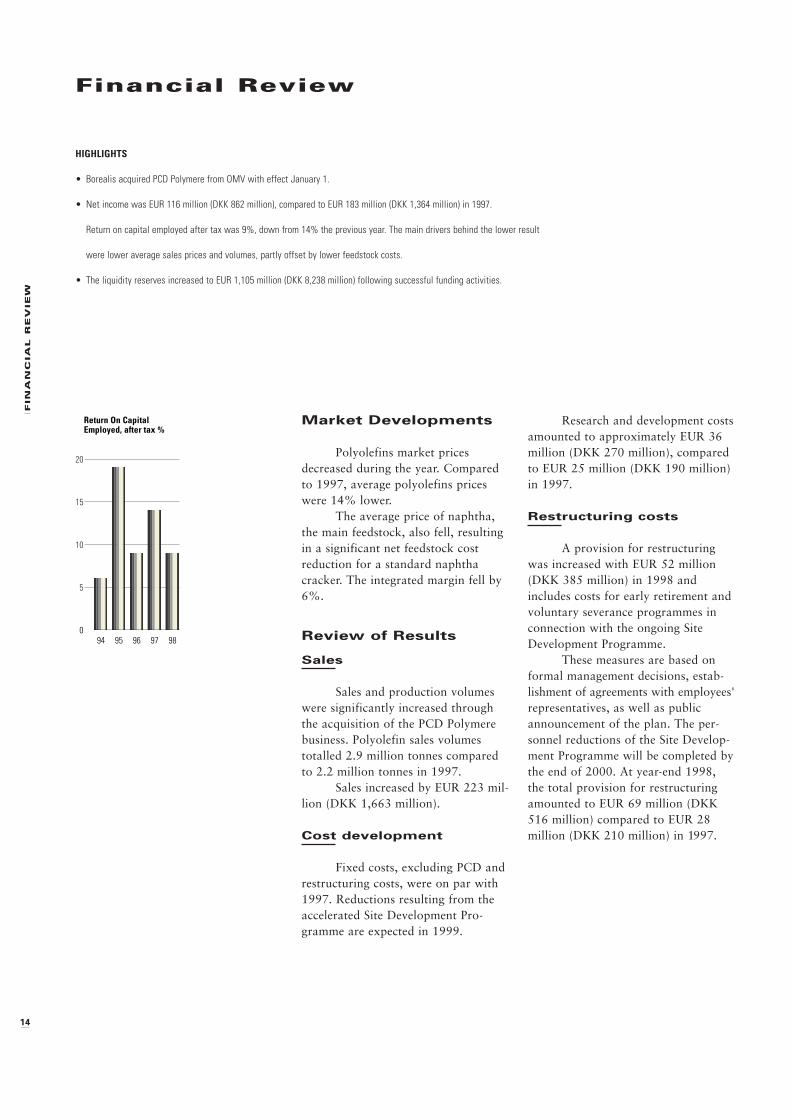
HIGHLIGHTS
• Borealis acquired PCD Polymere from OMV with effect January 1.
• Net income was EUR 116 million (DKK 862 million), compared to EUR 183 million (DKK 1,364 million) in 1997.
Return on capital employed after tax was 9%, down from 14% the previous year. The main drivers behind the lower result
were lower average sales prices and volumes, partly offset by lower feedstock costs.
• The liquidity reserves increased to EUR 1,105 million (DKK 8,238 million) following successful funding activities.
9594 96 97 98
Return On CapitalEmployed, after tax %
0
5
10
15
20
FIN
AN
CIA
L R
EV
IE
W
15
Return on capitalemployed
The return on capital employed
after tax amounted to 9%, down from
14% in 1997, with an average for the
years 1994-1998 of 12%, above the
long-term target of 11%.
Sensitivity analysis
The table below illustrates the
approximate effect of changes in mar-
ket conditions on Borealis' pre-tax
profits at the end of 1998:
Sensitivity
EUR million DKK million
Polyolefins prices
+/- 5 pf/kg +/- 75 +/- 560
Polyolefins sales
volumes +/- 5% +/- 51 +/- 380
Naphtha prices
+/- 10 USD/tonne -/+ 20 -/+ 150
Financial income andexpenses
Net financial expenses
amounted to EUR 21 million (DKK
153 million) compared to EUR 13
million (DKK 100 million) in 1997.
Foreign exchange differences
showed a gain of EUR 5 million (DKK
37 million) compared to EUR 3 mil-
lion (DKK 24 million) in 1997.
Taxes
The provision for income taxes
amounted to EUR 30 million (DKK
220 million) compared to EUR 37
million (DKK 277 million) in 1997,
corresponding to an effective tax rate
of 20% (17% in 1997). Borealis paid
corporate taxes of EUR 54 million
(DKK 401 million) compared to EUR
44 million (DKK 326 million) in
1997.
Net profit and distributionof dividend
Net profit for the year amount-
ed to EUR 116 million (DKK 862 mil-
lion), compared to EUR 183 million
(DKK 1,364 million) in 1997. The
Board of Directors proposes to distrib-
ute 69% of the net profit, correspond-
ing to EUR 79 million (DKK 591 mil-
lion) compared to EUR 91 million
(DKK 682 million) in 1997 as divi-
dends.
Financial Position
Total assets/capitalemployed
Total assets and capital
employed stood at EUR 2,636 million
(DKK 19,650 million) and EUR 1,765
million (DKK 13,157 million), respec-
tively, at year-end, compared to EUR
2,175 million (DKK 16,212 million)
and EUR 1,543 million (DKK 11,500
million) at year-end 1997.
Net interest-bearing debt was
increased with EUR 133 million (DKK
992 million) during 1998, and stood
at EUR 314 million (DKK 2,337 mil-
lion) at the end of the year.
The solvency ratio was 44% at
year-end 1998 compared to 52% at
year-end 1997. The gearing ratio
increased to 28% at year-end 1998.
16
FIN
AN
CIA
L R
EV
IE
W
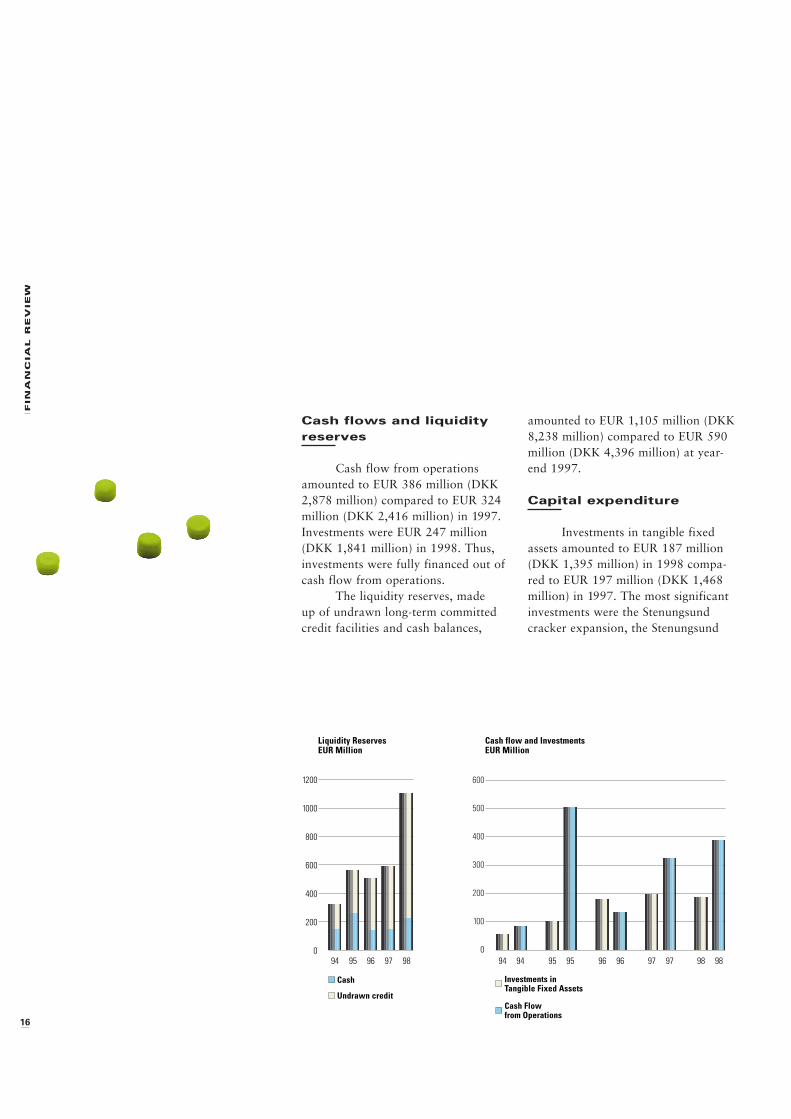
Cash flows and liquidityreserves
Cash flow from operations
amounted to EUR 386 million (DKK
2,878 million) compared to EUR 324
million (DKK 2,416 million) in 1997.
Investments were EUR 247 million
(DKK 1,841 million) in 1998. Thus,
investments were fully financed out of
cash flow from operations.
The liquidity reserves, made
up of undrawn long-term committed
credit facilities and cash balances,
amounted to EUR 1,105 million (DKK
8,238 million) compared to EUR 590
million (DKK 4,396 million) at year-
end 1997.
Capital expenditure
Investments in tangible fixed
assets amounted to EUR 187 million
(DKK 1,395 million) in 1998 compa-
red to EUR 197 million (DKK 1,468
million) in 1997. The most significant
investments were the Stenungsund
cracker expansion, the Stenungsund
9594 96 97 98
Liquidity ReservesEUR Million
0
200
400
600
800
1000
1200
Cash
Undrawn credit
9494 95 95 96 96 97 97
Cash flow and InvestmentsEUR Million
0
100
200
300
400
600
500
98 98
Investments inTangible Fixed Assets
Cash Flowfrom Operations
FIN
AN
CIA
L R
EV
IE
W
17
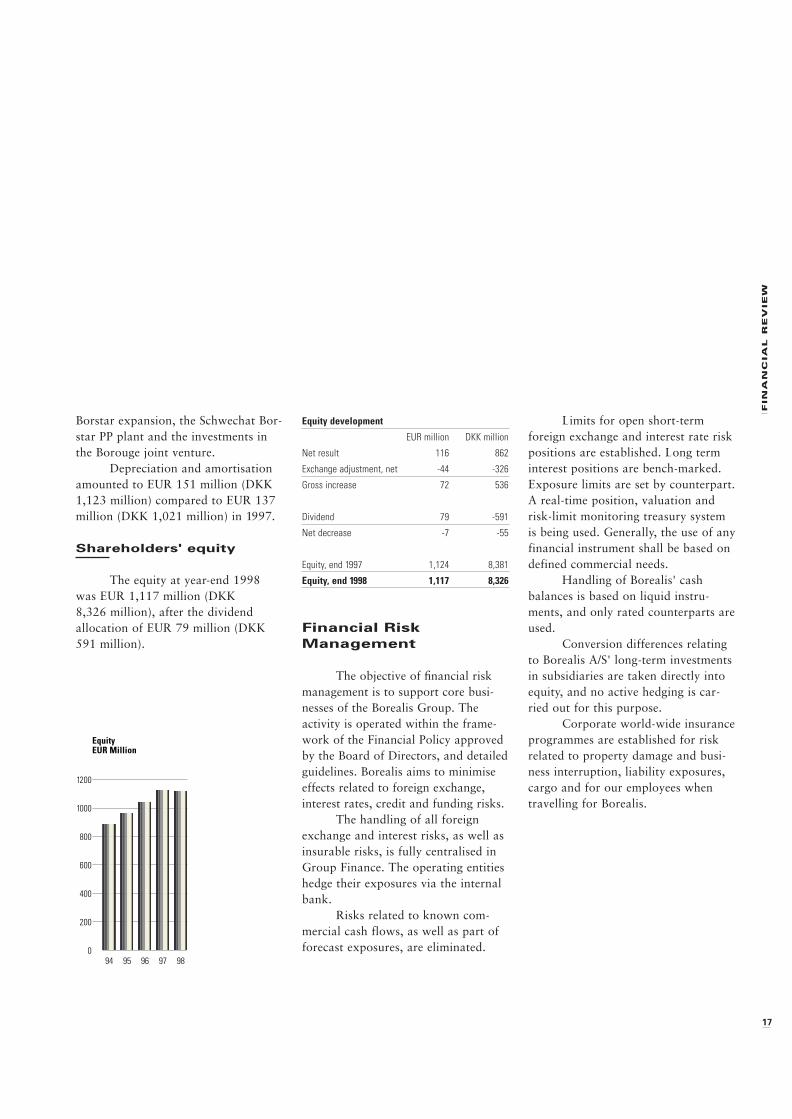
Borstar expansion, the Schwechat Bor-
star PP plant and the investments in
the Borouge joint venture.
Depreciation and amortisation
amounted to EUR 151 million (DKK
1,123 million) compared to EUR 137
million (DKK 1,021 million) in 1997.
Shareholders' equity
The equity at year-end 1998
was EUR 1,117 million (DKK
8,326 million), after the dividend
allocation of EUR 79 million (DKK
591 million).
Financial RiskManagement
The objective of financial risk
management is to support core busi-
nesses of the Borealis Group. The
activity is operated within the frame-
work of the Financial Policy approved
by the Board of Directors, and detailed
guidelines. Borealis aims to minimise
effects related to foreign exchange,
interest rates, credit and funding risks.
The handling of all foreign
exchange and interest risks, as well as
insurable risks, is fully centralised in
Group Finance. The operating entities
hedge their exposures via the internal
bank.
Risks related to known com-
mercial cash flows, as well as part of
forecast exposures, are eliminated.
Limits for open short-term
foreign exchange and interest rate risk
positions are established. Long term
interest positions are bench-marked.
Exposure limits are set by counterpart.
A real-time position, valuation and
risk-limit monitoring treasury system
is being used. Generally, the use of any
financial instrument shall be based on
defined commercial needs.
Handling of Borealis' cash
balances is based on liquid instru-
ments, and only rated counterparts are
used.
Conversion differences relating
to Borealis A/S' long-term investments
in subsidiaries are taken directly into
equity, and no active hedging is car-
ried out for this purpose.
Corporate world-wide insurance
programmes are established for risk
related to property damage and busi-
ness interruption, liability exposures,
cargo and for our employees when
travelling for Borealis.
Equity development
EUR million DKK million
Net result 116 862
Exchange adjustment, net -44 -326
Gross increase 72 536
Dividend 79 -591
Net decrease -7 -55
Equity, end 1997 1,124 8,381
Equity, end 1998 1,117 8,326
9594 96 97 98
EquityEUR Million
0
200
400
600
800
1000
1200
18
RE
SE
AR
CH
&
D
EV
EL
OP
ME
NT
Research & Development
The key role for Borealis' research and
product development is to support
ongoing business, identify new busi-
ness opportunities and develop pro-
prietary technology which can be sold
or licensed to third parties.
The trend towards higher devel-
opment costs and shorter product life
cycles requires significant investment,
and only a few companies can afford
being R&D leaders. Partnerships and
alliances are becoming the rule in
order to reduce costs and the vulner-
ability of being "left behind." Intellec-
tual rights are increasingly important,
and patents are used as strategic tools.
The strategic objectives for
Borealis R&D are to:
• Improve customer offerings by help-
ing Business Units to improve the
product and cost performance of
present grades and plants
• Expand the window of polyolefin
product performance into areas cur-
rently dominated by more expensive
and/or less environmentally friendly
materials
• Develop leading-edge, proprietary
technology in catalysts, processes
and products which can be profit-
ably licensed to third parties
• Concentrate on key technology areas
to improve the effectiveness of R&D
and to create an organisation in
which people want to work
Borealis has a strong proprie-
tary technology in Borstar, a process
developed commercially for PE
and now for PP. This technology
provides a new range of polyolefin
products which combine superior
properties with competitive produc-
tion costs and less burden on the
environment.
New products,new customers
Borealis has developed non-
woven products based on soft PP tech-
nology for breathable film/non-woven
composites. This tailor-made product
is well suited to existing conversion
technologies on the market, and to the
new cast, cast-coating and coating
technologies. The prime markets are
the clothing, construction and person-
al hygiene industries. Extremely high
coating and stretching velocities are
possible, and the achieved values are
among the top for filled products in
this sector.
To meet the increasing require-
ments for noise reduction in cars,
Borealis has developed a new mineral-
filled type, based on the same soft PP
technology for wheel arches. This
product has been employed successful-
ly in the VW Passat.
Borealis' efforts to increase the
melt strength, and especially foamabil-
ity, of PP have continued successfully.
Optimising our pilot plant made it
possible to increase both the produc-
tion stability and consistency of high-
melt strength PP. The grade Daploy
HMS 130D is being introduced in the
market for foaming applications.
Two more homopolymer grades,
Daploy HMS 110F and 120D have
been developed for use in the process-
ing technologies for coating and
blown film. Daploy HMS 110F plays
an important role as a processing aid
in the breathable composites men-
tioned above.
RE
SE
AR
CH
&
D
EV
EL
OP
ME
NT
19
I T ’ S A N A T T I T U D E
I N N O V A T I O N
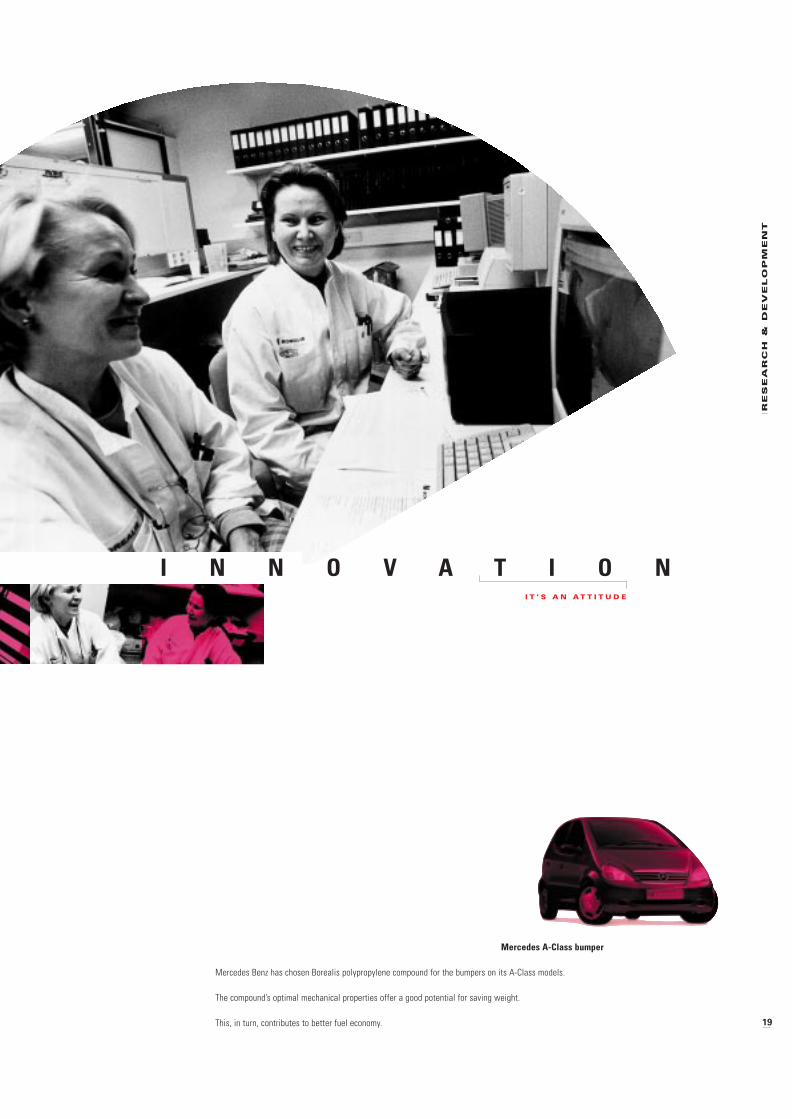
Mercedes A-Class bumper
Mercedes Benz has chosen Borealis polypropylene compound for the bumpers on its A-Class models.
The compound’s optimal mechanical properties offer a good potential for saving weight.
This, in turn, contributes to better fuel economy.
20
RE
SE
AR
CH
&
D
EV
EL
OP
ME
NT
One interesting product devel-
opment for Borealis is the establish-
ment of an entire range of elastomeric
ethylene methyl acrylate copolymers,
or EMA, such as the very soft but
tough OE5626. It is used by the Ikea
furniture chain for its soft "a.i.r." con-
cept – strong, inflated furniture mod-
ules that are combined to fill a living
room.
From R&T to R&D
When the new Borealis emerged
in 1998 with a new ownership struc-
ture and the acquisition of PCD,
research and development was restruc-
tured with it. This acquisition
strengthened our R&D operations by
adding key competencies and exper-
tise.
The first change was in name:
Borealis' former Research and Tech-
nology (R&T) unit became Research
and Development (R&D).
The former Skill Centres,
responsible for application know-how
and product development, were trans-
ferred to their corresponding Business
Units to establish a stronger link
between them and the market. This
will help Borealis increase customer
focus as our company grows.
Our R&D activities are now
concentrated at three Borealis loca-
tions: Porvoo, Finland; Rønningen,
Norway; and Linz, Austria.
After four years in practice,
Borealis' project management system,
"Product Development and Introduc-
tion" (PD&I), has proven its strength
and the R&D portfolio is even more
focused than before. R&D will contin-
ue to host the PD&I system, covering
all research and product development
within Borealis.
Without people, hardware has
no value. Skilled and committed
people of many nationalities comprise
Borealis' cross-functional development
teams. This has helped create an open,
inspiring atmosphere in which we set
our targets high and challenge our
scientists. The project teams can see
the fruits of their labour when the
new technology is commercialised.
Intellectual rights
The polyolefins industry is
restructuring with mergers and acqui-
sitions, and this can be felt in the field
of intellectual rights. New companies
are being formed, and technology
assets transferred and recreated.
Borealis R&D has responded by
committing more resources to protect-
ing the results of our research and
product development, and to support-
ing our business and licensing activ-
ities. We are broadening our rights to
operate freely by increasing patent
activity and agreements with external
parties.
Borealis promotes innovation
and rewards people who make contri-
butions to product and technological
development. This has also been rec-
ognised by third parties: The Borstar
PP team was cited by the Chemical
Industry Federation of Finland for the
development of proprietary technology
for polypropylene production.
In 1998, Borealis filed some 40
new patent applications and internally,
received about 80 invention disclo-
sures. The application of Borealis'
research and development is limited
only by the imagination.
RE
SE
AR
CH
&
D
EV
EL
OP
ME
NT
21
I T ’ S A N A T T I T U D E
A D D E D V A L U E
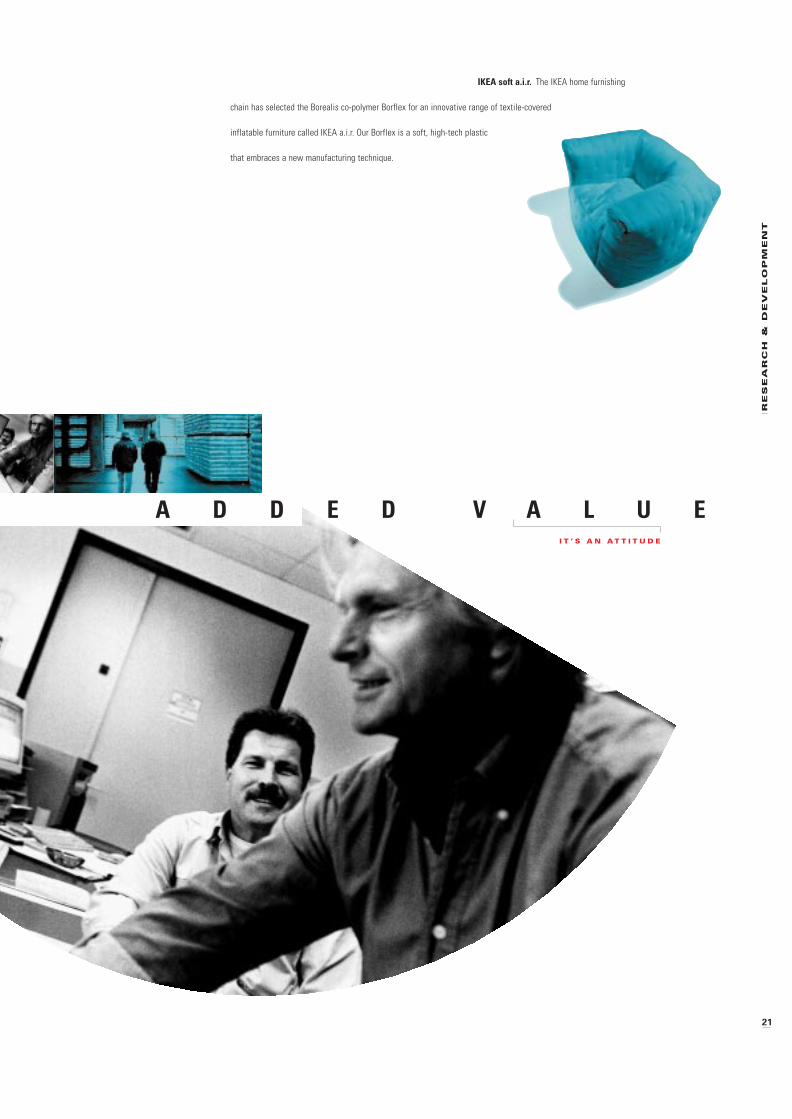
IKEA soft a.i.r. The IKEA home furnishing
chain has selected the Borealis co-polymer Borflex for an innovative range of textile-covered
inflatable furniture called IKEA a.i.r. Our Borflex is a soft, high-tech plastic
that embraces a new manufacturing technique.
22
BO
RS
TA
R T
EC
HN
OL
OG
Y F
OR
P
E A
ND
P
P
Borstar Technology for PE and PP
Borealis has advanced its position in
polyolefins process and catalyst devel-
opment with Borstar, a new technolo-
gy for PE and PP. Borstar provides
superior plastic products for a broad
range of applications at competitive
cost and with less burden on the envi-
ronment.
Borstar PE
The Borstar bimodal PE concept
allows the manufacture of resins that
are tough but with good processabil-
ity. These products compete on the
most advanced PE markets where the
borders are constantly being stretched.
One striking feature of Borstar PE is
the possibility to operate over the
entire density range. Borealis has
developed not only a linear low den-
sity film, LE6592, but also a high den-
sity film, HE6995, both of which have
been well received by the market. The
medium density film product ME6597
is yet another example. Customers
have shown interest in its unique
properties, and sales figures are
encouraging.
We have also seen rapid devel-
opment of our bimodal resins for
blow moulding and pipe. Our PE100
pipe grade, HE3490, allows the con-
struction of even thinner-walled PE
pipes for advanced drinking water
projects.
Borstar PP
Three years after the commer-
cial launch of Borstar PE, Borealis is
now commercialising Borstar PP.
Borstar PP utilises the same
technology as Borstar PE. The basic
process is a combination of a loop
reactor, operated at supercritical or
high-temperature conditions, in series
with a gas-phase reactor. Homopoly-
mers and random copolymers are pro-
duced in the basic module. For pro-
duction of heterophasic copolymers,
an additional gas-phase reactor is
included.
This reactor set-up produces all
three types of PP. In the complete Bor-
star PP process, an additional gas-
phase reactor is included to give the
possibility of making heterophasic
copolymers with tailored rubber.
As in PE, Borstar PP technology
includes catalyst technology, and the
first high yield Ziegler-Natta catalyst
is already in commercial use. Catalysts
in the Z-N families are being further
developed for specific Borstar PP
product requirements. We are also
developing single site catalyst tech-
nology for Borstar PP.
Because of the reactor set-up,
the Borstar PP process also has a
broad product window. While the
Borstar PE concept is bimodal, in PP
we call the products "multimodal,"
since the products may contain more
than two different polymer fractions.
Developmental grades include a
range from very soft to very stiff PP.
Product properties which are adverse
are combined. Thus, high stiffness is
combined with high impact. Good
impact is combined with good optical
properties. High stiffness and impact
are combined with good processabil-
ity, low creep and good melt strength.
With their excellent processabil-
ity and superior mechanical proper-
ties, Borstar products from Borealis
give added value to our customers.
Continued research and development
will bring even more superior prod-
ucts to the market.
BO
RS
TA
R T
EC
HN
OL
OG
Y F
OR
P
E A
ND
P
P
23
I T ’ S A N A T T I T U D E
P E R F O R M A N C E
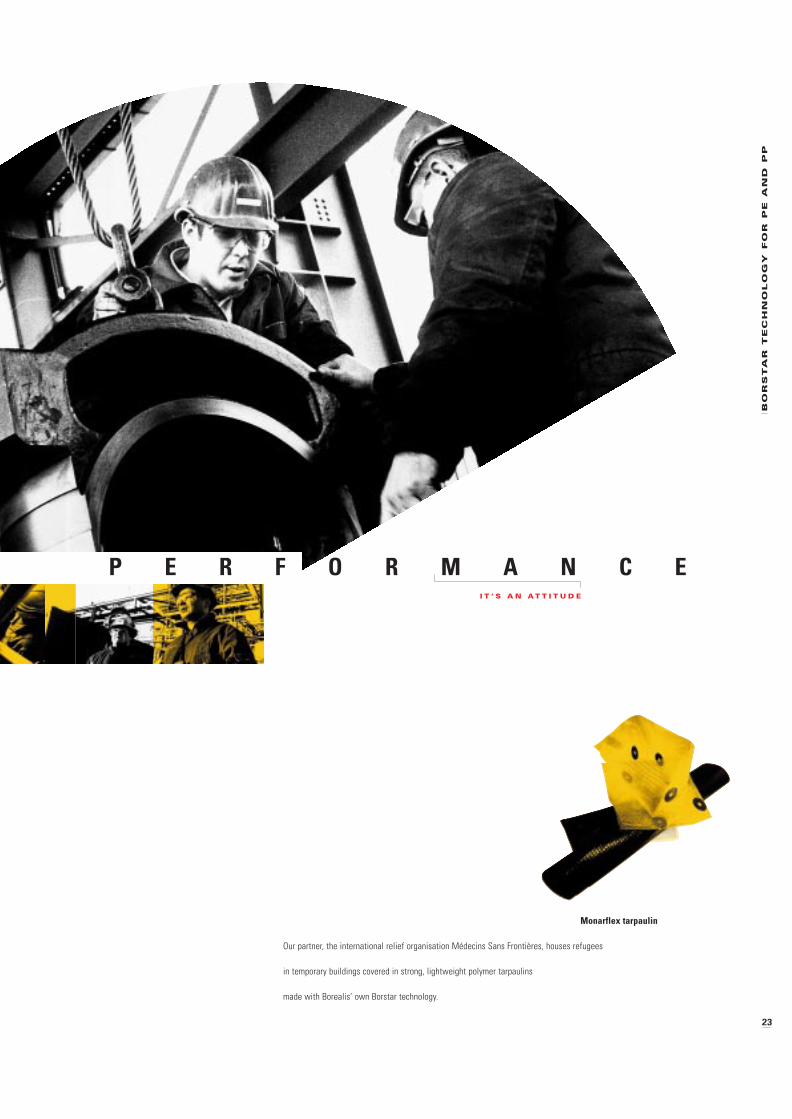
Monarflex tarpaulin
Our partner, the international relief organisation Médecins Sans Frontières, houses refugees
in temporary buildings covered in strong, lightweight polymer tarpaulins
made with Borealis’ own Borstar technology.
24
PR
EP
AR
IN
G F
OR
Y
EA
R 2
00
0
Preparing for Year 2000
Computers, operating systems, embed-
ded microchips, software, and other
electronic items in which dates have
been stored as six digits rather than
eight, have pervaded virtually every
segment of our lives: In homes, work-
places, laboratories, social infrastruc-
ture, in the supply of utilities and ser-
vices, and more. If they are not ready
for year 2000, they might cease to
function correctly.
The problem was identified ear-
ly by Borealis when the installation of
new commercial software, with some
special adaptations for Borealis, was
initiated in 1995 and implemented in
1996-97. This software is essentially
year 2000-ready, but due to the poten-
tially negative effects on business if it
were to fail, compliance testing will
nevertheless be performed.
In mid-1997 a corporate-wide
Year 2000 Programme was started. Its
goals are to ensure that Borealis con-
tinues to operate and do business
before, during and after the century
change.
The programme covers all
Borealis sites in Austria, Belgium,
Finland, France, Germany, Italy, Nor-
way, Portugal and Sweden; its sales
offices in Europe and the Far East;
and its Coordination Center and head
office.
The scope of the programme
includes all activities pertaining to
own assets, feedstocks, raw materials,
utilities, services and customers.
Progress in 1998
Borealis has made an inventory
of owned assets which could be
affected by the so-called "millennium
bug." This inventory extends to about
13,000 records of different models or
types. Each could contain several
microprocessors, or there could be
many instances of each model.
The different tasks of the Year
2000 Programme have been priorit-
ised. In the areas of highest impact,
solutions for non-ready items were
developed and approved during 1998,
and those of medium impact at the
end of February 1999. Solutions for
both will be implemented before Sep-
tember 1999, and solutions required
for the remaining categories will be
devised in early 1999 and applied later
in the year.
Borealis is seriously committed
to this programme because it realises
the effects of failure on society,
employees, customers and suppliers.
The process we are following enables
us to guarantee that technical break-
downs caused by Borealis' operational
facilities not being prepared for the
rollover to year 2000 will not in any
way result in Borealis declaring a force
majeure that can have an adverse
effect on Borealis fulfilling its commit-
ments.
PR
EP
AR
IN
G F
OR
Y
EA
R 2
00
0
25
I T ’ S A N A T T I T U D E
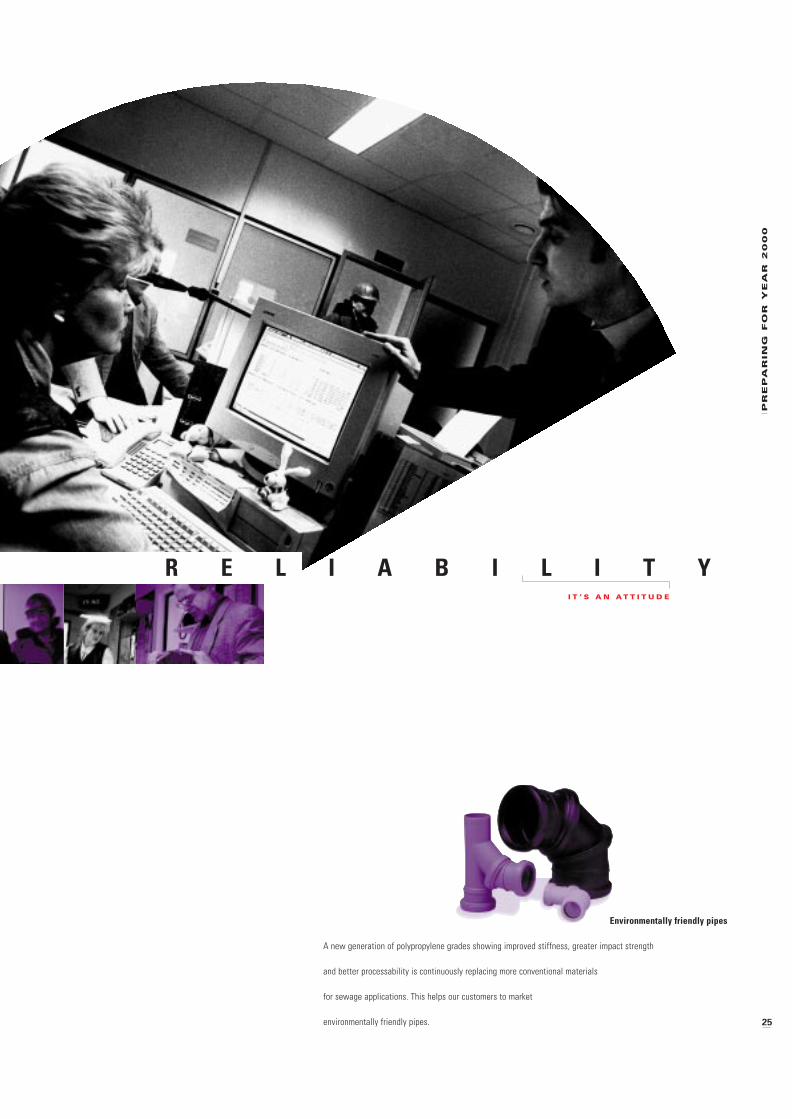
R E L I A B I L I T Y
Environmentally friendly pipes
A new generation of polypropylene grades showing improved stiffness, greater impact strength
and better processability is continuously replacing more conventional materials
for sewage applications. This helps our customers to market
environmentally friendly pipes.
26
BU
SIN
ES
S U
NIT
R
EV
IE
WS
Business Unit Reviews
Wire & Cable
Overcapacity in the world cable
industry, plus the effects of the eco-
nomic downturn in Asia and South
America, caused further pressure on
the overall profitability of this indus-
try sector. However, Borealis suc-
ceeded in limiting the impact on its
Wire & Cable business.
Volumes in 1998 were generally
lower than in 1997. Sales in Europe
and the Middle East held at previous-
year levels, despite increased competi-
tion in this region.
Borealis succeeded in increasing
its market share in China, where
demand remained healthy. Perform-
ance also improved in the North and
South American markets.
Borealis in 1998 again demon-
strated its leading position in tech-
nology. Power and telecom jacketing
products based on our proprietary
Borstar technology were well received
in the market due to their superior
properties. Further development of
our Casico technology, providing halo-
gen-free flame retardant products, led
to increased market penetration in this
high-performance segment.
In addition to this, the commer-
cialisation of Borealis' high-speed per-
oxide cross-linking technology now
allows cable producers to significantly
improve their cost performance in the
medium- and high-voltage area.
The commercial success of this
new generation of products, combined
with a continued commitment to
improve the quality of products and
services to our customers, further con-
solidates Borealis' position as a lead-
ing supplier of polyolefins to the
worldwide wire and cable industry.
Pipe
The pipe market developed dif-
ferently around the world in 1998.
The European market showed contin-
ued growth for polyolefins, but the
Asia-Pacific region suffered from eco-
nomic turmoil. Demand in this area
fell back to 1996 levels.
As a result of the integration of
PCD, Borealis extended its leading
position as a high performance poly-
olefin supplier to the pipe industry.
We expanded our range of products
and achieved synergy in complemen-
tary market positions.
Among applications, we saw
higher growth in hot water pipes, steel
pipe protection and water pipelines.
An important potential for PP is the
existing sewage pipe market which
today is still dominated by PVC.
Margins dropped steadily in
1998 due to a strong reduction in
commodity margins. We expect fur-
ther sales increases in 1999, especially
outside Europe, but with a slightly
lower margin than in 1998.
In the meantime, positive mar-
ket growth in Europe continues. This
development is aided by the replace-
ment of conventional materials such
as steel, concrete and copper with
plastics. Our new generation of PE100
material from Borstar technology and
the new PP stiff grades are our fastest
growing products.
BU
SIN
ES
S U
NIT
R
EV
IE
WS
27
I T ’ S A N A T T I T U D E
C U S T O M E R F O C U S
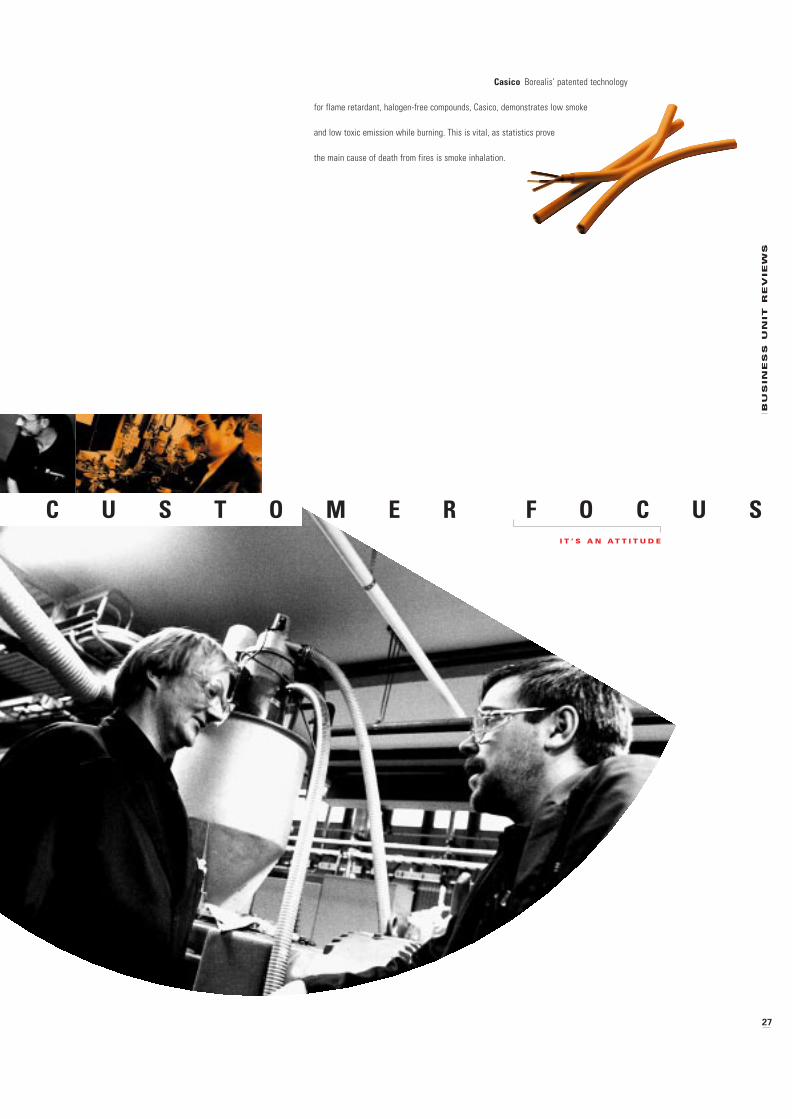
Casico Borealis’ patented technology
for flame retardant, halogen-free compounds, Casico, demonstrates low smoke
and low toxic emission while burning. This is vital, as statistics prove
the main cause of death from fires is smoke inhalation.
28
BU
SIN
ES
S U
NIT
R
EV
IE
WS
Engineering Applications
Borealis' business in Engineer-
ing Applications, serving the automo-
tive and appliances markets, enjoyed
7% sales growth during 1998. Prices
were under growing pressure, al-
though increased sale of specialities
compensated this in part.
European car sales exceeded 14
million units last year, compared with
12.8 million in 1997. Borealis supplied
the first full-series production of the
VW Golf A4 and Mercedes Benz A &
C classes, and extended our coopera-
tion with SEAT.
Borealis entered into product
development partnerships with major
automotive and appliance manufactur-
ers in 1998. Many are based on the
latest reactor or compound develop-
ments with cost-effective, all-polypro-
pylene solutions as the target.
As in previous years, sales
exceeded growth in some market sec-
tors, mainly due to the success of PP
and PP-based compounds in replacing
other materials. New products, appli-
cations and the use of CAED simula-
tions have given rise to new possibil-
ities for automotive applications.
The market for white goods and
small appliances was stagnant, resulting
in sector acquisitions and investment in
profitable markets. Increased OEM
(Original Equipment Manufacture)
activity resulted in larger production
volumes per model of major brands.
An increasing share of Borealis'
business during 1998 went to overseas
markets, with PP rapidly becoming the
material of choice for kitchen appli-
ances.
Investments in the compound
plants resulted in improved quality
and cost position. We established a
new compounding network to ensure
a cross-plant implementation of
systems and procedures in order to be
certified according to QS 9000 and
ISO 14001.
Polyethylene
The most significant event dur-
ing 1998 was the integration of PCD´s
PE business and the reorganisation of
PE activities into a structured line
organisation that focuses on customer
service. This new Polyethylene Busi-
ness Unit has strong market positions
in the Nordic region, central Europe
and on the Iberian peninsula.
Our proprietary Borstar PE
technology cut inroads to a number of
applications through its unique combi-
nation of mechanical strength and
easy processability. Just one example
is the high puncture-resistance of fro-
zen fish bags. They provide optimal
security for the distributor, while the
bags' manufacturer can operate lines
at speeds close to that of traditional
low density PE.
Thinner bags with superior
mechanical properties result in
resource efficiency that benefits the
environment. Borealis foresees rapid
growth for Borstar products. As a
consequence, Borealis is investing in
additional production capacity in Swe-
den and Abu Dhabi.
Another area where Borealis
leads development is in raw materials
for rotational moulding. The penetra-
tion of Borealis' unique, single-site
BU
SIN
ES
S U
NIT
R
EV
IE
WS
29
I T ’ S A N A T T I T U D E
Q U A L I T Y
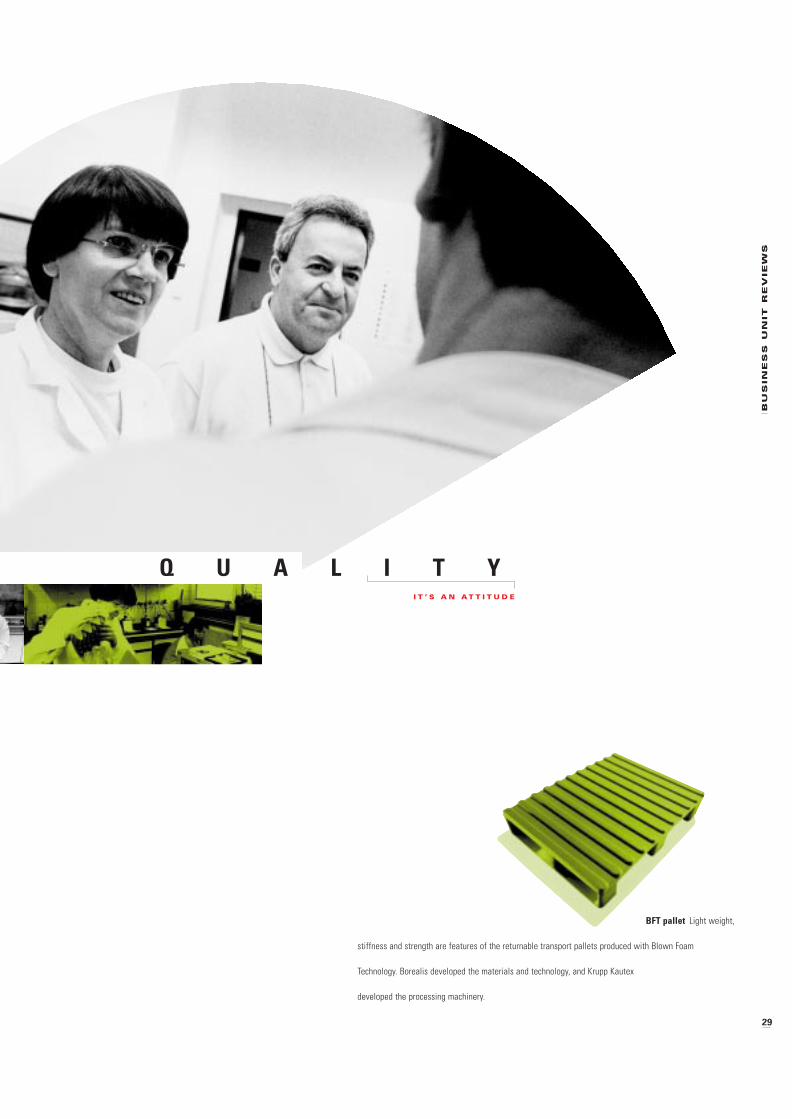
BFT pallet Light weight,
stiffness and strength are features of the returnable transport pallets produced with Blown Foam
Technology. Borealis developed the materials and technology, and Krupp Kautex
developed the processing machinery.
30
BU
SIN
ES
S U
NIT
R
EV
IE
WS
catalyst product range – Borecene – has
continued at an accelerating pace. Fast-
er cycle times, lower moulding temper-
ature and better mechanical properties
are enabling our customers to find new
products that replace conventional
materials and production methods.
Polypropylene
Polypropylene (PP) has demon-
strated high volume growth in recent
years and still has considerable poten-
tial. Borealis and former PCD have
placed major emphasis on PP, and the
successful integration of PCD into
Borealis has strengthened our total
competence. Synergies will be achieved
in marketing and sales, as well as in
technology and production.
The new PP organisation will
continue to advance business activities
through an application- and customer-
oriented approach. The development
of polymers in close collaboration
with customers has resulted in oppor-
tunities for market growth and the
possibility to truly realise the value of
our PP business.
Development is expanding in
two main directions: Increased stiff-
ness enables us to move PP into mar-
kets covered by engineering plastics,
and super-soft PP products lead us
into the rubber market segment.
Borealis in 1998 developed
products that emphasise the versatility
of PP and we extended its use into
new fields. This is best exemplified by
PP products showing high-melt
strength, butene-modified PP for cast
film, polymers with low-heat seal tem-
peratures, and copolymers for mould-
ing applications that require a high
degree of stiffness.
Borealis reached a milestone
in December when we began construc-
tion of the first PP plant to employ
our proprietary Borstar technology,
in Schwechat, Austria. The plant is
scheduled to go on stream in mid-
2000.
Olefins, Phenol &Aromatics
Ethylene and propylene, collec-
tively known as olefins, are the primary
products when cracking feedstocks
such as naphtha. Olefins are polymer-
ised to produce polyethylene and poly-
propylene, known as polyolefins.
Olefins demand remained
strong throughout 1998, both internal-
ly and externally. Olefins prices
eroded during the year but the trend
was offset by lower feedstock costs
from declining oil prices. Margins
remained satisfactory throughout the
year. Production volumes and capacity
utilisation remained high, both inter-
nally and externally, for most of the
year.
Borealis' ethylene production
totalled 1,180,000 tonnes, the highest
level since the company was founded
in 1994, with new production records
reached at the crackers in Stenung-
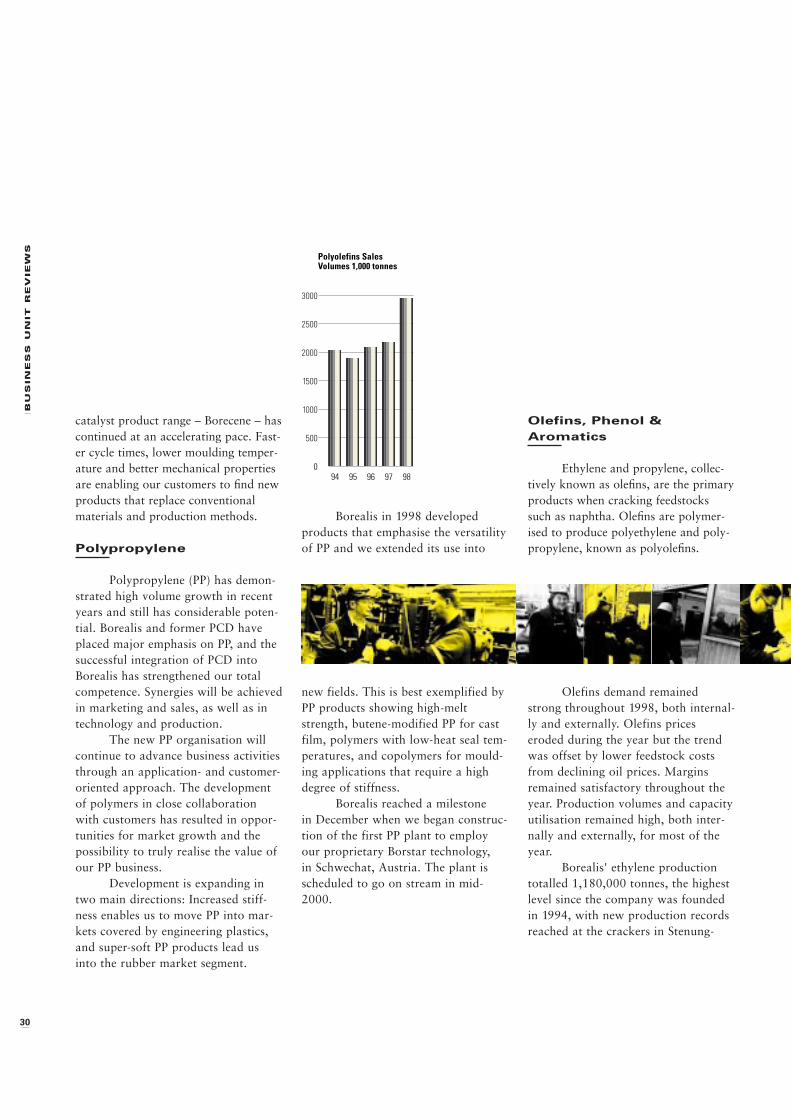
9594 96 97 98
Polyolefins SalesVolumes 1,000 tonnes
0
500
1000
1500
2000
2500
3000
BU
SIN
ES
S U
NIT
R
EV
IE
WS
31
I T ’ S A N A T T I T U D E
T E A M W O R K
sund and Porvoo. Propylene produc-
tion also reached a record high of
770,000 tonnes.
Phenol, derived from aromatic
feedstock from the olefin cracking
process, is used in the production of
adhesives, resins, fibres and pharma-
ceuticals. Acetone, a by-product of
phenol production, is used as a solvent
in methyl methacrylate and in plastics.
The phenol and acetone markets were
strong in the first half of 1998 with
high margins, but prices fell consider-
ably towards the end of the year.
Borealis' newly revamped phenol plant
performed well in its first year of opera-
tion, and phenol production reached its
highest level so far, at 130,000 tonnes.
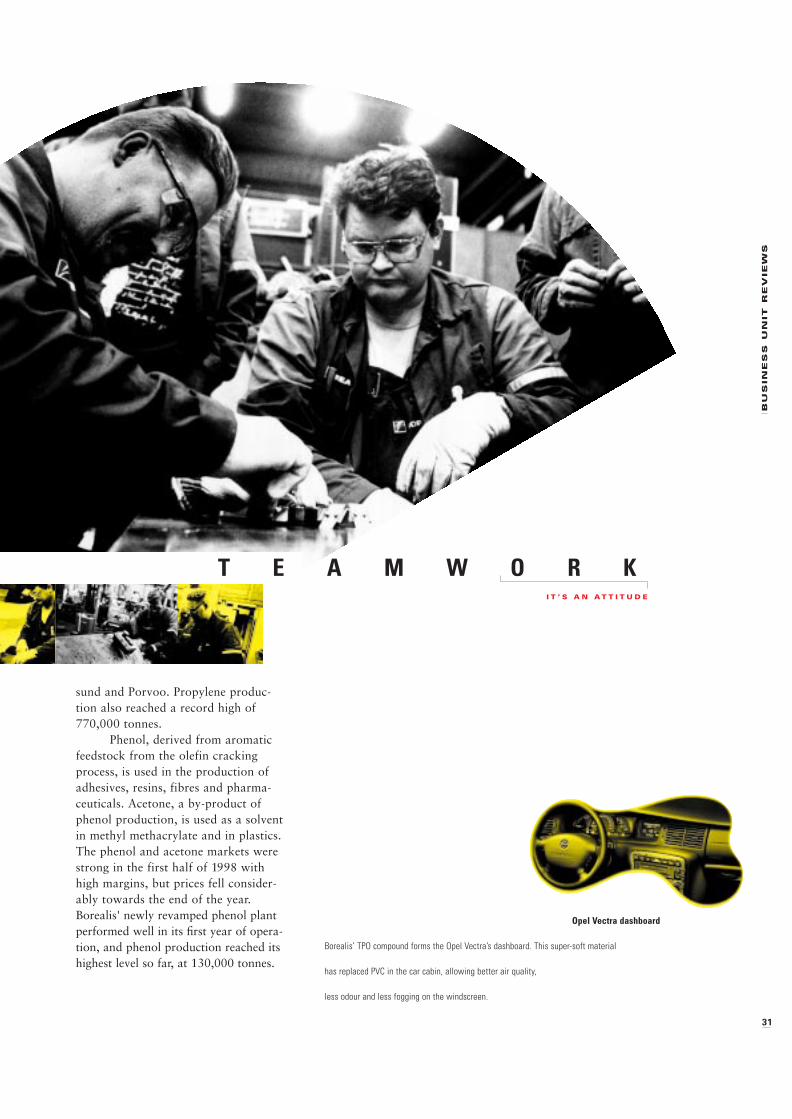
Opel Vectra dashboard
Borealis’ TPO compound forms the Opel Vectra’s dashboard. This super-soft material
has replaced PVC in the car cabin, allowing better air quality,
less odour and less fogging on the windscreen.
32
HE
ALT
H, S
AF
ET
Y A
ND
E
NV
IR
ON
ME
NT
Health, Safety and Environment
HSE targets
Borealis’ HSE targets were
revised in 1998 as part of a new five-
year strategy. New targets were set for
2003 and parameters for improvement
were increased from seven to 12. For
year 2000 the changes are minor,
except for the inclusion of Site Aus-
tria.
Health
The Borealis employee health
programme is designed to ensure the
prevention of illness and injury. Work-
places are monitored for employee
exposure to chemical and physical
agents. Some further improvements
have been identified. Our own work-
place survey system is a tool for con-
tinual improvement in use at our head
office and sites.
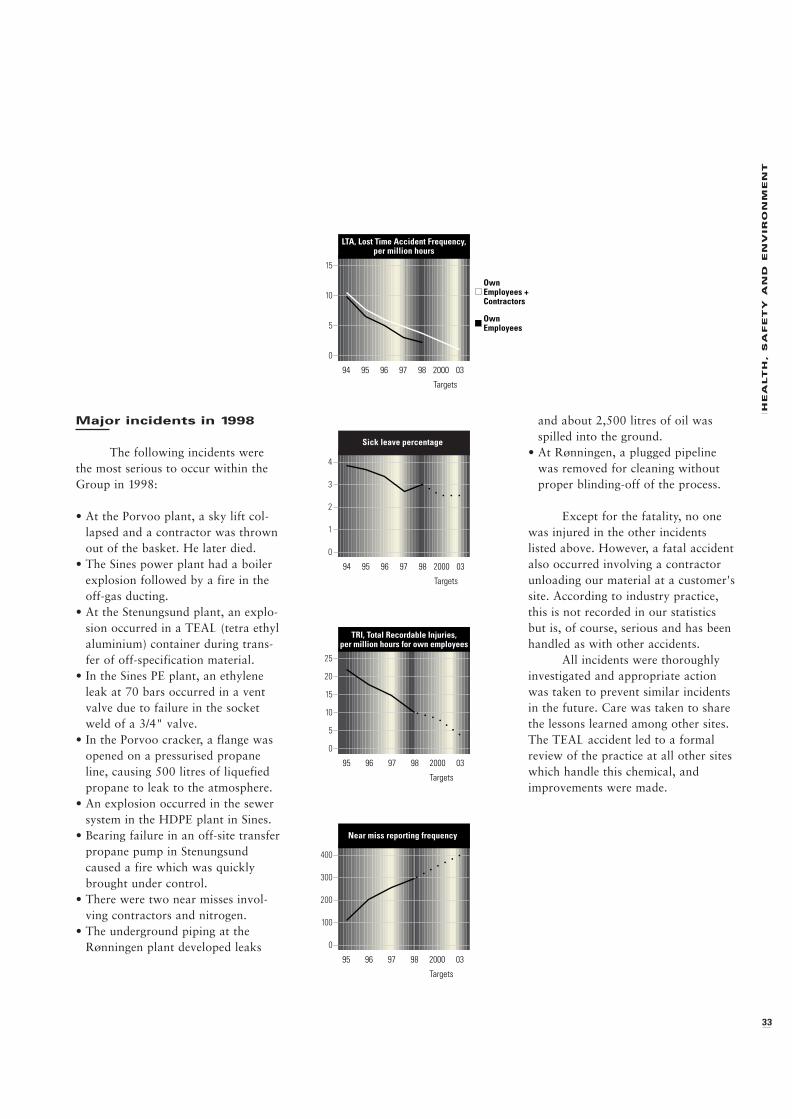
The sick leave percentage
changed only marginally during the
year, thus the expected improvement
was not achieved.
The targets for year 2000 and
2003 are 2.5% in line with the present
situation and planned actions.
Safety
The decline in lost time accident
(LTA) frequency continued, but not
fast enough. The frequency for
contractors was still 3.5 times higher
than for Borealis employees, despite
our ambition that they perform as
well in all HSE areas.
Our present performance is
close to the average for major Euro-
pean chemical industries, but far from
those with the best records, which
have frequencies below 1.
The frequency of total record-
able injuries (TRI) decreased by 30%,
from 14.8 in 1997 to 10.2 in 1998.
Thus, our ambitions have risen and
the new targets are noticeably lower.
The best performing companies have
frequency levels of 2-3.
A total of 78 fires and 116 liq-
uid or gas releases were reported in
1998. This represents an unchanged
number of fires and a noticeable
increase in releases. None of the fires
resulted in an insurance claim, as the
damage was below our deductible limit.
Near-miss reporting is a key ele-
ment for learning and reducing risks.
A campaign that started in 1996 has
improved the frequency of near-miss
reporting. In 1998 the average repor-
ting frequency was 300, compared
with 254 for 1997.
Borealis’ Health, Safety and Environment Policy
As a responsible citizen producing materials that
promote a better standard of living:
We aim to be a leader in our industry in health,
safety and environmental performance.
We give health, safety and the environment top
priority in process and product development, plant
operations and product delivery.
We believe that our workplaces can be free
from accidents and injuries, that emissions can be sig-
nificantly reduced and that resources must be used
efficiently.
We aim to continuously improve our health,
safety and environmental performance through our
employees in partnership with suppliers, contractors
and customers.
We are committed to meeting or exceeding
legal requirements when setting our standards.
This new HSE policy was approved by the Executive
HSE committee in May 1998.
HE
ALT
H, S
AF
ET
Y A
ND
E
NV
IR
ON
ME
NT
33
Major incidents in 1998
The following incidents were
the most serious to occur within the
Group in 1998:
• At the Porvoo plant, a sky lift col-
lapsed and a contractor was thrown
out of the basket. He later died.
• The Sines power plant had a boiler
explosion followed by a fire in the
off-gas ducting.
• At the Stenungsund plant, an explo-
sion occurred in a TEAL (tetra ethyl
aluminium) container during trans-
fer of off-specification material.
• In the Sines PE plant, an ethylene
leak at 70 bars occurred in a vent
valve due to failure in the socket
weld of a 3/4" valve.
• In the Porvoo cracker, a flange was
opened on a pressurised propane
line, causing 500 litres of liquefied
propane to leak to the atmosphere.
• An explosion occurred in the sewer
system in the HDPE plant in Sines.
• Bearing failure in an off-site transfer
propane pump in Stenungsund
caused a fire which was quickly
brought under control.
• There were two near misses invol-
ving contractors and nitrogen.
• The underground piping at the
Rønningen plant developed leaks
and about 2,500 litres of oil was
spilled into the ground.
• At Rønningen, a plugged pipeline
was removed for cleaning without
proper blinding-off of the process.
Except for the fatality, no one
was injured in the other incidents
listed above. However, a fatal accident
also occurred involving a contractor
unloading our material at a customer's
site. According to industry practice,
this is not recorded in our statistics
but is, of course, serious and has been
handled as with other accidents.
All incidents were thoroughly
investigated and appropriate action
was taken to prevent similar incidents
in the future. Care was taken to share
the lessons learned among other sites.
The TEAL accident led to a formal
review of the practice at all other sites
which handle this chemical, and
improvements were made.
LTA, Lost Time Accident Frequency,per million hours
94 95 96 97 98 2000 03
OwnEmployees
Targets
0
5
10
15
OwnEmployees +Contractors
94 95 96 97 98 2000 03
Targets
0
1
2
3
4
Sick leave percentage
95 96 97 98 032000
TRI, Total Recordable Injuries,per million hours for own employees
Targets
0
5
10
15
20
25
95 96 97 98 032000
Near miss reporting frequency
Targets
0
100
200
300
400
34
HE
ALT
H, S
AF
ET
Y A
ND
E
NV
IR
ON
ME
NT
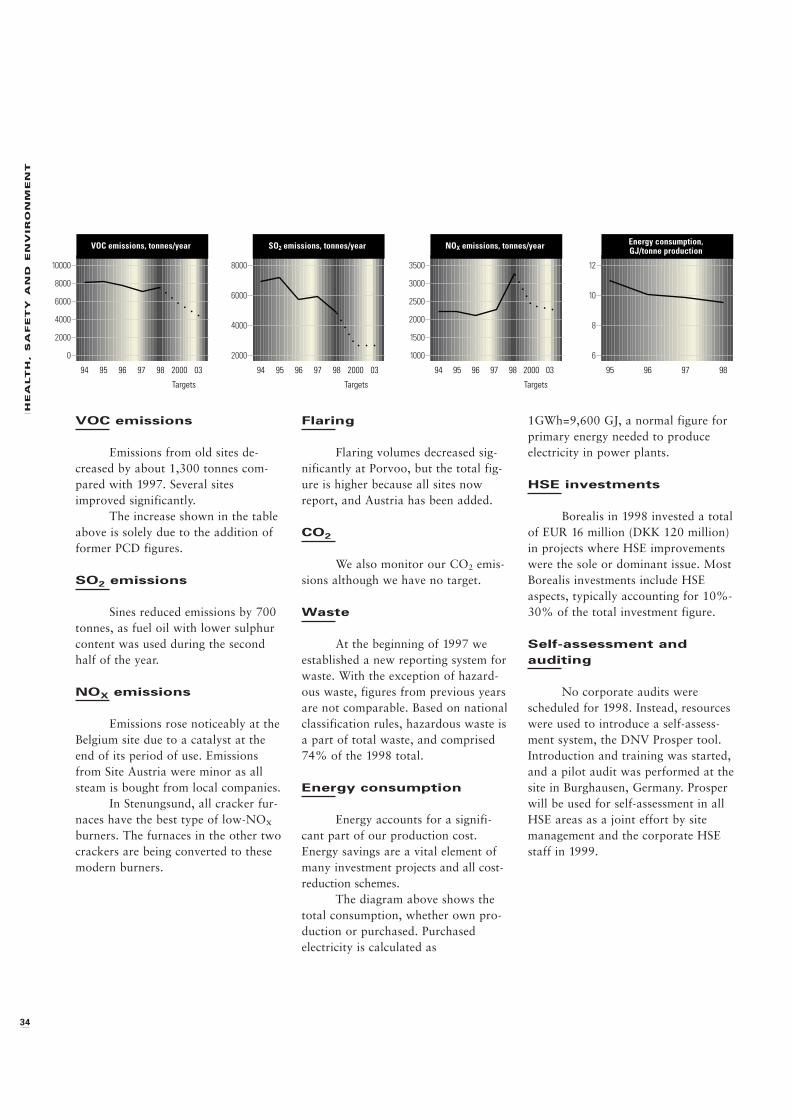
VOC emissions
Emissions from old sites de-
creased by about 1,300 tonnes com-
pared with 1997. Several sites
improved significantly.
The increase shown in the table
above is solely due to the addition of
former PCD figures.
SO2 emissions
Sines reduced emissions by 700
tonnes, as fuel oil with lower sulphur
content was used during the second
half of the year.
NOX emissions
Emissions rose noticeably at the
Belgium site due to a catalyst at the
end of its period of use. Emissions
from Site Austria were minor as all
steam is bought from local companies.
In Stenungsund, all cracker fur-
naces have the best type of low-NOx
burners. The furnaces in the other two
crackers are being converted to these
modern burners.
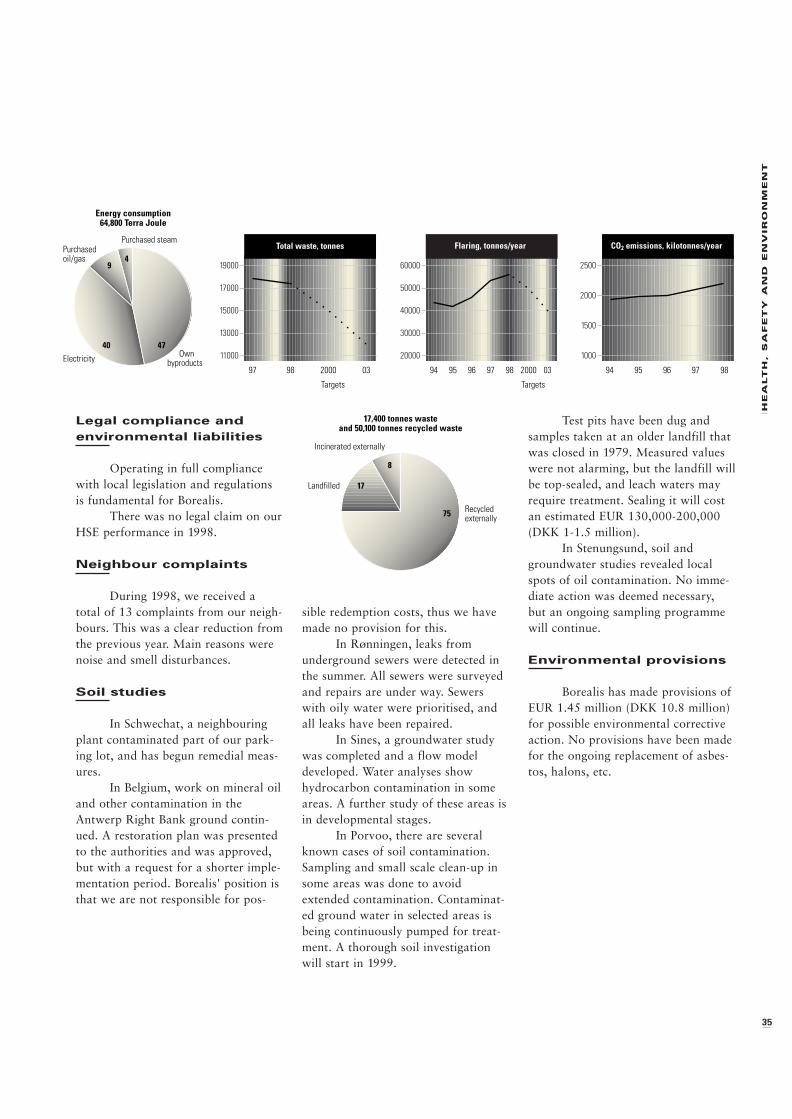
Flaring
Flaring volumes decreased sig-
nificantly at Porvoo, but the total fig-
ure is higher because all sites now
report, and Austria has been added.
CO2
We also monitor our CO2 emis-
sions although we have no target.
Waste
At the beginning of 1997 we
established a new reporting system for
waste. With the exception of hazard-
ous waste, figures from previous years
are not comparable. Based on national
classification rules, hazardous waste is
a part of total waste, and comprised
74% of the 1998 total.
Energy consumption
Energy accounts for a signifi-
cant part of our production cost.
Energy savings are a vital element of
many investment projects and all cost-
reduction schemes.
The diagram above shows the
total consumption, whether own pro-
duction or purchased. Purchased
electricity is calculated as
1GWh=9,600 GJ, a normal figure for
primary energy needed to produce
electricity in power plants.
HSE investments
Borealis in 1998 invested a total
of EUR 16 million (DKK 120 million)
in projects where HSE improvements
were the sole or dominant issue. Most
Borealis investments include HSE
aspects, typically accounting for 10%-
30% of the total investment figure.
Self-assessment andauditing
No corporate audits were
scheduled for 1998. Instead, resources
were used to introduce a self-assess-
ment system, the DNV Prosper tool.
Introduction and training was started,
and a pilot audit was performed at the
site in Burghausen, Germany. Prosper
will be used for self-assessment in all
HSE areas as a joint effort by site
management and the corporate HSE
staff in 1999.
94 95 96 97 98 032000
VOC emissions, tonnes/year
Targets
0
2000
4000
6000
8000
10000
94 95 96 97 98 2000 03
SO2 emissions, tonnes/year
Targets
2000
4000
6000
8000
94 95 96 97 98 2000 03
NOX emissions, tonnes/year
Targets
1000
1500
2000
2500
3000
3500
95 96 9897
Energy consumption,GJ/tonne production
6
8
10
12
HE
ALT
H, S
AF
ET
Y A
ND
E
NV
IR
ON
ME
NT
35
Legal compliance andenvironmental liabilities
Operating in full compliance
with local legislation and regulations
is fundamental for Borealis.
There was no legal claim on our
HSE performance in 1998.
Neighbour complaints
During 1998, we received a
total of 13 complaints from our neigh-
bours. This was a clear reduction from
the previous year. Main reasons were
noise and smell disturbances.
Soil studies
In Schwechat, a neighbouring
plant contaminated part of our park-
ing lot, and has begun remedial meas-
ures.
In Belgium, work on mineral oil
and other contamination in the
Antwerp Right Bank ground contin-
ued. A restoration plan was presented
to the authorities and was approved,
but with a request for a shorter imple-
mentation period. Borealis' position is
that we are not responsible for pos-
sible redemption costs, thus we have
made no provision for this.
In Rønningen, leaks from
underground sewers were detected in
the summer. All sewers were surveyed
and repairs are under way. Sewers
with oily water were prioritised, and
all leaks have been repaired.
In Sines, a groundwater study
was completed and a flow model
developed. Water analyses show
hydrocarbon contamination in some
areas. A further study of these areas is
in developmental stages.
In Porvoo, there are several
known cases of soil contamination.
Sampling and small scale clean-up in
some areas was done to avoid
extended contamination. Contaminat-
ed ground water in selected areas is
being continuously pumped for treat-
ment. A thorough soil investigation
will start in 1999.
Test pits have been dug and
samples taken at an older landfill that
was closed in 1979. Measured values
were not alarming, but the landfill will
be top-sealed, and leach waters may
require treatment. Sealing it will cost
an estimated EUR 130,000-200,000
(DKK 1-1.5 million).
In Stenungsund, soil and
groundwater studies revealed local
spots of oil contamination. No imme-
diate action was deemed necessary,
but an ongoing sampling programme
will continue.
Environmental provisions
Borealis has made provisions of
EUR 1.45 million (DKK 10.8 million)
for possible environmental corrective
action. No provisions have been made
for the ongoing replacement of asbes-
tos, halons, etc.
Flaring, tonnes/year
94 95 96 97 98 2000 03
Targets
20000
30000
40000
50000
60000
94 95 96 9897
CO2 emissions, kilotonnes/year
1000
1500
2000
2500
97 98 032000
Total waste, tonnes
Targets
11000
13000
15000
17000
19000
8
17
75
Landfilled
Incinerated externally
Recycledexternally
17,400 tonnes wasteand 50,100 tonnes recycled waste
9
40 47
4
Purchased steam
Electricity
Purchasedoil/gas
Ownbyproducts
Energy consumption64,800 Terra Joule
36
HE
ALT
H, S
AF
ET
Y A
ND
E
NV
IR
ON
ME
NT
HSE aggregated data
Consumption of resources 1998 1997
Hydrocarbons, kt 5,422 4,475
Energy
Fuels, TJ 5,919 5,846
Electricity, GWh 2,716 2,115
Steam, TJ 2,306 2,504
Water 1), Mm3 64.2 54.2
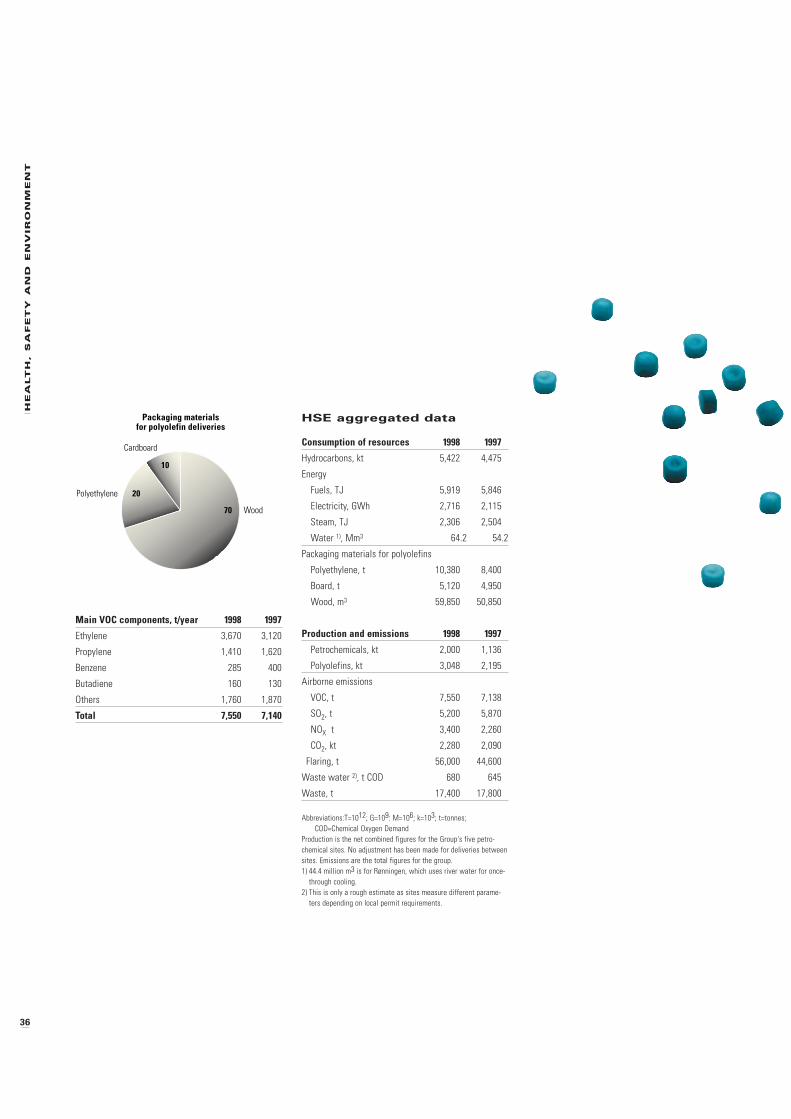
Packaging materials for polyolefins
Polyethylene, t 10,380 8,400
Board, t 5,120 4,950
Wood, m3 59,850 50,850
Production and emissions 1998 1997
Petrochemicals, kt 2,000 1,136
Polyolefins, kt 3,048 2,195
Airborne emissions
VOC, t 7,550 7,138
SO2, t 5,200 5,870
NOX t 3,400 2,260
CO2, kt 2,280 2,090
Flaring, t 56,000 44,600
Waste water 2), t COD 680 645
Waste, t 17,400 17,800
Abbreviations:T=1012; G=109: M=106; k=103; t=tonnes;COD=Chemical Oxygen Demand
Production is the net combined figures for the Group's five petro-chemical sites. No adjustment has been made for deliveries betweensites. Emissions are the total figures for the group.1) 44.4 million m3 is for Rønningen, which uses river water for once-
through cooling.2) This is only a rough estimate as sites measure different parame-
ters depending on local permit requirements.
10
20
70
Polyethylene
Cardboard
Wood
Packaging materialsfor polyolefin deliveries
Main VOC components, t/year 1998 1997
Ethylene 3,670 3,120
Propylene 1,410 1,620
Benzene 285 400
Butadiene 160 130
Others 1,760 1,870
Total 7,550 7,140
A C C O U N T S F O R 1 9 9 8
38
AC
CO
UN
TIN
G P
RIN
CIP
LE
S
Accounting Principles
The financial statements have been prepared
in accordance with the Danish Company
Accounts Act, Danish accounting recommen-
dations, and International Accounting Stan-
dards (IAS). The financial statements have
been prepared according to the same princi-
ples as the previous year.
Consolidation PrinciplesThe Group's consolidated financial statements
include the accounts of the Parent Company
and the companies in which Borealis, either
directly or indirectly, has a majority voting
interest.
The consolidated financial statements
are based on audited financial statements for
each subsidiary. Items of a similar nature have
been combined; intercompany transactions,
unrealised intercompany profits, internal
shareholdings, and intercompany balances
have been eliminated.
Companies which are not subsidiaries
but in which the Group owns 20% or more of
the share capital are considered as associated
companies.
Investments in jointly controlled
operations, joint ventures, are included in the
respective income statement and balance sheet
items under the rules of proportionate consoli-
dation.
Acquired subsidiaries and associated
companies are included in the consolidated
financial statements from the date of acquisi-
tion. A revaluation of the acquired net assets
is made on this date, using the purchase
accounting method and the assets are restated
in accordance with Borealis' accounting prin-
ciples. Any positive difference between book
value and the purchase price of subsidiaries
and associated companies, in the shape of
goodwill, is capitalised and amortised over its
expected lifetime. Any negative goodwill is
recorded under provisions and charged to the
income statement over 5 years. In the case of
minor acquisitions, goodwill or negative
goodwill is amortised fully in the year of
acquisition.
Foreign CurrencyAssets and liabilities denominated in foreign
currencies have been translated into Danish
kroner (DKK) at the exchange rates quoted on
the balance sheet date. Financial statements of
foreign subsidiaries have been translated at
the exchange rates quoted on the balance sheet
date for assets and liabilities. The income
statements of subsidiaries have been converted
on the basis of monthly exchange rates.
All foreign exchange related gains
and losses, both realised and unrealised, are
recorded as financial items in the income
statement. However, the exchange adjustments
arising from the following items are charged
directly to the equity: Conversion of the net
assets of foreign subsidiaries as of January 1
using the closing rate on December 31; trans-
lation of long-term intercompany receivables
which are considered part of investments in
subsidiaries; and conversion of the net income
of foreign subsidiaries calculated on monthly
rates to figures converted on the exchange
rates that applied on the balance sheet date.
Financial InstrumentsOff-balance sheet financial instruments such
as forward exchange contracts and currency
swaps used to hedge potential exchange rate
exposures are valued at market with resulting
gain and losses taken to income when the
gains and losses on the underlying hedged
transactions are recognised. The interest ele-
ment is recorded in the income statement over
the contract period. Gains and losses arising
from the valuation at market of financial
instruments that are not designated as hedges
are taken to income in the period in which
they arise. Interest differentials under swap
arrangements and forward rate agreements
used to manage interest exposure are recog-
nised by adjustment to interest expense.
Income Statement
Definition of income
Income from sales of goods and services is
recognised in the income statement where
delivery has been affected by the balance sheet
date. Net sales represent income that have
been realised, excluding value added tax and
after the deduction of goods returned, dis-
counts and allowances.
Research and development
Research and development costs are treated as
expenses under production costs in the income
statement in the year they are incurred.
Maintenance
Accruals for major maintenance programmes
are set up on a straight-line basis and charged
to production costs in the income statement.
AC
CO
UN
TIN
G P
RIN
CIP
LE
S
39
Accruals are classified as provisions in the bal-
ance sheet.
Results of subsidiaries and associated
companies
Investments in subsidiaries and associated
companies are recorded under the equity
method. A proportionate share of the prof-
it/loss of these companies is included in the
income statement.
Financial items
These include interest income and expenses,
exchange differences, and calculated interest
on finance leases.
Taxation
The income tax provision comprises payable
income tax and changes in deferred tax relat-
ed to the current year's profit, and adjust-
ments to previous years' tax liability.
Balance Sheet
Intangible fixed assets
Externally acquired intangible assets such as
licenses and patents are capitalised and amor-
tised over the lifetime or 20 years, whichever
is shorter. In the case of minor acquisitions,
amortisation is made fully in the year of
acquisition.
Tangible fixed assets
Production plants include land and buildings,
and associated non-moveable machinery and
equipment. Assets held under finance leases
are also included. Assets held under financial
lease are depreciated as comparable assets that
are owned by Borealis.
Tangible fixed assets are valued at
cost minus accumulated depreciation. Cost
comprises purchase price, site preparation and
installation.
Financing costs during construction
are capitalised on significant capital projects.
Depreciation has been made on a
straight-line basis over the expected economic
lifetime of assets. Land is not depreciated.
Buildings are depreciated over 20-50 years;
production facilities over 15-25 years; and
machinery and equipment over 3-15 years.
Minor tangible fixed assets are amortised fully
in the year of acquisition. Gains and losses
from disposals of tangible fixed assets are
recorded as adjustment to depreciation in the
income statement.
Investments in subsidiaries and associated
companies in parent company
Investments in subsidiaries and associated
companies are recorded under the equity
method. This means that the equity and net
result of the parent company and the Group
are identical.
Other financial fixed assets
Other investments are valued at purchase
price less any write-down for permanent
reduction in value.
Inventories
Inventories are recorded at either cost or net
realisable value, whichever is the lowest. Cost
is determined on the FIFO method, and com-
prises direct costs such as materials, utilities,
salaries and wages, and a systematic alloca-
tion of fixed and variable production over-
head costs. Provisions are made for obsolete
and slow-moving items.
Receivables
Receivables are stated at nominal value, less
provisions for anticipated losses on an indi-
vidual basis.
Deferred tax
The provision for deferred income tax is com-
puted individually for each company on the
basis of the current local tax rates in accor-
dance with the liability method.
The measurement of deferred tax
assets is reduced, if necessary, by a valuation
allowance representing the amount of any tax
benefits for which it is not probable that the
tax assets will be utilised.
Reserve for unrealised exchange differences
A reserve has been made under the parent
company's equity for unrealised exchange dif-
ferences related to long-term receivables from
subsidiaries.
Pension liabilities
Employees' pension rights are mainly secured
through pension schemes provided by insu-
rance companies. The provision for pensions,
calculated as the projected benefit obligation,
is determined using actuarial methods and is
recorded at net present value.
Government grants
Government grants include grants for research
and development as well as investment grants,
etc. Research and development grants are
credited to income to offset the related cost.
Investment grants are shown as deferred
income and recognised as income over the
useful life of the asset.
Cash flow statementThe consolidated cash flow statement shows
the Group's cash flow provided by/used in
operating, investing and financing activities.
The cash flow from operating activities is cal-
culated using the direct method.
Cash and cash equivalents consists of
cash in hand and bank deposits.
Comparative figuresCertain 1997 figures have been restated to
conform with the 1998 presentation.
AmountsAll amounts are in DKK million unless other-
wise stated. The amounts in parentheses relate
to the preceding year.
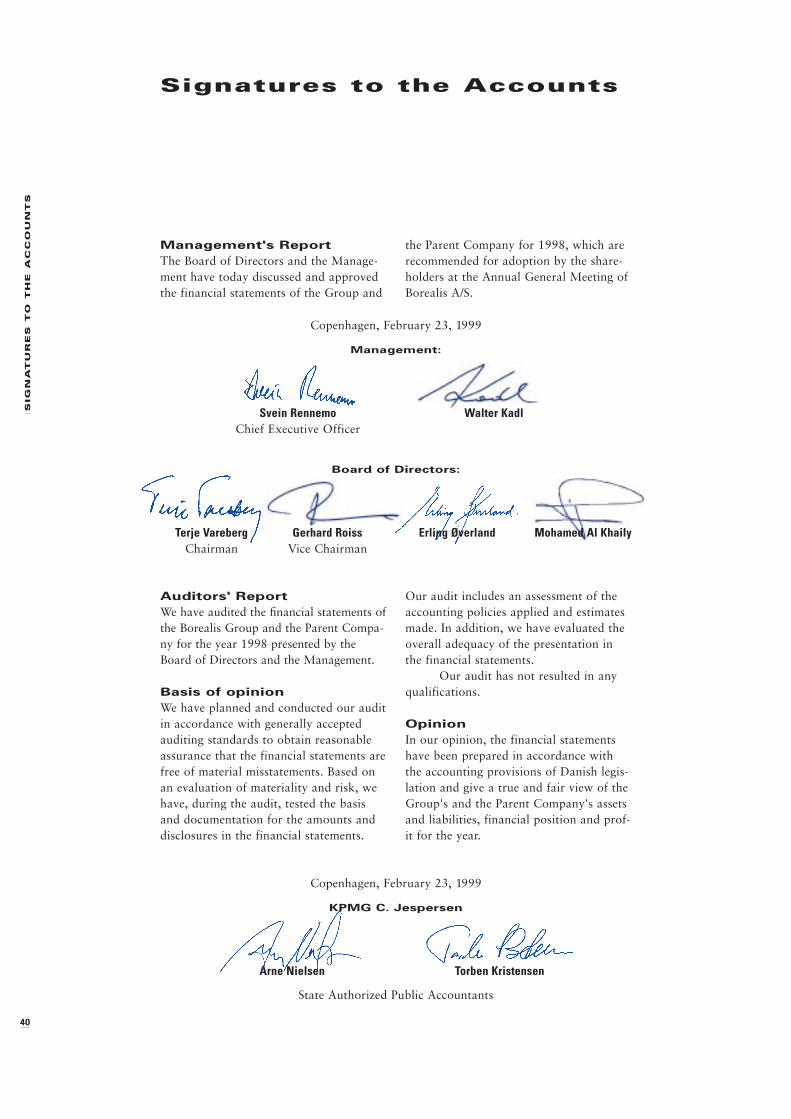
40
SIG
NA
TU
RE
S T
O T
HE
A
CC
OU
NT
S
Signatures to the Accounts
Auditors' ReportWe have audited the financial statements of
the Borealis Group and the Parent Compa-
ny for the year 1998 presented by the
Board of Directors and the Management.
Basis of opinionWe have planned and conducted our audit
in accordance with generally accepted
auditing standards to obtain reasonable
assurance that the financial statements are
free of material misstatements. Based on
an evaluation of materiality and risk, we
have, during the audit, tested the basis
and documentation for the amounts and
disclosures in the financial statements.
Our audit includes an assessment of the
accounting policies applied and estimates
made. In addition, we have evaluated the
overall adequacy of the presentation in
the financial statements.
Our audit has not resulted in any
qualifications.
OpinionIn our opinion, the financial statements
have been prepared in accordance with
the accounting provisions of Danish legis-
lation and give a true and fair view of the
Group's and the Parent Company's assets
and liabilities, financial position and prof-
it for the year.
Management's ReportThe Board of Directors and the Manage-
ment have today discussed and approved
the financial statements of the Group and
the Parent Company for 1998, which are
recommended for adoption by the share-
holders at the Annual General Meeting of
Borealis A/S.
Copenhagen, February 23, 1999
KPMG C. Jespersen
Arne Nielsen Torben Kristensen
State Authorized Public Accountants
Copenhagen, February 23, 1999
Management:
Svein Rennemo Walter KadlChief Executive Officer
Board of Directors:
Terje Vareberg Gerhard Roiss Erling Øverland Mohamed Al KhailyChairman Vice Chairman
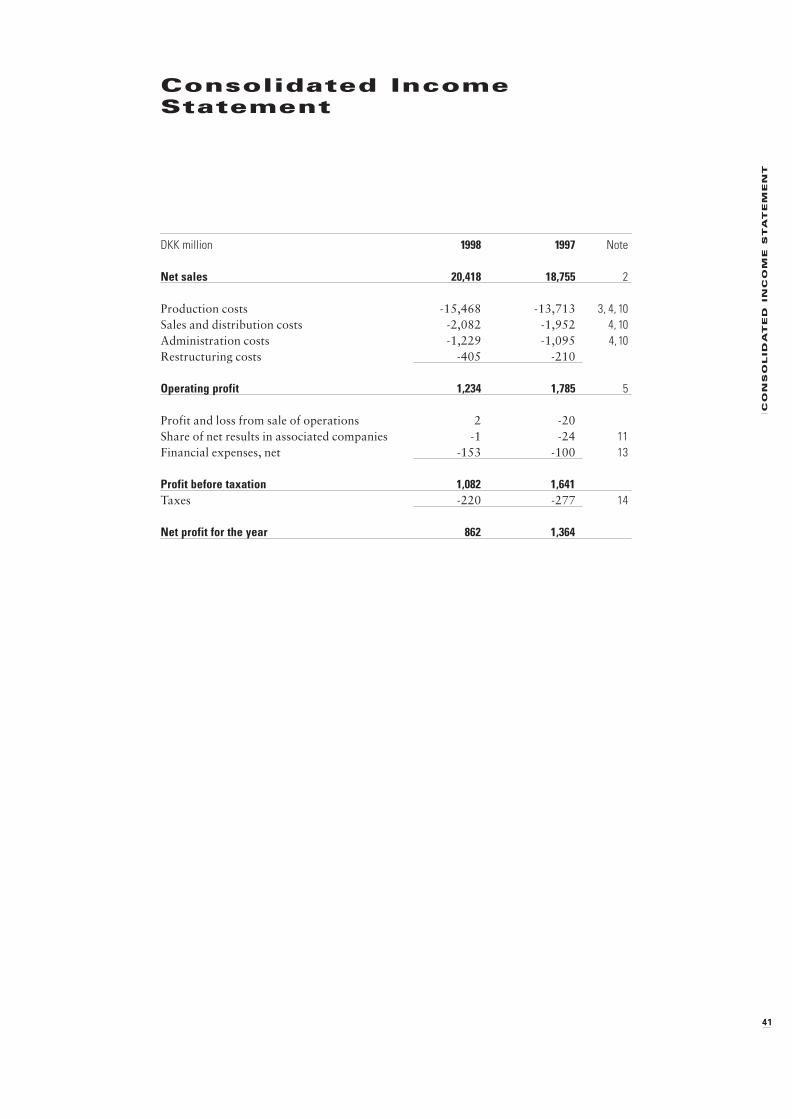
CO
NS
OL
ID
AT
ED
IN
CO
ME
S
TA
TE
ME
NT
41
Consolidated IncomeStatement
DKK million 1998 1997 Note
Net sales 20,418 18,755 2
Production costs -15,468 -13,713 3, 4, 10Sales and distribution costs -2,082 -1,952 4, 10Administration costs -1,229 -1,095 4,10Restructuring costs -405 -210
Operating profit 1,234 1,785 5
Profit and loss from sale of operations 2 -20
Share of net results in associated companies -1 -24 11Financial expenses, net -153 -100 13
Profit before taxation 1,082 1,641Taxes -220 -277 14
Net profit for the year 862 1,364
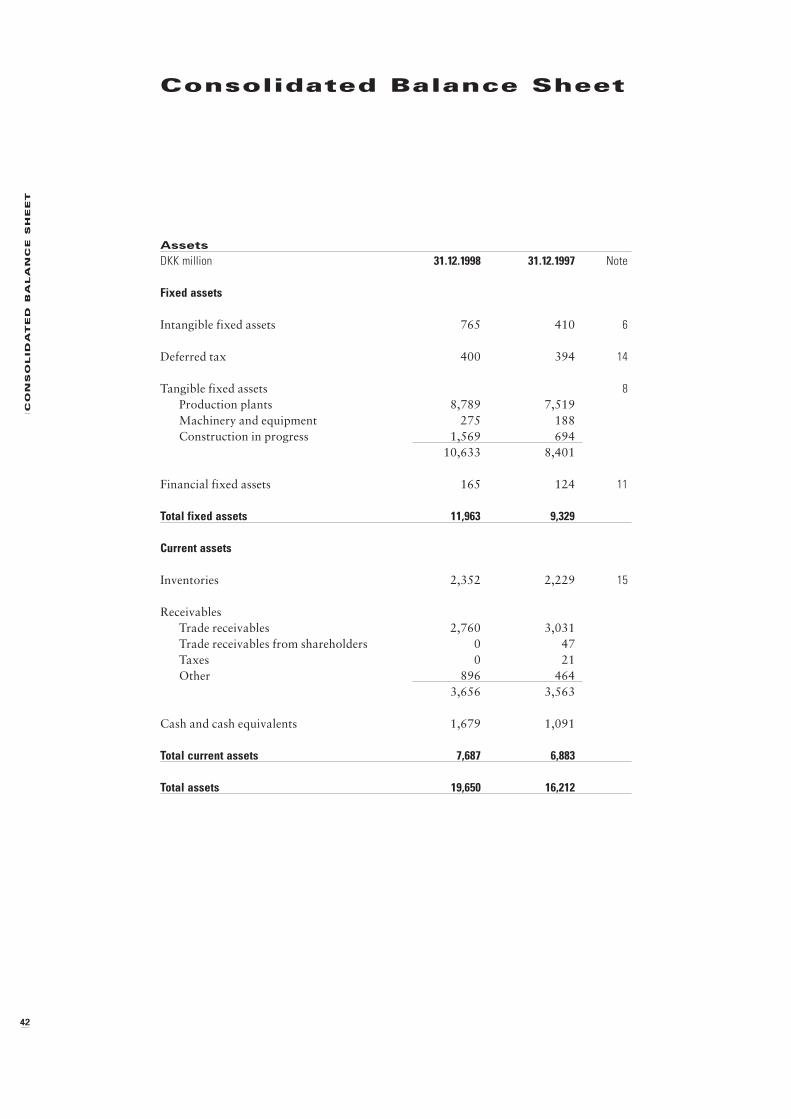
42
CO
NS
OL
ID
AT
ED
B
AL
AN
CE
S
HE
ET
Consolidated Balance Sheet
AssetsDKK million 31.12.1998 31.12.1997 Note
Fixed assets
Intangible fixed assets 765 410 6
Deferred tax 400 394 14
Tangible fixed assets 8Production plants 8,789 7,519
Machinery and equipment 275 188
Construction in progress 1,569 694
10,633 8,401
Financial fixed assets 165 124 11
Total fixed assets 11,963 9,329
Current assets
Inventories 2,352 2,229 15
Receivables
Trade receivables 2,760 3,031
Trade receivables from shareholders 0 47
Taxes 0 21
Other 896 464
3,656 3,563
Cash and cash equivalents 1,679 1,091
Total current assets 7,687 6,883
Total assets 19,650 16,212
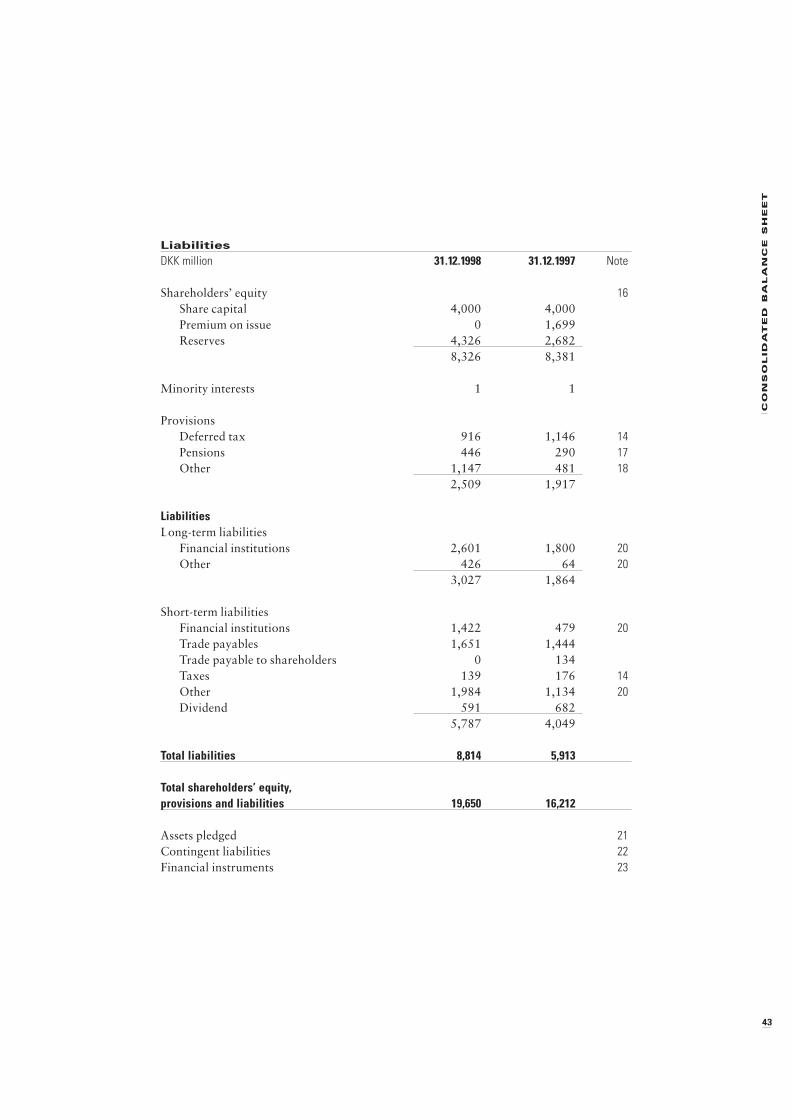
CO
NS
OL
ID
AT
ED
B
AL
AN
CE
S
HE
ET
43
LiabilitiesDKK million 31.12.1998 31.12.1997 Note
Shareholders’ equity 16Share capital 4,000 4,000
Premium on issue 0 1,699
Reserves 4,326 2,682
8,326 8,381
Minority interests 1 1
Provisions
Deferred tax 916 1,146 14Pensions 446 290 17Other 1,147 481 18
2,509 1,917
LiabilitiesLong-term liabilities
Financial institutions 2,601 1,800 20Other 426 64 20
3,027 1,864
Short-term liabilities
Financial institutions 1,422 479 20Trade payables 1,651 1,444
Trade payable to shareholders 0 134
Taxes 139 176 14Other 1,984 1,134 20Dividend 591 682
5,787 4,049
Total liabilities 8,814 5,913
Total shareholders’ equity,provisions and liabilities 19,650 16,212
Assets pledged 21Contingent liabilities 22Financial instruments 23
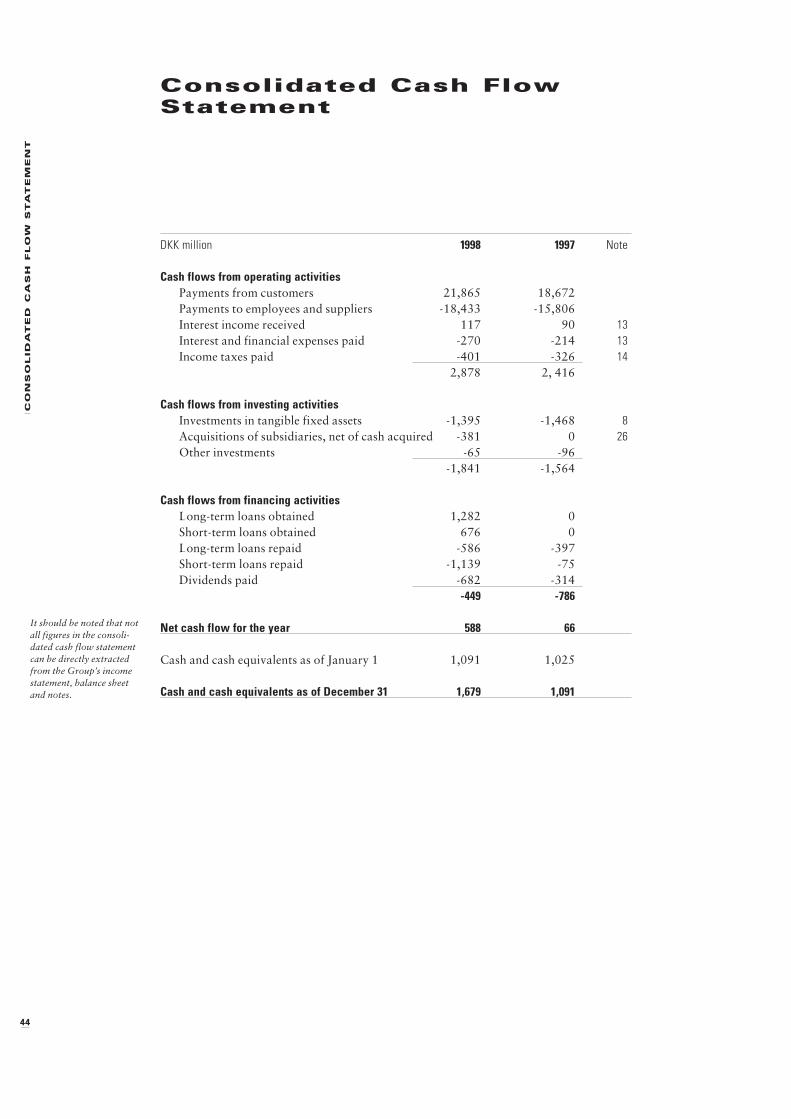
44
CO
NS
OL
ID
AT
ED
C
AS
H F
LO
W S
TA
TE
ME
NT
Consolidated Cash FlowStatement
DKK million 1998 1997 Note
Cash flows from operating activitiesPayments from customers 21,865 18,672
Payments to employees and suppliers -18,433 -15,806
Interest income received 117 90 13Interest and financial expenses paid -270 -214 13Income taxes paid -401 -326 14
2,878 2, 416
Cash flows from investing activitiesInvestments in tangible fixed assets -1,395 -1,468 8Acquisitions of subsidiaries, net of cash acquired -381 0 26Other investments -65 -96
-1,841 -1,564
Cash flows from financing activitiesLong-term loans obtained 1,282 0
Short-term loans obtained 676 0
Long-term loans repaid -586 -397
Short-term loans repaid -1,139 -75
Dividends paid -682 -314
-449 -786
Net cash flow for the year 588 66
Cash and cash equivalents as of January 1 1,091 1,025
Cash and cash equivalents as of December 31 1,679 1,091
It should be noted that notall figures in the consoli-dated cash flow statementcan be directly extractedfrom the Group’s incomestatement, balance sheetand notes.
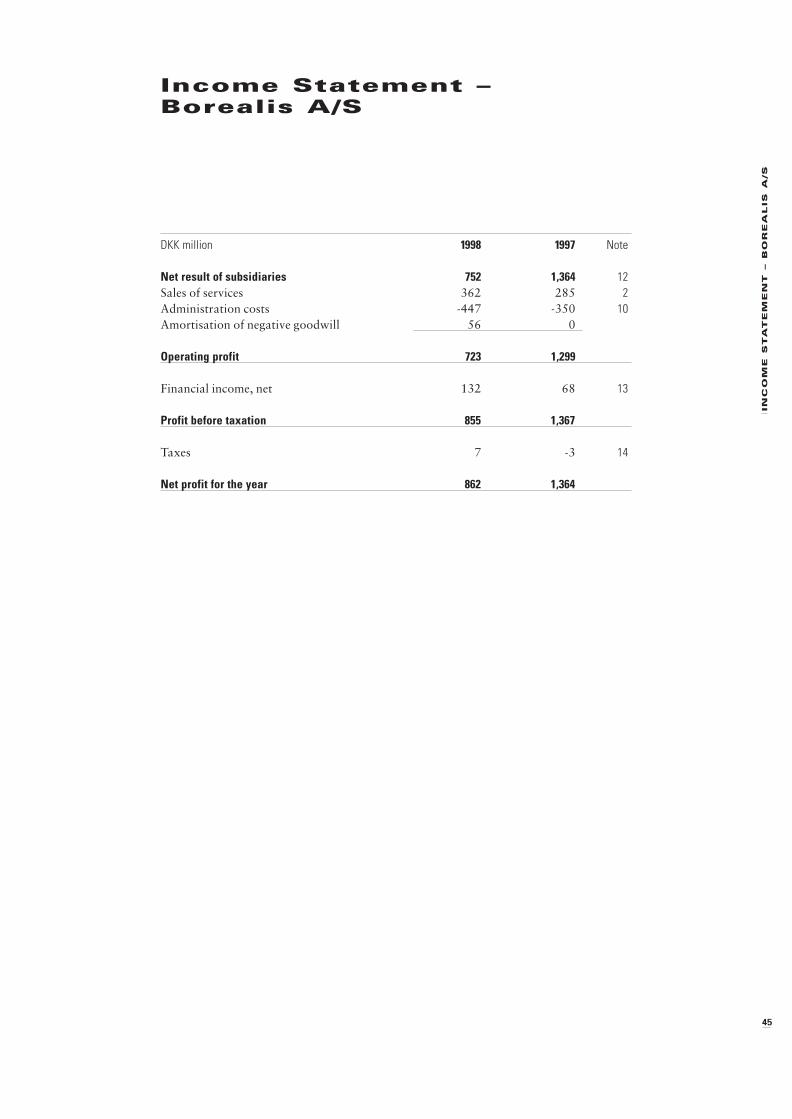
IN
CO
ME
S
TA
TE
ME
NT
– B
OR
EA
LIS
A
/S
45
Income Statement –Borealis A/S
DKK million 1998 1997 Note
Net result of subsidiaries 752 1,364 12Sales of services 362 285 2Administration costs -447 -350 10Amortisation of negative goodwill 56 0
Operating profit 723 1,299
Financial income, net 132 68 13
Profit before taxation 855 1,367
Taxes 7 -3 14
Net profit for the year 862 1,364
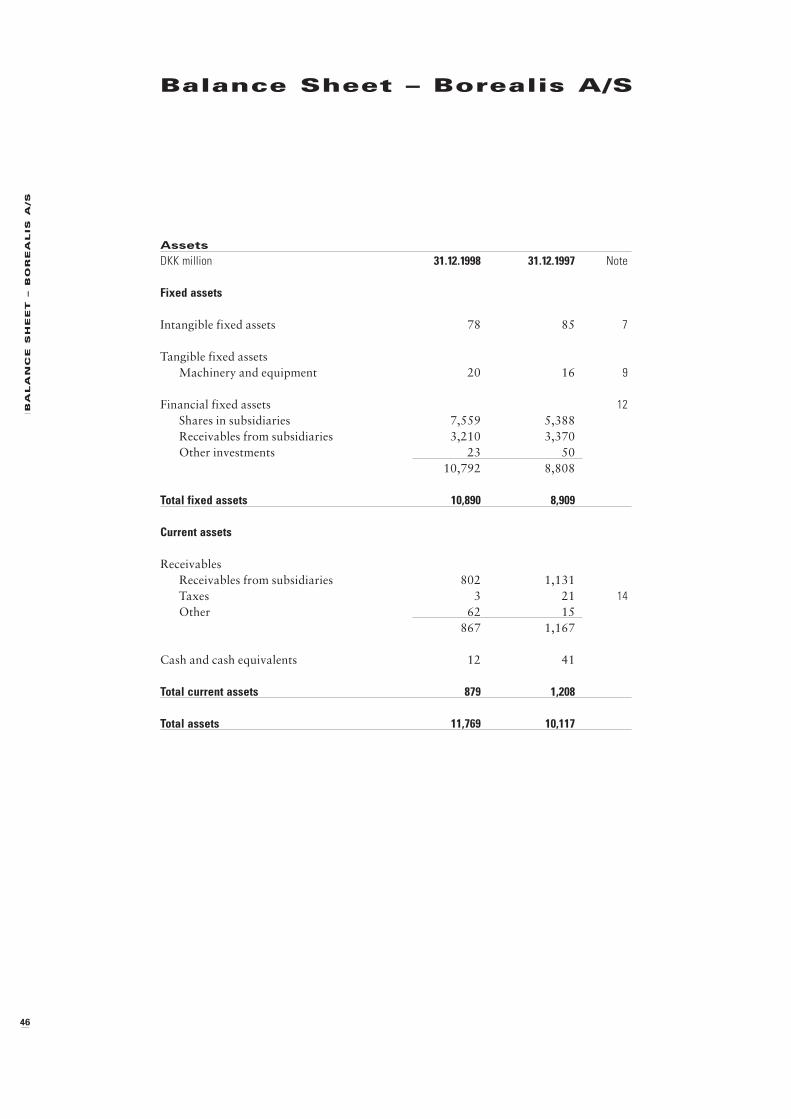
46
BA
LA
NC
E S
HE
ET
– B
OR
EA
LIS
A
/S
Balance Sheet – Borealis A/S
AssetsDKK million 31.12.1998 31.12.1997 Note
Fixed assets
Intangible fixed assets 78 85 7
Tangible fixed assets
Machinery and equipment 20 16 9
Financial fixed assets 12Shares in subsidiaries 7,559 5,388
Receivables from subsidiaries 3,210 3,370
Other investments 23 50
10,792 8,808
Total fixed assets 10,890 8,909
Current assets
Receivables
Receivables from subsidiaries 802 1,131
Taxes 3 21 14Other 62 15
867 1,167
Cash and cash equivalents 12 41
Total current assets 879 1,208
Total assets 11,769 10,117
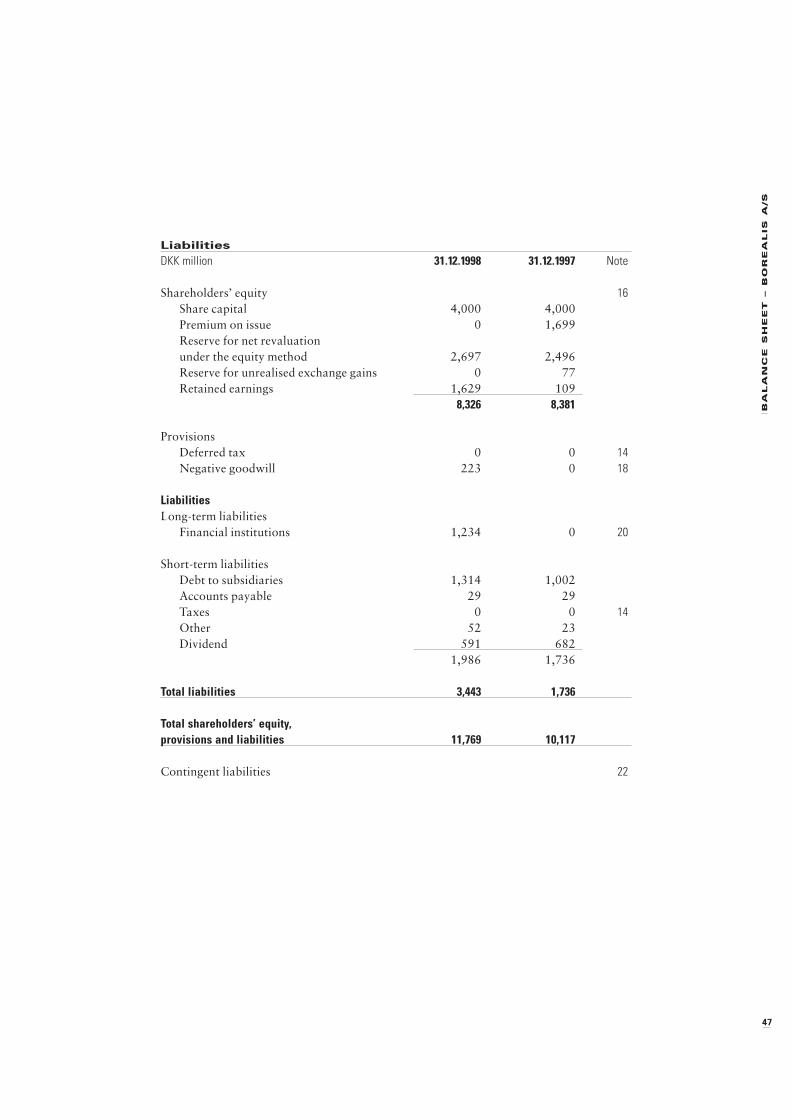
BA
LA
NC
E S
HE
ET
– B
OR
EA
LIS
A
/S
47
LiabilitiesDKK million 31.12.1998 31.12.1997 Note
Shareholders’ equity 16Share capital 4,000 4,000
Premium on issue 0 1,699
Reserve for net revaluation
under the equity method 2,697 2,496
Reserve for unrealised exchange gains 0 77
Retained earnings 1,629 109
8,326 8,381
Provisions
Deferred tax 0 0 14Negative goodwill 223 0 18
LiabilitiesLong-term liabilities
Financial institutions 1,234 0 20
Short-term liabilities
Debt to subsidiaries 1,314 1,002
Accounts payable 29 29
Taxes 0 0 14Other 52 23
Dividend 591 682
1,986 1,736
Total liabilities 3,443 1,736
Total shareholders’ equity,provisions and liabilities 11,769 10,117
Contingent liabilities 22
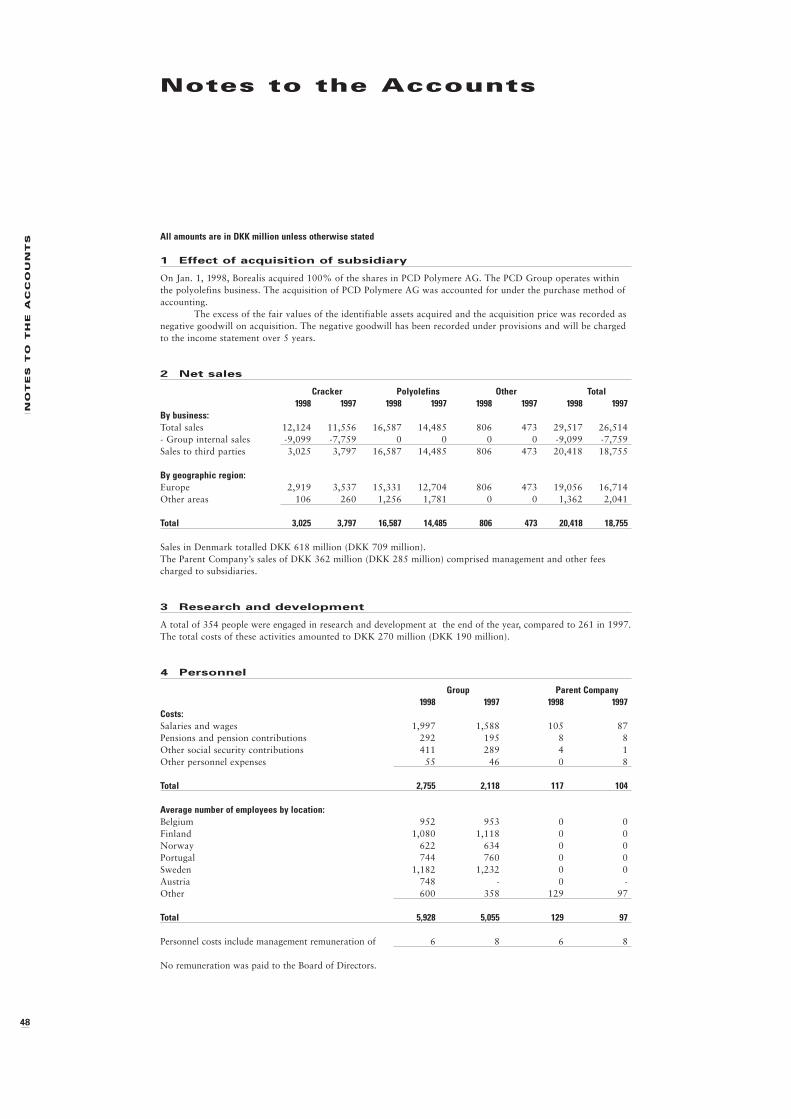
48
NO
TE
S T
O T
HE
A
CC
OU
NT
S
Notes to the Accounts
All amounts are in DKK million unless otherwise stated
1 Effect of acquisition of subsidiary
On Jan. 1, 1998, Borealis acquired 100% of the shares in PCD Polymere AG. The PCD Group operates within
the polyolefins business. The acquisition of PCD Polymere AG was accounted for under the purchase method of
accounting.
The excess of the fair values of the identifiable assets acquired and the acquisition price was recorded as
negative goodwill on acquisition. The negative goodwill has been recorded under provisions and will be charged
to the income statement over 5 years.
2 Net sales
Cracker Polyolefins Other Total1998 1997 1998 1997 1998 1997 1998 1997
By business:Total sales 12,124 11,556 16,587 14,485 806 473 29,517 26,514
- Group internal sales -9,099 -7,759 0 0 0 0 -9,099 -7,759
Sales to third parties 3,025 3,797 16,587 14,485 806 473 20,418 18,755
By geographic region:Europe 2,919 3,537 15,331 12,704 806 473 19,056 16,714
Other areas 106 260 1,256 1,781 0 0 1,362 2,041
Total 3,025 3,797 16,587 14,485 806 473 20,418 18,755
Sales in Denmark totalled DKK 618 million (DKK 709 million).
The Parent Company’s sales of DKK 362 million (DKK 285 million) comprised management and other fees
charged to subsidiaries.
3 Research and development
A total of 354 people were engaged in research and development at the end of the year, compared to 261 in 1997.
The total costs of these activities amounted to DKK 270 million (DKK 190 million).
4 Personnel
Group Parent Company1998 1997 1998 1997
Costs:Salaries and wages 1,997 1,588 105 87
Pensions and pension contributions 292 195 8 8
Other social security contributions 411 289 4 1
Other personnel expenses 55 46 0 8
Total 2,755 2,118 117 104
Average number of employees by location:Belgium 952 953 0 0
Finland 1,080 1,118 0 0
Norway 622 634 0 0
Portugal 744 760 0 0
Sweden 1,182 1,232 0 0
Austria 748 - 0 -
Other 600 358 129 97
Total 5,928 5,055 129 97
Personnel costs include management remuneration of 6 8 6 8
No remuneration was paid to the Board of Directors.
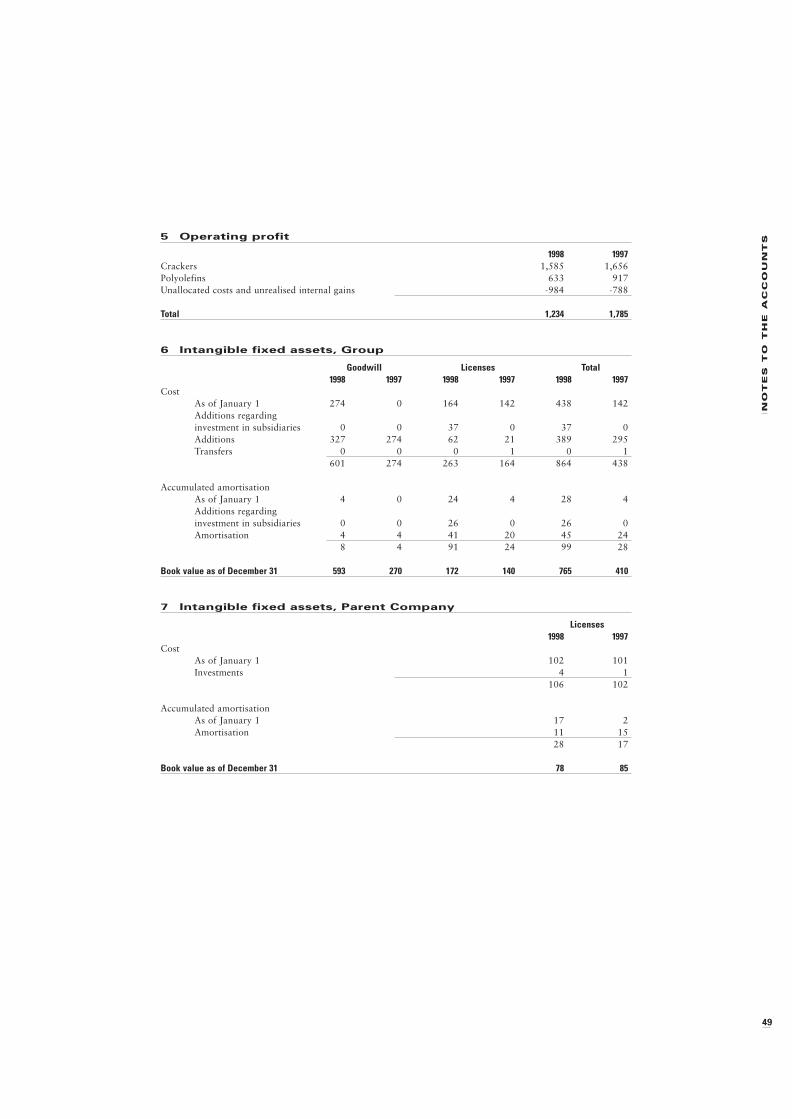
NO
TE
S T
O T
HE
A
CC
OU
NT
S
49
5 Operating profit
1998 1997Crackers 1,585 1,656
Polyolefins 633 917
Unallocated costs and unrealised internal gains -984 -788
Total 1,234 1,785
6 Intangible fixed assets, Group
Goodwill Licenses Total1998 1997 1998 1997 1998 1997
Cost
As of January 1 274 0 164 142 438 142
Additions regarding
investment in subsidiaries 0 0 37 0 37 0
Additions 327 274 62 21 389 295
Transfers 0 0 0 1 0 1
601 274 263 164 864 438
Accumulated amortisation
As of January 1 4 0 24 4 28 4
Additions regarding
investment in subsidiaries 0 0 26 0 26 0
Amortisation 4 4 41 20 45 24
8 4 91 24 99 28
Book value as of December 31 593 270 172 140 765 410
7 Intangible fixed assets, Parent Company
Licenses1998 1997
Cost
As of January 1 102 101
Investments 4 1
106 102
Accumulated amortisation
As of January 1 17 2
Amortisation 11 15
28 17
Book value as of December 31 78 85
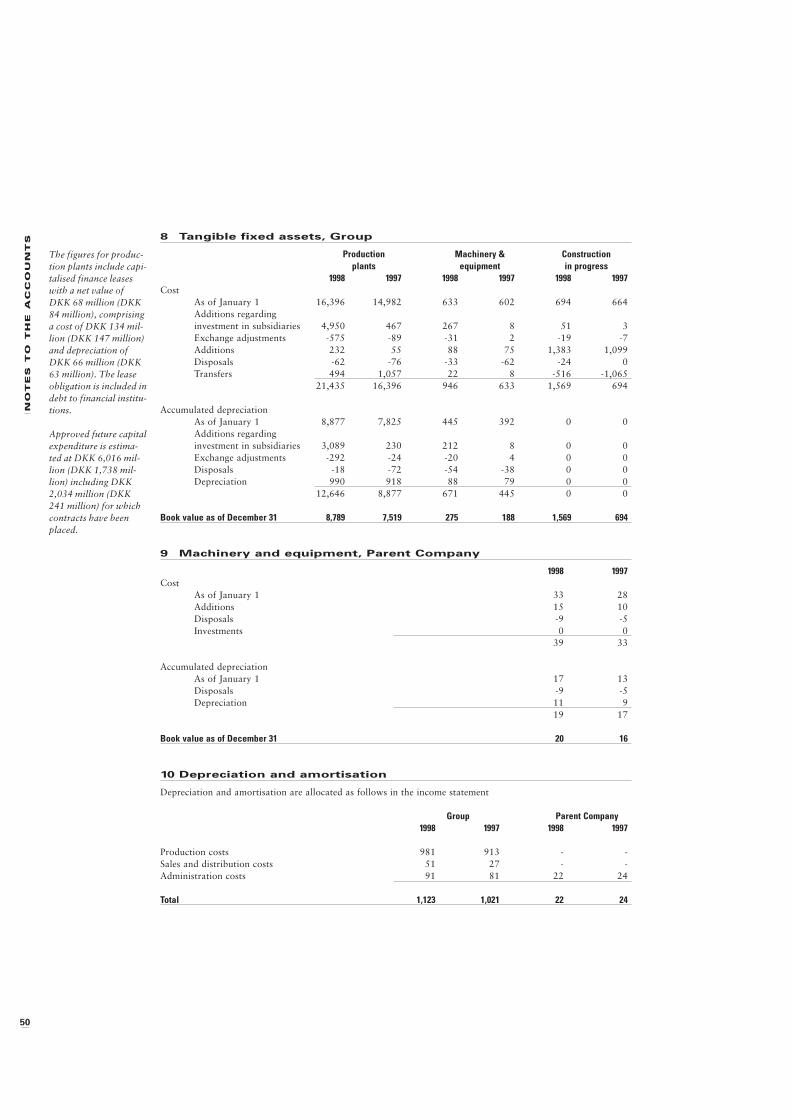
50
NO
TE
S T
O T
HE
A
CC
OU
NT
S 8 Tangible fixed assets, Group
Production Machinery & Constructionplants equipment in progress
1998 1997 1998 1997 1998 1997Cost
As of January 1 16,396 14,982 633 602 694 664
Additions regarding
investment in subsidiaries 4,950 467 267 8 51 3
Exchange adjustments -575 -89 -31 2 -19 -7
Additions 232 55 88 75 1,383 1,099
Disposals -62 -76 -33 -62 -24 0
Transfers 494 1,057 22 8 -516 -1,065
21,435 16,396 946 633 1,569 694
Accumulated depreciation
As of January 1 8,877 7,825 445 392 0 0
Additions regarding
investment in subsidiaries 3,089 230 212 8 0 0
Exchange adjustments -292 -24 -20 4 0 0
Disposals -18 -72 -54 -38 0 0
Depreciation 990 918 88 79 0 0
12,646 8,877 671 445 0 0
Book value as of December 31 8,789 7,519 275 188 1,569 694
9 Machinery and equipment, Parent Company
1998 1997Cost
As of January 1 33 28
Additions 15 10
Disposals -9 -5
Investments 0 0
39 33
Accumulated depreciation
As of January 1 17 13
Disposals -9 -5
Depreciation 11 9
19 17
Book value as of December 31 20 16
10 Depreciation and amortisation
Depreciation and amortisation are allocated as follows in the income statement
Group Parent Company1998 1997 1998 1997
Production costs 981 913 - -
Sales and distribution costs 51 27 - -
Administration costs 91 81 22 24
Total 1,123 1,021 22 24
The figures for produc-tion plants include capi-talised finance leaseswith a net value ofDKK 68 million (DKK84 million), comprisinga cost of DKK 134 mil-lion (DKK 147 million)and depreciation ofDKK 66 million (DKK63 million). The leaseobligation is included indebt to financial institu-tions.
Approved future capitalexpenditure is estima-ted at DKK 6,016 mil-lion (DKK 1,738 mil-lion) including DKK2,034 million (DKK241 million) for whichcontracts have beenplaced.
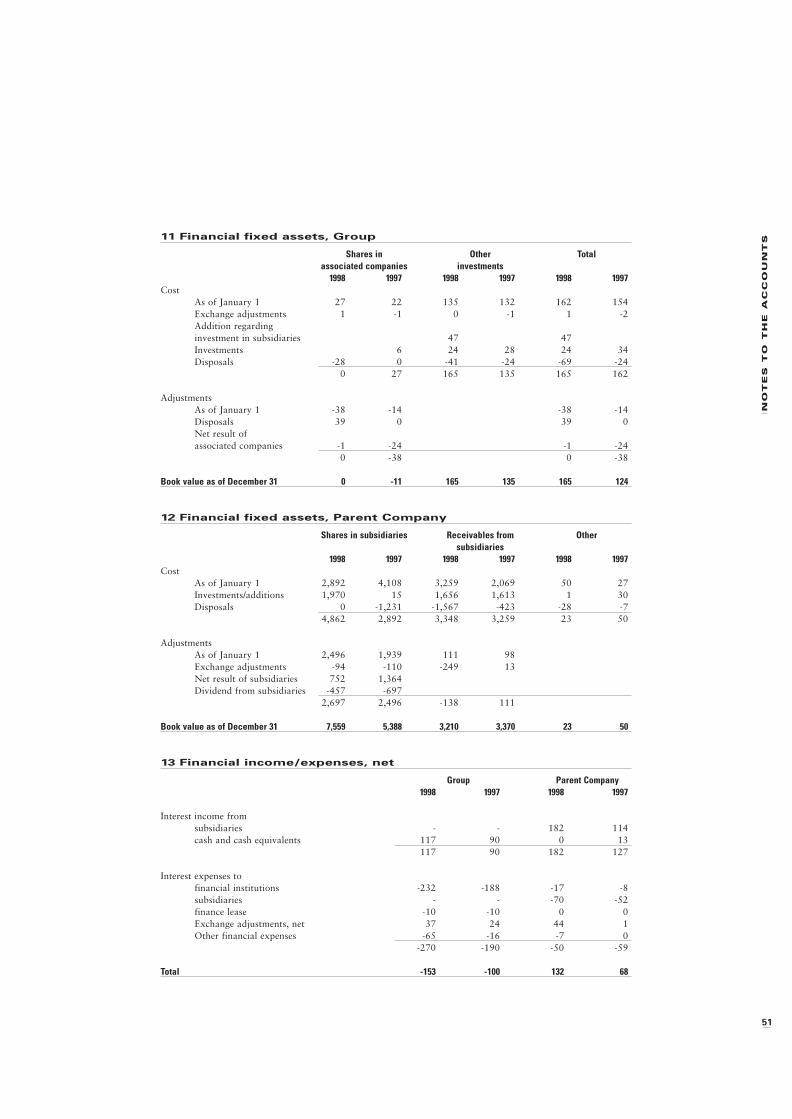
NO
TE
S T
O T
HE
A
CC
OU
NT
S
51
11 Financial fixed assets, Group
Shares in Other Totalassociated companies investments
1998 1997 1998 1997 1998 1997Cost
As of January 1 27 22 135 132 162 154
Exchange adjustments 1 -1 0 -1 1 -2
Addition regarding
investment in subsidiaries 47 47
Investments 6 24 28 24 34
Disposals -28 0 -41 -24 -69 -24
0 27 165 135 165 162
Adjustments
As of January 1 -38 -14 -38 -14
Disposals 39 0 39 0
Net result of
associated companies -1 -24 -1 -24
0 -38 0 -38
Book value as of December 31 0 -11 165 135 165 124
12 Financial fixed assets, Parent Company
Shares in subsidiaries Receivables from Othersubsidiaries
1998 1997 1998 1997 1998 1997Cost
As of January 1 2,892 4,108 3,259 2,069 50 27
Investments/additions 1,970 15 1,656 1,613 1 30
Disposals 0 -1,231 -1,567 -423 -28 -7
4,862 2,892 3,348 3,259 23 50
Adjustments
As of January 1 2,496 1,939 111 98
Exchange adjustments -94 -110 -249 13
Net result of subsidiaries 752 1,364
Dividend from subsidiaries -457 -697
2,697 2,496 -138 111
Book value as of December 31 7,559 5,388 3,210 3,370 23 50
13 Financial income/expenses, net
Group Parent Company1998 1997 1998 1997
Interest income from
subsidiaries - - 182 114
cash and cash equivalents 117 90 0 13
117 90 182 127
Interest expenses to
financial institutions -232 -188 -17 -8
subsidiaries - - -70 -52
finance lease -10 -10 0 0
Exchange adjustments, net 37 24 44 1
Other financial expenses -65 -16 -7 0
-270 -190 -50 -59
Total -153 -100 132 68
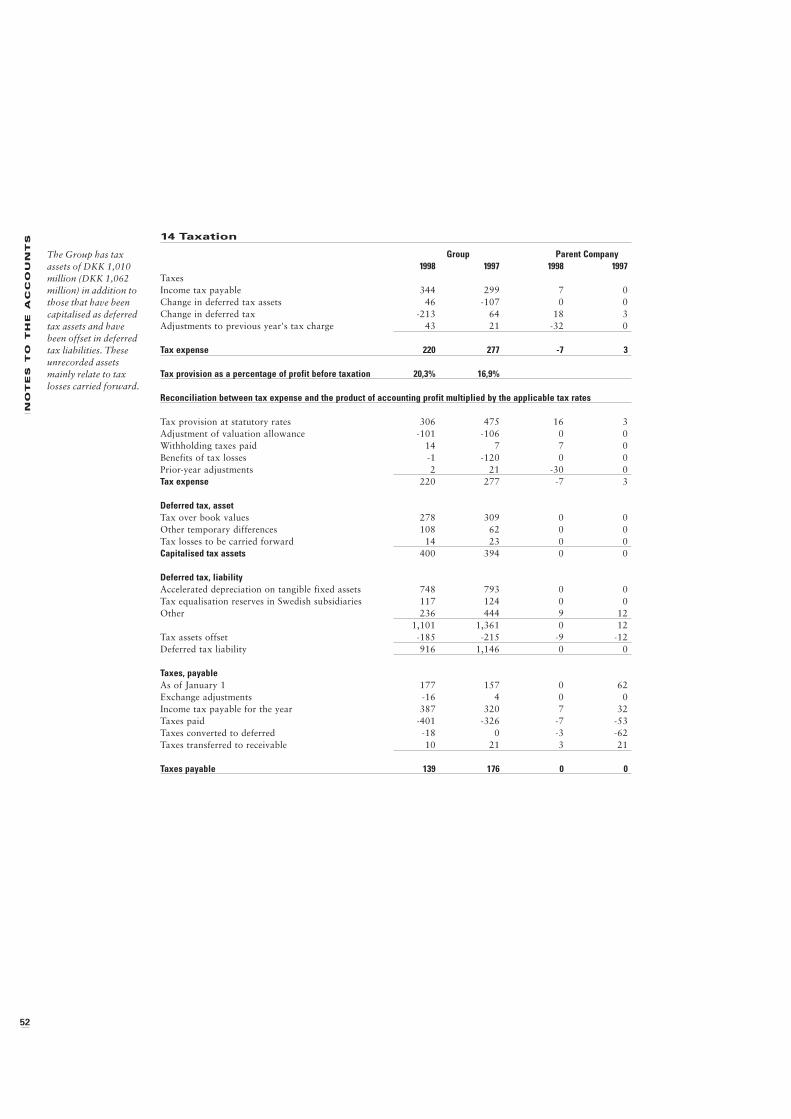
52
NO
TE
S T
O T
HE
A
CC
OU
NT
S 14 Taxation
Group Parent Company1998 1997 1998 1997
Taxes
Income tax payable 344 299 7 0
Change in deferred tax assets 46 -107 0 0
Change in deferred tax -213 64 18 3
Adjustments to previous year's tax charge 43 21 -32 0
Tax expense 220 277 -7 3
Tax provision as a percentage of profit before taxation 20,3% 16,9%
Reconciliation between tax expense and the product of accounting profit multiplied by the applicable tax rates
Tax provision at statutory rates 306 475 16 3
Adjustment of valuation allowance -101 -106 0 0
Withholding taxes paid 14 7 7 0
Benefits of tax losses -1 -120 0 0
Prior-year adjustments 2 21 -30 0
Tax expense 220 277 -7 3
Deferred tax, assetTax over book values 278 309 0 0
Other temporary differences 108 62 0 0
Tax losses to be carried forward 14 23 0 0
Capitalised tax assets 400 394 0 0
Deferred tax, liabilityAccelerated depreciation on tangible fixed assets 748 793 0 0
Tax equalisation reserves in Swedish subsidiaries 117 124 0 0
Other 236 444 9 12
1,101 1,361 0 12
Tax assets offset -185 -215 -9 -12
Deferred tax liability 916 1,146 0 0
Taxes, payableAs of January 1 177 157 0 62
Exchange adjustments -16 4 0 0
Income tax payable for the year 387 320 7 32
Taxes paid -401 -326 -7 -53
Taxes converted to deferred -18 0 -3 -62
Taxes transferred to receivable 10 21 3 21
Taxes payable 139 176 0 0
The Group has taxassets of DKK 1,010million (DKK 1,062million) in addition tothose that have beencapitalised as deferredtax assets and havebeen offset in deferredtax liabilities. Theseunrecorded assetsmainly relate to taxlosses carried forward.
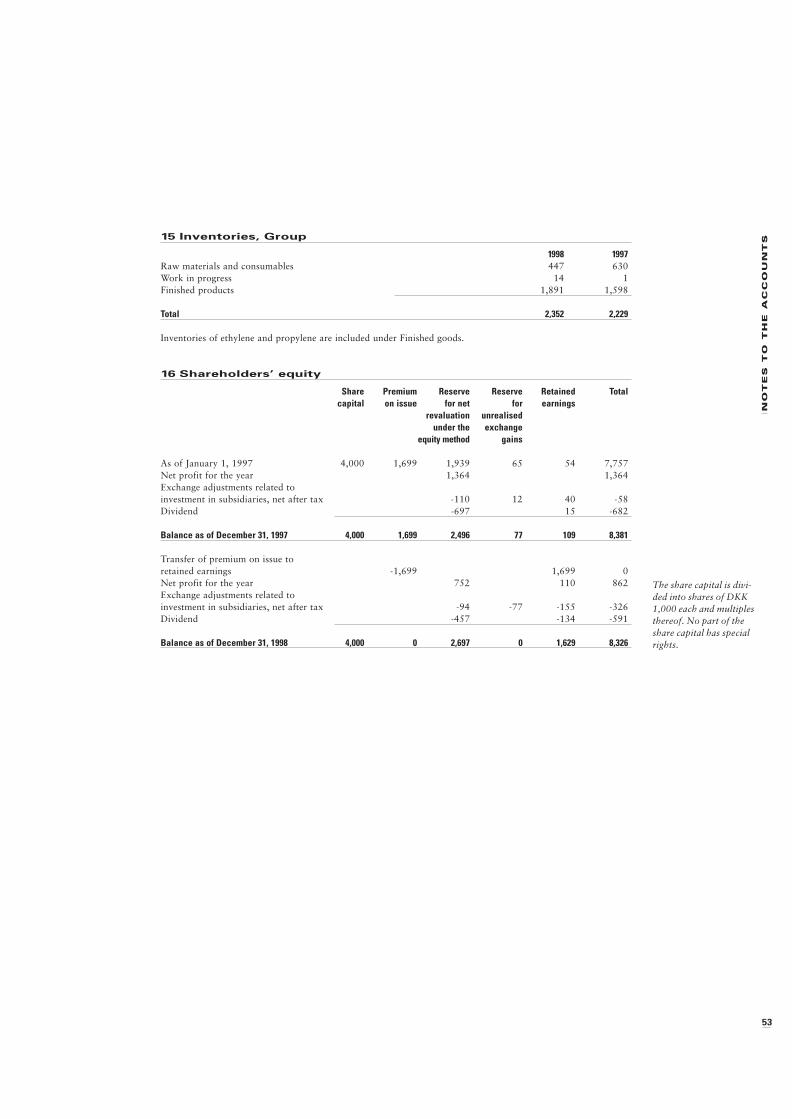
NO
TE
S T
O T
HE
A
CC
OU
NT
S
53
15 Inventories, Group
1998 1997Raw materials and consumables 447 630
Work in progress 14 1
Finished products 1,891 1,598
Total 2,352 2,229
Inventories of ethylene and propylene are included under Finished goods.
16 Shareholders’ equity
Share Premium Reserve Reserve Retained Totalcapital on issue for net for earnings
revaluation unrealisedunder the exchange
equity method gains
As of January 1, 1997 4,000 1,699 1,939 65 54 7,757
Net profit for the year 1,364 1,364
Exchange adjustments related to
investment in subsidiaries, net after tax -110 12 40 -58
Dividend -697 15 -682
Balance as of December 31, 1997 4,000 1,699 2,496 77 109 8,381
Transfer of premium on issue to
retained earnings -1,699 1,699 0
Net profit for the year 752 110 862
Exchange adjustments related to
investment in subsidiaries, net after tax -94 -77 -155 -326
Dividend -457 -134 -591
Balance as of December 31, 1998 4,000 0 2,697 0 1,629 8,326
The share capital is divi-ded into shares of DKK1,000 each and multiplesthereof. No part of theshare capital has specialrights.
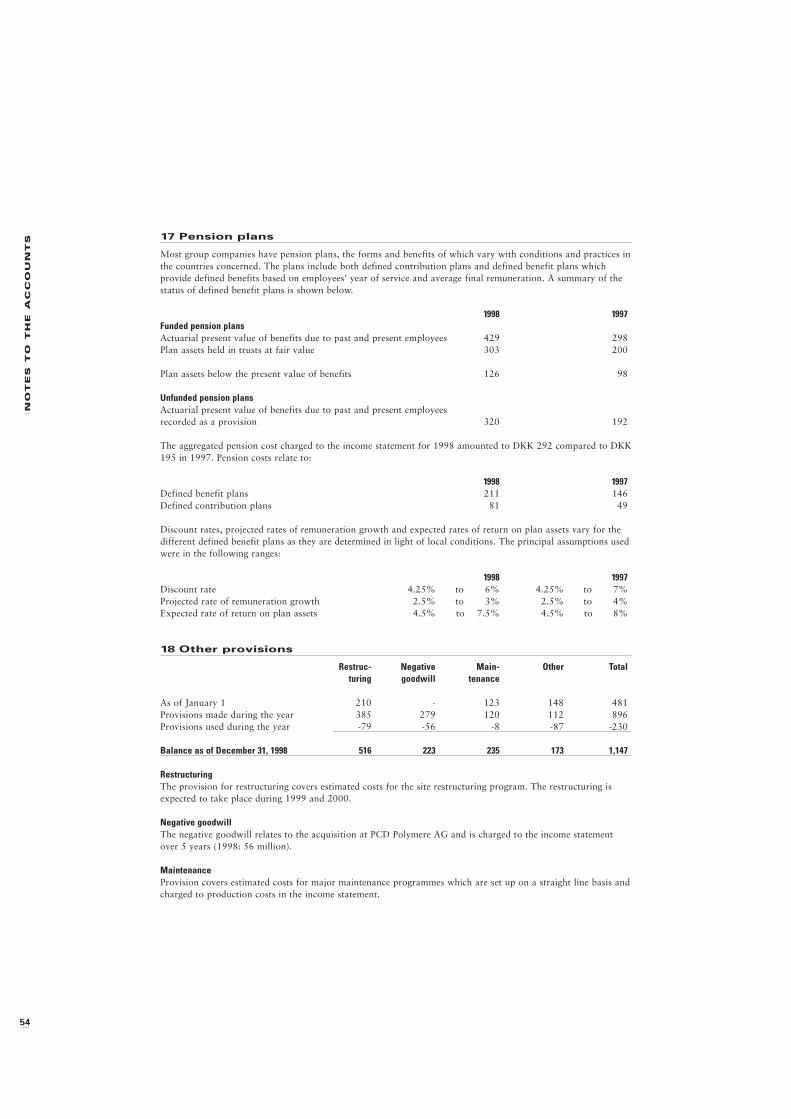
54
NO
TE
S T
O T
HE
A
CC
OU
NT
S 17 Pension plans
Most group companies have pension plans, the forms and benefits of which vary with conditions and practices in
the countries concerned. The plans include both defined contribution plans and defined benefit plans which
provide defined benefits based on employees' year of service and average final remuneration. A summary of the
status of defined benefit plans is shown below.
1998 1997Funded pension plansActuarial present value of benefits due to past and present employees 429 298
Plan assets held in trusts at fair value 303 200
Plan assets below the present value of benefits 126 98
Unfunded pension plansActuarial present value of benefits due to past and present employees
recorded as a provision 320 192
The aggregated pension cost charged to the income statement for 1998 amounted to DKK 292 compared to DKK
195 in 1997. Pension costs relate to:
1998 1997Defined benefit plans 211 146
Defined contribution plans 81 49
Discount rates, projected rates of remuneration growth and expected rates of return on plan assets vary for the
different defined benefit plans as they are determined in light of local conditions. The principal assumptions used
were in the following ranges:
1998 1997Discount rate 4.25% to 6% 4.25% to 7%
Projected rate of remuneration growth 2.5% to 3% 2.5% to 4%
Expected rate of return on plan assets 4.5% to 7.5% 4.5% to 8%
18 Other provisions
Restruc- Negative Main- Other Totalturing goodwill tenance
As of January 1 210 - 123 148 481
Provisions made during the year 385 279 120 112 896
Provisions used during the year -79 -56 -8 -87 -230
Balance as of December 31, 1998 516 223 235 173 1,147
RestructuringThe provision for restructuring covers estimated costs for the site restructuring program. The restructuring is
expected to take place during 1999 and 2000.
Negative goodwillThe negative goodwill relates to the acquisition at PCD Polymere AG and is charged to the income statement
over 5 years (1998: 56 million).
MaintenanceProvision covers estimated costs for major maintenance programmes which are set up on a straight line basis and
charged to production costs in the income statement.
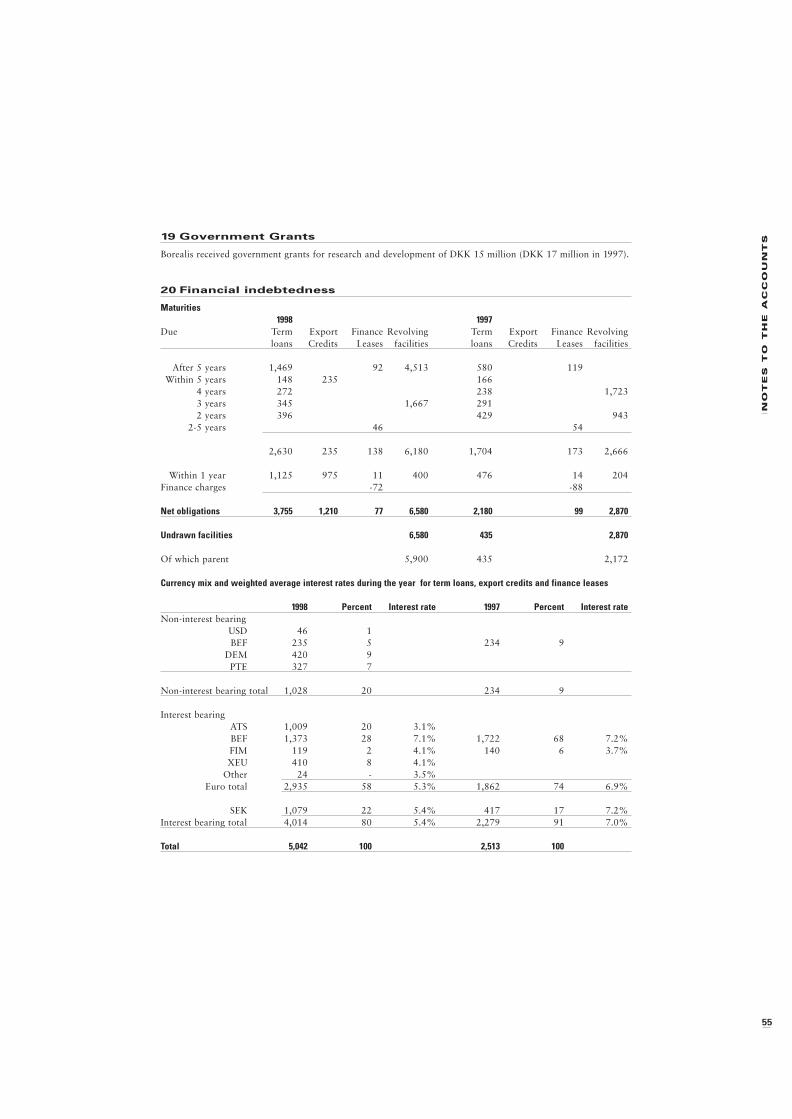
NO
TE
S T
O T
HE
A
CC
OU
NT
S
55
19 Government Grants
Borealis received government grants for research and development of DKK 15 million (DKK 17 million in 1997).
20 Financial indebtedness
Maturities1998 1997
Due Term Export Finance Revolving Term Export Finance Revolving
loans Credits Leases facilities loans Credits Leases facilities
After 5 years 1,469 92 4,513 580 119
Within 5 years 148 235 166
4 years 272 238 1,723
3 years 345 1,667 291
2 years 396 429 943
2-5 years 46 54
2,630 235 138 6,180 1,704 173 2,666
Within 1 year 1,125 975 11 400 476 14 204
Finance charges -72 -88
Net obligations 3,755 1,210 77 6,580 2,180 99 2,870
Undrawn facilities 6,580 435 2,870
Of which parent 5,900 435 2,172
Currency mix and weighted average interest rates during the year for term loans, export credits and finance leases
1998 Percent Interest rate 1997 Percent Interest rateNon-interest bearing
USD 46 1
BEF 235 5 234 9
DEM 420 9
PTE 327 7
Non-interest bearing total 1,028 20 234 9
Interest bearing
ATS 1,009 20 3.1%
BEF 1,373 28 7.1% 1,722 68 7.2%
FIM 119 2 4.1% 140 6 3.7%
XEU 410 8 4.1%
Other 24 - 3.5%
Euro total 2,935 58 5.3% 1,862 74 6.9%
SEK 1,079 22 5.4% 417 17 7.2%
Interest bearing total 4,014 80 5.4% 2,279 91 7.0%
Total 5,042 100 2,513 100
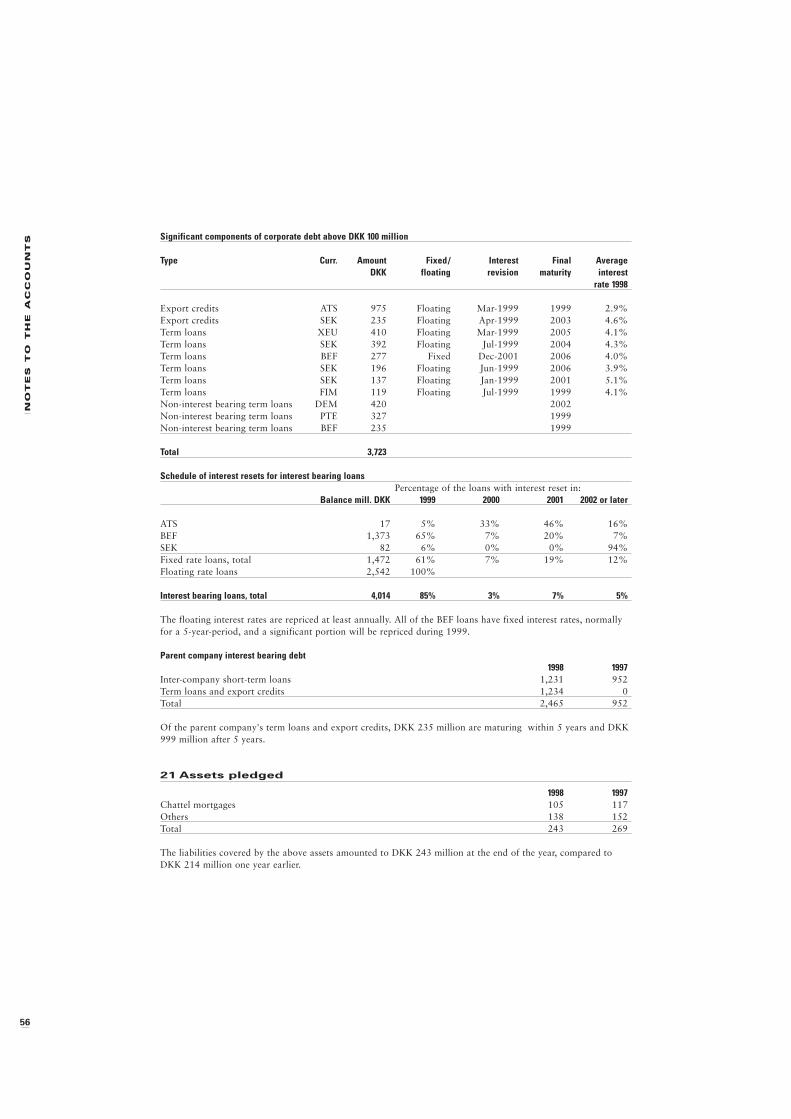
56
NO
TE
S T
O T
HE
A
CC
OU
NT
S Significant components of corporate debt above DKK 100 million
Type Curr. Amount Fixed/ Interest Final AverageDKK floating revision maturity interest
rate 1998
Export credits ATS 975 Floating Mar-1999 1999 2.9%
Export credits SEK 235 Floating Apr-1999 2003 4.6%
Term loans XEU 410 Floating Mar-1999 2005 4.1%
Term loans SEK 392 Floating Jul-1999 2004 4.3%
Term loans BEF 277 Fixed Dec-2001 2006 4.0%
Term loans SEK 196 Floating Jun-1999 2006 3.9%
Term loans SEK 137 Floating Jan-1999 2001 5.1%
Term loans FIM 119 Floating Jul-1999 1999 4.1%
Non-interest bearing term loans DEM 420 2002
Non-interest bearing term loans PTE 327 1999
Non-interest bearing term loans BEF 235 1999
Total 3,723
Schedule of interest resets for interest bearing loansPercentage of the loans with interest reset in:
Balance mill. DKK 1999 2000 2001 2002 or later
ATS 17 5% 33% 46% 16%
BEF 1,373 65% 7% 20% 7%
SEK 82 6% 0% 0% 94%
Fixed rate loans, total 1,472 61% 7% 19% 12%
Floating rate loans 2,542 100%
Interest bearing loans, total 4,014 85% 3% 7% 5%
The floating interest rates are repriced at least annually. All of the BEF loans have fixed interest rates, normally
for a 5-year-period, and a significant portion will be repriced during 1999.
Parent company interest bearing debt1998 1997
Inter-company short-term loans 1,231 952
Term loans and export credits 1,234 0
Total 2,465 952
Of the parent company's term loans and export credits, DKK 235 million are maturing within 5 years and DKK
999 million after 5 years.
21 Assets pledged
1998 1997Chattel mortgages 105 117
Others 138 152
Total 243 269
The liabilities covered by the above assets amounted to DKK 243 million at the end of the year, compared to
DKK 214 million one year earlier.
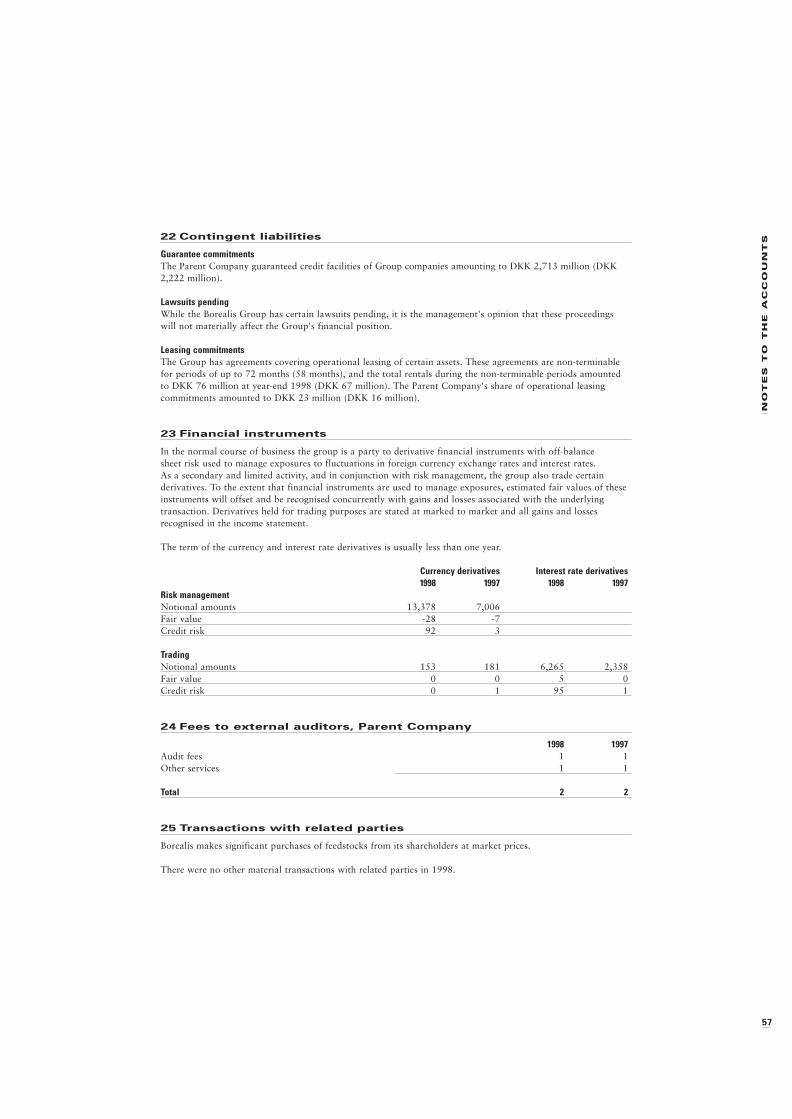
NO
TE
S T
O T
HE
A
CC
OU
NT
S
57
22 Contingent liabilities
Guarantee commitmentsThe Parent Company guaranteed credit facilities of Group companies amounting to DKK 2,713 million (DKK
2,222 million).
Lawsuits pendingWhile the Borealis Group has certain lawsuits pending, it is the management's opinion that these proceedings
will not materially affect the Group's financial position.
Leasing commitmentsThe Group has agreements covering operational leasing of certain assets. These agreements are non-terminable
for periods of up to 72 months (58 months), and the total rentals during the non-terminable periods amounted
to DKK 76 million at year-end 1998 (DKK 67 million). The Parent Company's share of operational leasing
commitments amounted to DKK 23 million (DKK 16 million).
23 Financial instruments
In the normal course of business the group is a party to derivative financial instruments with off-balance
sheet risk used to manage exposures to fluctuations in foreign currency exchange rates and interest rates.
As a secondary and limited activity, and in conjunction with risk management, the group also trade certain
derivatives. To the extent that financial instruments are used to manage exposures, estimated fair values of these
instruments will offset and be recognised concurrently with gains and losses associated with the underlying
transaction. Derivatives held for trading purposes are stated at marked to market and all gains and losses
recognised in the income statement.
The term of the currency and interest rate derivatives is usually less than one year.
Currency derivatives Interest rate derivatives1998 1997 1998 1997
Risk managementNotional amounts 13,378 7,006
Fair value -28 -7
Credit risk 92 3
TradingNotional amounts 153 181 6,265 2,358
Fair value 0 0 5 0
Credit risk 0 1 95 1
24 Fees to external auditors, Parent Company
1998 1997Audit fees 1 1
Other services 1 1
Total 2 2
25 Transactions with related parties
Borealis makes significant purchases of feedstocks from its shareholders at market prices.
There were no other material transactions with related parties in 1998.
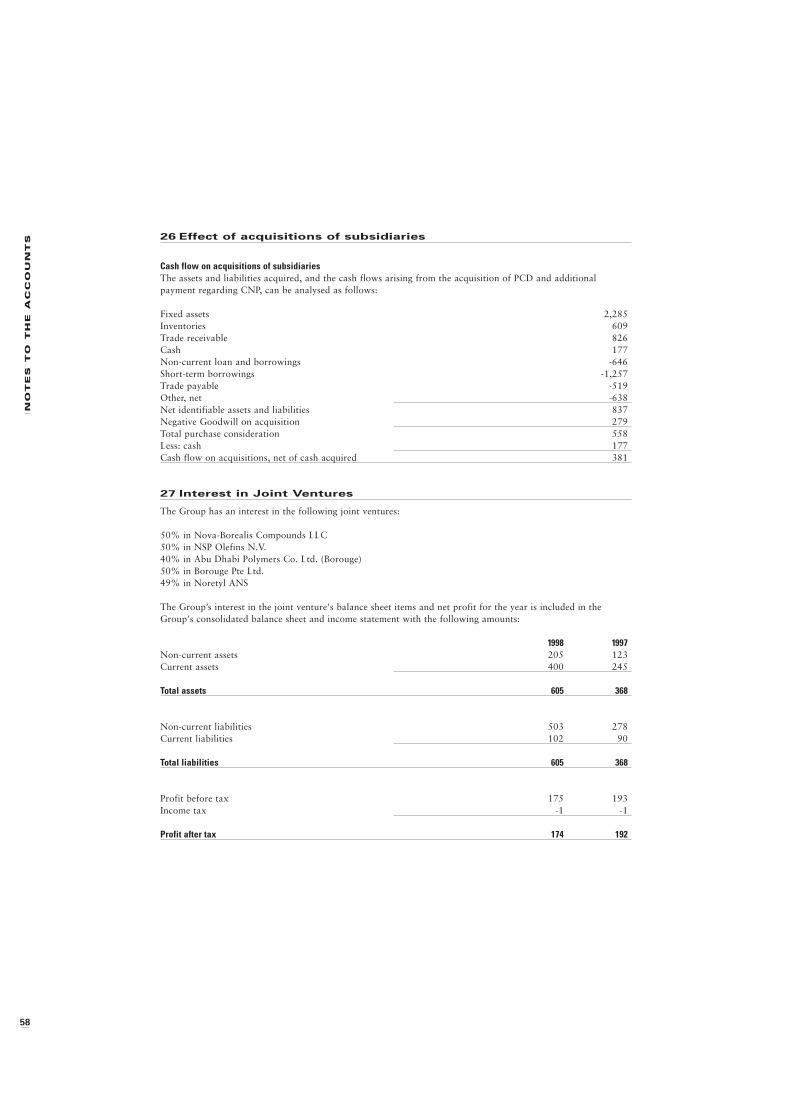
58
NO
TE
S T
O T
HE
A
CC
OU
NT
S 26 Effect of acquisitions of subsidiaries
Cash flow on acquisitions of subsidiariesThe assets and liabilities acquired, and the cash flows arising from the acquisition of PCD and additional
payment regarding CNP, can be analysed as follows:
Fixed assets 2,285
Inventories 609
Trade receivable 826
Cash 177
Non-current loan and borrowings -646
Short-term borrowings -1,257
Trade payable -519
Other, net -638
Net identifiable assets and liabilities 837
Negative Goodwill on acquisition 279
Total purchase consideration 558
Less: cash 177
Cash flow on acquisitions, net of cash acquired 381
27 Interest in Joint Ventures
The Group has an interest in the following joint ventures:
50% in Nova-Borealis Compounds LLC
50% in NSP Olefins N.V.
40% in Abu Dhabi Polymers Co. Ltd. (Borouge)
50% in Borouge Pte Ltd.
49% in Noretyl ANS
The Group’s interest in the joint venture's balance sheet items and net profit for the year is included in the
Group's consolidated balance sheet and income statement with the following amounts:
1998 1997Non-current assets 205 123
Current assets 400 245
Total assets 605 368
Non-current liabilities 503 278
Current liabilities 102 90
Total liabilities 605 368
Profit before tax 175 193
Income tax -1 -1
Profit after tax 174 192
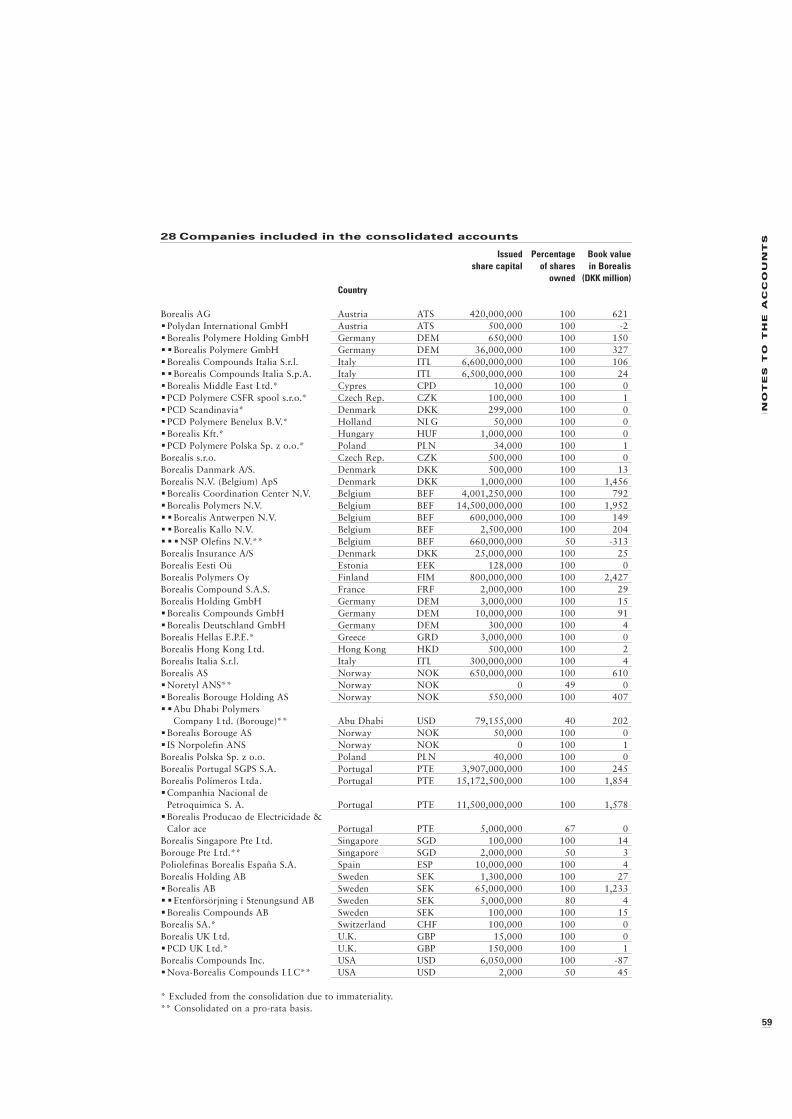
NO
TE
S T
O T
HE
A
CC
OU
NT
S
59
28 Companies included in the consolidated accounts
Issued Percentage Book valueshare capital of shares in Borealis
owned (DKK million)Country
Borealis AG Austria ATS 420,000,000 100 621
Polydan International GmbH Austria ATS 500,000 100 -2
Borealis Polymere Holding GmbH Germany DEM 650,000 100 150
Borealis Polymere GmbH Germany DEM 36,000,000 100 327
Borealis Compounds Italia S.r.l. Italy ITL 6,600,000,000 100 106
Borealis Compounds Italia S.p.A. Italy ITL 6,500,000,000 100 24
Borealis Middle East Ltd.* Cypres CPD 10,000 100 0
PCD Polymere CSFR spool s.r.o.* Czech Rep. CZK 100,000 100 1
PCD Scandinavia* Denmark DKK 299,000 100 0
PCD Polymere Benelux B.V.* Holland NLG 50,000 100 0
Borealis Kft.* Hungary HUF 1,000,000 100 0
PCD Polymere Polska Sp. z o.o.* Poland PLN 34,000 100 1
Borealis s.r.o. Czech Rep. CZK 500,000 100 0
Borealis Danmark A/S. Denmark DKK 500,000 100 13
Borealis N.V. (Belgium) ApS Denmark DKK 1,000,000 100 1,456
Borealis Coordination Center N.V. Belgium BEF 4,001,250,000 100 792
Borealis Polymers N.V. Belgium BEF 14,500,000,000 100 1,952
Borealis Antwerpen N.V. Belgium BEF 600,000,000 100 149
Borealis Kallo N.V. Belgium BEF 2,500,000 100 204
NSP Olefins N.V.** Belgium BEF 660,000,000 50 -313
Borealis Insurance A/S Denmark DKK 25,000,000 100 25
Borealis Eesti Oü Estonia EEK 128,000 100 0
Borealis Polymers Oy Finland FIM 800,000,000 100 2,427
Borealis Compound S.A.S. France FRF 2,000,000 100 29
Borealis Holding GmbH Germany DEM 3,000,000 100 15
Borealis Compounds GmbH Germany DEM 10,000,000 100 91
Borealis Deutschland GmbH Germany DEM 300,000 100 4
Borealis Hellas E.P.E.* Greece GRD 3,000,000 100 0
Borealis Hong Kong Ltd. Hong Kong HKD 500,000 100 2
Borealis Italia S.r.l. Italy ITL 300,000,000 100 4
Borealis AS Norway NOK 650,000,000 100 610
Noretyl ANS** Norway NOK 0 49 0
Borealis Borouge Holding AS Norway NOK 550,000 100 407
Abu Dhabi Polymers
Company Ltd. (Borouge)** Abu Dhabi USD 79,155,000 40 202
Borealis Borouge AS Norway NOK 50,000 100 0
IS Norpolefin ANS Norway NOK 0 100 1
Borealis Polska Sp. z o.o. Poland PLN 40,000 100 0
Borealis Portugal SGPS S.A. Portugal PTE 3,907,000,000 100 245
Borealis Polímeros Ltda. Portugal PTE 15,172,500,000 100 1,854
Companhia Nacional de
Petroquimica S. A. Portugal PTE 11,500,000,000 100 1,578
Borealis Producao de Electricidade &
Calor ace Portugal PTE 5,000,000 67 0
Borealis Singapore Pte Ltd. Singapore SGD 100,000 100 14
Borouge Pte Ltd.** Singapore SGD 2,000,000 50 3
Poliolefinas Borealis España S.A. Spain ESP 10,000,000 100 4
Borealis Holding AB Sweden SEK 1,300,000 100 27
Borealis AB Sweden SEK 65,000,000 100 1,233
Etenförsörjning i Stenungsund AB Sweden SEK 5,000,000 80 4
Borealis Compounds AB Sweden SEK 100,000 100 15
Borealis SA.* Switzerland CHF 100,000 100 0
Borealis UK Ltd. U.K. GBP 15,000 100 0
PCD UK Ltd.* U.K. GBP 150,000 100 1
Borealis Compounds Inc. USA USD 6,050,000 100 -87
Nova-Borealis Compounds LLC** USA USD 2,000 50 45
* Excluded from the consolidation due to immateriality.
** Consolidated on a pro-rata basis.
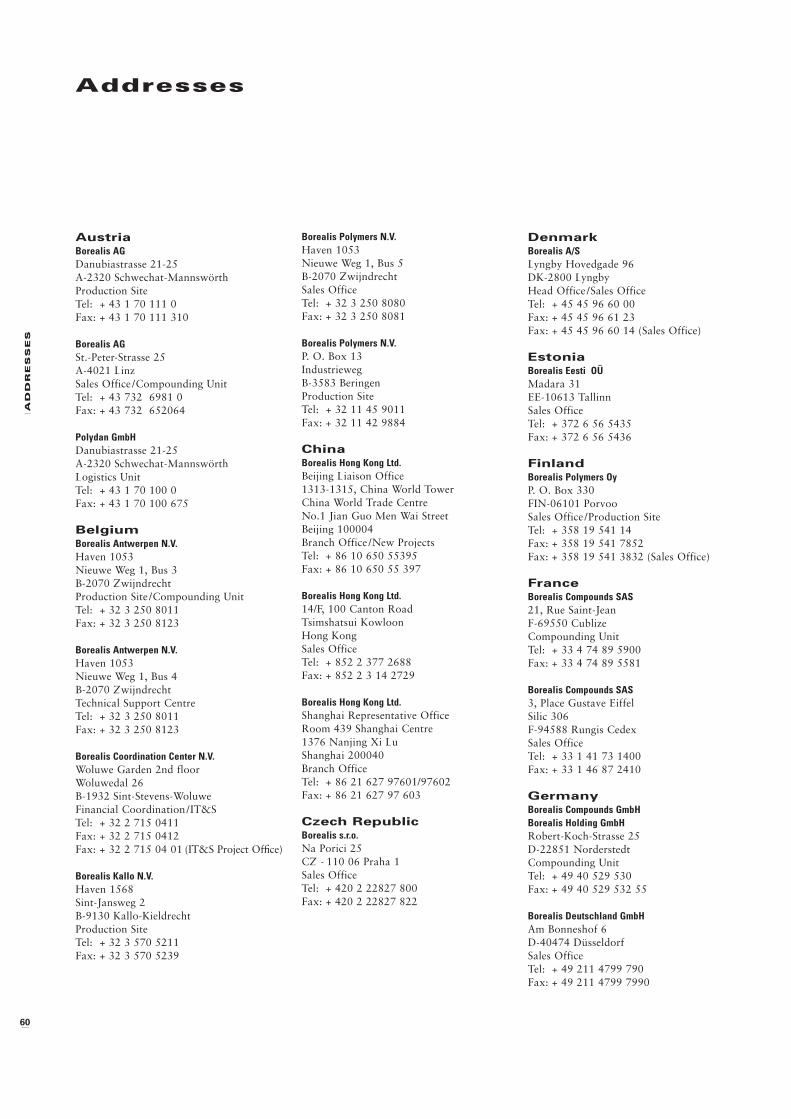
60
AD
DR
ES
SE
S
Addresses
AustriaBorealis AGDanubiastrasse 21-25
A-2320 Schwechat-Mannswörth
Production Site
Tel: + 43 1 70 111 0
Fax: + 43 1 70 111 310
Borealis AGSt.-Peter-Strasse 25
A-4021 Linz
Sales Office /Compounding Unit
Tel: + 43 732 6981 0
Fax: + 43 732 652064
Polydan GmbHDanubiastrasse 21-25
A-2320 Schwechat-Mannswörth
Logistics Unit
Tel: + 43 1 70 100 0
Fax: + 43 1 70 100 675
BelgiumBorealis Antwerpen N.V.Haven 1053
Nieuwe Weg 1, Bus 3
B-2070 Zwijndrecht
Production Site /Compounding Unit
Tel: + 32 3 250 8011
Fax: + 32 3 250 8123
Borealis Antwerpen N.V.Haven 1053
Nieuwe Weg 1, Bus 4
B-2070 Zwijndrecht
Technical Support Centre
Tel: + 32 3 250 8011
Fax: + 32 3 250 8123
Borealis Coordination Center N.V.Woluwe Garden 2nd floor
Woluwedal 26
B-1932 Sint-Stevens-Woluwe
Financial Coordination /IT&S
Tel: + 32 2 715 0411
Fax: + 32 2 715 0412
Fax: + 32 2 715 04 01 (IT&S Project Office)
Borealis Kallo N.V.Haven 1568
Sint-Jansweg 2
B-9130 Kallo-Kieldrecht
Production Site
Tel: + 32 3 570 5211
Fax: + 32 3 570 5239
Borealis Polymers N.V.Haven 1053
Nieuwe Weg 1, Bus 5
B-2070 Zwijndrecht
Sales Office
Tel: + 32 3 250 8080
Fax: + 32 3 250 8081
Borealis Polymers N.V.P. O. Box 13
Industrieweg
B-3583 Beringen
Production Site
Tel: + 32 11 45 9011
Fax: + 32 11 42 9884
ChinaBorealis Hong Kong Ltd. Beijing Liaison Office
1313-1315, China World Tower
China World Trade Centre
No.1 Jian Guo Men Wai Street
Beijing 100004
Branch Office /New Projects
Tel: + 86 10 650 55395
Fax: + 86 10 650 55 397
Borealis Hong Kong Ltd.14/F, 100 Canton Road
Tsimshatsui Kowloon
Hong Kong
Sales Office
Tel: + 852 2 377 2688
Fax: + 852 2 3 14 2729
Borealis Hong Kong Ltd. Shanghai Representative Office
Room 439 Shanghai Centre
1376 Nanjing Xi Lu
Shanghai 200040
Branch Office
Tel: + 86 21 627 97601/97602
Fax: + 86 21 627 97 603
Czech RepublicBorealis s.r.o.Na Porici 25
CZ - 110 06 Praha 1
Sales Office
Tel: + 420 2 22827 800
Fax: + 420 2 22827 822
DenmarkBorealis A/SLyngby Hovedgade 96
DK-2800 Lyngby
Head Office /Sales Office
Tel: + 45 45 96 60 00
Fax: + 45 45 96 61 23
Fax: + 45 45 96 60 14 (Sales Office)
EstoniaBorealis Eesti OÜMadara 31
EE-10613 Tallinn
Sales Office
Tel: + 372 6 56 5435
Fax: + 372 6 56 5436
FinlandBorealis Polymers OyP. O. Box 330
FIN-06101 Porvoo
Sales Office /Production Site
Tel: + 358 19 541 14
Fax: + 358 19 541 7852
Fax: + 358 19 541 3832 (Sales Office)
FranceBorealis Compounds SAS21, Rue Saint-Jean
F-69550 Cublize
Compounding Unit
Tel: + 33 4 74 89 5900
Fax: + 33 4 74 89 5581
Borealis Compounds SAS3, Place Gustave Eiffel
Silic 306
F-94588 Rungis Cedex
Sales Office
Tel: + 33 1 41 73 1400
Fax: + 33 1 46 87 2410
GermanyBorealis Compounds GmbHBorealis Holding GmbHRobert-Koch-Strasse 25
D-22851 Norderstedt
Compounding Unit
Tel: + 49 40 529 530
Fax: + 49 40 529 532 55
Borealis Deutschland GmbHAm Bonneshof 6
D-40474 Düsseldorf
Sales Office
Tel: + 49 211 4799 790
Fax: + 49 211 4799 7990
AD
DR
ES
SE
S
61
Borealis Polymere GmbHHaiminger-Straße 1
D-84489 Burghausen
Production Site
Tel: + 49 86 77 977 0
Fax: + 49 86 77 977 111
Borealis Polymere Holding GmbHBorealis Vertriebs GmbHArabellastrasse 4
D-81925 München
Sales Office
Tel: + 49 89-92 80 09 0
Fax: + 49 89 914952
HungaryBorealis Kft.Csalogany utca 13-19/B III. 15.
H-1027 Budapest
Sales Office
Tel: + 36 12021938
Fax: + 36 30311531
ItalyBorealis Compounds Italia S.r.lBorealis Compounds S.p.A.Via Ercolano 8/10
I-20052 Monza
Sales Office /Compounding Unit
Tel: + 39 039 20 421
Fax: + 39 039 20 42 254
Fax: + 39 039 20 42 252 (Sales Office)
NorwayBorealis ASN-3960 Stathelle
Sales Office /Production Site
Tel: + 47 35 57 7000
Fax: + 47 35 57 7200
Fax: + 47 35 57 7561 (Sales Office)
PolandBorealis Polska Sp. z o.o.Ul. Bagatela 14
PL-00 585 Warsaw
Sales Office
Tel: + 48 22 629 7723
Fax: + 48 22 621 3498
PortugalBorealis Polímeros, Lda.Monte Feio
Apartado 41
P-7520-954 Sines Codex
Production Site
Tel: + 351 69 860 100
Fax: + 351 69 860 121
Borealis Polímeros, Lda.Praceta das Fabricas 2/2A
Outurela-Portela
P-2795 Carnaxide
Sales Office
Tel: + 351 1 424 5900
Fax: + 351 1 424 5923
RussiaBorealis Polymers Representative Office, St. Petersburg
Business Center Linco Co.
14, Sofijskaya Steet (6th floor)
192236 St. Petersburg
Branch Office
Tel: + 7 812 326 6507/509
Fax: + 7 812 326 6508
Borealis Polymers Representative Office, Moscow
Parus Business Centre
23, 1st Tverskaya-Yamskaya Street
(7th Floor, Office No.9)
125047 Moscow
Branch Office
Tel: + 7 501 252 79 95
Fax: + 7 503 956 82 16
SingaporeBorealis Singapore Pte Ltd.438A Alexandra Road #08/01-02
Alexandra Technopark
Singapore 119967
Sales Office /Technical Support Centre
Tel: + 65 278 0555
Fax: + 65 276 0555
SpainPoliolefinas Borealis España S.ARambla de Catalunya, 2 y 4 - Planta 3a
E-08007 Barcelona
Sales Office
Tel: + 34 93 270 1040
Fax: + 34 93 302 3361
SwedenBorealis ABS-444 86 Stenungsund
Sales Office /Production Site
Tel: + 46 303 8 60 00
Fax: + 46 303 8 64 49
Fax: + 46 303 8 17 46 (Sales Office)
TurkeyBorealis S.A.Ayazma Deresi Cad. Saral Is Merkezi
No.6 Kat. 3
TR-80260 Gayrettepe-Istanbul
Sales Office
Tel: + 90 212 272 4212
Fax: + 90 212 267 4929
United KingdomBorealis UK LimitedBorealis House
Water Lane
Wilmslow, Cheshire SK9 5AR
Sales Office
Tel: + 44 1625 54 7300
Fax: + 44 1625 54 7301
Joint Ventures
SingaporeBorouge Pte Ltd438 A Alexandra Road #08/01-02
Alexandra Technopark
Singapore 119967
Tel: + 65 275 4100
Fax: + 65 377 1233
United Arab EmiratesAbu Dhabi Polymers Company Limited (Borouge)P. O. Box 6925
7th floor Al Fordous Tower,
Al Salam Street
Abu Dhabi
Tel: + 971 2 711 821
Fax: + 971 2 710 695
United KingdomAbu Dhabi Polymers CompanyLimited Project Officec/o Parsons House
Kew Bridge Road
Brentford, Middelsex TW8 0EH
Tel: + 44 181 742 5087
Fax: + 44 181 742 758 2554
U.S.A.Nova-Borealis Compounds LLC176 Thomas Road
Port Murray, NJ 07865
Tel: + 1 908 850 6200
Fax: + 1 908 850 1236
62
BO
AR
D A
ND
M
AN
AG
EM
EN
T
Board and Management
Board of Directors:
Terje Vareberg (Chairman)
Gerhard Roiss(Vice Chairman)
Mohamed Al Khaily
Erling Øverland
Executive Board:
Svein RennemoChief Executive Officer
Franz WurmChief Financial Officer
Walter KadlExecutive Vice President,
Polyolefins & Chemicals Division
Staffan LennströmExecutive Vice President,
Performance Products Division
Henry SperleExecutive Vice President,
Business Development Division
Harald YnnesdalExecutive Vice President,
Manufacturing Division
Vice Presidents:
Maarit AarniOlefins, Phenol & Aromatics BU
Kent AbbåsPolypropylene BU
Thomas AbelOperations Planning
Kjell AnbjørnsenStrategic Planning
Walter BaumannEngineering Applications BU
Stig BlombergHSE&Q
Bjarte BogsnesHuman Resources
Johan BrennerLogistics & Procurement
Harri BuchtAbu Dhabi Project
Johannes FischerCorporate Control
Tore GlittumCorporate Engineering
Dawn HansonCorporate Communications
Edward HsiaChina Project
Jan-Erik JohanssonPolyethylene BU
Björn KlofeltLicensing
Jan LindhGroup Finance
Gunnar NielsenInternal Audit
Richard PearsonIT&S
Hubert PuchnerPipe BU
Willy RaymaekersWire & Cable BU
Johan von KnorringResearch & Development
Blenda WeibullSite Development
Espen ØstmoeNew Ventures
Production SiteManagers:
Site Austria
Herbert Willerth
Site Belgium
Juhani Pulli
Site Porvoo, Finland
Jorma Rinta
Site Rønningen, Norway
Roy Vardheim
Site Sines, Portugal
Joost Schrevens
Site Stenungsund, Sweden
Robert Onsander
Design: Kontrapunkt A/S, Copenhagen.
Editorial support: Bryan Wilder, CA.
Photo: Anne Prytz Stensager,
John Bendtsen and others.
This printed matter is recycable. Printed on
official environmentally approved paper with
vegetable-based printing inks.
Phønix-Trykkeriet A/S, Århus, Denmark.
ISO 14001 certified and EMAS-approved.
Borealis A/SLyngby Hovedgade 96DK-2800 LyngbyDenmarkTel: + 45 45 96 60 00Fax: + 45 45 96 61 23


