Embed Size (px)
Citation preview

NASA/TMm2000-209891, Vol. 213
S on the
Study (BOREAS)
11and Sara Editors
213
,S TF-11 Decomposition Data
irle
nautics and
stration
:e Flight Center
No'

The NASA STI Program Office ... in Profile
Since its founding, NASA has been dedicated to
the advancement of aeronautics and spacescience. The NASA Scientific and Technical
Information (STI) Program Office plays a key
part in helping NASA maintain this importantrole.
The NASA STI Program Office is operated by
Langley Research Center, the lead center forNASA's scientific and technical information. The
NASA STI Program Office provides access to
the NASA STI Database, the largest collection of
aeronautical and space science STI in the world.
The Program Office is also NASA's institutional
mechanism for disseminating the results of its
research and development activities. These
results are published by NASA in the NASA STI
Report Series, which includes the following
report types:
• TECHNICAL PUBLICATION. Reports of
completed research or a major significant
phase of research that present the results of
NASA programs and include extensive data or
theoretical analysis. Includes compilations of
significant scientific and technical data and
information deemed to be of continuing
reference value. NASA's counterpart of
peer-reviewed formal professional papers but
has less stringent limitations on manuscript
length and extent of graphic presentations.
• TECHNICAL MEMORANDUM. Scientific
and technical findings that are preliminary or
of specialized interest, e.g., quick release
reports, working papers, and bibliographiesthat contain minimal annotation. Does not
contain extensive analysis.
• CONTRACTOR REPORT. Scientific and
technical findings by NASA-sponsored
contractors and grantees.
CONFERENCE PUBLICATION. Collected
papers from scientific and technical
conferences, symposia, seminars, or other
meetings sponsored or cosponsored by NASA.
SPECIAL PUBLICATION. Scientific, techni-cal, or historical information from NASA
programs, projects, and mission, often con-
cerned with subjects having substantial publicinterest.
TECHNICAL TRANSLATION.
English-language translations of foreign scien-
tific and technical material pertinent to NASA'smission.
Specialized services that complement the STI
Program Office's diverse offerings include creat-
ing custom thesauri, building customized data-
bases, organizing and publishing research results...
even providing videos.
For more information about the NASA STI Pro-
grain Office, see the following:
Access the NASA STI Program Home Page at
http://www, sti.nasa.gov/STI-homepage.html
E-mail your question via the Internet to
help@ sti.nasa.gov
Fax your question to the NASA Access Help
Desk at (301) 621-0134
• Telephone the NASA Access Help Desk at
(301) 621-0390
Write to:
NASA Access Help Desk
NASA Center for AeroSpace Information7121 Standard Drive
Hanover, MD 21076-1320

NASA/TMm2000-209891, Vol. 213
Technical Report Series on theBoreal Ecosystem-Atmosphere Study (BOREAS)
Forrest G. Hall and Sara Conrad, Editors
Volume 213
BOREAS TF-11 Decomposition Dataover the SSA-Fen
David W. Valentine
University of Alaska, Fairbanks
National Aeronautics and
Space Administration
Goddard Space Flight Center
Greenbelt, Maryland 20771
November 2000

NASA Center for AeroSpace Information7121 Standard Drive
Hanover, MD 21076-1320Price Code: A17
Available from:
National Technical Information Service
5285 Port Royal RoadSpringfield, VA 22161
Price Code: A10

BOREAS TF-11 Decomposition Data over the SSA-Fen
David Valentine
Summary
The BOREAS TF-11 team collected several data sets in its efforts to fully describe the flux and sitecharacteristics at the SSA-Fen site. This data set contains decomposition rates of a standard substrate(wheat straw) across treatments. The measurements were conducted in 1994 as part of a 2 x 2 factorial
experiment in which we added carbon (300 g/m 2 as wheat straw) and nitrogen (6 g/m 2 as urea) to fourreplicate locations in the vicinity of the TF- 11 tower. The data are stored in tabular ASCII files.
Table of Contents
1) Data Set Overview2) Investigator(s)3) Theory of Measurements4) Equipment5) Data Acquisition Methods6) Observations7) Data Description8) Data Organization9) Data Manipulations10) Errors11) Notes12) Application of the Data Set13) Future Modifications and Plans14) Software15) Data Access16) Output Products and Availability17) References18) Glossary of Terms19) List of Acronyms20) Document Information
1. Data Set Overview
1.1 Data Set Identification
BOREAS TF- 11 Decomposition Data over the SSA-Fen
1.2 Data Set Introduction
This data set contains decomposition rates of a standard substrate (wheat straw) across treatments.The measurements were conducted as part of a 2 x 2 factorial experiment in which we added carbon
(300 g/m2 as wheat straw) and nitrogen (6 g/m2 as urea) to four replicate locations in the vicinity of theTower Flux (TF)- 11 tower.
Page 1

1.3 Objective/PurposeMuchof theareawithin theborealforestbiomeconsistsof wetlands,in which largecarbonstores
andhighwatertablesdrivefundamentallydifferentatmosphericinteractionsthanoccurundertheotherforesttypesstudiedby theBORealEcosystem-AtmosphereStudy(BOREAS).Onekeydifferenceis intheformcarbonis emittedfollowing soilmicrobialrespiration;in wetlands,muchof it isemittedasmethane.Wetlandsarethedominantinfluenceof borealforestsonatmosphericmethane.
Thisstudywasundertakenin orderto assessresponsesof methaneemissionsin northernwetlandsto potentialchangesin plantproductivity,nitrogenavailabilityorboth.Whiting andChanton(1993)recentlyobservedthatmethaneemissionsfrom wetlandsacrosstheglobearewell relatedto netprimaryproductivity(NPP).Thismaybefor avarietyof reasons,includingenhancedplanttransport,increasedmethanogenicsubstratesfrom rootexudates,increasedlitter inputcascadingto enhancedsubstrateavailabilityfor methanogenesis,or enhancedC andN mineralizationof decomposingresidues.Previousworkby us(Valentineet al., 1994)andothershasshownthatsubstrateavailabilityis akeyconstraintonmethaneproductionin wetlands.Thepresentstudywasaneffort to testwhethersubstratemanipulationresultsfrom laboratorystudiescouldbemirroredunderfield conditions.
1.4 Summary of ParametersWereportthemasslossof a standardplantmaterial(wheatstraw)overthecourseof N50daysasa
functionof treatmentandlocation.We alsoreporttheinitial andfinal concentrationsof carbonandnitrogen(massbasis).
1.5 DiscussionThesedatawerecollectedfrom asetof smalllocationswithin thefen,andthereforenoonelocation
representedtheentirestudysite.In fact, thefenin whichthisworkwasconductedwascharacterizedby alarge-scalegradientof vegetation,microtopography,andhydrologysuchthatthestudysiteitselfis representativeonly of theportionof thefenin whichit waslocated(i.e.,thelower 1/3).
1.6 Related Data SetsBOREASTE-06BiomassEstimateDataBOREASTE-18BiomassDensityImageof theSSABOREASTGB-03PlantSpeciesCompositionDataovertheNSA-Fen
2. Investigator(s)
2.1 Investigator(s) Name and TitleDavid ValentineAssistant Professor
Department of Forest SciencesP.O. Box 757200
University of AlaskaFairbanks, AK 99775-7200
2.2 Title of InvestigationInfluence of Substrate Characteristics and Other Environmental Factors on Methane Emissions
from the BOREAS Southern Study Area Fen Site. III. Standard Litter Decomposition
Page 2

2.3 Contact Information
Contact 1:David Valentine
Department of Forest SciencesP.O. Box 757200
University of AlaskaFairbanks, AK 99775-7200(907) 474-7614(907) 474-6184 (fax)ffdwv@ aurora, alaska.edu
Contact 2:
Jeffrey A. NewcomerRaytheon ITSSCode 923NASA GSFC
Greenbelt, MD 20771(301) 286-7858(301) 286-0239 (fax)
Jeffrey.Newcomer@ gsfc.nasa.gov
3. Theory of Measurements
Litter bags were constructed from fiberglass screen to hold N3 g of plant material. Once filled withwheat straw and weighed, they were placed within each of the treatment/location replicates and allowedto remain for N50 days. They were then collected and reweighed, and the fraction of the originalweight remaining is reported in the accompanying file.
4. Equipment
4.1 Sensor/Instrument Description
Not applicable.
4.1.1 Collection Environment
The litter bags were set out around the end of July (21-Jul or 02-Aug-1994), then retrieved on17-Sep- 1994. Half the bags were placed on the surface of the peat, and half were inserted 0.1 m belowthe surface.
4.1.2 Source/Platform
Not applicable.
4.1.3 Source/Platform Mission Objectives
Recent papers (e.g., Whiting and Chanton, 1993) have suggested that CIq< emissions are
positively related to plant productivity. One possible mechanism by which enhanced NPP or otherfactors may result in higher CH4 emissions is through enhanced decomposition rates, perhaps
indexing a more rapid substrate supply rate from fermentative processes. We therefore wanted toevaluate whether enhanced litter decomposition rates (i.e., mass loss) covaried with CIq< emissionsrates or varied as a function of our C and N additions.
Page 3

4.1.4 Key VariablesName Unit Description
FRAC Not applicable Fraction of wheat straw mass
C Not applicable C fraction of wheat straw
H Not applicable H fraction of wheat straw
N Not applicable N fraction of wheat straw
4.1.5 Principles of OperationNot applicable.
4.1.6 Sensor/Instrument Measurement GeometryNot applicable.
4.1.7 Manufacturer of Sensor/Instrument
Not applicable.
4.2 Calibration
4.2.1 Specifications
Not applicable.
4.2.1.1 Tolerance
Not applicable.
4.2.2 Frequency of CalibrationNot applicable.
4.2.3 Other Calibration Information
Not applicable.
remaining
5. Data Acquisition Methods
Approximately 3 g of wheat straw was sealed into each fiberglass mesh screen. Oven dry equivalentweights for each were determined based on additional subsamples. Two replicate bags for eachtreatment/platform combination were either laid on the surface or inserted 0.1 m into the peat near theend of July, then collected in mid-September. Each bag was oven-dried at 30 °C for 48 h, thenweighed. Subsamples were ground and analyzed using a Leco CHN analyzer for C, H, and Nconcentrations.
Subsamples from the initial (undecomposed) wheat straw were similarly analyzed for C, H, and Nconcentrations:C ADDED,N ADDED, DURATION, REPLICATE ID,LITTER MASS FRACTION, C CONC,H CONC,N CONC
Initial, 0, 0, 0, 0, 0, i, .446, .061, .005
6. Observations
6.1 Data Notes
Vegetative growth lifted some of the bags off the peat surface during the decomposition period,and the resultant drying likely retarded those.
6.2 Field NotesNone.
Page 4

7. Data Description
7.1 Spatial Characteristics
7.1.1 Spatial Coverage
All measurements were made along two transects identified by their location relative to the TF- 11micrometeorology tower: a north transect (NA and NB platforms) and a south transect (SA and SBplatforms). All measurements were made within 70 m of the TF- 11 tower, whose North AmericanDatum of 1983 (NAD83) coordinates are 53.80206°N, 104.61798°W.
7.1.2 Spatial Coverage MapNot available.
7.1.3 Spatial ResolutionThe data are from point measurements at the given locations.
7.1.4 ProjectionNot applicable.
7.1.5 Grid DescriptionNot applicable.
7.2 Temporal Characteristics
7.2.1 Temporal CoverageLitter bags were placed either on 21-Jul-1994 (north transect) or 02-Aug-1994 (south transect). All
bags were collected on 17-Sep-1994.
7.2.2 Temporal Coverage MapNone.
7.2.3 Temporal Resolution
Ideally, the litter bags would have been placed at the beginning of the growing season. Because ofa miscommunication from the Principal Investigator (PI) to the field crew, the bags were not placeduntil much later than optimal.
7.3 Data Characteristics
7.3.1 Parameter/Variable
The parameters contained in the data files on the CD-ROM are:
Column Name
SITE NAME
SUB SITE
START OBS DATE
END OBS DATE
PEAT DEPTH
C ADDED
N ADDED
DURATION
REPLICATE ID
LITTER MASS FRACTION
C CONC
H CONC
Page 5

N CONC
S_TE COMMENTS
CRTFCN CODE
REVISION DATE
7.3.2 Variable Description/DefinitionThe descriptions of the parameters contained in the data files on the CD-ROM are:
Column Name Description
SITE NAHE
SUB SITE
START OBS DATE
END OBS DATE
PEAT DEPTH
C ADDED
N ADDED
DURATION
REPLICATE ID
LITTER MASS FRACTION
C CONC
H CONC
N CONC
SITE COMMENTS
CRTFCN CODE
REVISION DATE
The identifier assigned to the site by BOREAS, in
the format SSS-TTT-CCCCC, where SSS identifies
the portion of the study area: NSA, SSA, REG,
TRN, and TTT identifies the cover type for the
site, 999 if unknown, and CCCCC is the identifier
for site, exactly what it means will vary with
site type.
The identifier assigned to the sub-site by BOREAS
in the format GGGGG-IIIII, where GGGGG is the
group associated with the sub-site instrument,
e.g. HYD06 or STAFF, and IIIII is the identifier
for sub-site, often this will refer to an
instrument.
The date and time at which collection of the
referenced data commenced.
The date and time at which collection of the
referenced data was terminated.
The depth below the peat surface.
Estimated amount of carbon contained in the wheat
straw that was added to the plot.
Estimated amount of nitrogen contained in the
urea that was added to the plot.
Duration of time that the samples were in the
field since 21-JUL-94 or 02-AUG-94.
Replicate id, where 2 denotes a replicate.
Fraction of original litter mass remaining.
Carbon concentration of remaining littermass
Hydrogen concentration of remaining littermass
Nitrogen concentration of remaining littermass
Descriptive information to clarify or enhance the
site information.
The BOREAS certification level of the data.
Examples are CPI (Checked by PI), CGR (Certified
by Group), PRE (Preliminary), and CPI-??? (CPI
but questionable).
The most recent date when the information in the
referenced data base table record was revised.
Page 6

7.3.3 Unit of MeasurementThe measurement units for the parameters contained in the data files on the CD-ROM are:
Column Name Units
SITE NAME [none]
SUB SITE [none]
START OBS DATE [none]
END OBS DATE [none]
PEAT DEPTH [millimeters]
C ADDED [grams C] [meter^-2]
N ADDED [grams C] [meter^-2]
DURATION [days]
REPLICATE ID [unitless]
LITTER MASS FRACTION [unitless]
C CONC [grams C] [grams
H CONC [grams H] [grams
N CONC [grams N] [grams
S_TE COMMENTS [none]
CRTFCN CODE [none]
REVISION DATE [DD-MON-YY]
litter^-l]
litter^-l]
litter^-l]
7.3.4 Data Source
The sources of the parameter values contained in the data files on the CD-ROM are:
Column Name Data Source
SITE NAME [Assigned by BORIS Staff]
SUB SITE [Assigned by BORIS Staff]
START OBS DATE [Investigator]
END OBS DATE [Investigator]
PEAT DEPTH [Investigator]
C ADDED [Investigator]
N ADDED [Investigator]
DURATION [Investigator]
REPLICATE ID [Investigator]
LITTER MASS FRACTION [Balance]
C CONC [Leco CHN analyzer]
H CONC [Leco CHN analyzer]
N CONC [Leco CHN analyzer]
SITE COMMENTS [Investigator]
CRTFCN CODE [Assigned by BORIS Staff]
REVISION DATE [Assigned by BORIS Staff]
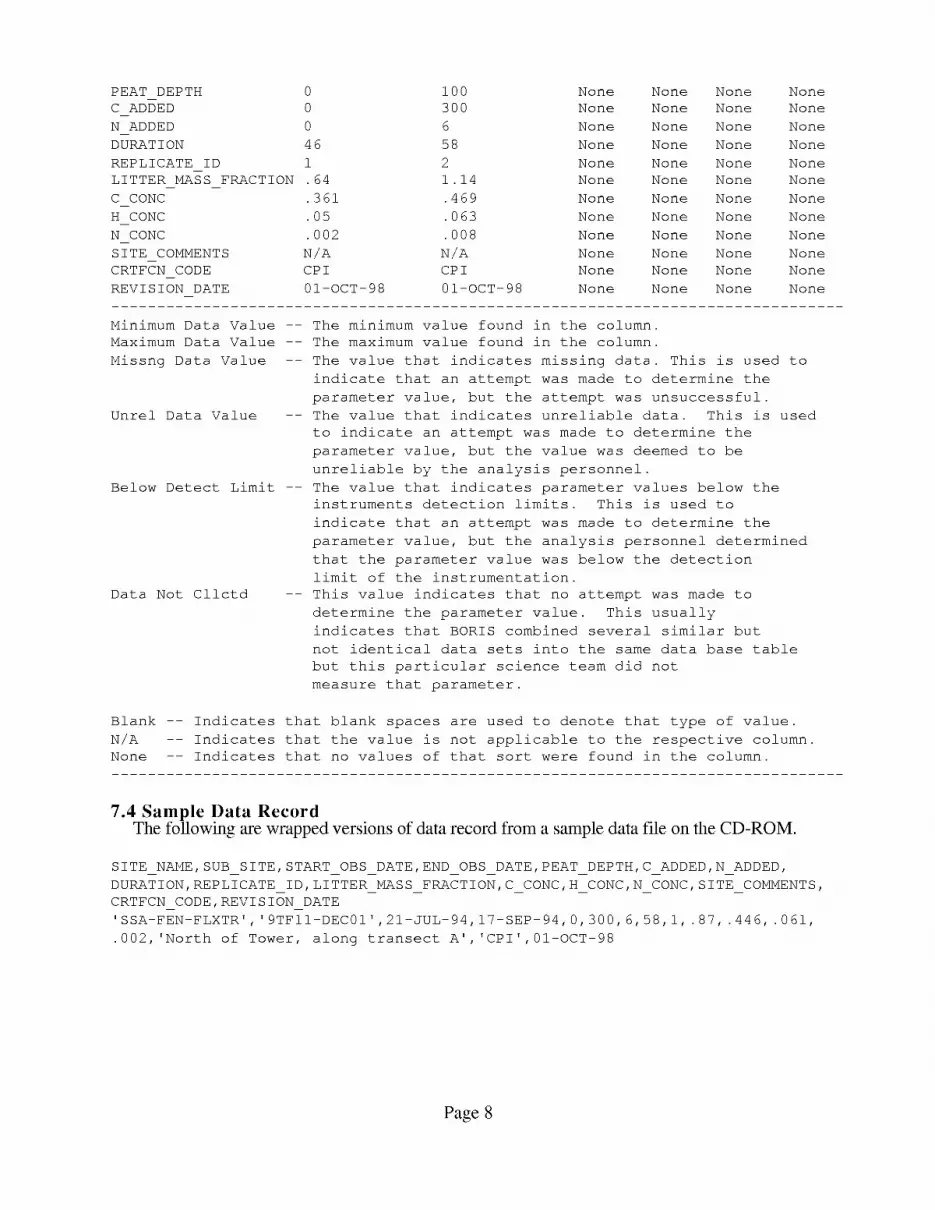
7.3.5 Data RangeThe following table gives information about the parameter values found in the data files on the
CD-ROM.
Minimum Maximum Missng Unrel Below Data
Data Data Data Data Detect Not
Column Name Value Value Value Value Limit Cllctd
SITE NAME SSA-FEN-FLXTR SSA-FEN-FLXTR None None None None
SUB SITE 9TFII-DEC01 9TFII-DEC07 None None None None
START OBS DATE 21-JUL-94 02-AUG-94 None None None None
END OBS DATE 17-SEP-94 17-SEP-94 None None None None
Page 7
PEAT DEPTH 0
C ADDED 0
N ADDED 0
DURATION 46
REPLICATE ID 1
LITTER MASS FRACTION .64m m
C CONC .361
H CONC .05
N CONC .OO2
SITE COMMENTS N/A
CRTFCN CODE CPI
REVISION DATE 01-OCT-98
i00 None None None None
300 None None None None
6 None None None None
58 None None None None
2 None None None None
1.14 None None None None
.469 None None None None
.063 None None None None
.008 None None None None
N/A None None None None
CPI None None None None
01-OCT-98 None None None None
Minimum Data Value -- The minimum value found in the column.
Maximum Data Value -- The maximum value found in the column.
Missng Data Value -- The value that indicates missing data. This is used to
indicate that an attempt was made to determine the
parameter value, but the attempt was unsuccessful.
Unrel Data Value -- The value that indicates unreliable data. This is used
to indicate an attempt was made to determine the
parameter value, but the value was deemed to be
unreliable by the analysis personnel.
Below Detect Limit -- The value that indicates parameter values below the
instruments detection limits. This is used to
indicate that an attempt was made to determine the
parameter value, but the analysis personnel determined
that the parameter value was below the detection
limit of the instrumentation.
Data Not Cllctd -- This value indicates that no attempt was made to
determine the parameter value. This usually
indicates that BORIS combined several similar but
not identical data sets into the same data base table
but this particular science team did not
measure that parameter.
Blank -- Indicates that blank spaces are used to denote that type of value.
N/A -- Indicates that the value is not applicable to the respective column.
None -- Indicates that no values of that sort were found in the column.
7.4 Sample Data RecordThe following are wrapped versions of data record from a sample data file on the CD-ROM.
SITE NAME,SUB SITE,START OBS DATE,END OBS DATE,PEAT DEPTH,C ADDED,N ADDED,
DURATION, REPLICATE ID,LITTER MASS FRACTION, C CONC,H CONC,N CONC,SITE COMMENTS,
CRTFCN CODE,REVISION DATE
'SSA-FEN-FLXTR', '9TFII-DECOI',21-JUL-94,17-SEP-94,0,300,6,58,1, .87, .446, .061,
.002, 'North of Tower, along transect A', 'CPI',01-OCT-98
Page 8

8. Data Organization
8.1 Data Granularity
The smallest unit of data tracked by the BOREAS Information System (BORIS) is themeasurement(s) made for a given site on a given day.
8.2 Data Format(s)
The Compact Disk-Read-Only Memory (CD-ROM) files contain American Standard Code forInformation Interchange (ASCII) numerical and character fields of varying length separated bycommas. The character fields are enclosed with single apostrophe marks. There are no spaces betweenthe fields.
Each data file on the CD-ROM has four header lines of Hyper-Text Markup Language (HTML)code at the top. When viewed with a Web browser, this code displays header information (data settitle, location, date, acknowledgments, etc.) and a series of HTML links to associated data files andrelated data sets. Line 5 of each data file is a list of the column names, and line 6 and following linescontain the actual data.
9. Data Manipulations
9.1 Formulae
Not applicable.
9.1.1 Derivation Techniques and AlgorithmsNone.
9.2 Data Processing Sequence
9.2.1 Processing StepsNone.
9.2.2 Processing ChangesNone.
9.3 Calculations
9.3.1 Special Corrections/AdjustmentsNone.
9.3.2 Calculated Variables
Not applicable.
9.4 Graphs and PlotsNone.
10. Errors
10.1 Sources of Error
The most obvious source of error was the tendency for the litter bags to be lifted above the peatsurface by vegetative growth, potentially retarding decomposition through excessive drying. Othersources of error include solubilization of straw constituents resulting in overstatement ofdecomposition rate, exclusion of soil fauna by the bag screen itself, and moss or other growth in thebag causing a mass gain during the period.
Page 9

10.2 Quality Assessment
10.2.1 Data Validation by SourceNot applicable.
10.2.2 Confidence Level/Accuracy JudgmentExcept for the bags that gained weight during the decomposition period, these data appear fairly
robust. The aforementioned gainers should be deleted prior to analysis.
10.2.3 Measurement Error for Parameters
Not applicable.
10.2.4 Additional Quality AssessmentsNone given.
10.2.5 Data Verification by Data Center
Data were examined for general consistency and clarity.
11.1 Limitations of the DataSee Sections 9.1 and 10.1.
11.2 Known Problems with the Data
None given.
11.3 Usage GuidanceSee Sections 9.1 and 10.1.
11.4 Other Relevant Information
None given.
11. Notes
12. Application of the Data Set
Several avenues are being pursued in publications now being produced to answer the followingquestions:
• How do CH4 flux measurements compare by technique used in measurement?• How and why do CH4 flux measurements vary through time and across the landscape?
• Does plant productivity limit CH 4 emissions?
None.
14.1 Software Description
13. Future Modifications and Plans
14. Software
We used only commercially available software, mostly the Quattro Pro spreadsheet.
14.2 Software Access
Not applicable.
Page 10

15. Data Access
The decomposition data are available from the Earth Observing System Data and Information System(EOSDIS) Oak Ridge National Laboratory (ORNL) Distributed Active Archive Center (DAAC).
15.1 Contact Information
For BOREAS data and documentation please contact:
ORNL DAAC User Services
Oak Ridge National LaboratoryP.O. Box 2008 MS-6407
Oak Ridge, TN 37831-6407Phone: (423) 241-3952Fax: (423) 574-4665E-mail: [email protected] or [email protected]
15.2 Data Center Identification
Earth Observing System Data and Information System (EOSDIS) Oak Ridge National Laboratory(ORNL) Distributed Active Archive Center (DAAC) for Biogeochemical Dynamicshttp://www-eosdis.ornl.gov/.
15.3 Procedures for Obtaining DataUsers may obtain data directly through the ORNL DAAC online search and order system
[http://www-eosdis.ornl.gov/] and the anonymous FTP site [ftp://www-eosdis.ornl.gov/data/] or bycontacting User Services by electronic mail, telephone, fax, letter, or personal visit using the contactinformation in Section 15.1.
15.4 Data Center Status/Plans
The ORNL DAAC is the primary source for BOREAS field measurement, image, GIS, andhardcopy data products. The BOREAS CD-ROM and data referenced or listed in inventories on theCD-ROM are available from the ORNL DAAC.
16.1 Tape ProductsNone.
16. Output Products and Availability
16.2 Film ProductsNone.
16.3 Other ProductsThese data are available on the BOREAS CD-ROM series.
Page 11
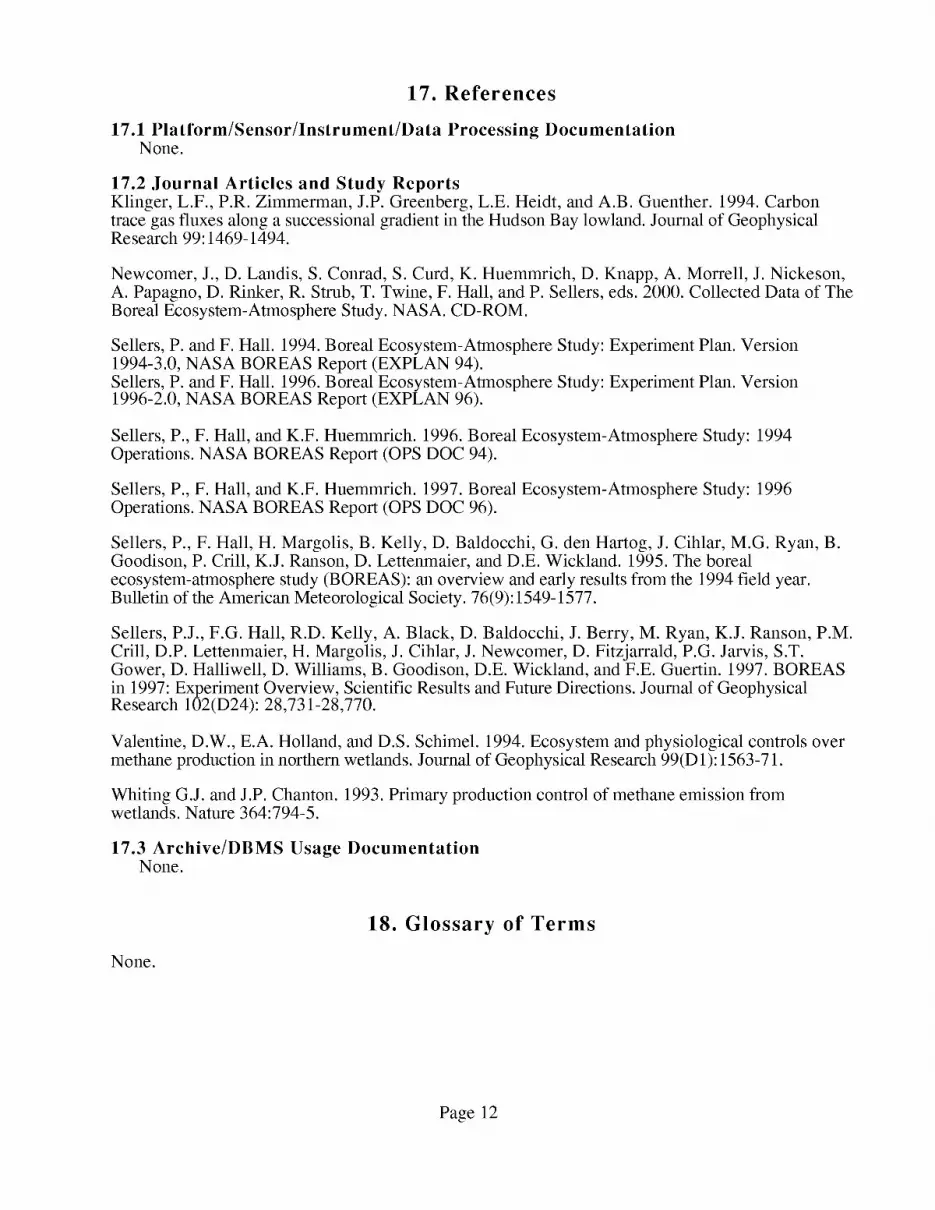
17. References
17.1 Platform/Sensor/Instrument/Data Processing DocumentationNone.
17.2 Journal Articles and Study Reports
Klinger, L.F., P.R. Zimmerman, J.P. Greenberg, L.E. Heidt, and A.B. Guenther. 1994. Carbontrace gas fluxes along a successional gradient in the Hudson Bay lowland. Journal of GeophysicalResearch 99:1469-1494.
Newcomer, J., D. Landis, S. Conrad, S. Curd, K. Huemmrich, D. Knapp, A. Morrell, J. Nickeson,A. Papagno, D. Rinker, R. Strub, T. Twine, F. Hall, and P. Sellers, eds. 2000. Collected Data of TheBoreal Ecosystem-Atmosphere Study. NASA. CD-ROM.
Sellers, P. and F. Hall. 1994. Boreal Ecosystem-Atmosphere Study: Experiment Plan. Version1994-3.0, NASA BOREAS Report (EXPLAN 94).Sellers, P. and F. Hall. 1996. Boreal Ecosystem-Atmosphere Study: Experiment Plan. Version1996-2.0, NASA BOREAS Report (EXPLAN 96).
Sellers, P., F. Hall, and K.F. Huemmrich. 1996. Boreal Ecosystem-Atmosphere Study: 1994Operations. NASA BOREAS Report (OPS DOC 94).
Sellers, P., F. Hall, and K.F. Huemmrich. 1997. Boreal Ecosystem-Atmosphere Study: 1996Operations. NASA BOREAS Report (OPS DOC 96).
Sellers, P., F. Hall, H. Margolis, B. Kelly, D. Baldocchi, G. den Hartog, J. Cihlar, M.G. Ryan, B.Goodison, P. Crill, K.J. Ranson, D. Lettenmaier, and D.E. Wickland. 1995. The boreal
ecosystem-atmosphere study (BOREAS): an overview and early results from the 1994 field year.Bulletin of the American Meteorological Society. 76(9): 1549-1577.
Sellers, P.J., F.G. Hall, R.D. Kelly, A. Black, D. Baldocchi, J. Berry, M. Ryan, K.J. Ranson, P.M.Crill, D.P. Lettenmaier, H. Margolis, J. Cihlar, J. Newcomer, D. Fitzjarrald, P.G. Jarvis, S.T.Gower, D. Halliwell, D. Williams, B. Goodison, D.E. Wickland, and F.E. Guertin. 1997. BOREAS
in 1997: Experiment Overview, Scientific Results and Future Directions. Journal of GeophysicalResearch 102(D24): 28,731-28,770.
Valentine, D.W., E.A. Holland, and D.S. Schimel. 1994. Ecosystem and physiological controls overmethane production in northern wetlands. Journal of Geophysical Research 99(D 1):1563-71.
Whiting G.J. and J.P. Chanton. 1993. Primary production control of methane emission fromwetlands. Nature 364:794-5.
17.3 Arehive/DBMS Usage DocumentationNone.
None.
18. Glossary of Terms
Page 12
ASCII
BOREAS
BORIS
CD-ROM
DAAC
EOS
EOSDIS
GIS
GSFC
HTML
NAD83
NASA
NPP
NSA
ORNL
PANP
PBR
PI
SSA
TE
TF
TGB
URL
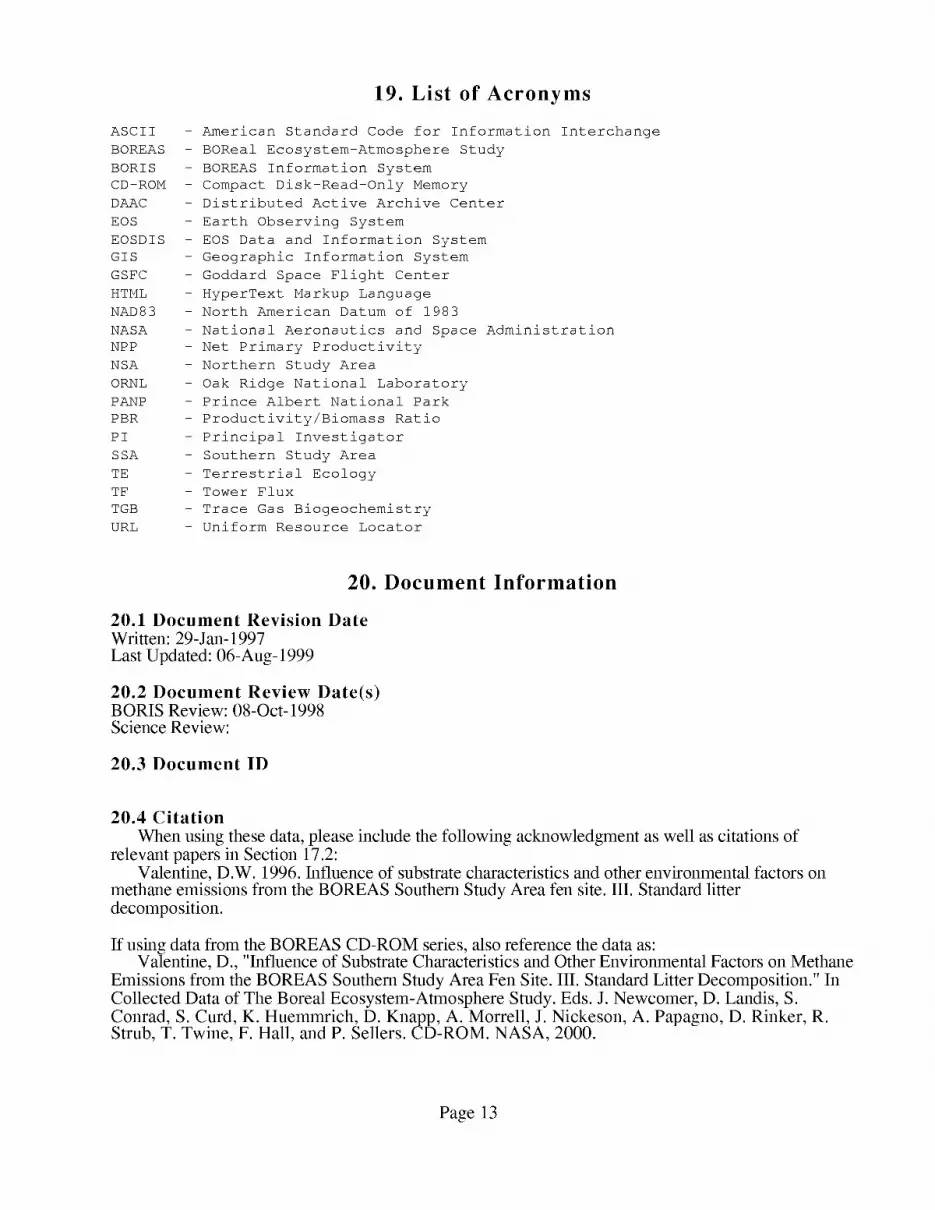
19. List of Acronyms
- American Standard Code for Information Interchange
- BOReal Ecosystem-Atmosphere Study
- BOREAS Information System
- Compact Disk-Read-Only Memory
- Distributed Active Archive Center
- Earth Observing System
- EOS Data and Information System
- Geographic Information System
- Goddard Space Flight Center
- HyperText Markup Language
- North American Datum of 1983
- National Aeronautics and Space Administration
- Net Primary Productivity
- Northern Study Area
- Oak Ridge National Laboratory
- Prince Albert National Park
- Productivity/Biomass Ratio
- Principal Investigator
- Southern Study Area
- Terrestrial Ecology
- Tower Flux
- Trace Gas Biogeochemistry
- Uniform Resource Locator
20. Document Information
20.1 Document Revision Date
Written: 29-Jan- 1997Last Updated: 06-Aug- 1999
20.2 Document Review Date(s)BORIS Review: 08-Oct- 1998Science Review:
20.3 Document ID
20.4 Citation
When using these data, please include the following acknowledgment as well as citations ofrelevant papers in Section 17.2:
Valentine, D.W. 1996. Influence of substrate characteristics and other environmental factors onmethane emissions from the BOREAS Southern Study Area fen site. III. Standard litterdecomposition.
If using data from the BOREAS CD-ROM series, also reference the data as:Valentine, D., "Influence of Substrate Characteristics and Other Environmental Factors on Methane
Emissions from the BOREAS Southern Study Area Fen Site. III. Standard Litter Decomposition." InCollected Data of The Boreal Ecosystem-Atmosphere Study. Eds. J. Newcomer, D. Landis, S.Conrad, S. Curd, K. Huemmrich, D. Knapp, A. Morrell, J. Nickeson, A. Papagno, D. Rinker, R.Strub, T. Twine, F. Hall, and P. Sellers. CD-ROM. NASA, 2000.
Page 13

Also,cite theBOREASCD-ROMsetas:Newcomer,J.,D. Landis,S.Conrad,S.Curd,K. Huemmrich,D. Knapp,A. Morrell, J.
Nickeson,A. Papagno,D. Rinker,R. Strub,T. Twine,F. Hall, andP.Sellers,eds.CollectedDataofTheBorealEcosystem-AtmosphereStudy.NASA. CD-ROM.NASA, 2000.
20.5 Document Curator
20.6 Document URL
Page 14

REPORT DOCUMENTATION PAGE FormApprovedOMB No. 0704-0188
Public reporting burden for this collection of informationis estimated to average 1 hour per response, including the time for reviewing instructions, searching existing data sources,gathering and maintaining the data needed, and completing and reviewing the collection of information. Send comments regarding this burden estimate or any other aspect of thiscollection of information, including suggestions for reducing this burden, to Washington Headquarters Services, Directorate for Information Operations and Reports, 1215 JeffersonDavis Highway, Suite 1204, Arlington, VA 22202-4302, and to the Office of Management and Budget, Paperwork Reduction Project (0704-0188), Washington, DC 20503.
1. AGENCY USE ONLY (Leave blank) 2. REPORT DATE 3. REPORT TYPE AND DATES COVERED
November 2000 Technical Memorandum
4. TITLE AND SUBTITLE
Technical Report Series on the Boreal Ecosystem-Atmosphere Study (BOREAS)
BOREAS TF- 11 Decomposition Data over the SSA-Fen
6. AUTHOR(S)David W. Valentine
Forrest G. Hall and Sara Conrad, Editors
7. PERFORMING ORGANIZATION NAME(S) AND ADDRESS (ES)
Goddard Space Flight Center
Greenbelt, Maryland 20771
9. SPONSORING / MONITORING AGENCY NAME(S) AND ADDRESS (ES)
National Aeronautics and Space Administration
Washington, DC 20546-0001
5. FUNDING NUMBERS
923
RTOP: 923-462-33-01
8. PEFORMING ORGANIZATIONREPORT NUMBER
2000-03136-0
10. SPONSORING / MONITORING
AGENCY REPORT NUMBER
TM--2000-209891
Vol. 213
11. SUPPLEMENTARY NOTES
D.W. Valentine: University of Alaska, Fairbanks; Sara Conrad: DynCorp
12a. DISTRIBUTION / AVAILABILITY STATEMENT
Unclassifie_Unlimited
Subject Category: 43
Report available from the NASA Center for AeroSpace Information,
7121 Standard Drive, Hanover, MD 21076-1320. (301) 621-0390.
12b. DISTRIBUTION CODE
13. ABSTRACT (Maximum 200 words)
The BOREAS TF-11 team collected several data sets in its efforts to fully describe the flux and site
characteristics at the SSA-Fen site. This data set contains decomposition rates of a standard substrate
(wheat straw) across treatments. The measurements were conducted in 1994 as part of a 2 x 2 factorial
experiment in which we added carbon (300 g/m 2 as wheat straw) and nitrogen (6 g/m 2 as urea) to four
replicate locations in the vicinity of the TF- 11 tower. The data are stored in tabular ASCII files.
14. SUBJECT TERMS
BOREAS, tower flux, decomposition data.
17. SECURITY CLASSIFICATIONOF REPORT
Unclassified
NSN 7540-01-280-5500
18. SECURITY CLASSIFICATIONOF THIS PAGE
Unclassified
19. SECURITY CLASSIFICATIONOF ABSTRACT
Unclassified
15. NUMBER OF PAGES
1416. PRICE CODE
20. LIMITATION OF ABSTRACT
UL
Standard Form 298 (Rev. 2-89)Prescribed by ANSI Std. Z39.18298-102


