Embed Size (px)
Citation preview
Published in
The Population Studies Working Papers (University of Botswana):
Volume 3 pp.41-75, 2002
Haron 2003 1
Botswana’s Population and Housing Census 2001:
An Analysis and Interpretation of its different Religious Traditions*
Muhammed Haron
University of Botswana
0. Introduction
According to the United States State Department „Religious Freedom Report‟ of
20021, it affirmed that the Botswana Constitution provides for the freedom of religion,
and that the government respects this right in practice. The Botswana government‟s
caring policy contributed to its population‟s healthy attitude towards other religions.
Section 11 (2) of the Botswana Constitution states: “…no person shall be hindered in
the enjoyment of his/her freedom of religion, freedom to change his/her2 religion or
belief either alone or in community with others, and both in public and in private, to
manifest and propagate his/her religion or belief in worship, teaching, practice and
observance.” And this has, in turn, promoted the development of a cordial relationship
amongst its citizens and particularly its expatriate/immigrant community.
The Botswana Government pursues a policy that provides the necessary protection to
its citizens, and takes offence against anyone – in both the private and public spheres
– who adopts an intolerant approach to other‟s religious traditions. In fact, its Vision
20163 policy further endorses the notion of building a moral and tolerant society that
would bring about a caring and compassionate nation. These essential elements form
part of the broad based strategy that would eventually make Vision 2016 a reality.
I just wish to express my gratitude to colleagues and friends who have critically perused the
papers and offered the criticisms. However, the (incorrect) interpretation and analyses are all
mine.
1 Visit: http://atheism.about.com/library/irf/irf02/blirf_botswana.htm for more information on the
report.
2 The researcher took the liberty of inserting „her‟ in order to make it more inclusive.
3 The document entitled Vision 2016: Towards Prosperity for All was finalised by The Presidential
Task Group and came into effect during 1997.
Published in
The Population Studies Working Papers (University of Botswana):
Volume 3 pp.41-75, 2002
Haron 2003 2
And Vision 2016, in fact, pointed out the significance of offering assistance to
religious organizations in playing a key role in realising these goals.
Since religion has been recognized as an important phenomenon in the Batswana
society, it is a clear endorsement that religion, which has been revitalised and
resurfaced during the latter part of the 20th
century, possesses the necessary
ingredients to effectively contribute towards a tolerant, morally sound and safe
society. Thus its strategic and significant role cannot be underestimated in the
contemporary world. And it is therefore very important that when states undertake
surveys of their respective populations, which is “a major determinant of national
power” and a nation‟s “greatest resource” (Organski & Organski 1961), that they
include „religion‟ under their „national topic chart.‟
„Religion‟ featured in the 1946 census survey as a topic when Botswana was still
known as Bechuanaland, religion listed it as a topic; unfortunately, this was later
dropped and did not appear in any of the subsequent surveys, according to Damschke
& Goyer (1986), that were circulated in 1956, 1964, 1971 and 1981; the trend
continued when the enumerators designed the 1991 census survey4. The Central
Statistics Office (hereafter CSO) redressed the issue when they included „religion‟ as
one of its important national topics in the Botswana Population and Housing Census
of 2001 (hereafter referred to only as BC 2001). It was indeed a pity that the CSO did
not retain it after the 1946 census because the absence of earlier religious affiliation
figures of its population makes it extraordinarily difficult for researchers and
statisticians to offer a meaningful analysis and interpretation of the BC 2001. Despite
this acknowledged shortcoming an attempt will still be made that would account for a
reasonable analysis and interpretation based upon available secondary sources.
The purpose for this article is to offer an analysis and an interpretation that would
assist in understanding the reasons for the presence of a variety of religious traditions
on Botswana soil. However, since the University of Botswana‟s Ms. Ntloedibe-
4 Even though the information on „religion‟ was not part of the included national topics, Amanze
(1998) however indicated that he drew his sources on the different religious traditions from the CSO
office data that had statistics available for the Botswana Housing and Census of 1991.
Published in
The Population Studies Working Papers (University of Botswana):
Volume 3 pp.41-75, 2002
Haron 2003 3
Kuswane completed a separate analysis of Botswana‟s „Badimo‟ Religious Tradition,
which forms part of the general statistical analysis project requested in May 2002 by
Botswana‟s Central Statistics Office, this article should be seen as a complementary
contribution. It moreover intends to peruse and analyse all the religious traditions
listed in the survey, and identify those that are not mentioned in the accompanying
tables. Furthermore, it hopes to make sense of why the figures are low for some, and
the reasons for sizeable numbers in others. In addition, it intends to offer tentative and
speculative thoughts on those who indicated why they opted to indicate „no religions.‟
The article begins by making general remarks about the context within which this
study locates itself, and then goes on to provide relevant statistical data of religious
traditions in the world before zooming in on the tables that specifically captures the
data of the Botswana religious traditions; and, in the process, it weaves a few critical
remarks regarding certain insertions and omissions into the text.
1. The Context
Botswana, being a land locked state with a small population and a fair amount of
resources, has over the years developed into a multi-cultural, multi-lingual and multi-
religious nation. Since its inhabitants are located in different part of the country, a
variety of cultures had always been present, and a number of local languages had also
been and are still spoken. And with the introduction of Christianity via the missionary
impulse in the 17th
century and thereafter, it resulted in Christianity becoming the
most influential religion in this country; according to BC 2001, it replaced the African
Traditional Religion - referred to in the census as Badimo – as the major religious
tradition and thus the dominant religious representative; however, this is still an issue
of debate as noted from the discussion that follows.
Many decades after Christianity was planted on Botswana soil in the early 1800s,
other religious traditions slowly trickled into the region. The first amongst these
immigrant religious traditions was Islam, which was later followed in the mid 1960s
by the Bahais and Hindus respectively. By the mid 1970s the Buddhist and Sikhs also
joined their company. Most, if not all, of the adherents of these traditions came to
Bechuanaland Protectorate - as it was initially known - as economic migrants; some
Published in
The Population Studies Working Papers (University of Botswana):
Volume 3 pp.41-75, 2002
Haron 2003 4
came for short periods whilst others came for longer. However, there were also those
who became naturalised citizens when their working conditions were found to be
favourable; and those who did not wish to become naturalised were forced to
reconsider for the sake of their children who had become accustomed to their adopted
environment and had grown up in emerging, prosperous surroundings. And since
these children regarded their adopted Botswana environment as their home, they
resisted the idea of repatriating back to the land of their birth. And those children of
the economic migrants or expatriates, who were born in Botswana, automatically
considered Botswana their motherland and, by implication, distanced themselves from
their parents‟ birthplace. In fact, this has been one of the major dilemmas faced by
immigrant working communities. Initially when they came to work in Botswana, they
came on their own and as the conditions became more conducive and favourable, they
brought their families and eventually made Botswana their new place of abode.
Many of the economic migrants not only transported their bags and clothes along with
them, but more importantly also brought their national identities, tribal customs and
religious traditions along with them. These customs and traditions slowly became
rooted in a new foreign environment facing many diverse challenges. In addition to
the working migrant skilled and unskilled labourers, there were also an influx of
refugees from neighbouring states and countries such as Somalia and others that were
in endless socio-political turmoil. Many ended up in Botswana with the assistance of
the United Nations Refugee Agency, commonly known by as the UNHCR. Here
specific reference is made to the Namibian, Angolan and Somali refugees who were
housed in Dukwi, which is geographically located in the northeastern part of the
country. Whilst some of the refugees, particularly the Namibians, have been yearning
to go home, others as in the case of the Angolans and Somalis have opted to remain in
the country and have been given the assistance to start their own small businesses or
pursue their studies with the assistance of the UNHCR5. Many of the children of
these refugees have been granted the opportunity to pursue their education by
attending Botswana educational institutions with the financial help of this
5 Cf. The UNHCR Global Report 2002 – Southern Africa Regional Overview that mentioned the
number of refugees (+3,320) in Botswana at the end of 2002; most of these refugees were from
Namibia, Angola and Somalia and those that remained and are in the process of being naturalised have
the opportunities of pursuing studies and embark upon career opportunities (p.4).
Published in
The Population Studies Working Papers (University of Botswana):
Volume 3 pp.41-75, 2002
Haron 2003 5
organization and the Botswana government. According to the UNHCR Global Report
2000, for example, about 40 Somali refugee children were permitted to attend primary
school, 30 adults were allowed to study English, and 6 young adolescents were given
the chance to enter educational research centres. In their case, they gradually merged
their migrant Somali cultures and customs with those in Botswana.
From the afore-mentioned, it can be seen that Botswana has, over the decades,
gradually developed into a fairly, vibrant multicultural, multilingual, and multi-
religious society. The indigenous cultures and languages as well as the immigrant
cultures, languages and religious traditions have pushed the country into the direction
of being a pluralistic state. These factors have therefore changed the demographics of
the state over the years and have developed it into a special blend and mixture that is
different from other neighbouring states. Although the discussion that follows will not
be looking at the cultural and linguistic issues, these should be ever present in the
back of one‟s mind since they do form an integral part of the individual and family‟s
religious identity.
2. Religious Traditions
Before offering an analysis of each of the religious traditions covered in the survey
and speculating on those columns that refer to „no religion,‟ it intends to briefly
discuss the major religious traditions, their branches and their demographics since
these would have implications for the nature of the BC 2001 survey. In passant,
mention should be made of the fact that it is not the intention of this article to venture
into defining the word „religion,‟ nor to elaborate upon the differences that exist
between the beliefs and practices of each of the religions as these have adequately
been addressed in many works on religion and in the sociology of religion. Many
competent and capable scholars such as Professors Mircea Eliade, Wilfred Cantwell
Smith, Ninian Smart and an array of others have dealt with their definitions and
interpretations in well-known and circulated publications as well as on the world wide
web.
Published in
The Population Studies Working Papers (University of Botswana):
Volume 3 pp.41-75, 2002
Haron 2003 6
The editors cum managers of the www.adherents.com site identified 12 major world
religions, listed the different branches of each of these and provided relevant
demographic data in order to provide interested stakeholders with an idea of the
numerical strength that these traditions possess. Since it was updated in May 2003,
the information is reasonably fresh, and most definitely, relevant and useful. The
traditions (including their branches) were listed in an alphabetical order and are: Babi
& Bahai Faiths (6m), Buddhism (329m), Confucianism (6.3m), Christianity (+1,5 b),
Hinduism (32m), Islam (+1,2 b), Jainism (4,8 m), Judaism (6m), Shinto (12,5 m),
Sikhism (23,2m), Taoism (2,5m), and Zoroastrianism (130m); the site had no
demographic figures for Confucianism nor for Taoism6. Barret & Johnson (2002)
provided the following statistics for Southern Africa, namely South Africa,
Swaziland, Lesotho, Botswana and Namibia: Christianity (39m), ethnoreligionists
(4,4m), non-religious (1,4m), Islam (958 th), Hindus (960th), Bahais (301th),
Buddhist (46th), Judaism (159th), and Sikhism (8,8th). These two scholars were very
wary of the fact that there is a tendency amongst contemporary communities not to
categorically state their religious status; and because of this, created the non-religious
category in order to gauge their actual numbers.
These demographics offer a rough overview as well as an insight into the numerical
strengths of the different religious traditions across the globe and specifically in
Southern Africa. They are not absolutely accurate nor are they meant to be; for
example on the www.adherents.com website (2002) the calculations for Bahais
worldwide is 6m but according to Barret & Johnson (2002) its 7m; from amongst the
many speculative reasons, it could be argued that the surveys did not look at certain
specifics such as formal adherents as opposed to someone who sees him/herself as an
informal adherent, or a practitioner as opposed to someone who only verbally
expresses his/her affiliation to a particular tradition7. In fact, the latter are selected
6 Information on these stats have been extracted from Barret & Johnson‟s (2002) „World Religions
Statistics‟ article.
7 See for example the International Social Survey Program – Religion Surveys at www.issp.org, which
conducted a survey in 1992 and 1998 respectively. The surveys covered the impact of religious beliefs
and behaviours upon the social, moral, and political attitudes, and include questions on religious
upbringing, current religious activities, traditional Christian beliefs, and existential beliefs. Glenn
Trewartha (1969) cautioned that data on attitudes etcetera will be difficult to map and as a result, hard
to analyse.
Published in
The Population Studies Working Papers (University of Botswana):
Volume 3 pp.41-75, 2002
Haron 2003 7
issues that also affect the quality of BC 2001 results. And as a consequence, one of
the major shortcomings of BC 2001 is that it does not request the individual to fill in
the religious branch or denomination the individual belongs to. The mentioned
website clearly reflected the variety of branches and different denominations that
exist, for example, within Christianity, Islam, Hinduism and the Bahai Faith; all of
these religious traditions are listed in the BC 2001 survey. The BC 2001 unfortunately
does not include or set aside space for Judaism, Buddhism or Sikhism; traditions that
have become part and parcel of the Botswana religious landscape for more than three
decades.
It might be useful to refer at this juncture to two different tables presented by two
different researchers who included all the mentioned religious traditions referred to in
the tables below and some unlisted ones. The first table was put together by Amanze
(1994: xi) – and later incorporated and interpreted by Nkomazana (2001: 341), when
he collected his data during the early 1990s for his Botswana Handbook of Churches
(hereafter BHC), and the second table, which was based on statistics made available
in 2000, was put together by Melton when he prepared his entry on „Botswana‟ for the
four volume Encyclopaedia that was edited by himself & Baumann (2002: 158).8
Whilst Amanze acknowledged that he gathered his information during his fieldwork
research from the secretaries of the various churches and leaders of the different
religious traditions in Botswana, and Melton provided no specific source from whence
he drew his statistics.
Prior to furnishing the two tables it might be in order to refer to the fact that Ness &
Ciment‟s (1999) statistics on Botswana leaves much to be desired; the reason for this
8 The religions of Botswana should be taken seriously. Scholars such as Amanze and Nkomazana have
proven in their research that religion plays a vital role in the lives of most – if not all - of the Batswana
including those who stated that they have „no religion.‟ One major advantage that Botswana has when
it is compared to its neighbours, namely South Africa and Zimbabwe, is that it has a small population
that is manageable and controllable; by implication, this means that the extremists elements that
operate amongst adherents of these religious traditions can easily be identified, managed and controlled
without the government interfering in the actual religious affairs of the specific religious traditions.
And this is, of course, another important reason for collecting data on the different religious traditions.
This might sound like doing the work for the intelligence services around the world, but is a problem
that all religious communities these days face and it will have to be challenged whether one likes it or
not.
Published in
The Population Studies Working Papers (University of Botswana):
Volume 3 pp.41-75, 2002
Haron 2003 8
pessimistic statement is that when they tabulated information on Botswana in their
encyclopaedic work, they had no information about the country‟s statistics on
„religion‟ except to state it has 50% religionists and 50% animists! Under the
respective periodical columns where the years 1965, 1980 and 1995 were punched in,
they had no data. And perhaps it might also be appropriate to mention that when John
Ross edited his two volumes encyclopaedia, which was published two decades ago in
1982, there was no entry on „Botswana‟ except under the broad „Sub-Saharan Africa‟
entry by Jeane Stillman. It is assumed that despite Botswana‟s geographical location
and its resources, it has always been given scant attention by European based scholars
during the earlier periods. This seemed to have changed during the past few years
because of its mineral resources, its socio-political stability and the spread of the
HIV/AIDS pandemic amongst its small but steadily growing population.
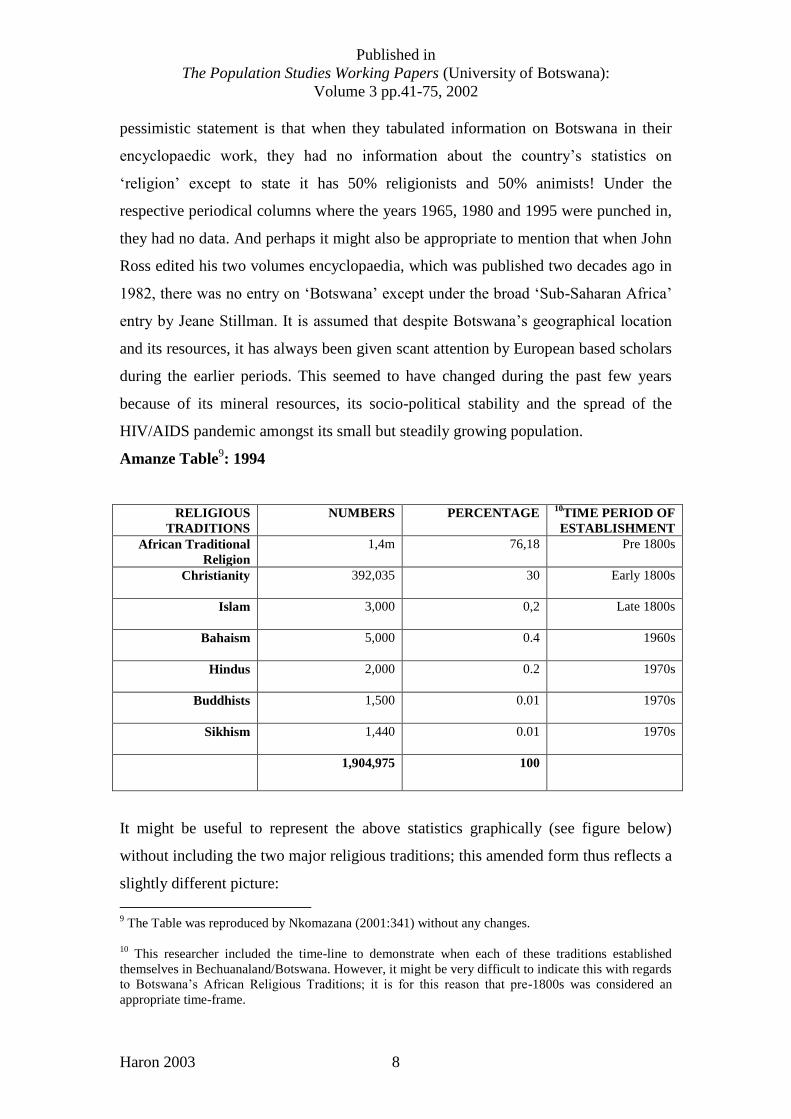
Amanze Table9: 1994
RELIGIOUS
TRADITIONS
NUMBERS PERCENTAGE 10
TIME PERIOD OF
ESTABLISHMENT
African Traditional
Religion
1,4m 76,18 Pre 1800s
Christianity
392,035 30 Early 1800s
Islam 3,000 0,2 Late 1800s
Bahaism 5,000 0.4 1960s
Hindus
2,000 0.2 1970s
Buddhists
1,500 0.01 1970s
Sikhism
1,440 0.01 1970s
1,904,975 100
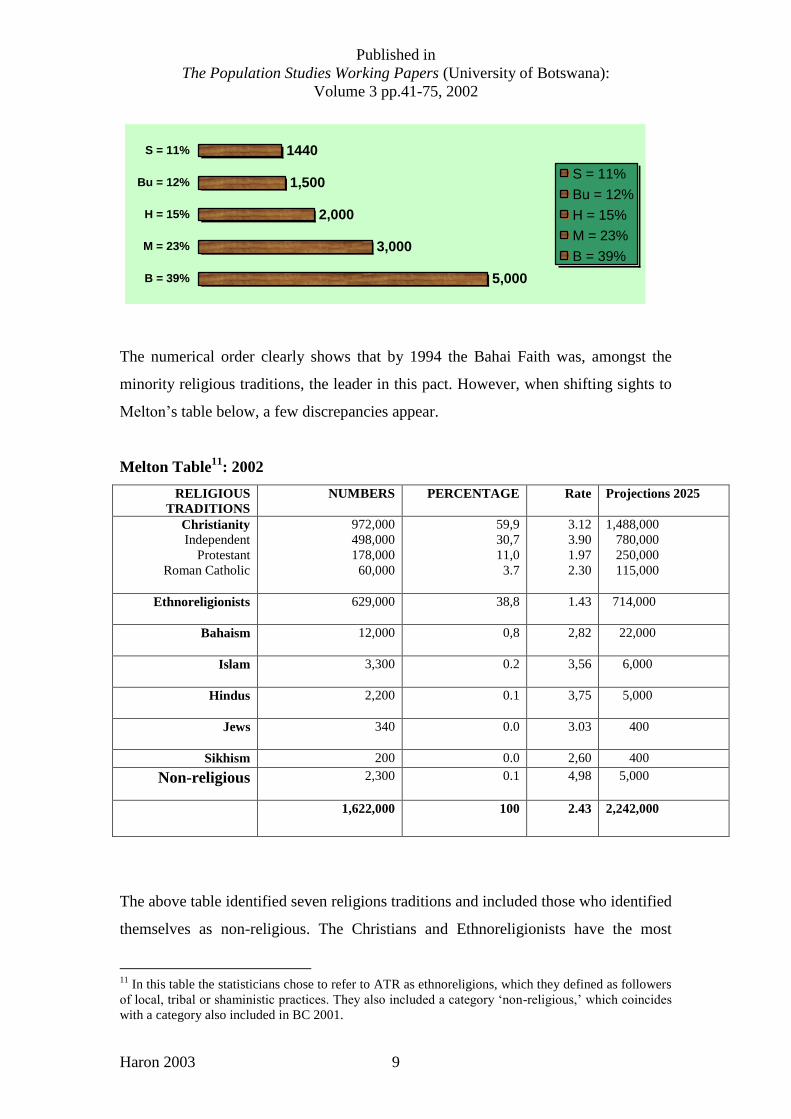
It might be useful to represent the above statistics graphically (see figure below)
without including the two major religious traditions; this amended form thus reflects a
slightly different picture:
9 The Table was reproduced by Nkomazana (2001:341) without any changes.
10
This researcher included the time-line to demonstrate when each of these traditions established
themselves in Bechuanaland/Botswana. However, it might be very difficult to indicate this with regards
to Botswana‟s African Religious Traditions; it is for this reason that pre-1800s was considered an
appropriate time-frame.
Published in
The Population Studies Working Papers (University of Botswana):
Volume 3 pp.41-75, 2002
Haron 2003 9
5,000
3,000
2,000
1,500
1440
B = 39%
M = 23%
H = 15%
Bu = 12%
S = 11%
S = 11%
Bu = 12%
H = 15%
M = 23%
B = 39%
The numerical order clearly shows that by 1994 the Bahai Faith was, amongst the
minority religious traditions, the leader in this pact. However, when shifting sights to
Melton‟s table below, a few discrepancies appear.
Melton Table11
: 2002
RELIGIOUS
TRADITIONS
NUMBERS PERCENTAGE Rate Projections 2025
Christianity
Independent
Protestant
Roman Catholic
972,000
498,000
178,000
60,000
59,9
30,7
11,0
3.7
3.12
3.90
1.97
2.30
1,488,000
780,000
250,000
115,000
Ethnoreligionists
629,000 38,8
1.43 714,000
Bahaism
12,000 0,8 2,82 22,000
Islam
3,300 0.2 3,56 6,000
Hindus
2,200 0.1 3,75 5,000
Jews
340 0.0 3.03 400
Sikhism 200 0.0 2,60 400
Non-religious 2,300 0.1 4,98 5,000
1,622,000 100 2.43 2,242,000
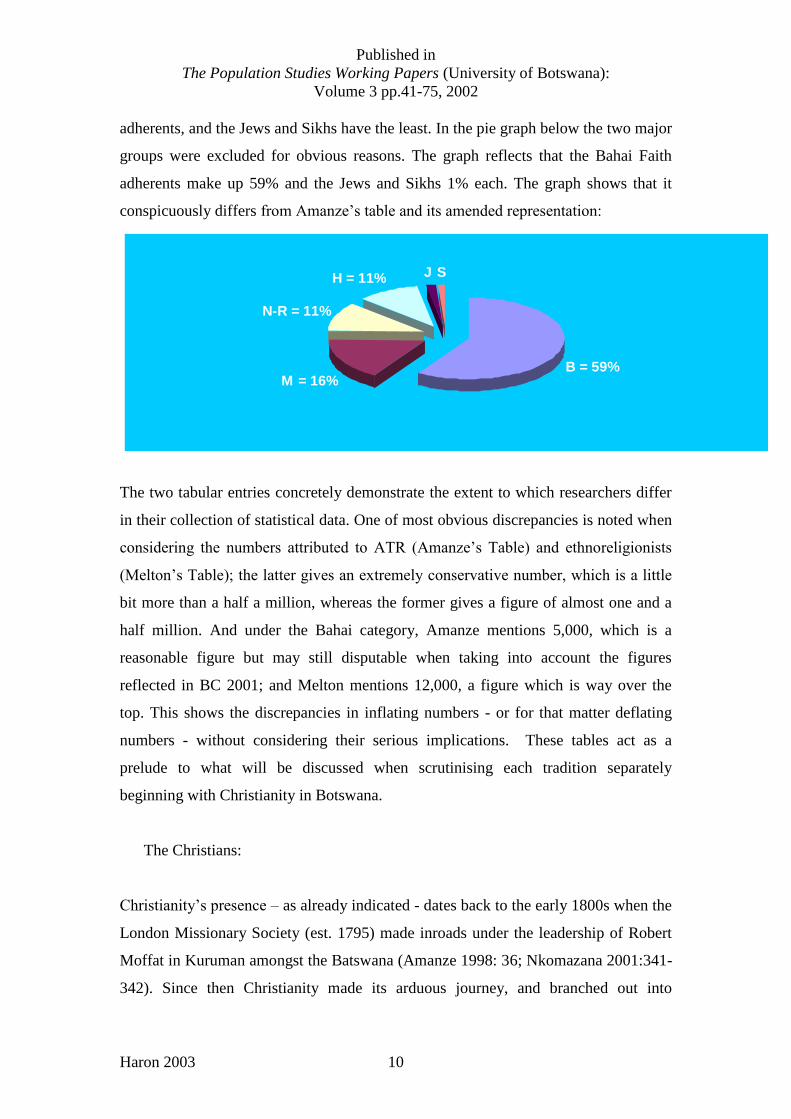
The above table identified seven religions traditions and included those who identified
themselves as non-religious. The Christians and Ethnoreligionists have the most
11
In this table the statisticians chose to refer to ATR as ethnoreligions, which they defined as followers
of local, tribal or shaministic practices. They also included a category „non-religious,‟ which coincides
with a category also included in BC 2001.
Published in
The Population Studies Working Papers (University of Botswana):
Volume 3 pp.41-75, 2002
Haron 2003 10
adherents, and the Jews and Sikhs have the least. In the pie graph below the two major
groups were excluded for obvious reasons. The graph reflects that the Bahai Faith
adherents make up 59% and the Jews and Sikhs 1% each. The graph shows that it
conspicuously differs from Amanze‟s table and its amended representation:
B = 59%M = 16%
N-R = 11%
H = 11% J S
The two tabular entries concretely demonstrate the extent to which researchers differ
in their collection of statistical data. One of most obvious discrepancies is noted when
considering the numbers attributed to ATR (Amanze‟s Table) and ethnoreligionists
(Melton‟s Table); the latter gives an extremely conservative number, which is a little
bit more than a half a million, whereas the former gives a figure of almost one and a
half million. And under the Bahai category, Amanze mentions 5,000, which is a
reasonable figure but may still disputable when taking into account the figures
reflected in BC 2001; and Melton mentions 12,000, a figure which is way over the
top. This shows the discrepancies in inflating numbers - or for that matter deflating
numbers - without considering their serious implications. These tables act as a
prelude to what will be discussed when scrutinising each tradition separately
beginning with Christianity in Botswana.
The Christians:
Christianity‟s presence – as already indicated - dates back to the early 1800s when the
London Missionary Society (est. 1795) made inroads under the leadership of Robert
Moffat in Kuruman amongst the Batswana (Amanze 1998: 36; Nkomazana 2001:341-
342). Since then Christianity made its arduous journey, and branched out into
Published in
The Population Studies Working Papers (University of Botswana):
Volume 3 pp.41-75, 2002
Haron 2003 11
numerous branches and denominations; at the head of the denominations was the
Methodist Church that rooted itself between 1836 and 1840, followed later by the
Dutch Reform in 1857, the Lutherans in 1857, the Roman Catholics in 1895, the
Anglicans in 1908 and the Seventh-Days Adventists in 1921. Other denominations
such as the Pentecostal and African Independent Churches also made their way into
the religious market. Amanze‟s BHC (1994) not only gives an overview of the variety
of churches that have mushroomed in different parts of Botswana over the many
decades but also indicates their general location, their membership figures and other
invaluable data that were not recorded before. The membership figures, which
Amanze included under most of the entries, are extremely valuable in that it grants
one the opportunity to compare them with those hauled in by the survey.
A glance at Table 1 below immediately begs the question: What are the various
affiliations of the Christians? In other words, to which denominations do the more
than 100,000 Batswana Christians belong? Who from amongst them are Methodists?
How many of them are Roman Catholics? The absence of the list of denominations as
a sub-heading is one of the drawbacks of this survey. Tabulating Church affiliations
are an invaluable source of information for the statisticians, religionists and, of
course, the politicians. Since the number game can be a contentious issue, it becomes
crucial to have a more-or-less accurate figure at hand to know numerical strengths and
weaknesses. The Roman Catholics might argue that they are numerically stronger
than the Apostolic Church in the country; and for them to justify this they need near
accurate statistics to prove this. But despite the absence of these numbers, the
researcher can at least in the interim period go back to Amanze‟s BHC (1994), which
have – as already stated – most of the membership figures of the different
denominations in it; he mentioned that he collected the data from the secretaries of the
churches and those who were in the leadership of the other religious traditions.
The other issue that may also be raised is to ask the following: what percentage of the
Christian community is immigrant or economic migrant Christians and how many
from amongst the fluctuating numbers of refugees are Christians. No clarity can be
gained from the stats as it appears in BC 2001. In addition, it is difficult to argue - as
Ntloedibe-Kuswane (2003) did – along the lines that those non-residents and
Published in
The Population Studies Working Papers (University of Botswana):
Volume 3 pp.41-75, 2002
Haron 2003 12
respondents who did not complete the form regarding their affiliation are adherents of
Christianity; it should be borne in mind that the country brought in a sizeable number
of skilled labourers12
from regions such as Eastern Europe where atheism was
rampant and viewed as a national „belief‟ system or as in the case of Asia where
Confucianism, Taoism and Buddhism were and remain the dominant religious
traditions, and this meant that their belief systems have not been recorded as part of
the religious minority traditions alongside Islam, Hinduism and Bahaism.
In fact, when scanning the South Asian continent it will be observed that Hinduism,
Islam and Christianity are not the only traditions on that continent; Sikhs and Parsis, a
branch of Zoroastrianism, also form part of that continent‟s minority traditions. And
as far as one could assess, there are a few Sikh families that are in Botswana; their
history goes back to more than 20 years in Botswana and about 15 years ago – 1989
to be exact - they built their own place of worship. The mere fact that they were able
to build a place of worship clearly supports the notion that they have grown steadily
and presently constitute a few hundred. But whether their numbers are as much as
1,440 as Amanze claims or as small as 200 as Melton states remain conjecture for the
time being; in fact, it should not be difficult to gauge from the Sikh community what
the actual tally is.
Returning to Christianity, the census categorically proves that it is the dominant
religion even though the government chose not to describe itself as a Christian
country. This is supported by the Educational Policy adopted by the Department of
Education, which has encouraged the implementation of a faith based educational
programme instead of a predominantly Christian based one; in any case, this issue is
being debated by the Christian communities since some of them argue that there is no
need to expose the Batswana to other religious traditions when the majority are in fact
Christians.
12
It is important for the census to not only look at „internal migration‟ of its population but also at
external migration from and immigration to the country. These statistics will assist in clearing the
speculations that exist with regards to immigration patterns. After all religion forms an integral part of
these immigration patterns.
Published in
The Population Studies Working Papers (University of Botswana):
Volume 3 pp.41-75, 2002
Haron 2003 13
In this regard, the observations of Nkomazana (2001: 341) must be brought into
purview. He argued that percentage wise the Christians are much less than those who
are Badimo or what he prefers to call „Traditional Indigenous Religion;‟ he allocates
65% to the latter and 33,95% to the former. The issue at hand is that the Batswana
identity seems to be fluid when it comes to Christianity and ATR; there exists a
marriage of convenience to the extent that individuals belong to both the Church and
the ATR at the same time; and because of this situation the figures fluctuate
dramatically between the two categories. When comparing Amanze/Nkomazana‟
percentage allocation to the statistics revealed in BC 2001, a major question is raised
as regards the reliability of the information pertaining to the religious affiliation
between the two groups, and this also brings into question the methods that were used
to arrive at the numbers and percentages. This unfortunately will remain debatable
amongst the theologians, religionists and the statisticians for the foreseeable future.
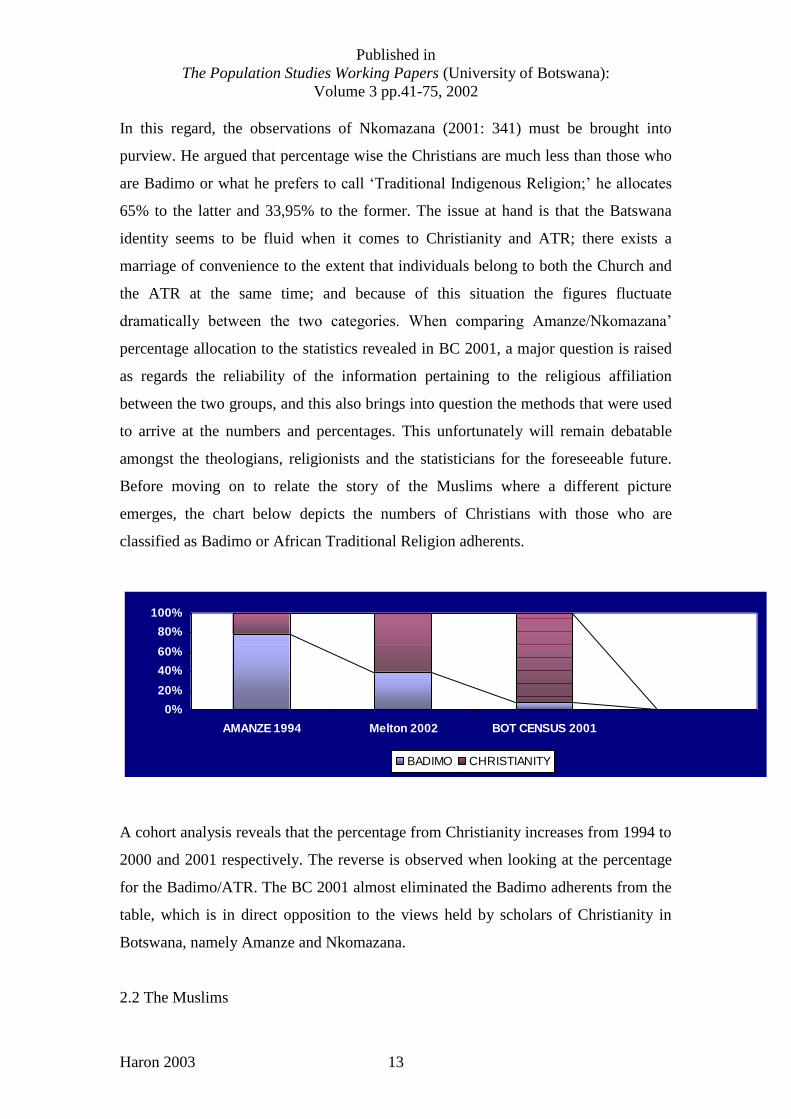
Before moving on to relate the story of the Muslims where a different picture
emerges, the chart below depicts the numbers of Christians with those who are
classified as Badimo or African Traditional Religion adherents.
0%
20%
40%
60%
80%
100%
AMANZE 1994 Melton 2002 BOT CENSUS 2001
BADIMO CHRISTIANITY
A cohort analysis reveals that the percentage from Christianity increases from 1994 to
2000 and 2001 respectively. The reverse is observed when looking at the percentage
for the Badimo/ATR. The BC 2001 almost eliminated the Badimo adherents from the
table, which is in direct opposition to the views held by scholars of Christianity in
Botswana, namely Amanze and Nkomazana.
2.2 The Muslims
Published in
The Population Studies Working Papers (University of Botswana):
Volume 3 pp.41-75, 2002
Haron 2003 14
Amanze (1998: x), who did not confine himself to the study of African Christianity in
Botswana but also to the study of Islam in Botswana, 1882-1995, stated that the 1991
census reflected that the Muslims numbered 3,848; a steady increase compared to the
previous years. And in a later publication Amanze (2000: 41) showed that the number
of Muslims steadily decreased to 3,628. But before these publications appeared he
pegged their numbers at 3,000 (cf. Amanze 1994: 156). If these figures are placed in a
chronological order and within their specific time frames as follows: 3,000 (1994),
3,628 (1996)13
and 3,848 (1998), it is noted that there was a steady increase. Amanze
did not comment on the steady growth nor did he give an account for the reasons for
this slow, steady annual increase. Nkomazana (2001: 341), however, seems to have
concurred with the latter figures and thus made no amendments.
Be that as it may, since that time there has been a gradual increase; the number stands
at a little more than 5,000 at present according to the 2001 census. Members of
Botswana Muslim Association‟s executive dispute these figures14
. According to their
calculations partially based upon a survey conducted in 200215
, the numbers are
beyond 7,000 and more towards 10,000. One of their supporting arguments is that
there has been an influx of expatriates from South Asia (Pakistan, India, Bangladesh
and Sri Lanka), East & Southern Africa (Somalia, Kenya, Tanzania, Rwanda,
Burundi, Uganda, Malawi and Mozambique, Zimbabwe and, of course, South Africa);
small numbers of Arabs have also trickled in from Egypt and its sister states. And it is
an established fact that because of the close proximity between Zimbabwe and South
Africa, there has always been a continuous in-and-out flow of Muslim traffic; these
are attributed to the strong familial and commercial ties between the Botswana based
13
Even though this publication of Amanze was completed by 1996/1997, it only appeared in 2000 after
he was requested to bring about some changes by the editors of the series.
14
According to the Islam in Africa Project, which is an NGO group based in Durban under the
leadership of Mr. Muhammad Amra, they reached an outrageous figure of about 23,200. This was
according to their 2001 publication. How they reached this figure is hard to tell; it is however assumed
that this assessment was reached when one of the IAP representatives visited in late 2000.
15
Dr. Mukram Sheikh edited Botswana Muslim Directory 2002. Dr. Sheikh apparently also did a
statistical survey but did not include the information in the firectory since it only listed the names and
addresses of the businesses concerned.
Published in
The Population Studies Working Papers (University of Botswana):
Volume 3 pp.41-75, 2002
Haron 2003 15
Muslims and their co-religionists in the two neighbouring states. The standard reasons
of procreation and conversion appear to have played less of a role in the Muslims‟
numerical increase. And as a result of this inflow of immigrants there was a demand
for another place of worship because the central mosque as well as the small Shah
Khaled mosque could not accommodate the increasing numbers. In August 2003 the
new unnamed mosque was completed in Gaborone West, and has taken that extra-
load, which was carried by the central mosque in the past.
The mix of religio-ethnic groups has created a vibrant and diverse Muslim
community; most of these groups usually follow their motherland traditions and thus
cause them to remain in close contact with their specific linguistic and ethnic groups.
For example, the Kiswahili speakers would normally huddle together at the mosque
before or after the performance of their daily ritual prayers, and the same can be said
for those speaking the different South Asian official languages and diverse dialects.
The tables that follow are based upon the information gathered during the 2001
census survey; it is clear from the first table that the numbers of the Muslims are
pretty small when comparing it to the Hindus who, at one stage, numbered less than
20 in the mid 1980s.
The table seems to reflect that the community did not expand numerically over the
past 10 years; if the figures16
recorded by Amanze are more-or-less accurate, then
there has been no significant increase since that time; the 2001 stats reveal that the
growth rate between 1991 and 2001 was indeed marginal, and thus does not leave
much room for a detailed analysis. However, despite the unsatisfactory statistics, it
might be possible to obtain accurate figures if the small Muslim community do a
survey for themselves, and compare theirs to the census figures; something like this
was apparently done during the course of 2002 when they compiled a register of
Muslim individuals and companies in Botswana. Whilst this might appear to be a
sound solution to the problem, it in fact may exacerbate it. Instead of offering a way
out of the statistical impasse, it might create more of a statistical problem. A
conclusion on this issue had been reached by Samia El-Badrey, an Arab-American
16
That is the 3,000 in 1991.
Published in
The Population Studies Working Papers (University of Botswana):
Volume 3 pp.41-75, 2002
Haron 2003 16
demographer, who made the point that the data of the group doing the survey “tend to
be higher than reality because the sources want to make sure that their numbers are
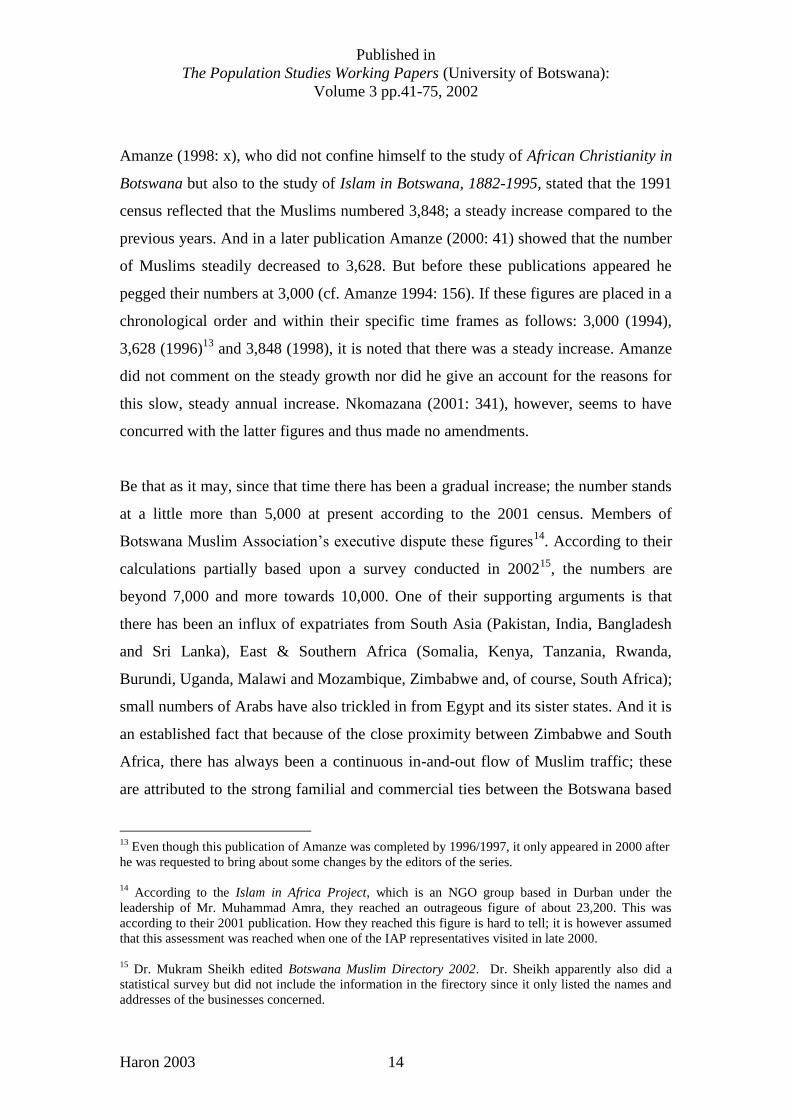
high” (quoted by Daniel Pipes 2001). It might be appropriate to make use of the
periodical growth of Muslims as reflected in Amanze‟s table (2000: 41) with the
added BC 2001 figure factorised in:
1
10
100
1000
10000
1911
1936
1956
1978
2001
Muslims
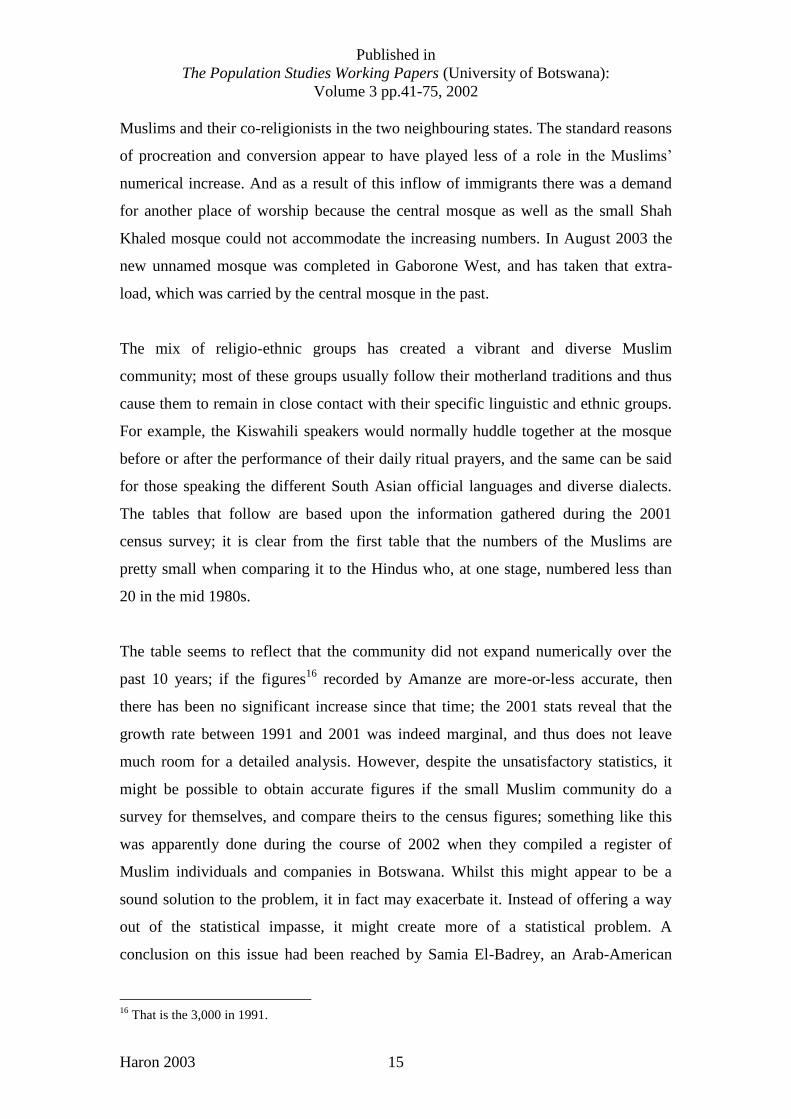
The figure below reflects a comparative view between the 1991 census as recorded by
Amanze and BC 2001 of Muslims residing in the major cities; when taken together,
their numbers add up to over 50% of the total Botswana Muslim population. Out of
the total of 5,036, these cities contain 2,673 Muslims. It clearly illustrates that since
the early 1990s the Gaborone Muslims‟ numbers dropped by 579 as compared to the
numbers presented by the BC 2001 survey. The opposite is observed when viewing
the statistics for Francistown and Lobatse respectively; in the case of the former the
increase was over 200% whilst in Lobatse by 37%.
0
500
1000
1500
2000
2500
3000
Amanze BOT
CENSUS
Gaborone
Francistown
Lobatse
2.3 The Hindus
Published in
The Population Studies Working Papers (University of Botswana):
Volume 3 pp.41-75, 2002
Haron 2003 17
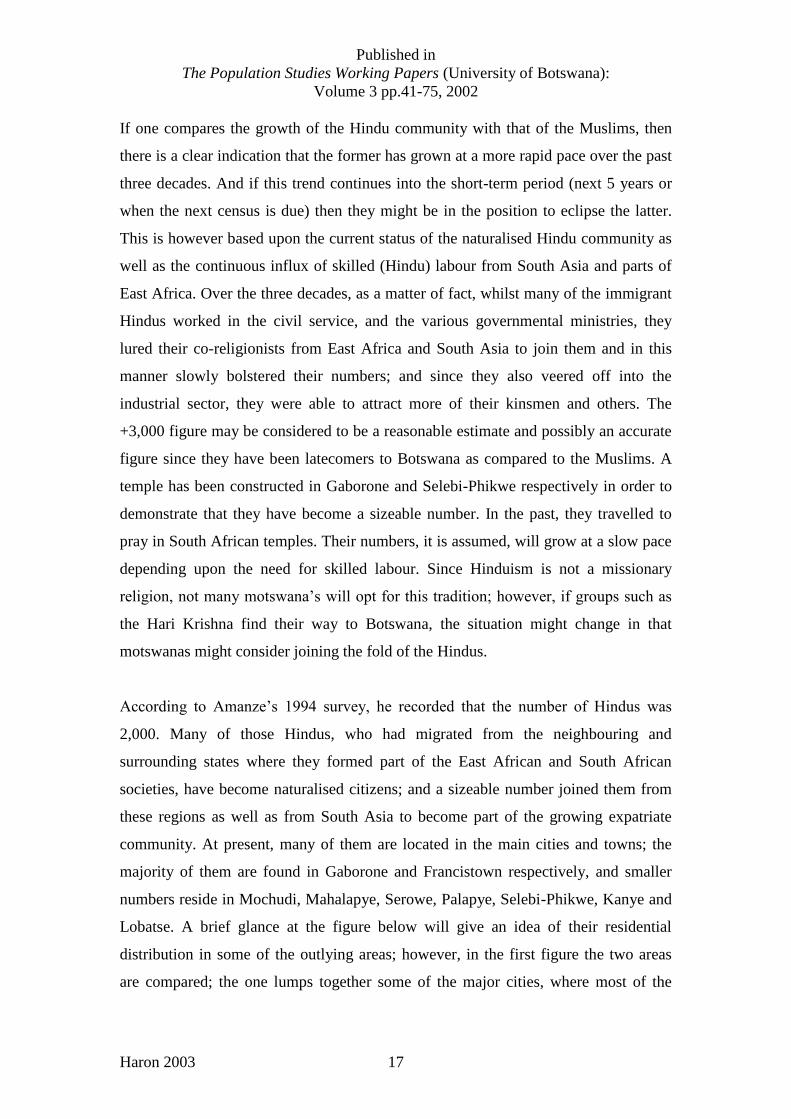
If one compares the growth of the Hindu community with that of the Muslims, then
there is a clear indication that the former has grown at a more rapid pace over the past
three decades. And if this trend continues into the short-term period (next 5 years or
when the next census is due) then they might be in the position to eclipse the latter.
This is however based upon the current status of the naturalised Hindu community as
well as the continuous influx of skilled (Hindu) labour from South Asia and parts of
East Africa. Over the three decades, as a matter of fact, whilst many of the immigrant
Hindus worked in the civil service, and the various governmental ministries, they
lured their co-religionists from East Africa and South Asia to join them and in this
manner slowly bolstered their numbers; and since they also veered off into the
industrial sector, they were able to attract more of their kinsmen and others. The
+3,000 figure may be considered to be a reasonable estimate and possibly an accurate
figure since they have been latecomers to Botswana as compared to the Muslims. A
temple has been constructed in Gaborone and Selebi-Phikwe respectively in order to
demonstrate that they have become a sizeable number. In the past, they travelled to
pray in South African temples. Their numbers, it is assumed, will grow at a slow pace
depending upon the need for skilled labour. Since Hinduism is not a missionary
religion, not many motswana‟s will opt for this tradition; however, if groups such as
the Hari Krishna find their way to Botswana, the situation might change in that
motswanas might consider joining the fold of the Hindus.
According to Amanze‟s 1994 survey, he recorded that the number of Hindus was
2,000. Many of those Hindus, who had migrated from the neighbouring and
surrounding states where they formed part of the East African and South African
societies, have become naturalised citizens; and a sizeable number joined them from
these regions as well as from South Asia to become part of the growing expatriate
community. At present, many of them are located in the main cities and towns; the
majority of them are found in Gaborone and Francistown respectively, and smaller
numbers reside in Mochudi, Mahalapye, Serowe, Palapye, Selebi-Phikwe, Kanye and
Lobatse. A brief glance at the figure below will give an idea of their residential
distribution in some of the outlying areas; however, in the first figure the two areas
are compared; the one lumps together some of the major cities, where most of the
Published in
The Population Studies Working Papers (University of Botswana):
Volume 3 pp.41-75, 2002
Haron 2003 18
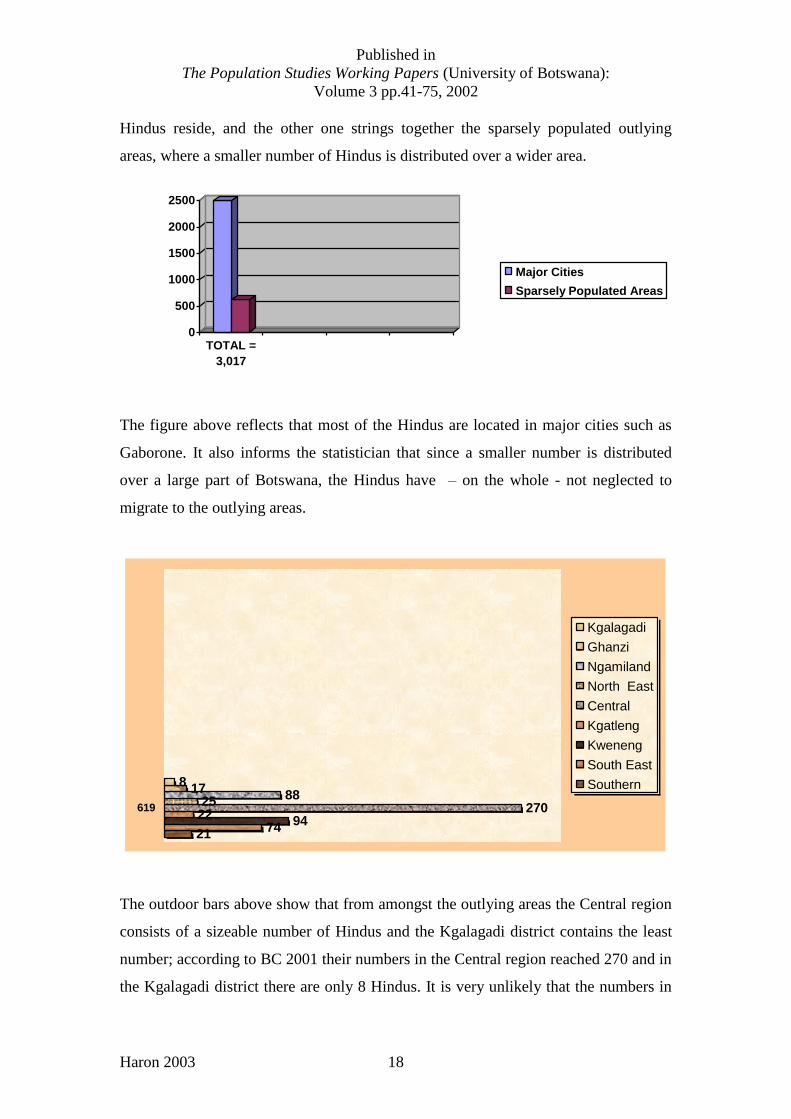
Hindus reside, and the other one strings together the sparsely populated outlying
areas, where a smaller number of Hindus is distributed over a wider area.
0
500
1000
1500
2000
2500
TOTAL =
3,017
Major Cities
Sparsely Populated Areas
The figure above reflects that most of the Hindus are located in major cities such as
Gaborone. It also informs the statistician that since a smaller number is distributed
over a large part of Botswana, the Hindus have – on the whole - not neglected to
migrate to the outlying areas.
2174
9422
27025
888
17
619
Kgalagadi
Ghanzi
Ngamiland
North East
Central
Kgatleng
Kweneng
South East
Southern
The outdoor bars above show that from amongst the outlying areas the Central region
consists of a sizeable number of Hindus and the Kgalagadi district contains the least
number; according to BC 2001 their numbers in the Central region reached 270 and in
the Kgalagadi district there are only 8 Hindus. It is very unlikely that the numbers in
Published in
The Population Studies Working Papers (University of Botswana):
Volume 3 pp.41-75, 2002
Haron 2003 19
these sparsely populated areas will increase by a large margin by the year 2016;
however, this would change, if – for some reason - the economic status of these areas
becomes more attractive in the near future. Moreover a religious group that made their
mark in the rural areas are the adherents of the Bahai Faith; the focus now turns to
them.
2.4 The Bahais17
One of the emerging religious traditions in Botswana is the Bahai Faith. The tradition
has been expanding rapidly in both the urban and rural sectors respectively. The
reason behind this expansion is because the Bahai faith followed the two major
religions, namely Christianity and Islam, in being a proselytising faith. Since they
have entered with this objective in mind, they have been active in sharing their skills
with the locals and in the process strove hard to attract Batswana to their faith. The
success rate is phenomenal, if this is based upon the figures provided by both Amanze
and Melton. And if the latter‟s table is taken seriously then its extraordinary
phenomenal; however, Melton‟s figures are highly questionable. In fact, Table 2
below clearly indicates that its adherents are not only located in the capital city but
has also in the outlying towns and villages; this is all in accordance with the One
World philosophy that they have been preaching over the many years that they have
settled in Botswana. Early in 2003 a new Bahai centre was constructed to reflect their
growth rate and the continuous interest by the motswana youth, who have become
disillusioned with the other major religious traditions in the country, and who have
been seeking alternatives to bring spiritual stability into their selves and their homes.
17
The growth of this faith is inextricably tied to its growth in South Africa. Visit its site:
www.bahai.org.za which describes its history and makes brief reference to Botswana.
Published in
The Population Studies Working Papers (University of Botswana):
Volume 3 pp.41-75, 2002
Haron 2003 20
0
2,000
4,000
6,000
8,000
10,000
12,000
14,000
0
200
400
600
800
Melton 2002
Amanze 1994
BC 2001
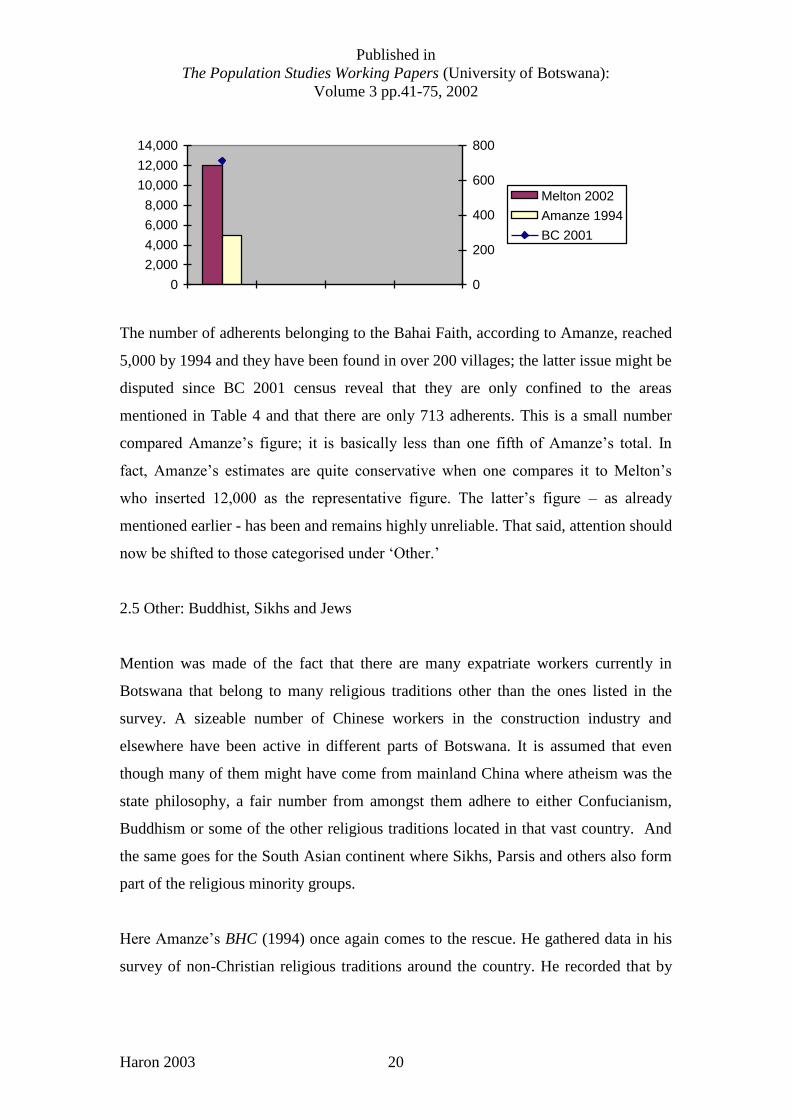
The number of adherents belonging to the Bahai Faith, according to Amanze, reached
5,000 by 1994 and they have been found in over 200 villages; the latter issue might be
disputed since BC 2001 census reveal that they are only confined to the areas
mentioned in Table 4 and that there are only 713 adherents. This is a small number
compared Amanze‟s figure; it is basically less than one fifth of Amanze‟s total. In
fact, Amanze‟s estimates are quite conservative when one compares it to Melton‟s
who inserted 12,000 as the representative figure. The latter‟s figure – as already
mentioned earlier - has been and remains highly unreliable. That said, attention should
now be shifted to those categorised under „Other.‟
2.5 Other: Buddhist, Sikhs and Jews
Mention was made of the fact that there are many expatriate workers currently in
Botswana that belong to many religious traditions other than the ones listed in the
survey. A sizeable number of Chinese workers in the construction industry and
elsewhere have been active in different parts of Botswana. It is assumed that even
though many of them might have come from mainland China where atheism was the
state philosophy, a fair number from amongst them adhere to either Confucianism,
Buddhism or some of the other religious traditions located in that vast country. And
the same goes for the South Asian continent where Sikhs, Parsis and others also form
part of the religious minority groups.
Here Amanze‟s BHC (1994) once again comes to the rescue. He gathered data in his
survey of non-Christian religious traditions around the country. He recorded that by
Published in
The Population Studies Working Papers (University of Botswana):
Volume 3 pp.41-75, 2002
Haron 2003 21
1994 the Buddhist community only had 1,50018
and were found in the two main cities,
namely Gaborone and Francistown, as well as the two principal towns of Lobatse and
Kanye respectively. The Buddhist referred to in Amanze‟s book are however from Sri
Lanka and not from India or China. And since, it is assumed that these are expatriate
groups, the numbers might have increased since then, and the community might have
spread to other towns that required their skills. The other minority religious tradition
is that of the Sikhs. The Sikh community immigrated to Botswana in the 1970s, and
have settled in the main cities and towns; they are found in Gaborone, Francistown,
Lobatse, Molepolole and Selebi-Phikwe, and built their place of worship in 1989 in
Gaborone.
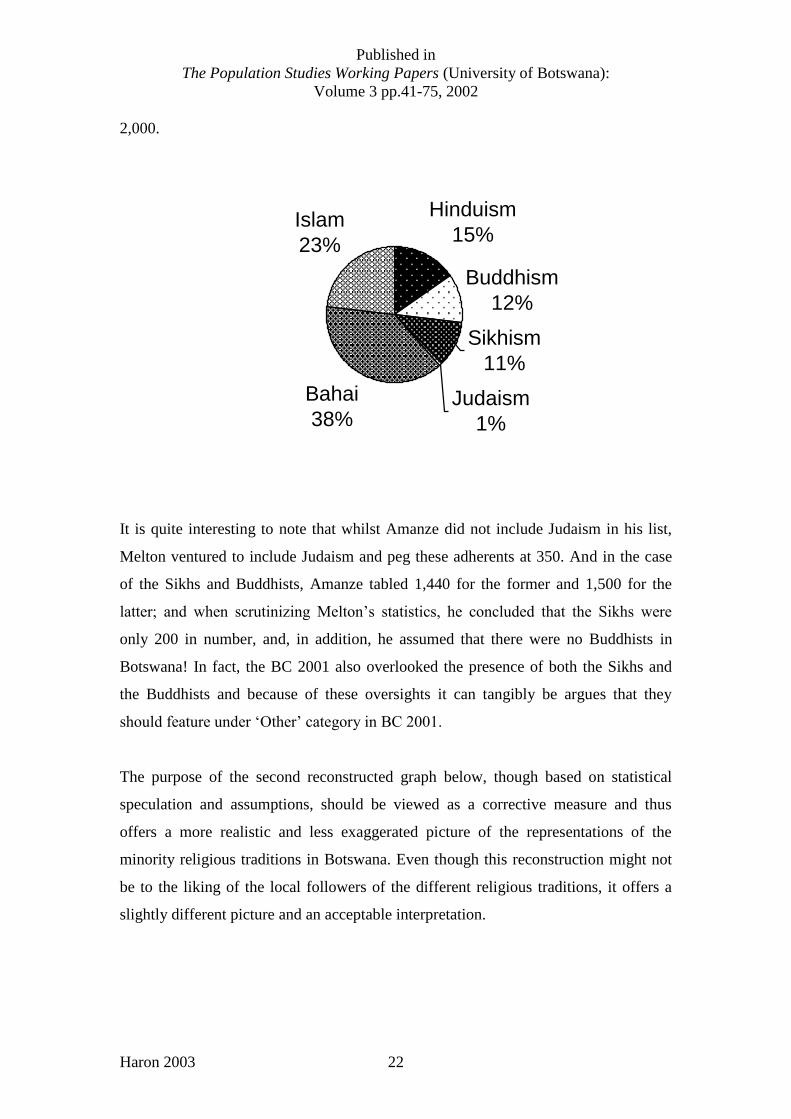
Below the first pie graph includes all the minor religious traditions listed in Amanze
and Melton‟s tables. An observation was already made of the fact that Melton‟s
statistics have exaggerated the figures pertaining to the Bahai Faith adherents;
particularly when it is compared to Amanze and the BC 2001 tables. The first pie
graph below consciously demonstrates this distortion. When working out a mean
between the two tabled figures of Melton and Amanze respectively and accommodate
the BC 2001 figure of 713, then the actual figure might hover between 1,000 and
18
In his text the number reflects as 150 and not as 1,500; the latter appears in his table, however. The
same goes for the Sikh entry where the actual number 1,440 and not 140.
Published in
The Population Studies Working Papers (University of Botswana):
Volume 3 pp.41-75, 2002
Haron 2003 22
2,000.
Hinduism
15%
Buddhism
12%
Sikhism
11%
Judaism
1%
Bahai
38%
Islam
23%
It is quite interesting to note that whilst Amanze did not include Judaism in his list,
Melton ventured to include Judaism and peg these adherents at 350. And in the case
of the Sikhs and Buddhists, Amanze tabled 1,440 for the former and 1,500 for the
latter; and when scrutinizing Melton‟s statistics, he concluded that the Sikhs were
only 200 in number, and, in addition, he assumed that there were no Buddhists in
Botswana! In fact, the BC 2001 also overlooked the presence of both the Sikhs and
the Buddhists and because of these oversights it can tangibly be argues that they
should feature under „Other‟ category in BC 2001.
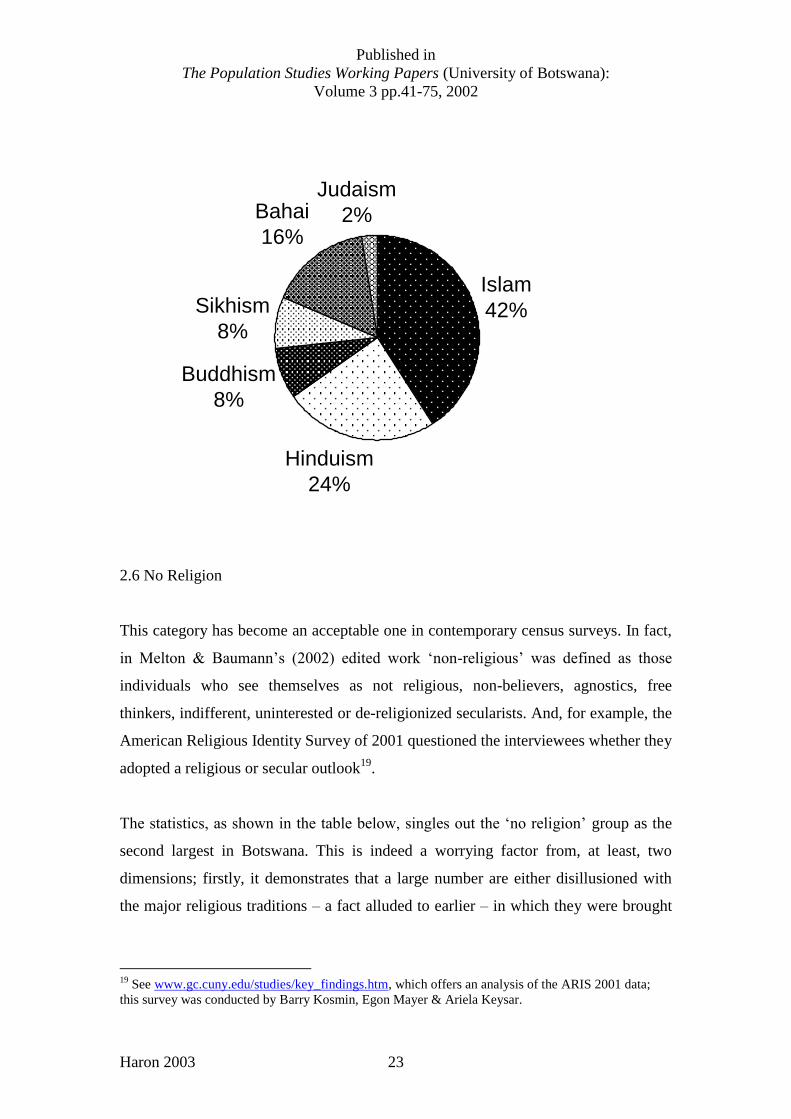
The purpose of the second reconstructed graph below, though based on statistical
speculation and assumptions, should be viewed as a corrective measure and thus
offers a more realistic and less exaggerated picture of the representations of the
minority religious traditions in Botswana. Even though this reconstruction might not
be to the liking of the local followers of the different religious traditions, it offers a
slightly different picture and an acceptable interpretation.
Published in
The Population Studies Working Papers (University of Botswana):
Volume 3 pp.41-75, 2002
Haron 2003 23
Islam
42%
Hinduism
24%
Buddhism
8%
Sikhism
8%
Bahai
16%
Judaism
2%
2.6 No Religion
This category has become an acceptable one in contemporary census surveys. In fact,
in Melton & Baumann‟s (2002) edited work „non-religious‟ was defined as those
individuals who see themselves as not religious, non-believers, agnostics, free
thinkers, indifferent, uninterested or de-religionized secularists. And, for example, the
American Religious Identity Survey of 2001 questioned the interviewees whether they
adopted a religious or secular outlook19
.
The statistics, as shown in the table below, singles out the „no religion‟ group as the
second largest in Botswana. This is indeed a worrying factor from, at least, two
dimensions; firstly, it demonstrates that a large number are either disillusioned with
the major religious traditions – a fact alluded to earlier – in which they were brought
19
See www.gc.cuny.edu/studies/key_findings.htm, which offers an analysis of the ARIS 2001 data;
this survey was conducted by Barry Kosmin, Egon Mayer & Ariela Keysar.
Published in
The Population Studies Working Papers (University of Botswana):
Volume 3 pp.41-75, 2002
Haron 2003 24
up or basically confused as regards, which religion to ultimately to choose20
, and
secondly, it does impact upon the future state of religion in the country. A cohort
analysis shows that the age groups ranging from 15 to 29, who have firmly identified
themselves in this category, collectively tally more than 100,000. And in a sense
might tentatively be described as rudderless since they in a transitory phase in which
they are floating from one religious tradition to another with the hope of eventually
finding a secure spiritual home. Snap surveys amongst the university student
population will readily reflect the degree of disillusionment that pervades the young
adolescent communities. However, it is not correct to say, as Ms. Ntloedibe-Kuswane
avers in her assessment of the survey, that all of them were and are in effect
Christians. The problems with this assumption is that they might have grown up in a
specific Christian denomination but have abandoned their denominational beliefs at
quite an early period in their lives. And their departure from these denominations
clearly indicates that individuals in the mentioned age categories have had genuine
problems with the beliefs and practices of their specific religious traditions, or
experienced social problems that their respective communities were unable to resolve.
The alternative left for them was to seek solace outside their religious traditions; one
such alternative was to opt for one of the minority religious traditions and the others
was to adopt a secularist approach without abandoning their quest for spirituality.
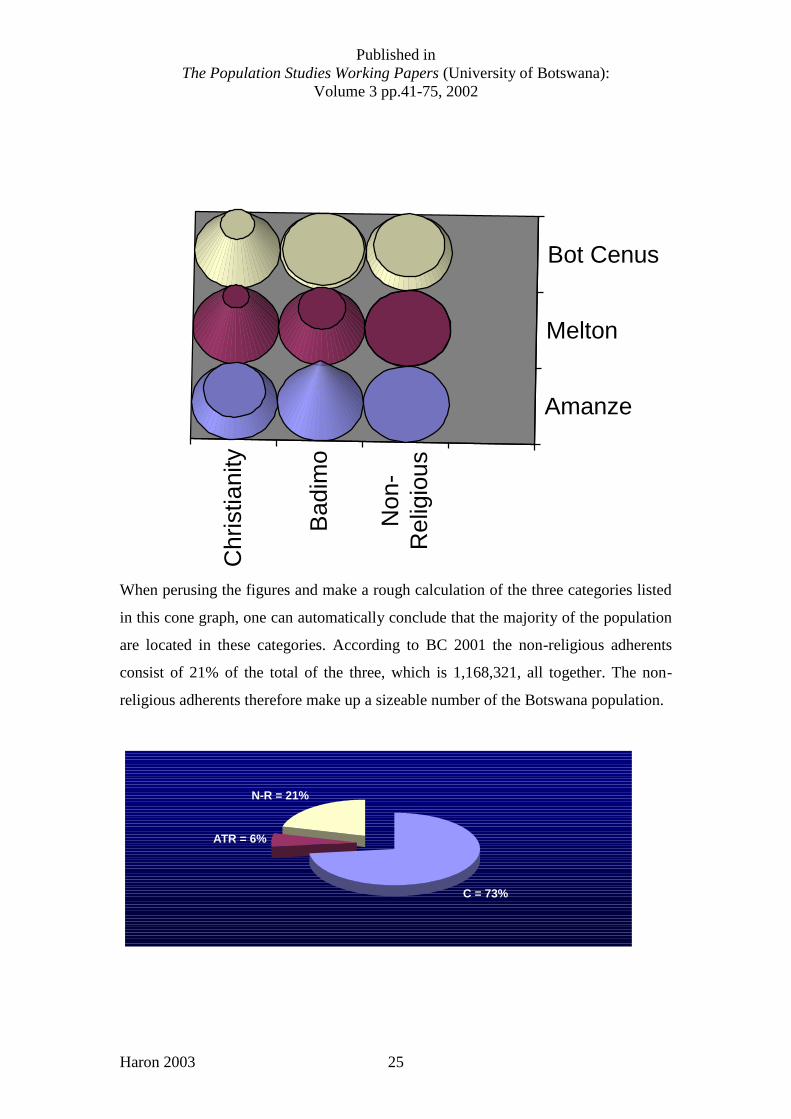
The cone shaped graph below captures the tables of Amanze and Melton as well as
BC 2001. When revisiting Amanze‟s table, it was observed that he did not
accommodate those who chose not to be identified with religion. Melton, being
located within the USA scene, has been aware of the fact that there has been an
increasing number of individuals who have been identifying themselves with the „no
religions‟ category. And it appears that the CSO enumerators were aware of this trend
and thus included it as one of the many options for the respondents.
20
It is an accepted fact that whilst they might not identify with a specific religious tradition, they are
not agnostics or atheists according to the earlier mentioned definition; they would describe themselves
as religious or are conscious of religion. Bouma & Hughes (1998) make the point that their association
with non-religious traditions “does not necessarily indicate a lack of interest in spirituality,” and that
added that complementing surveys affirmed that they continue to express their beliefs in God, albeit in
a very personal and private way.
Published in
The Population Studies Working Papers (University of Botswana):
Volume 3 pp.41-75, 2002
Haron 2003 25
Christianity
Bad
imo
Non-
Relig
iou
sAmanze
Melton
Bot Cenus
When perusing the figures and make a rough calculation of the three categories listed
in this cone graph, one can automatically conclude that the majority of the population
are located in these categories. According to BC 2001 the non-religious adherents
consist of 21% of the total of the three, which is 1,168,321, all together. The non-
religious adherents therefore make up a sizeable number of the Botswana population.
C = 73%
ATR = 6%
N-R = 21%
Published in
The Population Studies Working Papers (University of Botswana):
Volume 3 pp.41-75, 2002
Haron 2003 26
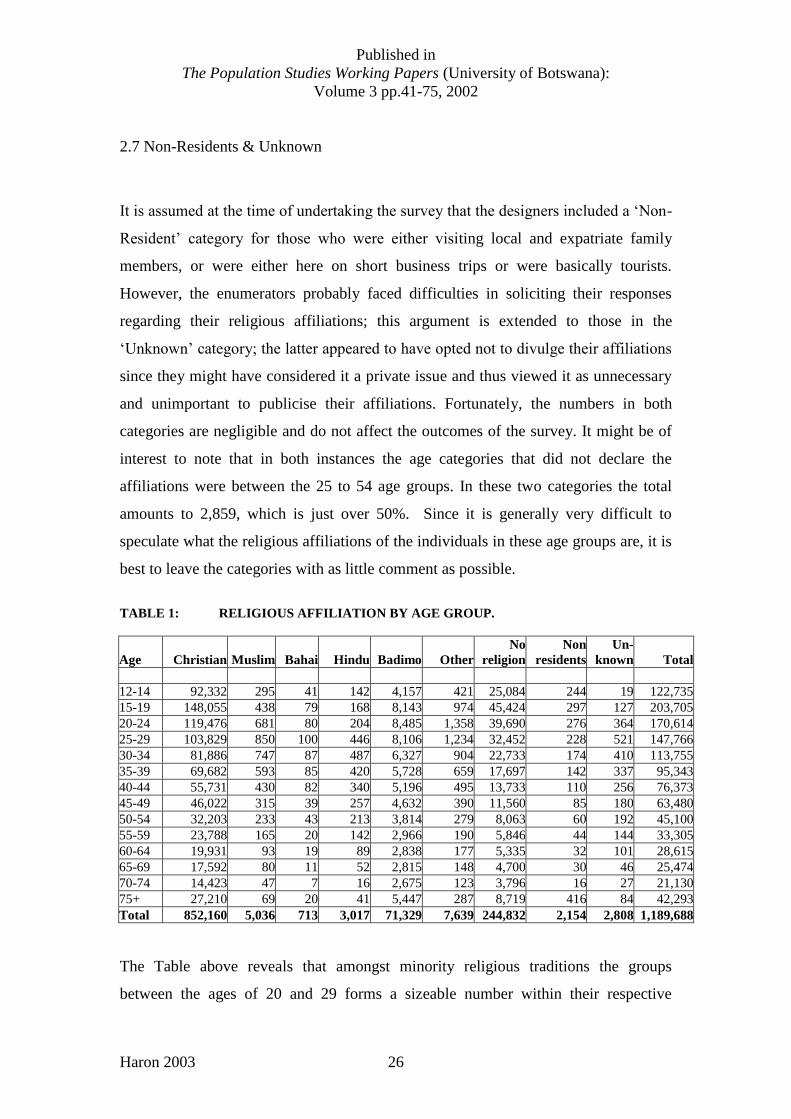
2.7 Non-Residents & Unknown
It is assumed at the time of undertaking the survey that the designers included a „Non-
Resident‟ category for those who were either visiting local and expatriate family
members, or were either here on short business trips or were basically tourists.
However, the enumerators probably faced difficulties in soliciting their responses
regarding their religious affiliations; this argument is extended to those in the
„Unknown‟ category; the latter appeared to have opted not to divulge their affiliations
since they might have considered it a private issue and thus viewed it as unnecessary
and unimportant to publicise their affiliations. Fortunately, the numbers in both
categories are negligible and do not affect the outcomes of the survey. It might be of
interest to note that in both instances the age categories that did not declare the
affiliations were between the 25 to 54 age groups. In these two categories the total
amounts to 2,859, which is just over 50%. Since it is generally very difficult to
speculate what the religious affiliations of the individuals in these age groups are, it is
best to leave the categories with as little comment as possible.
TABLE 1: RELIGIOUS AFFILIATION BY AGE GROUP.
Age Christian Muslim Bahai Hindu Badimo Other
No
religion
Non
residents
Un-
known Total
12-14 92,332 295 41 142 4,157 421 25,084 244 19 122,735
15-19 148,055 438 79 168 8,143 974 45,424 297 127 203,705
20-24 119,476 681 80 204 8,485 1,358 39,690 276 364 170,614
25-29 103,829 850 100 446 8,106 1,234 32,452 228 521 147,766
30-34 81,886 747 87 487 6,327 904 22,733 174 410 113,755
35-39 69,682 593 85 420 5,728 659 17,697 142 337 95,343
40-44 55,731 430 82 340 5,196 495 13,733 110 256 76,373
45-49 46,022 315 39 257 4,632 390 11,560 85 180 63,480
50-54 32,203 233 43 213 3,814 279 8,063 60 192 45,100
55-59 23,788 165 20 142 2,966 190 5,846 44 144 33,305
60-64 19,931 93 19 89 2,838 177 5,335 32 101 28,615
65-69 17,592 80 11 52 2,815 148 4,700 30 46 25,474
70-74 14,423 47 7 16 2,675 123 3,796 16 27 21,130
75+ 27,210 69 20 41 5,447 287 8,719 416 84 42,293
Total 852,160 5,036 713 3,017 71,329 7,639 244,832 2,154 2,808 1,189,688
The Table above reveals that amongst minority religious traditions the groups
between the ages of 20 and 29 forms a sizeable number within their respective
Published in
The Population Studies Working Papers (University of Botswana):
Volume 3 pp.41-75, 2002
Haron 2003 27
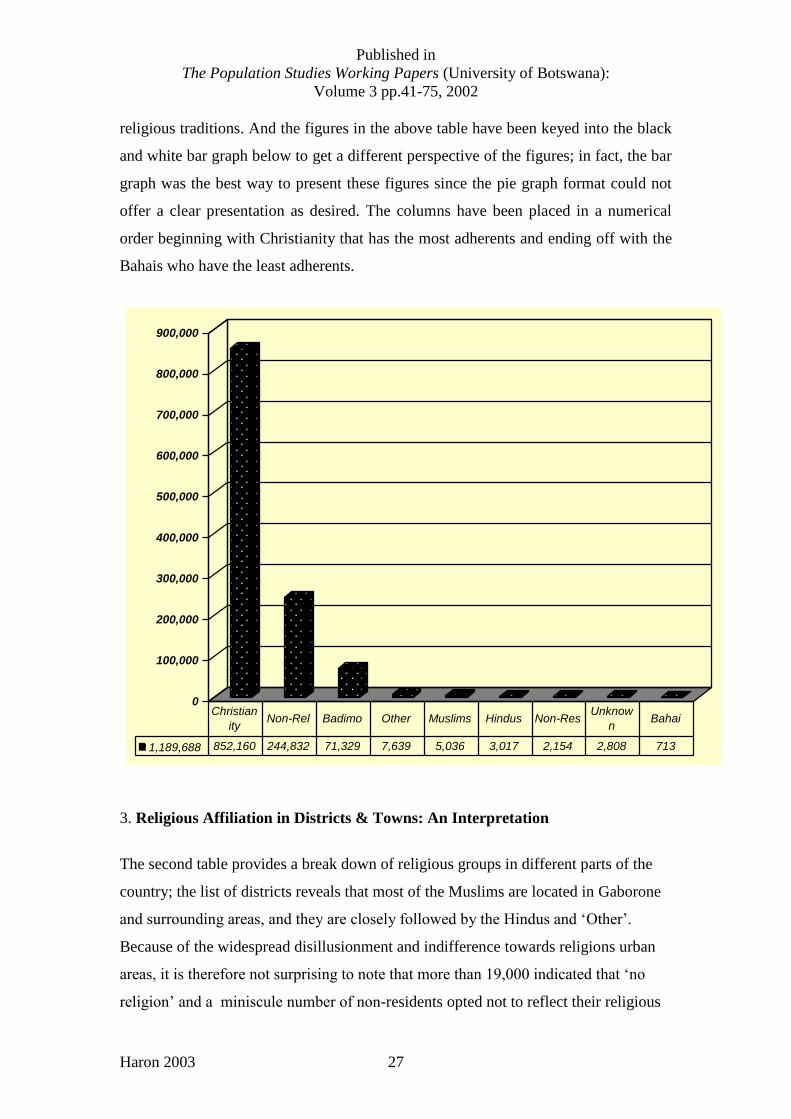
religious traditions. And the figures in the above table have been keyed into the black
and white bar graph below to get a different perspective of the figures; in fact, the bar
graph was the best way to present these figures since the pie graph format could not
offer a clear presentation as desired. The columns have been placed in a numerical
order beginning with Christianity that has the most adherents and ending off with the
Bahais who have the least adherents.
0
100,000
200,000
300,000
400,000
500,000
600,000
700,000
800,000
900,000
1,189,688 852,160 244,832 71,329 7,639 5,036 3,017 2,154 2,808 713
Christian
ityNon-Rel Badimo Other Muslims Hindus Non-Res
Unknow
nBahai
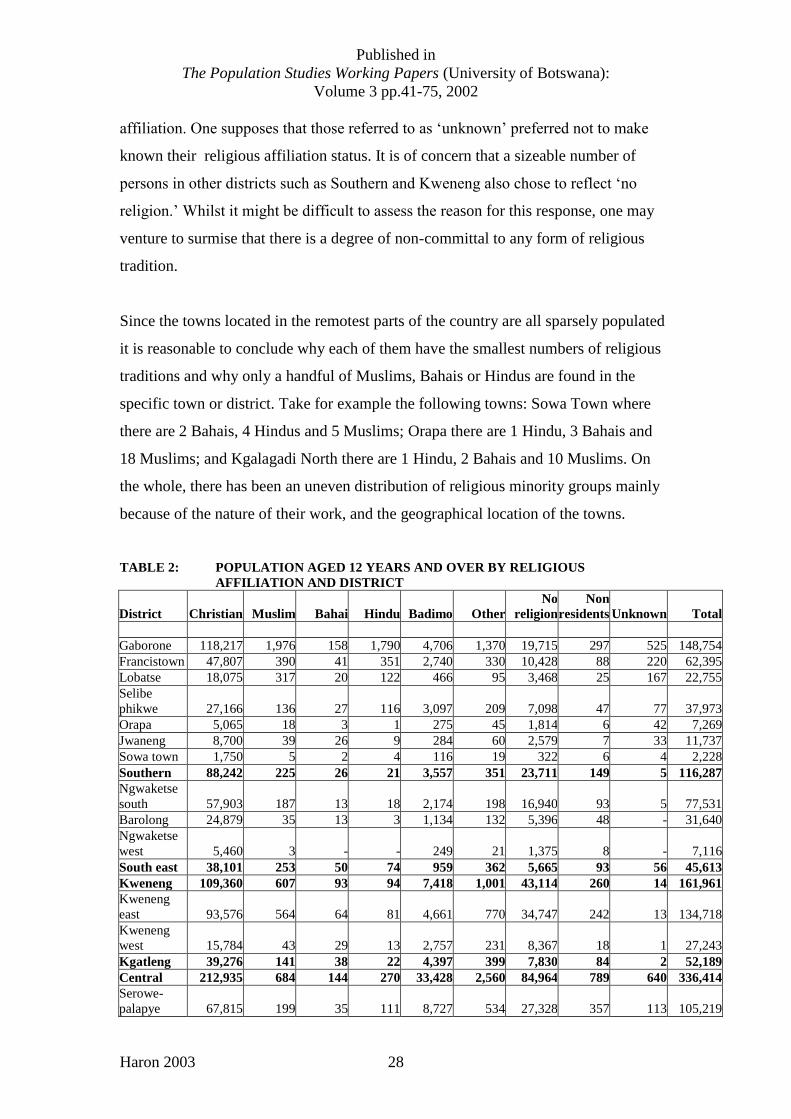
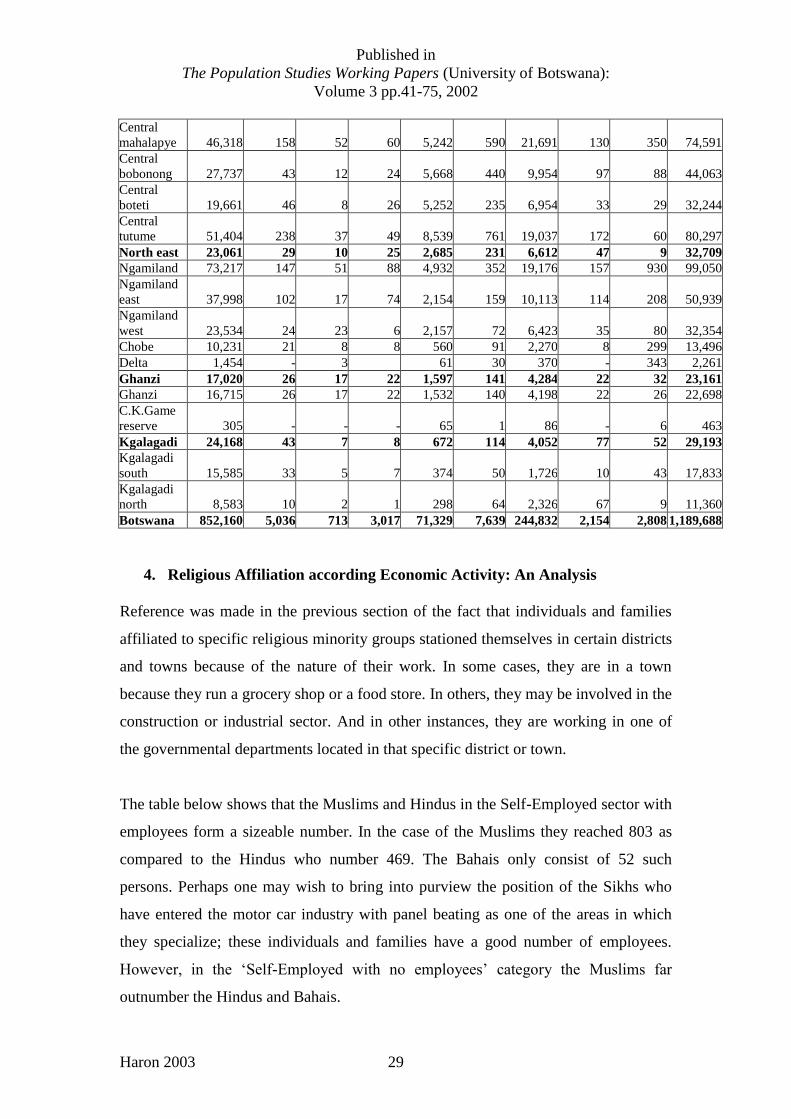
3. Religious Affiliation in Districts & Towns: An Interpretation
The second table provides a break down of religious groups in different parts of the
country; the list of districts reveals that most of the Muslims are located in Gaborone
and surrounding areas, and they are closely followed by the Hindus and „Other‟.
Because of the widespread disillusionment and indifference towards religions urban
areas, it is therefore not surprising to note that more than 19,000 indicated that „no
religion‟ and a miniscule number of non-residents opted not to reflect their religious
Published in
The Population Studies Working Papers (University of Botswana):
Volume 3 pp.41-75, 2002
Haron 2003 28
affiliation. One supposes that those referred to as „unknown‟ preferred not to make
known their religious affiliation status. It is of concern that a sizeable number of
persons in other districts such as Southern and Kweneng also chose to reflect „no
religion.‟ Whilst it might be difficult to assess the reason for this response, one may
venture to surmise that there is a degree of non-committal to any form of religious
tradition.
Since the towns located in the remotest parts of the country are all sparsely populated
it is reasonable to conclude why each of them have the smallest numbers of religious
traditions and why only a handful of Muslims, Bahais or Hindus are found in the
specific town or district. Take for example the following towns: Sowa Town where
there are 2 Bahais, 4 Hindus and 5 Muslims; Orapa there are 1 Hindu, 3 Bahais and
18 Muslims; and Kgalagadi North there are 1 Hindu, 2 Bahais and 10 Muslims. On
the whole, there has been an uneven distribution of religious minority groups mainly
because of the nature of their work, and the geographical location of the towns.
TABLE 2: POPULATION AGED 12 YEARS AND OVER BY RELIGIOUS
AFFILIATION AND DISTRICT
District Christian Muslim Bahai Hindu Badimo Other
No
religion
Non
residents Unknown Total
Gaborone 118,217 1,976 158 1,790 4,706 1,370 19,715 297 525 148,754
Francistown 47,807 390 41 351 2,740 330 10,428 88 220 62,395
Lobatse 18,075 317 20 122 466 95 3,468 25 167 22,755
Selibe
phikwe 27,166 136 27 116 3,097 209 7,098 47 77 37,973
Orapa 5,065 18 3 1 275 45 1,814 6 42 7,269
Jwaneng 8,700 39 26 9 284 60 2,579 7 33 11,737
Sowa town 1,750 5 2 4 116 19 322 6 4 2,228
Southern 88,242 225 26 21 3,557 351 23,711 149 5 116,287
Ngwaketse
south 57,903 187 13 18 2,174 198 16,940 93 5 77,531
Barolong 24,879 35 13 3 1,134 132 5,396 48 - 31,640
Ngwaketse
west 5,460 3 - - 249 21 1,375 8 - 7,116
South east 38,101 253 50 74 959 362 5,665 93 56 45,613
Kweneng 109,360 607 93 94 7,418 1,001 43,114 260 14 161,961
Kweneng
east
93,576
564 64
81
4,661
770
34,747
242
13
134,718
Kweneng
west
15,784
43 29
13
2,757
231
8,367
18
1
27,243
Kgatleng 39,276 141 38 22 4,397 399 7,830 84 2 52,189
Central 212,935 684 144 270 33,428 2,560 84,964 789 640 336,414
Serowe-
palapye
67,815
199 35
111
8,727
534
27,328
357
113
105,219
Published in
The Population Studies Working Papers (University of Botswana):
Volume 3 pp.41-75, 2002
Haron 2003 29
Central
mahalapye
46,318
158 52
60
5,242
590
21,691
130
350
74,591
Central
bobonong
27,737
43
12
24
5,668
440
9,954
97
88
44,063
Central
boteti
19,661
46 8
26
5,252
235
6,954
33
29
32,244
Central
tutume
51,404
238 37
49
8,539
761
19,037
172
60
80,297
North east 23,061 29 10 25 2,685 231 6,612 47 9 32,709
Ngamiland 73,217 147 51 88 4,932 352 19,176 157 930 99,050
Ngamiland
east 37,998 102 17 74 2,154
159
10,113
114
208
50,939
Ngamiland
west
23,534
24 23
6
2,157
72
6,423
35
80
32,354
Chobe 10,231 21 8 8 560 91 2,270 8 299 13,496
Delta 1,454 - 3 61 30 370 - 343 2,261
Ghanzi 17,020 26 17 22 1,597 141 4,284 22 32 23,161
Ghanzi 16,715 26 17 22 1,532 140 4,198 22 26 22,698
C.K.Game
reserve
305
- - -
65
1
86
-
6
463
Kgalagadi 24,168 43 7 8 672 114 4,052 77 52 29,193
Kgalagadi
south
15,585
33 5
7
374
50
1,726
10
43
17,833
Kgalagadi
north
8,583
10 2
1
298
64
2,326
67
9
11,360
Botswana 852,160 5,036 713 3,017 71,329 7,639 244,832 2,154 2,808 1,189,688
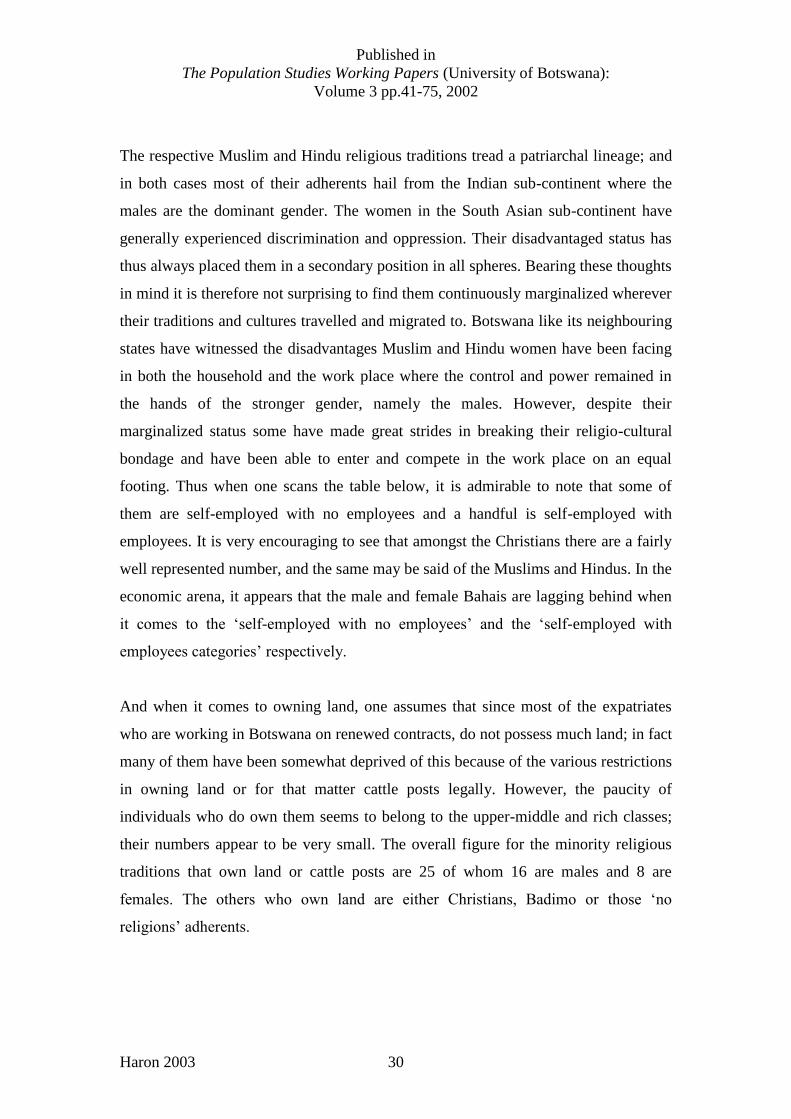
4. Religious Affiliation according Economic Activity: An Analysis
Reference was made in the previous section of the fact that individuals and families
affiliated to specific religious minority groups stationed themselves in certain districts
and towns because of the nature of their work. In some cases, they are in a town
because they run a grocery shop or a food store. In others, they may be involved in the
construction or industrial sector. And in other instances, they are working in one of
the governmental departments located in that specific district or town.
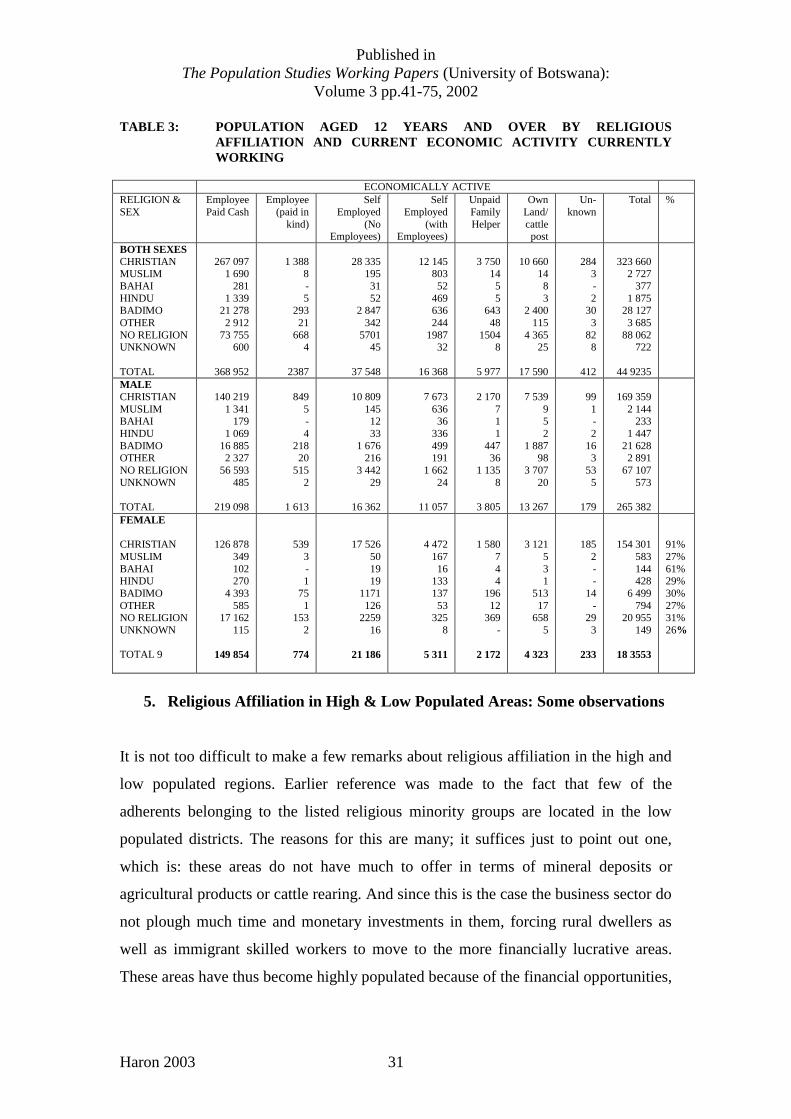
The table below shows that the Muslims and Hindus in the Self-Employed sector with
employees form a sizeable number. In the case of the Muslims they reached 803 as
compared to the Hindus who number 469. The Bahais only consist of 52 such
persons. Perhaps one may wish to bring into purview the position of the Sikhs who
have entered the motor car industry with panel beating as one of the areas in which
they specialize; these individuals and families have a good number of employees.
However, in the „Self-Employed with no employees‟ category the Muslims far
outnumber the Hindus and Bahais.
Published in
The Population Studies Working Papers (University of Botswana):
Volume 3 pp.41-75, 2002
Haron 2003 30
The respective Muslim and Hindu religious traditions tread a patriarchal lineage; and
in both cases most of their adherents hail from the Indian sub-continent where the
males are the dominant gender. The women in the South Asian sub-continent have
generally experienced discrimination and oppression. Their disadvantaged status has
thus always placed them in a secondary position in all spheres. Bearing these thoughts
in mind it is therefore not surprising to find them continuously marginalized wherever
their traditions and cultures travelled and migrated to. Botswana like its neighbouring
states have witnessed the disadvantages Muslim and Hindu women have been facing
in both the household and the work place where the control and power remained in
the hands of the stronger gender, namely the males. However, despite their
marginalized status some have made great strides in breaking their religio-cultural
bondage and have been able to enter and compete in the work place on an equal
footing. Thus when one scans the table below, it is admirable to note that some of
them are self-employed with no employees and a handful is self-employed with
employees. It is very encouraging to see that amongst the Christians there are a fairly
well represented number, and the same may be said of the Muslims and Hindus. In the
economic arena, it appears that the male and female Bahais are lagging behind when
it comes to the „self-employed with no employees‟ and the „self-employed with
employees categories‟ respectively.
And when it comes to owning land, one assumes that since most of the expatriates
who are working in Botswana on renewed contracts, do not possess much land; in fact
many of them have been somewhat deprived of this because of the various restrictions
in owning land or for that matter cattle posts legally. However, the paucity of
individuals who do own them seems to belong to the upper-middle and rich classes;
their numbers appear to be very small. The overall figure for the minority religious
traditions that own land or cattle posts are 25 of whom 16 are males and 8 are
females. The others who own land are either Christians, Badimo or those „no
religions‟ adherents.
Published in
The Population Studies Working Papers (University of Botswana):
Volume 3 pp.41-75, 2002
Haron 2003 31
TABLE 3: POPULATION AGED 12 YEARS AND OVER BY RELIGIOUS
AFFILIATION AND CURRENT ECONOMIC ACTIVITY CURRENTLY
WORKING
ECONOMICALLY ACTIVE
RELIGION &
SEX
Employee
Paid Cash
Employee
(paid in
kind)
Self
Employed
(No Employees)
Self
Employed
(with Employees)
Unpaid
Family
Helper
Own
Land/
cattle post
Un-
known
Total %
BOTH SEXES
CHRISTIAN MUSLIM
BAHAI
HINDU BADIMO
OTHER
NO RELIGION UNKNOWN
TOTAL
267 097 1 690
281
1 339 21 278
2 912
73 755 600
368 952
1 388 8
-
5 293
21
668 4
2387
28 335 195
31
52 2 847
342
5701 45
37 548
12 145 803
52
469 636
244
1987 32
16 368
3 750 14
5
5 643
48
1504 8
5 977
10 660 14
8
3 2 400
115
4 365 25
17 590
284 3
-
2 30
3
82 8
412
323 660 2 727
377
1 875 28 127
3 685
88 062 722
44 9235
MALE
CHRISTIAN
MUSLIM BAHAI
HINDU
BADIMO OTHER
NO RELIGION
UNKNOWN
TOTAL
140 219
1 341 179
1 069
16 885 2 327
56 593
485
219 098
849
5 -
4
218 20
515
2
1 613
10 809
145 12
33
1 676 216
3 442
29
16 362
7 673
636 36
336
499 191
1 662
24
11 057
2 170
7 1
1
447 36
1 135
8
3 805
7 539
9 5
2
1 887 98
3 707
20
13 267
99
1 -
2
16 3
53
5
179
169 359
2 144 233
1 447
21 628 2 891
67 107
573
265 382
FEMALE
CHRISTIAN
MUSLIM
BAHAI HINDU
BADIMO
OTHER NO RELIGION
UNKNOWN
TOTAL 9
126 878
349
102 270
4 393
585 17 162
115
149 854
539
3
- 1
75
1 153
2
774
17 526
50
19 19
1171
126 2259
16
21 186
4 472
167
16 133
137
53 325
8
5 311
1 580
7
4 4
196
12 369
-
2 172
3 121
5
3 1
513
17 658
5
4 323
185
2
- -
14
- 29
3
233
154 301
583
144 428
6 499
794 20 955
149
18 3553
91%
27%
61% 29%
30%
27% 31%
26%
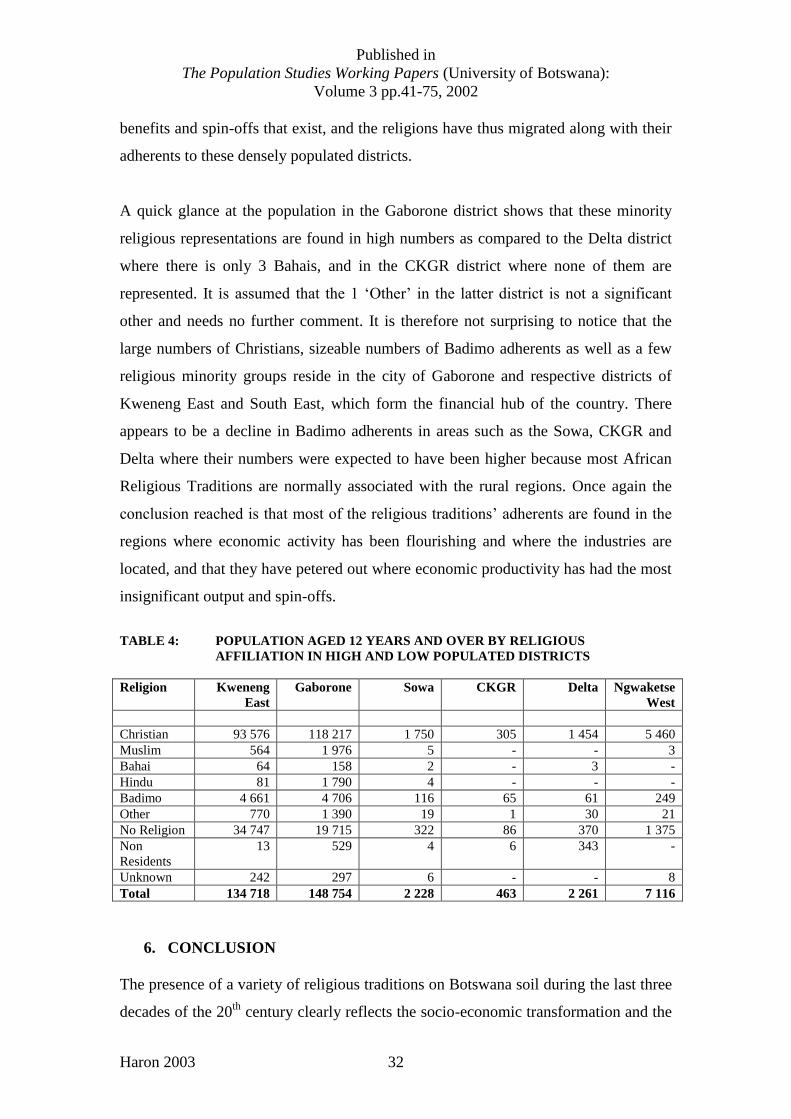
5. Religious Affiliation in High & Low Populated Areas: Some observations
It is not too difficult to make a few remarks about religious affiliation in the high and
low populated regions. Earlier reference was made to the fact that few of the
adherents belonging to the listed religious minority groups are located in the low
populated districts. The reasons for this are many; it suffices just to point out one,
which is: these areas do not have much to offer in terms of mineral deposits or
agricultural products or cattle rearing. And since this is the case the business sector do
not plough much time and monetary investments in them, forcing rural dwellers as
well as immigrant skilled workers to move to the more financially lucrative areas.
These areas have thus become highly populated because of the financial opportunities,
Published in
The Population Studies Working Papers (University of Botswana):
Volume 3 pp.41-75, 2002
Haron 2003 32
benefits and spin-offs that exist, and the religions have thus migrated along with their
adherents to these densely populated districts.
A quick glance at the population in the Gaborone district shows that these minority
religious representations are found in high numbers as compared to the Delta district
where there is only 3 Bahais, and in the CKGR district where none of them are
represented. It is assumed that the 1 „Other‟ in the latter district is not a significant
other and needs no further comment. It is therefore not surprising to notice that the
large numbers of Christians, sizeable numbers of Badimo adherents as well as a few
religious minority groups reside in the city of Gaborone and respective districts of
Kweneng East and South East, which form the financial hub of the country. There
appears to be a decline in Badimo adherents in areas such as the Sowa, CKGR and
Delta where their numbers were expected to have been higher because most African
Religious Traditions are normally associated with the rural regions. Once again the
conclusion reached is that most of the religious traditions‟ adherents are found in the
regions where economic activity has been flourishing and where the industries are
located, and that they have petered out where economic productivity has had the most
insignificant output and spin-offs.
TABLE 4: POPULATION AGED 12 YEARS AND OVER BY RELIGIOUS
AFFILIATION IN HIGH AND LOW POPULATED DISTRICTS
Religion Kweneng
East
Gaborone Sowa CKGR Delta Ngwaketse
West
Christian 93 576 118 217 1 750 305 1 454 5 460
Muslim 564 1 976 5 - - 3
Bahai 64 158 2 - 3 -
Hindu 81 1 790 4 - - -
Badimo 4 661 4 706 116 65 61 249
Other 770 1 390 19 1 30 21
No Religion 34 747 19 715 322 86 370 1 375
Non
Residents
13 529 4 6 343 -
Unknown 242 297 6 - - 8
Total 134 718 148 754 2 228 463 2 261 7 116
6. CONCLUSION
The presence of a variety of religious traditions on Botswana soil during the last three
decades of the 20th
century clearly reflects the socio-economic transformation and the
Published in
The Population Studies Working Papers (University of Botswana):
Volume 3 pp.41-75, 2002
Haron 2003 33
partial demographic changes that Botswana experienced. The presence of Christianity
since the beginning of the 1800s have deeply affected the status of African Traditional
Religion during the 20th
century, and the migration of the minority religious traditions
to Botswana have contributed towards the existence of a diverse, rich religio-cultural
and multi-lingual society. One is astonished that a population statistician such as
Clarke (1997) made no mention of „The Future of Religion‟ or „The Position of
Religion‟ in his well-publicised short essay on The Future of the Population.
In order to have a more informed reading and understanding of this multi-cultural and
multi-religious society, it becomes necessary to take cognisance of the position of
religion. And more specifically an attempt should be made to identify the various
Christian denominations as well as the different branches of the African Traditional
Religions in Botswana to fill in the bigger picture. The CSO will have to devise ways
and means that would assist and accommodate these varied strands/groups in the
forthcoming population survey. In fact, Trompf‟s (1998) article on the religious
traditions‟ attitudes towards population planning should be helpful in assisting
statisticians in the future. He underscored the positive position religious traditions
have taken with regards to issues such as the ethics of caring for human reproduction
and the ethics of protecting the environment. Among the many issues that will have to
be considered are: (a) the attitudes of the youth towards their respective religious
traditions, (b) the perspectives of these traditions on the issues of birth & death – more
specifically the fertility and mortality rates, (c) the concerns and solutions that
religious traditions have for diseases and illnesses such as terminal Cancer and
HIV/Aids, and (d) gauging the frequency of the migration of religious traditions from
and to Botswana. And as a spin off of these, an assessment should be made of the
extent of the religious traditions‟ growth, and the degree of religious conversion
amongst the Batswana themselves.
The inclusion of „religion‟ as an important topic has not only redressed the issue, it
also significantly added to the comprehensive understanding of Botswana‟s
population patterns. It has provided significant data that demonstrates the importance
of religion within a country such as Botswana. The notion that religion did not and
does not play a crucial role in the development of this society is far from true; the
Published in
The Population Studies Working Papers (University of Botswana):
Volume 3 pp.41-75, 2002
Haron 2003 34
statistics bears testimony to the fact the different religious traditions and their
adherents have and continues to make substantial contributions to the development of
this country, which directly works towards the realization of Vision 2016.
Published in
The Population Studies Working Papers (University of Botswana):
Volume 3 pp.41-75, 2002
Haron 2003 35
7. BIBLIOGRAPHY
Books & Articles:
Amanze, James N. Botswana Handbook of Churches. Gaborone: Pula Press. 1994
Amanze, James N. African Christianity in Botswana. Gweru: Mambo Press. 1998.
Amanze, James N. Islam in Botswana, 1882-1995. Uppsala: African Association for
the Study of Religions. 2000.
Amara, Muhammad (ed). Islam in Africa Project. Durban: IAP. 2001.
Anon. “American Religious Identification Survey.” Online:
www.gc.cuny.ed/studies/key_findings.htm. 15pages. 2001.
Anon. Interreligious Religious Freedom Report. Online:
http://atheism.about.com/library/irf/irf02/blirf_botswana.htm. 2002.
Barret, David B. & Todd M. Johnson. “A Statistical Approach to the World‟s
religious Adherents, 2000 – 2050.” In Religions of the World: A Comprehensive
Survey of Beliefs and Practices (ed. J. Gordon Melton & Martin Baumann). Santa
Barbara & Denver: ABC & CLIO. Vol. 1 pp.xxvii-xxxviii, 2002.
Botana, Toziba & Cornelis Vander-Post. “Population.” In Botswana National Atlas
(ed. Francis Sepe). Gaborone: Government of Botswana. Ch. 17 pp. 219-232, 2001.
Bouma, Gary & Philip Hughes. “Religion and Age in Australia.” In People and
Place. 6(1). 1998.
Bouma, Gary & Philip Hughes. “Religious Residential Concentrations in Australia.”
In People and Place. 8(3): 18-27, 2000.
Campbell, E.K. “Population Distribution and Urbanization.” In Botswana: Politics
and Society (ed. W.A. Edge & M.H. Lekorwe). Pretoria: Van Schaick. Pt. V Ch. 17
pp. 261-280, 1998.
Clarke, John I. The Future of Population. London: Phoenix – Orion Publishing Group
Ltd. 1997.
Damschke, Elaine & Doreen S. Goyer. “Botswana.” In The Handbook of National
Population Censuses. New York & Westport: Greenwood Press. Pp.62-72, 1986.
Published in
The Population Studies Working Papers (University of Botswana):
Volume 3 pp.41-75, 2002
Haron 2003 36
Haron, Muhammed. “Gaborone Muslims: A Vignette into their lives.” Gaborone:
Unpublished University of Botswana TRS Paper. October 2003.
Melton, J. Gordon. “Botswana.” In Religions of the World: A Comprehensive Survey
of Beliefs and Practices (ed. J. Gordon Melton & Martin Baumann). Santa Barbara &
Denver: ABC & CLIO. Vol. 1 pp.157-159, 2002.
Motswapong, Elizabeth. “Hinduism in Botswana.” In BOLESWA. University of
Swaziland. 2003 (forthcoming).
Ness, Immanuel & James Ciment. “Botswana.” In The Encyclopaedia of Global
Population and Demographics. Chicago: Fitzroy Dearborn Publishers. Pp. 219-222,
1999.
Nkomazana, Fidelis. “Religion in Botswana.” In Botswana National Atlas (ed. Francis
Sepe). Gaborone: Government of Botswana. Ch. 24 „Culture & Heritage‟ pp. 327-
344, 2001.
Ntloedibe-Kuswana, G.S. “African Religion and 2001 Population & Housing
Census.” Gaborone: Unpublished University of Botswana Report. September 2003.
Organski, Katherine & A.F.K. Organski. Population and World Power. New York: A.
Knopf. 1961.
Parrent, Saroj. “Muslims in Botswana.” In African Studies. 48(1): 72-82, 1989.
Pipes, Daniel. “How many American Muslims?” In WorldNetDaily Online.
www.worldnetdaily.com/news/article.asp?ARTICLE_ID=25109 Monday 29 October
2001.
Roxanne, J. “Some interesting religion demographics.” Online:
www.democraticunderground.com 22 November 2001.
Stillman, Jeanne B. “Sub-Saharan Africa.” In International Encyclopaedia of
Population. (ed. John A. Ross). New York: The Free Press. Vol. 2 pp. 625-636, 1982.
Trewartha, Glenn. A Geography of Population: World Patterns. New York: John
Wiley & Sons. 1969.
Trompf, Garry W. “The attitudes and involvement of Religions in Population
Planning.” In Population and Global Security (ed. Nicolas Polunin). Canbridge: CUP.
Ch. 11 pp. 205-234, 1998.
Websites:
www.adherents.com
Published in
The Population Studies Working Papers (University of Botswana):
Volume 3 pp.41-75, 2002
Haron 2003 37
www.thearda.com
www.beliefnet.com
www.cso.gov.bw
www.islamcity.com
www.sikhnet.com
www.hindunet.org
www.buddhanet.net
www.shamash.org
www.youthandreligion.org
www.africa2000.com
www.unhcr.ch


