Embed Size (px)
Citation preview
European Journal of Neuroscience, Vol. 11, pp. 575–582, 1999 © European Neuroscience Association
Brain location and visual topography of cortical area V6Ain the macaque monkey
Claudio Galletti, Patrizia Fattori, Dieter F. Kutz1 and Michela GamberiniDipartimento di Fisiologia umana e generale, Universita9 di Bologna, Piazza di Porta S. Donato 2, 40127, Bologna, Italy1Department of Zoology and Neurobiology, Ruhr-University Bochum, D-44780 Bochum, Germany
Keywords: prestriate cortex, reaching, superior parietal lobule, visuomotor integration
Abstract
The brain location, extent and functional organization of the cortical visual area V6A was investigated in macaque monkeys byusing single cell recording techniques in awake, behaving animals. Six hemispheres of four animals were studied. Area V6Aoccupies a horseshoe-like region of cortex in the caudalmost part of the superior parietal lobule. It extends from the medial surfaceof the brain, through the anterior bank of the parieto-occipital sulcus, up to the most lateral part of the fundus of the same sulcus.Area V6A borders on areas V6 ventrally, PEc dorsally, PGm medially and MIP laterally. Of 1348 neurons recorded in V6A, 61%were visual and 39% non-visual in nature. The visual neurons were particularly sensitive to orientation and direction of movementof visual stimuli. The inferior contralateral quadrant was the most represented one. Visual receptive fields were also found in theinferior ipsilateral quadrant and in the upper visual field. Receptive fields were on average smaller in the lower visual field than inthe upper one. Both central and peripheral parts of the visual field were represented. Large parts of the visual field were representedin small regions of area V6A, and the same regions of the visual field were re-represented many times in different parts of thisarea, without any apparent topographical order. The only reliable sign of retinotopic organization was the predominance of centralrepresentation dorsally and far periphery ventrally. The functional organization of area V6A is discussed in the view that this areacould be involved in the control of reaching out and grasping objects.
Introduction
For a long time, the monkey superior parietal lobule (SPL) has beenthought to be involved in the analysis of somatic signals andsomatomotor activity, both related to the movement of the arm,without any role in visual or visuomotor processing (see Stein, 1991).Yet, it was known since the beginning of this century that SPLcontained also a visual region. Brodmann (1909) reported the presenceof the most medial part of area 19, a cortical visual association area,in the caudalmost part of SPL. Later on, von Bonin & Bailey (1947)confirmed this view reporting that the cortex of the anterior bank ofthe parieto-occipital sulcus (APO) was occupied by the most medialpart of what they called area OA, the homologous of Brodmann’sarea 19.
More recently, extracellular recordings in anaesthetized and para-lysed animals confirmed the visual nature of this same brain region:a visual area, named PO, was located in the ventral part of APO(Colby et al., 1988). PO neurons were described as very sensitive tovisual stimulations and retinotopically organized. The same authorsreported the presence of visual neurons also in the cortex dorsal toPO, although these cells were described as less responsive to visualstimulation with respect to the neurons of area PO.
Recent recordings from single neurons in awake animals haveconfirmed that in APO at least two cortical visual areas are present:area V6 (PO) ventrally and area V6A dorsally (Gallettiet al., 1996).According to this study, both areas contain visual neurons that, whencorrectly activated, produce high firing rates of discharge. Some V6A
Correspondence: Prof. C. Galletti. E-mail: [email protected]
Received 2 June 1998, revised 6 September 1998, accepted 28 September 1998
visual neurons are also able to encode directly the spatial coordinatesof visual objects, as their receptive field remains anchored to thesame spatial location irrespective of the direction of gaze (Gallettiet al., 1993). While all neurons of area V6 are visual in nature, areaV6A contains visual neurons as well as neurons insensitive to visualstimulation. The activity of V6A non-visual neurons is modulated byoculomotor activities, such as fixations towards particular regions ofvisual space or changes in the direction of gaze (Gallettiet al., 1991,1995), and/or by somatomotor activities, in particular by the movementof the arms (Gallettiet al., 1997a). In summary, area V6A seems tohave a complete machinery to allow orienting of the animal towardsobjects present in the visual field, and to visually guide the reachingmovements toward those same objects.
The aim of this work is to describe the brain location and extentof area V6A, and to study the visual topography of this area in orderto discuss its functional organization with respect to the suggestedrole in visuomotor processing. Preliminary data on this matter havebeen previously published in abstract form (Gallettiet al., 1997b).
Materials and methods
Four monkeys (Macaca fascicularis; 3.1–7.1 kg) were used in thisstudy. Experimental protocols were approved by the BioethicalCommittee of the University of Bologna and were in compliancewith the national and European laws on the care and use of laboratoryanimals. A detailed description of training, anaesthetic, surgical andrecording procedures, as well as of visual stimulation, anatomicalreconstruction of recording sites and animal care are reported else-
576 C. Gallettiet al.
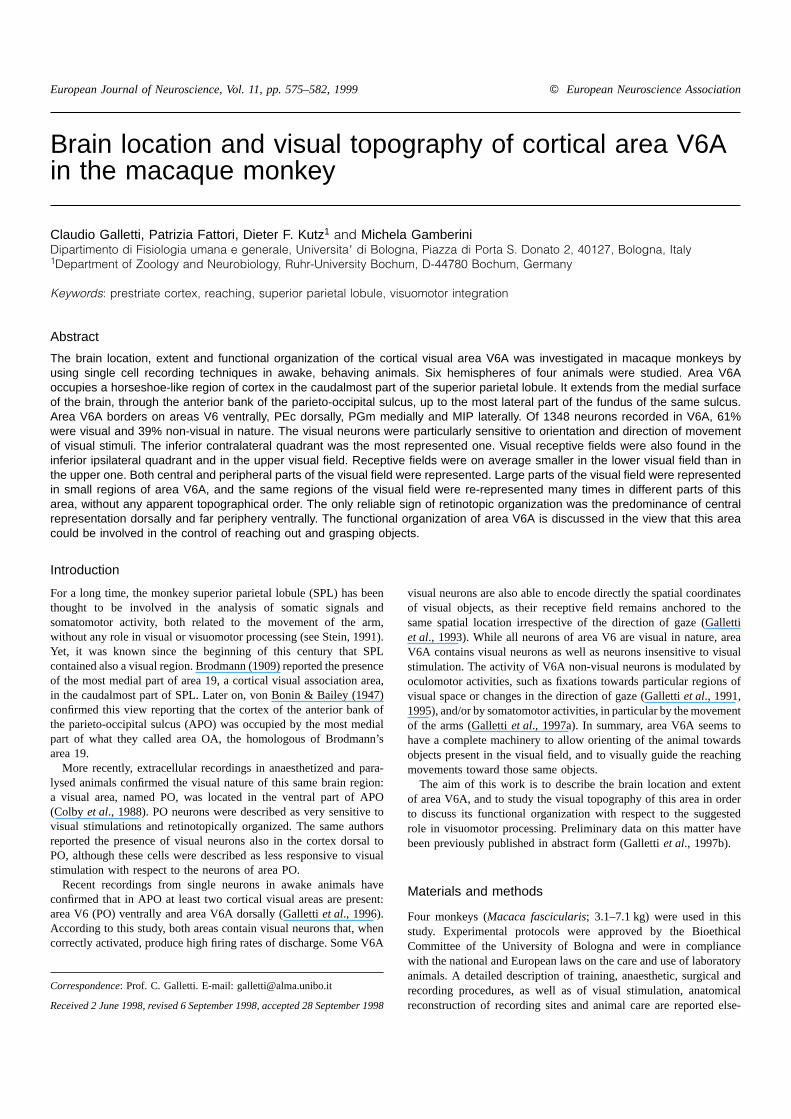
FIG. 1. Brain location of area V6A. (A) Posterior view of macaque brain (Macaca fascicularis). The right occipital pole is shown lightened and bordered by adashed line. SPL: superior parietal lobule; IPL: inferior parietal lobule; IPs: intraparietal sulcus; Ls: lunate sulcus; POs: parieto-occipital sulcus; STs: superiortemporal sulcus. (B) Posterior view of the right hemisphere of macaque brain after occipital pole dissection. The occipital pole has been cut away (dashed line)to show the anterior banks of POs medially and of Ls laterally. The anterior bank of POs has been bordered by a continuous line. A dotted line indicates theborder between areas V6 and V6A. An.g: angular gyrus; Ca: calcarine fissure; Pom: medial parieto-occipital sulcus; V1, V2, V6, V6A: areas V1, V2, V6 andV6A. Other abbreviations as in A. (C) Two-dimensional map of the caudal pole of SPL. The cortical mantle has been cut along the curvatures between themedial surface of the hemisphere and the dorsal surface of SPL, and between this latter and the medial bank of IPs. These three brain surfaces are shown ingrey and on the same plane of the anterior bank of POs (shown in white). A dotted line indicates the border between areas V6 and V6A as in B.
where (Gallettiet al., 1995). The following is a brief descriptionof them.
Before surgery, the animals were sedated with ketamine hydro-chloride (12 mg/kg i.m.). All surgical procedures were performedunder aseptic conditions using sodium thiopenthal i.v. (15 mg/kginitially followed by 8 mg/kg/h). The animals received analgesics for2 days and were given free access to water fruit and chow forµ 2weeks. Animals performed fixation tasks with the head restrainedwhile single neurons from the cortex of the posterior pole of SPLwere extracellularly recorded by home-made glass-coated Elgiloymicroelectrodes (Suzuki & Azuma, 1976). During recording sessions,animals sat in a primate chair facing a large (80°3 80°) tangentscreen. They were trained to look at a fixation spot projected on thescreen for 2–6 s without reacting to any other visual stimulus presenton the same screen during this period. Eye positions were recordedby an infra-red oculometer (Dr Bouis, Germany; Bachet al., 1983).The sample rate for action potentials was 1 kHz and that for eyeposition 100 Hz.
A standard protocol was used for testing the visual responsivenessof cells in record. Cells were first tested with simple visual stimuli(light/dark borders, light or dark bars and spots of different size,orientation, direction and speed of movement) rear-projected on thescreen facing the animal. If the neuron in record was not responsiveto these stimuli, testing was continued using more complex visualstimulations (light/dark gratings and corners of different orientation,direction and speed of movement). In some cases, cells that were atfirst responsive to complex visual stimuli then rapidly adapted to thecontinued visual stimulation, becoming unresponsive to it (see Gallettiet al., 1996). This type of cell remained active only if the visualstimuli delivered on their receptive fields were continuously changedin orientation, direction and/or speed of movement.
As the visual responsivity of many V6A cells was stronglymodulated by the direction of gaze (Gallettiet al., 1995), thepossibility existed that a cell was not responsive to visual stimulationbecause the animal was looking towards a non-preferred direction.For this reason, simple and complex visual stimulations were repeatedwhile the animal gazed at different screen locations. This procedure
© 1999 European Neuroscience Association,European Journal of Neuroscience, 11, 575–582
also allowed us to check whether the visual receptive field wasorganized in retinotopic or craniotopic coordinates.
In cases where we were not able to activate the cell in record withthe battery of simple and complex visual stimuli above described,we classified that cell as non-visual in nature. If the cell was visuallyresponsive, on the contrary, we mapped the borders of visual receptivefield with the optimal stimulus, chosen among the battery wehad tested.
At the end of recording sessions, the animals were killed with anoverdose of i.v. thiopenthal. Electrode tracks and the approximatelocation of each recording site were reconstructed on parasagittalsections of the brain on the basis of marking lesions and severalother cues, such as the coordinates of penetrations within recordingchamber, the kind of cortical areas passed through before reachingthe APO, the location of boundaries between white and grey matter,and the distance of recording site from the surface of the hemisphere.
Two-dimensional reconstruction of recording sites
Figure 1 shows the cortex of the posterior pole of SPL, whererecordings have been carried out, together with a two-dimensional(2D) map of this same cortical region. The partial unfolding methodof Van Essen & Zeki (1978) was used to construct the 2D map fromparasagittal sections of the brain. The construction of the mapdepended on two fixed points of reference in the brain. One was thedividing line between the APO and the medial surface of thehemisphere. The other was the crown of SPL, i.e. the dividing linebetween the cortex in the APO and that in the dorsal surface of thehemisphere. To afford comparability between different cases these tworeference lines adopted the same position in all our 2D reconstructions.Elsewhere the forms of the contours were free to reflect the variablegyral morphology of each case. Note that the APO, shown outlinedin Fig. 1B and in white in Fig. 1C, is not a straight wall in a coronalplane, as it could be supposed by looking at the course of the parieto-occipital sulcus in a dorsal view of the brain. Actually, the APO isbent anteriorly from medial to lateral, particularly in its ventrolateralpart, as can be seen in Fig. 1B as well as in any horizontal sectionof the brain passing near the fundus of the parieto-occipital sulcus.
Functional organization of area V6A 577
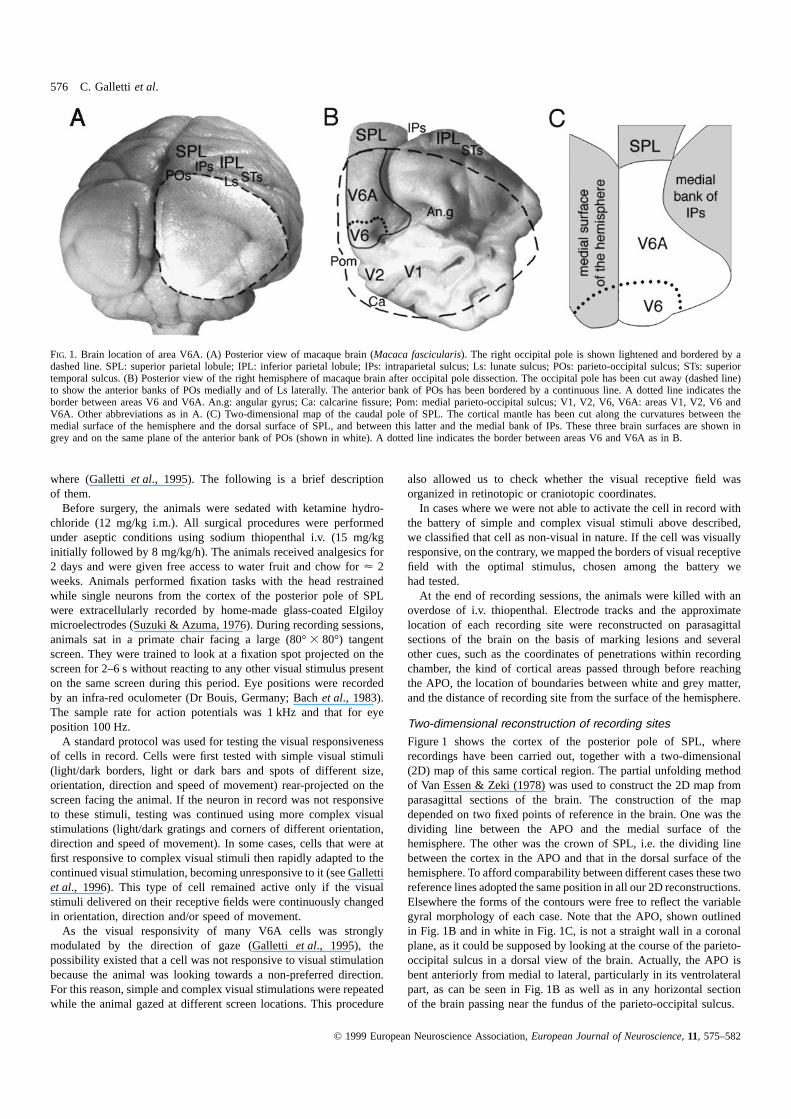
FIG. 2. Recording sites in V6A. Two-dimensional maps of the caudal pole of SPL in three different cases, and in a summary case that contains all V6A cellsrecorded from six hemispheres. Filled circles within the maps indicate brain locations of recorded cells attributed to area V6A on the basis of functional criteriadescribed in Gallettiet al. (1996). The total number of recorded cells is reported at the bottom of each map. Dashed lines indicate location of the border betweenareas V6 and V6A as determined by functional characteristics of recorded cells (see Gallettiet al., 1996). In the summary map, dashed line indicates the averagelocation of V6/V6A border in six hemispheres. PEc and V6: areas PEc and V6. Details on 2D maps as in Fig. 1.
As shown in Fig. 1C, we introduced two discontinuities in the 2Dmap between neighbouring cortical surfaces. They were at points ofmaximum local curvature of the cortical mantle: medially, betweenthe dorsal and medial surfaces of the hemisphere, and laterally,between the dorsal surface of the hemisphere and the medial bank ofintraparietal sulcus (IPs).
Each recording site was marked on a 2D map according to ourbest estimate of the location of the electrode track and of the cellalong the track. The map and recording sites were digitized, andlinked by purpose-written software to the database storing thefunctional properties of each unit, enabling rapid analysis of thedistribution of any given functional characteristic. In some cases, themaps of different animals were combined to give an overall summarydiagram of the data. To do this, the maps of different cases werealigned according to the two reference lines described above. As wedecided to show summary data on the right hemisphere, the mapsderived from left hemispheres were reflected. Before superimposition,each map was rescaled according to the relative size of the wholebrain and the dorsoventral extent of APO. The maximum rescalingfactor used was 9%.
Results
Microelectrode penetrations were carried out in six hemispheres offour animals. Cells were recorded from the posterior part of the SPL,involving four cortical surfaces: the medial and dorsal surfaces of theSPL, the medial bank of IPs and the APO (see Fig. 1C). All cellsrecorded from the dorsal surface of SPL turned out to be not activatedby visual stimulation and were assigned to area PEc (Pandya & Seltzer,1982). The other recorded cells were either visual or non-visual innature. Penetrations with mixed visual/non-visual cells were assignedto area V6A, according to Gallettiet al. (1996). Penetrations with onlyvisual neurons were assigned to areas V6 or V6A on the basis of thefunctional criteria illustrated below and in Gallettiet al. (1996), as wellas on the basis of the sequence of receptive-field locations observedalong the penetration (see below).
Figure 2 shows the cortical distribution of V6A cells recorded inthree different hemispheres, and a summary map with the locations ofall V6A cells recorded in the six hemispheres we studied. This summarymap roughly indicates the extent and limits of area V6A. It occupies ahorseshoe-like region of cortex extending from the medial surface upto the dorsal and ventrolateral parts of the APO. Area V6A borders on
© 1999 European Neuroscience Association,European Journal of Neuroscience, 11, 575–582
areas PEc dorsally and V6 ventrally. The location of its medial andlateral borders are more uncertain (see Discussion).
Area V6A contains two types of neurons: sensitive and insensitive tovisual stimulation. Those classified as insensitive to visual stimulationwere neurons neither activated by simple stimuli (light/dark borders,light or dark bars and spots of different size, orientation, direction andspeed of movement), nor by more complex visual stimuli (light/darkgratings and corners of different orientation, direction and speed ofmovement) projected on the screen facing the animal. Of 1348 neuronsrecorded from 132 microelectrode penetrations in V6A, 827 (61%)were visual and 521 (39%) non-visual in nature. These two types ofneurons were not spatially segregated within area V6A (see also Gallettiet al., 1996). In single penetrations, the two types of cells could beencountered in groups or isolated without any apparent rule. We alsochecked thepossibility thatvisualandnon-visualneuronsweredifferen-tially distributed according to the distance of recording site from thecortical surface, but we were not able to demonstrate such a type ofcorrelation. In summary, it seems a peculiarity of area V6A to haveboth types of cells mixed together. This peculiarity clearly distinguishesarea V6A from both area V6, whose neurons are all sensitive to visualstimulation (Gallettiet al., 1996), and area PEc, whose neurons are allinsensitive to visual stimulation (C. Galletti, unpublished observations).
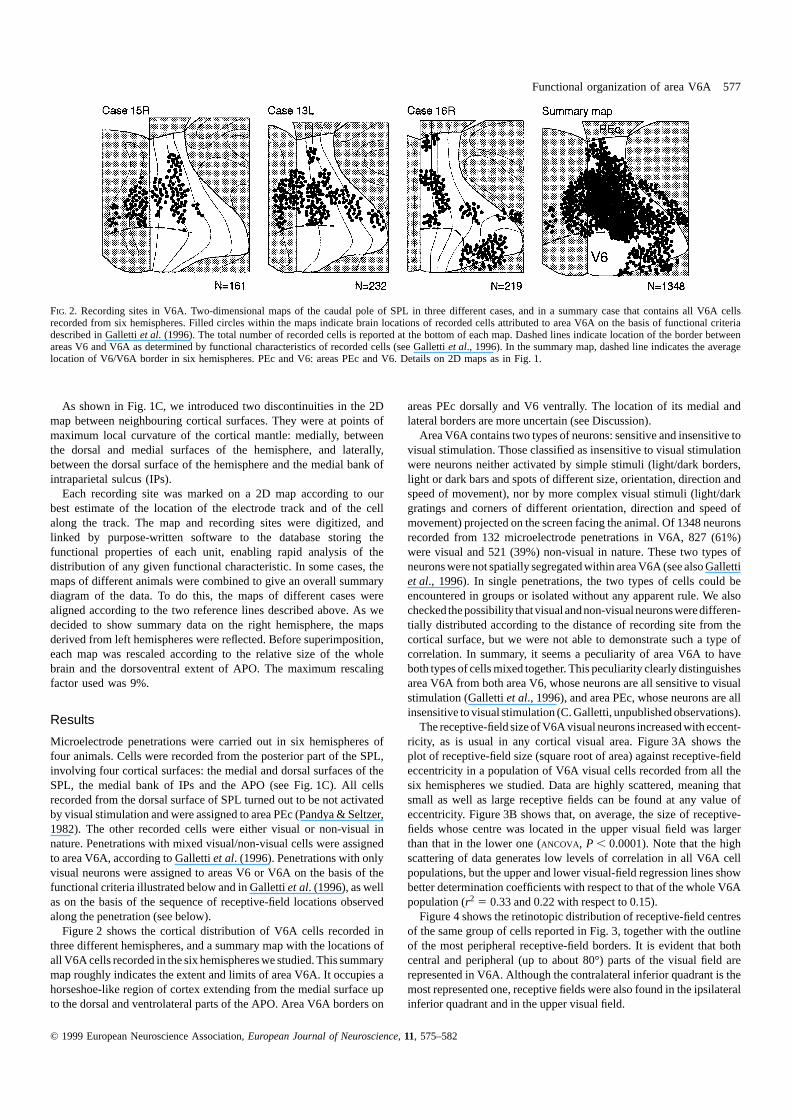
The receptive-field size of V6A visual neurons increased with eccent-ricity, as is usual in any cortical visual area. Figure 3A shows theplot of receptive-field size (square root of area) against receptive-fieldeccentricity in a population of V6A visual cells recorded from all thesix hemispheres we studied. Data are highly scattered, meaning thatsmall as well as large receptive fields can be found at any value ofeccentricity. Figure 3B shows that, on average, the size of receptive-fields whose centre was located in the upper visual field was largerthan that in the lower one (ANCOVA, P , 0.0001). Note that the highscattering of data generates low levels of correlation in all V6A cellpopulations, but the upper and lower visual-field regression lines showbetter determination coefficients with respect to that of the whole V6Apopulation (r2 5 0.33 and 0.22 with respect to 0.15).
Figure 4 shows the retinotopic distribution of receptive-field centresof the same group of cells reported in Fig. 3, together with the outlineof the most peripheral receptive-field borders. It is evident that bothcentral and peripheral (up to about 80°) parts of the visual field arerepresented in V6A. Although the contralateral inferior quadrant is themost represented one, receptive fields were also found in the ipsilateralinferior quadrant and in the upper visual field.
578 C. Gallettiet al.
FIG. 3. Receptive-field size vs. eccentricity in area V6A. (A) Regression plotof receptive-field size (square root of area) against eccentricity for 410 visualcells recorded in V6A. The regression equation is:
size5 21.0°1 0.22ecc; r2 5 0.15
(B) Dual regression plot of receptive-field size against eccentricity for V6Avisual cells with receptive field in the upper (filled circles) and lower (emptycircles) visual field (VF), respectively. Cells with receptive field at 0° ofeccentricity (N 5 21) have been discarded from this analysis. The regressionequations are:
Upper VF (N 5 49): size5 24.6°1 0.41ecc; r2 5 0.33Lower VF (N 5 340): size5 17.6°1 0.28ecc; r2 5 0.22
ANCOVA analysis established that the two regression lines were not significantlydifferent in slope (F1,3855 2.52;P 5 0.1) but they were significantly differentin elevation (mean difference in receptive field size5 10.5°; F1,3865 60.5;P , 0.0001).
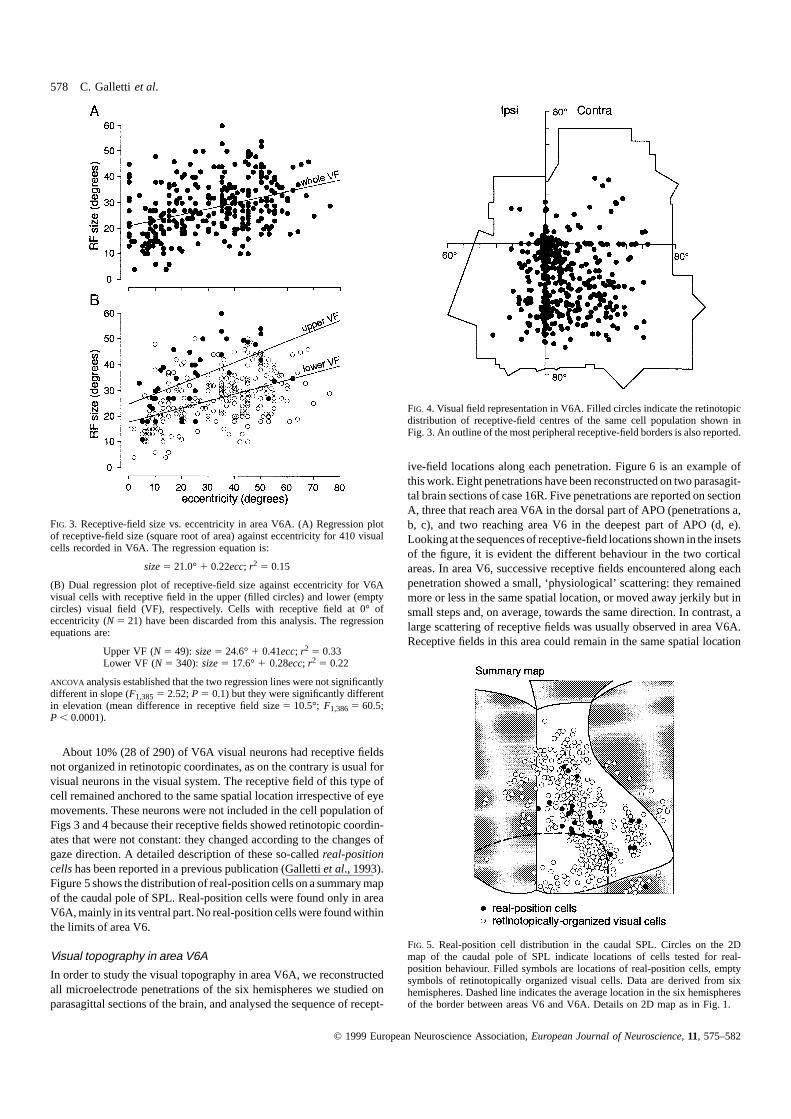
About 10% (28 of 290) of V6A visual neurons had receptive fieldsnot organized in retinotopic coordinates, as on the contrary is usual forvisual neurons in the visual system. The receptive field of this type ofcell remained anchored to the same spatial location irrespective of eyemovements. These neurons were not included in the cell population ofFigs 3 and 4 because their receptive fields showed retinotopic coordin-ates that were not constant: they changed according to the changes ofgaze direction. A detailed description of these so-calledreal-positioncellshas been reported in a previous publication (Gallettiet al., 1993).Figure 5 shows the distribution of real-position cells on a summary mapof the caudal pole of SPL. Real-position cells were found only in areaV6A, mainly in its ventral part. No real-position cells were found withinthe limits of area V6.
Visual topography in area V6A
In order to study the visual topography in area V6A, we reconstructedall microelectrode penetrations of the six hemispheres we studied onparasagittal sections of the brain, and analysed the sequence of recept-
© 1999 European Neuroscience Association,European Journal of Neuroscience, 11, 575–582
FIG. 4. Visual field representation in V6A. Filled circles indicate the retinotopicdistribution of receptive-field centres of the same cell population shown inFig. 3. An outline of the most peripheral receptive-field borders is also reported.
ive-field locations along each penetration. Figure 6 is an example ofthis work. Eight penetrations have been reconstructed on two parasagit-tal brain sections of case 16R. Five penetrations are reported on sectionA, three that reach area V6A in the dorsal part of APO (penetrations a,b, c), and two reaching area V6 in the deepest part of APO (d, e).Looking at the sequences of receptive-field locations shown in the insetsof the figure, it is evident the different behaviour in the two corticalareas. In area V6, successive receptive fields encountered along eachpenetration showed a small, ‘physiological’ scattering: they remainedmore or less in the same spatial location, or moved away jerkily but insmall steps and, on average, towards the same direction. In contrast, alarge scattering of receptive fields was usually observed in area V6A.Receptive fields in this area could remain in the same spatial location
FIG. 5. Real-position cell distribution in the caudal SPL. Circles on the 2Dmap of the caudal pole of SPL indicate locations of cells tested for real-position behaviour. Filled symbols are locations of real-position cells, emptysymbols of retinotopically organized visual cells. Data are derived from sixhemispheres. Dashed line indicates the average location in the six hemispheresof the border between areas V6 and V6A. Details on 2D map as in Fig. 1.
Functional organization of area V6A 579
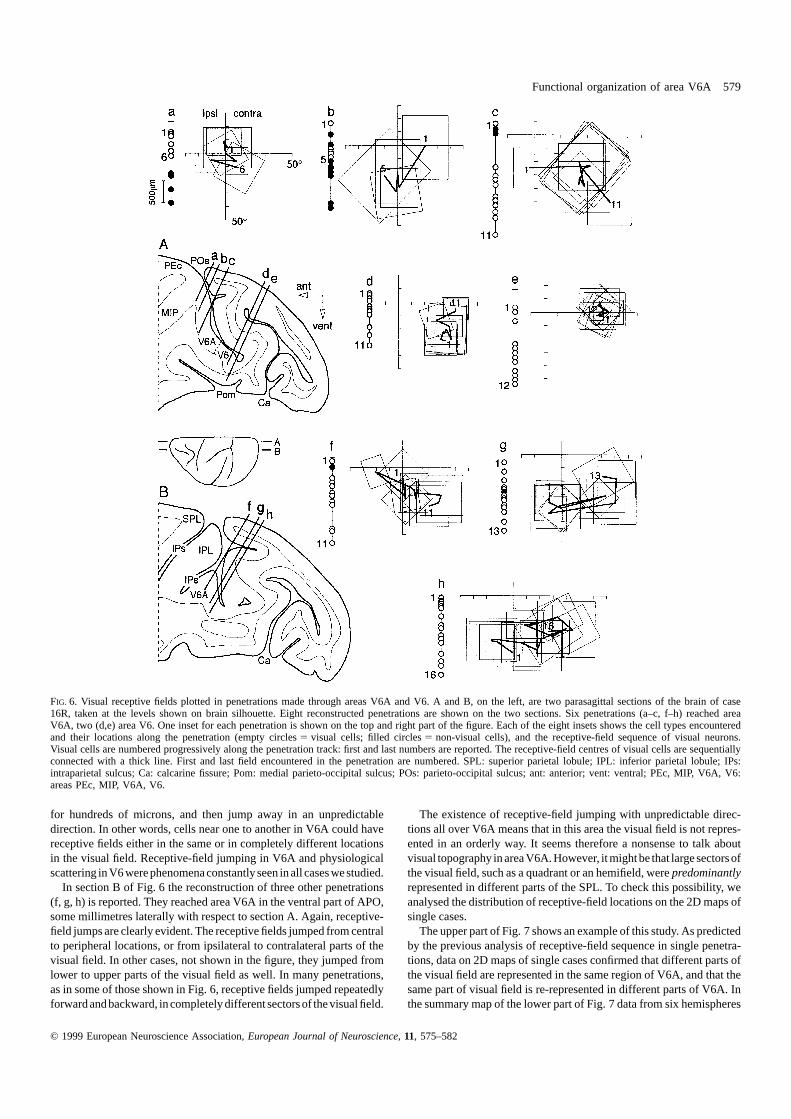
FIG. 6. Visual receptive fields plotted in penetrations made through areas V6A and V6. A and B, on the left, are two parasagittal sections of the brain of case16R, taken at the levels shown on brain silhouette. Eight reconstructed penetrations are shown on the two sections. Six penetrations (a–c, f–h) reached areaV6A, two (d,e) area V6. One inset for each penetration is shown on the top and right part of the figure. Each of the eight insets shows the cell types encounteredand their locations along the penetration (empty circles5 visual cells; filled circles5 non-visual cells), and the receptive-field sequence of visual neurons.Visual cells are numbered progressively along the penetration track: first and last numbers are reported. The receptive-field centres of visual cells are sequentiallyconnected with a thick line. First and last field encountered in the penetration are numbered. SPL: superior parietal lobule; IPL: inferior parietal lobule; IPs:intraparietal sulcus; Ca: calcarine fissure; Pom: medial parieto-occipital sulcus; POs: parieto-occipital sulcus; ant: anterior; vent: ventral; PEc, MIP, V6A, V6:areas PEc, MIP, V6A, V6.
for hundreds of microns, and then jump away in an unpredictabledirection. In other words, cells near one to another in V6A could havereceptive fields either in the same or in completely different locationsin the visual field. Receptive-field jumping in V6A and physiologicalscattering inV6 werephenomenaconstantlyseen in all caseswestudied.
In section B of Fig. 6 the reconstruction of three other penetrations(f, g, h) is reported. They reached area V6A in the ventral part of APO,some millimetres laterally with respect to section A. Again, receptive-field jumps are clearly evident. The receptive fields jumped from centralto peripheral locations, or from ipsilateral to contralateral parts of thevisual field. In other cases, not shown in the figure, they jumped fromlower to upper parts of the visual field as well. In many penetrations,as in some of those shown in Fig. 6, receptive fields jumped repeatedlyforwardandbackward, incompletely differentsectorsof thevisual field.
© 1999 European Neuroscience Association,European Journal of Neuroscience, 11, 575–582
The existence of receptive-field jumping with unpredictable direc-tions all over V6A means that in this area the visual field is not repres-ented in an orderly way. It seems therefore a nonsense to talk aboutvisual topography in areaV6A.However, it mightbe that large sectorsofthe visual field, such as a quadrant or an hemifield, werepredominantlyrepresented in different parts of the SPL. To check this possibility, weanalysed the distribution of receptive-field locations on the 2D maps ofsingle cases.
The upper part of Fig. 7 shows an example of this study. As predictedby the previous analysis of receptive-field sequence in single penetra-tions, data on 2D maps of single cases confirmed that different parts ofthe visual field are represented in the same region of V6A, and that thesame part of visual field is re-represented in different parts of V6A. Inthe summary map of the lower part of Fig. 7 data from six hemispheres
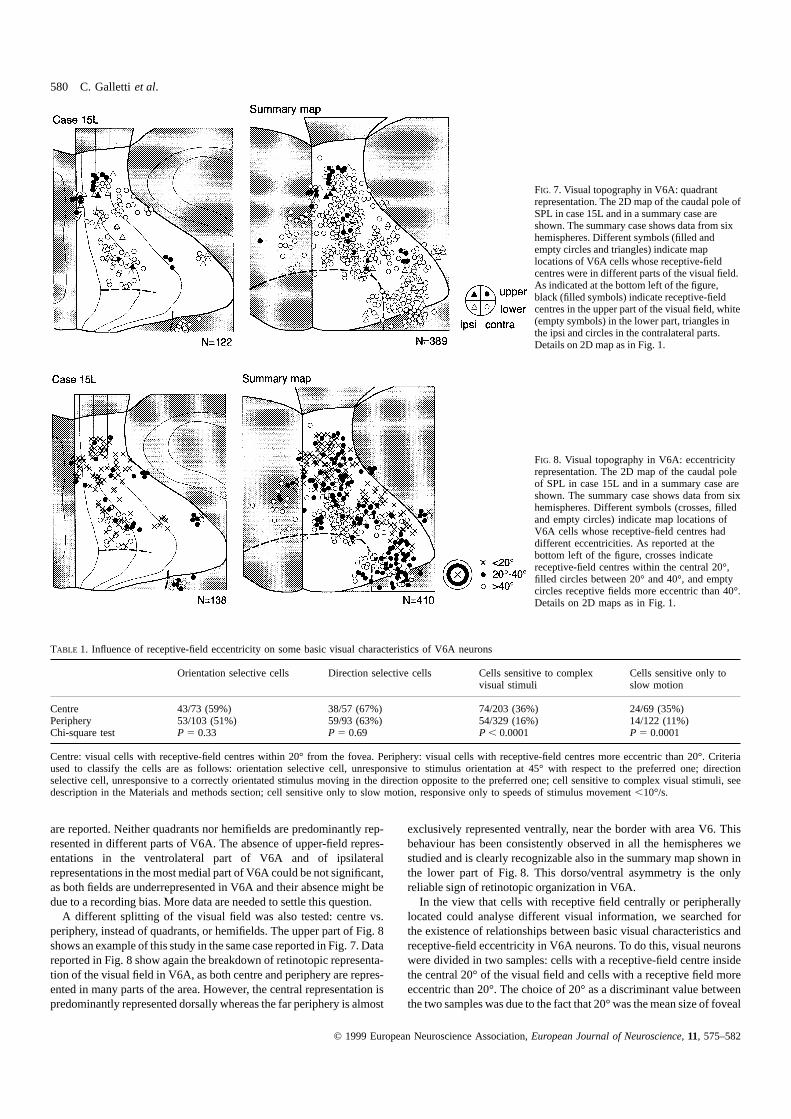
580 C. Gallettiet al.
FIG. 7. Visual topography in V6A: quadrantrepresentation. The 2D map of the caudal pole ofSPL in case 15L and in a summary case areshown. The summary case shows data from sixhemispheres. Different symbols (filled andempty circles and triangles) indicate maplocations of V6A cells whose receptive-fieldcentres were in different parts of the visual field.As indicated at the bottom left of the figure,black (filled symbols) indicate receptive-fieldcentres in the upper part of the visual field, white(empty symbols) in the lower part, triangles inthe ipsi and circles in the contralateral parts.Details on 2D map as in Fig. 1.
FIG. 8. Visual topography in V6A: eccentricityrepresentation. The 2D map of the caudal poleof SPL in case 15L and in a summary case areshown. The summary case shows data from sixhemispheres. Different symbols (crosses, filledand empty circles) indicate map locations ofV6A cells whose receptive-field centres haddifferent eccentricities. As reported at thebottom left of the figure, crosses indicatereceptive-field centres within the central 20°,filled circles between 20° and 40°, and emptycircles receptive fields more eccentric than 40°.Details on 2D maps as in Fig. 1.
TABLE 1. Influence of receptive-field eccentricity on some basic visual characteristics of V6A neurons
Orientation selective cells Direction selective cells Cells sensitive to complex Cells sensitive only tovisual stimuli slow motion
Centre 43/73 (59%) 38/57 (67%) 74/203 (36%) 24/69 (35%)Periphery 53/103 (51%) 59/93 (63%) 54/329 (16%) 14/122 (11%)Chi-square test P 5 0.33 P 5 0.69 P , 0.0001 P 5 0.0001
Centre: visual cells with receptive-field centres within 20° from the fovea. Periphery: visual cells with receptive-field centres more eccentric than 20°. Criteriaused to classify the cells are as follows: orientation selective cell, unresponsive to stimulus orientation at 45° with respect to the preferred one; directionselective cell, unresponsive to a correctly orientated stimulus moving in the direction opposite to the preferred one; cell sensitive to complex visual stimuli, seedescription in the Materials and methods section; cell sensitive only to slow motion, responsive only to speeds of stimulus movement,10°/s.
are reported. Neither quadrants nor hemifields are predominantly rep-resented in different parts of V6A. The absence of upper-field repres-entations in the ventrolateral part of V6A and of ipsilateralrepresentations in the most medial part of V6A could be not significant,as both fields are underrepresented in V6A and their absence might bedue to a recording bias. More data are needed to settle this question.
A different splitting of the visual field was also tested: centre vs.periphery, instead of quadrants, or hemifields. The upper part of Fig. 8shows an example of this study in the same case reported in Fig. 7. Datareported in Fig. 8 show again the breakdown of retinotopic representa-tion of the visual field in V6A, as both centre and periphery are repres-ented in many parts of the area. However, the central representation ispredominantly represented dorsally whereas the far periphery is almost
© 1999 European Neuroscience Association,European Journal of Neuroscience, 11, 575–582
exclusively represented ventrally, near the border with area V6. Thisbehaviour has been consistently observed in all the hemispheres westudied and is clearly recognizable also in the summary map shown inthe lower part of Fig. 8. This dorso/ventral asymmetry is the onlyreliable sign of retinotopic organization in V6A.
In the view that cells with receptive field centrally or peripherallylocated could analyse different visual information, we searched forthe existence of relationships between basic visual characteristics andreceptive-field eccentricity in V6A neurons. To do this, visual neuronswere divided in two samples: cells with a receptive-field centre insidethe central 20° of the visual field and cells with a receptive field moreeccentric than 20°. The choice of 20° as a discriminant value betweenthe two samples was due to the fact that 20° was the mean size of foveal
Functional organization of area V6A 581
receptive fields in V6A (see Fig. 3). As reported in Table 1, this analysisshowed that the percentages of cells selective for orientation and direc-tion of movement, although highly represented in V6A, were not signi-ficantly different in central vs. peripheral samples. On the contrary,cells activated only by complex visual stimuli and cells sensitive onlyto very slow speeds of movement (below 10°/s; most of them (17of 24) well responsive also to stationary stimuli) were much morerepresented in the central sample than in the peripheral one.
Discussion
In a previous paper we described the functional and anatomical tools torecognize the cortical visual areas V6 and V6A in the APO in macaquemonkey (Gallettiet al., 1996). The present work describes brain loca-tion, extent and visuotopic organization of one of them, area V6A.
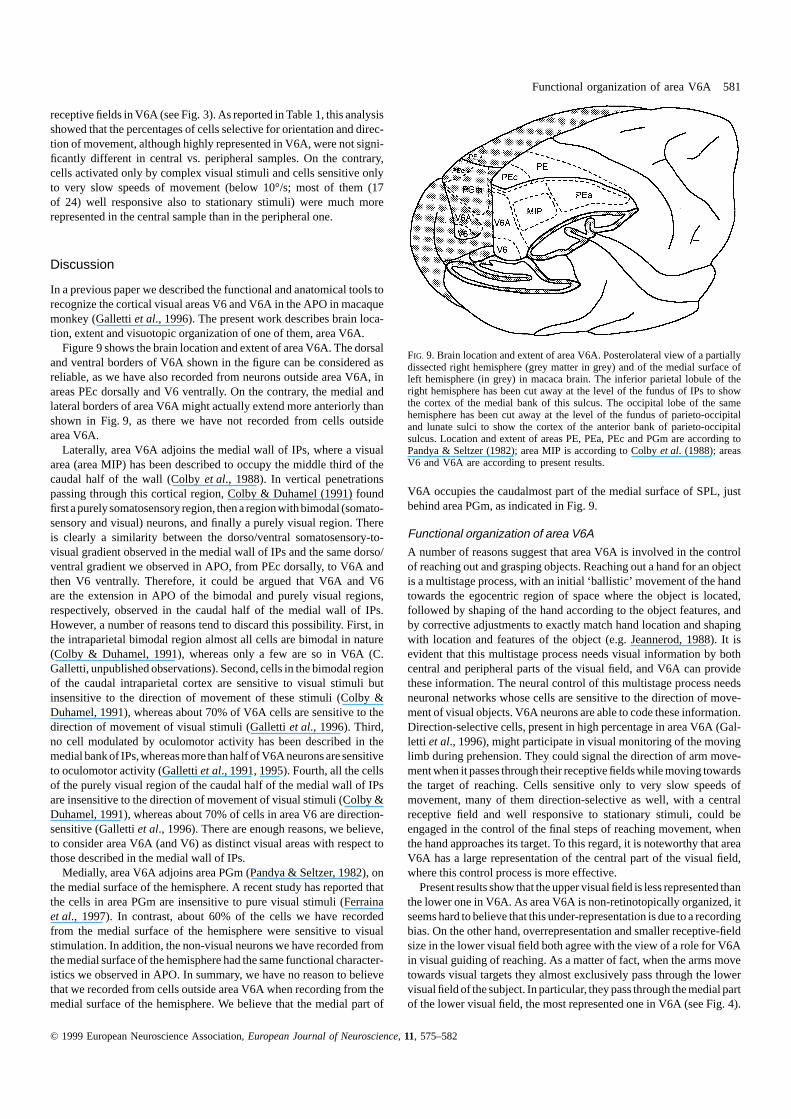
Figure 9 shows the brain location and extent of area V6A. The dorsaland ventral borders of V6A shown in the figure can be considered asreliable, as we have also recorded from neurons outside area V6A, inareas PEc dorsally and V6 ventrally. On the contrary, the medial andlateral borders of area V6A might actually extend more anteriorly thanshown in Fig. 9, as there we have not recorded from cells outsidearea V6A.
Laterally, area V6A adjoins the medial wall of IPs, where a visualarea (area MIP) has been described to occupy the middle third of thecaudal half of the wall (Colbyet al., 1988). In vertical penetrationspassing through this cortical region, Colby & Duhamel (1991) foundfirsta purelysomatosensory region, then a region withbimodal (somato-sensory and visual) neurons, and finally a purely visual region. Thereis clearly a similarity between the dorso/ventral somatosensory-to-visual gradient observed in the medial wall of IPs and the same dorso/ventral gradient we observed in APO, from PEc dorsally, to V6A andthen V6 ventrally. Therefore, it could be argued that V6A and V6are the extension in APO of the bimodal and purely visual regions,respectively, observed in the caudal half of the medial wall of IPs.However, a number of reasons tend to discard this possibility. First, inthe intraparietal bimodal region almost all cells are bimodal in nature(Colby & Duhamel, 1991), whereas only a few are so in V6A (C.Galletti, unpublished observations). Second, cells in the bimodal regionof the caudal intraparietal cortex are sensitive to visual stimuli butinsensitive to the direction of movement of these stimuli (Colby &Duhamel, 1991), whereas about 70% of V6A cells are sensitive to thedirection of movement of visual stimuli (Gallettiet al., 1996). Third,no cell modulated by oculomotor activity has been described in themedial bank of IPs, whereas more than half of V6A neurons are sensitiveto oculomotor activity (Gallettiet al., 1991, 1995). Fourth, all the cellsof the purely visual region of the caudal half of the medial wall of IPsare insensitive to the direction of movement of visual stimuli (Colby &Duhamel, 1991), whereas about 70% of cells in area V6 are direction-sensitive (Gallettiet al., 1996). There are enough reasons, we believe,to consider area V6A (and V6) as distinct visual areas with respect tothose described in the medial wall of IPs.
Medially, area V6A adjoins area PGm (Pandya & Seltzer, 1982), onthe medial surface of the hemisphere. A recent study has reported thatthe cells in area PGm are insensitive to pure visual stimuli (Ferrainaet al., 1997). In contrast, about 60% of the cells we have recordedfrom the medial surface of the hemisphere were sensitive to visualstimulation. In addition, the non-visual neurons we have recorded fromthe medial surface of the hemisphere had the same functional character-istics we observed in APO. In summary, we have no reason to believethat we recorded from cells outside area V6A when recording from themedial surface of the hemisphere. We believe that the medial part of
© 1999 European Neuroscience Association,European Journal of Neuroscience, 11, 575–582
FIG. 9. Brain location and extent of area V6A. Posterolateral view of a partiallydissected right hemisphere (grey matter in grey) and of the medial surface ofleft hemisphere (in grey) in macaca brain. The inferior parietal lobule of theright hemisphere has been cut away at the level of the fundus of IPs to showthe cortex of the medial bank of this sulcus. The occipital lobe of the samehemisphere has been cut away at the level of the fundus of parieto-occipitaland lunate sulci to show the cortex of the anterior bank of parieto-occipitalsulcus. Location and extent of areas PE, PEa, PEc and PGm are according toPandya & Seltzer (1982); area MIP is according to Colbyet al. (1988); areasV6 and V6A are according to present results.
V6A occupies the caudalmost part of the medial surface of SPL, justbehind area PGm, as indicated in Fig. 9.
Functional organization of area V6A
A number of reasons suggest that area V6A is involved in the controlof reaching out and grasping objects. Reaching out a hand for an objectis a multistage process, with an initial ‘ballistic’ movement of the handtowards the egocentric region of space where the object is located,followed by shaping of the hand according to the object features, andby corrective adjustments to exactly match hand location and shapingwith location and features of the object (e.g. Jeannerod, 1988). It isevident that this multistage process needs visual information by bothcentral and peripheral parts of the visual field, and V6A can providethese information. The neural control of this multistage process needsneuronal networks whose cells are sensitive to the direction of move-ment of visual objects. V6A neurons are able to code these information.Direction-selective cells, present in high percentage in area V6A (Gal-letti et al., 1996), might participate in visual monitoring of the movinglimb during prehension. They could signal the direction of arm move-ment when it passes through their receptive fields while moving towardsthe target of reaching. Cells sensitive only to very slow speeds ofmovement, many of them direction-selective as well, with a centralreceptive field and well responsive to stationary stimuli, could beengaged in the control of the final steps of reaching movement, whenthe hand approaches its target. To this regard, it is noteworthy that areaV6A has a large representation of the central part of the visual field,where this control process is more effective.
Present results show that the upper visual field is less represented thanthe lower one in V6A. As area V6A is non-retinotopically organized, itseems hard to believe that this under-representation is due to a recordingbias. On the other hand, overrepresentation and smaller receptive-fieldsize in the lower visual field both agree with the view of a role for V6Ain visual guiding of reaching. As a matter of fact, when the arms movetowards visual targets they almost exclusively pass through the lowervisual field of the subject. In particular, they pass through the medial partof the lower visual field, the most represented one in V6A (see Fig. 4).
582 C. Gallettiet al.
To grasp an object, it is necessary to know its location in space.Everybody can reach out the location of visual targets without visualfeedback and independently of the location of target image on theretinas (i.e. independent of the position of the eye, head or body). Toallow this,one cansuppose that themotor systemcontrolling prehensionuses representations of visual stimuli mapped in body-centred coordin-ates rather than retinal coordinates. In area V6A, these coordinates aredirectlyencoded by real-position cells (Gallettiet al., 1993). As recentlysuggested by Gallettiet al. (1995), the real-position behaviour could bethe result of inputs coming from gaze-dependent visual cells whosereceptive fields are in completely different parts of the visual field. Inthis view, the large scattering of visual receptive fields observed in V6Acouldbeuseful tobuild-up the real-positionbehaviour in localnetworks.Note that in V6A a large part of the visual field is repeatedly representedin small cortical regions (see penetrations a, b, c in Fig. 6A and f, g, hin Fig. 6B). Each one of these restricted cortical regions could be a localnetwork devoted to building up the real-position behaviour.
We suggested (Gallettiet al., 1993, 1995, 1996) that the real-positioncells send information about the spatial coordinates of visual objects tothe dorsal frontal cortex, where premotor arm movement-related neu-rons were described (Caminitiet al., 1991). Recent data confirm thepresence of direct, strong connection between V6A and dorsal frontalcortex (Matelliet al., 1995; Shipp & Zeki, 1995). Premotor neurons indorsal area 6 could use real-position input to direct the initial, ‘ballistic’movement of reaching action towards the target of reaching. In turn,premotor frontal neurons could send an efference copy of the motorcommand back to area V6A, as suggested by the presence of armmovement-related neurons in V6A (Gallettiet al., 1997a), for matchingthe willingness and effectiveness of the motor act. In agreement withthis view, patients with damage in the caudal pole of SPL are unable toreach out for objects present in their visual field (Perenin & Vighetto,1988). They did not show pure motor deficits. Patients are unable topick-up a cup of coffee from the table and have great difficulty inplacing it back, but have no problem in bringing the cup to the mouthand drink the coffee if someone put it in their hands (McCarthy &Warrington, 1990). It has been clearly demonstrated that these patientsare impaired in directing the hand towards a visual target when a ballisticmovement is required (Ratcliff & Davies-Jones, 1972). In other words,although they see the target, they are not able to use information aboutits spatial location to direct hand movement.
As previously mentioned, the knowledge of object spatial location isnot enough to grasp it; it is also necessary to know its size, form andorientation in space, in order to adapt grip aperture and hand orientationto the visual features of the object to be reached out. Many V6A neuronsare very sensitive to the orientation of stationary visual stimuli (Gallettiet al., 1996), and most of the cells sensitive to complex shapes havereceptive fields in the central part of the visual field. Area V6A couldthus provide critical visual information to the motor structures control-ling orientation of the hand during arm-reaching movements. The fibresdirectly connecting V6A with dorsal frontal cortex besides conveyingthe spatial coordinates of the target of reaching could convey also thistype of information, and this could explain why patients with damagein the caudal pole of SPL are not only impaired in directing arm-reaching movements, but also in orienting the hand according to theobject features (Perenin & Vighetto, 1988).
Acknowledgements
The authors wish to thank L. Sabattini and G. Mancinelli for mechanical andelectronic assistance, S. Boninsegna for technical assistance during experiments,and Chemical Industries Bracco S.p.A. for supplying the neurosurgical cement
© 1999 European Neuroscience Association,European Journal of Neuroscience, 11, 575–582
(Refobacin-Palacos R, Merck, Germany). This work was supported by Grantsfrom Ministero dell9Universitae della Ricerca Scientifica e Tecnologica andConsiglio Nazionale delle Ricerche, Italy.
AbbreviationsANCOVA, analysis of covariance; APO, anterior bank of parieto-occipital sulcus;IPL, inferior parietal lobule; IPs, intraparietal sulcus; MIP, medial intraparietalarea; PEc, caudal PE area; PGm, medial PG area; PO, parieto-occipital area;SPL, superior parietal lobule.
ReferencesBach, M., Bouis, D. & Fischer, B. (1983) An accurate and linear infrared
oculometer.J. Neurosci. Methods, 9, 9–14.Brodmann, K. (1909)Vergleichende Localisationslehre der Grosshirnrinde in
Ihren Prinzipien Dargestellt auf Grund des Zellenbaues. Barth, Leipzig.Caminiti, R., Johnson, P.B., Galli, C., Ferraina, S. & Burnod, Y. (1991) Making
arm movements within different parts of space: the premotor and motorcortical representation of a coordinate system for reaching to visual targets.J. Neurosci., 11, 1182–1197.
Colby, C.L. & Duhamel, J.R. (1991) Heterogeneity of extrastriate visual areasand multiple parietal areas in the macaque monkey.Neuropsychologia, 29,517–537.
Colby, C.L., Gattass, R., Olson, C.R. & Gross, C.G. (1988) Topographicalorganization of cortical afferents to extrastriate visual area PO in the macaque:A dual tracer study.J. Comp. Neurol., 269, 392–413.
Ferraina, S., Garasto, M.R., Battaglia-Mayer, A., Ferraresi, P., Johnson, P.B.,Laquaniti, F. & Caminiti, R. (1997) Visual control of hand-reachingmovement: activity in parietal area 7m.Eur. J. Neurosci., 9, 1090–1095.
Galletti, C., Battaglini, P.P. & Fattori, P. (1991) Functional properties of neuronsin the anterior bank of the parieto-occipital sulcus of the macaque monkey.Eur. J. Neurosci., 3, 452–461.
Galletti, C., Battaglini, P.P. & Fattori, P. (1993) Parietal neurons encoding spatiallocations in craniotopic coordinates.Exp. Brain Res., 96, 221–229.
Galletti, C., Battaglini, P.P. & Fattori, P. (1995) Eye position influence on theparieto-occipital area PO (V6) of the macaque monkey.Eur. J. Neurosci., 7,2486–2501.
Galletti, C., Fattori, P., Battaglini, P.P., Shipp, S. & Zeki, S. (1996) Functionaldemarcation of a border between areas V6 and V6A in the superior parietalgyrus of the macaque monkey.Eur. J. Neurosci., 8, 30–52.
Galletti, C., Fattori, P., Kutz, D.F. & Battaglini, P.P. (1997a) Arm movement-related neurons in the visual area V6A of the macaque superior parietal lobule.Eur. J. Neurosci., 9, 410–414.
Galletti, C., Fattori, P., Kutz, D.F. & Gamberini, M. (1997b) Visual topographyand cortical distribution of non-visual activities in area V6A of macaquesuperior parietal lobule.Soc. Neurosci. Abstr., 23, 604.13.
Jeannerod, M. (1988)The neural and behavioural organization of goal-directedmovements.Oxford University Press, Oxford.
Matelli, M., Luppino, G., D’Amelio, M., Fattori, P. & Galletti, C. (1995) Frontalprojections of a visual area (V6A) of the superior parietal lobule in macaquemonkey.Soc. Neurosci. Abstr., 21, 169.8.
McCarthy, R. & Warrington, E.K. (1990)Cognitive Neuropsychology, a ClinicalIntroduction.Academic Press, San Diego.
Pandya, D.N. & Seltzer, B. (1982) Intrinsic connections and architectonics ofposteriorparietal cortex in therhesusmonkey.J.Comp.Neurol.,204,196–210.
Perenin, M.T. & Vighetto, A. (1988) Optic ataxia: a specific disruption invisuomotor mechanisms. I. Different aspects of the deficit in reaching forobjects.Brain, 111, 643–674.
Ratcliff, G. & Davies-Jones, G.A.B. (1972) Defective visual localization in focalbrain wounds.Brain, 95, 49–60.
Shipp, S. & Zeki, S. (1995) Direct visual input to premotor cortex from superiorparietal cortex (areas V6 and V6A) in the macaque monkey.Eur. J. Neurosci.,7 (Suppl. 8), 32.24.
Stein, J.F. (1991) Space and the parietal association areas. In Paillard, J. (ed),Brain and Space.Oxford University Press, Oxford, pp. 185–222.
Suzuki, H. & Azuma, M. (1976) A glass-insulated ‘elgiloy’ microelectrode forrecording unit activity in chronic monkey experiments.Electroencephalogr.Clin. Neurophysiol., 41, 93–95.
Van Essen, D.C. & Zeki, S.M. (1978) The topographic organization of rhesusmonkey prestriate cortex.J. Physiol. (London), 277, 193–226.
Von Bonin, G. & Bailey, P. (1947)The Neocortex ofMacaca mulatta. Universityof Illinois Press, Urbana.


