Embed Size (px)
Citation preview

Brain structure and function in
Huntington’s disease gene carriers far
from predicted disease onset
Thesis submitted for the degree of Doctor of
Philosophy
Paul David Zeun
Institute of Neurology
University College London
2021

1
For the HD community

2
Declaration of Authorship
I, Paul Zeun, confirm that the work presented in this thesis is my own. Where
information has been derived from other sources, I confirm that this has been
indicated in the thesis.

3
Abstract
Whilst there are currently no available disease modifying therapies for Huntington’s
Disease (HD), recent progress in huntingtin-lowering strategies hold great promise.
Initiating therapies early in the disease course will be important and a complete
characterisation of the premanifest period will help inform when to initiate disease
modifying therapies and the biomarkers that may be useful in such trials.
Previous research has characterised the premanifest period up to approximately 15
years from predicted onset, but even at this early stage the disease process is already
underway as evidenced by striatal and white matter atrophy, reductions in structural
connectivity within brain networks, rising biofluid biomarkers of neuronal dysfunction,
elevations in psychiatric symptoms and emerging subtle cognitive impairments. In
order to understand how early neurodegeneration can be detected and which
measures are most sensitive to the early disease processes, we need to look even
earlier in the disease course.
This thesis documents the recruitment and analysis of the HD Young Adult Study: a
premanifest cohort further from predicted clinical onset than previously studied with
an average of 24 years prior to predicted onset. Differences between gene carriers
and controls were examined across a range of imaging, cognitive, neuropsychiatric
and biofluid measures. The structural and functional brain connectivity in this cohort
is then investigated in further detail. By providing a detailed characterisation of brain
structure and function in the early premanifest period along with the most sensitive
biomarkers at this stage, this work will inform future treatment strategies that may
seek to delay the onset of functional impairments in HD.

4
Impact Statement
Recent advances in therapeutic approaches targeting DNA and RNA hold great
promise for Huntington’s disease (HD), since they are capable of targeting the
causative genetic mutation and the resultant mutant huntingtin protein (mHTT)
thought to be central in the disease process. The first huntingtin-lowering approach
is now is a phase 3 clinical trial. Such treatments are most likely to be successful if
instigated early in the disease process and ideally, before function is impaired.
Previous research has characterised the premanifest period up until 15 years from
predicted onset. Even at this stage, there is already ongoing neurodegeneration
detectable on imaging and biofluid measures coupled with subtle early cognitive
impairment and neuropsychiatric disturbance. Therefore we need to look back even
earlier in the disease process to understand when these changes first become
detectable and which measures may be most sensitive at this stage, in order to inform
future therapeutic strategies that seek to delay or prevent early neurodegeneration
and preserve clinical function.
The central work in this thesis is the recruitment and study of a unique premanifest
HD cohort who, at approximately 24 years from predicted clinical disease onset, are
further from onset than previously studied, alongside a well matched control group.
This is one of the earliest premanifest cohorts ever studied in neurodegenerative
diseases. The study assessments included a state-of-the-art battery including multi-
modal imaging, extensive cognitive and neuropsychiatric testing, and blood and
cerebrospinal fluid for biofluid biomarker assessments.
There are four key findings from this thesis that will be influential in future therapeutic
strategies for HD. The first is that cognitive and neuropsychiatric function appears
intact approximately 24 years from predicted onset and hence this represents a
potentially appropriate time to initiate future disease-modifying therapies that aim to
delay or prevent early functional impairments in HD. Second, the finding that brain
structure as assessed by multi-modal imaging appears largely intact at this stage of
disease, further highlighting that brain structure and function is largely preserved early
in the premanifest period. The detailed characterisation of normal structural
connectivity in this cohort will be important for future viral-vector delivered therapies,

5
since the distribution of these therapeutics can be limited and depends partly on
preserved axonal connections. Thirdly, this thesis demonstrates that despite showing
largely preserved brain structure and function, cerebrospinal fluid (CSF) and plasma
concentrations of neurofilament light (NfL), a marker of neuroaxonal injury, are
already elevated alongside a detectable marker of astrocytic activation, YKL-40.
Thus, NfL appears to be one of the earliest detectable markers of neurodegeneration
and may be the most suitable biomarker to monitor progression and, eventually,
efficacy for future premanifest trials. Importantly, this work demonstrates that CSF
NfL has superior sensitivity/specificity than plasma NfL at this early stage and may be
a superior disease marker in such cohorts. Finally, huntingtin-lowering therapies in
development will require biomarkers of target engagement to assist in measuring the
pharmacodynamic response and identifying optimal dose-responses. This work
shows that suppression of CSF mHTT to undetectable concentrations could be a
viable measure of target engagement for such trials. However, because
concentrations of mHTT are frequently only just above the detection limit at this early
stage, CSF total huntingtin, measured in this thesis for the first time in HD, could be
used to provide a measure of percentage huntingtin reduction for total huntingtin-
lowering trials. Collectively, these results are likely to have a major impact on the
direction and design of future clinical trials in premanifest HD.
Each results chapter of this thesis has resulted in publishable work. The results of the
HD Young Adult Study have been published in the Lancet Neurology, whilst results
from the other two data chapters have been written up for publication. This work has
also been presented at several global conferences via platform talks and poster
presentations.

6
Acknowledgements
Firstly, I’d like to thank all participants who gave their valuable time to participate in
this research. I was so impressed and inspired by their commitment and resolve in
the pursuit of advancing Huntington’s research. I would also like to thank the
Wellcome Trust for funding this important work.
Thank you Sarah Tabrizi and Geraint Rees for bringing me to the UCL HD centre and
putting your trust in me. You have always been available, supportive and it has been
an honour to work under your guidance on such a great project.
Thanks to everyone who worked on the HD-YAS. It was a great collaborative project
to work on together and an amazing team to work with. To the HD clinical and
research team at UCL, I wanted to express my gratitude for your help and just how
much I have enjoyed being part of the team.
Special thanks to Peter McColgan, Rachael Scahill, Sarah Gregory, Eileanoir
Johnson and Marina Papoutsi for all of your support throughout this PhD and for
always being on hand to help whenever it was needed. I wouldn’t have been able to
do this without you.
Finally, I’d like to thank my wife and family for their love and support.

7
Contents
List of Tables ......................................................................................................... 13
List of Figures ........................................................................................................ 15
Abbreviations ......................................................................................................... 17
1 Introduction .................................................................................................... 20
1.1 Huntington’s disease ............................................................................... 21
1.1.1 Genetics ........................................................................................... 21
1.1.2 Neurobiology .................................................................................... 22
1.1.3 Pathology ......................................................................................... 25
1.1.4 Clinical manifestations ...................................................................... 26
1.1.5 Current therapeutic approaches for disease modification ................. 27
1.2 The premanifest period ............................................................................ 28
1.2.1 Predicting years to clinical onset ....................................................... 29
1.2.2 Motor ................................................................................................ 31
1.2.3 Cognition .......................................................................................... 31
1.2.4 Psychiatric ........................................................................................ 33
1.2.5 Biofluids ............................................................................................ 35
1.2.6 Imaging ............................................................................................ 39
1.3 Structural and functional connectivity in HD ............................................. 46
1.3.1 Structural connectivity breakdown in preHD ..................................... 47
1.3.2 Functional connectivity in preHD ...................................................... 48
1.3.3 The relationship between structural and functional connectivity in preHD
51

8
1.4 The Scope of this thesis ........................................................................... 51
1.4.1 Towards a better understanding of the early premanifest period in HD
51
1.4.2 Thesis aims ...................................................................................... 53
2 General methods ............................................................................................ 54
2.1 Cohorts .................................................................................................... 55
2.1.1 The HD Young Adult Study (HD-YAS) .............................................. 55
2.1.2 The TrackOn-HD Study .................................................................... 57
2.2 Genetic testing ......................................................................................... 57
2.3 Demographic and general clinical assessments ....................................... 58
2.4 Motor and functional assessments ........................................................... 58
2.5 Cognitive assessments ............................................................................ 59
2.6 Neuropsychiatric assessments ................................................................ 64
2.7 Biofluid assessments ............................................................................... 66
2.8 MRI .......................................................................................................... 68
2.8.1 Acquisition of MRI data ..................................................................... 69
2.8.2 Volumetric imaging ........................................................................... 69
2.8.3 Multi-parametric mapping.................................................................. 70
2.8.4 Resting state fMRI ............................................................................ 71
2.8.5 Diffusion weighted imaging ............................................................... 71
2.9 Diffusion MRI processing ......................................................................... 73
2.9.1 Pre-processing .................................................................................. 73
2.9.2 Constrained spherical deconvolution ................................................ 74
2.9.3 Connectivity-based parcellations of the striatum and thalamus ......... 74
2.9.4 Tractography..................................................................................... 77
2.9.5 Fixel-based analysis ......................................................................... 77

9
2.9.6 Connectomics and graph theory ....................................................... 79
2.9.7 Statistical considerations .................................................................. 82
3 Clinical and biomarker profiling of gene carriers far from predicted onset: The
HD Young Adult Study (HD-YAS) .......................................................................... 85
3.1 Introduction .............................................................................................. 86
3.2 Contributions and collaborators ............................................................... 88
3.3 Methods................................................................................................... 89
3.3.1 Study design and participants ........................................................... 89
3.3.2 Procedures and outcomes ................................................................ 90
3.3.3 Participant follow up ......................................................................... 99
3.3.4 Statistical analysis ............................................................................ 99
3.4 Results .................................................................................................. 101
3.4.1 Cognition ........................................................................................ 103
3.4.2 Neuropsychiatry .............................................................................. 105
3.4.3 Imaging .......................................................................................... 107
3.4.4 Biofluids .......................................................................................... 113
3.5 Discussion ............................................................................................. 118
3.5.1 No significant differences in cognition, but some trends of interest . 120
3.5.2 No significant differences in behavioural or psychiatric symptoms .. 122
3.5.3 Little evidence of change in brain structure ..................................... 123
3.5.4 NfL is a promising biomarker of early neurodegeneration in HD ..... 125
3.5.5 Measures of target engagement for huntingtin-lowering therapeutics
126
3.5.6 Evidence of astrocytic activation in the early premanifest period .... 127
3.5.7 Other candidate fluid biomarkers for HD show limited change ........ 128
3.5.8 Limitations ...................................................................................... 129
3.5.9 Conclusion ...................................................................................... 132

10
4 Timing and specificity of basal ganglia white matter loss in premanifest HD . 133
4.1 Introduction ............................................................................................ 134
4.2 Contribution and Collaborators............................................................... 136
4.3 Methods ................................................................................................. 136
4.3.1 Cohorts ........................................................................................... 136
4.3.2 Diffusion MRI processing ................................................................ 138
4.3.3 Spatial correspondence .................................................................. 139
4.3.4 Generating a fixel map and fixel metrics ......................................... 140
4.3.5 Generating tracts for analysis ......................................................... 142
4.3.6 Clinical scales ................................................................................. 143
4.3.7 Statistical analysis .......................................................................... 144
4.4 Results ................................................................................................... 145
4.4.1 No significant differences in cortico-striatal and cortico-thalamic
connections 25 years from predicted onset .................................................. 145
4.4.2 Anatomically specific basal ganglia white matter loss in preHD ...... 147
4.4.3 FDC changes using multi-shell acquisition at last time point in TrackOn-
HD 150
4.4.4 Reductions in FDC correlate with a priori clinical measures ............ 153
4.4.5 Changes in FD and FC when analysed separately ......................... 154
4.5 Discussion ............................................................................................. 161
4.5.1 Selective vulnerability of specific cortico-striatal connections .......... 164
4.5.2 Selective vulnerability of cortico-thalamic connections .................... 166
4.5.3 No longitudinal changes detectable over a two year period............. 167
4.5.4 Relationships between changes in FDC and clinical measures ....... 168
4.5.5 Higher b-values increase signal-to-noise in FBA ............................. 169
4.5.6 Other methodological considerations .............................................. 170
4.5.7 Limitations ...................................................................................... 171

11
4.5.8 Conclusion ...................................................................................... 173
5 Relationships between structural and functional connectivity in gene carriers far
from onset............................................................................................................ 174
5.1 Introduction ............................................................................................ 175
5.2 Contributions and collaborators ............................................................. 178
5.3 Methods................................................................................................. 179
5.3.1 Cohorts ........................................................................................... 179
5.3.2 Imaging acquisitions ....................................................................... 179
5.3.3 Atlases for brain segmentation ....................................................... 180
5.4 Diffusion MRI processing ....................................................................... 181
5.5 fMRI acquisition and processing ............................................................ 182
5.6 Statistical analysis ................................................................................. 183
5.7 Results .................................................................................................. 184
5.7.1 No significant differences in structural and functional connections .. 184
5.7.2 NfL subgroup analysis results ......................................................... 184
5.7.3 Functional, but not structural connectivity, correlates with CSF NfL 185
5.8 Discussion ............................................................................................. 189
5.8.1 No significant differences in structural or functional networks in early
preHD 189
5.8.2 Negative results are robust to different methods of analysis ........... 190
5.8.3 Structural and functional associations with NfL ............................... 191
5.8.4 Future directions ............................................................................. 193
5.8.5 Limitations ...................................................................................... 195
5.8.6 Conclusion ...................................................................................... 195
6 Discussion ................................................................................................... 197
6.1 Uncovering the earliest markers of neurodegeneration in HD ................ 197
6.2 Zeroing in on selectively vulnerable structural connections in preHD ..... 201

12
6.3 Whole brain structural and functional connectivity is preserved in early
preHD, but rising NfL is associated with functional upregulation ....................... 202
6.4 Implications for future therapeutic strategies and trial design ................. 202
6.4.1 When to treat? ................................................................................ 203
6.4.2 Which biomarkers? ......................................................................... 203
6.4.3 Where to treat? ............................................................................... 205
6.5 YAS as a resource for further research .................................................. 207
6.6 General limitations and lessons learnt .................................................... 208
6.6.1 A question of power ........................................................................ 208
6.6.2 Selection bias ................................................................................. 209
6.6.3 Biofluid collection in young cohorts ................................................. 210
6.6.4 The power of collaboration .............................................................. 211
6.7 Future directions .................................................................................... 211
6.7.1 Longitudinal follow up in the HD-YAS ............................................. 211
6.7.2 Future multi-site studies to maximise power and generalisability .... 212
6.7.3 Combining the best established assessments with emerging techniques
212
6.7.4 Enhancing disease staging for natural history studies ..................... 214
6.7.5 Translating from observational to interventional studies in premanifest
HD 214
6.8 Conclusion ............................................................................................. 215
7 Publications .................................................................................................. 216
8 References ................................................................................................... 218
9 Appendix ...................................................................................................... 252
9.1 Disease burden score (DBS) ................................................................. 252
9.2 HD-YAS eligibility criteria ....................................................................... 252
9.3 TrackOn-HD eligibility criteria ................................................................. 255

13
9.4 UHDRS total motor score (TMS)............................................................ 257
9.5 UHDRS diagnostic confidence score (DCS) .......................................... 260
9.6 Graph theory calculations ...................................................................... 261
9.7 Chapter 4 missing data .......................................................................... 262
List of Tables
Table 2.1. Biofluid assay details ............................................................................. 67
Table 3.1. Assessments in HD-YAS....................................................................... 91
Table 3.2. Participant demographics .................................................................... 102
Table 3.3 Number of assessments by modality .................................................... 103
Table 3.4 Cognitive results .................................................................................. 104
Table 3.5 Neuropsychiatric results ....................................................................... 106
Table 3.6 Volumetric results ................................................................................ 108
Table 3.7 Diffusion results ................................................................................... 109
Table 3.8 Structural connectivity results ............................................................... 110
Table 3.9 MPM results ......................................................................................... 112
Table 3.10 Biofluid results .................................................................................... 115
Table 4.1. Participant demographics .................................................................... 137
Table 4.2. TrackOn-HD multi-shell acquisition subcohort ..................................... 138
Table 4.3. MRI acquisitions .................................................................................. 139
Table 4.4 Cortico-striatal FDC in HD-YAS ........................................................... 145
Table 4.5 Cortico-thalamic FDC in HD-YAS ......................................................... 146
Table 4.6 Cortico-striatal FDC in TrackOn-HD single-shell baseline .................... 147
Table 4.7 Cortico-thalamic FDC in TrackOn-HD single-shell baseline .................. 148
Table 4.8. Cortico-striatal FDC in TrackOn-HD single-shell longitudinal ............... 148
Table 4.9 Cortico-thalamic FDC in TrackOn-HD single-shell longitudinal ............. 149
Table 4.10 Cortico-striatal FDC TrackOn-HD multi-shell ...................................... 150
Table 4.11 Cortico-thalamic FDC TrackOn-HD multi-shell ................................... 150
Table 4.12 Correlations between a priori cortico-striatal and cortico-thalamic FDC
and corresponding clinical task ..................................................................... 154

14
Table 4.13 Cortico-striatal FD and FC in HD-YAS ................................................ 155
Table 4.14 Cortico-thalamic FD and FC in HD-YAS ............................................. 156
Table 4.15 Cortico-striatal FD and FC in TrackOn-HD single-shell baseline ......... 157
Table 4.16 Cortico-thalamic FD and FC in TrackOn-HD single-shell baseline ...... 158
Table 4.17 Cortico-striatal FD and FC in TrackOn-HD multi-shell......................... 159
Table 4.18 Cortico-thalamic FD and FC in TrackOn-HD multi-shell ...................... 160
Table 5.1 Participant demographics ..................................................................... 179
Table 5.2 Correlations between increasing functional connectivity and CSF NfL in
preHD ........................................................................................................... 186

15
List of Figures
Figure 1.1 Longitudinal changes in grey and white matter. .................................... 43
Figure 1.2 Atlas-based white matter DTI analysis. ................................................. 44
Figure 1.3 Example of limitation of tensor-based measures in regions with crossing
fibres............................................................................................................... 45
Figure 1.4 Functional connectivity changes in preHD. ........................................... 50
Figure 1.5. Evidence-based schematic of disease trajectory in HD from early
adulthood to manifest disease. ....................................................................... 52
Figure 2.1. Overview of HD-YAS assessments. ..................................................... 56
Figure 2.2. Composite image of CANTAB tests. .................................................... 62
Figure 2.3. Composite image of EMOTICOM tests. ............................................... 63
Figure 2.4. Examples of tensor shapes and DTI measures. ................................... 72
Figure 2.5. Striatal connectivity-based atlas. .......................................................... 76
Figure 2.6. Thalamic connectivity-based atlas. ...................................................... 77
Figure 2.7. Fixel-based metrics. ............................................................................. 79
Figure 2.8. Summary of global graph measures used in this thesis........................ 81
Figure 3.1. MPM and interpretation. ....................................................................... 95
Figure 3.2. Summary of connectivity processing pipeline. ...................................... 99
Figure 3.3. Radar plot showing cognitive variables in HD-YAS. ........................... 104
Figure 3.4. Radar plot showing neuropsychiatric variables in HD-YAS. ............... 106
Figure 3.5. Volumetric MRI results. ...................................................................... 108
Figure 3.6. Selected biofluid results. .................................................................... 114
Figure 3.7 ROC curves for CSF NfL (A), plasma NfL (B) and YKL-40 (C). ........... 116
Figure 3.8. NfL trajectories. .................................................................................. 117
Figure 3.9. Updated evidence based schematic of disease trajectory in HD. ....... 119
Figure 4.1 FOD-based directionally encoded colour map of population template. 140
Figure 4.2 Varying the threshold of the raw peak FOD amplitudes to produce
discrete set of fixels in TrackOn-HD. ............................................................. 141
Figure 4.3 Thresholding tract density images to create concise non-overlapping
tracts............................................................................................................. 143

16
Figure 4.4. Cortico-striatal tract fibre density and cross-section left and right in HD-
YAS (A+B), TrackOn-HD single-shell (B+C) and multi-shell (E+F) datasets. . 152
Figure 4.5. Cortico-thalamic tract fibre density and cross-section left and right in
HD-YAS (A+B), TrackOn-HD single-shell (C+D) and multi-shell (E+F) datasets.
..................................................................................................................... 153
Figure 4.6 Overview of study methodology and key cross-sectional results. ........ 162
Figure 5.1 Functional connectivity-based striatal atlas subdivisions. .................... 181
Figure 5.2 NBS correlation analysis of functional connections and CSF NfL. ....... 186

17
Abbreviations
ACT Anatomically constrained tractography
AD Axial diffusivity
AE Adverse event
AMI Apathy motivation index
ASO Antisense oligonucleotide
AUC Area under the curve
BAIS Baltimore irritability and apathy scale
BIS Barratt impulsivity scale
BDNF Brain derived neurotrophic factor
CANTAB Cambridge neuropsychological test automated battery
CAP CAG-Age product
CRISPR Clustered regularly interspaced short palindromic repeats
CSD Constrained spherical deconvolution
CSF Cerebrospinal fluid
DBS Disease burden score
DCS Diagnostic confidence score
DIAN Dominantly inherited Alzheimer’s disease
DTI Diffusion tensor imaging
DWI Diffusion weighted imaging
ELISA Enzyme-linked immunosorbent assay
EMA European Medicines Agency
EPI Echo planar imaging
FA Fractional anisotropy
FBA Fixel-based analysis
FC Fibre cross-section
FD Fibre density
FDA Food and drug administration
FDC Fibre density and cross-section
fMRI Functional magnetic resonance Imaging
FOD Fibre orientation distribution

18
FrSBE Frontal systems behavioural scale
FWE Family-wise error
FWF Free water fraction
GFAP Glial fibrillary acidic protein
GWAS Genome-wide association studies
HD Huntington’s disease
HD-YAS Huntington’s disease young adult study
IED Intra-extra dimensional set shifting
IL Interleukin
MALP-EM Multi-atlas label propagation with expectation maximisation-based
refinement
MD Mean diffusivity
mHTT Mutant huntingtin
MOS Medical outcomes study
MIDAS Metabolite imaging and data analysis system
MNI Montreal neurological institute
MPM Multi-parametric mapping
MRI Magnetic resonance imaging
MT Magnetisation transfer
NART National adult reading test
NBS Network-based statistics
NDI Neurite density index
NfL Neurofilament light
NODDI Neurite orientation dispersion and density imaging
OCI Obsessive-compulsive inventory
ODI Orientation dispersion index
OTS One-touch stockings of Cambridge
PAL Paired associates learning
PBA Problem behaviours assessment
PCR Polymerase chain reaction
PD Effective proton density
PET Positron emission tomography
preHD Premanifest Huntington’s disease

19
PSQI Pittsburgh sleep quality index
R1 Longitudinal relaxation rate
R2* Effective transverse relaxation rate
RNAi RNA interference
RD Radial diffusivity
ROC Receiver operating characteristic
ROI Region of interest
RVP Rapid visual information processing
SDMT Symbol digit modalities test
SCL-90 Symptom checklist-90-revised
SD Standard deviation
SDS Zung self-rating depression scale
SE Standard error
SF-36 Short-form health survey
SIFT Spherical-deconvolution informed filtering of tractograms
SMC Single molecule counting
STAI Spielberger state/trait anxiety
SST Stop signal test
SWM Spatial working memory
SWRT Stroop word reading test
tHTT Total huntingtin
T Tesla
TE Echo time
TFC Total functional capacity
TMS Total motor score
TR Repetition time
UCH-L1 Ubiquitin C-terminal Hydrolase L1
UHDRS Unified Huntington’s Disease Rating Scale

20
1 Introduction
In this introduction, I provide an overview of Huntington’s disease (HD), with particular
emphasis on the premanifest period. I reflect on recent progress in the search for
disease modifying treatments and the currently unanswered questions that may help
inform future treatment strategies.

21
1.1 Huntington’s disease
Huntington’s disease (HD) is a progressive neurodegenerative disease characterised
by neuropsychiatric symptoms, cognitive and motor impairment. Disease onset can
occur at any time in life, but the incidence is highest between 50-70 years (Evans et
al. 2013). Despite the identification of the causative mutation, a trinucleotide repeat
expansion in the Huntingtin gene in 1993 (The Huntington's Disease Collaborative
Research Group 1993), there are still no disease modifying therapies for this
devastating disease. The prevalence of HD worldwide is 2.7 per 100,000 (Pringsheim
et al. 2012). This varies between regions and is higher in Europe, North America and
Australia (5.7 per 100,000) and lower in Asia at 0.4 per 100,000. In the UK, prevalence
is 12.3 per 100,000 and it is estimated there are more than 5700 people, aged 21 or
more, with HD (Evans et al. 2013).
1.1.1 Genetics
HD is an autosomal dominant monogenic disorder caused by a CAG repeat
expansion within exon 1 of the HTT gene leading to the production of mutant
huntingtin (mHTT) protein (Bates et al. 2015). HD is fully penetrant in mutation
carriers with > 39 CAG repeats and the age of onset is inversely correlated with the
length of the expansion (Langbehn et al. 2010; Ross et al. 2014). Repeat lengths in
excess of 50 can lead to clinical onset before 21 years which is known as Juvenile
HD (Fusilli et al. 2018). Juvenile HD is associated with a different phenotype to adult
onset HD, presenting with a more rigid, bradykinetic clinical picture and faster
progression. In addition, magnetic resonance imaging (MRI) and post-mortem studies
show more severe striatal atrophy and less white matter involvement, underscoring
the phenotypic differences that distinguish this group from adult-onset HD (Fusilli et
al. 2018). Individuals with repeat lengths between 36-39 display reduced penetrance
where individuals may or may not develop HD symptoms over a typical lifespan
(Rubinsztein et al. 1996).
CAG repeat length shows a strong relationship with age of onset, accounting for 50-
70% of variability in age of onset (Langbehn et al. 2004; Lee et al. 2012). Genome-

22
wide association studies (GWAS) have uncovered other genes involved in DNA repair
that may account for some of the remaining variability in age of onset as well as the
rate of progression of HD (Hensman Moss et al. 2017; Goold et al. 2019). Recent
work suggests that uninterrupted CAG repeats rather than polyglutamine length may
be the dominant factor influencing age of onset (Genetic Modifiers of Huntington’s
Disease Consortium 2019).
Predictive testing via polymerase chain reaction (PCR) analysis is widely available in
the UK and sizing is accurate within ±1 repeat for alleles ≤42 and ±3 repeats for alleles
>42 (Losekoot et al. 2013). However current levels of uptake in the UK are low
(17.4%) with a median age at testing of 37 years (Baig et al. 2016).
1.1.2 Neurobiology
Although huntingtin-lowering therapies are now in clinical development, the precise
role of wild type huntingtin has yet to be fully characterised. It is an intracellular protein
which is ubiquitously expressed throughout all cell types although its expression is
higher in the central nervous system (CNS) than peripheral tissues (Saudou and
Humbert 2016). It appears to be involved in several cellular functions including in
vesicular trafficking, ciliogenesis, endocytosis, autophagy and transcriptional
regulation (Saudou and Humbert 2016). HTT knock out models are embryonically
lethal indicating it also has an essential role in neurodevelopment (Zeitlin et al. 1995;
Liu and Zeitlin 2017).
The HD mutation is thought to represent a toxic gain of function although the
mechanism of how this results in neuronal death is multifactorial and incompletely
understood (Bates et al. 2015). Full-length huntingtin is cleaved through proteolysis
to generate additional protein fragments, some of which can enter the nucleus. These
fragments can be retained in the nucleus forming inclusions and causing
transcriptional dysregulation. Huntingtin fragments also oligomerise and aggregate in
the cytoplasm (Bates et al. 2015). An amino-terminal HTT exon1 truncated protein
formed by aberrant splicing may also contribute to aggregation (Sathasivam et al.
2013). The presence of mutant huntingtin and its fragments leads to a diversity of
cellular impairments including synaptic dysfunction (Reddy and Shirendeb 2012;
Nithianantharajah and Hannan 2013), mitochondrial toxicity (Johri, Chandra et al.

23
2013), immune dysfunction (Ellrichmann et al. 2013) and decreased axonal transport
(Reddy and Shirendeb 2012). Together, these dysfunctions result in progressive
neuronal impairment, damage and death (Bates, Dorsey et al. 2015).
Synaptic and immune dysfunction may be particularly relevant in the early disease
process. Evidence for early synaptic dysfunction in HD includes altered transmission
and excitability in HD brains and animal models (Smith-Dijak et al. 2019). The
disruption of synaptic function and plasticity affects a variety of synaptic signalling
molecules over a range of neuronal types and brain structures. The cortico-striatal
synapse has been a particular focus of study and shows significant dysfunction before
the degeneration of the medium spiny neurons which predominate in the striatum
(Veldman and Yang 2018). Due to changes in subunit composition and localisation
of the glutamatergic NMDA receptor, as well as reduced function of glutamate
transporter 1, glutamatergic signalling at the cortico-striatal synapse more readily
engages pro-death signalling pathways (Smith-Dijak et al. 2019). Medium spiny
neurons also receive reduced trophic support from cortical projection neurons due to
reduced expression and trafficking of brain derived neurotrophic factor (BDNF),
resulting in pro-death rather than pro-survival plasticity pathways being activated. In
addition, the medium spiny neurons may receive increased inhibitory signalling due
to enhanced GABAergic input from striatal interneurons. Some of the alterations in
signalling, such as reduced transcription and transport of BDNF, are thought to be a
direct result of the effect of the CAG expansion on the function of mHTT, whilst others
appear to be the consequence of mHTT-mediated disruption of other related
pathways (Smith-Dijak et al. 2019). Collectively, such alterations increase neuronal
vulnerability to cell death. These changes appear to occur early in the disease
process, highlighted by the fact that premanifest Huntington’s disease (preHD)
human subjects demonstrate altered motor cortex plasticity and excitability long
before the onset of overt symptoms (Orth et al. 2010).
Immune dysfunction has also been an area of increasing focus in HD. Glial cells have
been shown to become dysregulated early in the disease course (Wilton and Stevens
2020). Such dysregulation can lead to the disruption of normal biological processes,
such as impaired myelination attributed to changes in oligodendrocyte biology (Jin et
al. 2015; Garcia-Miralles et al. 2019), but can also cause reactive changes, such as
24
the increased secretion of inflammatory cytokines by microglia (Crotti et al. 2014).
Several studies have demonstrated that cell-autonomous dysfunction driven by
mHTT in specific glial types is able to induce HD pathology and disease-related
impairments in motor and cognitive performance (Wilton and Stevens 2020).
Transcriptional dysregulation as a result of mHTT expression has been observed in
both oligodendrocytes and astrocytes and their common progenitor as well as earlier
stages of neural development, suggesting that their dysfunctional biology is apparent
at an early stage (Diaz-Castro et al. 2019; Osipovitch et al. 2019; Wilton and Stevens
2020). Underlining this, recent work has demonstrated mHTT-driven transcriptional
dysregulation in astrocytes becomes more pronounced over time and is reversed with
mHTT lowering (Diaz-Castro et al. 2019). It is still unclear whether glia facilitate or
mitigate HD pathogenesis, although the cell-autonomous pathology generated by
selective expression of mHTT and evidence of glial dysfunction early in the disease
course lends increasing weight that it is not simply a response to early neuronal
damage (Wilton and Stevens 2020). Understanding how markers of glial activity relate
to markers of neuronal damage in early preHD will be of specific interest in this regard.
Finally, increasing evidence for the role of somatic instability in HD pathogenesis is
emerging, supported by aforementioned findings that genetic variation in genes
involved in DNA repair are closely related to age of onset and rate of progression in
HD (Hensman Moss et al. 2017; Goold et al. 2019). Similar findings have been
reported in other CAG-repeat disorders such as spinocerebellar ataxias, supporting
somatic expansion as a driver of pathogenesis across multiple CAG expansion
disorders (Sobczak and Krzyzosiak 2004). This somatic instability varies between cell
and tissue types, and is particularly prominent in the striatum and cortex and may
partly explain the selective vulnerability of these tissues (Telenius et al. 1994; Swami
et al. 2009). Intriguingly, huntingtin-lowering was recently observed to reduce somatic
instability of both Htt and Atxn2 CAG tracts in knock-in mouse models and the HTT
CAG tract in human neurons, suggesting a role for HTT in regulating somatic
instability (Coffey et al. 2020).

25
1.1.3 Pathology
Post-mortem studies demonstrate that the striatum, comprising the ventral striatum,
caudate and putamen, is a major site of pathology in HD (Vonsattel et al. 1985;
Vonsattel and DiFiglia 1998). Striatal volume loss is mainly caused by an extensive
reduction in GABA-ergic medium spiny stellate projection neurons (Graveland et al.
1985; Vonsattel and DiFiglia 1998). These account for approximately 95% of all
neurons in the striatum and are the main targets of striatal input and provide the main
efferent output of the striatum. The neuropathological changes within the striatum
appear to follow a dorso-ventral, medial-lateral caudal-rostral gradient (Vonsattel et
al. 1985).
Alongside the striatum, the thalamus is another central subcortical structure in basal-
ganglia loops providing efferent output from the basal ganglia back to the cortex
(Haber 2016). Degeneration of the thalamus with global atrophy, neuronal loss and
astrogliosis has been described in previous neuropathological studies (Heinsen et al.
1996; Heinsen et al. 1999; Rub et al. 2016). This neurodegeneration appears to
involve the different component nuclei of the thalamus including the motor
ventrolateral nucleus, centromedian-parafascicular complex and mediodorsal
nucleus.
Over time, all four cerebral lobes undergo thinning of their cortical mantles, layer
specific neuronal loss and severe atrophy (Rub et al. 2016). The degree of neuronal
loss is closely association with the extent of reactive astrogliosis observed (Myers et
al. 1991). The brainstem and cerebellum also show evidence of widespread
neurodegeneration in HD, demonstrating that although the striatum shows early
striking neurodegeneration, HD ultimately affects the whole brain (Rub et al. 2016).
White matter pathology has been less well characterised in HD, but substantial white
matter atrophy has been consistently described with evidence of axonal inclusions in
the white matter tracts (de la Monte et al. 1988; Rub et al. 2016). In post-mortem
brains of preHD subjects, increased oligodendrocyte densities were observed in the
striatum alongside normal densities of other cell types (Gómez-Tortosa et al. 2001).
Given the central role of oligodendrocytes in myelination, this result increases interest
in disrupted myelination early in the disease processes.

26
Increased iron deposition is a common feature in other degenerative diseases
affecting the basal ganglia (Rouault 2013). Iron deposition has also been described
in early stage HD (Simmons et al. 2007; Rosas et al. 2012; Muller and Leavitt 2014),
including in the putamen, pallidum and occipital cortex (Rosas et al. 2012). Whether
such iron deposition contributes to pathogenesis or is a secondary phenomenon is
unclear (Muller and Leavitt 2014).
1.1.4 Clinical manifestations
The diagnosis of manifest HD is based on a positive genetic test coupled with the
onset of motor abnormalities typical of HD. The latter is defined by a diagnostic
confidence score of 4 (unequivocal motor signs) on the standardised Unified HD
rating scale (UHDRS) (Huntington Study Group 1996).
One of the hallmarks of HD is chorea which increases in the early course of the
disease before typically plateauing. Other motor abnormalities typically seen include
dystonia, bradykinesia, motor impersistence and gait instability. Motor function is
typically assessed on the UHDRS total motor score (TMS), which involves a focused
examination of motor signs associated with HD. Though there is a degree of inter-
rater variability, it is sensitive to change over time (Hogarth et al. 2005; Tabrizi et al.
2013; Biglan et al. 2016). More quantitative assessments include the Q-motor battery,
which includes tongue force variability, grip force, speeded and self-paced tapping
and also show sensitivity to longitudinal change in HD (Tabrizi et al. 2013).
HD also causes progressive cognitive impairment (Papoutsi et al. 2014). In manifest
HD there is a range of cognitive impairments demonstrable over many related
domains including executive function, psychomotor speed, attention, episodic
memory, working memory, learning, emotion recognition and odour perception
(Paulsen 2011; Papoutsi et al. 2014). Domains such as semantic memory, language
comprehension, spatial awareness and orientation remain relatively intact,
highlighting the subcortical nature of neurodegeneration in the early stages of the
disease (Papoutsi et al. 2014).
Neuropsychiatric disturbance is the third cardinal feature of HD and can be the most
problematic for patients and their families. Psychiatric symptoms have typically been
assessed using either standardised self-report questionnaires (Epping et al. 2016) or

27
the problem behaviours assessment (PBA), where symptoms are assessed using a
semi-structured interview (Craufurd et al. 2001). A number of different psychiatric
symptoms can be seen at increased rates in HD compared to the general population,
including apathy, anxiety, depression, irritability, obsessive compulsive symptoms
and psychosis (Craufurd et al. 2001; van Duijn et al. 2014). Apathy and irritability are
particularly common, occurring in approximately 70% and 40% of HD patients
respectively (Craufurd et al. 2001). Apathy typically increases with disease duration
and whilst affective symptoms such as depression and anxiety are very common,
these do not typically associate with disease duration likely due to the availability of
effective treatments for the latter (Craufurd et al. 2001; Tabrizi et al. 2013).
1.1.5 Current therapeutic approaches for disease modification
No disease modifying treatments currently exist for HD, however recent advances in
DNA and RNA modifying therapies hold great promise. Most advanced in clinical
development are anti-sense oligonucleotide (ASO) therapies. ASOs are short,
synthetic, single-stranded oligonucleotide analogues that bind to complementary pre-
mRNA targets that lead to target protein reduction via a number of potential pathways
including through RNase H1 recruitment (Tabrizi et al. 2019). A non-allele selective
ASO has already been shown to effectively lower mHTT in humans (Tabrizi et al.
2019) and is now in a phase 3 clinical trial whilst an allele selective approach is also
in human trials (Hersch et al. 2017).
Other RNA lowering approaches include RNA interference (RNAi) compounds. RNAi
uses RNA-based therapeutic molecules including short hairpin RNA, microRNA and
short interfering RNA (siRNA). These molecules bind to mature spliced cytosolic
mRNA, promoting its removal by argonaute2, an enzyme within the RNA-induced
silencing complex (Hutvagner and Simard 2008).
Current DNA lowering approaches in preclinical development for HD include
clustered regularly interspaced short palindromic repeats (CRISPR) with CRISPR
associated protein 9 (CRISPR/Cas9) and zinc finger proteins (ZFNs) (Tabrizi et al.
2019). Potential applications for HD include the excision of CAG repeats, inactivation
of the mutant allele by insertion of stop codons or missense mutations (Cox et al.
2015).

28
One aspect important to treatment success is the distribution of a disease-modifying
therapy. ASOs are large molecules and do not effectively permeate the blood-brain-
barrier and hence are delivered intrathecally (Tabrizi et al. 2019). Meanwhile RNAi,
ZFNs and certain CRISPR-Cas9 approaches using adenoviral vectors will require
delivery by injection direct to the brain parenchyma. Although a more invasive
procedure, adenoviral vector delivery should mean only a single dose is required to
produce a lasting huntingtin-lowering effect. However distribution, which can occur in
part through axonal transport with certain adenoviral vectors (Weiss et al. 2020), is
often limited. Therefore, injection sites may need to be selected based on factors such
as regions most vulnerable to degeneration or areas of high connectivity to other
important brain regions to help facilitate therapeutic distribution.
Collectively, these DNA and RNA editing approaches hold great promise for future
disease modification in HD. Currently in preclinical development there are 3 RNAi
candidates, 1 small molecule, 2 CRISPR/Cas9, 2 ZFPs and 1 ASO whilst 2 ASO
candidates are currently in advanced clinical trials (Tabrizi et al. 2019). Such
approaches are likely to have the most success if instituted early in the disease
course before widespread neurodegeneration has occurred and preventing or
delaying clinical onset will be a key goal of future treatments. Therefore, fully
characterising the premanifest period, from the first detectable markers of
neurodegeneration through the cascade of biomarker changes that lead to clinical
onset, will be important in determining the optimal time to treat and biomarkers that
may be helpful when there is little in the way of clinical impairments. The genetic basis
of HD affords the possibility to study the course of disease in its entirety and trace
neurodegeneration back to the very earliest timepoint.
1.2 The premanifest period
Current understanding of the premanifest period in HD has largely been shaped by
TRACK-HD and PREDICT-HD, two large-scale longitudinal cohort studies. TRACK-
HD was a 4 site international study involving 366 individuals, including 120 preHD
individuals and 120 controls who were followed up over 36 months collecting motor,
cognitive, psychiatric and imaging data along with blood collection that was not used
in the original analysis (Tabrizi et al. 2009; Tabrizi et al. 2011; Tabrizi et al. 2012;

29
Tabrizi et al. 2013). PreHD subjects were required to have a CAG repeat length of
>39. The TrackOn-HD study was an extension of TRACK-HD but with only the preHD
and control participants carried over (Kloppel et al. 2015). In addition to the clinical
assessments, diffusion tensor imaging and resting state functional MRI (fMRI) were
added to the imaging battery whilst neurite orientation dispersion and density imaging
(NODDI) was added to the final timepoint.
The PREDICT-HD study collected data from September 2001 to August 2012 from
1314 participants including 1013 preHD and 301 controls at 32 worldwide sites
(Paulsen et al. 2008; Paulsen et al. 2014). The average years in the study were six
with a range of 1-10. Assessments included motor, cognitive, psychiatric and brain
MRI. Unlike the TRACK-HD study, individuals with intermediate repeat lengths of 36-
39 were included in the preHD group. MRI assessments included either a 1.5T or 3T
volumetric scan with diffusion tensor imaging added to the schedules later in the
study.
1.2.1 Predicting years to clinical onset
To enable a detailed characterisation of the premanifest period, previous natural
history studies have utilised models which aim to predict years to clinical onset or
estimate disease burden in order to stratify subgroups according to proximity to onset.
Such models leverage the strong association with CAG length on age of clinical onset
by incorporating CAG length within the model.
The Penney Disease Burden Score (DBS), used in TRACK-HD to recruit a preHD
cohort likely to show demonstrable change in selected outcome measures, is
calculated as age X [CAG length-35.5] (Appendix 9.1). This equation is based on the
linear correlation observed between CAG repeat number and the degree of atrophy
in the striatum for 89 HD patients (Penney et al. 1997). The score functions as a
posteriori estimate of an individual’s lifetime exposure to mHTT at any given age. The
DBS does not, however, directly predict the number of years to clinical onset. The
Langbehn survival analysis formula (Langbehn et al. 2004) was derived using a
cohort of 2913 individuals from 40 centres worldwide and uses a parametric survival
model based on CAG repeat length to predict age of disease onset. This prediction
is not perfect and suffers from referral and observation biases. It also cannot account
30
for the influence of other genetic determinants of age of onset that are beginning to
be revealed as discussed earlier. Nevertheless, a prospective validation of the model
reported reasonably accurate predictions in age of onset (Langbehn et al. 2010). This
model was used in TRACK-HD to divide the preHD group in two based on being < or
> 10.8 years from predicted onset. The study results demonstrated a striking
relationship with numerous disease biomarkers and time to predicted onset (Tabrizi
et al. 2009; Tabrizi et al. 2013), indicating that this model provides a meaningful
predictor of time to clinical onset at the group level to enable preHD stratification.
The PREDICT-HD study used the CAG-Age Product (CAP) score to split the
premanifest group into near, mid and far stages which were <7.59, 7.59-12.78 and
>12.78 years from predicted onset respectively (Paulsen et al. 2014). CAP is similar
to DBS with both indexing the cumulative toxicity of mutant huntingtin by incorporating
age and CAG repeat lengths within the model. The CAP score is calculated as
CAP=100xAGEx[(CAG-L) ÷S], where AGE is the patient’s current age at time of study
and L and S are constants (Zhang et al. 2011). S is a normalising constant chosen
so that the CAP score is approximately 100 at the patient’s expected age of onset as
estimated by the Langbehn formula (Langbehn et al. 2004). L is a scaling constant
that represents the lower limit of CAG lengths for which some pathological effect
might be expected. In the original CAP score, this was estimated at 33.66 (Zhang et
al. 2011), contrasting to the DBS estimation which uses 35.5. Since the inception of
the CAP score, the optimal L and S values have been found to be 30 and S of 627
for correlation with a wide variety of clinical measures (Ross et al. 2014). Like the
DBS, this model appeared to provide a meaningful measure of disease staging, with
a variety of markers showing progressive changes from the far to near groups
(Paulsen et al. 2008; Stout et al. 2011; Epping et al. 2016).
Using the above models, all of which use age and CAG length to provide an estimate
of years to expected onset, large observational studies such as PREDICT-HD and
TRACK-HD have shed light on when certain disease markers first become abnormal
in the premanifest period.

31
1.2.2 Motor
Clinical diagnosis based on UHDRS requires ‘unequivocal motor signs’ on a focused
clinical examination. Motor signs observed on the TMS typically gradually and subtly
increase towards diagnosis (Biglan et al. 2009; Tabrizi et al. 2012; Tabrizi et al. 2013;
Paulsen et al. 2014; Biglan et al. 2016). Paulsen et al. found that the total score on
TMS, rather than the chorea, bradykinesia, ocular, rigidity and dystonia subscores,
demonstrated the strongest effect size of the motor measures across the PREDICT-
HD cohort (Paulsen et al. 2014). This finding was extended by a recent study
demonstrating that TMS had the largest longitudinal effect size over a 3-year
timespan in preHD across five large observational studies, outperforming cognitive
and functional measures included across studies (Langbehn and Hersch 2020).
Quantitative motor tasks included in TRACK-HD such as tongue protrusion force and
speeded tapping variability begin to show changes in those who are <10 years from
predicted onset (Tabrizi et al. 2013). However, preHD individuals >10 years from
onset do not appear to show any detectable motor changes (Tabrizi et al. 2009;
Paulsen et al. 2014). Collectively, the evidence suggests that whilst motor changes
may demonstrate large effect sizes in preHD close to predicted onset, they are not
sensitive to disease effects in groups > 10 years from predicted onset.
1.2.3 Cognition
Subtle cognitive impairment is detectable in preHD at least 10 years away from onset
(Stout et al. 2011) and cognitive deficits are predominantly based fronto-striatal
dependent tasks (Papoutsi et al. 2014). Early deficits have been reported in executive
function (Lawrence et al. 1998; Stout et al. 2011; Papp et al. 2013), visuomotor
integration (Lemay et al. 2005; Say et al. 2011), psychomotor speed (Lawrence et al.
1998; Snowden et al. 2002; Stout et al. 2011; Stout et al. 2012; Tabrizi et al. 2013)
and emotion recognition (Stout et al. 2011; Harrington et al. 2014).
A wide variety of cognitive tasks have been used to study cognition in the premanifest
period. Among the most established measures are the symbol digit modalities test
(SDMT) and Stroop word reading test (SWRT), which were included in both TRACK-
HD (Tabrizi et al. 2009) and PREDICT-HD (Paulsen et al. 2008) studies and continue
to be utilised in the ongoing Enroll-HD study (Landwehrmeyer et al. 2016). As a
32
substitution task, the SDMT assesses attention, perceptual speed, motor speed and
visual scanning. It has been shown to be sensitive to a variety of neurological
conditions associated with impairments in processing speed (Van Schependom et al.
2014; Fellows and Schmitter-Edgecombe 2019). In the PREDICT-HD study, it
demonstrated the highest effect size in the “near” and “mid” groups up to 12 years
from predicted onset, but displayed little difference in the group furthest from
predicted onset (Stout et al. 2011). In TRACK-HD, longitudinal change was also
demonstrated in the premanifest group close to predicted onset, but not the group
further from predicted onset (Tabrizi et al. 2013). The Stroop word reading test also
assesses processing speed and has demonstrated cross-sectional and longitudinal
change in the premanifest period with relatively high effect sizes (Stout et al. 2011;
Tabrizi et al. 2013). With respect to the other components of the Stroop test, colour
naming and interference variables have been found to be less sensitive compared to
the word reading component (Schobel et al. 2017).
Tests of executive function that have been shown to be sensitive in the premanifest
period include the trail making and verbal fluency tests (Lawrence et al. 1998; Stout
et al. 2011). One previous study demonstrated significant impairments in semantic
but not phonemic verbal fluency in preHD (Lawrence et al. 1998). Phonemic verbal
fluency showed significant differences in the group closest to predicted onset in
PREDICT-HD, but not in the groups further from onset, suggesting it is generally a
less sensitive test of cognitive impairment in the early premanifest period. Although
not previously included in either TRACK-HD, or PREDICT-HD cohorts, attentional set
shifting has also been previously shown to be sensitive in the premanifest period
(Lawrence et al. 1998).
Social cognition is also of interest in HD. Emotion recognition has been assessed in
a relatively large number of HD studies within the last 20 years, with particular focus
on negative emotions (anger, disgust, fear, and sadness) that appear to be more
affected (Johnson et al. 2007; Henley et al. 2012). Negative emotion recognition is
the only task that has shown changes in the group further from onset in both TRACK-
HD and PREDICT-HD (Tabrizi et al. 2009; Stout et al. 2011), the latter with a relatively
low effect size (Cohens d= -0.26).
33
Tasks sensitive to hippocampal dysfunction, such as the paired associates learning
and virtual reality Morris maze task, do not appear to be sensitive to disease effects
in the premanifest period (Begeti et al. 2016).
Taken together, the existing literature suggests that cognitive deficits become
increasingly prominent and widespread in individuals close to predicted onset, but
there has been little evidence to date of cognitive impairment in gene carriers >15
years from predicted onset. The lack of evidence for cognitive impairment in gene
carriers further from onset suggests that HD is not associated with cognitive
differences throughout the lifespan. However, it remains possible that cognitive
changes may occur in individuals further from predicted onset, but have been so far
undetected either because their effect sizes are too small, or due to a failure to target
the affected cognitive functions with the right tests.
1.2.4 Psychiatric
Neuropsychiatric features are relatively common in the premanifest period but can
also be observed in the general population. Most of the assessment tools used
previously to examine for neuropsychiatric symptoms in preHD have quantified the
degree of current neuropsychiatric symptoms, typically from the preceding days to
weeks, rather than lifetime rates (Tabrizi et al. 2009; Duff et al. 2010; Epping et al.
2013; Epping et al. 2016).
Using the PBA, TRACK-HD reported significant cross-sectional differences in apathy
and irritability in preHD but not in affective features (Tabrizi et al. 2009). Similarly,
increased levels of apathy have also been reported in preHD using the frontal system
behavioural Scale (FrsBe) (Duff et al. 2010).
Depressive symptoms, as measured on the self-report symptom checklist-90-revised
(SCL-90R) and the beck depression inventory, have also been found to be more
prevalent in preHD (Epping et al. 2013). However this study did not find a relationship
with depressive symptoms and proximity to predicted onset or time since genetic
testing. A separate study using a diagnostic interview method also found increased
depressive symptoms in preHD, with the rate of depression increasing with proximity
to estimated clinical onset (Julien et al. 2007). However gene carriers and non-gene

34
carriers did not differ in lifetime history of psychiatric diagnoses or subclinical
symptoms.
Obsessive and compulsive symptoms, which are more common in HD than the
general population (Beglinger et al. 2007), have also been studied in the premanifest
period using a self-report questionnaire (Beglinger et al. 2008). There was evidence
of increased symptoms in the preHD group overall, although mean scores were below
those of patients with a clinical diagnosis of obsessive-compulsive disorder. There
was also no evidence of this symptom increasing in the groups closer to predicted
onset in this cohort.
In a longitudinal analysis of 1305 PREDICT-HD subjects using scores on the SCL-
90R, significant cross-sectional and longitudinal increases were found in 19 out of the
24 psychiatric measures in the group closest to onset (Epping et al. 2016). In the
group >12 years from predicted onset there were significant cross-sectional increases
in levels of depression, anxiety and obsessive-compulsive symptoms, although these
did not show longitudinal change. Longitudinal increases in psychiatric symptoms
have been observed in a smaller preHD sample, with the greatest changes noted in
irritability and hostility (Kirkwood et al. 2002). In TRACK-HD, only apathy showed
significant longitudinal changes in the preHD group close to predicted onset (Tabrizi
et al. 2013).
Since neuropsychiatric symptoms are often assessed using self-report scales, some
studies have sought to establish how closely aligned HD gene carrier ratings are to
companion ratings. In PREDICT-HD, companion ratings tended to be higher than
preHD self-ratings, particularly in participants closest to expected onset (Epping et al.
2016). However, another study found that preHD participants self-rated higher on the
FrsBe compared their companion, and the reverse was true in the manifest
participants (Andrews et al. 2018). This is consistent with previous findings of
decreased awareness of symptoms in HD (Chatterjee et al. 2005; Ho et al. 2006) and
in preHD close to predicted onset (Duff et al. 2010; McCusker et al. 2013). There is
little evidence of a lack of symptom awareness in individuals further from onset
however.

35
In the majority of previous studies, including TRACK-HD and PREDICT-HD,
medication use has been not controlled for, creating a potential limitation in the report
of symptoms that can be medicated. Indeed, it was proposed as a reason why
affective symptoms might not demonstrate longitudinal change in TRACK-HD (Tabrizi
et al. 2013). However, in the latter study, medication use was similar in both preHD
and control groups whilst in PREDICT-HD, the proportion of participants taking
antidepressants increased with depression severity in both groups (Epping et al.
2013), suggesting that medication use may not substantially confound previously
reported results.
The cause of increased psychiatric symptoms observed in the premanifest period
remains difficult to determine. Observations of increasing prevalence and severity of
psychiatric symptoms in individuals closer to predicted onset (Julien et al. 2007;
Epping et al. 2016) may suggest this to be a neurobiological effect, however this
relationship has not always been observed in previous preHD studies (Beglinger et
al. 2008; Epping et al. 2013; Tabrizi et al. 2013). Environmental factors, such as
growing up in HD families could be relevant, however the control groups in previous
studies have minimised this influence by including gene negative or family members
as the control group. Finally, the impact of a positive predicted test is a relevant
consideration. However collective evidence from previous studies on the impact of
testing has suggested that a positive test result is not associated increased
psychiatric symptoms compared to those testing negative over time (Crozier et al.
2015).
1.2.5 Biofluids
The study of biofluid biomarkers in HD can further inform understanding of the
premanifest period and has greatly accelerated over the past decade owing to several
factors including: a greater understanding of the pathophysiology of HD, the
development of new highly sensitive assays and improvements in the standardisation
of sample collection and processing (Zeun et al. 2019). Cerebrospinal fluid (CSF),
which is enriched with brain-derived substances, has been a focus of particular
interest, but other biofluids have the potential to yield relevant biomarkers if their
composition reflects that of the CNS. All biofluids, including CSF, may reflect

36
peripheral as well as central disease-related changes, especially since mHTT is
ubiquitously expressed.
1.2.5.1 Huntingtin
The central role of mHTT in HD pathogenesis makes it a key biomarker of interest.
For huntingtin-lowering therapeutics in development, it is also an important measure
of target engagement and has already been successfully used as such in the first
huntingtin-lowering therapy trialled in HD (Tabrizi et al. 2019). CSF mHTT can be
quantified with a femtomolar-sensitive single molecule counting (SMC) immunoassay
(Wild et al. 2015) which has been validated according to the guidelines for regulatory
approval (Fodale et al. 2017). This assay uses the 2B7 antibody, which binds to the
N-terminus of HTT; and the MW1 antibody, which binds to polyglutamine tracts for
detection. As should be expected, there has been no detectable signal in control
groups in previous studies (Wild et al. 2015; Byrne et al. 2018). There is a known
correlation between mHTT and haemoglobin concentrations, however this only
becomes significant at haemoglobin concentrations above 2µg/ml (Fodale et al.
2017).
CSF mHTT concentrations appear to increase from the premanifest to manifest stage
of disease and correlate with clinical scores (Wild et al. 2015; Byrne et al. 2018). It
has been shown to rise linearly with age and in a CAG-dependent fashion (Rodrigues
et al. 2020). CSF mHTT is highly stable within individuals over short intervals (Byrne
et al. 2018) and has been shown to be unaffected by batch, assay or storage effects
(Rodrigues et al. 2020).
Total huntingtin is also a potential biomarker of interest in HD. Due to the previous
lack of an assay capable of measuring total huntingtin in biofluids, it is currently
unknown whether the HD mutation affects concentrations of total huntingtin in
humans. Recently a total huntingtin assay has become available using a 2B7-D7F7
immunoassay on the SMC Erenna® platform, with D7F7 recognising a region
surrounding Pro1220 of human HTT protein. With certain therapeutic approaches
aimed at lowering total huntingtin, total huntingtin may also be a biomarker of interest
to quantify target engagement for such approaches.

37
1.2.5.2 Neurofilament light
Neurofilament light (NfL), a protein of the axonal cytoskeleton thought to be important
for the radial growth and stability of axons, has been found to be a non-specific marker
of neuronal damage with elevated NfL concentrations reported across a spectrum of
neurological conditions (Khalil et al. 2018).
CSF concentrations are elevated in both premanifest and manifest HD
(Constantinescu et al. 2009; Niemela et al. 2017; Byrne et al. 2018) and are closely
associated with CSF mHTT, suggesting both proteins are released together from
damaged neurons (Wild et al. 2015; Byrne et al. 2018). Cross-sectionally, CSF NfL
concentrations correlate with disease stage and motor, cognitive and functional
impairment in HD (Vinther-Jensen et al. 2016; Niemela et al. 2017; Byrne et al. 2018).
CSF NfL has also been shown to correlate with whole brain, white matter, grey matter
and caudate volumes (Byrne et al. 2018).
In a comparison with mHTT, NfL measures showed stronger independent predictive
ability than mHTT for clinical measures and stronger correlations with clinical and
imaging measures of disease (Byrne et al. 2018).
NfL is also detectable at lower concentrations in blood and has been shown to closely
correlate to CSF NfL, implying a CNS origin of NfL detected in plasma (Byrne et al.
2017; Byrne et al. 2018). In the TRACK-HD cohort, plasma NfL concentrations rose
with every subsequent disease stage compared to the control group and were closely
associated with CAG repeat length (Byrne et al. 2017). Baseline plasma NfL values
were shown to predict disease onset within 3 years in premanifest subjects as well
as subsequent change in cognitive and functional measures and brain atrophy in
preHD.
These results suggest NfL is a robust biomarker of neuronal damage and progression
in HD. Baseline values of NfL have been shown to be superior to their rate of change
in predicting clinical disease status, subsequent clinical progression and brain atrophy
(Rodrigues et al. 2020). Plasma NfL may represent a more appealing biomarker over
CSF NfL due to sampling practicalities and cost, and current evidence suggests they
have similar sensitivity and specificity in premanifest and manifest disease (Byrne et
al. 2018).

38
1.2.5.3 Other biofluid markers studied in preHD
Tau is an axonal protein that promotes microtubule assembly and stability (Zetterberg
2017). Whilst total tau appears to be elevated in manifest HD (Constantinescu et al.
2011; Rodrigues et al. 2016), few studies have investigated tau in preHD. Vinther-
Jensen et al. found tau was only elevated in manifest HD and not the preHD group
(Vinther-Jensen et al. 2016). A head to head comparison of NfL with tau in a mixed
group of premanifest and manifest HD reported that NfL is more strongly correlated
with disease phenotype (Niemela et al. 2017) and hence appears to be a superior
biomarker of HD.
Central and peripheral immune system hyperactivity driven by the effects of mHTT in
monocytes and microglia has been implicated in HD pathogenesis (Björkqvist et al.
2009). Elevated concentrations of cytokines IL-6 and IL-8 have been reported in HD
(Dalrymple et al. 2007; Bjorkqvist et al. 2008; Chang et al. 2015). Bjorkqvist et al.
reported increased IL-6, but not IL-8 in plasma of preHD participants estimated to be
approximately 16 years from predicted onset (Bjorkqvist et al. 2008). In the same
study, IL-8 was increased in early HD subjects. Furthermore, concentrations of IL-6
and IL-8 in plasma and CSF were shown to be closely correlated. IL-6, but not IL-8
has been shown to be elevated in the CSF of a mixed premanifest and manifest HD
cohort (Rodrigues et al. 2016). YKL-40, also known as chitinase-3-like 1 (CHI3L1) is
a glycoprotein abundantly expressed in reactive astrocytes (Baldacci et al. 2017).
Elevated YKL-40 concentrations have been reported in a number of
neurodegenerative and neuroinflammatory diseases (Bonneh-Barkay et al. 2012;
Llorens et al. 2017), reflecting a common detectable immune response to a variety of
neuropathology. CSF concentrations of YKL-40 have shown mixed results in HD to
date with two studies reporting no significant differences between controls and
premanifest or manifest HD (Vinther-Jensen et al. 2016; Niemelä et al. 2018) and one
finding increased concentrations of YKL-40 in a mixed premanifest and manifest HD
cohort (Rodrigues et al. 2016). However the aforementioned studies of YKL-40 have
been in relatively small sample sizes incorporating a mixture of preHD and HD
participants and with the increasing evidence of astrocytic dysfunction in the early
stages of HD (Ben Haim et al. 2015; Wilton and Stevens 2020), YKL-40 remains an
important biomarker of interest.

39
1.2.5.4 Other promising biofluid biomarkers yet to be studied in HD
The above represent what are currently the biofluid biomarkers with the most
evidence in preHD. Neurodegenerative diseases often involve common pathways
such as astrocytic activation (Ben Haim et al. 2015) and synaptic dysfunction
(Merluzzi et al. 2018; Nguyen et al. 2019). Indeed, many of the known biomarkers of
HD are not specific to HD pathology and were originally discovered in studies of other
neurodegenerative diseases or traumatic brain injury and this continues to be a
source of novel biomarkers sensitive to neuronal injury that may be of interest in HD.
For example, glial fibrillary acidic protein (GFAP), a marker of astrocyte activation,
has been shown to be sensitive in frontal-temporal dementia (Heller et al. 2020),
Friederichs ataxia (Zeitlberger et al. 2018) and traumatic brain injury (Bazarian et al.
2018). Another source of potential biomarkers include proteins that are found in the
neuronal cytoplasm. One example of this includes ubiquitin c-terminal hydrolase L1
(UCH-L1), an abundant protein in neuronal cytoplasm (Wilkinson et al. 1989) shown
to be elevated in several neurodegenerative conditions (Öhrfelt et al. 2016;
Zeitlberger et al. 2018; Ng et al. 2020) and traumatic brain injury (Bazarian et al.
2018). Such biomarkers are therefore of potential interest for study in HD.
1.2.6 Imaging
Early imaging studies in HD mainly focused on volumetric imaging, with the striatum
being a particular focus of attention. Over the past decade, diffusion imaging and
functional MRI, both resting state and task-based, have been increasingly studied to
examine white matter microstructure and functional connectivity respectively.
1.2.6.1 Volumetric imaging
The most widely studied imaging acquisition in HD is the structural volumetric MRI
scan. Typically, a T1-weighted image is used as it presents the best contrast between
grey and white matter, which makes delineation of structures of interest more
accurate.
1.2.6.1.1 The striatum
Cross-sectional and longitudinal studies have shown that atrophy of the caudate and
putamen can be observed from 15-20 years prior to predicted disease onset, and this

40
atrophy increases in individuals closer to onset in a linear fashion (Paulsen et al.
2008; Tabrizi et al. 2009; Aylward et al. 2011; Tabrizi et al. 2013). Caudate volumes
have previously shown stronger effect sizes than putamen (Aylward et al. 2011;
Tabrizi et al. 2013). The caudate is easier to delineate than the putamen due to its
boundary with lateral ventricle, and this may contribute to measurements being more
sensitive and less variable in the caudate. (Tabrizi et al. 2009; Tabrizi et al. 2013;
Scahill et al. 2017). Striatal atrophy rates (Tabrizi et al. 2013; Paulsen et al. 2014) are
predictors of conversion to manifest HD, highlighting the influence of striatal atrophy
in emerging clinical signs. Striatal atrophy shows significant correlations with UHDRS
TMS (Jurgens et al. 2008; Paulsen et al. 2010; Aylward et al. 2012), whilst paced
finger tapping and tongue force also correlate with striatal volume (Tabrizi et al. 2009).
Caudate volume loss is associated with deficits in verbal learning, working memory
and emotion recognition (Aylward et al. 2013) whilst putaminal atrophy correlates with
executive dysfunction and emotion recognition (Jurgens et al. 2008; Aylward et al.
2013; Harrington et al. 2014).
1.2.6.1.2 Other subcortical structures
Volume reduction has been reported in the nucleus accumbens, pallidum and
thalamus from the premanifest stage (van den Bogaard et al. 2011) and longitudinal
studies have also highlighted thalamic atrophy in premanifest cohorts (Aylward et al.
2011; Majid et al. 2011). However, effect sizes were small compared with the caudate
and putamen. Thalamic volume has been shown to correlate with TMS (van den
Bogaard et al. 2011). There is a relative lack of longitudinal studies of non-striatal
subcortical structures, and no differences were found either cross-sectionally or
longitudinally in any of these structures in one such study using an automated
segmentation technique (Majid et al. 2011). The apparent lack of sensitivity of these
structures to HD pathology compared with the caudate and putamen may be a real
biological phenomenon or may just reflect the paucity of well-powered studies and/or
the fact that these small structures have relatively poorly defined boundaries.
1.2.6.1.3 Cortical structures
Cortical volumes can be assessed using a number of manual (Aylward et al. 1998),
semi-automated (Henley et al. 2006) and automated segmentation techniques (e.g.
Statistical Parametric Mapping (https://www.fil.ion.ucl.ac.uk/spm/); Freesurfer

41
(https://surfer.nmr.mgh.harvard.edu/); FSL (https://fsl.fmrib.ox.ac.uk/fsl), although
manual delineation of the cortex is generally more challenging than subcortical
segmentation due to its convoluted structure.
Whole brain and grey matter volume has been shown to be reduced cross-sectionally
and longitudinally, including in the premanifest stages (Kipps et al. 2005; Tabrizi et
al. 2011; Tabrizi et al. 2012). Effect sizes are smaller than for striatal or white matter
measures in the early premanifest stage of the disease (Tabrizi et al. 2012; Tabrizi et
al. 2013). Although it is possible that the higher complexity of measuring the
convoluted structure of the cortex is contributing to reduced sensitivity of global
atrophy, previous work suggests that striatal and white matter loss does indeed occur
early in the disease prior to symptom manifestation and that there is an acceleration
of grey matter loss around the time of clinical conversion (Tabrizi et al. 2013).
Reductions in cortical thickness have been demonstrated in premanifest disease
(Tabrizi et al. 2009). However, this fully automated technique can introduce errors
and in particular, misclassification around the mid-sagittal plane has led to spurious
results (Rosas et al. 2008; Hobbs et al. 2011). Longitudinal measures of cortical
thinning appear to be less sensitive to change over time in HD than other structural
measures (Hobbs et al. 2015).

42

43
Figure 1.1 Longitudinal changes in grey and white matter. Parametric maps from the TRACK-HD study showing regions with statistically significant atrophy in (A) white matter and (B) grey matter over 24 months, relative to controls (Tabrizi et al. 2012). Corresponding longitudinal plots show mean values at baseline, 12 months, and 24 months. Significant change differences relative to controls over 0-12, 12-24, and 0-24 months are represented by *p<0.05, **p<0.01, and ***p0.001. Reprinted with permission from Elsevier.
1.2.6.1.4 White matter
The importance of white matter degeneration and resulting loss of brain connectivity
has been increasingly recognised in both premanifest and manifest stages of the
disease. Like grey matter, white matter volumes can be analysed using manual or
automated techniques, either in specific regions of interest or looking at total white
matter volume.
Reduction of global white matter volume has been reported cross-sectionally and
longitudinally and appears to be one of the earliest detectable changes in preHD
alongside caudate volumes and certain biofluid biomarkers. Both TRACK-HD and
PREDICT-HD demonstrated progressive white matter atrophy in preHD, including in
the groups furthest from estimated onset (Aylward et al. 2011; Tabrizi et al. 2011;
Tabrizi et al. 2012) with the most prominent changes around the striatum and
posterior corpus callosum (Tabrizi et al. 2011; Crawford et al. 2013). White matter
atrophy has been shown to correlate with worsening motor function (Paulsen et al.
2010; Aylward et al. 2011; Scahill et al. 2013) and cognitive function (Paulsen et al.
2010; Scahill et al. 2013).
1.2.6.2 Diffusion Imaging
Diffusion MRI provides complementary information to volumetric MRI by being
sensitive to microscopic, rather than macroscopic changes. This technique measures
the diffusion of water in different directions within the brain and has been used in HD
to study white matter microstructure.
The most widely-studied diffusion technique in HD is diffusion tensor imaging (DTI).
Typically, reductions in DTI measures of fractional anisotropy (FA) and increases in
mean diffusivity (MD) are seen across various neurodegenerative diseases (Zhang
et al. 2009; Atkinson-Clement et al. 2017; Slattery et al. 2017), attesting to their
sensitivity but relative lack of specificity to the underlying neurodegenerative process.

44
These changes are generally considered to reflect one or more of axonal loss,
demyelination and less coherent white matter tracts.
In cross-sectional studies, tensor measure changes in preHD have been observed in
the corpus callosum, internal capsule and thalamic radiations (Rosas et al. 2010;
Stoffers et al. 2010; Poudel et al. 2014; Harrington et al. 2016). In the PREDICT-HD
study, MD was found to be the most sensitive DTI metric of white matter change in
preHD (Faria et al. 2016). It was increased in the white matter adjacent to the posterior
thalamus in the mid subgroup (estimated 7.6-12.8 years from onset), whilst the group
closest to onset demonstrated more widespread diffusion changes which were
especially marked in the posterior white matter (Figure 1.2). However, there were no
detectable differences in the group furthest from predicted onset in this study.
Figure 1.2 Atlas-based white matter DTI analysis. Ascending axial slices of a template brain demonstrating regions of significant changes in white matter MD between controls and the subgroup closest to predicted onset in the PREDICT-HD cohort (Faria et al. 2016). The colours represent the degree of MD increase. Reprinted under creative commons license.
Longitudinal findings using tensor measures have been inconsistent. In preHD, two
studies have failed to find 12-30 month changes (Poudel et al. 2014; Odish et al.
2015), whereas two larger studies demonstrated progressive changes over 1-5 years
in preHD cohorts including those up to 10 years away from onset (Harrington et al.
2016; Shaffer et al. 2017). Changes in regional tensor measures have correlated with
a number of clinical measures including TMS, paced finger tapping, executive
function (Poudel et al. 2014), apathy (Delmaire et al. 2013) and depression
(Sprengelmeyer et al. 2014).
A substantial limitation of the diffusion tensor model is that voxel averaged measures
cannot account for the contribution of free water, crossing fibres or the orientation
dispersion of fibres within that voxel. For example, the observation of a reduction in

45
FA can be attributable to a reduction in axonal density, an increase in the dispersion
of axons, or a reduction in myelin (Zhang et al. 2012; Grussu et al. 2017). The inability
to resolve crossing fibres can produce misleading DTI results. This was demonstrated
in a study using DTI measures alongside a technique that is able to resolve crossing
fibres, where increases in FA were seen in certain voxels containing crossing fibres
(Mito et al. 2018). Whilst FA typically decreases with neurodegeneration, in this
example the selective degeneration of only one of these crossing fibres produced a
misleading increase in FA (Figure 1.3)
Figure 1.3 Example of limitation of tensor-based measures in regions with crossing fibres. (A) In this study of Alzheimer’s subjects (Mito et al. 2018), voxels exhibit a significant (family-wise error-corrected p-value <0.05) increase in FA in the Alzheimer’s group compared to healthy controls along coronal, axial and sagittal views. Increased FA typically reflects increasing white matter coherence and is the opposite of what would be expected in neurodegeneration. (B) The centrum semiovale contains fibre structures belonging to the cortico-spinal tract, superior longitudinal fasciculus, and corpus callosum, as demonstrated with probabilistic tractography. Alzheimer’s disease patients showed white matter degeneration specifically within the superior longitudinal fasciculus, with relative preservation of the corticospinal tract and body of the corpus callosum. (C) Using a DTI model, this difference would be detected as an increase in FA of the tensor, given the relative contribution of the superior longitudinal fasciculus to the tensor is decreased, resulting in a misleading increase in FA along the direction of the corticospinal tract. Modelling the equivalent voxel fibre orientation distribution (FOD), the different fibre orientations within the voxel can be resolved, highlighting a specific decrease in the longitudinal fasciculus, without any significant abnormality in the corticospinal tract and corpus callosum. Reprinted with permission from Oxford University Press.

46
More recent advances in diffusion acquisition and modelling techniques have aimed
to address these limitations and provide more sensitive and biologically meaningful
measures. One such example is Neurite Orientation Dispersion and Density Imaging
(NODDI) (Zhang et al. 2012). By applying a three-compartment tissue model to DWI
data, NODDI enables the examination of both intra- and extra-cellular properties of
white matter tissue. In turn this enables differentiation of two key aspects of axonal
organisation that can both contribute to tensor measures: axonal density and the
spatial organisation of axons. By also estimating the amount of free water present,
changes in axonal density can be distinguished from increasing dispersion of fibres,
whilst accounting for the potentially confounding effect of free water. Using NODDI in
the TrackOn-HD cohort, Zhang et al. found widespread reductions in axonal density
in the peristriatal white matter of the preHD group compared to controls and this
correlated with increasing motor signs on the TMS (Zhang et al. 2018). The peristriatal
white matter also exhibited reduced fibre dispersion with the authors suggesting that
this may reflect a process of reorganisation with selective pruning of fibres within
tracts linking the striatum to the cortex (Zhang et al. 2018). This example
demonstrates how improved diffusion modelling with more advanced MRI
acquisitions can provide further insights into the underlying white matter
microstructure by separating multiple factors that can collectively contribute to
diffusion within a given voxel.
1.3 Structural and functional connectivity in HD
Both volumetric MRI and diffusion MRI studies using white matter atlases have shown
that white matter appears to undergo degeneration at least 15 years prior to predicted
disease onset and that the peristriatal matter appears particularly vulnerable.
However, such studies cannot examine how this affects connectivity between
different brain regions and what role this has on the emerging clinical signs of the
disease. Connectivity can be conceptualised as two interlinked elements; structural
connectivity, referring to the white matter tracts consisting of bundles of axons
between two regions, and functional connectivity, representing neural co-activation
between two regions. Diffusion MRI and functional MRI can be used to investigate
structural and functional connectivity respectively in the human brain.

47
1.3.1 Structural connectivity breakdown in preHD
In addition to investigating diffusion metrics in atlas-derived major white matter
pathways, diffusion MRI can also be utilised to delineate white matter pathways of
the brain via tractography to investigate structural connectivity between different
regions. Diffusion tractography can be used either to investigate a diffusion metric,
such as FA, across reconstructed tracts, or to generate a connectome which
quantifies connectivity across a network of brain regions. Details of these methods
are discussed more extensively in the methods section.
In an early study focusing on connections between the striatum and frontal cortex,
Kloppel et al. reported reduced structural connectivity between the caudate body and
frontal cortex in preHD relative to controls and this reduction in connectivity correlated
with expected years to disease onset (Kloppel et al. 2008). Investigating whole brain
connectivity in premanifest and manifest HD participants, McColgan et al. reported
selective loss of cortico-striatal and cortical hub connections alongside increased
network segregation in preHD with more widespread loss of connectivity in manifest
HD (McColgan et al. 2015). These reductions in connection strength were shown to
correlate with motor and cognitive deficits, suggesting pathophysiological relevance
of this connectivity loss. In a follow up to this work looking at relative vulnerability
between groups of connections, cortico-striatal connections displayed the greatest
loss of connectivity both cross-sectionally and longitudinally, followed by
interhemispheric and intrahemispheric cortical connections respectively (McColgan
et al. 2017). The vulnerability of cortico-striatal connections in preHD has been
reinforced by a longitudinal analysis of a separate cohort that focused specifically on
tracts connecting the caudate and putamen to motor, premotor and somato-sensory
regions of the cortex (Shaffer et al. 2017). This revealed change in DTI metrics across
all tracts, both cross-sectionally and longitudinally, in preHD up to a decade before
predicted disease onset with changes more pronounced in those closer to expected
disease onset. Specifically, the right premotor-putamen tract was the only tract to
show significant changes in the group furthest from onset. However other striatal
connections such as to prefrontal, parietal and temporal cortices were not
investigated in this work and it remains unclear whether specific cortico-striatal
connections show greater change in preHD than others.

48
Outside cortico-striatal connectivity, very little is known about other specific
subcortical connections in preHD. In particular, the thalamus is central to the cortical-
basal ganglia feedback loops and cortico-thalamic connections have scarcely been
studied to date. In a whole brain analysis, McColgan et al. found reduced thalamic
connectivity to superior parietal, precuneus and superior frontal regions in manifest
HD but not in preHD (McColgan et al. 2015). In a small study of 12 premanifest
participants approximately 23 years from predicted onset, Gorges et al. found no
significant difference in DTI metrics of a single reconstructed cortico-thalamic tract
(Gorges et al. 2017). However, the thalamus has widespread connections to different
cortical areas and it is currently unknown if and when these connections become
abnormal in HD.
1.3.2 Functional connectivity in preHD
Functional MRI (fMRI) studies use regional cerebral blood flow to infer brain activity
and connectivity at rest or during tasks. Functional connectivity is a descriptive
measure of the temporal correlations between regional activity across the brain or in
specific networks.
In task-fMRI, participants perform a task or function whilst their brain activity is
recorded, as compared to resting state fMRI where brain activity is recorded at rest.
There have been a number of task-fMRI studies in preHD showing differences in
activation patterns in preHD during motor, cognitive and behavioural tasks. Activation
may be elevated or reduced and can vary according to disease stage, the task being
presented and the regions of the brain being examined (Gregory and Scahill 2018).
Variability in task performance can confound activation patterns, requiring studies to
ensure that behavioural performance is matched between gene carriers and controls.
Resting state fMRI avoids the issue of variability in task performance by examining
activation patterns at rest and has been increasingly used to examine functional
networks in preHD in recent years. There are different ways in which resting state
data can be analysed, ranging from seed-based approaches to investigate specific
networks of interest, to data-driven approaches to investigate whole brain
connectivity.

49
Some studies have used seed-based approaches to investigate specific networks of
interest in HD, such as motor or cognitive networks. In one early example, reduced
connectivity was found between the posterior cingulate, a region of the default mode
network, and ventromedial and dorsomedial prefrontal cortices, with the former
correlating with Stroop test performance (Quarantelli et al. 2013). However results
from such approaches are influenced by the choice and means of defining regions of
interest which can introduce variability and limit generalisability to other studies.
Highlighting this, another study found network-wide increased connectivity when
using the posterior cingulate cortex and supplementary motor area as seed regions
(Sánchez-Castañeda et al. 2017).
Other studies have used data-driven approaches to investigate whole-brain
connectivity. Using such an approach, reductions in putaminal and putamen-insula
connectivity have been reported in preHD with increasing CAG length, with the latter
correlating with motor and cognitive performance. Concurrently, visual networks
showed increasing fronto-occipital connectivity with increasing CAG length (Espinoza
et al. 2018). Reduced connectivity in the somatosensory cortex and dorsal attention
network has also been reported in preHD, the latter correlating with motor
performance (Poudel et al. 2014).
Resting state fMRI has also been analysed using a connectomic approach to examine
network characteristics. Using this approach, premanifest gene carriers have been
shown to display reduced connectivity between highly connected “rich club” regions
– hub areas that are key to integration of diverse processing (Harrington et al. 2015;
Gargouri et al. 2016). Harrington et al. also found reduced connectivity in long-range
frontostriatal and frontoparietal connections as disease burden increased whilst
functional segregation, relating to distinct regions that work together to facilitate
function, was maintained both locally and globally. However Gargouri et al. found no
longitudinal changes in connectivity, raising the question of whether these results
represented genuine change, limitations in test-retest reliability (Noble et al. 2019) or
represent a process too subtle to detect change over a 3 year period.
Relatively few studies have sought to examine how early changes in functional
connectivity can be detected in preHD. In the PREDICT-HD cohort, no changes in
functional connectivity were found in the group >12.8 years from predicted onset,

50
whilst reductions in connectivity were identified in the group 7.6-12.8 years from
predicted onset and increased connectivity only in the group <7.6 years from onset
(Figure 1.4). In a comparatively smaller study of preHD further from predicted onset,
no differences in sensorimotor functional connectivity were reported in a 11 preHD
participants approximately 23 years from predicted onset compared to 22 matched
controls (Gorges et al. 2017). Hence, it is currently unclear where and when changes
in functional connectivity can be detected in preHD and whether functional
upregulation is seen before reductions in connectivity.
Figure 1.4 Functional connectivity changes in preHD. Differences in functional connectivity in the PREDICT-HD cohort were investigated using network-based statistics (Harrington et al. 2015). The cohort were stratified based on predicted years to onset to low (>12.78 years), medium (12.78 to 7.59 years) and high (<7.59 years) groups. Glass brains at the top show reductions in functional connectivity

51
(red lines). Brains at the bottom display connections that were stronger in each prodromal group (blue lines). Reprinted with permission from Oxford University Press.
1.3.3 The relationship between structural and functional
connectivity in preHD
As detailed above, the majority of studies have investigated changes in structural or
functional connectivity in HD separately, despite both being clearly interlinked in
facilitating neural connectivity and function. This is partly due to the fact that many
methods of analysis are not directly transferable between diffusion and fMRI data.
One exception to this is the connectomic approach, where connectivity is examined
between parcellated regions across the brain using graph theory. As previously
detailed, this approach has been used to investigate structural and functional
connectivity separately. Converging evidence from these studies has suggested that
structural and functional connectivity to rich club regions is reduced in preHD
(Harrington et al. 2015; McColgan et al. 2015; Gargouri et al. 2016). The only existing
study to date that has sought to assess the relationship between structural and
functional connectivity in HD found that strong structural connectivity predicted
reduced functional connectivity in preHD (and vice versa) and that posterior regions
showed reduced functional connectivity as compared to anterior regions (McColgan
et al. 2017). The latter finding is consistent with previous structural connectivity results
in preHD (McColgan et al. 2017).
1.4 The Scope of this thesis
1.4.1 Towards a better understanding of the early premanifest
period in HD
Recent progress in huntingtin-lowering techniques raises the prospect that the first
effective disease modifying therapies for HD may become available in the near future.
With this, the question of when such therapies should be initiated is timely. Ideally
effective treatments would be administered prior to widespread neuronal damage and
any future trials in premanifest cohorts will require biomarkers for recruitment, staging,
target engagement and to evaluate efficacy.

52
Figure 1.5. Evidence-based schematic of disease trajectory in HD from early adulthood to manifest disease. Biofluid changes are shown in red, brain volumetrics in blue and functional performance in green. CSF NfL and mHTT are already elevated 15 years prior to onset (Byrne et al. 2017; Byrne et al. 2018), with initial slow increases followed by an acceleration shortly prior to disease onset. Striatal volumes are already declining 15 years from onset (Tabrizi et al. 2011) and this is approximately linear with volume reduced by around 50% of control volume by the time of clinical onset (Georgiou-Karistianis et al. 2013; Langbehn et al. 2019). Peristriatal white matter volume is already reduced 15 years from onset (Tabrizi et al. 2009) and shows higher rates of atrophy in a non-linear fashion, becoming more generalised by time of onset (Aylward et al. 2011; Langbehn et al. 2019). Grey matter loss extends beyond the striatum later at around 10 years before symptom onset, after which it progresses non-linearly (Tabrizi et al. 2009; Langbehn et al. 2019). Soft motor signs in the form of increased variability in voluntary movements are apparent by 15 years prior to symptom onset and increase non-linearly (Biglan et al. 2009; Tabrizi et al. 2009; Long et al. 2014). Subtle selective cognitive changes are apparent approximately 15 years from expected symptom onset (Tabrizi et al. 2009; Stout et al. 2011), declining relatively slowly following a non-linear trajectory (Tabrizi et al. 2012; Langbehn et al. 2019). There have been no previous studies examining across these domains in cohorts >15 years from onset.
As summarised in this introduction and Figure 1.5, the existing literature in preHD has
consistently reported subtle motor, cognitive and neuropsychiatric impairments at
least 10-15 years from onset. At this stage there is already evidence of striatal
atrophy, white matter degeneration, altered structural and functional connectivity and
elevations in biofluid markers of neuronal injury and immune activation. Since the
preHD cohorts studied to date already show disease effects across these multiple
domains, if we are to identify the earliest manifestations of HD pathology and indeed
establish whether there is a time when they are undetectable, we need to look back
even earlier in the disease process.

53
Meanwhile certain disease modifying approaches using viral-vectors such as RNAi
and CRISPR/Cas9 therapeutics require direct injection into the brain parenchyma and
their distribution, which can occur in part through axonal transport (Weiss et al. 2020),
is often limited (Tabrizi et al. 2019). Therefore, targeting injections to areas most
affected by early pathology, but before significant neurodegeneration and white
matter loss has occurred, may represent an optimal treatment strategy. However it is
not currently known when white matter connections begin to degenerate, which
connections are affected first and how this affects functional connectivity in the early
disease course.
In this thesis, I detail the HD Young Adult Study (HD-YAS), which was established to
look further back in the premanifest period to investigate how early HD
neurodegeneration can be detected and which measures may prove most sensitive
in early preHD. I then focus on how early basal ganglia white matter tract
degeneration can be detected in preHD and whether specific tracts show selective
vulnerability early in the disease course by performing a combined analysis in the HD-
YAS and TrackOn-HD cohorts, the latter representing preHD closer to expected
disease onset. Finally, I characterise the relationship between structural and
functional connectivity in early preHD and their relationship to the axonal marker NfL.
1.4.2 Thesis aims
1) To establish a cohort of young adult preHD individuals >18 years from
predicted onset and a matched control group who have undergone state-of-
the-art imaging, cognitive, neuropsychiatric assessments with CSF and blood
collection.
2) To evaluate how early disease-related changes in preHD can be identified,
and which measures are most sensitive in very early preHD.
3) To identify how early degeneration of white matter connections can be
detected in HD and which connections are most susceptible to early
degeneration.
4) To characterise the relationship between structural and functional connectivity
and concentrations of NfL in far from onset preHD.

54
2 General methods
This chapter introduces the methods used in this thesis which will then be expanded
upon in each subsequent chapter. After detailing the cohorts, I will introduce the
assessment methods used throughout this thesis. Processing and analytical methods
for diffusion weighted imaging will be discussed in particular detail, given its
prominence in chapters 4 and 5.

55
2.1 Cohorts
The data used in this thesis were collected from two different patient cohorts as
outlined below. I was the lead clinician for the HD young adult study (HD-YAS) which
involved patient recruitment, assessing eligibility, collecting demographic details,
performing functional scales and motor assessments, collecting blood and CSF
samples and participant follow up to capture adverse events. All cohort studies were
performed in accordance with the declaration of Helsinki with all participants providing
written consent before enrolment.
2.1.1 The HD Young Adult Study (HD-YAS)
HD-YAS was a single-site cross-sectional study of 64 young adult gene carriers far
from predicted onset with a closely matched control group (N=67). The minimum
sample size of 60 gene carriers and 60 controls was derived from power calculations
that the resulting effect size of 0.53 would be sufficient to detect striatal volume
differences seen in the group furthest from onset in TRACK-HD restricted to those
under 40 years of age.
The study involved detailed cognitive, neuropsychiatric, and imaging assessments
alongside blood and CSF collection for biofluid biomarker assessments, as
summarised in Figure 2.1. By recruiting preHD participants who had a DBS of <240,
approximating to ≥ 18 years from predicted onset, the study aimed to look further
back in the premanifest period than previously studied to evaluate how early disease-
related changes can be identified, and which measures are most sensitive in very
early preHD.
PreHD participants required a previous positive HD genetic test (CAG ≥ 40) that was
performed on a clinical basis without clinical signs of the disease (UHDRS Diagnostic
confidence score <4). CAG lengths were re-measured at a single lab for statistical
analysis. Controls were either gene negative (family history of HD but negative
genetic test), family members with no HD risk (partners/spouses of gene carriers) or
members of the wider HD community (recruited through support groups or friends of
participants).

56
Figure 2.1. Overview of HD-YAS assessments. Cognitive assessment included tasks from the CANTAB and EMOTICOM batteries to study multiple cognitive domains. 3T Multi-modal MRI was performed to investigate white and grey matter macro and microstructure and connectivity. Psychiatric domains were measured using validated self-report questionnaires. Several biofluid biomarkers were measured in CSF and plasma.
Participants were initially screened via telephone against the study eligibility criteria
(Appendix 9.2) before formal screening on the first day of the study. The study
procedures took place over a day and a half for each participant at the National

57
Hospital of Neurology and Neurosurgery and UCL Institute of Neurology, United
Kingdom. The study protocol is available at
https://www.ucl.ac.uk/ion/sites/ion/files/hd-yas_protocol_v6.0_sep18_signed.pdf.
2.1.2 The TrackOn-HD Study
TrackOn-HD was an extension of the TRACK-HD study and aimed to investigate
compensatory mechanisms that allow preHD individuals to maintain cognitive and
motor performance despite grey and white matter brain atrophy as noted in the
TRACK-HD study (Tabrizi et al. 2013). Data were collected over 3 annual time-points
between 2012-2014 in 4 sites: London (UK), Leiden (Netherlands), Paris (France)
and Vancouver (Canada). Assessments included 3T volumetric MRI, task and resting
state fMRI and diffusion weighted imaging (DWI). Participants also underwent
cognitive, motor and psychiatric assessment.
The baseline cohort included 110 preHD, 21 early HD and 112 controls (Kloppel et
al. 2015). Most preHD and control participants were also in TRACK-HD. PreHD
participants were required to have a CAG repeat length ≥40, a DBS of ≥250,
approximating to ≤ 15 years from predicted onset, and a TMS of ≤5 at recruitment.
Participants were aged 18-65 years and other inclusion and exclusion criteria were
similar to HD-YAS (Appendix 9.3).
2.2 Genetic testing
In both studies, preHD and gene negative participants required evidence of having
previously had a genetic test on a clinical basis in an accredited UK laboratory. In HD-
YAS, CAG lengths were resized for to control for the slight variations in sizing that
can occur between different laboratories in the statistical analysis. Genetic tests were
performed at the National Hospital of Neurology and Neurosurgery Neurogenetics
Laboratory according to standardised protocols (Losekoot et al. 2013). Testing
involved DNA extraction and PCR amplification of the HTT CAG repeat region
followed by size fractionation and fragment analysis. A total of 5 preHD participants’
CAG length changed on resizing, 4 of which changing ± 1 and the other increasing
by 3 repeats. This result was not fed back to participants as detailed on the participant
consent form as such differences are not clinically significant.

58
2.3 Demographic and general clinical assessments
All participants had their demographics and medical history documented, including
previous or current comorbidities. In HD-YAS, participants were also explicitly asked
about a history of head injury including concussion or previous head injury requiring
hospitalisation, due to potential influence on NfL or cognitive performance in
particular. Medications, non-pharmacological therapies and recreational drug use
were recorded for all participants.
Gene carriers and controls were matched by monitoring group means for sex, age,
years of education, and standard deviation (SD) for age and education as recruitment
progressed, to assist targeted recruitment to match the groups as closely as possible
for these demographics.
In HD-YAS, participants also had a full neurological examination, principally to
exclude contraindications for lumbar puncture.
2.4 Motor and functional assessments
The following motor and functional scales were performed in both studies and are
derived from the Unified Huntington’s Disease Rating Scales (UDHRS) (Huntington
Study Group 1996). All raters using the scale receive periodic training and
assessment to optimise interrater reliability.
Total Motor Score (TMS)
The TMS (Appendix 9.4) is a combined score for all aspects of HD-related motor
abnormalities derived from a standardised focus examination. This incorporates
assessment of 31 items rated on a scale of zero to four, with a score of zero indicating
no abnormalities and four indicating the most severe impairment. The assessment
covers eye movements, motor impersistence, tone, bradykinesia, motor planning,
chorea, dystonia, gait, balance and dysarthria. The maximum possible score is 124.
Diagnostic Confidence Score (DCS)
The DCS (Appendix 9.5) is a measure of how confident a rater is in classifying an
individual as manifest HD based on the TMS. The rating ranges from: 0 = normal to

59
4 = unequivocal signs of HD (>99% confidence). Typically scores of ≥15 on the TMS
will trigger a DCS of 4 and hence diagnosis of manifest HD, although this depends on
which items are scoring and the judgement of the rater.
Total Functional Capacity (TFC)
The TFC is a combined score assessing the individual’s ability to work, complete
household finances, perform activities of daily living and whether they can be cared
for at home. A score of 13 = fully functional and independent whilst a score of 0 would
indicate complete dependence for all care (Shoulson and Fahn 1979).
2.5 Cognitive assessments
All cognitive assessments discussed in this thesis were performed as part of HD-YAS.
This included tests from the Cambridge Neuropsychological Test Automated Battery
(CANTAB) (Sahakian and Owen 1992; Robbins et al. 1994; Robbins et al. 1998) as
well as social and emotional cognition and motivation from the EMOTICOM battery
(Bland et al. 2016). Tests were specifically chosen to measure performance across
multiple domains in which there is previous evidence of impairment in preHD including
cognitive flexibility (Lawrence et al. 1998), planning (Ho et al. 2003), verbal fluency
(Paulsen and Long 2014), emotion recognition (Henley et al. 2008), inhibition (Hart et
al. 2012), attention (Hart et al. 2012), learning (Begeti et al. 2016) and memory
(Lawrence et al. 2000; Begeti et al. 2016). Stroop word reading, semantic verbal
fluency, and symbol digit modalities testing, all part of the Enroll-HD study battery,
were also included given previous literature of impairment in preHD (Lawrence et al.
1998; Stout et al. 2011; Tabrizi et al. 2013).
CANTAB intra-extra dimensional set shifting (IED)
The IED (Figure 2.2A) is a 7-minute test measuring cognitive flexibility and is similar
to a computerised version of the Wisconsin Card Sorting test. It initially features rule
acquisition and reversal and then attentional set formation and set shifting. There are
9 stages to the test. Initially the test presents simple stimuli with just one dimension
(pink shapes). These later change to compound stimuli (white lines overlaid on pink
shapes). Early in the test the shifts are intra-dimensional (ID) (pink shapes are
relevant) to establish set formation. Then an extra-dimensional (ED) shift (white lines

60
become relevant) occurs (attentional set-shifting). This latter stage is followed by a
final reversal of the rule. Outcomes measures include the number of pre-ED errors,
ED shift errors, ED reversal errors and stages completed.
CANTAB one-touch stockings of Cambridge (OTS)
The OTS is a modified test of visuospatial planning and working memory based on
the Tower of London which takes approximately 10 minutes to complete. Participants
are shown example configurations of three coloured balls (Figure 2.2B). There are
two displays and participants are asked the number of moves required to match their
display to the example display without actually moving the balls. The problems differ
in the number of moves required to match the example configuration, starting at one
move progressing to six moves. The outcome measures include average response
latency and number of problems solved efficiently at the first choice.
CANTAB rapid visual information processing (RVP)
The RVP is a 10 minute test which measures sustained attention by presenting a
rapid stream of digits and requiring participants to detect target sequences. A white
box is displayed in the centre of the screen in which digits 2-9 are rapidly presented
at 100 digits per minute (Figure 2.2C). Participants are required to detect target
sequences (e.g. 2-4-7, 3-5-7 or 4-6-8) and respond to this target sequence as quickly
as possible. Outcome measures include A’, a signal detection theory measure of
target sensitivity, and mean response latency.
CANTAB stop signal test (SST)
The SST is a test of response inhibition and takes 20 minutes to complete. The
participant is shown an arrow in the centre of the screen and must respond with a
button depending on the direction the arrow is pointing (left or right); (Figure 2.2D). If
an audio tone is presented together with the arrow, the participant must withhold
making the response. The outcome measures are stop signal reaction time (SSRT),
mean reaction time on go trials and the proportion of successful stops. Only the SSRT
from the last half of the trials was calculated.
CANTAB paired associates learning (PAL)
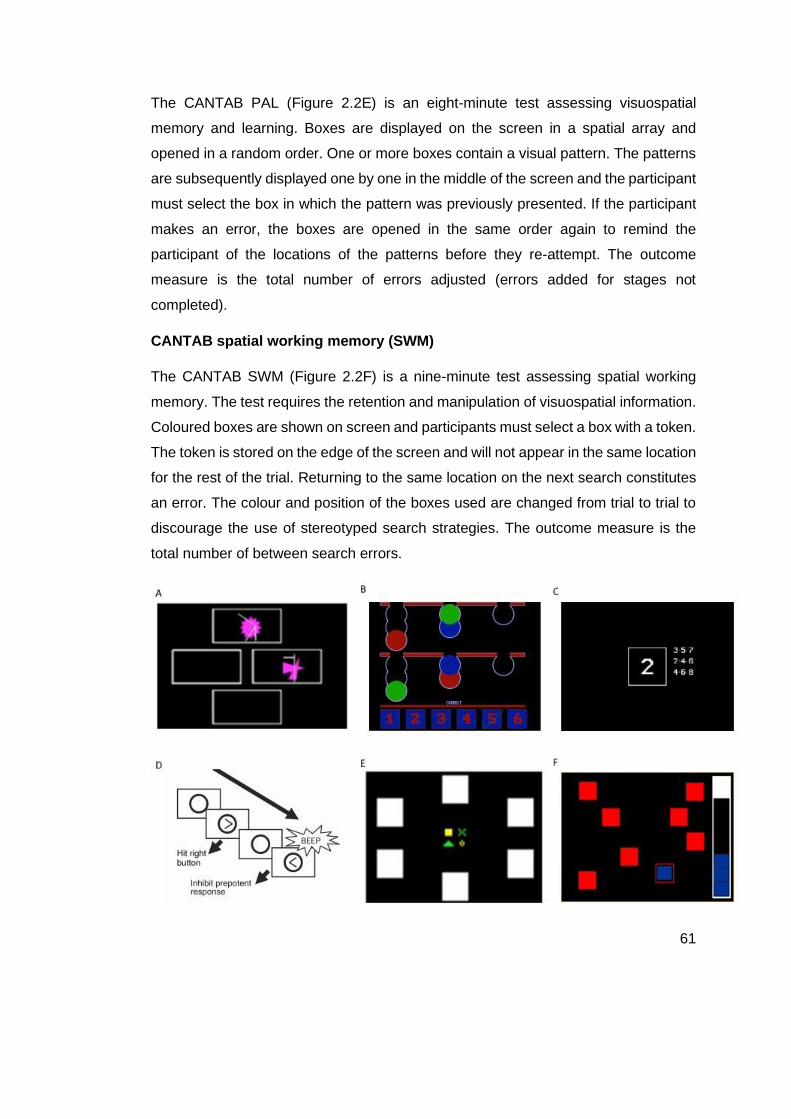
61
The CANTAB PAL (Figure 2.2E) is an eight-minute test assessing visuospatial
memory and learning. Boxes are displayed on the screen in a spatial array and
opened in a random order. One or more boxes contain a visual pattern. The patterns
are subsequently displayed one by one in the middle of the screen and the participant
must select the box in which the pattern was previously presented. If the participant
makes an error, the boxes are opened in the same order again to remind the
participant of the locations of the patterns before they re-attempt. The outcome
measure is the total number of errors adjusted (errors added for stages not
completed).
CANTAB spatial working memory (SWM)
The CANTAB SWM (Figure 2.2F) is a nine-minute test assessing spatial working
memory. The test requires the retention and manipulation of visuospatial information.
Coloured boxes are shown on screen and participants must select a box with a token.
The token is stored on the edge of the screen and will not appear in the same location
for the rest of the trial. Returning to the same location on the next search constitutes
an error. The colour and position of the boxes used are changed from trial to trial to
discourage the use of stereotyped search strategies. The outcome measure is the
total number of between search errors.

62
Figure 2.2. Composite image of CANTAB tests. A) CANTAB Intra-extra dimensional set shifting; B) CANTAB One Touch Stockings of Cambridge; C) CANTAB Rapid Visual Informational Visual Processing; D) CANTAB Stop Signal Test; E) CANTAB Paired Associate Leaning; F) CANTAB Spatial Working Memory.
EMOTICOM emotional intensity face morphing
The intensity morphing test (Figure 2.3A) measures the emotional intensity at which
participants recognise a facial emotion. In a 10 minute test, participants are presented
with faces that either increase or decrease in emotional intensity. Participants are
required to respond when they either first see the emotion (increasing) or can no
longer see the emotion (decreasing). The outcome measures were average detection
threshold of sad faces, for the increasing and decreasing condition separately.
EMOTICOM moral emotions test
In the 20 minute moral emotions test (Figure 2.3B) participants view cartoon figures
depicting moral scenarios. Participants are asked to rate their levels of guilt, shame,
annoyance and feeling “bad” following each of the cartoons. Half of the cartoons are
portrayed as deliberate harm and half as unintended harm. Participants are asked to
rate their emotions from the perspective of both the victim and the perpetrator. The
main outcome measure defined for this study was the guilt score collapsed across all
conditions (deliberate vs unintentional and perpetrator vs victim).
EMOTICOM progressive ratio
The progressive ratio test (Figure 2.3C) is a measure of motivation and effort and is
adapted from similar animal tests (Bland et al. 2016; Heath et al. 2019). Participants
are shown four red squares and are asked to select the odd one out (i.e., the large
square). Participants are rewarded progressively less per trial and each trial requires
more effort (number of presses) for the reward. The total number of trials is 436.
Participants are told they may end the test at any point, but they must stay and face
the screen for the remaining time (for 20 minutes minus the time they performed the
test). The outcome measure is the breakpoint, which is calculated as the maximum
total number of trials performed before the participant no longer wishes to continue
the test.

63
Figure 2.3. Composite image of EMOTICOM tests. A) EMOTICOM Emotional Intensity Face Morphing; B) EMOTICOM Moral Judgement; C) EMOTICOM Progressive Ratios
Semantic verbal fluency
The verbal fluency test is a short test of semantic verbal retrieval. Participants are
asked to list as many items as possible in a particular category (animals) in 60
seconds. The outcome measure is the number of words recited correctly.
Stroop word reading test (SWRT)
During the word reading test, participants are asked to read the words (colours) on
the page as quickly possible. The outcome measure was the number of words read
within 45 seconds.
Stroop colour naming test
During the colour naming test, participants are asked to name the colours on the page
as quickly as possible. The outcome measure was the number of colours named
within 45 seconds.
Symbol digit modalities test (SDMT)

64
The SDMT is a short test of psychomotor speed. It involves a substitution task,
whereby using a reference key, the participant has 90 seconds to pair specific
numbers and geometric figures.
Reinforcement learning
This task aim requires participants to choose the best symbol from a pair of abstract
symbols displayed on the screen (Palminteri et al. 2012). One of the symbols is
associated with a favourable outcome with a probability of 0.8 and the other symbol
is associated with the same outcome with a probability of only 0.2. Participants see
three pairs of such symbols corresponding to the three conditions – gains, neutral
and loss. With the gain frame the better outcome is to win fictional money (£1) as
compared to earning no reward. In the loss frame, participants either receive no
reward or lose £1. In the neutral conditions, both outcomes yielded no reward. In the
gain condition if participants win, they see a high resolution image of a £1-coin with a
green surrounding halo. If they lost, they see the same £1-coin image with a red cross
superimposed over it indicating they had lost money. In the neutral condition the two
outcomes were either an empty grey disc the same size as the pound coin or the
word ‘Nothing’. Participants are shown each pair of stimuli 30 times with a total of 90
choices per run. Participants are not paid for performance in this task. The outcome
measure was total percentage correct over both gains and losses.
2.6 Neuropsychiatric assessments
Neuropsychiatric assessments included in this thesis are a series of well-validated
self-report questionnaires, capturing the following domains: depression, anxiety,
apathy, sleep, impulsivity, obsessive compulsion, frontal behaviour and general
health. In each case, higher scores reflect higher levels of the domain being
assessed.
Apathy motivation index (AMI)
The AMI (Ang et al. 2017) is a recently developed apathy scale (adapted from the
Lille Apathy Rating Scale (Sockeel et al. 2006) assessing three distinct subtypes of
apathy: 1) behavioural activation; 2) social motivation; and 3) emotional sensitivity.

65
The items are assessed on a five-point scale that represents how true each statement
is over the past 2 weeks.
Baltimore irritability and apathy scale (BAIS)
The BAIS was designed to form a composite picture of an apathetic or irritability
syndrome in HD (Chatterjee et al. 2005). The apathy scale consists of 14 items
regarding different dimensions of apathetic behaviour. The irritability scale also
consists of 14 items regarding various dimensions of irritable behaviour.
Barratt impulsivity scale (BIS-11)
The BIS (Patton et al. 1995) assesses the personality/behavioural construct of
impulsiveness. It measures three factors, including attentional, motor and non-
planning impulsivity. Items are scored on a four-point scale relating to frequency of
behaviours.
Frontal systems behavioural scale (FrSBE)
The FrSBE (Stout et al. 2003) is a 46-item rating scale of three frontal systems
behavioural syndromes: apathy, disinhibition and executive dysfunction. In each
domain, it provides a measure of frequency of the behaviour over the previous two
weeks and the distressed caused. It includes a Total Score and scores across the
three subscales, where 14 items relate to apathy, 15 items to disinhibition and 17
items to executive dysfunction.
MOS 36-Item short-form health survey (SF-36)
The SF-36 (Ware and Sherbourne 1992) quantifies eight health concepts: 1)
limitations in physical activities because of health problems; 2) limitations in social
activities because of physical/emotional problems; 3) limitations in usual role because
of physical health problems; 4) bodily pain; 5) general mental health (psychological
distress and well-being); 6) limitations in usual role because of emotional problems;
7) vitality (energy and fatigue); and 8) general health.
Obsessive-compulsive inventory (OCI-R)
The OCI (Foa et al. 2002) is a brief questionnaire to determine severity of obsessive
and compulsive behaviours over the past month. The items are scored on a five-point

66
scale identifying how often an individual is distressed by behaviours relating to
washing, checking, ordering, obsessing, hoarding and neutralising.
Pittsburgh sleep quality index (PSQI)
The PSQI (Buysse et al. 1989) assess several subcategories including; subjective
quality of sleep, sleep onset latency, sleep duration, sleep efficiency, presence of
sleep disturbances, use of hypnotic-sedative medication and presence of daytime
sleepiness over the past month.
Spielberger state/trait anxiety (STAI)
The STAI (Spielberger et al. 1983) is a commonly used measure of anxiety,
quantifying both state and trait levels of anxiety. Items are scored on a four-point scale
that reflects usual frequency of anxious thoughts/behaviours.
Zung self-rating depression scale (SDS)
The SDS (Zung et al. 1965) is a self-rated scale for depression. It covers affective,
psychological and somatic symptoms associated with depression. Items are scored
on a four-point scale based on how often the participant has felt or behaved this way
over the previous few days.
2.7 Biofluid assessments
All biofluids assessed in this thesis were collected as part of HD-YAS using
standardised and well validated conditions, methods and equipment. Blood collection
was performed between 0930-1030 without fasting, using up to four 10 ml lithium
heparin tubes. Samples were placed on wet ice and processed within 30 minutes of
collection. Plasma was isolated by centrifugation and frozen.
CSF sample collection and processing was performed using standardised methods
derived from previous HD studies (Wild et al. 2015; Byrne et al. 2018). Lumbar
punctures were carried out between 0830-1030 after overnight fasting. Polypropylene
tubes were precooled on ice prior to CSF collection. The lateral decubitus position
was used as preference for the procedure. On occasions, if CSF collection was
challenging, an upright position was used to obtain access, before reverting back to

67
the lateral decubitus position for collection. Lidocaine 2% was administered
subcutaneously for local anaesthesia. Whitacre 22-gauge atraumatic spinal needles
were used for the procedure to minimise post-lumbar puncture headaches (Nath et
al. 2018). Upon access, CSF was collected without suctioning until 20 ml had been
collected or 20 minutes had elapsed. If the CSF was initially macroscopically bloody,
it was discarded until it had become clear, but no more than 20 ml was collected in
total. The stylet was reinserted at the end of collection before the spinal needle was
removed. Immediately after the lumbar puncture, an additional fasted blood sample
was taken using up to four 10 ml lithium heparin tubes. Samples were placed on wet
ice and processed within 30 minutes of collection by centrifugation and freezing using
standard kits containing polypropylene plasticware supplied by the HDClarity study
(Clinicaltrials.gov; NCT02855476 2016). All samples were stored at -80oC and
analysed blinded to disease status and clinical data. Haemoglobin concentration was
measured using a commercial ELISA to determine CSF contamination by blood.
CSF concentrations of mHTT were quantified using the SMC Erenna Immunoassay
system (Singulex) at a clinical research facility (Evotek), using a protocol previously
described (Wild et al. 2015). The assay has been subsequently validated, where the
signal generated by the assay was partially dependent on the polyglutamine length
of the protein, the HTT fragment size as well as mHTT concentration (Fodale et al.
2017). Capturing antibodies MW1 target the polyglutamine expansion whilst 2B7
target the first 17 amino acids of huntingtin. Total huntingtin was quantified for the first
time in human samples with the 2B7-D7F7 assay where D7F7 binds to the middle
HTT region at Proline 1220 (Weiss et al. 2012; Cariulo et al. 2017).
Neurogranin was quantified using an in-house ELISA at the Zetterberg lab in
Gothenburg, as previously published (Wellington et al. 2016). All other analytes were
quantified using commercially available assays as detailed in
Table 2.1. Plasma UCH-L1 results were not included in the analysis in this thesis due
to previously reported high variability in assay performance (Zeitlberger et al. 2018;
Thelin et al. 2019). Haemoglobin, mutant and total huntingtin (tHTT) concentrations
were measured in triplicate with the other analytes all measured in duplicate.
Table 2.1. Biofluid assay details

68
Analyte Source Assay name Platform Manufacturer Performed
by
Median
CV
N CV
>20%
mHTT CSF 2B7-MW1
immunoassay
SMCTM
Erenna®
Singulex Evotek 9.9 6
tHTT CSF 2B7-DF7
immunoassay
SMCTM
Erenna®
Singluex IRBM 9.2 10
NfL CSF Neurology 4-Plex
A
SIMOA HD-1
AnalyzerTM
Qunaterix UCL 2.5 0
NfL Plasma Neurology 4-Plex
A
SIMOA HD-1
AnalyzerTM
Qunaterix UCL 4.3 2
Tau CSF Neurology 4-Plex
A
SIMOA HD-1
AnalyzerTM
Qunaterix UCL 2.6 0
Tau Plasma Neurology 4-Plex
A
SIMOA HD-1
AnalyzerTM
Qunaterix UCL 4.1 2
GFAP CSF Neurology 4-Plex
A
SIMOA HD-1
AnalyzerTM
Qunaterix UCL 2.0 0
UCH-L1 CSF Neurology 4-Plex
A
SIMOA HD-1
AnalyzerTM
Qunaterix UCL 4.8 2
IL-6 CSF IL-6 SIMOA HD-1
AnalyzerTM
Qunaterix UCL 2.4 0
IL-8 CSF IL-8 SIMOA HD-1
AnalyzerTM
Qunaterix UCL 4.7 5
Neurogranin CSF Neurogranin ELISA Euroimmun UCL 3.5 2
YKL-40 CSF Human YKL-40
Assay
U-PLEX® MSD UCL 1.8 2
Coefficient of Variability; SMC = Single Molecule Counting, MSD = Mesoscale Discovery; SIMOA = Single
Molecule Array.
2.8 MRI
MRI allows for visualisation of the structure and function of the brain in-vivo, enabling
measurement of neuropathological change as it occurs over time without invasive
procedures. This section will introduce the different imaging acquisitions referenced
in this thesis before focusing in more detail on DWI which represents the main data
analysed in chapters 4 and 5.

69
2.8.1 Acquisition of MRI data
MRI scans use a magnet and radiofrequency pulses to change the state of hydrogen
atoms in the body, with the energy created by these changes in state measured and
outputted in the form of an image (Currie et al. 2013). The strength of this magnetic
field is described in units of Tesla (T), with higher Tesla scanners typically resulting
in higher resolution images. Most modern scanners are either 1.5T or 3T in strength.
7T scanners are just starting to become available having been approved by the FDA
in 2017 (FDA 2017).
In the MRI scanner, there is a constant magnetic field in the longitudinal or “z” plane,
prior to the administration of a pulse sequence. This causes protons to spin together
about the direction of the magnetic field generating longitudinal magnetisation. To
create a detectable signal, a second magnetic field is applied that moves protons into
the “transverse” (x-y) plane. The longitudinal magnetisation is reduced to zero and
the protons now spin due to magnetisation in the transverse plane. The ensuing
movement induces an electromagnetic current which is measured as the MR signal.
As soon as protons are moved into the transverse plane, longitudinal magnetisation
begins to return to zero, known as longitudinal or T1 relaxation and characterised by
the time constant, T1. When protons are moved into the transverse plane, they
interact with each other and lose magnetisation; known as transverse relaxation and
characterised by the T2 time constant. T1 relaxation can take several seconds whilst
T2 relaxation just a few milliseconds. T1 and T2 weighting determine the nature of
the image contrast, where differences in signal intensity occur due to different
physical properties of tissue types. The weighting is governed by two parameters:
repetition time (TR), the time between pulse sequence repetitions; and echo time
(TE), the duration between the initial pulse and the point at which the signal is
measured. These parameters are then manipulated to produce different weightings
based on the requirements of the scan (Currie et al. 2013; Gregory et al. 2018).
2.8.2 Volumetric imaging
Volumetric imaging is a form of structural MRI scan that quantifies volumes either in
structures of interest or the whole brain. T1-weighted images are used, since they
provide the best between-tissue contrast. Volumetric analysis can be performed on

70
regions of interest or the whole brain. Segmentation of regions of interests can be
performed by manual delineation, using software that performs automated
segmentations, or semi-automated approaches where a combination of the two are
used. Automated techniques such as Multi Atlas Label Propagation with Expectation
Maximisation-Based Refinement (MALP-EM) (Ledig et al. 2015) and Freesurfer
(Fischl et al. 2002) can perform brain segmentations quickly and accurately, which is
advantageous when multiple region segmentations are required for each scan in large
datasets, such as in a structural connectivity analysis. Whilst semi-automated
techniques such as the medical image display and analysis system (MIDAS) (Fox et
al. 1996) take longer to process, they are well established within the field of
neuroscience and are typically used when only segmenting select structures such as
whole brain, or caudate for example.
2.8.3 Multi-parametric mapping
Multi-parametric mapping (MPM) was designed to provide absolute measures of
select MR parameters and thus data that are comparable across sites and time points
(Weiskopf et al. 2013). It provides maps of the longitudinal relaxation rate (R = 1/T1),
effective proton density (PD), magnetisation transfer saturation (MT) and effective
transverse relaxation rate (R2* = 1/T2*). The multiple parameter maps and high
resolution allow for a detailed assessment of white and grey matter microstructure,
including providing proxy estimates of iron and myelin (Stüber et al. 2014). MT
measures macromolecular content, particularly myelin so a decrease in MT
represents demyelination. PD is most sensitive to microstructural water content, R1
detects the relative contribution of myelin and water content as well as paramagnetic
content such as iron, and R2* is most sensitive to iron and myelin distribution. Hence,
the study of MPM results in parallel facilitates biological interpretation, for example
changes in R1 or R2* without congruent changes in PD would be suggestive of iron,
rather than myelin changes.
MPM has been previously validated showing good reproducibility (Weiskopf et al.
2013). It has been used in contexts such as healthy aging (Draganski et al. 2011) and
mapping cortical myelination (Sereno et al. 2013), but has not been used to study HD
before.

71
2.8.4 Resting state fMRI
fMRI measures signals related to the coupling of neuronal activity and blood flow.
BOLD (blood oxygen level-dependent) fMRI measures a signal predominantly related
to blood oxygen, a proxy measure of metabolic activation and thereby brain activity.
The vascular origin of the change in signal has a time course known as the
haemodynamic response function which is modelled to provide localization of
neuronal activity (Gregory and Scahill 2018). Resting state fMRI analysis focuses on
connectivity between regions in the brain at rest. In chapter five of this thesis, resting
state fMRI is used to investigate temporal correlations in functional activity across the
network.
2.8.5 Diffusion weighted imaging
Diffusion weighted imaging (DWI) is a method of signal contrast generation based on
the differences in Brownian motion. The diffusion signal is generated from the phase
change resulting from the displacement of spins along the axis of an applied field
gradient. The longer the protons are allowed to diffuse (diffusion time, Δ) and the
higher the mean squared displacement per unit time of the molecules (apparent
diffusivity), the further molecules will distribute from their origin. The signal attenuation
depends on two factors; the distribution of displacements during the diffusion time
along the axis of the applied gradient, and the gradient strength and duration which
determine the sensitivity of the signal phase towards displacement. For example,
since water can freely diffuse in CSF, the signal is strongly attenuated. In white matter
however, water diffusion is restricted by tightly packed axons and the signal is
therefore higher (Jones et al. 2013).
A single DWI image is created by a single pulse in a single direction. Thus, repeated
pulses with multiple gradient directions create a more detailed diffusion image. A
diffusion gradient can be represented as a 3D vector ‘q’, whose orientation is in the
direction of diffusion and length is proportional to gradient strength. The gradient
strength, also referred to as the diffusion weighting, can be expressed in terms of the
b-value. This is a combined measure of gradient strength and diffusion time.
Therefore, a larger b-value represents increased gradient amplitudes or duration
and/or widened intervals between gradient pulses. As a result, increased b-values

72
result in greater diffusion contrast but lowered signal-to-noise ratio. Shells refer to a
set of volumes with the same b-value. Adding multiple shells to an acquisition
improves the ability to model the diffusion signal and to further probe tissue
microstructure (Jones et al. 2013; Fritz et al. 2019)
2.8.5.1 Diffusion Tensor Imaging (DTI) and Neurite Orientation
Dispersion and Density Imaging (NODDI)
The most commonly used diffusion imaging technique is DTI and because white
matter diffusion is more easily modelled than grey matter, the majority of DTI studies
in clinical neuroscience focus on the white matter. A tensor is a 3x3 matrix that
represents water movement in the three dimensions in each voxel and can be
represented as three eigenvectors (Figure 2.4) through eigenvalue decomposition (Le
Bihan et al. 2001).
Figure 2.4. Examples of tensor shapes and DTI measures.
As shown in Figure 2.4, λ1 represents diffusivity along the principal axis of diffusion,
whilst λ2 and λ3 measure diffusivity orthogonal to the principle axis of diffusion. The
eigenvalues are then used to calculate measures of fractional anisotropy (FA), axial
diffusivity (AD), radial diffusivity (RD) and mean diffusivity (MD). In the diffusion tensor
73
model, diffusion is assumed to be anisotropic in white matter which can be
represented as an ellipsoid, where the principle direction of diffusion runs parallel to
the axon. Increases in AD/RD/MD and reductions in FA are typically reported in
neurodegeneration irrespective of cause (Zhang et al. 2009; Gregory et al. 2015;
Atkinson-Clement et al. 2017) and is thought to represent axonal degeneration
although several processes can influence these metrics, including demyelination and
increases in water content (Jones et al. 2013; Grussu et al. 2017).
Recent advances in MRI have facilitated new techniques that attempt to provide a
more direct in vivo characterisation of white matter microstructure. One of the most
commonly used models is NODDI (Zhang et al. 2012) which applies a three-
compartment tissue model to multi-shell DWI data. By modelling the packing density
of axons (neurite density index; NDI), the spatial dispersion of axons (orientation
dispersion index; ODI) and the amount of free water in each voxel (free water fraction;
FWF), all of which can affect a diffusion tensor measure, it aims to quantify each
process separately to provide more specificity to any white matter change observed.
It has been previously successfully applied to study several neurodegenerative
conditions (Slattery et al. 2017; Broad et al. 2019; Mitchell et al. 2019) including
preHD, where reductions in NDI coupled with increased local organisation in
peristriatal regions were found to be the dominant changes (Zhang et al. 2018).
2.9 Diffusion MRI processing
In this section, I explain the diffusion processing that relate to the following chapters
in this thesis.
2.9.1 Pre-processing
Pre-processing of DWI data can be important to increase the signal-to-noise for
subsequent analysis. Pre-processing steps were performed using tools within
MRtrix3 following recommended guidelines (Tournier et al. 2019). This included
denoising of data (Veraart et al. 2016), Gibbs-ringing artefact removal (Kellner et al.
2016) eddy-current correction and motion correction (Andersson and Sotiropoulos
2016), bias correction (Tustison et al. 2010) and up-sampling diffusion MRI spatial
resolution in all 3 dimensions using cubic b-spline interpolation to 1.3×1.3×1.3 mm3

74
voxels (Dyrby et al. 2014). The up-sampling of data helps to increase the anatomical
contrast, which improves downstream spatial normalisation and statistics (Raffelt et
al. 2017).
2.9.2 Constrained spherical deconvolution
One of the major limitations of the previously widely used diffusion tensor model was
that its voxel averaged measurement meant it was incapable of resolving crossing
fibres within a voxel, a phenomenon estimated to occur in up to 90% of all voxels
(Jeurissen et al. 2013). Constrained spherical deconvolution (CSD) enables the
robust determination of the orientation of various fibre bundles present within an
individual voxel and provides a better angular resolution than many other multiple-
fibre reconstructions whilst maintaining a modest computation time (Tournier et al.
2007; Ramirez-Manzanares et al. 2011).
The principle here is that the diffusion signal measured from a fibre population is
proportional to the volume of that population. The response function corresponds to
the diffusion signal measured for a single fibre bundle aligned with the z axis, and is
assumed as constant in all 3 tissue types (Tournier et al. 2004). CSD involves the
spherical deconvolution of the response function, which simply transforms the data
such that the resulting amplitude along a particular direction is proportional to the
measured signal that is orientated in that direction. CSD is performed on the DWI
signal within each voxel for grey matter, white matter and CSF separately, to produce
the fibre orientation density function (FOD). The white matter FOD then contains all
the information regarding the fibre orientations present within a given voxel and their
corresponding volume fractions which can then be used for tractography or estimating
fibre density as described later.
2.9.3 Connectivity-based parcellations of the striatum and
thalamus
In order to investigate structural connections between different brain regions, it is
necessary to parcellate the structures of interest. In chapters three and four, I
investigate cortico-striatal and cortico-thalamic white matter tract integrity using
connectivity-based atlases. Previously, studies examining white matter connectivity

75
in HD have utilised parcellation schemes based on macrostructural properties
(McColgan et al. 2015; McColgan et al. 2017; Shaffer et al. 2017; Zhang et al. 2018),
typically splitting the striatum into a single caudate and putamen region. However this
does not take into account structural connectivity patterns of the brain regions being
studied, which can vary substantially across a single anatomical region. Indeed,
several imaging and primate tracer studies have consistently demonstrated a distinct
topographical organisation of cortical connections to the striatum and thalamus along
a dorsal-ventral caudal-rostral gradient (Behrens et al. 2003; Haber 2003; Haber et
al. 2006; Tziortzi et al. 2014; Fan et al. 2016; Parkes et al. 2017). Therefore one of
the aims in this thesis was to examine these subconnections separately to further
understanding of the patterns of structural connectivity breakdown in preHD.
Three different striatal connectivity-based parcellation schemes were tested for use
in this thesis; the Oxford-GSK-Imanova (Tziortzi et al. 2014), Brainnetome (Fan et al.
2016) and Parkes striatal (Parkes et al. 2017) atlases. The Oxford-GSK-Imanova
atlas (Figure 2.5), available in FSL (Jenkinson et al. 2012), was selected due to
satisfactory registration to diffusion space and possessing enough granularity (option
of three or seven divisions per hemisphere) to examine subregion tracts separately.
In chapter three, the three subregion atlas was used to avoid too many comparisons
given connectivity in several cortical regions was also investigated. In chapter four,
the aim was to look in more detail at subnetworks and so the seven division atlas was
used. In the seven striatal subregion parcellation, the limbic region connects to the
orbital gyri, gyrus rectus and ventral anterior cingulate. The executive region connects
to dorsal prefrontal cortex. The rostral motor region connects to the supplementary
motor, pre-supplementary motor cortex and the frontal eye field region. The caudal
motor region connects the post-commissural striatum to the pre- and primary motor
cortex, whilst parietal, temporal and occipital regions connect to respective cortices
as defined by the Harvard-Oxford cortical atlas (Tziortzi et al. 2014). The three
subregion striatal atlas is comprised of limbic, executive and sensorimotor subregions
only.

76
Figure 2.5. Striatal connectivity-based atlas. Showing the subdivisions of the striatal atlas used in this thesis. The atlas is based on cortico-striatal anatomical connectivity information derived from diffusion tractography in health human subjects (Tziortzi et al. 2014). The temporal and occipital subdivisions are the smallest subregions and are not shown in this figure. Reprinted with permission from Oxford University Press.
As a key output structure in the cortico-basal ganglia network, cortico-thalamic
connectivity was also examined in preHD as part of this thesis in chapter four. For
consistency, the seven region per hemisphere connectivity based parcellation also
available in FSL (Behrens et al. 2003; Johansen-Berg et al. 2005) was used (Figure
2.6). Here, the medial and dorsal thalamus including the mediodorsal nucleus connect
to prefrontal and temporal regions. The ventral posterior nucleus connects to sensory
cortex. The ventral lateral and anterior nuclei connect to primary motor and premotor
cortex. The lateral posterior nucleus and parts of the pulvinar connect to parietal
cortex.
In chapter five, a similar approach to segmenting the striatum is used, except the atlas
selected was derived from fMRI data (Choi et al. 2012), rather than diffusion data,
although the resulting subdivisions are similar to those derived from diffusion data.

77
Figure 2.6. Thalamic connectivity-based atlas. Showing subdivisons of the thalamus based on diffusion tractography in healthy human subjects (Behrens et al. 2003). a) Divisions of the cortex were based on anatomical landmarks. Blue is the prefrontal cortex, green is the premotor, orange primary-motor, light blue sensory, yellow parietal, purple temporal and red occipital. b) showing the corresponding subregions of the thalamus that predominantly connect to the corresponding cortical region. Reprinted with permission from Springer Nature.
2.9.4 Tractography
Diffusion tractography is a method of using the DWI signal to reconstruct white matter
tracts in-vivo and is utilised in all following chapters.
Tractography was performed using the iFOD2 algorithm available in MRtrix3
(Tournier et al. 2019). This is a probabilistic algorithm that uses the FOD as input to
reconstruct white matter tracts. Candidate streamline paths are drawn and a
streamline is more probable to follow a path where FOD amplitudes (relating to the
estimated fibre density) is large. Similarly, a streamline will not follow a path where
the FOD is very low, limiting false positive tract generation. Despite this however,
probabilistic tractography does suffer from a significant false positive tract generation
(Maier-Hein et al. 2017; Sarwar et al. 2019).
In chapters using connectomic approaches, these streamlines are seeded throughout
the white matter to provide whole brain tractograms. In chapter 4, streamlines are
seeded in specific striatal and thalamic subregions to enable reconstruction of select
tracts only.
2.9.5 Fixel-based analysis
In chapter 4, a recently developed technique known as fixel-based analysis (FBA) is
utilised to assess cortico-striatal and cortico-thalamic white matter tract
microstructure. FBA enables fibre tract-specific comparisons by generating measures

78
of fibre density and cross-section for a single fibre population within a voxel (termed
fixel) (Raffelt et al. 2017). It generates measures of fibre density (FD), fibre cross-
section (FC) and fibre density and cross-section (FDC) (Figure 2.7). FD is a measure
proportional to the intra-axonal volume of white matter axons aligned with a fibre
population (Raffelt et al. 2012). It is derived from segmenting the FOD under the
assumption that the integral of the FOD along a particular direction is proportional to
the intra-axonal volume of axons aligned in that direction.
While FD estimates changes in intra-axonal volume, another possibility in
neurodegeneration is atrophy of a fibre bundle across its whole cross section. The
FC metric is computed to capture such a change (Raffelt et al. 2017). Here, the
morphological differences in the fixel cross-section (in the plane perpendicular to the
fixel direction) are estimated for each fixel by using the non-linear warps required to
spatially normalise the subject image to the template image to compute the change
in fibre bundle cross-section. With respect to the population template, a FC of >1
indicates a larger fibre cross-section in the subject, while FC values <1 indicate a
smaller cross-section.
To account for the possibility that white matter pathology may manifest as both
changes in FD and FC, the FDC is computed by a multiplication of FD and FC to give
a combined measure that captures both changes (Raffelt et al. 2017).

79
Figure 2.7. Fixel-based metrics. A schematic representing a fibre bundle cross-section with grey circles representing axons and the grid representing a voxel. A change in intra-axonal volume may be represented by a change in (a) fibre density, (b) reduction in fibre cross section or (c) a combination of both. Reprinted from (Raffelt et al. 2017) under creative commons license.
2.9.6 Connectomics and graph theory
Whilst the previously described methodology can interrogate microstructural changes
in specific white matter connections, it is unable to characterise connectivity across a
given network and cannot be used to study functional connectivity. Through the
construction of structural and functional white matter networks, connectomics
provides a framework to investigate connectivity on a broader scale. This approach
will be used to investigate structural and functional connectivity in early preHD in
chapters 3 and 5.
Structural and functional brain networks can be constructed using diffusion
tractography and resting state fMRI. The brain can be parcellated into a number of
distinct regions using a brain atlas. Atlases may be based on structural (Desikan et
al. 2006) or functional profiling (Yeo et al. 2011) or incorporating both structural and

80
functional aspects of brain regions (Fan et al. 2016; Glasser et al. 2016). Each
parcellated brain region represents a node in a network of other nodes. In structural
brain networks, these nodes are connected by white matter connections whereas in
functional networks these connections represent temporal correlations from fMRI time
series (Fornito and Bullmore 2015).
The topological characteristics of these brain networks can be described using a
mathematical approach known as graph theory (Rubinov and Sporns 2010). Graph
theory measures can be classified as local or global, depending on whether they
quantify connectivity within clusters, or across the network. An example of local
measure includes degree and graph strength. Degree represents the number of
binary connections a brain region has. However, this cannot capture the density of
such connections which will strongly influence connectivity. Strength calculates the
sum of connection weights to the rest of the network for a given brain region, providing
a measure of density for each connection that is missing from degree. An example of
a weight might be a fibre density measure across the connection estimated directly
from the underlying diffusion signal (Smith et al. 2015).
Whilst local measures can be useful in examining the connectivity of specific regions
of interest, global measures can quantify connectivity across a whole network. Global
measures used in this thesis are global efficiency and modularity (Figure 2.8). Global
efficiency is the inverse of the average shortest path length (the average of shortest
paths between brain regions in a network) and a decrease represents loss of network
integration. Modularity refers to the community structure within brain networks.
Modules are clusters of nodes with dense interconnectivity within the cluster but
sparse connections between nodes in different clusters (Rubinov and Sporns 2010).
As modularity increases, the network is more segregated with fewer connections
between different modules. Calculations for these measures are detailed in the
appendix 9.6.

81
Figure 2.8. Summary of global graph measures used in this thesis. On the left is an example of three interconnected modules. If this network lost the connection highlighted in the blue box, modularity would increase as the network is more segregated. On the right, highlights the shortest path through a network. If the connection within the blue box is lost, the shortest path increases and thus global efficiency of the network decreases. Adapted under creative commons license (Farahani et al. 2019).
2.9.6.1 Connectome considerations
Connectivity matrices can be influenced by several factors including scale of the brain
parcellation, tractography algorithm, weighting scheme, thresholding approach and
streamline filtering (Bullmore and Sporns 2009; Smith et al. 2015).
In choosing a parcellation scheme, using a higher number of brain regions can
provide more detail whereas using lower numbers of brain regions can potentially
improve reproducibility of results (Cammoun et al. 2012). In chapter three,
reproducibility was prioritised and therefore the Freesurfer Desikan atlas (Desikan et
al. 2006) was used since it has a relatively coarse parcellation and has been used in
previous studies of structural connectivity in HD (McColgan et al. 2015; McColgan et
al. 2017). In chapter five, I further investigate reproducibility of results by using a 100
and 500 parcellation scheme in a connectivity analysis.
Interpretation of the connectome relies on the assumption that streamlines have
terminated at the right place (i.e. when it meets a grey matter boundary). Older
methods included using a FOD or FA threshold, which is not always reliable, or using
a cortical brain mask, which suffers from poor spatial resolution of diffusion images.
Anatomically constrained tractography (ACT) is a newer method that utilises
anatomical information from a co-registered T1 image (where the grey-white matter
boundary is clearer) to define appropriate terminations of streamlines and rejecting

82
streamlines that pass through CSF for example, whilst still also using the FOD to help
remove false positive tracks (Smith et al. 2015).
Another potential problem in connectomics is that the density of reconstructed
connections is not indicative of the density of underlying axonal connections (Jones
et al. 2013) and false positive tractograms can occur. In order to address this, the
second iteration of spherical deconvolution informed filtering of tractograms (SIFT2)
was performed (Smith et al. 2015). This determines an appropriate cross-sectional
area multiplier for each streamline, based on the underlying FOD, to provide a
weighted measure of connectivity that is representative of the underlying axonal
bundle density. This also limits the influence of any false positive tracts generated
that can be assumed to have low FODs.
2.9.6.2 Network based statistics
Network-based statistics (NBS) is a statistical approach for graph analysis that aims
to increase power to detect group differences by controlling the family-wise error
(FWE) rate when mass univariate testing is performed at every connection in the
graph (Zalesky et al. 2010). NBS is a well validated method that has been used to
examine brain network dysfunction in neurological and psychiatric diseases (Fornito
and Bullmore 2015). Here, a test statistic is calculated for each connection
independently and a primary threshold (p < 0.05, uncorrected) is then applied to form
a set of suprathreshold connections. Permutation testing is used to assign a p-value
controlled for FWE to each set of suprathreshold connections. For each permutation
the test statistic is recalculated, after which the same threshold is applied to define a
set of suprathreshold connections. The maximal component size for each
permutation is then determined to provide an empirical estimate of the null distribution
of maximal component size. The FWE corrected p-value of the observed component
size k is estimated by finding the proportion of permutations for which the maximal
component is greater than k. The FWE adjusted p-value is set at 0.05.
2.9.7 Statistical considerations
In the HD-YAS, appropriately powering the study was an important consideration
when any true disease effects in gene carriers far from predicted onset would likely
be subtle. The study was powered based on the effect size of striatal volumes

83
between controls and the preHD group furthest from onset, limited to those under 40,
in the TRACK-HD study. However, the study may be underpowered to detect more
subtle differences in this measure in a group further from predicted onset and indeed
in other measures who’s effect size, if there was a true difference, would be
anticipated to be even smaller based on previous evidence. Therefore power across
other domains and variables is unknown and likely to be relatively weak. An
alternative route might have been to conduct power calculations for different
modalities, such as one test from each modality with the largest observed effect size
in previous premanifest studies such as TRACK-HD or PREDICT-HD. This would
have likely concluded a larger sample size would be required to achieve sufficient
power for these variables. However in planning the study, it was felt that recruiting a
larger sample size would not be possible based on the known low levels of predictive
testing in young adults in the UK.
HD-YAS had 165 different measures analysed across the four domains of cognition,
neuropsychiatry, imaging and biofluids and consideration of statistical adjustment for
multiple comparisons was important. One approach is not correct for multiple
comparisons and instead report individual P values and confidence intervals,
acknowledging that 5% of significant values may be wrongly rejecting the null
hypothesis. In this study, this approach was not pursued as it was felt to be more
important to control for multiple comparisons and set a higher bar for reporting
significant results.
There are different methods for correcting for multiple comparisons. Family-wise error
rates, such as the Bonferroni correction are often highly conservative, controlling the
probability of type I errors at the cost of significantly reduced power to detect true
positives (Korthauer et al. 2019). FDR is an alternative method that has been shown
to have greater power to detect true positives, while still controlling the proportion of
type I errors at a specified level (Benjamini and Hochberg 1995; Benjamini and
Hochberg 2000). Therefore, given the limited power across the study, the Benjamini
Hochberg false discovery rate (FDR) calculation was performed, correcting variables
each domain separately, to maximise power to detect true positives in the study.
Importantly, rigor is not diminished by performing these calculations at the domain
level rather than in a single appraisal of the combined domains. Unlike correction for

84
family-wise error rate, FDR calculations depend on the distribution but not on the
number of hypothesis test p values considered simultaneously, which is possibly
advantageous in a study with a large number of hypotheses such as HD-YAS.

85
3 Clinical and biomarker profiling of gene carriers
far from predicted onset: The HD Young Adult
Study (HD-YAS)
This chapter is based on data published in Lancet Neurology, where I was joint first
author (Scahill et al. 2020). This study performed a cross-sectional deep phenotyping
of HD gene carriers further from onset than previously examined, to identify how early
HD related changes can be detected and which measures are most sensitive early in
the disease course.

86
3.1 Introduction
As discussed in the introductory chapter, the past decade has seen significant
progress in the development of therapeutics that can target RNA and DNA. As a
monogenetic disorder with onset typically in midlife, HD represents an appealing
disease candidate for such approaches. A detailed characterisation of the early
premanifest period in HD is crucial for disease staging, informing the optimum time to
initiate treatments, and identifying biomarkers for future trials in preHD. Although
dependent on the profile of a given therapeutic, one potential strategy would be to
initiate treatment before neurodegeneration has affected clinical function, but at a time
where there is a measurable biomarker of disease to measure efficacy.
Previous large observational studies have characterised the premanifest stage of
disease up to 15 years before expected clinical onset. Of the clinical features,
cognitive impairment and increased neuropsychiatric symptoms appear to be the
earliest detectable changes in the premanifest period, with motor signs emerging
closer to expected disease onset (Tabrizi et al. 2013).
Subtle cognitive impairments in domains such as executive function (Lawrence et al.
1998; Stout et al. 2011; Papp et al. 2013), psychomotor speed (Lawrence et al. 1998;
Snowden et al. 2002; Stout et al. 2011; Stout et al. 2012; Tabrizi et al. 2013),
visuomotor integration (Lemay et al. 2005; Say et al. 2011) and emotion recognition
(Stout et al. 2011; Harrington et al. 2014) have been previously reported in preHD.
Among the most widely studied tasks, the SDMT, Stroop word reading, and emotion
recognition have shown strong effect sizes in the premanifest period (Stout et al.
2011; Tabrizi et al. 2013). Such cognitive impairments become increasingly
pronounced in individuals close to predicted onset, but there is little previous evidence
of cognitive impairment in gene carriers approximately 15 years from predicted onset
(Stout et al. 2011; Tabrizi et al. 2013).
Increased neuropsychiatric symptoms previously reported in the premanifest period
include apathy, depression, anxiety, and obsessive-compulsive symptoms (Tabrizi et
al. 2013; Epping et al. 2016). Similarly to cognitive features, these become more
prevalent in groups closer to onset, although associations between affective

87
symptoms and disease stage are less consistent, possibly owing to their treatable
nature.
Progressive striatal atrophy has been consistently reported at the earliest stages
studied in preHD (Paulsen et al. 2008; Aylward et al. 2011; Tabrizi et al. 2011) and
striatal volumes have shown the largest effect size in the group furthest from onset in
the TRACK-HD study (Tabrizi et al. 2013). Progressive white matter atrophy has also
been detected in preHD in the groups furthest from onset in TRACK-HD and
PREDICT HD (Aylward et al. 2011; Tabrizi et al. 2013), with prominent changes in
the peristriatal white matter and corpus callosum. Reductions in whole brain and grey
matter volumes have been reported in preHD, but with smaller effect sizes than for
striatal or white matter measures in the early premanifest stage of the disease (Tabrizi
et al. 2012; Tabrizi et al. 2013).
Diffusion MRI has been utilised to examine white matter microstructure and structural
connectivity in the premanifest period. Both DTI and the more recently developed
NODDI model have shown the most prominent changes occurring in the corpus
callosum, internal and external capsules (Rosas et al. 2010; Stoffers et al. 2010;
Poudel et al. 2014; Harrington et al. 2016; Zhang et al. 2018). In previous structural
connectivity analyses using the TRACK-HD and TrackOn-HD cohorts, cortical rich
club and cortico-striatal connections have appeared particularly vulnerable to
degeneration in the premanifest period (McColgan et al. 2015; McColgan et al. 2017).
Similarly, network measures of reduced integration and increased segregation have
also been reported at this stage (McColgan et al. 2015).
Several biofluid biomarkers of neuronal damage or immune activation have also been
reported in the premanifest period (Zeun et al. 2019). mHTT and NfL have been
examined most extensively, the latter in blood and CSF. Both have been reported to
be elevated in preHD and to track disease progression (Byrne et al. 2017; Byrne et
al. 2018). Of other markers of neuronal damage, elevated concentrations of tau has
also been reported in preHD, although it appears to be less related to disease
progression than NfL (Niemela et al. 2017). Of the immune mediated markers, the
astrocytic marker YKL-40 has been reported to be increased in the CSF of
premanifest gene carriers (Rodrigues et al. 2016) whilst elevated concentrations of
cytokines IL-6 and IL-8 have also been observed in preHD in plasma (Bjorkqvist et

88
al. 2008). IL-6, but not IL-8, was found to be elevated in a mixed group of preHD and
HD (Rodrigues et al. 2016). The studies above have previously examined select
biomarkers together such as mHTT and NfL (Byrne et al. 2018), tau and NfL (Niemela
et al. 2017), or select immune biomarkers (Bjorkqvist et al. 2008; Rodrigues et al.
2016), but no previous study has evaluated across a series of biofluid markers in the
premanifest period to establish which biofluid biomarkers may be most sensitive at
this time.
Recent results from the Kids-HD study have suggested there are
neurodevelopmental differences in striatal volume and cerebellar-striatal connectivity
of gene carriers (van der Plas et al. 2019; Tereshchenko et al. 2020), raising the
consideration that any early differences in brain structure and function observed in
preHD could potentially be as a result of either early neurodegeneration or a
neurodevelopmental effect.
It is currently unknown when these various manifestations of HD first arise in the
premanifest period, or indeed whether there is ever a time in which they are
undetectable. To address this, we need to look back earlier in the disease process.
Using state-of-the-art methods to examine for potential group differences between
healthy controls and a preHD cohort far from predicted onset, this study aimed to
assess how early disease-related changes can be identified and which measures are
most sensitive in early preHD.
3.2 Contributions and collaborators
I was the lead clinician on this study and led on initial participant screening and
recruitment with support from Jessica Lowe, Sarah Gregory, Eileanoir Johnson and
Rachael Scahill. I led on eligibility screening, demographic assessment, clinical
examination and blood collection with support from Akshay Nair and cover from
Carlos Estevez-Fraga. I performed CSF collection with cover from Carlos Estevez-
Fraga and Filipe Rodrigues and performed follow up to document and manage any
adverse events. Initial biofluid processing was performed by Kate Fayer, with cover
from myself and Jessica Lowe. I led on the diffusion MRI processing for structural
connectivity analysis with support from Peter McColgan. I led on coordinating biofluid
storage and analysis. Rachael Scahill and myself led on drafting the manuscript with

89
additional input from Ed Wild, Geraint Rees and Sarah Tabrizi, along with the help
and review of all other co-authors. This work was published in the Lancet Neurology
(Scahill et al. 2020), where I was equal first author.
The study was conceived by Sarah Tabrizi who obtained funding and led as principal
investigator with additional input on study design from Cristina Sampaio, Rachael
Scahill, Geraint Rees, Trevor Robbins, Barbara Sahakian and Doug Langbehn.
Imaging assessments were conceived by Sarah Gregory, Rachael Scahill, Eileanoir
Johnson, Hui Zhang and Geraint Rees. Imaging acquisition was led by Sarah
Gregory, Rachael Scahill, Eileanoir Johnson and Marina Papoutsi with support from
the UCL Wellcome Centre for Human Neuroimaging. Further imaging processing was
performed by Rachael Scahill, Eileanoir Johnson, Chris Parker and Sarah Gregory.
Imaging safety reviews were done by Harpreet Hyare. Cognitive and neuropsychiatric
batteries were designed by Trevor Robbins, Barbara Sahakian and Claire
O’Callaghan and implemented by Katie Osbourne-Crowley and Eileanoir Johnson.
Cognitive and neuropsychiatric processing and analysis was done by Katie
Osbourne-Crowley, Christelle Langley, Trevor Robbins and Barbara Sahakian. The
biofluid assay battery was designed by Ed Wild, Amanda Heslegrave, Henrik
Zetterberg and Sarah Tabrizi. Biofluid assays were run by Henny Wellington and
Amanda Heslegrave. Biofluid data sharing from HD-CSF was from Lauren Byrne,
Filipe Rodrigues and Ed Wild. Statistical analysis design and execution was by Doug
Langbehn.
This study was supported by a Wellcome Trust Collaborative Award 200181/Z/15/Z.
Funding for CSF collection was provided by the CHDI Foundation, a not-for-profit
organisation dedicated to finding treatments for HD.
3.3 Methods
3.3.1 Study design and participants
This was a single site cross-sectional study of preHD and control participants aged
18-40 who were recruited from across the UK. PreHD participants required a previous
positive HD genetic test (CAG ≥40), a DCS of <4 confirming premanifest status and
a DBS of ≤240 (Appendix 9.1), approximating to more than 18 years from predicted

90
clinical onset. CAG lengths were re-measured at a single lab for statistical analysis.
Controls were gene negative, partners of either gene carriers or someone at risk of
HD, or members of the wider HD community (recruited through support groups or as
friends of participants). Exclusion criteria included contraindication to MRI scanning,
significant comorbidity likely to impair ability to complete study assessments and at
risk status without a genetic test. Full inclusion and exclusion criteria are detailed in
Appendix 9.2.
Recruitment initially centred on searching HD clinic databases at the National Hospital
or Neurology and Neurosurgery to identify gene negative participants and gene
positive participants who met age and CAG criteria. Eligible participants from the
Enroll-HD study at UCL were also identified and invited to participate. Health
Research Authority approval was obtained to set up several regional genetic and HD
centres as patient identification centres (PICs) to help identify eligible participants for
this study nationally. PIC’s were asked to identify potentially eligible participants from
the Enroll-HD study at their own site. HD-YAS study information material was
provided to PICs to disseminate to eligible participants and participants then made
contact with the UCL team directly. Recruitment was also facilitated through
advertisement in newsletters and social medial channels of the HD Association and
the HD Youth Organisation. Control subjects were recruited through the above
channels, but also through recruiting partners, spouses and in some cases, friends of
those from a HD family.
Gene carriers and controls were matched by monitoring group means for sex, age,
years of education, and standard deviation (SD) for age and education as recruitment
progressed, to assist targeted recruitment.
3.3.2 Procedures and outcomes
3.3.2.1 Initial assessment, confirmation of eligibility
Study assessments took place over a day and a half in a standardised order.
Participants were pre-screened via telephone and eligibility was confirmed at the start
of the study, including a physical examination to confirm the TMS and exclude motor
signs of HD. A full neurological examination along with bloods for a full blood count
and coagulation profile was performed to confirm safety of the lumbar puncture and

91
absence of any incidental neurology. Other demographic details including education,
medical and medication history were obtained and TFC was assessed for all
participants.
All prespecified outcomes for analysis by modality are listed in Table 3.1. All study
procedures were mandatory except for CSF collection, which was made an optional
component in order to enhance recruitment rates to the study.
Table 3.1. Assessments in HD-YAS
Source of Measure Task/Measure
Cognition
CANTAB Intra-extra dimensional set shift Paired Associate Learning Rapid Visual Processing One Touch Stockings of Cambridge Spatial Working Memory Stop Signal Task
EMOTICOM Emotion Intensity Face Morphing – Increasing and Decreasing Moral Judgement Progressive Ratio
Other
Stroop Colour Stroop Word Symbol Digit Modalities Test Verbal Fluency (Category) Reinforcement Learning
Neuropsychiatric
Self-report Questionnaires Apathy Motivation Index Barratt Impulsivity Scale Frontal systems behaviour scale MOS 36-Item Short-Form Health Survey Obsessive-Compulsive Inventory Pittsburgh Sleep Quality Index Speilberger State/Trait Anxiety Index Zung self-rating depression scale

92
Imaging Volumetric DTI NODDI MPM Structural Connectivity (Graph Theory)
Caudate Putamen Grey Matter White Matter Whole Brain Axial Diffusivity Fractional Anisotropy Mean Diffusivity Radial Diffusivity Axial Diffusivity Free Water Fraction Neurite Density Index Orientation Dispersion Index MT PD R1 R2* Connection Strength Efficiency Modularity
Biofluids CSF Plasma
Mutant Huntingtin Total Huntingtin GFAP IL-6 IL-8 Neurogranin NfL Total tau UCH-L1 YKL-40 GFAP NfL Total tau
3.3.2.2 Cognitive and neuropsychiatric assessments
Participants undertook a battery of neuropsychological tests in a standardised order,
including from the CANTAB and EMOTICOM battery (General Methods 2.5). Tests
were chosen to measure performance across multiple domains for which there was

93
previous evidence of impairment in HD, including cognitive flexibility (Lawrence et al.
1998), planning (Ho et al. 2003), verbal fluency (Paulsen and Long 2014), emotion
recognition (Henley et al. 2008), inhibition (Hart et al. 2012), attention (Hart et al.
2012), learning (Begeti et al. 2016), and memory (Lawrence et al. 2000; Begeti et al.
2016).
A comprehensive battery of neuropsychiatric function was collected using well
validated self-report questionnaires, capturing the following domains: depression,
anxiety, apathy, sleep, impulsivity, obsessive-compulsive behaviour, frontal
behaviour, and general health (General Methods 2.6). The UHDRS PBA short form
was also performed as part of the study assessment protocol, along with other
components of the Enroll-HD study for future comparability between studies, but was
not included for this analysis.
3.3.2.3 Biofluid assessments
Plasma and CSF collection was performed using standardised, well validated
conditions, methods, and equipment (General Methods 2.7). Total huntingtin, mHTT,
NfL, YKL-40, total tau, neurogranin, IL-6, IL-8, GFAP, and UCH-L1 were measured in
CSF; NfL, total tau, and GFAP were also measured in plasma. Total huntingtin has
not yet been studied in humans whilst UCH-L1 and GFAP were included since they
are included in the Quanterix 4-Plex assay used to generate NfL and Tau
concentrations for analysis. Given the lack of prior evidence in HD, total huntingtin,
GFAP and UCH-L1 were deemed exploratory in this analysis (see 3.3.4). The
unfasted plasma samples were used in this analysis. CSF haemoglobin was also
quantified to determine CSF contamination by blood. Red and white cell counts were
measured in CSF via microscopy in the local lab, with a cut-off for flagging of > 1000
and ≥ 5 cells/μl respectively.
3.3.2.4 Neuroimaging assessments
Neuroimaging was performed for all enrolled participants when possible. However,
despite initial screening for MRI contraindications some participants did not undergo
scanning on the day of their visit, either due to claustrophobia or another previously
unidentified contraindication. Assessments included volumetric T1-weighted imaging,
DWI, and MPM (General Methods 2.8).

94
3.3.2.4.1 Imaging acquisition
All MRI data were acquired on a 3T Prisma scanner (Siemens Healthcare, Germany)
with radiofrequency body coil for transmission and a 64-channel head coil for signal
reception using a protocol optimised for this study. The T1-weighted images were
acquired using a 3D magnetization prepared rapid gradient echo sequence with the
following parameters: repetition time (TR) =2530ms; time to echo (TE) =3.34ms;
inversion time =1100ms; flip angle = 7º; field of view = 256x256x176mm3 and a
resolution of 1.0x1.0x1.0 mm3. DWI were acquired using a multiband spin-echo echo
planar imaging sequence with TR=3260ms, TE=58ms, flip angle=88º, field of
view=220x220mm2. Seventy-two slices were collected with a resolution of 2x2x2mm3.
The multi-shell data consisted of b-values of 0 (n=10), 100 (n=8), 300 (n=8), 1000
(n=64) and 2000 (n=64) s/mm2.
The MPM acquisition protocol consisted of three differently weighted 3D multi-echo
acquisitions: MT-weighted, PD-weighted and T1-weighted in addition to two scans
collected to estimate participant-specific field inhomogeneities. The MT, PD and T1
scans were all acquired using a field of view of 256x224x179 mm3, TR=25ms, flip
angle of 6º and resolution of 0.8x0.8x0.8mm3. Field maps were acquired with 64 slices
using TR=1020ms, TE1=10ms TE2=12.46ms, slice thickness=4 mm; field-of-view:
192x192 mm3.
3.3.2.4.2 Volumetric MRI
Volumetric measures of whole brain, striatum (putamen and caudate), grey and white
matter, and the ventricles were derived from T1-weighted images. Whole brain, total
intracranial and ventricular volumes were measured using MIDAS with previously
described semiautomated protocols (Fox et al. 1996; Whitwell et al. 2001). Putamen
and caudate volumes were derived using MALP-EM software (Ledig et al. 2015)
(version 1.2), after linear registration into standard space using the International
Consortium of Brain Mapping 152 template. White and grey matter volumes were
generated in native space using voxel-based morphometry (Ashburner and Friston
2000) (Statistical Parametric Mapping version 12) with the Computational Anatomy
Toolbox (version 12). All segmentations were visually inspected blind to disease
status and no segmentations failed this quality control.

95
3.3.2.4.3 MPM
Estimates of R1, R2*, PD and MT were generated from MPM as previously described
(Weiskopf et al. 2013). R1 represents estimates of iron and myelin, R2* iron, PD
sensitivity to water content and MT myelin (Figure 3.1). Eight regions of interest were
specified a priori. The caudate and putamen regions generated by MALP-EM were
registered and resampled to native MPM space for each participant via an affine
registration using NiftyReg software (Ourselin et al. 2001). White matter regions from
the John Hopkins University (JHU) White Matter Label Atlas (Mori et al. 2008) were
used to generate values for the external capsule, posterior and anterior internal
capsule, posterior- mid- and anterior- corpus callosum. These were registered and
resampled to native MPM space for each participant via affine transformation,
followed by non-linear registrations (Ourselin et al. 2001). Quantitative values
representing the average value within each region were then extracted for each
quantitative map, for every participant and values for the control group were found to
be in line with previously published values (Kullmann et al. 2016).
Figure 3.1. MPM and interpretation. Regions analysed in HD-YAS displayed in the MT image. Caudate blue, putamen red, anterior corpus callosum yellow, anterior internal capsule light blue, posterior internal capsule light orange, external capsule green. Mid and posterior corpus callosum were also included in the analysis but not shown in this image. Yellow arrows indicate whether the value would increase or decrease in neurodegeneration.
3.3.2.4.4 DTI and NODDI
White matter microstructure was also analysed using DTI (Basser et al. 1994) and
NODDI (Zhang et al. 2012). DWI images were corrected for susceptibility-induced
artefacts and motion using FSL’s eddy (version 5.0.11) (Andersson and Sotiropoulos

96
2016). Diffusion tensors were fitted to DWI data using FSL dtifit. DTI metrics FA, AD,
MD and RD were then calculated using DTI-TK software (version 2.3.3). The NODDI
model was fitted to DWI data using the accelerated microstructure imaging via convex
optimization toolbox to output metrics of NDI, ODI and FWF. The average values of
DTI and NODDI metrics were computed for the genu, splenium and mid-body of the
corpus callosum, anterior and posterior limbs of the internal capsules, and the
external capsules. For the internal and external capsules, the left and right
hemispheric regions were combined as one. Regions of interest (ROIs) were
extracted from the JHU white matter atlas (Mori et al. 2008) and each participant’s
data was registered to the JHU atlas via a bootstrapped population template using
linear and non-linear deformation in DTI-TK (Keihaninejad et al. 2013; Mahoney et al.
2015).
3.3.2.4.5 Structural connectivity
Processing for the structural connectivity in HD-YAS is summarised in Figure 3.2.
Seventy-six cortical ROIs were segmented on the T1-weighted images using
FreeSurfer (version 6.0.0) (Desikan et al. 2006). The amygdala was not included as
automatic segmentation of this structure is not sufficiently reliable (Hibar et al. 2015).
The cerebellum was not included as diffusion data was incomplete. Tissue partial
volume maps of the brain white matter, grey matter, and CSF were prepared for
anatomically constrained tractography (ACT) (Smith et al. 2012).
Twelve cortical rich club regions and six striatal regions were selected a priori based
on previous evidence of selective rich club connectivity loss in HD (McColgan et al.
2015). The striatum was segmented using the three subregion Oxford-GSK-Imanova
striatal connectivity atlas (Tziortzi et al. 2014). These subregions are labelled limbic,
executive and sensorimotor based on the dominant cortical connectivity to each
striatal subregion (Tziortzi et al. 2014). For this study, the equivalent seven subregion
atlas was not used to minimise the number of multiple comparisons, anticipating these
three regions would be the key regions of interest. A surface-based registration was
used to register the atlas to participant T1 space before registering to participant
diffusion space using the NiftyReg toolkit (Modat et al. 2010).
FODs were computed using multi-shell, multi-tissue constrained spherical
deconvolution with group averaged response functions for white matter, grey matter

97
and CSF (Jeurissen et al. 2014). Multi-tissue informed log-domain global intensity
normalisation was then performed (Tournier et al. 2019). Whole-brain probabilistic
tractography was performed in participant-space using a FOD threshold of 0.06. Ten
million streamlines were generated for each scan. The ‘back-tracking’ mechanism
was used within the ACT framework (Smith et al. 2012) to allow tracks to be truncated
and re-tracked if poor structural termination was encountered. All diffusion processing
steps were conducted using commands either implemented within MRtrix3 (version
3.0) or using MRtrix scripts that interfaced with external software packages (Tournier
et al. 2019).
Connectomes were constructed by combining streamline tractograms with the
participant’s grey matter parcellation. Streamlines were assigned to the closest node
within a 2-mm radius of each streamline endpoint. Structural connections were
weighted by streamline count and a cross-sectional area multiplier, as implemented
in SIFT2 (Smith et al. 2015). Connections were then combined into an 82 x 82
undirected and weighted matrix. SIFT2 was chosen in preference to SIFT as it can
retain the full connectome and requires significantly less processing time.
Graph metrics were calculated using the brain connectivity toolbox (version 2016-16-
01) (Rubinov and Sporns 2010). Connection strength of the 6 striatal regions, 12
cortical rich club regions and whole brain network measures of modularity and global
efficiency were measured. The strength of each connection is calculated by the sum
of its connection weights. The 12 cortical rich club regions selected were those with
the highest connection strength in the network. These were the superior frontal,
precentral, superior parietal, thalamus, inferior parietal and rostral middle frontal
regions from both hemispheres. The rich club regions were the same for gene carriers
and controls and consistent with previous literature (Baggio et al. 2015; McColgan et
al. 2015).
Whole brain connectivity was assessed by using measures of modularity and global
efficiency (General Methods 2.9.6). Average path length represents the average of
shortest paths between brain regions in a network. Global efficiency is the inverse of
the average shortest path length and a decrease represents loss of network
integration. Modularity refers to the clustering of nodes with dense interconnectivity
within the cluster but sparse connections between nodes in different clusters. As

98
modularity increases, the network is more segregated with fewer connections
between different modules.

99
Figure 3.2. Summary of connectivity processing pipeline. QC = quality control. Pre-processing = Eddy current and motion correction, bias correction. CSD = Multi-shell multi-tissue constrained spherical deconvolution. FOD = fibre orientation distributions. Striatal atlas reprinted from FSL https://fsl.fmrib.ox.ac.uk/fsl/fslwiki/Atlases/striatumconn
3.3.3 Participant follow up
A 24-72hr follow up call was performed for all participants to record any adverse
events (AE) from the study. Those with AEs were followed up until completion of the
AE. The T1 weighted MRI brain was also reviewed by an experienced consultant
neuroradiologist and CSF white and red cell counts were also reviewed to further
ensure absence of neurological comorbidity.
3.3.4 Statistical analysis
The study had 80% power and a 5% risk of type 1 error to reject the primary null
hypothesis based on a sample size of 60 participants per group if, after statistical
adjustment for covariates, the group difference was 0.53 within-group standard
deviations. This hypothetical difference is based on the striatal volume difference
between controls and the group furthest from onset in the TRACK-HD study (Tabrizi
et al. 2009).
All measures were processed and analysed blinded to disease status and clinical
data. All CSF and serum measures were analysed after log transformation, given the
skewed empirical distributions of the raw data. To test possible contamination by
blood, CSF haemoglobin concentration was measured and for any CSF analyte with
a significant association with haemoglobin, the analysis was repeated including
haemoglobin concentration as an additional covariate. More than 10% of the
combined case and control CSF data was missing, primarily due to participants
declining to undergo the optional lumbar puncture. Multiple imputations generated via
random forest predictions were used to estimate CSF-model parameter estimates for
missing data and associated hypothesis test results.
General least-squares linear models were used to assess for overall group
differences and age interactions between groups. The primary analysis model had
the generic form:

100
𝑦 = 𝑏0 + 𝐼𝑝𝐻𝐷 ∗ (𝑏1 + 𝑏2 ∗ 𝐶𝐴𝐺 + 𝑏3 ∗ 𝑎𝑔𝑒 + 𝑏4 ∗ 𝐶𝐴𝐺 ∗ 𝑎𝑔𝑒) + 𝑏5 ∗ 𝑎𝑔𝑒 + 𝑏6 ∗ 𝑔𝑒𝑛𝑑𝑒𝑟
+ 𝑏7 ∗ 𝑎𝑔𝑒 ∗ 𝑔𝑒𝑛𝑑𝑒𝑟 + 𝑏8 ∗ 𝐼𝑄 + 𝑒
Where y is an outcome variable, IpHD = 1 if a participant is from the preHD group and
0 otherwise, the bi’s are linear regression coefficients, and e is the residual random
error term, assumed to be independently, identically normally distributed among the
participants with 0 mean. Two-tailed tests were performed. Within these same models
possible differences driven by age-CAG interaction within the preHD group were
controlled and tested for, since this interaction closely relates to predicted years to
onset.
Covariates included age, sex, and age interactions with sex. For cognitive measures,
the national adult reading test score (NART), an estimate of premorbid IQ, and the
International Standard Classification of Education (ISCED), an index of the highest
level of education achieved, were also included as covariates. For volumetric imaging
measures, total intracranial volume was included as a covariate.
Within the preHD group, unadjusted correlations between mHTT and NfL were
assessed. Further analysis of how well the clinical, neuroimaging and biofluid
variables are predicted by CSF concentrations of mutant huntingtin and by CSF and
plasma NfL was also performed. Analyses were performed one biomarker at a time,
with the general form;
𝛾 = 𝑏0 + 𝑏1 ∗ 𝑏𝑖𝑜𝑚𝑎𝑟𝑘𝑒𝑟 + 𝑏2 ∗ 𝑎𝑔𝑒 + 𝑏3 ∗ 𝑔𝑒𝑛𝑑𝑒𝑟 + 𝑏4 ∗ 𝑎𝑔𝑒 ∗ 𝑔𝑒𝑛𝑑𝑒𝑟 + 𝑏5 + 𝐼𝑄 +
𝑒
Multiple comparisons were addressed via the FDR, with an FDR estimate of less than
0.05 deemed to be significant. Exceptions were the relationship of mutant huntingtin
concentrations to age and CAG length - a fundamental a priori hypothesis which was
assessed with traditional p values. The biofluid measures total huntingtin, GFAP, and
UCH-L1 were deemed exploratory in this analysis based on the absence of previous
published evidence in HD and therefore were excluded from FDR correction.
Informed by primary hypothesis results, several further analyses were performed.
First, a receiver operator characteristic (ROC) area under the curve analysis of YKL-
40, CSF, and plasma NfL to assess their ability to distinguish preHD participants from

101
controls. Second, an age-by-NfL concentration comparison combining the HD-YAS
and HD-CSF study (Byrne et al. 2018) cohorts to generate CAG-specific curves
across the adult lifespan. This was performed using backwards variable elimination
from a saturated two-degree polynomial model of main effects and interactions of age
and CAG-length. All HD-YAS NfL data was included in the modelling. HD-CSF had
CSF and plasma NfL data from 40 manifest subjects, 20 preHD and 20 controls.
These subjects were older than the HD-YAS cohort with average ages and standard
deviations of 50.7 +/- 11.0, 42.4 +/- 11.1 and 56.0 +/- 9.4 respectively. Therefore
combining the two datasets enabled modelling NfL trajectories from 20-70 years for
commonly occurring CAG repeat lengths of 40-45. The mean age of onset for each
given CAG was annotated using estimates provided from previously published data
of 2913 HD individuals using the Langbehn equation (Langbehn et al. 2004). Finally,
a nonparametric bootstrapped comparison of caudate and putamen volumes to test
for a relative significant difference between the two volumes (i.e. if one was more
affected than the other) in the relationship to gene-carrier status. In each bootstrap
replication, regression models were separately fitted for caudate and putamen
volumes. After controlling for age and sex, the adjusted preHD versus control ratios
of both caudate and putamen volumes were calculated. The null hypothesis is that
these caudate and putamen ratios are equal. The bootstrapped statistic was the ratio
of these two ratios, which would equal 1 under the null. Two-sided p-values were
calculated by inverting bias corrected interval estimates from a set of 5,000 bootstrap
replications.
All analyses were performed in R (versions 3.5.1 and 3.5.3). SAP models were fit via
the lm() function, and false discovery rates were calculated via the p.adjust() function
with option ‘BH’. The boot library was used for model-comparison boot-strapping and
the mouse library for multiple imputation generation and summarization. A
combination of the ggROC and pROC packages were used to generate ROC curves
and to calculate associated summary statistics.
3.4 Results
In total, 314 individuals were screened to recruit 131 individuals between August 2017
and April 2019. Of the 183 individuals excluded, common reasons included a DBS of

102
> 240 (n=75), contraindications for MRI (n=41), at-risk genetic status (n=23), and
significant comorbidity (n=11; four of which were psychiatric). Twenty-three
individuals were not included owing to inadequate matching. One participant was
excluded on the basis of an incidental finding of probable demyelinating lesions on
the MRI. The final cohort comprised of 64 preHD and 67 controls, closely matched
for age, sex, and education (Table 3.2). Controls were gene negative (28), partners
with no known risk of HD (29), or HD community members (10). The preHD cohort
was estimated to be a mean 23.6 years (SD 5.8, range 10.6-38.4) from clinical
disease onset. Although all participants were required to be over 18 years from onset
based on their original CAG repeat length, due to one participants resized CAG
increasing by +3 repeats, one participant was estimated to be 10.6 years from
predicted onset.
Sixty-one (91%) controls and 62 (97%) preHD participants were assessed to be
suitable for MRI scanning on the day of the procedure and underwent neuroimaging.
Since DWI and MPMs occurred after the T1, occasionally the sequences were not
acquired if participants were unable to tolerate the whole session. All but one
participant had plasma for analysis; 109 (83%) participants also underwent optional
CSF collection obtained via lumbar puncture. The final recruitment number ensured
there was a minimum of 60 participants complete datasets, not including CSF,
according to prior power calculations. The total number of assessments by modality
is detailed in Table 3.3.
Table 3.2. Participant demographics
PreHD
(N =64)
Control
(N=67)
P value
Age (years) 29.0 ± 5.6 29.1 ± 5.7 0.95
Male sex (%) 47 42 0.81
Education (years) 16.2 ± 2.1 16.3 ± 2.2 0.93
NART 102.4 ± 7.5 103.5 ± 8.3 0.42
UHDRS TMS (range)* 0 (0-5) 0 (0-1)
TFC (range)** 13 (13-13) 13 (13-13)
CAG Repeat Length 42.2 ± 1.6 N/A
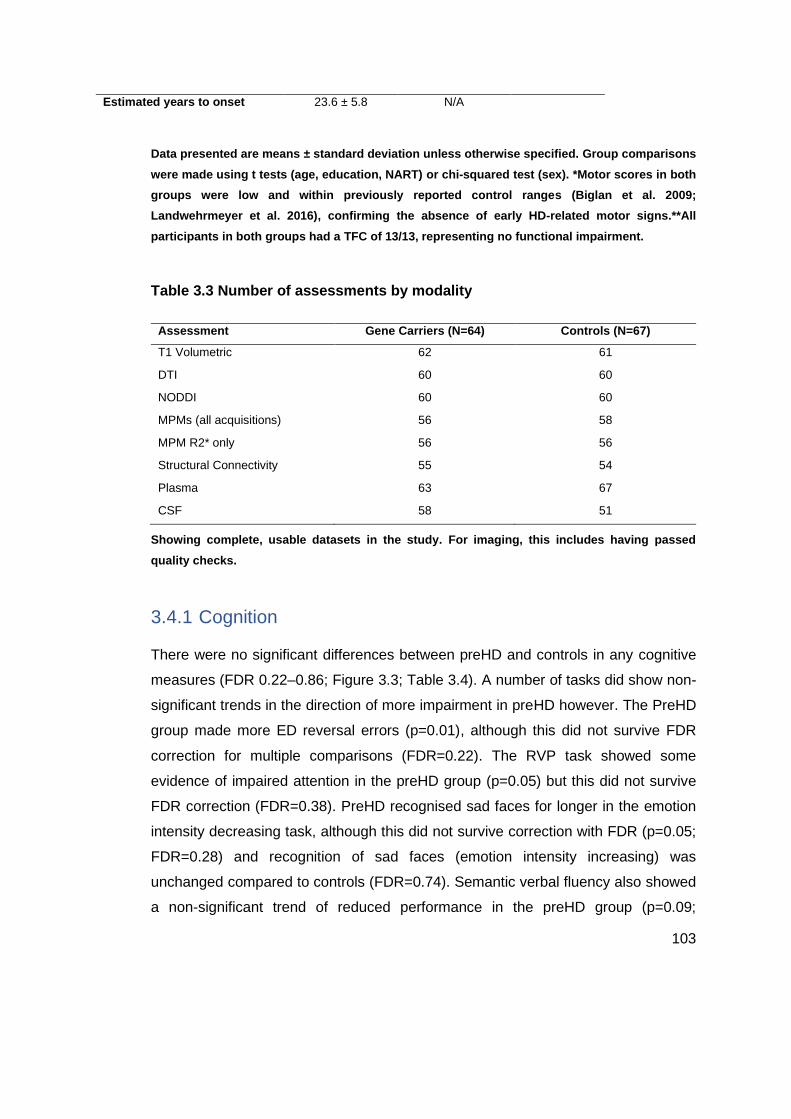
103
Data presented are means ± standard deviation unless otherwise specified. Group comparisons
were made using t tests (age, education, NART) or chi-squared test (sex). *Motor scores in both
groups were low and within previously reported control ranges (Biglan et al. 2009;
Landwehrmeyer et al. 2016), confirming the absence of early HD-related motor signs.**All
participants in both groups had a TFC of 13/13, representing no functional impairment.
Table 3.3 Number of assessments by modality
Assessment Gene Carriers (N=64) Controls (N=67)
T1 Volumetric 62 61
DTI 60 60
NODDI 60 60
MPMs (all acquisitions) 56 58
MPM R2* only 56 56
Structural Connectivity 55 54
Plasma 63 67
CSF 58 51
Showing complete, usable datasets in the study. For imaging, this includes having passed
quality checks.
3.4.1 Cognition
There were no significant differences between preHD and controls in any cognitive
measures (FDR 0.22–0.86; Figure 3.3; Table 3.4). A number of tasks did show non-
significant trends in the direction of more impairment in preHD however. The PreHD
group made more ED reversal errors (p=0.01), although this did not survive FDR
correction for multiple comparisons (FDR=0.22). The RVP task showed some
evidence of impaired attention in the preHD group (p=0.05) but this did not survive
FDR correction (FDR=0.38). PreHD recognised sad faces for longer in the emotion
intensity decreasing task, although this did not survive correction with FDR (p=0.05;
FDR=0.28) and recognition of sad faces (emotion intensity increasing) was
unchanged compared to controls (FDR=0.74). Semantic verbal fluency also showed
a non-significant trend of reduced performance in the preHD group (p=0.09;
Estimated years to onset 23.6 ± 5.8 N/A

104
FDR=0.35). No further variables showed any notable evidence of group effects and
no cognitive measures showed any association with age-CAG (FDR=0.10-0.98).
Figure 3.3. Radar plot showing cognitive variables in HD-YAS. The black line is the standardised mean difference between preHD and controls, with conventional frequentist 95% confidence intervals (CI) shaded in light blue. The red line represents no difference between means and a value within this line represents greater impairment in the preHD group. After FDR correction for multiple comparisons, there were no significant group differences in any cognitive measures.
Table 3.4 Cognitive results
Outcome Measure Control
Mean
HD Mean Effect size (CL) p FDR
IED Pre ED Errors 5.87 5.64 0.10 (-0.25, 0.46) 0.35 0.74
IED ED Errors 5.06 7.09 -0.29 (-0.64, 0.06) 0.13 0.47
IED ED Reversal Errors 2.71 5.40 -0.37 (-0.73, -0.02) 0.01 0.22
IED Stages completed 8.92 8.73 0.37 (0.01, 0.72) 0.1 0.44

105
Intensity Morphing
Decreasing
11.7 11.2 0.35 (0.00, 0.71) 0.05 0.28
Intensity Morphing
Increasing
10.1 10.3 -0.16 (-0.51, 0.19) 0.37 0.74
Moral Emotions Guilt Score 6.06 6.12 -0.10 (-0.45, 0.26) 0.58 0.80
OTS Mean Latency 11.7 11.8 -0.05 (-0.40, 0.30) 0.78 0.86
OTS Problems Solved 11.5 11.6 -0.05 (-0.41, 0.30) 0.75 0.86
PAL Total Errors 19.3 22.3 -0.15 (-0.50, 0.21) 0.42 0.80
Reinforcement Learning Rate 0.81 0.81 -0.04 (-0.39, 0.31) 0.82 0.86
Progressive Ratio Breakpoint 391 388 0.03 (-0.32, 0.38) 0.24 0.58
RVP A' 0.93 0.92 0.36 (0.00, 0.71) 0.05 0.38
RVP Mean Latency 445 450 -0.07 (-0.43, 0.28) 0.68 0.83
SDMT 60.7 59.7 0.11 (-0.24, 0.46) 0.53 0.80
SST Proportion Successful
Stops
0.44 0.43 0.09 (-0.26, 0.44) 0.62 0.80
SST RT 191 201 -0.22(-0.58, 0.14) 0.23 0.58
SST Mean RT on Correct Go
Trials
522 512 0.10 (-0.25, 0.45) 0.56 0.80
Stroop Colour Naming 87.5 84.0 0.25 (-0.10, 0.61) 0.16 0.51
Stroop Word Reading 106 104 0.25 (-0.10, 0.61) 0.16 0.51
SWM Between Errors 69.3 68.2 0.03 (-0.32, 0.38) 0.87 0.87
Verbal Fluency 25.0 23.3 0.30 (-0.05, 0.65) 0.09 0.44
CL = confidence levels; t = t-test; Effect size is the standardised mean difference between preHD
and control groups; FDR = false discovery rate. RVP A’ = a signal detection theory measure of
target sensitivity, and mean response latency. Outcomes measures are described in General
Methods 2.5.
3.4.2 Neuropsychiatry
There were no significant differences between preHD and controls in any
neuropsychiatric measure (FDR=0.31–0.91; Figure 3.4; Table 3.5), although there
was a general trend of higher levels of neuropsychiatric symptoms in the control
group. Controls had higher scores in FrsBe disinhibition, but this did not survive
correction (p=0.04, FDR=0.31). None of these measures showed a significant
relationship with age-CAG in the preHD group (FDR 0.31–0.88).

106
Figure 3.4. Radar plot showing neuropsychiatric variables in HD-YAS. The black line is the standardised mean difference between preHD and controls, with conventional frequentist 95% confidence intervals (CI) shaded in light blue. The red line represents no difference between means and a value within this line represents higher levels of symptoms in the preHD group. After FDR correction for multiple comparisons, there were no significant group differences in any neuropsychiatric measures.
Table 3.5 Neuropsychiatric results
Outcome Measure Control
Mean
HD Mean Effect size (CL) p FDR
PSQI 5.02 4.38 0.25 (-0.10, 0.60) 0.16 0.36
BIS 61.7 60.8 0.09 (-0.26, 0.44) 0.60 0.76
STAI Trait 40.2 38.8 0.15 (-0.20, 0.50) 0.41 0.61
STAI State 35.1 33.0 0.24 (-0.11, 0.59) 0.18 0.36
OCI 10.3 7.79 0.31 (-0.04, 0.66) 0.08 0.33

107
SDS 33.2 33.4 -0.02 (-0.37, 0.33) 0.91 0.91
AMI 1.25 1.27 -0.04 (-0.39, 0.31) 0.82 0.91
FrsBe Apathy 27.6 26.4 0.08 (-0.27, 0.43) 0.65 0.76
FrsBe Disinhibition 29.8 25.3 0.36 (0.01, 0.71) 0.04 0.31
FrsBe Executive Functioning 32.8 29.8 0.19 (-0.16, 0.54) 0.29 0.52
SF36 Physical Functioning 95.4 98.1 -0.28 (-0.64, 0.07) 0.11 0.33
SF36 Physical Health
Limitations
93.5 97.5 -0.27 (-0.62, 0.08) 0.13 0.33
SF36 Emotional Limitations 83.1 92.5 -0.35 (-0.70, 0.00) 0.05 0.31
SF36 Energy/Fatigue 59.6 61.0 -0.08 (-0.43, 0.28) 0.67 0.76
SF36 Emotional Wellbeing 75.3 77.6 -0.15 (-0.50, 0.20) 0.40 0.61
SF36 Social Functioning 87.9 89.5 -0.10 (-0.45, 0.25) 0.56 0.76
SF36 Pain 88.5 93.1 -0.38 (-0.73, -0.03) 0.03 0.31
SF36 General Health 73.0 67.9 0.30 (-0.05, 0.65) 0.09 0.33
Outcome measures described in General Methods 2.6.
3.4.3 Imaging
Putamen volumes were significantly smaller in preHD participants compared with
controls after FDR correction (FDR=0.03; Figure 3.5). Uncorrected caudate volumes
were also smaller in preHD participants (p=0.05), but the corresponding FDR was
non-significant (FDR=0.20). These differences were small: the preHD group had
5.5% smaller putamen and 4.0% smaller caudate volumes. Putamen and caudate
volumes did not show a significant relationship with age-CAG in preHD (FDR
corrected value 0.54 for both). The nonparametric bootstrapped comparison of
caudate and putamen volumes showed no significant differences between the two
(p=0.30), suggesting that the putamen volumes did not appear more affected than
the caudate volumes. There were no significant group differences in volumes of whole
brain, grey or white matter, or ventricles (Figure 3.5, Table 3.6).

108
Figure 3.5. Volumetric MRI results. Boxplots of covariate adjusted standardised residuals of a) Putamen b) Caudate c) Whole Brain d) Grey Matter e) White Matter and f) Ventricle volumes corrected for intracranial volume. Horizontal lines are median; boxes are upper and lower quartiles; whiskers are 1.5 x interquartile range.
Table 3.6 Volumetric results
Outcome
Measure
Controls
Mean
HD Mean Effect size (CL) p FDR
Putamen 0.66 0.62 0.53 (0.16, 0.89) 0.005 0.03
Caudate 0.50 0.48 0.37 (0.00, 0.74) 0.05 0.20
Grey matter 43.7 43.5 0.10 (-0.27, 0.46) 0.60 0.92
White matter 34.5 34.6 -0.02 (-0.39, 0.35) 0.91 0.92
Whole brain 80.3 80.2 0.06 (-0.31, 0.42) 0.76 0.92
Ventricles 0.86 0.88 -0.05 (-0.41, 0.32) 0.81 0.92
All measures are expressed as a percentage of intracranial volume

109
There were no significant differences in white matter microstructure as assessed by
diffusion tensor imaging and NODDI (FDR 0.27–0.98; Table 3.7). Axial diffusivity in
the genu of the corpus callosum was lower in the preHD group than controls (p=0.01),
although this did not survive correction for FDR (FDR=0.27). The free water fraction
in this region also showed uncorrected group differences (p=0.04; FDR=0.54), being
increased in controls. In addition, the orientation dispersion in the posterior limb of
the internal capsule was reduced in the preHD group (p=0.04) but this did not survive
FDR correction (FDR=0.54).
Table 3.7 Diffusion results
Outcome
Measure
Controls
Mean
HD Mean Effect size (CL) p FDR
AD CC Genu 1.27 1.26 0.53 (0.16, 0.91) 0.006 0.27
AD CC Spl 1.33 1.32 0.28 (-0.10, 0.66) 0.15 0.75
AD CC mid 1.27 1.27 0.17 (-0.20, 0.55) 0.37 0.86
AD IC ant 1.00 1.00 -0.26 (-0.63, 0.11) 0.17 0.75
AD IC post 1.05 1.05 -0.15 (-0.52, 0.23) 0.46 0.87
AD EC 0.95 0.95 -0.21 (-0.59, 0.17) 0.27 0.75
FA CC Genu 0.69 0.69 -0.01 (-0.30, 0.36) 0.95 0.98
FA CC Spl 0.75 0.75 -0.03 (-0.40, 0.35) 0.89 0.98
FA CC mid 0.67 0.67 -0.07 (-0.45, 0.30) 0.70 0.92
FA IC ant 0.58 0.58 -0.19 (-0.56, 0.19) 0.32 0.84
FA IC post 0.68 0.68 -0.23 (-0.60, 0.15) 0.23 0.75
FA EC 0.45 0.45 -0.25 (-0.62, 0.13) 0.19 0.75
MD CC Genu 0.64 0.63 0.33 (-0.04, 0.71) 0.09 0.75
MD CC Spl 0.63 0.63 0.24 (-0.14, 0.61) 0.21 0.75
MD CC Mid 0.65 0.65 0.13 (-0.25, 0.50) 0.51 0.87
MD IC ant 0.57 0.57 -0.09 (-0.46, 0.29) 0.64 0.92
MD IC post 0.54 0.54 0.07 (-0.30, 0.45) 0.70 0.92
RD CC Genu 0.32 0.32 0.12 (-0.25, 0.50) 0.53 0.87
RD CC Spl 0.28 0.28 0.15 (-0.23, 0.53) 0.43 0.86
RD CC Mid 0.34 0.34 0.08 (-0.30, 0.46) 0.67 0.92
RD IC ant 0.35 0.35 0.09 (-0.28, 0.47) 0.63 0.92
RD IC post 0.29 0.29 0.23 (-0.14, 0.61) 0.22 0.75

110
RD EC 0.45 0.45 0.12 (-0.25, 0.50) 0.54 0.87
ND CC Genu 0.62 0.62 0.02 (-0.36, 0.40) 0.91 0.98
NDI CC Spl 0.67 0.67 -0.04 (-0.42, 0.33) 0.82 0.98
NDI CC Mid 0.64 0.63 0.16 (-0.22, 0.53) 0.41 0.86
NDI IC Ant 0.63 0.63 -0.01 (-0.39, 0.36) 0.94 0.98
NDI IC Post 0.69 0.70 -0.16 (-0.53, 0.22) 0.41 0.86
NDI EC 0.52 0.52 -0.06 (-0.44, 0.31) 0.74 0.92
FWF CC Genu 0.12 0.11 0.40 (0.02, 0.77) 0.04 0.54
FWF CC Spl 0.14 0.13 0.25 (-0.12, 0.63) 0.18 0.75
FWF CC Mid 0.15 0.15 0.21 (-0.16, 0.59) 0.27 0.75
FWF IC ant 0.15 0.15 0.21 (-0.16, 0.59) 0.27 0.75
FWF IC post 0.08 0.08 -0.07 (-0.44, 0.31) 0.73 0.92
FWF EC 0.03 0.03 -0.24 (-0.61, 0.14) 0.22 0.75
ODI CC Genu 0.08 0.08 -0.07 (-0.45, 0.30) 0.70 0.92
ODI CC Spl 0.07 0.07 0.15 (-0.23, 0.52) 0.43 0.86
ODI CC Mid 0.09 0.09 0.02 (-0.35, 0.40) 0.90 0.98
ODI IC ant 0.12 0.11 0.12 (-0.26, 0.49) 0.54 0.87
ODI IC post 0.11 0.11 0.40 (0.02, 0.78) 0.04 0.54
ODI EC 0.21 0.20 0.30 (-0.07, 0.68) 0.11 0.75
AD = axial diffusivity; MD = mean diffusivity; RD = radial diffusivity; FA = fractional anisotropy;
NDI = neurite density index; MD = mean diffusivity; ODI = orientation dispersion index; FWF =
free water fraction CC = corpus callosum; IC = internal capsule; EC = external capsule; ant =
anterior; post = posterior; mid = mid-body; Spl = splenium
Using diffusion tractography and graph theory measures, there were no significant
group differences in connection strength for any hub or striatal region, nor any
difference in network measures of integration or segregation between preHD and
controls (FDR=0.71-0.99; Table 3.8).
Table 3.8 Structural connectivity results
Outcome
Measure
Controls
Mean
HD Mean Effect Size (CL) p FDR
L Limbic 0.01 0.01 -0.31 (-0.71, 0.08) 0.12 0.77
R Limbic 0.01 0.01 -0.05 (-0.45, 0.34) 0.80 0.99
L Executive 0.01 0.01 0.01 (-0.38, 0.40) 0.96 0.99

111
R Executive 0.01 0.01 0.07 (-0.32, 0.47) 0.71 0.99
L Sensorimotor 0.01 0.01 0.00 (-0.39, 0.40) 0.99 0.99
R Sensorimotor 0.01 0.01 -0.33 (-0.72, 0.07) 0.11 0.77
L Superior
Frontal
0.05 0.05 0.01 (-0.38, 0.41) 0.94 0.99
R Superior
Frontal
0.05 0.05 -0.19 (-0.58, 0.21) 0.36 0.87
L Precentral 0.04 0.04 -0.02 (-0.41, 0.37) 0.92 0.99
R Precentral 0.04 0.04 -0.21 (-0.60, 0.19) 0.30 0.87
L Superior
Parietal
0.03 0.03 -0.17 (-0.57, 0.22) 0.39 0.87
R Superior
Parietal
0.03 0.03 0.12 (-0.28, 0.51) 0.56 0.99
L Thalamus 0.03 0.03 -0.03 (-0.43, 0.36) 0.86 0.99
R Thalamus 0.03 0.03 0.21 (-0.19, 0.60) 0.29 0.87
L Inferior Parietal 0.02 0.02 0.19 (-0.20, 0.59) 0.33 0.87
R Inferior
Parietal
0.03 0.03 0.12 (-0.28, 0.51) 0.54 0.99
L Rostral Middle
Frontal
0.02 0.02 0.42 (0.03, 0.82) 0.04 0.71
R Rostral Middle
Frontal
0.02 0.02 -0.02 (-0.41, 0.38) 0.92 0.99
Efficiency 0.00 0.00 -0.02 (-0.41, 0.38) 0.92 0.99
Modularity 0.46 0.46 0.25 (-0.14, 0.65) 0.20 0.87
Efficiency is a measure of network integration whilst Modularity is a measure of network
segregation. All other measures represent connection strength of each respective region.
Limbic, executive and sensorimotor are divisions of the striatum. Other measures are cortical
hub regions. L = Left, R = Right.
There were no significant differences between preHD and controls in MPM measures
(FDR=0.17-0.98; Table 3.9). There were trends of increased R1 and R2 in the
putamen (p=0.006 and 0.03 respectively) and external capsule (p=0.04 and 0.03
respectively), whilst R2 was also increased in the posterior limb of the internal capsule
(p=0.03) in preHD. None of these differences survived FDR correction however.
Within the preHD group, there were no significant relationships between any imaging
measure and age-CAG (FDR 0.44–0.96).

112
Table 3.9 MPM results
Outcome
Measure
Controls
Mean
HD Mean Effect size (CL) p FDR
R2* Putamen 21.5 22.4 -0.42 (-0.81, -0.04) 0.03 0.20
R1 Putamen 0.75 0.77 -0.54 (-0.92, -0.15) 0.005 0.17
PD Putamen 77.9 77.9 -0.01 (-0.39, 0.38) 0.91 0.98
MT Putamen 0.90 0.89 0.25 (-0.14, 0.63) 0.21 0.36
R2* Caudate 18.7 19.2 -0.34 (-0.73, 0.05) 0.09 0.36
R1 Caudate 0.71 0.72 -0.38 (-0.76, 0.01) 0.06 0.36
PD Caudate 80.0 80.2 -0.19 (-0.57, 0.20) 0.34 0.78
MT Caudate 0.83 0.83 0.24 (-0.14, 0.63) 0.21 0.38
R2* CC Spl 23.3 23.5 -0.13 (-0.52, 0.26) 0.51 0.78
R1 CC Spl 1.02 1.03 -0.13 (-0.51, 0.26) 0.51 0.99
PD CC Spl 68.6 68.7 -0.04 (-0.43, 0.34) 0.83 0.98
MT CC Spl 1.58 1.59 -0.08 (-0.46, 0.31) 0.69 0.98
R2* CC Genu 22.3 22.5 -0.15 (-0.54, 0.24) 0.45 0.78
R1 CC Genu 1.07 1.08 -0.21 (-0.60, 0.17) 0.27 0.78
PD CC Genu 67.8 68.0 -0.22 (-0.61, 0.16) 0.26 0.67
MT CC Genu 1.67 1.66 0.13 (-0.25, 0.52) 0.49 0.67
R2* CC mid 20.6 20.8 --0.32, (-0.71, 0.07) 0.11 0.39
R1 CC mid 1.01 1.02 -0.31 (-0.70. 0.07) 0.11 0.59
PD CC mid 68.7 68.8 -0.14 (-0.52, 0.25) 0.48 0.85
MT CC mid 1.55 1.55 -0.07 (-0.45, 0.32) 0.73 0.98
R2* IC pos 20.4 20.8 -0.43 (-0.82, -0.04) 0.03 0.20
R1 IC pos 1.00 1.01 -0.21 (-0.60, 0.17) 0.28 0.78
PD IC pos 67.6 67.7 -0.11 (-0.49, 0.28) 0.58 0.78
MT IC pos 1.52 1.52 0.01 (-0.38, 0.39) 0.96 0.84

113
R2* IC ant 22.5 22.5 -0.03 (-0.41, 0.36) 0.90 0.99
R1 IC ant 1.00 1.01 -0.29 (0.67, 0.10) 0.15 0.67
PD IC ant 69.7 69.8 -0.04 (-0.43, 0.34) 0.83 0.98
MT IC ant 1.49 1.47 0.23 (-0.15, 0.62) 0.23 0.36
R2* EC 18.5 18.8 (-0.43 (0.82, -0.04) 0.03 0.20
R1 EC 0.89 0.91 -0.30 (-0.79, -0.02) 0.04 0.29
PD EC 71.1 71.0 0.09 (-0.30, 0.47) 0.66 0.81
MT EC 71.1 71.0 0.09 (-0.30, 0.47) 0.65 0.98
CC = corpus callosum; IC = internal capsule; EC = external capsule; ant = anterior; post =
posterior; mid = mid-body; Spl = splenium. R1 = longitudinal relaxation rate; R2* = the effective
transverse relaxation rate; MT = magnetization transfer. PD = proton density.
3.4.4 Biofluids
The CSF quality of the study was good, with no CSF samples above the predefined
cut-off for red cell count. Only one participant’s white cell count was above the white
cell cut-off, being mildly raised at 8 cells/μl. Given the non-specificity of the count with
a normal neurological examination and T1-weighted MRI, this control was kept in the
analysis. The median and inter-quartile range for CSF white cell count across the
cohort was 0 and 1 cells/μl respectively. For red cell count, it was 1 and 5 cells/μl
respectively, indicating minimal blood contamination across samples. Similarly, no
participants had significant abnormalities on full blood count or coagulation, prior to
lumbar puncture.
CSF haemoglobin was associated with mHTT (p=0.03) and YKL-40 (p=0.01) and was
controlled for in the subsequent analyses for these analytes. CSF haemoglobin was
not associated with any other analyte. One control outlier for CSF NfL was noted.
They had a normal T1 brain scan, normal CSF white cell and red cell counts and did
not outlie in other biofluid or cognitive parameters and so were not excluded from the
analysis.
CSF mHTT was detectable at low concentrations for all mutation carriers except in
three participants, all of whom had a low disease burden score. mHTT was

114
undetectable in all controls. Higher mHTT concentrations were associated with
increasing age-CAG (p=0.05). However, 53% of preHD mHTT values were between
the limit of detection and limit of reliable quantification (8–25 fM), a range in which the
output from the assay is not linear. Total huntingtin concentrations were not
significantly different between controls and preHD (p=0.23) (Figure 3.6).
Figure 3.6. Selected biofluid results. Boxplots of standardised residuals (covariate adjusted) of a) CSF mHTT b) CSF NfL c) plasma NfL d) YKL-40 e) CSF total tau f) CSF neurogranin g) CSF IL-6 h) IL-8, i) CSF total huntingtin. All analytes were log transformed. As expected mHTT was undetectable in all controls. There were significant differences between preHD and controls in CSF NfL, plasma NfL, and CSF YKL-40. No other analytes showed significant group differences (FDR>0.5).

115
The preHD cohort had significantly higher concentrations of CSF NfL, plasma NfL,
and CSF YKL-40 than the control cohort (FDR <0.0001, FDR=0.01, and FDR=0.03,
respectively; Figure 3.6). In the preHD group, 53% had CSF NfL concentrations within
the normal control range (95th percentile of controls) whilst 87% had plasma NfL
concentrations within this range.
There were no significant differences between the preHD and control cohorts for CSF
and plasma tau and GFAP, nor for CSF neurogranin, IL-6 or IL-8 (FDR 0.48–0.94;
Table 3.10).
Table 3.10 Biofluid results
Outcome Measure Controls
Mean
HD Mean Effect Size (CL) p FDR
NfL CSF 5.79 6.40 -1.17 (-1.56, -0.79) <0.0001 <0.0001
NfL plasma 2.02 2.28 -0.55 (-0.90, -0.20) 0.003 0.01
YKL-40 CSF 10.97 11.12 -0.50 (-0.89, -0.12) 0.01 0.03
IL6 CSF 1.01 0.98 0.07 (-0.31, 0.46) 0.68 0.77
IL8 CSF 4.14 4.19 -0.15 (-0.54, 0.23) 0.41 0.54
Neurogranin CSF 5.68 5.68 0.00 (-0.38, 0.39) 0.94 0.94
Tau CSF 4.16 4.22 -0.20 (-0.58, 0.19) 0.34 0.54
Tau plasma 1.57 1.44 0.20 (-0.14, 0.56) 0.26 0.52
UCH-L1 CSF 7.14 7.17 -0.16 (-0.55, 0.22) 0.41 0.48
GFAP CSF 9.43 9.37 0.14 (-0.25, 0.52) 0.48 N/A
GFAP Plasma 4.38 4.51 -0.23 (-0.58, 0.12) 0.20 N/A
tHTT CSF (log fM) 3.85 3.75 0.24 (-0.15, 0.62) 0.22 N/A
mHTT CSF (log fM) 0 3.08 N/A N/A N/A
All values in log pg/ml unless otherwise stated.
Only CSF NfL concentrations showed a strong positive association with age-CAG in
preHD (FDR<0.0001). Plasma NfL showed a weaker association that did not reach
statistical significance (p=0.07, FDR=0.18).

116
ROC analysis of CSF NfL, plasma NfL, and CSF YKL-40 gave areas under the curve
of 0.79, 0.65, and 0.64 respectively, implying superior discriminatory ability of CSF
NfL over plasma NfL and YKL-40 in preHD far from predicted clinical onset (Figure
3.7).
Figure 3.7 ROC curves for CSF NfL (A), plasma NfL (B) and YKL-40 (C). AUC = area under the curve.
NfL trajectories across an age range of 20–70 years were modelled by combining
HD-YAS data with baseline values from the HD-CSF study (Byrne et al. 2018),
showing the age at which NfL is predicted to rise above the 95th percentile of controls
for each given CAG count (Figure 3.8). CSF NfL concentrations showed a sigmoid
trajectory, increasing slowly initially before accelerating as individuals moved close to

117
predicted clinical onset, followed by a deceleration later in the disease. Plasma NfL
showed a similar trajectory, but with concentrations remaining within the normal range
for longer.
Figure 3.8. NfL trajectories. Associations of NfL concentration in (a) CSF and (b) plasma with age and CAG repeat count (right of figure) from combined datasets of HD-YAS and HD-CSF (Byrne et al. 2018). Data were modelled with a polynomial function of age, CAG repeat counts, their squares, and their interactions. NfL concentrations were reverse-transformed from log NfL values. CAG repeat counts are coloured separately and labelled on the right of the image. Shaded in grey is the range between the control curve (dark grey line) and the 95th prediction interval of controls. Coloured dotted lines show the intercept of NfL trajectory in HD and the 95th prediction interval of controls, representing the age at which NfL concentrations become abnormal. Diamonds show mean age of onset for each CAG based on the Langbehn equation using previously published data (Langbehn et al. 2004).

118
3.4.4.1 Associations of mHTT and NfL with other measures in HD-YAS
Associations between CSF mHTT, NfL and plasma NfL with other biofluid, imaging,
cognitive and psychiatric measures were investigated. CSF NfL was highly correlated
with plasma NfL and CSF mHTT (r=0.68 and 0.57; p=<0.0001) whilst plasma NfL also
correlated with mHTT to a lesser extent (r=0.31, p=0.02). There were significant
associations between CSF mHTT and CSF YKL-40, CSF tau, and CSF UCH-L1
(r=0.54, 0.50 and 0.50 respectively, FDR=0.003). CSF NfL significantly correlated
with CSF YKL-40 (r=0.37; FDR=0.04).
NfL and mHTT did not significantly correlate with any imaging, cognitive, or
neuropsychiatric measure. Of particular interest given the above results, caudate
volumes showed a negative correlation with NfL in plasma (r=-0.35, FDR=0.06), and
CSF (r=-0.19, FDR=0.24). Putamen volumes also showed a negative correlation with
NfL in plasma (r=-0.22, FDR=0.21) and CSF (r=-0.15, FDR=0.36).
3.5 Discussion
The results of HD-YAS provide crucial new insights in early preHD and suggest that
cognitive and psychiatric function, as measured using the above scales, are
preserved in gene carriers approximately 24 years from predicted onset. At this stage,
there is little evidence of brain imaging changes, yet elevations of NfL and YKL-40
are suggestive of subtle early neuronal injury in this cohort. The results indicate CSF
NfL, mHTT and YKL-40 may be the earliest detectable markers of neurodegeneration
in HD. By combining the results of HD-YAS with pre-existing literature on the later
stages of HD, an evidence-based schematic of disease trajectory was generated
(Figure 3.9), extending the timeline of pathological changes back to the very start of
adulthood. It should be noted however that there remains a gap in the literature
between HD-YAS and previous studies characterising disease-related changes <15
years from predicted onset. Hence this schematic would need further validation from
follow up in the HD-YAS and/or other studies in the range between 20-15 years from
predicted onset.

119
Figure 3.9. Updated evidence based schematic of disease trajectory in HD. With results from the HD-YAS, we can now extend our understanding of disease-related changes from those presented in Figure 1.5. CSF NfL and mHTT are among the earliest pathological changes, occurring around 24 years before expected clinical onset (data from the HD-YAS), with slow increases for approximately 10 years, followed by an acceleration prior to expected onset already elevated 15 years prior to onset (Byrne et al. 2017; Byrne et al. 2018). Striatal volumes are slightly smaller than those of age-matched controls at the beginning of adulthood (data from the HD-YAS) and start a linear decline around 18 years before expected symptom onset (Tabrizi et al. 2011) with volume reduced by around 50% of control volumes by the time of clinical onset (Georgiou-Karistianis et al. 2013; Langbehn et al. 2019). Peristriatal white matter volume shows reductions approximately 15 years from onset (Tabrizi et al. 2009) and shows higher rates of atrophy in a non-linear fashion, becoming more generalised by time of onset (Aylward et al. 2011; Langbehn et al. 2019). Grey matter loss extends beyond the striatum later at around 10 years before symptom onset, after which it progresses non-linearly (Tabrizi et al. 2009; Langbehn et al. 2019). Soft motor signs in the form of increased variability in voluntary movements are apparent by 15 years prior to symptom onset and increase non-linearly (Biglan et al. 2009; Tabrizi et al. 2009; Long et al. 2014). Subtle selective cognitive changes are apparent approximately 15 years from expected symptom onset (Tabrizi et al. 2009; Stout et al. 2011), declining relatively slowly following a non-linear trajectory (Tabrizi et al. 2012; Langbehn et al. 2019).

120
3.5.1 No significant differences in cognition, but some trends of
interest
Cognitive deficits centred around executive function and emotion processing have
been reported previously in premanifest cohorts (Tabrizi et al. 2009), with the
PREDICT-HD study suggesting that cognitive function starts to decline around 15
years before clinical onset (Paulsen et al. 2008; Paulsen and Long 2014). The
cognitive battery in HD-YAS represents a targeted assessment of cognitive domains
that are known to be vulnerable in HD, including tasks that have not previously been
studied in the premanifest stage. Although there were no measures that showed
corrected significant differences, there were some small group differences in
measures of cognitive flexibility, sustained attention, and emotion processing trending
in the direction of greater impairment in preHD that will be of interest for further study.
Cognitive flexibility is a key component of executive function and can be measured at
the extra-dimensional shift stage of the IED task. Although not as widely investigated
as other cognitive tasks in HD, the ED set shifting stage of the IED has previously
been shown to be sensitive in early HD (Lawrence et al. 1996) and preHD up to 10
years prior to onset (Lawrence et al. 1998). ED shift errors have previously been
associated with reduced functional connectivity in fronto-striatal networks in healthy
controls (Morris et al. 2016). These networks have also been shown to be disrupted
in HD (Enzi et al. 2012; McColgan et al. 2017). Therefore, although not reaching
corrected significance in this study, the ED set shift may be a sensitive measure of
emerging cognitive impairment in preHD closer to predicted onset.
Deficits in semantic verbal fluency in preHD have also been demonstrated previously
(Lawrence et al. 1998), and the subthreshold group difference in this task may be
suggestive of a small subset of individuals showing very mild impairment in this task.
Sustained visual attention has been comparatively understudied in HD. The trail
making test has been shown to be sensitive in preHD and involves visual attention
(Paulsen and Long 2014), but also it also involves other cognitive components such
as set-shifting, perceptual processing and working memory (O'Rourke et al. 2011). A
comparatively small study using a simple go/no-go task found some evidence of
attentional deficits in the HD, but not preHD group (Hart et al. 2012). Here, the preHD

121
group showed subtle reductions in sustained attention as measured in the RVP task,
however this did not reach statistical significance. As with the other subthreshold
trends, the RVP may be a task of interest for future studies of early preHD.
Although impaired performance on the OTS, PAL and SWM have been shown in early
HD previously (Lawrence et al. 2000; Ho et al. 2003; Begeti et al. 2016), studies in
preHD have not found evidence significant impairments in these tasks (Lawrence et
al. 1998; Begeti et al. 2016). The results here are consistent with these tasks not
being sensitive in the premanifest period.
The SDMT and SWRT have proved to be among the most robust measures of early
cognitive deficits in HD (Tabrizi et al. 2013; Paulsen and Long 2014). In TRACK-HD,
both had relatively high longitudinal signal-to-noise ratios compared to other
measures (Tabrizi et al. 2013) and have subsequently been incorporated into a
composite measure of disease progression (Schobel et al. 2017). This composite is
currently being used as a primary outcome measure in huntingtin-lowering clinical
trial (Clinicaltrials.gov; NCT03761849 2018), reflecting the relative sensitivity of these
two cognitive tasks in HD. Both tasks have also demonstrated progressive declines
in preHD as individuals moved closer to predicted onset (Tabrizi et al. 2013; Paulsen
and Long 2014). It is striking then, just how similar preHD performance was to controls
for these tasks in the current results and is supportive but not confirmatory of the
hypothesis that cognition may be preserved at this early stage in preHD.
Of the cognitive assessments performed in this study, social cognition, motivational
and emotional functioning was investigated using the recently developed EMOTICOM
battery (Bland et al. 2016). Among these domains, emotion recognition has been
most widely studied, with evidence that recognition of negative emotions is impaired
in both preHD and HD (Tabrizi et al. 2009; Henley et al. 2012). Previous studies have
tended to use either static, or morphing images with the outcome measure of
detecting the emotion in question (Henley et al. 2012). In this study, preHD
participants showed no differences in detecting the emotion in the increasing task,
but recognised the sad face for longer in the decreasing task. Comparatively little is
known about the implications of this observation, but inability to disengage from
negative stimuli has previously been observed in depression (Dam et al. 2020). Our
neuropsychiatric data suggests this would not explain the small observed effect

122
however. The emotion intensity decreasing condition has not been previously studied
before in HD, and so it will be interesting to see if this subtle difference remains or
increases over time in preHD.
Decreased breakpoints have been recently described in humans and animal models
of HD (Heath et al. 2019). However there were no differences observed in the
progressive ratio breakpoint in this cohort, suggesting motivational deficits likely occur
later in the disease course.
Reinforcement learning was included in this study since it has been shown to be
sensitive to pharmacological manipulation with a D2 receptor antagonist (Eisenegger
et al. 2014) and was anticipated to be sensitive to any early indirect pathway
dysfunction that has been observed in HD previously (Albin et al. 1992; Waldvogel et
al. 2015). Furthermore, reward learning has been shown to be impaired in HD
(Palminteri et al. 2012) and other diseases of the basal ganglia (Frank et al. 2004).
However, reinforcement scores in this group were virtually identical in this study,
showing no evidence of impaired learning by reinforcement at this stage of disease.
Collectively, there was no evidence of significantly impaired cognition across a broad
spectrum of assessments. Although some non-significant differences appeared to be
trending in the direction of more impairment in the preHD group, there were no
significant associations with age-CAG to support the notion these differences are
driven by those closer to expected clinical onset. Longitudinal follow up will be
important in examining whether these trends persist or increase at this stage,
although little cognitive change has been previously detected in preHD over a 24
month period (Stout et al. 2012), suggesting that a longer interval will likely be
required to detect any longitudinal changes in this group.
3.5.2 No significant differences in behavioural or psychiatric
symptoms
Using validated self-report questionnaires, current behavioural and neuropsychiatric
symptoms were assessed across both groups. Increased neuropsychiatric symptoms
have been reported in preHD (Kirkwood et al. 2002; Beglinger et al. 2008; Tabrizi et
al. 2009; Epping et al. 2013), including in those more than 12 years from predicted

123
onset (Epping et al. 2016). The reported progressive nature of these symptoms has
given credence to this being as a result of neurodegeneration. The results reported
here suggest that neuropsychiatric features of the disease are not increased
comparative to controls 24 years from predicted onset, and is a phenomenon that
becomes observable approximately 15 years from predicted onset.
There was a non-significant trend towards higher pain scores and emotional
limitations on the SF-36 in preHD. This scale has been previously used in manifest
participants where the pain subsection has not shown notable differences between
groups (Helder et al. 2002; Ho et al. 2004), and it is unlikely this is a meaningful
difference.
These results also add to previous literature on neuropsychiatric outcomes following
a positive predictive test. In a systematic review of the literature, Crozier et al. found
that the psychological impact of predictive testing was not associated with test result
(Crozier et al. 2015), although some studies have reported an increase in
neuropsychiatric symptoms following a positive test result (Crozier et al. 2015; Quaid
et al. 2017). However, the mean age across all studies included in this review ranged
from 36.9 to 41.9 years, with no studies previously investigating outcomes of
predictive testing in younger adults. Although the HD-YAS was not specifically set up
to investigate the impact of predictive testing, the neuropsychiatric profiling included
similar assessments to previous studies in this area (Crozier et al. 2015). The findings
in the HD-YAS are therefore consistent with previous reports of no significant changes
in the extent of neuropsychiatric symptoms in those with a positive predictive test,
even at younger ages. These results may further support current clinical approaches
to predictive testing in young adults.
3.5.3 Little evidence of change in brain structure
There was little evidence of differences in brain structure assessed by multi-modal
imaging at this stage of HD, with the only significant finding across a wide range of
measures being a subtle reduction in preHD putamen volumes. Volumetric imaging
is the most established imaging method in HD and brain atrophy has been widely
reported in premanifest cohorts closer to predicted onset (Paulsen et al. 2008; Tabrizi
et al. 2012). Both TRACK-HD (Tabrizi et al. 2009) and PREDICT-HD (Paulsen et al.

124
2008) studies suggested that striatal volumes are reduced compared with controls at
least 15 years from expected disease onset. Although gene carriers in this study were
found to have significantly smaller putamen volumes, a statistical comparison of
volume reduction between striatal subregions did not provide evidence for the
putamen being more affected than the caudate. The lack of significant associations
between striatal volumes and age-CAG or NfL points towards a possible
neurodevelopmental constitutive difference in striatal volumes, supported by
previously published work in child and adolescent HD gene carriers (van der Plas et
al. 2019). Alternatively, reduced striatal volumes might be a result of
neurodegeneration that is too subtle and variable to show robust associations with
age-CAG or subtle elevations in NfL at this stage; longitudinal follow up might help to
resolve this question. Nevertheless, the small effect size and absence of association
with disease burden indicates striatal atrophy might be limited as a marker of
progression at this stage of HD.
Whole brain, grey matter and white matter atrophy has also been observed previously
in the premanifest period (Kipps et al. 2005; Tabrizi et al. 2012). White matter atrophy
is particularly pronounced, and is detectable around 15 years from symptom onset,
whereas grey and whole brain atrophy typically become detectable closer to predicted
onset (Aylward et al. 2011; Tabrizi et al. 2011). It is notable then, that not only was
there no significant between-group differences in whole brain, grey matter and white
matter volumes in this study, but how similar the two groups were in these measures,
with corresponding FDR values all over 0.9.
Previous literature had reported changes in peristriatal white matter microstructure
(Zhang et al. 2018) and loss of cortico-striatal connections (McColgan et al. 2015;
McColgan et al. 2017) in preHD closer to onset. Here, there were uncorrected
differences observed in the corpus callosum for AD and FWF, although these were in
the opposite direction to what is typically observed later in the disease course
(Gregory et al. 2015; Shaffer et al. 2017; Zhang et al. 2018). Other diffusion metrics
and structural connectivity measures were remarkably similar with no consistent
directional trends, indicative of there being very little detectable change in white
matter microstructure and connectivity at this timepoint despite using varied and well
established methods.

125
MPM was included in this study to investigate evidence of abnormalities in iron or
myelin in the striatum and peristriatal white matter. Abnormalities in myelin producing
oligodendrocytes have been described previously in neuropathological studies in
humans (Myers et al. 1991; Gómez-Tortosa et al. 2001) and HD animal models
(Huang et al. 2015; Peng et al. 2016). A previous imaging study using MT and DTI
imaging has provided additional support for myelin breakdown in the basal ganglia
white matter tracts of HD participants (Bourbon-Teles et al. 2017). Iron dysregulation
has also been described in HD neuropathology (Muller and Leavitt 2014), including
evidence of increasing striatal iron deposition (Dexter et al. 1992; Simmons et al.
2007; Rosas et al. 2012) with HD progression. MRI studies, typically using T2-based
or susceptibility weighted imaging, have also reported indirect evidence of subcortical
iron accumulation which appears to be detectable in preHD (Rosas et al. 2012;
Domínguez et al. 2016) and increases with disease progression (Dumas et al. 2012;
Rosas et al. 2012). MPM, used here for the first time in HD, did not identify any
regional differences between preHD participants and controls at this stage of the
disease process. However, the subthreshold R1 and R2 signal changes in the
putamen, caudate and external capsule, in the absence of changes in MT, may
indicate that iron is starting to accumulate at this early stage. Similarly, these results
indicate that oligodendrocyte dysfunction and myelin abnormalities previously
observed are a feature of later disease progression, rather than a
neurodevelopmental effect as previously suggested (Myers et al. 1991).
3.5.4 NfL is a promising biomarker of early neurodegeneration in
HD
NfL concentrations are closely associated with brain volumes, clinical scores, and
subsequent clinical onset and progression in HD (Byrne et al. 2017; Byrne et al.
2018). CSF and plasma NfL were both significantly elevated in this cohort 24 years
from predicted onset. CSF NfL had the highest effect size of any measure in this study
and was the only measure showing a significant association with age-CAG. However,
53% of preHD participants had CSF NfL concentrations within the 95th percentile of
controls and 87% had plasma NfL concentrations within this range, suggesting a
crucial point where NfL begins to rise has been identified. The ROC analysis indicated
that CSF NfL is more sensitive and specific for early preHD compared to plasma NfL,

126
in contrast to their near-equivalence in manifest HD (Byrne et al. 2018). These results
advance NfL as a potential candidate to measure disease progression in early preHD
and might eventually be used as a marker of response to treatment in future
preventive trials. Importantly, our results suggest that despite its practical and cost
advantages, plasma NfL may not be as sensitive as CSF NfL in early preHD, although
even more highly sensitive assays may improve plasma performance. Future trials
targeting early preHD might enrich recruitment by combining an age-CAG score (e.g.
DBS) with NfL above a predefined cut-off to increase the likelihood of seeing
measurable change over a typical trial timeframe. Through modelling NfL with age,
the approximate age at which NfL becomes abnormal for a given CAG length is
highlighted and may serve to guide future studies and trials in HD which may consider
the use of NfL as a biomarker. The use of NfL as an enrichment marker requires
further validation however, as does its possible use as a treatment-response marker.
Although non-specific to HD, the usefulness of NfL is strengthened in this case since
individuals with HD can be reliably identified by genetic testing and other neurological
diseases are rare in the age ranges studied in this cohort.
3.5.5 Measures of target engagement for huntingtin-lowering
therapeutics
A central aim of current therapies in development for HD is to reduce mHTT in the
nervous system. Accordingly, CSF mHTT represents a marker of target engagement
for these trials and has already been successfully used as such in the first huntingtin-
lowering trial in manifest HD (Tabrizi et al. 2019). In this cohort further from predicted
onset, mHTT concentrations were lower than previous reports (Wild et al. 2015; Byrne
et al. 2018); only 40% had concentrations above the limit of reliable quantification.
This finding suggests that, although suppression of mHTT could be a viable measure
of target engagement for clinical trials at this early stage, it would not be possible to
quantify the percentage of huntingtin-lowering to assess dose-response.
Alternatively, with concentrations consistently well above the limit of quantification,
total huntingtin might provide a more reliably quantifiable marker of target
engagement in non-allele selective huntingtin-lowering therapies than mHTT at this
early stage. This is the first study to examine total huntingtin concentration in humans.
That concentrations are consistently detectable above the lower limit of quantification

127
would suggest that huntingtin is naturally released from neurons into CSF. mHTT on
the other hand is known to aggregate within neurons (Bates et al. 2015) and is
believed to be released with neuronal damage, based on observations of rising mHTT
with disease progression and its close association with NfL (Byrne et al. 2018).
Therefore this discrepancy between mHTT and total huntingtin concentrations in this
cohort suggests that mHTT may be aggregating at this early stage, but not to a level
sufficient to cause significant neuronal death and subsequent widespread release into
the CSF.
3.5.6 Evidence of astrocytic activation in the early premanifest
period
The astrocytic marker YKL-40 has previously been investigated in HD with
inconsistent results. Rodrigues et al. found increased YKL-40 in a mixed preHD/HD
group (Rodrigues et al. 2016), whilst two other studies found non-significant increases
in the HD group, but no differences in the preHD group (Vinther-Jensen et al. 2014;
Niemelä et al. 2018). Here in a larger sample size, YKL-40 was found to be
significantly elevated in the preHD group. YKL-40 concentrations were also closely
associated with CSF mHTT and NfL, suggesting astrocytic activation may be
occurring in response mHTT-induced neuronal injury or cell-autonomous effects of
mHTT in astrocytes. Its utility as a marker of early disease progression may be limited
however, since concentrations do not appear to associate with age-CAG at this stage
and results from the ROC analysis show that YKL-40 is less sensitive and specific
than plasma and CSF NfL in early preHD.
YKl-40 is known to be elevated in a number of neurodegenerative and
neuroinflammatory diseases (Bonneh-Barkay et al. 2012; Olsson et al. 2016; Llorens
et al. 2017). Its transcription in astrocytes is associated with cell migration and
morphological changes characteristic of reactive gliosis (Bonneh-Barkay et al. 2012).
In Alzheimer’s disease, YKL-40 positive astrocytes have been found around β-
amyloid plaques and surrounding vessels with β-amyloid angiopathy, highlighting
how their activation is often closely related to pathological events (Llorens et al. 2017).
YKL-40 activation also appears as a preclinical event in experimental models of prion
diseases and Alzheimer’s pathology (Llorens et al. 2017). Although YKL-40’s role in

128
neurodegenerative disease pathogenesis remains unclear, dysregulated
neuroinflammation can be contributory to the pathogenesis of various neurological
diseases (Tansey and Goldberg 2010; Heneka et al. 2015; Wilton and Stevens 2020).
However, in two previous in-vivo studies of controlled cortical impact (Wiley et al.
2015) and autoimmune encephalitis (Bonneh-Barkay et al. 2012), YKL-40 knock-out
mice presented with more severe neuropathology and gliosis than wild-type
littermates. Therefore YKL-40 may, in certain circumstances, be neuroprotective in
modulating the neuroinflammatory response in response to injury.
In HD, astrocytic activation has been reported in the moderate, but not the earliest
pathological grades of HD in humans (Myers et al. 1991). Mouse models have
similarly reported elevations in GFAP expressing astrocytes in the moderate to late
disease stages (Tong et al. 2014). However, the role of astrocytes and other glial cells
in HD pathology is complex and incompletely understood (Wilton and Stevens 2020).
For example, there is evidence that mHTT expression in certain glial cells is sufficient
to generate cell-autonomous pathology in HD (Benraiss et al. 2016). Furthermore,
astrocyte biology seems to be disrupted by mHTT expression. In a recent study,
mHTT was found to alter the expression of many genes associated with basic
astrocytic functions which was then restored with huntingtin-lowering (Diaz-Castro et
al. 2019). Whilst the complexities of glial and astrocytic biology are outside the scope
of this study, the current results provide the first evidence of detectable astrocytic
activation very early in the premanifest period.
The absence of corresponding elevations in GFAP, another marker of astrocytic
activation, may reflect the limited nature of astrocytic activation at this stage and/or
GFAPs relative insensitivity as an early disease biomarker. This is consistent with
previous findings from a meta-analysis in Alzheimer’s cohorts where YKL-40 has
been found to be increased without corresponding elevations in GFAP (Olsson et al.
2016).
3.5.7 Other candidate fluid biomarkers for HD show limited change
Concentrations of total tau have been previously reported to be increased in HD
(Constantinescu et al. 2011; Rodrigues et al. 2016), although two previous studies
have found no significant differences in preHD (Vinther-Jensen et al. 2016; Niemela

129
et al. 2017). Results here, with a larger sample size than previous studies, corroborate
previous findings that total-tau is not elevated in preHD, and that elevations of tau
occur later in the disease course.
Increases in plasma IL-6 and IL-8 have been reported previously in preHD (Bjorkqvist
et al. 2008), whilst IL-6, but not IL-8 was found to be elevated in the CSF (Rodrigues
et al. 2016). In the latter study, IL-6 elevations were not as marked as elevations of
YKL-40. IL-6 has been also been shown to correlate with YKL-40 in several mouse
models of neuroinflammation and with IL-1, upregulates YKL-40 expression in human
astrocytes (Bhardwaj et al. 2015). The results here suggest that these cytokines are
not elevated centrally early in the disease process and that YKL-40 elevation is not
seemingly being driven by increased IL-6 production.
Neurogranin was included as the only measure of synaptic function in the study
biofluid battery since there is evidence for a role of synaptic dysfunction in HD (Sepers
and Raymond 2014) and neurogranin has previously been shown to be increased in
Alzheimer’s disease (Blennow et al. 2010; Tarawneh et al. 2016). Furthermore, a post
mortem study found neurogranin gene expression to be robustly downregulated in
HD (Hodges et al. 2006). The conclusively negative result here for CSF neurogranin
alongside a previous negative result in HD (Byrne et al. 2018) suggests that
neurogranin is not a biomarker of HD.
UCH-L1 has not been studied in HD before. However as an abundant protein in the
neuronal cytoplasm, it has been shown to be elevated in several neurodegenerative
conditions and traumatic brain injury (Öhrfelt et al. 2016; Bazarian et al. 2018;
Zeitlberger et al. 2018; Ng et al. 2020). The negative result in this cohort therefore
supports the lack of significant neuronal dysfunction or death in this cohort. Based on
the aforementioned results in other neurological diseases, it is still possible that UCH-
L1 may be a biomarker of later stage disease progression however.
3.5.8 Limitations
With respect to limitations, this study was powered to detect plausible disease-related
changes in striatal volumes and might have been underpowered to detect more subtle
changes across the range of measures studied. Therefore it cannot be confidently
concluded that an absence of significant differences is proof of normality in preHD in

130
any given measure. Longitudinal follow up of this cohort will be important, particularly
in re-examining subthreshold trends in the data, whilst also providing further clarity
on the biomarkers that are most suitable for clinical trials in such far-from-onset
cohorts.
The uptake of predictive testing in the UK is 17.4% (Baig et al. 2016) and there may
be factors unique to those obtaining genetic testing, particularly at an early age, which
may be a source of selection bias limiting the generalisability of the cognitive and
psychiatric results in particular. Although factors that influence those pursuing a
predictive testing has been previously described, little is known about differences
between individuals who choose to have predictive testing and those who do not
(Crozier et al. 2015). For example, it is unknown whether those who undergo
predictive testing show demographic differences with respect to socioeconomic
status, education level, mental health or other less easily defined personal
characteristics that may influence the measures included in this study. Selection bias
is particularly relevant to the interpretation of neuropsychiatric results, since it can be
reasonably expected that those with active mental health problems such as
depression, anxiety or apathy would be significantly less likely to volunteer for such a
demanding study. The latter is a general limitation to any observational study of
mental health, but may be particularly relevant given this study’s demanding schedule
of procedures that included extensive cognitive assessments, a long scanning time,
venepuncture and lumbar puncture.
Education levels for both groups in this study were fairly high (61% with university
education), and this is higher than in the general UK population of similar ages where
50% undertake university education (UK Government Department for Education
2019). It is possible that higher education levels may conceal any emerging subtle
cognitive deficits that could have otherwise been present by means of an early
compensatory effect (Brayne et al. 2010). Whilst significant neuropsychiatric disease
was an exclusion criterion for this study to guard against confounding the cognitive
results, only four gene carriers were excluded on this basis. This suggests our
neuropsychiatric results are not unduly influenced by excluding potential preHD
participants on this criteria, particularly given the trend of higher psychiatric symptoms
in the control group.

131
The neuropsychiatric self-report questionnaires used in this study were selected to
provide a broader coverage of neuropsychiatric symptoms than is achieved on the
PBA, with good evidence that these tools can be sensitive in the premanifest period
(Beglinger et al. 2008; Epping et al. 2013; Epping et al. 2016). However these
assessment tools ask participants to provide ratings for items over recent days, weeks
or the past month depending on the questionnaire. As such, the results do not capture
behavioural or psychiatric symptoms over a longer period and so would miss any
differences in psychopathology that have occurred prior to the point of assessment.
Analysing the ‘worst’ scores on PBA items collected may be a future avenue to
provide further insights on this point. Longitudinal follow up may also help establish
trends overtime, but would suffer from the same problem of potentially missing
psychopathology that has occurred in-between assessment visits. Further, although
medication use was not factored into this analysis, the rates of antidepressant use
across the cohort was low, being 9% in preHD and 5% in the control group, and hence
would be unlikely to influence the neuropsychiatric results. No participants were on
other forms of psychiatric medication. Whilst some studies have previously included
companion ratings in neuropsychiatric assessments to minimise the potential of lack
of awareness, evidence suggests that such lack of awareness only becomes evident
in manifest HD or preHD close to predicted onset and so is unlikely to confound the
neuropsychiatric results (Epping et al. 2016; Andrews et al. 2018).
The control group were specifically required to be from a HD-background, either as a
gene-negative, family member or friend, to control for any influence of being from a
HD-environment. It also provides an effective way of matching groups, since such
controls are likely to share similar demographics to the gene carriers included in the
study. However the trade-off is that this control group cannot be directly inferred to be
representative of the general population.
The cognitive assessments included in this study were designed to interrogate a
broad range of cognitive functions known to be affected in preHD, as well as more
exploratory tests such as some EMOTICOM tasks. However, this battery of tasks is
not exhaustive in coverage of all cognitive domains. Although there is some
provisional evidence from small scale studies for preHD deficits in language (Nemeth
et al. 2012; Hinzen et al. 2018) and calculation (Nanetti et al. 2018) for example, larger

132
replication studies in manifest groups may be helpful before warranting their inclusion
in studies of preHD cohorts far from predicted onset.
Similarly, the biofluid assessments were selected largely on the basis of previous
evidence in preHD, with some exploratory markers with evidence of sensitivity in other
neurodegenerative diseases. GFAP and UCH-L1 were included within this study
because their regulatory acceptance as biomarkers for head injury (Bazarian et al.
2018) has resulted in their inclusion in the Quanterix Neurology 4-Plex ultrasensitive
immunoassay kit that was used here to generate results for NfL and tau. Other
candidate biomarkers of neurodegeneration are increasingly being uncovered
(Schindler et al. 2019) that could also be tested in HD. However, as a general principle
it would be prudent to evaluate such exploratory markers in larger cohorts with
manifest HD (Clinicaltrials.gov; NCT02855476 2016; Byrne et al. 2018), since biofluid
resources are more abundant in these groups and because of the likely futility of
evaluating markers in early preHD that do not show evident effects in manifest
cohorts.
Finally, whilst our imaging assessments have shown very little evidence of change in
brain structure at this early stage, it is possible that with continuing advances,
techniques such as 7T imaging might provide higher signal-to-noise ratios that could
help uncover early disease effects that may be otherwise undetectable and this will
be a future avenue of interest in the field (Springer et al. 2016).
3.5.9 Conclusion
In summary, these results highlight a timepoint in preHD where subtle elevations in
select biological measures of neurodegeneration occur in the absence of detectable
functional impairment. This therefore may represent the very beginnings of the
neurodegenerative process in HD. Treatments initiated at this stage may offer the
prospect of delaying or preventing further neurodegeneration while function is intact,
giving gene carriers many more years of life without impairment.

133
4 Timing and specificity of basal ganglia white
matter loss in premanifest HD
Having described some of the earliest detectable changes in preHD, this chapter
focuses more specifically on cortical-basal ganglia white matter connections known
to be susceptible to early HD pathology. By combining the HD-YAS dataset with the
TrackOn-HD dataset, I sought to evaluate whether specific cortico-striatal and cortico-
thalamic connections show differential vulnerability in preHD and if so, how far before
predicted onset this could be detected.

134
4.1 Introduction
The striatum has long been recognised as a central region in HD pathology with
atrophy detectable early in the disease course (Aylward et al. 1994; Kipps et al. 2005;
Tabrizi et al. 2011). However, it has been increasingly recognised that the white
matter also undergoes significant atrophy early in the premanifest period (Aylward et
al. 2011; Tabrizi et al. 2011).
Several studies using DTI have described the vulnerability of cortico-striatal
connections in manifest HD (Bohanna et al. 2011; Marrakchi-Kacem et al. 2013;
McColgan et al. 2015; Novak et al. 2015), with sensorimotor connections showing the
greatest HD-related changes and the limbic connections appearing relatively
preserved. Some studies have failed to detect such DTI metric changes in
premanifest groups (Novak et al. 2015; Gorges et al. 2017; Gregory et al. 2018),
whilst others have reported significant differences in these tracts (Dumas et al. 2012;
McColgan et al. 2015; Orth et al. 2016; McColgan et al. 2017). Studies that have
investigated specific cortico-striatal subnetworks in the premanifest period have
reported changes in sensorimotor (Dumas et al. 2012; Poudel et al. 2014; Orth et al.
2016) and prefrontal tracts (Poudel et al. 2014).
Few previous studies have characterised how early in the premanifest period these
changes can be detected however. In the PREDICT cohort, cross-sectional
differences in tensor measures of cortico-striatal tracts were apparent predominantly
in the group closest to predicted onset, with no tracts showing change in the group
estimated to be >13 years from predicted onset (Shaffer et al. 2017). Longitudinal
findings using tensor measures have been inconsistent. In preHD, two studies have
failed to find 12-30 month changes (Poudel et al. 2014; Odish et al. 2015), whereas
two larger studies demonstrated progressive changes over 1-5 years in premanifest
HD cohorts (Harrington et al. 2016; Shaffer et al. 2017).
Whilst the striatum is the major input in cortico-basal ganglia circuits, its output back
to the cortex is predominantly via cortico-thalamic white matter connections (Haber
2016). The thalamus has received comparatively less attention than the striatum in
HD, although its involvement in HD pathology has been well described (Heinsen et
al. 1996; Heinsen et al. 1999; Rub et al. 2016). Cortico-thalamic connections are

135
thought to be relatively preserved in preHD (Dumas et al. 2012; Poudel et al. 2014;
McColgan et al. 2015; Gorges et al. 2017), although changes in posterior thalamic
radiations have been described (Stoffers et al. 2010).
Previous studies investigating cortico-striatal or cortico-thalamic connections have
typically investigated these as one homogenous group of connections (McColgan et
al. 2015) or have focused on select motor and sensory connections (Dumas et al.
2012; Orth et al. 2016; Gorges et al. 2017; Shaffer et al. 2017; Scahill et al. 2020).
However, the striatum and thalamus have a distinct topographical organisation of
cortical connections forming individual subnetworks (Behrens et al. 2003; Tziortzi et
al. 2014). It is currently unknown when these connections are first affected in HD and
whether specific subregional connections are more vulnerable in the early disease
course.
The majority of the previous literature on this topic comes from DTI, where voxel-
averaged measures are unable to account for crossing fibres and have poor
interpretability as measures of structural connectivity (Jones, Knosche et al. 2013;
Raffelt, Tournier et al. 2017; Mito, Raffelt et al. 2018). FBA is a more recently
developed diffusion technique which can resolve crossing fibre populations to provide
more reliable tractograms whilst also providing more biologically specific measures
of fibre density and cross-section (Raffelt et al. 2017). Similarly, whereby the majority
of previous diffusion imaging studies in HD have used single-shell acquisitions, there
is an increasing trend towards acquisitions using multiple-shells with higher b-values,
which can improve the ability to model the diffusion signal and further probe tissue
microstructure (Zhang et al. 2018; Genc et al. 2020). It is possible that such modern
acquisitions may increase signal-to-noise when searching for early disease effects
using diffusion MRI.
Understanding the timing and pattern of white matter connection degeneration in HD
has particular relevance to emerging viral-vector based therapeutics such as RNAi
approaches. These therapeutics typically require direct injection into the brain
parenchyma and drug distribution, which can occur through axonal transport (Salegio
et al. 2013; Weiss et al. 2020), may be limited. Therefore, targeting injections to
vulnerable subregions before significant white matter loss has occurred may
represent a potential treatment strategy for these therapeutics.

136
I tested the hypothesis that cortico-striatal and cortico-thalamic connections may be
preserved early in preHD and that subregions of the striatum and thalamus might
show differential vulnerability to degeneration in a group closer to expected clinical
onset. To test this hypothesis, diffusion MRI tractography with fixel-based analysis
(FBA) of specific cortico-striatal and cortico-thalamic connections was performed
using datasets from two cohorts with preHD participants approximately 11 and 25
years before expected clinical onset.
4.2 Contribution and Collaborators
I led on project conception and design along with Peter McColgan. Contributors for
data collection for HD-YAS and TrackOn-HD has been descripted previously in
Chapter 3 and by Kloppel et al. (Kloppel et al. 2015) respectively. Sarah Gregory and
Peter McColgan provided original quality checks of diffusion data. I performed further
scan and processing quality checks, including registrations for all subjects in the
study. I conducted all data processing, except for single-shell multi-tissue CSD, with
supervision from Peter McColgan. Thijs Dhollander performed the single-shell multi-
tissue CSD, a technique not available in the public domain at the time. I performed
statistical analysis with support from Peter McColgan and further input from Marina
Papoutsi. Thijs Dhollander, Sarah Gregory, Eileanoir Johnson, Akshay Nair, Marina
Papoutsi, Rachael Scahill, Geraint Rees and Sarah Tabrizi have all provided critique
and input into study design, execution and interpretation. I have written up the results
for publication, including all tables, figures and collating edits from co-authors.
Supervision for the project has been provided by Peter McColgan, Rachael Scahill,
Geraint Rees and Sarah Tabrizi.
4.3 Methods
4.3.1 Cohorts
To investigate how early basal ganglia white matter loss could be detected, MRI data
from HD-YAS (Scahill et al. 2020) were utilised. PreHD participants required a DBS
of ≤ 240, approximating to ≥ 18 years from predicted clinical onset. Multi-shell
diffusion MRI data were analysed from 54 preHD and 53 control participants.

137
To investigate whether there is selective loss of specific basal ganglia white matter
connections in preHD closer to predicted onset, MRI data from the TrackOn-HD study
(Kloppel et al. 2015) was used. This included single-shell diffusion data acquired at
three timepoints over 24 months from four sites (London, Paris, Leiden, and
Vancouver). Gene carriers were required to have a disease burden score of > 250,
approximating to < 17 years from predicted onset. The total number of participants
each year was as follows: year one (72 gene carriers, 85 controls), year two (81 gene
carriers, 87 controls) and year three (80 gene carriers, 78 controls). Participant
demographics are summarised in Table 4.1.
Table 4.1. Participant demographics
TrackON-HD HD-YAS
PreHD
N=72
Control
N=85
p PreHD
N=54
Control
N=53
p
Age 43.3 ± 9.2 48.8 ± 9.8 4.0 x 10⁻⁴ 29.8 ± 5.6 29.3 ± 5.5 0.67
Male (%) 53 38 0.06 48 43 0.49
Education 4.0 ± 1.0 4.0 ± 1.0 0.94 4.9 ± 1.8 4.8 ± 1.6 0.71
CAG 42.9 ± 2.3 42.2 ± 1.7
Years to
Onset
11.3 ± 3.9 24.7 ± 6.3
Unless otherwise specified, values are means ± standard deviations. Group comparisons were
made using t tests (age, education) or chi-squared (sex and education). Education was measured
using ISCED. Years to predicted onset was calculated using the Langbehn equation (Langbehn,
Brinkman et al. 2004). TrackOn-HD demographics presented for baseline visit.
At the last TrackOn-HD visit, participants at London and Paris sites had an additional
multi-shell diffusion MRI scan, similar to the HD-YAS acquisition, which included 33
gene carriers and 40 healthy control participants (Table 4.2). The existence of multiple
shells, including some with higher b-values, is a more common feature in modern
DWI acquisitions and was added to the final time-point assessments in TrackON-HD
as a relatively new technique of interest to detect early disease effects. The MRI
acquisitions used for this study are summarised in Table 4.3.

138
Participants were excluded if they were left-handed, ambidextrous, or had poor quality
diffusion MRI data, as defined by visual quality control performed (Appendix 9.7).
Table 4.2. TrackOn-HD multi-shell acquisition subcohort
PreHD
N=33
Control
N=40
p
Age 42.1 ± 9.5 47.2 ± 10.6 0.03
Male (%) 42 63 0.09
Education 3.9 ± 1.2 4.0 ± 0.9 0.28
CAG 43.0 ± 1.9
Years to Onset 11.5 ± 4.0
A multi-shell diffusion MRI scan was performed for a subgroup of TrackOn-HD participants at the
final time point. Education was measured using the ISCED Years to predicted onset was
calculated using the Langbehn equation (Langbehn et al. 2004).
4.3.2 Diffusion MRI processing
Pre-processing of diffusion data was performed with a combination of tools in the
MRtrix3 (Tournier et al. 2019) and FSL (Jenkinson et al. 2012) software packages.
This included denoising of data (Veraart et al. 2016), Gibbs-ringing artefact removal
(Kellner et al. 2016), eddy-current correction and motion correction (Andersson and
Sotiropoulos 2016) and up-sampling diffusion MRI spatial resolution in all 3
dimensions using cubic b-spline interpolation to 1.3×1.3×1.3 mm3 voxels (Dyrby et
al. 2014). The up-sampling of data helps to increase the anatomical contrast, which
improves downstream spatial normalisation and statistics (Raffelt et al. 2017).
Three-tissue CSD modelling of diffusion data was performed using MRtrix3Tissue
(https://3Tissue.github.io), a fork of MRtrix3. For all data, response functions for
single-fibre white matter as well as grey matter and CSF were estimated from the
data themselves using an unsupervised method (Dhollander et al. 2019). For the
single-shell TrackOn-HD data, FODs for the three tissues were computed using
single-shell three-tissue CSD (Dhollander and Connelly 2016) whilst multi-shell multi-
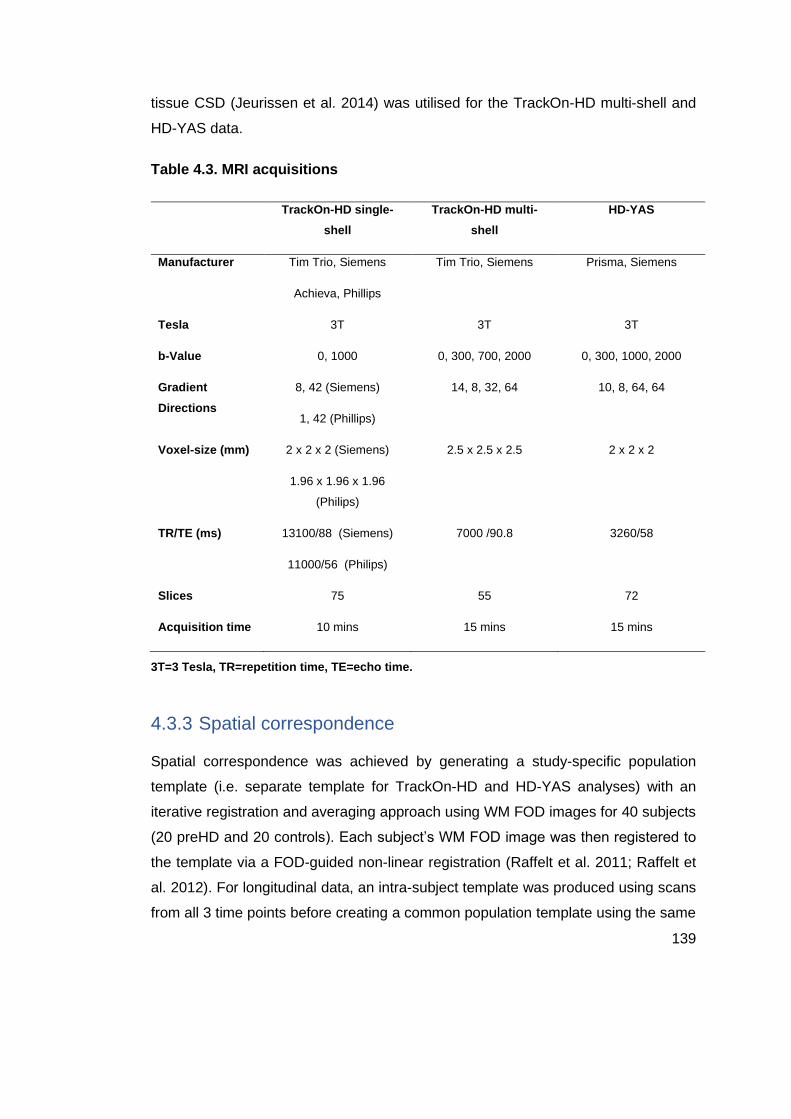
139
tissue CSD (Jeurissen et al. 2014) was utilised for the TrackOn-HD multi-shell and
HD-YAS data.
Table 4.3. MRI acquisitions
TrackOn-HD single-
shell
TrackOn-HD multi-
shell
HD-YAS
Manufacturer Tim Trio, Siemens
Achieva, Phillips
Tim Trio, Siemens Prisma, Siemens
Tesla 3T 3T 3T
b-Value 0, 1000 0, 300, 700, 2000 0, 300, 1000, 2000
Gradient
Directions
8, 42 (Siemens)
1, 42 (Phillips)
14, 8, 32, 64 10, 8, 64, 64
Voxel-size (mm) 2 x 2 x 2 (Siemens)
1.96 x 1.96 x 1.96
(Philips)
2.5 x 2.5 x 2.5 2 x 2 x 2
TR/TE (ms) 13100/88 (Siemens)
11000/56 (Philips)
7000 /90.8 3260/58
Slices 75 55 72
Acquisition time 10 mins 15 mins 15 mins
3T=3 Tesla, TR=repetition time, TE=echo time.
4.3.3 Spatial correspondence
Spatial correspondence was achieved by generating a study-specific population
template (i.e. separate template for TrackOn-HD and HD-YAS analyses) with an
iterative registration and averaging approach using WM FOD images for 40 subjects
(20 preHD and 20 controls). Each subject’s WM FOD image was then registered to
the template via a FOD-guided non-linear registration (Raffelt et al. 2011; Raffelt et
al. 2012). For longitudinal data, an intra-subject template was produced using scans
from all 3 time points before creating a common population template using the same

140
registration approach. The resulting template was visually quality checked by creating
a FOD-based directionally encoded colour map (Figure 4.1) and inspecting
consistency of core structures such as the corpus callosum and anterior and posterior
commissures. A template mask was then created by warping all individual subject
masks into template space and computing the mask as an intersection of all subject
masks in template space. The resulting mask ensures that subsequent analysis is
only performed in voxels that contain data from all participants.
Figure 4.1 FOD-based directionally encoded colour map of population template. To quality check the population template for alignment, a FOD-based directionally colour encoded map was produced. Colour indicates orientation of fibres with red for mediolateral, green for anteroposterior, blue for superoinferior. (A) Sagittal view showing that even small structures like the anterior commissure (red) remain visible within the template. (B) Axial view with FODs overlaid. The FOD lobes of the anterior commissure inspected at focus (white box, left side of image) showing correct transverse alignment. These checks indicate good alignment of structures within the population template.
4.3.4 Generating a fixel map and fixel metrics
Fixels were then segmented from the FOD template to create a fixel mask that acts
as a grid for subsequent analysis. The FOD lobe threshold recommended for
segmentation is 0.06 (Tournier et al. 2019). However at this threshold, particularly in
the single-shell datasets, there was a considerable number of spurious fixels in the
grey matter and CSF. Hence the threshold was optimised to 0.1 which removed the
vast majority of spurious fixels from grey matter and CSF to produce a fixel map more
in line with known anatomy and white matter tracts (Figure 4.2).

141
Figure 4.2 Varying the threshold of the raw peak FOD amplitudes to produce discrete set of fixels in TrackOn-HD. (A) A fixel map with a 0.06 threshold where there are many spurious fixels in the grey matter and CSF. (B) With a raised threshold of 0.1 many of these spurious fixels are now removed. Below – images displaying fixel count per voxel. Blue/Cyan/Yellow/Orange/Red = 1,2,3,4 and 5 fixels/voxel respectively. (C) At a threshold of 0.06, more voxels contain 4-5 fixels which are likely spurious given known normal anatomy. (D) Using the 0.1 threshold, these excess fixels are removed giving more reliable fixel counts and better contours of certain white matter structures. Each participant’s FOD image was then warped to template space before each FOD lobe was segmented to identify the number and orientation of fixels in each voxel and compute FD. Fixels were reoriented for all participants in template space based on the local transformation at each voxel in the warps used previously. Participant fixels were then assigned to template fixels to achieve alignment for all participant fixels and FC was derived from the warps generated during registration.
FBA was used to interrogate changes in white matter (General Methods 2.9.5). For
the main analysis, to avoid excessive multiple comparisons only FDC is reported as
it can be expected that neurodegeneration will cause combined reductions in both
fibre density and bundle atrophy, supported by results in other neurodegenerative
diseases (Mito et al. 2018; Rau et al. 2019). However, results of FD and FC were also
analysed and discussed separately to provide a more complete overview of fixel
metric change in preHD.

142
4.3.5 Generating tracts for analysis
Connectivity-based atlases of the striatum and thalamus were used to segment each
structure into seven subregions per hemisphere based on the dominant area of
cortical connectivity in each subregion (General Methods 2.9.3). For the striatum,
subregions included limbic, executive, rostral motor, caudal motor, parietal, temporal
and occipital regions (Tziortzi et al. 2014). For the thalamic segmentation, subregions
included prefrontal, premotor, primary motor, sensory, parietal, temporal and occipital
cortices (Behrens et al. 2003). The striatal and thalamic atlases were registered to
the population template with a linear registration using NiftyReg (Modat et al. 2010).
Registrations were visually checked to ensure accurate alignment.
The objective for tractography was to create tractograms for each subregion that were
consistent with the original connectivity-based atlases, with each striatal and thalamic
subregion having a tract connecting to its target cortical region and with minimal
overlap between regions. A tractogram for each striatal and thalamic subregion was
generated using probabilistic tractography on the population template using tools
within MRtrix3 (Tournier et al. 2019). Twenty thousand streamlines were seeded in
each striatal subregion. This streamline count was selected as it produced well
reconstructed tracts in all regions with a modest computation time and further
increases in streamline seed counts did not appear to produce superior
reconstructions. Streamlines were initiated in each subregion, with all other
subregions excluded to avoid streamlines traversing other subregions and creating
large amounts of overlap between the tracts. An inter-hemisphere mask was also
used to stop streamlines traversing to the contralateral hemisphere and creating
overlapping tracts. Since the striatal atlas also had corresponding cortical target
regions, tracks were only included if they traversed their corresponding cortical target
region. Although the thalamic atlas did not have corresponding cortical target regions,
the tractograms generated appeared to adequately reach their cortical targets without
the need for further constraints. The minimum FOD amplitude for seeding tracts was
set at 0.08. This was above the recommended threshold of 0.05 for FBA and was
selected after inspecting tractograms thresholded between 0.05-0.18, with the raised
threshold removing some likely spurious and isolated streamlines.

143
The result was a single fibre bundle for each subregion connecting to its respective
main cortical region. A track density image was then created from each tractogram
by mapping the tractograms to the template fixel map. This track density image is
then converted to a mask for each tract to compute fixel metrics within. Here, after
some experimentation, the threshold was set at 50, since this provided non-
overlapping but well-constructed tracts that were consistent with the original
connectivity-based parcellation atlases. Fixel-based metrics were then calculated for
all fixels within each tract and averaged to generate a single measure of FDC for each
tract.
Figure 4.3 Thresholding tract density images to create concise non-overlapping tracts. (A) Showing the initial track density image for the cortico-striatal limbic tract on the group template. Here there are relatively dense tracts towards the medial prefrontal cortex. However there are more sparse tracts elsewhere, including some tracking through the corpus callosum. (B) By applying a threshold, the less dense tracts have been removed and there is now one concise tract running from the ventral striatum to the target medial prefrontal cortex. This now forms a mask for the subsequent analysis and the FDC can be computed for all fixels within this mask to generate a result for the limbic cortico-striatal tract.
4.3.6 Clinical scales
To investigate whether reductions in FDC observed in the TrackOn-HD baseline
results were associated with clinical findings, correlations were performed with these
tracts and specific a priori clinical tasks in preHD. For limbic cortico-striatal tracts,
relationships with apathy using the BAIS (General Methods 2.6) were investigated
given the known clinical relevance of these tracts in neurological conditions causing
apathy (Levy and Dubois 2006; Le Heron et al. 2018; Prange et al. 2019). Only the

144
apathy scale was used in this study where higher scores indicate higher levels of
apathy.
For caudal cortico-striatal connections and thalamic premotor and motor cortical
connections, relationships between FDC and motor signs on the UHDRS TMS
(Huntington Study Group 1996) (General Methods 2.4) were investigated.
4.3.7 Statistical analysis
Statistical analysis was performed in MATLAB R2018a and box plots were generated
in R using the ggplot function (version 3.63). Analysis of the single time point HD-YAS
and TrackOn-HD multi-shell data involved permutation testing (10,000 permutations)
with two-tailed t-tests to investigate group differences.
For the longitudinal TrackOn-HD analysis, linear mixed effects regression was used
as it provides unbiased estimates under the assumption that the missing data is
ignorable whilst accounting for dependence due to repeated measures. The model
was defined as:
Yij = α + βtij + γ (groupi) + δ (groupi) (tij) + θXi + ai + bi tij + eij
Where Yij is FDC for the ith participant ( i = 1, ... , N) at the jth time point (j = 1, ... , ni),
with time metric tij = visitij – 1, so that ti1 = 0 . Groupi is a dummy variable taking the
value of 0 if a participant is in the control group and the value of 1 if a gene carrier.
Greek letters denote fixed effects; α is the control group mean at the first visit, β is the
control group linear slope, γ is the mean difference among the preHD and control
groups at the first visit (difference of intercepts), δ is the slope difference among the
groups (rate of change difference), Xi is the matrix of covariates with associated
regression coefficient vector θ; ai and bi are random effects (random intercepts and
slopes), and eij is random error. Maximum likelihood methods are used for estimation
under the assumption that the random effects have a joint-normal distribution with
zero-means and non-singular covariance matrix, and the random error is normally
distributed with zero mean and constant nonzero variance. The objects of inference
were γ and δ, with the former being the baseline cross-sectional mean difference
among the groups adjusting for the covariates and the latter being the group
difference in the rate of change (slope difference) adjusting for the covariates. The
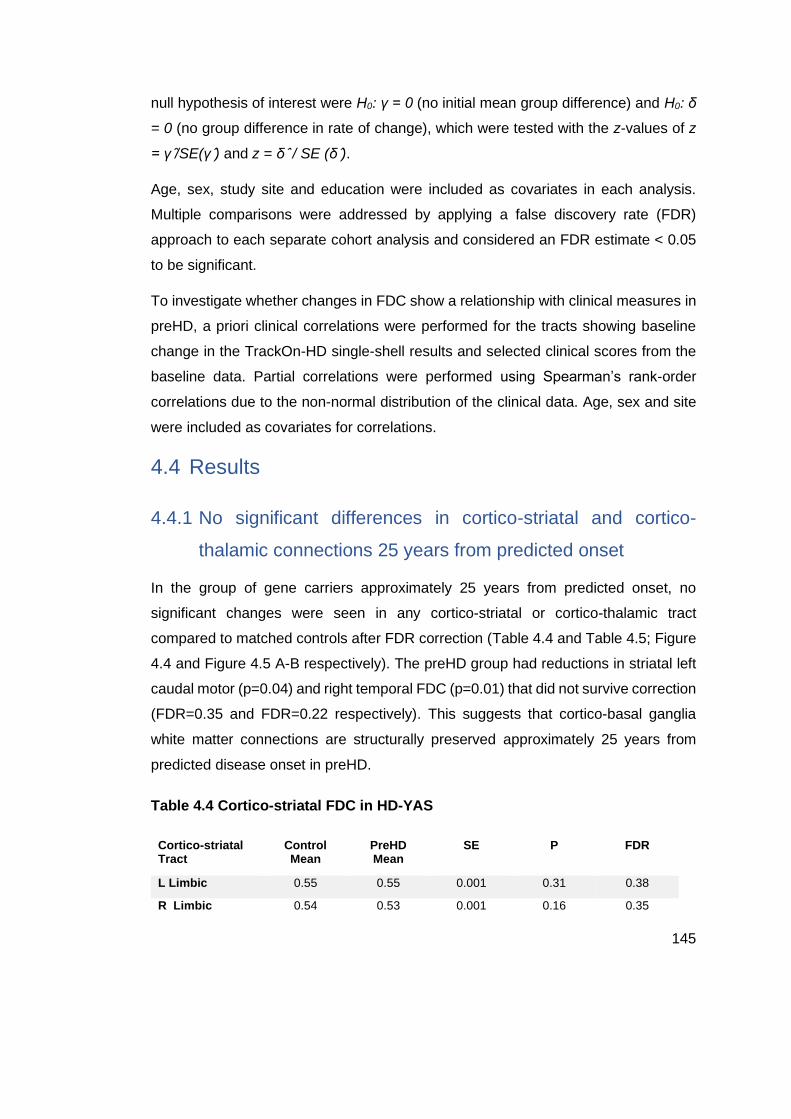
145
null hypothesis of interest were H0: γ = 0 (no initial mean group difference) and H0: δ
= 0 (no group difference in rate of change), which were tested with the z-values of z
= γ /̂SE(γ )̂ and z = δ ̂/ SE (δ )̂.
Age, sex, study site and education were included as covariates in each analysis.
Multiple comparisons were addressed by applying a false discovery rate (FDR)
approach to each separate cohort analysis and considered an FDR estimate < 0.05
to be significant.
To investigate whether changes in FDC show a relationship with clinical measures in
preHD, a priori clinical correlations were performed for the tracts showing baseline
change in the TrackOn-HD single-shell results and selected clinical scores from the
baseline data. Partial correlations were performed using Spearman’s rank-order
correlations due to the non-normal distribution of the clinical data. Age, sex and site
were included as covariates for correlations.
4.4 Results
4.4.1 No significant differences in cortico-striatal and cortico-
thalamic connections 25 years from predicted onset
In the group of gene carriers approximately 25 years from predicted onset, no
significant changes were seen in any cortico-striatal or cortico-thalamic tract
compared to matched controls after FDR correction (Table 4.4 and Table 4.5; Figure
4.4 and Figure 4.5 A-B respectively). The preHD group had reductions in striatal left
caudal motor (p=0.04) and right temporal FDC (p=0.01) that did not survive correction
(FDR=0.35 and FDR=0.22 respectively). This suggests that cortico-basal ganglia
white matter connections are structurally preserved approximately 25 years from
predicted disease onset in preHD.
Table 4.4 Cortico-striatal FDC in HD-YAS
Cortico-striatal Tract
Control Mean
PreHD Mean
SE P FDR
L Limbic 0.55 0.55 0.001 0.31 0.38
R Limbic 0.54 0.53 0.001 0.16 0.35

146
L Cognitive 0.58 0.57 0.001 0.32 0.38
R Cognitive 0.56 0.57 0.001 0.49 0.53
L Rostral Motor 0.58 0.59 0.001 0.54 0.54
R Rostral Motor 0.59 0.59 0.001 0.33 0.38
L Caudal Motor 0.62 0.60 0.001 0.04 0.35
R Caudal Motor 0.61 0.60 0.001 0.16 0.35
L Parietal 0.67 0.67 0.001 0.33 0.38
R Parietal 0.68 0.68 0.001 0.34 0.38
L Temporal 0.60 0.60 0.001 0.18 0.35
R Temporal 0.64 0.61 0.001 0.01 0.22
L Occipital 0.73 0.71 0.001 0.07 0.35
R Occipital 0.71 0.70 0.001 0.18 0.35
Unadjusted means displayed. SE = standard error.
Table 4.5 Cortico-thalamic FDC in HD-YAS
Cortico-thalamic Tract
Control Mean
PreHD Mean
SE p FDR
L Prefrontal 0.61 0.61 0.001 0.18 0.35
R Prefrontal 0.62 0.62 0.001 0.32 0.38
L Premotor 0.65 0.63 0.001 0.08 0.35
R Premotor 0.63 0.62 0.001 0.30 0.35
L Primary Motor 0.61 0.61 0.001 0.34 0.38
R Primary Motor 0.60 0.60 0.001 0.34 0.38
L Sensory 0.62 0.62 0.001 0.52 0.54
R Sensory 0.58 0.58 0.001 0.33 0.38
L Parietal 0.68 0.67 0.001 0.09 0.35
R Parietal 0.65 0.64 0.001 0.17 0.35
L Temporal 0.52 0.51 0.0004 0.13 0.35
R Temporal 0.51 0.50 0.0004 0.05 0.35
L Occipital 0.51 0.50 0.0004 0.08 0.35
R Occipital 0.55 0.54 0.0004 0.18 0.35
Unadjusted means displayed. SE = standard error.

147
4.4.2 Anatomically specific basal ganglia white matter loss in
preHD
To establish whether particular connections showed selective vulnerability in preHD
closer to predicted onset, the same technique was applied to the TrackOn-HD single-
shell baseline dataset. For cortico-striatal tracts, significant reductions were seen
bilaterally in limbic (left FDR=0.002, right FDR=0.02) and caudal motor (left
FDR=0.002, right FDR=0.006) FDC (Table 4.6; Figure 4.4 C-D respectively). For
cortico-thalamic tracts, significant reductions were seen bilaterally in premotor (left
FDR=0.005, right FDR=0.02), primary motor (left FDR=0.001, right FDR=0.02) and
left sensory (FDR=0.006) FDC (Table 4.7; Figure 4.5 C-D).
Table 4.6 Cortico-striatal FDC in TrackOn-HD single-shell baseline
Cortico-striatal Tract
Control Mean
PreHD Mean
γ SE p FDR
L Limbic 0.42 0.41 -0.03 0.008 3.0 x 10⁻⁴ 0.002
R Limbic 0.40 0.39 -0.02 0.007 0.005 0.02
L Cognitive 0.42 0.42 -0.01 0.006 0.05 0.08
R Cognitive 0.41 0.42 -0.01 0.006 0.13 0.15
L Rostral Motor 0.49 0.50 -0.007 0.008 0.38 0.55
R Rostral Motor 0.52 0.52 -0.02 0.008 0.04 0.09
L Caudal Motor 0.55 0.53 -0.03 0.008 4.9 x 10⁻⁴ 0.002
R Caudal Motor 0.56 0.54 -0.03 0.008 0.001 0.006
L Parietal 0.55 0.55 -0.02 0.008 0.02 0.06
R Parietal 0.57 0.56 -0.02 0.008 0.07 0.11
L Temporal 0.41 0.41 2.2 x 10⁻⁴ 0.006 0.97 0.97
R Temporal 0.43 0.44 0.001 0.006 0.84 0.84
L Occipital 0.55 0.55 -0.004 0.007 0.53 0.62
R Occipital 0.56 0.56 -0.01 0.007 0.08 0.11
Unadjusted means displayed. γ=estimated group intercept difference (preHD minus control);
SE=standard error.

148
Table 4.7 Cortico-thalamic FDC in TrackOn-HD single-shell baseline
Cortico-thalamic Tract
Control Mean
PreHD Mean
γ SE P FDR
L Prefrontal 0.49 0.49 -0.02 0.007 0.03 0.05
R Prefrontal 0.48 0.48 -0.01 0.007 0.08 0.08
L Premotor 0.58 0.55 -0.03 0.009 0.002 0.005
R Premotor 0.51 0.51 -0.03 0.009 0.002 0.02
L Primary Motor 0.57 0.55 -0.03 0.008 1.30 x 10⁻⁴ 0.001
R Primary Motor 0.57 0.55 -0.02 0.009 0.007 0.02
L Sensory 0.55 0.53 -0.02 0.008 0.003 0.006
R Sensory 0.53 0.52 -0.01 0.007 0.08 0.08
L Parietal 0.51 0.51 -0.006 0.006 0.35 0.40
R Parietal 0.51 0.51 -0.01 0.006 0.05 0.08
L Temporal 0.36 0.36 -0.007 0.005 0.15 0.21
R Temporal 0.36 0.36 -0.008 0.004 0.06 0.08
L Occipital 0.52 0.52 -0.002 0.007 0.08 0.35
R Occipital 0.54 0.53 -0.01 0.008 0.06 0.08
Unadjusted means displayed. γ=estimated group intercept difference (preHD minus control),
SE=standard error.
4.4.2.1 No longitudinal changes in preHD 11 years from predicted onset
The next step in analysis investigated whether there was significant change over a 2-
year time period at this stage using the TrackOn-HD longitudinal dataset. Although
there was a trend towards slight reductions in FDC, there were no significant changes
in any cortico-striatal or cortico-thalamic tracts after FDR correction (Table 4.8 and
Table 4.9).
Table 4.8. Cortico-striatal FDC in TrackOn-HD single-shell longitudinal
Cortico-striatal Tract
δ SE p FDR
L Limbic -0.002 0.003 0.52 0.60
R Limbic -0.003 0.002 0.26 0.45
L Cognitive -0.002 0.001 0.20 0.36
R Cognitive -0.002 0.001 0.25 0.45

149
L Rostral Motor -0.003 0.002 0.14 0.33
R Rostral Motor -0.001 0.002 0.70 0.82
L Caudal Motor -0.004 0.002 0.09 0.30
R Caudal Motor 0.002 0.002 0.42 0.58
L Parietal -0.002 0.002 0.37 0.51
R Parietal 0.001 0.002 0.82 0.82
L Temporal 3.0 x 10⁻⁴ 0.002 0.80 0.89
R Temporal -0.003 0.002 0.12 0.45
L Occipital -0.003 0.002 0.08 0.30
R Occipital -0.003 0.002 0.17 0.45
δ = estimated group slope difference (preHD minus controls), SE=standard error.
Table 4.9 Cortico-thalamic FDC in TrackOn-HD single-shell longitudinal
Cortico-thalamic Tract
δ SE p FDR
L Prefrontal 0.000 0.002 0.81 0.81
R Prefrontal -0.001 0.001 0.64 0.75
L Premotor -0.002 0.002 0.40 0.48
R Premotor 0.002 0.002 0.39 0.75
L Primary Motor -0.002 0.003 0.37 0.48
R Primary Motor 0.001 0.002 0.59 0.75
L Sensory -0.002 0.002 0.41 0.48
R Sensory 0.000 0.002 0.95 0.95
L Parietal -0.001 0.002 0.34 0.48
R Parietal -0.002 0.002 0.28 0.75
L Temporal -0.001 0.001 0.32 0.48
R Temporal -0.001 0.001 0.44 0.75
L Occipital -0.004 0.002 0.03 0.24
R Occipital -0.004 0.002 0.04 0.28
δ = estimated group slope difference (preHD minus controls), SE=standard error.

150
4.4.3 FDC changes using multi-shell acquisition at last time point
in TrackOn-HD
The impact of diffusion MRI acquisition on these results was investigated by repeating
the analysis in the TrackOn-HD final time-point subgroup who had an additional multi-
shell diffusion MRI scan as part of the protocol. In this subgroup, there were
widespread significant FDC reductions in cortico-striatal and cortico-thalamic tracts
(Table 4.10 and Table 4.11; Figure 4.4 and Figure 4.5 E-F respectively) despite the
number of participants being fewer.
Table 4.10 Cortico-striatal FDC TrackOn-HD multi-shell
Cortico-striatal Tract
Control Mean PreHD Mean SE p FDR
L Limbic 0.39 0.38 0.001 0.008 0.01
R Limbic 0.41 0.40 0.001 0.005 0.01
L Cognitive 0.43 0.42 0.001 0.02 0.02
R Cognitive 0.43 0.42 0.001 0.002 0.01
L Rostral Motor 0.50 0.50 0.001 0.04 0.05
R Rostral Motor 0.51 0.51 0.001 0.19 0.19
L Caudal Motor 0.59 0.55 0.001 0.002 0.01
R Caudal Motor 0.60 0.58 0.001 0.02 0.02
L Parietal 0.58 0.56 0.001 0.005 0.01
R Parietal 0.56 0.55 0.001 0.01 0.02
L Temporal 0.41 0.40 0.001 0.01 0.10
R Temporal 0.41 0.40 0.001 0.04 0.05
L Occipital 0.58 0.57 0.001 0.008 0.01
R Occipital 0.59 0.56 0.001 0.006 0.01
Unadjusted means displayed. SE = standard error.
Table 4.11 Cortico-thalamic FDC TrackOn-HD multi-shell
Cortico-thalamic Tract
Control Mean
PreHD Mean
SE p FDR
L Prefrontal 0.49 0.47 0.001 0.001 0.01
R Prefrontal 0.54 0.52 0.001 0.006 0.01
L Premotor 0.58 0.54 0.001 3.0 x 10⁻⁴ 0.01

151
R Premotor 0.56 0.54 0.001 0.04 0.05
L Primary Motor 0.49 0.47 0.001 0.01 0.02
R Primary Motor 0.45 0.43 0.001 0.02 0.03
L Sensory 0.46 0.45 0.001 0.06 0.07
R Sensory 0.44 0.42 0.001 0.007 0.01
L Parietal 0.50 0.48 0.001 0.006 0.01
R Parietal 0.52 0.49 0.001 0.001 0.01
L Temporal 0.52 0.51 0.001 0.02 0.02
R Temporal 0.53 0.50 0.001 0.002 0.01
L Occipital 0.50 0.48 0.001 0.04 0.05
R Occipital 0.44 0.41 0.001 0.001 0.01
Unadjusted means displayed. SE = standard error.

152
Figure 4.4. Cortico-striatal tract fibre density and cross-section left and right in HD-YAS (A+B), TrackOn-HD single-shell (B+C) and multi-shell (E+F) datasets. FDC = Fibre density and cross-section. Cortico-striatal tracts are displayed on the x-axis. Lim = Limbic, Cog = Cognitive, Rmot = Rostral motor, Cmot = Caudal motor, Par = Parietal, Temp = Temporal, Occ = Occipital. * FDR= < 0.05.

153
Figure 4.5. Cortico-thalamic tract fibre density and cross-section left and right in HD-YAS (A+B), TrackOn-HD single-shell (C+D) and multi-shell (E+F) datasets. FDC = Fibre density and cross-section. Cortico-thalamic tracts are displayed on the x-axis. Pfront = Prefrontal, Premot = Premotor, Primot = Primary motor, Sens = Sensory, Par = Parietal, Temp = Temporal, Occ = Occipital. * FDR = < 0.05.
4.4.4 Reductions in FDC correlate with a priori clinical measures
The next step of analysis assessed whether TrackOn-HD baseline FDC changes
were associated with relevant clinical measures in preHD. There were significant
positive correlations between limbic cortico-striatal FDC and apathy (left r=0.25,
p=0.03, right r=0.34, p=0.004). Reductions in caudal motor-striatal FDC correlated

154
with increasing motor signs (left r=-0.21, p=0.08, right r=-0.22, p=0.07) after
adjustment for age, sex and site. There were also correlations between increasing
motor scores and reductions in premotor thalamic FDC (left r=- 0.23, p=0.06, right r
=-0.22, p=0.07) and primary motor-thalamic FDC (left r=-0.20, p=0.10, right r=-0.30,
p=0.01). Neither apathy or TMS showed notable correlations with DBS (r=-0.05,
p=0.67 and r = 0.04, p=0.75).
Table 4.12 Correlations between a priori cortico-striatal and cortico-thalamic
FDC and corresponding clinical task
Correlation Track – Clinical measure r p
L Limbic - apathy 0.25 0.03
R Limbic - apathy 0.34 0.004
L Caudal Motor – TMS -0.21 0.08
R Caudal Motor – TMS -0.22 0.07
L Premotor - TMS -0.23 0.06
R Premotor - TMS -0.22 0.07
L Primary Motor - TMS -0.20 0.10
R Primary Motor - TMS -0.30 0.01
DBS – apathy -0.05 0.67
DBS – TMS 0.04 0.75
Correlations were performed using partial correlations with age, gender, and site as covariates.
Apathy scores were from the Baltimore apathy/irritability scale. Caudal motor and limbic are
cortico-striatal tracts. Premotor and primary motor are cortico-thalamic tracts.
4.4.5 Changes in FD and FC when analysed separately
For the primary analysis, only changes in FDC are reported since this provides a
single measure incorporating changes in FD and FC to enable comparisons across
the range of tracts investigated whilst limiting the extent of multiple comparisons.
However to understand their relative contributions to the FDC results observed,
changes in FD and FC were also analysed separately (Tables 4.13 - 4.18). As per
the primary analysis, there were no significant differences in FD or FC in gene carriers
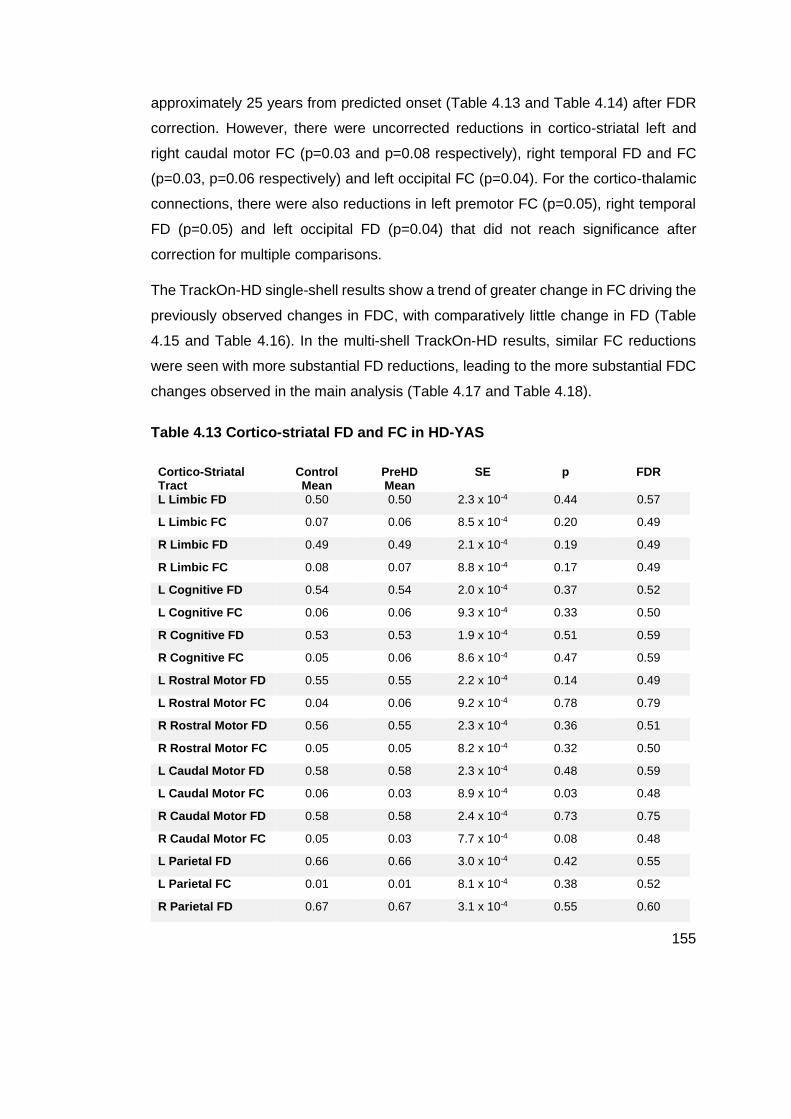
155
approximately 25 years from predicted onset (Table 4.13 and Table 4.14) after FDR
correction. However, there were uncorrected reductions in cortico-striatal left and
right caudal motor FC (p=0.03 and p=0.08 respectively), right temporal FD and FC
(p=0.03, p=0.06 respectively) and left occipital FC (p=0.04). For the cortico-thalamic
connections, there were also reductions in left premotor FC (p=0.05), right temporal
FD (p=0.05) and left occipital FD (p=0.04) that did not reach significance after
correction for multiple comparisons.
The TrackOn-HD single-shell results show a trend of greater change in FC driving the
previously observed changes in FDC, with comparatively little change in FD (Table
4.15 and Table 4.16). In the multi-shell TrackOn-HD results, similar FC reductions
were seen with more substantial FD reductions, leading to the more substantial FDC
changes observed in the main analysis (Table 4.17 and Table 4.18).
Table 4.13 Cortico-striatal FD and FC in HD-YAS
Cortico-Striatal Tract
Control Mean
PreHD Mean
SE p FDR
L Limbic FD 0.50 0.50 2.3 x 10⁻⁴ 0.44 0.57
L Limbic FC 0.07 0.06 8.5 x 10⁻⁴ 0.20 0.49
R Limbic FD 0.49 0.49 2.1 x 10⁻⁴ 0.19 0.49
R Limbic FC 0.08 0.07 8.8 x 10⁻⁴ 0.17 0.49
L Cognitive FD 0.54 0.54 2.0 x 10⁻⁴ 0.37 0.52
L Cognitive FC 0.06 0.06 9.3 x 10⁻⁴ 0.33 0.50
R Cognitive FD 0.53 0.53 1.9 x 10⁻⁴ 0.51 0.59
R Cognitive FC 0.05 0.06 8.6 x 10⁻⁴ 0.47 0.59
L Rostral Motor FD 0.55 0.55 2.2 x 10⁻⁴ 0.14 0.49
L Rostral Motor FC 0.04 0.06 9.2 x 10⁻⁴ 0.78 0.79
R Rostral Motor FD 0.56 0.55 2.3 x 10⁻⁴ 0.36 0.51
R Rostral Motor FC 0.05 0.05 8.2 x 10⁻⁴ 0.32 0.50
L Caudal Motor FD 0.58 0.58 2.3 x 10⁻⁴ 0.48 0.59
L Caudal Motor FC 0.06 0.03 8.9 x 10⁻⁴ 0.03 0.48
R Caudal Motor FD 0.58 0.58 2.4 x 10⁻⁴ 0.73 0.75
R Caudal Motor FC 0.05 0.03 7.7 x 10⁻⁴ 0.08 0.48
L Parietal FD 0.66 0.66 3.0 x 10⁻⁴ 0.42 0.55
L Parietal FC 0.01 0.01 8.1 x 10⁻⁴ 0.38 0.52
R Parietal FD 0.67 0.67 3.1 x 10⁻⁴ 0.55 0.60

156
R Parietal FC 0.01 0.01 8.1 x 10⁻⁴ 0.28 0.50
L Temporal FD 0.56 0.56 2.4 x 10⁻⁴ 0.63 0.67
L Temporal FC 0.05 0.04 7.5 x 10⁻⁴ 0.10 0.48
R Temporal FD 0.59 0.58 2.7 x 10⁻⁴ 0.03 0.48
R Temporal FC 0.07 0.05 7.0 x 10⁻⁴ 0.06 0.48
L Occipital FD 0.65 0.65 2.2 x 10⁻⁴ 0.57 0.63
L Occipital FC 0.11 0.09 7.1 x 10⁻⁴ 0.04 0.48
R Occipital FD 0.65 0.65 2.3 x 10⁻⁴ 0.32 0.50
R Occipital FC 0.08 0.07 6.7 x 10⁻⁴ 0.21 0.49
Unadjusted means displayed. SE = standard error.
Table 4.14 Cortico-thalamic FD and FC in HD-YAS
Cortico-thalamic Tract
Control Mean
PreHD Mean
SE p FDR
L Prefrontal FD 0.59 0.59 2.2 x 10⁻⁴ 0.17 0.49
L Prefrontal FC 0.02 0.01 7.9 x 10⁻⁴ 0.25 0.50
R Prefrontal FD 0.6 0.6 2.3 x 10⁻⁴ 0.28 0.50
R Prefrontal FC 0.02 0.02 7.6 x 10⁻⁴ 0.38 0.52
L Premotor FD 0.62 0.62 2.5 x 10⁻⁴ 0.53 0.60
L Premotor FC 0.04 0.02 8.2 x 10⁻⁴ 0.05 0.48
R Premotor FD 0.6 0.61 2.5 x 10⁻⁴ 0.81 0.81
R Premotor FC 0.03 0.03 7.8 x 10⁻⁴ 0.19 0.49
L Primary Motor FD
0.59 0.6 2.6 x 10⁻⁴ 0.62 0.66
L Primary Motor FC
0.02 0.02 7.9 x 10⁻⁴ 0.27 0.50
R Primary Motor FD
0.58 0.58 2.7 x 10⁻⁴ 0.69 0.72
R Primary Motor FC
0.02 0.02 8.5 x 10⁻⁴ 0.26 0.50
L Sensory FD 0.61 0.61 3.0 x 10⁻⁴ 0.51 0.59
L Sensory FC 0.02 0.02 8.3 x 10⁻⁴ 0.49 0.59
R Sensory FD 0.56 0.56 3.2 x 10⁻⁴ 0.46 0.59
R Sensory FC 0.03 0.03 9.0 x 10⁻⁴ 0.26 0.50
L Parietal FD 0.64 0.64 2.5 x 10⁻⁴ 0.21 0.49
L Parietal FC 0.06 0.05 7.2 x 10⁻⁴ 0.15 0.49
R Parietal FD 0.62 0.61 2.6 x 10⁻⁴ 0.12 0.49
R Parietal FC 0.03 0.04 6.6 x 10⁻⁴ 0.36 0.51

157
L Temporal FD 0.51 0.5 3.0 x 10⁻⁴ 0.42 0.55
L Temporal FC 0.01 3.0 x 10⁻⁴ 8.3 x 10⁻⁴ 0.10 0.48
R Temporal FD 0.51 0.49 3.4 x 10⁻⁴ 0.05 0.48
R Temporal FC 0.001 0.007 8.0 x 10⁻⁴ 0.55 0.60
L Occipital FD 0.47 0.46 1.4 x 10⁻⁴ 0.04 0.48
L Occipital FC 0.08 0.08 7.2 x 10⁻⁴ 0.23 0.50
R Occipital FD 0.51 0.5 1.6 x 10⁻⁴ 0.10 0.48
R Occipital FC 0.07 0.07 7.2 x 10⁻⁴ 0.32 0.50
Unadjusted means displayed. SE = standard error.
Table 4.15 Cortico-striatal FD and FC in TrackOn-HD single-shell baseline
Cortico-Striatal Tract
Control Mean
PreHD Mean
γ SE p FDR
L Limbic FD 0.38 0.38 -0.005 0.004 0.28 0.39
L Limbic FC 0.09 0.06 -0.06 0.01 1.2 x 10⁻⁷ 1.6 x 10⁻⁵
R Limbic FD 0.36 0.36 1.7 x 10⁻⁴ 0.005 0.97 0.97
R Limbic FC 0.10 0.07 -0.06 0.01 4.9 x 10⁻⁷ 6.9 x10⁻⁶
L Cognitive FD 0.40 0.41 -0.001 0.003 0.79 0.79
L Cognitive FC 0.03 0.03 -0.03 0.01 0.01 0.02
R Cognitive FD 0.40 0.41 0.003 0.003 0.35 0.46
R Cognitive FC 0.03 0.02 -0.03 0.01 0.006 0.01
L Rostral Motor FD 0.46 0.46 0.003 0.004 0.37 0.44
L Rostral Motor FC 0.07 0.07 -0.03 0.01 0.02 0.04
R Rostral Motor FD 0.47 0.47 0.002 0.003 0.59 0.63
R Rostral Motor FC 0.10 0.08 -0.04 0.01 0.001 0.003
L Caudal Motor FD 0.50 0.50 -0.003 0.004 0.37 0.44
L Caudal Motor FC 0.09 0.06 -0.04 0.01 8.9 x 10⁻⁵ 6.3 x 10⁻⁴
R Caudal Motor FD 0.51 0.50 -0.003 0.004 0.39 0.46
R Caudal Motor FC 0.09 0.06 -0.04 0.01 0.001 0.003
L Parietal FD 0.53 0.53 -0.002 0.004 0.67 0.73
L Parietal FC 0.04 0.03 -0.03 0.01 0.008 0.02
R Parietal FD 0.54 0.53 -0.004 0.004 0.40 0.46
R Parietal FC 0.05 0.05 -0.02 0.01 0.10 0.18
L Temporal FD 0.40 0.41 0.01 0.004 3.9 x 10⁻⁴ 0.001
L Temporal FC 0.01 -0.01 -0.04 0.01 1.3x10⁻⁴ 6.5 x 10⁻⁴
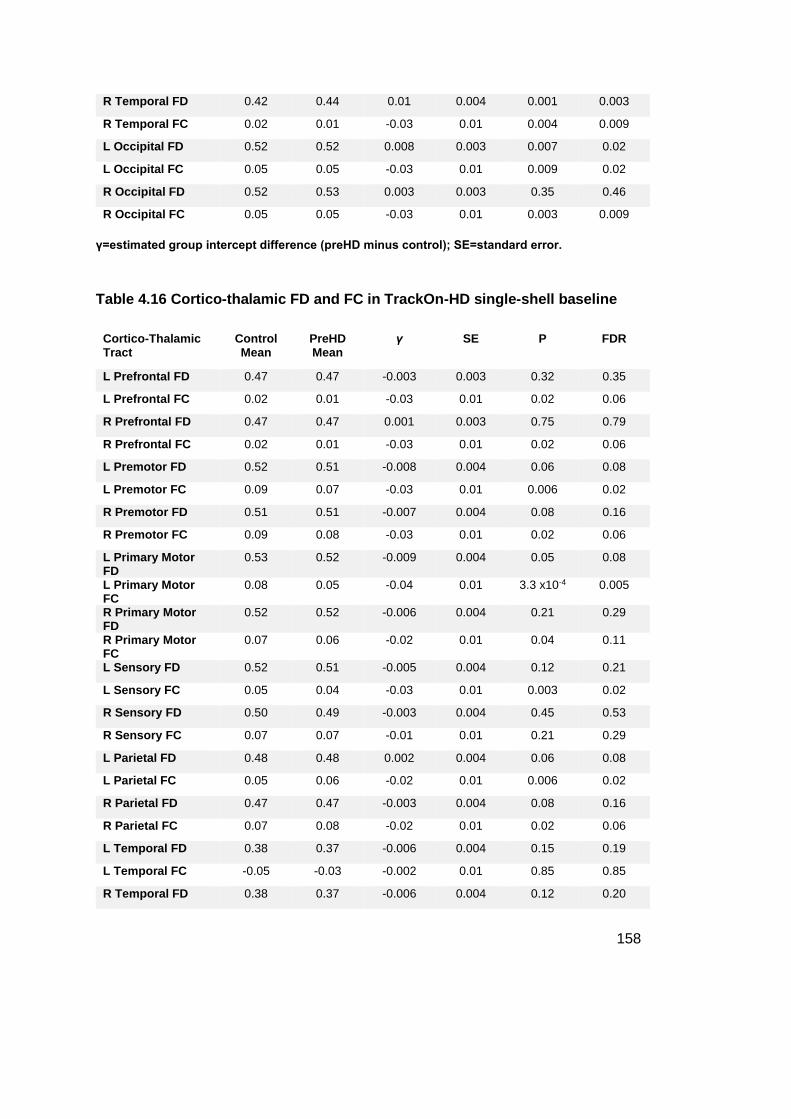
158
R Temporal FD 0.42 0.44 0.01 0.004 0.001 0.003
R Temporal FC 0.02 0.01 -0.03 0.01 0.004 0.009
L Occipital FD 0.52 0.52 0.008 0.003 0.007 0.02
L Occipital FC 0.05 0.05 -0.03 0.01 0.009 0.02
R Occipital FD 0.52 0.53 0.003 0.003 0.35 0.46
R Occipital FC 0.05 0.05 -0.03 0.01 0.003 0.009
γ=estimated group intercept difference (preHD minus control); SE=standard error.
Table 4.16 Cortico-thalamic FD and FC in TrackOn-HD single-shell baseline
Cortico-Thalamic Tract
Control Mean
PreHD Mean
γ SE P FDR
L Prefrontal FD 0.47 0.47 -0.003 0.003 0.32 0.35
L Prefrontal FC 0.02 0.01 -0.03 0.01 0.02 0.06
R Prefrontal FD 0.47 0.47 0.001 0.003 0.75 0.79
R Prefrontal FC 0.02 0.01 -0.03 0.01 0.02 0.06
L Premotor FD 0.52 0.51 -0.008 0.004 0.06 0.08
L Premotor FC 0.09 0.07 -0.03 0.01 0.006 0.02
R Premotor FD 0.51 0.51 -0.007 0.004 0.08 0.16
R Premotor FC 0.09 0.08 -0.03 0.01 0.02 0.06
L Primary Motor FD
0.53 0.52 -0.009 0.004 0.05 0.08
L Primary Motor FC
0.08 0.05 -0.04 0.01 3.3 x10⁻⁴ 0.005
R Primary Motor FD
0.52 0.52 -0.006 0.004 0.21 0.29
R Primary Motor FC
0.07 0.06 -0.02 0.01 0.04 0.11
L Sensory FD 0.52 0.51 -0.005 0.004 0.12 0.21
L Sensory FC 0.05 0.04 -0.03 0.01 0.003 0.02
R Sensory FD 0.50 0.49 -0.003 0.004 0.45 0.53
R Sensory FC 0.07 0.07 -0.01 0.01 0.21 0.29
L Parietal FD 0.48 0.48 0.002 0.004 0.06 0.08
L Parietal FC 0.05 0.06 -0.02 0.01 0.006 0.02
R Parietal FD 0.47 0.47 -0.003 0.004 0.08 0.16
R Parietal FC 0.07 0.08 -0.02 0.01 0.02 0.06
L Temporal FD 0.38 0.37 -0.006 0.004 0.15 0.19
L Temporal FC -0.05 -0.03 -0.002 0.01 0.85 0.85
R Temporal FD 0.38 0.37 -0.006 0.004 0.12 0.20

159
R Temporal FC -0.04 -0.03 -0.008 0.01 0.45 0.53
L Occipital FD 0.47 0.48 0.007 0.003 0.03 0.08
L Occipital FC 0.09 0.10 -0.02 0.01 0.05 0.08
R Occipital FD 0.48 0.48 0.001 0.004 0.79 0.79
R Occipital FC 0.12 0.11 -0.03 0.01 0.01 0.06
Unadjusted means displayed. γ=estimated group intercept difference (preHD minus control);
SE=standard error.
Table 4.17 Cortico-striatal FD and FC in TrackOn-HD multi-shell
Cortico-Striatal Tract
Control Mean
PreHD Mean
SE p FDR
L Limbic FD 0.36 0.36 4.1 x 10⁻⁴ 0.05 0.08
L Limbic FC 0.06 0.05 0.001 0.01 0.03
R Limbic FD 0.38 0.37 3.4 x 10⁻⁴ 0.10 0.13
R Limbic FC 0.06 0.05 0.001 0.005 0.02
L Cognitive FD 0.41 0.41 3.12 x 10⁻⁴ 0.11 0.14
L Cognitive FC 0.02 0.01 0.001 0.01 0.02
R Cognitive FD 0.42 0.42 3.9 x 10⁻⁴ 0.30 0.31
R Cognitive FC 0.03 -0.007 0.001 9.0 x 10⁻⁴ 0.01
L Rostral Motor FD 0.49 0.48 3.2 x 10⁻⁴ 0.07 0.10
L Rostral Motor FC 0.02 0.01 0.001 0.08 0.11
R Rostral Motor FD 0.49 0.49 3.2 x 10⁻⁴ 0.28 0.29
R Rostral Motor FC 0.03 0.03 0.001 0.19 0.22
L Caudal Motor FD 0.56 0.54 4.6 x 10⁻⁴ 0.10 0.12
L Caudal Motor FC 0.04 1.6 0.001 0.01 0.03
R Caudal Motor FD 0.58 0.57 4.6 x 10⁻⁴ 0.03 0.05
R Caudal Motor FC 0.02 0.01 0.001 0.16 0.20
L Parietal FD 0.58 0.57 4.2 x 10⁻⁴ 0.07 0.10
L Parietal FC -0.009 -0.02 0.001 0.02 0.04
R Parietal FD 0.556 0.55 4.4 x 10⁻⁴ 0.06 0.09
R Parietal FC -0.001 -0.001 0.001 0.08 0.10
L Temporal FD 0.36 0.36 3.9 x 10⁻⁴ 0.27 0.28
L Temporal FC 0.1 0.09 0.001 0.03 0.06
R Temporal FD 0.37 0.37 3.6 x 10⁻⁴ 0.44 0.44
R Temporal FC 0.09 0.07 0.001 0.01 0.02
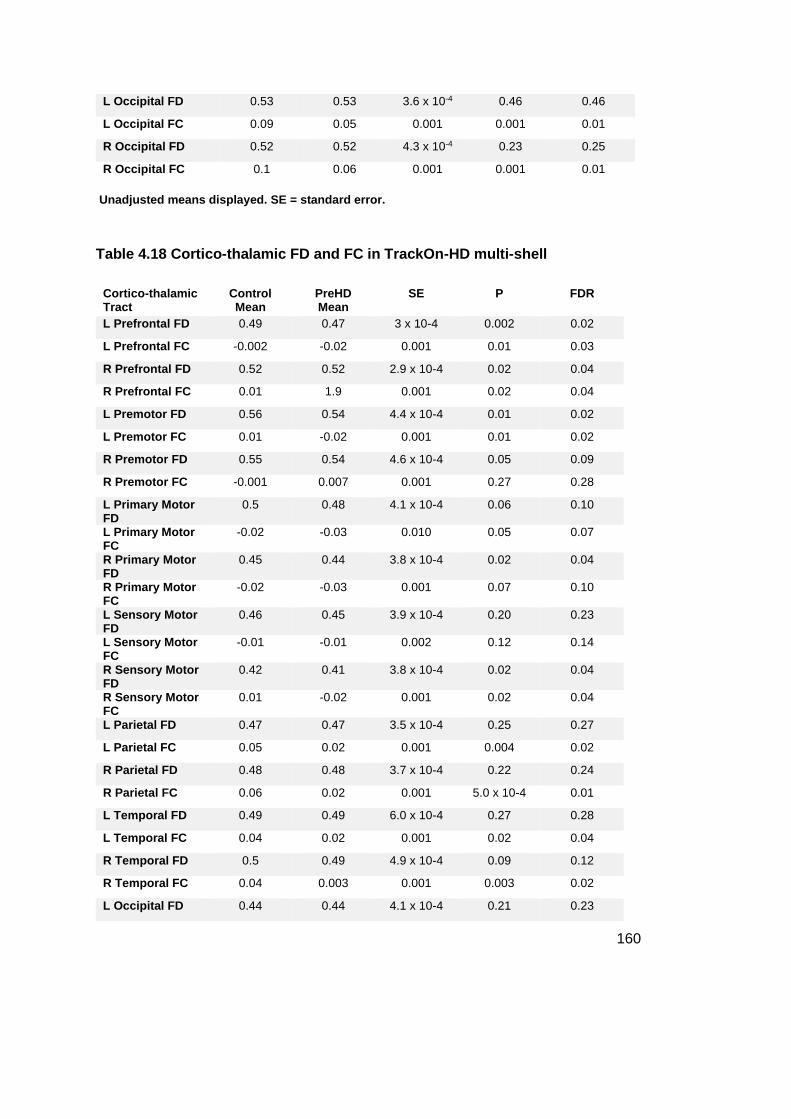
160
L Occipital FD 0.53 0.53 3.6 x 10⁻⁴ 0.46 0.46
L Occipital FC 0.09 0.05 0.001 0.001 0.01
R Occipital FD 0.52 0.52 4.3 x 10⁻⁴ 0.23 0.25
R Occipital FC 0.1 0.06 0.001 0.001 0.01
Unadjusted means displayed. SE = standard error.
Table 4.18 Cortico-thalamic FD and FC in TrackOn-HD multi-shell
Cortico-thalamic Tract
Control Mean
PreHD Mean
SE P FDR
L Prefrontal FD 0.49 0.47 3 x 10⁻⁴ 0.002 0.02
L Prefrontal FC -0.002 -0.02 0.001 0.01 0.03
R Prefrontal FD 0.52 0.52 2.9 x 10⁻⁴ 0.02 0.04
R Prefrontal FC 0.01 1.9 0.001 0.02 0.04
L Premotor FD 0.56 0.54 4.4 x 10⁻⁴ 0.01 0.02
L Premotor FC 0.01 -0.02 0.001 0.01 0.02
R Premotor FD 0.55 0.54 4.6 x 10⁻⁴ 0.05 0.09
R Premotor FC -0.001 0.007 0.001 0.27 0.28
L Primary Motor FD
0.5 0.48 4.1 x 10⁻⁴ 0.06 0.10
L Primary Motor FC
-0.02 -0.03 0.010 0.05 0.07
R Primary Motor FD
0.45 0.44 3.8 x 10⁻⁴ 0.02 0.04
R Primary Motor FC
-0.02 -0.03 0.001 0.07 0.10
L Sensory Motor FD
0.46 0.45 3.9 x 10⁻⁴ 0.20 0.23
L Sensory Motor FC
-0.01 -0.01 0.002 0.12 0.14
R Sensory Motor FD
0.42 0.41 3.8 x 10⁻⁴ 0.02 0.04
R Sensory Motor FC
0.01 -0.02 0.001 0.02 0.04
L Parietal FD 0.47 0.47 3.5 x 10⁻⁴ 0.25 0.27
L Parietal FC 0.05 0.02 0.001 0.004 0.02
R Parietal FD 0.48 0.48 3.7 x 10⁻⁴ 0.22 0.24
R Parietal FC 0.06 0.02 0.001 5.0 x 10⁻⁴ 0.01
L Temporal FD 0.49 0.49 6.0 x 10⁻⁴ 0.27 0.28
L Temporal FC 0.04 0.02 0.001 0.02 0.04
R Temporal FD 0.5 0.49 4.9 x 10⁻⁴ 0.09 0.12
R Temporal FC 0.04 0.003 0.001 0.003 0.02
L Occipital FD 0.44 0.44 4.1 x 10⁻⁴ 0.21 0.23

161
L Occipital FC 0.11 0.09 0.001 0.004 0.02
R Occipital FD 0.37 0.36 3.1 x 10⁻⁴ 0.09 0.12
R Occipital FC 0.16 0.12 0.001 2.00 0.01
Unadjusted means displayed. SE = standard error.
4.5 Discussion
By studying two unique cohorts, these results provide insight into the timing and
anatomical specificity of basal ganglia white matter loss in preHD. As summarised in
Figure 4.6, cortico-striatal and cortico-thalamic white matter connections appear
structurally preserved in preHD 25 years from clinical onset. However, in preHD
closer to clinical onset, specific cortico-striatal and cortico-thalamic tracts appear
more vulnerable than others to early degeneration.

162
Figure 4.6 Overview of study methodology and key cross-sectional results.
For each study, scans were registered to a common template. Connectivity-based atlases of the striatum and thalamus were registered to the group template. Diffusion tractography was performed on the group template to reconstruct each of the cortico-thalamic and cortico-striatal tracts in right and left hemispheres. Measures of FDC were then computed for each tract. In gene carriers 25 years from

163
predicted onset, there were no differences in any cortico-striatal or cortico-thalamic tract. In gene carriers 11 years from predicted onset, reductions in FDC were seen in limbic and caudal motor cortico-striatal tracts and premotor, primary motor and sensory cortico-thalamic tracts cross-sectionally. There were no significant longitudinal changes in gene carriers 11 years from predicted onset. GC = Gene Carriers, FDC = Fibre density and cross-section. No evidence of neurodevelopmental differences in the integrity of white matter connections
Recent evidence has suggested that the HD mutation may lead to abnormalities in
striatal and cortical development (Molina-Calavita et al. 2014; van der Plas et al. 2019;
Barnat et al. 2020). One of the functions attributed to HTT is the promotion of striatal
cell survival by ensuring the anterograde delivery of the pro-survival factor BDNF to
cortico-striatal synapses, since the striatum is unable to produce BDNF independently
(Saudou and Humbert 2016). Evidence for abnormal cortical development as a result
of mHTT expression has stemmed from animal work, with Molina-Calvita et al.
reporting defects in cortical progenitor cell division and development of the mouse
neocortex (Molina-Calavita et al. 2014). More recently, cortical cellular abnormalities
in neural progenitor cell differentiation, mitosis and cell cycle progression were
reported using tissue from human foetuses that carry the HD mutation at 13 weeks
gestation (Barnat et al. 2020). Evidence of abnormal striatal development also has
come from the Kids-HD study which recruited at risk participants < 18 years of age
and subsequently performed research genotyping to study differences in preHD and
gene negative participants. In the initial analysis, gene carriers were reported to show
striatal hypertrophy up to 14 years of age, followed by more rapid atrophy in the older
preHD participants (van der Plas et al. 2019). However, the study included children
with CAG repeats up to 59 which is in the juvenile HD range, limiting the
interpretability of this result. In this context, the current findings suggest that there is
no detectable developmental abnormality in the microstructure of cortico-striatal and
cortico-thalamic white matter connections in preHD, consistent with results in the
previous chapter (Scahill et al. 2020). This may suggest that any of the
aforementioned neurodevelopmental effects of mHTT do not affect the microstructure
of these white matter pathways, or that diffusion imaging may lack the resolution to
detect more subtle effects. Importantly, this result also suggests that the initiation of
disease modifying therapies early in the premanifest period could potentially preserve
these important connections. Furthermore, with viral-vector based therapeutics such

164
as RNAi capable of axonal propagation (Weiss et al. 2020), this period may represent
the best time to achieve widespread distribution in the brain for such therapeutics.
4.5.1 Selective vulnerability of specific cortico-striatal connections
The results in the TrackOn-HD cohort who are closer to predicted onset suggest
certain basal ganglia subregions are more susceptible to early degeneration.
Previous literature examining the integrity of cortico-striatal connections in the
premanifest period has been conflicting, with some studies failing to detect
differences (Novak et al. 2015; Gorges et al. 2017; Gregory et al. 2018), whilst others
have reported significant differences in these tracts (McColgan et al. 2015; McColgan
et al. 2017; Shaffer et al. 2017). The likely reason for these discrepancies is differing
analysis techniques and the comparatively low sample sizes in those reporting
negative results.
The largest study to date in this area came from the PREDICT-HD cohort. Shaffer et
al. studied 191 preHD and 70 healthy controls and stratified the preHD group into 3
subgroups based on proximity to predicted onset, with the far group >13 years from
predicted onset (Shaffer et al. 2017) and the middle group most comparable to the
TrackOn-HD cohort. Tensor metrics FA, MD, AD and RD were investigated for twelve
tracts predominantly focused on sensorimotor cortical connections to both the
caudate and putamen. No differences were found in the group furthest from onset,
and only the group closest to onset displayed substantial changes across the different
tensor measures. Despite the large sample size, several limitations may have
affected the power to detect significant change in the groups further from onset. The
single control group was low in number and poorly matched for the preHD groups,
being on average over 10 years older than the far preHD group. As a large multi-site
study, there was also significant variability in DWI scanners and acquisitions across
the 33 sites, including scanner upgrades occurring over the course of the study and
a mixture of 1.5 and 3T MRI (Paulsen et al. 2014). Finally, the analysis focused largely
on sensorimotor connections and did not specifically investigate limbic connections.
Poudel et al. also investigated cortico-striatal connectivity using deterministic
tractography to generate a connectivity matrix of 40 regions that included the striatum
and thalamus (Poudel et al. 2014). They found reduced tractography streamlines in

165
a tract connecting the putamen to the prefrontal and motor cortex using NBS. Using
tensor based measures to further investigate, the only significant difference was an
increase in putamen-prefrontal RD. However, like the Shaffer et al. study, this study
did not look specifically at subregions of the striatum or thalamus and also suffers
from several methodological issues such as the false positives generated by
tractography, limitations of DTI measures and deterministic tractography.
Another limitation of previous research in investigating the selective vulnerability of
specific cortico-striatal connections is the analysis of caudate and putamen as
separate entities, when accumulating evidence demonstrates that both structures
display overlapping topographical organisation of their cortical inputs (Tziortzi et al.
2014; Haber 2016; Parkes et al. 2017). For example the ventral caudate shares a
similar connectivity profile to the ventral putamen, but a very different profile to the
dorsal-caudal caudate. Given the reported observed gradient of neuropathological
changes observed in the striatum (Vonsattel et al. 1985), it is possible that
connectivity breakdown may follow a similar topographical distribution which would
affect the caudate and putamen in a similar fashion. Therefore, the use of a
connectivity-based parcellation to reconstruct the full spectrum of cortico-striatal
connections is more directly interpretable when looking for such gradients of change
in white matter organisation.
This study expands on previous literature by providing a comprehensive analysis of
individual cortico-striatal connection networks in two different premanifest cohorts
with a mode of analysis that resolves many of the limitations of previously used
tensor-based analyses. The results of the cortico-striatal analysis indicates that
caudal motor tracts connecting the dorsal-caudal striatum to the primary motor cortex
are particularly vulnerable in early preHD, consistent with previous results (Poudel et
al. 2014; Shaffer et al. 2017). The connections to the rostral motor region, including
the supplementary motor cortex and frontal eye field regions, have not been
previously investigated in preHD. The results here show that the striatal connections
to these regions are relatively preserved, compared to the primary motor cortical
connections.
Previously, neuropathological studies have described HD neurodegeneration
progressing along a dorsal-caudal rostral-ventral gradient, though most cases already

166
had manifest disease (Roos et al. 1985; Vonsattel et al. 1985). Clinically there is
considerable psychiatric comorbidity in HD with increases in levels of depression,
anxiety, irritability and apathy reported in the premanifest period (Tabrizi et al. 2013;
Epping et al. 2016; Martinez-Horta et al. 2016). Functional neuroimaging studies have
shown disrupted striato-prefrontal connectivity in premanifest cohorts (Enzi et al.
2012; McColgan et al. 2017), however little was previously known about the structural
integrity of these connections in preHD. The current results suggest that limbic
cortico-striatal connections undergo early structural degeneration in preHD, adding
further weight to the selective vulnerability of these tracts early in the premanifest
period.
4.5.2 Selective vulnerability of cortico-thalamic connections
Whilst the striatum has long been a key target for disease-modifying therapies, the
thalamus is a major connection hub in the human brain and hence may represent a
target for RNAi injections to achieve widespread cortical and striatal coverage (Evers
et al. 2018). The thalamus and its white matter connections have been comparatively
understudied in preHD to date. Whilst neuronal loss and astrogliosis of the thalamus
has been reported in neuropathological studies (Heinsen et al. 1996; Heinsen et al.
1999; Rub et al. 2016), volumetric imaging studies have found the thalamus to be
relatively preserved in the premanifest period (Majid et al. 2011; van den Bogaard et
al. 2011). However, this may partly be explained by the difficulties in segmenting the
thalamus at lower field strengths with less clear anatomical boundaries than the
striatum.
Few studies have investigated the structural integrity of cortico-thalamic connections
in preHD. In a whole brain connectomic analysis, McColgan et al. found evidence of
a reduction in connectivity in manifest but not premanifest groups (McColgan et al.
2015). Similarly, Dumas et al. found higher apparent diffusion coefficient in white
matter connections traversing the thalamus in manifest but not premanifest HD
(Dumas et al. 2012). In a multi-modal study using DTI to investigate the sensorimotor
network in preHD far from onset, there were no differences in the FA of a connection
between the thalamus and the somatosensory cortex in 12 preHD and 22 control
participants (Gorges et al. 2017).

167
Like the striatum, the thalamus is a large subcortical structure and has an extensive
range of cortical connections that are highly organised with specific subregions being
connected to specific cortical regions (Behrens et al. 2003; Johansen-Berg et al.
2005). No study has previously investigated differences across the range of different
cortico-thalamic subnetworks in HD or preHD. By studying specific subregional
connections using advanced diffusion techniques in a relatively large cohort, the
current results suggest that thalamic connections are affected in the premanifest
period, with the premotor, primary motor and sensory connections appearing
particularly vulnerable to early degeneration. Consequently, the thalamus may also
prove to be an important therapeutic target to prevent such early neurodegeneration
and maximise cortical coverage for viral-vector based therapeutics.
4.5.3 No longitudinal changes detectable over a two year period
Using data from the TrackOn-HD cohort who had three scans over a two year time
period, there was no evidence of longitudinal changes across cortico-striatal and
cortico-thalamic tracts at this stage of disease. Previous longitudinal studies using
DTI have fared differently in detecting longitudinal changes. Using a whole brain
analysis, Poudel et al. found evidence of longitudinal change over an 18 month period
in manifest but not preHD groups (Poudel et al. 2015). Gregory et al. also found subtle
longitudinal white matter changes in early HD patients (Gregory et al. 2015).
However, longitudinal changes in cortico-striatal tracts were detected in the
premanifest PREDICT-HD cohort over a one to five year follow up period,
predominantly in the group closest to onset (Shaffer et al. 2017). In a study comparing
longitudinal effect sizes across different MRI measures in HD over a 15 month time
period, DTI metrics showed notably smaller effect sizes compared to volumetric
imaging (Hobbs et al. 2015). Collectively, these results suggest that changes in white
matter microstructure occur slowly over time in preHD and a large sample size with a
longer follow up period of >2 years would likely be required to detect such changes.

168
4.5.4 Relationships between changes in FDC and clinical
measures
To investigate the clinical significance of these findings, correlations were performed
between tracts showing changes in FDC at baseline in the TrackOn-HD cohort and
selected clinical measures.
For limbic cortico-striatal tracts, apathy scores were chosen given their known close
relationship in a number of neurological diseases (Le Heron et al. 2018). In addition,
apathy was the only neuropsychiatric measure to show significant change in the
premanifest period in Track-HD (Tabrizi et al. 2013) and cannot be modified by
pharmacological treatment to confound such comparisons. Previously, using DTI in a
small group of early HD subjects, FA in the bilateral gyrus rectus negatively correlated
with apathy score (Delmaire et al. 2013). This area contains fibres connecting the
orbitofrontal cortex and subcortical structures including the ventral striatum. The
observed correlation would be consistent with white matter tract breakdown resulting
in reduced FA and higher apathy scores in HD. However, two other studies have not
found any associations with apathy and white matter microstructure using whole brain
approaches (Gregory et al. 2015; McColgan et al. 2017). The whole brain nature of
the aforementioned studies and use of tract based spatial statistics, which
skeletonises the major white matter tracts, may limit the ability to detect significant
relationships between white matter microstructure and apathy. No study has
previously specifically investigated the association between limbic cortico-striatal tract
microstructure and apathy in HD. In the current study, there was an unexpected
significant positive correlation between limbic cortical-striatal FDC and levels of
apathy. However, apathy scores in this preHD cohort were low, with a mean score of
10/42. Furthermore, preHD scores were similar to the control group and did not
correlate with disease burden. Hence this association should be interpreted with
caution. Nevertheless, converging literature across other neurodegenerative and
cerebrovascular diseases associated with apathy has clearly demonstrated that
degeneration or injury to this white matter pathway or connecting cortical/sub-cortical
structures is associated with the emergence of apathy (Le Heron et al. 2018; Prange
et al. 2019). It is therefore likely that the observed reductions in limbic cortico-striatal

169
tract FDC does contribute to the emergence of apathy in HD later in the disease
course.
Motor symptoms have been previously associated with connectivity in the
sensorimotor striatum and associated white matter tracts in HD participants (Bohanna
et al. 2011; Dumas et al. 2012; Novak et al. 2015). In a preHD cohort using a network-
based analysis, speeded tapping was not found to correlate white matter tract
microstructure in premanifest groups (Poudel et al. 2014). A separate study
investigating cortico-thalamic connections using DTI reported correlations between
thalamic motor connections and grip force (Orth et al. 2016). In this study, reductions
in striatal caudal motor, thalamic premotor and primary motor FDC were associated
with increasing motor signs on the TMS. Although only the right primary motor-
thalamic association reached statistical significance, other associations were all close
to statistical significance. Furthermore, motor scores were generally low and not
associated with DBS, likely reflecting the variability of this measure at this stage.
Collectively, the results indicate that degeneration of these motor connections is likely
to be significant in the emergence of the diagnostic motor signs of the disease.
4.5.5 Higher b-values increase signal-to-noise in FBA
The majority of previous DWI studies in HD have utilised single-shell DTI acquisitions
with low b-values that were prevailing around the period up until around 2012.
However since then, DWI acquisitions have increasingly moved towards multi-shell
acquisitions with higher b-values that improve diffusion modelling (Zhang et al. 2012).
Indeed, in TrackOn-HD, the multi-shell acquisition was only added to the final
timepoint in 2014, reflecting the emergence of improved DWI acquisitions at that time.
There have been very few cohort studies in HD conducted since this time to
investigate the relative sensitivity of more modern DWI acquisitions to disease effects.
To investigate the influence of different acquisition parameters in this current study,
the analysis was repeated in the subset of the TrackOn-HD cohort who had additional
multi-shell diffusion MRI at the final time point with b-values of up to 2,000 s/mm².
These results replicated findings from the single-shell analyses and in addition
revealed more widespread changes in FDC, which appeared driven by greater
reductions in the FD metric. This suggests improved sensitivity to white matter

170
differences in FBA using a multi-shell acquisition with higher b-values and also further
strengthens the null result in the HD-YAS cohort which had a comparable acquisition
and a larger sample size.
The apparent improved sensitivity to HD-related changes with the multi-shell
acquisition can likely be explained by the origins of the FD measurement and its
partial dependence on the b-values of the acquisition. In FBA, the measure of FD is
derived from the amplitude of the FOD. This is based on the observation that intra-
axonal water is restricted in the radial direction and that at high b-values the extra-
axonal water signal is strongly attenuated (Raffelt et al. 2012). Therefore the total
radial DW signal is approximately proportional to the density of fibres. Since the FOD
amplitude is also approximately proportional to the radial DW signal for the
corresponding fibre orientation, it provides a relative measure of the intra-axonal
volume occupied by fibres aligned in that direction. However, simulations have
demonstrated that whilst extra-axonal water is strongly attenuated at b-values ≥ 3,000
s/mm2, with decreasing b-values there is an increasing extra-axonal component to
the FD measure (Raffelt et al. 2012). Therefore, it can be anticipated that the
sensitivity of the FD measure will decrease with falling b-values due to the increasing
influence of extra-axonal water, even though it is still expected to provide a useful
measure at b-values as low as 1,000 mm/s, as used in the TrackON-HD single shell
analysis (Raffelt et al. 2017). The improved sensitivity of FD at higher b-values
observed here is also consistent with recent findings in a study of adolescent brain
development, which demonstrated improved sensitivity of the FD measure to detect
age-related changes with increasing b-values (Genc et al. 2020). Collectively this
suggests that in future studies in HD, the use of improved diffusion acquisitions and
analysis techniques as used here may aid the early detection of white matter
pathology. Furthermore, the advent of multi-slice accelerated imaging has shortened
acquisition times for multi-shell acquisitions, removing a previous barrier to
populations that may not withstand longer acquisition times (Barth et al. 2016).
4.5.6 Other methodological considerations
This is the first application of FBA in HD. The majority of previous diffusion MRI
studies in HD have utilised the diffusion tensor model for tractogram generation and
interpretation of white matter microstructure. The diffusion tensor model has major

171
limitations in its interpretability since most white matter voxels contain contributions
from multiple fibre populations. Hence, in these regions voxel-averaged DTI
measures cannot provide reliable tractograms, are not fibre-specific and have poor
interpretability as measures of structural connectivity (Jones, Knosche et al. 2013;
Raffelt, Tournier et al. 2017; Mito, Raffelt et al. 2018). Furthermore, many previous
diffusion MRI studies in HD have used a tract-based spatial statistics approach which
skeletonises the white matter and so only analyses white matter microstructure in the
very centre of each major white matter bundle. It is also unable to study specific white
matter connections of interest, as done here. FBA accounts for crossing fibre
populations to provide more reliable tractograms and account for the differing ways
in which changes to intra-axonal volume may manifest by quantifying both a measure
of fibre density and a measure of fibre bundle cross-section. As such, it enables a
more comprehensive evaluation of white matter changes and has been successfully
applied in other disease states for more directly interpretable measures of white
matter connectivity (Vaughan, Raffelt et al. 2017; Mito, Raffelt et al. 2018; Pecheva,
Tournier et al. 2019; Zarkali, McColgan et al. 2020).
In the previous chapter using a connectomics approach, I did not find any evidence
of detectable abnormalities in cortico-striatal, cortico-cortical or cortico-thalamic
connections (Scahill et al. 2020) in the HD-YAS cohort. However, this analysis did not
fully investigate all subnetworks of the striatum and thalamus to minimise the extent
of multiple comparisons. Further, whilst useful in studying global network properties,
the connectomic approach cannot fully negate the influence of false positive
connections within the network that occur with whole brain diffusion tractography
(General Methods 2.9.6.1). Here, by focusing on the dominant cortical tract in each
subregion, informed by previous non-human primate tracer studies (McFarland and
Haber 2002; Haber 2003) and focused diffusion tractography studies in humans
(Behrens et al. 2003; Johansen-Berg et al. 2005; Tziortzi et al. 2011), the potential
issue of false positive connections is negated, and a more detailed view of striatal
and thalamic subnetworks is provided.
4.5.7 Limitations
Having discussed the benefits of FBA, it is important to recognise that reductions in
the FD measure do not necessarily fully correspond to reductions in axonal density.

172
Notably demyelination has been shown to result in increased radial diffusivity and
could therefore also lead to a reduction in the FD measure (Winklewski et al. 2018).
This is true of any diffusion model and represents a limitation of diffusion imaging, in
that it cannot provide measures that have a singular and precise biological correlate.
For example, a validation of NODDI in post-mortem spinal cords with multiple
sclerosis demonstrated that both axonal density and demyelination influence the
NODDI neurite density measure (Grussu et al. 2017). For this reason, multi-modal
imaging approaches are best placed to relate imaging changes to neurobiological
changes such as demyelination or axonal loss. Despite the lack of biological
specificity, reductions in FD whether reflecting axonal loss and/or demyelination, still
represent a meaningful pathological change indicative of neurodegeneration that will
decrease the ability of a fibre bundle’s ability to transfer information.
Direct comparisons between these two cohorts are limited by differences in MRI
acquisition, participant numbers and study design between the two cohorts that
required different statistical methodology. The findings of no significant difference
between controls and early preHD does not exclude the possibility of subtle early
changes in the latter. HD-YAS included fewer participants than TrackOn-HD cohort
owing partly to the limited number of at-risk individuals undergoing genetic testing at
an early age (also see 3.5.8) and therefore has comparatively reduced statistical
power. Indeed, HD-YAS was powered to detect striatal atrophy based on the findings
of Track-HD and it’s power to detect differences in FDC here is unknown. The finding
of widespread FDC changes in the TrackOn-HD subgroup with a similar acquisition
to HD-YAS does however demonstrate the improved signal-to-noise with a multi-shell
acquisition as used in HD-YAS compared that maximises the possibility of detecting
early changes using such techniques. Longitudinal follow up of this cohort will also be
important to further interrogate these important connections in early preHD, although
the longitudinal results here suggest an interval of several years might be required to
detect any significant changes. It is also possible that these connections, whilst
appearing structurally intact, could exhibit functional differences as could be
measured by functional MRI or neurophysiological studies, and this warrants further
investigation. Finally, whilst it is suggested that both striatal and thalamic connections
show change in this study, there is inevitably some overlap between thalamic and
striatal white matter tracts in this analysis which cannot be overcome using diffusion

173
MRI. However on inspection of all tracts in the data, such overlap is minimal and
confined to the portion close to the target cortical region. Nevertheless at these
cortical convergence points, it is not possible to separate the striatal from thalamic
connections and so the possibility that the observed thalamic changes may be partly
influenced by striatal changes or vice versa cannot be excluded.
4.5.8 Conclusion
These findings suggest that cortico-striatal and cortico-thalamic white matter
connections remain intact in HD gene-carriers approximately 25 years prior to
predicted onset and that these connections have begun to degenerate by 11 years
from predicted onset. Connections to limbic and motor cortices appear particularly
vulnerable in the early disease course. This indicates that initiation of disease
modifying therapies in the early premanifest period could protect such structural
connections from undergoing neurodegeneration and highlights selectively
vulnerable subregions of the striatum and thalamus that may be important targets for
future therapies.

174
5 Relationships between structural and functional
connectivity in gene carriers far from onset
Reflecting on the results of the previous two chapters, it appears that cortico-basal
ganglia connections, rich club cortical connections and whole brain network structure
are preserved at this early stage of preHD. However, it is also apparent that this
preHD cohort have detectable rises in the axonal marker neurofilament light,
particularly in those closer to onset suggestive of early axonal injury or loss. With this
in mind, I next sought to evaluate whether these gene carriers displayed any
differences in whole brain functional and structural connectivity at this early stage,
and to evaluate the relationship between connectivity and NfL in this cohort.

175
5.1 Introduction
The topographical structure of the cerebral cortex and its connections provides an
organising principle that, coupled with regional gene expression, shapes functional
connectivity (van den Heuvel and Sporns 2013; Suárez et al. 2020). Advances in the
field of human connectomics have revealed multiple largescale networks that each
demonstrate distinct functional profiles (Suárez et al. 2020). Some of these functional
profiles help serve core functions such as movement or sensation, whilst some
networks are less well-understood such as the default mode network. Whilst studying
structural and functional connectivity has provided insights into the basis of
neurological function, understanding when and how early neurodegeneration affects
structural and functional connectivity of the brain may also help piece together the
sequence of events that lead to the emergence of early clinical symptoms for
diseases like HD and further inform decisions on when to initiate treatments.
So far in this thesis, I have closely examined the integrity of white matter connections
in the premanifest period of HD and its associations with the clinical features of the
disease. In studying data from the HD-YAS cohort, I have found no evidence of
alterations in the structural integrity of cortico-basal ganglia connections, rich club
connectivity or integration and segregation of the network, in gene carriers
approximately 24 years from predicted onset. However, I have not yet examined
whole brain structural connectivity in this cohort. A potential limitation of this approach
is the vast number of multiple comparisons that can be required. For example,
assessing connections strength for each pair of connections across an 80 region brain
parcellation would require 6,400 separate tests. However cluster-based thresholding
approaches such as NBS (General Methods 2.9.6.2) can be used to gain statistical
power when performing mass univariate testing to isolate network connections that
are altered by disease in the connectivity matrix. This approach has been previously
used to provide important insights in structural connectivity breakdown in preHD
(Poudel et al. 2014; McColgan et al. 2015; McColgan et al. 2017). Furthermore, I have
not yet examined functional connectivity in this early premanifest cohort, where
resting state fMRI data is available for most subjects.
176
Resting state fMRI has been increasingly used to examine functional networks in
preHD to understand how functional connectivity changes in response to increasing
HD pathology. Some studies have used seed-based approaches to investigate
specific networks of interest in HD, with some inconsistent results across studies. For
example, reduced connectivity between the posterior cingulate, a region of the default
mode network, and ventromedial and dorsomedial prefrontal cortices has been
reported, with the former correlating with Stroop test performance (Quarantelli et al.
2013). However another study found network-wide increased connectivity when using
the posterior cingulate cortex and supplementary motor area as seed regions
(Sánchez-Castañeda et al. 2017). The findings from such seed-based approaches
are difficult to directly compare however, since connectivity findings likely vary by
seed location.
Given some of the inconsistent findings in terms of resting state changes using seed-
based approaches, a data driven approach that interrogates all networks may provide
a more standardised way of trying to understand functional changes in HD. However,
similar to the network focused seed-based studies, there is mixed evidence in HD
cohorts, who demonstrate both increases and decreases in functional connectivity
across a series of networks, and sometimes with conflicting clinical correlations
(Gregory and Scahill 2018). Examples of reduced connectivity have been reported in
visual networks correlating with SDMT performance and DBS (Wolf et al. 2014), in
the default mode network correlating with worsening cognitive function (Dumas et al.
2013) and in the sensorimotor network correlating with increasing motor signs
(Poudel et al. 2014). However, the same studies have also detected increases in
functional connectivity including in frontoparietal (Poudel et al. 2014) and left anterior
prefrontal cortex (Wolf et al. 2014). Increased connectivity in motor and parietal
cortices has also been correlated with motor impairment, whilst increased striatal,
frontal, thalamic and insular connectivity correlated with worsening function on the
TFC scale (Werner et al. 2014).
Several studies have previously reported altered functional connectivity in the
premanifest period (Dumas et al. 2013; Harrington et al. 2015; Poudel et al. 2015;
Espinoza et al. 2018). Again however, findings have varied across studies likely due
to the varied cohorts and methods used. Reduced connectivity in motor and

177
subcortical networks has been reported in preHD (Poudel et al. 2015; Espinoza et al.
2018) which associated with increasing CAG length and worsening motor
performance. However, Espinoza et al. also found increased fronto-occipital
connectivity with increasing CAG (Espinoza et al. 2018). Using a connectomic
approach in the PREDICT-HD cohort, Harrington et al. found patterns of decreased
frontostriatal connectivity and strengthened frontal-posterior connectivity as disease
burden increased (Harrington et al. 2015). However the increases in functional
connectivity were only observed in the group closest to predicted onset whilst
decreased connectivity was found in the mid and near groups, but not the group
furthest from predicted onset. Longitudinal studies assessing functional connectivity
can also help to unravel how functional connectivity changes with disease
progression, although two such studies to date in preHD have both failed to find
longitudinal changes over a 2-3 year time period in preHD (Odish et al. 2015; Gargouri
et al. 2016). It therefore remains unclear how early changes in functional connectivity
can be detected in preHD, and whether increases in functional connectivity precede
decreases or vice versa.
The basis of disrupted functional connectivity in preHD is not fully understood.
Reductions in functional connectivity may occur as a result of neuroaxonal loss
between regions. Increases in functional connectivity may be attributable to
neuroaxonal loss within that network and subsequent upregulation of the remaining
connections as they work harder to support normal functions. Conversely, the
upregulation may be taking place in regions unaffected by early pathology that are
compensating for early neurodegenerative effects in another network (Kloppel et al.
2015; Gregory et al. 2017). Hence, studying the relationship between structural and
functional connectivity may provide further insights by characterising how disrupted
functional connectivity relates to underlying structural connectivity. Few studies have
previously characterised the relationship between structural and functional
connectivity in HD. In one previous study of the TrackOn-HD cohort, brain areas with
strong structural connectivity were found to show decreases in functional connectivity
and vice versa (McColgan et al. 2017). In addition, increased functional upregulation
was observed in anterior regions, whilst decreased functional connections were
observed in posterior regions. These findings are in keeping with the vulnerability of
rich club regions (McColgan et al. 2015) and posterior white matter atrophy in early

178
preHD (Tabrizi et al. 2009; McColgan et al. 2017) and suggests that the earliest
connectivity changes may be increased functional connectivity in regions that are
relatively spared by early disease effects.
Previous studies in preHD have sought to contextualise changes in functional
connectivity to disease burden by studying associations with CAG repeat length
(Espinoza et al. 2018), or models estimating proximity to onset (Harrington et al.
2015). However, these are indirect proxy measures of true disease burden and hence
may be limited in this sense. As previously discussed in this thesis, NfL has emerged
as a sensitive marker of HD progression and is directly related to axonal integrity. It
is therefore likely to be a more relevant and sensitive marker of disease progression
when investigating structural and functional connectivity in HD. In the primary analysis
of HD-YAS, despite reporting largely intact brain structure and function, NfL was
increased in the blood and CSF of gene carriers (Scahill et al. 2020), with CSF
concentrations showing greater sensitivity and specificity over plasma NfL. CSF NfL
concentrations were strongly associated with age-CAG and approximately half the
preHD cohort had CSF NfL concentrations above the 95th percentile of controls. It is
therefore of interest to understand if and how structural and functional connectivity is
affected as NfL begins to rise in preHD.
I therefore hypothesised that in early preHD, increases in functional connectivity may
be detectable in the context of normal or reduced structural connectivity and that this
is related to increasing concentrations of NfL. To test this hypothesis, corresponding
functional and structural networks were constructed to examine both functional and
structural connectivity. Associations between structural and functional connectivity
and NfL were then examined.
5.2 Contributions and collaborators
The study design and execution was performed in collaboration with Sarah Gregory
and Peter McColgan. Data came from the HD-YAS cohort and recruitment and data
collection for this cohort was described in Chapter 3. I performed the processing and
analysis for the structural connectivity component of the study. Sarah Gregory
performed data collection and fMRI processing. Peter McColgan analysed the fMRI
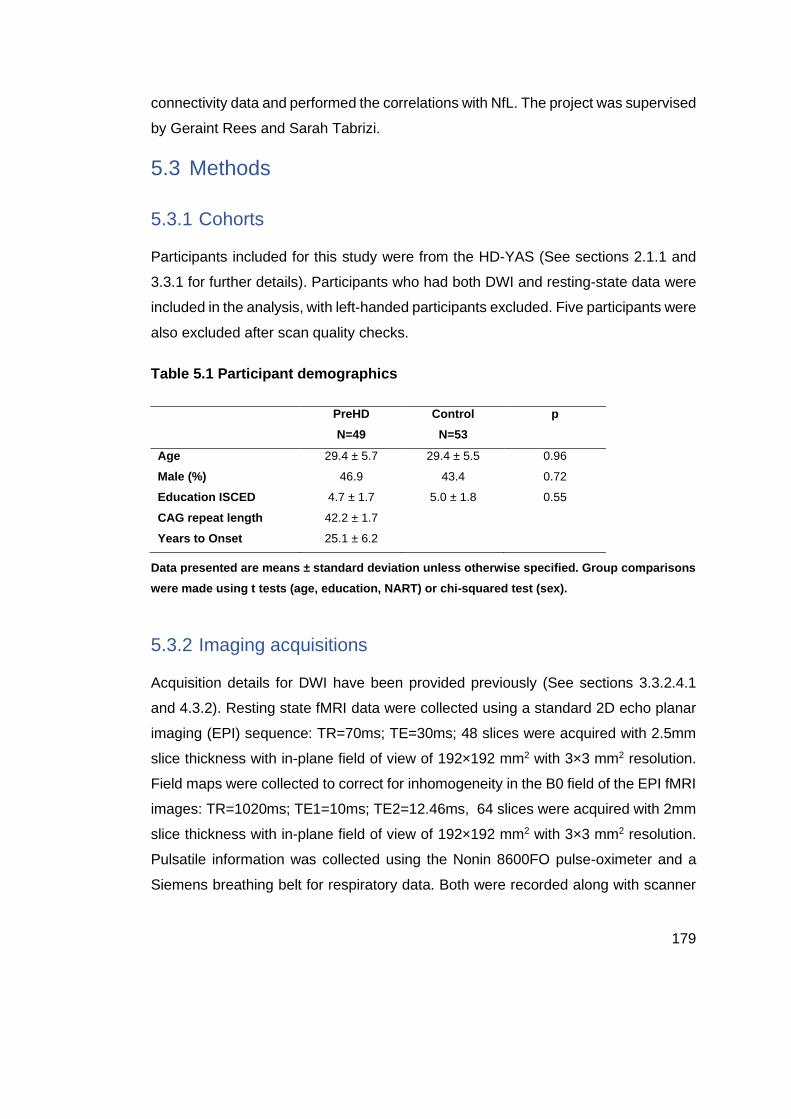
179
connectivity data and performed the correlations with NfL. The project was supervised
by Geraint Rees and Sarah Tabrizi.
5.3 Methods
5.3.1 Cohorts
Participants included for this study were from the HD-YAS (See sections 2.1.1 and
3.3.1 for further details). Participants who had both DWI and resting-state data were
included in the analysis, with left-handed participants excluded. Five participants were
also excluded after scan quality checks.
Table 5.1 Participant demographics
PreHD
N=49
Control
N=53
p
Age 29.4 ± 5.7 29.4 ± 5.5 0.96
Male (%) 46.9 43.4 0.72
Education ISCED 4.7 ± 1.7 5.0 ± 1.8 0.55
CAG repeat length 42.2 ± 1.7
Years to Onset 25.1 ± 6.2
Data presented are means ± standard deviation unless otherwise specified. Group comparisons
were made using t tests (age, education, NART) or chi-squared test (sex).
5.3.2 Imaging acquisitions
Acquisition details for DWI have been provided previously (See sections 3.3.2.4.1
and 4.3.2). Resting state fMRI data were collected using a standard 2D echo planar
imaging (EPI) sequence: TR=70ms; TE=30ms; 48 slices were acquired with 2.5mm
slice thickness with in-plane field of view of 192×192 mm2 with 3×3 mm2 resolution.
Field maps were collected to correct for inhomogeneity in the B0 field of the EPI fMRI
images: TR=1020ms; TE1=10ms; TE2=12.46ms, 64 slices were acquired with 2mm
slice thickness with in-plane field of view of 192×192 mm2 with 3×3 mm2 resolution.
Pulsatile information was collected using the Nonin 8600FO pulse-oximeter and a
Siemens breathing belt for respiratory data. Both were recorded along with scanner

180
pulses using Cambridge Electronics Device CED Micro 1401 Mk II connected to a
laptop running Spike v2.
5.3.3 Atlases for brain segmentation
In contrast to previous chapters, the cortical and subcortical atlases selected for this
study were derived from fMRI datasets and therefore represent regions parcellated
on this basis of their functional connections. The Shaeffer cortical atlas (Schaefer et
al. 2018) is derived from task and resting state fMRI data from 1489 healthy
participants and is available in both 100 region and 500 region parcellations. The atlas
was derived using a combination of a local gradient approach, which detects abrupt
transitions in functional connectivity patterns, along with the global similarity
approach, which clusters similar functional connectivity patterns regardless of spatial
proximity resulting in parcels with similar resting state fMRI signals. In the validation
of this atlas, the generated parcellations and boundaries were found to be in
agreement with known histological data (Schaefer et al. 2018).
For the striatum, the Choi atlas (Choi et al. 2012) (Figure 5.1) was used. The approach
taken to generate these subdivisions was similar to previously utilised structural
connectivity-based atlases, whereby each voxel in the striatum was assigned to the
most strongly correlated cortical region on the basis of its functional connectivity. The
parcellation was validated using two independent groups of 500 subjects. Its
parcellations are consistent with anatomical studies in non-human primates with a
dorsolateral to ventromedial organisation (Yeterian and Van Hoesen 1978; Selemon
and Goldman-Rakic 1985) and similar to the structural connectivity-based atlas
regions derived from diffusion tractography used in Chapters 3 and 4. Regions include
a limbic subdivision localised in the ventral striatum, a central territory of the dorsal
anterior caudate and putamen projecting to the association cortex and a motor-related
subdivisions located in the posterior putamen (Figure 5.1).

181
Figure 5.1 Functional connectivity-based striatal atlas subdivisions. Schematic illustrating the striatal subdivisions and corresponding cortical regions (above/middle), displayed on lateral and ventral surfaces of the left hemisphere (Anderson et al. 2018). Regions are default, frontoparietal control, limbic, ventral attention, somato/motor, dorsal attention, and visual networks. The latter two networks are not illustrated here and have sparse representation in the striatal atlas. Figure adapted under creative commons license
The Shaeffer cortical and Choi subcortical atlases were registered to a standard
space (Montreal Neurological Institute (MNI) space), before being combined into one
atlas. To investigate the influence of parcellation granularity on the results, one atlas
was created using the 100 parcellation cortical atlas and one with the 500 parcellation
atlas.
5.4 Diffusion MRI processing
Pre-processed images from the HD-YAS structural connectivity analysis were used.
This included eddy-current (FSL 5.0.11) and motion correction (Andersson and

182
Sotiropoulos 2016) and bias field correction (Smith et al. 2004). Following these
steps, fibre orientation distributions (FODs) were computed using multi-shell, multi-
tissue constrained spherical deconvolution with group averaged response functions
for white matter, grey matter and CSF (Jeurissen et al. 2014). Multi-tissue informed
log-domain global intensity normalisation was then performed. Whole-brain
probabilistic tractography was done in subject-space using the 2nd order integration
over fibre orientation distributions (iFOD2) algorithm (Tournier et al. 2010) with length
= 10-250 mm and FOD threshold of 0.06. Ten million streamlines were generated for
each scan using dynamic seeding in the white matter (Smith et al. 2015).
The functional atlas was then registered to each participants FOD image using a
linear registration (Modat et al. 2010). Connectomes were constructed by combining
streamline tractograms with the participant’s grey matter parcellation. Streamlines
were assigned to the closest node within a 2-mm radius of each streamline endpoint.
Structural connections were weighted by streamline count and a cross-sectional area
multiplier, as implemented in SIFT2 (Smith et al. 2015). Connections were then
combined into 114 x114 and 514 x 514 undirected and weighted matrices.
5.5 fMRI acquisition and processing
Functional MRI data pre-processing was performed using SPM12 and the using the
CONN toolbox version 14 (Whitfield-Gabrieli and Nieto-Castanon 2012) running
under MATLAB (ver R.2012b.) Segmented images were used to create an improved
anatomical scan for coregistration. The first five EPI images were discarded to allow
for steady state equilibrium.
Functional images were first slice-timing corrected, realigned incorporating field maps
used for inhomogeneity correction and then coregistered to the functional atlas
(Modat et al. 2010). Using the CONN toolbox, EPI images and ROIs were denoised
using the anatomical Compcorr method, along with 6 movement parameters, using a
band pass filter (0.008-0.9) and linear detrending, calculation of bivariate correlations
and application of a Fisher transform.
Subsequent statistical analyses were performed performed using the CONN toolbox
(Whitfield-Gabrieli and Nieto-Castanon 2012). Smoothed, normalised EPI images

183
were included with corresponding structural images (combined, segmented grey and
white matter). Connections were then combined into 114 x 144 and 514 x 514
undirected and weighted matrices, matching the corresponding structural connectivity
matrices. ROIs were defined as functionally connected if there was a correlation
between the time series of ROI 1 and ROI 2.
5.6 Statistical analysis
To assess whether specific structural and functional connections showed group
differences between preHD and controls, the NBS method was used (Zalesky et al.
2010) (see also section 2.9.6.2). This involves creation of a general linear model with
age and gender as covariates. Permutation testing was then performed using
unpaired t-tests and 5000 permutations. A test statistic was then computed for each
connection and a threshold applied (t=3.1) to produce a set of suprathreshold
connections, thereby identifying networks, which show significant differences in
connectivity between groups. A FWE correction was also applied (p=<0.05).
Functional and structural connectivity were investigated separately, in both the 114
and 514 region parcellations.
The functional connectivity analysis was then repeated by constraining the functional
connectome by the structural connectome. This was motivated by the known high
rate of false positive rates in fMRI connectivity analyses when using cluster-based
inferences (Eklund et al. 2016). To do so, the functional matrix was simply multiplied
by the structural matrix to remove any functional connections that do not have a
supporting structural connection and the NBS analysis was repeated on the new
constrained connectome.
Next, to investigate whether preHD participants with high CSF NfL showed
differences in structural or functional connectivity compared to preHD participants
with normal CSF NfL, a subgroup analysis was performed where the preHD group
was split in two on the basis of the CSF NfL result in the study. The low group had
NfL values within the 95th percentile of controls (<951 pg/mL), whereas the high group
had NfL values above this. Differences between both groups were investigated for
both structural and functional connectivity using both 114 and 514 parcellations.

184
Finally, correlations between CSF NfL and structural and functional connections
within the preHD group were investigated by including NfL as the contrast in the NBS
for both structural and functional connectivity matrices. The lowest cluster p-values
are reported for each analysis.
5.7 Results
5.7.1 No significant differences in structural and functional
connections
Using NBS, there were no significant differences in structural connectivity between
preHD and control groups in either the 114 or 514 region network parcellation, with
the lowest cluster p-value 0.35 and 0.14 respectively. Similarly, there were no
significant differences in functional connectivity in either the 114 or 514 region
network with lowest cluster p-values of 0.40 and 0.48 respectively. Given the lack of
significant differences at either resolution, the remainder of the analysis was
performed for the 114 region network only.
The functional analysis was repeated after constraining the functional connectome by
the structural connectome, thereby removing functional connections without a
corresponding structural connection. This repeat analysis similarly revealed no
significant differences in functional connectivity between preHD and controls
(p=0.39).
5.7.2 NfL subgroup analysis results
Next, the analysis was repeated to investigate whether preHD participants with high
CSF NfL (N=22) demonstrated altered structural and functional connectivity
compared to preHD participants with CSF NfL concentrations in the control range (<
95th percentile of controls; N=24). There were no significant differences in structural
connectivity between the low and high NfL groups (p=0.13). Similarly there were no
significant differences in functional connectivity between the low and high NfL group
(p=0.56).

185
5.7.3 Functional, but not structural connectivity, correlates with
CSF NfL
Correlations between connectivity and NfL were performed for both structural and
functional connections separately. There were no significant correlations between NfL
and structural connectivity within the network (p=0.19). Similarly, there were no
significant correlations between NfL and reducing functional connectivity (p=0.69).
However, there were significant correlations between NfL and increasing functional
connectivity in the preHD group (p=0.03) (Figure 5.2; Table 5.2). Within this network,
there was a preponderance of posterior connections and a similar number of
intrahemispheric and interhemispheric connections. There was no obvious left or right
dominance. Of the significant correlations, the dorsal attention network was most well
represented whilst the ventral attention and control networks had the least number of
connections within this subnetwork of connections correlating with NfL.

186
Figure 5.2 NBS correlation analysis of functional connections and CSF NfL. This network of 58 nodes and 112 connections showed significant increases in functional connectivity with increasing NfL (p=0.03). Significant connections also tabulated in Table 5.2.
Table 5.2 Correlations between increasing functional connectivity and CSF NfL
in preHD
ROI 1 ROI 2 t
L Cont pCun 1 R Default Temp 3 3.2
L Cont pCun 1 R SomMot 2 5.02
L Cont pCun 1 R SomMot 5 4.72
L Cont pCun 1 R SomMot 6 4.94
L Default Par 1 R DorsAttn Post 5 3.33
L Default Par 1 R Vis 2 4.18
L Default PFC 1 R DorsAttn Post 5 3.73
L Default PFC 1 R SomMot 4 3.63
L Default PFC 4 R SomMot 6 3.38
L Default PFC 6 R DorsAttn Post 2 3.21
L Default PFC 6 R DorsAttn Post 5 3.51
L Default PFC 6 R SomMot 2 3.23
L Default PFC 6 R Vis 7 3.26
L Default Temp 1 R DorsAttn FEF 1 3.63
L Default Temp 1 R DorsAttn Post 5 5.01
L Default Temp 1 R Vis 2 3.39
L Default Temp 1 R Vis 7 3.48
L Default Temp 2 R DorsAttn FEF 1 3.26
L Default Temp 2 R DorsAttn Post 2 3.12
L Default Temp 2 R DorsAttn Post 5 4.27
L Default Temp 2 R Vis 2 3.61
L Default Temp 2 R Vis 3 3.2
L Default Temp 2 R Vis 7 3.64
L DorsAttn FEF 1 L Default PFC 2 3.93
L DorsAttn FEF 1 L Default Temp 1 3.27
L DorsAttn FEF 1 L Default Temp 2 3.39
L DorsAttn FEF 1 L Limbic TempPole 1 4.94
L DorsAttn FEF 1 R Limbic TempPole 1 5.06
L DorsAttn FEF 1 R Vis 8 3.61
L DorsAttn Post 3 L Default Temp 2 3.18
L DorsAttn Post 3 L Limbic TempPole 1 3.11
L DorsAttn Post 5 L Striatal Somatomotor 3.16
L DorsAttn Post 5 R SomMot 1 3.33
L DorsAttn Post 6 L Default PFC 2 4.44

187
L DorsAttn Post 6 L Default Temp 1 4.31
L DorsAttn Post 6 L Default Temp 2 4.33
L DorsAttn Post 6 L Limbic TempPole 1 3.18
L DorsAttn Post 6 R DorsAttn Post 2 3.24
L DorsAttn Post 6 R Limbic OFC 1 3.16
L DorsAttn Post 6 R Limbic TempPole 1 3.45
L DorsAttn Post 6 R Striatal Default 3.21
L DorsAttn PrCv 1 R Limbic TempPole 1 3.37
L Limbic TempPole 1 L Default PFC 6 3.31
L Limbic TempPole 1 R DorsAttn FEF 1 4.23
L Limbic TempPole 1 R DorsAttn Post 1 3.4
L Limbic TempPole 1 R DorsAttn Post 2 3.25
L Limbic TempPole 1 R DorsAttn Post 5 3.84
L Limbic TempPole 1 R SomMot 3 3.48
L Limbic TempPole 1 R SomMot 4 4.25
L Limbic TempPole 1 R SomMot 6 3.13
L Limbic TempPole 1 R SomMot 7 3.69
L Limbic TempPole 1 R SomMot 8 5.28
L VentAttn Med 1 R Vis 7 3.51
L VentAttn Med 2 R Limbic TempPole 1 3.96
L VentAttn Med 3 L Limbic TempPole 1 3.41
L VentAttn Med 3 R DorsAttn Post 1 3.54
L VentAttn Med 3 R Limbic TempPole 1 3.21
L SomMot 3 R Vis 7 3.27
L SomMot 4 L DorsAttn Post 6 3.36
L SomMot 4 L Limbic TempPole 1 3.16
L SomMot 4 R DorsAttn Post 5 3.48
L SomMot 5 R DorsAttn Post 1 3.48
L SomMot 6 L Default PFC 6 3.62
L SomMot 6 L Limbic TempPole 1 5.32
L SomMot 6 R DorsAttn Post 1 3.61
L SomMot 6 R Limbic TempPole 1 5.72
L Vis 3 R DorsAttn FEF 1 3.38
L Vis 3 R DorsAttn Post 2 4.09
L Vis 5 R Default Temp 3 3.12
L Vis 5 R VentAttn TempOccPar 1 4.43
L Vis 7 L Default Temp 1 3.43
L Vis 7 L Limbic TempPole 1 3.81
L Vis 7 R Default Temp 2 3.2
L Vis 7 R Limbic TempPole 1 3.28
L Vis 7 R SomMot 6 3.12
L Vis 8 L SomMot 5 3.17
L Vis 8 L SomMot 6 3.29

188
L Vis 9 L Default PFC 6 3.25
L Vis 9 L Default Temp 1 3.96
L Vis 9 L Default Temp 2 3.85
R DorsAttn Post 1 R DorsAttn Post 2 3.62
R DorsAttn Post 1 R VentAttn Med 2 3.6
R DorsAttn Post 2 R DorsAttn Post 5 4.79
R DorsAttn Post 5 L Striatal Frontoparietal 4.48
R DorsAttn Post 5 R Default PFCv 2 4.45
R DorsAttn Post 5 R Default Temp 3 3.12
R DorsAttn Post 5 R DorsAttn PrCv 1 3.63
R DorsAttn Post 5 R Limbic TempPole 1 3.27
R DorsAttn Post 5 R Striatal Default 3.17
R DorsAttn Post 5 R Striatal Frontoparietal 4.25
R VentAttn Med 1 R Limbic TempPole 1 5.11
R SomMot 4 R DorsAttn Post 5 3.43
R SomMot 5 R DorsAttn Post 1 3.36
R SomMot 6 R DorsAttn Post 1 5.55
R SomMot 7 R DorsAttn Post 1 3.51
R SomMot 7 R DorsAttn Post 5 3.28
R SomMot 7 R Limbic TempPole 1 4.36
R SomMot 8 R DorsAttn Post 1 4.73
R SomMot 8 R Limbic TempPole 1 4.42
R Vis 1 R SomMot 7 3.27
R Vis 2 R DorsAttn Post 1 3.36
R Vis 2 R VentAttn Med 2 3.51
R Vis 2 R SomMot 8 3.99
R Vis 3 R DorsAttn Post 1 3.43
R Vis 5 R DorsAttn Post 2 3.41
R Vis 5 R VentAttn TempOccPar 1 3.99
R Vis 6 R DorsAttn Post 2 3.35
R Vis 6 R Striatal Default 3.55
R Vis 7 L Striatal Somatomotor 3.14
R Vis 7 R SomMot 3 3.12
R Vis 7 R SomMot 8 3.44
R Vis 8 R DorsAttn FEF 1 3.66
Correlations are listed in alphabetical order of left, then right regions of the first connection. t =
test statistic; L = Left; R = Right; Cont = Control network; Default = Default mode network;
DorsAttn = Dorsal attention network; VentAttn = Ventral attention network; SomMot =
Somatomotor network; Vis = Visual network; pCun = Precuneus; PFC = Prefrontal; OFC =
Orbitofrontal; Temp = Temporal; FEF = Frontal eye field; PrCv = Precentral ventral; TempPole =
Temporal pole; Med = Medial; Post = Posterior.

189
5.8 Discussion
Expanding on results from previous chapters, this study demonstrates that both
structural and functional connectivity appear preserved at the group level in HD gene
carriers approximately 25 years from predicted onset. However, by linking CSF NfL
into a HD connectivity analysis for the first time, I show that the functional connectivity
of certain connections increases with increasing NfL. This may represent the
beginning of compensatory functional upregulation in the very early stages of
neurodegeneration.
5.8.1 No significant differences in structural or functional networks
in early preHD
Whilst previous literature has demonstrated changes in functional connectivity in both
HD and preHD, the direction of changes and connections affected has been variable
between studies. Data-driven approaches can help standardise some aspects of
analysis by avoiding focusing on select networks where there can be considerable
variability between the choice of networks and their definition. However, even data-
driven approaches have previously recorded varying results in preHD with decreases
in striatal and rich club connectivity (Poudel et al. 2014; Harrington et al. 2015;
Espinoza et al. 2018) and increases in fronto-occpital, fronto-striatal and fronto-
parietal regions (Harrington et al. 2015; Espinoza et al. 2018) having been reported
previously.
In this study, both structural and functional connectivity across a standardised
network were investigated so that any alterations in functional connectivity could be
related back to any changes in their underpinning structural connections. However,
there were no significant differences in structural or functional connectivity between
this preHD group far from predicted onset and a well matched control group. These
results build upon those from previous chapters by solidifying the evidence for
preserved structural connectivity at this stage of preHD, whilst also providing
evidence of no underlying changes in whole brain functional connectivity.

190
5.8.2 Negative results are robust to different methods of analysis
When assessing structural and functional connectivity, the method of analysis can
have a significant influence on results. This study used varying but complementary
approaches to investigate how robust the initial findings were to variations in analyses
methods.
Connectivity analyses can be sensitive to the resolution of the parcellation scheme
employed. Using parcellations with lower numbers of regions may be beneficial to
maximise inter-subject correlation, however significant changes in connectivity may
be lost due to large spatial averaging. Alternatively, using matrices that are too large
may lead to variability due to registration errors and MRI noise that may be larger
than the functional connectivity difference between the two groups (Cammoun et al.
2012). To address this issue, a validated cortical atlas with 100 and 500 region
parcellations was used in this analysis to assess the influence of parcellation
resolution on the results. There were no significant differences in structural or
functional connectivity in using either the 100 and 500 region parcellation,
demonstrating that the null result is robust to the influence of varying parcellation
resolution.
In connectome construction, false positives have been shown to be a significant
problem in functional connectivity analyses (Eklund et al. 2016). Utilising the
existence of both structural and functional connectivity data in this analysis, functional
connectivity was reassessed after removing all functional connections without an
underlying structural connection. Although it is not the case that functional
connections cannot exist without a direct structural link, since indirect connections
can exist in the network, repeating the analysis in this way may help remove a
significant proportion of false positive connections and affords another opportunity to
assess how robust the null result is to differing modes of analysis. The result of no
significant differences across the functional network, after constraining by structure,
again strengthens the previous findings of no significant differences in structural and
functional connectivity between the preHD and control groups.

191
5.8.3 Structural and functional associations with NfL
NfL has emerged as a leading prognostic and disease progression biomarker in
preHD (Zeun et al. 2019). As a major component of the axonal cytoskeleton, it can
be presumed that increases in NfL seen across a spectrum of traumatic, inflammatory
or degenerative neurological diseases originate from axonal damage and/or loss.
Recent studies have begun to link imaging with NfL to understand how elevations in
NfL relate to changes in white matter macro- and micro-structure seen using MRI. In
HD, significant associations between plasma NfL and white matter volume loss in
peristriatal white matter and within the corpus callosum has been observed previously
in the TRACK-HD cohort (Johnson et al. 2018). Plasma NfL also significantly
predicted subsequent white matter atrophy and occipital grey matter atrophy in this
cohort. In a study of a mixed preHD/HD cohort, no significant associations were found
between standard DTI or NODDI metrics and CSF or plasma NfL concentrations,
although there was a consistent non-significant trend of diffusion metric changes
characteristic of white matter degeneration disorganisation and higher NfL
concentrations (Gregory et al. 2020). The failure to find significance between diffusion
measures and NfL in this cohort might be due to the relatively low sample size ( 30
HD and 19 controls), since a similar larger study of autosomal dominant Alzheimer’s
disease mutation carriers found significant associations between DTI measures and
plasma NfL both cross-sectionally and longitudinally (Schultz et al. 2020). Similar
associations between DTI measures and NfL has also been reported in amyotrophic
lateral sclerosis (Menke et al. 2015).
Whilst NfL has previously been related to microstructural changes in white matter
tracts, its impact on structural and functional connectivity has not been previously
explored in HD. Since connectivity depends on axonal integrity, it should be expected
that as NfL rises, structural connectivity will decrease. However, functional
connectivity may increase for several possible reasons including as compensatory
effect (Gregory et al. 2018) or as a result of pathological hyperexcitability (Orth et al.
2010) and therefore it is less predictable how functional connectivity may change in
response to increasing concentrations of NfL. In the initial HD-YAS analysis, CSF NfL
concentrations were found to be elevated in the preHD group and strongly associated
with age-CAG. However, 53% of preHD participants had CSF NfL concentrations

192
within the 95th percentile of controls, suggesting that early axonal loss was becoming
apparent in approximately half of the cohort closer to predicted onset. Therefore, it is
possible that such changes in structural and functional connectivity might only be
apparent in preHD participants closer to onset who show elevated CSF NfL
concentrations. However, there was no evidence of significant changes in structural
and functional connectivity between gene carriers with NfL concentrations within the
normal range and gene carriers with concentrations above this range. This may
signify that early elevations in CSF NfL are not associated with axonal loss, or more
likely, that the imaging methods employed are not sensitive enough to detect early
axonal loss that might only be occurring in a limited number of white matter regions
at this time. This is consistent with the results in chapter three, where no significant
differences or correlations with NfL were observed across a variety of white matter
imaging measures in the preHD group.
Despite not finding significant group differences in this study, the correlation analysis
revealed a significant correlation between CSF NfL and functional, but not structural
connectivity. This subnetwork of increased functional connectivity consisted of
predominantly posterior connections. The dorsal attention network was particularly
well represented in this subnetwork with comparatively few connections in ventral
attention and frontoparietal networks. Whilst this study was not designed to detect
whether this correlation with increased functional connectivity is compensatory or as
a result of early pathology, the prominence of connections in the dorsal attention
network and the normal clinical profile of this preHD group as described in chapter
three, might suggest that this is early evidence of compensatory upregulation in these
functional connections. The finding of increased functional connectivity in posterior
regions with increasing NfL is consistent with results from a previous study in the
PREDICT-HD cohort that found upregulation in posterior connections in preHD
participants closer to predicted onset also using NBS (Harrington et al. 2015).
However, a separate study using a different method of analysis found a pattern of
reduced connectivity in posterior regions and upregulation in anterior regions
(McColgan et al. 2017). Since this observation was in a cohort closer to predicted
onset, one possible explanation for this discrepancy with the current result is that
regions most affected by early pathology show an initial increase in neuronal activity
that subsequently leads to reduced neuronal activity and death with disease

193
progression. In support of this, mHTT has been shown to cause widespread synaptic
dysfunction which may lead to a failure to regulate excitatory drive as a contributor of
neuronal death (Smith-Dijak et al. 2019).
Looking to other neurodegenerative diseases, Alzheimer’s studies have also
demonstrated concurrent increases and decreases in functional connectivity in the
early disease process but with more consistent widespread decreases in functional
connectivity occurring with disease progression (Chhatwal et al. 2013; Badhwar et al.
2017; Demirtaş et al. 2017). A recent study using a computational model of
connectivity change over time in Alzheimer’s disease suggested that observed
temporary excessive neuronal activity may be an early pathological event that
subsequently leads to neurodegeneration and reduced functional connectivity in the
same regions (de Haan et al. 2012). Considering the collective evidence, the
observed correlations between NfL and increasing functional connectivity may
represent an early compensatory effect, but the alternate hypothesis of representing
early pathological change cannot be excluded. Further longitudinal study of well
stratified cohorts will be required to better characterise the topographical and
temporal nature of increased functional connectivity in preHD and its relationship to
rising concentrations of NfL.
5.8.4 Future directions
There have been very few studies investigating the relationship between structural
and functional connectivity in HD. Direct structural connectivity accounts for much of
the variance observed in functional connectivity (Suárez et al. 2020), hence
examining structural and functional connectivity in tandem can lead to further insights
than the study of each in isolation. In this study, both were analysed separately to be
able to relate any changes observed in functional connectivity to the corresponding
underlying structural connections. However, the relationship between the structural
and functional connectivity is imperfect since some functional connections may not
be directly linked by a structural connection and where a corresponding structural
connection exists, there is still a degree of variance between the functional and
structural strength of that connection (Suárez et al. 2020).

194
The study of how structural connectivity constrains function has been increasingly
studied. Recent studies using different methods have provided converging evidence
that structure-function relationships are organised around a hierarchical gradient
spanning from unimodal to transmodal cortex (Margulies et al. 2016; Preti and Van
De Ville 2019; Baum et al. 2020), consistent with the spatial hierarchy established in
earlier primate tract-tracing work (Mesulam 2012). Within this organisation, structure
and function appear to be closely coupled in unimodal sensory and motor areas, but
systematically decouple towards transmodal cortex. This decoupling appears to
increase through development and is associated with age-related improvements in
executive function (Baum et al. 2020). This underscores how the structure-function
hierarchy reorganises during development to support key functions that are known to
be disrupted in neurodegenerative diseases like HD. If there is indeed
neurodevelopmental effects of mHTT on striatal and cortical development, it is
possible that the normal structure-function relationship may be altered in HD gene
carriers, which in turn could affect clinical performance in more subtle ways. Hence,
studying structure-function coupling in this way may be of interest in future studies of
early preHD.
Previous research using fMRI has found evidence of compensation in preHD,
whereby maintenance of clinical performance despite detectable early disease
markers is associated with increased functional connectivity in certain networks
(Kloppel et al. 2015; Gregory et al. 2018). This study was not designed to study
evidence of compensation, but since this preHD cohort demonstrate normal clinical
function, coupled with elevations in NfL, further investigation for evidence of
compensation within this cohort is warranted.
The use of the Allen transcriptome brain atlas (Hawrylycz et al. 2012) which maps
regional gene expression in the brain to imaging space, also affords the opportunity
to investigate relationships between regional gene expression and observed changes
in functional connectivity (Anderson et al. 2018) that may help understand biological
basis of altered functional connectivity in certain networks in preHD.

195
5.8.5 Limitations
There are several limitations to this study. Since HD-YAS was powered to detect
disease-related striatal volume changes, it may be underpowered for detecting
differences in structural and functional connectivity as studied here. Furthermore,
whilst NBS aims to boost statistical power by cluster-thresholding, whole brain
approaches are unlikely to detect any subtle, regional specific changes in
connectivity, should they be present. However a whole-brain approach was
necessary, since previous literature has not converged on where, when and how
functional connectivity changes in preHD.
To facilitate group comparisons, a uniform parcellation was applied to all participants
in this study and hence assumes that regions can be mapped to identical spatial
locations in each participant. There is likely to be some individual variation in
structural and functional boundaries within each subject, with functional boundaries
particular likely to vary in this respect. Indeed, functional boundaries can
systematically vary across individuals and cortical regions and such variability may
limit the ability to detect early disease effects in preHD (Mueller et al. 2013).
Finally, whilst correlations observed between NfL and functional connectivity in this
study may represent possible evidence of compensation, this study was not designed
to specifically investigate for evidence of compensation in this cohort and so cannot
confidently advance this hypothesis. Validated models of compensation incorporating
clinical measures are best placed to test this specific hypothesis in such cohorts
(Gregory et al. 2017; Gregory et al. 2018).
5.8.6 Conclusion
These results suggest that both structural and functional whole-brain connectivity is
intact in HD gene carriers approximately 25 years from predicted onset. This result
extends the findings from previous chapters, demonstrating that brain structure and
function is largely preserved approximately 25 years from predicted onset in preHD.
However, the correlations between increasing NfL and functional connectivity in
certain connections may be early evidence of compensatory upregulation in this
cohort. Future studies will seek to specifically test this hypothesis to build an ever

196
more complete picture of changes in brain structure and function through the
premanifest period and further inform future therapeutic strategies for HD.

197
6 Discussion
The overarching aim of this thesis was to characterise brain structure and function in
young adult HD gene carriers far from predicted onset. First, a novel cohort of gene
carriers further from predicted onset than previously studied were recruited along with
a matched control group. A state-of-the-art battery covering cognition, psychiatric
symptoms, multi-modal imaging alongside blood and CSF collection was performed
to provide a deep phenotyping of this cohort. Analysis of the data then aimed to
evaluate how early disease-related changes in preHD could be identified, and which
measures were most sensitive at this early stage of disease. The thesis then turned
specifically towards further characterising structural and functional connectivity in the
early premanifest period. By combining diffusion MRI data from the HD-YAS cohort
with a previously recruited preHD cohort closer to expected onset, I aimed to identify
how early degeneration of white matter connections could be detected in HD and
which connections were most susceptible to early degeneration. Finally, I aimed to
characterise the relationship between structural and functional connectivity in early
preHD by performing a combined analysis of diffusion and functional MRI datasets
from HD-YAS, and utilising a biofluid marker of axonal degeneration to further
understand its relationship to imaging measures of connectivity. Collectively, by
providing a more detailed view of brain structure and function in the early premanifest
period, these results will inform future treatment strategies that aim to delay or prevent
the emergence of HD signs and symptoms.
6.1 Uncovering the earliest markers of neurodegeneration
in HD
Previous cohort studies in preHD had characterised the premanifest period up until
approximately 15 years from predicted onset, at which time there are still detectable
and progressive changes in brain structure, biofluid biomarkers, neuropsychiatric
symptoms and cognition (Paulsen et al. 2008; Stout et al. 2011; Tabrizi et al. 2013;
Epping et al. 2016). In order to wind back the clock further to trace how early such
changes could be detected, the HD-YAS recruited participants who were 18 years or

198
more from predicted onset by targeting a young age group with low CAG repeat
lengths. Of particular importance when searching for subtle disease-effects, was
combining the previous literature with advances in methodology to create a
comprehensive yet targeted assessment battery best placed to detect any early
changes. The assessment battery in HD-YAS was devised on these principles and
as a single-site study, afforded the ability to execute a standardised protocol without
the possible confound of inter-site variability in assessors or methodological
equipment such as MRI scanners.
Of the clinical features of disease, subtle cognitive impairments and increased
neuropsychiatric symptoms have been shown to be the most consistently detectable
features in the premanifest period (Duff et al. 2010; Stout et al. 2011; Tabrizi et al.
2013; Epping et al. 2016). Even subtle cognitive impairments observed in the
premanifest period, such as executive dysfunction and attentional deficits can affect
functional abilities such as work performance, driving and financial management
(Beglinger et al. 2010). Similarly, neuropsychiatric symptoms that are more common
in preHD, such as depression, anxiety or apathy, can have a significant impact on an
individual’s functioning and sense of well-being (Duff et al. 2007). It is important then
for clinical practice, to understand when these features can first be detected.
Results from HD-YAS suggest that gene carriers approximately 24 years from
predicted onset, show no significant cognitive or neuropsychiatric differences
compared to controls. The finding of no significant cognitive differences, despite a
wide range of targeted cognitive assessments, is in keeping with previous literature
that has found minimal cognitive deficits in preHD further than 10 years from predicted
onset (Stout et al. 2011; Papoutsi et al. 2014). It also extends this literature in scope,
particularly by incorporating tests of social cognition that have not been widely studied
in preHD previously.
The findings of no neuropsychiatric differences between the preHD and control
groups is similarly significant. Firstly, it indicates that the previously observed increase
in neuropsychiatric symptoms is a feature that may begin to emerge from
approximately 15 years from predicted onset. It also adds to previous literature on
neuropsychiatric outcomes following a positive predictive test, where the results are
consistent with previous reports of no significant changes in the extent of

199
neuropsychiatric symptoms in those with a positive predictive test, even at younger
ages. These results demonstrate that neuropsychiatric symptoms are common in the
young adult population and supports a hypothesis that neuropsychiatric symptoms in
preHD may only begin to increase later in the premanifest period as a result of
neurodegeneration rather than being related to carrying the gene. However this study
was not specifically designed to address the question of neuropsychiatric effects of
genetic testing and the significant limitation of selection bias in this study makes it
difficult to draw definitive conclusions regarding the susceptibility to and cause of
neuropsychiatric symptoms in preHD.
Previous research had suggested that changes in brain structure can be detected via
imaging at least 15 years from predicted onset. Striatal volume loss, peristriatal white
matter degeneration, loss of cortico-striatal and rich club connectivity and changes in
functional connectivity have all been consistently described in preHD (Tabrizi et al.
2013; Kloppel et al. 2015; McColgan et al. 2015; Zhang et al. 2018). In HD-YAS, the
only imaging measure showing significant change in preHD was reduced putaminal
volumes, although caudate volumes did also show a volume reduction to a lesser
extent. Whether this slight reduction is due to early neurodegeneration or as a result
of abnormal development is not clear, although there was no significant association
with age-CAG or NfL in this measure. Hence, reduction of striatal volumes appears
to be the earliest detectable imaging feature of HD, with other described changes
beginning to appear closer to expected onset.
With no detectable changes in cognition, neuropsychiatric symptoms and brain
structure appearing largely intact on MRI, it is of particular interest that increases in
NfL and YKL-40 can be detected at this early stage in HD-YAS. Over the past decade,
NfL has emerged as a sensitive marker of neuronal damage across a wide-spectrum
of neurological diseases (Khalil et al. 2018; Bridel et al. 2019) and is already known
to be track disease-progression, predict onset and closely associate with clinical
measures of disease in HD (Byrne et al. 2017; Niemela et al. 2017; Byrne et al. 2018).
The findings of elevated NfL indicate that neuroaxonal injury is occurring at this early
stage. Concurrent increases in YKL-40 and its close association with NfL
concentrations is suggestive of a detectable astrocytic response to early neuronal
injury. However, that 53% of preHD had CSF NfL concentrations within the control
200
range, along with its strong association with age-CAG, suggests that a timepoint has
been identified where a marker of neurodegeneration may be beginning to emerge
before significant changes in brain structure and function have occurred.
Finally it is important to consider how the results of HD-YAS relate to emerging
evidence suggesting that the HD mutation may confer to neurodevelopmental
differences in brain structure and function. Data from mouse models (Molina-Calavita
et al. 2014), human induced pluripotent stem cells (HD iPSC Consortium 2017) and
more recently human foetal tissue (Barnat et al. 2020) have suggested that the HD
mutation causes abnormalities in the developing cortex, including defects in neural
progenitor cell differentiation, changes in mitosis and cell cycle progression. It is
difficult to predict how this might influence the clinical, imaging and biofluid phenotype
in preHD however. Data from the Kids-HD study, in some respects the antecedent
study to HD-YAS, found an age-related striatal volume difference in HD mutation
carriers, with initial hypertrophy followed by a more rapid volume decline. In HD-YAS,
the observed reduced putaminal and caudate volumes in preHD could be construed
to be consistent with a neurodevelopmental difference in striatal development in HD
mutation carriers, particularly given the lack of age-CAG association. However, the
observation in Kids-HD was that striatal volumes were already quickly declining
having started larger than controls. If that were true, one would have expected to see
a more significant association with age-CAG in striatal volumes in HD-YAS, which
was not the case. Therefore it may be more likely that the reduced striatal volumes in
HD-YAS are a reflection of atrophy over time which is too subtle to show a significant
association with age-CAG, which is an imperfect proxy of disease stage in preHD. In
support of this theory, is the observation that NfL is already elevated in CSF and
plasma of preHD in HD-YAS and is associated with age-CAG, suggesting that there
is detectable neuronal damage occurring at this point related to disease stage.
Overall, the results included within this thesis provide little evidence of developmental
differences in brain structure and function in early preHD, which is perhaps surprising
if there are such pronounced differences in the developing cortex as observed in the
aforementioned studies. It is possible however, that developmental differences in HD
mutation carriers may manifest as making certain cell types more susceptible to
damage later in this disease course as the harmful effects of the mutation accumulate
(Molero et al. 2016), rather than causing fundamental differences in brain structure

201
and function that may be expected to be detected by neuroimaging, biofluid
assessments and functional measures. Given important connotations for the
development of HD therapeutics, the impact of the HD mutation in neurodevelopment
remains a key area of interest in the field.
6.2 Zeroing in on selectively vulnerable structural
connections in preHD
In chapter 3 as part of the initial analysis of HD-YAS, select rich club and cortico-
striatal connection strengths were investigated, alongside network measures of
integration and segregation. These measures were selected based on previous
evidence that they were sensitive to early changes in preHD (McColgan et al. 2015;
McColgan et al. 2017). No differences between gene carriers and controls were found
in any of these measures however (Scahill et al. 2020). In chapter 4, by utilising an
advanced diffusion analysis technique and focusing specifically on cortico-striatal and
cortico-thalamic subnetworks in both HD-YAS and TrackOn-HD cohorts, I have
provided further insights in the timing and anatomical specificity of basal ganglia white
matter degeneration in preHD. Whilst the vulnerability of motor cortico-striatal
connections has been described previously, the selectively vulnerability of limbic
cortico-striatal connections has not been previously described and may be important
in understanding the biological basis of how neuropsychiatric symptoms such as
irritability and apathy begin to arise in the premanifest period (Le Heron et al. 2018).
Similarly, the apparent vulnerability of thalamic connections to premotor and primary
motor cortex is a novel finding in the field and may help broaden future research focus
to continue to investigate these central connections in basal ganglia-cortical loops.
Whilst select connections showed changes in the group 11 years from onset, findings
in the preHD group 25 years from predicted onset extended previous findings in
chapter 3, suggesting that these vulnerable connections are preserved at this early
stage of the premanifest period. By using a cohort who had two different acquisition
protocols, I demonstrated that a more advanced multi-shell diffusion acquisition with
higher b-values can improve signal-to-noise in FBA, likely through providing a more
sensitive measure of FD. This suggests that the use of improved diffusion acquisitions

202
and techniques may be more able to detect the early effects of neurodegeneration
than techniques that had been used previously in HD cohorts.
6.3 Whole brain structural and functional connectivity is
preserved in early preHD, but rising NfL is associated
with functional upregulation
Although preHD participants 24 years from predicted onset showed no discernible
change in cortico-striatal and cortical rich club connections, the elevations in NfL, a
protein of the axonal cytoskeleton, suggests that there may be some early axonal
degeneration in this preHD cohort. A whole brain network-based statistical analysis
of functional connectivity and its underlying structural connections in the HD-YAS
cohort revealed no significant differences in either functional or structural connections
between preHD and controls. This finding was robust to the granularity of the network
reconstructed, with neither the 114 nor 514 region network showing significant
differences. It was also robust when constraining the functional network by structural
connectivity, i.e. removing functional connections from the network if they did not have
a corresponding structural connection in the network. In a subgroup analysis, preHD
with elevated concentrations of CSF NfL did not show any differences in structural or
functional connectivity compared to preHD with NfL concentrations within the control
range. However there were correlations between increasing CSF NfL and increased
functional connectivity in a subnetwork of connections. Collectively, these results
suggest that whilst structural and functional connectivity appear broadly preserved at
the group level, certain functional connections may begin upregulating as CSF NfL
rises, potentially in a compensatory process to counteract early neuroaxonal loss and
preserve clinical function.
6.4 Implications for future therapeutic strategies and trial
design
Central to the work in this thesis, is furthering our understanding of the early
premanifest period in HD to inform future therapeutic strategies and trial design.

203
6.4.1 When to treat?
Common to all dementias is that by the time symptoms have manifested, there has
been many years of unchecked neurodegeneration that may not be reversible
(Bateman et al. 2012; Rohrer et al. 2015). To date, all trials of disease-modifying
therapeutics for dementias have been unsuccessful. One factor speculated to be
contributory is a failure to initiate treatments early enough in the disease course
(Gauthier et al. 2016). In this respect, the genetic basis of HD, its tendency to affect
individuals in the fourth to sixth decades of life and availability of predictive testing
affords an advantage, since treatments could in theory be initiated at any stage of the
disease, including long in advance of likely symptom onset. Although dependent on
the profile of a given therapeutic, one potential treatment strategy would be to initiate
a therapeutic in the premanifest period with an aim to delay or prevent the emergence
of clinical features of the disease. The HD-YAS reveals a time whereby treatments
aiming to prevent or delay emerging clinical features could be given, since there was
no detectable functional impairment and brain structure also appeared largely intact.
6.4.2 Which biomarkers?
For trials in the premanifest period to become viable, there is a need for biomarkers
to stratify or enrich recruitment, demonstrate target engagement and also an efficacy
biomarker that will show measurable change over the course of typical trial period
and is closely related to relevant clinical features of disease.
Results detailed in this thesis provide valuable information regarding potential target
engagement markers for huntingtin-lowering therapies currently in development.
Although successfully used to demonstrate target engagement in the first huntingtin-
lowering trial (Tabrizi et al. 2019), the reported low and near undetectable
concentrations of mHTT observed in HD-YAS indicate that mHTT is unlikely to offer
a measure of target engagement that will be informative for assessing dose-response
relationships in early preHD, since concentrations will quickly fall to undetectable.
However, the significantly higher concentrations of total huntingtin in this group should
provide a more granular dose-response for total huntingtin therapies at this early
stage of disease.

204
Results from this thesis also advance NfL as a potential candidate biomarker in far
from onset preHD. Favourable attributes include its relatively strong effect size
compared to the few other changes detected in the preHD group, its close association
with age-CAG and previously described ability to predict disease onset and clinical
change (Byrne et al. 2017; Niemela et al. 2017; Byrne et al. 2018; Johnson et al.
2018). Significantly, the HD-YAS results show that CSF NfL is more sensitive and
specific at this early stage than plasma NfL, in contrast to their near equivalence in
early manifest disease (Byrne et al. 2018). However, the wide distribution of years to
predicted onset (11-38 years) in a relatively small cohort with biofluid data limits
inferences about how NfL changes within this time-frame and when NfL first begins
to rise. These questions are particularly important to address before NfL can become
a prognostic biomarker to facilitate clinical trials in such far from onset groups in the
future.
In a future preHD clinical trial, one approach might be to enrich recruitment by having
a predefined CSF NfL cut-off to increase the likelihood of seeing measurable change
over a typical trial timeframe. The validity of this approach is strengthened by the
recent findings that baseline CSF and plasma NfL values appear to have superior
prognostic value than the rate of change in NfL over a 24 month period in a mixed
premanifest and manifest HD cohort (Rodrigues et al. 2020). Furthermore,
computational clinical trial simulations in this study demonstrated the use of CSF or
plasma NfL could substantially reduce the number of participants or trial duration
required to obtain a prespecified effect size compared to currently used clinical
measures. Alternatively surrogate endpoints could include time to elevation in NfL,
rate of increase in NfL concentration or change from baseline. The NfL curves
produced from combining HD-YAS results with a cohort later in the disease process
provide an anticipated trajectory of this biomarker and the age at which NfL is
predicted to rise above the 95th percentile of controls for a given CAG in both CSF
and plasma.
The use of NfL as an efficacy marker will require further evaluation of its response to
treatment. It has already shown ability to track therapeutic response in other
neurological diseases (Kuhle et al. 2019; Olsson et al. 2019), including those
delivered by intrathecal injection (Olsson et al. 2019). In HD, CSF NfL values
205
unexpectedly increased in response to a phase 1 trial of huntingtin-lowering ASO
(Tabrizi et al. 2019). Hence, an improved understanding of NfL’s response to
therapeutic interventions in HD will be required as its performance in numerous
clinical trial programmes becomes apparent, alongside the performance of each
therapy.
Finally, it’s notable that clinical improvement has typically been a requirement for
regulatory approval of therapeutics, with the United States food and drug
administration (FDA) being particularly stringent on requiring demonstrable clinical
benefit that encompasses how a patient feels, functions or survives (Bous Hufnagel
2019). This is exemplified by the current phase III trial of tominersen, a non-allelle
selective huntingtin-lowering ASO, where the composite UHDRS measure which
includes cognitive test performance has been permitted as a primary endpoint for
European medicines agency (EMA) but not the FDA who have required that the
UHDRS total functional capacity scale serves as the primary endpoint. Although the
approval of therapeutics based on validated biomarkers is likely to increase in the
future, it will be essential to have robust evidence that biomarker change predicts
clinical benefit or improvement. Hence before biomarkers such as NfL can be
permitted as surrogate endpoints, it will be necessary to demonstrate that reducing
NfL either is associated symptomatic improvement or delays clinical diagnosis in
preHD. For the latter, a trial would need to recruit a preHD cohort who are closer to
predicted onset than the HD-YAS to minimise the necessary trial duration period.
Beyond this, further characterisation of when NfL begins to rise and it’s early trajectory
in preHD will be important before it can be used as a potential efficacy marker in any
future far from onset preHD trials.
6.4.3 Where to treat?
Viral-vector delivered therapeutics are currently in development for HD (Tabrizi et al.
2019), with the first RNAi therapeutic now in phase 1 human trials (Clinicaltrials.gov;
NCT04120493 2019; Uniqure N.V 2020). A significant advantage of viral-vector
based therapeutics is that a single administration can provide a long-term therapeutic
effect. However, a key potential limitation is the invasive intra-parenchymal nature of
delivery and that limited tissue distribution following injection may necessitate
choosing only certain sites for injection. Importantly, viral-vectors commonly used

206
show evidence of retrograde axonal transport. Notably, in a HD-minipig widespread
adenoviral-vector 5 based RNAi distribution was seen in the cortex following
putaminal injection (Evers et al. 2018), suggesting retrograde axonal transport is a
key mechanism of distribution for such therapeutics.
The striatum is an important target for such an approach given its notable involvement
in disease pathology, however its significant anterior-to-posterior length may make it
difficult to target both anterior and posterior striatum in one injection. Injection of the
thalamus, a central hub region with extensive cortical connections, has been shown
to achieve widespread cortical and subcortical coverage in preclinical models (Evers
et al. 2018; Naidoo et al. 2018; Tabrizi et al. 2019) and is also a possible target site
for such treatment approaches. However, a limitation of preclinical biodistribution
studies in animal models such as HD-minipigs (Evers et al. 2018) or macaques
(Weiss et al. 2020), is that they do not display the white matter pathology seen in
humans with HD. It can be expected given the above, that as white matter
degeneration and axonal loss occurs, the distribution of the drug to the cortex will be
reduced. Therefore, understanding the temporal and topographical evolution of
axonal degeneration in humans will be informative to selecting injection sites for such
approaches. In particular, one approach may be to target areas most affected by early
pathology, but before significant neurodegeneration and white matter loss has
occurred, to maximise biodistribution and prevent white matter degeneration.
The findings in chapter 4 highlight the vulnerability of the caudal motor striatal
connections in preHD. But the concurrent findings of early limbic striatal tract
vulnerability and the likely significance of this to neuropsychiatric symptoms seen in
HD suggest that coverage of the ventral striatum may also be important to prevent
the onset of clinical symptoms, rather than only targeting the dorsal striatum.
Similarly, there has been little previous attention to cortico-thalamic connections in
preHD which are believed to be relatively preserved at this stage of disease. However
the results of this thesis suggest that motor-thalamic connections are affected early
in HD and that these thalamic subregions may also be an important injection site, not
just to achieve widespread biodistribution, but to prevent further degeneration of
connections that may be influential in the emergence of motor signs of the disease.
Finally, results from this chapter suggest that these important connections are

207
preserved approximately 25 years from predicted onset, highlighting a time at which
viral-vector based therapeutics should have maximal coverage in the brain to help
prevent early neurodegeneration.
6.5 YAS as a resource for further research
The significant advances in understanding the natural history of HD over the past two
decades owe a great deal to previous cohort studies TRACK-HD, PREDICT-HD,
PHAROS and Enroll-HD. In each case, a multitude of studies providing new insights
have followed the initial main analyses of the cohorts, facilitated in part by open data
sharing with research groups worldwide. Similarly, the uniqueness of the cohort and
extensive range of assessments in HD-YAS has generated a rich dataset that stands
to generate many future studies that further our understanding of the early
premanifest period.
The cohort is unique for its young age ranges and the distance from predicted onset
in the preHD group. Among its strengths include an advanced 3T imaging protocol,
combining well established acquisitions with novel promising acquisitions such as
MPMs, which if combined can offer further in-vivo insights into brain structure than
any single modality. The existence of resting state fMRI data with an extensive array
of cognitive and neuropsychiatric assessments may provide the tools to further
investigate the relationships between brain connectivity and clinical function,
including searching for evidence of compensation in this cohort (Gregory et al. 2018).
Meanwhile the study also collected demographic and medication history as well as
data from the UHDRS PBA. Unlike the neuropsychiatric questionnaires used in the
main HD-YAS analysis, the PBA also measures previous worst, as well as current
levels of neuropsychiatric symptoms. Hence the PBA data may be well placed to
further investigate for any past or present neuropsychiatric differences between
preHD and different control subgroups, including in gene negative participants.
Biofluid collection was performed using standardised and well validated conditions,
methods and equipment to facilitate generalisability to previous biofluid collection
studies within HD. The biofluids collected as part of HD-YAS will continue to be stored
and made available for future research both internally and externally. It is also

208
reassuring that mHTT and NfL have recently been shown to be unaffected by batch,
assay or storage effects (Rodrigues et al. 2020). Hence, this resource maybe useful
for any novel promising biomarkers that emerge in the future. In an example of how
this approach has already been beneficial, the first large-scale study to demonstrate
the potential utility of NfL as a biomarker for HD came from using plasma samples
stored from the TRACK-HD study years after it had completed (Byrne et al. 2017). In
addition, all preHD participants in HD-YAS had DNA storage performed as part of the
protocol. Though not analysed to date, these samples may be used in the future to
further emerging research around somatic instability that is increasingly appearing
central to HD pathogenesis and progression (Swami et al. 2009; Hensman Moss et
al. 2017; Genetic Modifiers of Huntington’s Disease Consortium 2019).
Collectively, further research using this rich dataset may provide many further
important insights into the early premanifest period of HD and could even be used to
study brain structure and function in young controls.
6.6 General limitations and lessons learnt
6.6.1 A question of power
One limitation of the HD-YAS is that it was not possible to increase power above and
beyond detecting the largest effect size in the group furthest from onset in TRACK-
HD. Naturally, when looking further back in a disease process it can be expected that
effect sizes will become smaller and smaller until true no difference is reached.
Furthermore, since the power calculation was based on one measure (striatal volume)
from a previous study, it cannot necessarily be extrapolated that the study was
powered to assess for differences in other domains such as cognitive tasks or
assessing associations with age-CAG. These limitations temper the interpretation of
the HD-YAS results of no significant group differences across many of the measures
included. However it would be a challenge for any single-site study targeting preHD
this far from onset to recruit a significantly larger cohort due to the current low uptake
of predictive testing worldwide, particularly in those aged 18-30 (Baig et al. 2016).
Furthermore, the low CAG lengths required for this study would further exclude many
premanifest gene carriers in this age range from such a study. Instead, in addition to

209
using the immediate resource of a national HD clinic, recruitment was boosted by
setting up regional genetic centre patient identification sites across the UK, and
through broader efforts such as advertising via the HD Association and HD youth
organisation. The population density and research infrastructure in the UK likely aided
this recruitment, as did close connections with other regional HD centres and the
collective visibility and reach of the HD charitable groups to meet the recruitment
target and establish this immensely valuable cohort.
6.6.2 Selection bias
As discussed in section 3.5.8, the generalisability of the results of this thesis are
potentially limited by selection bias of which, there are multiple considerations that
may be a source of such bias. To take part in HD-YAS, participants needed to be a
UK resident and have an awareness of the study that typically came from
engagement in other studies or activity in patient support groups. They often were
required to take time off work, travel long distances and tolerate a challenging two
day study assessment period that included a physical examination looking for
diagnostic signs of HD, extensive cognitive testing, a long MRI scanning period,
venepuncture and lumbar puncture. Motivation for the study may have also included
those seeking positive feedback from being included in the study and individuals with
active mental health problems such as depression or apathy would be unlikely to
volunteer for such a study. All of the above considerations could possibly lead to
selection bias and a sample not necessarily representative of the general population.
The most important potential source of such bias however, is the requirement of
preHD participants having previously undergone a HD genetic test, where it is
estimated that less than 20% of the wider at-risk population choose to have a
predictive test (Baig et al. 2016) in the UK. The limited evidence base of differences
between those who choose to undergo predictive testing and those who do not
represents a significant potential limitation in the generalisability of these results to
the wider at-risk/premanifest population.
One possible solution to address this selection bias a would have been to recruit
those at risk and subsequently perform predictive testing for the study without
disclosing to the participants. This approach has been used in previous studies of
inheritable neurodegenerative diseases (Bateman et al. 2012; van der Plas et al.

210
2019) and is beneficial in eliminating such bias that may arise from requiring a
predictive test to be enrolled. It would also facilitate recruitment for such a study and
potentially enable many more participants to be studied. The limitation of such an
approach includes the difficulty of establishing balanced groups and there would have
been no way of avoiding recruitment of those who were likely to be less than 18 years
from predicted onset given that CAG repeat length would be unknown. Although both
limitations could be largely addressed by significantly expanding the numbers
recruited, a further limitation that would follow would have beena obtaining funding to
recruit large numbers of participants with such an extensive range of assessments
which may have precluded such a study getting off the ground.
6.6.3 Biofluid collection in young cohorts
The results of HD-YAS illustrate the importance of blood and CSF biomarkers in
characterising the early effects of neurodegeneration, consistent with findings from
other neurodegenerative diseases. On this note, another potential barrier to
recruitment was the willingness of participants to undergo CSF collection. Given their
young age, many participants had no or limited prior experience with any type of
invasive procedure, including blood collection and it was uncertain at the start of the
study how many participants would be willing to donate CSF. Therefore, the CSF
collection was made optional since recruitment was already likely to be challenging
for reasons detailed above. Nevertheless, on reflection the high numbers undergoing
CSF collection were testament to the bravery and motivation of those involved, and
indicative that CSF collection can be a viable part of a young adult study. On this note
however, the incidence of post-lumbar puncture headaches (22% of cohort) was
higher than previously described in other, albeit older cohorts using the same
equipment and approach (Nath et al. 2018; Rodrigues 2018). This is likely reflective
of the known association of younger age groups being more susceptible to this
adverse event (Amorim et al. 2012; Monserrate et al. 2015). It was however
reassuring that such headaches were short lived and all resolved spontaneously
without the need for a blood patch. The tolerability of lumbar punctures in age groups
this young has not been well characterised previously and further study will be helpful
to inform future use of CSF as biomarkers in trials or in the clinic for young adults.

211
6.6.4 The power of collaboration
The HD-YAS, funded by a Wellcome Collaborative award, is a positive example of
the benefits of collaboration. To fully characterise early disease effects, a combination
of imaging, cognitive, neuropsychiatric and biofluid assessment was required. Hence,
the study was set up with experts in each field, not restricted to the arena of HD
research, to help inform the study design and methods of assessment. The outcome
of the study and interpretation of results was greatly enhanced by the collaborative
approach taken. On a similar theme, it is notable that a key result was the finding of
elevated NfL in the preHD group. Tracing the origins of NfL as biomarker back, it first
description as potential biomarker in neurology was in a mixed amyotrophic lateral
sclerosis and Alzheimer’s disease cohort in 1996 (Rosengren et al. 1996). The fact it
has become a leading candidate biomarker for HD reflects that many neurological
diseases share similar hallmarks and that discoveries in one disease can greatly
inform research in another. This potential for shared learning has been influential in
the establishment of initiatives such as the UK Dementia Research Institute (Hesse
and Henstridge 2018). Specifically, comparable research is ongoing with similar
premanifest cohorts such as the dominantly inherited Alzheimer’s disease (DIAN)
(Bateman et al. 2012) and the genetic frontotemporal initiative (Rohrer et al. 2015)
and it is likely that future research progress in HD will continue to be influenced by
research in other neurological diseases.
6.7 Future directions
6.7.1 Longitudinal follow up in the HD-YAS
The HD-YAS was established as a cross-sectional study. Whilst some inferences
were made based the influence of disease burden on the measures studied, inevitably
the results raised further questions that will require longitudinal follow up to resolve.
Whilst results advanced NfL as a potential biomarker of early disease, further
characterisation of the longitudinal dynamics of NfL this early in the disease course
and whether values are predictive of other disease related changes that arise later in
the premanifest course will be important. Similarly, whether the observed reduced
striatal volumes are as a result of ongoing subtle neurodegeneration, or a possible

212
neurodevelopmental effect can be further clarified with longitudinal follow-up. Finally,
there were several sub-threshold trends in the results, including reduced performance
in cognitive tasks and certain imaging changes in DTI, NODDI and MPMs.
Longitudinal follow up to see if these trends persist or increase may help clarify
whether they represent very early HD-related changes or not. Given that the preHD
individuals are far from onset and the known slow progressive changes that occur in
HD across all modalities (Witjes-Ané et al. 2007; Stout et al. 2012; Barker et al. 2013;
Tabrizi et al. 2013; Gregory et al. 2015), any such follow up would benefit from a
reasonable gap between visits.
6.7.2 Future multi-site studies to maximise power and
generalisability
As previously discussed, single-site studies confer certain advantages when
searching for subtle disease effects. This first investigation in gene carriers >18 years
from predicted onset has already provided valuable insights into the very early
premanifest period and will continue to help shape which assessments may be most
useful for future studies wishing to build and extend upon this knowledge. In the
future, recruitment of a multi-site, multi-national study of a similarly young premanifest
cohort may be important to maximise power and generalisability of findings to further
inform future clinical trials in early premanifest groups. In such a study, it may be
advantageous to include those at risk to minimise selection bias and extend
generalisability of the results, as previously discussed in section 6.6.2.
6.7.3 Combining the best established assessments with emerging
techniques
As done in the HD-YAS, future studies of the early premanifest period will similarly
look to combine existing assessment tools shown to be most sensitive in this early
period with emerging techniques that either increase signal-to-noise or tap into
previously unchartered neurobiology. Similarly, future studies will need to balance
comprehensiveness of assessments with minimising unnecessary loss of power
through multiple-comparisons of an extensive assessment battery.
213
The results of this thesis highlight assessments to include, and some that may be
dropped in future premanifest studies. For example, amongst biofluids, clear null
results for biomarkers such as neurogranin, UCHL-1 and GFAP may be dropped in
exchange for any new emerging biomarkers that demonstrate significant potential in
this area.
Among advancing techniques that may provide utility in this area are 7T imaging and
huntingtin radioligand positron emission tomography (PET). To date, study of
structural changes in the cortex has been limited by the inability of 3T imaging to
resolve the many cortical layers and it’s convoluted structure. By enhancing spatial
and anatomical resolution, 7T imaging may be used to investigate the susceptibility
of specific cortical layers in the early disease process and its relationship with axonal
loss and microcircuit dysfunction in preHD (McColgan et al. 2020). 7T imaging may
also improve signal to noise of current assessments (Springer et al. 2016; McKiernan
and O’Brien 2017). This could help interrogate for early disease pathology in
potentially key structures of interest that are unable to be fully delineated at 3T, such
as the globus pallidus whilst also enhancing the ability to detect early atrophy in key
structures of interest such as the caudate and putamen which may inform decisions
about when to initiate treatments in the future. However at present biofluid biomarkers
such as NfL have shown superior potential as biomarkers (e.g. sensitivity, cost,
reproducibility) that may help facilitate clinical trials over 3T imaging techniques and
it is unlikely that 7T imaging will reverse this trend. Furthermore, 7T imaging comes
with ever stricter eligibility criteria, including for tattoos. The experience from HD-YAS,
where 29 potential participants screen failed due to tattoos and a further 60 study
participants had tattoos that met eligibility for 3T scanning, but might fail stricter
criteria, illustrates a potential limitation for 7T imaging in young cohorts. This, along
with the relative scarcity of 7T scanners across the world at present, would limit the
prospect of 7T imaging being used in large scale clinical trials in the near future.
With a first-in-human open-label study of novel candidate ligands now underway
(Clinicaltrials.gov; NCT03810898 2020), mHTT-PET imaging may open new
possibilities to quantify in-vivo mHTT aggregation in preHD and thus provide crucial
insights into the relationship of mHTT aggregation to other early disease biomarkers.
It may also be used to quantify regional target engagement in the same way as
214
Alzheimer’s trials have done (Klein et al. 2019). Further development of PET imaging
may provide further in-vivo insights that can complement biofluid biomarkers, such as
mapping astrocyte and microglial activation for example (Cybulska et al. 2020).
6.7.4 Enhancing disease staging for natural history studies
Throughout this thesis, use has been made of models which predict years to clinical
onset or estimate disease burden based on age-CAG interactions, in order to stratify
subgroups according to proximity to onset. The ability to accurately stratify groups is
crucial to map the evolution of disease markers over time. However current models
are known to be limited, since CAG length only explains approximately 60% of the
variability in age of onset. This underlines why it cannot affirmatively be concluded
that the absence of age-CAG associations with e.g. reduced putamen volumes, is
evidence of a static neurodevelopmental change as opposed to subtle
neurodegeneration. Whilst longitudinal follow up can help address such problems, the
slow nature of change poses an additional challenge for such approaches. It will be
important then, to combine other genetic modifiers that are being increasingly
uncovered (Hensman Moss et al. 2017; Genetic Modifiers of Huntington’s Disease
Consortium 2019; Goold et al. 2019) into new predictive models to enhance the ability
to make inferences about biomarker changes in natural history studies in HD that feed
into clinical trial design.
6.7.5 Translating from observational to interventional studies in
premanifest HD
Finally, it is hoped that in addition to informing future premanifest trial design, well
phenotyped premanifest cohorts such as HD-YAS may represent ideal cohorts for
future clinical trials in preHD. As an example, the DIAN study was a pioneering study
established in 2008 to track longitudinal change in dominantly inherited Alzheimer’s
disease. The results of which has subsequently informed the DIAN trials unit (DIAN-
TU) (Clinicaltrials.gov; NCT01760005 2013) an adaptive platform trial which aims to
implement clinical trials aimed at delaying or preventing onset whilst advancing
scientific understanding of both the disease and proposed therapies (Mills et al. 2013;
Bateman et al. 2017). DIAN-TU has become the forebearer for premanifest trials in
neurodegeneration, notable for using longer trial durations than had been the norm

215
previously with dose-adjustment algorithms informed by combined safety and
biomarker-target analyses to maximise target engagement. Whilst recent top line data
of the first two drug arms fell short of primary endpoints, there were positive target
engagement and other biomarker signals in one arm. Other themes emerging include
a suggestion that presymptomatic participants did notably better than symptomatic
participants, the importance of longer follow up and having a robust disease model to
devise the best endpoints (https://www.alzforum.org/news/conference-
coverage/dian-tu-gantenerumab-brings-down-tau-lot-open-extension-planned). This
further strengthens the case for early interventions in HD and the importance in
furthering understanding of the premanifest course to inform trial design and
endpoints that are most likely to provide definitive answers and further insights into
disease pathogenesis.
6.8 Conclusion
In closing, this thesis has provided evidence that early neurodegeneration can be
detected in HD approximately 25 years from predicted onset. Despite elevations in
NfL, YKL-40, and slightly reduced striatal volumes, gene carriers at this stage
demonstrate no clinical impairments, and brain structure and function that is almost
indistinguishable from controls. In addition, characterising the timing and anatomical
specificity of basal ganglia white matter loss in preHD may inform the optimal timing
and injection sites for future viral-vector based therapeutics. I argue that with the right
therapeutic or combination of therapeutics, interventions at this stage may be best
placed to delay or prevent further neurodegeneration, affording gene carriers many
more years of life without impairment.

216
7 Publications
Zeun, P., R. I. Scahill, S. J. Tabrizi and E. J. Wild. Fluid and imaging biomarkers for
Huntington's disease. Mol Cell Neurosci 2019; 97: 67-80.
Scahill, R. I.*, P. Zeun*, K. Osborne-Crowley, E. B. Johnson, S. Gregory, C. Parker,
et al. Biological and clinical characteristics of gene carriers far from predicted onset
in the Huntington's disease Young Adult Study (HD-YAS): a cross-sectional analysis.
Lancet Neurol 2020; 19(6): 502-512.
Under peer review
Zeun, P., McColgan, P., Dhollander, T., Gregory, S., Johnson, E.B., Papoutsi, M.,
Nair, N., Scahill, R.I., Rees, G., Tabrizi, S.J. and the TrackOn-HD and HD-YAS
Investigators. Timing and specificity of basal ganglia white matter loss in premanifest
Huntington’s disease.
Nair, A., Johnson, E.B., Gregory, S., Osbourne-Crowley, K., Zeun, P., Scahill, R.I.,
Lowe, J., Papoutsi, M., Palminteri, S., Rutledge, R.B., Rees, G., Tabrizi, S.J. Aberrant
striatal value representation in Huntington’s disease gene carriers 25 years before
onset.
Gregory, S., Wijeratne, P., Osborne-Crowley, K., Johnson, E.B., Zeun, P., Scahill,
R.I., Lowe, J., Nair, A., O’callaghan, C., Langley, C., Papoutsi, M., Estevez-Fraga,
C.E., Fayer, K., Alexander, D., Robbins, T.W., Sahakian, B.J., Tabrizi, S.J., Rees, G.
Neural connectivity as a substrate for behavioural compensation in premanifest
Huntington’s disease. Under peer review.
Johnson, E.B., Parker, C., Scahill, R.I., Gregory, S., Papoutsi, M., Zeun, P., Osborne-
Crowley, K., Lowe, J., Nair, A., Estevez-Fraga, C., Fayer, K., Rees, G., Zhang, G.,
Tabrizi, S.J. and the HD-YAS Investigators. Iron and myelin as markers of early
microstructural brain changes in premanifest Huntington’s disease

217
Langley, C., Gregory, S., Osborne-Crowley, K., O’Callaghan, C., Zeun, P., Lowe, J.,
Johnson, E.B., Papoutsi, M., Scahill, R.I., Rees, G., Tabrizi, S.J., Robbins, T.W.,
Sahakian, B.J. Fronto-striatal circuits for cognitive flexibility in far from onset
Huntington’s Disease: Evidence from the Young Adult Study. Under peer review.
* Joint first authors
218
8 References
Albin, R. L., A. Reiner, K. D. Anderson, L. S. t. Dure, B. Handelin, R. Balfour, et al. Preferential loss of striato-external pallidal projection neurons in presymptomatic Huntington's disease. Ann Neurol 1992; 31(4): 425-430.
Amorim, J. A., M. V. Gomes de Barros and M. M. Valenca. Post-dural (post-lumbar) puncture headache: risk factors and clinical features. Cephalalgia 2012; 32(12): 916-923.
Anderson, K. M., F. M. Krienen, E. Y. Choi, J. M. Reinen, B. T. T. Yeo and A. J. Holmes. Gene expression links functional networks across cortex and striatum. Nature Communications 2018; 9(1): 1428.
Andersson, J. L. R. and S. N. Sotiropoulos. An integrated approach to correction for off-resonance effects and subject movement in diffusion MR imaging. Neuroimage 2016; 125: 1063-1078.
Andrews, S. C., D. Craufurd, A. Durr, B. R. Leavitt, R. A. Roos, S. J. Tabrizi, et al. Executive impairment is associated with unawareness of neuropsychiatric symptoms in premanifest and early Huntington's disease. Neuropsychology 2018; 32(8): 958-965.
Ang, Y. S., P. Lockwood, M. A. Apps, K. Muhammed and M. Husain. Distinct Subtypes of Apathy Revealed by the Apathy Motivation Index. PLoS One 2017; 12(1): e0169938.
Ashburner, J. and K. J. Friston. Voxel-based morphometry--the methods. Neuroimage 2000; 11(6 Pt 1): 805-821.
Atkinson-Clement, C., S. Pinto, A. Eusebio and O. Coulon. Diffusion tensor imaging in Parkinson's disease: Review and meta-analysis. NeuroImage : Clinical 2017; 16: 98-110.
Aylward, E. H., N. B. Anderson, F. W. Bylsma, M. V. Wagster, P. E. Barta, M. Sherr, et al. Frontal lobe volume in patients with Huntington's disease. Neurology 1998; 50(1): 252-258.
Aylward, E. H., J. Brandt, A. M. Codori, R. S. Mangus, P. E. Barta and G. J. Harris. Reduced basal ganglia volume associated with the gene for Huntington's disease in asymptomatic at-risk persons. Neurology 1994; 44(5): 823-828.
Aylward, E. H., D. L. Harrington, J. A. Mills, P. C. Nopoulos, C. A. Ross, J. D. Long, et al. Regional atrophy associated with cognitive and motor function in prodromal Huntington disease. J Huntingtons Dis 2013; 2(4): 477-489.

219
Aylward, E. H., D. Liu, P. C. Nopoulos, C. A. Ross, R. K. Pierson, J. A. Mills, et al. Striatal Volume Contributes to the Prediction of Onset of Huntington Disease in Incident Cases. Biological Psychiatry 2012; 71(9): 822-828.
Aylward, E. H., P. C. Nopoulos, C. A. Ross, D. R. Langbehn, R. K. Pierson, J. A. Mills, et al. Longitudinal change in regional brain volumes in prodromal Huntington disease. J Neurol Neurosurg Psychiatry 2011; 82(4): 405-410.
Badhwar, A., A. Tam, C. Dansereau, P. Orban, F. Hoffstaedter and P. Bellec. Resting-state network dysfunction in Alzheimer's disease: A systematic review and meta-analysis. Alzheimers Dement (Amst) 2017; 8: 73-85.
Baggio, H. C., B. Segura, C. Junque, M. A. de Reus, R. Sala-Llonch and M. P. Van den Heuvel. Rich Club Organization and Cognitive Performance in Healthy Older Participants. J Cogn Neurosci 2015; 27(9): 1801-1810.
Baig, S. S., M. Strong, E. Rosser, N. V. Taverner, R. Glew, Z. Miedzybrodzka, et al. 22 Years of predictive testing for Huntington's disease: the experience of the UK Huntington's Prediction Consortium. Eur J Hum Genet 2016; 24(10): 1396-1402.
Baldacci, F., S. Lista, E. Cavedo, U. Bonuccelli and H. Hampel. Diagnostic function of the neuroinflammatory biomarker YKL-40 in Alzheimer's disease and other neurodegenerative diseases. Expert Rev Proteomics 2017; 14(4): 285-299.
Barker, R. A., S. L. Mason, T. P. Harrower, R. A. Swain, A. K. Ho, B. J. Sahakian, et al. The long-term safety and efficacy of bilateral transplantation of human fetal striatal tissue in patients with mild to moderate Huntington's disease. Journal of Neurology, Neurosurgery &amp; Psychiatry 2013; 84(6): 657.
Barnat, M., M. Capizzi, E. Aparicio, S. Boluda, D. Wennagel, R. Kacher, et al. Huntington's disease alters human neurodevelopment. Science 2020, 10.1126/science.aax3338.
Barth, M., F. Breuer, P. J. Koopmans, D. G. Norris and B. A. Poser. Simultaneous multislice (SMS) imaging techniques. Magn Reson Med 2016; 75(1): 63-81.
Basser, P. J., J. Mattiello and D. LeBihan. MR diffusion tensor spectroscopy and imaging. Biophys J 1994; 66(1): 259-267.
Bateman, R. J., T. L. Benzinger, S. Berry, D. B. Clifford, C. Duggan, A. M. Fagan, et al. The DIAN-TU Next Generation Alzheimer's prevention trial: Adaptive design and disease progression model. Alzheimers Dement 2017; 13(1): 8-19.
Bateman, R. J., C. Xiong, T. L. S. Benzinger, A. M. Fagan, A. Goate, N. C. Fox, et al. Clinical and Biomarker Changes in Dominantly Inherited Alzheimer's Disease. New England Journal of Medicine 2012; 367(9): 795-804.
Bates, G. P., R. Dorsey, J. F. Gusella, M. R. Hayden, C. Kay, B. R. Leavitt, et al. Huntington disease. Nat Rev Dis Primers 2015; 1: 15005.

220
Baum, G. L., Z. Cui, D. R. Roalf, R. Ciric, R. F. Betzel, B. Larsen, et al. Development of structure-function coupling in human brain networks during youth. Proc Natl Acad Sci U S A 2020; 117(1): 771-778.
Bazarian, J. J., P. Biberthaler, R. D. Welch, L. M. Lewis, P. Barzo, V. Bogner-Flatz, et al. Serum GFAP and UCH-L1 for prediction of absence of intracranial injuries on head CT (ALERT-TBI): a multicentre observational study. Lancet Neurol 2018; 17(9): 782-789.
Begeti, F., L. C. Schwab, S. L. Mason and R. A. Barker. Hippocampal dysfunction defines disease onset in Huntington's disease. J Neurol Neurosurg Psychiatry 2016; 87(9): 975-981.
Beglinger, L. J., D. R. Langbehn, K. Duff, L. Stierman, D. W. Black, C. Nehl, et al. Probability of obsessive and compulsive symptoms in Huntington's disease. Biol Psychiatry 2007; 61(3): 415-418.
Beglinger, L. J., J. J. O'Rourke, C. Wang, D. R. Langbehn, K. Duff and J. S. Paulsen. Earliest functional declines in Huntington disease. Psychiatry Res 2010; 178(2): 414-418.
Beglinger, L. J., J. S. Paulsen, D. B. Watson, C. Wang, K. Duff, D. R. Langbehn, et al. Obsessive and compulsive symptoms in prediagnosed Huntington's disease. J Clin Psychiatry 2008; 69(11): 1758-1765.
Behrens, T. E., H. Johansen-Berg, M. W. Woolrich, S. M. Smith, C. A. Wheeler-Kingshott, P. A. Boulby, et al. Non-invasive mapping of connections between human thalamus and cortex using diffusion imaging. Nat Neurosci 2003; 6(7): 750-757.
Ben Haim, L., M.-A. Carrillo-de Sauvage, K. Ceyzériat and C. Escartin. Elusive roles for reactive astrocytes in neurodegenerative diseases. Frontiers in Cellular Neuroscience 2015; 9(278).
Benjamini, Y. and Y. Hochberg. Controlling the False Discovery Rate: A Practical and Powerful Approach to Multiple Testing. Journal of the Royal Statistical Society: Series B (Methodological) 1995; 57(1): 289-300.
Benjamini, Y. and Y. Hochberg. On the Adaptive Control of the False Discovery Rate in Multiple Testing With Independent Statistics. Journal of Educational and Behavioral Statistics 2000; 25(1): 60-83.
Benraiss, A., S. Wang, S. Herrlinger, X. Li, D. Chandler-Militello, J. Mauceri, et al. Human glia can both induce and rescue aspects of disease phenotype in Huntington disease. Nat Commun 2016; 7: 11758.
Bhardwaj, R., J. W. Yester, S. K. Singh, D. D. Biswas, M. J. Surace, M. R. Waters, et al. RelB/p50 complexes regulate cytokine-induced YKL-40 expression. J Immunol 2015; 194(6): 2862-2870.

221
Biglan, K. M., C. A. Ross, D. R. Langbehn, E. H. Aylward, J. C. Stout, S. Queller, et al. Motor abnormalities in premanifest persons with Huntington's disease: the PREDICT-HD study. Mov Disord 2009; 24(12): 1763-1772.
Biglan, K. M., I. Shoulson, K. Kieburtz, D. Oakes, E. Kayson, M. A. Shinaman, et al. Clinical-Genetic Associations in the Prospective Huntington at Risk Observational Study (PHAROS): Implications for Clinical Trials. JAMA Neurol 2016; 73(1): 102-110.
Björkqvist, M., E. J. Wild and S. J. Tabrizi. Harnessing Immune Alterations in Neurodegenerative Diseases. Neuron 2009; 64(1): 21-24.
Bjorkqvist, M., E. J. Wild, J. Thiele, A. Silvestroni, R. Andre, N. Lahiri, et al. A novel pathogenic pathway of immune activation detectable before clinical onset in Huntington's disease. J Exp Med 2008; 205(8): 1869-1877.
Bland, A. R., J. P. Roiser, M. A. Mehta, T. Schei, H. Boland, D. K. Campbell-Meiklejohn, et al. EMOTICOM: A Neuropsychological Test Battery to Evaluate Emotion, Motivation, Impulsivity, and Social Cognition. Frontiers in Behavioral Neuroscience 2016; 10: 25.
Blennow, K., H. Hampel, M. Weiner and H. Zetterberg. Cerebrospinal fluid and plasma biomarkers in Alzheimer disease. Nat Rev Neurol 2010; 6(3): 131-144.
Bohanna, I., N. Georgiou-Karistianis and G. F. Egan. Connectivity-based segmentation of the striatum in Huntington's disease: vulnerability of motor pathways. Neurobiol Dis 2011; 42(3): 475-481.
Bonneh-Barkay, D., S. J. Bissel, J. Kofler, A. Starkey, G. Wang and C. A. Wiley. Astrocyte and Macrophage Regulation of YKL-40 Expression and Cellular Response in Neuroinflammation. Brain pathology (Zurich, Switzerland) 2012; 22(4): 530-546.
Bonneh-Barkay, D., G. Wang, W. A. Laframboise, C. A. Wiley and S. J. Bissel. Exacerbation of experimental autoimmune encephalomyelitis in the absence of breast regression protein 39/chitinase 3-like 1. J Neuropathol Exp Neurol 2012; 71(11): 948-958.
Bourbon-Teles, J., S. Bells, D. K. Jones, E. Coulthard, A. Rosser and C. Metzler-Baddeley. Myelin breakdown in human Huntington's disease: Multi-modal evidence from diffusion MRI and quantitative magnetization transfer. Neuroscience 2017, 10.1016/j.neuroscience.2017.05.042.
Bous Hufnagel, S. (2019). "Defining and Assessing Clinical Benefit: A Regulatory Perspective." Retrieved 14/12/2020, 2020, from https://www.fda.gov/media/131585/download.
Brayne, C., P. G. Ince, H. A. Keage, I. G. McKeith, F. E. Matthews, T. Polvikoski, et al. Education, the brain and dementia: neuroprotection or compensation? Brain 2010; 133(Pt 8): 2210-2216.

222
Bridel, C., W. N. van Wieringen, H. Zetterberg, B. M. Tijms, C. E. Teunissen, J. C. Alvarez-Cermeño, et al. Diagnostic Value of Cerebrospinal Fluid Neurofilament Light Protein in Neurology: A Systematic Review and Meta-analysis. JAMA Neurol 2019; 76(9): 1035-1048.
Broad, R. J., M. C. Gabel, N. G. Dowell, D. J. Schwartzman, A. K. Seth, H. Zhang, et al. Neurite orientation and dispersion density imaging (NODDI) detects cortical and corticospinal tract degeneration in ALS. Journal of Neurology, Neurosurgery &amp; Psychiatry 2019; 90(4): 404.
Bullmore, E. and O. Sporns. Complex brain networks: graph theoretical analysis of structural and functional systems. Nat Rev Neurosci 2009; 10(3): 186-198.
Buysse, D. J., C. F. Reynolds, 3rd, T. H. Monk, S. R. Berman and D. J. Kupfer. The Pittsburgh Sleep Quality Index: a new instrument for psychiatric practice and research. Psychiatry Res 1989; 28(2): 193-213.
Byrne, L. M., F. B. Rodrigues, K. Blennow, A. Durr, B. R. Leavitt, R. A. C. Roos, et al. Neurofilament light protein in blood as a potential biomarker of neurodegeneration in Huntington's disease: a retrospective cohort analysis. Lancet Neurol 2017; 16(8): 601-609.
Byrne, L. M., F. B. Rodrigues, E. B. Johnson, E. De Vita, K. Blennow, R. Scahill, et al. Cerebrospinal fluid neurogranin and TREM2 in Huntington's disease. Sci Rep 2018; 8(1): 4260.
Byrne, L. M., F. B. Rodrigues, E. B. Johnson, P. A. Wijeratne, E. De Vita, D. C. Alexander, et al. Evaluation of mutant huntingtin and neurofilament proteins as potential markers in Huntington's disease. Sci Transl Med 2018; 10(458).
Cammoun, L., X. Gigandet, D. Meskaldji, J. P. Thiran, O. Sporns, K. Q. Do, et al. Mapping the human connectome at multiple scales with diffusion spectrum MRI. J Neurosci Methods 2012; 203(2): 386-397.
Cariulo, C., L. Azzollini, M. Verani, P. Martufi, R. Boggio, A. Chiki, et al. Phosphorylation of huntingtin at residue T3 is decreased in Huntington's disease and modulates mutant huntingtin protein conformation. Proceedings of the National Academy of Sciences of the United States of America 2017; 114(50): E10809-E10818.
Chang, K. H., Y. R. Wu, Y. C. Chen and C. M. Chen. Plasma inflammatory biomarkers for Huntington's disease patients and mouse model. Brain Behav Immun 2015; 44: 121-127.
Chatterjee, A., K. E. Anderson, C. B. Moskowitz, W. A. Hauser and K. S. Marder. A comparison of self-report and caregiver assessment of depression, apathy, and irritability in Huntington's disease. J Neuropsychiatry Clin Neurosci 2005; 17(3): 378-383.

223
Chhatwal, J. P., A. P. Schultz, K. Johnson, T. L. Benzinger, C. Jack, Jr., B. M. Ances, et al. Impaired default network functional connectivity in autosomal dominant Alzheimer disease. Neurology 2013; 81(8): 736-744.
Choi, E. Y., B. T. T. Yeo and R. L. Buckner. The organization of the human striatum estimated by intrinsic functional connectivity. Journal of neurophysiology 2012; 108(8): 2242-2263.
Clinicaltrials.gov; NCT01760005 (2013). Dominantly Inherited Alzheimer Network Trial: An Opportunity to Prevent Dementia. A Study of Potential Disease Modifying Treatments in Individuals at Risk for or With a Type of Early Onset Alzheimer's Disease Caused by a Genetic Mutation, https://ClinicalTrials.gov/show/NCT01760005.
Clinicaltrials.gov; NCT02855476. (2016). "HDClarity: a Multi-site Cerebrospinal Fluid Collection Initiative to Facilitate Therapeutic Development for Huntington's Disease."
Clinicaltrials.gov; NCT03761849. (2018). "A Study to Evaluate the Efficacy and Safety of Intrathecally Administered RO7234292 (RG6042) in Patients With Manifest Huntington's Disease."
Clinicaltrials.gov; NCT03810898 (2020). iMagemHTT: FIH Evaluation of Novel Mutant Huntingtin PET Radioligands ¹¹C CHDI-00485180-R and ¹¹C CHDI-00485626, https://ClinicalTrials.gov/show/NCT03810898.
Clinicaltrials.gov; NCT04120493. (2019). "Safety and Proof-of-Concept (POC) Study With AMT-130 in Adults With Early Manifest Huntington Disease."
Coffey, S. R., M. Andrew, H. Ging, J. Hamilton, M. Flower, M. Kovalenko, et al. Huntingtin lowering reduces somatic instability at CAG-expanded loci. bioRxiv 2020, 10.1101/2020.07.23.218347: 2020.2007.2023.218347.
Constantinescu, R., M. Romer, D. Oakes, L. Rosengren and K. Kieburtz. Levels of the light subunit of neurofilament triplet protein in cerebrospinal fluid in Huntington's disease. Parkinsonism Relat Disord 2009; 15(3): 245-248.
Constantinescu, R., M. Romer, H. Zetterberg, L. Rosengren and K. Kieburtz. Increased levels of total tau protein in the cerebrospinal fluid in Huntington's disease. Parkinsonism Relat Disord 2011; 17(9): 714-715.
Cox, D. B. T., R. J. Platt and F. Zhang. Therapeutic genome editing: prospects and challenges. Nature medicine 2015; 21(2): 121-131.
Craufurd, D., J. C. Thompson and J. S. Snowden. Behavioral changes in Huntington Disease. Neuropsychiatry Neuropsychol Behav Neurol 2001; 14(4): 219-226.
Crawford, H. E., N. Z. Hobbs, R. Keogh, D. R. Langbehn, C. Frost, H. Johnson, et al. Corpus callosal atrophy in premanifest and early Huntington's disease. J Huntingtons Dis 2013; 2(4): 517-526.

224
Crotti, A., C. Benner, B. E. Kerman, D. Gosselin, C. Lagier-Tourenne, C. Zuccato, et al. Mutant Huntingtin promotes autonomous microglia activation via myeloid lineage-determining factors. Nat Neurosci 2014; 17(4): 513-521.
Crozier, S., N. Robertson and M. Dale. The psychological impact of predictive genetic testing for Huntington's disease: a systematic review of the literature. J Genet Couns 2015; 24(1): 29-39.
Currie, S., N. Hoggard, I. J. Craven, M. Hadjivassiliou and I. D. Wilkinson. Understanding MRI: basic MR physics for physicians. Postgraduate Medical Journal 2013; 89(1050): 209.
Cybulska, K., L. Perk, J. Booij, P. Laverman and M. Rijpkema. Huntington's Disease: A Review of the Known PET Imaging Biomarkers and Targeting Radiotracers. Molecules 2020; 25(3).
Dalrymple, A., E. J. Wild, R. Joubert, K. Sathasivam, M. Bjorkqvist, A. Petersen, et al. Proteomic profiling of plasma in Huntington's disease reveals neuroinflammatory activation and biomarker candidates. J Proteome Res 2007; 6(7): 2833-2840.
Dam, V. H., D. S. Stenbæk, K. Köhler-Forsberg, C. Ip, B. Ozenne, B. J. Sahakian, et al. Hot and cold cognitive disturbances in antidepressant-free patients with major depressive disorder: a NeuroPharm study. Psychol Med 2020, 10.1017/s0033291720000938: 1-10.
de Haan, W., K. Mott, E. C. van Straaten, P. Scheltens and C. J. Stam. Activity dependent degeneration explains hub vulnerability in Alzheimer's disease. PLoS Comput Biol 2012; 8(8): e1002582.
de la Monte, S. M., J. P. Vonsattel and E. P. Richardson, Jr. Morphometric demonstration of atrophic changes in the cerebral cortex, white matter, and neostriatum in Huntington's disease. J Neuropathol Exp Neurol 1988; 47(5): 516-525.
Delmaire, C., E. M. Dumas, M. A. Sharman, S. J. van den Bogaard, R. Valabregue, C. Jauffret, et al. The structural correlates of functional deficits in early huntington's disease. Hum Brain Mapp 2013; 34(9): 2141-2153.
Demirtaş, M., C. Falcon, A. Tucholka, J. D. Gispert, J. L. Molinuevo and G. Deco. A whole-brain computational modeling approach to explain the alterations in resting-state functional connectivity during progression of Alzheimer's disease. Neuroimage Clin 2017; 16: 343-354.
Desikan, R. S., F. Segonne, B. Fischl, B. T. Quinn, B. C. Dickerson, D. Blacker, et al. An automated labeling system for subdividing the human cerebral cortex on MRI scans into gyral based regions of interest. Neuroimage 2006; 31(3): 968-980.
Dexter, D. T., P. Jenner, A. H. Schapira and C. D. Marsden. Alterations in levels of iron, ferritin, and other trace metals in neurodegenerative diseases affecting the basal ganglia. The Royal Kings and Queens Parkinson's Disease Research Group. Ann Neurol 1992; 32 Suppl: S94-100.

225
Dhollander, T. and A. Connelly. A novel iterative approach to reap the benefits of multi-tissue CSD from just single-shell (+b=0) diffusion MRI data. 24th International Society of Magnetic Resonance in Medicine; 2016 Singapore.
Dhollander, T., R. Mito, D. Raffelt and A. Connelly. Improved white matter response function estimation for 3-tissue constrained spherical deconvolution. 27th International Society of Magnetic Resonance in Medicine; 2019 Montréal, Québec, Canada.
Diaz-Castro, B., M. R. Gangwani, X. Yu, G. Coppola and B. S. Khakh. Astrocyte molecular signatures in Huntington's disease. Sci Transl Med 2019; 11(514).
Domínguez, J. F., A. C. Ng, G. Poudel, J. C. Stout, A. Churchyard, P. Chua, et al. Iron accumulation in the basal ganglia in Huntington's disease: cross-sectional data from the IMAGE-HD study. J Neurol Neurosurg Psychiatry 2016; 87(5): 545-549.
Draganski, B., J. Ashburner, C. Hutton, F. Kherif, R. S. Frackowiak, G. Helms, et al. Regional specificity of MRI contrast parameter changes in normal ageing revealed by voxel-based quantification (VBQ). Neuroimage 2011; 55(4): 1423-1434.
Duff, K., J. Paulsen, J. Mills, L. J. Beglinger, D. J. Moser, M. M. Smith, et al. Mild cognitive impairment in prediagnosed Huntington disease. Neurology 2010; 75(6): 500-507.
Duff, K., J. S. Paulsen, L. J. Beglinger, D. R. Langbehn and J. C. Stout. Psychiatric symptoms in Huntington's disease before diagnosis: the predict-HD study. Biol Psychiatry 2007; 62(12): 1341-1346.
Duff, K., J. S. Paulsen, L. J. Beglinger, D. R. Langbehn, C. Wang, J. C. Stout, et al. "Frontal" behaviors before the diagnosis of Huntington's disease and their relationship to markers of disease progression: evidence of early lack of awareness. J Neuropsychiatry Clin Neurosci 2010; 22(2): 196-207.
Dumas, E. M., S. J. van den Bogaard, E. P. Hart, R. P. Soeter, M. A. van Buchem, J. van der Grond, et al. Reduced functional brain connectivity prior to and after disease onset in Huntington's disease. Neuroimage Clin 2013; 2: 377-384.
Dumas, E. M., S. J. van den Bogaard, M. E. Ruber, R. R. Reilman, J. C. Stout, D. Craufurd, et al. Early changes in white matter pathways of the sensorimotor cortex in premanifest Huntington's disease. Hum Brain Mapp 2012; 33(1): 203-212.
Dumas, E. M., M. J. Versluis, S. J. van den Bogaard, M. J. van Osch, E. P. Hart, W. M. van Roon-Mom, et al. Elevated brain iron is independent from atrophy in Huntington's Disease. Neuroimage 2012; 61(3): 558-564.
Dyrby, T. B., H. Lundell, M. W. Burke, N. L. Reislev, O. B. Paulson, M. Ptito, et al. Interpolation of diffusion weighted imaging datasets. Neuroimage 2014; 103: 202-213.

226
Eisenegger, C., M. Naef, A. Linssen, L. Clark, P. K. Gandamaneni, U. Muller, et al. Role of dopamine D2 receptors in human reinforcement learning. Neuropsychopharmacology 2014; 39(10): 2366-2375.
Eklund, A., T. E. Nichols and H. Knutsson. Cluster failure: Why fMRI inferences for spatial extent have inflated false-positive rates. Proc Natl Acad Sci U S A 2016; 113(28): 7900-7905.
Ellrichmann, G., C. Reick, C. Saft and R. A. Linker. The role of the immune system in Huntington's disease. Clin Dev Immunol 2013; 2013: 541259.
Enzi, B., M. A. Edel, S. Lissek, S. Peters, R. Hoffmann, V. Nicolas, et al. Altered ventral striatal activation during reward and punishment processing in premanifest Huntington's disease: a functional magnetic resonance study. Exp Neurol 2012; 235(1): 256-264.
Epping, E. A., J. I. Kim, D. Craufurd, T. M. Brashers-Krug, K. E. Anderson, E. McCusker, et al. Longitudinal Psychiatric Symptoms in Prodromal Huntington's Disease: A Decade of Data. Am J Psychiatry 2016; 173(2): 184-192.
Epping, E. A., J. A. Mills, L. J. Beglinger, J. G. Fiedorowicz, D. Craufurd, M. M. Smith, et al. Characterization of depression in prodromal Huntington disease in the neurobiological predictors of HD (PREDICT-HD) study. J Psychiatr Res 2013; 47(10): 1423-1431.
Espinoza, F. A., J. A. Turner, V. M. Vergara, R. L. Miller, E. Mennigen, J. Liu, et al. Whole-Brain Connectivity in a Large Study of Huntington's Disease Gene Mutation Carriers and Healthy Controls. Brain connectivity 2018; 8(3): 166-178.
Evans, S. J. W., I. Douglas, M. D. Rawlins, N. S. Wexler, S. J. Tabrizi and L. Smeeth. Prevalence of adult Huntington's disease in the UK based on diagnoses recorded in general practice records. Journal of neurology, neurosurgery, and psychiatry 2013; 84(10): 1156-1160.
Evers, M. M., J. Miniarikova, S. Juhas, A. Vallès, B. Bohuslavova, J. Juhasova, et al. AAV5-miHTT Gene Therapy Demonstrates Broad Distribution and Strong Human Mutant Huntingtin Lowering in a Huntington's Disease Minipig Model. Mol Ther 2018; 26(9): 2163-2177.
Fan, L., H. Li, J. Zhuo, Y. Zhang, J. Wang, L. Chen, et al. The Human Brainnetome Atlas: A New Brain Atlas Based on Connectional Architecture. Cereb Cortex 2016; 26(8): 3508-3526.
Farahani, F. V., W. Karwowski and N. R. Lighthall. Application of Graph Theory for Identifying Connectivity Patterns in Human Brain Networks: A Systematic Review. Front Neurosci 2019; 13: 585.
Faria, A. V., J. T. Ratnanather, D. J. Tward, D. S. Lee, F. van den Noort, D. Wu, et al. Linking white matter and deep gray matter alterations in premanifest Huntington disease. Neuroimage Clin 2016; 11: 450-460.

227
FDA, N. (2017). "FDA clears first 7T magnetic resonance imaging device." Retrieved 21/04/2020, from https://www.fda.gov/news-events/press-announcements/fda-clears-first-7t-magnetic-resonance-imaging-device
Fellows, R. P. and M. Schmitter-Edgecombe. Symbol Digit Modalities Test: Regression-Based Normative Data and Clinical Utility. Archives of Clinical Neuropsychology 2019; 35(1): 105-115.
Fischl, B., D. H. Salat, E. Busa, M. Albert, M. Dieterich, C. Haselgrove, et al. Whole brain segmentation: automated labeling of neuroanatomical structures in the human brain. Neuron 2002; 33(3): 341-355.
Foa, E. B., J. D. Huppert, S. Leiberg, R. Langner, R. Kichic, G. Hajcak, et al. The Obsessive-Compulsive Inventory: development and validation of a short version. Psychol Assess 2002; 14(4): 485-496.
Fodale, V., R. Boggio, M. Daldin, C. Cariulo, M. C. Spiezia, L. M. Byrne, et al. Validation of Ultrasensitive Mutant Huntingtin Detection in Human Cerebrospinal Fluid by Single Molecule Counting Immunoassay. Journal of Huntington's Disease 2017; 6(4): 349-361.
Fornito, A. and E. T. Bullmore. Connectomics: a new paradigm for understanding brain disease. Eur Neuropsychopharmacol 2015; 25(5): 733-748.
Fox, N. C., P. A. Freeborough and M. N. Rossor. Visualisation and quantification of rates of atrophy in Alzheimer's disease. Lancet 1996; 348(9020): 94-97.
Frank, M. J., L. C. Seeberger and C. O'Reilly R. By carrot or by stick: cognitive reinforcement learning in parkinsonism. Science 2004; 306(5703): 1940-1943.
Fritz, F. J., S. Sengupta, R. L. Harms, D. H. Tse, B. A. Poser and A. Roebroeck. Ultra-high resolution and multi-shell diffusion MRI of intact ex vivo human brains using kT-dSTEAM at 9.4T. NeuroImage 2019; 202: 116087.
Fusilli, C., S. Migliore, T. Mazza, F. Consoli, A. De Luca, G. Barbagallo, et al. Biological and clinical manifestations of juvenile Huntington's disease: a retrospective analysis. The Lancet. Neurology 2018; 17(11): 986-993.
Garcia-Miralles, M., N. Yusof, J. Y. Tan, C. I. Radulescu, H. Sidik, L. J. Tan, et al. Laquinimod Treatment Improves Myelination Deficits at the Transcriptional and Ultrastructural Levels in the YAC128 Mouse Model of Huntington Disease. Mol Neurobiol 2019; 56(6): 4464-4478.
Gargouri, F., A. Messé, V. Perlbarg, R. Valabregue, P. McColgan, L. Yahia-Cherif, et al. Longitudinal changes in functional connectivity of cortico-basal ganglia networks in manifests and premanifest huntington's disease. Hum Brain Mapp 2016; 37(11): 4112-4128.

228
Gauthier, S., M. Albert, N. Fox, M. Goedert, M. Kivipelto, J. Mestre-Ferrandiz, et al. Why has therapy development for dementia failed in the last two decades? Alzheimers Dement 2016; 12(1): 60-64.
Genc, S., C. M. W. Tax, E. P. Raven, M. Chamberland, G. D. Parker and D. K. Jones. Impact of b-value on estimates of apparent fibre density. Hum Brain Mapp 2020, 10.1002/hbm.24964.
Genetic Modifiers of Huntington’s Disease Consortium. CAG Repeat Not Polyglutamine Length Determines Timing of Huntington's Disease Onset. Cell 2019; 178(4): 887-900.e814.
Georgiou-Karistianis, N., R. Scahill, S. J. Tabrizi, F. Squitieri and E. Aylward. Structural MRI in Huntington's disease and recommendations for its potential use in clinical trials. Neurosci Biobehav Rev 2013; 37(3): 480-490.
Glasser, M. F., T. S. Coalson, E. C. Robinson, C. D. Hacker, J. Harwell, E. Yacoub, et al. A multi-modal parcellation of human cerebral cortex. Nature 2016; 536(7615): 171-178.
Gómez-Tortosa, E., M. E. MacDonald, J. C. Friend, S. A. Taylor, L. J. Weiler, L. A. Cupples, et al. Quantitative neuropathological changes in presymptomatic Huntington's disease. Ann Neurol 2001; 49(1): 29-34.
Goold, R., M. Flower, D. H. Moss, C. Medway, A. Wood-Kaczmar, R. Andre, et al. FAN1 modifies Huntington's disease progression by stabilizing the expanded HTT CAG repeat. Human molecular genetics 2019; 28(4): 650-661.
Gorges, M., H.-P. Müller, I. M. S. Mayer, G. S. Grupe, T. Kammer, G. Grön, et al. Intact sensory-motor network structure and function in far from onset premanifest Huntington's disease. Scientific reports 2017; 7: 43841-43841.
Graveland, G. A., R. S. Williams and M. DiFiglia. Evidence for degenerative and regenerative changes in neostriatal spiny neurons in Huntington's disease. Science 1985; 227(4688): 770-773.
Gregory, S., J. H. Cole, R. E. Farmer, E. M. Rees, R. A. Roos, R. Sprengelmeyer, et al. Longitudinal Diffusion Tensor Imaging Shows Progressive Changes in White Matter in Huntington's Disease. J Huntingtons Dis 2015; 4(4): 333-346.
Gregory, S., H. Crawford, K. Seunarine, B. Leavitt, A. Durr, R. A. C. Roos, et al. Natural biological variation of white matter microstructure is accentuated in Huntington's disease. Hum Brain Mapp 2018; 39(9): 3516-3527.
Gregory, S., E. Johnson, L. M. Byrne, F. B. Rodrigues, A. Henderson, J. Moss, et al. Characterizing White Matter in Huntington's Disease. Mov Disord Clin Pract 2020; 7(1): 52-60.

229
Gregory, S., J. D. Long, S. Klöppel, A. Razi, E. Scheller, L. Minkova, et al. Testing a longitudinal compensation model in premanifest Huntington's disease. Brain 2018; 141(7): 2156-2166.
Gregory, S., J. D. Long, S. J. Tabrizi and G. Rees. Measuring compensation in neurodegeneration using MRI. Curr Opin Neurol 2017; 30(4): 380-387.
Gregory, S. and R. I. Scahill. Functional Magnetic Resonance Imaging in Huntington's Disease. Int Rev Neurobiol 2018; 142: 381-408.
Gregory, S., R. I. Scahill, G. Rees and S. Tabrizi. Magnetic Resonance Imaging in Huntington's Disease. Methods Mol Biol 2018; 1780: 303-328.
Gregory, S., R. I. Scahill, K. K. Seunarine, C. Stopford, H. Zhang, J. Zhang, et al. Neuropsychiatry and White Matter Microstructure in Huntington's Disease. J Huntingtons Dis 2015; 4(3): 239-249.
Grussu, F., T. Schneider, C. Tur, R. L. Yates, M. Tachrount, A. Ianus, et al. Neurite dispersion: a new marker of multiple sclerosis spinal cord pathology? Ann Clin Transl Neurol 2017; 4(9): 663-679.
Haber, S. N. The primate basal ganglia: parallel and integrative networks. J Chem Neuroanat 2003; 26(4): 317-330.
Haber, S. N. Corticostriatal circuitry. Dialogues Clin Neurosci 2016; 18(1): 7-21.
Haber, S. N., K. S. Kim, P. Mailly and R. Calzavara. Reward-related cortical inputs define a large striatal region in primates that interface with associative cortical connections, providing a substrate for incentive-based learning. J Neurosci 2006; 26(32): 8368-8376.
Harrington, D. L., D. Liu, M. M. Smith, J. A. Mills, J. D. Long, E. H. Aylward, et al. Neuroanatomical correlates of cognitive functioning in prodromal Huntington disease. Brain Behav 2014; 4(1): 29-40.
Harrington, D. L., J. D. Long, S. Durgerian, L. Mourany, K. Koenig, A. Bonner-Jackson, et al. Cross-sectional and longitudinal multimodal structural imaging in prodromal Huntington's disease. Mov Disord 2016; 31(11): 1664-1675.
Harrington, D. L., M. Rubinov, S. Durgerian, L. Mourany, C. Reece, K. Koenig, et al. Network topology and functional connectivity disturbances precede the onset of Huntington's disease. Brain 2015; 138(Pt 8): 2332-2346.
Hart, E. P., E. M. Dumas, R. H. A. M. Reijntjes, K. van der Hiele, S. J. A. van den Bogaard, H. A. M. Middelkoop, et al. Deficient sustained attention to response task and P300 characteristics in early Huntington's disease. Journal of neurology 2012; 259(6): 1191-1198.

230
Hawrylycz, M. J., E. S. Lein, A. L. Guillozet-Bongaarts, E. H. Shen, L. Ng, J. A. Miller, et al. An anatomically comprehensive atlas of the adult human brain transcriptome. Nature 2012; 489(7416): 391-399.
HD iPSC Consortium. Developmental alterations in Huntington's disease neural cells and pharmacological rescue in cells and mice. Nature neuroscience 2017; 20(5): 648-660.
Heath, C. J., C. O'Callaghan, S. L. Mason, B. U. Phillips, L. M. Saksida, T. W. Robbins, et al. A Touchscreen Motivation Assessment Evaluated in Huntington's Disease Patients and R6/1 Model Mice. Frontiers in neurology 2019; 10: 858-858.
Heinsen, H., U. Rüb, M. Bauer, G. Ulmar, B. Bethke, M. Schüler, et al. Nerve cell loss in the thalamic mediodorsal nucleus in Huntington's disease. Acta Neuropathol 1999; 97(6): 613-622.
Heinsen, H., U. Rüb, D. Gangnus, G. Jungkunz, M. Bauer, G. Ulmar, et al. Nerve cell loss in the thalamic centromedian-parafascicular complex in patients with Huntington's disease. Acta Neuropathol 1996; 91(2): 161-168.
Helder, D. I., A. A. Kaptein, G. M. Van Kempen, J. Weinman, H. C. Van Houwelingen and R. A. Roos. Living with Huntington's disease: Illness perceptions, coping mechanisms, and patients' well-being. Br J Health Psychol 2002; 7(Part 4): 449-462.
Heller, C., M. S. Foiani, K. Moore, R. Convery, M. Bocchetta, M. Neason, et al. Plasma glial fibrillary acidic protein is raised in progranulin-associated frontotemporal dementia. J Neurol Neurosurg Psychiatry 2020; 91(3): 263-270.
Heneka, M. T., M. J. Carson, J. El Khoury, G. E. Landreth, F. Brosseron, D. L. Feinstein, et al. Neuroinflammation in Alzheimer's disease. Lancet Neurol 2015; 14(4): 388-405.
Henley, S. M., C. Frost, D. G. MacManus, T. T. Warner, N. C. Fox and S. J. Tabrizi. Increased rate of whole-brain atrophy over 6 months in early Huntington disease. Neurology 2006; 67(4): 694-696.
Henley, S. M., M. J. Novak, C. Frost, J. King, S. J. Tabrizi and J. D. Warren. Emotion recognition in Huntington's disease: a systematic review. Neurosci Biobehav Rev 2012; 36(1): 237-253.
Henley, S. M., E. J. Wild, N. Z. Hobbs, J. D. Warren, C. Frost, R. I. Scahill, et al. Defective emotion recognition in early HD is neuropsychologically and anatomically generic. Neuropsychologia 2008; 46(8): 2152-2160.
Hensman Moss, D. J., A. F. Pardinas, D. Langbehn, K. Lo, B. R. Leavitt, R. Roos, et al. Identification of genetic variants associated with Huntington's disease progression: a genome-wide association study. Lancet Neurol 2017; 16(9): 701-711.
Hersch, S., D. Claassen, M. Edmondson, E. Wild, R. Guerciolini and M. Panzara. Multicenter, Randomized, Double-blind, Placebo-controlled Phase 1b/2a Studies of
231
WVE-120101 and WVE-120102 in Patients with Huntington’s Disease (P2.006). Neurology 2017; 88(16 Supplement): P2.006.
Hesse, R. and C. M. Henstridge. FENS-Kavli winter symposium: Addressing the cellular phase of dementia-visions of the UK Dementia Research Institute. Eur J Neurosci 2018; 48(2): 1720-1722.
Hibar, D. P., J. L. Stein, M. E. Renteria, A. Arias-Vasquez, S. Desrivieres, N. Jahanshad, et al. Common genetic variants influence human subcortical brain structures. Nature 2015; 520(7546): 224-229.
Hinzen, W., J. Rosselló, C. Morey, E. Camara, C. Garcia-Gorro, R. Salvador, et al. A systematic linguistic profile of spontaneous narrative speech in pre-symptomatic and early stage Huntington's disease. Cortex 2018; 100: 71-83.
Ho, A. K., A. O. Robbins and R. A. Barker. Huntington's disease patients have selective problems with insight. Mov Disord 2006; 21(3): 385-389.
Ho, A. K., A. O. Robbins, S. J. Walters, S. Kaptoge, B. J. Sahakian and R. A. Barker. Health-related quality of life in Huntington's disease: a comparison of two generic instruments, SF-36 and SIP. Mov Disord 2004; 19(11): 1341-1348.
Ho, A. K., B. J. Sahakian, R. G. Brown, R. A. Barker, J. R. Hodges, M. N. Ane, et al. Profile of cognitive progression in early Huntington's disease. Neurology 2003; 61(12): 1702-1706.
Hobbs, N. Z., R. E. Farmer, E. M. Rees, J. H. Cole, S. Haider, I. B. Malone, et al. Short-interval observational data to inform clinical trial design in Huntington's disease. J Neurol Neurosurg Psychiatry 2015; 86(12): 1291-1298.
Hobbs, N. Z., A. V. Pedrick, M. J. Say, C. Frost, R. Dar Santos, A. Coleman, et al. The structural involvement of the cingulate cortex in premanifest and early Huntington's disease. Mov Disord 2011; 26(9): 1684-1690.
Hodges, A., A. D. Strand, A. K. Aragaki, A. Kuhn, T. Sengstag, G. Hughes, et al. Regional and cellular gene expression changes in human Huntington's disease brain. Hum Mol Genet 2006; 15(6): 965-977.
Hogarth, P., E. Kayson, K. Kieburtz, K. Marder, D. Oakes, D. Rosas, et al. Interrater agreement in the assessment of motor manifestations of Huntington's disease. Mov Disord 2005; 20(3): 293-297.
Huang, B., W. Wei, G. Wang, M. A. Gaertig, Y. Feng, W. Wang, et al. Mutant huntingtin downregulates myelin regulatory factor-mediated myelin gene expression and affects mature oligodendrocytes. Neuron 2015; 85(6): 1212-1226.
Huntington Study Group. Unified Huntington's Disease Rating Scale: reliability and consistency. Mov Disord 1996; 11(2): 136-142.

232
Huntington Study Group. Unified Huntington's Disease Rating Scale: reliability and consistency. Huntington Study Group. Mov Disord 1996; 11(2): 136-142.
Hutvagner, G. and M. J. Simard. Argonaute proteins: key players in RNA silencing. Nature reviews. Molecular cell biology 2008; 9(1): 22-32.
Jenkinson, M., C. F. Beckmann, T. E. J. Behrens, M. W. Woolrich and S. M. Smith. FSL. NeuroImage 2012; 62(2): 782-790.
Jeurissen, B., A. Leemans, J. D. Tournier, D. K. Jones and J. Sijbers. Investigating the prevalence of complex fiber configurations in white matter tissue with diffusion magnetic resonance imaging. Hum Brain Mapp 2013; 34(11): 2747-2766.
Jeurissen, B., J. D. Tournier, T. Dhollander, A. Connelly and J. Sijbers. Multi-tissue constrained spherical deconvolution for improved analysis of multi-shell diffusion MRI data. Neuroimage 2014; 103: 411-426.
Jin, J., Q. Peng, Z. Hou, M. Jiang, X. Wang, A. J. Langseth, et al. Early white matter abnormalities, progressive brain pathology and motor deficits in a novel knock-in mouse model of Huntington's disease. Human Molecular Genetics 2015; 24(9): 2508-2527.
Johansen-Berg, H., T. E. Behrens, E. Sillery, O. Ciccarelli, A. J. Thompson, S. M. Smith, et al. Functional-anatomical validation and individual variation of diffusion tractography-based segmentation of the human thalamus. Cereb Cortex 2005; 15(1): 31-39.
Johnson, E. B., L. M. Byrne, S. Gregory, F. B. Rodrigues, K. Blennow, A. Durr, et al. Neurofilament light protein in blood predicts regional atrophy in Huntington disease. Neurology 2018; 90(8): e717-e723.
Johnson, S. A., J. C. Stout, A. C. Solomon, D. R. Langbehn, E. H. Aylward, C. B. Cruce, et al. Beyond disgust: impaired recognition of negative emotions prior to diagnosis in Huntington's disease. Brain 2007; 130(Pt 7): 1732-1744.
Jones, D. K., T. R. Knosche and R. Turner. White matter integrity, fiber count, and other fallacies: the do's and don'ts of diffusion MRI. Neuroimage 2013; 73: 239-254.
Julien, C. L., J. C. Thompson, S. Wild, P. Yardumian, J. S. Snowden, G. Turner, et al. Psychiatric disorders in preclinical Huntington's disease. J Neurol Neurosurg Psychiatry 2007; 78(9): 939-943.
Jurgens, C. K., L. van de Wiel, A. C. van Es, Y. M. Grimbergen, M. N. Witjes-Ane, J. van der Grond, et al. Basal ganglia volume and clinical correlates in 'preclinical' Huntington's disease. J Neurol 2008; 255(11): 1785-1791.
Keihaninejad, S., H. Zhang, N. S. Ryan, I. B. Malone, M. Modat, M. J. Cardoso, et al. An unbiased longitudinal analysis framework for tracking white matter changes using diffusion tensor imaging with application to Alzheimer's disease. Neuroimage 2013; 72: 153-163.

233
Kellner, E., B. Dhital, V. G. Kiselev and M. Reisert. Gibbs-ringing artifact removal based on local subvoxel-shifts. Magn Reson Med 2016; 76(5): 1574-1581.
Khalil, M., C. E. Teunissen, M. Otto, F. Piehl, M. P. Sormani, T. Gattringer, et al. Neurofilaments as biomarkers in neurological disorders. Nat Rev Neurol 2018; 14(10): 577-589.
Kipps, C., A. Duggins, N. Mahant, L. Gomes, J. Ashburner and E. McCusker. Progression of structural neuropathology in preclinical Huntington's disease: a tensor based morphometry study. Journal of Neurology, Neurosurgery, and Psychiatry 2005; 76(5): 650-655.
Kirkwood, S. C., E. Siemers, R. Viken, M. E. Hodes, P. M. Conneally, J. C. Christian, et al. Longitudinal personality changes among presymptomatic Huntington disease gene carriers. Neuropsychiatry Neuropsychol Behav Neurol 2002; 15(3): 192-197.
Klein, G., P. Delmar, N. Voyle, S. Rehal, C. Hofmann, D. Abi-Saab, et al. Gantenerumab reduces amyloid-β plaques in patients with prodromal to moderate Alzheimer's disease: a PET substudy interim analysis. Alzheimers Res Ther 2019; 11(1): 101.
Kloppel, S., B. Draganski, C. V. Golding, C. Chu, Z. Nagy, P. A. Cook, et al. White matter connections reflect changes in voluntary-guided saccades in pre-symptomatic Huntington's disease. Brain 2008; 131(Pt 1): 196-204.
Kloppel, S., S. Gregory, E. Scheller, L. Minkova, A. Razi, A. Durr, et al. Compensation in Preclinical Huntington's Disease: Evidence From the Track-On HD Study. EBioMedicine 2015; 2(10): 1420-1429.
Korthauer, K., P. K. Kimes, C. Duvallet, A. Reyes, A. Subramanian, M. Teng, et al. A practical guide to methods controlling false discoveries in computational biology. Genome Biology 2019; 20(1): 118.
Kuhle, J., H. Kropshofer, D. A. Haering, U. Kundu, R. Meinert, C. Barro, et al. Blood neurofilament light chain as a biomarker of MS disease activity and treatment response. Neurology 2019; 92(10): e1007-e1015.
Kullmann, S., M. F. Callaghan, M. Heni, N. Weiskopf, K. Scheffler, H. U. Häring, et al. Specific white matter tissue microstructure changes associated with obesity. Neuroimage 2016; 125: 36-44.
Landwehrmeyer, G. B., C. J. Fitzer-Attas, J. D. Giuliano, N. Gonçalves, K. E. Anderson, F. Cardoso, et al. Data Analytics from Enroll-HD, a Global Clinical Research Platform for Huntington's Disease. Movement disorders clinical practice 2016; 4(2): 212-224.
Langbehn, D. R., R. R. Brinkman, D. Falush, J. S. Paulsen and M. R. Hayden. A new model for prediction of the age of onset and penetrance for Huntington's disease based on CAG length. Clin Genet 2004; 65(4): 267-277.
234
Langbehn, D. R., M. R. Hayden and J. S. Paulsen. CAG-repeat length and the age of onset in Huntington disease (HD): a review and validation study of statistical approaches. Am J Med Genet B Neuropsychiatr Genet 2010; 153b(2): 397-408.
Langbehn, D. R. and S. Hersch. Clinical Outcomes and Selection Criteria for Prodromal Huntington's Disease Trials. Movement Disorders 2020; n/a(n/a).
Langbehn, D. R., J. C. Stout, S. Gregory, J. A. Mills, A. Durr, B. R. Leavitt, et al. Association of CAG Repeats With Long-term Progression in Huntington Disease. JAMA Neurology 2019; 76(11): 1375-1385.
Lawrence, A. D., J. R. Hodges, A. E. Rosser, A. Kershaw, C. ffrench-Constant, D. C. Rubinsztein, et al. Evidence for specific cognitive deficits in preclinical Huntington's disease. Brain 1998; 121 ( Pt 7): 1329-1341.
Lawrence, A. D., B. J. Sahakian, J. R. Hodges, A. E. Rosser, K. W. Lange and T. W. Robbins. Executive and mnemonic functions in early Huntington's disease. Brain 1996; 119 ( Pt 5): 1633-1645.
Lawrence, A. D., L. H. Watkins, B. J. Sahakian, J. R. Hodges and T. W. Robbins. Visual object and visuospatial cognition in Huntington's disease: implications for information processing in corticostriatal circuits. Brain 2000; 123 ( Pt 7): 1349-1364.
Le Bihan, D., J. F. Mangin, C. Poupon, C. A. Clark, S. Pappata, N. Molko, et al. Diffusion tensor imaging: concepts and applications. J Magn Reson Imaging 2001; 13(4): 534-546.
Le Heron, C., M. A. J. Apps and M. Husain. The anatomy of apathy: A neurocognitive framework for amotivated behaviour. Neuropsychologia 2018; 118: 54-67.
Ledig, C., R. A. Heckemann, A. Hammers, J. C. Lopez, V. F. Newcombe, A. Makropoulos, et al. Robust whole-brain segmentation: application to traumatic brain injury. Med Image Anal 2015; 21(1): 40-58.
Lee, J. M., E. M. Ramos, J. H. Lee, T. Gillis, J. S. Mysore, M. R. Hayden, et al. CAG repeat expansion in Huntington disease determines age at onset in a fully dominant fashion. Neurology 2012; 78(10): 690-695.
Lemay, M., E. Fimbel, A. Beuter, S. Chouinard and F. Richer. Sensorimotor mapping affects movement correction deficits in early Huntington's disease. Exp Brain Res 2005; 165(4): 454-460.
Levy, R. and B. Dubois. Apathy and the functional anatomy of the prefrontal cortex-basal ganglia circuits. Cereb Cortex 2006; 16(7): 916-928.
Liu, J.-P. and S. O. Zeitlin. Is Huntingtin Dispensable in the Adult Brain? Journal of Huntington's disease 2017; 6(1): 1-17.

235
Llorens, F., K. Thüne, W. Tahir, E. Kanata, D. Diaz-Lucena, K. Xanthopoulos, et al. YKL-40 in the brain and cerebrospinal fluid of neurodegenerative dementias. Molecular Neurodegeneration 2017; 12(1): 83.
Long, J. D., J. S. Paulsen, K. Marder, Y. Zhang, J. I. Kim and J. A. Mills. Tracking motor impairments in the progression of Huntington's disease. Mov Disord 2014; 29(3): 311-319.
Losekoot, M., M. J. van Belzen, S. Seneca, P. Bauer, S. A. R. Stenhouse, D. E. Barton, et al. EMQN/CMGS best practice guidelines for the molecular genetic testing of Huntington disease. European journal of human genetics : EJHG 2013; 21(5): 480-486.
Mahoney, C. J., I. J. Simpson, J. M. Nicholas, P. D. Fletcher, L. E. Downey, H. L. Golden, et al. Longitudinal diffusion tensor imaging in frontotemporal dementia. Ann Neurol 2015; 77(1): 33-46.
Maier-Hein, K. H., P. F. Neher, J. C. Houde, M. A. Côté, E. Garyfallidis, J. Zhong, et al. The challenge of mapping the human connectome based on diffusion tractography. Nat Commun 2017; 8(1): 1349.
Majid, D. S., A. R. Aron, W. Thompson, S. Sheldon, S. Hamza, D. Stoffers, et al. Basal ganglia atrophy in prodromal Huntington's disease is detectable over one year using automated segmentation. Mov Disord 2011; 26(14): 2544-2551.
Margulies, D. S., S. S. Ghosh, A. Goulas, M. Falkiewicz, J. M. Huntenburg, G. Langs, et al. Situating the default-mode network along a principal gradient of macroscale cortical organization. Proc Natl Acad Sci U S A 2016; 113(44): 12574-12579.
Marrakchi-Kacem, L., C. Delmaire, P. Guevara, F. Poupon, S. Lecomte, A. Tucholka, et al. Mapping cortico-striatal connectivity onto the cortical surface: a new tractography-based approach to study Huntington disease. PLoS One 2013; 8(2): e53135.
Martinez-Horta, S., J. Perez-Perez, E. van Duijn, R. Fernandez-Bobadilla, M. Carceller, J. Pagonabarraga, et al. Neuropsychiatric symptoms are very common in premanifest and early stage Huntington's Disease. Parkinsonism Relat Disord 2016; 25: 58-64.
McColgan, P., S. Gregory, A. Razi, K. K. Seunarine, F. Gargouri, A. Durr, et al. White matter predicts functional connectivity in premanifest Huntington's disease. Ann Clin Transl Neurol 2017; 4(2): 106-118.
McColgan, P., J. Joubert, S. J. Tabrizi and G. Rees. The human motor cortex microcircuit: insights for neurodegenerative disease. Nat Rev Neurosci 2020, 10.1038/s41583-020-0315-1.
McColgan, P., A. Razi, S. Gregory, K. K. Seunarine, A. Durr, R. A C Roos, et al. Structural and functional brain network correlates of depressive symptoms in premanifest Huntington's disease. Human brain mapping 2017; 38(6): 2819-2829.

236
McColgan, P., K. K. Seunarine, S. Gregory, A. Razi, M. Papoutsi, J. D. Long, et al. Topological length of white matter connections predicts their rate of atrophy in premanifest Huntington's disease. JCI insight 2017; 2(8): e92641.
McColgan, P., K. K. Seunarine, A. Razi, J. H. Cole, S. Gregory, A. Durr, et al. Selective vulnerability of Rich Club brain regions is an organizational principle of structural connectivity loss in Huntington's disease. Brain 2015; 138(Pt 11): 3327-3344.
McCusker, E. A., D. G. Gunn, E. A. Epping, C. T. Loy, K. Radford, J. Griffith, et al. Unawareness of motor phenoconversion in Huntington disease. Neurology 2013; 81(13): 1141-1147.
McFarland, N. R. and S. N. Haber. Thalamic relay nuclei of the basal ganglia form both reciprocal and nonreciprocal cortical connections, linking multiple frontal cortical areas. J Neurosci 2002; 22(18): 8117-8132.
McKiernan, E. F. and J. T. O’Brien. 7T MRI for neurodegenerative dementias in vivo: a systematic review of the literature. Journal of Neurology, Neurosurgery &amp; Psychiatry 2017; 88(7): 564.
Menke, R. A., E. Gray, C. H. Lu, J. Kuhle, K. Talbot, A. Malaspina, et al. CSF neurofilament light chain reflects corticospinal tract degeneration in ALS. Ann Clin Transl Neurol 2015; 2(7): 748-755.
Merluzzi, A. P., C. M. Carlsson, S. C. Johnson, S. E. Schindler, S. Asthana, K. Blennow, et al. Neurodegeneration, synaptic dysfunction, and gliosis are phenotypic of Alzheimer dementia. Neurology 2018; 91(5): e436-e443.
Mesulam, M. The evolving landscape of human cortical connectivity: facts and inferences. Neuroimage 2012; 62(4): 2182-2189.
Mills, S. M., J. Mallmann, A. M. Santacruz, A. Fuqua, M. Carril, P. S. Aisen, et al. Preclinical trials in autosomal dominant AD: implementation of the DIAN-TU trial. Rev Neurol (Paris) 2013; 169(10): 737-743.
Mitchell, T., D. B. Archer, W. T. Chu, S. A. Coombes, S. Lai, B. J. Wilkes, et al. Neurite orientation dispersion and density imaging (NODDI) and free-water imaging in Parkinsonism. Hum Brain Mapp 2019; 40(17): 5094-5107.
Mito, R., D. Raffelt, T. Dhollander, D. N. Vaughan, J. D. Tournier, O. Salvado, et al. Fibre-specific white matter reductions in Alzheimer's disease and mild cognitive impairment. Brain 2018, 10.1093/brain/awx355.
Modat, M., G. R. Ridgway, Z. A. Taylor, M. Lehmann, J. Barnes, D. J. Hawkes, et al. Fast free-form deformation using graphics processing units. Comput Methods Programs Biomed 2010; 98(3): 278-284.
Molero, A. E., E. E. Arteaga-Bracho, C. H. Chen, M. Gulinello, M. L. Winchester, N. Pichamoorthy, et al. Selective expression of mutant huntingtin during development

237
recapitulates characteristic features of Huntington's disease. Proc Natl Acad Sci U S A 2016; 113(20): 5736-5741.
Molina-Calavita, M., M. Barnat, S. Elias, E. Aparicio, M. Piel and S. Humbert. Mutant huntingtin affects cortical progenitor cell division and development of the mouse neocortex. J Neurosci 2014; 34(30): 10034-10040.
Monserrate, A. E., D. C. Ryman, S. Ma, C. Xiong, J. M. Noble, J. M. Ringman, et al. Factors associated with the onset and persistence of post-lumbar puncture headache. JAMA Neurol 2015; 72(3): 325-332.
Mori, S., K. Oishi, H. Jiang, L. Jiang, X. Li, K. Akhter, et al. Stereotaxic white matter atlas based on diffusion tensor imaging in an ICBM template. Neuroimage 2008; 40(2): 570-582.
Morris, L. S., P. Kundu, N. Dowell, D. J. Mechelmans, P. Favre, M. A. Irvine, et al. Fronto-striatal organization: Defining functional and microstructural substrates of behavioural flexibility. Cortex 2016; 74: 118-133.
Mueller, S., D. Wang, M. D. Fox, B. T. Yeo, J. Sepulcre, M. R. Sabuncu, et al. Individual variability in functional connectivity architecture of the human brain. Neuron 2013; 77(3): 586-595.
Muller, M. and B. R. Leavitt. Iron dysregulation in Huntington's disease. J Neurochem 2014; 130(3): 328-350.
Myers, R. H., J. P. Vonsattel, P. A. Paskevich, D. K. Kiely, T. J. Stevens, L. A. Cupples, et al. Decreased Neuronal and Increased Oligodendroglial Densities in Huntington's Disease Caudate Nucleus. Journal of Neuropathology & Experimental Neurology 1991; 50(6): 729-742.
Naidoo, J., L. M. Stanek, K. Ohno, S. Trewman, L. Samaranch, P. Hadaczek, et al. Extensive Transduction and Enhanced Spread of a Modified AAV2 Capsid in the Non-human Primate CNS. Molecular therapy : the journal of the American Society of Gene Therapy 2018; 26(10): 2418-2430.
Nanetti, L., V. E. Contarino, A. Castaldo, L. Sarro, A. C. Bachoud-Levi, M. Giavazzi, et al. Cortical thickness, stance control, and arithmetic skill: An exploratory study in premanifest Huntington disease. Parkinsonism Relat Disord 2018; 51: 17-23.
Nath, S., A. Koziarz, J. H. Badhiwala, W. Alhazzani, R. Jaeschke, S. Sharma, et al. Atraumatic versus conventional lumbar puncture needles: a systematic review and meta-analysis. Lancet 2018; 391(10126): 1197-1204.
Nemeth, D., C. D. Dye, T. Sefcsik, K. Janacsek, Z. Turi, Z. Londe, et al. Language deficits in pre-symptomatic Huntington's disease: evidence from Hungarian. Brain Lang 2012; 121(3): 248-253.

238
Ng, A. S. L., Y. J. Tan, Z. Lu, E. Y. Ng, S. Y. E. Ng, N. S. Y. Chia, et al. Plasma ubiquitin C-terminal hydrolase L1 levels reflect disease stage and motor severity in Parkinson's disease. Aging (Albany NY) 2020; 12(2): 1488-1495.
Nguyen, M., Y. C. Wong, D. Ysselstein, A. Severino and D. Krainc. Synaptic, Mitochondrial, and Lysosomal Dysfunction in Parkinson's Disease. Trends Neurosci 2019; 42(2): 140-149.
Niemelä, V., J. Burman, K. Blennow, H. Zetterberg, A. Larsson and J. Sundblom. Cerebrospinal fluid sCD27 levels indicate active T cell-mediated inflammation in premanifest Huntington's disease. PLoS ONE 2018; 13(2): e0193492.
Niemela, V., A. M. Landtblom, K. Blennow and J. Sundblom. Tau or neurofilament light-Which is the more suitable biomarker for Huntington's disease? PLoS One 2017; 12(2): e0172762.
Nithianantharajah, J. and A. J. Hannan. Dysregulation of synaptic proteins, dendritic spine abnormalities and pathological plasticity of synapses as experience-dependent mediators of cognitive and psychiatric symptoms in Huntington's disease. Neuroscience 2013; 251: 66-74.
Noble, S., D. Scheinost and R. T. Constable. A decade of test-retest reliability of functional connectivity: A systematic review and meta-analysis. Neuroimage 2019; 203: 116157.
Novak, M. J., K. K. Seunarine, C. R. Gibbard, P. McColgan, B. Draganski, K. Friston, et al. Basal ganglia-cortical structural connectivity in Huntington's disease. Hum Brain Mapp 2015; 36(5): 1728-1740.
O'Rourke, J. J., L. J. Beglinger, M. M. Smith, J. Mills, D. J. Moser, K. C. Rowe, et al. The Trail Making Test in prodromal Huntington disease: contributions of disease progression to test performance. J Clin Exp Neuropsychol 2011; 33(5): 567-579.
Odish, O. F., A. Leemans, R. H. Reijntjes, S. J. van den Bogaard, E. M. Dumas, R. Wolterbeek, et al. Microstructural brain abnormalities in Huntington's disease: A two-year follow-up. Hum Brain Mapp 2015; 36(6): 2061-2074.
Odish, O. F. F., A. A. van den Berg-Huysmans, S. J. A. van den Bogaard, E. M. Dumas, E. P. Hart, S. A. R. B. Rombouts, et al. Longitudinal resting state fMRI analysis in healthy controls and premanifest Huntington's disease gene carriers: a three-year follow-up study. Human brain mapping 2015; 36(1): 110-119.
Öhrfelt, A., P. Johansson, A. Wallin, U. Andreasson, H. Zetterberg, K. Blennow, et al. Increased Cerebrospinal Fluid Levels of Ubiquitin Carboxyl-Terminal Hydrolase L1 in Patients with Alzheimer's Disease. Dement Geriatr Cogn Dis Extra 2016; 6(2): 283-294.
Olsson, B., L. Alberg, N. C. Cullen, E. Michael, L. Wahlgren, A. K. Kroksmark, et al. NFL is a marker of treatment response in children with SMA treated with nusinersen. J Neurol 2019; 266(9): 2129-2136.

239
Olsson, B., R. Lautner, U. Andreasson, A. Ohrfelt, E. Portelius, M. Bjerke, et al. CSF and blood biomarkers for the diagnosis of Alzheimer's disease: a systematic review and meta-analysis. Lancet Neurol 2016; 15(7): 673-684.
Orth, M., S. Gregory, R. I. Scahill, I. S. Mayer, L. Minkova, S. Klöppel, et al. Natural variation in sensory-motor white matter organization influences manifestations of Huntington's disease. Hum Brain Mapp 2016; 37(12): 4615-4628.
Orth, M., S. Schippling, S. A. Schneider, K. P. Bhatia, P. Talelli, S. J. Tabrizi, et al. Abnormal motor cortex plasticity in premanifest and very early manifest Huntington disease. J Neurol Neurosurg Psychiatry 2010; 81(3): 267-270.
Osipovitch, M., A. Asenjo Martinez, J. N. Mariani, A. Cornwell, S. Dhaliwal, L. Zou, et al. Human ESC-Derived Chimeric Mouse Models of Huntington's Disease Reveal Cell-Intrinsic Defects in Glial Progenitor Cell Differentiation. Cell Stem Cell 2019; 24(1): 107-122.e107.
Ourselin, S., A. Roche, G. Subsol, X. Pennec and N. Ayache. Reconstructing a 3D structure from serial histological sections. Image and Vision Computing 2001; 19(1): 25-31.
Palminteri, S., D. Justo, C. Jauffret, B. Pavlicek, A. Dauta, C. Delmaire, et al. Critical roles for anterior insula and dorsal striatum in punishment-based avoidance learning. Neuron 2012; 76(5): 998-1009.
Papoutsi, M., I. Labuschagne, S. J. Tabrizi and J. C. Stout. The cognitive burden in Huntington's disease: pathology, phenotype, and mechanisms of compensation. Mov Disord 2014; 29(5): 673-683.
Papp, K. V., P. J. Snyder, J. A. Mills, K. Duff, H. J. Westervelt, J. D. Long, et al. Measuring executive dysfunction longitudinally and in relation to genetic burden, brain volumetrics, and depression in prodromal Huntington disease. Archives of clinical neuropsychology : the official journal of the National Academy of Neuropsychologists 2013; 28(2): 156-168.
Parkes, L., B. D. Fulcher, M. Yucel and A. Fornito. Transcriptional signatures of connectomic subregions of the human striatum. Genes Brain Behav 2017, 10.1111/gbb.12386.
Patton, J. H., M. S. Stanford and E. S. Barratt. Factor structure of the Barratt impulsiveness scale. J Clin Psychol 1995; 51(6): 768-774.
Paulsen, J. S. Cognitive impairment in Huntington disease: diagnosis and treatment. Current neurology and neuroscience reports 2011; 11(5): 474-483.
Paulsen, J. S., D. R. Langbehn, J. C. Stout, E. Aylward, C. A. Ross, M. Nance, et al. Detection of Huntington's disease decades before diagnosis: the Predict-HD study. J Neurol Neurosurg Psychiatry 2008; 79(8): 874-880.

240
Paulsen, J. S. and J. D. Long. Onset of Huntington's disease: can it be purely cognitive? Mov Disord 2014; 29(11): 1342-1350.
Paulsen, J. S., J. D. Long, H. J. Johnson, E. H. Aylward, C. A. Ross, J. K. Williams, et al. Clinical and Biomarker Changes in Premanifest Huntington Disease Show Trial Feasibility: A Decade of the PREDICT-HD Study. Front Aging Neurosci 2014; 6: 78.
Paulsen, J. S., J. D. Long, C. A. Ross, D. L. Harrington, C. J. Erwin, J. K. Williams, et al. Prediction of manifest Huntington's disease with clinical and imaging measures: a prospective observational study. Lancet Neurol 2014; 13(12): 1193-1201.
Paulsen, J. S., P. C. Nopoulos, E. Aylward, C. A. Ross, H. Johnson, V. A. Magnotta, et al. Striatal and white matter predictors of estimated diagnosis for Huntington disease. Brain Res Bull 2010; 82(3-4): 201-207.
Peng, Q., B. Wu, M. Jiang, J. Jin, Z. Hou, J. Zheng, et al. Characterization of Behavioral, Neuropathological, Brain Metabolic and Key Molecular Changes in zQ175 Knock-In Mouse Model of Huntington's Disease. PLoS One 2016; 11(2): e0148839.
Penney, J. B., Jr., J. P. Vonsattel, M. E. MacDonald, J. F. Gusella and R. H. Myers. CAG repeat number governs the development rate of pathology in Huntington's disease. Ann Neurol 1997; 41(5): 689-692.
Poudel, G. R., G. F. Egan, A. Churchyard, P. Chua, J. C. Stout and N. Georgiou-Karistianis. Abnormal synchrony of resting state networks in premanifest and symptomatic Huntington disease: the IMAGE-HD study. Journal of psychiatry & neuroscience : JPN 2014; 39(2): 87-96.
Poudel, G. R., J. C. Stout, D. J. Dominguez, A. Churchyard, P. Chua, G. F. Egan, et al. Longitudinal change in white matter microstructure in Huntington's disease: The IMAGE-HD study. Neurobiol Dis 2015; 74: 406-412.
Poudel, G. R., J. C. Stout, D. J. Dominguez, L. Salmon, A. Churchyard, P. Chua, et al. White matter connectivity reflects clinical and cognitive status in Huntington's disease. Neurobiol Dis 2014; 65: 180-187.
Prange, S., E. Metereau, A. Maillet, E. Lhommée, H. Klinger, P. Pelissier, et al. Early limbic microstructural alterations in apathy and depression in de novo Parkinson's disease. Mov Disord 2019; 34(11): 1644-1654.
Preti, M. G. and D. Van De Ville. Decoupling of brain function from structure reveals regional behavioral specialization in humans. Nature Communications 2019; 10(1): 4747.
Pringsheim, T., K. Wiltshire, L. Day, J. Dykeman, T. Steeves and N. Jette. The incidence and prevalence of Huntington's disease: a systematic review and meta-analysis. Movement disorders : official journal of the Movement Disorder Society 2012; 27(9): 1083-1091.

241
Quaid, K. A., S. W. Eberly, E. Kayson-Rubin, D. Oakes and I. Shoulson. Factors related to genetic testing in adults at risk for Huntington disease: the prospective Huntington at-risk observational study (PHAROS). Clin Genet 2017; 91(6): 824-831.
Quarantelli, M., E. Salvatore, S. M. Giorgio, A. Filla, A. Cervo, C. V. Russo, et al. Default-mode network changes in Huntington's disease: an integrated MRI study of functional connectivity and morphometry. PLoS One 2013; 8(8): e72159.
Raffelt, D., J. D. Tournier, S. Crozier, A. Connelly and O. Salvado. Reorientation of fiber orientation distributions using apodized point spread functions. Magn Reson Med 2012; 67(3): 844-855.
Raffelt, D., J. D. Tournier, J. Fripp, S. Crozier, A. Connelly and O. Salvado. Symmetric diffeomorphic registration of fibre orientation distributions. Neuroimage 2011; 56(3): 1171-1180.
Raffelt, D., J. D. Tournier, S. Rose, G. R. Ridgway, R. Henderson, S. Crozier, et al. Apparent Fibre Density: a novel measure for the analysis of diffusion-weighted magnetic resonance images. Neuroimage 2012; 59(4): 3976-3994.
Raffelt, D. A., J. D. Tournier, R. E. Smith, D. N. Vaughan, G. Jackson, G. R. Ridgway, et al. Investigating white matter fibre density and morphology using fixel-based analysis. Neuroimage 2017; 144(Pt A): 58-73.
Ramirez-Manzanares, A., P. A. Cook, M. Hall, M. Ashtari and J. C. Gee. Resolving axon fiber crossings at clinical b-values: an evaluation study. Med Phys 2011; 38(9): 5239-5253.
Rau, Y.-A., S.-M. Wang, J.-D. Tournier, S.-H. Lin, C.-S. Lu, Y.-H. Weng, et al. A longitudinal fixel-based analysis of white matter alterations in patients with Parkinson's disease. NeuroImage. Clinical 2019; 24: 102098-102098.
Reddy, P. H. and U. P. Shirendeb. Mutant huntingtin, abnormal mitochondrial dynamics, defective axonal transport of mitochondria, and selective synaptic degeneration in Huntington's disease. Biochim Biophys Acta 2012; 1822(2): 101-110.
Robbins, T. W., M. James, A. M. Owen, B. J. Sahakian, A. D. Lawrence, L. McInnes, et al. A study of performance on tests from the CANTAB battery sensitive to frontal lobe dysfunction in a large sample of normal volunteers: implications for theories of executive functioning and cognitive aging. Cambridge Neuropsychological Test Automated Battery. J Int Neuropsychol Soc 1998; 4(5): 474-490.
Robbins, T. W., M. James, A. M. Owen, B. J. Sahakian, L. McInnes and P. Rabbitt. Cambridge Neuropsychological Test Automated Battery (CANTAB): a factor analytic study of a large sample of normal elderly volunteers. Dementia 1994; 5(5): 266-281.
Rodrigues, F. B., L. Byrne, P. McColgan, N. Robertson, S. J. Tabrizi, B. R. Leavitt, et al. Cerebrospinal fluid total tau concentration predicts clinical phenotype in Huntington's disease. J Neurochem 2016; 139(1): 22-25.

242
Rodrigues, F. B., L. M. Byrne, P. McColgan, N. Robertson, S. J. Tabrizi, H. Zetterberg, et al. Cerebrospinal Fluid Inflammatory Biomarkers Reflect Clinical Severity in Huntington’s Disease. PLoS ONE 2016; 11(9): e0163479.
Rodrigues, F. B., L. M. Byrne, R. Tortelli, E. B. Johnson, P. A. Wijeratne, M. Arridge, et al. Longitudinal dynamics of mutant huntingtin and neurofilament light in Huntington's disease: the prospective HD-CSF study. medRxiv 2020, 10.1101/2020.03.31.20045260: 2020.2003.2031.20045260.
Rodrigues, F. B. E., A.; Owen, G.; Gosling, S.; Lifer, S.; Neacy, E.; Kaur, .; Handley, O.; Townhill, J.; Leavitt, B.; Guttman, M.; Bang, J.; Levey, J.; Pak, E.; Sampaio, C.; Wild, E. J. Safety and Tolerability of Research Lumbar Puncture in Huntington Disease: the HDClarity Cohort and Community Bioresource. Huntington Study Group Annual Meeting; 2018 Houston Texas, USA.
Rohrer, J. D., J. M. Nicholas, D. M. Cash, J. van Swieten, E. Dopper, L. Jiskoot, et al. Presymptomatic cognitive and neuroanatomical changes in genetic frontotemporal dementia in the Genetic Frontotemporal dementia Initiative (GENFI) study: a cross-sectional analysis. Lancet Neurol 2015; 14(3): 253-262.
Roos, R. A., J. F. Pruyt, J. de Vries and G. T. Bots. Neuronal distribution in the putamen in Huntington's disease. Journal of neurology, neurosurgery, and psychiatry 1985; 48(5): 422-425.
Rosas, H. D., Y. I. Chen, G. Doros, D. H. Salat, N. K. Chen, K. K. Kwong, et al. Alterations in brain transition metals in Huntington disease: an evolving and intricate story. Arch Neurol 2012; 69(7): 887-893.
Rosas, H. D., S. Y. Lee, A. C. Bender, A. K. Zaleta, M. Vangel, P. Yu, et al. Altered white matter microstructure in the corpus callosum in Huntington's disease: implications for cortical "disconnection". Neuroimage 2010; 49(4): 2995-3004.
Rosas, H. D., D. H. Salat, S. Y. Lee, A. K. Zaleta, V. Pappu, B. Fischl, et al. Cerebral cortex and the clinical expression of Huntington's disease: complexity and heterogeneity. Brain 2008; 131(Pt 4): 1057-1068.
Rosengren, L. E., J. E. Karlsson, J. O. Karlsson, L. I. Persson and C. Wikkelso. Patients with amyotrophic lateral sclerosis and other neurodegenerative diseases have increased levels of neurofilament protein in CSF. J Neurochem 1996; 67(5): 2013-2018.
Ross, C. A., E. H. Aylward, E. J. Wild, D. R. Langbehn, J. D. Long, J. H. Warner, et al. Huntington disease: natural history, biomarkers and prospects for therapeutics. Nat Rev Neurol 2014; 10(4): 204-216.
Rouault, T. A. Iron metabolism in the CNS: implications for neurodegenerative diseases. Nat Rev Neurosci 2013; 14(8): 551-564.
243
Rub, U., K. Seidel, H. Heinsen, J. P. Vonsattel, W. F. den Dunnen and H. W. Korf. Huntington's disease (HD): the neuropathology of a multisystem neurodegenerative disorder of the human brain. Brain Pathol 2016; 26(6): 726-740.
Rubinov, M. and O. Sporns. Complex network measures of brain connectivity: uses and interpretations. Neuroimage 2010; 52(3): 1059-1069.
Rubinsztein, D. C., J. Leggo, R. Coles, E. Almqvist, V. Biancalana, J. J. Cassiman, et al. Phenotypic characterization of individuals with 30-40 CAG repeats in the Huntington disease (HD) gene reveals HD cases with 36 repeats and apparently normal elderly individuals with 36-39 repeats. American journal of human genetics 1996; 59(1): 16-22.
Sahakian, B. J. and A. M. Owen. Computerized assessment in neuropsychiatry using CANTAB: discussion paper. Journal of the Royal Society of Medicine 1992; 85(7): 399-402.
Salegio, E. A., L. Samaranch, A. P. Kells, G. Mittermeyer, W. San Sebastian, S. Zhou, et al. Axonal transport of adeno-associated viral vectors is serotype-dependent. Gene Ther 2013; 20(3): 348-352.
Sánchez-Castañeda, C., F. de Pasquale, C. F. Caravasso, M. Marano, S. Maffi, S. Migliore, et al. Resting-state connectivity and modulated somatomotor and default-mode networks in Huntington disease. CNS Neurosci Ther 2017; 23(6): 488-497.
Sarwar, T., K. Ramamohanarao and A. Zalesky. Mapping connectomes with diffusion MRI: deterministic or probabilistic tractography? Magn Reson Med 2019; 81(2): 1368-1384.
Sathasivam, K., A. Neueder, T. A. Gipson, C. Landles, A. C. Benjamin, M. K. Bondulich, et al. Aberrant splicing of HTT generates the pathogenic exon 1 protein in Huntington disease. Proceedings of the National Academy of Sciences of the United States of America 2013; 110(6): 2366-2370.
Saudou, F. and S. Humbert. The Biology of Huntingtin. Neuron 2016; 89(5): 910-926.
Say, M. J., R. Jones, R. I. Scahill, E. M. Dumas, A. Coleman, R. C. Santos, et al. Visuomotor integration deficits precede clinical onset in Huntington's disease. Neuropsychologia 2011; 49(2): 264-270.
Scahill, R. I., R. Andre, S. J. Tabrizi and E. H. Aylward (2017). Chapter 20 - Structural imaging in premanifest and manifest Huntington disease. Handbook of Clinical Neurology. A. S. Feigin and K. E. Anderson, Elsevier. 144: 247-261.
Scahill, R. I., N. Z. Hobbs, M. J. Say, N. Bechtel, S. M. Henley, H. Hyare, et al. Clinical impairment in premanifest and early Huntington's disease is associated with regionally specific atrophy. Hum Brain Mapp 2013; 34(3): 519-529.
Scahill, R. I., P. Zeun, K. Osborne-Crowley, E. B. Johnson, S. Gregory, C. Parker, et al. Biological and clinical characteristics of gene carriers far from predicted onset in

244
the Huntington's disease Young Adult Study (HD-YAS): a cross-sectional analysis. Lancet Neurol 2020; 19(6): 502-512.
Scahill, R. I., P. Zeun, K. Osborne-Crowley, E. B. Johnson, S. Gregory, C. Parker, et al. Biological and clinical characteristics of gene carriers far from predicted onset in the Huntington’s disease Young Adult Study (HD-YAS): a cross-sectional analysis. Lancet Neurol 2020, In press.
Schaefer, A., R. Kong, E. M. Gordon, T. O. Laumann, X. N. Zuo, A. J. Holmes, et al. Local-Global Parcellation of the Human Cerebral Cortex from Intrinsic Functional Connectivity MRI. Cereb Cortex 2018; 28(9): 3095-3114.
Schindler, S. E., Y. Li, K. W. Todd, E. M. Herries, R. L. Henson, J. D. Gray, et al. Emerging cerebrospinal fluid biomarkers in autosomal dominant Alzheimer's disease. Alzheimers Dement 2019; 15(5): 655-665.
Schobel, S. A., G. Palermo, P. Auinger, J. D. Long, S. Ma, O. S. Khwaja, et al. Motor, cognitive, and functional declines contribute to a single progressive factor in early HD. Neurology 2017; 89(24): 2495-2502.
Schultz, S. A., J. F. Strain, A. Adedokun, Q. Wang, O. Preische, J. Kuhle, et al. Serum neurofilament light chain levels are associated with white matter integrity in autosomal dominant Alzheimer's disease. Neurobiol Dis 2020; 142: 104960.
Selemon, L. D. and P. S. Goldman-Rakic. Longitudinal topography and interdigitation of corticostriatal projections in the rhesus monkey. J Neurosci 1985; 5(3): 776-794.
Sepers, M. D. and L. A. Raymond. Mechanisms of synaptic dysfunction and excitotoxicity in Huntington's disease. Drug Discov Today 2014; 19(7): 990-996.
Sereno, M. I., A. Lutti, N. Weiskopf and F. Dick. Mapping the human cortical surface by combining quantitative T(1) with retinotopy. Cereb Cortex 2013; 23(9): 2261-2268.
Shaffer, J. J., A. Ghayoor, J. D. Long, R. E. Kim, S. Lourens, L. J. O'Donnell, et al. Longitudinal diffusion changes in prodromal and early HD: Evidence of white-matter tract deterioration. Hum Brain Mapp 2017; 38(3): 1460-1477.
Shoulson, I. and S. Fahn. Huntington disease: clinical care and evaluation. Neurology 1979; 29(1): 1-3.
Simmons, D. A., M. Casale, B. Alcon, N. Pham, N. Narayan and G. Lynch. Ferritin accumulation in dystrophic microglia is an early event in the development of Huntington's disease. Glia 2007; 55(10): 1074-1084.
Slattery, C. F., J. Zhang, R. W. Paterson, A. J. M. Foulkes, A. Carton, K. Macpherson, et al. ApoE influences regional white-matter axonal density loss in Alzheimer's disease. Neurobiol Aging 2017; 57: 8-17.
Smith-Dijak, A. I., M. D. Sepers and L. A. Raymond. Alterations in synaptic function and plasticity in Huntington disease. J Neurochem 2019; 150(4): 346-365.

245
Smith, R. E., J. D. Tournier, F. Calamante and A. Connelly. Anatomically-constrained tractography: improved diffusion MRI streamlines tractography through effective use of anatomical information. Neuroimage 2012; 62(3): 1924-1938.
Smith, R. E., J. D. Tournier, F. Calamante and A. Connelly. The effects of SIFT on the reproducibility and biological accuracy of the structural connectome. Neuroimage 2015; 104: 253-265.
Smith, R. E., J. D. Tournier, F. Calamante and A. Connelly. SIFT2: Enabling dense quantitative assessment of brain white matter connectivity using streamlines tractography. Neuroimage 2015; 119: 338-351.
Smith, S. M., M. Jenkinson, M. W. Woolrich, C. F. Beckmann, T. E. Behrens, H. Johansen-Berg, et al. Advances in functional and structural MR image analysis and implementation as FSL. Neuroimage 2004; 23 Suppl 1: S208-219.
Snowden, J. S., D. Craufurd, J. Thompson and D. Neary. Psychomotor, executive, and memory function in preclinical Huntington's disease. J Clin Exp Neuropsychol 2002; 24(2): 133-145.
Sobczak, K. and W. J. Krzyzosiak. Patterns of CAG repeat interruptions in SCA1 and SCA2 genes in relation to repeat instability. Human Mutation 2004; 24(3): 236-247.
Sockeel, P., K. Dujardin, D. Devos, C. Deneve, A. Destee and L. Defebvre. The Lille apathy rating scale (LARS), a new instrument for detecting and quantifying apathy: validation in Parkinson's disease. J Neurol Neurosurg Psychiatry 2006; 77(5): 579-584.
Spielberger, C., R. Gorsuch and R. Lushene (1983). STAI manual for the state-trait anxiety inventory. Self-Evaluation Questionnaire, Consulting Psychologists Press (Palo Alto, CA).
Sprengelmeyer, R., M. Orth, H. P. Muller, R. C. Wolf, G. Gron, M. S. Depping, et al. The neuroanatomy of subthreshold depressive symptoms in Huntington's disease: a combined diffusion tensor imaging (DTI) and voxel-based morphometry (VBM) study. Psychol Med 2014; 44(9): 1867-1878.
Springer, E., B. Dymerska, P. L. Cardoso, S. D. Robinson, C. Weisstanner, R. Wiest, et al. Comparison of Routine Brain Imaging at 3 T and 7 T. Invest Radiol 2016; 51(8): 469-482.
Stoffers, D., S. Sheldon, J. M. Kuperman, J. Goldstein, J. Corey-Bloom and A. R. Aron. Contrasting gray and white matter changes in preclinical Huntington disease: an MRI study. Neurology 2010; 74(15): 1208-1216.
Stout, J. C., R. Jones, I. Labuschagne, A. M. O'Regan, M. J. Say, E. M. Dumas, et al. Evaluation of longitudinal 12 and 24 month cognitive outcomes in premanifest and early Huntington's disease. Journal of Neurology, Neurosurgery & Psychiatry 2012; 83(7): 687-694.

246
Stout, J. C., J. S. Paulsen, S. Queller, A. C. Solomon, K. B. Whitlock, J. C. Campbell, et al. Neurocognitive signs in prodromal Huntington disease. Neuropsychology 2011; 25(1): 1-14.
Stout, J. C., R. E. Ready, J. Grace, P. F. Malloy and J. S. Paulsen. Factor Analysis of the Frontal Systems Behavior Scale (FrSBe). Assessment 2003; 10(1): 79-85.
Stüber, C., M. Morawski, A. Schäfer, C. Labadie, M. Wähnert, C. Leuze, et al. Myelin and iron concentration in the human brain: a quantitative study of MRI contrast. Neuroimage 2014; 93 Pt 1: 95-106.
Suárez, L. E., R. D. Markello, R. F. Betzel and B. Misic. Linking Structure and Function in Macroscale Brain Networks. Trends Cogn Sci 2020; 24(4): 302-315.
Swami, M., A. E. Hendricks, T. Gillis, T. Massood, J. Mysore, R. H. Myers, et al. Somatic expansion of the Huntington's disease CAG repeat in the brain is associated with an earlier age of disease onset. Human Molecular Genetics 2009; 18(16): 3039-3047.
Tabrizi, S. J., R. Ghosh and B. R. Leavitt. Huntingtin Lowering Strategies for Disease Modification in Huntington's Disease. Neuron 2019; 101(5): 801-819.
Tabrizi, S. J., D. R. Langbehn, B. R. Leavitt, R. A. Roos, A. Durr, D. Craufurd, et al. Biological and clinical manifestations of Huntington's disease in the longitudinal TRACK-HD study: cross-sectional analysis of baseline data. Lancet Neurol 2009; 8(9): 791-801.
Tabrizi, S. J., B. R. Leavitt, G. B. Landwehrmeyer, E. J. Wild, C. Saft, R. A. Barker, et al. Targeting Huntingtin Expression in Patients with Huntington's Disease. N Engl J Med 2019; 380(24): 2307-2316.
Tabrizi, S. J., R. Reilmann, R. A. Roos, A. Durr, B. Leavitt, G. Owen, et al. Potential endpoints for clinical trials in premanifest and early Huntington's disease in the TRACK-HD study: analysis of 24 month observational data. Lancet Neurol 2012; 11(1): 42-53.
Tabrizi, S. J., R. I. Scahill, A. Durr, R. A. Roos, B. R. Leavitt, R. Jones, et al. Biological and clinical changes in premanifest and early stage Huntington's disease in the TRACK-HD study: the 12-month longitudinal analysis. Lancet Neurol 2011; 10(1): 31-42.
Tabrizi, S. J., R. I. Scahill, G. Owen, A. Durr, B. R. Leavitt, R. A. Roos, et al. Predictors of phenotypic progression and disease onset in premanifest and early-stage Huntington's disease in the TRACK-HD study: analysis of 36-month observational data. Lancet Neurol 2013; 12(7): 637-649.
Tansey, M. G. and M. S. Goldberg. Neuroinflammation in Parkinson's disease: its role in neuronal death and implications for therapeutic intervention. Neurobiol Dis 2010; 37(3): 510-518.

247
Tarawneh, R., G. D'Angelo, D. Crimmins, E. Herries, T. Griest, A. M. Fagan, et al. Diagnostic and Prognostic Utility of the Synaptic Marker Neurogranin in Alzheimer Disease. JAMA Neurol 2016; 73(5): 561-571.
Telenius, H., B. Kremer, Y. P. Goldberg, J. Theilmann, S. E. Andrew, J. Zeisler, et al. Somatic and gonadal mosaicism of the Huntington disease gene CAG repeat in brain and sperm. Nat Genet 1994; 6(4): 409-414.
Tereshchenko, A. V., J. L. Schultz, J. E. Bruss, V. A. Magnotta, E. A. Epping and P. C. Nopoulos. Abnormal development of cerebellar-striatal circuitry in Huntington disease. Neurology 2020; 94(18): e1908-e1915.
The Huntington's Disease Collaborative Research Group. A novel gene containing a trinucleotide repeat that is expanded and unstable on Huntington's disease chromosomes. Cell 1993; 72(6): 971-983.
Thelin, E., F. Al Nimer, A. Frostell, H. Zetterberg, K. Blennow, H. Nyström, et al. A Serum Protein Biomarker Panel Improves Outcome Prediction in Human Traumatic Brain Injury. J Neurotrauma 2019; 36(20): 2850-2862.
Tong, X., Y. Ao, G. C. Faas, S. E. Nwaobi, J. Xu, M. D. Haustein, et al. Astrocyte Kir4.1 ion channel deficits contribute to neuronal dysfunction in Huntington's disease model mice. Nat Neurosci 2014; 17(5): 694-703.
Tournier, J.-D., F. Calamante and A. Connelly. Improved probabilistic streamlines tractography by 2nd order integration over fibre orientation distributions. Proceedings of the International Society for Magnetic Resonance in Medicine 2010.
Tournier, J. D., F. Calamante and A. Connelly. Robust determination of the fibre orientation distribution in diffusion MRI: non-negativity constrained super-resolved spherical deconvolution. Neuroimage 2007; 35(4): 1459-1472.
Tournier, J. D., F. Calamante, D. G. Gadian and A. Connelly. Direct estimation of the fiber orientation density function from diffusion-weighted MRI data using spherical deconvolution. Neuroimage 2004; 23(3): 1176-1185.
Tournier, J. D., R. Smith, D. Raffelt, R. Tabbara, T. Dhollander, M. Pietsch, et al. MRtrix3: A fast, flexible and open software framework for medical image processing and visualisation. NeuroImage 2019; 202: 116137-116137.
Tustison, N. J., B. B. Avants, P. A. Cook, Y. Zheng, A. Egan, P. A. Yushkevich, et al. N4ITK: improved N3 bias correction. IEEE Trans Med Imaging 2010; 29(6): 1310-1320.
Tziortzi, A. C., S. N. Haber, G. E. Searle, C. Tsoumpas, C. J. Long, P. Shotbolt, et al. Connectivity-based functional analysis of dopamine release in the striatum using diffusion-weighted MRI and positron emission tomography. Cereb Cortex 2014; 24(5): 1165-1177.
248
Tziortzi, A. C., G. E. Searle, S. Tzimopoulou, C. Salinas, J. D. Beaver, M. Jenkinson, et al. Imaging dopamine receptors in humans with [11C]-(+)-PHNO: dissection of D3 signal and anatomy. Neuroimage 2011; 54(1): 264-277.
UK Government Department for Education. (2019). "Participation Rates in Higher Education: Academic Years 2006/2007 – 2017/2018 (Provisional)." Retrieved 03/03/2020, 2020, from https://www.gov.uk/government/statistics/participation-rates-in-higher-education-2006-to-2018.
Uniqure N.V. (2020). "uniQure Announces First Two Patients Treated in Phase I/II Clinical Trial of AMT-130 for the Treatment of Huntington’s Disease." Retrieved 9th July, 2020, from https://tools.eurolandir.com/tools/Pressreleases/GetPressRelease/?ID=3781729&lang=en-GB&companycode=nl-qure&v=.
van den Bogaard, S. J., E. M. Dumas, T. P. Acharya, H. Johnson, D. R. Langbehn, R. I. Scahill, et al. Early atrophy of pallidum and accumbens nucleus in Huntington's disease. J Neurol 2011; 258(3): 412-420.
van den Heuvel, M. P. and O. Sporns. An anatomical substrate for integration among functional networks in human cortex. J Neurosci 2013; 33(36): 14489-14500.
van der Plas, E., D. R. Langbehn, A. L. Conrad, T. R. Koscik, A. Tereshchenko, E. A. Epping, et al. Abnormal brain development in child and adolescent carriers of mutant huntingtin. Neurology 2019; 93(10): e1021-e1030.
van Duijn, E., D. Craufurd, A. A. Hubers, E. J. Giltay, R. Bonelli, H. Rickards, et al. Neuropsychiatric symptoms in a European Huntington's disease cohort (REGISTRY). J Neurol Neurosurg Psychiatry 2014; 85(12): 1411-1418.
Van Schependom, J., B. D'Hooghe M, K. Cleynhens, M. D'Hooge, M. C. Haelewyck, J. De Keyser, et al. The Symbol Digit Modalities Test as sentinel test for cognitive impairment in multiple sclerosis. Eur J Neurol 2014; 21(9): 1219-1225, e1271-1212.
Veldman, M. B. and X. W. Yang. Molecular insights into cortico-striatal miscommunications in Huntington's disease. Curr Opin Neurobiol 2018; 48: 79-89.
Veraart, J., D. S. Novikov, D. Christiaens, B. Ades-Aron, J. Sijbers and E. Fieremans. Denoising of diffusion MRI using random matrix theory. Neuroimage 2016; 142: 394-406.
Vinther-Jensen, T., L. Bornsen, E. Budtz-Jorgensen, C. Ammitzboll, I. U. Larsen, L. E. Hjermind, et al. Selected CSF biomarkers indicate no evidence of early neuroinflammation in Huntington disease. Neurol Neuroimmunol Neuroinflamm 2016; 3(6): e287.
Vinther-Jensen, T., E. Budtz-Jorgensen, A. H. Simonsen, J. E. Nielsen and L. E. Hjermind. YKL-40 in cerebrospinal fluid in Huntington's disease--a role in pathology or a nonspecific response to inflammation? Parkinsonism Relat Disord 2014; 20(11): 1301-1303.

249
Vonsattel, J. P. and M. DiFiglia. Huntington disease. J Neuropathol Exp Neurol 1998; 57(5): 369-384.
Vonsattel, J. P., R. H. Myers, T. J. Stevens, R. J. Ferrante, E. D. Bird and E. P. Richardson, Jr. Neuropathological classification of Huntington's disease. J Neuropathol Exp Neurol 1985; 44(6): 559-577.
Waldvogel, H. J., E. H. Kim, L. J. Tippett, J. P. Vonsattel and R. L. Faull. The Neuropathology of Huntington's Disease. Curr Top Behav Neurosci 2015; 22: 33-80.
Ware, J. E., Jr. and C. D. Sherbourne. The MOS 36-item short-form health survey (SF-36). I. Conceptual framework and item selection. Med Care 1992; 30(6): 473-483.
Weiskopf, N., J. Suckling, G. Williams, M. M. Correia, B. Inkster, R. Tait, et al. Quantitative multi-parameter mapping of R1, PD(*), MT, and R2(*) at 3T: a multi-center validation. Frontiers in neuroscience 2013; 7: 95-95.
Weiss, A., U. Trager, E. J. Wild, S. Grueninger, R. Farmer, C. Landles, et al. Mutant huntingtin fragmentation in immune cells tracks Huntington's disease progression. J Clin Invest 2012; 122(10): 3731-3736.
Weiss, A. R., W. A. Liguore, J. S. Domire, D. Button and J. L. McBride. Intra-striatal AAV2.retro administration leads to extensive retrograde transport in the rhesus macaque brain: implications for disease modeling and therapeutic development. Scientific Reports 2020; 10(1): 6970.
Wellington, H., R. W. Paterson, E. Portelius, U. Törnqvist, N. Magdalinou, N. C. Fox, et al. Increased CSF neurogranin concentration is specific to Alzheimer disease. Neurology 2016; 86(9): 829-835.
Werner, C. J., I. Dogan, C. Saß, S. Mirzazade, J. Schiefer, N. J. Shah, et al. Altered resting-state connectivity in Huntington's disease. Hum Brain Mapp 2014; 35(6): 2582-2593.
Whitfield-Gabrieli, S. and A. Nieto-Castanon. Conn: a functional connectivity toolbox for correlated and anticorrelated brain networks. Brain Connect 2012; 2(3): 125-141.
Whitwell, J. L., W. R. Crum, H. C. Watt and N. C. Fox. Normalization of cerebral volumes by use of intracranial volume: implications for longitudinal quantitative MR imaging. AJNR Am J Neuroradiol 2001; 22(8): 1483-1489.
Wild, E. J., R. Boggio, D. Langbehn, N. Robertson, S. Haider, J. R. Miller, et al. Quantification of mutant huntingtin protein in cerebrospinal fluid from Huntington's disease patients. J Clin Invest 2015; 125(5): 1979-1986.
Wiley, C. A., D. Bonneh-Barkay, C. E. Dixon, A. Lesniak, G. Wang, S. J. Bissel, et al. Role for mammalian chitinase 3-like protein 1 in traumatic brain injury. Neuropathology 2015; 35(2): 95-106.

250
Wilkinson, K. D., K. M. Lee, S. Deshpande, P. Duerksen-Hughes, J. M. Boss and J. Pohl. The neuron-specific protein PGP 9.5 is a ubiquitin carboxyl-terminal hydrolase. Science 1989; 246(4930): 670-673.
Wilton, D. K. and B. Stevens. The contribution of glial cells to Huntington's disease pathogenesis. Neurobiol Dis 2020; 143: 104963.
Winklewski, P. J., A. Sabisz, P. Naumczyk, K. Jodzio, E. Szurowska and A. Szarmach. Understanding the Physiopathology Behind Axial and Radial Diffusivity Changes-What Do We Know? Front Neurol 2018; 9: 92.
Witjes-Ané, M. N., B. Mertens, J. P. van Vugt, A. C. Bachoud-Lévi, G. J. van Ommen and R. A. Roos. Longitudinal evaluation of "presymptomatic" carriers of Huntington's disease. J Neuropsychiatry Clin Neurosci 2007; 19(3): 310-317.
Wolf, R. C., F. Sambataro, N. Vasic, E.-M. Baldas, I. Ratheiser, G. Bernhard Landwehrmeyer, et al. Visual system integrity and cognition in early Huntington's disease. European Journal of Neuroscience 2014; 40(2): 2417-2426.
Wolf, R. C., F. Sambataro, N. Vasic, N. D. Wolf, P. A. Thomann, G. B. Landwehrmeyer, et al. Longitudinal task-negative network analyses in preclinical Huntington's disease. Eur Arch Psychiatry Clin Neurosci 2014; 264(6): 493-505.
Yeo, B. T., F. M. Krienen, J. Sepulcre, M. R. Sabuncu, D. Lashkari, M. Hollinshead, et al. The organization of the human cerebral cortex estimated by intrinsic functional connectivity. J Neurophysiol 2011; 106(3): 1125-1165.
Yeterian, E. H. and G. W. Van Hoesen. Cortico-striate projections in the rhesus monkey: the organization of certain cortico-caudate connections. Brain Res 1978; 139(1): 43-63.
Zalesky, A., A. Fornito and E. T. Bullmore. Network-based statistic: identifying differences in brain networks. Neuroimage 2010; 53(4): 1197-1207.
Zeitlberger, A. M., G. Thomas-Black, H. Garcia-Moreno, M. Foiani, A. J. Heslegrave, H. Zetterberg, et al. Plasma Markers of Neurodegeneration Are Raised in Friedreich's Ataxia. Front Cell Neurosci 2018; 12: 366.
Zeitlin, S., J. P. Liu, D. L. Chapman, V. E. Papaioannou and A. Efstratiadis. Increased apoptosis and early embryonic lethality in mice nullizygous for the Huntington's disease gene homologue. Nature genetics 1995; 11(2): 155-163.
Zetterberg, H. Review: Tau in biofluids - relation to pathology, imaging and clinical features. Neuropathol Appl Neurobiol 2017; 43(3): 194-199.
Zeun, P., R. I. Scahill, S. J. Tabrizi and E. J. Wild. Fluid and imaging biomarkers for Huntington's disease. Mol Cell Neurosci 2019; 97: 67-80.
251
Zhang, H., T. Schneider, C. A. Wheeler-Kingshott and D. C. Alexander. NODDI: practical in vivo neurite orientation dispersion and density imaging of the human brain. Neuroimage 2012; 61(4): 1000-1016.
Zhang, J., S. Gregory, R. I. Scahill, A. Durr, D. L. Thomas, S. Lehericy, et al. In vivo characterization of white matter pathology in pre-manifest Huntington's disease. Ann Neurol 2018, 10.1002/ana.25309.
Zhang, Y., J. D. Long, J. A. Mills, J. H. Warner, W. Lu and J. S. Paulsen. Indexing disease progression at study entry with individuals at-risk for Huntington disease. Am J Med Genet B Neuropsychiatr Genet 2011; 156b(7): 751-763.
Zhang, Y., N. Schuff, A. T. Du, H. J. Rosen, J. H. Kramer, M. L. Gorno-Tempini, et al. White matter damage in frontotemporal dementia and Alzheimer's disease measured by diffusion MRI. Brain 2009; 132(Pt 9): 2579-2592.
Zung, W. W., C. B. Richards and M. J. Short. Self-rating depression scale in an outpatient clinic. Further validation of the SDS. Arch Gen Psychiatry 1965; 13(6): 508-515.

252
9 Appendix
9.1 Disease burden score (DBS)
DBS is calculated as age X [CAG length-35.5]. The score functions as a posteriori
estimate of an individual’s lifetime exposure to mHTT at any given age (Penney et al.
1997).
In HD-YAS, gene carriers with DBS scores of ≤ 240 were eligible. The below chart
demonstrates the range of ages and CAG lengths (shaded in green) within this DBS
criterion.
9.2 HD-YAS eligibility criteria
Inclusion criteria

253
a. Are 18-40 years of age, inclusive; and
b. Are capable of providing informed consent and
c. Are capable of complying with study procedures and
For the Healthy Control group, participants eligible are persons who meet the
following criteria:
d. Have no known family history of Huntington’s disease (family control or
community control)*; or
e. Have known family history of Hungington’s disease but have been tested for the
huntingtin gene CAG expansion and are not at genetic risk for Huntington’s
disease (CAG < 36) (gene negative).
For the Young Adult Premanifest Huntington’s disease group, participants eligible
are persons who meet the additional following criteria:
f. Do not have clinical diagnostic motor features of Huntington’s disease, defined as
Unified Huntington's Disease Rating Scale (UHDRS) Diagnostic Confidence
Score1 < 4; and
g. Have CAG expansion ≥ 40 and
h. A disease burden score (DBS) ≤ 2402 **
* Family controls were partners or spouses of someone either with the Huntington’s
disease gene or at risk of Huntington’s disease due to having a 1st degree relative
with Huntington’s disease. Community controls were either friends of someone with
or at risk of Huntington’s disease, or from the wider Huntington’s disease community
recruited via advertisement through Huntington’s disease support groups.
** The rationale for this DBS cut-off is that this boundary corresponds approximately
to >18 years to estimated disease onset according to the Langbehn formula3.

254
Exclusion criteria
a. Current use of investigational drugs or participation in a clinical drug trial within 30
days prior to study visit; or
b. Current intoxication, drug or alcohol abuse or dependence; or
c. If using any antidepressant, psychoactive, psychotropic or other medications or
nutraceuticals used to treat Huntington’s disease, the use of inappropriate (e.g.,
non-therapeutically high) or unstable dose within 30 days prior to study visit; or
d. Significant medical, neurological or psychiatric co-morbidity likely***, in the
judgment of the Principal
Investigator, to impair participant’s ability to complete essential study procedures; or
e. Predictable non-compliance as assessed by the Principal Investigator; or
f. Inability or unwillingness to undertake any of the essential study procedures; or g.
Needle phobia; or
h. Contraindication to MRI, including, but not limited to, MR-incompatible
pacemakers, recent metallic implants, foreign body in the eye or other
indications, as assessed by a standard pre-MRI questionnaire; or
i. Pregnant (as confirmed by urine pregnancy test); or
j. Claustrophobia, or any other condition that would make the subject incapable of
undergoing an MRI.
For the optional cerebrospinal fluid (CSF) collection only
k. Needle phobia, frequent headache, significant lower spinal deformity or major
surgery; or
l. Antiplatelet or anticoagulant therapy within the 14 days prior to sampling visit,
including but not limited to:
aspirin, clopidogrel, dipyridamole, warfarin, dabigatran, rivaroxaban and apixaban; or
m. Clotting or bruising disorder; or

255
n. Screening blood test results outside the clinical laboratory’s normal range for the
following: white cell count, neutrophil count, lymphocyte count, haemoglobin
(Hb), platelets, prothrombin time or activated partial thromboplastin time; or
o. Screening blood test results for C-reactive protein >2× upper limit of normal; or
p. Exclusion during history or physical examination, final decision to be made by the
Principal Investigator; including but not limited to:
i any reason to suspect abnormal bleeding tendency, e.g. easy bruising, petechial
rash; or ii any reason to suspect new focal neurological lesion, e.g. new headache,
optic disc swelling, asymmetric focal long tract signs; or iii any other reason that, in
the clinical judgment of the operator or the Principal Investigator, it is felt that lumbar
puncture is unsafe.
*** Comorbidities are assessed for during an interview asking about current and
previous medical and drug history. The T1 weighted MRI brain was reviewed by
an experienced consultant neuroradiologist and CSF white and red cell counts
were also reviewed to further ensure absence of neurological comorbidity.
9.3 TrackOn-HD eligibility criteria
Inclusion Criteria
Written informed consent must be obtained from the participant, who must agree to
all the assessments. In addition:
1. All participants should be able to tolerate MRI and sample donation
2. Participants will be either
a. Control participant
i. An existing control participant previously enrolled in TRACK-HD
ii. A newly recruited control participant who is either
256
• Partner/spouse of a participant, not at risk of HD (note these participants will not
have CAG repeat testing)
• HD Normal repeat length sibling or HD normal repeat length control volunteer
b. Premanifest gene carrier
i. An existing premanifest gene carrier previously enrolled in TRACK-HD
ii. A newly recruited premanifest gene carrier with:
• Positive genetic test with CAG repeat length ≥ 40 and
• Burden of pathology score (CAG-35.5) × age >250 and
Exclusion Criteria
1. Stage 1 (UHDRS diagnostic confidence score of 4) or greater at time of enrolment,
unless previously enrolled as a premanifest participant in TRACK-HD
2. Less than 18 years of age
3. More than 65 years of age (unless previously enrolled in TRACK-HD)
4. Major psychiatric disorder at time of enrolment
5. Concomitant significant neurological disorder
6. Concomitant significant medical illness
7. Unsuitability for MRI, e.g. claustrophobia, metal implants
8. Unwillingness to donate blood
9. History of significant head injury
10. Predictable non–compliance by drug and/or alcohol abuse
11. Significant hand injuries that preclude either writing or rapid computerized
responding
12. Participant in Predict-HD
13. Currently participating in a clinical drug trial

257
9.4 UHDRS total motor score (TMS)
The TMS is a score out of 124 based on a clinical assessment on the presence or
absence of motor signs that can be seen in HD observed on examination. Each sign
is scored 0-4 based on whether the sign is absent, or present. Where present, scores
ascend from 1-4 based on whether the sign is subtle or more prominent/severe.
Ocular pursuit:
0 = complete (normal)
1 = jerky movement
2 = interrupted pursuits/full range
3 = incomplete range
4 = cannot pursue
Saccade initiation:
0 = normal
1 = increased latency only
2 = suppressible blinks or head movements to initiate
3 = unsupressable head movements
4 = cannot initiate saccades
Horizontal and vertical scored separately
Saccade velocity:
0 = normal
1 = mild slowing
2 = moderate slowing
3 = severely slow, full range
4 = incomplete range
Horizontal and vertical scored separately
Dysarthria:
0 = normal
1 = unclear, no need to repeat
2 = must repeat to be understood

258
3 = mostly incomprehensible
4 = anarthria
Tongue protrusion:
0 = can hold tongue fully protruded for 10 sec
1 = cannot keep fully protruded for 10 sec
2 = cannot keep fully protruded for 5 sec
3 = cannot fully protrude tongue
4 = cannot protrude tongue beyond lips
Finger taps:
0 = normal (≥15/5 sec.)
1 = mild slowing, reduction in amplitude (11-14/5 sec.)
2 = moderately impaired (7-10/5 sec.)
3 = severely impaired (3-6/5 sec.)
4 = can barely perform task (0-2/5 sec.)
Right and left scored separately
Pronate/supinate-hands:
0 = normal
1 = mild slowing and/or irregular
2 = moderate slowing and irregular
3 = severe slowing and irregular
4 = cannot perform
Right and left scored separately
Luria:
0 = ≥4 in 10 sec, no cue
1 = <4 in 10 sec, no cue
2 = ≥4 in 10 sec with cues
3 = <4 in 10 sec with cues
4 = cannot perform
Rigidity-arms:
0 = absent

259
1 = slight or present only with activation
2 = mild to moderate
3 = severe, full range of motion
4 = severe with limited range
Right and left scored separately
Bradykinesia-body:
0 = normal
1 = minimally slow (?normal)
2 = mildly but clearly slow
3 = moderately slow, some hesitation
4 = markedly slow, long delays in initiation
Maximal dystonia:
0 = absent
1 = slight/intermittent
2 = mild/common or moderate/intermittent
3 = moderate/common
4 = marked/prolonged
Trunk, right upper extremity, left upper extremity, right lower extremity, left lower extremity scored separately
Maximal chorea:
0 = absent
1 = slight/intermittent
2 = mild/common or moderate/intermittent
3 = moderate/common
4 = marked/prolonged
Face, buccal-oral, trunk, right upper extremity, left upper extremity, right lower extremity, left lower extremity scored separately
Gait:
0 = normal gait, narrow base
1 = wide base and/or slow
2 = wide base and walks with difficulty
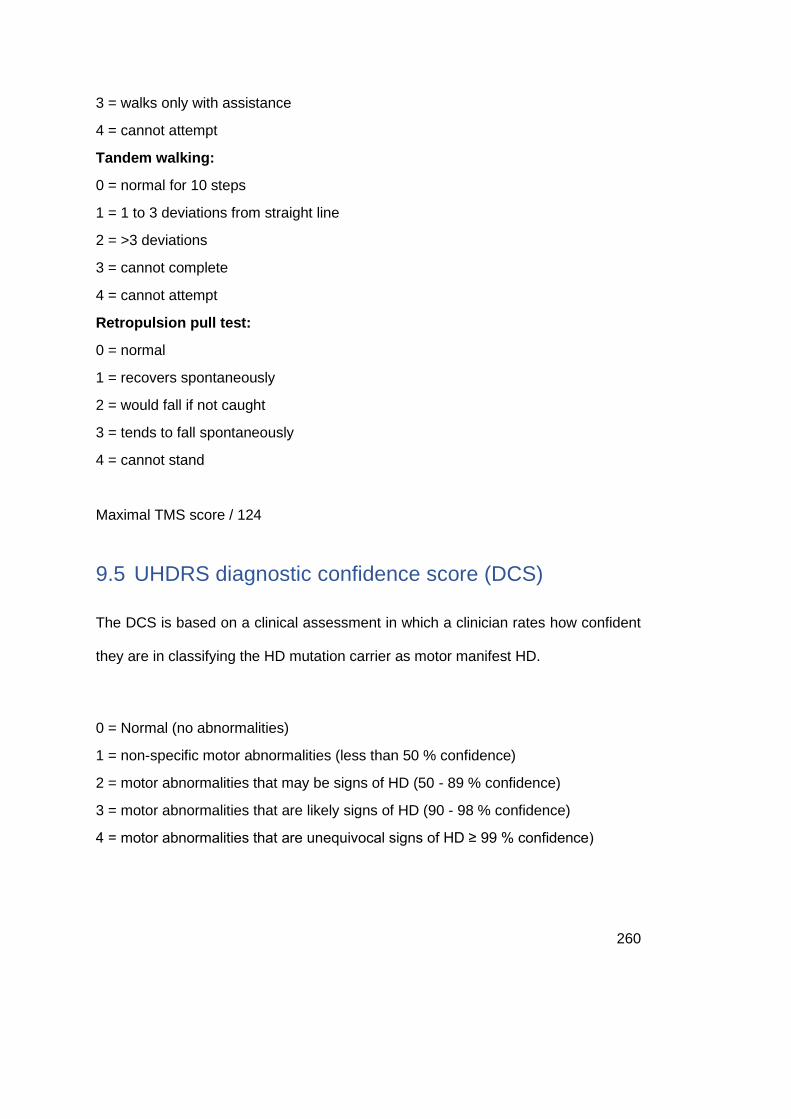
260
3 = walks only with assistance
4 = cannot attempt
Tandem walking:
0 = normal for 10 steps
1 = 1 to 3 deviations from straight line
2 = >3 deviations
3 = cannot complete
4 = cannot attempt
Retropulsion pull test:
0 = normal
1 = recovers spontaneously
2 = would fall if not caught
3 = tends to fall spontaneously
4 = cannot stand
Maximal TMS score / 124
9.5 UHDRS diagnostic confidence score (DCS)
The DCS is based on a clinical assessment in which a clinician rates how confident
they are in classifying the HD mutation carrier as motor manifest HD.
0 = Normal (no abnormalities)
1 = non-specific motor abnormalities (less than 50 % confidence)
2 = motor abnormalities that may be signs of HD (50 - 89 % confidence)
3 = motor abnormalities that are likely signs of HD (90 - 98 % confidence)
4 = motor abnormalities that are unequivocal signs of HD ≥ 99 % confidence)

261
9.6 Graph theory calculations
Graph theory metrics were calculated using the brain connectivity toolbox (Rubinov
and Sporns 2010).
The degree of a node i is calculated as follows:
𝑘𝑖 = ∑ 𝑎𝑖𝑗
𝑗𝜀𝑁
where N is the set of all nodes in the network and 𝑎𝑖𝑗 is the connection between nodes
i and j.
Nodal strength (graph strength or connection strength) is calculated using the
weighted connection (Eq. 2):
𝑠𝑖 = ∑ 𝑤𝑖𝑗
𝑗𝜀𝑁
The path length of a node is defined as follows, where 𝑑𝑖𝑗 is the (weighted) shortest
path length between two nodes:
𝐿𝑖 = 1
𝑛 ∑
∑ 𝑑𝑖𝑗𝑗𝜀𝑁,𝑗≠𝑖
𝑛 − 1𝑖𝜀𝑁
The average path length for the network is calculated by taking the average across
all nodes:
𝐿 =1
𝑛 ∑ 𝐿𝑖
𝑖𝜀𝑁
Modularity is where the network is fully subdivided into a set of nonoverlapping
modules M. It is calculated as follows, where 𝑒𝑢𝑣 is the portion of connections that link
nodes in module u with nodes in module v:
𝑄 = ∑ ⌈𝑒𝑢𝑢 − (∑ 𝑒𝑢𝑣
𝑢ε𝑀
) 2⌉
𝑢ε𝑀

262
9.7 Chapter 4 missing data
Study Total number
QC Fail Left handed or ambidexterous
Total
HD-YAS 122 1 14 107
TrackOn-HD Single-shell 2012
222 41 24 157
TrackOn-HD Single-shell 2013
222 30 24 168
TrackOn-HD Single-shell 2014
222 40 24 158
TrackOn-HD Multi-shell 2014
80 0 7 73
For TrackOn-HD single shell data, 56 gene carriers and 65 controls had data at 3 time points, 28
premanifest and 24 controls had data at 2-time points, and 10 gene carriers and 9 controls had
data at one time point. The TrackOn-HD multi-shell acquisition was only performed at 2 of the 4
sites (London and Paris).


