Embed Size (px)
Citation preview

IOSR Journal of Computer Engineering (IOSR-JCE)
e-ISSN: 2278-0661,p-ISSN: 2278-8727, Volume 17, Issue 5, Ver. II (Sep. – Oct. 2015), PP 07-18 www.iosrjournals.org
DOI: 10.9790/0661-17520718 www.iosrjournals.org 7 | Page
Brain Tumor Detection through MR Images: A Review of
Literature
Ritu Rana1, Parvinder Singh
2
1M. Tech. Scholar Department of CSE, D.C.R. University of Science & Technology, Murthal, Sonepat,
Haryana-131001, India 2Associate Professor Department of CSE, DCRUST, Murthal, Sonepat, Haryana-131001, India
Abstract: A brain tumor is an abnormal growth of tissue in the brain or central spine that can disrupt proper
brain function and creates an increasing pressure in the brain. This paper is intended to present a
comprehensive review of the methods of brain tumor detection through Magnetic Resonance Imaging (MRI)
technique used in different stages of Computer Aided Detection System (CAD). It also provides a brief
background on brain tumor in general and non-invasive imaging of brain tumor in order to give a
comprehensive insight into the field. Lastly, the paper concludes with a concise discussion and provides a
direction toward the upcoming trend of more advanced research studies on brain image segmentation and
tumor detection.
Keywords: Brain Tumor, Central Nervous System (CNS), Cerebrospinal Fluid (CSF), Magnetic Resonance
Imaging (MRI), Segmentation.
I. Introduction A brain tumor is a collection (or mass) of abnormal cells in the brain. A tumor may lead to cancer,
which is a major leading cause of death and responsible for around 13% of all deaths world-wide. Cancer
incidence rate is growing at an alarming rate in the world. So detection of the tumor is very important in earlier
stages. Great knowledge and experience on radiology are required for accurate tumor detection in medical
imaging. MRI is the most flexible of our diagnostic imaging modalities, possessing the ability to characterize a
wide range of parameters in the living subject and provide exquisite spatial resolution. Brain tumor
identification form magnetic resonance imaging (MRI) consists of several stages. Segmentation is known to be
an essential but difficult step in medical imaging classification and analysis. Hence, it is highly necessary that segmentation of the MRI images must be done accurately before asking the computer to do the exact diagnosis.
This review presents an overview of magnetic resonance imaging (MRI)-based medical image analysis for brain
tumor studies.
1.1 Brain
Together, the brain and spinal cord (the central nervous system (CNS)) control the physiological and
psychological functions of our body. Generally our brain includes three major parts:
1. Cerebrum. It controls thinking, learning, problem solving, emotions, speech, reading, writing, and voluntary
movement.
2. Cerebellum. It controls movement, balance, and posture.
3. Brain stem. It connects the brain to the spinal cord, and controls vital functions in human body such as motor, sensory pathways, cardiac, repository and reflexes [1].
The brain is composed of two tissue types, namely gray matter (GM) and white matter (WM). Gray
matter is made of neuronal and glial cells, also known as neuroglia or glia that controls brain activity and the
basal nuclei which are the gray matter nuclei located deep within the white matter. The basal nuclei include:
caudate nucleus, putamen, pallidum and claustrum. White matter fibers consist of many elinated axons which
connect the cerebral cortex with other brain regions. The left and the right hemispheres of the brain are
connected by corpus callosum which is a thick band of white matter fibers. Both, cerebellum and cerebrum
have a very thin outer cortex of gray matter, internal white matter and small but deeply situated masses of the
gray matter. The spinal cord is located toward the bottom of the brain. It has three structures: the midbrain, pons
and medulla oblongata [2].
The brain also contains cerebrospinal fluid (CSF) which consists of glucose, salts, enzymes, and white blood cells. This fluid circulates through channels (ventricles) around the brain and the spinal cord to protect
them from injury. There is also another tissue called meninges which are the membrane covering the brain and
spinal cord [2].

Brain Tumor Detection through MR Images: A Review of Literature
DOI: 10.9790/0661-17520718 www.iosrjournals.org 8 | Page
Fig. 1 [3] shows the anatomy of the brain. It is composed of the cerebrum and the brain stem. The
cerebrum occupies the
Fig. 1 Structure of Brain and its Functions.
Largest part of the brain. It is connected with the conscious thoughts, movement and sensations. It
further consists of two halves, the right and the left hemispheres. Each controls the opposite side of the body. Moreover, each hemisphere is divided into four lobes: the frontal, temporal, parietal and occipital lobes as
shown in Fig. 2 [3].
Fig. 2 Lobes of Human Brain.
Functions of lobes are: 1. Frontal Lobe. It is a portion of the cerebral cortex lying just behind the forehead. It is involved in speaking
and muscle movements and in making plans and judgments.
2. Occipital Lobe. It is a portion of the cerebral cortex lying at the back of the head. It includes areas that
receive information from the visual fields.
3. Parietal Lobe. It is a portion of the cerebral cortex lying at the top of the head and toward the rear. It
receives sensory input for touch and body position.
4. Temporal Lobe. It is a portion of the cerebral cortex lying roughly above the ears. It includes the auditory
areas, each receiving information primarily from the opposite ear [3].
1.2 Brain Tumor
A brain tumor is an abnormal growth of tissue in the brain or central spine that can disrupt proper brain function and creates an increasing pressure in the brain. Due to increased pressure on the brain, some brain
tissues are shifted, pushed against the skull or are responsible for the damage of the nerves of the other healthy
brain tissues [4]. Brain and spinal cord tumors are different for everyone. They form in different areas, develop

Brain Tumor Detection through MR Images: A Review of Literature
DOI: 10.9790/0661-17520718 www.iosrjournals.org 9 | Page
from different cell types, and may have different treatment options. Scientists have classified brain tumor
according to:
1. The type and grade (how aggressive it is), 2. Whether it is a primary or a secondary tumor,
3. If it is cancerous (malignant) or not (benign), and
4. Where in the brain the tumor is located [5].
The least aggressive type of brain tumor is often called a benign brain tumor. They originate from cells
within or surrounding the brain, do not contain cancer cells, grow slowly, and typically have clear borders that
do not spread into other tissue. They may become quite large before causing any symptoms. If these tumors can
be removed entirely, they tend not to return. Still, they can cause significant neurological symptoms depending
on their size, and location near other structures in the brain. Some benign tumors can progress to become
malignant.
Malignant brain tumors contain cancer cells and often do not have clear borders. They are considered to be life-threatening because they grow rapidly and invade surrounding brain tissue. Although malignant brain
tumors very rarely spread to other areas of the body, they can spread throughout the brain or to the spine. These
tumors can be treated with surgery, chemotherapy and radiation, but they may recur after treatment.
Whether cancerous or benign, tumors that start in cells of the brain are called primary brain tumors. Primary
brain tumors may spread to other parts of the brain or to the spine, but rarely to other organs. Metastatic or
secondary brain tumors begin in another part of the body and then spread to the brain. These tumors are more
common than primary brain tumors and are named by the location in which they begin. They are treated based
on where they originate, such as the lung, breast, colon or skin. Each of these tumors has unique clinical,
radiographic and biological characteristics [4].
1.3 Brain Tumor Grading
Tumors are given a name based on the cells where they arise, and a number ranging from 1–4, usually represented by Roman numerals I-IV. This number is called the “grade” and it represents how fast the cells can
grow and are likely to spread. This is critical information for planning treatment and predicting outcomes.
Lower grade tumors (grades I & II) are not very aggressive and are usually associated with long-term
survival. These appear almost normal under a microscope and can potentially be cured with surgery. Grade II
tumor can invade adjacent normal tissue and can recur as a higher grade tumor. Higher grade tumors (grade III
& IV) grow more quickly, can cause more damage, and are often more difficult to treat. These are considered
malignant or cancerous. These appear abnormal under a microscope. Areas of dead cells (necrosis) in center
tumors can contain several grades of cells; however, the most malignant cell determines the grade for the entire
tumor (even if most of the tumor is a lower grade). Some tumors can change the way they grow and may
become malignant over time [1].
1.4 Brain Tumor Types
The World Health Organization (WHO) has created a standard by which all tumors are classified.
There are over 120 brain tumor classifications defined by the WHO, based on the tumor cell type and location,
making this a very complex diagnosis. The most common primary tumor types found in adults are Gliomas,
Meningiomas, Schwannomas, pituitary tumors, and CNS Lymphoma[1]. Gliomas begin from glial cells found
in the supportive tissue of the brain. There are two types of gliomas Astrocytomas and Oligodendrogliomas,
categorized by where they are found, and where the tumor begins. These begin in the supporting tissue cells
(astrocytes) of the brain. In adults, they are most commonly found in the cerebrum where they cause pressure,
seizures and personality changes. Astrocytomas are generally subdivided into low (grade I & II) or high grade
(grade III & IV). High grade (grade IV) are the most malignant of all brain tumors, known as glioblastoma.
Oligodendrogliomas tend to respond better to therapies and have a better prognosis than most other gliomas.
They are grade II or III. Meningiomas are usually slow-growing, benign tumors that come from the outer coverings of the brain
just under the skull. This type of tumor accounts for about one third of brain tumors in adults. They may exist
for many years before being detected and are commonly found in the cerebral hemispheres just under the skull
[1].
Schwannomas are usually benign tumors that arise from the supporting nerve cells called vestibular
schwannomas or acoustic neuromas. Vestibular schwannomas often cause hearing loss, or problems with
balance or weakness on one side of the face. Surgery can be difficult because of where they are located.
Sometimes radiation (or a combination of surgery and radiation) is used to treat these tumors [1].
Brain Tumor Detection through MR Images: A Review of Literature
DOI: 10.9790/0661-17520718 www.iosrjournals.org 10 | Page
The pituitary gland is located at the base of the brain and it produces hormones that control other
glands in the body; specifically the thyroid, adrenal glands, ovaries and testes, glands for milk production in
pregnant women, and the kidneys. Tumors in or around the pituitary gland can lead to problems with how these glands function. Also, patients may have vision problems. Pituitary tumors are frequently benign, and surgical
removal is often the cure. Some are treated with medication to shrink or stop the tumor from growing [1].
CNS (Central Nervous System) Lymphoma is a malignant primary brain tumor that originates from the
lymphocytes found in the brain, spinal cord, or eyes. It typically remains confined to the CNS. Treatment
commonly includes chemotherapy and/or radiation [1].
II. Scan and Imaging Techniques A scan is the first step to identify whether a brain tumor is present or not, and if present, locate exactly
where it is growing. A scan creates computerized images of the brain and spinal cord by examining it from different angles. Some scans use a contrast agent (or a dye) to allow the doctor to see the difference between
normal and abnormal tissue. A patient may need more than one type of scan to diagnose a tumor, depending on
its type and location.
Commonly used scanning and imaging techniques [1]:
Computed Axial Tomography (CAT or CT Scan) is a computerized x-ray that can show a combination of
soft tissue, bone, and blood vessels. This is often the first test a person will receive in an emergency room
(i.e. after a seizure).
Magnetic Resonance Imaging (MRI) can create clear and detailed three dimensional images of a brain
tumor. An MRI is not often used with people who have a pace maker or other metal device.
Magnetic Resonance Spectroscopy (MRI Spect or MRS), measures the levels of metabolites in the body. An MRS can detect irregular patterns of activity to help diagnose the type of tumor, evaluate its response to
therapies, or determine aggressiveness of a tumor.
Perfusion MRI examines the flow of blood into the tissues to help assess the grade/aggressiveness of tumors
and differentiate a recurrent tumor from dead tumor tissue.
Functional MRI (fMRI) tracks the use of oxygen and blood flow in the brain as patients perform tasks. An
fMRI can identify the motor, sensory, visual and language centres of the brain which helps your doctor
carefully plan for surgery.
Positron Emission Tomography (PET) scan uses a radioactive substance to visualize hypermetabolic
activity such as with malignant cells, or abnormalities from a tumor or scar tissue. PET is also used during
brain mapping procedures.
Spinal tap (also called a lumbar puncture), uses a special needle placed into the lower back to measure pressure in the spinal canal and brain and determine if there is an infection or tumor cells.
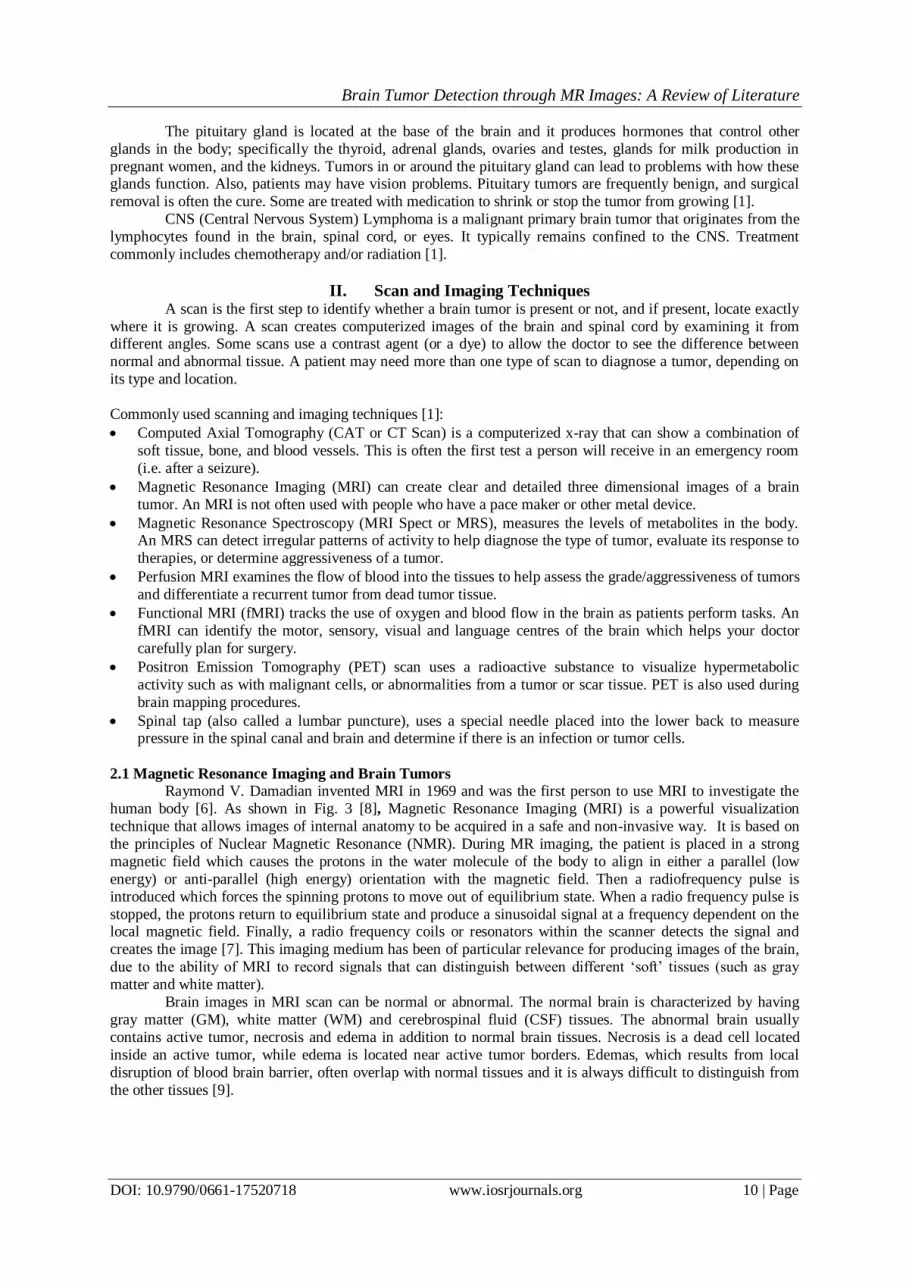
2.1 Magnetic Resonance Imaging and Brain Tumors
Raymond V. Damadian invented MRI in 1969 and was the first person to use MRI to investigate the
human body [6]. As shown in Fig. 3 [8], Magnetic Resonance Imaging (MRI) is a powerful visualization
technique that allows images of internal anatomy to be acquired in a safe and non-invasive way. It is based on
the principles of Nuclear Magnetic Resonance (NMR). During MR imaging, the patient is placed in a strong
magnetic field which causes the protons in the water molecule of the body to align in either a parallel (low
energy) or anti-parallel (high energy) orientation with the magnetic field. Then a radiofrequency pulse is
introduced which forces the spinning protons to move out of equilibrium state. When a radio frequency pulse is
stopped, the protons return to equilibrium state and produce a sinusoidal signal at a frequency dependent on the local magnetic field. Finally, a radio frequency coils or resonators within the scanner detects the signal and
creates the image [7]. This imaging medium has been of particular relevance for producing images of the brain,
due to the ability of MRI to record signals that can distinguish between different „soft‟ tissues (such as gray
matter and white matter).
Brain images in MRI scan can be normal or abnormal. The normal brain is characterized by having
gray matter (GM), white matter (WM) and cerebrospinal fluid (CSF) tissues. The abnormal brain usually
contains active tumor, necrosis and edema in addition to normal brain tissues. Necrosis is a dead cell located
inside an active tumor, while edema is located near active tumor borders. Edemas, which results from local
disruption of blood brain barrier, often overlap with normal tissues and it is always difficult to distinguish from
the other tissues [9].

Brain Tumor Detection through MR Images: A Review of Literature
DOI: 10.9790/0661-17520718 www.iosrjournals.org 11 | Page
Fig. 3 MRI Scanner.
An axial MRI looks at the brain from below in a series of images starting at the chin and moving to the
top of the head. A sagittal MRI looks at the brain from the side in a series of images starting at one ear and
moving to the other. A coronal MRI looks at the brain from behind in a series of images starting at the back of
the head and moving to the face as shown in Fig. 4 [10].
a) b) c)
Fig. 4 Brain MR Images from a) Axial Plane, b) Sagittal Plane, and c) Coronal Plane.
The signal processing has three different images that can be achieved from the same body: T1-
weighted, T2- weighted and PD-weighted (proton density) as shown in Fig. 5 [11].
a) b) c)
Fig. 5 Brain MR Images from Axial Plane a) T1-w, b) T2-w, and c) PD-w image.
The signal intensity on the MR image is determined by four basic parameters: 1) Proton density, 2) T1
relaxation time, 3) T2 relaxation time, and 4) Flow. Proton density is the concentration of protons in the tissue in
the form of water and macromolecules (proteins, fat, etc). The T1 and T2 relaxation times define the way that
the protons revert back to their resting states after the initial RF pulse. The most common effect of flow is loss
of signal from rapidly flowing arterial blood [12].
The contrast on the MR image can be manipulated by changing the pulse sequence parameters. A pulse
sequence sets the specific number, strength, and timing of the RF and gradient pulses. The two most important
parameters are the repetition time (TR) and the echo time (TE). The TR is the time between consecutive 90 degree RF pulse. The TE is the time between the initial 90 degree RF pulse and the echo. The most common
pulse sequences are the T1-weighted and T2-weighted spin-echo sequences.
The T1-weighted sequence uses a short TR and short TE (TR < 1000msec, TE < 30msec). The T2-
weighted sequence uses a long TR and long TE (TR > 2000msec, TE > 80msec). The T2-weighted sequence is
usually employed as a dual echo sequence. The first or shorter echo (TE < 30msec) is proton density (PD)

Brain Tumor Detection through MR Images: A Review of Literature
DOI: 10.9790/0661-17520718 www.iosrjournals.org 12 | Page
weighted or a mixture of T1 and T2. This image is very helpful for evaluating periventricular pathology, such as
multiple sclerosis, because the hyperintense plaques are contrasted against the lower signal CSF. More recently,
the FLAIR (Fluid Attenuated Inversion Recovery) sequence has replaced the PD image. FLAIR images are T2-weighted with the CSF signal suppressed [12].
When reviewing an MR image, the easiest way to determine which pulse sequence was used, or the
"weighting" of the image, is to look at the cerebrospinal fluid (CSF). If the CSF is bright (high signal), then it
must be a T2-weighted imaged. If the CSF is dark, it is a T1-weighted image. Thereafter, look at the signal
intensity of the brain structures. On MR images of the brain, the primary determinants of signal intensity and
contrast are the T1 and T2 relaxation times. The contrast is distinctly different on T1 and T2-weighted images.
Also, brain pathology has some common signal characteristics [12].
2.2 Difficulties in segmentation of brain MRI
Cortical segmentation has not been made fully automated and operated at high speed because of the
reliability of the MRI with regards to the homogeneity of its magnetic field. The problems of MRI include: 1. Noise: There is random noise connected with MR imaging system. This is known to have a Rician
distribution [13].
2. Intensity non-homogeneity also called bias field or shading artifact: The non-uniformity in the radio
frequency (RF) field during data collection results in shading effect [14].
3. Partial volume effect: In this type of effect more than one type of class or tissue occupies one pixel or voxel
of an image. The pixels or voxels are called mixels [15].
III. Literature Review Image segmentation [16] is the process of partitioning a digital image into multiple segments (sets of pixels, also known as super pixels). The goal of segmentation is to simplify and/or change the representation of
an image into something that is more meaningful and easier to analyze. Image segmentation is typically used to
locate objects and boundaries (lines, curves, etc.) in images. More precisely, image segmentation is the process
of assigning a label to every pixel in an image such that pixels with the same label share certain visual
characteristics.
In case of medical image segmentation the aim is to [16]:
Study anatomical structure,
Identify Region of Interest i.e. locate tumor, lesion and other abnormalities,
Measure tissue volume to measure growth of tumor (also decrease in size of tumor with treatment), and
Help in treatment planning prior to radiation therapy; in radiation dose calculation.
Using segmentation in medical images is a very important task for detecting the abnormalities, study
and tracking progress of diseases and surgery planning. Segmentation must not allow regions of the image to
overlap.
Objective of this review section is to present literature survey of image segmentation methods. The
main goal is to highlight advantages and limitations of these methods. Key image processing techniques for
brain MRI image segmentation are classified as thresholding, region-growing, clustering, edge detection, atlas-
based, other methods etc. All these techniques are explained further in the following sections and many notable
methods have been reviewed.
3.1 Thresholding based methods
Thresholding is one of the most generally used and oldest methods for image segmentation. In thresholding approach, image segmentation is based on gray level intensity value of pixels. Histogram of image
is consists of peaks and valleys, where each peak represents one region. The valley between the peaks represents
a threshold value. Histogram thresholding method is based on a concept that divides the image into two equal
halves and histograms are compared to detect the tumor and cropping method is used to find a proper physical
dimension of brain tumor. The threshold technique makes decision based on the local raw pixel information. It
helps in extracting the basic shape of an image, overlooking the little unnecessary details. However,
thresholding is often used as an initial step in a sequence of image segmentation process. Its main limitation is
that only two classes are generated and it does not work when confronted with structures that lack clear borders
[17].
Image segmentation through thresholding is considered to be a simple and powerful approach to
segment the images that have light objects on dark background [18]. On the basis of thresholding value, there are two types of threshold values such as global and local thresholding [19]. The approach is called global
thresholding when the T is fixed or constant. Otherwise, it is called local thresholding. If the background

Brain Tumor Detection through MR Images: A Review of Literature
DOI: 10.9790/0661-17520718 www.iosrjournals.org 13 | Page
illumination is uneven, the global thresholding is likely to fail. In local thresholding, multiple thresholds are
used to compensate the uneven illumination [20].
3.2 Region growing based methods
In this technique, the images are partitioned by organizing the nearest pixel of similar kind (texture,
intensity levels, homogeneity or sharpness). It starts with some initial seed point (pixel) selection using some
predefined criteria. Accordingly the neighbouring pixels based on homogeneity criteria are appended
progressively to the seed. This technique is simple and can correctly separate the image pixels that have similar
properties to form large regions or objects. As this approach depends on the spatial correlation of pixels in an
image, the segmented output is expected to be better as compared to the histogram thresholding based scheme.
After region growing is over region merging is performed, different regions of the image are merged to a single
region with some similarity criteria.
In splitting process, region get divided into sub regions that do not satisfy a given homogeneity criteria.
Splitting and merging can be used together and its performance mostly depends on the selected homogeneity criterion. Without tuning homogeneity parameters, the seeded region growing technique is controlled by a
number of initial seeds. If the number of regions was approximately known & used it to estimate the
corresponding parameters of edge detection.
For region growing, seeds can be automatically or manually selected. Their automated selection can be
based on finding pixels that are of interest, e.g. the brightest pixel in an image can serve as a seed pixel. They
can also be determined from the peaks found in an image histogram. On the other hand, seeds can also be
selected manually for every object present in the image. The method is employed to segment an image into
different regions using a set of seeds. Each seeded region is a connected component comprising of one or more
points and is represented by a set S. The set of immediate neighbors bordering the pixel is calculated. The
neighbors are then examined and if they intersect any region from set S, then a measure δ (difference between a
pixel and the intersected region) is computed. If the neighbors intersect more than one region, then the set is
taken as that region for which difference measure δ is maximum. The new state of regions for the set then constitutes input to the next iteration. This process continues until the entire image pixels have been assimilated
into regions [21]. To eliminate the dependency on initial seeds and to make the method automatic statistical
information and a priori knowledge can be incorporated in the algorithm. Region growing can be so sensitive to
noise, that it may cause extracted regions to have holes or even is disconnected. Conversely, overlapping gray
value distribution in MR images can cause separate regions to become connected.
Region growing is not often used alone because it is not sufficient to segment brain structures
accurately and robustly. As compared to edge detection method, segmentation algorithms based on region are
simpler and have strongly immune to noise [22], [23]. Edge method divide an image based on frequent changes
in intensity near the edges, while, region method divide an image into regions which are similar as per a set of
predetermined criteria [24].
3.3 Clustering Based Methods
The method of clustering organizes the objects into groups based on some feature, attribute and
characteristic. Hence a cluster consists of groups of similar objects. There are two types of clustering, supervised
and unsupervised. In supervised type clustering, cluster criteria are specified by the user. In unsupervised type,
the cluster criteria are decided by the clustering system itself.
1) K-Means Clustering: K-Means Clustering partition the n observations into k clusters in which each
pixel belongs to the clusters by minimizing an objective function in a way that the within cluster sum of squares
is get minimized. It starts with initial K cluster centres and it reassigns the observations to clusters based on the
similarity between the observations and cluster centre. Automation of detection and segmentation of brain
tumors in MRI images is a very challenging task due to occurrence of high degree of gray-level similarity in the
image. T. U. Paul and S. K. Bandhyopadhyay [25] have presented a fully automated two-step segmentation
process of brain MRI images. In the first step, skull stripping is performed by generating a skull mask from the MRI image and in the second step, an advanced K-means algorithm improvised by two-level granularity
oriented grid based localization process based on standard local deviation is used to segment the image into gray
matter, white matter and tumor region and then length and breadth of the tumor is assessed.
2) Fuzzy C-Means Clustering: Fuzzy C-means (FCM) clustering is a data clustering method in which
each data point belongs to a cluster to a degree specified by a membership value. Fuzzy C-means divides a
collection of n vectors into c fuzzy groups and finds a cluster centre in each group such that a cost function of
dissimilarity measure is minimized.

Brain Tumor Detection through MR Images: A Review of Literature
DOI: 10.9790/0661-17520718 www.iosrjournals.org 14 | Page
3.4 Edge Detection Based Methods
Edge-based methods are focused on detecting contour. They fail when the image is blurry or too
complex to identify a given border. The most important feature in an image is the contrast. Contrast may be described as discontinuities in the gray values of an image or variations in scene illumination. In vision based
analysis edge is considered as a very good descriptor of contrast. Different approaches of edge detection in an
image includes gradient based edge (includes Sobel, Perwitt and Robert operators), Canny edge, Fuzzy edge,
Laplacian of Gaussian (LOG), Laplacian edge etc.
Edge detection based scheme provides an efficient object detection result against illumination variation
in the scene but it has its own drawbacks. The major limitation of the edge-based approach of object detection
scheme is its inability to produce a reasonable solution in cluttered background. In case of two or more objects
present (overlapped with each other) in the scene the effect of silhouette is also likely to occur as one of the
objects may not able to be identified in the image. Many of the edge detection problems can be eliminated by
the active contour detection schemes. Active contours are deforming dynamic curves defined within an image
that can move under the influence of internal and external forces derived from the image data. It can be specified through a function and a differential equation controlling the contour causes it to evolve so as to
reduce its energy to minima that correspond to the desired region boundaries. Few examples of the active
contour approaches includes: snake model, balloon model, gradient vector field snake, and level set approaches
[26]. However, these approaches have a limitation of getting stuck at local minima and also highly sensitive to
starting point.
3.5 Fuzzy Based Methods
Fuzzy logic is a set of mathematical principles for knowledge representation based on degrees of
classical binary logic. In brain tumor segmentation fuzzy systems allow for the development of methods to
perform the tasks related to intelligent human behaviours.
Dunn suggested image segmentation using fuzzy c-means (FCM) clustering algorithm [27]. FCM
implemented by several researchers and provide improved version for segmentation for brain MRI. To overcome the intensity inhomogeneities in FCM, Arakeri et al. [28] proposed a modified version MFCM.
Accuracy is one of the important factors for brain image segmentation applications, they preferred
computational techniques. MFCM is applied to the approximate image to segment the tumor and contain more
detail of the images.
Rajendran proposed fuzzy logic processing using c-means clustering on MR images for brain tumor
segmentation [29]. FCM algorithm fails to deal with significant properties of images, which leads to strong
noise sensitivity. To overcome this weakness, proposed a new clustering algorithm named PCM. Possibilistic
membership, are very sensitive to the choice of the additional parameters of PCM, which directly decide the
clustering accuracy.
To overcome the weakness of the original PCM algorithm combined the objective function of PCM
and FCM into a new objective function and PFCM, which can be interpreted as PCM and FCM, respectively, in some special cases where some proper parameter were adopted Xuan ji et al. [30], [31]. Pal et al. [32] Proposed
EPFCM method, distance metric in PCFM is modified in such a way that includes memberships, both local non
local spatial neighbourhood information to overcome the noise effect in MRI brain medical images.
3.6 Atlas- Guided Approaches
Atlas-guided approaches are a powerful tool for medical-image segmentation when a standard atlas or
template is available. The atlas is generated by compiling information on the anatomy that requires segmenting.
This atlas is then used as a reference frame for segmenting new images. Conceptually, atlas-guided approaches
are similar to classifiers except that they are implemented in the spatial domain of the image rather than in a
feature space. Atlas-guided approaches have been applied mainly in MR brain imaging for segmentation of
various structures, as well as for extracting the brain volume from head scans.
The standard atlas-guided approach treats segmentation as a registration problem. It first finds a one-to-one transformation that maps a pre-segmented atlas image to the target image that requires segmenting. This
process is often referred to as „atlas warping‟. The warping can be performed with linear transformations, but,
because of anatomical variability, a sequential application of linear and nonlinear transformations is often used
[33]. Because the atlas is already segmented, all structural information is transferred to the target image. A
major challenge associated with atlas-based segmentation techniques is developing the atlas itself. The atlas-
guided approaches are generally better suited for segmentation of structures that are stable over the population
of study [34].

Brain Tumor Detection through MR Images: A Review of Literature
DOI: 10.9790/0661-17520718 www.iosrjournals.org 15 | Page
3.7 Comparison of Segmentation Methods
In this study, we have studied different techniques for segmentation. The segmentation methods studied
in this paper include thresholding, region growing, edge detection, clustering, fuzzy & atlas- based methods. Comparison of the studied techniques is shown in Table 1.
3.8 Papers Reviewed
S. Shen, et al, 2003, proposed [50] a new brain tumor diagnostic procedure using magnetic-resonance
imaging (MRI) which circumvents the requirement of an invasive biopsy. In this method MR images were
preprocessed, using standardizing, non-brain removal and enhancement and an improved fuzzy clustering
algorithm was then applied to segment the brain MRI into different tissues. To complete the diagnosis fuzzy
logic based genetic programming (GP) procedure was developed to search for classification rules. Classification
results for three types of tumors on different MR images for different pathologies, indicated that the technique is
promising.
TABLE 1. Summary Table of Segmentation Methods
Segmentation Method
Advantages Disadvantages
Threshold-based: Global
and Local Thresholding
Simple and computationally fast. Limited applicability to enhancing tumor
areas [35].
Region-based: Region-
growing
Simple and capable of correctly segmenting regions that have
similar properties and generating connected region [36].
Partial volume effect [37], [38]. Noise or
variation of intensity may result in holes or
over-segmentation.
Edge Detection Based
Method
Focused on detecting contour.
In vision based analysis, edge is considered as a very good
descriptor of contrast [26].
Fail when the image is blurry or too
complex to identify a given border.
Inability to produce a reasonable solution in
cluttered background.
Watershed Segments multiple regions at the same time, produces a
complete contour of the images and avoids the need for any
kind of contour joining [39].
Over-segmentation [40].
Pixel-based: Fuzzy C
Means
Unsupervised, always converges the boundaries of tumor. Long computational time, sensitive to noise
[41].
Artificial Neural
Networks
Ability to model non-trivial distributions and non-linear
dependencies [42].
Gathering training samples is not straight-
forward and learning phase is slow [43].
Markov Random Fields Are able to represent complex dependencies among data
instances [44].
Difficulty when selecting the parameters
that control the strength of spatial
interactions, & usually require algorithms
that are computationally intensive [45].
Model-based:
Parametric Deformable
Models
Capable of accommodating to the variability of biological
structures over time and across different individuals [46].
The model may converge to wrong
boundaries in case of inhomogeneities [47].
Level Sets Approach Topological changes are naturally possible [48]. Computationally expensive [49].
Atlas- Guided Approach Labels are transferred as well as the segmentation. They also
provide a standard system for studying morphological
properties, and the data from such study can be used to generate
morphological statistics [34].
Developing the atlas itself is difficult.
M. C. de Andrade, 2004, introduced [51] an interactive algorithm for image smoothing and
segmentation. This method combines some known image smoothing and segmentation methods of mathematical
morphology and PDE-based level set frames. The segmentation was a region growing and automatically detect
all image minima using a property inherited from the watershed transformation (NHW). A merging mechanism
was used to change the image topology which reduces over-segmentation and the need of preprocessing.
Accurate and fast segmentation results were achieved for gray and color images in any number of dimensions
using this method.
Cigdem Demir, et al, 2005, presented [52] a graph-based representation (a.k.a., cellgraph) of
histopathological images for automated cancer diagnosis by probabilistically assigning a link between a pair of cells (or cell clusters). First, the work defined a set of global metrics on a cell-graph to capture tissue level
information coded into the histopathological images. Second, the results were obtained on the photomicrographs
of 646 archival brain biopsy samples of 60 different patients by comparing the cell-graph approach against cell-
distribution and textural approaches for tissue level diagnosis of brain cancer called malignant glioma. This
method measured the strength of the cell-graph representation which showed 99 percent accuracy for healthy
tissues with lower cellular density level, and at least 92 percent accuracy for benign tissues in the diagnosis of
cancer.
Carles Arus, et al, 2006, introduced [53] HealthAgents, an EC-funded research project to improve the
classification of brain tumors through combination of vivo MRS with in vitro MAS and gene expression.
HealthAgents solved the problem of collection and management of highly complex data by building multi-agent

Brain Tumor Detection through MR Images: A Review of Literature
DOI: 10.9790/0661-17520718 www.iosrjournals.org 16 | Page
decision support over a distributed network of local databases or data marts. They introduced a unique
technology to develop clinical tools for the diagnosis, management and understanding of brain tumors.
G. Farias, et al, 2008, proposed [54] a synergy of signal processing techniques and intelligent strategies was applied in order to identify different types of human brain tumors, so that it help to confirm the histological
diagnosis. The wavelet-SVM (support vector machine) classifier merged wavelet transform and SVM to reduce
the size of the biomedical spectra and to extract the main features, with SVM to classify them. It reduces the
classification time and improve the results specially taking into account that medical knowledge was not
considered.
Rajeev Ratan, Sanjay Sharma, S. K. Sharma, 2009, have developed [55] a brain tumor segmentation
method on 2D MRI Data which automatically identifies tumor tissue. The watershed segmentation method did
not require any initialization inside the tumor and the visualization and quantitative evaluations of the
segmentation results demonstrate the effectiveness of this approach. This method performance is better for the
cases where the intensity level difference between the tumor and non tumor regions is higher.
Sabuncu et al, 2010, proposed [56] a nonparametric, probabilistic model for the automatic segmentation of medical images, given a training set of images and corresponding label maps. Label fusion
segmentation approach can be employed on large multi-subject datasets and yields more accurate segmentation
than FreeSurfer‟s widely used atlas-based segmentation tool and previous label fusion algorithms. It robustly
detected hippocampal volume differences in a study of early Alzheimer‟s Disease and aging.
Debnath Bhattacharyya and Tai-hoon Kim, 2011, proposed [57] an image segmentation method to
indentify or detect tumor from the brain magnetic resonance imaging (MRI) for further consideration of medical
practitioners. Thresholding methods have different result in each image. So a set of image segmentation
algorithms was proposed by which detection of tumor can be done uniquely on brain tumor images.
In contrast to segmentation algorithms, detection algorithms only try to decide if tumor is present and
output the approximate tumor location instead of providing a complete segmentation. The tumor detection could
be used for initializing a segmentation method. Saha et al, 2011, proposed [58] a method to locate the tumor
using a fast unsupervised change detection method searching for dissimilar regions across the symmetry line of the brain using Bhattacharya coefficient score. This method drew a bounding box, instead of segmenting tumor
which helps in quick analysis of large amounts of data.
Farjam et al, 2012, proposed [59] a template-matching method to detect metastases on conventional
MRI for screening purposes. The result was improved on the spherical template generation process by varying
tumor size, lesion shape and intensities to achieve more accurate detection rates.
The most common way to quantitatively evaluate segmentation results is to calculate the overlap with
the ground truth. Usually, Dice similarity coefficient (DSC) or Hausdroff Distance are used. DSC can range
from 0 to 1 with 0 indicating no overlap and 1 indicating perfect overlap. Another method is to assess results on
a synthetic dataset including ground-truth. Although synthetic data lacks important characteristics of real
images, it has been used by many groups for initially assessing both segmentation and registration methods on
healthy datasets. Zou et al, 2004, compared [60] the three different validation metrics: area under the receiver operating
characteristics (ROC) curve, mutual information (MI) and Dice similarity coefficient (DSC) for probabilistic
brain tumor segmentation. The conclusion was that for overall classification accuracy the area under the ROC
curve should be used, for sensitivity to changes in tumor size MI was the metric of choice and for spatial
alignment evaluation the Dice coefficient was best.
IV. Conclusion Image segmentation is extensively used in numerous biomedical-imaging applications, e.g., the
quantification of tissue volumes, study of anatomical structure, diagnosis, localization of pathology, treatment planning and computer-integrated surgery. Now-e-days, speed of computation is no longer an issue for
researchers. Therefore, the focus is directed toward improvement of information from images obtained through
the slice orientation and perfecting the process of segmentation to get an accurate picture of the brain tumor. As
diagnosing tumor is a complicated and sensitive task; therefore, accuracy and reliability are always assigned
much importance. Hence, an elaborated methodology that highlights new vistas for developing more robust
image segmentation technique is much sought.

Brain Tumor Detection through MR Images: A Review of Literature
DOI: 10.9790/0661-17520718 www.iosrjournals.org 17 | Page
References [1] Cancer Support Community, “Frankly Speaking About Cancer: Brain Tumors”, National Brain Tumor Society, New York, Final
Rep. June 2013.
[2] Charles R. Noback, Norman L. Strominger, Robert J. Demarest and David A. Ruggiero, the Human Nervous System: Structure and
Function, 6th ed., Humana Press, 2005.
[3] The Nervous System, [Online]. Available: http://humananatomy2013.weebly.com/nervous-system.html, Accessed on: April 20,
2015.
[4] Louis D.N., Ohgaki H., Wiestler O.D, Cavenee W.K. (Eds.), WHO Classification of Tumors of the Central Nervous System,
International Agency for Research on Cancer (IARC), Lyon, France, 2007.
[5] Jan C. Buckner, et al., ―Central Nervous System Tumors, Mayo Clinic Proceedings, Vol. 82, No. 10, pp. 1271-1286. 2007.
[6] Damadian, R., Goldsmith, M. & Minkoff, L. NMR in Cancer: XVI. FONAR Image of the Live Human Body. Physiological
Chemistry and Physics, Vol.9, No.1, pp.97- 100, ISSN: 0031-9325. 1977.
[7] A. O Rodriguez, Principles of Magnetic Resonance Imaging, Revista Mexicana de Fisica, Vol. 50, No. 3, pp. 272-286. 2004.
[8] Rotator Cuff MRI Shoulder Scan & Arthrogram (MRA), [Online]. Available: http://www.colinmcnulty.com/blog/2011/08/04/my-
rotator-cuff-mri-shoulder-scan-and-arthrogram-mra/, Accessed on: April 20, 2015.
[9] [Online]. Available: http://www.radiologyassistant.nl/, Accessed on: April 20, 2015.
[10] [Online]. Available: http://www2.massgeneral.org/livingwithtsc/affects/brain-popup_anatomy.htm, Accessed on: April 20, 2015.
[11] Different types of MRI, [Online]. Available:
https://www.ole.bris.ac.uk/bbcswebdav/institution/Faculty%20of%20Medicine%20and%20Dentistry/MB%20ChB/Radiology/MRI
%20e-tutorial/page_04.htm, Accessed on: April 20, 2015.
[12] Magnetic Resonance Imaging of the Brain, [Online]. Available: http://spinwarp.ucsd.edu/neuroweb/rad401/syllabus.htm Accessed
on: April 20, 2015.
[13] Prima, S., Ayache, N., Barrick, T. & Roberts, N. Maximum Likelihood Estimation of the Bias Field in MR Brain Images:
Investigating Different Modelings of the Imaging Process, Processings of Medical Image Computing and Computer-Assisted
Intervention (MICCAI' 2001), Vol.2208, pp.811-819, DOI: 10.1007/3-540-45468-3_97. 2001.
[14] Li, X., Li, L., Lu, H., Chen, D. & Liang, Z. Inhomogeneity Correction for Magnetic Resonance Images with Fuzzy CMean
Algorithm, Processings of SPIE, Vol.5032, 2003.
[15] Ruan, S., Jaggi, C., Xue, J., Fadili, J. & Bloyet, D. Brain Tissue Classification of Magnetic Resonance Images Using Partial Volume
Modeling. IEEE Transactions on Medical Imaging, Vol.19, No.12, pp.1179- 1187, ISSN: 0278-0062. 2000.
[16] Image Segmentation, [Online]. Available: http://en.wikipedia.org/wiki/Image_segmentation, Accessed on: April 20, 2015.
[17] Sezgin M. and Sankur B., Survey over image thresholding techniques and quantitative performance evaluation, Journal of
Electronic Imaging, Vol. 13, No. 1, pp. 146– 165. 2004.
[18] Rastgarpour M., and Shanbehzadeh J., Application of AI Techniques in Medical Image Segmentation and Novel Categorization of
Available Methods and Tools, Proceedings of the International Multi Conference of Engineers and Computer Scientists 2011 Vol. I,
IMECS 2011, March 16-18, 2011, Hong Kong.
[19] Y. Zhang, H. Qu, Y. Wang, “Adaptive Image Segmentation Based on Fast Thresholding and Image Merging”, Artificial reality and
Telexistence-Workshops, pp. 308-311, 1994.
[20] T. Lindeberg and M.X. Li "Segmentation and classification of edges using minimum description length approximation and
complementary junction cues", Computer Vision and Image Understanding, Vol. 67, No. 1, pp. 88-98, 1997.
[21] Yian Leng Chang and Xiaobo Li, Adaptive Image Region-Growing, IEEE transaction on image processing, Vol. 3, No. 6,
November, 1994.
[22] W. X. Kang, Q. Q. Yang, R. R. Liang, “The Comparative Research on Image Segmentation Algorithms”, IEEE Conference on
ETCS, pp. 703-707, 2009.
[23] H. Zhang, J. E. Fritts, S. A. Goldman, “Image Segmentation Evaluation: A Survey of unsupervised methods”, computer vision and
image understanding, pp. 260-280, 2008.
[24] H. G. Kaganami, Z. Beij, “Region Based Detection versus Edge Detection”, IEEE Transactions on Intelligent information hiding
and multimedia signal processing, pp. 1217- 1221, 2009.
[25] T.U Paul and S.K. Bandyopadhyay, “Segmentation of Brain Tumor from Brain MRI Images Reintroducing K – Means with
advanced Dual Localization Method”, International Journal of Engineering Research and Applications, June 2012.
[26] G. Heo and C. G. Small. Form representions and means for landmarks: A survey and comparative study. Computer Vision and
Image Understanding, 102(2):188–203, 2006.
[27] J. C. Dunn, A Fuzzy Relative of the ISODATA Process and Its Use in Detecting Compact Well-Separated Clusters, Journal of
Cybernetics, Vol. 3, No.3, pp. 32-57. 1973.
[28] Megha. P. Arakeri · G. Ram Mohana Reddy “Computeraided diagnosis system for tissue characterization of brain tumor on
magnetic resonance images” SpringerVerlag London. 2013.
[29] A. Rajendran and R. Dhanasekaran, A hybrid Method Based on Fuzzy Clustering and Active Contour Using GGVF for Brain
Tumor Segmentation on MRI Images, European Journal of Scientific Research, Vol. 61, No. 2, pp. 305-313. 2011.
[30] Ze-Xuan Ji,Quan-SenSun ,De-ShenXia “A framework with modified fast FCM for brain MR images segmentation” Pattern
Recognition 44, pp. 999–1013. 2011.
[31] Ze-Xuan Ji, Quan-Sen Sun, De-Shen Xia “A modified possibilistic fuzzy c-means clustering algorithm for bias field estimation and
segmentation of brain MR image” Computerized Medical Imaging and Graphics 35, 383–397. 2011.
[32] Pal N.R, Pal K, Keller J.M. and Bezdek J.C, “A Possibilistic Fuzzy c-Means Clustering Algorithm”, IEEE Transactions on Fuzzy
Systems, Vol. 13, No. 4, pp. 517–530, 2005.
[33] Talairach J, Tournoux P. Co-Planar Stereotaxic Atlas of the Human Brain, 3-Dimensional Proportional System: An Approach to
Cerebral Imaging. Stuttgart, Ger. Thieme, p. 122. 1988.
[34] Rajarethinam NC, Andreasen R, Cizadlo T, Arndt S, Swayze VW, et al. Automatic atlas-based volume estimation of human brain
regions from MR images. J. Comput. Assist. Tomogr. 20 pp. 98–106. 1996.
[35] Gibbs P, Buckley D, Blackb S, Horsman A. Tumour determination from MR images by morphological segmentation. Phys Med
Biol, 41, pp. 2437–46. 1999.
[36] Salman Y, Badawi A, Assal M, Alian S. New automatic technique for tracking brain tumor response.Int Conf Biol Med Phys, pp.
1–4. 2005.
[37] Sato M, Lakare S, Wan M, Kaufman A. A gradient magnitude based region growing algorithm for accurate segmentation. Int Conf
Image Process, 3, pp. 448–51. 2008.

Brain Tumor Detection through MR Images: A Review of Literature
DOI: 10.9790/0661-17520718 www.iosrjournals.org 18 | Page
[38] Lakare S. 3D segmentation techniques for medical volumes. Stony Brooks: Center of Visual Computer, state university of NY;
2000.
[39] Gies V, Bernard T. Statistical solution to watershed over-segmentation. Int Conf Image Process, pp. 1863–6, 2004.
[40] Dam E, Loog M, Letteboer M. Integrating automatic and interactive brain tumor segmentation. Int Conf Pattern Rec, 3, pp. 790–3.
2004.
[41] Schmidt M. Automatic brain tumor segmentation. Master‟s thesis, University of Alberta, 2005.
[42] Zhang J, Ma K, Er M, Chong V. Tumor segmentation from magnetic resonance imaging by learning via one-class support vector
machine. Int Workshop Adv Image Technol, pp. 207–11. 2007.
[43] McInerney T, Terzopoulos D. Deformable models. Handbook of medical imaging processing and analysis. San Diego, CA:
Academic Press. pp. 127–45. 2000.
[44] Osher S, Sethian YA. Fronts propagating with curvature-dependent speed: algorithms based on Hamilton–Jacobi formulations. J
Comput Phys, 79(1), pp.12–49. 1988.
[45] Cobzas D, Birkbeck N, Schmidt M, Jagersand M, Murtha A. 3D variational brain tumor segmentation using a high dimensional
feature set. Computer Vision, 2007. ICCV 2007. p.1-8, [Online]. Available: http://dx.doi.org/10.1109/ICCV.2007.4409130.
[46] Capelle A, Colot O, Fernandez-Maloigne C. Evidential segmentation scheme of multi-echo MR images for the detection of brain
tumors using neighbourhood information. Inf Fusion, 5(3), pp. 203–16. 2004.
[47] Luo S, Li R, Ourselin S. A new deformable model using dynamic gradient vector flow and adaptive balloon forces. APRS
Workshop on Dig Image Comp. pp. 9–14. 2003.
[48] Iftekharuddin K, Zheng J, Islam M, Ogg R. Fractal-based brain tumor detection in multimodal MRI. Appl Math Comput, 207, pp.
23–41. 2009.
[49] Kannan S. A new segmentation system for brain MR images based on fuzzy techniques. Appl Soft Comput, 8, pp. 1599–606. 2008.
[50] Shen, S., Sandham, W.A., Granat, M.H., Dempsey, M.F., Patterson, J.: A new approach to brain tumour diagnosis using fuzzy logic
based genetic programming. In: International Conference of the IEEE Engineering in Medicine and Biology Society, Piscataway,
NJ, September 17-21, pp. 870–873. 2003.
[51] De Andrade, M.C.: An Interactive Algorithm for Image Smoothing and Segmentation. Electronic Letters on Computer Vision and
Image Analysis 4(1), pp. 32–48. 2004.
[52] Demir, C., Humayun Gultekin, S., Yener, B.: Learning the Topological Properties of Brain Tumors. IEEE/ACM Transactions on
Computational Biology and Bioinformatics 2(3), pp. 262–270. 2005.
[53] Arus, C., Celda, B., Dasmahaptra, S., Dupplaw, D., Gonzalez-Velez, H., Huffel, S.V., Lewis, P., Lluch i Ariet, M., Mier, M., Peet,
A., Robles, M.: On the Design of a Web-Based Decision Support System for Brain Tumour Diagnosis Using Distributed Agents. In:
Web Intelligence and Intelligent Agent Technology Workshops, Hong Kong, December 18-22,
pp. 208–211. 2006.
[54] Farias, G., Santos, M., Lopez, V.: Brain tumour diagnosis with Wavelets and Support Vector Machines. In: International
Conference on Intelligent System and Knowledge Engineering, Xiamen, November 17-19, pp. 1453–1459. 2008.
[55] Ratan, R., Sharma, S., Sharma, S.K.: Multiparameter Segmentation & Quantization of Brain Tumor from MRI images. ISEE-IJST
Journal 3(1). March 2009.
[56] Mert R. Sabuncu, B. T. Thomas Yeo, Koen Van Leemput, Bruce Fischl, and Polina Golland. A Generative Model for Image
Segmentation Based on Label Fusion, IEEE Transactions on Medical Imaging, vol. 29, no. 10, pp. 1714-1729. Oct. 2010.
[57] D. Bhattacharyya and T.-h. Kim. Brain Tumor Detection Using MRI Image Analysis, Springer-Verlag Berlin Heidelberg, UCMA
2011, Part II, CCIS 151, pp. 307–314. 2011.
[58] Saha, B. N., Ray, N., Greiner, R., Murtha, A., and Zhang, H. Quick detection of brain tumors and edemas: A bounding box method
using symmetry. Computerized medical imaging and graphics, 36(2), pp. 95–107. 2011.
[59] Farjam, R., Parmar, H. A., Noll, D. C., Tsien, C. I., and Cao, Y. An approach for computer-aided detection of brain metastases in
post-Gd T1-W MRI. Magnetic resonance imaging, 30(6), pp. 824–836. 2012.
[60] Zou, K. H., Wells, W. M., Kikinis, R., and Warfield, S. K. Three validation metrics for automated probabilistic image segmentation
of brain tumours. Statisticsin medicine, 23(8), pp. 1259–82. 2004.


