Embed Size (px)
Citation preview

Brave new worldHow the “new economy” could change the
face of economic base analysisKatherine Chalmers
Department of Economics, Bowling Green State University,Bowling Green, Ohio, USA
Eric HolsappleCenter for Investment and Real Estate and Department of Finance andReal Estate, Colorado State University, Fort Collins, Colorado, USA
Elaine WorzalaReal Estate Institute, University of San Diego, San Diego,
California, USA
Keywords Economics, Exports, Employment, Research work, United States of America
Abstract The expansion of computer and information technology firms combined with thesimultaneous decline in traditional manufacturing firms in the 1990s argues for a re-examinationof economic base models in light of changing basic sectors within the economy. This paper reviewsthe literature and employs an in-depth survey to describe the differences in the pattern ofemployment for traditional manufacturing firms and the “new economy” firms in LarimerCounty, Colorado, USA. This study indicates that traditional economic base analysis is not easilyapplied to communities with “new economy” firms and maintains that a more inclusive andcomprehensive survey method remains the best way to adequately capture the essential makeup ofa region’s economic base.
IntroductionThe large and rapid expansion of computer and information technology firms,often called the new economy, in the 1990s pushed many local communitiesseeking economic development and growth to consider these firms for incentiverelocation packages and other inducements (Gavin, 2001). Simultaneously,traditional manufacturing industries that had long provided a solid employmentbase for communities have recently been the source of significant layoffs. Inlight of these significant changes, traditional economic base analysis needs to bereconsidered. Do the new economy firms have a different impact on acommunity’s economic growth when compared to traditional manufacturingfirms? Given the recent economic decline of the information technology sector, isit reasonable to assume new economy firms provide a more stable, solidemployment base than traditional manufacturing companies?
The Emerald Research Register for this journal is available at The current issue and full text archive of this journal is available at
www.em�eraldinsight.com/res�earchregister� www.em�eraldinsight�.com/0263-7472.�htm
The authors would like to extend their sincere thanks to Dr Stephan Weiler of Colorado StateUniversity and Dr Jerry Carlino of the Federal Reserve Bank of Philadelphia for theirconstructive comments and advice in the writing of this paper.
Brave new world
29
Received December 2002Revised October 2003
Property ManagementVol. 22 No. 1, 2004
pp. 29-44q Emerald Group Publishing Limited
0263-7472DOI 10.1108/02637470410525473

This research evaluates these questions and analyzes the impact of“traditional” versus “new economy” types of basic industry in the followingmanner. First, research on economic base and location quotient theory and itsapplication for economic base theory are reviewed. Next, problems facingeconomic base theory and variations on economic base analysis are discussed.Then, the results of an in-depth survey of basic employers seeks to describe thedifferences in the pattern of basic employment for traditional manufacturingfirms and the new economy firms located in Larimer County, Colorado in theUSA. Finally, conclusions are provided which explore ways in which economicbase analysis might be expanded to describe better the employment base of acommunity.
Literature reviewSurvey of export base modelsCities or regions, like countries, do not exist in isolation; rather, they are subjectto ongoing flows of goods, ideas, people, products, and services. Therefore, anyeconomic model that seeks to explain local growth must take these flows intoaccount in its explanation of the sources of growth. Emerging frominternational trade theory, economic base models have sought to explain aregion’s growth through the examination of its inflows and outflows (North,1955). North (1955) argues that regions resemble countries, exploiting theirnatural resource distributions and comparative advantages to produce goodswith a lower opportunity cost. According to this model of economicdevelopment, all other economic activity within the region that is not directlytied to this export activity is supported by growth in these exporting industries.These ancillary industries are labeled service or “non-basic” industries,producing locally-demanded consumer goods and services. In this way, thetotal employment of a local community is driven by the employment growth ofbasic industries. These local businesses are assumed to be a consequence of aregion’s growth – not the source of it.
From this original idea, economic base theory has undergone a series ofrevisions. These revisions include measuring export flows out of a region byidentifying the long-run value of its imports (Hoyt, 1961). In addition,diversification of consumer goods produced by non-basic industries allowsresidents to consume largely within the community thereby keeping moneyflowing within the region rather than flowing out. In addition, other sources ofgrowth have been identified beyond those originally included in traditionaleconomic base models. Such factors as cultural traits, population size, andinstitutions should also be considered because they change and influence aregion’s economic growth (Thomas, 1964). Furthermore, Thomas (1964) alsopoints out that export base theory does not predict what will happen if anindustry arises which is not dependent on the traditional “basic” industries forgrowth. These could include the new economy firms who are largely dependenton consumer demand and innovation for industry growth.
PM22,1
30

It must also be noted that a regional economy need not be solely dependenton natural resources for growth (Stabler, 1968). Not only will the long-runcharacteristics of the natural resource help dictate a region’s growth pattern,but also population growth, changes in taste, new discoveries, depletions ofnatural resources, changes in technology, linkage effects, and history will allhave an influence on a region’s economic growth potential. Finally, economicbase models have been created which try to explain how a region can base itsexports on a trade of services, not goods (Polese and Verreault, 1989).
Problems facing export base theoryExport base theoretically explains the source of economic growth byidentifying a multiplier effect on basic employment as the cause of all thegrowth in total employment. However, making predictions of growth based oneconomic base analysis can be problematic. The most significant problem inapplication that an export base model faces is accurately distinguishingindustries as basic or non-basic. Typically, a “location quotient” is used todistinguish between basic and non-basic industries (North, 1955; Hildebrandand Mace, 1950).
Location quotients examine an industry’s local employment, relative to theregion’s total employment and compares that proportion to the labor forceemployed by the industry at the national level as illustrated in Equation 1.
LQ ! "ei=eT#="USi=UST# "1#
where:
LQ ! location quotient
ei ! local industry i’s employment
eT ! total local employment
USi ! national industry i’s employment
UST ! total national employment
A priori a location of 1.00 means no greater relative specialization in the subjecteconomy than in the benchmark economy, for the particular industry. In eachindustry, values significantly below 1.00 indicate much greater relativespecialization in the benchmark economy; or if well over 1.00 much greaterrelative specialization in the subject economy (Hildebrand andMace, 1950, p. 243).
Those industries which have a larger relative concentration in a particularindustry are said to be basic industries that are “exporting” products (andtherefore the jobs of those workers who produce them) out of the region whilethose industries with a smaller relative specialization (than the benchmarkeconomy) are said to be “importing” jobs into the region by producing only forlocal consumption. A location quotient value equal to 1 means that the local
Brave new world
31

industry is as concentrated locally as it is nationally; in other words, thecommunity is self-sufficient, as far as that industry is concerned.
To test the location quotient’s applicability in determining the differencebetween basic and non-basic sectors, Leigh (1970) weighs the effectiveness ofthis method against a more comprehensive survey of the Vancouver, Canadametropolitan area completed earlier using the Canadian Census of Industry.Leigh (1970) bases his study on the assumption that location quotient’s sizeshould be proportional to the ratio of external market to home market sales, theprocess that economic base analysis intends to capture. After comparing thoseindustries identified as basic by the location quotient method against thoseproven to be basic by the survey, Leigh (1970) concludes that the locationquotient method does not allow for a clear classification into basic/non-basicindustry sectors, with the weakest correlation in the middle to lower ranges ofthe distribution. Leigh (1970) notes that his findings confirm the suspicions ofother researchers that the location quotient method provides an incomplete andpossibly misleading classification for economic base analysis[1].
Isserman (1980) summarizes the discussion of alternative methodsdistinguishing between basic and non-basic sectors and evaluates variousmethods for estimating export activity. He examines four methods ofestimating export activity to see if all four generate similar estimates. Isserman(1980) examines the location quotient approach, the minimum requirementsapproach, the assumption approach, and the Mathur and Rosen (1974)econometric approach[2]. After pointing out the theoretical flaws of all fourapproaches, he concludes that the choice of estimation method does matter –the location quotient approach consistently underestimates the level of aregion’s exports while the Mathur and Rosen (1974) approach consistentlyoverestimates regional exports. In addition, the minimum requirementsapproach yields estimates that are below the LQmethod a significant portion ofthe time. Isserman (1980) concludes that there is no consistent method ofdistinguishing between basic and non-basic industries.
Furthermore, results from the present study suggest that properclassification into basic and non-basic remains elusive for an additionalreason. Location quotients rely on Standard Industrial Classification (SIC)codes or the more recent North American Industrial Classification System(NAICS) codes, which are not a reliable marker for basic versus non-basicindustries. These codes are largely an administrative creation, and there is noautomatic mechanism for updating the codes to capture the innovation andshort-product life cycles of firms operating within the new economy.
Because location quotients serve as identifying markers of a region’sindustrial composition, inaccuracies in NAICS (or SIC) code classification usedin the location quotient method flow directly into the economic baseemployment multiplier as defined in Equation 1:
PM22,1
32

Multiplier ! T=B where
T ! total community employment
B ! community basicemployment
"2#
The multiplier is important because economic base theory predicts that allnon-basic employment is dependent entirely on basic employment for itsgrowth (or decline). This correlation can be shown with Equation 3:
DT ! Multiplier $ DB ! "T=B# $ DB where
T ! total community employment
B ! community basic employment
"3#
Equation 3 reveals that all growth in a community’s total employment isentirely dependent on the growth of basic employment, shown by the economicbasic employment multiplier.
Application of the employment multiplier to the new economy firms isdifficult. Since these new economy firms are not adequately captured by NAICScodes, the basic employment multiplier derived from a location quotient that iscompiled from inaccurate NAICS codes cannot be accurate.
Variations on economic base analysisDue to these shortfalls, variations of economic base analysis have emerged. Forexample, Shaffer (1983) notes that different types of manufacturing will havedifferent impacts on a community. In his model, Shaffer (1983) attempts toisolate the effects of various community factors such as geographic location,population size, and the type of manufacturing in the community by dividingbasic sector employment into three main categories: manufacturing,agriculture, and other basic industries. If the manufacturing sector requireslocally supplied inputs for its production, then Shaffer (1983) argues the localcommunity will benefit more from the firm’s presence. Differences incapital-output ratios and labor-output ratios will result in different effects onthe employment for a community from the basic manufacturing sector. Giventhe declining importance of agriculture, Shaffer assumes that agriculturalemployment always declines and that the change in the third basic sector wasgenerally positive. Given these assumptions, Shaffer (1983) concludes that incounties experiencing an increase in basic manufacturing employment, theemployment multipliers were statistically significant. Additionally, the largestmultipliers are from the manufacturing sector with the third basic sector alsocontributing significantly to increased employment levels. However, he notesthat in counties with decreasing manufacturing employment, the results wereless consistent with theoretical expectations. Shaffer (1983) gives three possibleexplanations:
Brave new world
33

(1) a substitution of non-manufacturing export base employment for thedeclining manufacturing sector;
(2) the counties experienced a shift in the composition of the manufacturingsector;
(3) long term growth in real income led to an increase in demand for“non-basic” services despite the decline in the basic sector.
The present study extends Shaffer’s analysis by isolating the new economyfirms from the traditional manufacturing sector. The composition of themanufacturing sector in many communities has changed and is now dominatedby new economy firms. New economy firms are often perceived as moreattractive than the traditional manufacturing firms because they typically payabove average salaries. They are also characterized by spin-offs andoutsourcing which should result in higher than average economic basemultipliers. However, as recent trends have shown, these firms could also beless stable than the more traditional manufacturing base.
The present studyTo understand better the employment base and the impact of computer andinformation technology firms, 14 of the largest employers of Larimer County,Colorado, were surveyed to ascertain their perspectives on a variety of issuesincluding the impact of technological innovation on technological innovation’simpact on the firms’ business decisions and the need for outsourcing.Additionally, firms were queried about their salary profiles, expected futuregrowth, and spin-off activity. The presence of innovative, new economycompanies in Larimer County, Colorado, makes it an appropriate test case sinceit is a combination of traditional manufacturing firms and computermanufacturing firms that operate within the new economy. In recent years,these new economy firms have emerged as a primary force behind theeconomic employment base for Larimer County.
The firms surveyed were among the largest employers in the county. Firmswere chosen based on number of employees, rather than volume of sales oroutput, since employment numbers are typically used as a proxy for the incomegenerated by basic employers (Tiebout, 1962) in most economic base models.There were 44 firms employing more than 200 employees. “Firms” listed suchas community hospitals, local schools and governments, temporaryemployment agencies, car dealerships, or newspapers were classified asnon-basic by nature and were not surveyed. Therefore, 19 firms remained aspotential basic employers. This study includes data from 14 firms, indicating aresponse rate of 74 percent.
The empirical data used for this study was obtained by a comprehensivesurvey that was comprised of in-person interviews conducted over the springand summer of 2001[3]. The interviews were used to insure accuracy in survey
PM22,1
34

respondents’ answers by minimizing any potential misunderstanding ormisreading of the survey questions.
Study resultsThis study identifies the differences between new economy manufacturing firmsfrom traditional manufacturing firms on the economic basic employment forLarimer County. All the responding firms that were identified as potential neweconomy firms reported a three-digit NAICS code of 334, "Computer andelectronic product manufacturing”, since the new economy firms in LarimerCounty specialize in manufacturing activity. All other responding firms reportedvarying three-digit NAICS codes and were classified as traditional basicmanufacturers. Therefore, the study results are separated into new economyfirms and traditional manufacturing firms by using NAICS codes. Given thesmall number of firms surveyed in the new economy, statistical inferences orgeneralizations cannot be made. However, the survey results reveal manyinteresting differences between the new economy and traditional firms.
The mean employment size for the two types of basic employers differeddramatically based on the type of firm as shown in Table I. New economyfirms, on average, were over twice as large as traditional manufacturing firms.
In relative scale, Larimer County has a labor force of 90,677 and ColoradoState University is its largest employer with 5,419 employees (Bureau of theCensus’ County Business Patterns Report, 1999). Of the total number of basicand non-basic employees in Larimer County, the firms surveyed employ 17,954people or 20 percent of the total Larimer County workforce.
As indicated in previous research, it is very difficult to use NAICS codes andlocation quotients to classify basic and nonbasic employment. Results inTable II illustrate that although the firms chosen for the study were basicindustries within the local economy, when compared to the basic/non-basiccategorization as predicted by the location quotient method, over half of thetraditional manufacturing firms would not have been classified as basicemployers.
To verify that the firms surveyed were basic employers, the survey includedquestions that identified backward input-supply linkages within the LarimerCounty economy as well as isolating the percentage of output sold to LarimerCounty consumers (forward linkages). Results also indicated that theresponding firms are basic employers as shown by the percent of their
New economyn ! 4 firms
Traditional basicn ! 10 firms
Total firmsn ! 14 firms
Mean number of employees 2,146 937 1,282Minimum 880 150 150Maximum 3,400 5,419 5,419
Table I.Mean employment of
respondents
Brave new world
35

output that is exported outside Larimer County. All respondents sold less than1 percent of their total output directly to Larimer County consumers, therefore,exporting the majority of their products outside the county.
Technological innovationTechnological innovation was believed to make business-planning decisionsdifficult. The short product lifecycle (for some new economy firms, productlifecycles have fallen to as little as six months) and changing consumer demandfaced by new economy firms encourages quick development of new products,which is a difficult activity to capture through traditional data collection andreporting methods. A change in consumer demand may also place strain ondemand for employees and real estate, which manifests itself in outsourcingand temporary structures for a variety of purposes.
The role of technological innovation on a firm’s business decision has beensomewhat varied for both firm types. As illustrated in Table III, new economyfirms agree that technological innovation has shortened product lifecycles andgreatly increased a firms’ use/need for employee outsourcing. Interestingly,these new economy firms do not feel strongly that technological innovationmakes business decisions or planning for future real estate needs more difficult.As for technological innovation’s role in the case of change, the respondentswere split in their opinion. Traditional basic employers, on the other hand, didnot believe that technological innovation makes hiring decisions more difficult,greatly increases firms’ use/need for employee outsourcing, or makes planningfor future real estate needs more difficult. However, these firms were morelikely to agree that technological innovation made it easier to plan for change.
OutsourcingFurther tracing the impact of technological innovation, the firms were surveyedregarding their use of outsourced employees in the following areas:
NAICS code LQ Survey resultConsistentmatch?
Basic firmtype
Number offirms fromsample
233 1.378 Basic Yes Traditional 1312 5.309 Basic Yes Traditional 1323 0.895 Basic No Traditional 1325 0.163 Basic No Traditional 1334 4.143 Basic Yes New economy 4335 0.539 Basic No Traditional 3511 1.502 Basic Yes Traditional 2611 3.093 Basic Yes Traditional 1
Notes: Employment data by three-digit NAICS code provided by 1999 County BusinessPatterns for Larimer County, CO as compiled by the US Bureau of the Census; All respondentsindicated that the majority of their output was sold to consumers outside Larimer County, CO
Table II.Location quotientresults for industries insample compared tosurvey result (by threedigit NAICS code)
PM22,1
36

. security;
. manufacturing;
. housekeeping;
. food services;
. groundskeeping;
. electrician/plumbing;
. construction;
. marketing;
. subcontracting; and
. other.
As detailed in Table IV, only in the manufacturing category did the traditionalfirms’ mean number of outsourced employment approach parity with the neweconomy firms (35.5 and 37.5, respectively). In all of the other outsourcingcategories, the mean outsourced employment by the new economy firms wasgreater than the outsourced employment by traditional manufacturing firms.The largest category of outsourcing for the new economy firms was insubcontracting, with an average of 233 subcontracted employees in the neweconomy firms. In contrast, the traditional manufacturing firms outsourced anaverage of 30.6 subcontracted employees. As a percent of the meanemployment (columns 3 and 5), this represents over 10 percent of an average
New economy Traditional basicTechnologicalinnovation has. . .
Agree(%)
Neutral(%)
Disagree(%)
Meanscore
Agree(%)
Neutral(%)
Disagree(%)
Meanscore
Made it easy to plan forchange 50 0 50 2.75 70 10 20 3.60
Made hiring moredifficult 25 25 50 3.00 30 10 60 2.50
Shortened our productlifecycle 50 25 25 3.75 30 20 50 2.90
Made real estateplanning moredifficult 25 0 75 2.50 10 20 70 2.30
Increased our need foroutsourcing 50 25 25 3.50 20 10 70 2.60
Notes:A Likert Scale was used to measure respondents’ perceptions of technological innovationwith 1=strongly disagree and 5=strongly agree. Four of the five response categories werecollapsed into two categories: those respondents answering Agree or Strongly agree werecondensed together into “Agree” and those respondents answering Disagree or Strongly disagreewere condensed together into “Disagree”; To calculate the mean Likert responses, surveyrespondents’ answers were disaggregated back into their original values (1-5)
Table III.Respondents’ perception
of technologicalinnovation’s impact on
business decisions
Brave new world
37

new economy firm’s employment versus only 3 percent of the meanemployment for a traditional manufacturing firm. When considering that neweconomy firms employ an average of 2,146 employees, the total employmentgenerated by these firms (both directly and indirectly through outsourcing)rises to an average of 2,658 an increase close to 25 percent, compared to 1,049 or10 percent for the traditional manufacturing firms.
The new economy firms have very clear motivations behind theiroutsourcing. All the respondents agreed with the statement that “Weoutsource labor due to external economic fluctuations” and only one firmdisagreed with the statement that “We outsource labor due to a changingmarket demand for our product.” As might be expected with such strongresponses, all new economy firms surveyed also agreed, “We outsource labor tohandle our demand for a variable number of employees.”
These results provide evidence that the traditional economic base modelmight misestimate the impact of new economy employment. Firms in the neweconomy employ out-sourcing as a means of responding to fluctuating productdemand and changing economic environments. By outsourcing non-corecompetency areas, these firms help to stimulate further employment within aregion through the creation of companies that provide the outsourced labor.These new companies are not included in the original firms’ NAICS code oremployee-reporting; therefore, this additional generated employment would notbe captured within the traditional economic base model that utilizes the basicmultiplier derived from employment figures based on NAICS codes.
New economy firms Traditional basic firms
Mean numberof outsourcedemployment
Meanoutsourced
employment aspercentage of
meanemployment by
firmn ! 2146
Mean numberof outsourcedemployment
Meanoutsourced
employment aspercentage of
meanemployment by
firmn ! 937
Security 31 1.44 8 0.85Manufacturing 37.5 1.75 35.5 3.79Housekeeping 31.7 1.48 21.6 2.31Food services 32 1.49 6 0.64Groundskeeping 6.5 0.30 1.8 0.19Electrician/plumbing 20.6 0.96 3 0.32Consulting/training 18.8 0.88 1.4 0.15Marketing 0 0.00 0.25 0.03Subcontracting 233 10.9 30.6 3.27Other 100.6 4.69 4.1 0.44Total mean outsourcedemployment 511.7 23.84 112.25 11.98
Table IV.Mean outsourcedemployment as apercentage of total meanfirm employment byfirm type
PM22,1
38

By contrast, the traditional basic employers’ motivations for outsourcedemployees were less certain. As illustrated in Table V, the respondents’answers to almost all the questions were bipolar. If evaluated by a simplemajority (over 50 percent), the respondents’ answers were negative for all theoutsourcing statements. Interestingly, when the question probing outsourcingin response to variable consumer demand was phrased differently, “Weoutsource labor to handle our demand for a variable number of employees”, theresulting answer from traditional basic employers was still bipolar, but thesimple majority affirmed the statement, in contrast to the earlier answer, whichhad a negative bipolar distribution.
Salary profilesAs Tiebout (1962) indicates, employment is typically used as a proxy for theincome generated by the exporting firms since employment numbers are moreavailable than income. An attempt was made to ascertain the income variablegenerated by each company surveyed by examining the salary profiles of theiremployees.
The salary profiles by type of basic employment differ substantially betweenthe two firm types. The majority of employees who fall into the higher salarycategories are predominantly employed by the new economy firms. As illustratedin Table VI, approximately three-quarters of the employees in the $75-99,000category are employed in new economy firms and that number grows to almost
New economy Traditional basic
We outsource labor. . .Agree(%)
Neutral(%)
Disagree(%)
Meanscore
Agree(%)
Neutral(%)
Disagree(%)
Meanscore
To decrease labor costs 25 50 25 3.00 40 0 60 2.70Due to external economicfluctuations 100 0 0 4.50 30 10 60 2.60
Due to changing marketdemand 75 0 25 4.00 40 0 60 2.80
To handle changes inproduct lifecycle 25 50 25 2.75 20 0 80 2.20
Because employees lackexpertise 25 0 75 2.50 40 0 60 2.50
To handle demand forvariable numbers ofemployees 100 0 0 4.75 60 0 40 3.30
Notes: A Likert scale was used to measure respondents’ perceptions of technological innovationwith 1=Strongly disagree and 5=Strongly agree. Four of the five response categories werecollapsed into two categories: those respondents answering Agree or Strongly agree werecondensed together into “Agree” and those respondents answering Disagree or Strongly disagreewere condensed together into “Disagree.”; To calculate the mean Likert responses, surveyrespondents’ answers were disaggregated back into their original values (1-5)
Table V.Isolating motivations
for utilizing outsourcedlabor
Brave new world
39
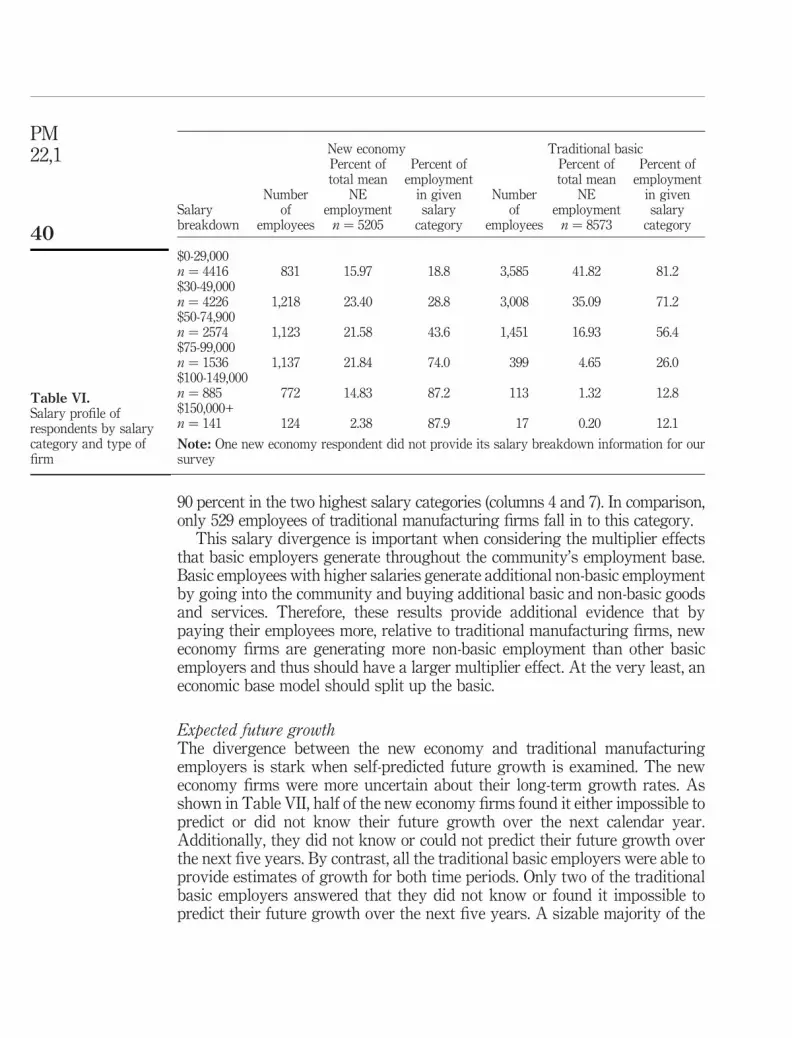
90 percent in the two highest salary categories (columns 4 and 7). In comparison,only 529 employees of traditional manufacturing firms fall in to this category.
This salary divergence is important when considering the multiplier effectsthat basic employers generate throughout the community’s employment base.Basic employees with higher salaries generate additional non-basic employmentby going into the community and buying additional basic and non-basic goodsand services. Therefore, these results provide additional evidence that bypaying their employees more, relative to traditional manufacturing firms, neweconomy firms are generating more non-basic employment than other basicemployers and thus should have a larger multiplier effect. At the very least, aneconomic base model should split up the basic.
Expected future growthThe divergence between the new economy and traditional manufacturingemployers is stark when self-predicted future growth is examined. The neweconomy firms were more uncertain about their long-term growth rates. Asshown in Table VII, half of the new economy firms found it either impossible topredict or did not know their future growth over the next calendar year.Additionally, they did not know or could not predict their future growth overthe next five years. By contrast, all the traditional basic employers were able toprovide estimates of growth for both time periods. Only two of the traditionalbasic employers answered that they did not know or found it impossible topredict their future growth over the next five years. A sizable majority of the
New economy Traditional basic
Salarybreakdown
Numberof
employees
Percent oftotal mean
NEemploymentn ! 5205
Percent ofemploymentin givensalarycategory
Numberof
employees
Percent oftotal mean
NEemploymentn ! 8573
Percent ofemploymentin givensalarycategory
$0-29,000n ! 4416 831 15.97 18.8 3,585 41.82 81.2$30-49,000n ! 4226 1,218 23.40 28.8 3,008 35.09 71.2$50-74,900n ! 2574 1,123 21.58 43.6 1,451 16.93 56.4$75-99,000n ! 1536 1,137 21.84 74.0 399 4.65 26.0$100-149,000n ! 885 772 14.83 87.2 113 1.32 12.8$150,000+n ! 141 124 2.38 87.9 17 0.20 12.1
Note: One new economy respondent did not provide its salary breakdown information for oursurvey
Table VI.Salary profile ofrespondents by salarycategory and type offirm
PM22,1
40

traditional basic employers, eight out of ten, predicted growth rates of 4 percentor less over the next calendar year, but growth rates are predicted to increase asthe forecasting period is lengthened to five years.
In light of an economic decline by the fall of 2001, survey respondents werequeried a second time with respect to growth predictions to insure their originalresponses were still accurate. Given the numerous local layoff announcements,significant changes were anticipated, but it is interesting to note that not one ofthe survey respondents changed their growth predictions for either time period.
Spin-off formationAnecdotal evidence would seem to suggest that new economy firms wouldexperience a higher rate of spin-off activity than traditional manufacturing firmsdue to technological innovation’s influence on its product lifecycle. Only foursurvey respondents acknowledged spin-off activity from their Larimer Countyoperations, with the numbers split evenly between the new economy andtraditional manufacturing firms. However, when examined in relation to the totalnumber of respondents in both categories, 50 percent of the new economy firmsreported spin-off activity, while only 20 percent of the traditional basic employersreported spin-off activity. Furthermore, one new economy firm listed as many as26 spin-off companies formed by or with Larimer County employees.
ConclusionsThis study’s results indicate that traditional economic base analysis is noteasily applied to the firms of the new economy – a growing proportion of thebasic sector for many communities. There are fundamental flaws in theapplication of traditional economic base analysis in the twenty-first century.This research maintains that a more inclusive and comprehensive surveymethod remains the best way to adequately capture the essential makeup of aregion’s economic base.
New economy firms are greatly impacted by technological innovation andutilize outsourced employment to a much greater degree than traditional
New economyn ! 4
Traditional basicn ! 10
Self-predicted expected growth rateNext year
(%)Next five years
(%)Next year
(%)Next five years
(%)
0 percent growth 25 0 30 01-4 percent growth 25 0 50 405-10 percent growth 0 25 10 20Over 10 percent growth 0 25 10 20Don’t know 25 0 0 10Impossible to predict 25 50 0 10Total 100 100 100 100
Table VII.Growth pattern
predictions
Brave new world
41

manufacturing firms. Also, new economy firms have salary profiles that areskewed toward higher levels, providing additional income to be spent in thelocal economy. Finally, new economy firms are more likely to have spin-offactivity than traditional manufacturing firms, thus generating even morepotential basic employment for a community.
These conclusions have serious consequences for the future accuracy ofeconomic base analysis as the new economy industries grow in importance.Because they are buffeted by technological innovation, new economy firms findit difficult to predict their future growth, resulting in more uncertainenvironment. In comparison, traditional manufacturing firms readily offerexpected future growth rates, providing more stable estimates of growth for acommunity.
As with most of the empirical research in economic base analysis, thisresearch was limited to a specific geographical location as only a sample ofLarimer County’s basic employers were surveyed. There were additional neweconomy firms operating in Larimer County who did not respond to the survey.Also, the firms surveyed were limited by employment numbers; there are basicemployers in Larimer County who produce for export but employ less than 200people. Due to difficulties in scheduling personal interviews, the survey wasconducted over a number of months, and economic conditions changed overthat time period. Finally, follow-up questions concerning growth rates wereasked and respondents reported no change in their earlier growth estimates[4].
Extensions of this research include actual calculations of the differentemployment multipliers between new economy and traditional manufacturingfirms. This step would allow economic development officers and city plannersto create a more targeted development strategy for their communities and havea better understanding of the impact a new economy firm might have ascompared to the more traditional manufacturing firm. In addition, extendingsome of the earlier research that links research universities and new economyfirms could also be conducted in Larimer County. This research study wasunable to pinpoint a link between Colorado State University and new economyfirms in Larimer County. All of the firms surveyed employed CSU graduates.However, employers did not keep specific records about these graduates, whichwould have enhanced the understanding of the university linkages. Directlysurveying the employees would also provide important data, which wouldaugment the results of this study by directly tracing basic and non-basicconsumption by both types of basic employees to their income.
This research has highlighted many advantages to having new economyfirms within a community and points out that the higher employmentmultipliers may also be accompanied by greater employment volatility. InLarimer County alone in 2001, new economy firms were reported to havelaid-off over 1,000 employees while traditional manufacturing firms havelaid-off 75 employees[5]. As shown by the responses to the Likert questions,
PM22,1
42

these new industries are more responsive to changes in overall economicconditions than traditional manufacturing firms. Communities must evaluatethe costs of higher volatility and less predictability associated with the neweconomy when evaluating the benefits of higher growth and jobs with highersalaries. For many communities, the future of their economic developmentdepends on this relative importance of growth versus volatility as they plantheir path to prosperity.
Notes
1. Please see Greytak (1969) for additional discussion of the drawbacks of location quotienttheory, including uniform consumption patterns, national self-sufficiency, and industrygrouping. Additionally, O’Sullivan (1996) provides an additional review of problems facinglocation quotient theory.
2. The minimum requirements approach (credited to Ullman and Dacey, 1960) uses theindustry employment for the smallest community being studied as minimum amountnecessary for self-sufficiency in a particular industry. For a detailed discussion of thesealternative measures for distinguishing between basic and non-basic employment, please seeMathur and Rosen (1974), Isserman (1975) and Mathur and Rosen (1975) for an econometrictreatment of distinguishing basic from non-basic.
3. Please contact the authors for a copy of the survey used.
4. Other issues in the survey, such as the number of employees used for outsourcing, weresubject to change as well but were not included in the follow-up survey.
5. These numbers were calculated from newspaper articles from the Fort Collins Coloradoan,the Denver Post, and the Denver Rocky Mountain News from the spring of 2001 through thefall of 2001. It should be noted that a major new economy employer that had laid-offs duringthis time period was not forthcoming with numbers specifically for our study area.Therefore, this lay-off estimate is actually larger than the reported 1,000 employees.
References
Gavin, R. (2001), “Getting a lift: the Rockies emerge as pocket of prosperity in a slowingeconomy”, Wall Street Journal, 6 June.
Greytak, D. (1969), “A statistical analysis of regional export estimating techniques”, Journal ofRegional Science, Vol. 9, pp. 387-97.
Hildebrand, G. and Mace, A. (1950), “The employment multiplier in an expanding industrialmarket: Los Angeles County, 1940-1947”, Review of Economics and Statistics, Vol. 32,pp. 241-9.
Hoyt, H. (1961), “A method for measuring the value of imports into an urban community”, LandEconomics, Vol. 37, pp. 150-61.
Isserman, A. (1975), “Regional employment multiplier: a new approach: comment”, LandEconomics, Vol. 51, pp. 290-3.
Isserman, A. (1980), “Estimating export activity in a regional economy: a theoretical andempirical analysis of alternative methods”, International Regional Science Review, Vol. 5,pp. 155-84.
Leigh, R. (1970), “The use of location quotients in urban economic base studies”, LandEconomics, Vol. 46, pp. 202-5.
Brave new world
43

Mathur, V. and Rosen, H. (1974), “Regional employment multipliers: a new approach”, LandEconomics, Vol. 50, pp. 93-6.
Mathur, V. and Rosen, H. (1975), “Regional employment multiplier: a new approach: reply”, LandEconomics, Vol. 51, pp. 294-5.
North, D. (1955), “Location theory and regional economic growth”, Journal of Political Economy,June, pp. 243-58.
O’Sullivan, A. (1996), Urban Economics, 3e, McGraw-Hill, Boston, MA, pp. 138-41.
Polese, M. and Verreault, R. (1989), “Trade in information-intensive services: how and whyregions develop export advantages”, Canadian Public Policy, Vol. 15, pp. 376-86.
Shaffer, R. (1983), “A test of the differences in export base multipliers in expanding andcontracting economies”, Regional Science Perspectives, Vol. 13, pp. 61-74.
Stabler, J.C. (1968), “Exports and evolution: the process of regional change”, Land Economics,Vol. 44, pp. 10-23.
Thomas, M. (1964), “The export base and development stages theories of regional economicgrowth: an appraisal”, Land Economics, Vol. 40, pp. 421-32.
Tiebout, C. (1962), The Community Economic Base Study, Committee for Economic Development,New York, NY.
Ullman, E.L. (1960), “The minimum requirements approach to the urban economic base” (withDacey, M.F. ), Papers and proceedings, Regional Science Association 6, pp. 175-94.
PM22,1
44


