Embed Size (px)
Citation preview
1
Bread, durum and sinthetic hexaploid wheats in saline and non-saline soils.
Acevedo, E. a*, Silva, P.a, Fraga, H.b , Pargas, R. b and Mujeeb- Kazi, A.c
a Laboratorio de Relación Suelo-Agua-Planta. Facultad de Ciencias Agronómicas. Universidad de Chile. Casilla 1004.Santiago, Chile.b Universidad Autonoma de Baja California Sur. Apdo. Postal 19-B. La Paz, B.C.S., México.c CIMMYT, Lisboa 27, Col. Juárez, Apdo. Postal 6-641, 06600, México, D.F., México.
Abstract
The genetic improvement of resistance to salinity is becoming increasingly important as
marginal soils are incorporated to agriculture. The work reported in this paper evaluated the intra and
inter-specific variability in yield responses to soil salinity of four Triticum groups: synthetic
hexaploid wheat (T.turgidum x Aegilops tauschii), bread wheat (T. aestivum L.), durum wheat (T.
turgidum L.) and bread wheat from a salinity resistance reference group. The yield potencial of these
genotypes was measured and the salinity resistance per se was calculated. The wheat material was
gown in five environments (2 locations and 3 years) variably affected by soil salinity. The mean grain
yield of the nursery ranged from 1,821 to 5,876 Kg ha-1. The bread, durum and the salinity reference
set groups of genotypes had significantly higher yield. The genotypes of the synthetic hexaploid group
were late flowering, had high stature, low number of grains per ear and low harvest index, which
resulted high yield stability but low grain yield. The best adapted genetic material was found in the
bread wheat and the reference set groups.The salinity reference set had the highest grain and biomass
yield in the lowest yielding environment. The synthetic and bread wheats groups did not have
variability in biomass in this environment while the variability for both, biomass and grain yield was
nil in the durum wheat group. The soil salinity resistance was analyzed using a resistance index
(Bidinger et al., 1987a; 1987b). The bread wheats, including those in the soil salinity resistance group
had the higher yield potential and soil salinity resistance.
Keywords: soil salinity, hexaploid and tetraploid wheats, synthetic hexaploids, grain yield.
* Corresponding author.Tel.: 56-02-6785816; Fax: 56-02-6785858; e-mail: [email protected]
1. Introduction
2
Soil salinity is an important agricultural problem in many areas, particularly in arid zones
irrigated with low quality water. Winter cereals are affected by excess soil salinity, cell elongation is
reduced leading to a decreased leaf area and ions accumulate in the leaf tissues with consequent toxic
effects. Wheat usually shows early senescence and srivelled grains resulting from toxic salt effects
(Wyn Jones and Gorham, 1991), there also abortion of distal spikelets leading to reduced grain yield
(Grieve et al., 1992). The number of spike bearing tillers is also drastically reduced (Maas and Grieve,
1990; Maas et al., 1994).
Grain yield of bread wheat (hexaploid) is reduced to 50% of its potential when the electrical
conductivity of the soil saturation extract (Ece) reaches 13 dS m-1 (Ayers and Westcot, 1985). The soil
salinity threshold at which bread wheat (hexaploid) starts decreasing grain yield is higher (8.6 dS m-1)
than in the tetraploid durum wheat (5.9 dS m-1). Bread wheat has a higher resistance to salinity
(Maas,1986). Furthermore, durum wheat decreases its grain yield at a higher rate than bread wheat
with increasing soil salinity.
Genetic improvement has not been highly successfull in improving grain yield under salinity
stress. One reason may be that the genetic variability for this trait in the genetic pool being used by
breeders is low (Wyn Jones and Gorham, 1991) or it may be that not enough attention is being given to
the salinity resistance per se in wheat improvement programs.
Direct selection for grain yield under stress does not guarante the stress resistance of the
genotypes in as much as the yield under stress depends on the yield potential, phenology and the stress
resistance per se of the genotype (Acevedo et al., 1998).
The stress resistance per se of genotype is seldom evaluated. Usually yield under stress is
reported where yield potential, crop phenology and stress resistance are confounded (Acevedo,
1991). To avoid these confounding effects, Bidinger et al. ( 1987a, 1987b) proposed a stress response
index which allows the estimation of the salinity resistance per se of the genotypes.
Aegilops tauschii (syn. Aegilops squarrosa auct. non L.), diploid, is a wild relative of wheat,
donor of the D genome (Mac-Fadden and Sears, 1946). Ae. tauschii grows wild in Asia (Appels and
Lagudah, 1990) existing a high diversity in natural populations of the species. This diversity has not
been introgressed into modern bread wheat and by so doing it may increase the wheat resistance to
environmental stresses. The genome of Ae. tauschii is homologous to the D genome of modern
hexaploid wheat and genetically normal recombinants are obtained when the species is crossed to bread
3
wheat directly or when its synthetic hexaploid (Triticum turgidum x Ae. tauschii) is utilized (Mujeeb-
Kazi et al., 1996).
Several authors agree that genes located in the D genome confer salinity tolerance to hexaploid
wheat by reducing Na+ accumulation in the leaf tissue (Shah et al., 1987, Gorham et al., 1987) and
increasing discrimination in favor of K+ (Schachtman et al., 1991).
With a different perspective, it has been suggested that selection for high yield potential could
be the best strategy to increase wheat yield under soil salinity stress owing to the heterogeneity of salt
distribution in the soil. Wheat would grow and yield best in the soil zones with lower soil salinity.
Higher grain yield can be obtained in these zones with genotypes having an higher yield potential
(Richards et al., 1987).
In this work we evaluate the intra and inter-specific variability in response to soil salinity of
four Triticum groups: synthetic hexaploids (T. turgidum x Ae. tauschii), bread wheat (T. aestivum L.),
durum wheat (T. turgidum L.) and a spring bread wheat group reputed to have high yield under
salinity stress. We measured the yield potential, the yield under salinity stress and evaluated the salinity
resistance of the genotypes in each group.
2. Materials and methods
2.1. Field experiments
A nursery of forty wheat genotypes, each one classed into one of four groups, was assembled :
nine entries of synthetics hexaploids plus Altar, the durum wheat used in the crosses with Ae. tauschii
conformed the synthetic group; ten entries of bread wheat, ten entries of durum wheat and ten entries
of the salinity reference set conformed the other groups. All the entries were suggested by CIMMYT
wheat breeders for this experiment. The various groups will be referred to as synthetics, bread wheat,
durum wheat and reference set.
The nursery was planted at two locations: a) La Paz, Baja California Sur, Mexico (24°09’N,
110°20’ W, 16 m.a.s.l.), having a loamy sand soil (ECe = 3.5 dS m-1, pH = 8.0) irrigated with a high
salinity water (ECw ≅ 3.0 dS m-1, pH ≅ 7.5) ; and b) Obregon, Sonora, Mexico (27°48’N, 109°92’W,
38 m.a.s.l.) with a clay loam soil (ECe = 0,7 dS m-1, pH = 8.0) and good quality irrigation water (ECe =
4
0,3 dS m-1, pH = 8.3) . The genotypes were planted in five row plots (0.2 m between rows) 3.5 m in
length (3.5 m² plot-1) using an RCB field design with 4 replicates in La Paz and 3 replicates in
Obregon. The three central rows 2.5 m in length (1.5 m²) were harvested for yield and yield
components.
The experiment was repeated in five environments 3 seasons at La Paz (91/92, 92/93 and 93/94)
and two seasons at Obregon (92/93 and 93/94).
The crop husbandry was identical in all environments (site x year combination). The sowing
rate was 120 Kg ha-1 for all genotypes and fertilizers, weed and pest control was according to
CIMMYT practices, described elsewhere (Sayre et al., 1995).
2.2. Field obsevations
The following observations were made : plant height (to the tip of the ear, awns included) ;
emergence date; anthesis (yellow anthers, DC 70, Zadoks et al., 1974) ; physiological maturity, taken
as the moment of complete yelloging of the spike (Hanft and Hych, 1982) ; biomass, grain yield, grain
weight. The harvest index, the number of spikes m-², grains per spike and grain per unit area were
calculated. The Na + and K+ concentration of the flag leaf was measured in samples taken at anthesis at
La Paz in the 92/93 season. The analysis was done in the Soils and Plant Nutrition Laboratory at El
Batan, CIMMYT, Mexico.
2.3. Statistical analyses
The results were analyzed using either a single or combined ANOVA and groups were
compared using contrasts (Scheffe method). Stability analysis were done by regressing genotypic
yields on an environmental index for grain yield. (Finlay and Wilkinson, 1963 ; Eberhart and Russell,
1966).
The stress resistance index (DRI) was calculated as a residual by expressing yield under stress
(Ys) as a function of yield potential (Yp), flowering date (FL) and correcting for experimental error (e)
(Bidinger et al., 1987a ; 1987b), such that,
Ys = a + b Yp + cFL + DRI + e (1)
5
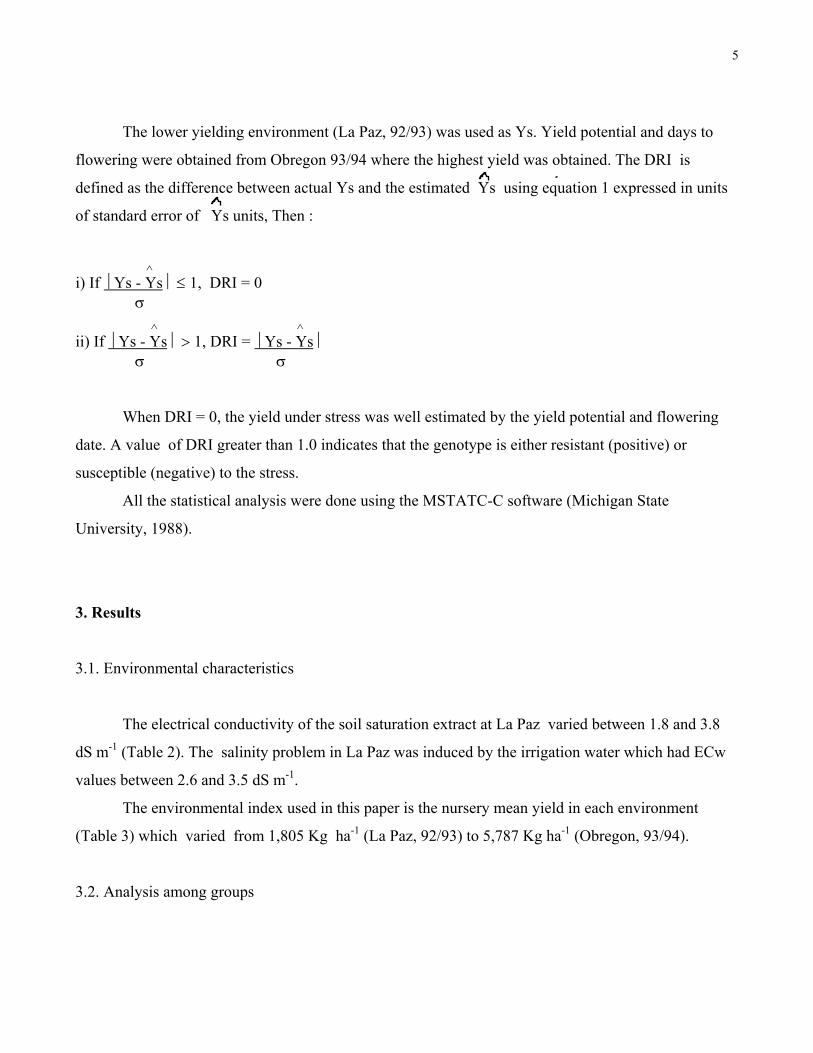
The lower yielding environment (La Paz, 92/93) was used as Ys. Yield potential and days to
flowering were obtained from Obregon 93/94 where the highest yield was obtained. The DRI is
defined as the difference between actual Ys and the estimated Ys using equation 1 expressed in units
of standard error of Ys units, Then :
∧
i) If Ys - Ys ≤ 1, DRI = 0 σ ∧ ∧ii) If Ys - Ys > 1, DRI = Ys - Ys σ σ
When DRI = 0, the yield under stress was well estimated by the yield potential and flowering
date. A value of DRI greater than 1.0 indicates that the genotype is either resistant (positive) or
susceptible (negative) to the stress.
All the statistical analysis were done using the MSTATC-C software (Michigan State
University, 1988).
3. Results
3.1. Environmental characteristics
The electrical conductivity of the soil saturation extract at La Paz varied between 1.8 and 3.8
dS m-1 (Table 2). The salinity problem in La Paz was induced by the irrigation water which had ECw
values between 2.6 and 3.5 dS m-1.
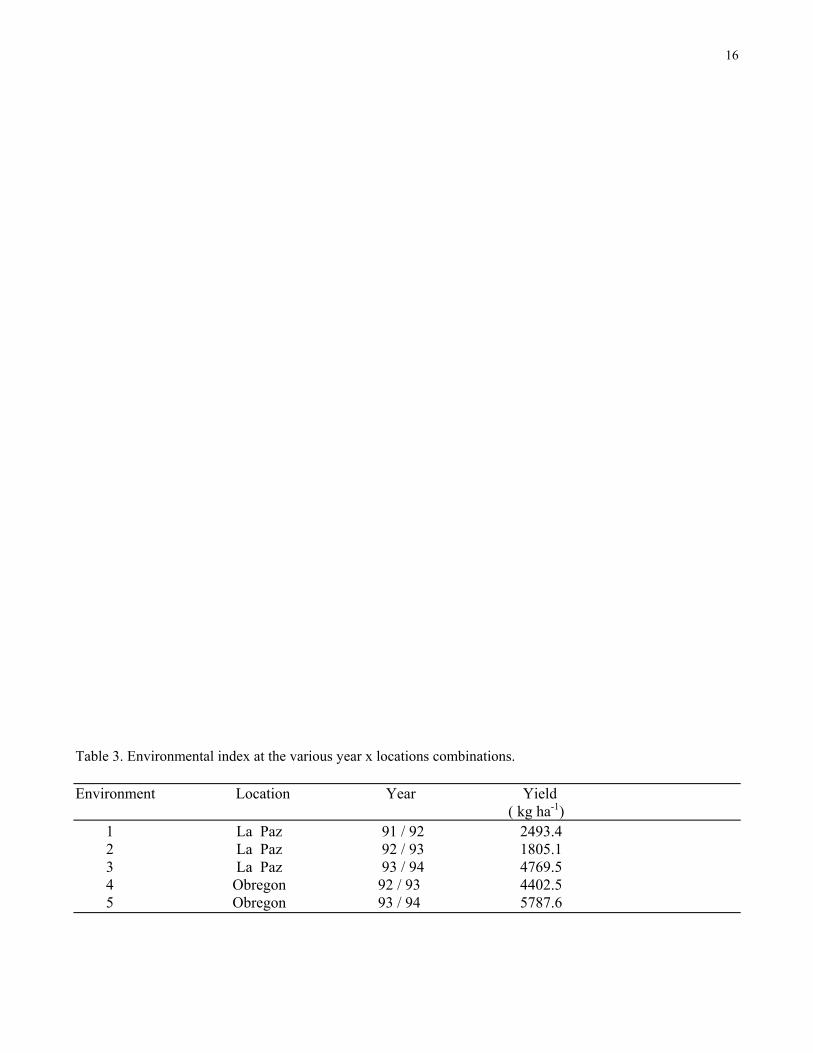
The environmental index used in this paper is the nursery mean yield in each environment
(Table 3) which varied from 1,805 Kg ha-1 (La Paz, 92/93) to 5,787 Kg ha-1 (Obregon, 93/94).
3.2. Analysis among groups
6
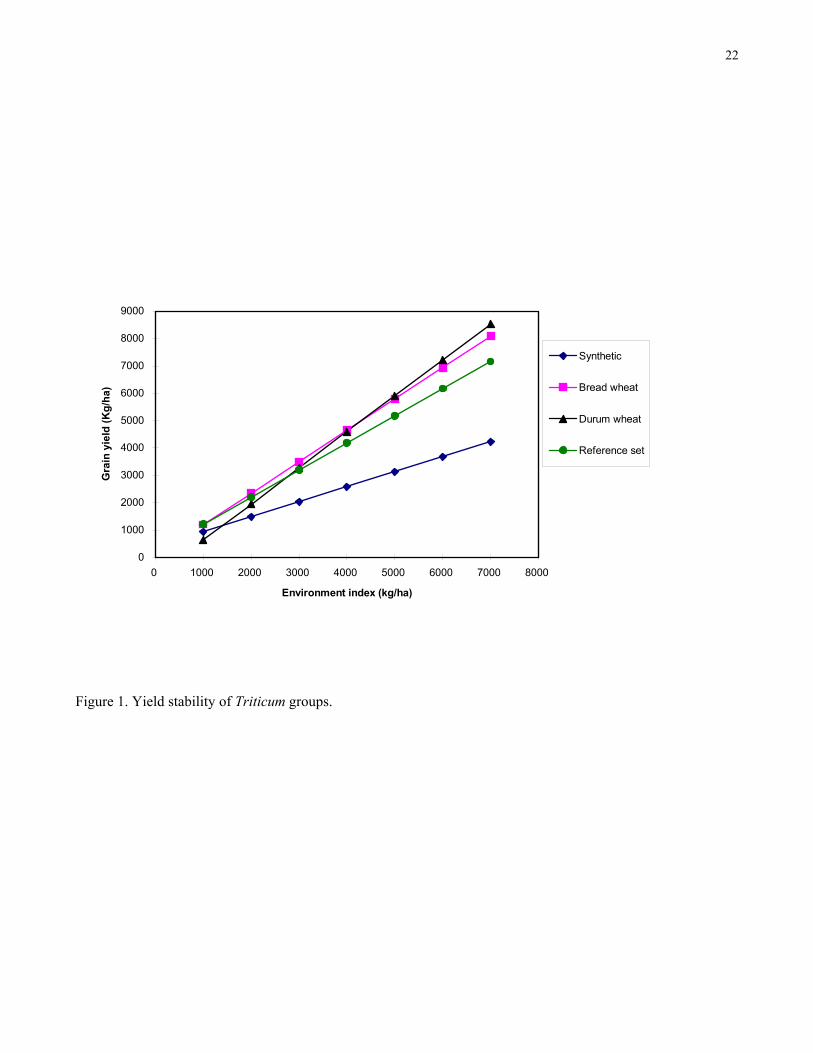
The stability analysis indicated that the synthetics were the lower yielding group across
environments. This group had the highest yield stability and lowest potential yield (Fig. 1) The salinity
reference set of genotypes had the highest yield stability among the improved entries and the durum
wheat group had the lowest yield stability. Durum wheats had the highest yield potential but they
decreased their grain yield faster when the quality of the environment decreased (Fig. 1).
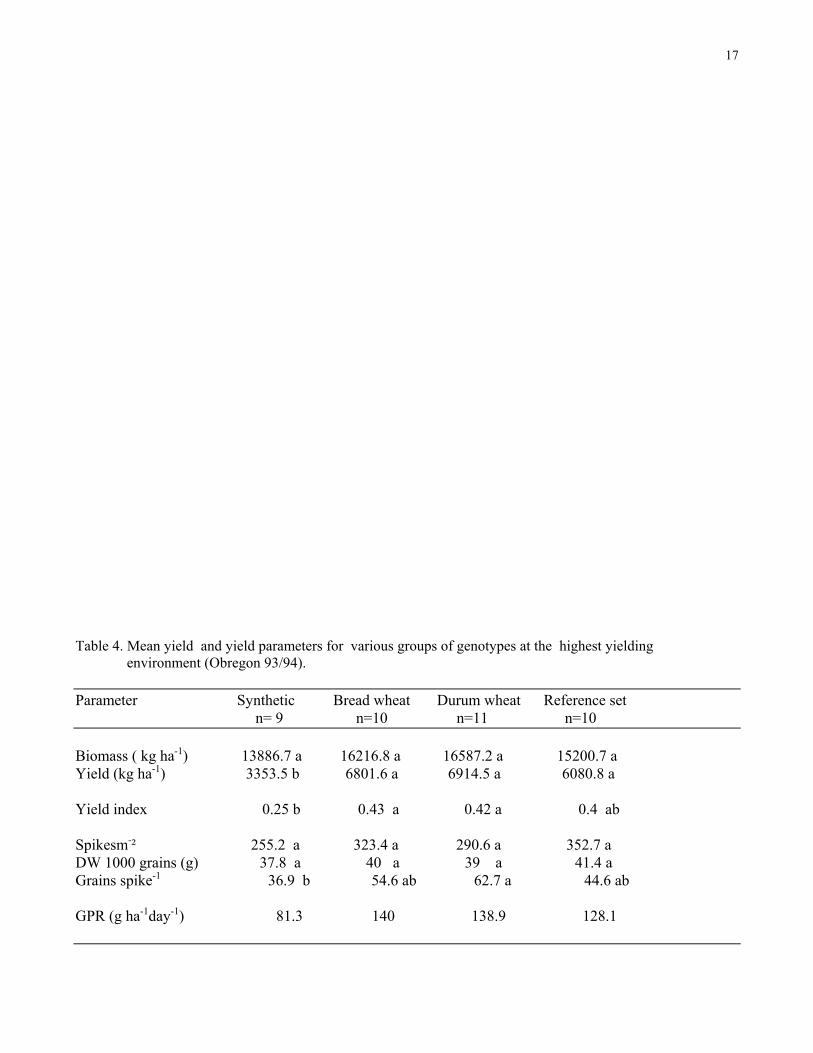
The biomass production was similar among groups in the favorable environment (Table 4). The
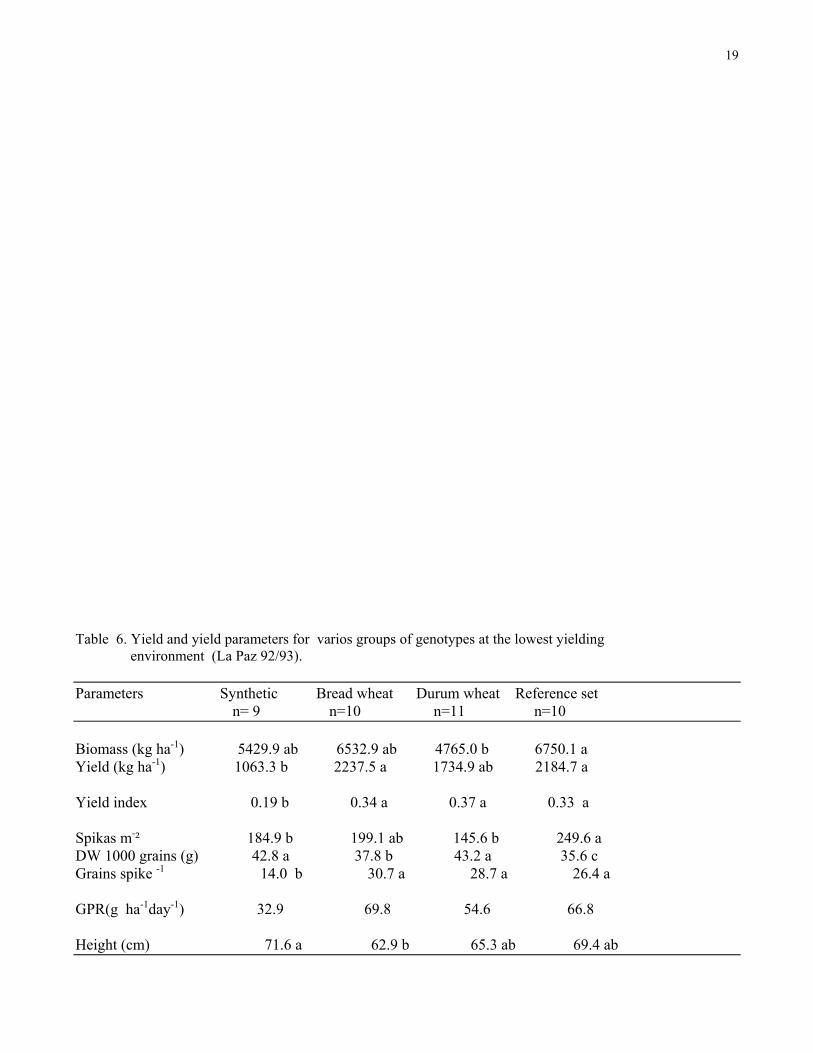
durum wheat group had the lowest biomass production in the stressed environments and the reference
set the highest (Table 6).
3.3. Highest yielding environment
The genetically improved entries (bread wheat, durum wheat and reference set) had the highest
grain yield in the most favourable environment. The three groups had similar grain yield in this
environment as well as similar yield components and harvest index (Table 4). The synthetic group had
the lowest grain yield, being about half when compared to the other groups.
There were no differences in biomass production among groups in this environment.
The within group analysis indicated that in the high yielding environment there was no
variability for biomass or grain yield within durum wheats and within the synthetics.
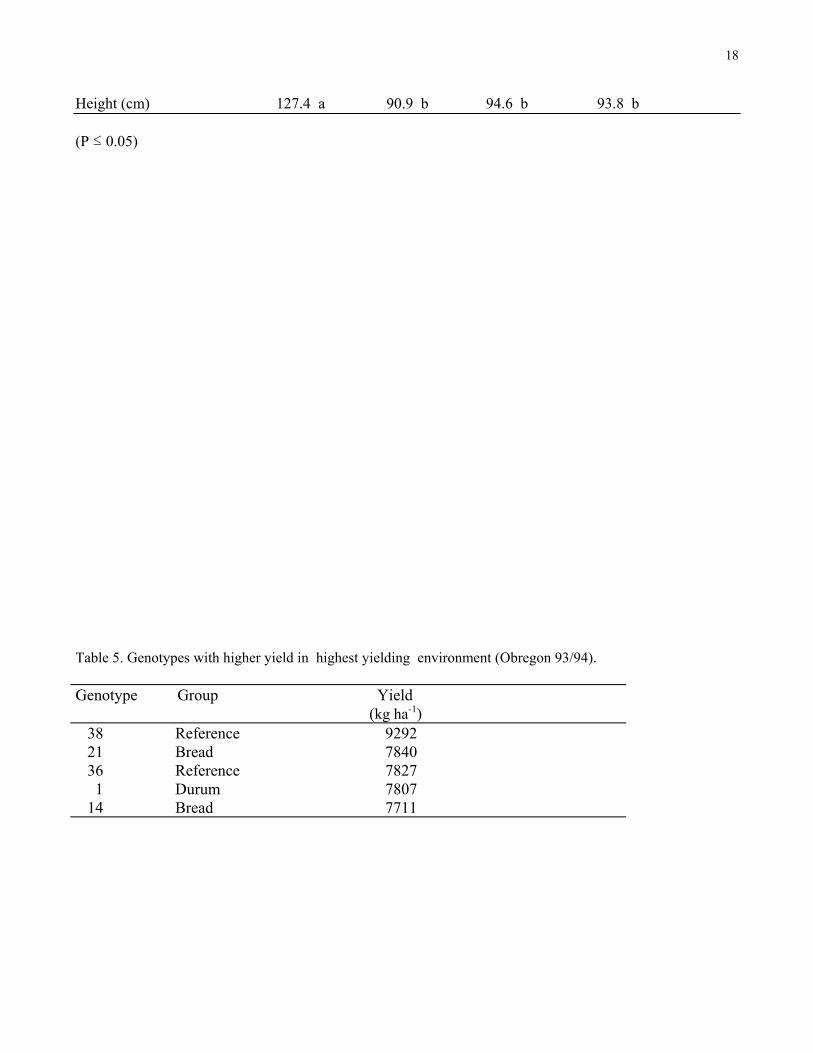
The genotypes with the highest yield in the most favourable environment were 38 (Q19 which
is an Australian wheat with high yield potential), 21 (bread wheat), 36 (Sakha 8, bread wheat from
the reference set), 1 (Altar, durum wheat) and 14 (bread wheat) (Table 5).
3.4. Lowest yielding environment
The synthetic group had the lowest grain yield in the lowest yielding environment. The highest
grain yield in this environment was obtained by the bread wheat and the reference set groups. The
reference set group had the highest biomass yield; the lowest biomass yielding group being the durum
wheat (Table 6). There was no within group variability for biomass nor grain yield in the durum wheat
group under salinity stress. There was within group grain yield variability for all the other three
groups but the salinity reference set was the only one to have within group variability for biomass
under the high stress conditions.
7
The five genotypes attaining the highest grain yield in this lowest yielding environment were:
21 (bread wheat, 2,810 Kg ha-1 ); 36 (Sakha 8, bread wheat from the reference set, 2,613 Kg ha-1 ) , 33
(Kharchia, bread wheat from the reference set, 2,560 Kg ha-1), 15 (Kauz, bread wheat, 2,593 Kg ha-1)
and 37 (Shorawaki, bread wheat, 2,450 Kg ha-1).
3.5. Effect of flowering date on yield under salinity stress
Grain yield was negatively correlated to days to anthesis in the La Paz 92/93 environment (r = -
0,687, P<0,001) when the 40 genotypes of the nursery were considered. There was no correlation of
grain yield with flowering date within the bread wheat and reference set groups which had the highest
yielding genotypes in the highly stressed environment. These entries were mid flowering they flower
either a bit earlier than the mean anthesis date (15, 21, 33) or a bit late (36, 37) when compared to the
40 genotypes of the nursery.
3.6. Resistance to salinity
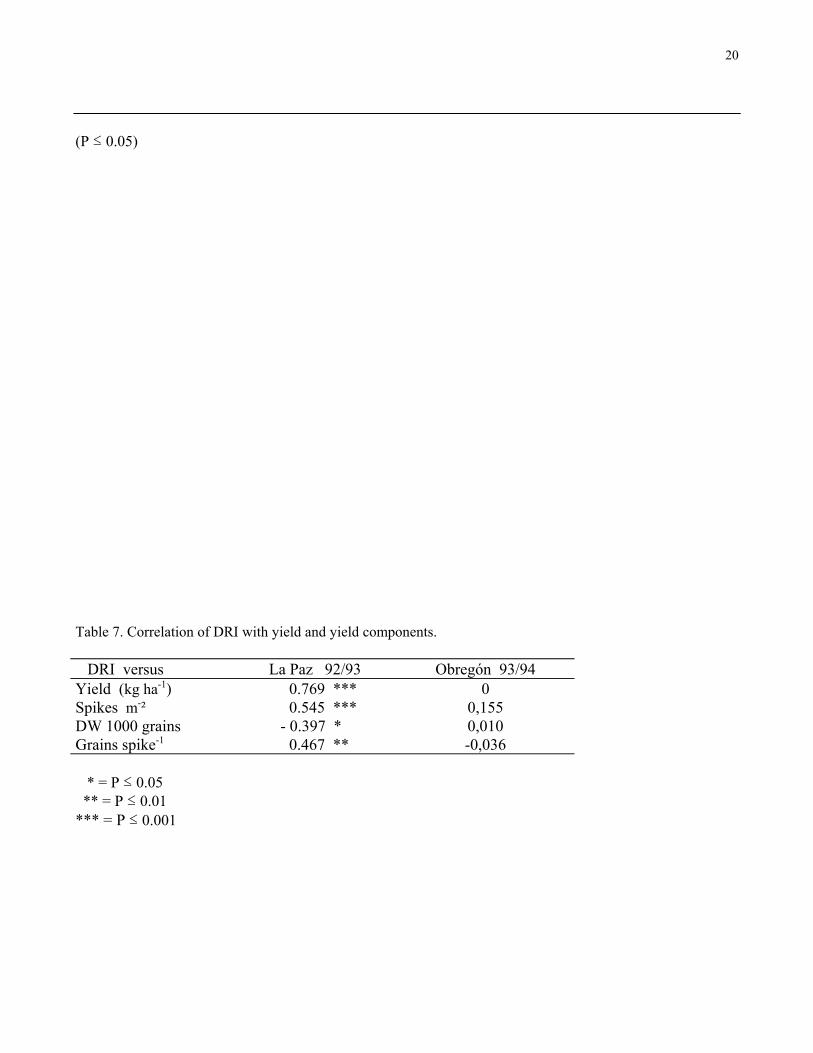
Grain yield was highly and positively correlated (r = 0,769, P < 0,001) to DRI across the 40 Triticum
genotypes at the poorest yielding environment (Table 7). The following genotypes were found to have
a DRI above 1.0, i.e. to be resistant to salinity : 15 (Kauz, bread wheat), 21 (bread wheat), 32
(Candeal, bread wheat of the reference set), 33 (Kharchia, bread wheat of the reference set), 36 (Sakha
8 , bread wheat of the reference set) and 37 (Shorawaki, bread wheat of the reference set). No
genotype from the synthetic and the durum wheat group was found resistant to salinity.
3.7. Sodium concentration in flag leaves
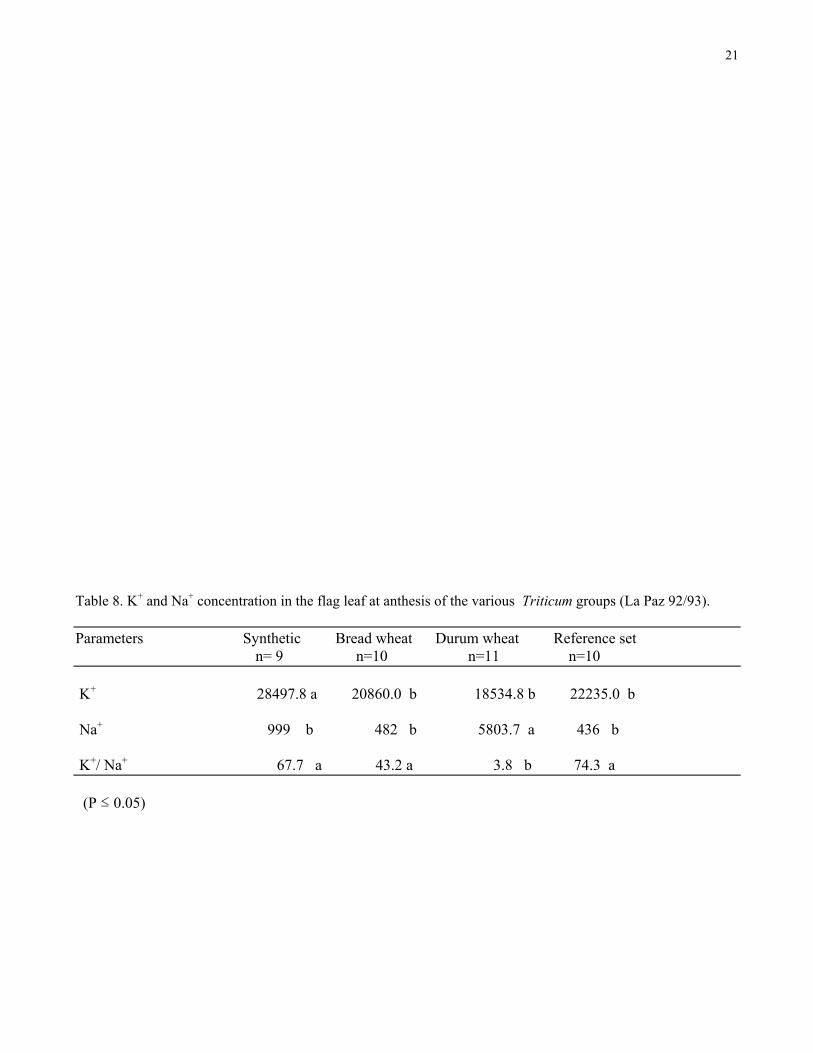
Table 8 shows the concentration of Na+, K+ and K+/Na+ ratio for the four groups of entries. The
three groups having the D genome did not show significant differences in the leaf concentration of Na+,
K+ or in the K+/Na+ ratio. There was within group variability for Na+ concentration in the synthetic
group but not in the bread wheat and reference set group. There was also genetic variability within the
durum group for Na+ concentration in the flag leaf. Variability within groups was also found for K+
8
concentration in the synthetics, bread wheat and reference set groups, and in K+/Na+ in the synthetics,
durum wheat and reference set.
The sodium concentration of the flag leaf was negatively correlated to above ground biomass
(r = -0.601, n = 40, P< 0.001) in the 92/93 environment of La Paz while the K+/Na+ was positively
correlated to biomass yield (r= 0.42, n = 40, P< 0,007). The DRI was negatively correlated to Na+
concentration in the flag leaf (r = -0.467, n=40, P< 0,002).
4. Discussion
4.1. Environmental characteristics
The values of the soil saturation extract at La Paz are below the soil salinity threshold causing
grain yield reduction in wheat (5.9 dS m-1 for durum wheat and 8.6 dS m-1 for bread wheat (Maas,
1986). Even during the most sensitive growing stage to salinity (germination and seedling stages) the
wheat crop can tolerate 4 to 5 dS m-1 (Ayers and Westcot, 1985; Richards, 1983).
The irrigation water it doubles its concentration at field capacity, and it doubles again as the
soil water content decreases towards permanent wilting point (Hanson et al., 1993). On the average, the
efective EC of soil water is approximately three times higher than that of free water. Severe salinity
problems are reported with an ECw of 3 dS m-1 (Ayers and Westcot, 1985). Therefore, the genotypes
planted at La Paz experienced salinity problems while when planted in Obregon they did not
experience salinity.
3.2. Analysis among groups
The Durum wheats group had the highest sensitivity to the salinity stress, in agreement with results
reported by Maas (1986).
Ver pdte de los genotipos duros/harineros
Var con poco rendimiento son más estables
Puntos de la regresion
9
3.3. Highest yielding environment
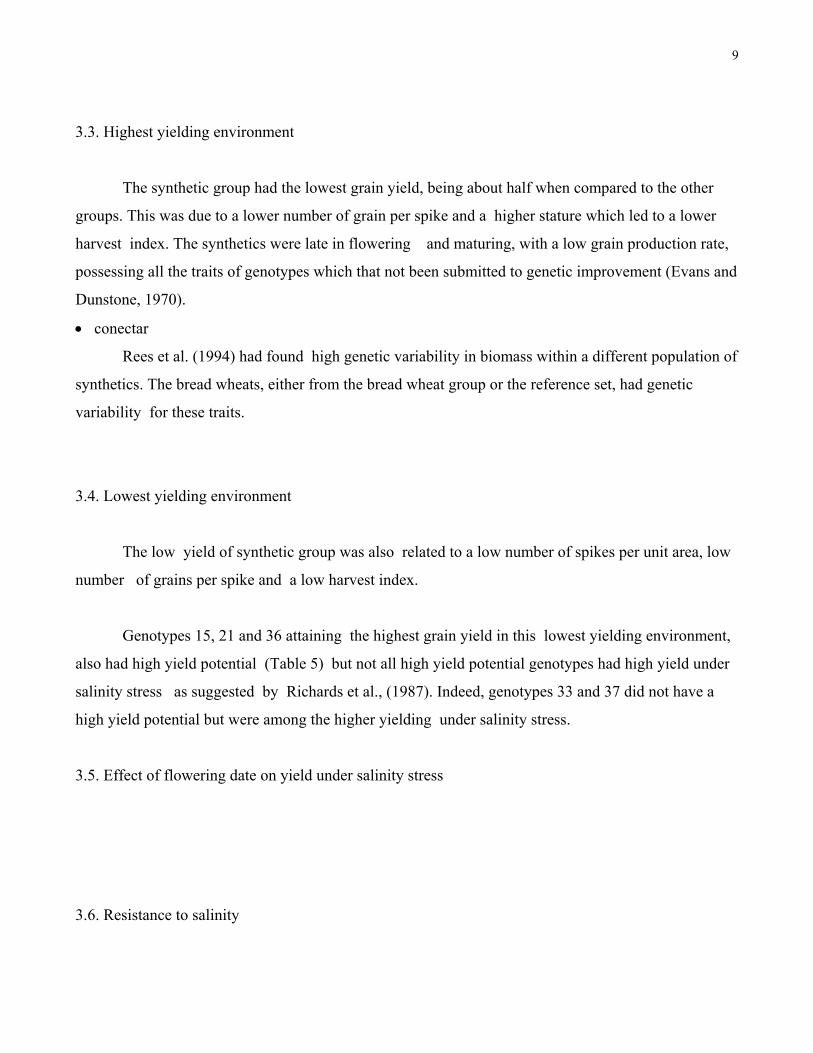
The synthetic group had the lowest grain yield, being about half when compared to the other
groups. This was due to a lower number of grain per spike and a higher stature which led to a lower
harvest index. The synthetics were late in flowering and maturing, with a low grain production rate,
possessing all the traits of genotypes which that not been submitted to genetic improvement (Evans and
Dunstone, 1970).
• conectar
Rees et al. (1994) had found high genetic variability in biomass within a different population of
synthetics. The bread wheats, either from the bread wheat group or the reference set, had genetic
variability for these traits.
3.4. Lowest yielding environment
The low yield of synthetic group was also related to a low number of spikes per unit area, low
number of grains per spike and a low harvest index.
Genotypes 15, 21 and 36 attaining the highest grain yield in this lowest yielding environment,
also had high yield potential (Table 5) but not all high yield potential genotypes had high yield under
salinity stress as suggested by Richards et al., (1987). Indeed, genotypes 33 and 37 did not have a
high yield potential but were among the higher yielding under salinity stress.
3.5. Effect of flowering date on yield under salinity stress
3.6. Resistance to salinity
10
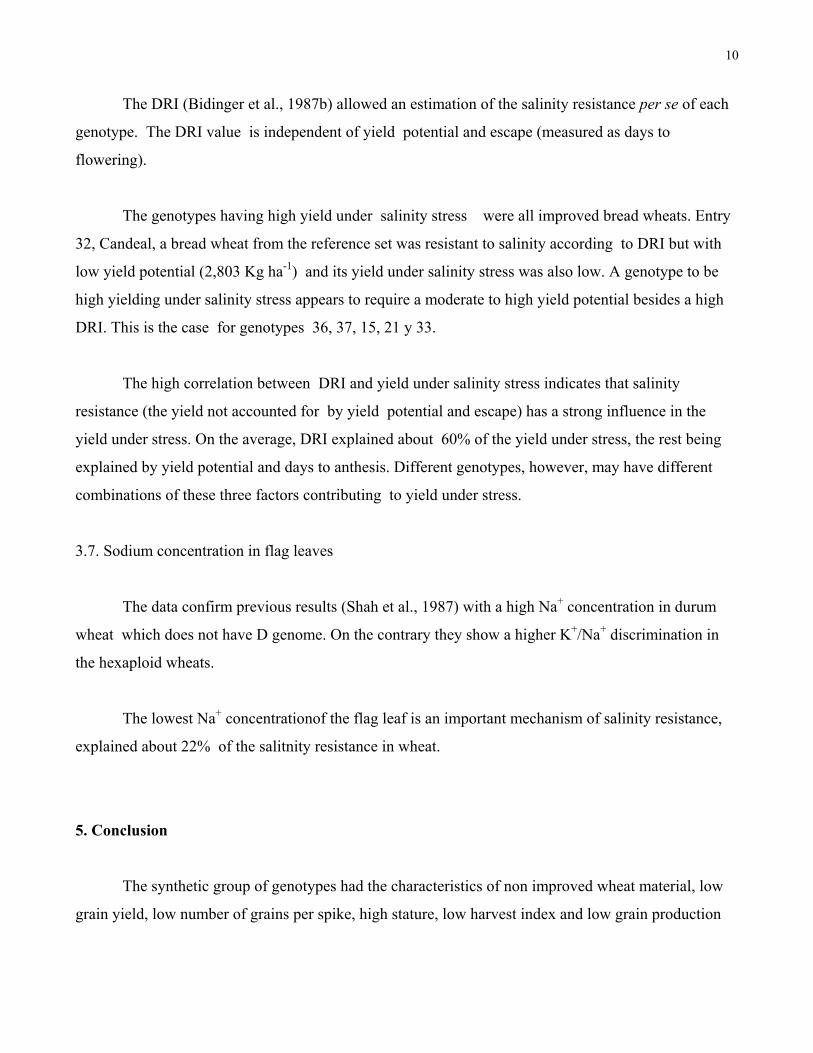
The DRI (Bidinger et al., 1987b) allowed an estimation of the salinity resistance per se of each
genotype. The DRI value is independent of yield potential and escape (measured as days to
flowering).
The genotypes having high yield under salinity stress were all improved bread wheats. Entry
32, Candeal, a bread wheat from the reference set was resistant to salinity according to DRI but with
low yield potential (2,803 Kg ha-1) and its yield under salinity stress was also low. A genotype to be
high yielding under salinity stress appears to require a moderate to high yield potential besides a high
DRI. This is the case for genotypes 36, 37, 15, 21 y 33.
The high correlation between DRI and yield under salinity stress indicates that salinity
resistance (the yield not accounted for by yield potential and escape) has a strong influence in the
yield under stress. On the average, DRI explained about 60% of the yield under stress, the rest being
explained by yield potential and days to anthesis. Different genotypes, however, may have different
combinations of these three factors contributing to yield under stress.
3.7. Sodium concentration in flag leaves
The data confirm previous results (Shah et al., 1987) with a high Na+ concentration in durum
wheat which does not have D genome. On the contrary they show a higher K+/Na+ discrimination in
the hexaploid wheats.
The lowest Na+ concentrationof the flag leaf is an important mechanism of salinity resistance,
explained about 22% of the salitnity resistance in wheat.
5. Conclusion
The synthetic group of genotypes had the characteristics of non improved wheat material, low
grain yield, low number of grains per spike, high stature, low harvest index and low grain production
11
rate. They had low grain yield and high stability. Furthermore, they had low genetic variability in the
parameters studied. They had, however, a high K+/Na+ ratio, equal to the other hexaploid wheats.
The improved genotypes had higher grain yield with the reference set being most stable. The
hexaploids had the higher grain yield under stress and the higher salinity resistance.
A high yield potential appears to be a important trait to achieve high yield under salinity stress,
but alone it does not imply high yield under such conditions. Salinity resistance measured with the DRI
index is correlated to grain yield under stress which in turn is negatively correlated to Na+
concentration in the flag leaf at anthesis.
References
Acevedo, E. 1991. Morphophysiological traits of adaptation of cereals to Mediterranean environments. In:Acevedo, E., Fereres, E., Giménez, C. and Srivastava, J. (Eds), Improvement and management ofwinter cereals under temperature, drought and salinity stresses. Proceeding of the InternationalSymposium October, 1987, Cordoba, Spain. Proccedings of the ICARDA-INIA Symposium ,Córdoba, Spain, pp. 85-96.
Acevedo, E., Silva, H. y Silva, P. 1998. Tendencias actuales de la investigación en la resistencia al estréshídrico de las plantas cultivadas. Bol. Téc. Fac. Cs. Agrarias y Forestales, Universidad de Chile49 :1-28.
Appels, R. and Lagudah, E. 1990. Manipulation of chromosomal segments from wild wheat for theimprovement of bread wheat. Aust. J. Plant Physiol. 17:253-266.
Ayers, R.S. and Westcot, D.W. 1985. Water quality for agriculture. FAO Irrigation and Drainage PaperN°29. Food and Agriculture Organization of the United Nations. Roma. 97 p.
Bidinger, F.R., Mahalakshmi, V. and Rao, G.D. 1987 a. Assesment of drought resistance in Pearl Millet(Pennisetum americanum (L.) Leeke).I Factors affecting yields under stress. Aust. J. Agric. Res.38:37-48.
Bidinger, F.R., Mahalakshmi,V. and Rao, G.D. 1987 b. Assesment of drought resistance in Pearl Millet(Pennisetum americanum (L.) Leeke). II Estimation of genotype response to stress. Aust. J. Agric.Res. 38: 49-59.
Eberhart, S. and Russell, W. 1966. Stability parameters for comparing varieties. Crop Sci. 6:36-40.
Evans, L. and Dunstone, R. 1970. Some physiological aspects of evolution in wheat. Aust. J. Biol. Sci.23:725-741.
Finlay, K.W. and Wilkinson, G. N. 1963. The analysis of adaptation in a plant-breeding programme. Aust.J. Agric. Res. 14: 742-754.
12
Gorham, J., Hardy, C. Wyn Jones, R., G. Joppa L. and Law, C. 1987. Chromosomal location of a K+/ Na+
dsicrimination character in the D genome of wheat. Theor. Appl. Genet. 74:584-588.
Grieve, C., Lesch, S., Francois, L. and Maas, E. 1992. Analysis of main spike yield components in salt-stressed wheat. Crop Sci. 32:697-703.
Hanft, J.M. and Wych, R.D. 1982. Visual indicators of physiological maturity of hard red spring wheat.Crop Sci. 22:584-587.
Hanson, B., Grattan, S.R. and Fulton, A. 1993. Agricultural salinity and drainage: A Handbook for watermanagers. University of California Irrigation Program. University of California, Davis. 141p.
Maas, E. 1986. Salt tolerance of plants. Appl. Agric. Res. 1(1):12-26.
Maas, E. and Grieve, C. 1990. Spike and leaf development in salt stressed wheat. Crop Sci. 30:1309-1313.
Maas, E., Lesch, S., Francois, L. and Grieve, C. 1994. Tiller development in salt -stressed wheat. Crop Sci.34:1594-1603.
Mujeeb-Kazi, A., Rosas, V. and Roldan, S. 1996. Conservation of the genetic variation of Triticumtauschii (Coss.) Schmalh., (Aegilops squarrosa auct. non L.) in synthetic hexaploid wheats (T.turgidum L.S. lat. x T. tauschii ; 2n = 6x = 42, AABBDD). Genet. Res. Crop Evol. 43 :129-134.
McFadden, E.S. and Sears, E.R. 1946. The origin of Triticum spelta and its free-threshing hexaploidrelatives. J. Hered. 37: 81-89; 107-116.
Michigan State University. 1988. MSTAT-C. A software program for the design, management andanalysis of agronomic research experiments. Michigan, U.S.A.
Rees, D., Ruis Ibarra, L., Acevedo, E., Mujeeb- Kazi, A. and Villareal, R.L. 1994. Photosyntheticcharacteristics of synthetic bread wheats. Wheat Special Report N°.28. CIMMYT. México.
Richards, R.A. 1983. Should selection for yield in saline regions be made on saline or non saline soils?.Euphytica 32: 431-438.
Richards, R.A., Denett, C.W., Qualset, C.O., Epstein, E., Norlyn, J.D. and Winslow, M.D. 1987. Variationfor yield of grain and biomass in wheat, barley, and triticale in a salt affected field. Field Crops Res.15: 277-287.
Sayre, K. D., Acevedo, E., and Austin, R.B. 1995. Carbon isotope discrimination and grain yield of threebread wheat germplasm groups grown at different levels of water stress. Field Crops Res. 41: 45-54.
Schachtman, D.P., Munns, R. and Whitecross, M.I. 1991. Variation and sodium exclusion and salt tolerancein Triticum tauschii. Crop Sci. 31:992-997.
Shah, S.H., Gorham, J., Forster, B.P. and Wyn Jones, R.G. 1987. Salt tolerance in the Triticeae: Theatribution of the D genome to cation selectivity in hexaploid wheat. J. Exp. Bot. 38:254-269.
13
Wyn Jones, R.G. and Gorham, J. 1991. Physiological effects of salinity: scope for genetic improvement.In: Acevedo, E., Fereres, E., Giménez, C. and Srivastava, J. (Eds), Improvement and management ofwinter cereals under temperature, drought and salinity stresses. Proceeding of the InternationalSymposium October, 1987, Cordoba, Spain. Proccedings of the ICARDA-INIA Symposium ,Córdoba, Spain. pp. 177- 201.
Zadoks, J.C., Chang, T.T. and Konzak, C.F. 1974. A decimal code for the growth stages of cereals. WeedRes. 14:415-421.
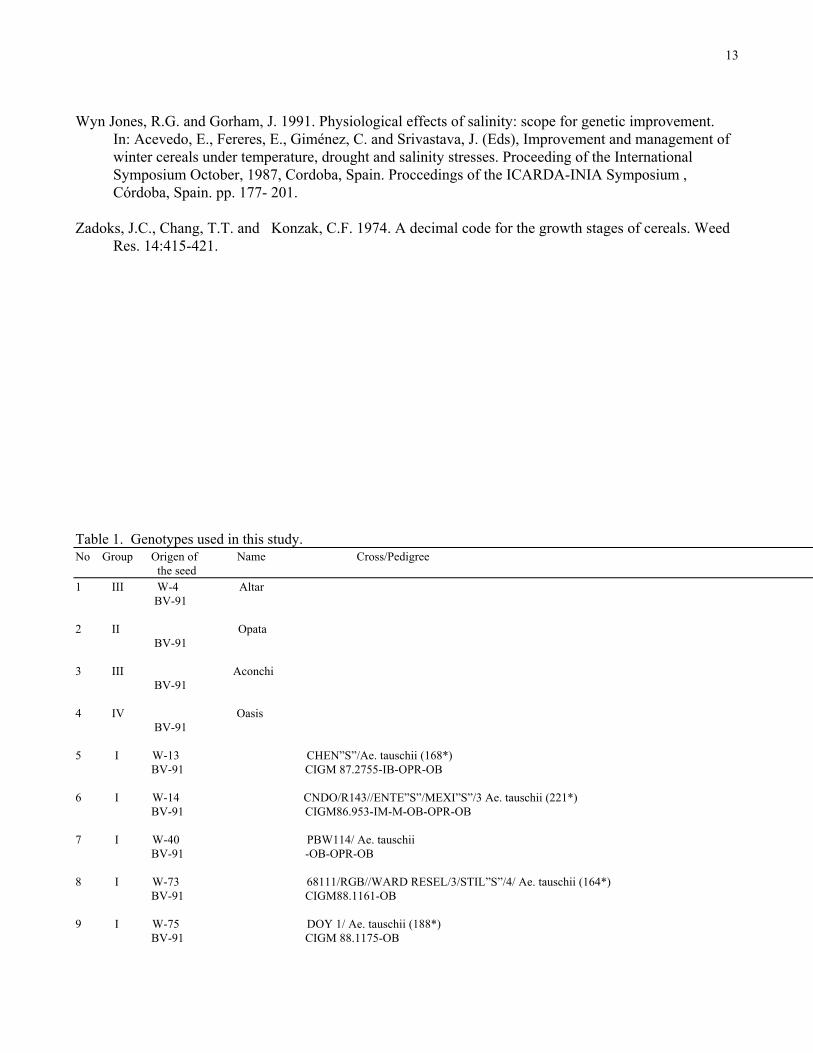
Table 1. Genotypes used in this study.No Group Origen of Name Cross/Pedigree the seed1 III W-4 Altar BV-91
2 II Opata BV-91
3 III Aconchi BV-91
4 IV Oasis BV-91
5 I W-13 CHEN”S”/Ae. tauschii (168*) BV-91 CIGM 87.2755-IB-OPR-OB
6 I W-14 CNDO/R143//ENTE”S”/MEXI”S”/3 Ae. tauschii (221*) BV-91 CIGM86.953-IM-M-OB-OPR-OB
7 I W-40 PBW114/ Ae. tauschii BV-91 -OB-OPR-OB
8 I W-73 68111/RGB//WARD RESEL/3/STIL”S”/4/ Ae. tauschii (164*) BV-91 CIGM88.1161-OB
9 I W-75 DOY 1/ Ae. tauschii (188*) BV-91 CIGM 88.1175-OB
14
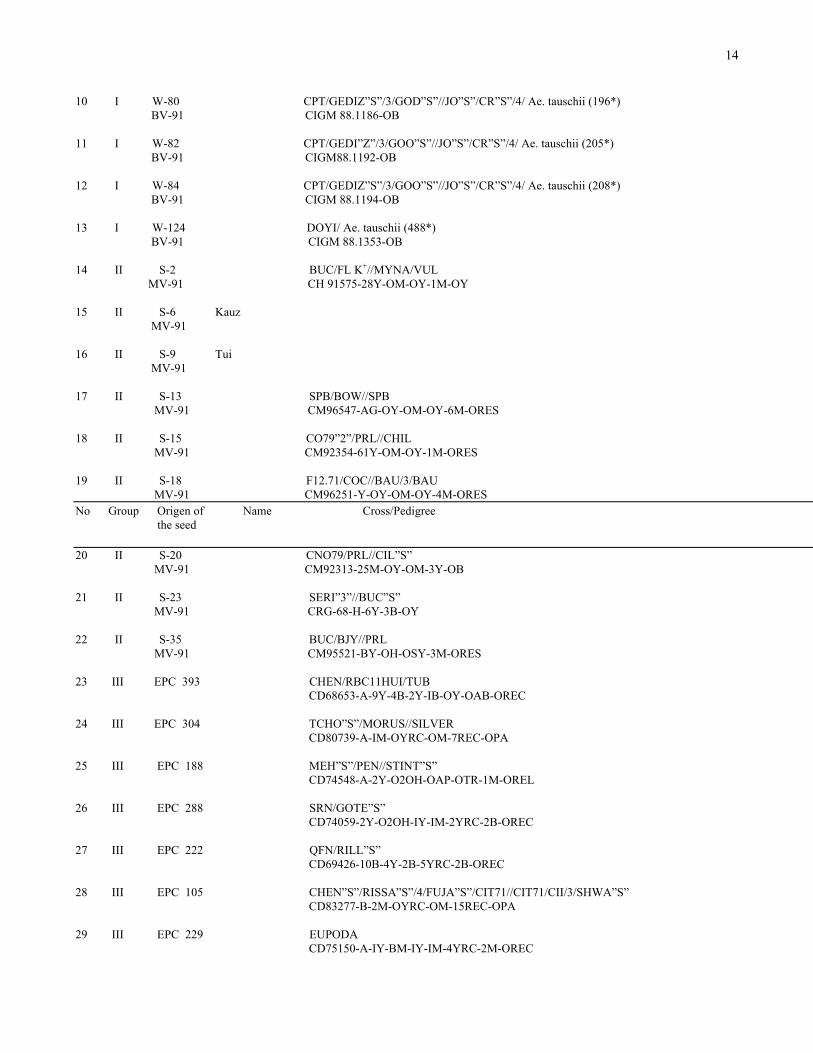
10 I W-80 CPT/GEDIZ”S”/3/GOD”S”//JO”S”/CR”S”/4/ Ae. tauschii (196*) BV-91 CIGM 88.1186-OB
11 I W-82 CPT/GEDI”Z”/3/GOO”S”//JO”S”/CR”S”/4/ Ae. tauschii (205*) BV-91 CIGM88.1192-OB
12 I W-84 CPT/GEDIZ”S”/3/GOO”S”//JO”S”/CR”S”/4/ Ae. tauschii (208*) BV-91 CIGM 88.1194-OB
13 I W-124 DOYI/ Ae. tauschii (488*) BV-91 CIGM 88.1353-OB
14 II S-2 BUC/FL K+//MYNA/VUL MV-91 CH 91575-28Y-OM-OY-1M-OY
15 II S-6 Kauz MV-91
16 II S-9 Tui MV-91
17 II S-13 SPB/BOW//SPB MV-91 CM96547-AG-OY-OM-OY-6M-ORES
18 II S-15 CO79”2”/PRL//CHIL MV-91 CM92354-61Y-OM-OY-1M-ORES
19 II S-18 F12.71/COC//BAU/3/BAU MV-91 CM96251-Y-OY-OM-OY-4M-ORESNo Group Origen of Name Cross/Pedigree the seed
20 II S-20 CNO79/PRL//CIL”S” MV-91 CM92313-25M-OY-OM-3Y-OB
21 II S-23 SERI”3”//BUC”S” MV-91 CRG-68-H-6Y-3B-OY
22 II S-35 BUC/BJY//PRL MV-91 CM95521-BY-OH-OSY-3M-ORES
23 III EPC 393 CHEN/RBC11HUI/TUB CD68653-A-9Y-4B-2Y-IB-OY-OAB-OREC
24 III EPC 304 TCHO”S”/MORUS//SILVER CD80739-A-IM-OYRC-OM-7REC-OPA
25 III EPC 188 MEH”S”/PEN//STINT”S” CD74548-A-2Y-O2OH-OAP-OTR-1M-OREL
26 III EPC 288 SRN/GOTE”S” CD74059-2Y-O2OH-IY-IM-2YRC-2B-OREC
27 III EPC 222 QFN/RILL”S” CD69426-10B-4Y-2B-5YRC-2B-OREC
28 III EPC 105 CHEN”S”/RISSA”S”/4/FUJA”S”/CIT71//CIT71/CII/3/SHWA”S” CD83277-B-2M-OYRC-OM-15REC-OPA
29 III EPC 229 EUPODA CD75150-A-IY-BM-IY-IM-4YRC-2M-OREC
15
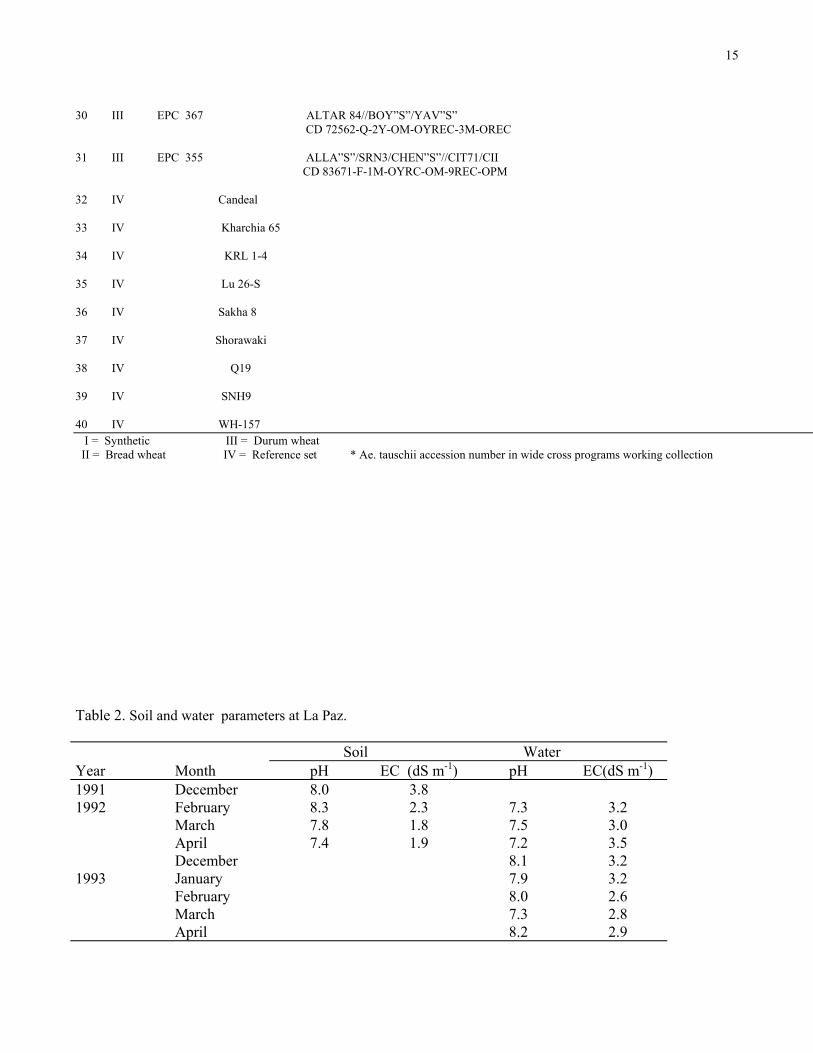
30 III EPC 367 ALTAR 84//BOY”S”/YAV”S” CD 72562-Q-2Y-OM-OYREC-3M-OREC
31 III EPC 355 ALLA”S”/SRN3/CHEN”S”//CIT71/CII CD 83671-F-1M-OYRC-OM-9REC-OPM
32 IV Candeal
33 IV Kharchia 65
34 IV KRL 1-4
35 IV Lu 26-S
36 IV Sakha 8
37 IV Shorawaki
38 IV Q19
39 IV SNH9
40 IV WH-157 I = Synthetic III = Durum wheat II = Bread wheat IV = Reference set * Ae. tauschii accession number in wide cross programs working collection
Table 2. Soil and water parameters at La Paz.
Soil WaterYear Month pH EC (dS m-1) pH EC(dS m-1)1991 December 8.0 3.81992 February 8.3 2.3 7.3 3.2
March 7.8 1.8 7.5 3.0April 7.4 1.9 7.2 3.5December 8.1 3.2
1993 January 7.9 3.2February 8.0 2.6March 7.3 2.8April 8.2 2.9
16
Table 3. Environmental index at the various year x locations combinations.
Environment Location Year Yield ( kg ha-1) 1 La Paz 91 / 92 2493.4 2 La Paz 92 / 93 1805.1 3 La Paz 93 / 94 4769.5 4 Obregon 92 / 93 4402.5 5 Obregon 93 / 94 5787.6
17
Table 4. Mean yield and yield parameters for various groups of genotypes at the highest yielding environment (Obregon 93/94).
Parameter Synthetic Bread wheat Durum wheat Reference set n= 9 n=10 n=11 n=10
Biomass ( kg ha-1) 13886.7 a 16216.8 a 16587.2 a 15200.7 aYield (kg ha-1) 3353.5 b 6801.6 a 6914.5 a 6080.8 a
Yield index 0.25 b 0.43 a 0.42 a 0.4 ab
Spikesm-² 255.2 a 323.4 a 290.6 a 352.7 aDW 1000 grains (g) 37.8 a 40 a 39 a 41.4 aGrains spike-1 36.9 b 54.6 ab 62.7 a 44.6 ab
GPR (g ha-1day-1) 81.3 140 138.9 128.1
18
Height (cm) 127.4 a 90.9 b 94.6 b 93.8 b
(P ≤ 0.05)
Table 5. Genotypes with higher yield in highest yielding environment (Obregon 93/94).
Genotype Group Yield (kg ha-1)
38 Reference 9292 21 Bread 7840 36 Reference 7827 1 Durum 7807 14 Bread 7711
19
Table 6. Yield and yield parameters for varios groups of genotypes at the lowest yielding environment (La Paz 92/93).
Parameters Synthetic Bread wheat Durum wheat Reference set n= 9 n=10 n=11 n=10
Biomass (kg ha-1) 5429.9 ab 6532.9 ab 4765.0 b 6750.1 aYield (kg ha-1) 1063.3 b 2237.5 a 1734.9 ab 2184.7 a
Yield index 0.19 b 0.34 a 0.37 a 0.33 a
Spikas m-² 184.9 b 199.1 ab 145.6 b 249.6 aDW 1000 grains (g) 42.8 a 37.8 b 43.2 a 35.6 cGrains spike -1 14.0 b 30.7 a 28.7 a 26.4 a
GPR(g ha-1day-1) 32.9 69.8 54.6 66.8
Height (cm) 71.6 a 62.9 b 65.3 ab 69.4 ab
20
(P ≤ 0.05)
Table 7. Correlation of DRI with yield and yield components.
DRI versus La Paz 92/93 Obregón 93/94Yield (kg ha-1) 0.769 *** 0Spikes m-² 0.545 *** 0,155DW 1000 grains - 0.397 * 0,010Grains spike-1 0.467 ** -0,036
* = P ≤ 0.05 ** = P ≤ 0.01*** = P ≤ 0.001
21
Table 8. K+ and Na+ concentration in the flag leaf at anthesis of the various Triticum groups (La Paz 92/93).
Parameters Synthetic Bread wheat Durum wheat Reference set n= 9 n=10 n=11 n=10
K+ 28497.8 a 20860.0 b 18534.8 b 22235.0 b
Na+ 999 b 482 b 5803.7 a 436 b
K+/ Na+ 67.7 a 43.2 a 3.8 b 74.3 a
(P ≤ 0.05)
22
0
1000
2000
3000
4000
5000
6000
7000
8000
9000
0 1000 2000 3000 4000 5000 6000 7000 8000
Environment index (kg/ha)
Gra
in y
ield
(K
g/h
a)
Synthetic
Bread wheat
Durum wheat
Reference set
Figure 1. Yield stability of Triticum groups.


